


Abstract
Tropical coastal regions exhibit pronounced spatial and temporal variability in rainfall driven by seasonal atmospheric circulation and coastal–orographic interactions. Accurate representation of the temporal distribution of rainfall is essential for hydrologic modeling and infrastructure design. This study develops regionalized Huff curves for the Department of Magdalena, Colombia, addressing a critical gap in the characterization of rainfall temporal patterns in tropical coastal regions. A total of 270 short-duration (5–6 h) rainfall events from automatic stations were converted into normalized cumulative mass curves. The resulting curves were grouped into homogeneous temporal patterns using clustering algorithms. Three dominant storm types were identified: early-peak (Curve 1), intermediate (Curve 2), and uniform (Curve 3), reflecting the region’s coastal, lowland, and orographic influences. Probability envelopes and representative design hyetographs were derived to quantify intra-event variability. Rainfall–runoff simulations for a 100-km2 watershed showed peak-flow differences of up to 132% between storm types, highlighting the sensitivity of hydrologic response to rainfall temporal distributions. The resulting regionalized Huff curves provide a practical and transferable framework for hydrologic modeling, flood-risk assessment, and infrastructure planning in tropical regions with limited high-resolution rainfall data.
1. Introduction
The temporal distribution of rainfall is a fundamental component of hydrologic analysis, as it controls runoff generation, peak flow timing, and the performance of hydraulic infrastructure [1]. Understanding how rainfall is organized within individual storm events is particularly important in regions where short-duration, high-intensity storms strongly influence flood response and drainage performance. In tropical coastal Colombia, these sub-daily rainfall events are a key driver of hydrologic design and are commonly associated with flash flooding [2].
Recent assessments indicate that rainfall regimes are undergoing measurable shifts in duration, intensity, and cumulative volume, with expected increases in storm intensity under warming scenarios [3,4,5,6]. These changes contribute to a higher frequency of extreme events and greater flood impacts, particularly in regions where stormwater and fluvial systems are highly sensitive to short-duration rainfall inputs [7,8]. In Colombia, hydrometeorological events account for most natural disasters, often driven by the combined effects of storm intensity, duration, and antecedent soil moisture [9]. Short-duration storms, therefore, play a critical role in shaping hydrologic response at local and regional scales.
Within this context, the Department of Magdalena exemplifies these challenges. Its physiographic heterogeneity, ranging from the Sierra Nevada de Santa Marta to extensive alluvial plains and savanna landscapes, produces strong spatial and temporal contrasts in rainfall [10,11]. These conditions highlight the need for tools capable of representing storm temporal distributions to support hydrological modeling, infrastructure design, and risk-management efforts.
Huff curves remain a widely used approach for representing the intra-storm distribution of precipitation [12]. By normalizing storm duration and cumulative depth, these curves describe rainfall timing relative to storm progression and allow estimation at different percentiles. Their application has expanded globally, including in tropical, Andean, and coastal regions [13,14]. However, their transferability is constrained in areas where storm dynamics differ from those under which they were originally developed.
Recent efforts have incorporated machine-learning techniques to identify recurrent temporal patterns, enhance storm classification, and support the use of high-resolution rainfall data [15,16,17]. These approaches are particularly relevant in tropical environments, where convective activity produces highly variable storm structures, making temporal distribution a key control in rainfall–runoff modeling [18]. Their effectiveness, however, depends on regionally representative classifications that retain physical interpretability for design applications.
In Colombia, previous efforts to develop regional Huff curves have focused on departments such as Antioquia and Boyacá [19]. No regionalization currently exists for Magdalena, partly due to the limited spatial density of automatic rain-gauge stations. In data-scarce regions, hydrological regionalization provides a practical means of deriving representative storm distributions [18,20].
Despite this need, the temporal structure of short-duration storms in the Department of Magdalena has not been systematically analyzed. The absence of regionalized curves, probability envelopes, and design-ready distributions limits the reliability of hydrological modeling and infrastructure design in one of Colombia’s most rainfall-variable regions.
Temporal rainfall distributions also serve as boundary conditions in event-based hydrologic models, directly controlling runoff generation, peak discharge, and flood timing. In regions dominated by short-duration convective storms, uncertainty in intra-storm structure can lead to substantial errors in peak flow estimation and to systematic under- or overdesign of drainage and flood-control infrastructure.
The principal contribution of this study is the development of design-ready regionalized Huff curves for short-duration (5–6 h) storms in the Department of Magdalena, derived from 270 sub-hourly rainfall events recorded at automatic stations. The study identifies dominant temporal patterns, quantifies uncertainty using percentile envelopes, and evaluates hydrologic design implications through rainfall–runoff simulations. Together, these components provide an operational and physically interpretable framework for hydrologic applications in coastal tropical regions with high rainfall variability and sparse observational networks.
2. Materials and Methods
2.1. Study Area
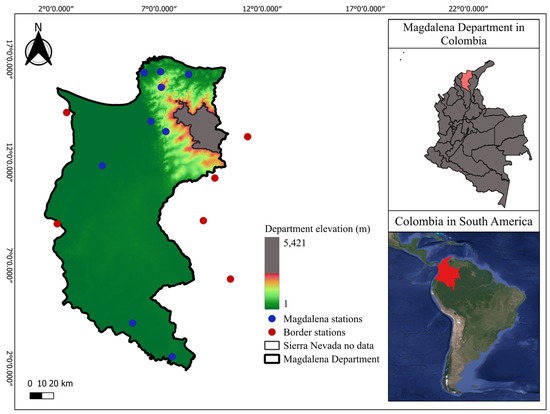
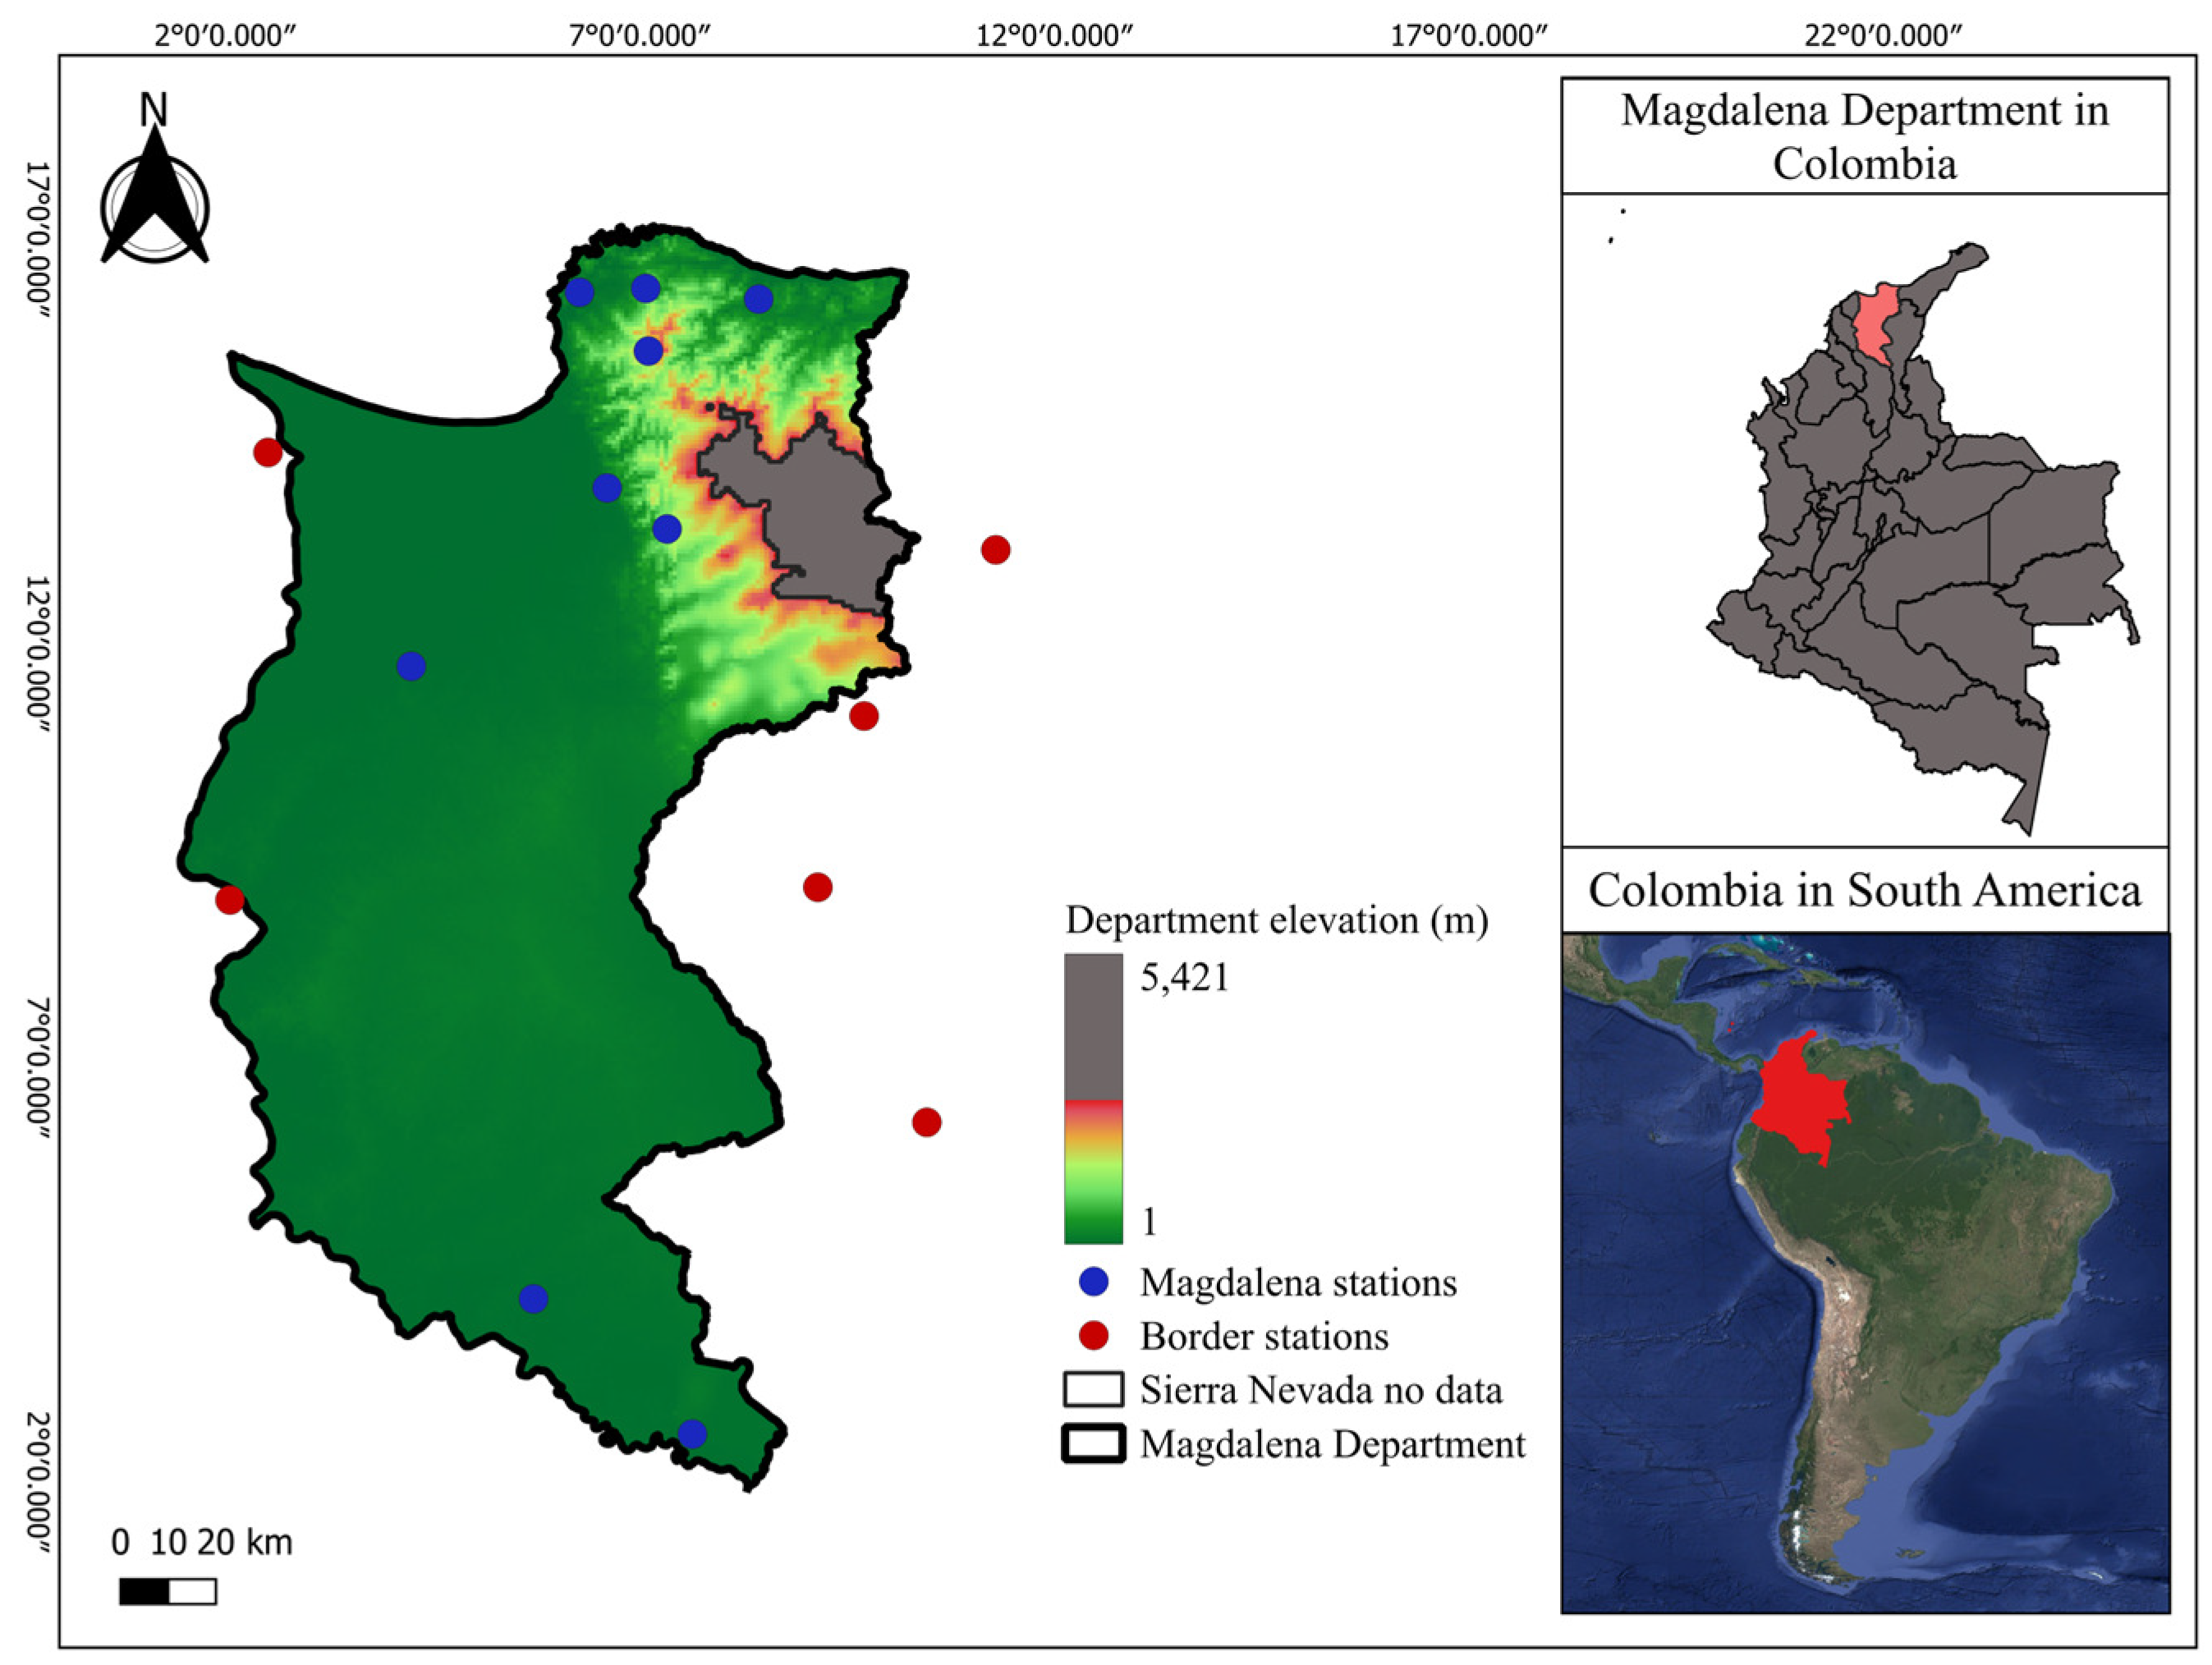
The Department of Magdalena is located in northern Colombia along the Caribbean coast, bounded by the Caribbean Sea to the north, the Magdalena River to the south and west, and the departments of La Guajira and Cesar to the east (Figure 1). The region includes three dominant physiographic units: the Sierra Nevada de Santa Marta in the northeast, extensive alluvial plains associated with the Magdalena River valley, and the Momposina Depression, which is characterized by wetlands and flood-prone lowlands [10,11].
Figure 1.
Study area showing the network of stations, elevation, and areas excluded due to lack of data above 2711 m a.s.l.
Temperature varies primarily with elevation, although warm conditions dominate approximately 80% of the department, with an average annual temperature near 27 °C. The precipitation regime is bimodal, with the first rainy season typically occurring in April-May and a second in September-November [10,11,21].
2.2. Data Collection and Processing
Precipitation datasets were obtained from the Institute of Hydrology, Meteorology, and Environmental Studies of Colombia (IDEAM). Although approximately 100 rainfall stations operate in the Department of Magdalena, this study used 15 automatic stations that provide 10-min resolution data, including 9 within the department and 6 from neighboring regions, to ensure adequate spatial coverage across the 23,188 km2 study area (Table 1) [20]. The inclusion of border stations reduces spatial gaps and improves regional representativeness, consistent with recommendations for data-sparse regions [22,23].
Table 1.
Metadata for the rainfall stations used in the study. Coordinates in decimal degrees (World Geodetic System (WGS84), 1984). Type: Magdalena = station within the department’s boundaries; Border = stations in neighboring departments.
Rainfall records were screened for temporal consistency and completeness. Events containing missing or irregular time steps were excluded, and only storms with continuous 10-min observations were retained. Storm separation was based on non-overlapping durations without applying an inter-event dry-period threshold.
Storms lasting 5–6 h were selected due to their strong association with flood generation and infrastructure exceedance in the Colombian Caribbean [9,24]. These events typically produce sufficient rainfall to trigger rapid runoff and exhibit pronounced first-quartile dominance, making them relevant for hydrologic design [25]. The focus on a single duration class reflects limitations in the availability of high-resolution data [26].
2.3. Definition of Catchment Areas Using the Thiessen Method
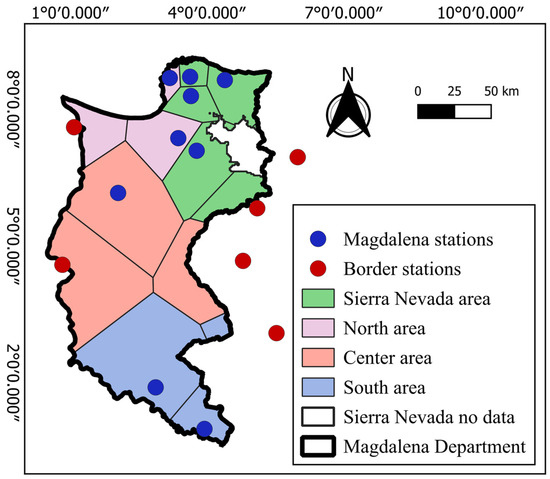
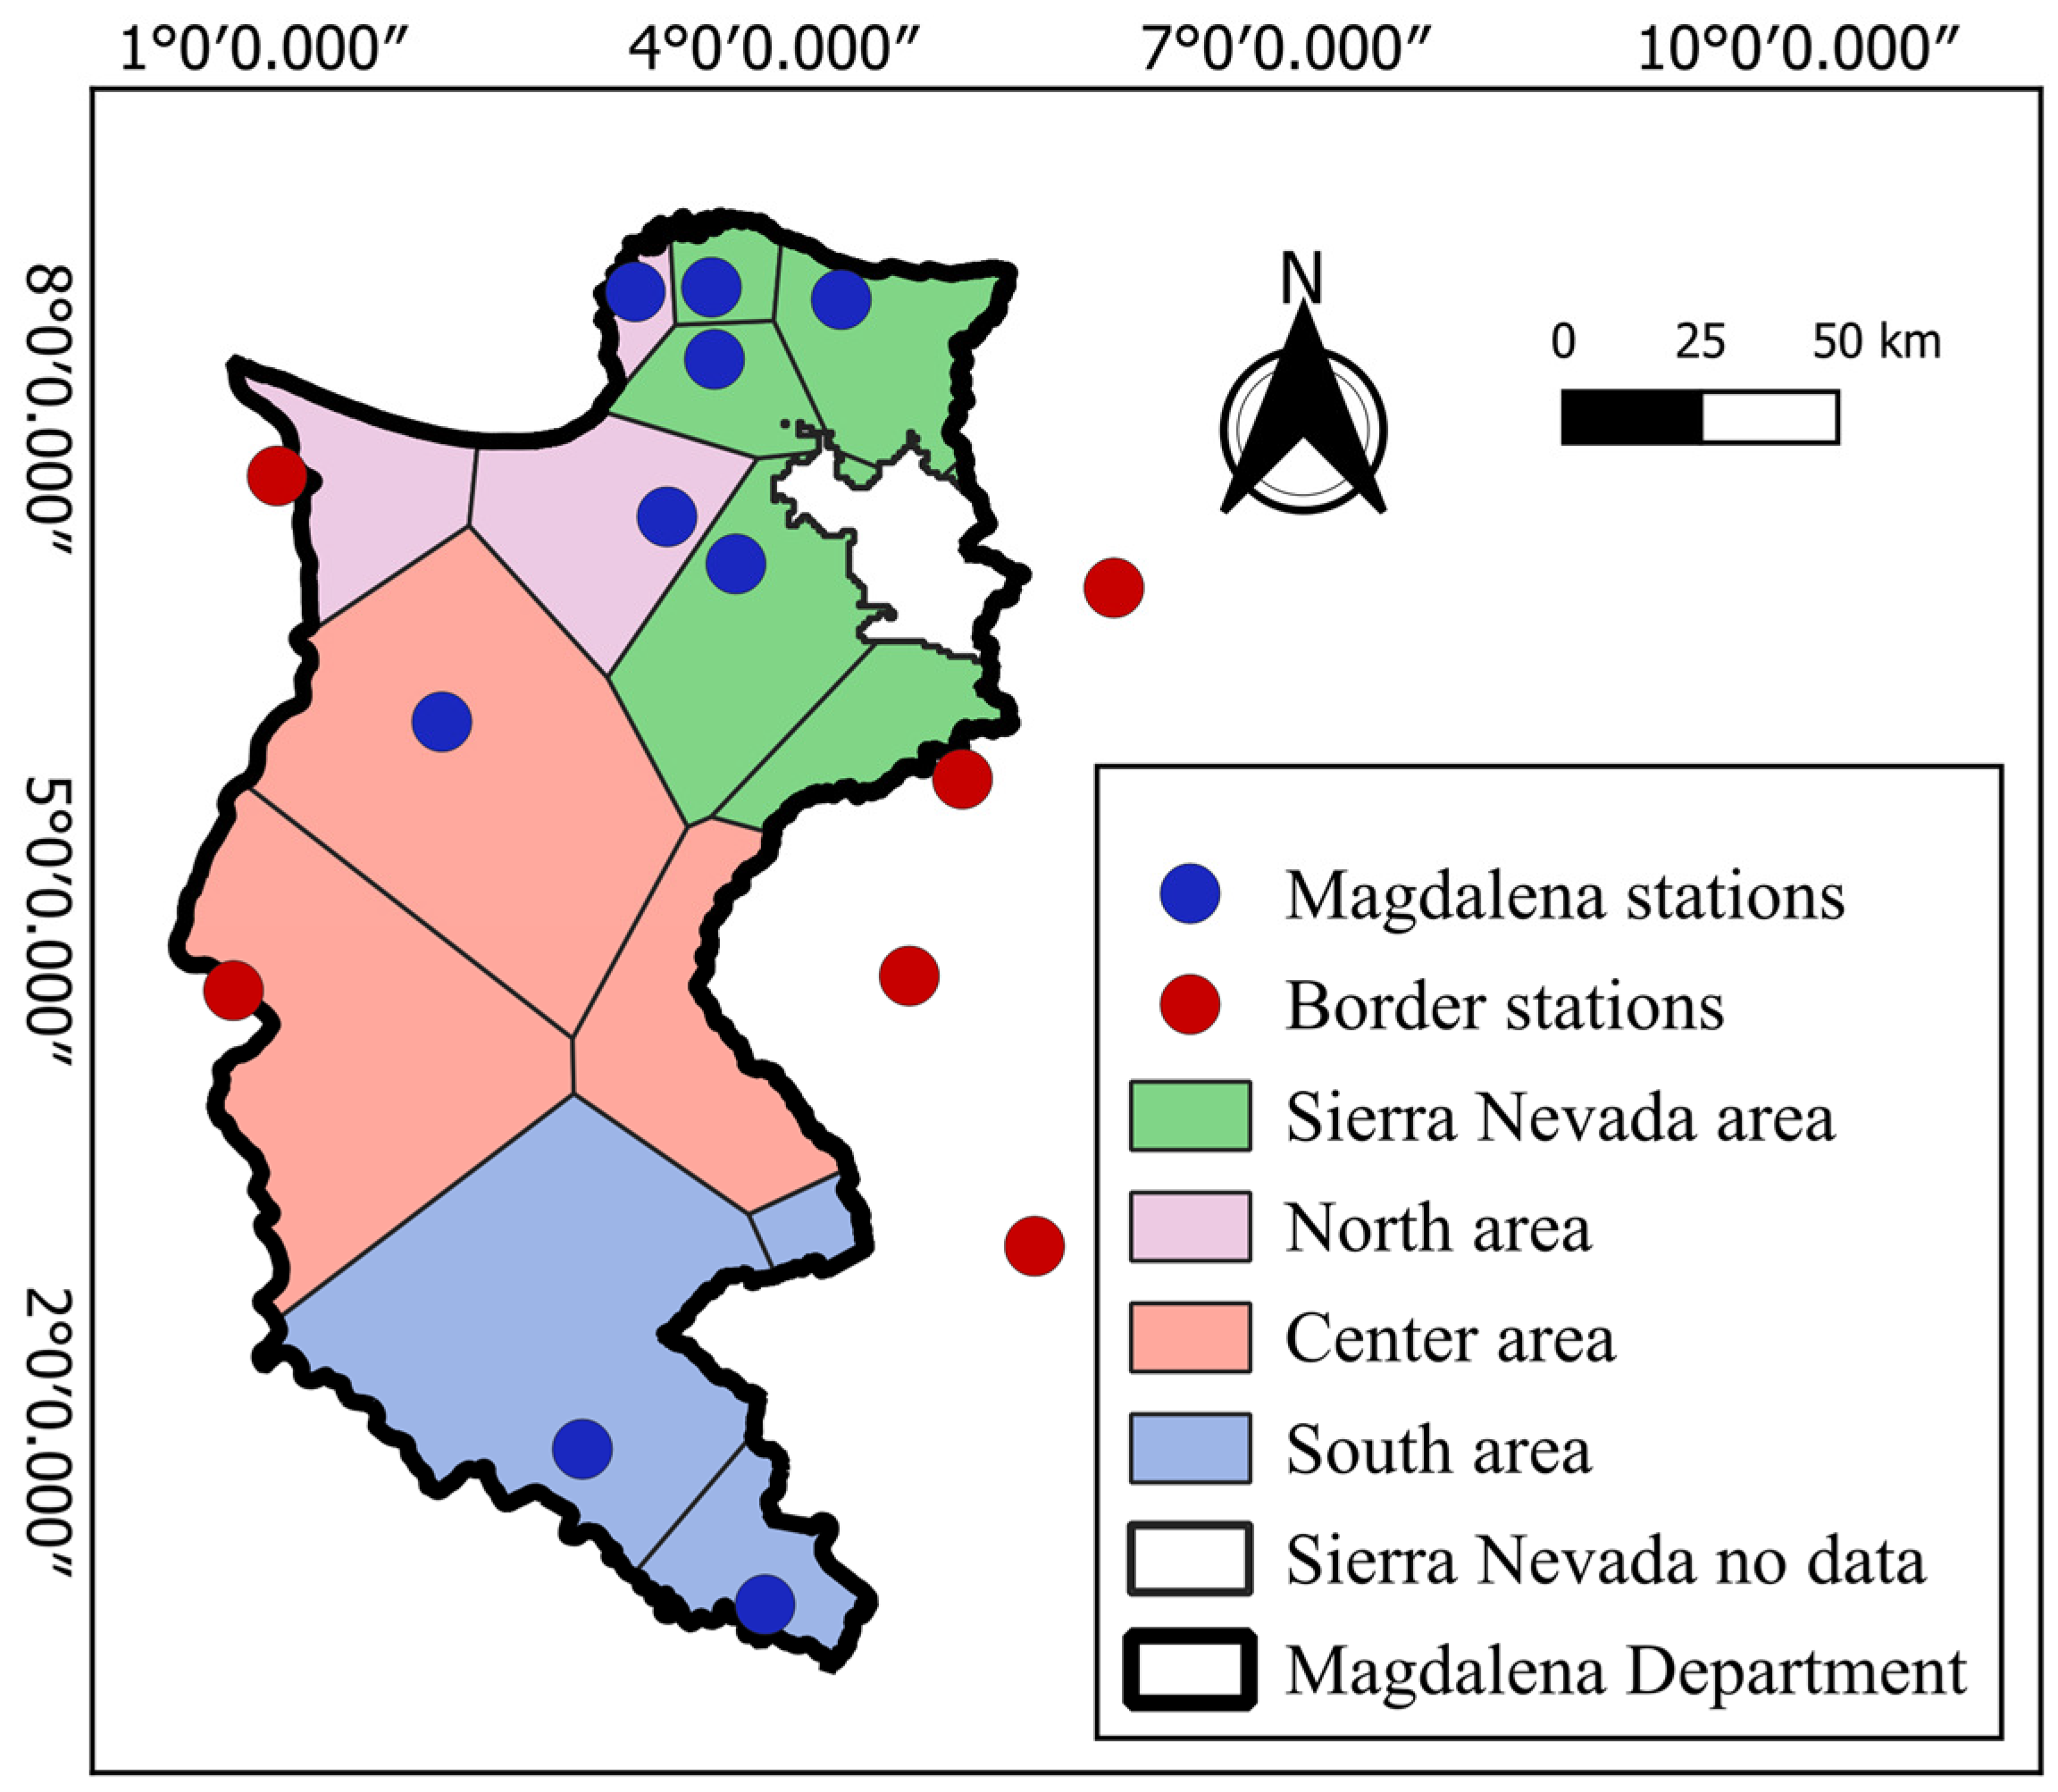
To support the spatial regionalization of storm temporal patterns, rainfall stations were grouped into homogeneous zones using Thiessen (Voronoi) polygons, which delineate each station’s area of influence based on proximity. This approach provides a spatially explicit framework for associating rainfall observations with representative zones, particularly in regions with limited station density [23].
Because Thiessen polygons assume relatively smooth precipitation gradients, the analysis was restricted to elevations below 2711 m a.s.l., above which steep orographic gradients in the Sierra Nevada de Santa Marta reduce the validity of this assumption [23]. Based on station influence areas and physiographic consistency, the department was divided into four zones (North, Central, South, and Sierra Nevada) to support subsequent regionalization of storm temporal patterns [27].
2.4. Construction of Huff Curves
Within each spatial zone, Huff curves were constructed and regionalized to characterize intra-storm temporal variability. Normalized storm mass curves were grouped into homogeneous temporal patterns using the k-means clustering algorithm. The optimal number of clusters was identified using the silhouette coefficient and the elbow criterion, which evaluate cluster compactness and separation, respectively [28,29]. This approach has been widely applied to identify recurrent patterns in hydrological and meteorological datasets [30,31].
Each storm was represented as a dimensionless cumulative mass curve by normalizing the cumulative rainfall depth and storm duration to the interval (0, 1). Curves were sampled at 21 equidistant time steps following the standard Huff grid (t = 0.00, 0.05, …, 1.00), which provides sufficient temporal resolution to capture intra-storm variability while maintaining computational efficiency [12,14,32].
Differences between clusters were evaluated using the Mann–Whitney U test, which is appropriate for non-normally distributed samples [33]. Shape metrics included the cumulative precipitation fraction (y25, y50) and the corresponding normalized time (T25, T50) at the 25% and 50% storm percentiles. The magnitude of the clusters’ differences was quantified using Cliff’s δ, a non-parametric effect size measure that reflects stochastic dominance between groups. To account for multiple pairwise comparisons, p-values from the Mann–Whitney tests were adjusted using the Holm–Bonferroni procedure, a sequential method that controls the family-wise Type I error rate by testing ordered p-values with progressively less restrictive thresholds, improving the detection of true differences relative to the classical Bonferroni correction [34,35].
Uncertainty was quantified by extracting the 10th, 50th, and 90th percentiles of normalized cumulative mass curves at each time step, producing P10–P90 probability envelopes for each zone. Confidence intervals for the shape metrics were estimated using non-parametric bootstrap resampling (n = 1000), following established hydrological practice [31,36,37]. Median curves were subsequently scaled to a design rainfall depth of 50 mm and disaggregated into 15-min hyetographs.
All analyses were performed using Python 3.13.4 (Python Software Foundation), employing standard libraries for clustering, statistical testing, and bootstrap resampling.
2.5. Rainfall–Runoff Modeling Framework
Rainfall–runoff simulations were performed using the Hydrologic Engineering Center–Hydrologic Modeling System (HEC-HMS) 4.12 (USACE, USA) under a controlled comparative framework. A hypothetical watershed of 100 km2 was defined with identical basin characteristics across all simulations. The model configuration included the Initial and Constant loss method (initial loss = 10 mm, constant loss rate = 5 mm h−1), with parameter values representative of regional soil conditions, and the Soil Conservation Service Unit Hydrograph transform method with a lag time of 60 min and a standard peaking factor of 484. A design rainfall depth of 50 mm was applied, representing a moderate, runoff-generating event typical of short-duration storms in the region, and temporal rainfall distributions were specified using the regionalized Huff curves for each cluster. No routing component was included because the analysis focuses exclusively on the direct runoff response at the watershed outlet, thereby isolating the influence of intra-storm rainfall structure on runoff generation, peak discharge, and time to peak.
Because the simulations were not intended for calibration against observed hydrographs, performance metrics (e.g., Nash–Sutcliffe efficiency or root-mean-square error) were not used. The analysis focuses on relative differences in hydrologic response among storm types.
3. Results
3.1. Hydrometeorological and Spatial Context
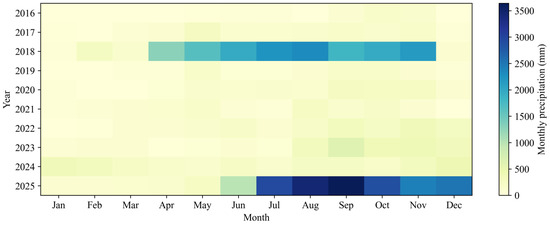
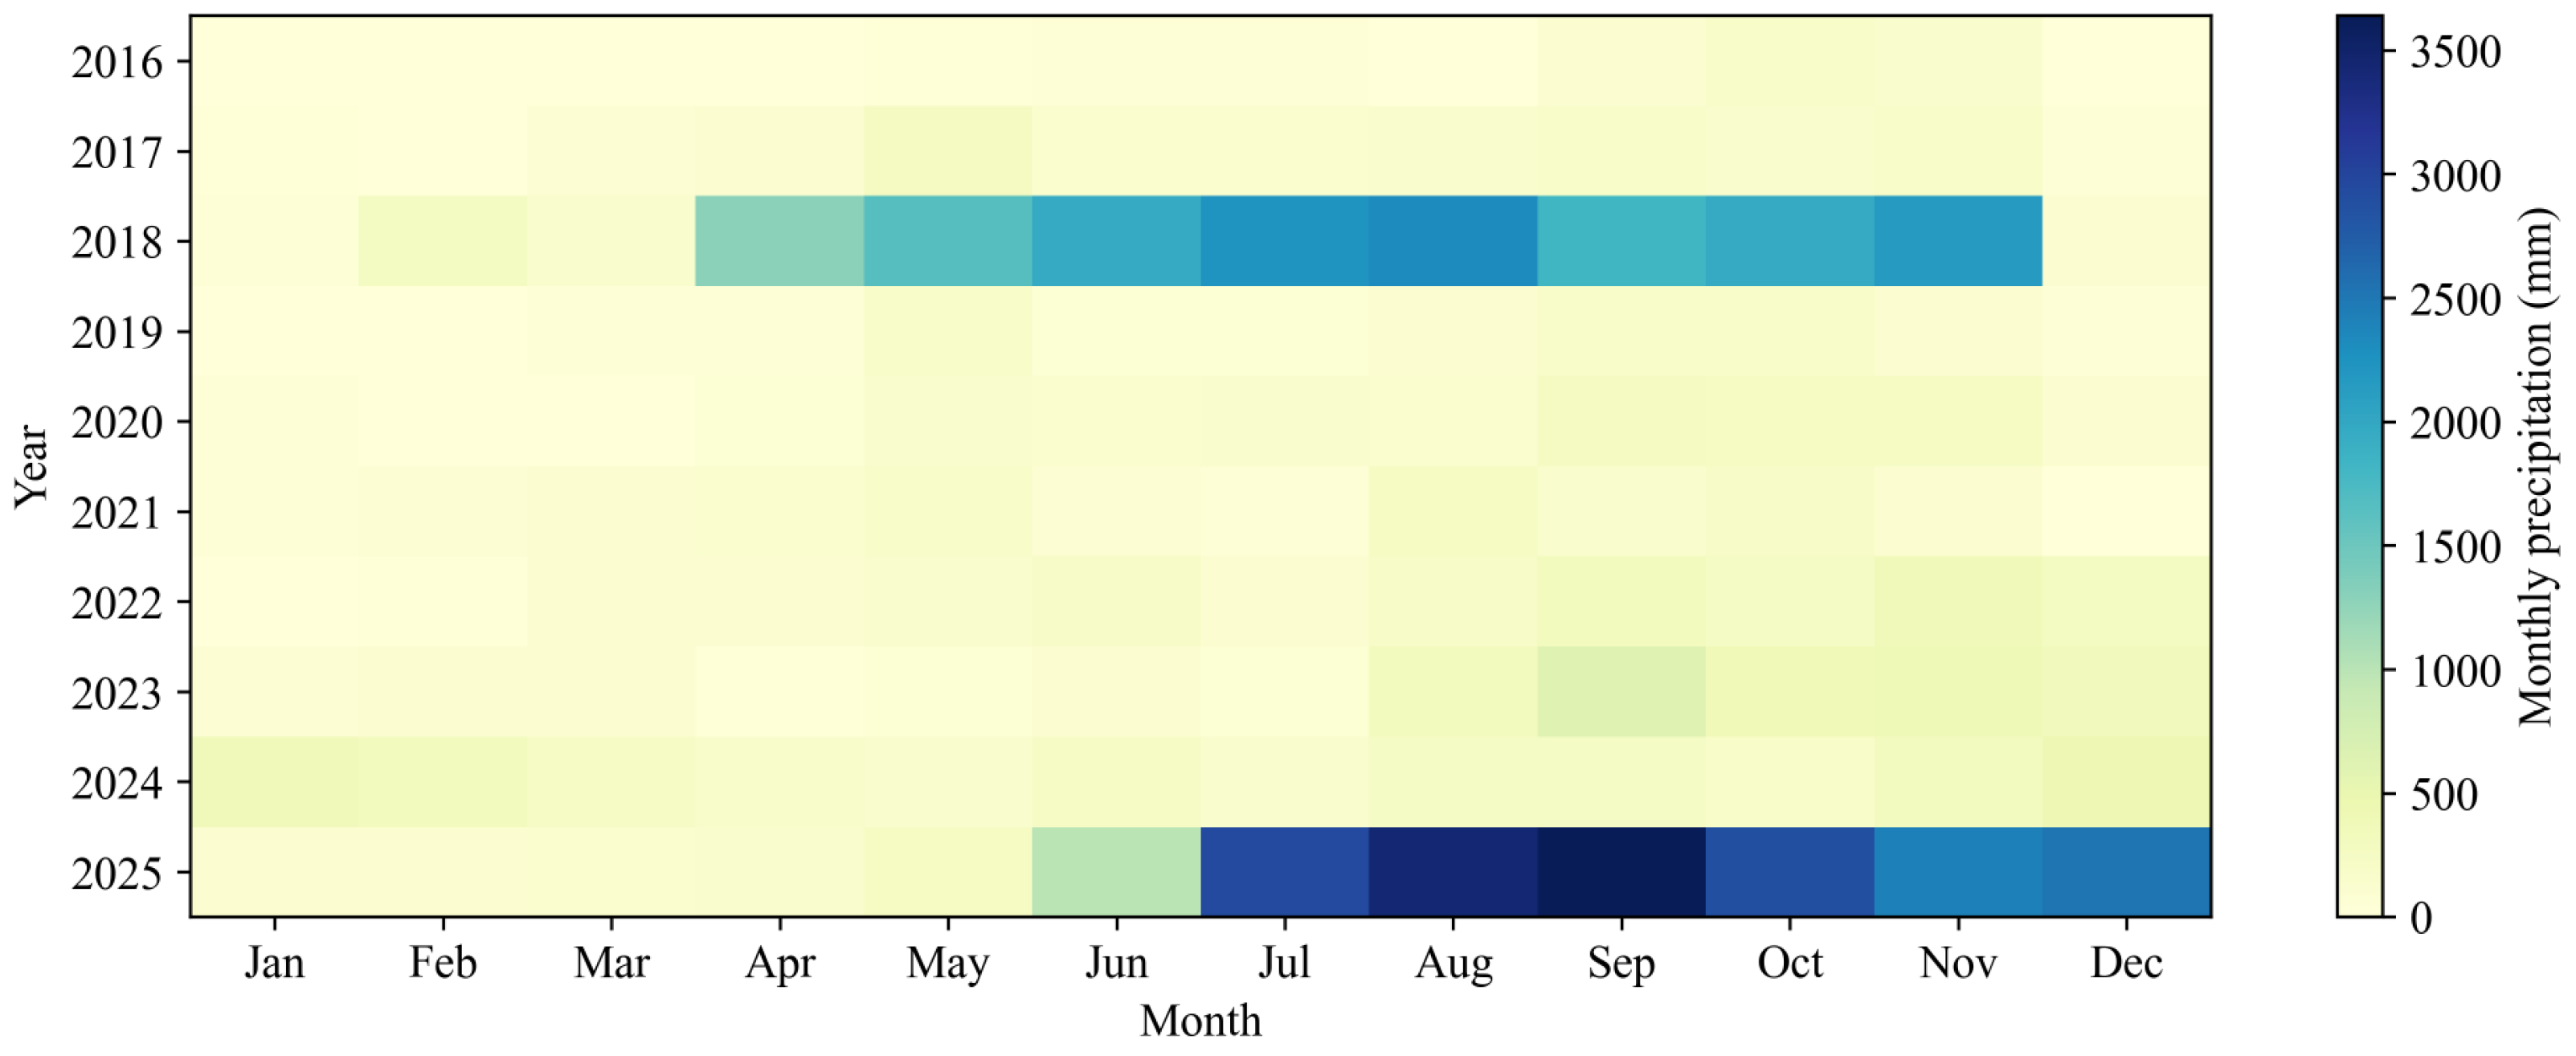
Figure 2 shows the average monthly precipitation for 2016–2025, confirming the bimodal rainfall regime of the Colombian Caribbean. The highest accumulation occurs in May and September-November, consistent with regional climatology. Years 2018 and 2025 exhibited elevated mid-year precipitation.
Figure 2.
Heat map of average monthly precipitation by season (2016–2025).
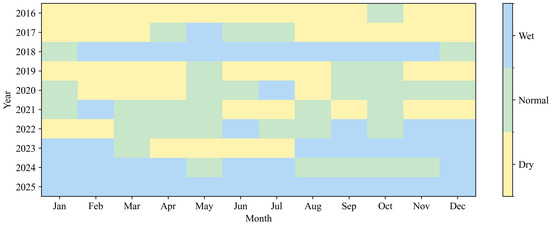
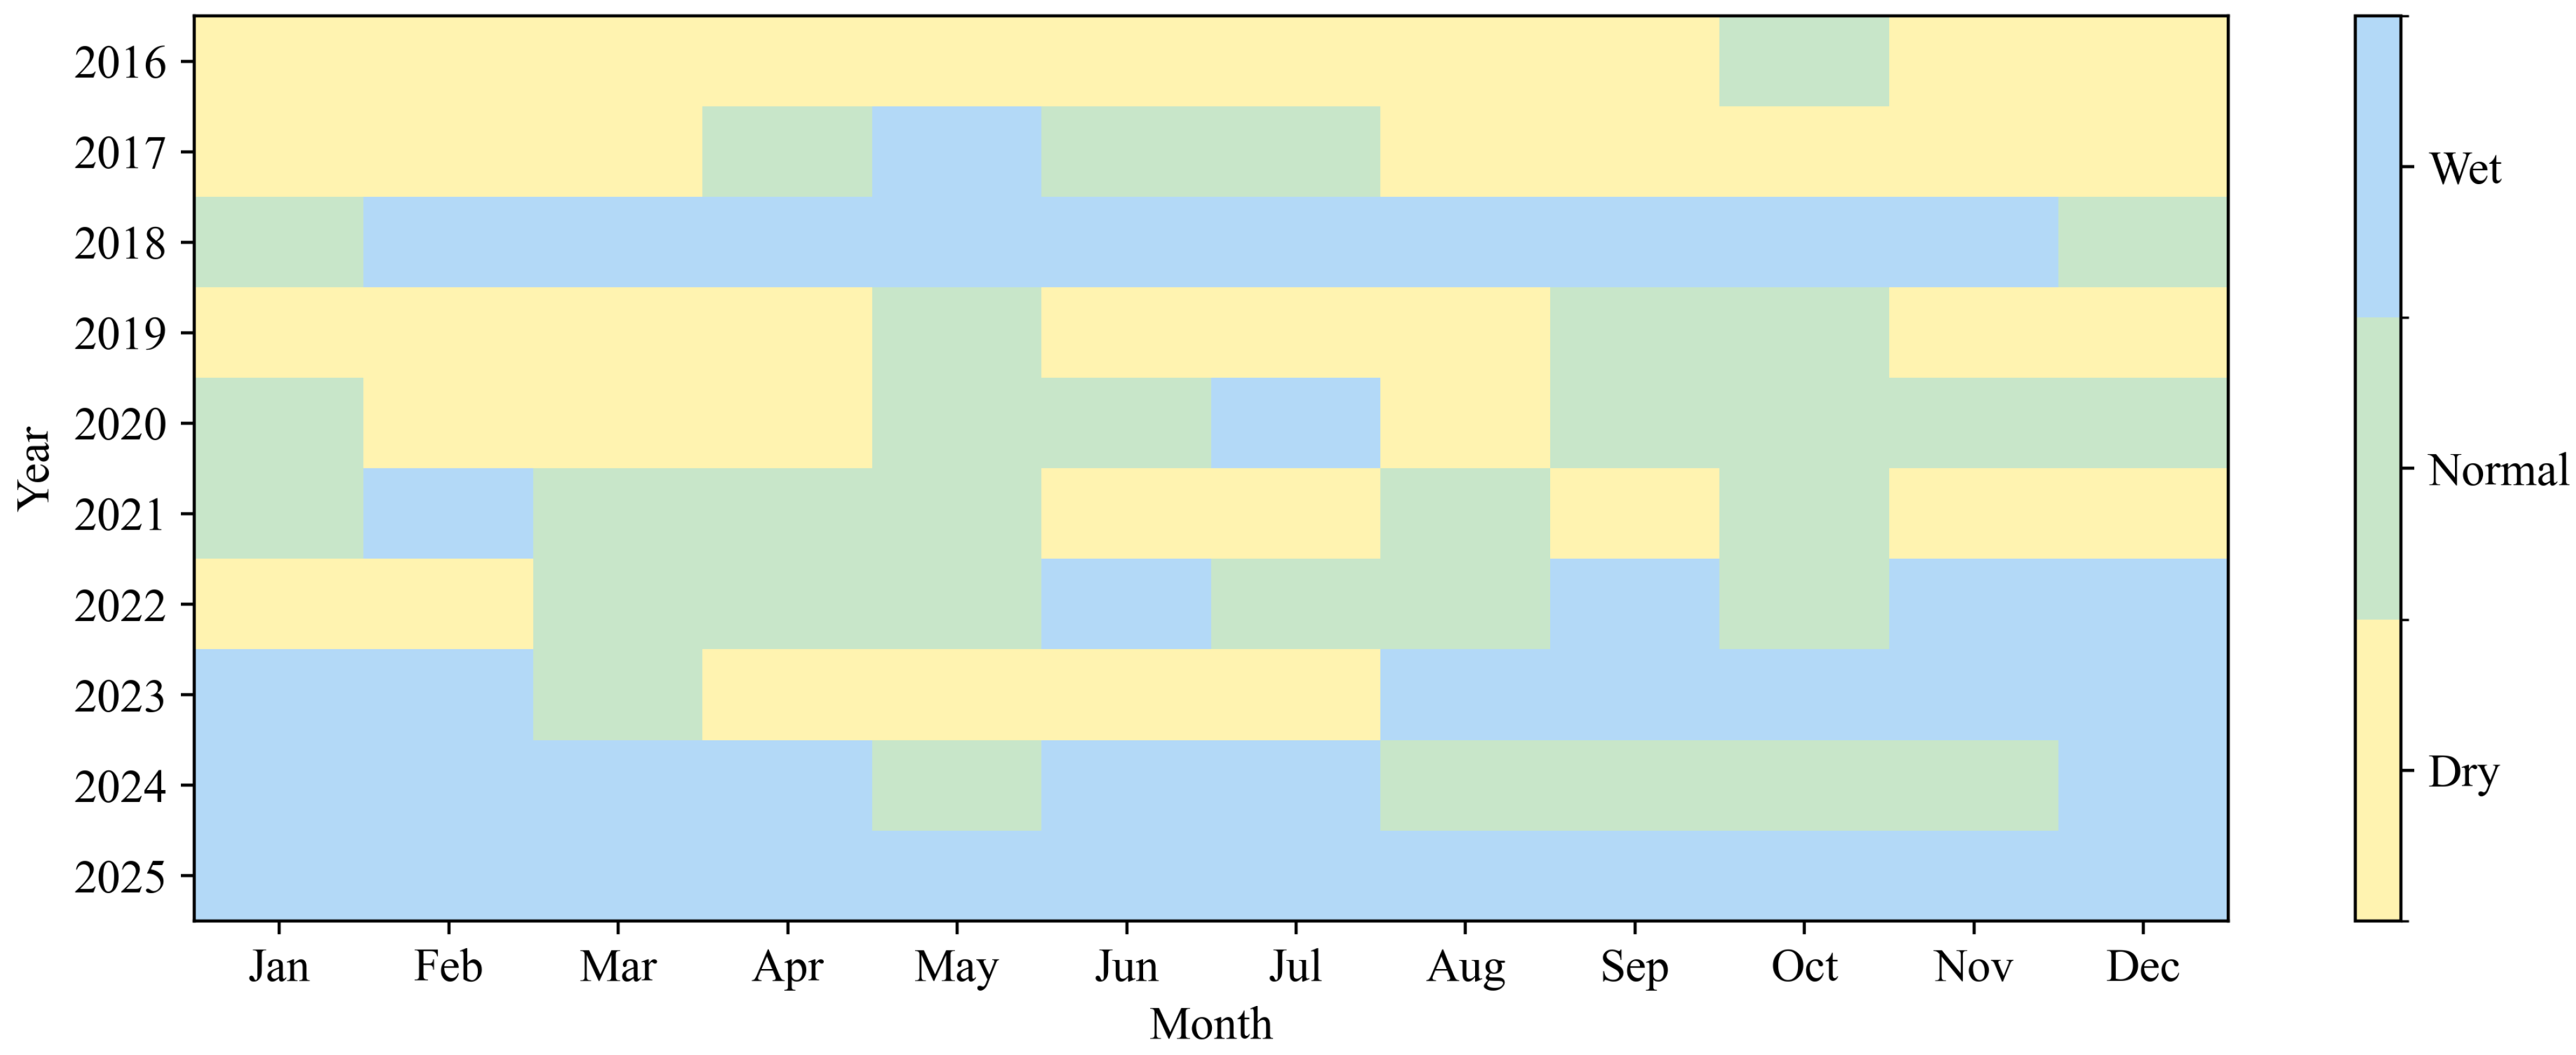
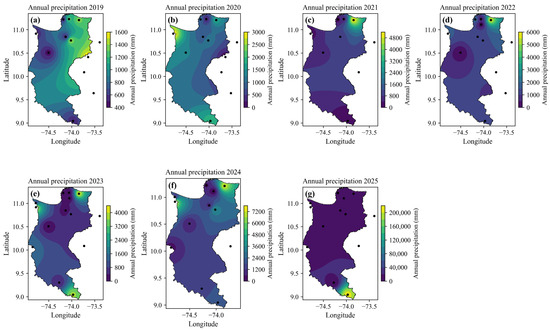
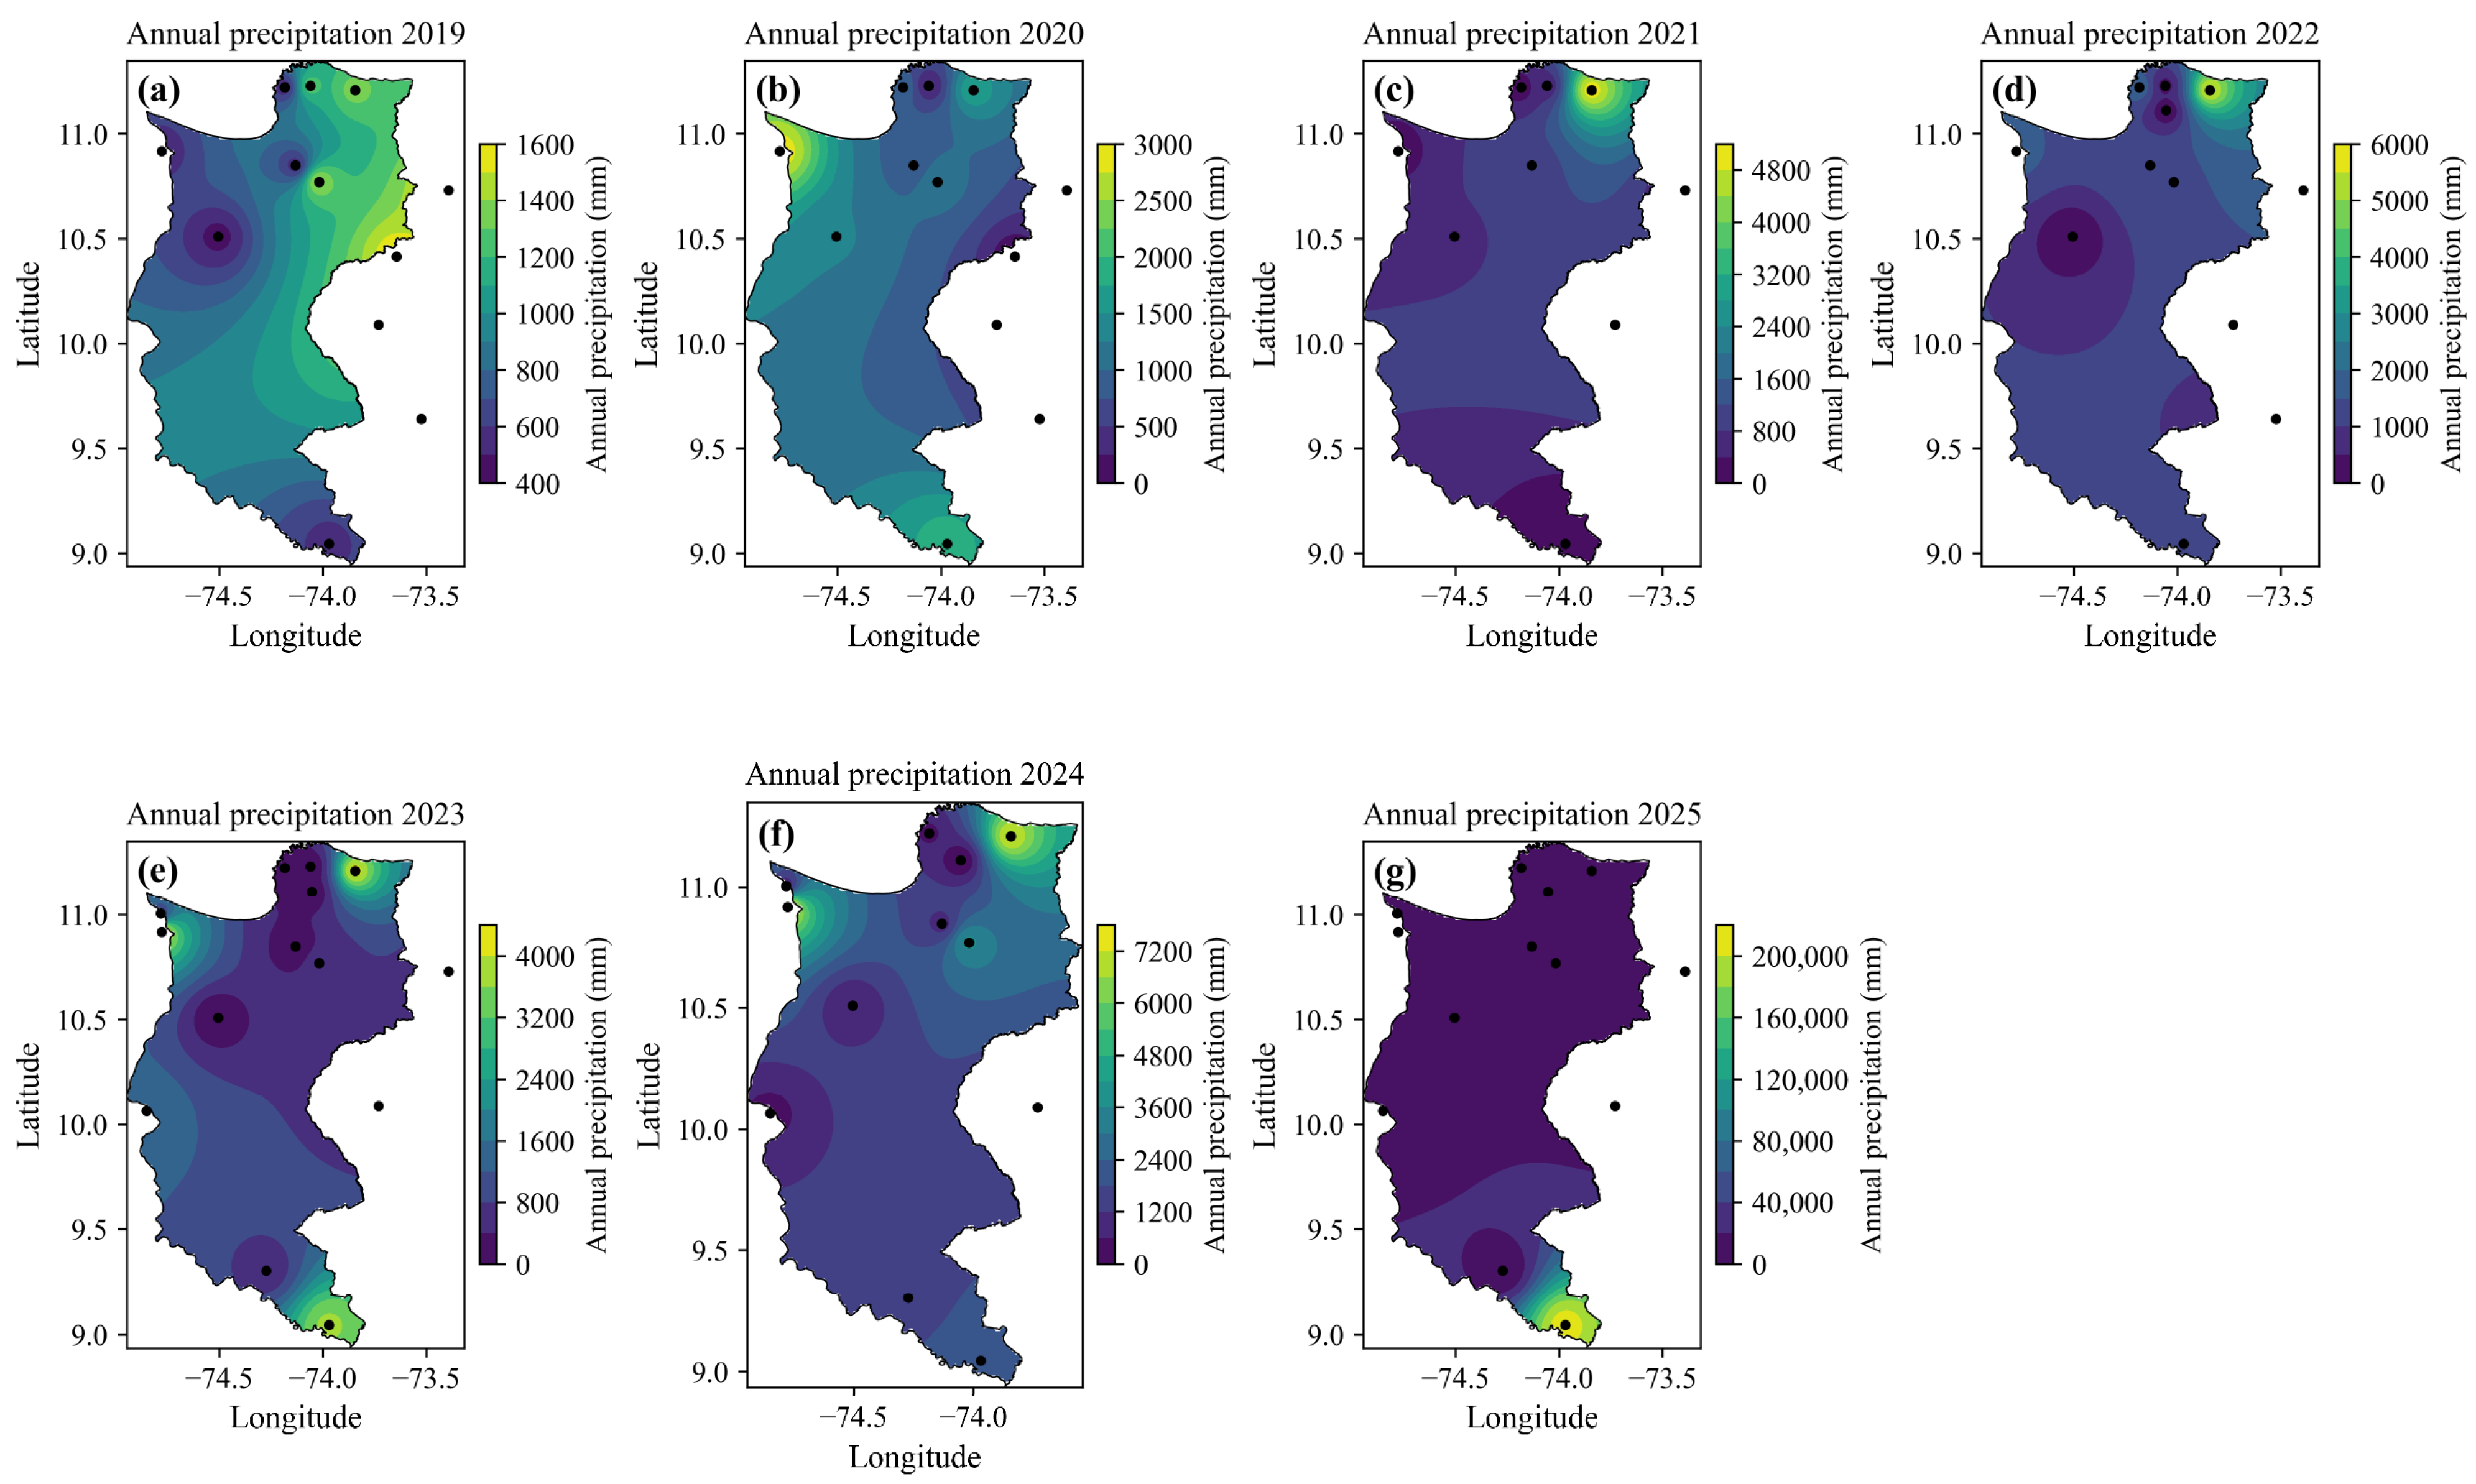
Figure 3 classifies monthly conditions as dry, normal, or wet relative to the historical median, highlighting periods of marked anomalies. Stations were grouped into zones using Thiessen polygons (Figure 4), and Figure 5 illustrates interpolated annual precipitation for 2019–2025. These maps reveal persistent north–south gradients and interannual variability.
Figure 3.
Heat map of monthly climate condition classification (Dry/Normal/Wet) for the period 2016–2025.
Figure 4.
Catchment area of each station based on its Thiessen polygon.
Figure 5.
Inverse Distance Weighting (IDW) maps of interpolated annual precipitation for the department of Magdalena, 2019–2025. (a) 2019, (b) 2020, (c) 2021, (d) 2022, (e) 2023, (f) 2024, (g) 2025.
3.2. Temporal Distribution of Detected Events
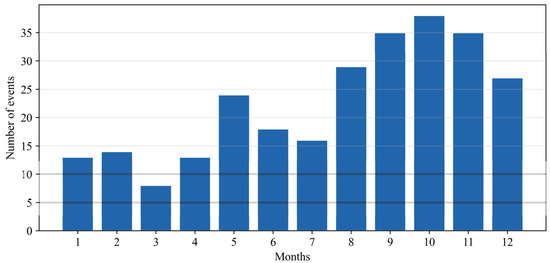
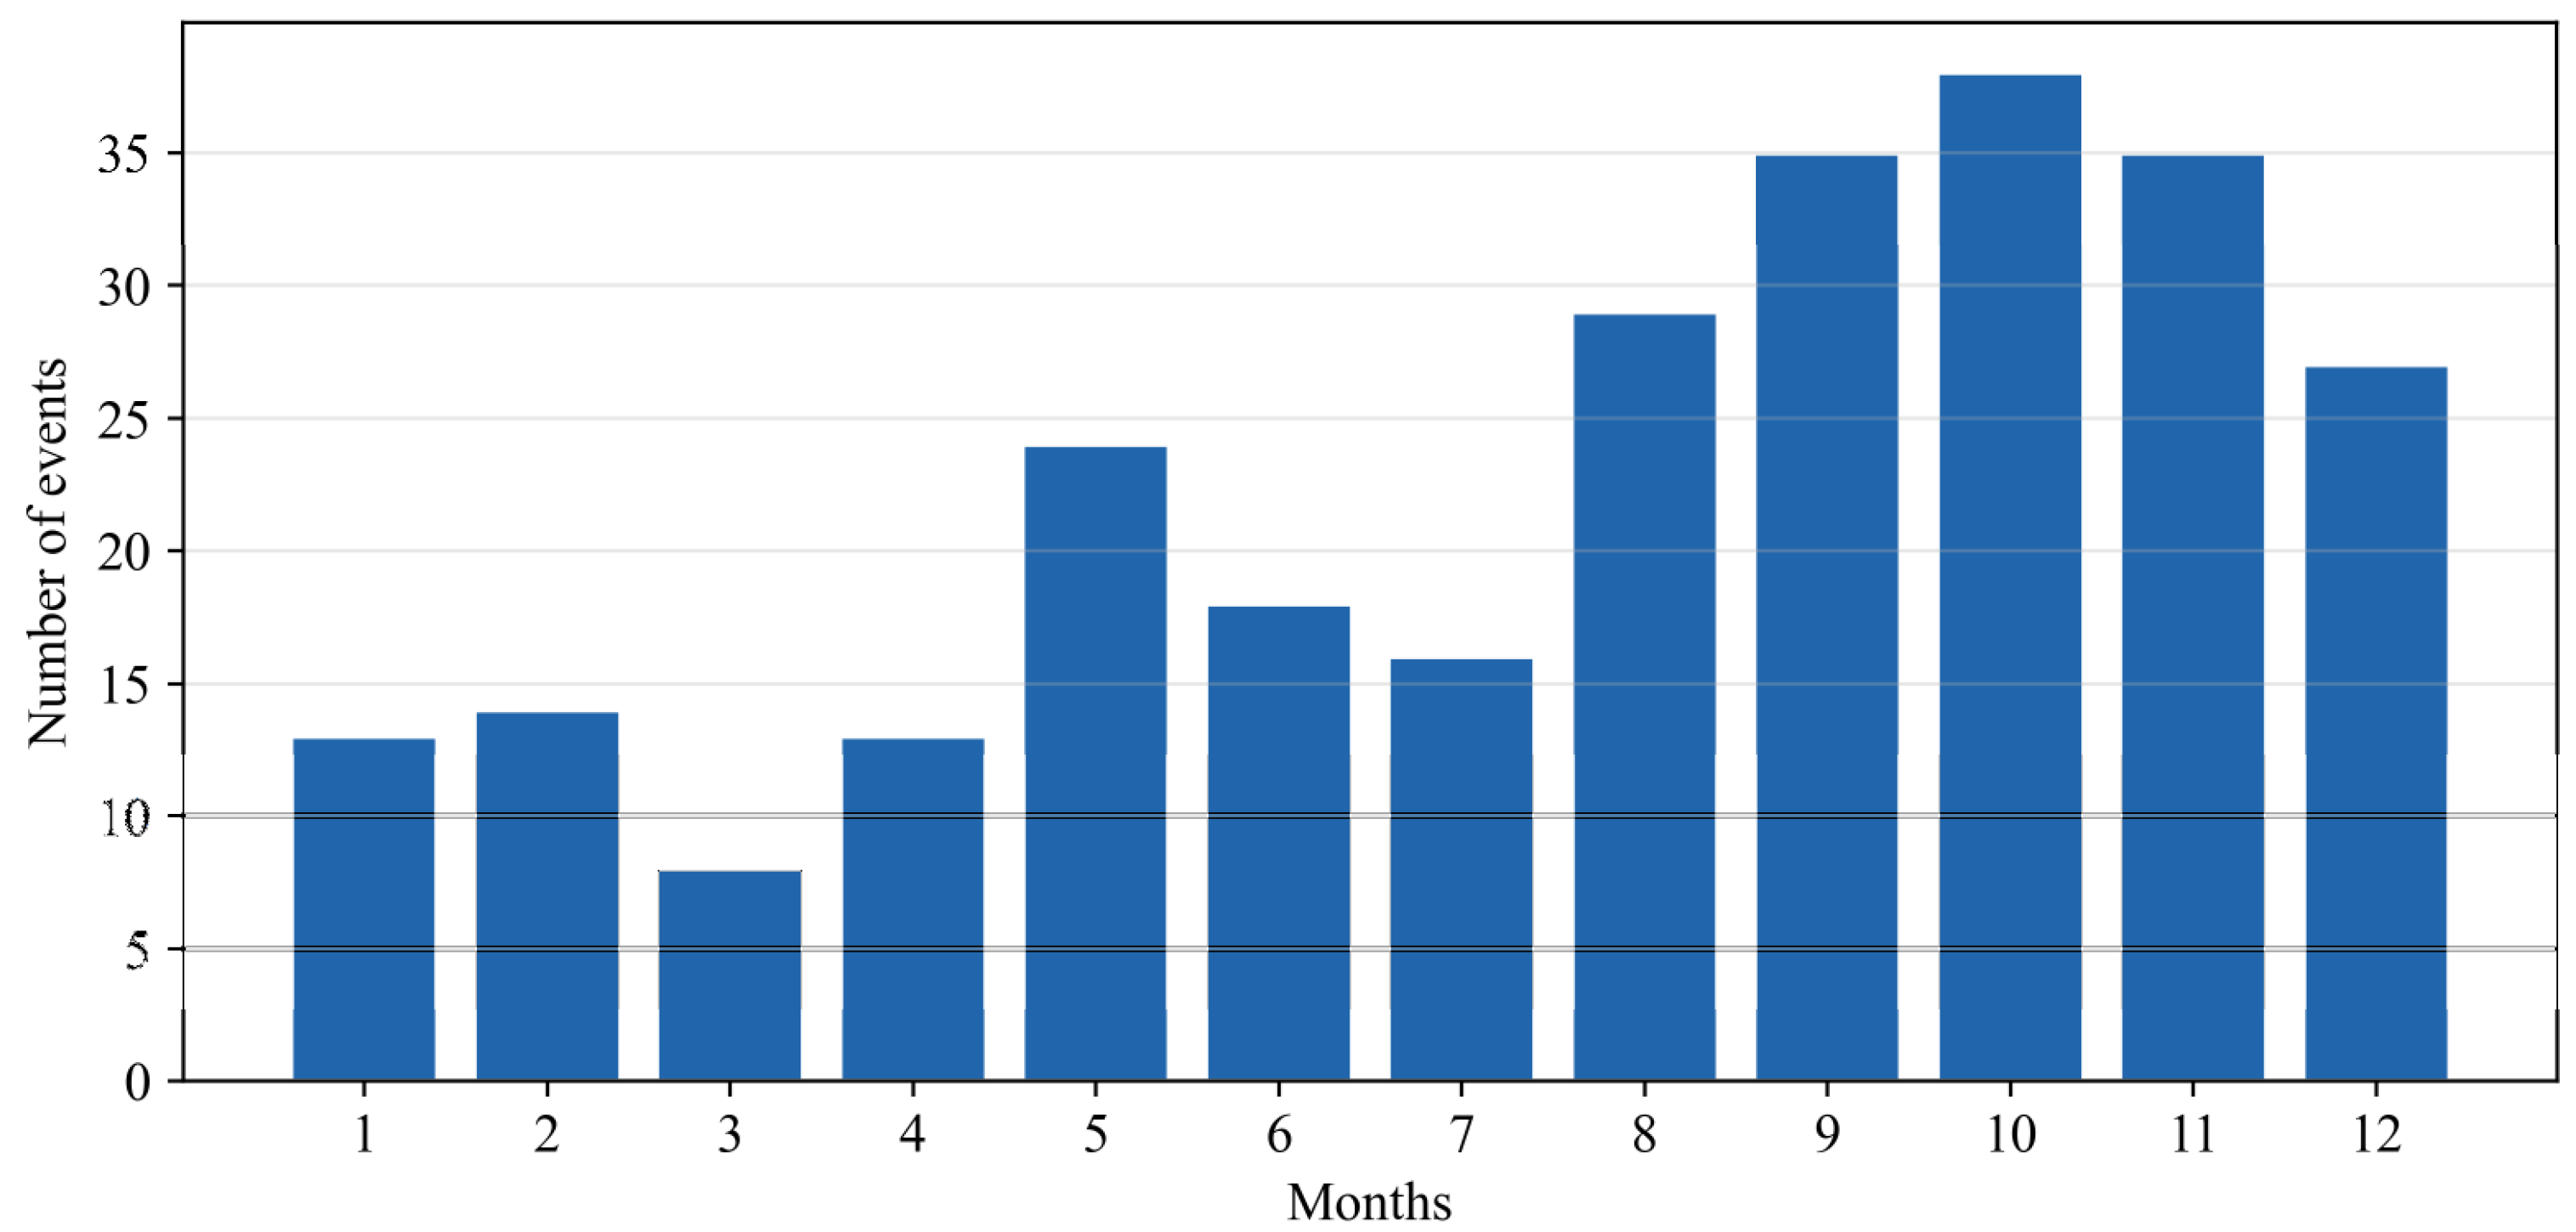
A total of 270 storms with durations between 5 and 6 h were identified across all zones. As shown in Figure 6, these events occur predominantly during the second rainy season (September–November). October recorded the largest number of events (38), followed by September and November (35 each), confirming the temporal concentration of short-duration storms during this period.
Figure 6.
Monthly distribution of 5 to 6 h precipitation events detected in all study areas.
3.3. Intra-Event Variability by Zone
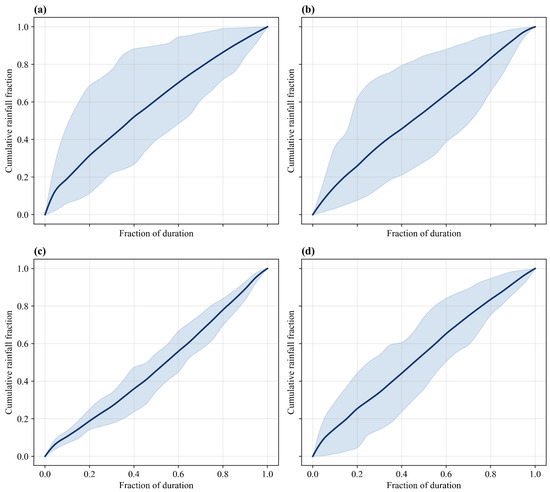
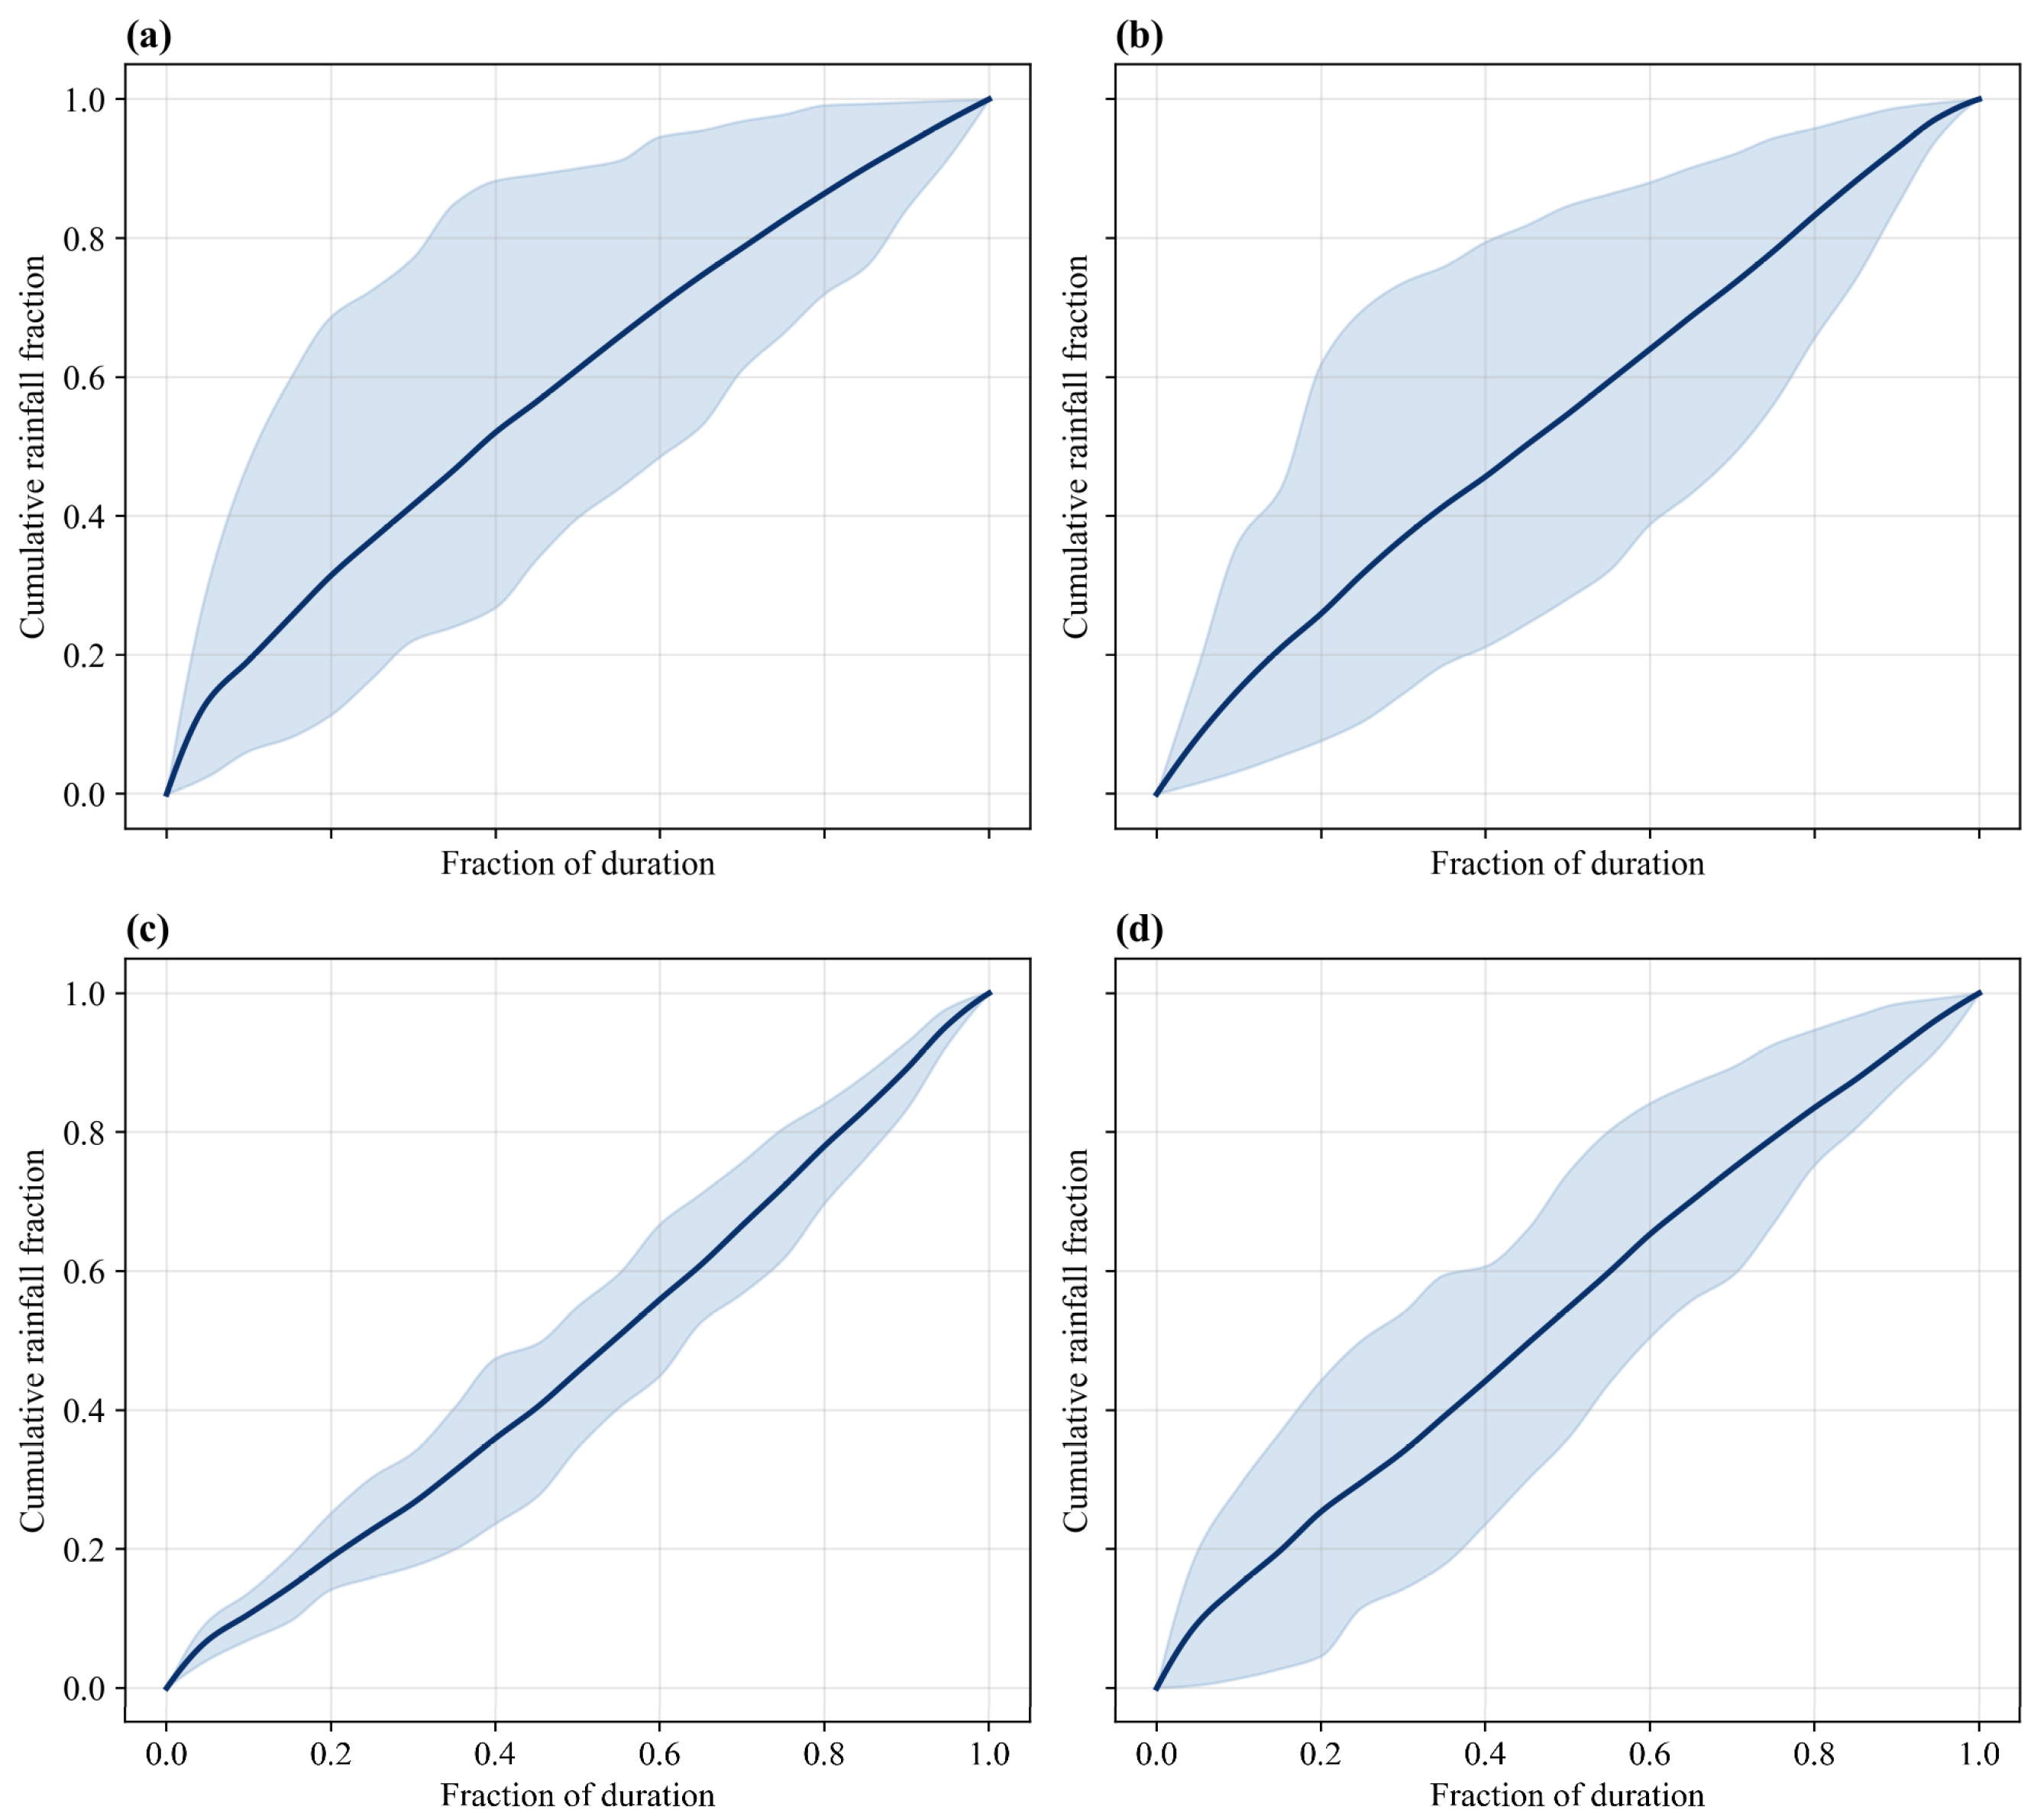
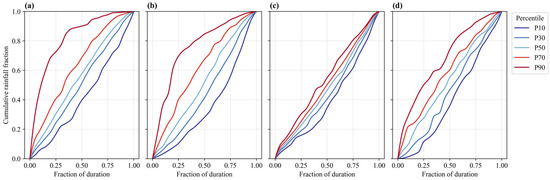
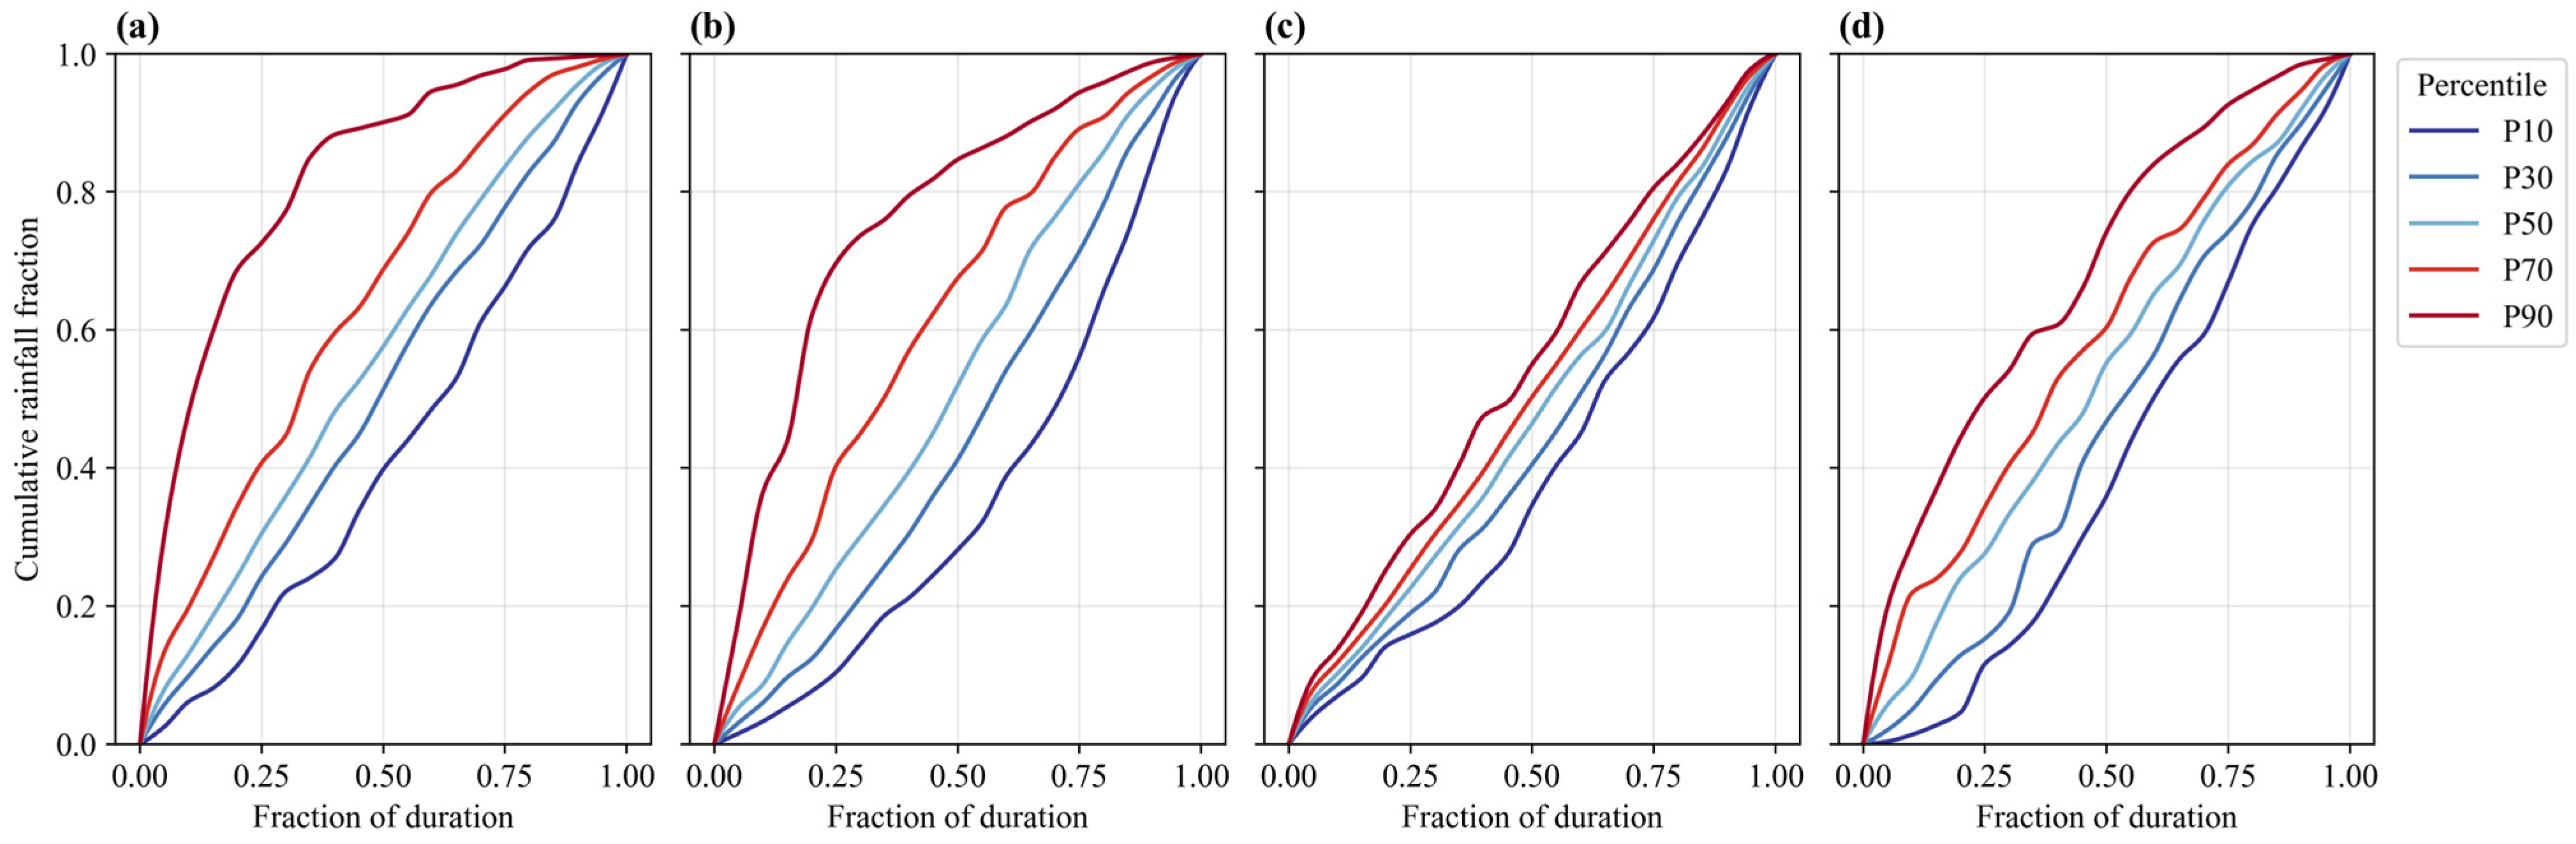
Figure 7 presents the P10–P90 envelopes of normalized cumulative mass curves for the four zones. All zones exhibit substantial intra-storm variability, as reflected in the width of the envelopes. The Northern zone shows a clear tendency toward early-peak storms, while the Central zone displays a narrower envelope, indicating more homogeneous temporal structure.
Figure 7.
P10–P90 envelope bands (shaded region) of the normalized cumulative mass curves by study area: (a) North, (b) Sierra Nevada, (c) Central, and (d) South.
The Sierra Nevada and Southern zones show wider envelopes, suggesting the coexistence of different storm types within each region. These contrasts highlight the need for region-specific representation of temporal rainfall patterns.
3.4. Regionalization by Zone
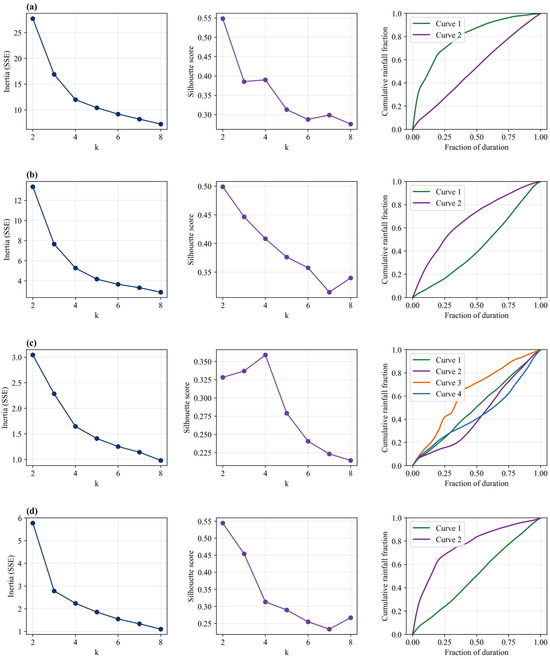
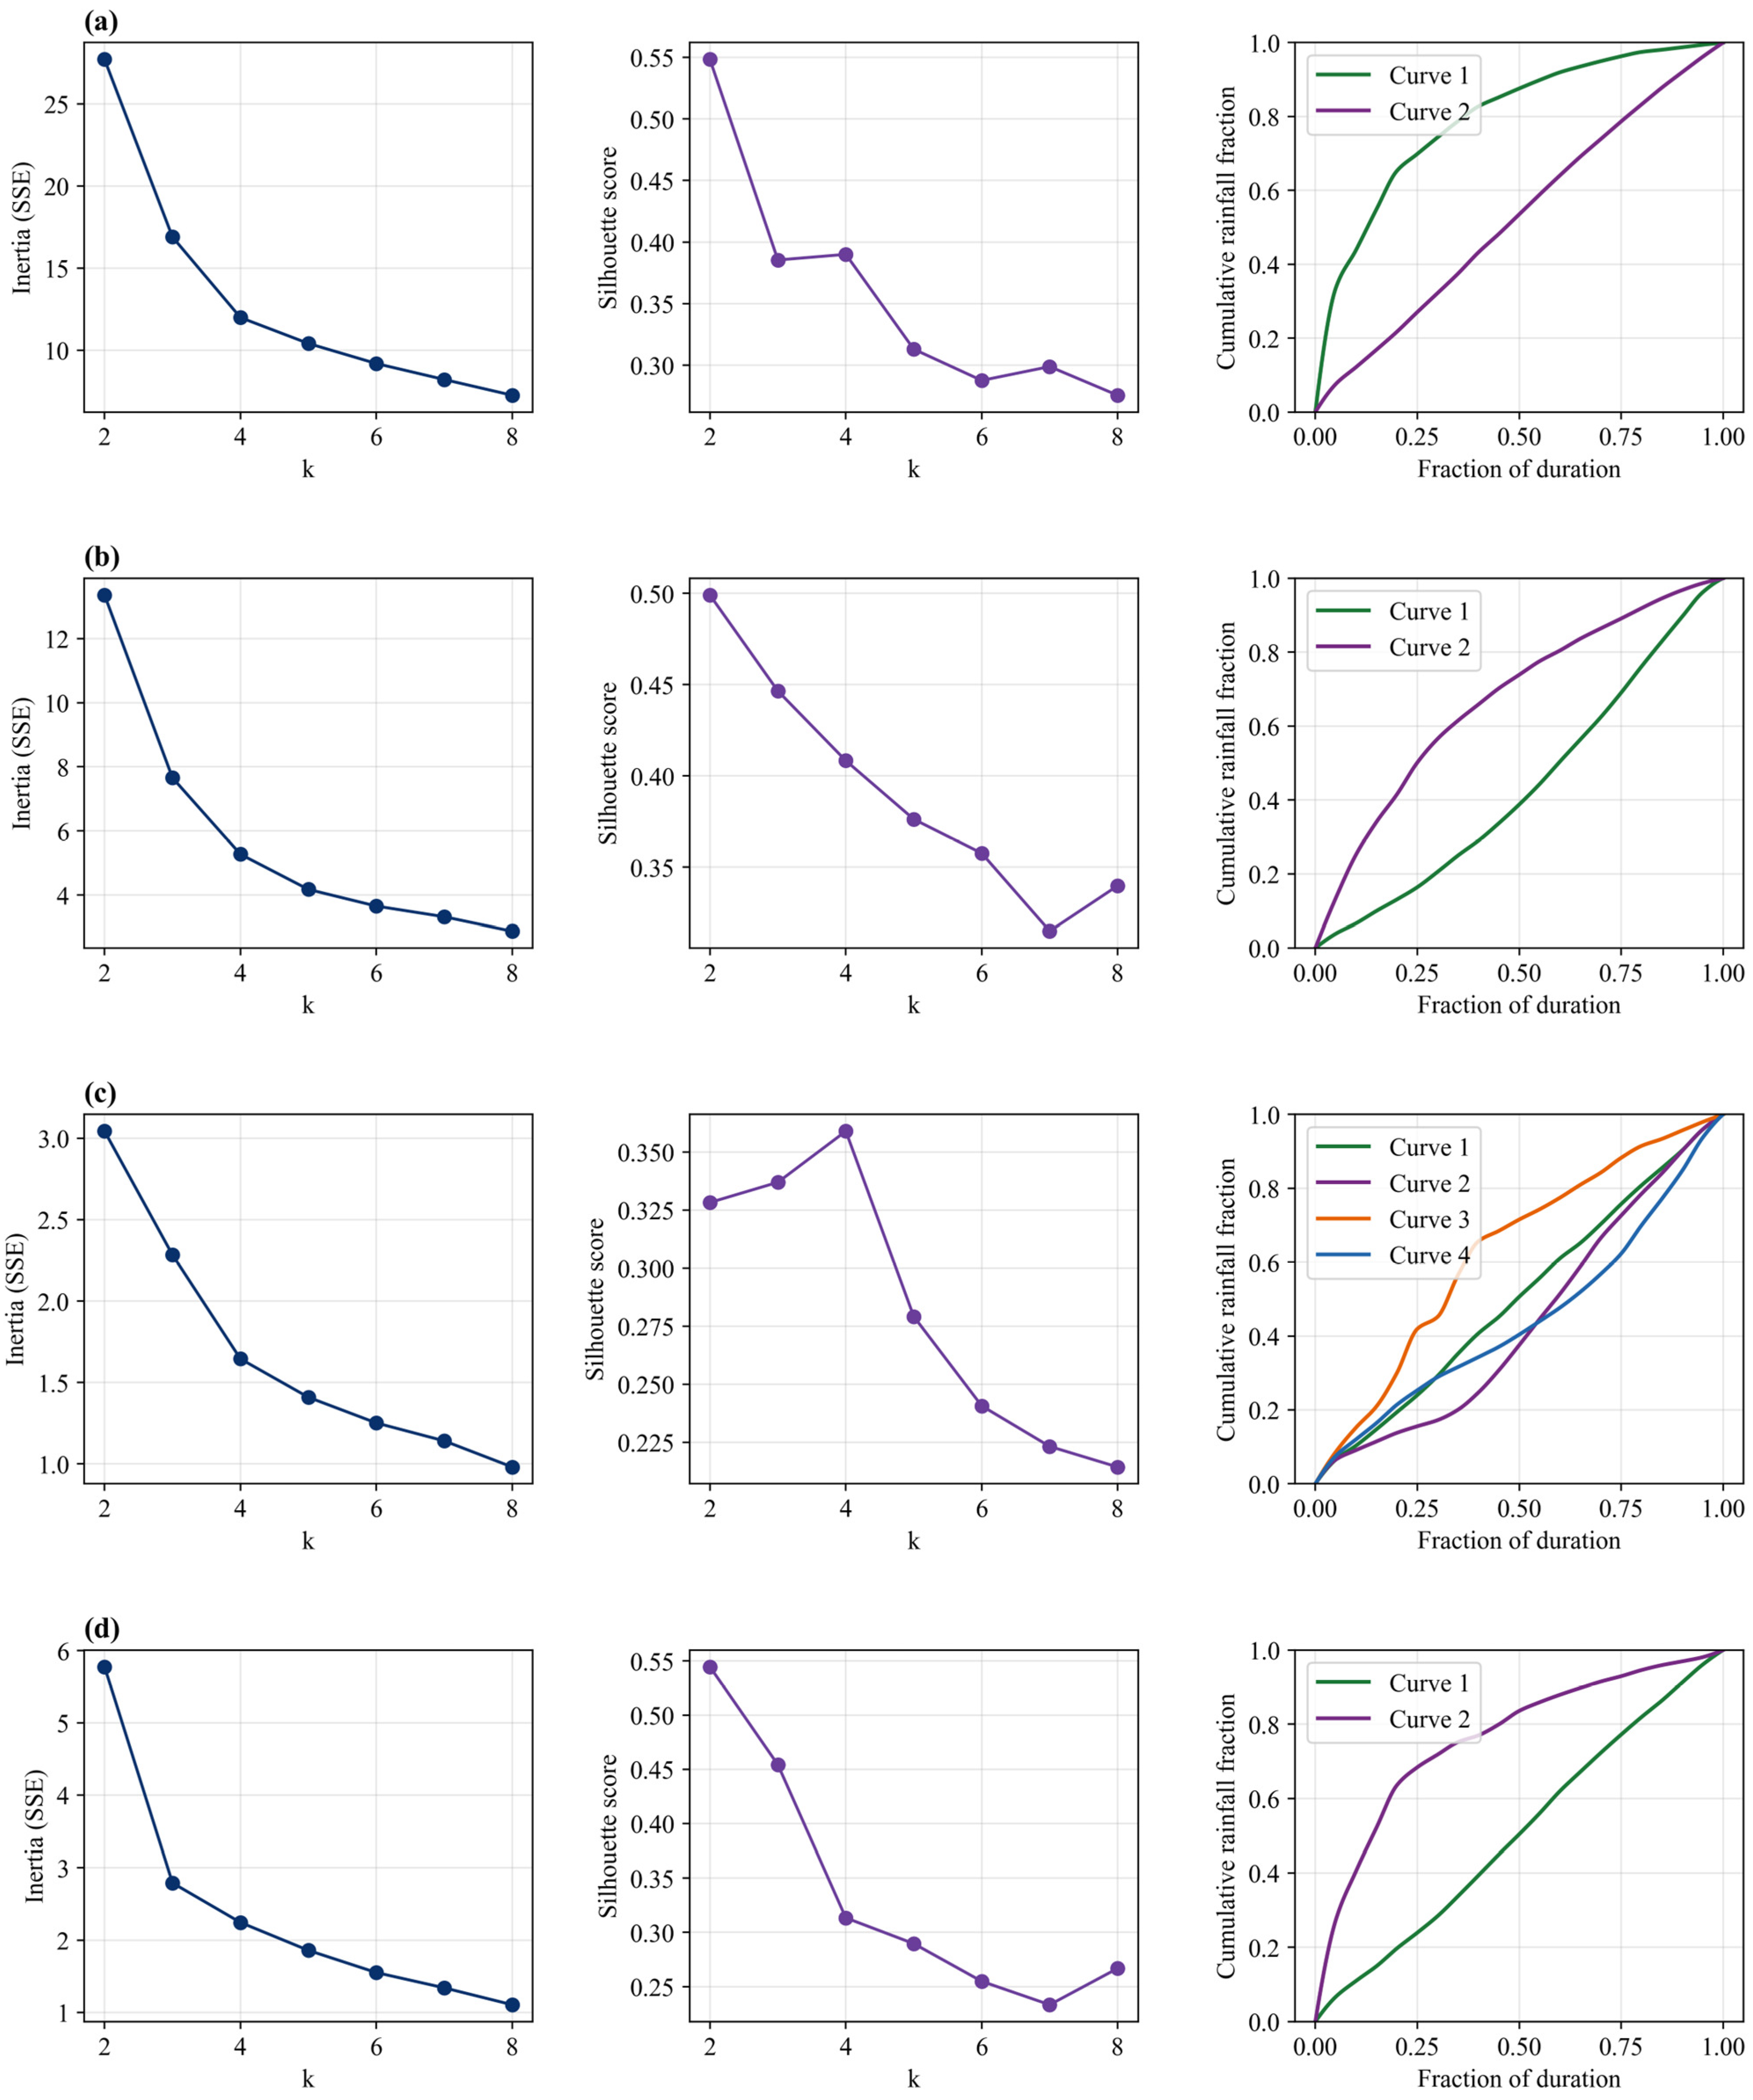
Clustering yielded distinct temporal patterns for each zone (Figure 8). The elbow and silhouette criteria identified two clusters for the North, Sierra Nevada, and South zones, and four clusters for the Central zone. Statistical tests confirmed significant differences (p < 0.001) in key shape metrics (y50, T50), with large effect sizes (δ > 0.47), confirming clear separation between storm types (Table 2).
Figure 8.
Composite figure of the k-means analysis by zone: elbow method (left), silhouette (center), and regionalized Huff curves (right). Rows: (a) North, (b) Sierra Nevada, (c) Central, and (d) South. SSE: Sum of Squared Errors.
Table 2.
Paired Mann–Whitney U tests between groups within each zone. y50 and T50: main descriptors of the Huff curve shape. Medians expressed as dimensionless fractions [0–1].
3.5. Probability Distribution by Zone
Figure 9 shows the probabilistic Huff curves (P10–P90) for each zone. Early-peak storms dominate the upper percentiles in the Northern zone, where the P90 curve exceeds 60% accumulation within the first 20% of storm duration. Table 3 summarizes percentile distributions across zones. The Northern zone exhibits the highest median early accumulation (30.5% at 25% duration), while the Central zone shows a more uniform temporal structure (22.6%).
Figure 9.
Probabilistic Huff curves by zone (P10 to P90 percentiles): (a) North, (b) Sierra Nevada, (c) Central, and (d) South.
Table 3.
Percentage of accumulated precipitation in each temporal quartile by study area. The median corresponds to the P50 curve; the 95% CI encompasses the P10–P90 probability envelope.
3.6. Departmental Regionalization
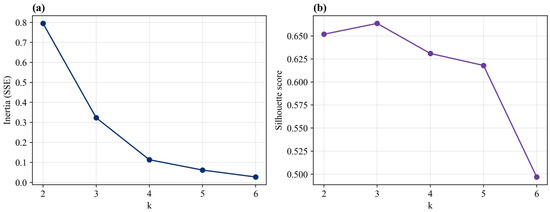
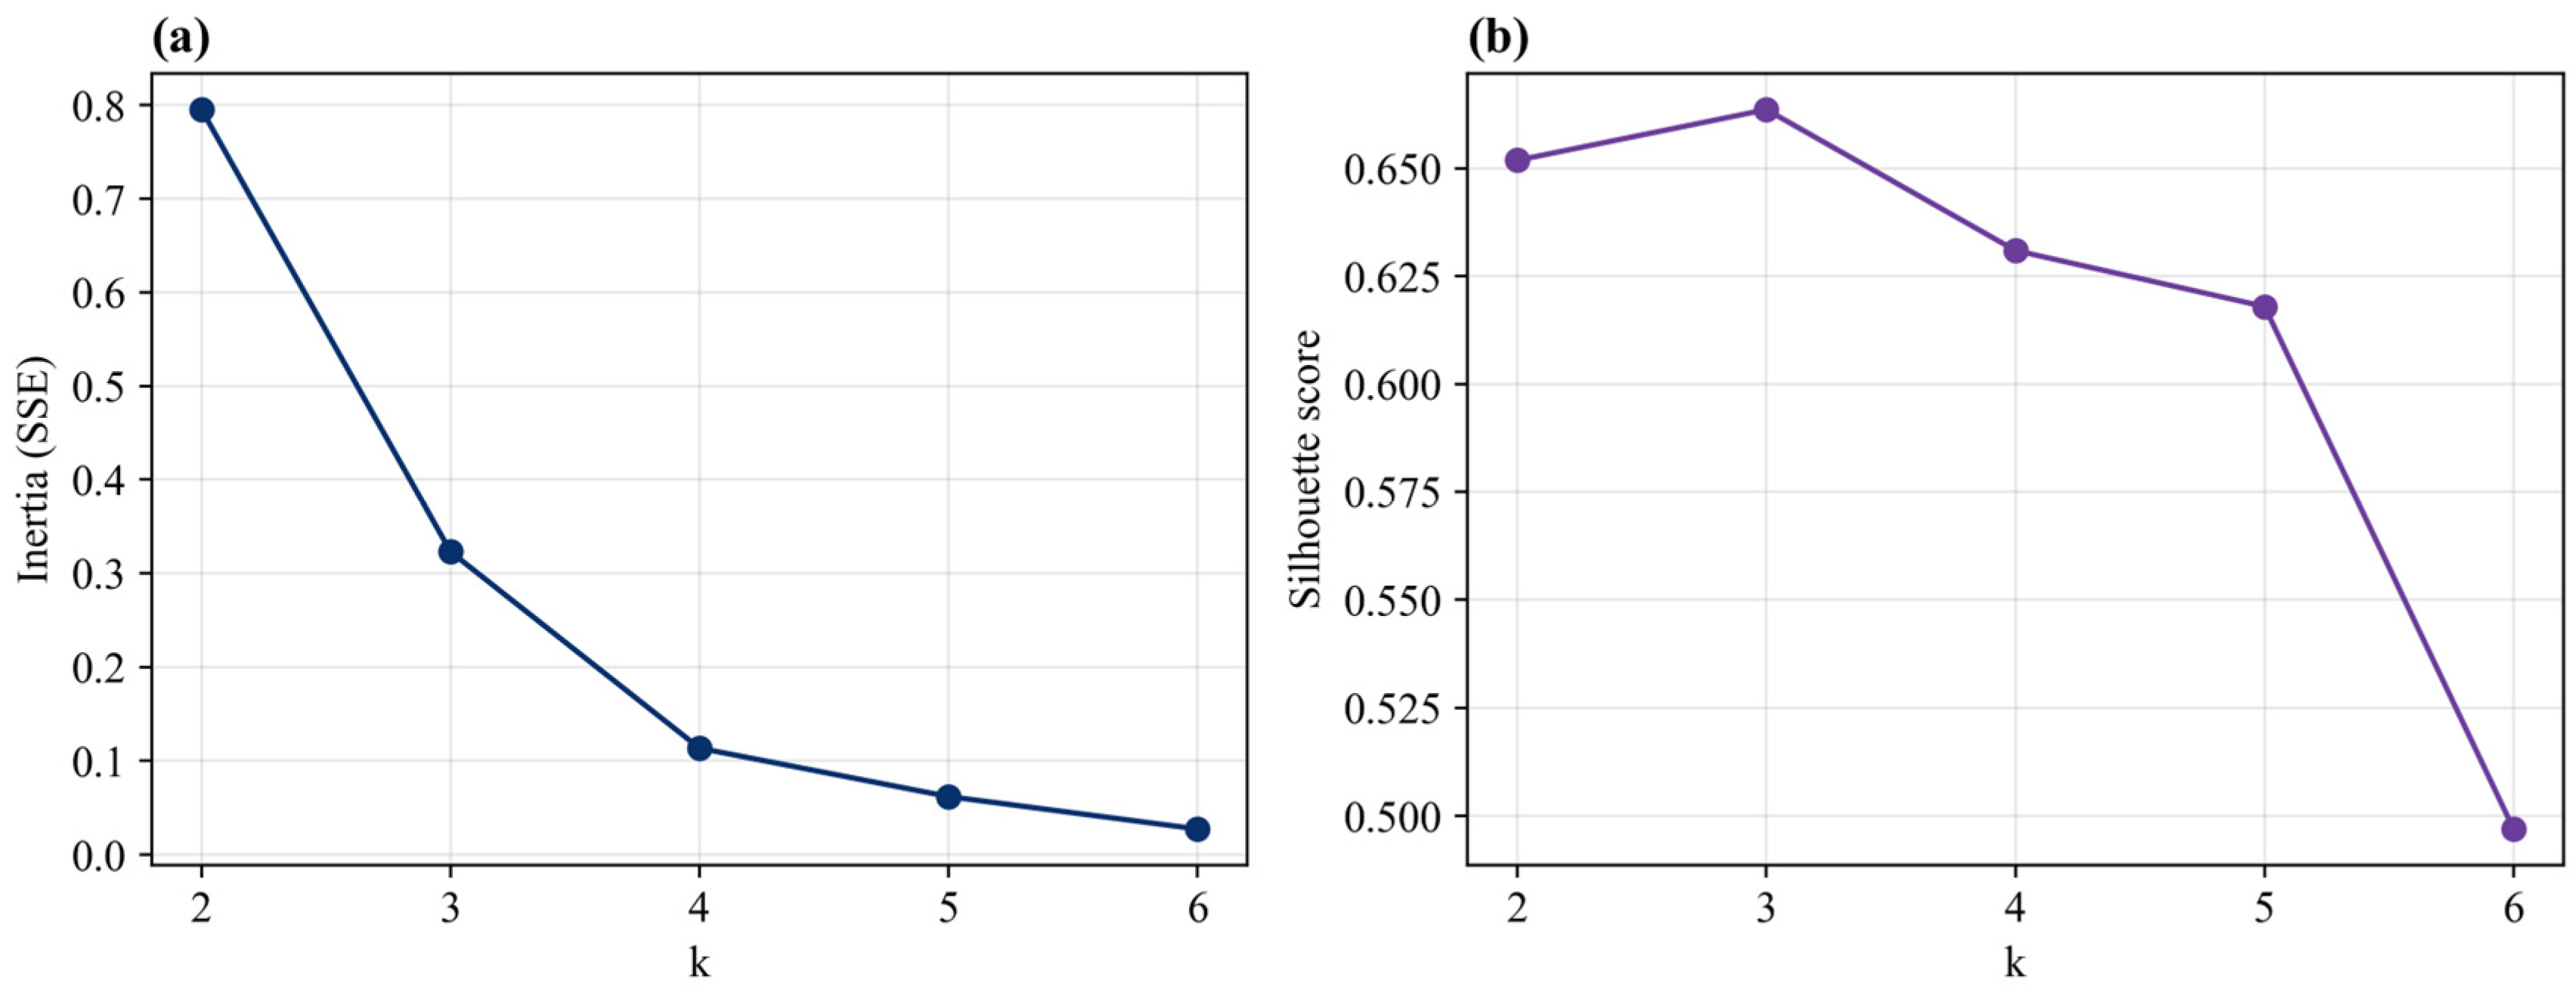
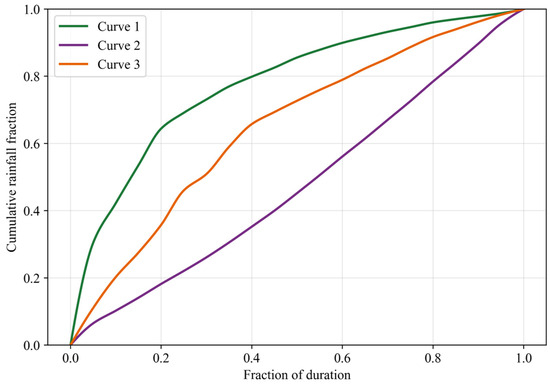
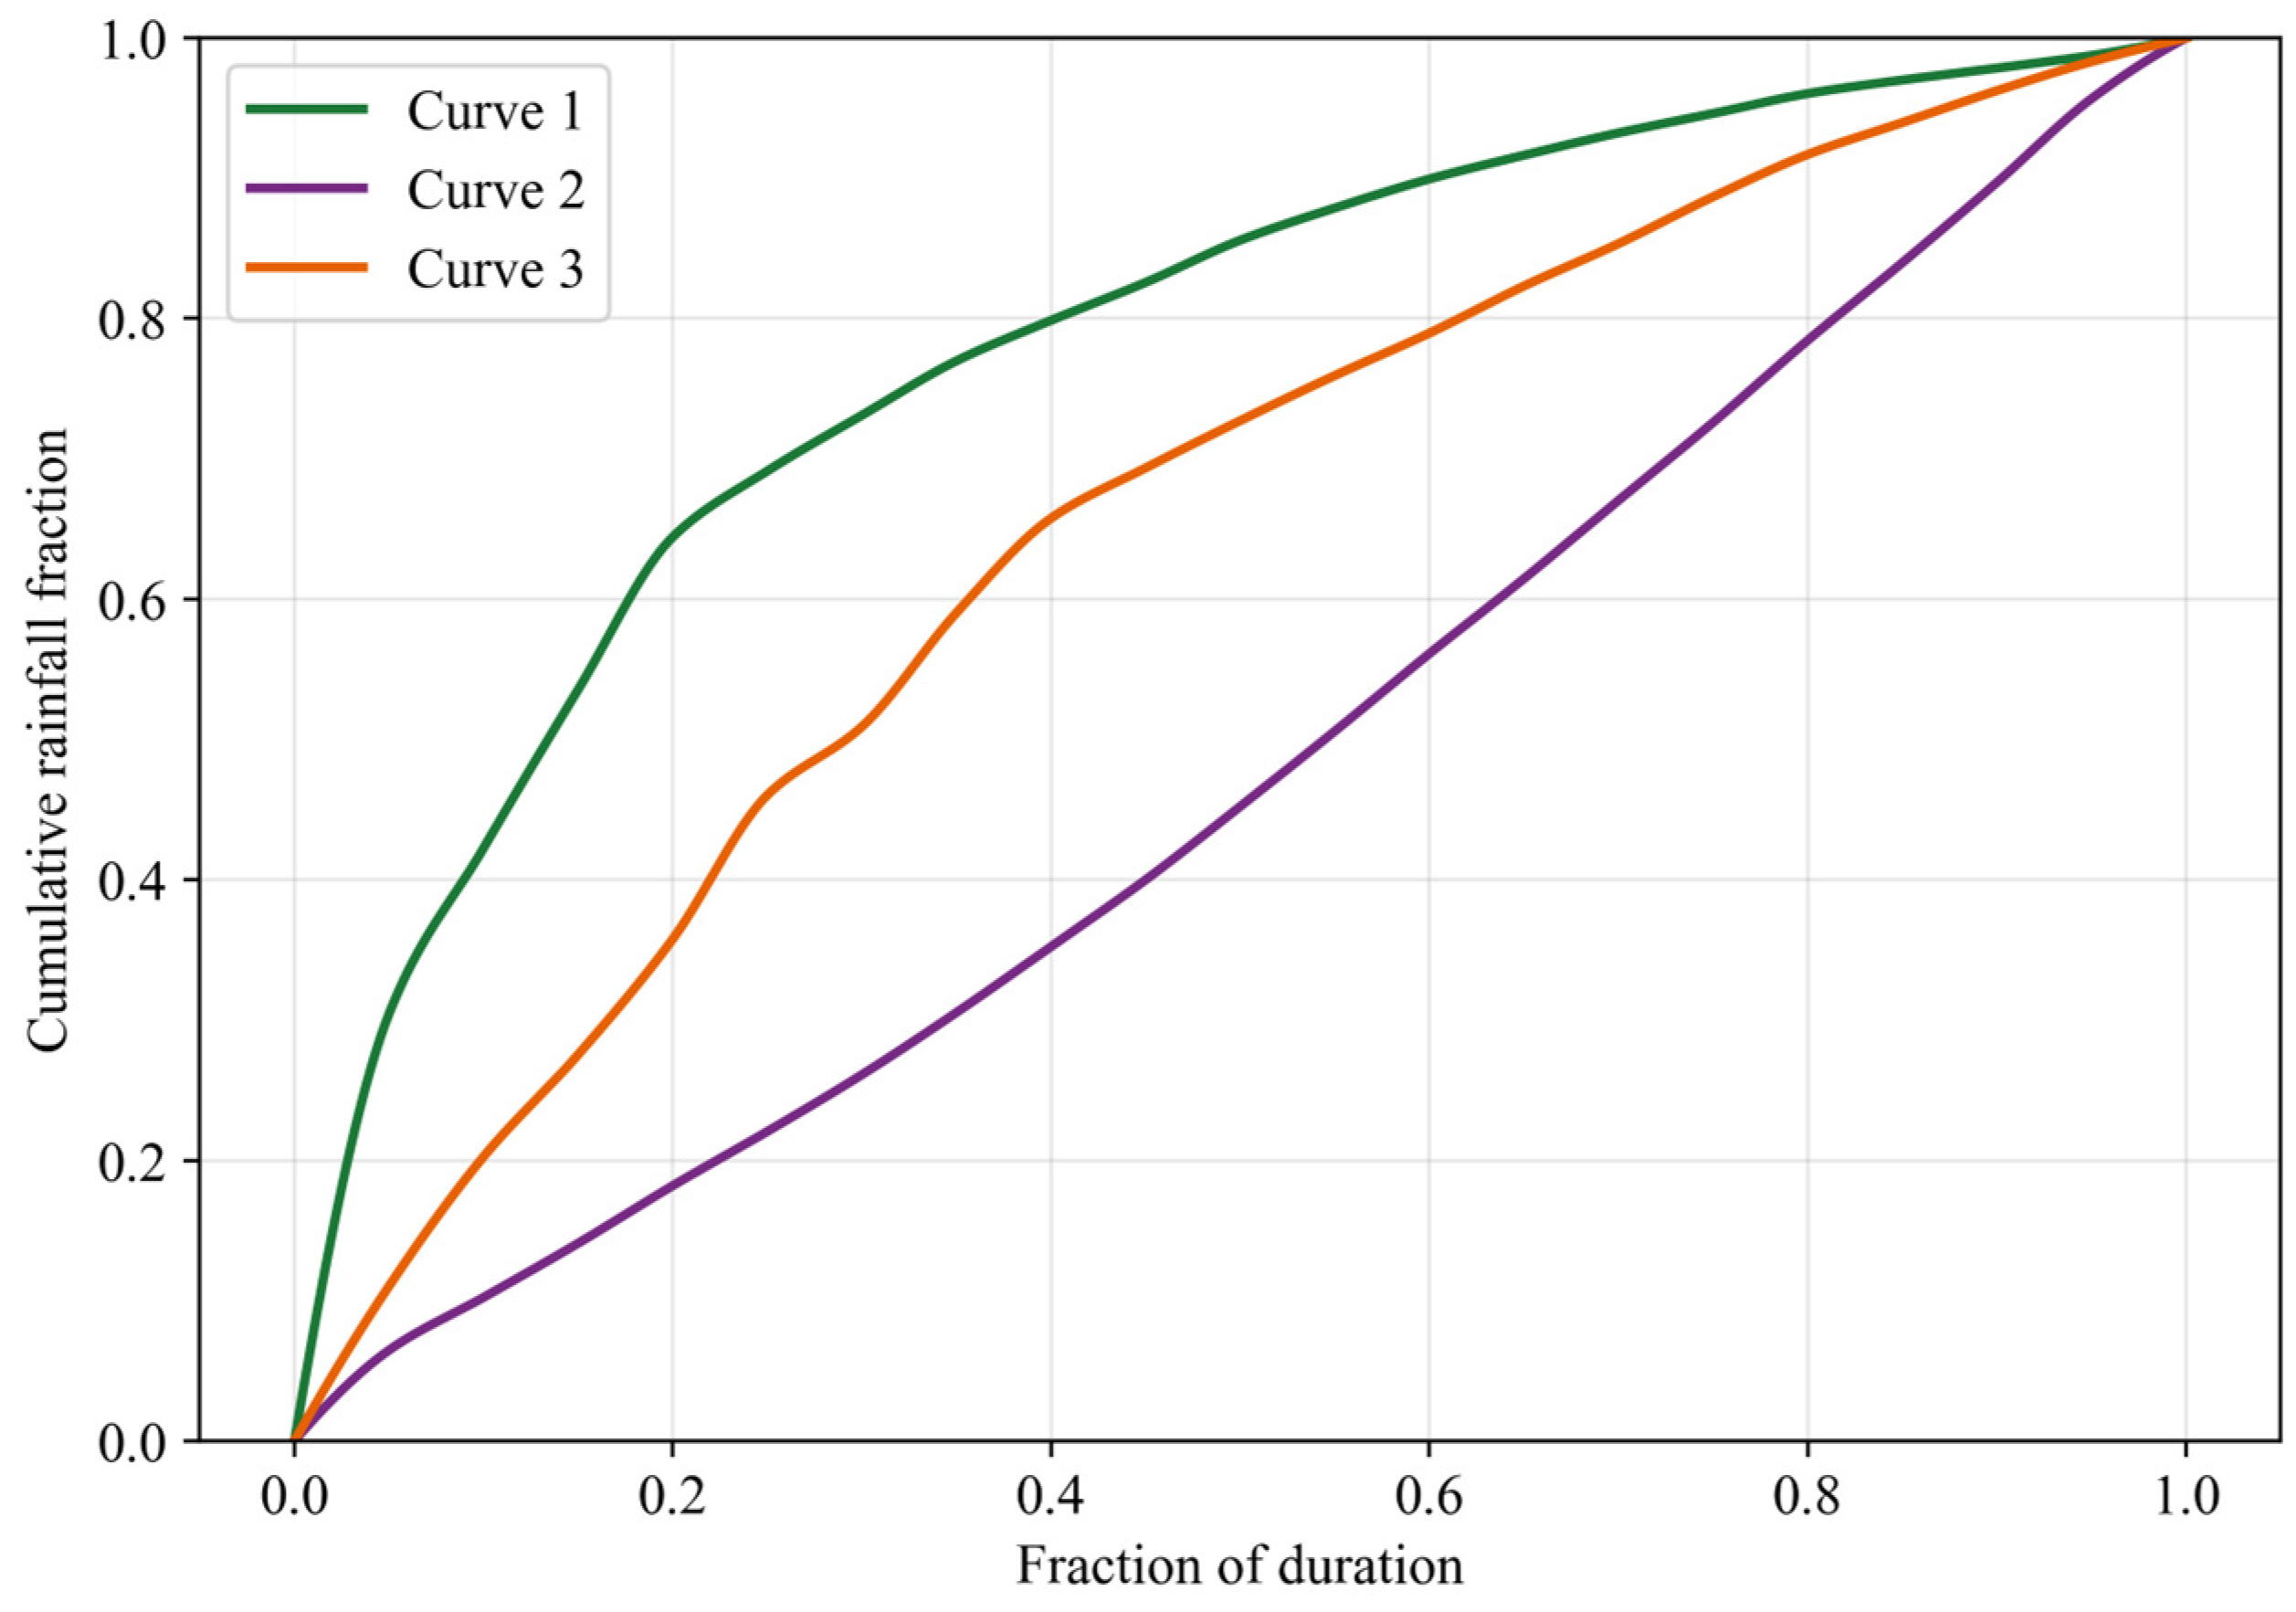
Using zone-level centroids, a departmental-scale clustering produced three distinct curve types (Figure 10 and Figure 11): early-peak (Curve 1), uniform (Curve 2), and intermediate (Curve 3). Table 4 shows quartile distributions, confirming clear separation among storm structures. Confidence intervals for the shape metrics (Table 5) demonstrate the robustness of the regionalized curves across zones and at the departmental scale.
Figure 10.
Elbow (a) and silhouette (b) methods for selecting the optimal number of clusters in the departmental regionalization of Magdalena. SSE: Sum of Squared Errors.
Figure 11.
Final regionalized Huff curves for the department of Magdalena (k = 3).
Table 4.
Percentage of accumulated precipitation in each temporal quartile for the regionalized curves of Magdalena.
Table 5.
Shape metrics of the regionalized Huff curves: T25, T50, y25, and y50 with 95% confidence intervals obtained via bootstrap by zone and for the departmental curves.
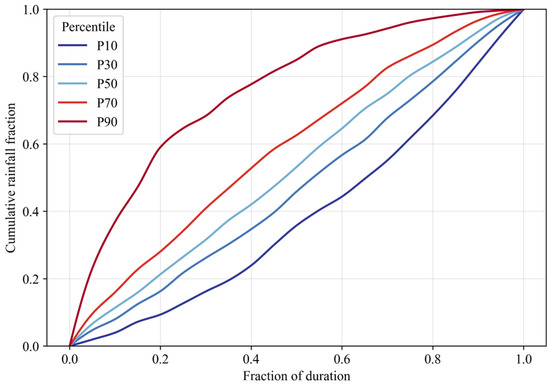
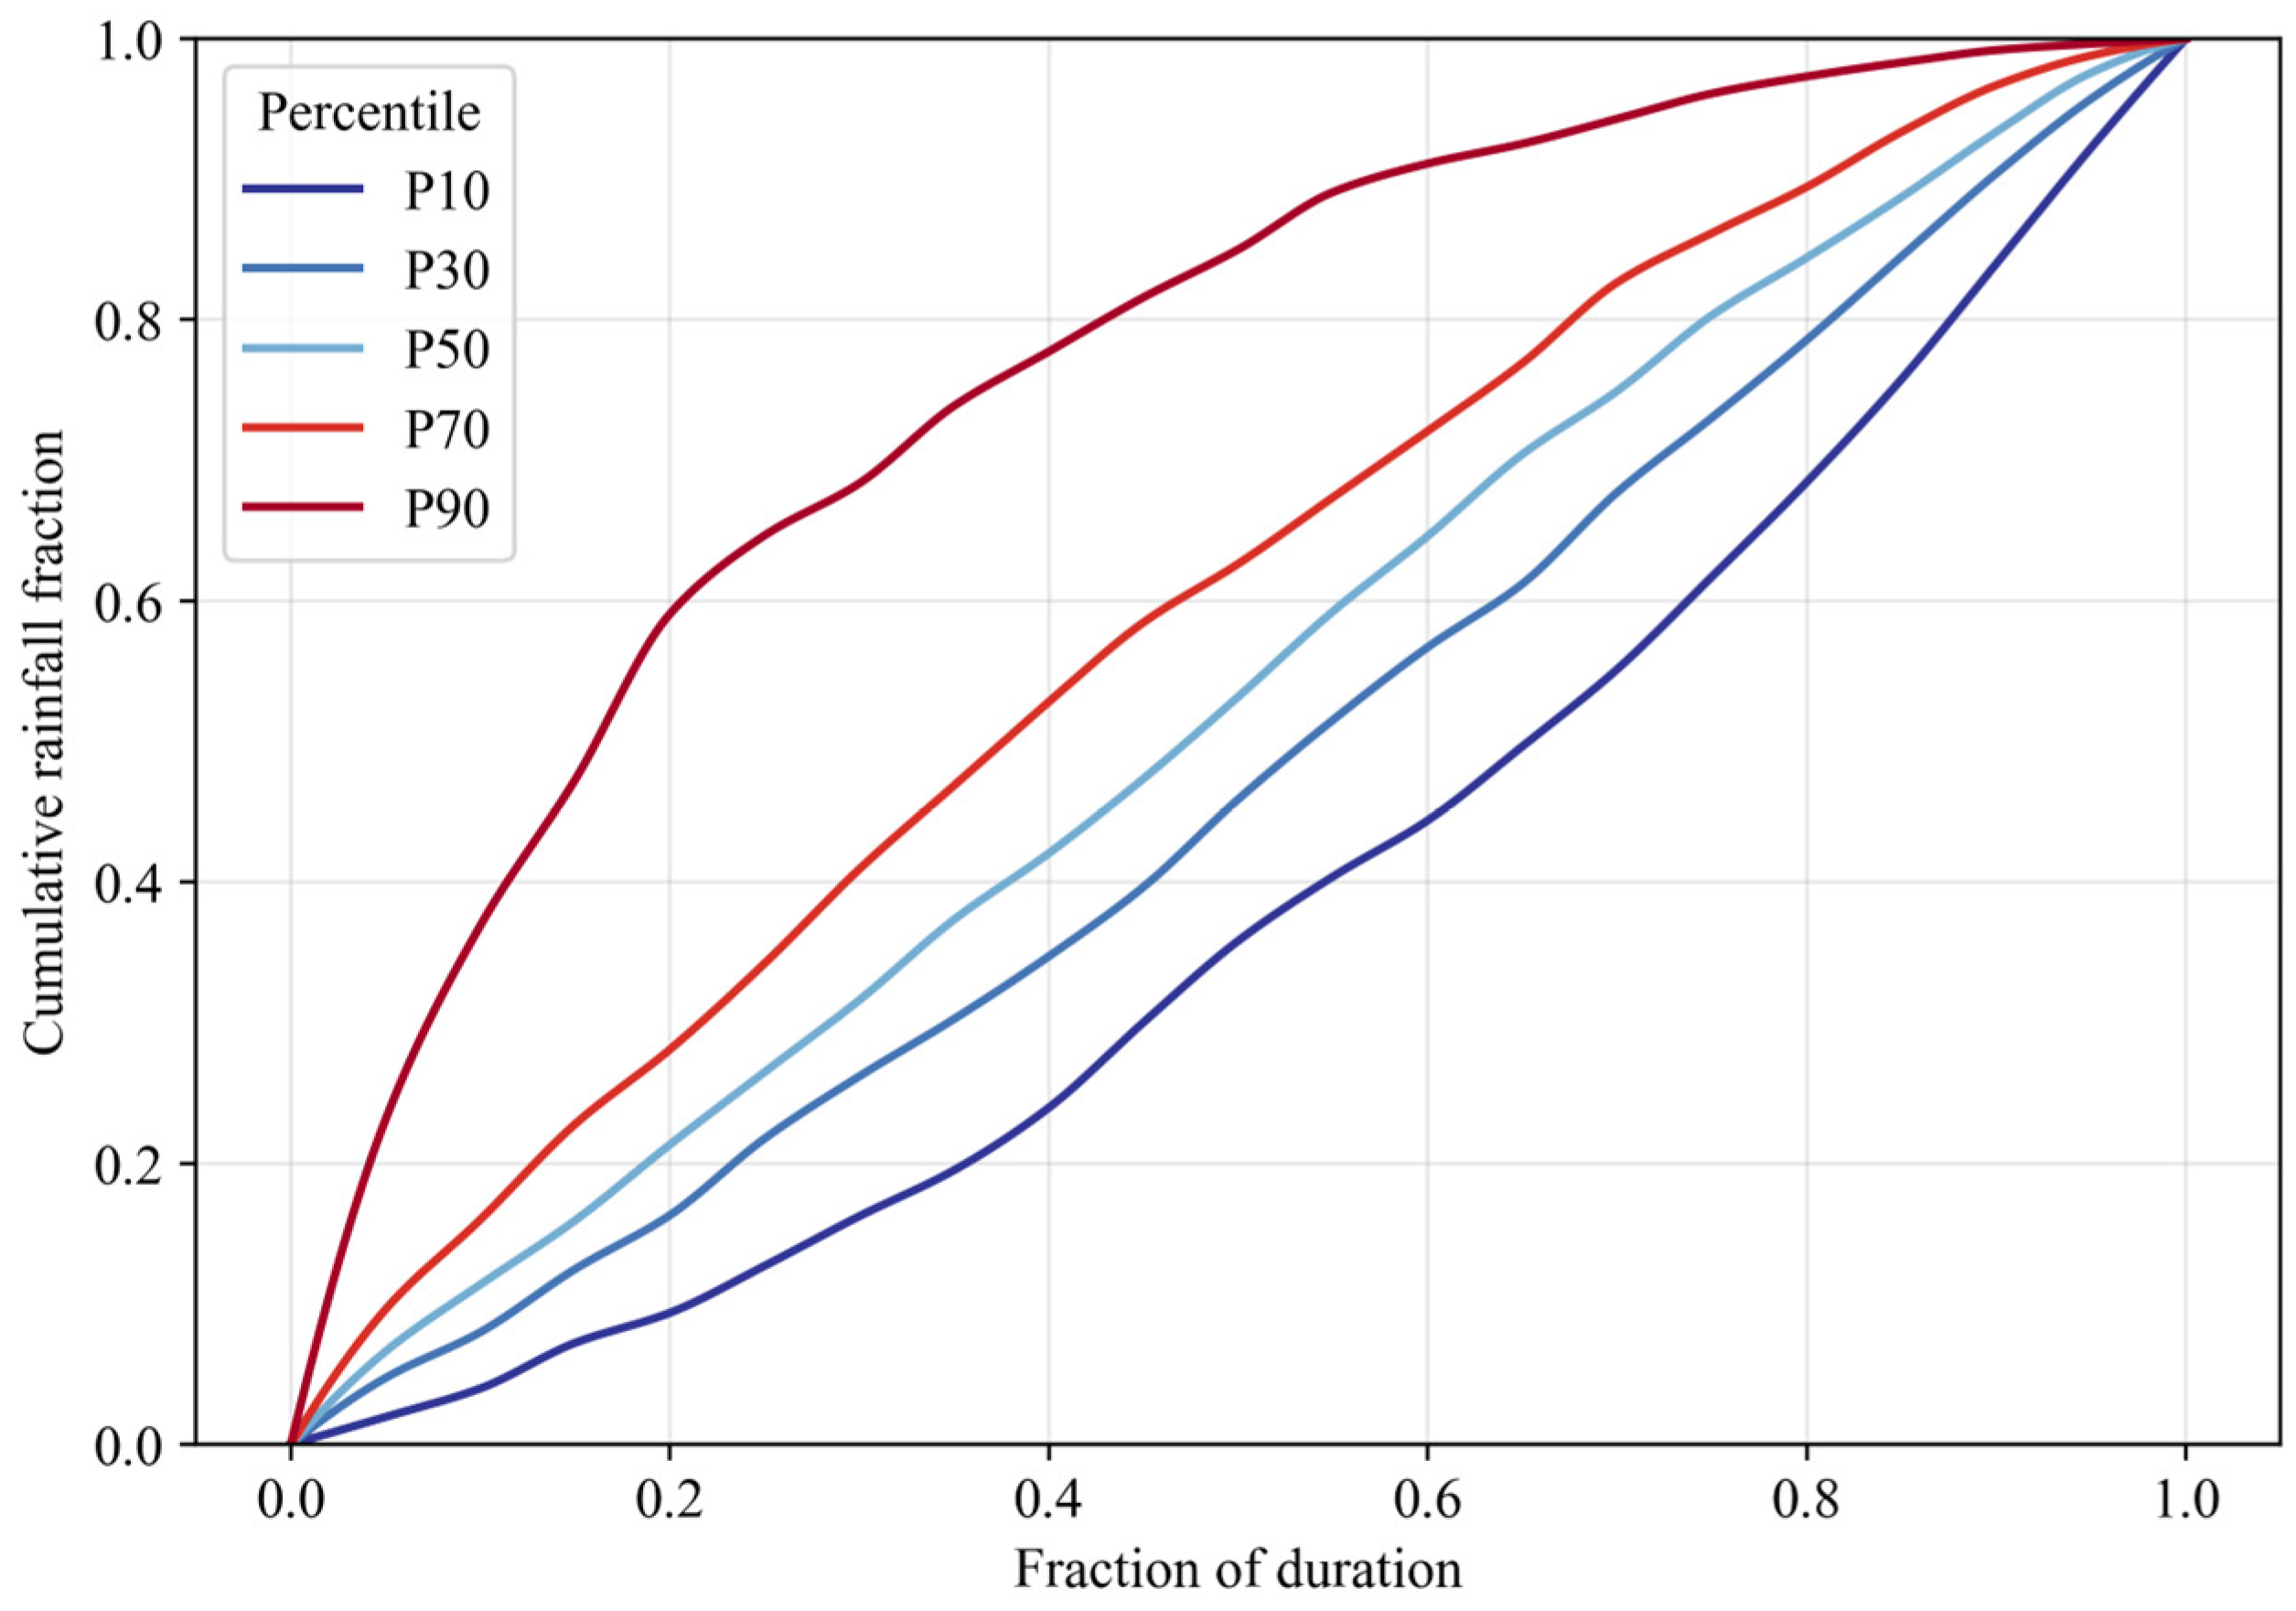
Figure 12 and Table 5 further illustrate differences in temporal accumulation across storm types. Higher percentiles (P75–P90) show strong early concentration, while lower percentiles (P10–P25) indicate more uniform or delayed distributions. The shape metrics (y25, y50, T25, T50) highlight earlier accumulation in the Northern zone and later accumulation in the Central zone, consistent with the three identified regionalized patterns (early-peak, intermediate, and uniform). These differences directly translate into hydrologic sensitivity, as shown in the modeling results.
Figure 12.
Temporal distribution curves by quartiles for the Magdalena River (percentiles P10 to P90).
3.7. Spatial Distribution of Clusters
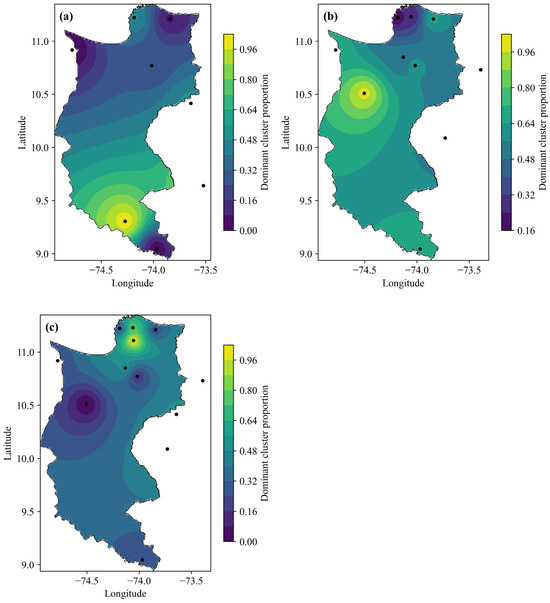
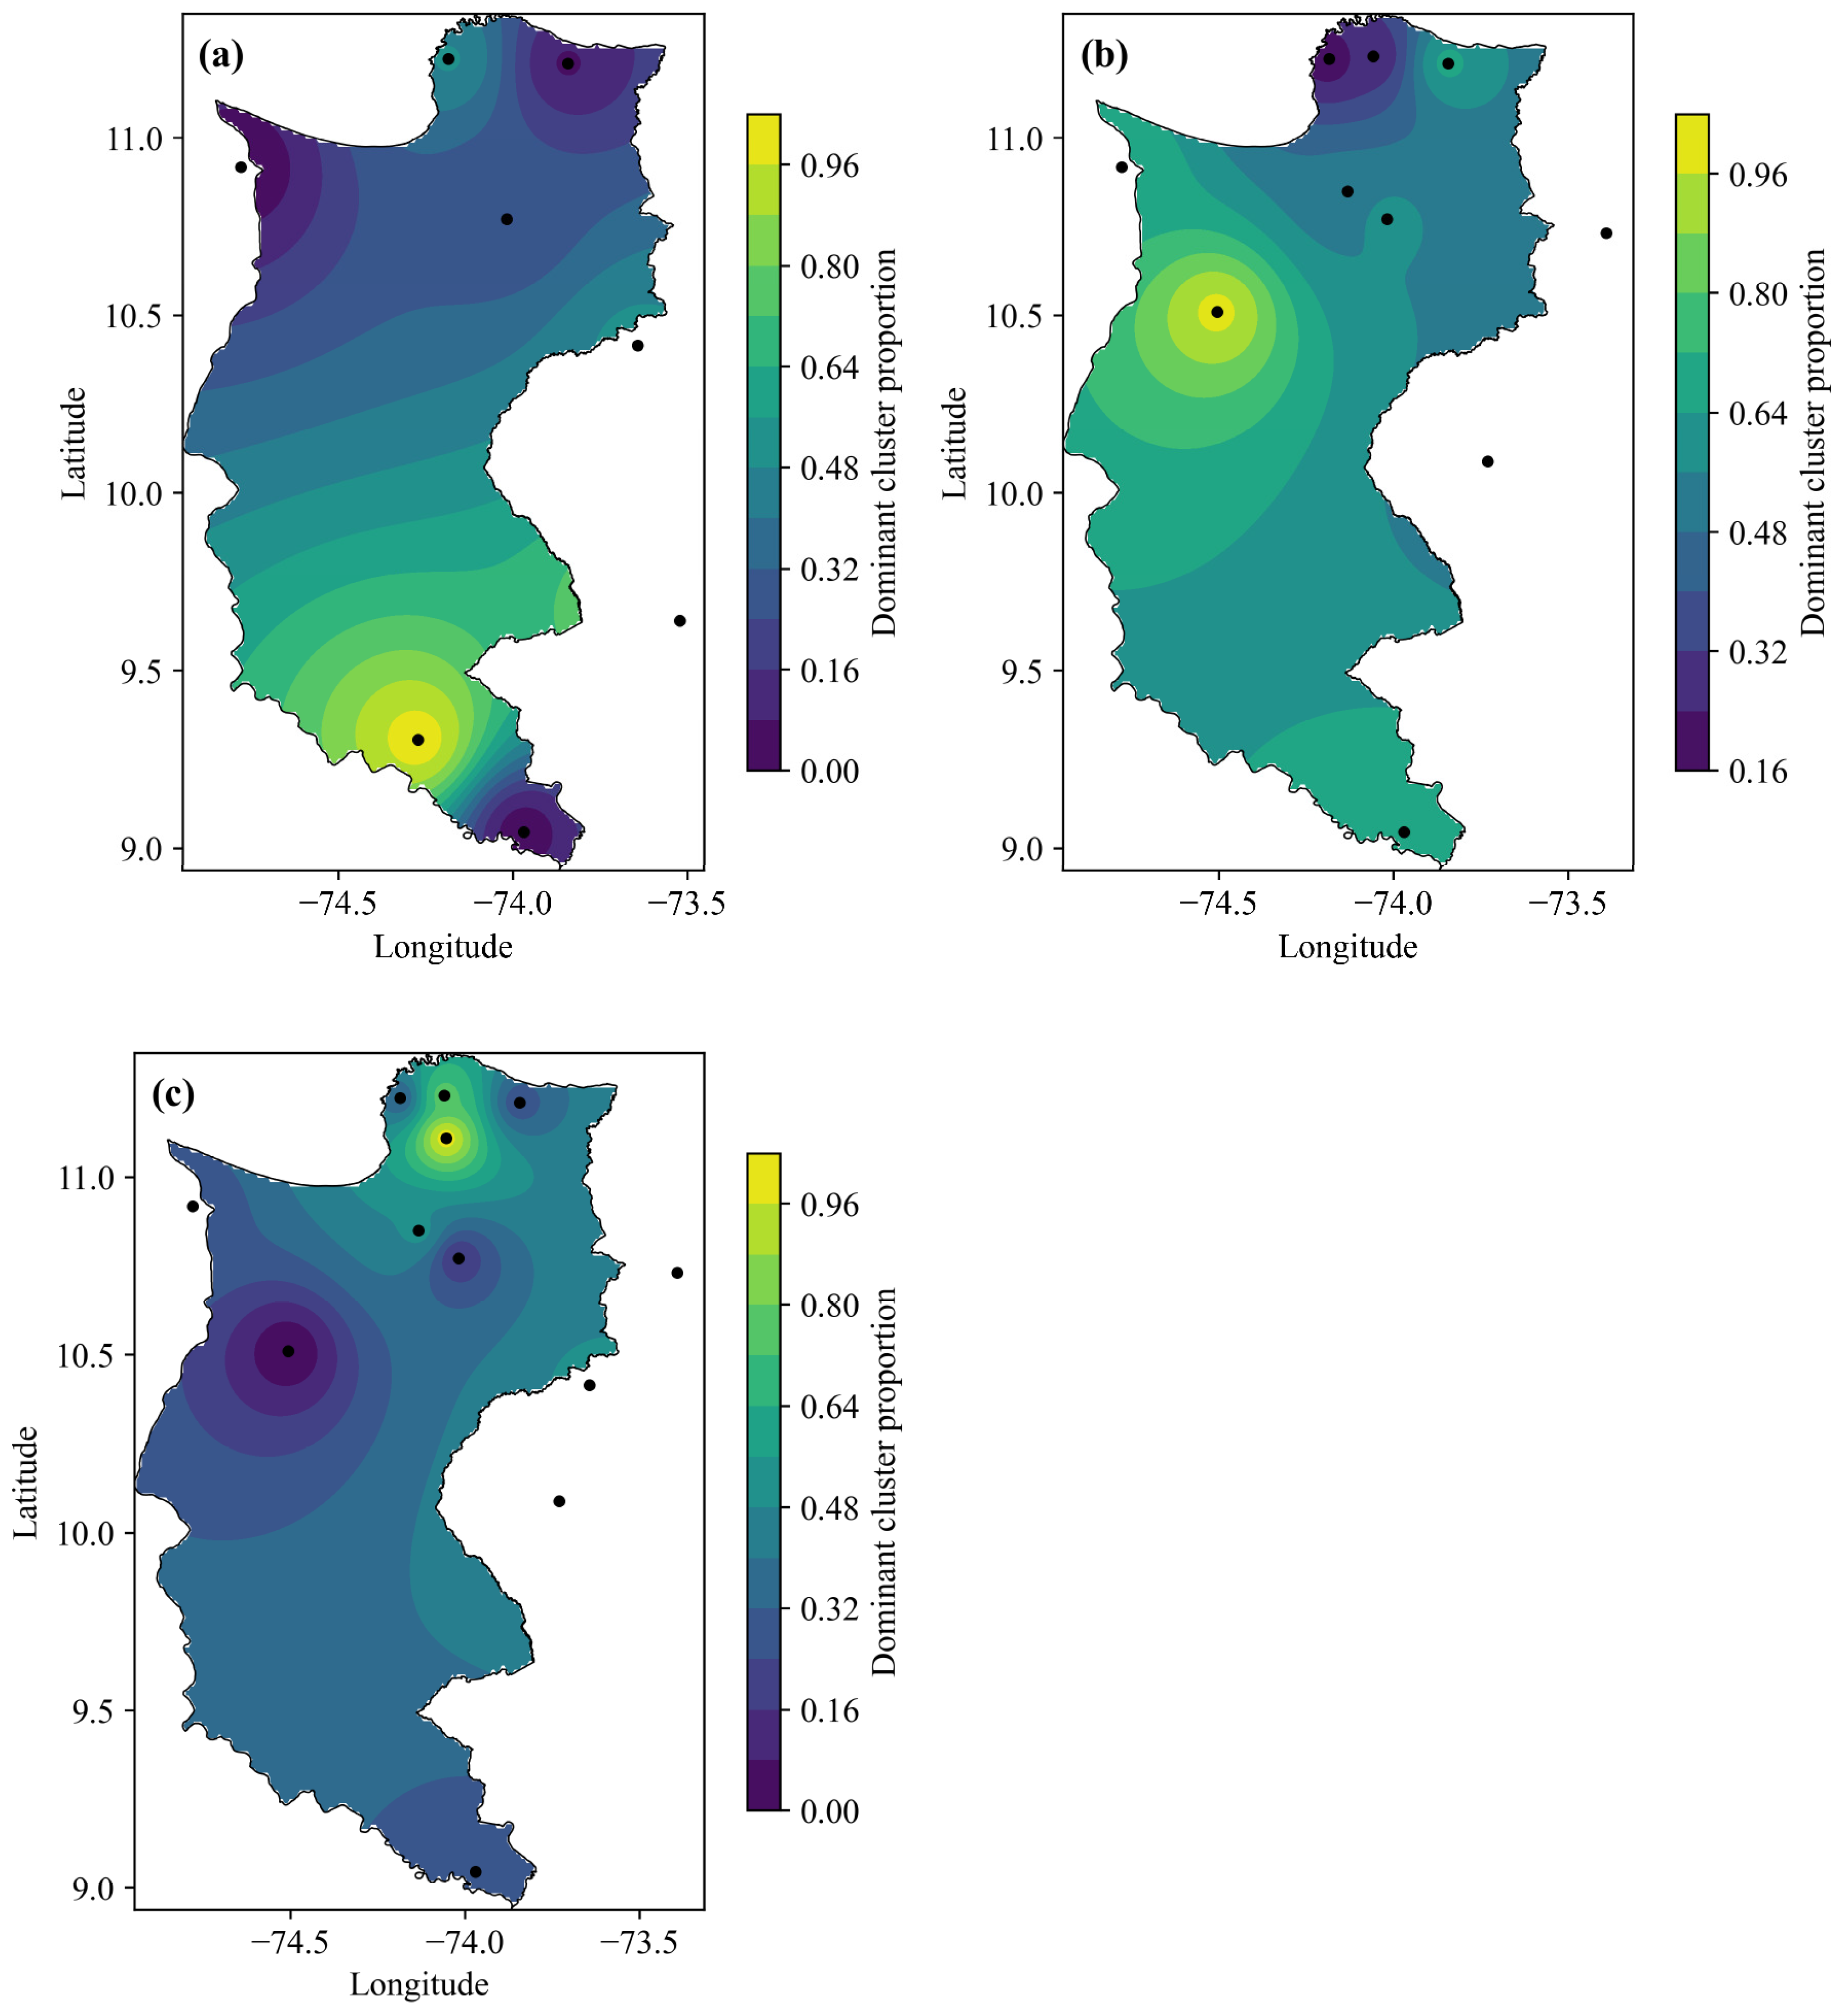
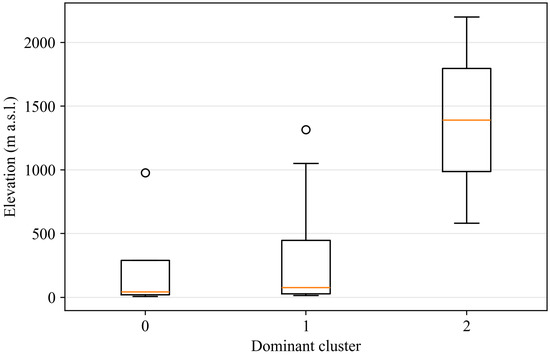
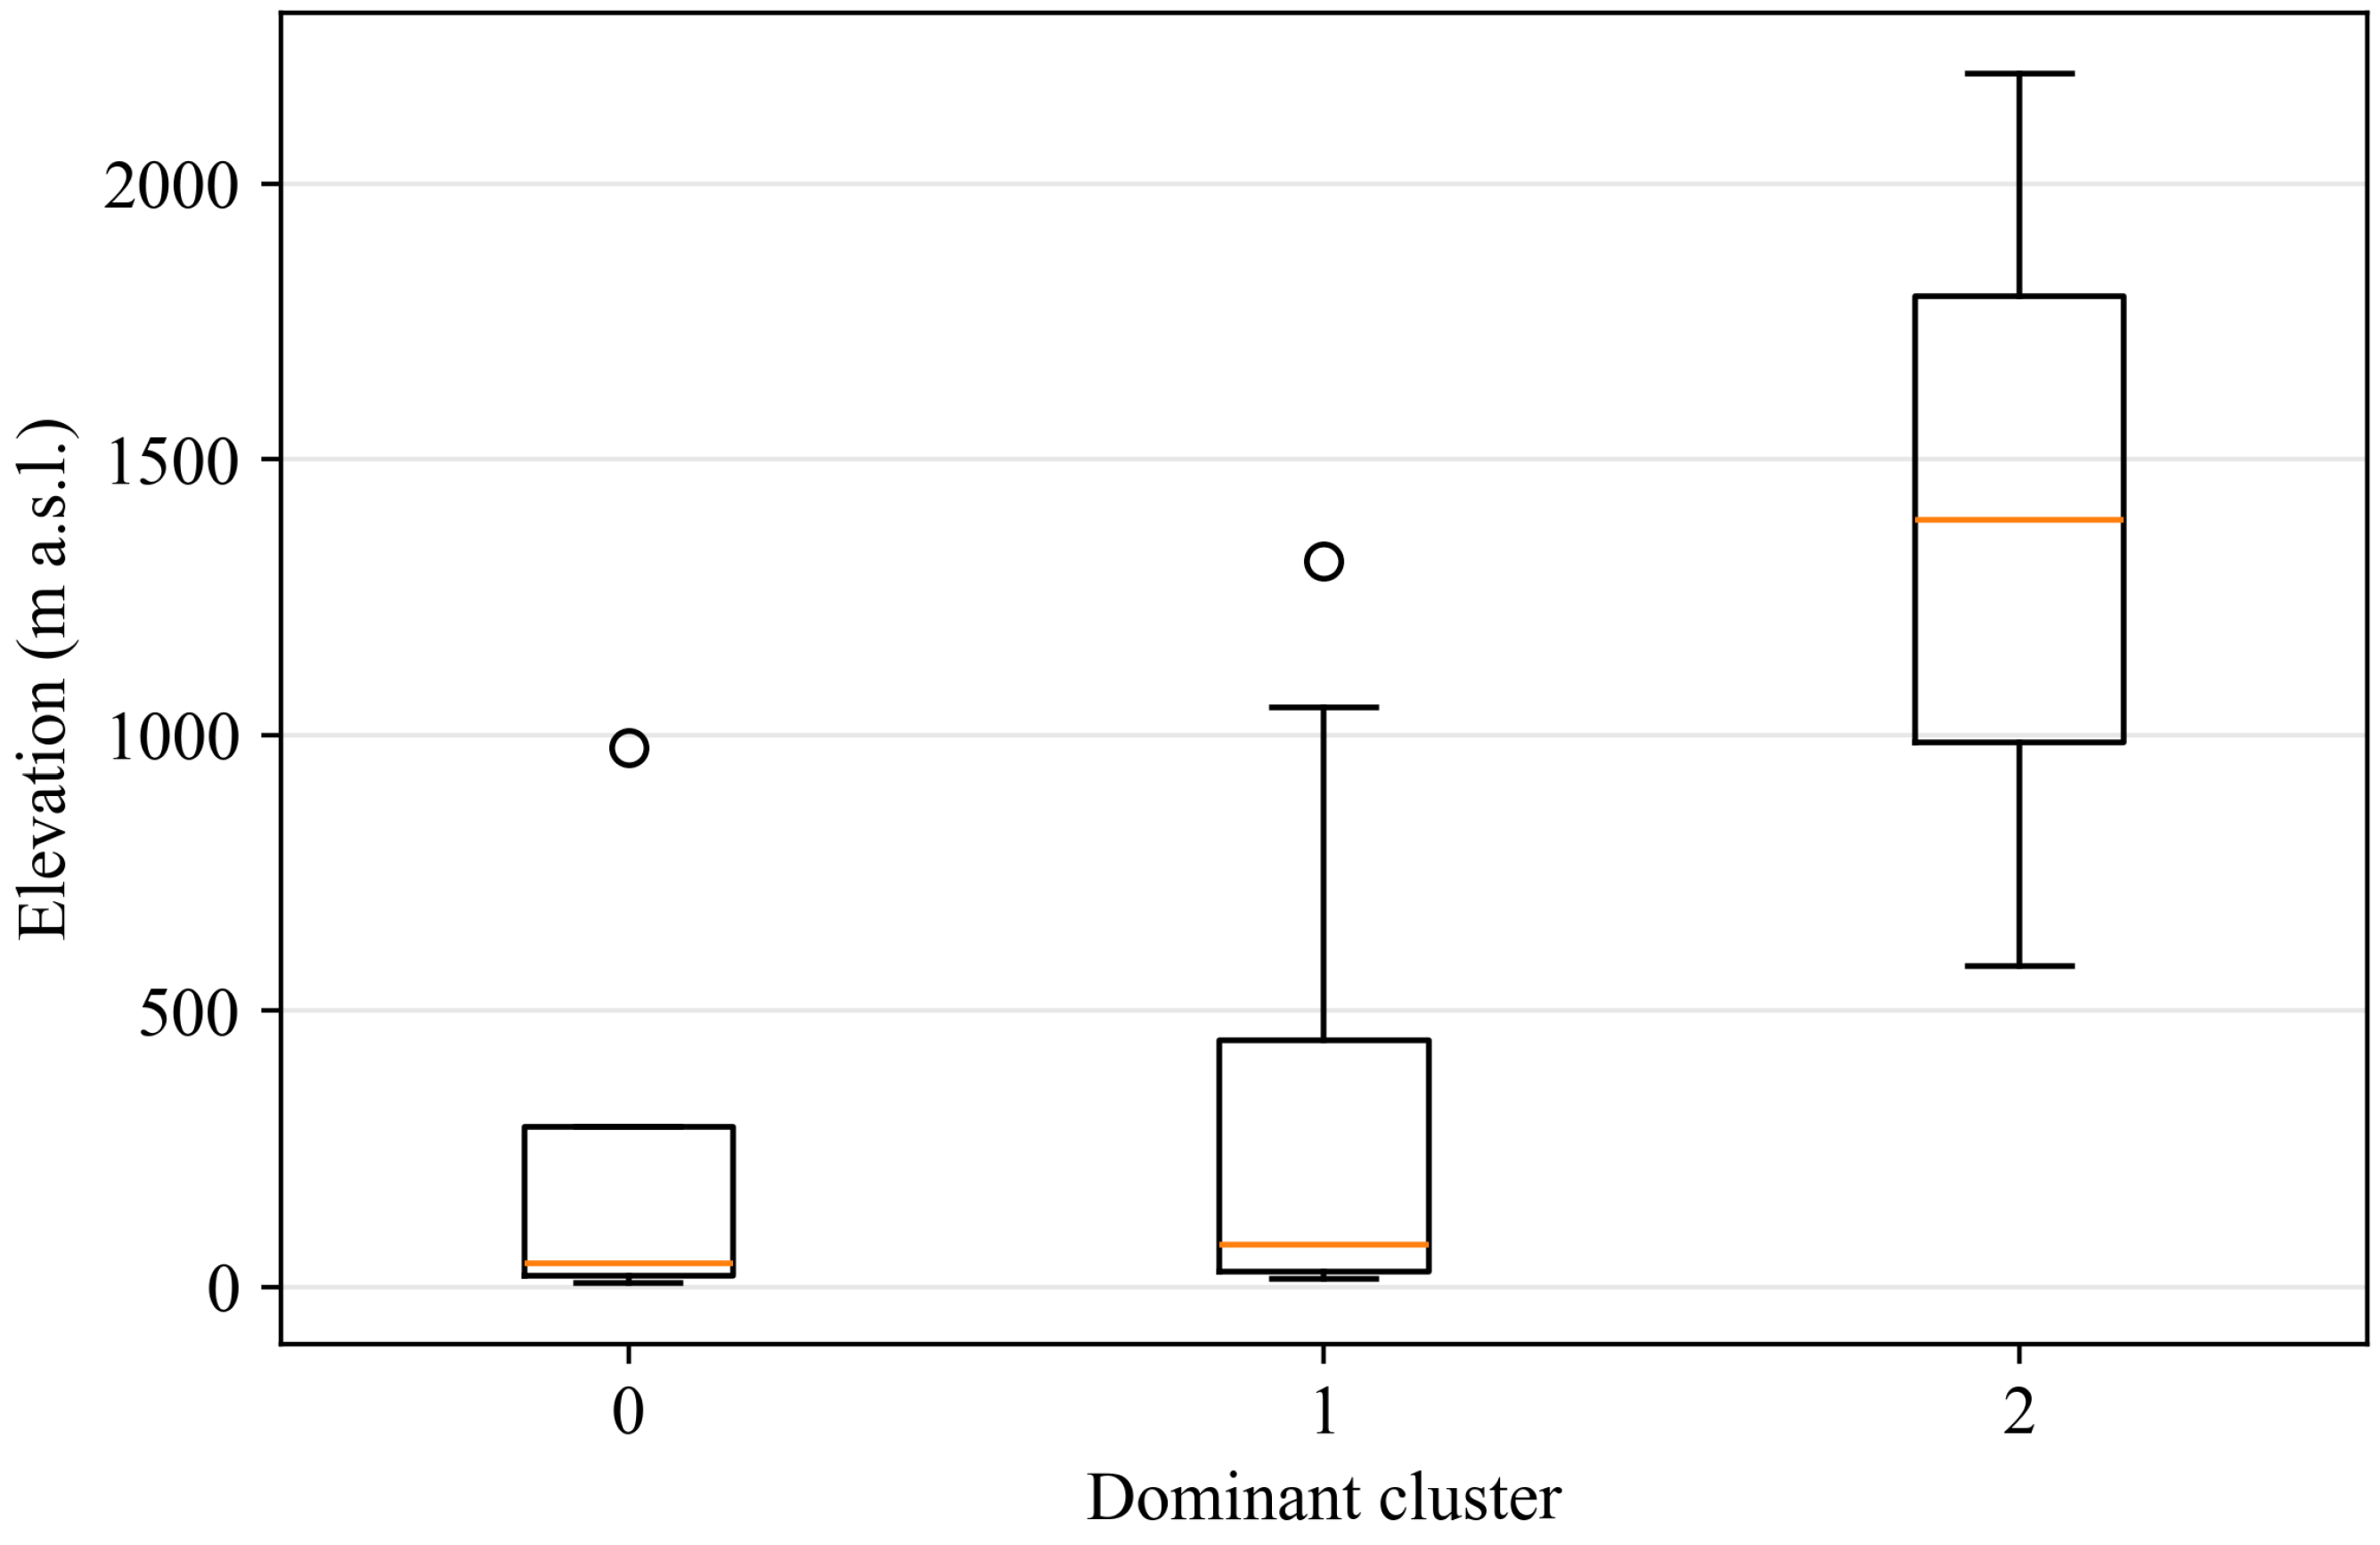
Figure 13 illustrates the dominant cluster at each station. Early-peak storms are prevalent in the northern and southeastern foothill areas, uniform storms dominate the central and southern plains, and intermediate curves are associated with mid-elevation stations in the Sierra Nevada. Figure 14 shows the elevation distribution for each cluster, reinforcing the relationship between temporal rainfall patterns and the physiographic setting.
Figure 13.
Inverse Distance Weighting (IDW) maps of proportions by cluster in the department of Magdalena: (a) Cluster 0, (b) Cluster 1, and (c) Cluster 2. Black dots indicate weather stations.
Figure 14.
Boxplot of elevation (m a.s.l.) by dominant cluster (0, 1, 2 at the departmental scale). Dots represent outliers.
3.8. Rainfall–Runoff Modeling
Simulations based on regionalized Huff curves indicate a strong sensitivity of watershed response to the temporal distribution of rainfall. Table 6 presents the characteristics of the resulting hyetographs, and Table 7 summarizes the corresponding response for a 100 km2 basin. Early-peak storms (Curve 1) produced the highest peak discharge (278.7 m3/s) and the shortest time to peak (1:45 h), whereas uniform storms generated the lowest peak (119.9 m3/s) and significantly delayed response (6:00 h). These results demonstrate pronounced hydraulic sensitivity to intra-storm rainfall structure.
Table 6.
Characteristics of the design hydrographs exported in HEC-HMS format for the three regionalized curves in the Department of Magdalena.
Table 7.
Results of the rainfall–runoff simulation in HEC-HMS for the three regionalized Huff curves (hypothetical 100 km2 watershed, 50 mm design rainfall, duration 6 h). Source: HEC-HMS simulation. Prepared by the authors.
4. Discussion
The results show that the temporal structure of short-duration storms exerts a first-order control on modeled flood response, even when rainfall depth and duration are fixed. The rainfall–runoff simulations (Section 3.8) indicate that different temporal distributions produce markedly different peak discharges and response times. Early-peak storms generated substantially higher peak flows and shorter times to peak, whereas uniform patterns produced attenuated and delayed responses. These results confirm that temporal rainfall distributions are not interchangeable inputs in flood simulation and must be explicitly represented in hydrologic design.
These differences have direct implications for flood analysis and infrastructure design. Using non-representative temporal distributions can underestimate peak discharge and compromise structural reliability. By incorporating dominant storm types and probabilistic envelopes (Section 3.5 and Section 3.6), the regionalized Huff curves developed here provide a consistent basis for flood-oriented modeling and support the analysis of variability within zones.
The regionalization results (Section 3.4, Section 3.5 and Section 3.6) identify three characteristic storm types, early-peak (Curve 1), intermediate (Curve 2), and uniform (Curve 3), that capture the temporal rainfall distribution observed across the Department of Magdalena. These findings confirm that a single design storm is insufficient to capture intra-storm variability in tropical regions, where rainfall timing strongly influences runoff generation and infrastructure performance [13,31].
The intermediate curve (Curve 2) represents transitional storm structures with peak rainfall occurring in the second quartile, consistent with moderate convective systems. The uniform curve (Curve 3), which dominates the central and southern plains, reflects more evenly distributed rainfall typical of low-relief regions. Similar behavior has been reported in alluvial tropical environments, such as Peninsular Malaysia [32], whereas contrasting late-peak patterns have been observed in regions under different atmospheric controls, such as California [38,39].
The probabilistic envelopes (Section 3.5) further illustrate substantial variability within zones, particularly in the Northern and Sierra Nevada regions, where contrasting storm types coexist. In contrast, the Central Zone exhibits narrower envelopes, indicating more homogeneous precipitation regimes. These patterns are consistent with the spatial and elevational gradients observed in Section 3.7 and confirm the link between temporal rainfall distribution and physiography.
The statistical separation of clusters (Section 3.4) supports the robustness of the identified storm types and the consistency of the regionalization framework. The resulting clusters are stable and physically interpretable, which is essential for hydrologic applications that require both statistical rigor and practical usability [28,30].
From an applied perspective, the differences in modeled responses are significant. Peak discharge varied by up to 132% between early-peak and uniform storms (Section 3.8), with corresponding differences in time to peak. This level of sensitivity quantifies the magnitude of error associated with using a non-representative temporal distribution. It highlights the need for region-specific storm patterns in drainage design, flood-risk assessment, and climate adaptation planning.
This study has limitations. The spatial density of automatic stations constrains the resolution of regionalization, and the analysis is limited to a single storm duration class. Although these factors do not affect the internal consistency of the results, they indicate opportunities for future work, including incorporating multiple storm durations and integrating radar-derived rainfall products.
Overall, the regionalized Huff curves developed in this study provide a physically interpretable and operational framework for representing the temporal variability of storms in coastal tropical regions. By linking observed rainfall patterns to hydrologic response, they address a key limitation in current design practices and offer a transferable approach for data-sparse environments.
5. Conclusions
This study characterized and regionalized the temporal distribution of short-duration (5–6 h) rainfall events in the Department of Magdalena using storm mass curves and statistical classification. The analysis identified three distinct temporal patterns that capture the dominant intra-storm variability across the region’s coastal, lowland, and orographic environments. These results demonstrate that a single temporal distribution is insufficient to represent the hydrologic response of short-duration storms in this physiographically diverse tropical setting.
At the zonal scale, two clusters were consistently identified in the North, Sierra Nevada, and South regions, and four clusters in the Central region. At the departmental scale, these patterns converge into three robust storm types. Statistical testing confirmed a clear separation among clusters, supported by large effect sizes and consistent confidence intervals, indicating stable, well-defined temporal structures.
The P10–P90 probability envelopes highlight substantial variability in rainfall concentration, particularly in the northern coastal areas and Sierra Nevada foothills, while the Central zone exhibits more homogeneous temporal behavior. These spatial differences are consistent with regional physiographic and atmospheric controls on rainfall distribution.
Rainfall–runoff simulations demonstrate the hydrologic relevance of temporal rainfall structure. For the same rainfall depth and duration, peak discharge varied by up to 132% between early-peak and uniform storms, with corresponding shifts in time to peak. These differences highlight the importance of selecting representative temporal distributions in flood modeling and infrastructure design.
The regionalized Huff curves developed in this study provide a consistent basis for linking observed rainfall patterns to hydrologic response in coastal tropical regions. By representing dominant storm types and their variability, they support improved flood-risk assessment and infrastructure design in a region where high-resolution rainfall data are limited.
Future work should extend this framework to multiple storm durations, incorporate radar or satellite rainfall products to improve spatial representation, and support the integration of regionalized temporal distributions into engineering design practice.
Author Contributions
Conceptualization, V.H.Z., A.H.P. and J.J.R.-A.; Formal analysis, V.H.Z., A.H.P. and J.J.R.-A.; Investigation, V.H.Z., L.S.M., A.H.P. and J.J.R.-A.; Methodology, V.H.Z., L.S.M., A.H.P. and J.J.R.-A.; Resources, J.J.R.-A.; Software, V.H.Z. and A.H.P.; Supervision, J.J.R.-A.; Validation, V.H.Z.; Visualization, V.H.Z.; Writing—original draft, V.H.Z., A.H.P. and J.J.R.-A.; Writing—review and editing, V.H.Z., L.S.M., A.H.P. and J.J.R.-A. All authors have read and agreed to the published version of the manuscript.
Funding
This study received no external funding.
Data Availability Statement
The data and code that support the findings of this study are available from the corresponding author upon reasonable request.
Acknowledgments
This study was conducted within the Hydrology Education and Research Mentorship for Students (HEARS) Program, an initiative of the American Institute of Hydrology (AIH) that promotes education, research capacity building, and professional mentorship in hydrology. The authors acknowledge the contributions of students and a mentor from the Universidad del Magdalena, as well as the guidance of an AIH mentor affiliated with the Watersheds and Water Quality Research Lab of the Rula School of Civil and Environmental Engineering at Mississippi State University. The collaborative environment fostered by AIH-HEARS was instrumental in advancing this study and strengthening technical skills in hydrologic data analysis and climate variability assessment. Andrés F. Hatum Pontón acknowledges scholarship support from the Fundação de Apoio ao Desenvolvimento do Ensino, Ciência e Tecnologia do Estado de Mato Grosso do Sul-Brasil (FUNDECT) and the Coordenação de Aperfeiçoamento de Pessoal de Nível Superior-Brasil (CAPES) Bolsista CAPES/BRASIL, under Process No. 83/022.631/2023 and Finance Code 001.
Conflicts of Interest
The authors declare no conflicts of interest.
References
- Vantas, K.; Sidiropoulos, E.; Vafiadis, M. Optimal temporal distribution curves for the classification of heavy precipitation using hierarchical clustering on principal components. Glob. Nest J. 2019, 21, 530–538. [Google Scholar] [CrossRef] [Scilit]
- Arrieta-Pastrana, A.; Saba, M.; Puello Alcázar, A. Analysis of Climate Variability and Climate Change in Sub-Daily Maximum Intensities: A Case Study in Cartagena, Colombia. Atmosphere 2023, 14, 146. [Google Scholar] [CrossRef] [Scilit]
- Castro, Z.F.; Vásquez, N.M. Análisis del Comportamiento de Variables Meteorológicas en el Departamento del Atlántico en los Últimos 30 Años; Universidad Nacional Abierta y a Distancia UNAD: Bogotá, Colombia, 2017; Available online: http://repository.unad.edu.co/handle/10596/13908 (accessed on 5 May 2026).
- Martínez, P.F.; Patiño, C. Efectos del cambio climático en la disponibilidad de agua en México. Tecnol. Cienc. Agua 2012, 3, 5–20. [Google Scholar]
- Saldarriaga, V.; Chavarría, J.; Guzmán, Á.; Tarazona, N. Efecto de las variables climáticas sobre la fluctuación del nivel freático en suelos fluvisoles del valle del río Carrizal. Cienc. Tecn. UTEQ 2020, 13, 55–62. [Google Scholar] [CrossRef] [Scilit]
- Intergovernmental Panel on Climate Change (IPCC). Weather and Climate Extreme Events in a Changing Climate. In Climate Change 2021—The Physical Science Basis: Working Group I Contribution to the Sixth Assessment Report of the Intergovernmental Panel on Climate Change; Cambridge University Press: Cambridge, UK, 2023; pp. 1513–1766. [Google Scholar] [CrossRef] [Scilit]
- Food and Agriculture Organization of the United Nations (FAO). El estado de la alimentación y la agricultura: Gestión integrada de los recursos hídricos. In Proceedings of the Governing Bodies, Rome, Italy, 1–7 July 2023; Available online: https://www.fao.org/3/nm092es/nm092es.pdf (accessed on 5 May 2026).
- FAO; IFAD; PAHO; UNICEF; WFP. Latin America and the Caribbean—Regional Overview of Food Security and Nutrition 2025: Statistics and Trends; FAO: Santiago, Chile, 2026. [Google Scholar] [CrossRef] [Scilit]
- Cerón, W.L.; Andreoli, R.V.; Kayano, M.T.; Canchala, T.; Ocampo-Marulanda, C.; Avila-Diaz, A.; Antunes, J. Trend Pattern of Heavy and Intense Rainfall Events in Colombia from 1981–2018: A Trend-EOF Approach. Atmosphere 2022, 13, 156. [Google Scholar] [CrossRef] [Scilit]
- Instituto de Hidrología; Meteorología y Estudios Ambientales (IDEAM). Boletín Informativo sobre el Monitoreo de los Fenómenos de Variabilidad Climática “El Niño” y “La Niña”; IDEAM: Bogotá, Colombia, 2016.
- Instituto Geográfico Agustín Codazzi (IGAC). Magdalena: Características Geográficas; IGAC: Bogotá, Colombia, 1993.
- Dunkerley, D. Huff quartile classification of rainfall intensity profiles (‘storm patterns’): A modified approach employing an intensity threshold. CATENA 2022, 216, 106371. [Google Scholar] [CrossRef] [Scilit]
- Oh, B.; Kim, J.; Hwang, S. Influence of Rainfall Patterns on Rainfall-Runoff Processes: Indices for the Quantification of Temporal Distribution of Rainfall. Water 2024, 16, 2904. [Google Scholar] [CrossRef] [Scilit]
- Na, W.; Yoo, C. Evaluation of Rainfall Temporal Distribution Models with Annual Maximum Rainfall Events in Seoul, Korea. Water 2018, 10, 1468. [Google Scholar] [CrossRef] [Scilit]
- Abdullahi, J.; Rufai, I.; Rimtip, N.N.; Orhon, D.; Aslanova, F.; Elkiran, G. A novel approach for precipitation modeling using artificial intelligence-based ensemble models. Desalin. Water Treat. 2024, 317, 100188. [Google Scholar] [CrossRef] [Scilit]
- Li, Y.; Huo, S.; Ma, B.; Pei, B.; Tan, Q.; Guo, Q.; Wang, D.; Yu, L. A new method for predicting precipitation δ18O distribution based on deep learning and spatio-temporal clustering. Hydrol. Sci. J. 2024, 69, 1449–1467. [Google Scholar] [CrossRef] [Scilit]
- Oppel, H.; Fischer, S. A New Unsupervised Learning Method to Assess Clusters of Temporal Distribution of Rainfall and Their Coherence with Flood Types. Water Resour. Res. 2020, 56, e2019WR026511. [Google Scholar] [CrossRef] [Scilit]
- Linero-Cueto, J.; Morales-Acuña, E.; Manrique Cantillo, A.; Macías Acevedo, J.; Armenta Porras, G.; Pacheco, M.; Castellanos Barliza, J.; Estrada Castillo, S.; Valencia Cuéllar, D.; Jáuregui-Romero, G.; et al. Influencias del Cambio Climático y la Variabilidad Climática Sobre el Recurso Hídrico, Biodiversidad y Servicios Ecosistémicos en el Departamento del Magdalena; Editorial Universitaria de la Costa S.A.S.: Barranquilla, Colombia, 2022; Available online: https://hdl.handle.net/11323/10339 (accessed on 5 May 2026).
- Granada Mora, S.E. Elaboración de las Curvas de Variación Temporal de las Precipitaciones Máximas en 57 Estaciones Pluvigráficas del Departamento de Antioquia; Politécnico Colombiano Jaime Isaza Cadavid: Medellín, Colombia, 2004; Available online: https://repositorio.elpoli.edu.co/handle/123456789/5583 (accessed on 5 May 2026).
- Pomares-Meza, G.M.; Camargo Caicedo, Y.; Vélez-Pereira, A.M. Long-Term Spatiotemporal Analysis of Precipitation Trends with Implications of ENSO-Driven Variability in the Department of Magdalena, Colombia. Water 2024, 16, 3372. [Google Scholar] [CrossRef] [Scilit]
- Rodriguez, M.M.; Oviedo, A.; Bautista, D.; Tamaris-Turizo, D.P.; Flores, F.S.; Castro, L.R. Molecular Detection of Rickettsia and Other Bacteria in Ticks and Birds in an Urban Fragment of Tropical Dry Forest in Magdalena, Colombia. Life 2023, 13, 145. [Google Scholar] [CrossRef] [Scilit] [PubMed]
- Abbasnezhadi, K.; Rousseau, A.N.; Koenig, K.A.; Zahmatkesh, Z.; Wruth, A.M. Hydrological assessment of meteorological network density through data assimilation simulation. J. Hydrol. 2019, 569, 844–858. [Google Scholar] [CrossRef] [Scilit]
- Olawoyin, R. Objective assessment of the Thiessen polygon method for estimating areal rainfall depths in the River Volta catchment in Ghana. Ghana J. Geogr. 2017, 9, 151–174. [Google Scholar]
- Munar, A.M.; Mendez, N.; Narvaez, G.; Campo Zambrano, F.; Motta-Marques, D.; Lyra Fialho Brêda, J.P.; Angarita, H. Modelling the climate change impacts on river discharge and inundation extent in the Magdalena River basin—Colombia. Hydrol. Sci. J. 2023, 68, 1286–1300. [Google Scholar] [CrossRef] [Scilit]
- Huff, F.A. Time Distributions of Heavy Rainstorms in Illinois; Illinois State Water Survey: Champaign, IL, USA, 1990; Available online: https://hdl.handle.net/2142/94492 (accessed on 5 May 2026).
- Coronado-Hernández, Ó.E.; Merlano-Sabalza, E.; Díaz-Vergara, Z.; Coronado-Hernández, J.R. Selection of Hydrological Probability Distributions for Extreme Rainfall Events in the Regions of Colombia. Water 2020, 12, 1397. [Google Scholar] [CrossRef] [Scilit]
- Johnston, C.M.; Dewald, T.G.; Bondelid, T.R.; Worstell, B.B.; McKay, L.D.; Rea, A.; Moore, R.B.; Goodall, J.L. Evaluation of Catchment Delineation Methods for the Medium-Resolution National Hydrography Dataset; Scientific Investigations Report 2009-5233. U.S. Geological Survey: Reston, VA, USA, 2009; 88p. Available online: http://pubs.usgs.gov/sir/2009/5233 (accessed on 5 May 2026).
- Arbelaitz, O.; Gurrutxaga, I.; Muguerza, J.; Pérez, J.M.; Perona, I. An extensive comparative study of cluster validity indices. Pattern Recognit. 2013, 46, 243–256. [Google Scholar] [CrossRef] [Scilit]
- Rousseeuw, P.J. Silhouettes: A graphical aid to the interpretation and validation of cluster analysis. J. Comput. Appl. Math. 1987, 20, 53–65. [Google Scholar] [CrossRef] [Scilit]
- Hu, H.; Liu, J.; Zhang, X.; Fang, M. An Effective and Adaptable K-means Algorithm for Big Data Cluster Analysis. Pattern Recognit. 2023, 139, 109404. [Google Scholar] [CrossRef] [Scilit]
- Zhang, Q.; Qian, J. Identification and Temporal Distribution of Typical Rainfall Types Based on K-Means++ Clustering and Probability Distribution Analysis. Hydrology 2025, 12, 88. [Google Scholar] [CrossRef] [Scilit]
- Azli, M.; Rao, A.R. Development of Huff curves for Peninsular Malaysia. J. Hydrol. 2010, 388, 77–84. [Google Scholar] [CrossRef] [Scilit]
- Chicco, D.; Sichenze, A.; Jurman, G. A simple guide to the use of Student’s t-test, Mann-Whitney U test, Chi-squared test, and Kruskal-Wallis test in biostatistics. BioData Min. 2025, 18, 56. [Google Scholar] [CrossRef] [Scilit]
- Macbeth, G.; Razumiejczyk, E.; Ledesma, R.D. Cliff’s Delta Calculator: A non-parametric effect size program for two groups of observations. Univ. Psychol. 2011, 10, 545–555. [Google Scholar] [CrossRef] [Scilit]
- Bagkavos, D.; Patil, P.N. Improving the Wilcoxon signed rank test by a kernel smooth probability integral transformation. Stat. Probab. Lett. 2021, 171, 109026. [Google Scholar] [CrossRef] [Scilit]
- Burn, D.H.; Hag Elnur, M.A. Detection of hydrologic trends and variability. J. Hydrol. 2022, 255, 107–122. [Google Scholar] [CrossRef] [Scilit]
- Napoli, A.; Crespi, A.; Ragone, F.M.; Maugeri, M.; Pasquero, C. Variability of orographic enhancement of precipitation in the Alpine region. Sci. Rep. 2019, 9, 13352. [Google Scholar] [CrossRef] [Scilit] [PubMed]
- Scaff, L.; Rutllant, J.A.; Rahn, D.; Gascoin, S.; Rondanelli, R. Meteorological Interpretation of Orographic Precipitation Gradients along an Andes West Slope Basin at 30°S (Elqui Valley, Chile). J. Hydrometeorol. 2017, 18, 713–727. [Google Scholar] [CrossRef] [Scilit]
- United States National Weather Service. Precipitation-Frequency Atlas of the United States, Volume 6 Version 2.3: California; National Oceanic and Atmospheric Administration (NOAA): Silver Spring, MD, USA, 2011. Available online: https://repository.library.noaa.gov/view/noaa/22614 (accessed on 5 May 2026).

Disclaimer/Publisher’s Note: The statements, opinions and data contained in all publications are solely those of the individual author(s) and contributor(s) and not of MDPI and/or the editor(s). MDPI and/or the editor(s) disclaim responsibility for any injury to people or property resulting from any ideas, methods, instructions or products referred to in the content. |
© 2026 by the authors. Licensee MDPI, Basel, Switzerland. This article is an open access article distributed under the terms and conditions of the Creative Commons Attribution (CC BY) license.