


Abstract
Floods are among the extreme events associated with climate variability in the Lacramarca River basin, located in the department of Ancash, Peru. Meteorological phenomena such as El Niño during the periods 1982–1983 and 1997–1998, as well as the Coastal El Niño in 2017, constitute key reference events that motivated the development of the present study, based on a case study conducted in the area between the rural settlements of Santa Clemencia and Pampadura. This research is based on maximum precipitation data derived from historical climate records and from the climate scenarios ACCESS 1-3, HadGEM2-ES, and MPI-ESM-MR, as well as the median projected scenario for 2050, obtained from the National Meteorology and Hydrology Service of Peru (SENAMHI) data platform. This information was analyzed considering the spatial location of the basin and its position relative to the area of interest, using Intensity–Duration–Frequency (IDF) curves. To demonstrate the changes in the river hydrological behavior before and after the 2017 Coastal El Niño event, a Random Forest modeling approach was applied using Sentinel-2 satellite imagery. Design peak discharges for return periods of 50, 100, and 140 years were estimated using the HEC-HMS software. Hydraulic simulation of the Lacramarca River basin, carried out using HEC-RAS version 6.7 beta 3 and IBER version 3.3.1 software, made it possible to identify flood-prone areas affecting agricultural land and areas adjacent to population centers, covering 149,000 m2 and 172,000 m2 for return periods of 100 and 140 years, respectively, based on information from the historical scenario. In contrast, using data from the 2050 projection scenario, affected areas of 242,000 m2 and 323,000 m2 were estimated for the same return periods.
1. Introduction
Climate change is a phenomenon characterized by an imbalance in the Earth’s energy budget, manifested through significant variability in climate patterns and closely linked to human activities. This imbalance in the atmospheric system is reflected in rising temperatures, thereby contributing to global warming, which promotes glacier melting, sea-level rise, and an increase in extreme meteorological events [1].
Global warming tends to modify the hydrological cycle through changes in atmospheric temperature and humidity. These factors alter precipitation distribution, increase mean temperatures, reduce river flows, and raise the likelihood of extreme hydrometeorological events [2], which manifest at different spatial scales, ranging from global to regional and local levels [3]. As a result, some regions experience prolonged droughts, while others are subject to increasingly intense rainfall events that trigger flooding. These changes in rainfall regimes and temperature constitute the primary drivers of such phenomena [4].
Numerous studies indicate that increases in the intensity and frequency of extreme events are directly associated with climate change and climate variability [5]. In particular, the El Niño–Southern Oscillation (ENSO) in its two main phases—El Niño (EN) and La Niña (LN)—has been extensively studied in recent decades by numerous authors seeking to describe the impacts of ENSO events on global precipitation In Peru, floods represent large-scale events that periodically affect the territory, generating adverse impacts on the economy and public welfare [6]. The ENSO events that produced the most significant negative socioeconomic impacts in the country occurred during the periods 1982–1983, 1997–1998, and 2017, the latter corresponding to the Coastal El Niño, considered the third most intense ENSO event in recent years. In March 2023, this phenomenon recurred due to warm sea surface temperature conditions along the northern coast of the country, causing intense rainfall and also affecting the central coast and the northwestern region. These events resulted in torrential rains and severe flooding, often leading to landslides and damage to infrastructure, agricultural land, and housing.
The Pan American Health Organization (PAHO) reports that direct losses associated with the extreme 1997–1998 event were estimated at USD 1 billion, of which 80% corresponded to flooding in northern Peru [7]. Likewise, according to the 2017 Statistical Compendium of the National Institute of Civil Defense (INDECI), Peru, the damage caused between February and March 2017 by intense rainfall associated with the El Niño phenomenon resulted in 151,161 affected individuals, in addition to 32,396 dwellings, 323 educational facilities, and 110 health institutions reporting damage or varying degrees of destruction across different areas of the Ancash region in Peru [8].
Floods have significantly impacted populations, territories, and socioeconomic assets in recent decades [9]. Increased population density near rivers, rapid economic growth in floodplains, and changes in land use significantly influence flood occurrence [10]. In this context, the most severe impacts generated by floods are closely related to human-induced factors, together with accelerated demographic growth, uncontrolled urbanization, and the design and implementation of inefficient flood mitigation strategies [11]. Flood forecasting has been, and continues to be, an important disaster prevention measure and an adaptation mechanism in the context of climate change [12].
Previous research has demonstrated that climate change is generating significant transformations in hydrological processes at the global scale. The trend toward large-scale flooding has become increasingly evident, as multiple scenarios project a substantial rise in the frequency and intensity of extreme precipitation events [13].
In Peru, the Piura River basin and the Rimac River basin, located along the Pacific coast, are regions frequently affected by ENSO events. The Rimac River basin, in particular, is highly susceptible to climatic variability due to its geographic position and the interaction of ocean-atmosphere dynamics across the tropical Pacific, which has made it the focus of numerous studies [14].
The Lacramarca River basin, which is the subject of the present research, is located in the Ancash region of Peru and drains toward the northern coast of the Pacific Ocean. Due to its short length, this basin is considered highly vulnerable to the occurrence of debris flows (huaicos) and flooding, primarily during extreme events associated with El Niño. During these events, intense rainfall produces a marked increase in river discharges, transporting sediments from the upper reaches of the mountain ranges and causing damage to populated areas and agricultural land. This situation is exacerbated by the lack of adequate infrastructure for riverbank protection.
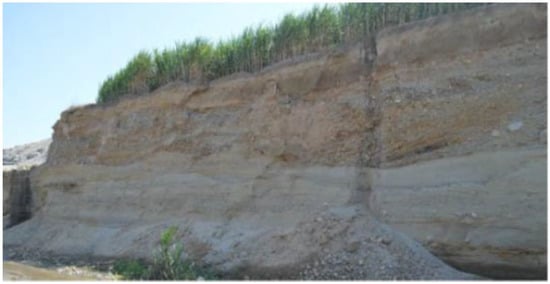
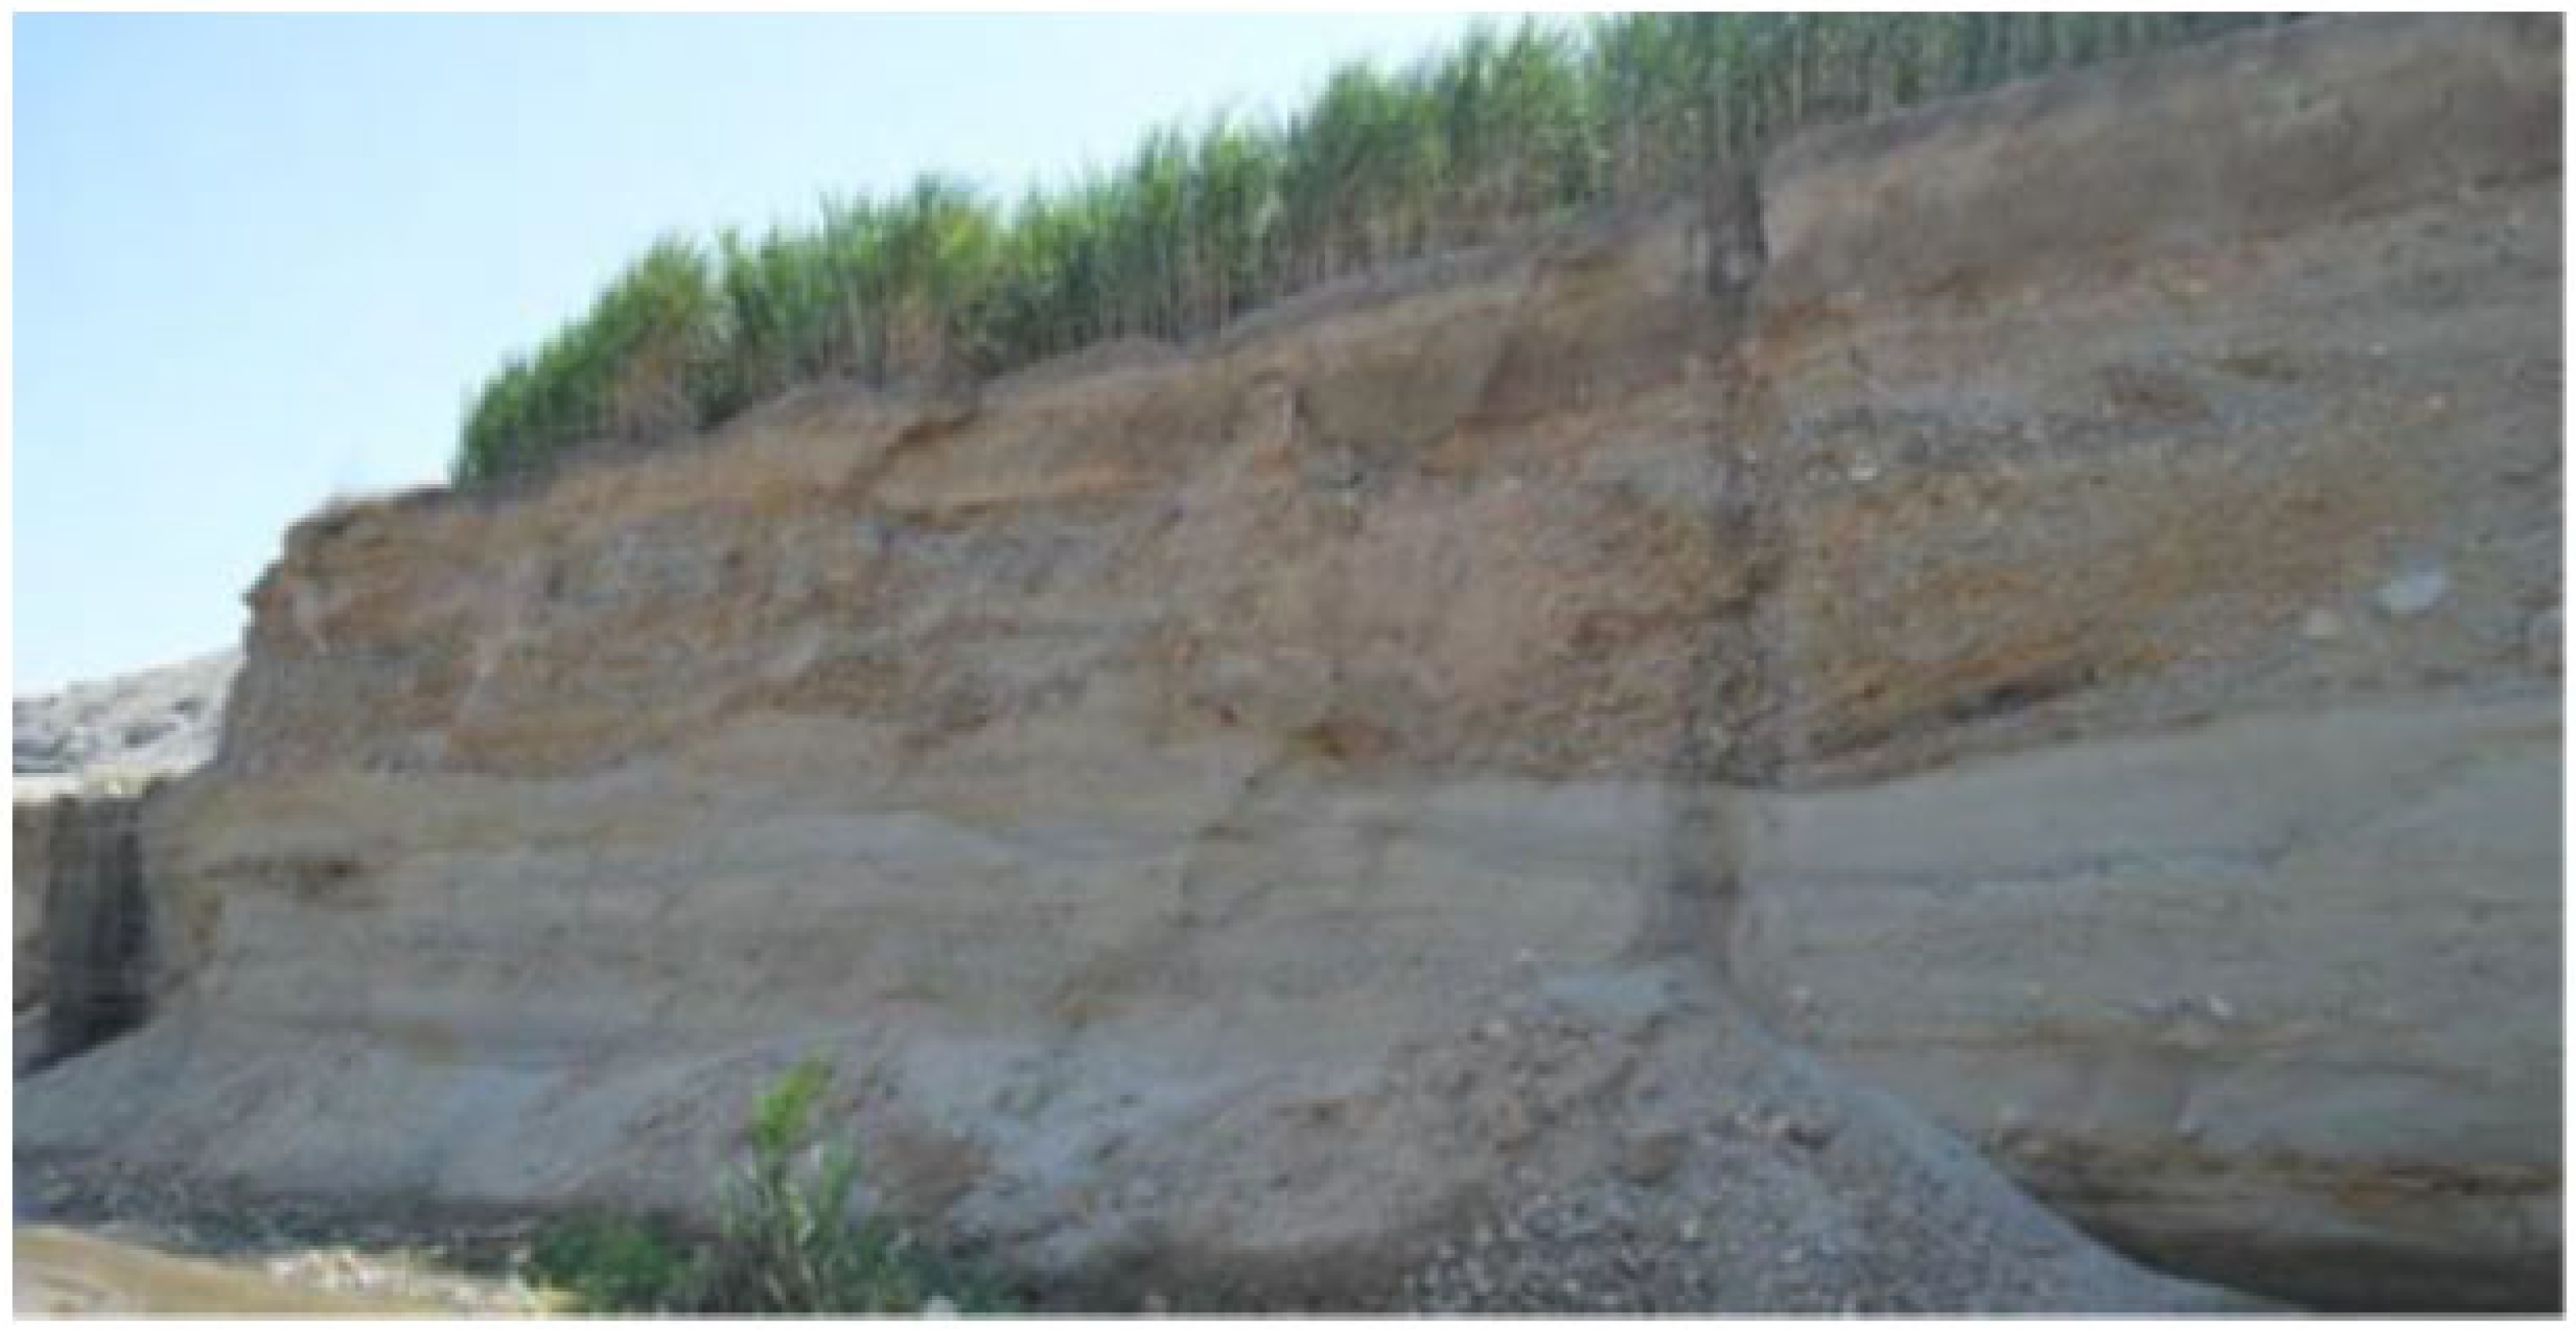
Owing to its seasonal or intermittent nature, the Lacramarca River exhibits irregular hydrological behavior that has generated negative impacts on the territory, as observed during the 1997–1998 events, when extensive overbank flows and flooding occurred across large portions of the basin, affecting both urban and rural areas [15]. The basin was also subjected to extreme El Niño events during the periods 1982–1983, 1997–1998, and 2017, during which extensive land areas were inundated, causing severe damage primarily to agricultural zones, especially rice crops, in the Pampadura and Santa Clemencia areas near the river. In this region, mass movement events occurred in the Chinecas Canal—which diverts water from the Santa River and intersects transversely with the Lacramarca River basin and the city of Nuevo Chimbote—due to debris transport originating from transverse ravines, affecting multiple sectors [16] (Figure 1).
Figure 1.
Longitudinal cross-section of the Lacramarca River showing channel incision, widening, and traces of paleochannels identified through sediment deposits originating from past flood events [16].
It should be emphasized that changes in the magnitude and frequency of flows within river channels are not solely attributable to climate change effects. They are also associated with human-induced alterations of channel morphology driven by population needs, particularly those related to agricultural activities and demographic growth. Additionally, new riverbank protection works are currently being implemented to prevent overflows and flooding in the Lacramarca River; this information has been incorporated into the development of the research.
Modeling constitutes a fundamental tool for understanding the different components of river basins and their respective roles in hydrology. Over recent decades, hydrological models have undergone significant improvement through the integration of additional environmental factors influencing hydrological processes, particularly those associated with global climate change [17]. The integration of hydrological models with climate models contributes to the design of more effective strategies for water resource management and the development of climate-resilient infrastructure [18].
A wide variety of models are currently available for comparative analysis and result evaluation, including General Circulation Models (GCMs) and Regional Climate Models (RCMs), developed under different climate change scenarios.
Flooding can be quantified using a variety of methods, ranging from simple empirical procedures to evaluations based on the rational method, flood frequency analysis, simplified conceptual models, multicriteria decision analysis, and numerical hydrodynamic modeling supported by Geographic Information Systems (GIS) [19]. The authors further emphasize that access to computational technology, combined with the availability of reliable input data and the use of multiple remote information sources—such as satellite data and platform-hosted datasets—has facilitated the development of hydrodynamic models using IBER, hydraulic modeling for flow simulation and analysis using the Hydrologic Engineering Center-River Analysis System (HEC-RAS), and rainfall–runoff simulation using the Hydrologic Engineering Center-Hydrologic Modeling System (HEC-HMS), among others.
According to a general analysis, several hydrological models for basin-scale process simulation have demonstrated their usefulness in evaluating external impacts on water resources. These studies indicate that models such as HEC-HMS (version 4.12) stand out due to their performance, accessibility, versatility for analyzing different basins and spatial scales, ease of implementation, and availability of technical support [20].
Flooding events represent a serious problem that significantly impacts populations, particularly in the Peruvian highlands. In the Cunas River basin, a study analyzed precipitation data, calculated basin parameters, and estimated peak discharges and flood-prone areas. In this project, HEC-HMS version 4.12 software was used to estimate peak discharges corresponding to return periods of 50, 100, 140, and 200 years, while hydraulic simulation was conducted using HEC-RAS version 6.7, revealing flood depths in the study area [21]. According to hydrological and hydraulic models developed with HEC-HMS and HEC-RAS, extreme events generate flooding that affects populations located near the Santa Eulalia River [22].
Other studies indicate that, in combination, geology, topography, and basin characteristics, together with hydraulic modeling and simulation using tools such as HEC-RAS and ArcGIS version 10.8, are key elements in determining flood generation processes. These approaches have proven effective for studying flood channels and increasingly replace traditional analytical models [23]. HEC-RAS is capable of generating flood maps directly from computed water surface profile results for a variety of scenarios [24].
In addition, IBER is recognized as a computational modeling system designed to simulate water flow in rivers, estuaries, and coastal environments [25]. Using this software in the Tesechoacan River basin (Mexico), risk maps were generated showing flood-prone areas, where 56.9% of the territory was classified as high risk [26].
The present research constitutes a case study conducted in a section of the Lacramarca River located downstream of the Pampadura population center and in the area adjacent to the Santa Clemencia community, a region that has limited hydrological studies, with the objective of identifying flood-prone areas under extreme discharge conditions and climate-related phenomena such as ENSO. The central hypothesis of this research considers that changes associated with climate variability may increase peak discharges in the lower Lacramarca river basin, intensifying flood risk of agricultural land and human settlements progressively established near the natural riverbank. Furthermore, this case study contributes to the fulfillment of Sustainable Development Goals through the generation of scenarios to support flood risk mapping and the planning of resilient infrastructure.
This study is based on projections derived from simulations of water flow behavior in the study area, carried out using HEC-RAS and IBER, and the estimation of design peak discharges modeled with HEC-HMS (version 4.12) for return periods (T) of 50, 100, and 140 years. These simulations use historical precipitation data derived from Intensity–Duration–Frequency (IDF) curves published on the official data platform of the National Meteorology and Hydrology Service of Peru (SENAMHI) [27], as well as climate scenario data available through the same platform.
2. Materials and Methods
2.1. Location of the Study Area: Lacramarca River Basin
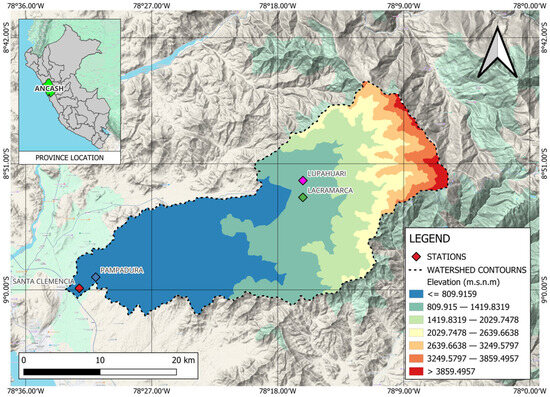
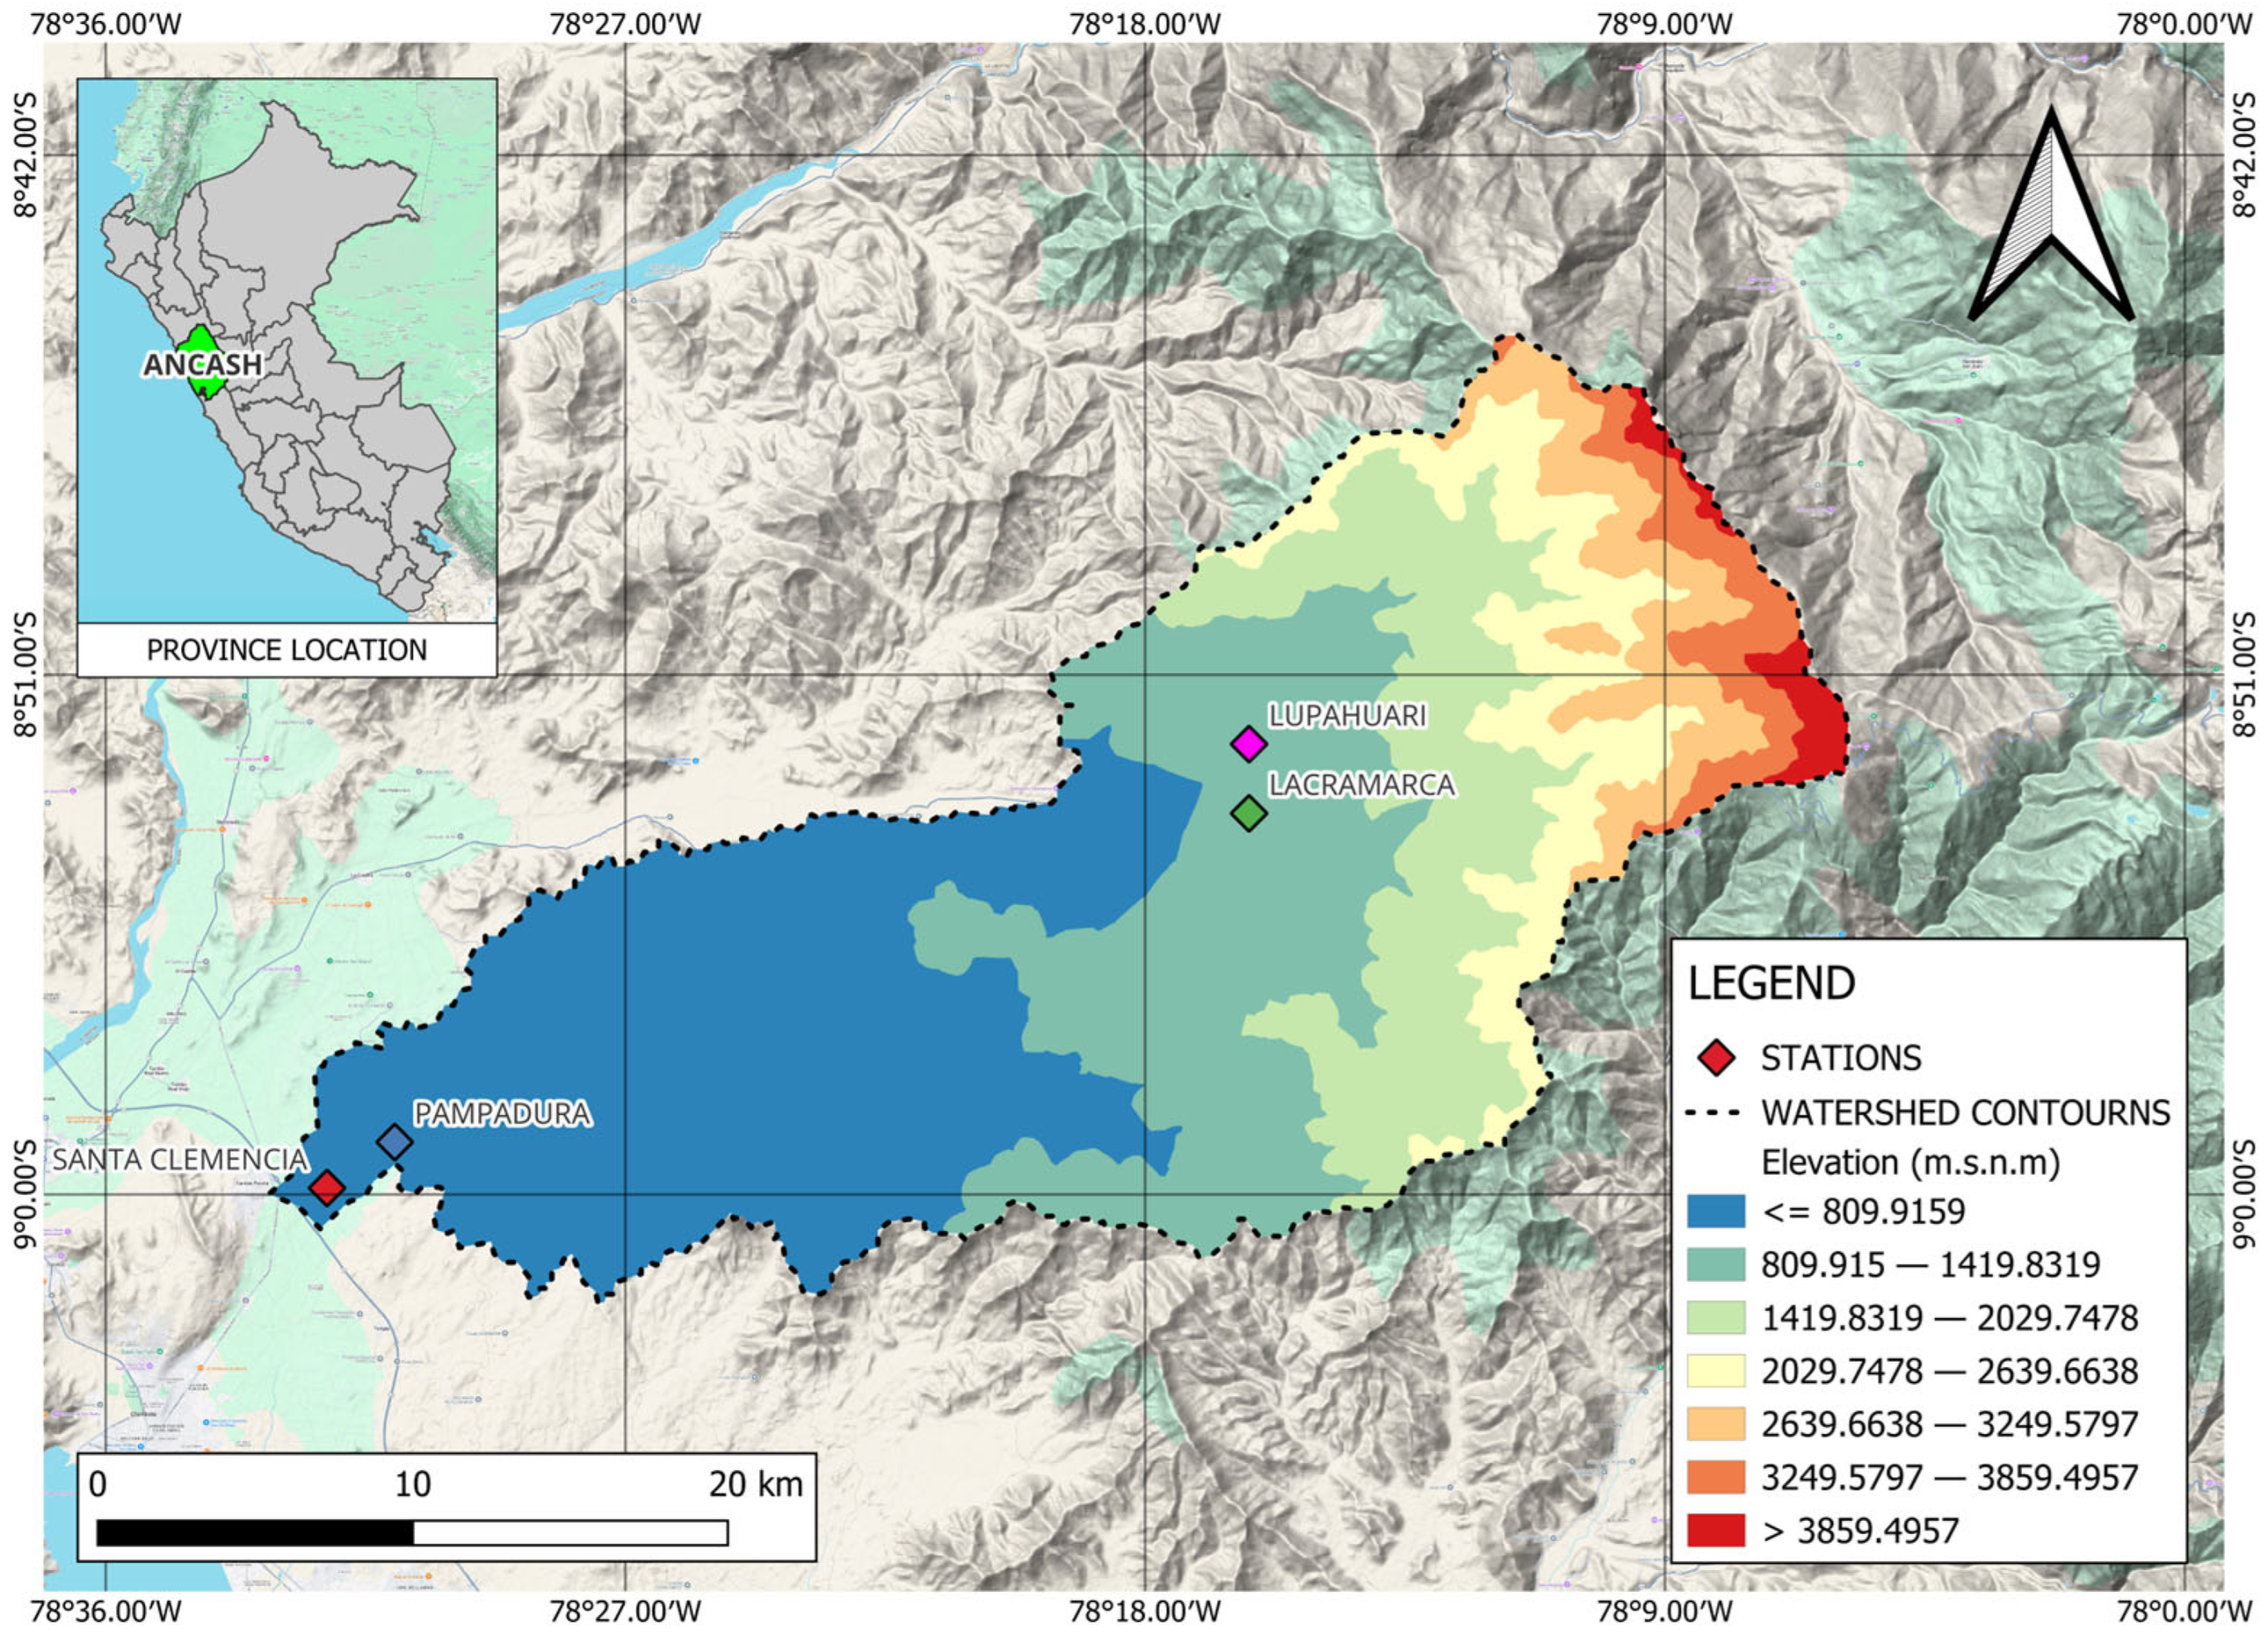
The Lacramarca River originates in the highlands of Cerro Ulto Cruz, where it is initially referred to as the Lupahuari River. Downstream, along its left bank, it is joined by the Santa Ana River, at which point it is formally identified as the Lacramarca River. This research was conducted within this basin, focusing on the study area located between the Pampadura and Santa Clemencia zones, situated in the district of Cambio Puente, Santa Province, within the Ancash region of Peru. The study area is located at coordinates 476,791.26 and 8,658,567.699 (Datum) (Figure 2).
Figure 2.
Location of the study area within the Lacramarca River basin in the Ancash region, produced using QGIS 3.36.2.
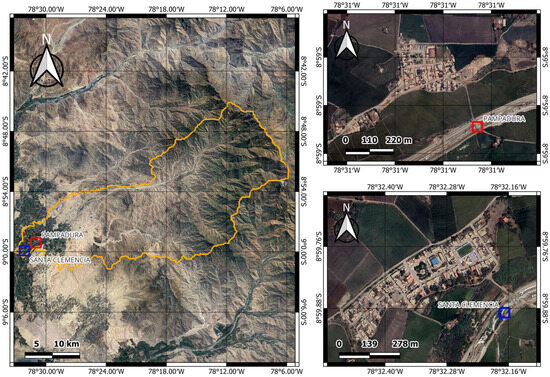
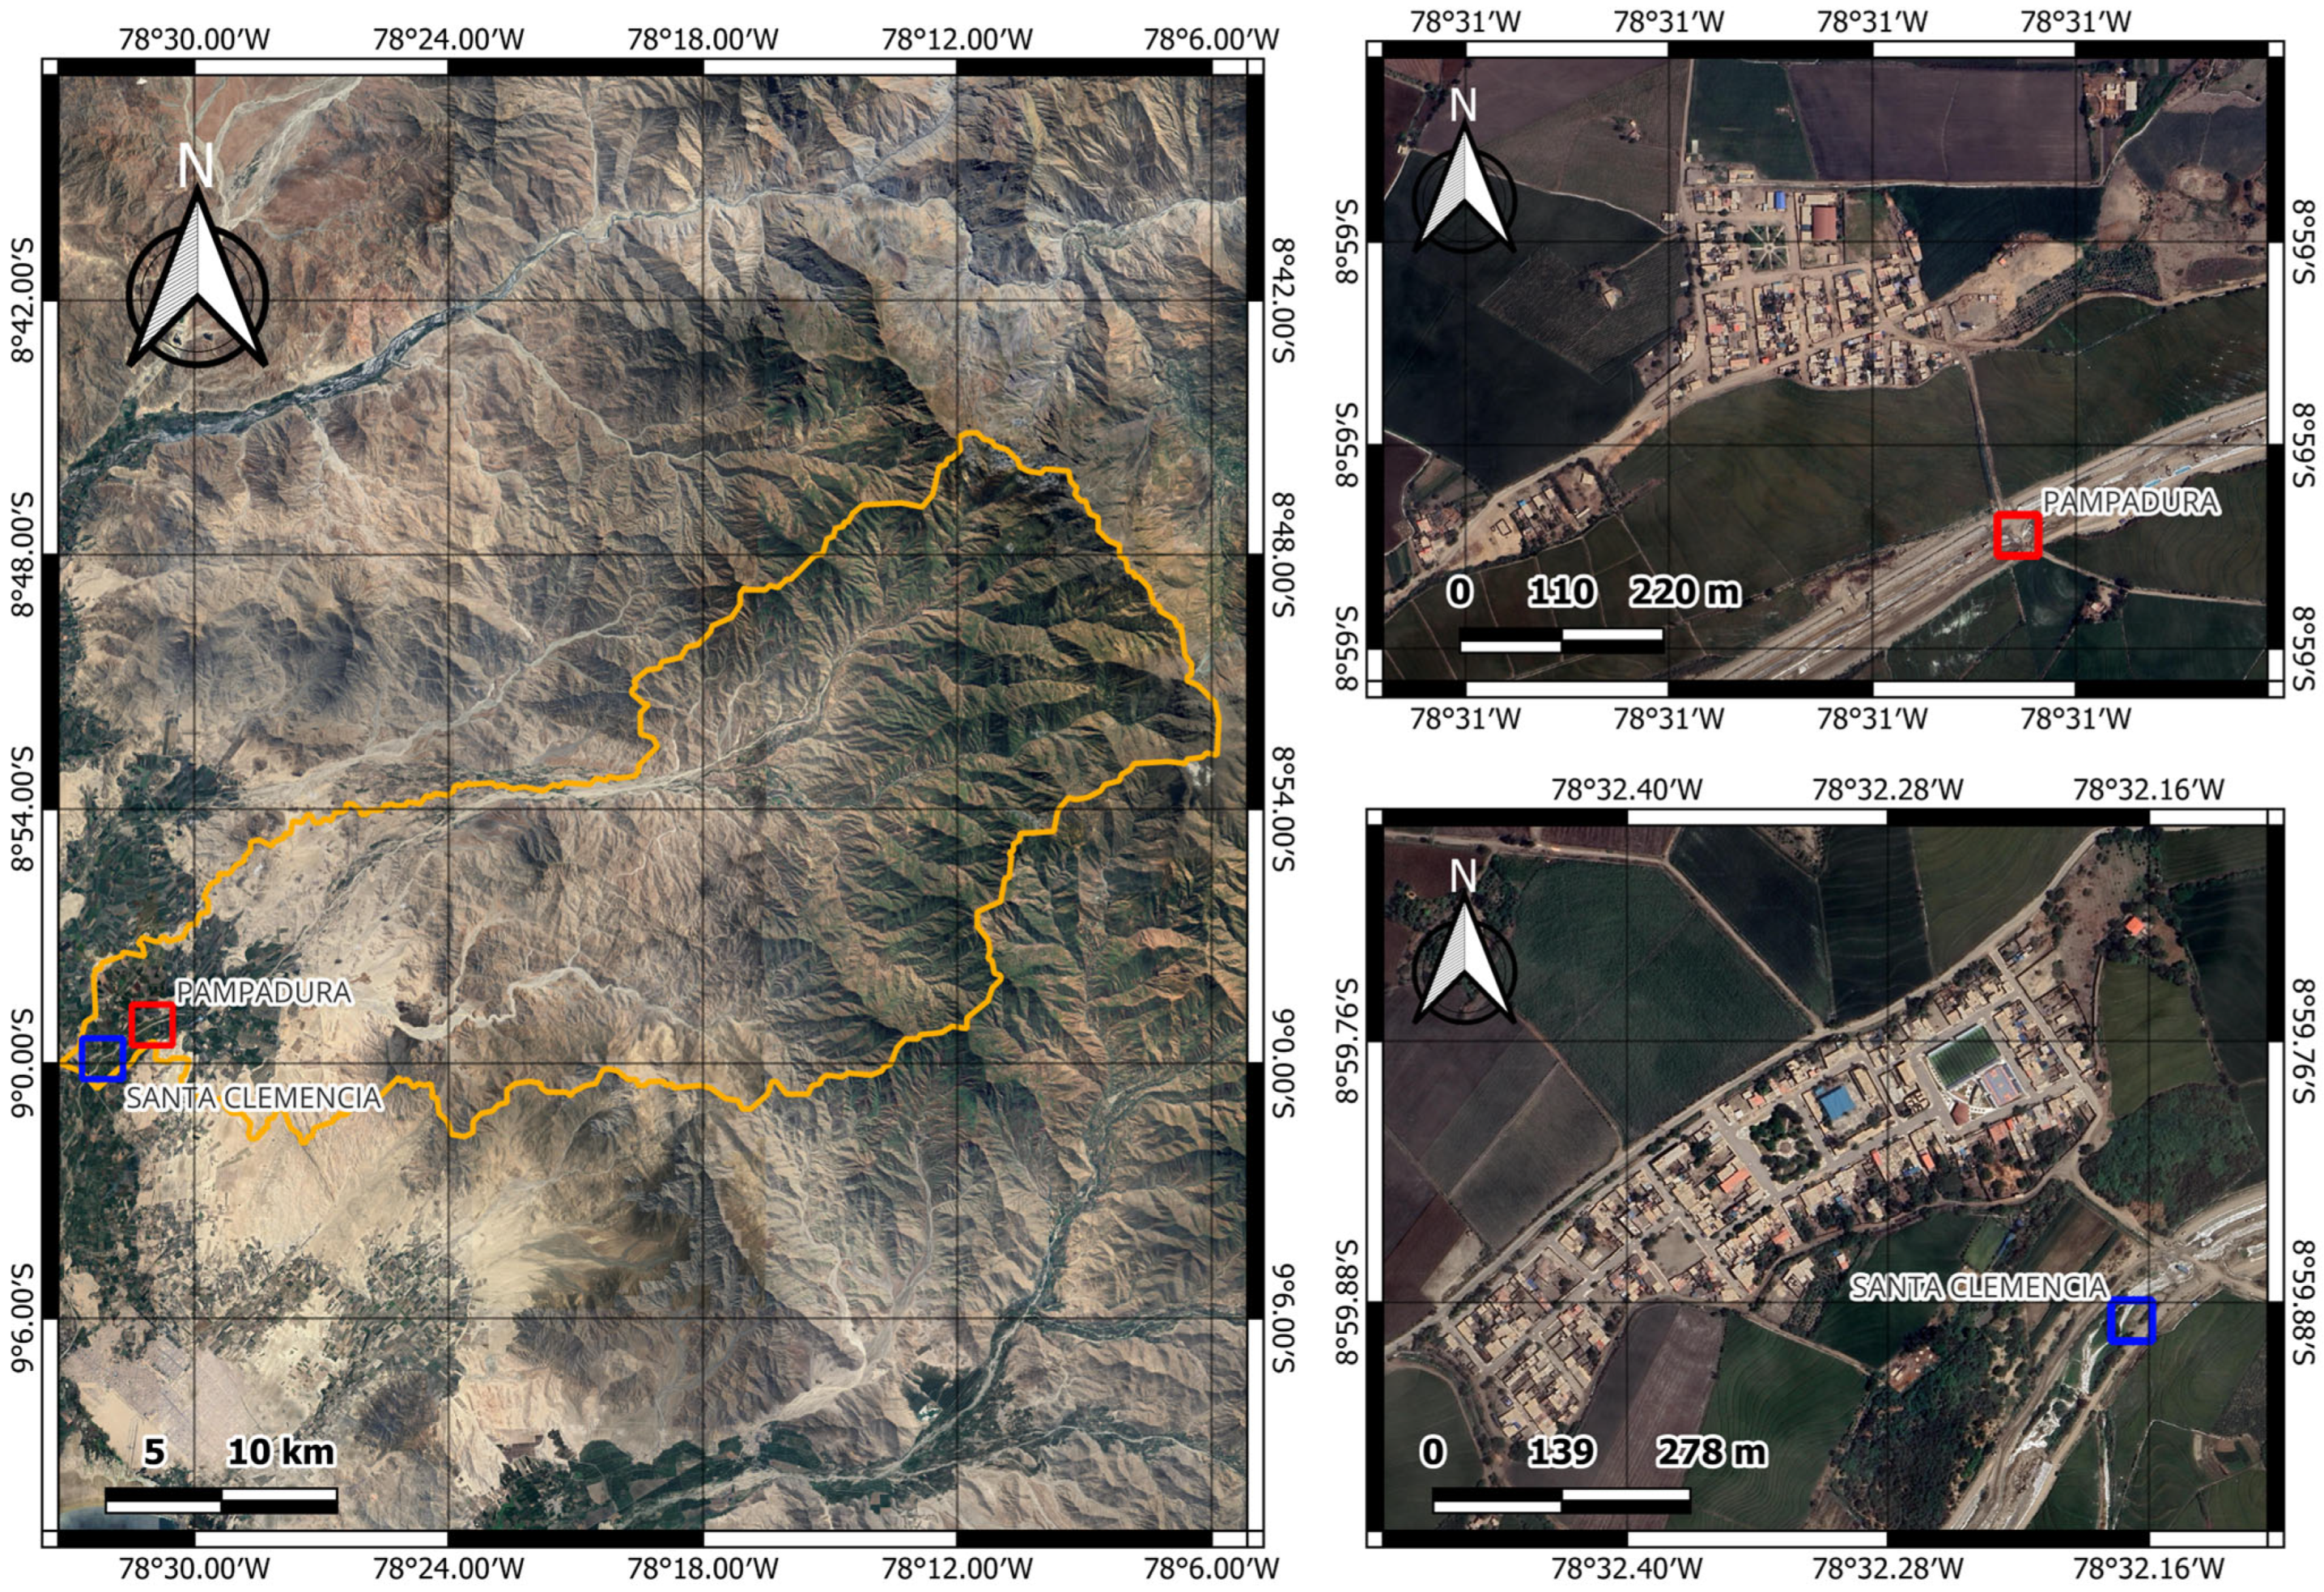
The Lacramarca River basin is characterized by mountainous topography and a heterogeneous climate, with seasonal behavior and a variable flow regime. The river experiences prolonged dry periods and episodic high discharges, conditions that have contributed to major flooding events. With respect to the physiographic characteristics of the basin and the study area, QGIS version 3.36.2 was used to determine several parameters, including a basin area of 712.89 km2 and an average slope of 9% (Figure 3).
Figure 3.
Study area within the Lacramarca River basin located between the populated centers of Pampadura and Santa Clemencia.
2.2. Generation of Satellite Imagery of the Study Area During the 2017 Coastal El Niño Event
To provide a detailed depiction of the hydrological behavior of the Lacramarca River during the 2017 Coastal El Niño event, satellite imagery was generated for the study area, which includes the reach of the Lacramarca River near the city of Chimbote, Peru (9.07° S–8.94° S, 78.57° W–78.45° W), covering an approximate area of 196 km2.
Sentinel-2 Level-2A surface reflectance imagery was obtained through the Google Earth Engine platform [28] for two temporal periods: January 2017 (before) and March 2017 (after). Cloud-masked composite images were generated using median compositing, filtering scenes with less than 30% cloud cover. The composites included four spectral bands: Blue (B2, 490 nm), Green (B3, 560 nm), Red (B4, 665 nm), and Near-Infrared (B8, 842 nm), all resampled to a spatial resolution of 10 m. The images were exported in GeoTIFF format using the WGS84 geographic coordinate system (EPSG:4326).
To enhance class discrimination, three spectral indices were computed from the original bands: the Normalized Difference Vegetation Index (NDVI), used to identify vegetated areas and crop vigor; the Normalized Difference Water Index (NDWI), optimized for water body detection; and the Modified Normalized Difference Water Index (MNDWI), an alternative water detection index adapted to the available spectral bands. The final feature space consisted of seven predictors: four original spectral bands and three derived indices.
A total of 200 training points were randomly sampled across both images using the terra package [29], ensuring adequate spatial representation of all land cover classes. Each training point was manually labeled in QGIS version 3.x [30] through visual interpretation of high-resolution Sentinel-2 true-color composites for both temporal periods. Four land cover classes were defined: Water, Crops, Bare Soil, and Buildings. Each point was assigned two independent labels (class_before and class_after), allowing for temporal change analysis. The training dataset was stored as a GeoPackage vector file containing point geometries and associated class attributes.
Supervised classification was conducted using the Random Forest (RF) algorithm [31] implemented through the ranger R package [32]. For each temporal period (before and after), spectral band values and derived indices were extracted at the training point locations. The dataset was partitioned into training (70%) and testing (30%) subsets using stratified random sampling. RF models were trained using 500 trees and a minimum node size of 5 as hyperparameters. The trained models were applied on a pixel-wise basis across the entire image extent using the terra package’s predict function, producing categorical land cover maps for both periods. Output rasters were encoded with a Raster Attribute Table (RAT) linking integer class codes to land cover classes. Classification maps were visualized using the tmap package [33], applying distinct color palettes for each land cover class.
All analyses were conducted using R version 4.x [34], with spatial operations performed using the terra and sf packages [35]. It is important to note that only satellite imagery from 2010 onward was considered in this analysis due to limitation in data availability.
Classification accuracy was evaluated using both training and independent testing datasets. Confusion matrices were generated by comparing predicted classes with reference classes using the 30% holdout test set. Three complementary performance metrics were employed: Overall Accuracy (OA), representing the proportion of correctly classified pixels; the Kappa coefficient (κ), which measures agreement between predicted and reference classifications while accounting for chance agreement; and per-class metrics, including sensitivity (recall), specificity, precision, F1-score, and balanced accuracy, to assess classification performance across individual land cover classes. Variable importance was evaluated using the mean decrease in node impurity (Gini importance) to identify the most discriminative spectral features for each classification scenario.
Land cover area for each class was calculated by multiplying the number of pixels per class by the cell area expressed in hectares, accounting for the 10 m spatial resolution. Total area and per-class areas were computed for both temporal periods, and absolute (hectares) and relative (percentage) changes were quantified.
2.3. Estimation of Maximum Precipitation
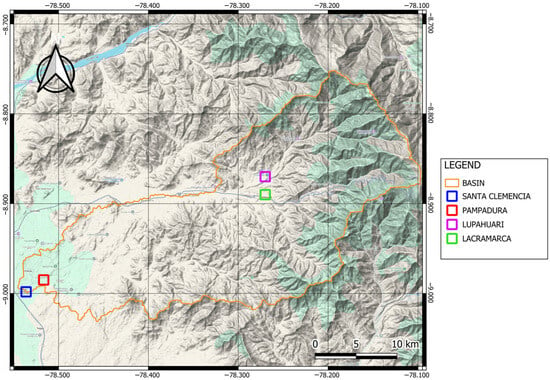
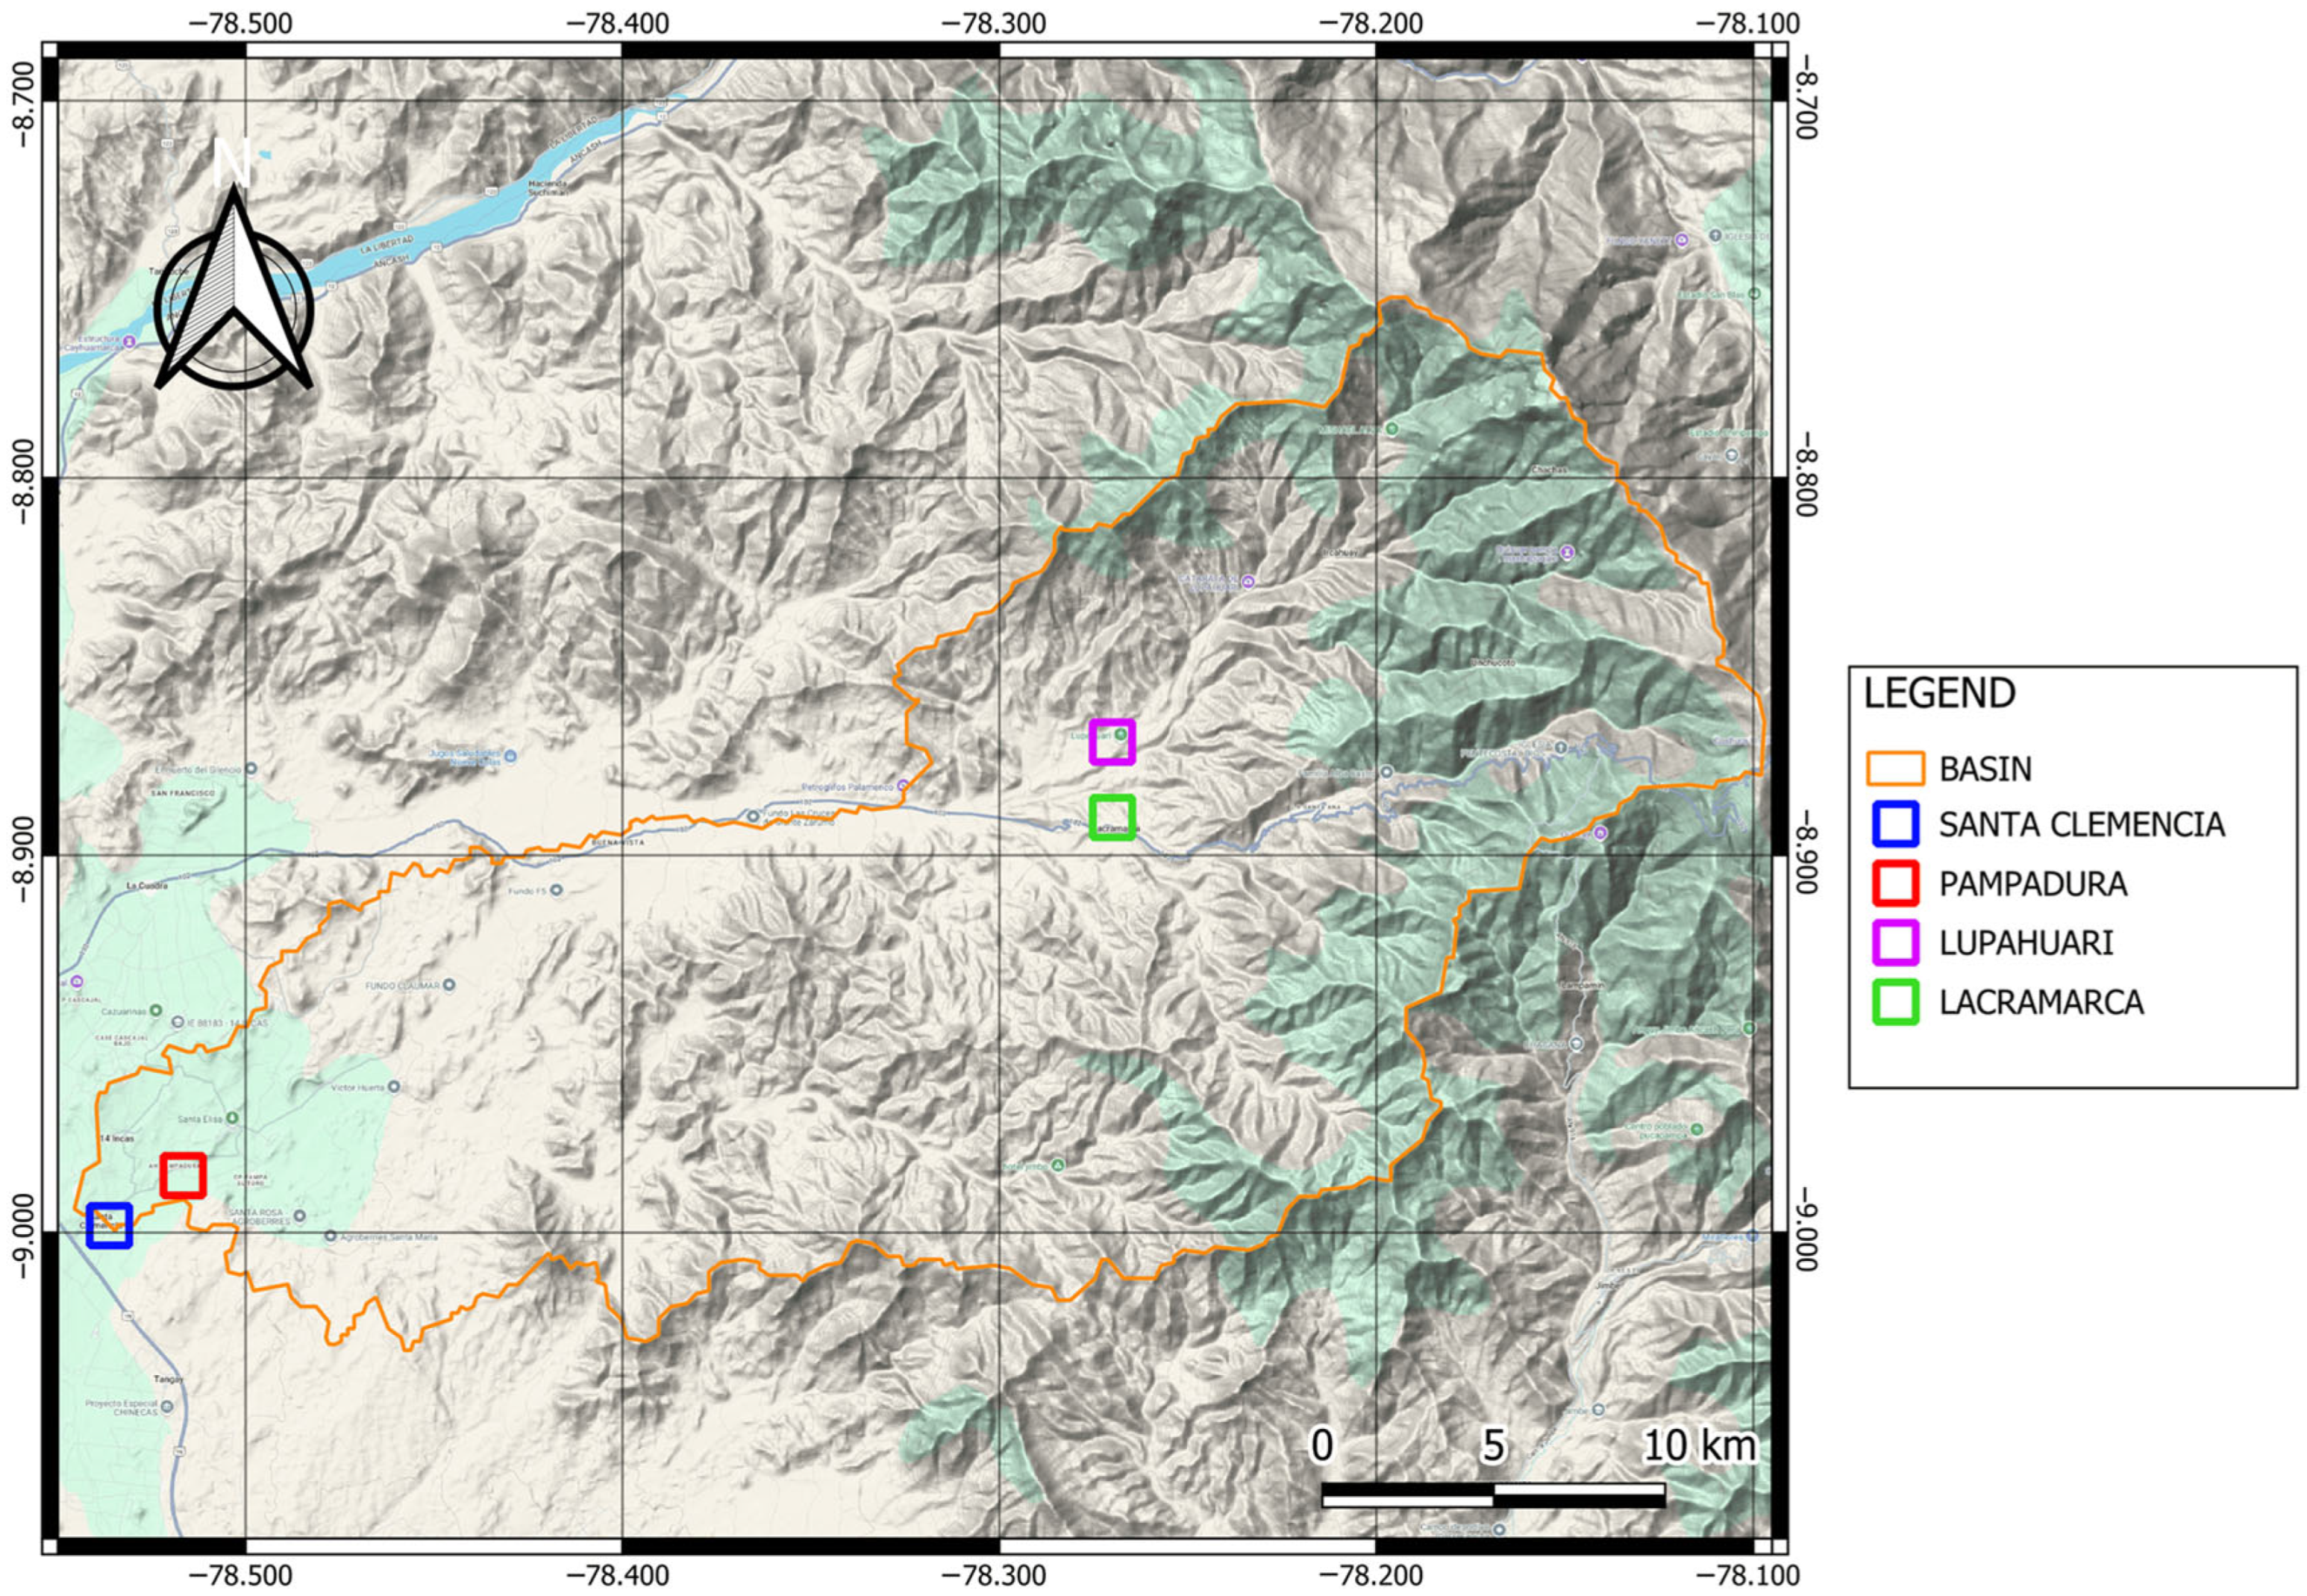
The estimation procedure was based on the analysis of Intensity–Duration–Frequency (IDF) curves associated with different return periods, obtained from SENAMHI’s climate information platform. Maximum precipitation values were derived for two strategically located points within the basin (Figure 4). These locations were defined based on the downstream endpoint of the basin section at Santa Clemencia (9.00° S, 78.54° W; WGS84), from which two additional analysis points were established: Lacramarca (8.89° S, 78.27° W; WGS84) and the Lupahuari Ravine (8.87° S, 78.27° W; WGS84).
Figure 4.
Geographic location of the analysis points used for maximum precipitation estimation.
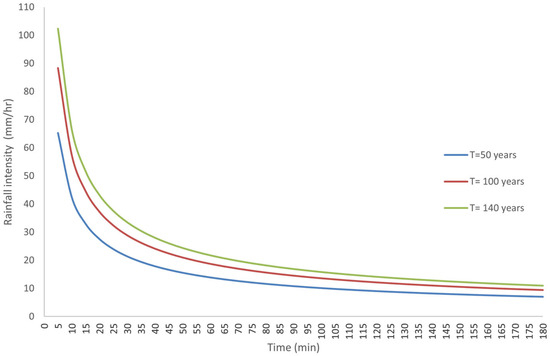
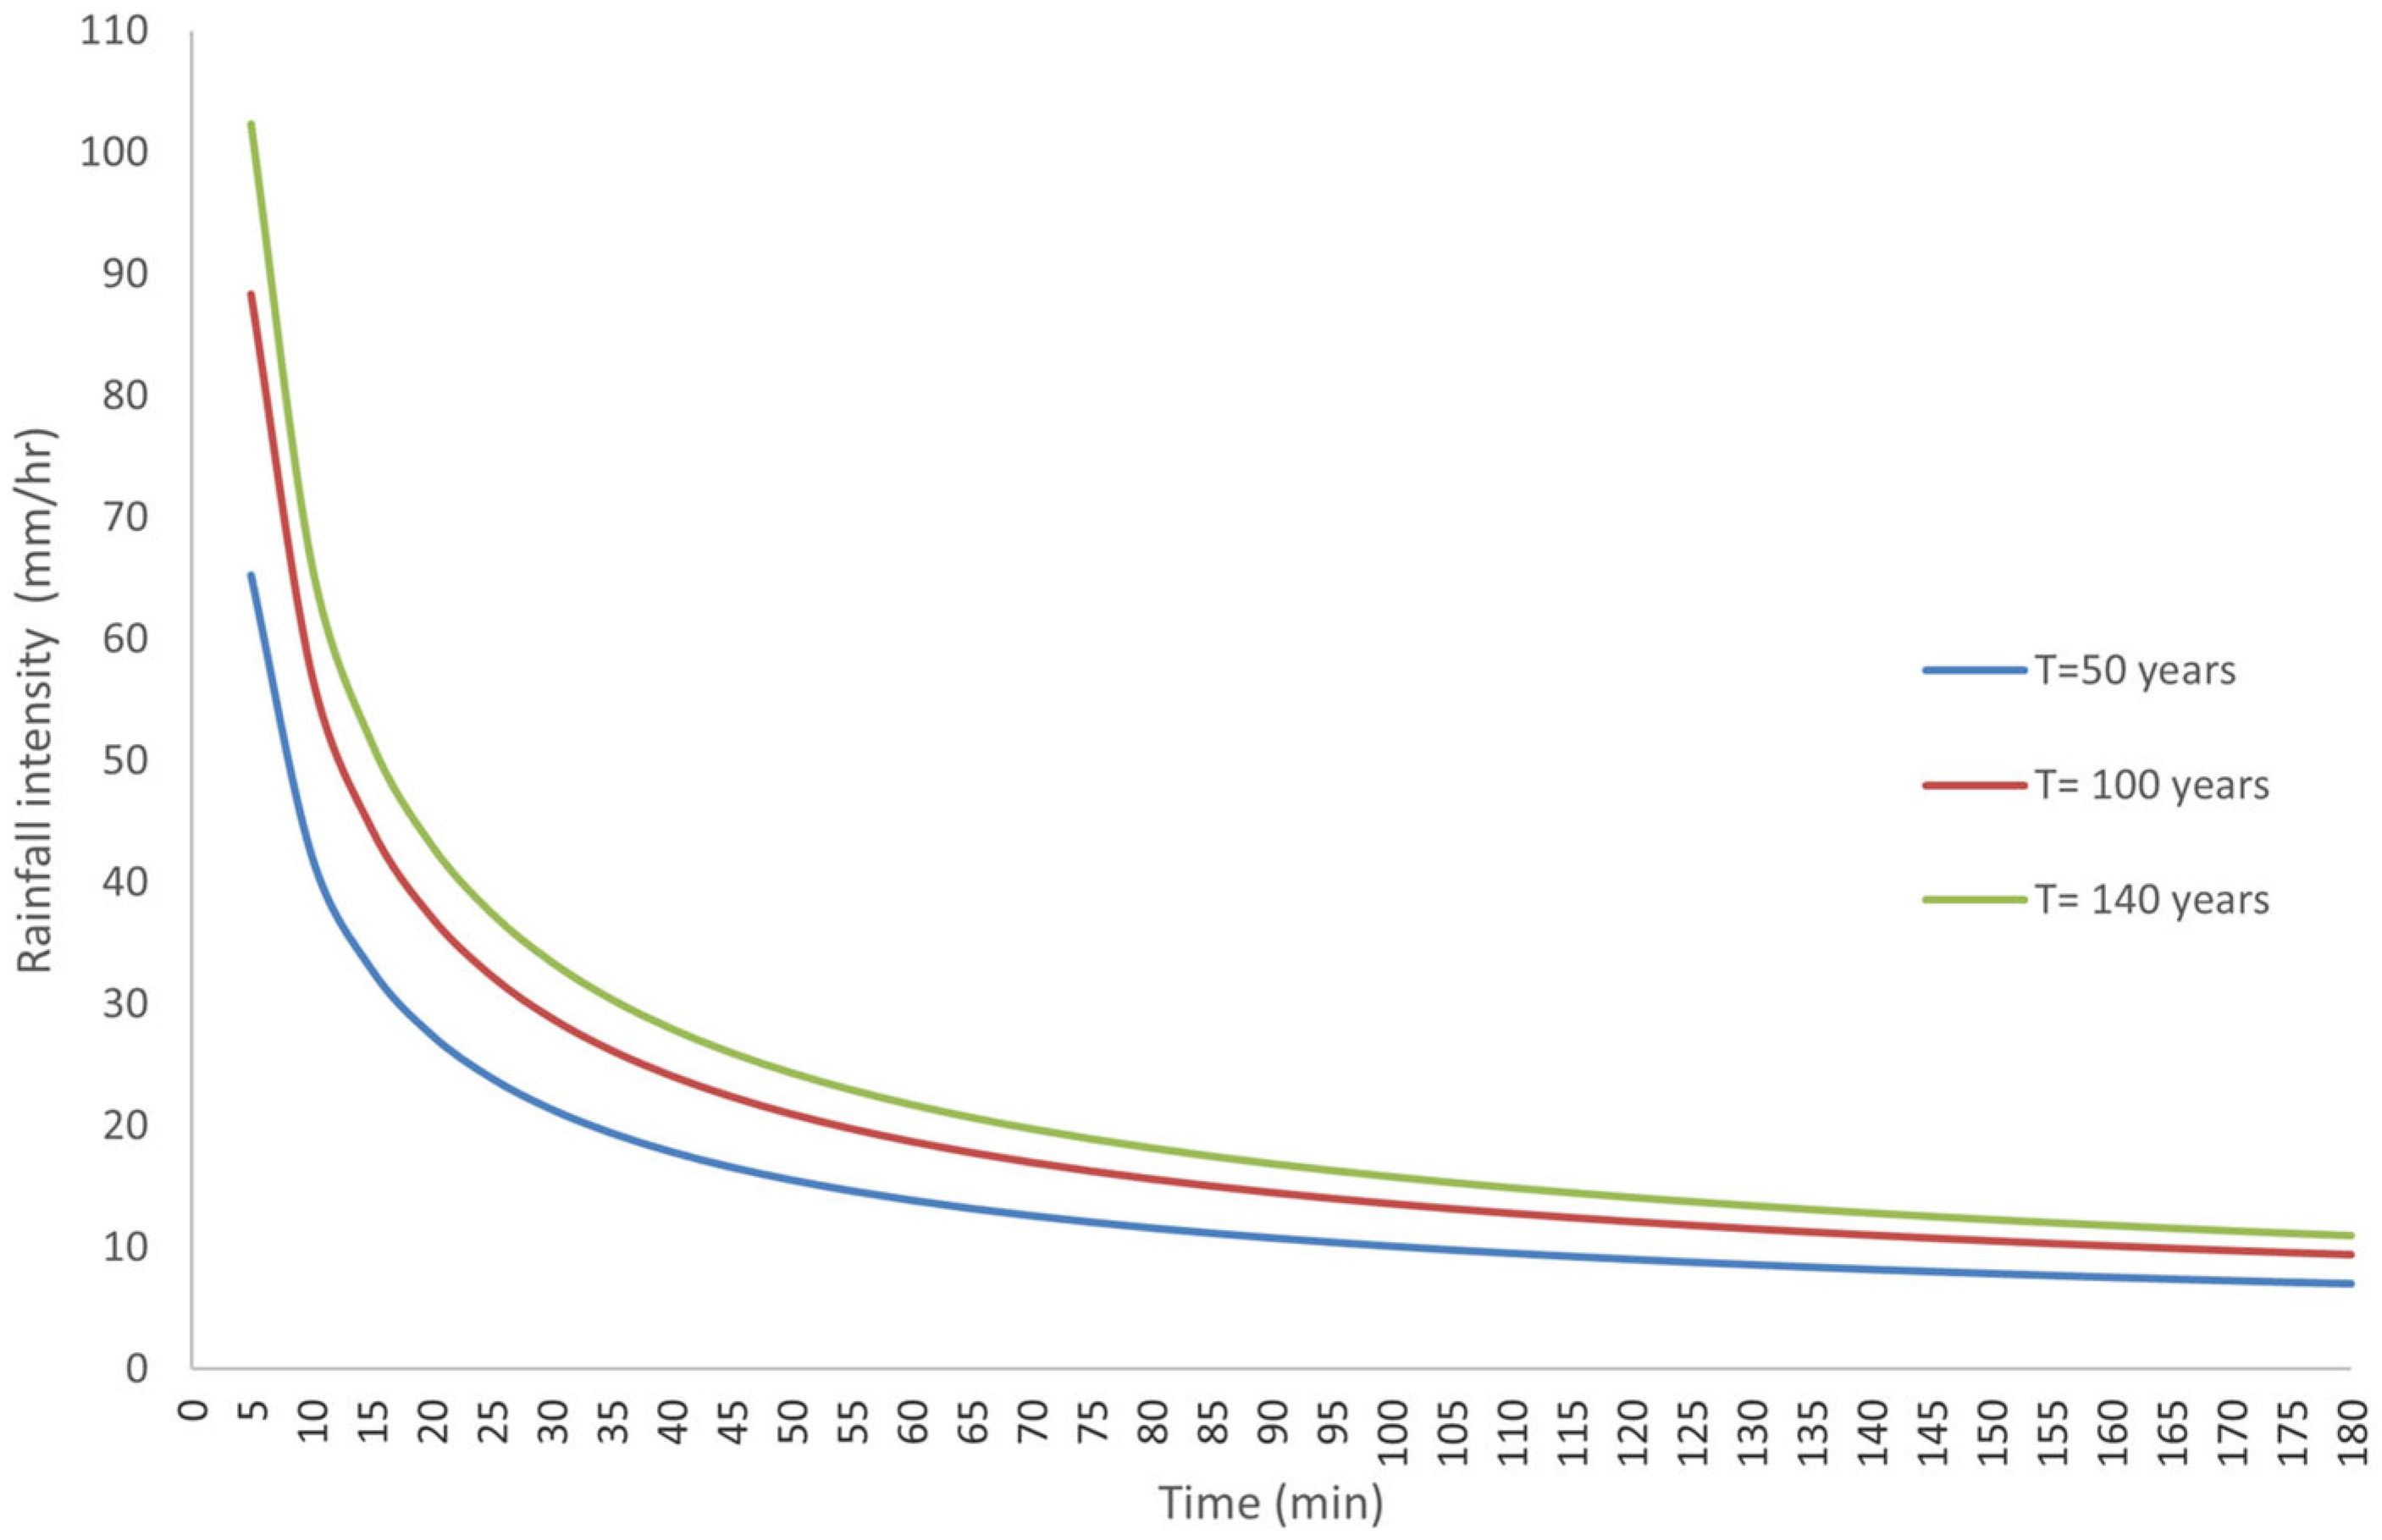
Maximum precipitation values for this research were derived from IDF curves (Figure 5) constructed using historical annual maximum precipitation records and hourly precipitation data collected from 442 conventional meteorological stations and 286 automatic stations distributed nationwide and managed by SENAMHI, the National Water Authority (ANA), and Appalachian State University (USA). These datasets were complemented with data obtained from climate scenarios ACCESS 1-3, HadGEM2-ES, MPI-ESM-MR, and the median projection scenario for 2050, disseminated through SENAMHI’s IDF Curve Estimation Module [27].
Figure 5.
IDF curves constructed for the return periods considered in this research, derived from SENAMHI IDF curves.
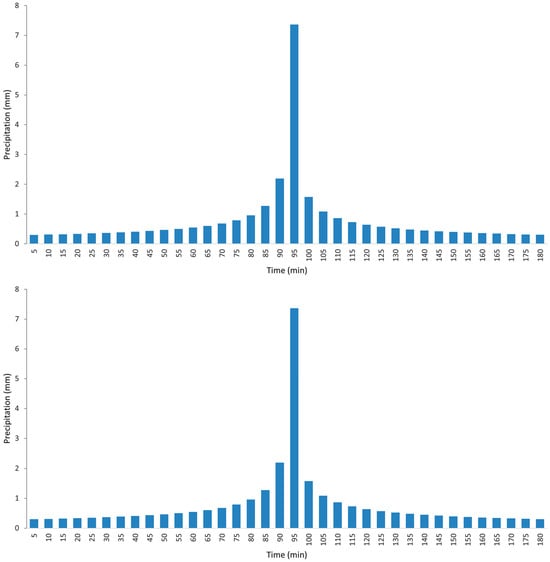
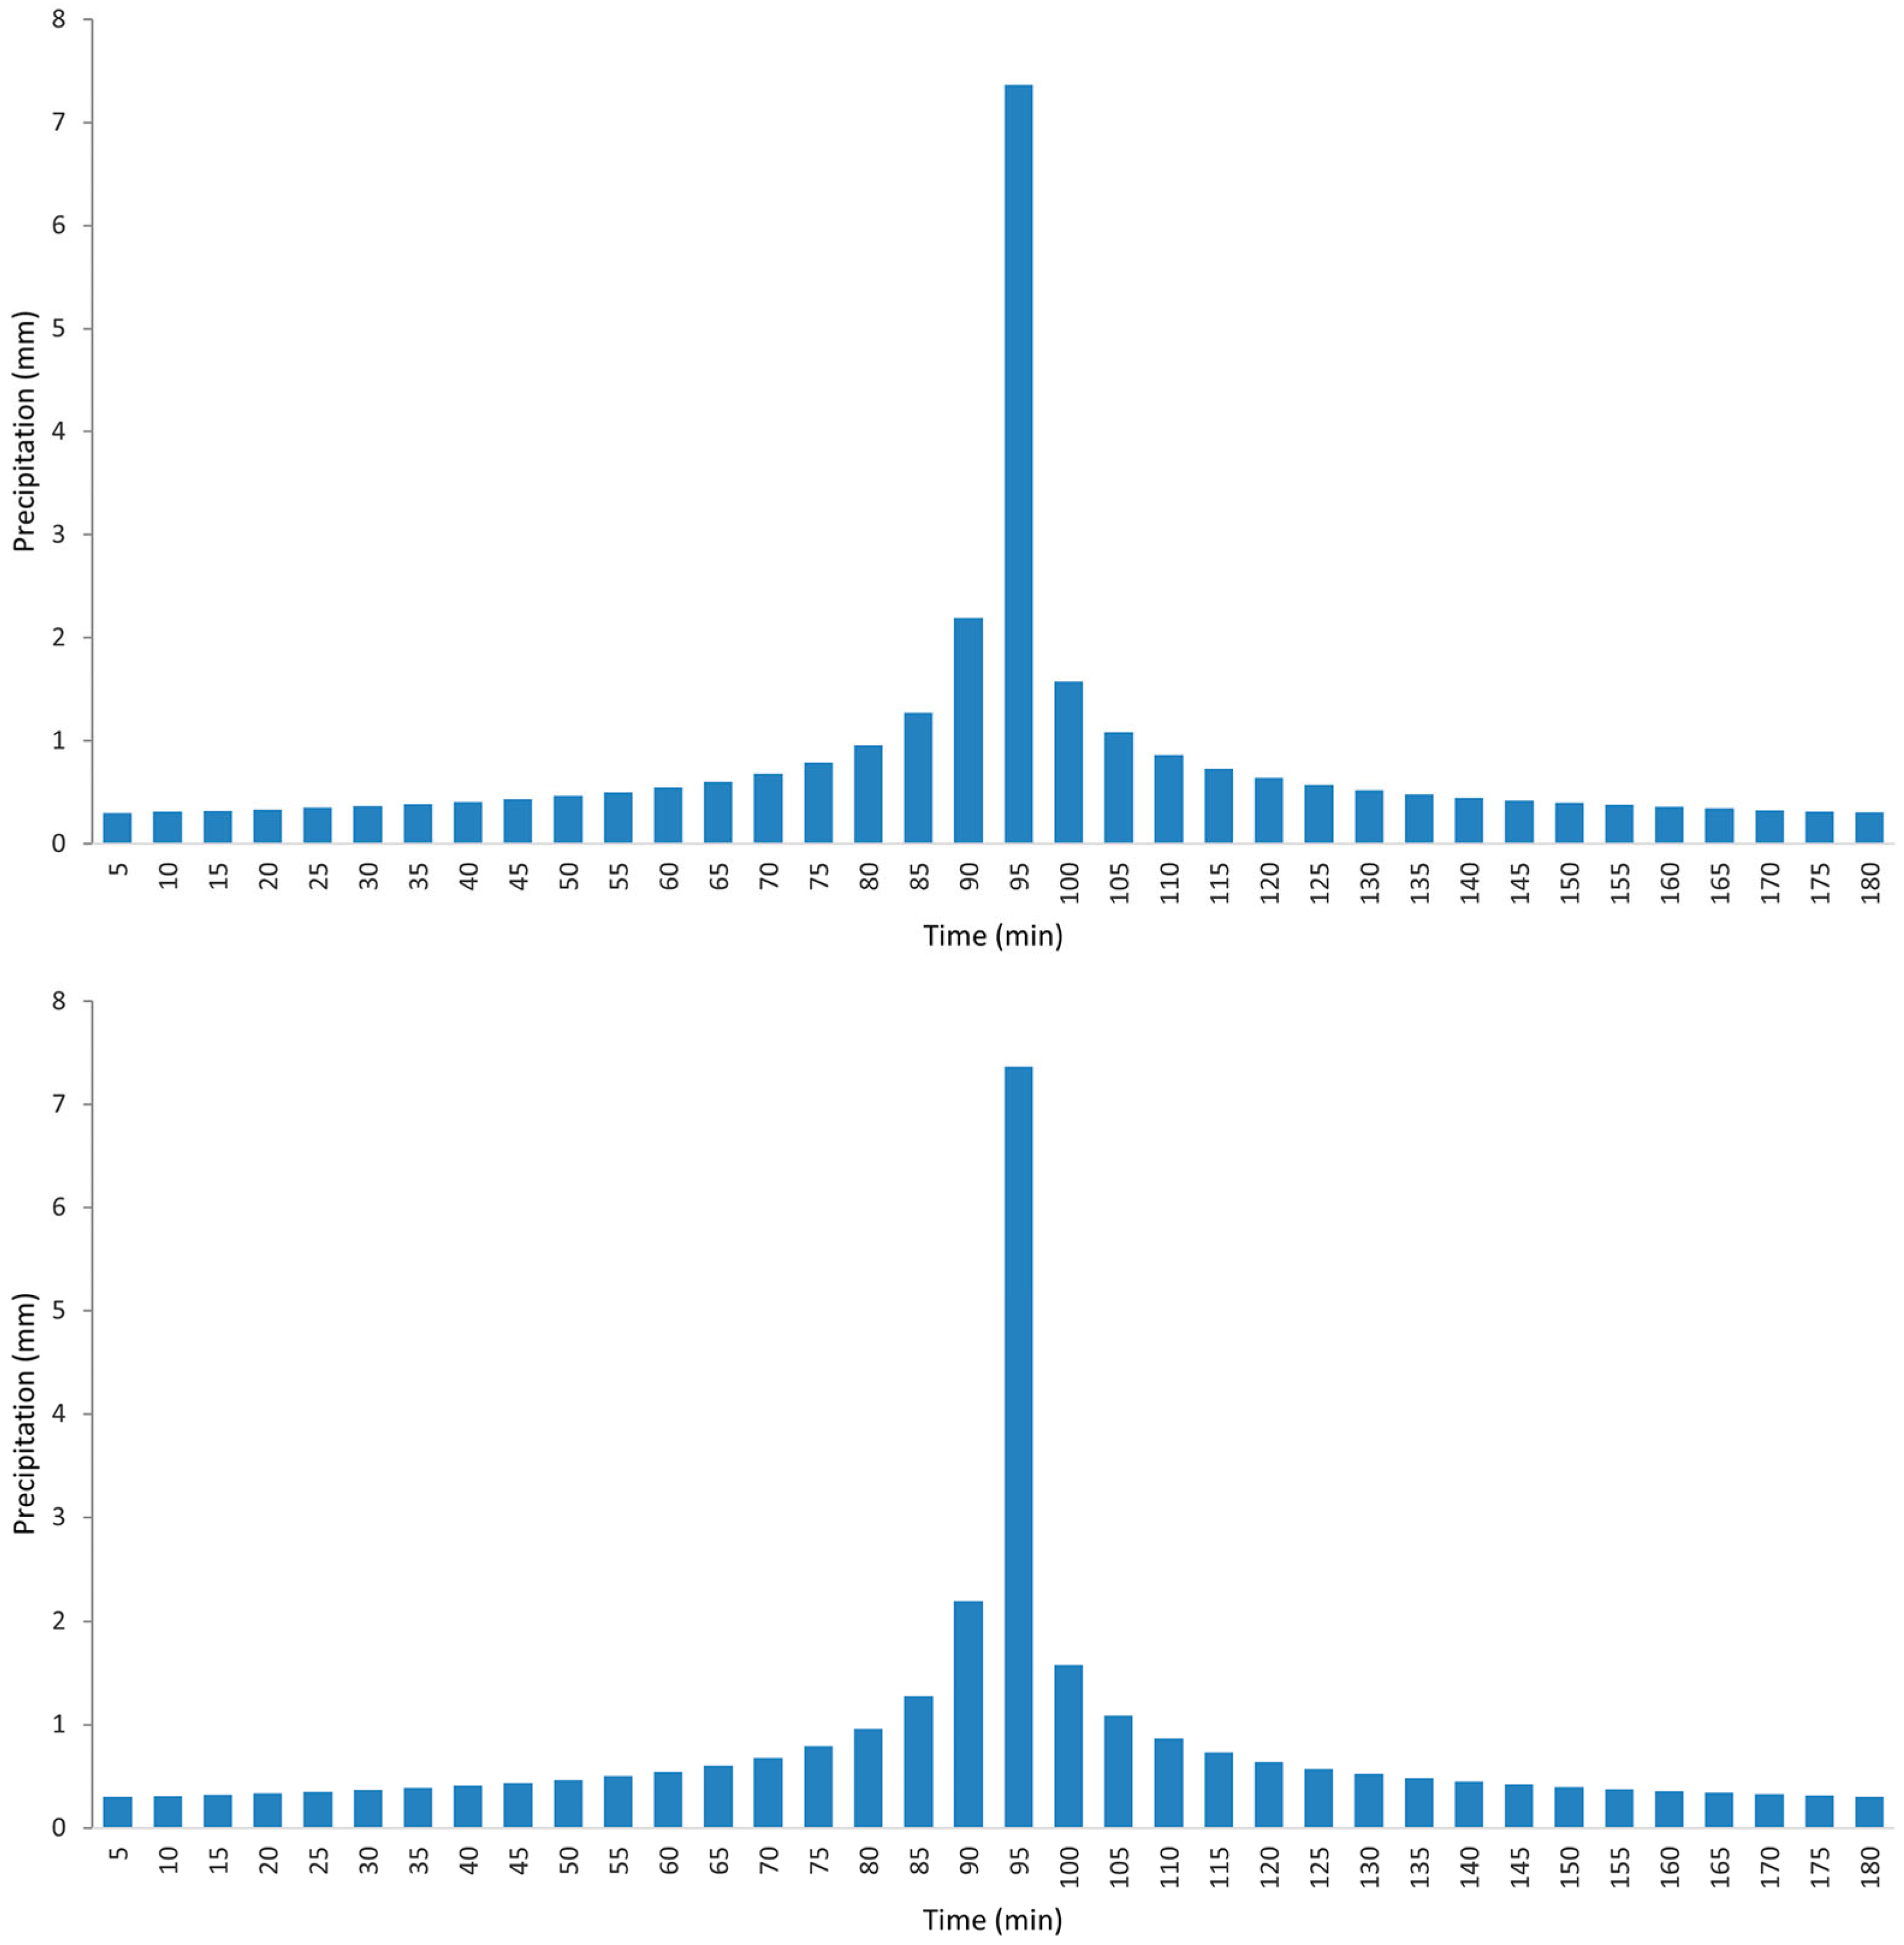
The IDF curves provided the maximum precipitation inputs used to generate hyetographs required for peak discharge estimation. This process was carried out using the HEC-HMS software, considering return periods (T) of 50, 100, and 140 years. The resulting peak discharges were subsequently incorporated into hydraulic modeling, following recurrence criteria established in the regulatory framework [36] for riverbank protection design (Figure 6).
Figure 6.
Hyetographs corresponding to return periods of 100 and 140 years.
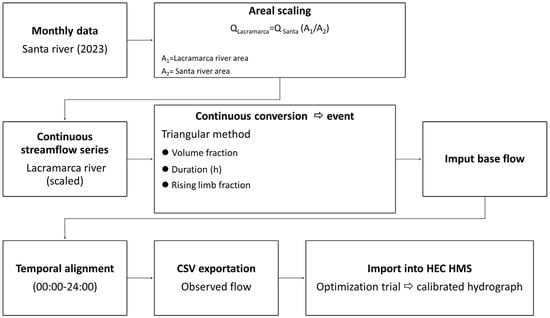
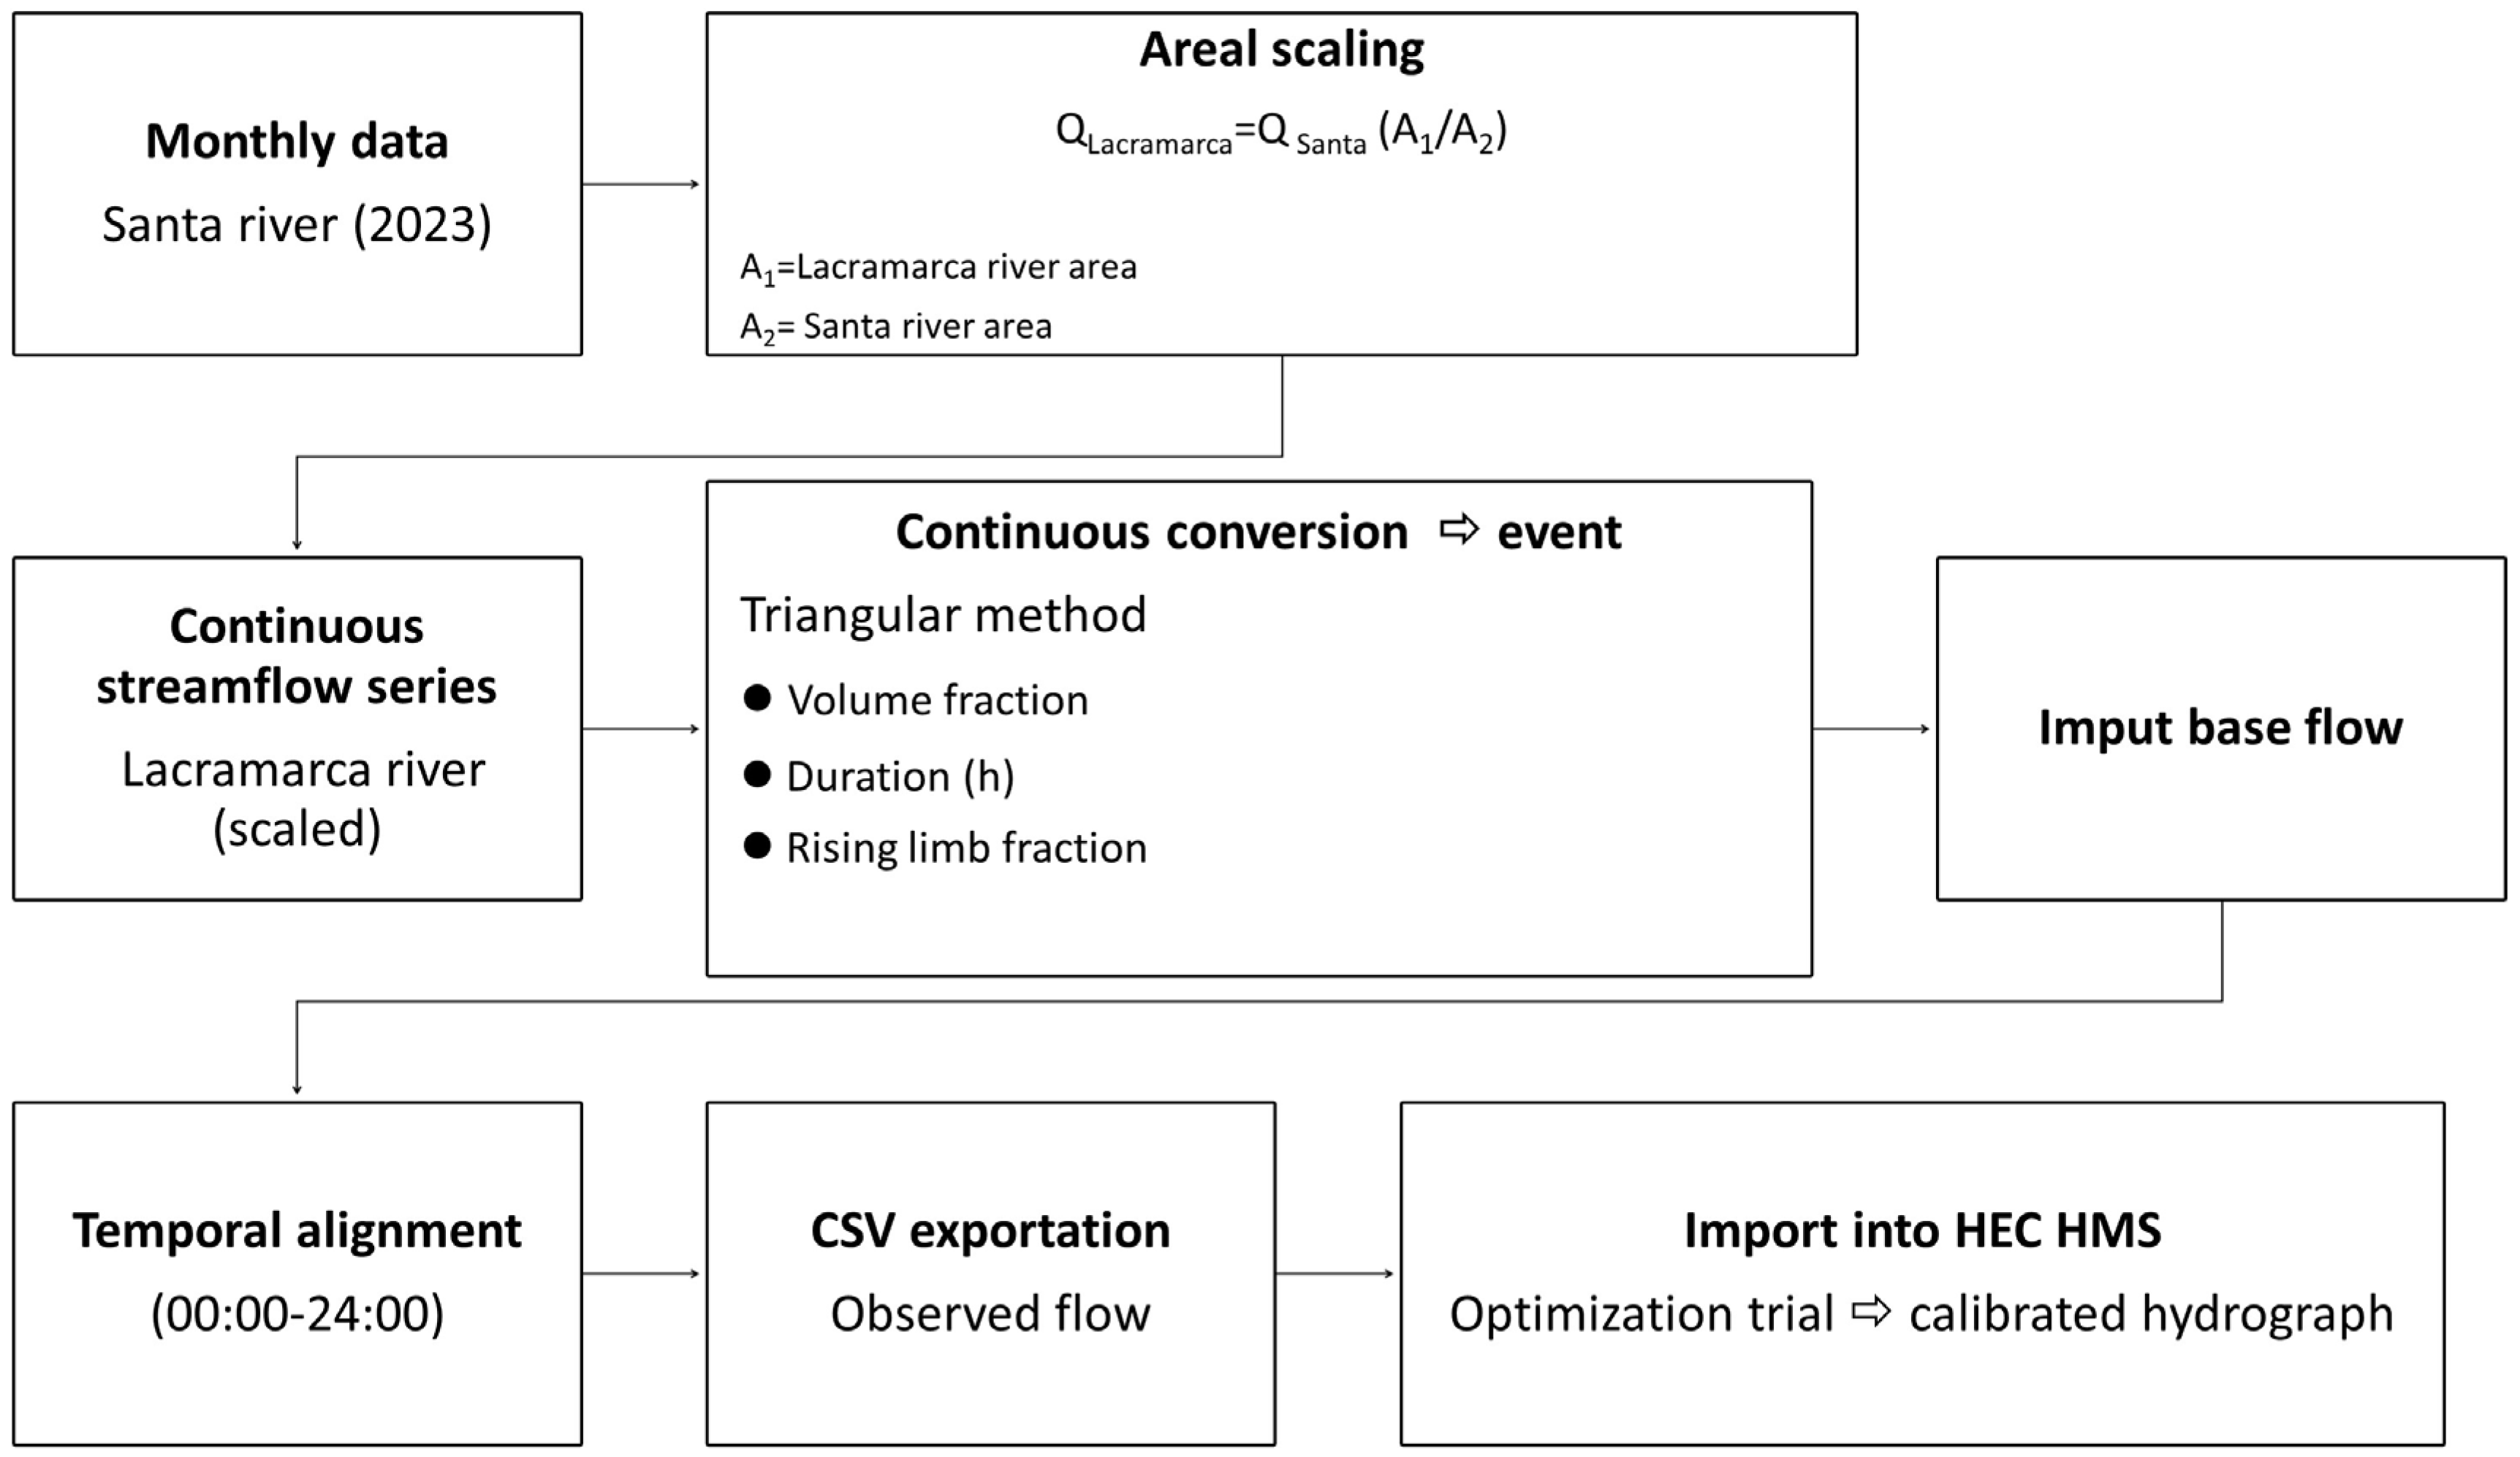
To verify the reliability of the hydrometric data for the Lacramarca River basin derived from discharge modeling using HEC-HMS, a data validation process was conducted. This process involved a comparative analysis using discharge records from the Quitaracsa hydrometric station, located in the Santa River basin near the Lacramarca basin and selected due to the similarity in their extreme hydrological behavior. The calibration methodology employed [37] is presented schematically in Figure 7.
Figure 7.
Methodological scheme for hydrometric data calibration using discharge records from the Quitaracsa o Station located in the Santa River basin compared with peak discharges estimated by HEC-HMS based on SENAMHI IDF curves.
Several statistical indicators were used to assess the accuracy and consistency of the hydrological models applied in the Lacramarca River basin. These validation metrics include Nash–Sutcliffe efficiency (NSE) and the coefficient of determination (R2), which made measuring the degree of agreement between simulated and observed values possible. The NSE [38] ranges from −∞ to 1, where values close to 1 represent better model performance, whereas values near 0 or negative reflect low predictive capability (Equation (1)). Similarly, the R2 coefficient [39] varies from 0 to 1, where values approaching 1 reflect a high level of correlation (Equation (2)).
where and denote the simulated and observed discharges (m3/s) respectively.
The magnitude of the absolute differences between simulated and observed values was evaluated using the Mean Absolute Error (MAE) and the Root Mean Square Error (RMSE) [40] were a value equal to 0 indicates a perfect agreement (Equations (3) and (4)). Additionally, the Percent Bias (PBIAS) was used to express the difference in percentage terms [41], indicating whether the model estimates are above or below the observations (Equation (5)).
For a dataset of model predictions in which each predicted value is associated with an observed value .
where PBIAS quantifies the percentage deviation between simulated and observed data .
As part of the model calibration and validation procedures, precipitation and hydrometric data were obtained from the database of the National Water Authority (ANA), considering records from the Quitarasca hydrometric station located in the neighboring Santa River basin, which were used for model calibration based on annual hydrometric records [42]. Table 1 presents the statistical metrics used to evaluate the performance of the hydrological model.
Table 1.
Statistical indicators applied to evaluate the reliability of the hydrological models.
It should be noted that, in addition to historical precipitation data, the projection to 2050 was also analyzed. This projection incorporated information compiled and validated within SENAMHI’s IDF Curve Estimation Module, which has undergone a calibration process using data from 442 conventional meteorological stations and 286 automatic stations distributed nationwide.
2.4. Estimation of Peak Discharges for Flow Simulation in the Lacramarca River
To estimate peak discharges in the Lacramarca River and simulate flow dynamics, the model required input data derived from maximum precipitation analysis within the basin, which is essential for defining the peak rainfall intensities used in the simulation. In addition, physical basin characteristics were incorporated, including topography, basin area, basin perimeter, channel length, and time of concentration, as well as infiltration-related variables, primarily the Curve Number (CN).
Topographic data were derived from the ASTER GDEM v3 satellite product and processed to a spatial resolution of 10 m. The study reach was discretized into 51 cross-sections spaced at 100 m intervals. Elevation points for each cross-section were digitally extracted from the terrain surface using the RiverGIS extension in QGIS, ensuring sufficient point density for accurate morphological representation of the river channel.
During the discharge modeling process in HEC-HMS, it was necessary to define the loss method. Accordingly, the Soil Conservation Service Curve Number (SCS-CN) method was selected, which requires input parameters including initial abstraction (mm), Curve Number (CN), and the percentage of impervious surface within the basin [36]. The basic equation used to estimate direct runoff in basins [43] is given by Equation (6).
where Q is direct runoff (mm), P is total precipitation (mm), S is potential soil water storage capacity (mm), and Ia is initial abstraction (mm).
Soil water storage capacity was calculated using Equation (7):
Initial abstraction was defined using Equation (8):
To proceed with the simulation stage, the CN value was established based on basin land-use characteristics, soil type, infiltration capacity, and vegetation cover. Considering the relatively homogeneous land-use characteristics of the coastal basin, a CN value of 78 was obtained, reflecting a predominance of cultivated land under conservation treatment and hydrologic soil group C. This group is typically associated with clay loams, shallow sandy loams, soils with low organic content, and soils with high clay content [36].
The time of concentration (tc) is a key parameter representing the time required for rainfall to contribute to runoff at the basin outlet. It was estimated using the Kirpich formula [44], yielding a tc value of 180 min (3 h). Once all input data were defined, the calculation of design peak discharges was carried out using the HEC-HMS software for return periods of 50, 100, and 140 years, primarily associated with extreme events such as ENSO.
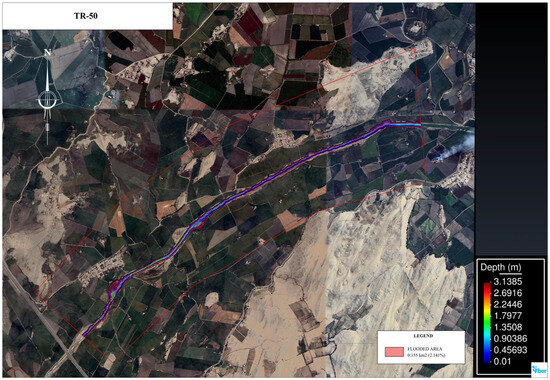
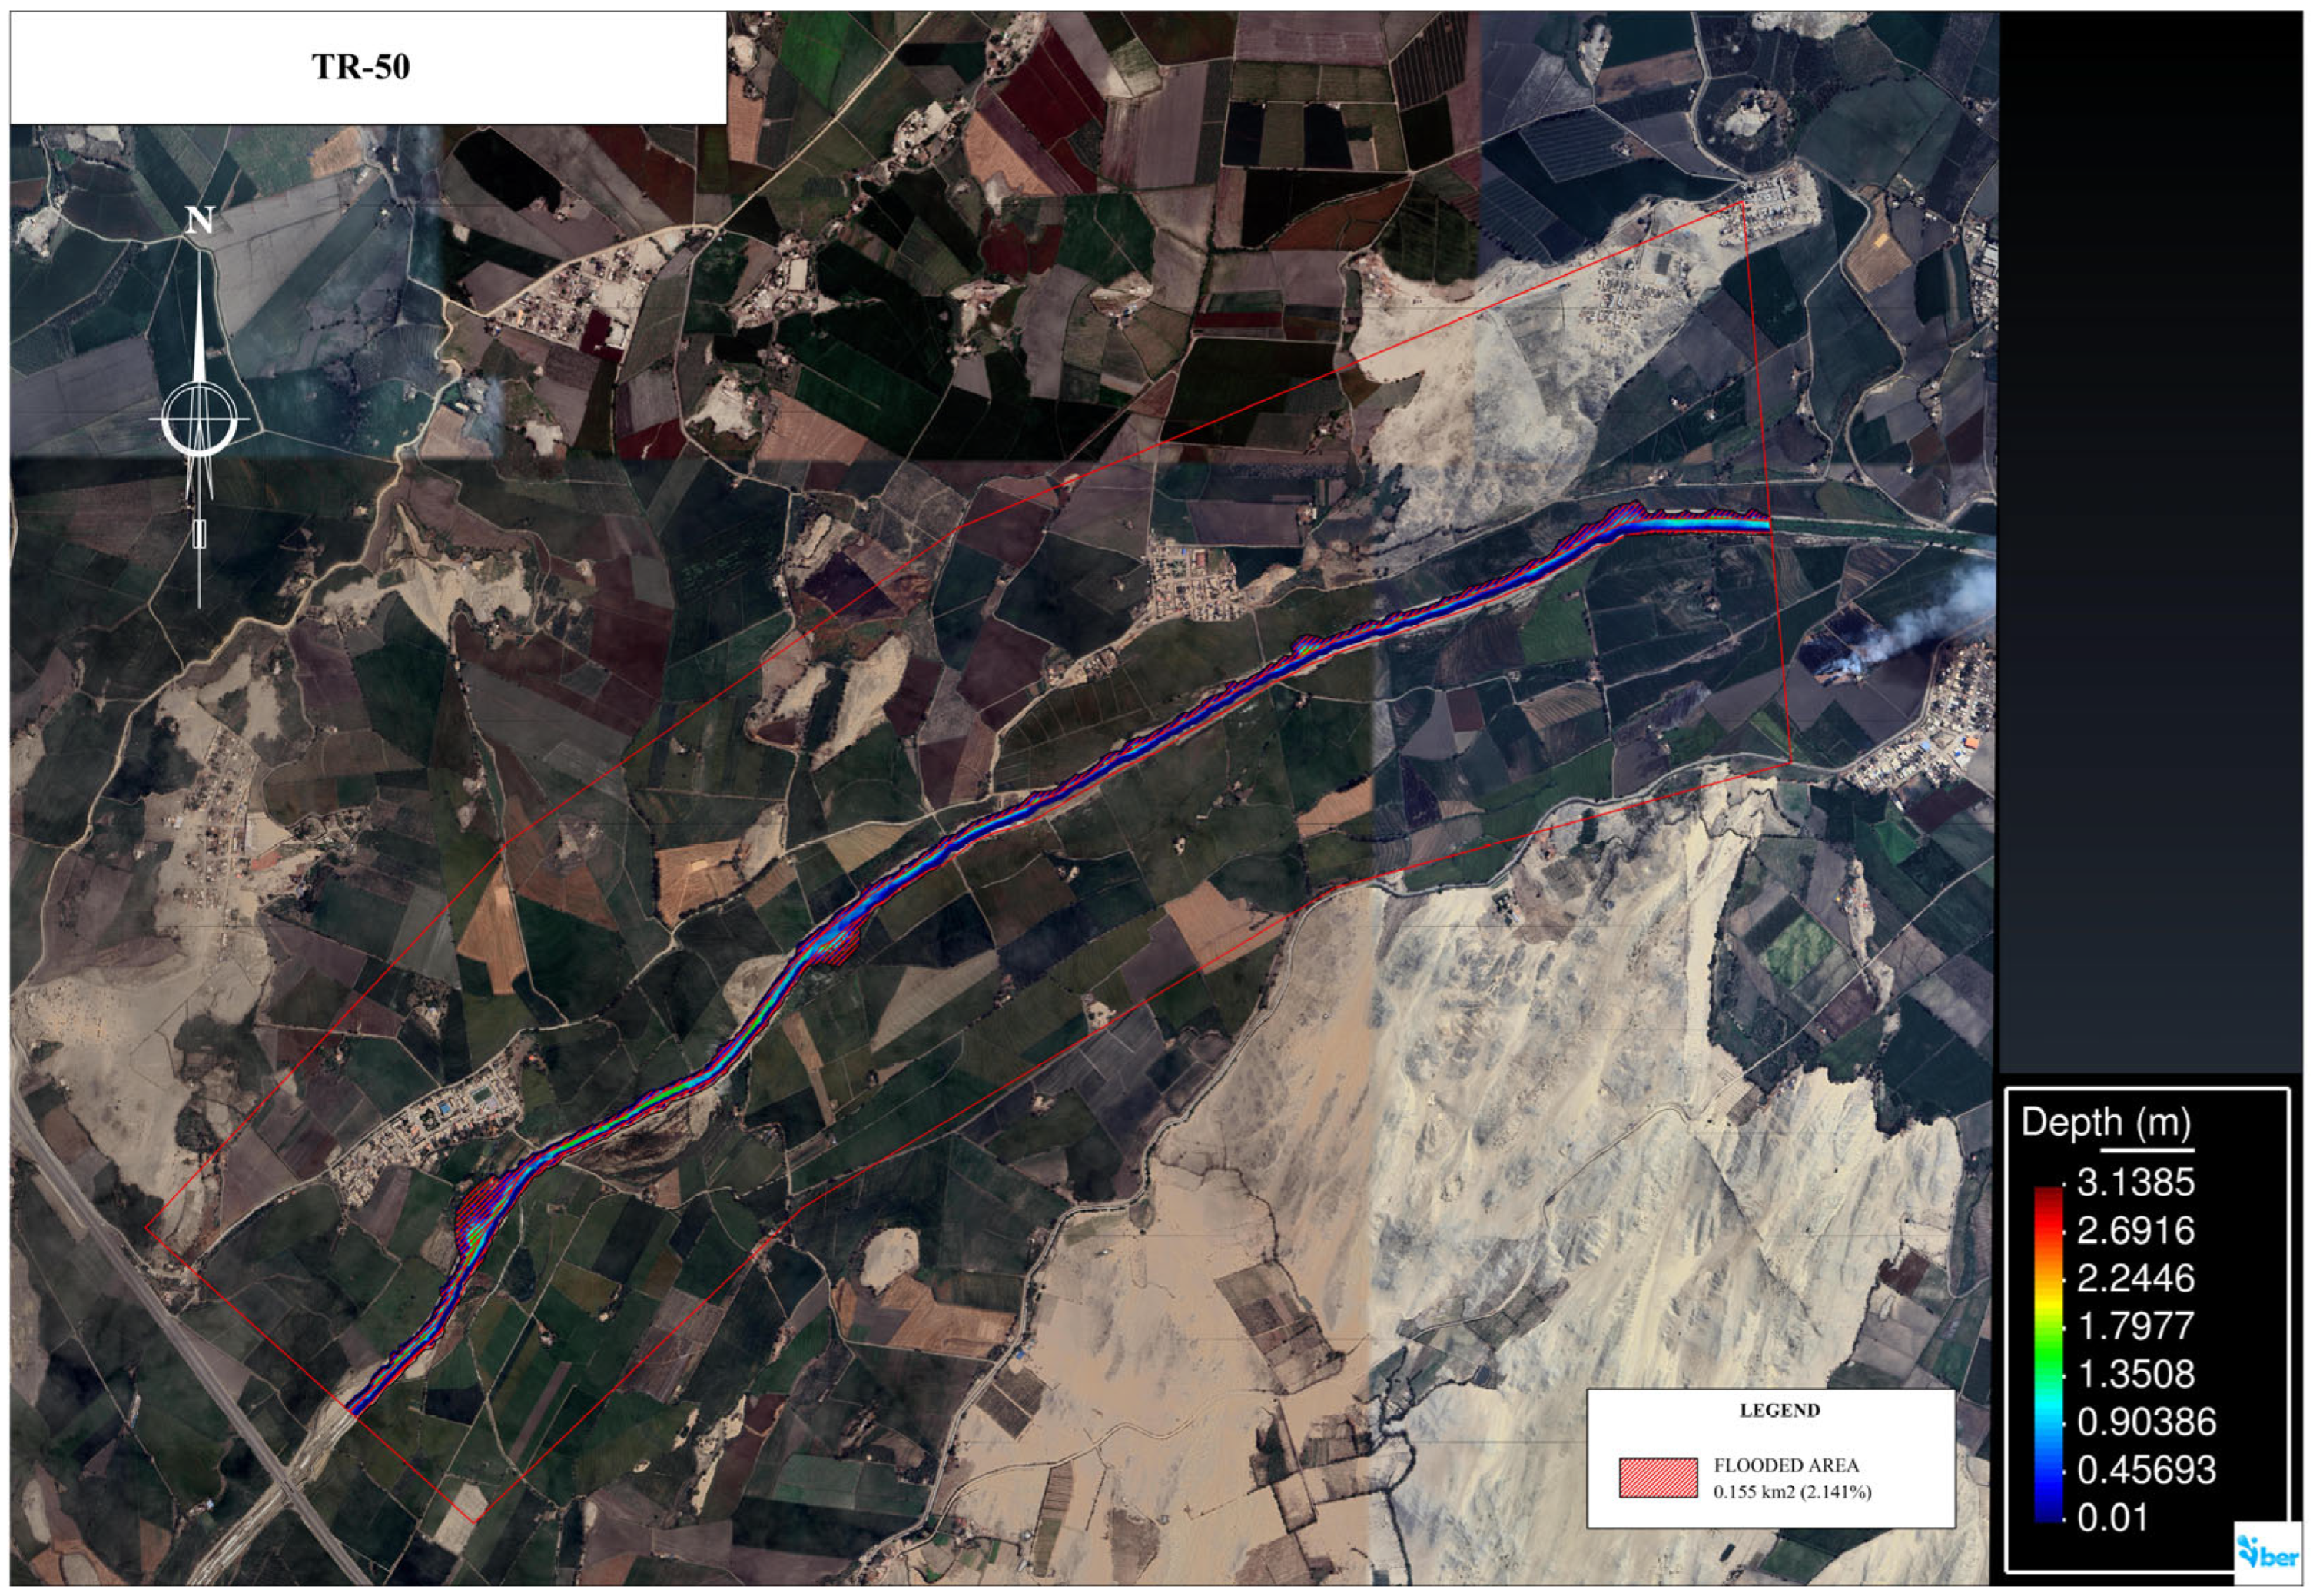
Using the defined area of influence and the calibrated design peak discharges generated by HEC-HMS for different return periods, the simulation of extreme flow events was carried out using the IBER and HEC-RAS models, transferring topographic and discharge data into both software environments (Figure 8). As a result, the most vulnerable zones and the spatial extent of flood-prone areas (km2) within the study area were identified, along with critical points.
Figure 8.
Flow simulation in the Lacramarca River basin using the IBER model for a 50-year return period.
Based on the identified critical points, two sections in the Lacramarca River were selected for detailed analysis of hydraulic behavior. This analysis aimed to evaluate the water levels reached by peak discharges under projected scenarios involving extreme flows associated with phenomena such as ENSO, for different return periods. These sections are located in the lower basin at Santa Clemencia and Pampadura, at coordinates 8°59′51.659″ S and 78°32′08.458″ W.
Hydraulic parameterization was based on spatial analysis of land cover and surrounding surface layers, allowing the assignment of a Manning roughness coefficient of 0.025 for the main channel and 0.18 for the floodplains. The latter value reflects the hydraulic influence of dense vegetation and agricultural crops along the riverbanks. This configuration was applied to river geometry modeled with cross-sections spaced every 100 m. For steady-flow simulations, critical depth boundary conditions were defined both upstream and downstream, using peak discharges derived from the median 2050 climate projection scenario.
Once the simulation of hydraulic behavior in the basin was initiated using the HEC-RAS and IBER software, water-level results associated with the estimated peak discharges at the critical sections were obtained. These values enabled a comparative analysis between the water levels produced by projected peak flows for return periods of 100 and 140 years and the dimensions of a specific section of the Lacramarca River near Santa Clemencia, where a riverbank protection structure is currently under construction. This structure was designed with a height of 2 m along the lateral banks and a variable cross-sectional width ranging from 28 to 30 m, thereby allowing a comparative evaluation of the simulated water levels relative to the limits of the riverbank protection structure.
As described above, hydrological and hydraulic modeling of the Lacramarca River basin enabled the identification of areas with the highest vulnerability to flooding. Data generated using QGIS Desktop 3.40.7 and IBER version 3.3.1 software, and subsequently exported to AutoCAD 2023, facilitated visualization and quantification of flood extent, magnitude, and percentage of inundated area (km2) relative to the total basin area and the specific study area between Santa Clemencia and Pampadura, considering the specified return periods. This procedure significantly enhanced result interpretation and supported a clearer and more effective presentation of the findings.
3. Results
Based on the methodology applied in this study, the main results derived from the hydrological and hydraulic analyses are presented in the following section.
3.1. Evaluation of the Hydrological Behavior of the Lacramarca River Using Satellite Data
In accordance with the proposed methodological framework, satellite imagery was generated to illustrate changes in the hydrological behavior of the Lacramarca River before and after the precipitation and runoff associated with the 2017 Coastal El Niño.
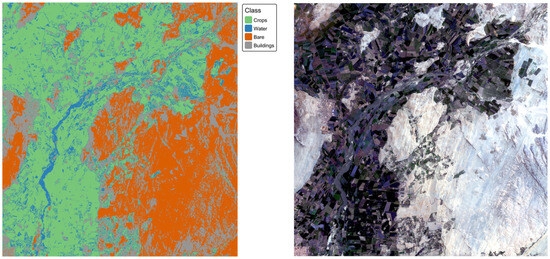
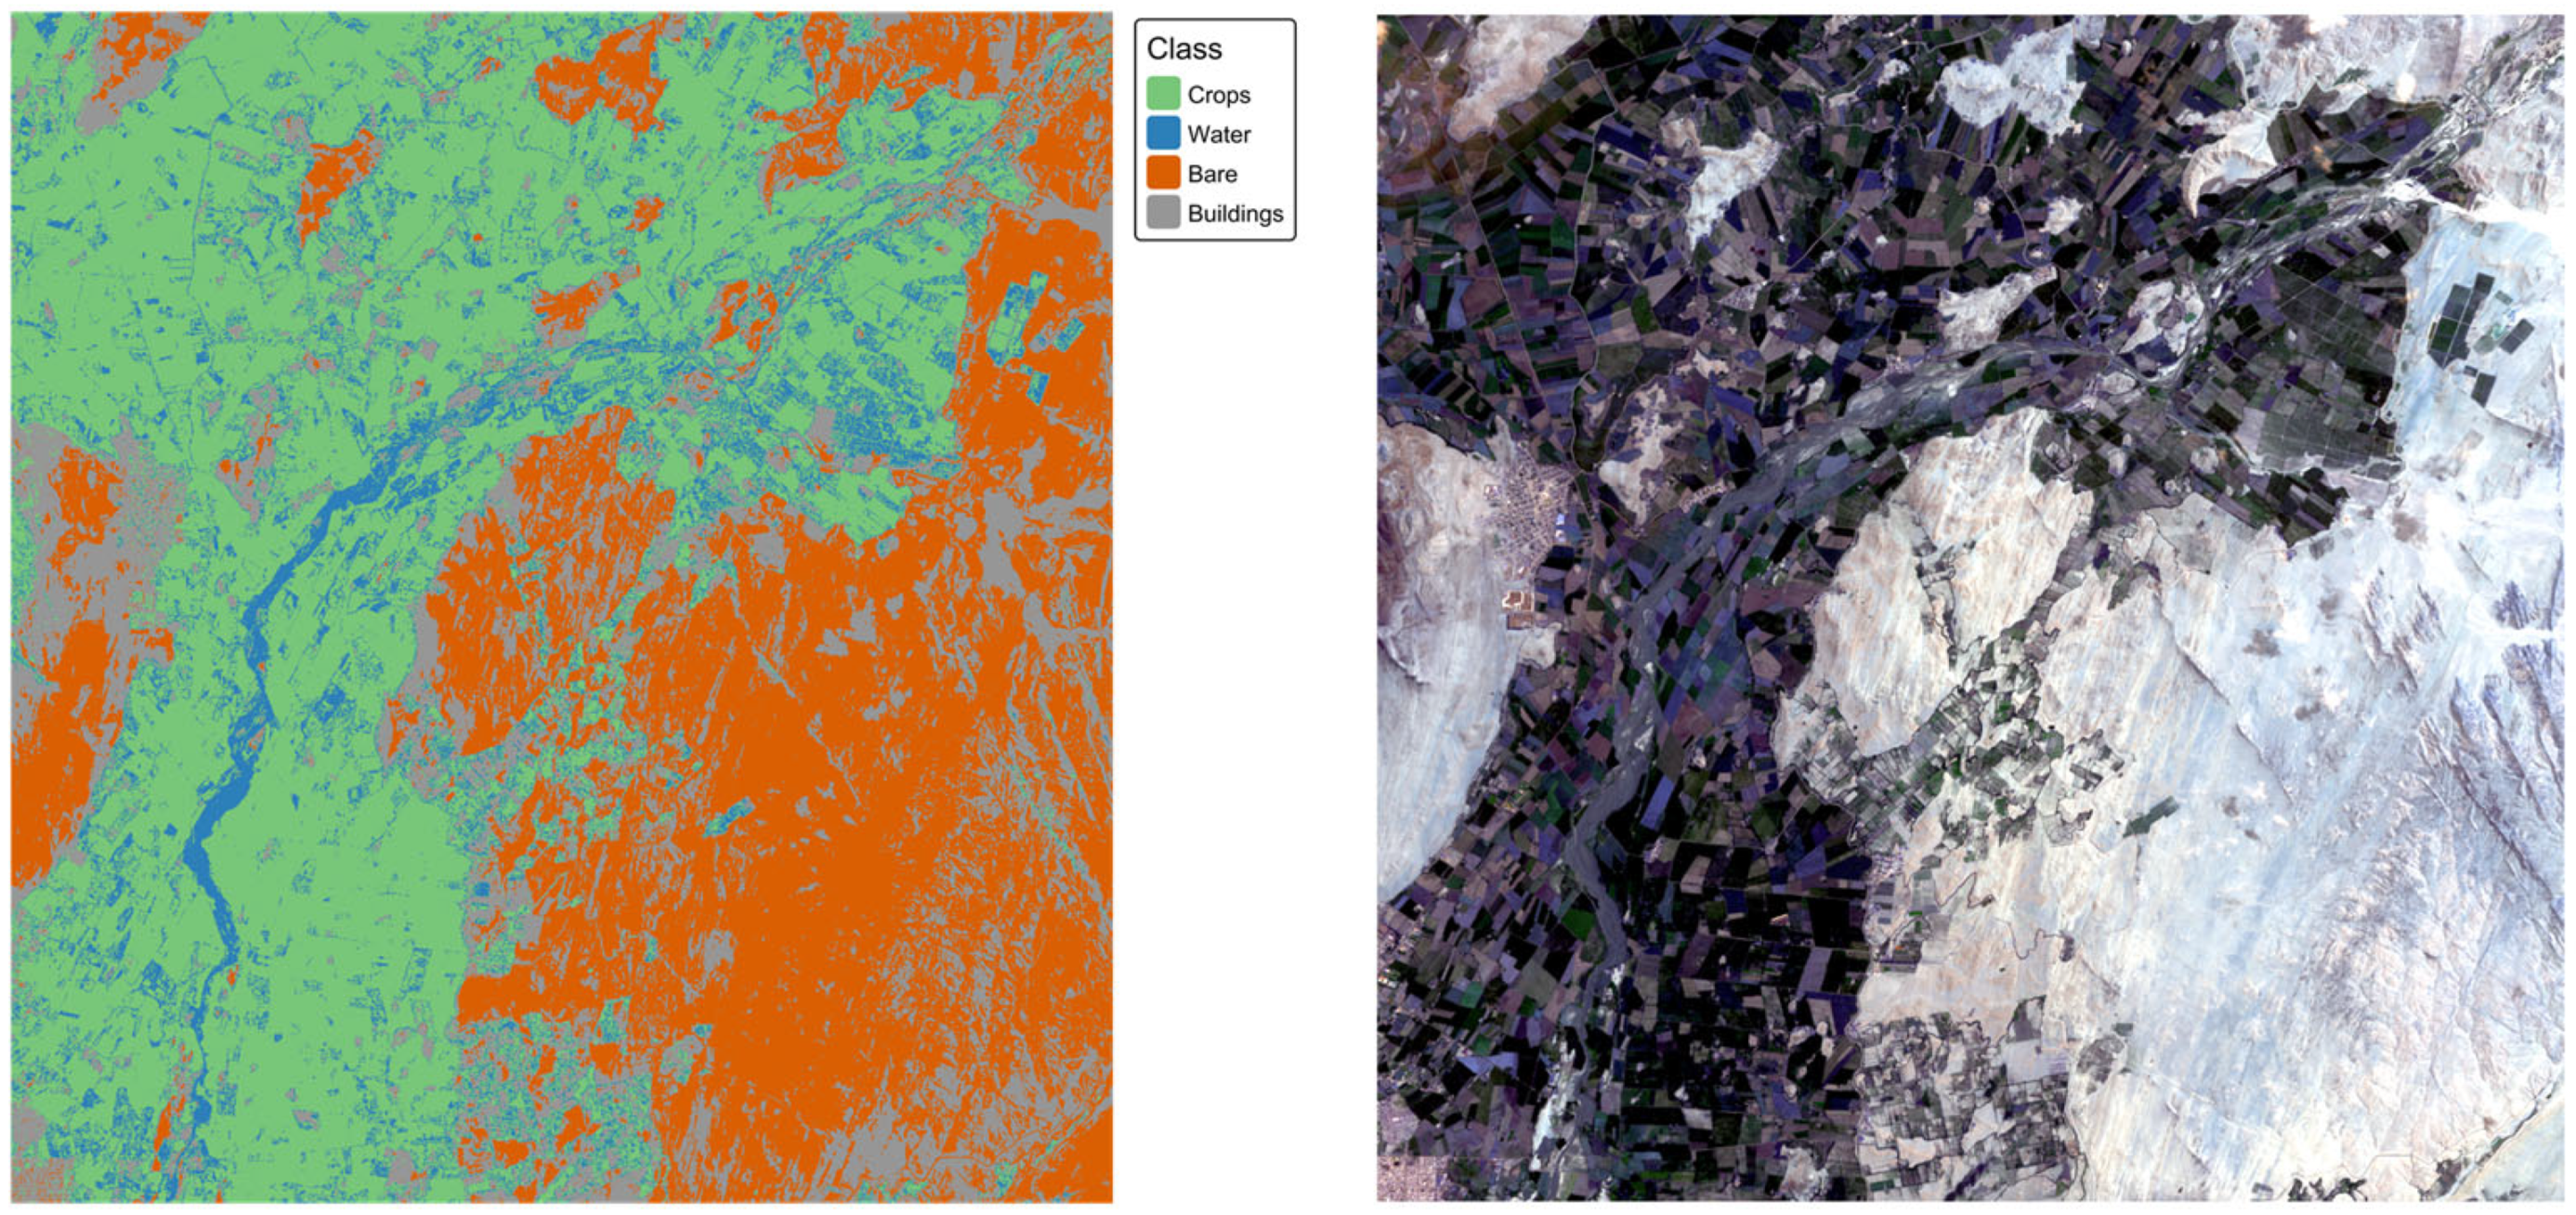
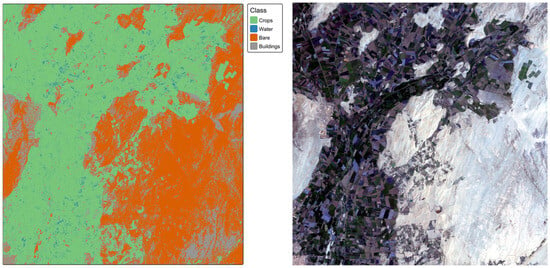
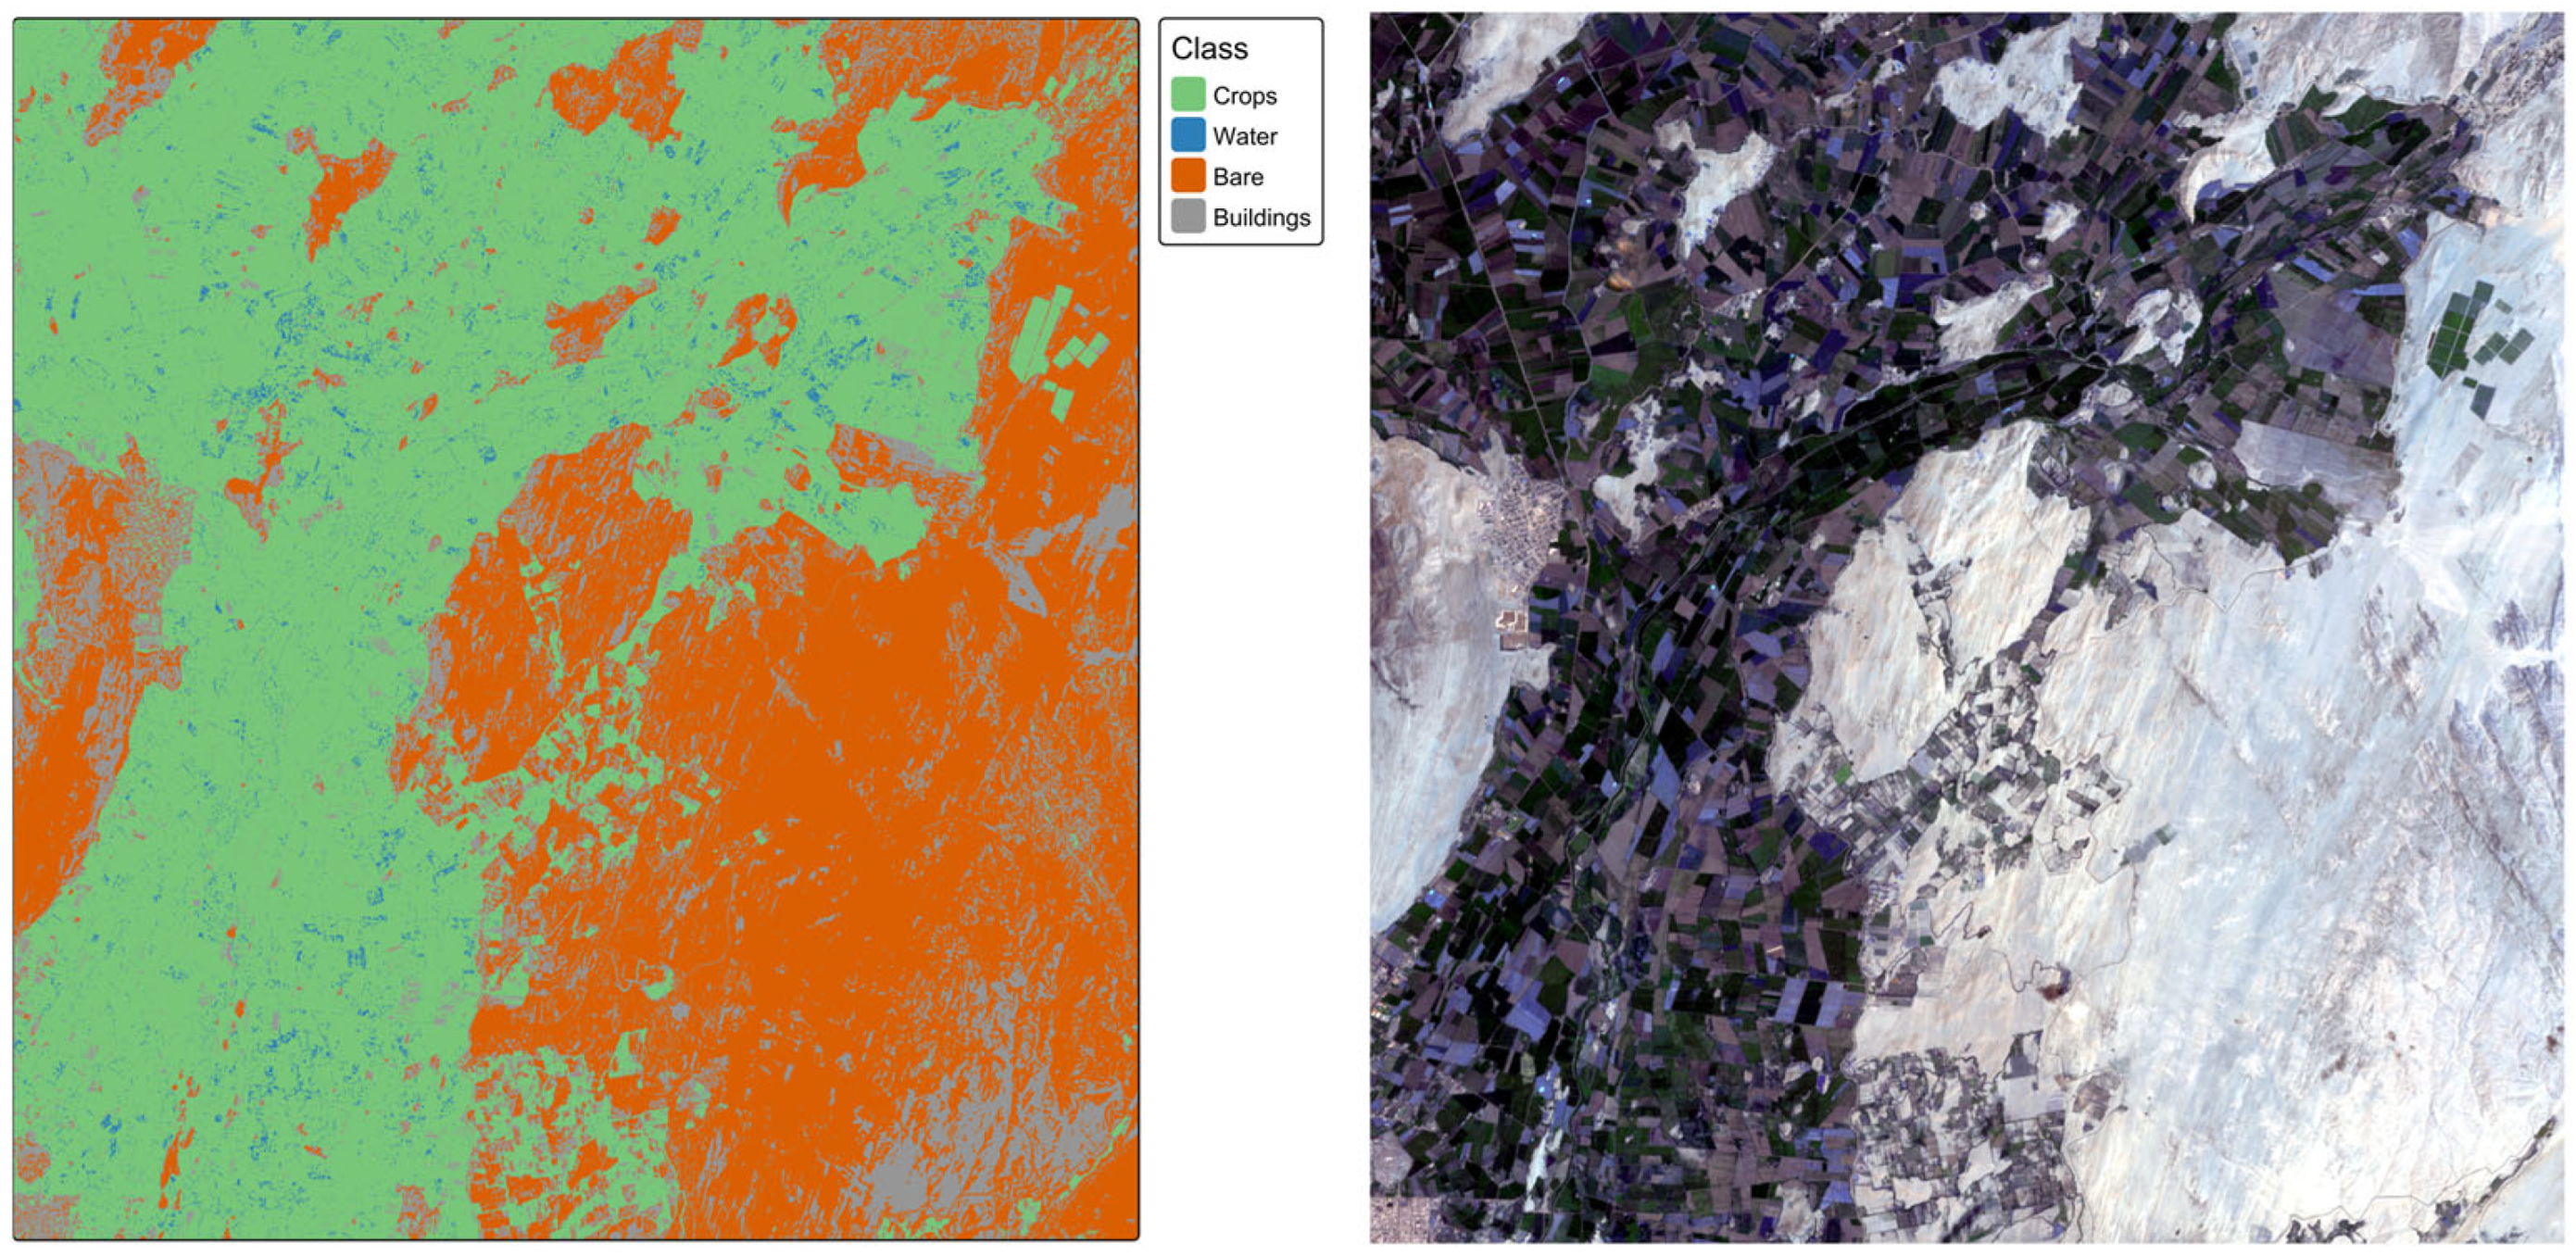
Figure 9 illustrates the natural development of the river channel under normal conditions, whereas Figure 10 shows the changes in runoff generated by extraordinary precipitation associated with the extreme events of 2017.
Figure 9.
Satellite images showing land surface conditions of the study area prior to the 2017 Coastal El Niño event.
Figure 10.
Satellite images showing land surface conditions of the study area after the 2017 Coastal El Niño event.
The Random Forest classifier achieved high Overall Accuracy (OA) for both temporal periods. For the before period (15 December 2016–15 January 2017), the model achieved a training accuracy of 96.3% (κ = 0.92) and a test accuracy of 75.9% (κ = 0.59). The after period (15 March–15 April 2017) showed improved performance, with a training accuracy of 97.0% (κ = 0.95) and a test accuracy of 77.6% (κ = 0.68).
Per-class performance analysis revealed that the Crops class exhibited the highest sensitivity in both periods (93.3% before, 89.5% after), while the Water class showed a substantial improvement between periods (30.0% to 81.0% sensitivity). Buildings demonstrated moderate detection rates (28.6% before, 42.9% after), mainly due to spectral similarity with Bare Soil and a limited number of training samples (12% of total samples). Bare Soil maintained high specificity (97.9% before, 100% after) with excellent discrimination from vegetated classes.
Variable importance analysis showed distinct seasonal patterns in feature contribution. In the before period, original spectral bands dominated (B2, B3, and B4 contributing a total importance of 32.2), followed by NDVI and MNDWI indices. However, in the after period, spectral indices became the most important predictors (NDVI = 16.8, NDWI = 14.1, B8 NIR = 12.5), indicating enhanced vegetation and water discrimination during the later growing season.
The land cover classification for the before period revealed the following distribution across the 19,946-hectare study area: Crops dominated with 9851.32 ha (49.4%), followed by Bare Soil with 7543.99 ha (37.8%), Buildings with 2100.17 ha (10.5%), and Water with 450.45 ha (2.3%).
During the after period, the distribution shifted to: Crops 9997.47 ha (50.1%), Bare Soil 7475.67 ha (37.5%), Buildings 2041.22 ha (10.2%), and Water 431.56 ha (2.2%).
3.2. Estimation of Design Peak Discharges
For the estimation of peak discharges in the Lacramarca River, return periods (T) of 50, 100, and 140 years were considered using the HEC-HMS version 4.12 model. The analysis incorporated data from the study area and estimated precipitation data for the reference points.
The results presented in Table 2 show the estimated design peak discharges obtained through hydrological simulation for return periods ranging from 50 to 140 years. For a return period of T = 100 years, the estimated peak discharge under the historical scenario is 125.4 m3/s, whereas under the 2050 projection scenario it is 319.6 m3/s. Similarly, for T = 140 years, the design peak discharge for the historical scenario is 210 m3/s, while under the 2050 projection scenario, it reaches 460 m3/s.
Table 2.
Estimated peak discharges using the HEC-HMS model.
3.3. Hydraulic Flow Simulation Using IBER and HEC-RAS
Hydraulic simulation is a process that enables the identification of areas with greater vulnerability to peak discharges and the projection of potential flooding along the banks of the Lacramarca River within the study area. These results constitute a useful technical resource for land-use planning and for the adoption of preventive measures aimed at protecting vulnerable areas, in alignment with Sustainable Development Goal 13 (SDG 13).
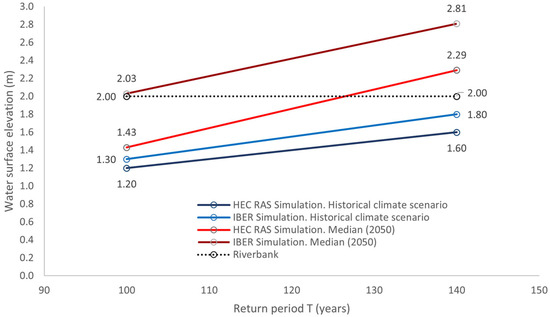
The hydraulic simulation conducted using historical data and 2050 projections with the HEC-RAS and IBER software enabled the determination of the water levels reached by peak discharges. The results show that, for a return period of 100 years, water levels remain at or below the height of the Lacramarca River bank structure at the first critical point located in the Santa Clemencia area. For T = 140 years, water levels estimated using data from the historical scenario remain below the riverbank structure level; however, simulations incorporating information from the 2050 median projection indicate that the estimated water level exceeds the riverbank protection structure, suggesting the occurrence of flooding in areas adjacent to the river, affecting both rural and urban areas within the study area (Figure 11).
Figure 11.
Simulated water levels (m) obtained using HEC-RAS and IBER compared with the design elevation of the Lacramarca River bank for 100- and 140-year return periods in the Santa Clemencia sector under historical and 2050 projection scenarios.
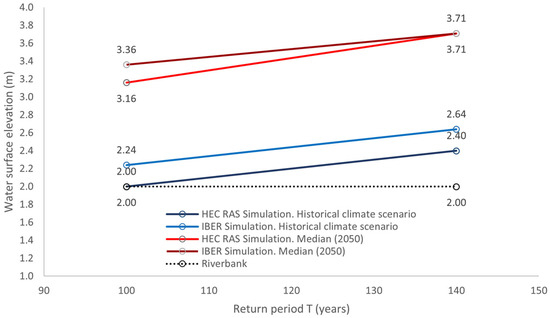
Similarly, flow modeling indicates that the water level reached by peak discharges at the second critical point located in the Pampadura area coincides with the height limit of the riverbank, according to results generated by the HEC-RAS model for a return period of 100 years, whereas IBER records a slightly higher water level, indicating riverbank overtopping for the same return period. Regarding the estimation of water levels for return periods of 100 and 140 years, the simulation shows that the discharge will overtop the riverbank protection structure, resulting in flooding of agricultural areas, primarily affecting rice production (Figure 12).
Figure 12.
Simulated water levels (m) obtained using HEC-RAS and IBER compared with the design elevation of the Lacramarca River bank for 100- and 140-year return periods in the Pampadura area, considering historical and 2050 projection scenarios.
3.4. Flood-Prone Areas Identified Through Simulation
Flood-prone areas were identified based on projections generated using the IBER model, with results spatially visualized using QGIS and IBER software, including the delineation of the Lacramarca River flow path.
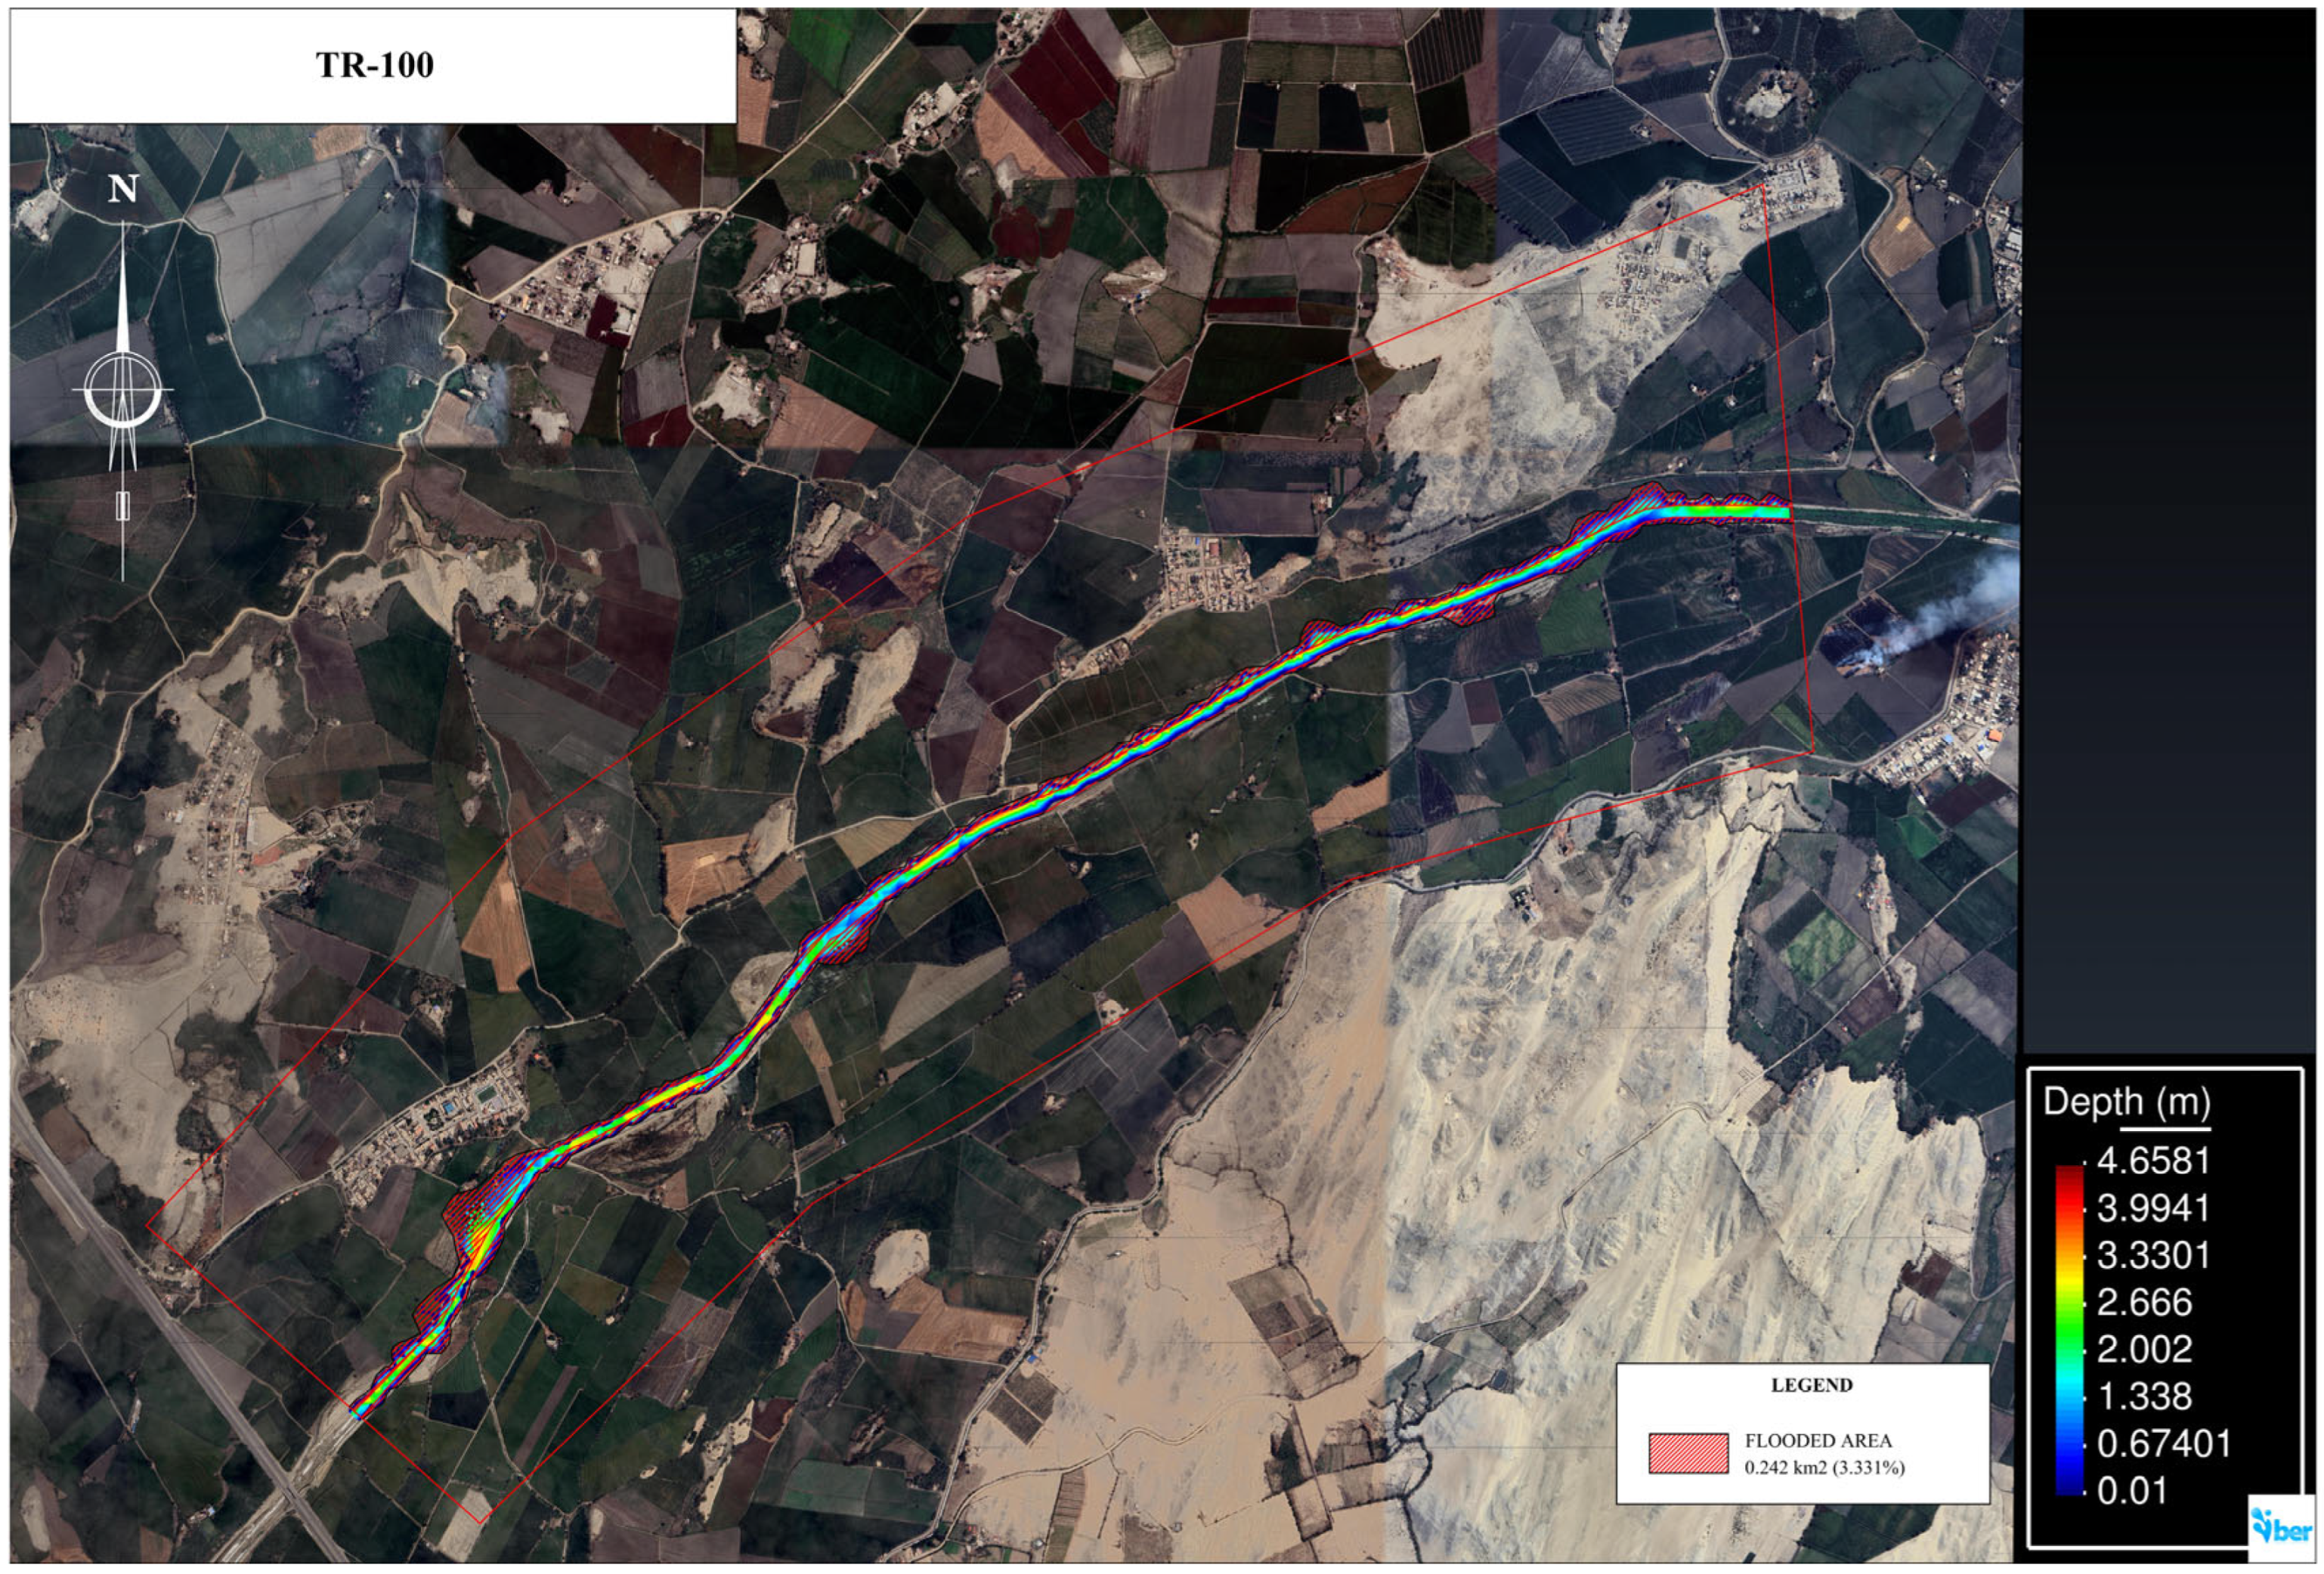
The projection of estimated discharges over the territory, based on hydraulic simulation using historical data and 2050 projections, indicates that for a peak discharge of 125.4 m3/s corresponding to a 100-year return period, a flooded area of 149,000 m2 (0.149 km2) is generated. This corresponds to 2.05% of the surface area within the analyzed area of the Lacramarca River basin under the historical scenario (Figure 13). In contrast, the area evaluated under the 2050 projection indicates a flooded area of 242,000 m2 (0.242 km2), corresponding to 3.331%.
Figure 13.
Representation of flood-prone areas resulting from peak discharges in the Lacramarca River, estimated through hydraulic simulation for the 100-year return period.
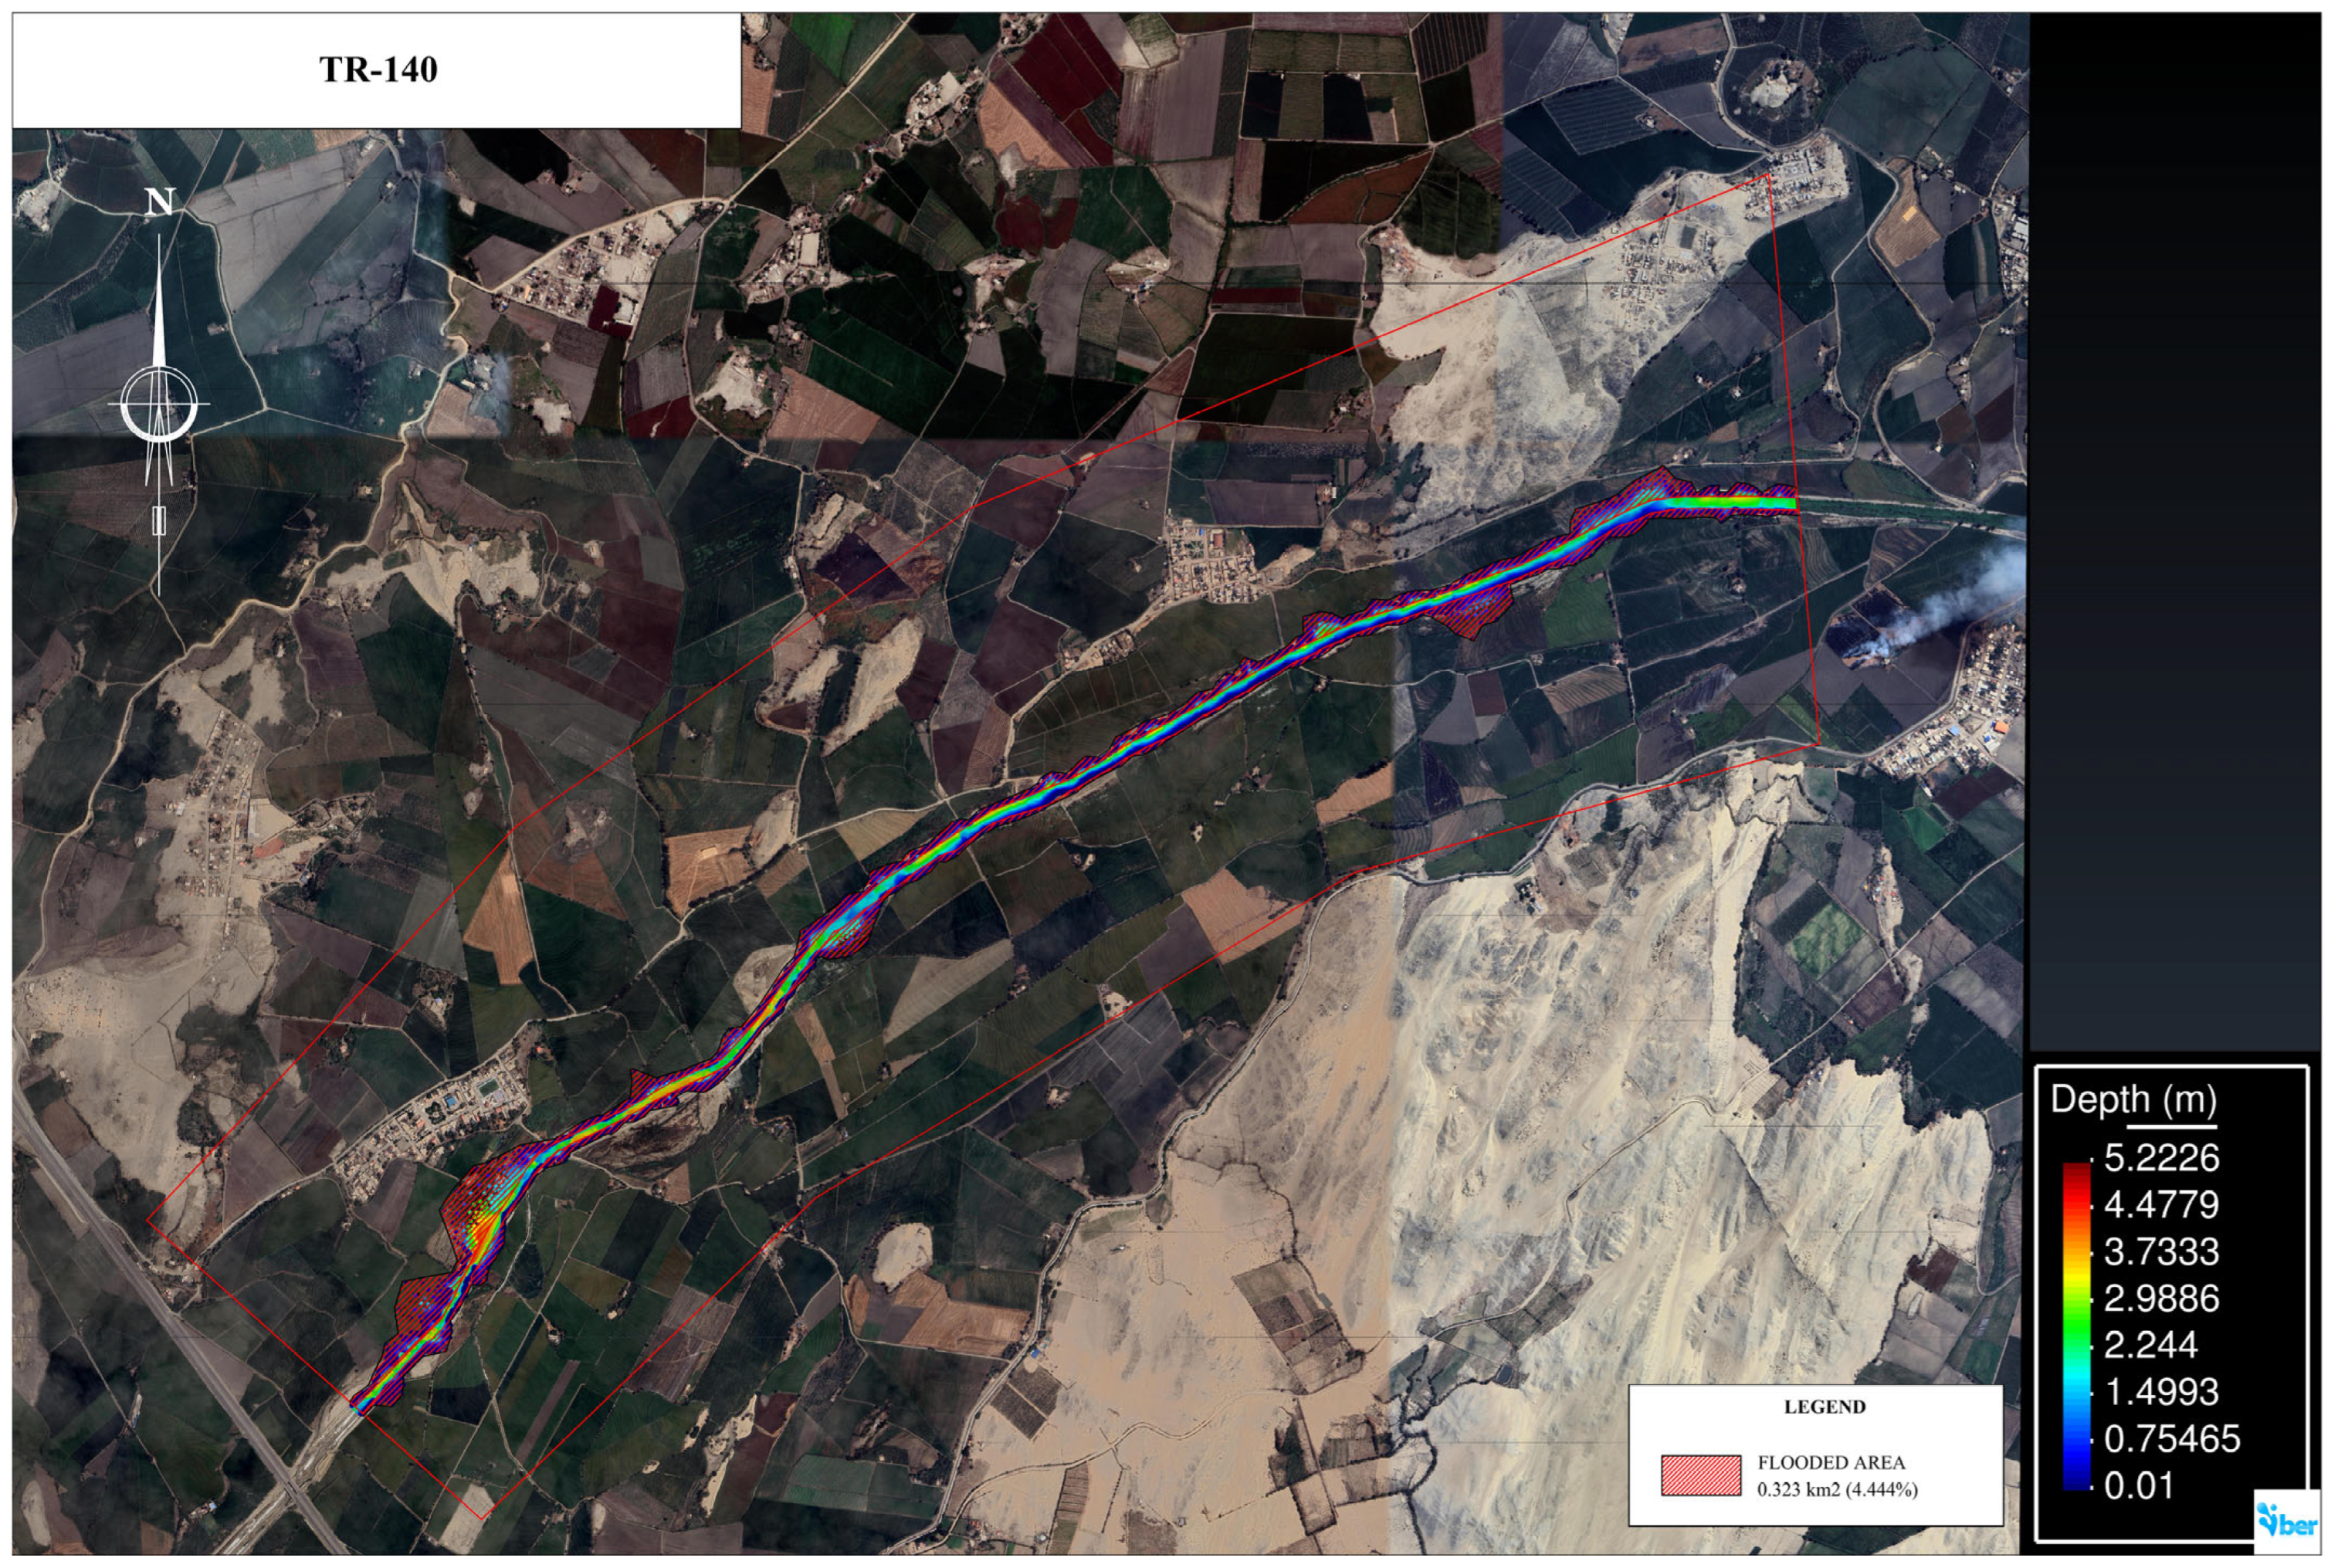
Figure 14 shows that, based on an estimated peak discharge of 210 m3/s and a return period of 140 years, the projected flood-prone area is 172,000 m2 (0.172 km2), representing 2.38% of the study surface area of the Lacramarca River basin based on historical data. In contrast, using data projected to 2050, the resulting flood-prone area is 323,000 m2 (0.323 km2), corresponding to 4.444%.
Figure 14.
Representation of flood-prone areas resulting from peak discharges in the Lacramarca River, estimated through hydraulic simulation for the 140-year return period.
These results indicate that the variation in flood-prone areas, when comparing the two evaluated scenarios, shows increases of 62.42% and 87.79%, respectively, values that exceed the flood-prone area percentages estimated for the 100- and 140-year return periods, respectively.
Specifically, Table 3 summarizes the information generated through the hydraulic modeling process using the IBER software, related to flood-prone areas within the study area, located between the populated centers of Santa Clemencia and Pampadura.
Table 3.
Flood-prone areas (m2) and percentage (%) relative to the total basin area.
4. Discussion of Results
The findings of this research contribute to understanding the hydrological and hydraulic behavior of the Lacramarca River basin under different climate scenarios. In addition, the analysis demonstrates that climate variability and extreme events such as ENSO in Peru significantly influence peak discharges and the expansion of flood-prone areas. The modeling tools implemented through HEC-RAS, HEC-HMS, and IBER enabled the assessment of the relationship between the rainfall intensity, runoff formation, and the spatial spread of flood risk areas.
Among the most significant results of this study is the estimation of the peak discharges associated with different return periods using the HEC-HMS system. Peak discharges of the Lacramarca River were estimated for return periods ranging from 50–140 years, with particular focus on the 100- and 140-year return periods [36]. Based on historical data, peak discharge values of 125.4 and 210 m3/s were obtained, respectively. In contrast, under the 2050 projection scenario, these values increase substantially to 319.6 m3/s and 460 m3/s.
The interpretation of these results reveals that the hydrological behavior of the Lacramarca River basin is highly sensitive to intense precipitation scenarios. The increase in the estimated values suggests that modifications in precipitation patterns amplify surface runoff processes, thereby increasing the likelihood of flooding within the basin. This response is associated with the basin’s morphological characteristics, including its mountainous topography, an average slope of approximately 9%, soils with limited infiltration capacity, and the predominance of agricultural land use in the lower basin. This type of hydrological pattern has also been observed in other Andean coastal basins, where intense precipitation produces high runoff volume and substantial peak discharges, such as the ENSO impacts on the river discharges along Peruvian territory registered mainly on the Pacific coast [45].
The successful application of this methodology in previous hydrological studies supports the reliability of the modeling results presented in this research. Similar studies on the peak discharge for flood dynamics using the same modeling tools have been conducted in the Filyos River basin in the Black Sea region, where peak discharge shows an increase of nearly 200% between the 2-year and 100-year return periods [46]. Likewise, studies developed for the construction of a hydrological model in the Fuerte River basin (Mexico), associated with extreme rainfall events in 2009, 2011, 2015, 2016, and 2017, also used the HEC-HMS software for discharge modeling, predicting values that indicate a strong agreement between simulated and observed discharge values at the study stations [47].
The hydraulic simulation conducted for the Lacramarca River based on historical scenarios and the 2050 projection scenario using the IBER software indicated that at the control point located in Santa Clemencia, water levels ranging from 1.3 to 2.03 m were obtained for a 100-year return period. Meanwhile, water-level estimates derived from HEC-RAS recorded projected values between 1.20 and 1.43 m for the same analysis period. For the return period of T = 140 years, based on historical scenario data, the Santa Clemencia area showed an estimated water level of 1.6 m using HEC-RAS, while IBER yielded a water level of 1.8 m. Moreover, water-level estimates based on data projected to 2050, obtained from simulations using HEC-RAS and IBER, exceeded the riverbank protection height, reaching 2.29 m and 2.81 m, respectively.
Regarding the analysis point located in the Pampadura area, hydraulic modeling for T = 100 years estimated water levels of 2.24 m and 3.36 m using IBER under historical and 2050 projection scenarios, respectively. Meanwhile, HEC-RAS provided water-level values of 2.0 m and 3.16 m using the same data sources. For a return period of 140 years, these software packages estimated flow depths of 2.64 m and 3.71 m through IBER simulations, and 2.4 m and 3.71 m using HEC-RAS, based on projected discharges.
Numerous studies on river basin analysis conducted worldwide support the validity of the hydraulic modeling tools applied to this research, which were used to estimate water levels and flood-prone areas. For example, studies conducted in the Göksu River basin (Turkey) for the development of flood hazard and risk maps demonstrate the applicability of the HEC-RAS model for simulating hydraulic behavior and estimating water levels for return periods ranging from 25 to 500 years [48]. Similarly, for flood assessment in the Wadi Deffa channel, which crosses the city of El Bayadh in southwestern Algeria, using HEC-RAS and IBER produced comparable results for maximum water depths for return periods of 50, 100, and 1000 years [49].
The hydraulic simulation process enabled the projection of flood-prone areas within the study area located between the populated centers of Santa Clemencia and Pampadura, determining areas of 149,000 and 172,000 m2 for return periods of 100 and 140 years, respectively, when considering historical information. Meanwhile, data from the 2050 projection scenario show flood-prone areas of 242,000 and 323,000 m2.
In addition, a study conducted in the Krishna River basin (India) used a high-resolution Digital Elevation Model (DEM) integrated into the HEC-RAS 2D model to simulate flood inundations, demonstrating that the affected area encompassed a wide variety of land uses [50]. The previously cited study on the Wadi Deffa channel reports comparative results of flood-prone areas obtained through hydraulic modeling using HEC-RAS and IBER, identifying vulnerable areas for return periods of 50, 100, and 1000 years [49].
One of the main limitations of this study, is the insufficient number of hydrometeorological monitoring network within the Lacramarca River basin; consequently, the information used for the development of this project was collected from the SENAMHI climate platform and is available through its statistical database, relying primarily on Intensity–Duration–Frequency (IDF) rainfall curves under historical and 2050 projected climate scenarios. However, the reliability of the hydrological modeling was verified through a calibration process using discharge data from a hydrometric station located in the neighboring basin. The model performance was evaluated using statistical indicators commonly employed in hydrological model validation (NSE, R2, MEAN, RMSE, and PBIAS). The results obtained in this process confirm the reliability of the modeling framework approach adopted.
Although limitations in data availability were identified, the use of validated data in the modeling process enabled the assessment of flood risk and vulnerability in the sector located between the Santa Clemencia community and the Pampadura settlement. In this area, the flow depths associated with the estimated peak discharges exceed the design limits of the existing riverbank protection structures currently under construction. The findings suggest that during extreme precipitation events, communities settled near the riverbanks, and the agricultural areas in the region could be significantly affected.
Research projects of this nature that emphasize the evaluation of flood-risk areas primarily due to climate change effects are of significant importance for the design of early warning systems for flood forecasting as a disaster-prevention measure. Additionally, they contribute to the establishment of a solid information base for the construction of protection structures in an area that has experienced the effects of ENSO events in 1982–1983 and 1997–1998, the 2017 Coastal El Niño event, as well as Cyclone Yaku in 2023, demonstrating that existing structures lacked the capacity to withstand the force of water, leading to the collapse of riverbank protection structures.
5. Conclusions
Flood assessment is a systematic evaluation process that has gained relevance due to the significant impacts on human settlements, infrastructure, and agricultural land within the Lacramarca River basin, particularly in areas near the populated centers of Santa Clemencia and Pampadura. These impacts have implications for socioeconomic dynamics and the environmental sphere, driven by increases in the frequency and magnitude of precipitation associated with natural phenomena and climate variability. Flood assessment also serves as a tool for anticipating vulnerability scenarios and supporting decision-making in the design of risk-management strategies.
This research demonstrates the importance of integrating hydrological and hydraulic modeling as a technical resource for the analysis and prediction of flood events. The application of validated and widely used models such as HEC-HMS, HEC-RAS, and IBER made it possible to evaluate flow dynamics in the Lacramarca River basin through the estimation of peak discharges, the determination of water levels during extreme meteorological events, and the spatial projection of flood-prone areas. The integration of these tools is indispensable for the development of risk-mitigation measures and sustainable territorial planning.
The hydraulic simulation conducted using HEC-RAS and IBER demonstrated that water levels generated by the estimated peak discharges generally remain below the height limit of the Lacramarca River bank protection structure in the Santa Clemencia area when considering historical data for return periods of 100 and 140 years.
Only water-level projections based on the median climate scenarios projected to 2050 exceed the riverbank height for T = 140 years. In the Pampadura area, estimates based on a historical scenario for return periods of 100 and 140 years indicate flood-prone areas representing 2.05% and 2.38% of the study area, respectively. In contrast, using median projections to 2050, these areas increase to 3.331% and 4.444%, respectively. These modeling results indicate that the riverbank protection infrastructure currently under construction may be insufficient to contain flows under extreme future scenarios.
The present study considers rainfall–runoff modeling based on maximum precipitation; however, this basin also receives discharges along the river course from the Carlos Leight Canal, part of the Chinecas Special Project. According to the Ministry of Agriculture (MINAG), this input does not represent a significant influence on flood evaluation within the study area and was therefore not considered in this study.
Finally, future investigations could explore additional aspects that may contribute to improving the accuracy of the results obtained in this study and extend the scope of the hydrological analysis, such as incorporating local pluviometric and hydrometric data to improve the calibration and validation of the datasets.
Overall, the findings of this study constitute a valuable contribution to the development of a reference framework for future projects in the region, particularly within the Lacramarca River basin.
Author Contributions
Conceptualization, G.P.C.; methodology G.P.C. and K.K.R.-V.; software, C.C.L.; validation, C.C. and G.P.C.; formal analysis K.K.R.-V., V.M.M.-G. and J.M.B.-C.; investigation G.P.C. and K.K.R.-V.; resources, K.K.R.-V., V.M.M.-G. and J.M.B.-C.; data curation, V.M.M.-G. and J.M.B.-C.; writing—original draft preparation, K.K.R.-V. and G.P.C.; writing—review and editing, K.K.R.-V. and G.P.C.; visualization, C.C., V.M.M.-G. and J.M.B.-C.; supervision, G.P.C.; project administration and G.P.C. and K.K.R.-V. All authors have read and agreed to the published version of the manuscript.
Funding
This research received no external funding.
Data Availability Statement
The maximum precipitation and rainfall records analyzed in this study are publicly available through the SEMANHI database, (https://idesep.senamhi.gob.pe/dhi-idf/ (accessed on 21 March 2026)), and Autoridad Nacional del Agua (ANA) of Peru https://repositorio.ana.gob.pe/bitstream/20.500.12543/3953/1/ANA0002535_1.pdf (accessed on 10 September 2025).
Acknowledgments
The authors would like to express their special thanks to the residents of the towns of Pampadura and Santa Clemencia for their support in gathering initial information, for the assessmento the educational institutions Universidad Continental (Peru) and Universidad Autónoma de Sinaloa (Mexico), whose partnership made the completion of this scientific article possible. Additionally, the authors express their gratitude to Andrea Cerna, Camila Morales, Henry Ramon, and Fabrizio Torres for their contributions to data collection and the development of initial calculations for this project.
Conflicts of Interest
The authors declare no conflicts of interest.
References
- Mbaye, M.L.; Sy, K.; Faty, B.; Sall, S.M. Impact of 1.5 and 2.0 °C Global Warming on the Hydrology of the Faleme River Basin. J. Hydrol. Reg. Stud. 2020, 31, 100719. [Google Scholar] [CrossRef] [Scilit]
- Kundzewicz, Z.W.; Szwed, M.; Pińskwar, I. Climate Variability and Floods—A Global Review. Water 2019, 11, 1399. [Google Scholar] [CrossRef] [Scilit]
- Bernardo, B.; Candeias, C.; Rocha, F. Integration of Electrical Resistivity and Modified DRASTIC Model to Assess Groundwater Vulnerability in the Surrounding Area of Hulene-B Waste Dump, Maputo, Mozambique. Water 2022, 14, 1746. [Google Scholar] [CrossRef] [Scilit]
- Robledo, F.A.; Vera, C.S.; Penalba, O.C. Influence of the Large-Scale Climate Variability on Daily Rainfall Extremes over Argentina. Int. J. Climatol. 2016, 36, 412–423. [Google Scholar] [CrossRef] [Scilit]
- de Lima Moraes, A.G.; Watkins, A.H.; Brecheisen, Z.; Bowling, L.C.; Pinto Cáceres, J.P.; Nov, H.M.; Cherkauer, K.A. The Fast-Changing Climate Reality of Arequipa, Peru. Int. J. Climatol. 2023, 43, 979–995. [Google Scholar] [CrossRef] [Scilit]
- Romero, F.P. El Fenómeno El Niño y sus implicaciones en el Perú. Diálogos Soberanía Clima 2024, 3, 74–85. [Google Scholar]
- Lavado-Casimiro, W.; Espinoza, J.C. Impactos de El Niño y La Niña en las Lluvias del Perú (1965–2007). Rev. Bras. Meteorol. 2014, 29, 171–182. [Google Scholar] [CrossRef] [Scilit]
- INDECI. Compendio Estadístico del INDECI 2017—Gestión Reactiva; Instituto Nacional de Defensa Civil: Lima, Peru, 2017. Available online: https://portal.indeci.gob.pe/wp-content/uploads/2019/01/201802271714541.pdf (accessed on 2 June 2025).
- Lousada, S.; Alves, R.; Fernandes, M.; Gonçalves, L. Hydraulic Planning in Insular Urban Territories: The Case of Madeira Island—Ribeira Brava, Tabua. Water 2023, 15, 2609. [Google Scholar] [CrossRef] [Scilit]
- Dimitriou, E.; Efstratiadis, A.; Zotou, I.; Papadopoulos, A.; Iliopoulou, T.; Sakki, G.-K.; Mazi, K.; Rozos, E.; Koukouvinos, A.; Koussis, A.D.; et al. Post-Analysis of Daniel Extreme Flood Event in Thessaly, Central Greece: Practical Lessons and the Value of State-of-the-Art Water-Monitoring Networks. Water 2024, 16, 980. [Google Scholar] [CrossRef] [Scilit]
- Weiler, M.; Krumm, J.; Haag, I.; Leistert, H.; Schmit, M.; Steinbrich, A.; Hänsler, A. The Pluvial Flood Index (PFI): A New Instrument for Evaluating Flash Flood Hazards and Facilitating Real-Time Warning. EGUsphere 2025, 2025, 1519. [Google Scholar] [CrossRef] [Scilit]
- Liu, Y.; Yuan, X.; Jiao, Y.; Ji, P.; Li, C.; An, X. Ensemble Forecasts of Extreme Flood Events with Weather Forecasts, Land Surface Modeling and Deep Learning. Water 2024, 16, 990. [Google Scholar] [CrossRef] [Scilit]
- Nam, D.H.; Hoa, T.D.; Duong, P.C.; Thuan, D.H.; Mai, D.T. Assessment of Flood Extremes Using Downscaled CMIP5 High-Resolution Ensemble Projections of Near-Term Climate for the Upper Thu Bon Catchment in Vietnam. Water 2019, 11, 634. [Google Scholar] [CrossRef] [Scilit]
- Córdova, M.; Rau, P.; Bourrel, L.; Sosa, J. El Niño Impacts from Large to Local Scale on Peruvian Rivers. In Proceedings of the 40th IAHR World Congress; Habersack, H., Tritthart, M., Waldenberger, L., Eds.; International Association for Hydro-Environment Engineering and Research: Vienna, Austria, 2023; pp. 2927–2936. [Google Scholar] [CrossRef] [Scilit]
- Sardón, H.; Lavado-Casimiro, W.; Felipe, O. Inventario de Datos de Eventos de Inundaciones del Perú; Estudio Final; Servicio Nacional de Meteorología e Hidrología del Perú (SENAMHI): Lima, Peru, 2022. Available online: https://repositorio.senamhi.gob.pe/handle/20.500.12542/1786 (accessed on 12 June 2025).
- Concha Niño de Guzmán, R.F. Evaluación Geológica de las Zonas Afectadas por El Niño Costero 2017 en la Región Ancash; Informe Técnico N.º A6763; Instituto Geológico, Minero y Metalúrgico (INGEMMET): Lima, Peru, 2017. Available online: https://repositorio.ingemmet.gob.pe/handle/20.500.12544/814 (accessed on 10 July 2025).
- Maurya, V.; Gupta, M. Advancements and Challenges in Hydrological Modelling. Int. J. Res. Appl. Sci. Eng. Technol. (IJRASET). 2024, 12, 746–751. [Google Scholar] [CrossRef] [Scilit]
- Savino, M.; Todaro, V.; Maranzoni, A.; D’Oria, M. Combining Hydrological Modeling and Regional Climate Projections to Assess the Climate Change Impact on the Water Resources of Dam Reservoirs. Water 2023, 15, 4243. [Google Scholar] [CrossRef] [Scilit]
- El-Bagoury, H.; Gad, A. Integrated Hydrological Modeling for Watershed Analysis, Flood Prediction, and Mitigation Using Meteorological and Morphometric Data, SCS-CN, HEC-HMS/RAS, and QGIS. Water 2024, 16, 356. [Google Scholar] [CrossRef] [Scilit]
- Keller, A.A.; Garner, K.; Rao, N.; Knipping, E.; Thomas, J. Hydrological Models for Climate-Based Assessments at the Watershed Scale: A Critical Review of Existing Hydrologic and Water Quality Models. Sci. Total Environ. 2023, 867, 161209. [Google Scholar] [CrossRef] [Scilit]
- Torres-Mercado, C.-E.; Villafuerte-Jeremias, J.-A.; Guerreros-Ollero, G.-P.; Pérez-Campomanes, G. Comparison of Flood Scenarios in the Cunas River Under the Influence of Climate Change. Hydrology 2025, 12, 117. [Google Scholar] [CrossRef] [Scilit]
- Perez Campomanes, G.; Quispe Palomino Quispe, J.F.; Choque Flores, L.; Romero Valdez, K.K. Flood Simulation for Different Scenarios Generated by the Influence of Climate Change in the Santa Eulalia Basin, Peru. Civil Eng. Archit. 2025, 13, 3237–3247. [Google Scholar] [CrossRef] [Scilit]
- Harkat, N.; Chaouche, S.; Bencherif, M. Flood Hazard Spatialization Applied to The City of Batna: A Methodological Approach. Eng. Technol. Appl. Sci. Res. 2020, 10, 5748–5758. [Google Scholar] [CrossRef] [Scilit]
- Zainal, N.N.; Abu Talib, S.H. Review Paper on Applications of the HEC-RAS Model for Flooding, Agriculture, and Water Quality Simulation. Water Pract. Technol. 2024, 19, 2883–2900. [Google Scholar] [CrossRef] [Scilit]
- Sanz-Ramos, M.; Cea, L.; Bladé, E.; López-Gómez, D.; Sañudo, E.; Corestein, G.; García-Alén, G.; Aragón-Hernández, J.L. Iber v3. Manual de referencia e interfaz de usuario de las nuevas implementaciones. In Iber. More than 2D Hydraulic Modelling; International Centre for Numerical Methods in Engineering (CIMNE): Barcelona, Spain, 2022. [Google Scholar] [CrossRef] [Scilit]
- Gutiérrez García, J.V.; Rubiños Panta, J.E.; Fernández Reynoso, D.S.; Ramírez Ayala, C.; Roblero Hidalgo, R.; Gutiérrez García, F.G.; Romero Sánchez, M.E. Modelación hidráulica en Iber para prevención de inundaciones en la cuenca Tesechoacán. Rev. Mex. Cienc. For. 2022, 13, 159–181. [Google Scholar] [CrossRef] [Scilit]
- Dirección de Hidrología. Desarrollo de Curvas Pluviométricas Intensidad-Duración-Frecuencia (IDF) en Perú; Servicio Nacional de Meteorología e Hidrología del Perú (SENAMHI): Lima, Peru, 2023. Available online: https://www.senamhi.gob.pe/load/file/01401SENA-106.pdf (accessed on 20 June 2025).
- Gorelick, N.; Hancher, M.; Dixon, M.; Ilyushchenko, S.; Thau, D.; Moore, R. Google Earth Engine: Planetary-scale geospatial analysis for everyone. Remote Sens. Environ. 2017, 202, 18–27. [Google Scholar] [CrossRef] [Scilit]
- Hijmans, R.J.; Barbosa, M.; Bivand, R.; Brown, A.; Chirico, M.; Cordano, E.; Dyba, K.; Pebesma, E.; Rowlingson, B.; Sumner, M.D. Terra: Spatial Data Analysis. CRAN Compr. R Arch. Netw. [CrossRef] [Scilit]
- QGIS Development Team. QGIS Geographic Information System, Version 3.44.5; QGIS Association: Genève, Switzerland, 2025. [Google Scholar] [CrossRef]
- Breiman, L. Random Forests. Mach. Learn. 2001, 45, 5–32. [Google Scholar] [CrossRef] [Scilit]
- Wright, M.N.; Ziegler, A. Ranger: A Fast Implementation of Random Forests for High Dimensional Data in C++ and R. J. Statical Softw. 2017, 77, 1–17. [Google Scholar] [CrossRef] [Scilit]
- Tennekes, M. Tmap: Thematic Maps in R. J. Statical Softw. 2018, 84, 1–39. [Google Scholar] [CrossRef] [Scilit]
- R Core Team. R: A Language and Environment for Statistical Computing; R Foundation for Statistical Computing: Vienna, Austria, 2023; Available online: https://www.r-project.org/ (accessed on 12 June 2025).
- Pebesma, E. Simple Features for R: Standardized Support for Spatial Vector Data. R J. 2018, 10, 439–446. [Google Scholar] [CrossRef] [Scilit]
- Dirección General de Caminos y Ferrocarriles. Manual de Hidrología, Hidráulica y Drenaje; Resolución Directoral N° 20-2011-MTC/14; Ministerio de Transportes y Comunicaciones: Lima, Peru, 2011.
- Del Águila Ríos, S. Modelamiento Hidrológico de Cuencas Andinas; Fondo Editorial de la Universidad Nacional de San Cristóbal de Huamanga, UNSCH: Ayacucho, Peru, 2024; 168p, Available online: https://oficinas.unsch.edu.pe/vri/wp-content/uploads/2024/04/df_2422715.001_LIBRO-MODELAMIENTO-HIDROLO%CC%81GICO-final.pdf (accessed on 12 June 2025).
- Duc, L.; Sawada, Y. A signal-processing-based interpretation of the Nash–Sutcliffe efficiency. Hydrol. Earth Syst. Sci. 2023, 27, 1827–1839. [Google Scholar] [CrossRef] [Scilit]
- Krause, P.; Boyle, D.P.; Bäse, F. Comparison of different efficiency criteria for hydrological model assessment. Adv. Geosci. 2005, 5, 89–97. [Google Scholar] [CrossRef] [Scilit]
- Robeson, S.M.; Willmott, C.J. Decomposition of the Mean Absolute Error (MAE) into Systematic and Unsystematic Components. PLoS ONE 2023, 18, e0279774. [Google Scholar] [CrossRef] [Scilit]
- Moriasi, D.N.; Arnold, J.G.; Van Liew, M.W.; Bingner, R.L.; Harmel, R.D.; Veith, T.L. Model Evaluation Guidelines for Systematic Quantification of Accuracy in Watershed Simulations. Trans. ASABE 2007, 50, 885–900. [Google Scholar] [CrossRef] [Scilit]
- Autoridad Nacional del Agua (ANA); Administración Local de Agua Santa–Lacramarca–Nepeña. Evaluación de Los Recursos Hídricos en las Cuencas de los Ríos Santa, Lacramarca y Nepeña: Estudio Hidrológico de la Cuenca del río Nepeña; Informe Final; Ministerio de Agricultura: Lima, Peru, 2009.
- Aparicio Mijares, F.J. Fundamentos de Hidrología de Superficie; Limusa: Mexico City, Mexico, 2010; 303p, ISBN 978-970-15-0404-8. [Google Scholar]
- Texas Department of Transportation (TxDOT). The Kirpich Method—Time of Concentration. In Hydraulics Manual; Texas Department of Transportation: Austin, TX, USA, 2019; Chapter 4: Hydrology, Section 11. Available online: https://www.txdot.gov/content/txdotoms/us/en/manuals/des/hyd/chapter-4--hydrology/section-11--time-of-concentration/the-kirpich-method.html (accessed on 12 June 2025).
- Lavado-Casimiro, W.S.; Felipe, O.; Silvestre, E.; Bourrel, L. ENSO Impact on Hydrology in Peru. Adv. Geosci. 2013, 33, 33–39. [Google Scholar] [CrossRef] [Scilit]
- Aksoy, B. Flood Analysis in Lower Filyos Basin Using HEC-RAS and HEC-HMS Software. Sustainability 2025, 17, 5220. [Google Scholar] [CrossRef] [Scilit]
- Merino-Jiménez, E.; Ibáñez-Castillo, L.A.; Arteaga-Ramírez, R.; Vázquez-Peña, M.A. Hourly hydrologic modeling in the upper basin of the Fuerte River, Sinaloa, Mexico. Ing. Agrícola Biosist. 2021, 13, 53–76. [Google Scholar] [CrossRef] [Scilit]
- Peker, İ.B.; Gülbaz, S.; Demir, V.; Orhan, O.; Beden, N. Integration of HEC-RAS and HEC-HMS with GIS in Flood Modeling and Flood Hazard Mapping. Sustainability 2024, 16, 1226. [Google Scholar] [CrossRef] [Scilit]
- Sahbi, B.; Megnounif, A.; Ferroudj, H.; Hadji, R.; Derdous, O. Flood Modeling Using HEC-RAS 2D and IBER 2D: A Comparative Study. Water Supply 2024, 24, 3061–3084. [Google Scholar] [CrossRef] [Scilit]
- Vashist, K.; Singh, K.K. HEC-RAS 2D modeling for flood inundation mapping: A case study of the Krishna River Basin. Water Pract. Technol. 2023, 18, 831–844. [Google Scholar] [CrossRef] [Scilit]

Disclaimer/Publisher’s Note: The statements, opinions and data contained in all publications are solely those of the individual author(s) and contributor(s) and not of MDPI and/or the editor(s). MDPI and/or the editor(s) disclaim responsibility for any injury to people or property resulting from any ideas, methods, instructions or products referred to in the content. |
© 2026 by the authors. Licensee MDPI, Basel, Switzerland. This article is an open access article distributed under the terms and conditions of the Creative Commons Attribution (CC BY) license.