1. Introduction
Drought is a slow-onset, spatially extensive natural hazard whose impacts often exceed those of more rapid disasters in terms of duration, geographic coverage, and socioeconomic consequences. Unlike floods or earthquakes, drought evolves gradually from sustained precipitation deficits and associated anomalies in temperature, evapotranspiration, soil moisture, and streamflow [
1]. Recent decades have seen an increase in drought frequency, intensity, and spatial extent in many regions of the world, consistent with observed and projected climate variability and warming [
2,
3,
4]. The cascading impacts of drought affect agricultural productivity, ecosystems, hydropower generation, water supply systems, and public health, particularly in arid and semi-arid regions. In this context, the arid and semi-arid plains of Algeria are consistently prone to drought, particularly during periods such as the late 1980s and late 1990s, characterized by widespread agricultural losses, groundwater depletion, and socioeconomic stress [
5]. Recent analyses suggest that rising temperatures and precipitation variability are intensifying meteorological and hydrological drought conditions across the country [
6]. For this reason, in the past FEW years, several analyses have been performed in Algeria, using various indices across different timescales to capture both short- and long-term drought patterns [
7]. In particular, key areas of study included comparing drought indices and their connections at multiple timescales, identifying trends, change points, and persistence, analyzing periodicity and links to global climate oscillations or local meteorological factors, and conducting in-depth assessments of drought frequency, severity, duration, and propagation between different drought types. Additionally, efforts have focused on predicting drought indices to enhance preparedness and response strategies across Algeria in recent decades [
8].
As regards hydrological drought, its analysis in Algeria has expanded substantially over the last decade, as water-supply systems have become increasingly exposed to multi-year runoff deficits and strong rainfall–runoff non-linearity in semi-arid basins. Early national-scale and regional studies emphasized drought timing, persistence, and predictability, often linking drought evolution to climate variability and limited monitoring density [
9]. More recent, basin-based work has increasingly adopted streamflow-centered indices, mainly the Standardized Runoff Index (SRI) and related streamflow drought metrics, to detect hydrological drought onset, quantify event characteristics, and evaluate propagation from meteorological anomalies into runoff deficits. In northwestern Algeria, studies in the Wadi Ouahrane basin used multi-timescale SPI–SRI analysis together with copula-based dependence modeling to estimate conditional drought risks and show that runoff exhibits stronger temporal persistence than precipitation, which has direct implications for reservoir operations and drought preparedness [
10]. Complementary research has focused on uncertainty sources in drought-index computation (e.g., distribution choice and timescale effects) to improve the robustness of hydrological drought monitoring using SRI [
11]. Alongside monitoring, forecasting hydrological drought has gained attention, including hybrid machine learning approaches trained on SRI time series for Algerian basins (e.g., Wadi Mina), reflecting a shift toward operational early warning [
12]. In parallel, recent streamflow-based studies employing the SRI at multiple timescales have documented the temporal evolution of hydrological drought across observed discharge networks, reinforcing the importance of long records for characterizing rare extremes [
13].
Effective drought risk assessment requires more than index values alone. Critical attributes, including duration, cumulative deficit (severity), and overall magnitude, must be systematically identified and jointly analyzed to fully capture drought behavior [
14]. A major difficulty in such analyses arises from the fact that these drought characteristics typically follow different probability distributions, complicating their joint statistical modeling. To overcome this limitation, copula-based methods have gained increasing attention [
15]. Copulas allow the dependence structure among drought variables to be modeled separately from their marginal distributions, enabling a more robust representation of interrelated characteristics even when their statistical behaviors differ [
16,
17]. While earlier investigations primarily relied on univariate frequency analysis, contemporary research increasingly adopts multivariate frameworks to better represent the complexity of drought processes [
18]. In particular, copula-based approaches have proven valuable for assessing drought risk under climate variability and change, as they facilitate the evaluation of joint probabilities and return periods across different severity levels [
19,
20]. The development of diverse copula families and advanced dependence structures has further enhanced modeling flexibility, making them especially suitable for capturing non-linear and climate-driven variability in hydroclimatic extremes [
21].
Comprehensive bivariate drought analyses remain limited for Algerian basins, especially those supplying strategic reservoirs. Moreover, the divergence between univariate and multivariate return periods has not been sufficiently quantified for long-term hydrological droughts in this region. This gap is critical, as water resource systems are designed based on return period estimates that may underestimate compounded risks if dependence between duration and severity is ignored. Therefore, the aim of this study is to present a bivariate probabilistic framework for assessing long-term hydrological drought risk using the Standardized Runoff Index (SRI-12), run theory, and Archimedean copulas. The approach explicitly models the dependence between drought duration and severity, moving beyond traditional univariate drought analysis. By estimating joint return periods under OR and AND scenarios, the framework provides a more realistic representation of compound drought risk. Previous Algerian studies have mainly focused on meteorological drought indices, drought occurrence, or predictive modeling, with limited attention to multivariate hydrological drought analysis. By contrast, this research specifically examines the joint behavior of hydrological drought characteristics derived from streamflow deficits. The study, therefore, contributes to a more comprehensive probabilistic assessment of drought risk. It also focuses on the Wadi Sahouat basin, which supplies the strategically important Ouizert Dam reservoir in northwestern Algeria. The basin lies in a semi-arid Mediterranean transition zone where drought persistence strongly affects water availability. In spite of its importance for regional water supply, detailed multivariate drought risk studies for this basin are scarce. By analyzing long-term runoff records and modeling compound drought extremes, this study provides new insights relevant for reservoir management and climate-adaptation planning.
3. Results
3.1. Hydroclimatic Overview
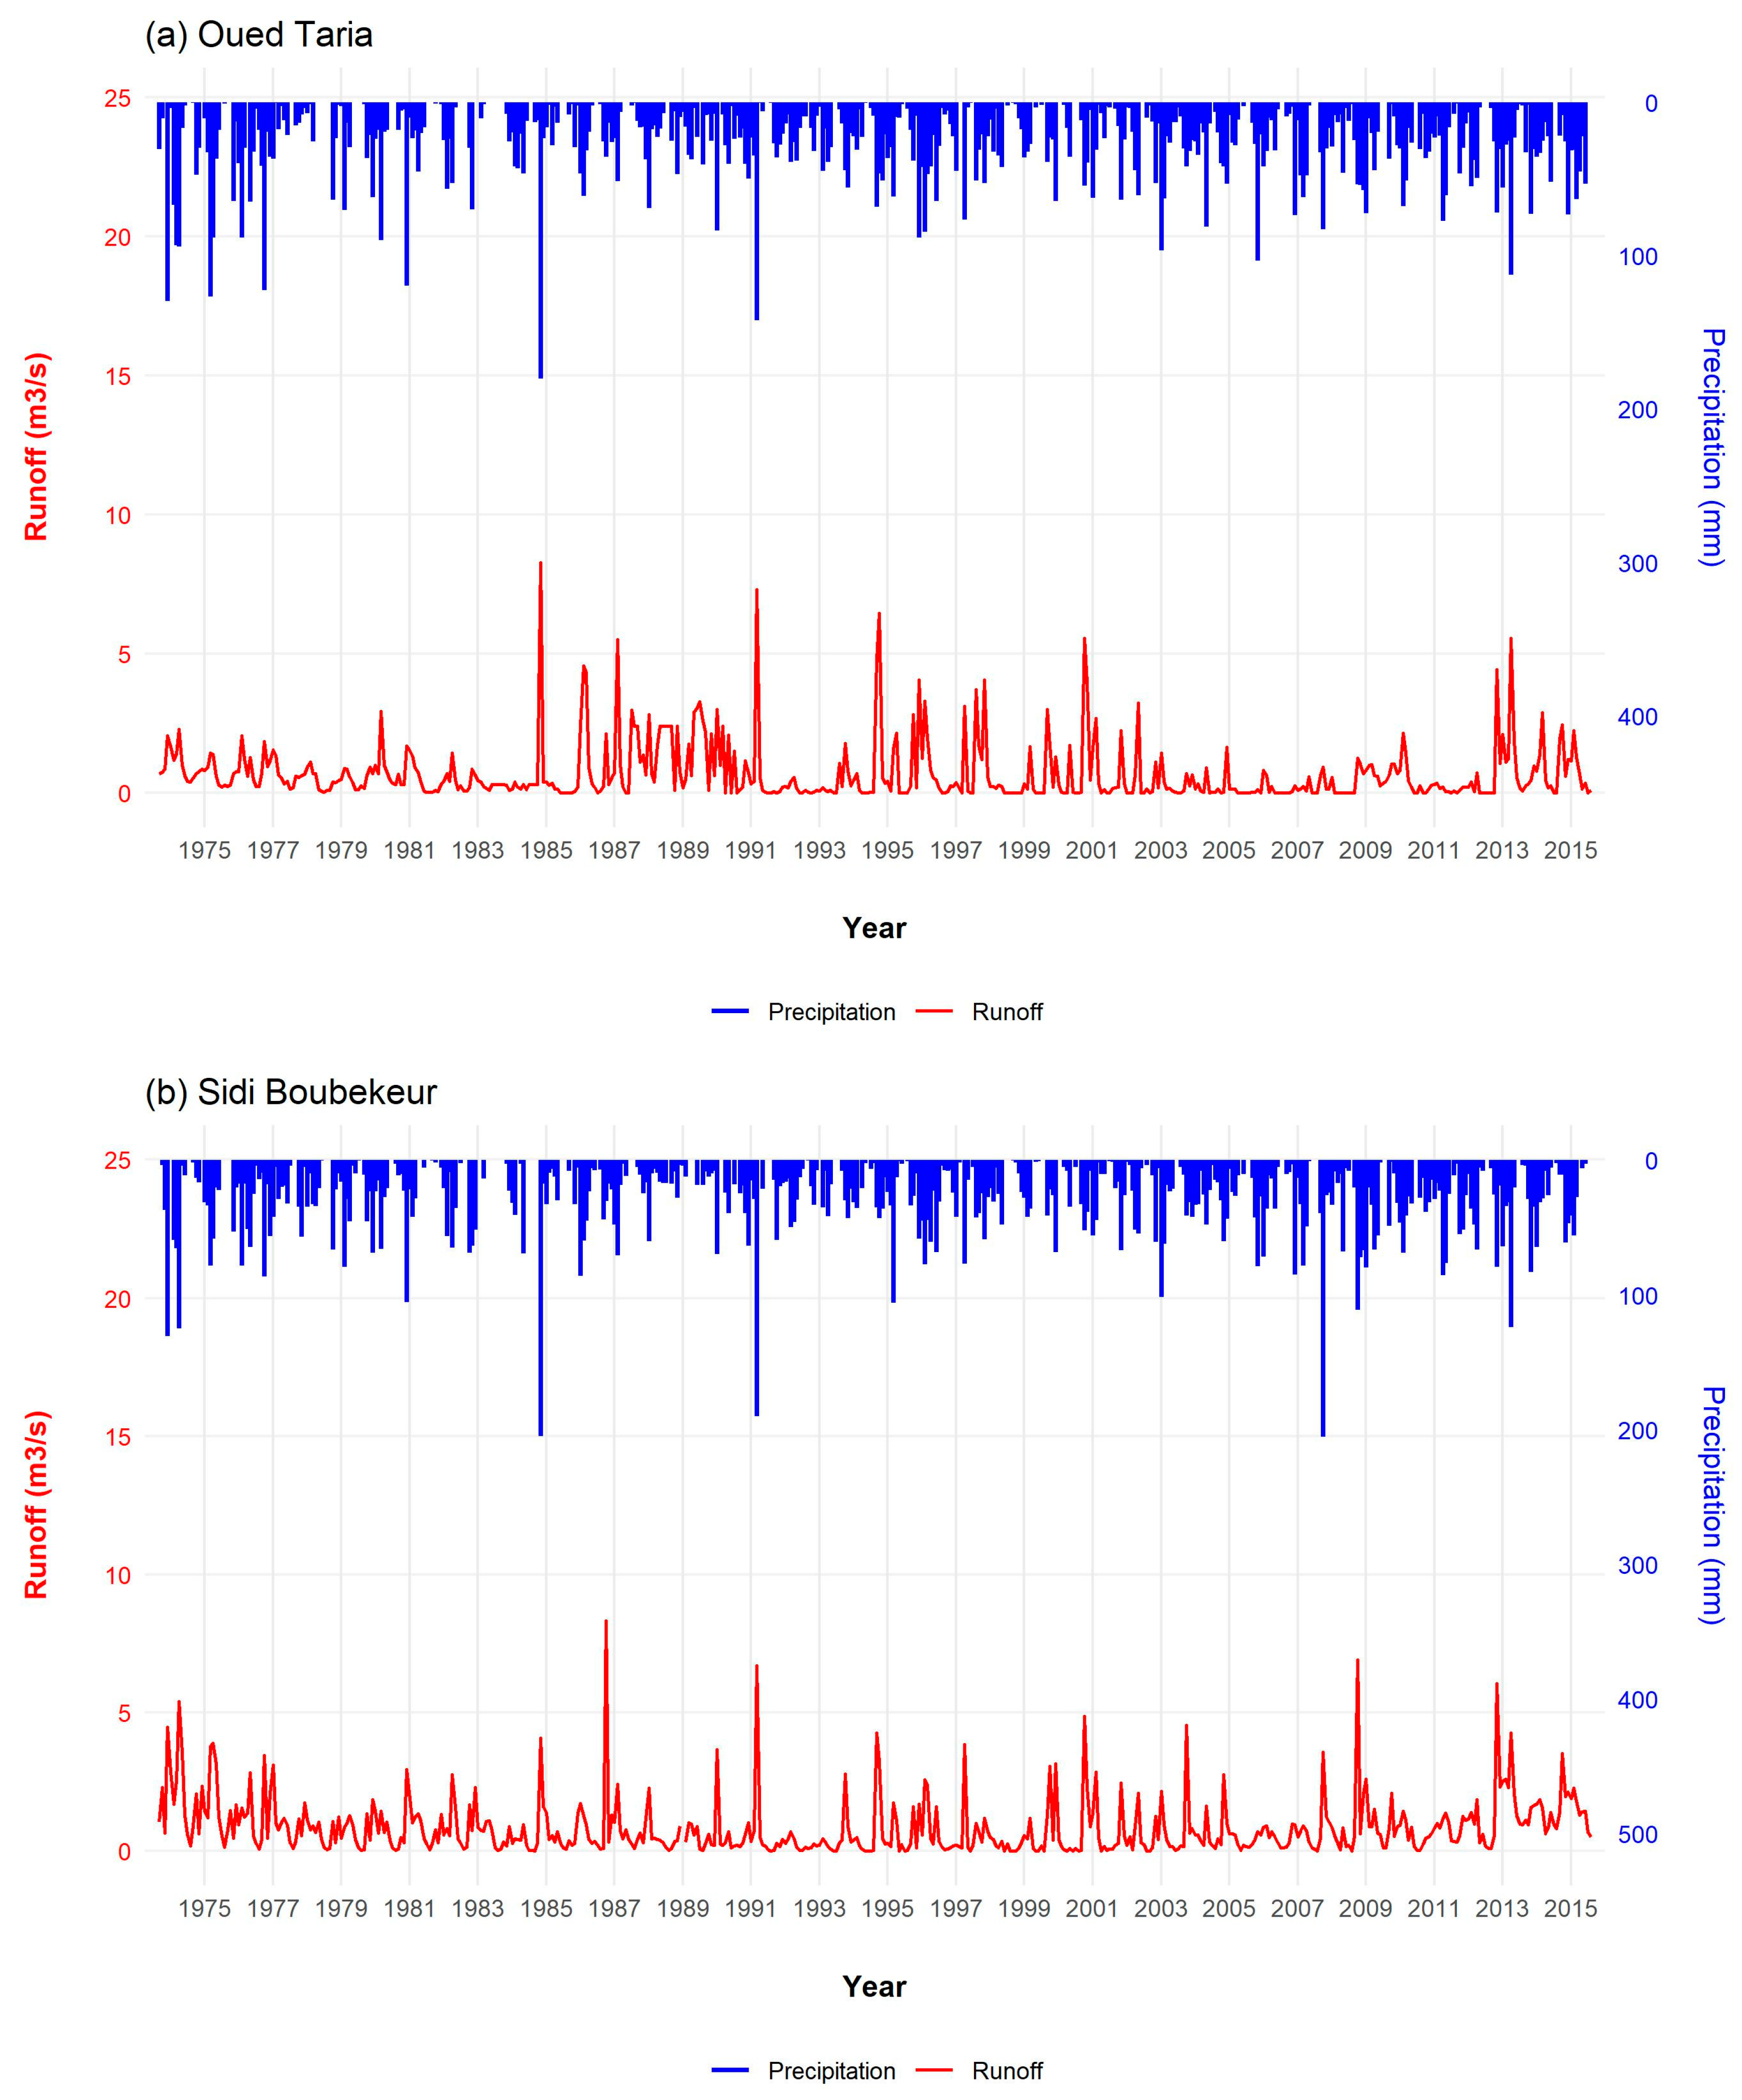
The hyetohydrographs (
Figure 3) provide a multi-decadal perspective on the seasonal synchronization and inter-annual variability of precipitation and runoff for the Oued Taria and Sidi Boubekeur basins between 1975 and 2015. At first glance, both systems exhibit the classic Mediterranean semi-arid signature, where runoff is heavily concentrated in the winter months following intense rainfall clusters. However, a closer inspection of the peak alignments suggests distinct differences in how each basin processes these climatic inputs. In Oued Taria (a), the peak runoff values appear to synchronize almost immediately with the most intense monthly precipitation events. This near-simultaneous response likely reflects a flashy hydrological regime, where limited soil storage or steeper physiography allows rainfall to be converted into surface runoff with minimal retention. In contrast, the hydrological response in Sidi Boubekeur (b) seems to follow a more regulated pattern. While the basin recorded higher peak precipitation volumes, the resulting runoff peaks often show a perceptible lag or attenuation relative to the rainfall signal. This decoupling suggests a higher degree of natural regulation, where the basin’s memory buffers the immediate impact of the rain. This buffering effect is further supported by the flow persistence data; while Oued Taria recorded 92 months of zero flow during the study period, Sidi Boubekeur remained significantly more consistent with only 24 months of intermittency. In summary, this hydroclimatic overview establishes the foundational basis for the subsequent hydrological drought analysis. By characterizing the natural variability of precipitation and runoff between 1975 and 2015, the study ensures that the statistical assessment via the SRI-12 is grounded in the observed physical dynamics of the basins.
3.2. Hydrological Drought Analysis
To determine the most appropriate probability distribution for the SRI-12 calculation, a comparative fitting analysis was performed among Lognormal, Gamma, Weibull, and GEV distributions. As summarized in
Table 2, the Gamma distribution demonstrated a robust fit across all goodness-of-fit metrics, yielding a low AIC and a significant Kolmogorov–Smirnov
p-value. While the Weibull distribution showed slightly lower AIC values, the Gamma distribution was ultimately selected due to its widespread adoption in drought literature, ensuring the comparability of our results with existing regional studies.
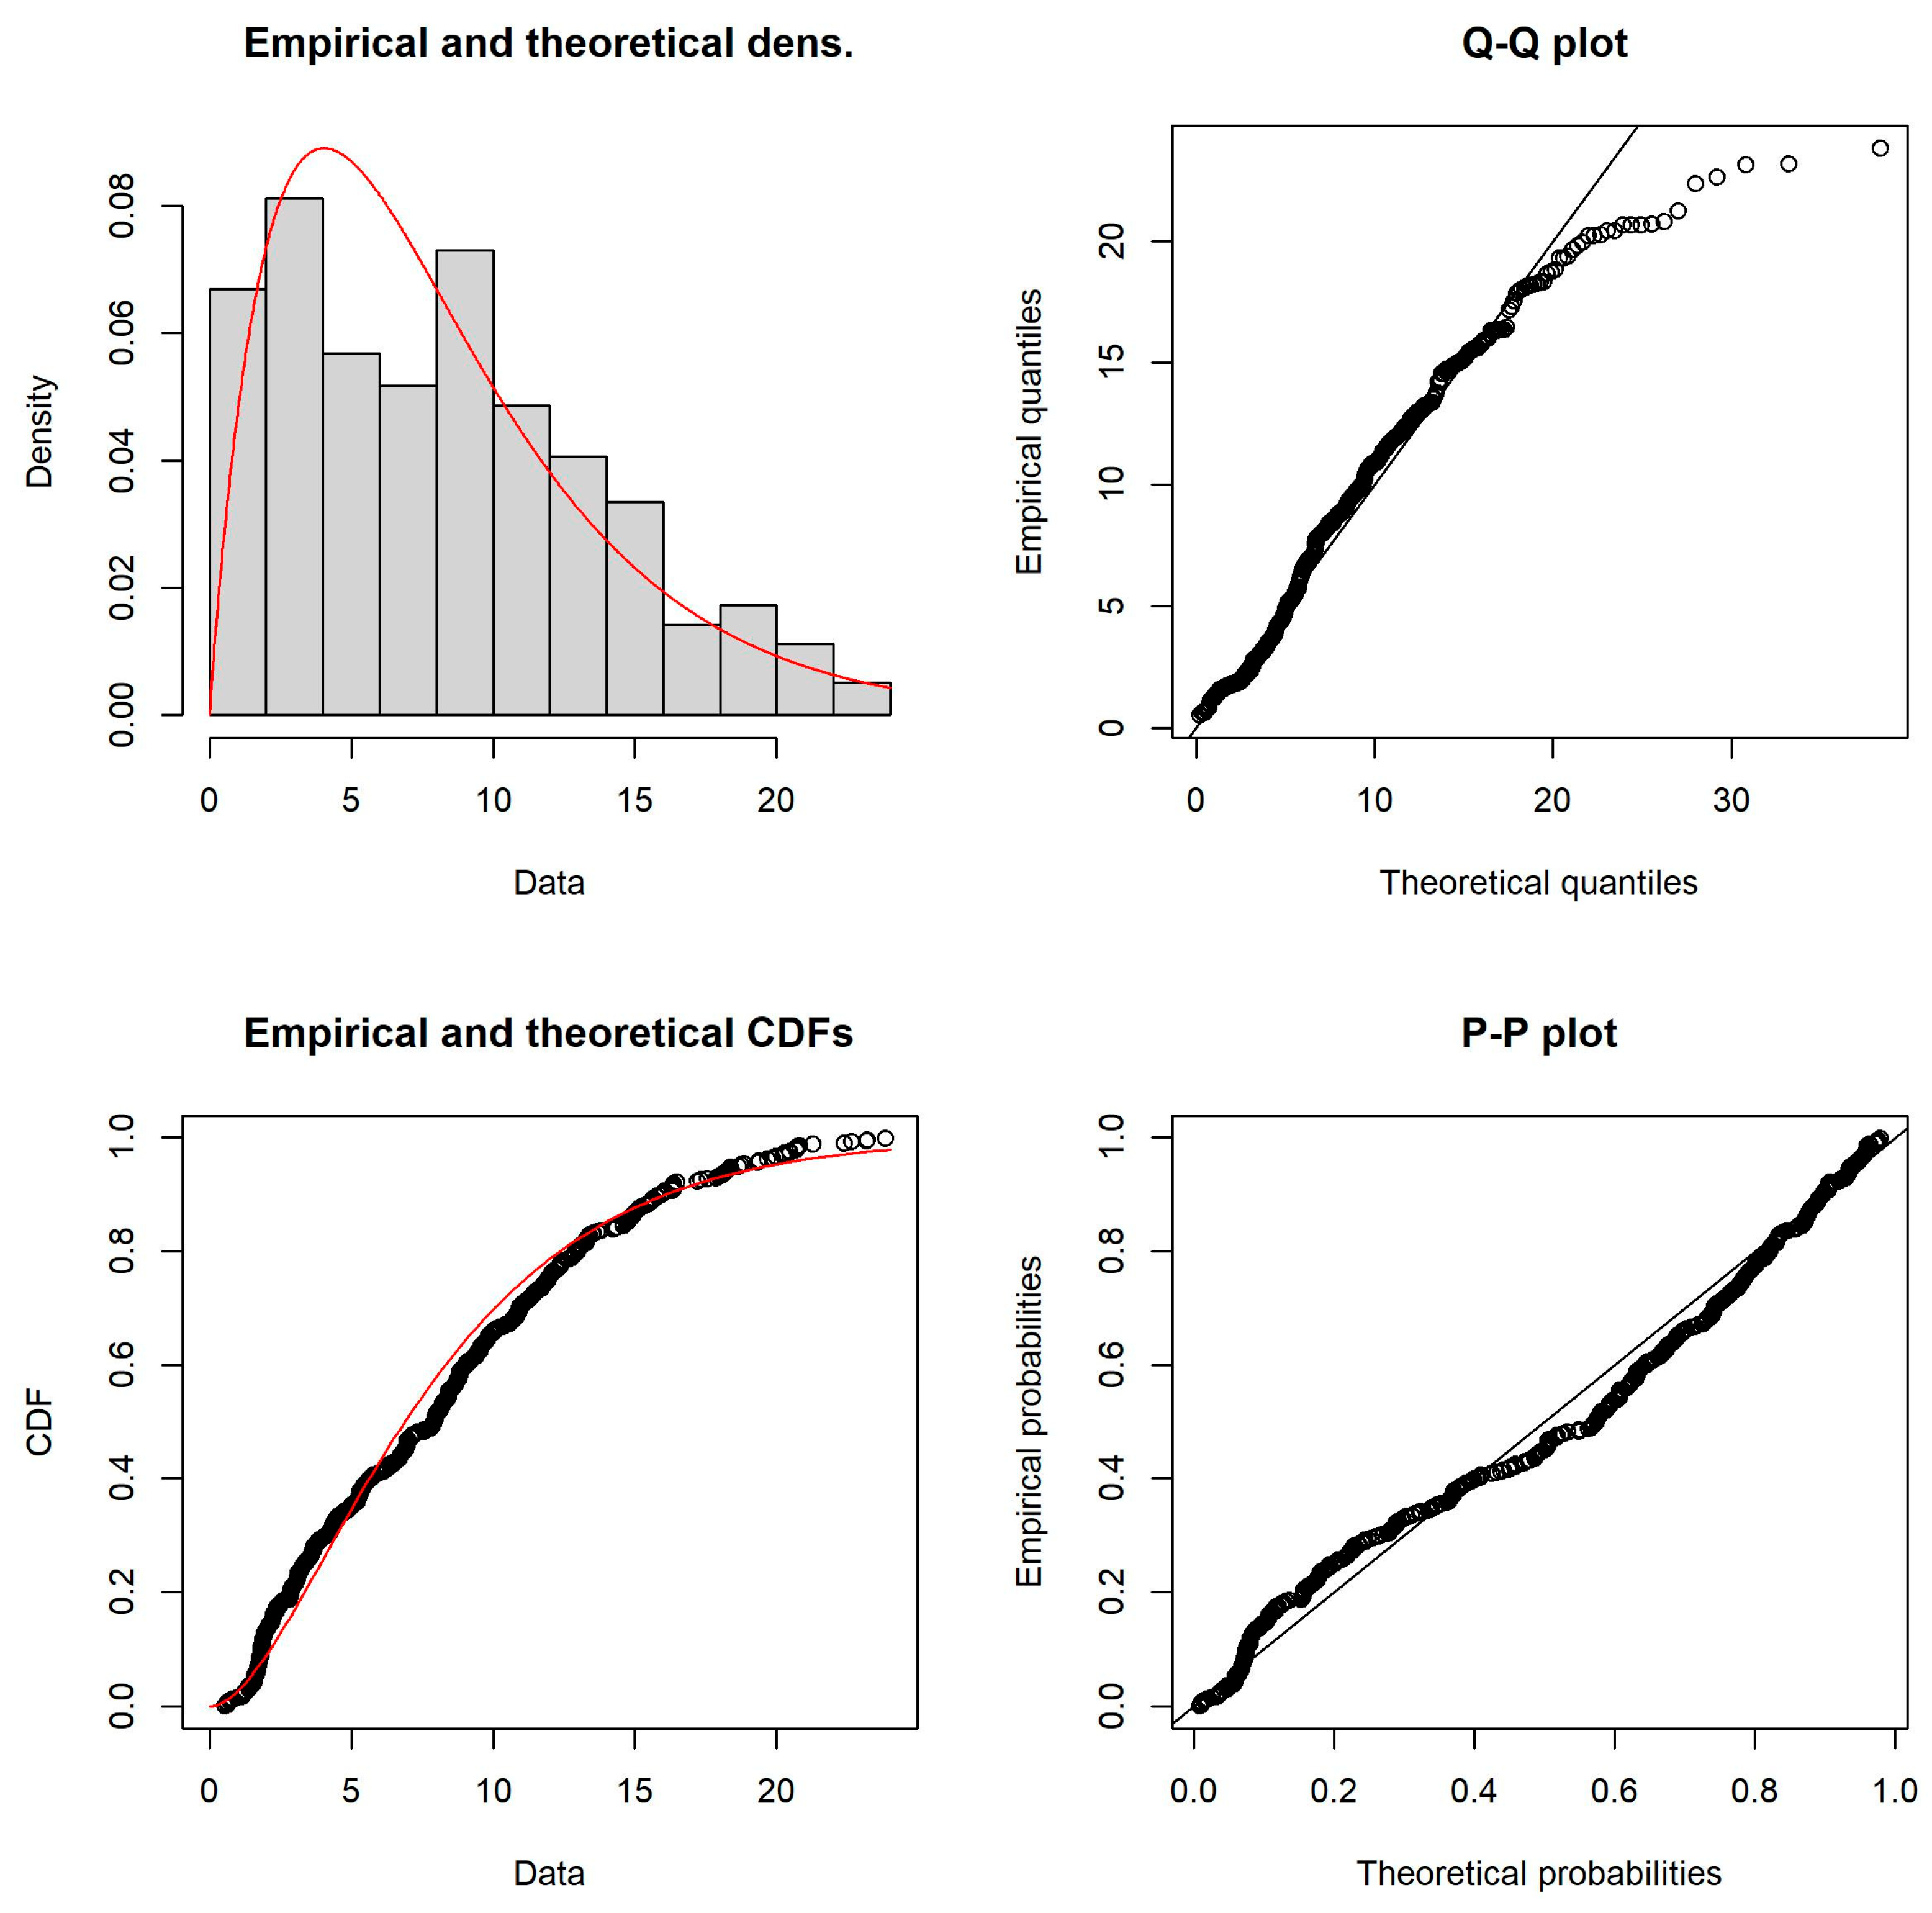
The diagnostic plots in
Figure 4 suggest that the Gamma distribution provides a reasonable approximation of the empirical runoff behavior. Notably, the distribution appears to follow the lower tail of the data quite well, which is a key consideration for the characterization of severe drought events.
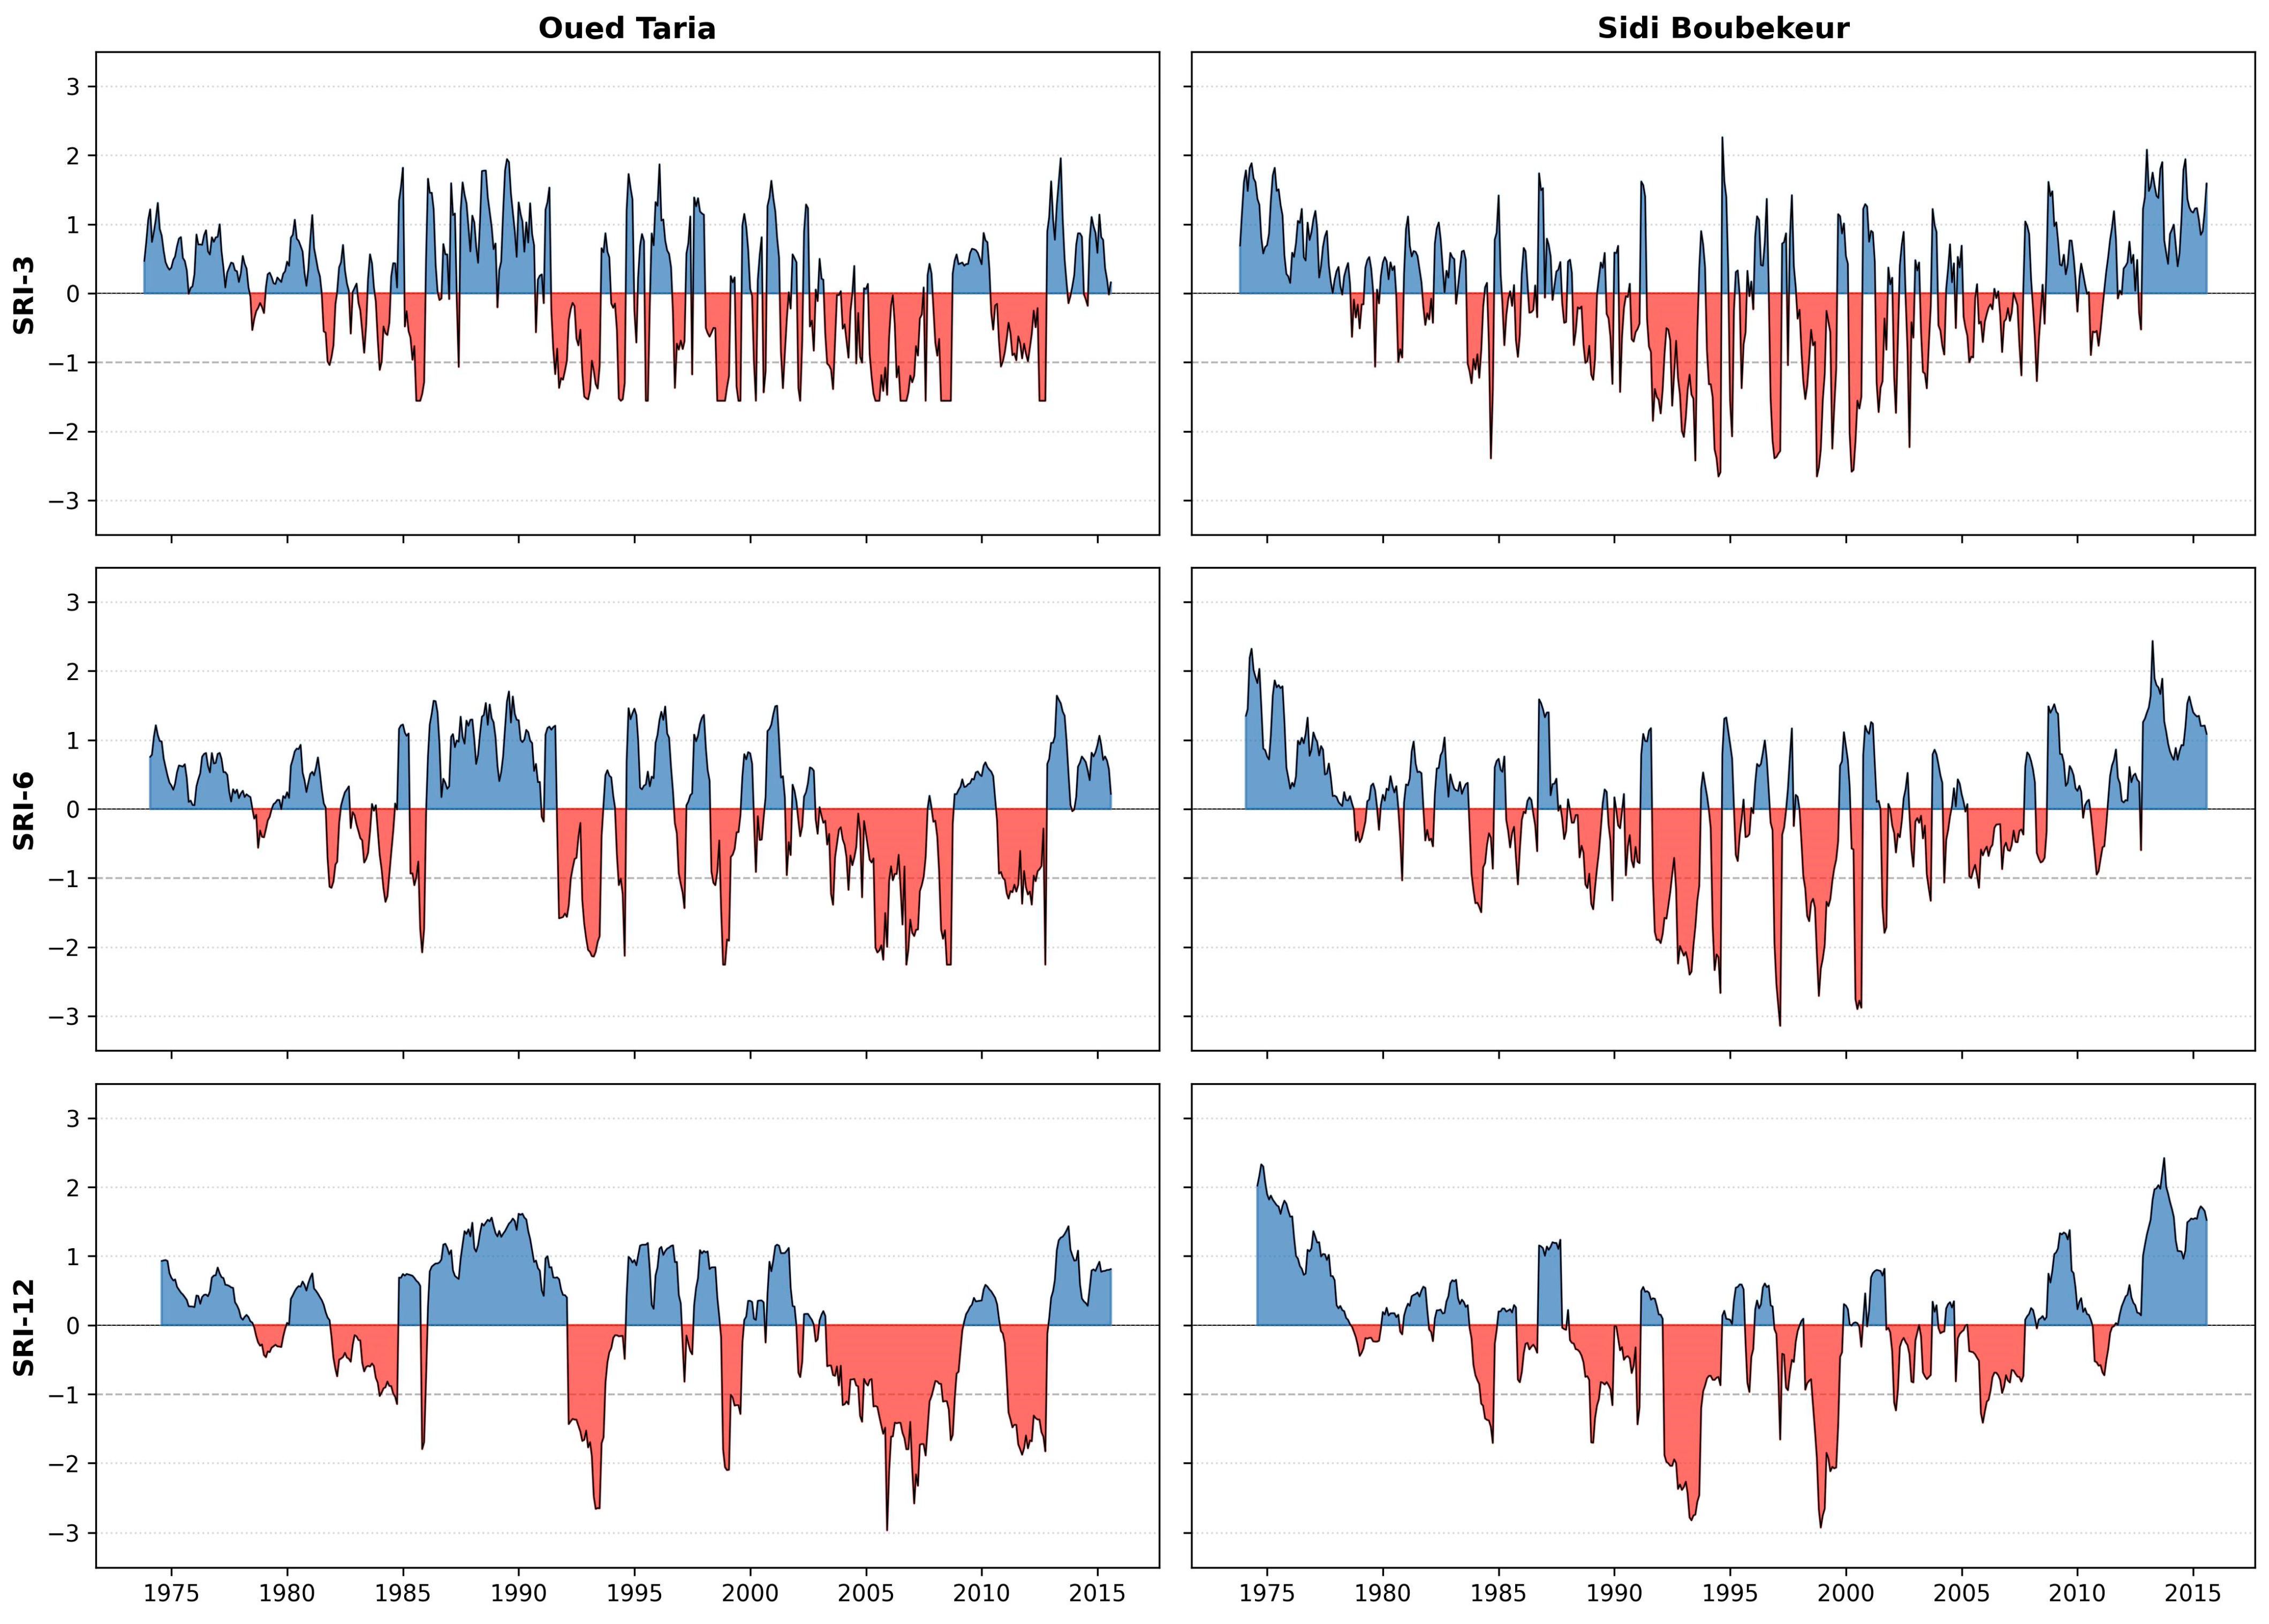
The temporal dynamics of hydrological drought were evaluated across three accumulation scales (3, 6, and 12 months) to capture the transition from seasonal runoff fluctuations to more persistent water deficits. As illustrated in
Figure 5, the SRI-3 series is characterized by high-frequency oscillations, reflecting the immediate impact of seasonal precipitation variability on streamflow. These short-term events are critical for understanding immediate risks to run-of-river irrigation and ecological flow requirements.
As the accumulation scale increases to SRI-6 and SRI-12, a distinct smoothing effect is observed. The short-lived dry spells seen on the 3-month scale merge into more continuous and severe drought episodes. This transition signifies the progression from meteorological anomalies to established hydrological droughts that can impact larger reservoir systems and multi-seasonal water planning.
At the Oued Taria and Sidi Boubekeur stations, the multi-scale analysis reveals that while the frequency of drought events decreases with longer scales, their average duration increases. This behavior underscores the importance of monitoring long-term indices like the SRI-12 for drought preparedness, as these scales better represent the slow-onset, high-impact risks to regional water security.
3.3. Drought Characteristics
To evaluate the selection of the SRI threshold for defining significant drought events, we examined the number, duration, and severity of droughts under three thresholds: −0.8, −1.0, and −1.2. As shown in
Table 3, stricter thresholds generally reduce the number of identified events while increasing their average severity and duration. For both Oued Taria and Sidi Boubekeur, the threshold of −1.0 provides a balanced representation, capturing meaningful drought events without being overly restrictive.
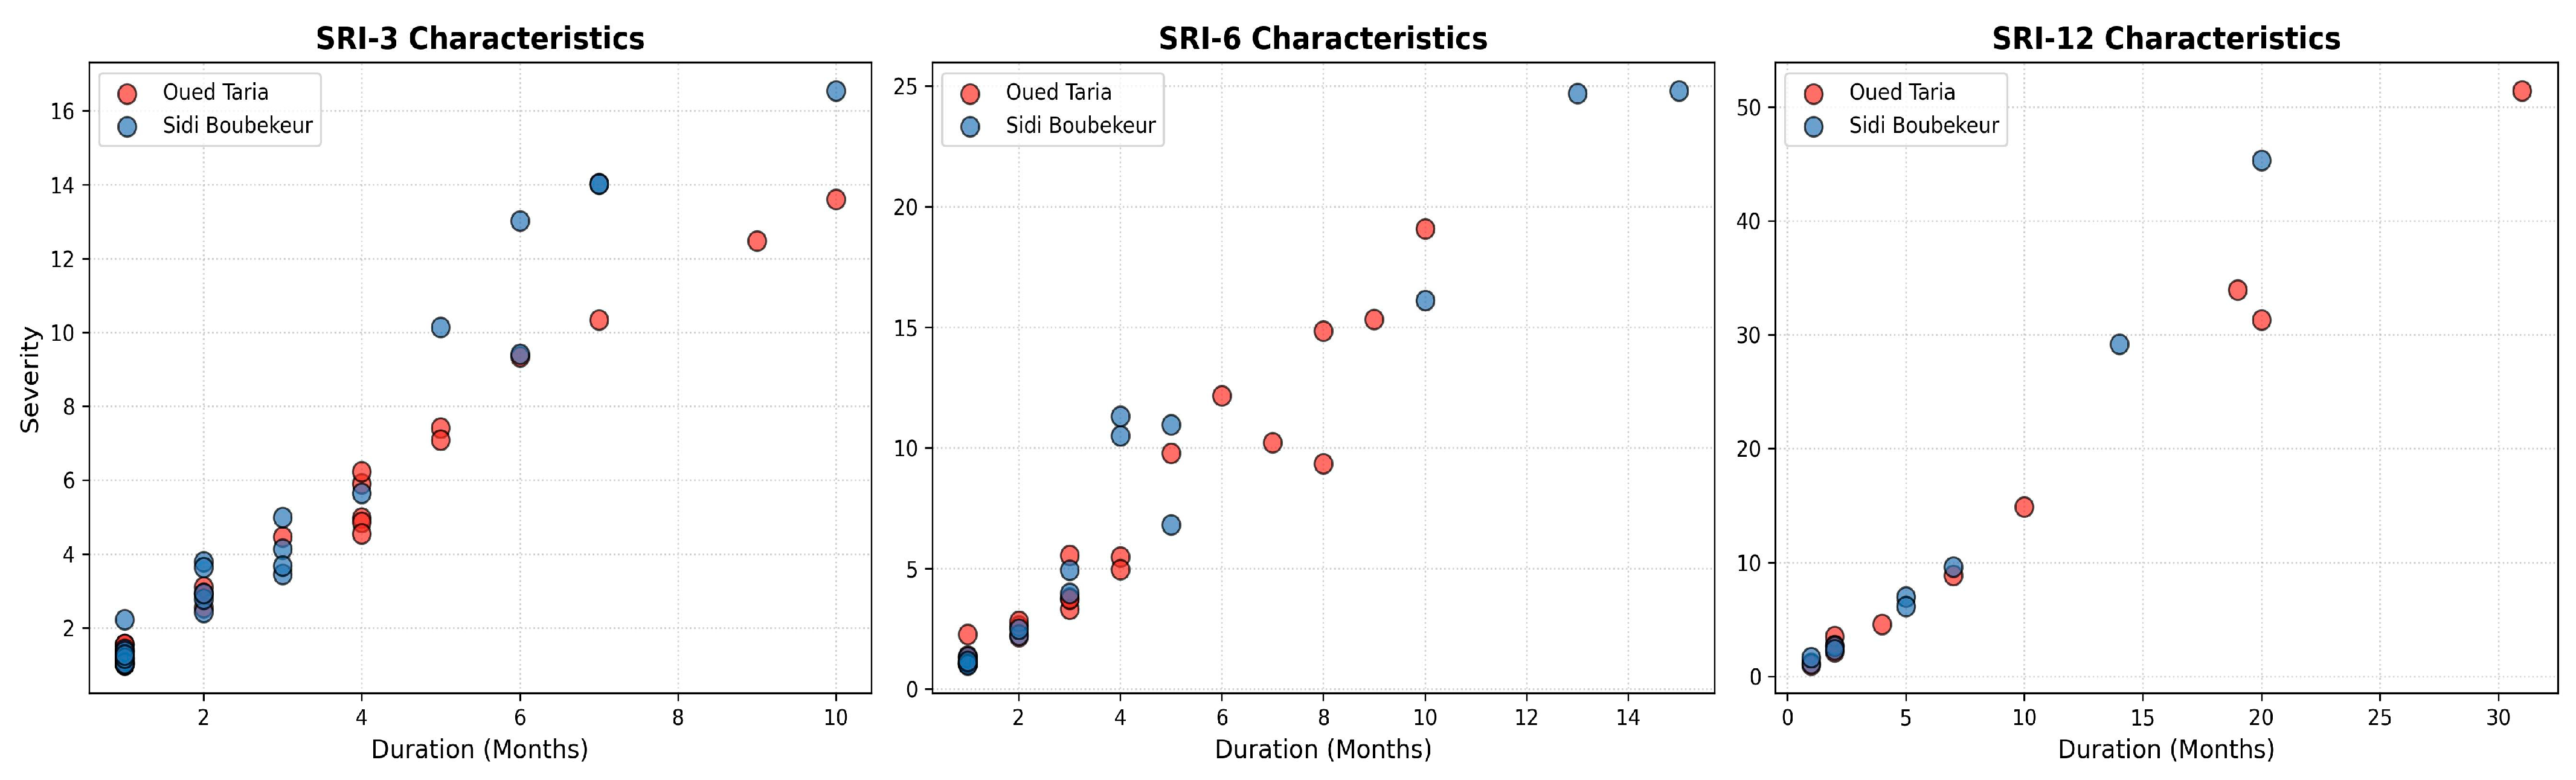
Following the identification of drought events through Yevjevich’s run theory, the primary characteristics, duration (D), and severity (S) were quantified for both the Oued Taria and Sidi Boubekeur stations. As shown in
Figure 6, a clear and positive non-linear relationship exists between these two variables across both basins.
For the Oued Taria station, 10 distinct drought events were identified. The most critical event lasted 31 months with a total accumulated severity of 51.41, representing a massive deficit in the basin’s water budget. The average duration at this station was approximately 9.8 months, though the presence of two mega-events (19 and 31 months) significantly skews the risk profile toward long-term persistence.
At the Sidi Boubekeur station, 9 events were recorded. While the maximum duration was shorter than Oued Taria (20 months), the severity of this peak event was remarkably high (45.34). This suggests that while droughts at Sidi Boubekeur may be slightly less persistent, they are more intense, as evidenced by the high severity-to-duration ratio in its most extreme event.
As illustrated in
Figure 6, the relationship between duration and severity is strongly positive and non-linear. The scatter distribution confirms that long-duration events are disproportionately severe, particularly for Sidi Boubekeur, where the intensity (severity per month) remains high even during prolonged events. This dependency is the statistical foundation for the subsequent bivariate analysis, as univariate return periods would significantly underestimate the risk of such high-intensity, long-duration occurrences.
3.4. Marginal Distributions
To establish the bivariate framework, the marginal probability distributions of drought duration and severity were evaluated. Selecting the appropriate distribution is a prerequisite for copula modeling, as it ensures that the univariate probabilities (u, v) are accurately transformed into the [0, 1] interval. Five candidate distributions (Gamma, Lognormal, Weibull, Genextreme, and Exponential) were tested for each variable at both stations.
The goodness-of-fit results, summarized in
Table 4, were assessed using the Akaike Information Criterion (AIC), the Bayesian Information Criterion (BIC), and the Kolmogorov–Smirnov (K-S) test. The marginal distributions were primarily selected based on the lowest AIC values. In cases where multiple distributions had similar AICs, the K-S test was used as a secondary check to ensure a statistically adequate fit, particularly in representing the distribution tails. Visual diagnostic plots were also employed to confirm the fit quality.
Using this approach, the Exponential distribution was identified as the most suitable model for the majority of variables, capturing both the central tendency and the behavior of extreme values in the hydrological drought data. For the severity variable at Sidi Boubekeur, the Lognormal distribution provided a superior fit, particularly in representing higher-magnitude deficits. The careful, criteria-based selection of marginal distributions ensures statistical consistency and robustness, providing a reliable foundation for transforming univariate probabilities into the [0, 1] interval. These well-characterized marginals are essential for accurate copula modeling, enabling the subsequent bivariate analysis to faithfully represent the joint behavior of drought duration and severity across both study sites.
3.5. Return Period Analysis
The final phase of the risk assessment involved modeling the joint dependence between drought duration and severity using copula functions. By integrating the marginal distributions into a bivariate framework, we quantified the joint return periods, providing a comprehensive view of hydrological risk.
Three Archimedean copula families (Clayton, Gumbel, and Frank) were tested to determine the best representation of the dependence structure between D and S. As shown in
Table 5, the Gumbel copula emerged as the superior model for both stations, yielding the lowest AIC values (−22.54 for Oued Taria and −26.74 for Sidi Boubekeur).
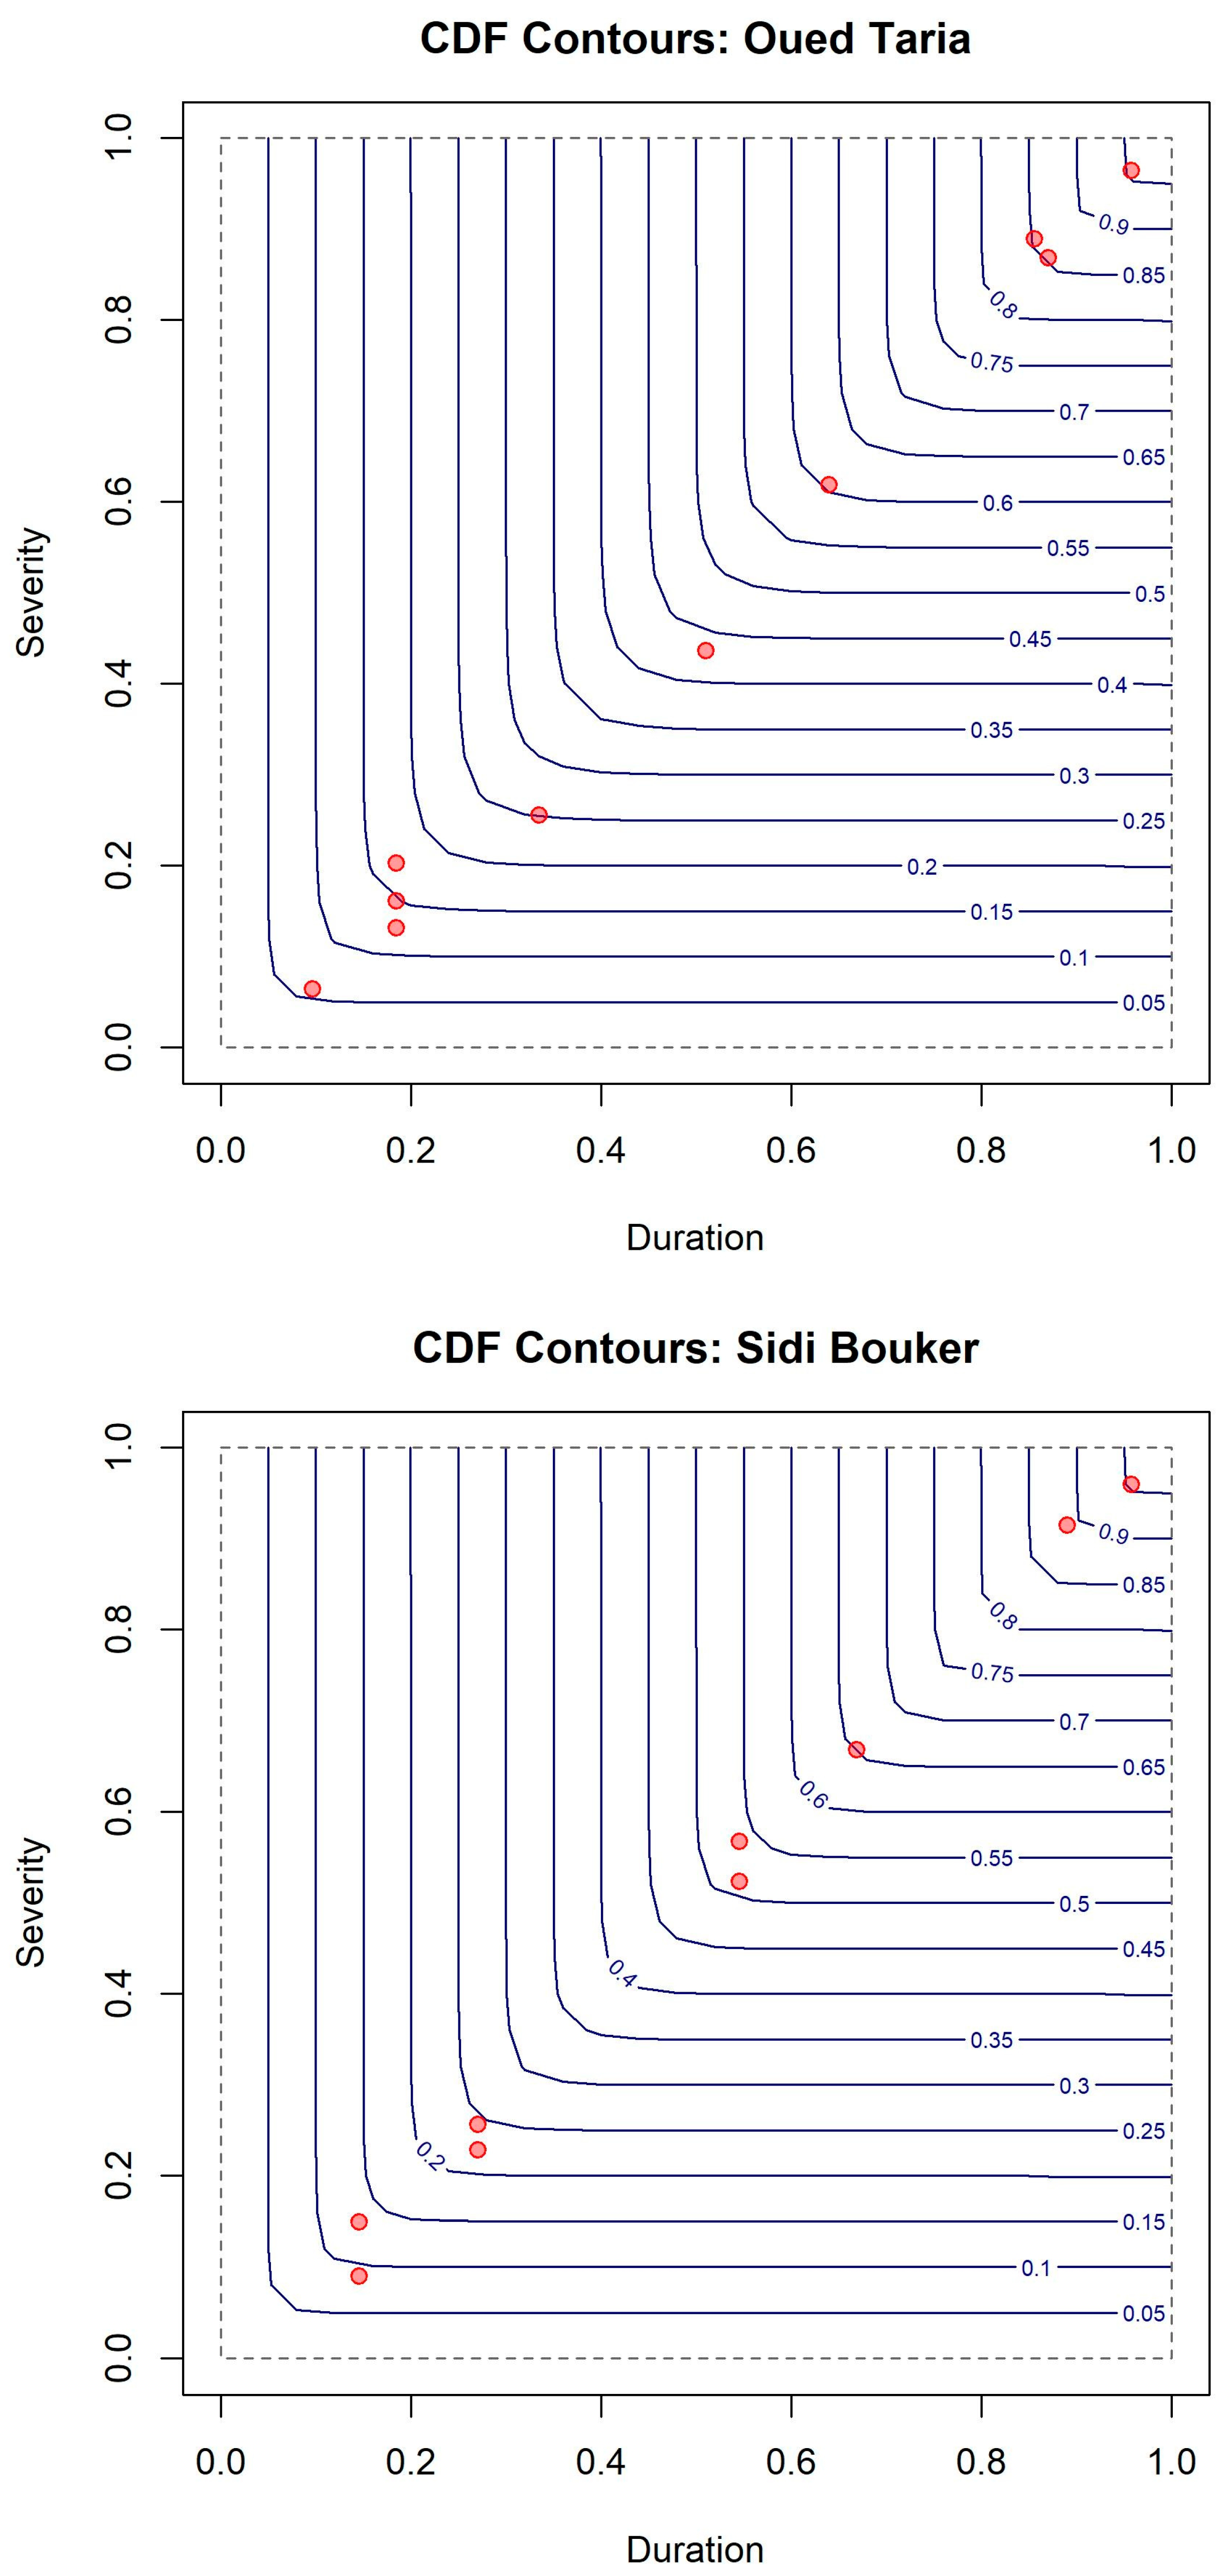
Figure 7 shows the CDF contour plots of the Gumbel copula for Oued Taria and Sidi Boubekeur. The alignment of the red points with the contour lines indicates that the copula captures the joint distribution of drought duration and severity reasonably well. In particular, the contours are denser in the upper-right corner, where long-duration and severe events occur, reflecting the Gumbel copula’s ability to model upper-tail dependence. Despite the limited sample size, the visual agreement supports the use of the Gumbel copula for assessing the risk of extreme droughts.
The selection of the Gumbel copula is particularly significant for water risks, as it is known for its upper-tail dependence, effectively capturing the joint occurrence of extreme durations and extreme severities. Using the Gumbel copula, we calculated the univariate and bivariate joint return periods (T
OR, T
AND) for target intervals ranging from 10 to 200 years (
Table 6). The results highlight a significant divergence between the “OR” and “AND” scenarios. For Oued Taria, a 50-year drought event (T = 50) shows that the risk of exceeding either a duration of 48.8 months or a severity of 94.3 occurs approximately every 47.9 years T
OR.
However, the risk of both thresholds being exceeded simultaneously (TAND) is lower, with a return period of 52.3 years. In contrast, Sidi Boubekeur exhibits much higher worst-case risks. For a 50-year target, the TAND reaches 74.4 years, and for a 100-year target, it jumps to 150.3 years. This indicates that while droughts at Sidi Boubekeur may have shorter average durations, the joint probability of experiencing a long and intense drought is more severe than univariate metrics suggest. The AND return periods are consistently higher than their univariate counterparts, confirming that multi-dimensional drought extremes are rarer but pose a significantly greater threat to water security. For water managers in these basins, these bivariate metrics provide a more realistic stress test for reservoir reliability and climate change adaptation strategies.
4. Discussion
The present study provides a comprehensive probabilistic assessment of hydrological drought characteristics in the Oued Taria and Sidi Boubekeur basins using run theory and a copula-based bivariate framework. The methodological foundation of the analysis is consistent with the hydrological drought characterization framework proposed by Shukla and Wood [
30], who introduced the Standardized Runoff Index (SRI) as a robust tool for diagnosing streamflow deficits beyond short-term climatic variability. Subsequent applications in Mediterranean-type climates, such as Nalbantis and Tsakiris [
31], confirmed that hydrological drought indices capture long-term basin storage depletion more effectively than meteorological indicators alone. In this context, the identified 10 drought events at Oued Taria and 9 at Sidi Boubekeur reflect persistent runoff anomalies comparable to those reported in semi-arid North African basins, including the Wadi Ouahrane in Algeria [
10].
A key finding of the present study is the pronounced non-linear relationship between drought duration and absolute severity. Similar exponential growth patterns between duration and cumulative deficit have been documented in Chinese and Middle Eastern basins [
32,
33], where prolonged droughts resulted in disproportionately larger hydrological losses. The 31-month mega-drought at Oued Taria, with a severity of 51.41, reflects this compounding effect and is consistent with findings from the Yellow River Basin in China, where Li et al. [
34] observed that long-duration events accelerate groundwater depletion and reservoir stress. Such prolonged hydrological droughts indicate the progressive exhaustion of basin storage components rather than temporary precipitation shortfalls.
Although Sidi Boubekeur recorded shorter maximum durations (20 months), its higher severity-to-duration ratio suggests intensity-driven drought behavior. Comparable basin-specific drought signatures were reported by Qin et al. [
35] in the Upper Minjiang River and by Liu et al. [
36] in the Ganjiang River Basin, where catchment hydrological response, evapotranspiration demand, and soil storage capacity influenced whether drought risk was persistence- or intensity-dominated. This differentiation underscores that hydrological drought dynamics are not uniform, even within climatically similar regions. The contrast between Oued Taria’s persistence-driven regime and Sidi Boubekeur’s intensity-driven regime reinforces the need for basin-specific adaptation planning.
The marginal distribution analysis identified the Weibull distribution as the most reliable model for drought duration and severity. This finding aligns with several copula-based drought studies [
32,
37], which reported that Weibull marginals often outperform Lognormal or Gamma distributions in capturing both central tendency and extreme tails. Accurate tail representation is crucial, as infrastructure reliability depends primarily on extreme quantile estimation. Similar distributional robustness was observed in bivariate precipitation and drought analyses across arid and semi-arid climates [
38].
The dependence structure modeled through Archimedean copulas further strengthens the study’s contribution. The superior performance of the Gumbel copula in both basins confirms the presence of upper-tail dependence, meaning that extreme drought duration and severity occur jointly rather than independently. This result is consistent with findings from the East River Basin in China [
33], the Kaidu River Basin [
39], and hydro-meteorological drought studies by Shaw and Chithra [
37], all of which reported that Gumbel copulas effectively capture compound drought extremes. In North African contexts, Achite et al. [
10] similarly demonstrated that upper-tail-dependent copulas better represent hydrological drought risk in semi-arid Algerian basins.
A critical outcome of the return period analysis is the substantial divergence between univariate and bivariate estimates. The inflation of joint (AND) return periods relative to target univariate thresholds mirrors results reported by Mirabbasi et al. [
32] and Yang et al. [
39], who showed that univariate frequency analysis systematically underestimates compound drought risk. The escalation of joint return periods at higher recurrence levels exceeding 300 years for extreme thresholds at Sidi Boubekeur confirms that compound exceedance events are rarer yet substantially more destructive. Such divergence has also been documented in Mediterranean and Asian basins, where multivariate risk frameworks revealed hidden vulnerability in reservoir design and water allocation systems [
33,
35].
From a water management perspective, these findings strongly advocate for transitioning from univariate to multivariate probabilistic frameworks. In semi-arid regions such as Algeria, where rainfall variability and evapotranspiration pressures are intensifying, compound drought modeling becomes essential for climate-resilient infrastructure planning. Reservoir operation policies, irrigation scheduling, and groundwater abstraction controls should be evaluated against joint return periods to account for upper-tail dependence. Persistence-driven systems like Oued Taria require enhanced long-term storage buffering, whereas intensity-driven systems like Sidi Boubekeur necessitate rapid-response allocation mechanisms to manage short but severe deficit shocks.
This study provides a robust long-term assessment of hydrological drought characteristics, yet certain contextual considerations should be noted. The analysis is based on the period 1973/74–2014/15 and therefore does not incorporate more recent climate or water management developments. Only two basins were examined, which may limit the direct generalization of results to other semi-arid regions. While extreme drought estimates are based on carefully selected Weibull marginals and Gumbel copulas, catchment-scale processes such as groundwater interactions and evapotranspiration were not explicitly modeled. Despite these considerations, the study delivers valuable insights into historical drought patterns, providing a sound basis for water resource planning and management.
Overall, the integration of Weibull marginals with the Gumbel copula provides a statistically robust and physically interpretable framework for compound hydrological drought assessment. Consistent with global evidence from China, Algeria, and other semi-arid basins, the study confirms that hydrological drought risk is governed by strong duration–severity dependence and non-linear deficit escalation. Moving beyond univariate drought indices toward multivariate probabilistic modeling is therefore not merely methodological refinement but a prerequisite for realistic and climate-resilient water resource management.
In addition to conventional drought frequency analysis, the present study applies an extended post-processing framework to SRI-derived drought characteristics by integrating duration and severity within a copula-based bivariate probabilistic model. This post-processing step enables the estimation of joint return periods under OR and AND scenarios and reveals a systematic divergence between univariate and multivariate risk estimates, particularly for extreme events. The results demonstrate that univariate approaches may substantially underestimate compound drought risk when the dependence between duration and severity is not explicitly considered. From an applied perspective, these post-processed SRI results provide actionable risk metrics for water resource management. In particular, joint return periods offer a quantitative basis for defining infrastructure design horizons, evaluating reservoir reliability under compound stress conditions, and improving operational strategies under prolonged or high-intensity droughts. Furthermore, the differentiation between persistence-driven (Oued Taria) and intensity-driven (Sidi Boubekeur) drought regimes highlights the need for station-specific management approaches, as the dominant risk mechanism varies across the basin. These findings provide a multivariate, risk-based foundation for long-term climate adaptation planning in semi-arid water supply systems.
5. Conclusions
This study developed a bivariate probabilistic framework for long-term hydrological drought risk assessment in the Wadi Sahouat basin, a strategic water-supplying sub-basin in northwestern Algeria. Using the 12-month Standardized Runoff Index (SRI-12) over the 1973/74–2014/15 period, drought events were identified through run theory and characterized by their duration and cumulative severity. The results confirm that long-term hydrological droughts in the basin exhibit strong persistence and non-linear dependence between duration and severity, emphasizing the limitations of univariate risk assessments. The marginal analysis demonstrated that the Weibull distribution provided the most consistent fit for both drought duration and severity at the studied stations, effectively representing extreme values in the upper tails. This ensured reliable transformation into the copula framework. Among the tested Archimedean copulas (Clayton, Frank, and Gumbel), the Gumbel copula yielded the best performance based on AIC and BIC criteria at both Oued Taria and Sidi Boubekeur stations. The selection of the Gumbel family indicates significant upper-tail dependence, meaning that prolonged drought events are statistically associated with disproportionately high cumulative deficits. From a water management perspective, this implies that extended drought duration substantially amplifies hydrological stress rather than increasing linearly. The comparison between univariate and bivariate return periods revealed notable discrepancies, particularly under extreme conditions. While univariate return periods treat duration and severity independently, the joint OR and AND return periods account for their dependence structure. The AND return periods were consistently higher than the corresponding univariate estimates, demonstrating that simultaneous extreme duration and severity events are rarer but represent considerably greater risk. This divergence becomes more pronounced for longer return intervals (e.g., 100- and 200-year horizons), highlighting the importance of multivariate approaches in infrastructure design and long-term climate adaptation planning. Moreover, spatial differences between the two stations were evident. Oued Taria exhibited longer-duration “mega-droughts,” whereas Sidi Boubekeur showed comparatively shorter but more intense events. These differences underscore the need for station-specific risk assessments rather than generalized basin-wide assumptions.
Based on the obtained results, several management implications can be highlighted. First, joint return period estimates can be used to establish early warning thresholds when drought duration and severity approach critical levels identified by the OR and AND scenarios. Second, reservoir operators may consider adaptive storage strategies, such as maintaining higher precautionary storage levels when SRI-12 values indicate the onset of persistent hydrological drought conditions. Third, the identification of basin-specific drought behavior suggests that long-duration drought scenarios should be incorporated into reservoir reliability assessments and contingency planning. These additions strengthen the practical relevance of the study by demonstrating how the probabilistic drought risk assessment can inform climate-resilient reservoir operation and water resource management in semi-arid basins supplying strategic infrastructure such as the Ouizert Dam.