


Abstract
This study investigates the optimization of fabrication and operating parameters for poly(ether sulfone) (PES) ultrafiltration membranes embedded with Bismuth tungstate and multi-walled carbon nanotubes (MWCNTs) Bi2WO6/MWCNTs for the removal of dye pollutants from wastewater. Response surface methodology (RSM) coupled with Analysis of Variance (ANOVA) was employed to develop regression models for evaluating membrane performance in terms of dye rejection and permeate flux. A central composite design (CCD) was used to conduct a systematic series of ultrafiltration experiments. The effects of key variables, including Bi2WO6/MWCNTs loading (0–0.1 wt.%), operating pressure (5–9) bar, and methyl red (MR) dye concentration (50–150 ppm), on membrane separation performance were comprehensively examined. The developed models demonstrated strong statistical significance and accurately described the experimental data. Optimization results revealed that the operating parameters exerted a more pronounced influence on membrane performance than fabrication variables. The maximum MR rejection of 96.8457% was achieved at an optimal Bi2WO6/MWCNTs loading of 0.08 wt.%, dye concentration of 112.6 ppm, and operating pressure of 9 bar. Experimental validation confirmed the reliability and predictive capability of the proposed models. In order to provide high-performance membranes with enhanced permeability, antifouling resistance, and dye removal efficiency for useful wastewater treatment applications, this study attempts to optimize the operating and preparation parameters for adding Bi2WO6/MWCNT nanocomposites into PES membranes.
1. Introduction
Freshwater is necessary for all human activities. However, in many regions of the world, water consumption has exceeded their potential for replenishment and assimilation, owing primarily to human activity. As a result, over one billion people do not have recourse to clean water for their fundamental needs [1]. Water pollution is growing as a result of a lack of freshwater supplies and massive streams of industrial effluent and sewage, and this problem has grown into a major concern that endangers humanity and life on the globe [2]. Population expansion, especially in developing countries, manufacturing progress, and economic expansion require the use of safe and sustainable methods to solve this worldwide problem. Industrial treatment of water, which involves removing pollutants and water purification from it, is a necessary and complex process in numerous industries, such as tanning, leather, dyes, medicines, and petrochemicals [3,4]. Around 10–15% of dyes employed in textile manufacturing do not attach to fibers and are released straight into water bodies [5,6].
The basic procedures used in wastewater treatment fall into three categories: biological, chemical, and physical. Chemical procedures include oxidation, coagulation, and photochemical oxidation. Biological techniques, on the other hand, involve the use of successive anaerobic/aerobic cycles. In addition, physical methods include the use of membrane technology [7,8]. Technology for membranes has developed as a great option for purifying wastewater via various sources [9,10]. These membranes have extensive uses for ecological treatment and pollution management due to their excellent features, including better mechanical, thermal, and chemical capabilities, enhanced hydrophilicity, and efficiency in pollutant removal [11,12]. Fouling of membranes substantially impedes many water treatment operations, significantly reducing membrane lifetimes and performance [13,14]. To address this issue, the membrane’s characteristics and efficiency must be modified and optimized. Additives are a viable technique for improving membranes [15]. Hydrophobic membranes can be converted into highly hydrophilic membranes through the addition of inorganic nanoparticles to the membrane, such as ZnO [16], SiO2 [17,18], WO2.89 [19], Ag-SnO2 [20], GO [21], TiO2 [22], and TiO2-GO [23].
Integrating Bi2WO6/MWCNTs has demonstrated tremendous promise in a variety of methods. By combining the high electrical conductivity and large specific surface area of MWCNTs with the photocatalytic activity of Bi2WO6, the Bi2WO6/MWCNTs nanocomposite enhances charge transfer and suppresses electron hole recombination [24]. When mixed with polymer matrices like polyethersulfone, the resultant hybrid nanocomposite improves membrane permeability, fouling resistance, and hydrophilicity. Whereas MWCNTs contribute to increased flux of water and the strength of mechanical, the photocatalytic process promotes the organic contaminants’ breakdown during visible light circumstances. The membranes of PES/Bi2WO6/MWCNTs are a complex and sustainable treatment of water systems that are capable of breaking down contaminants rather than only removing them, according to their dual-action mechanism combining mechanical separation with degradation by photocatalytic means.
Seyed and Amin used a two-level full factorial design (23 FFD) to methodically optimize the operating conditions of an ultrafiltration (UF) process for treating produced water using a PAN350 membrane. The major impacts and interaction effects of three operational parameters—temperature, transmembrane pressure (TMP), and cross-flow velocity (CFV)—on three performance responses permeate—flux, fouling resistance, and total organic carbon (TOC) rejection—were measured concurrently. According to a statistical study, CFV was the most important parameter for TOC rejection, followed by temperature and TMP, whereas TMP was the most important factor for permeate flux and fouling resistance, followed by temperature and CFV. For the various responses, significant two-factor interactions (T–TMP, T–CFV, and TMP–CFV) were found. Tests for model adequacy verified that the predicted and experimental results agreed well. According to the optimization, the PAN350 membrane showed efficient organic removal and industrial applicability at 50 °C, 3.9 bar TMP, and 1.75 m s−1 CFV [25].
Several researchers have developed experiments to improve the membrane regarding parameters involved for dye-laden treatment of wastewater. Shahad et al. investigated the effects of manufacturing and operation on MB rejection and PES/BiFeO3 membrane permeability across all membrane types. The factors analyzed were operation pressure (1 to 4) bar, the content of dye (5–12.5 ppm), and BiFeO3 content (0–0.4 wt.%). Using the created models, the operating variables were additionally improved at the desired removing circumstances [26]. Yusur et al. studied to improve the UF technique. Several parameters were studied, including pressure (1–5 bar), dye level (100–300 ppm), and concentration of green propolis (bee glue) nanoparticles (PRS-NP) (0–88 mg). Optimizing studies demonstrated that PES/PRS Mix Matrix Membranes (MMMs) were very effective, with a dye removal efficiency of 99.8% and a flux of 48.44 kg/m2 h, at a PRS amount of 64.43 mg, a working pressure of 5 bar, and CR (Congo Red) dye feed levels of 210.08 ppm [27].
In current work, response surface methodology (RSM) based on a central composite design (CCD) was employed to optimize the key operational parameters governing methyl red (MR) dye removal during membrane filtration. Analysis of Variance (ANOVA) (version 7.0) was applied to evaluate the statistical significance of individual variables and their interaction effects. The optimization focused on Bi2WO6/MWCNTs loading (0–0.1 wt.%), MR dye concentration (50–150 ppm), and operating pressure (5–9 bar), with experimental design and data analysis performed using Design-Expert® software (version 7.0). The influence of these parameters on membrane performance was assessed in terms of MR rejection efficiency and permeate flux. Furthermore, the interactive effects among operating variables were systematically analyzed to identify optimal conditions for enhancing the separation efficiency of PES/Bi2WO6/MWCNTs nanocomposite membranes.
2. Materials and Methods
2.1. Materials
Dimethylacetamide (DMAc) was supplied from BASF Company (Ludwigshafen, Germany), and Solvay Advanced Polymers of Belgium supplied polyethersulfone (MW = 30,000 g/mol). Hydrochloric acid (HCl) was provided by Thermo Fisher (Budapest, Hungary). Sigma-Aldrich (Taufkirchen, Germany) ordered cobalt nitrate and ammonium heptamolybdate. ACS Chemicals Ltd. (Mumbai, India) delivered nitric acid (HNO3). The (MR) methyl red dye (λ-max = 497 nm; MW = 696.6 g/mol) was an anionic organic molecule manufactured in India.
2.2. Synthesis of Multi-Walled Carbon Nanotubes (MWCNTs)
Multi-walled carbon nanotubes (MWCNTs) were synthesized using the chemical vapor deposition (CVD) method. Briefly, a cobalt/molybdenum (Co/Mo) nanocomposite catalyst was prepared using cobalt nitrate and ammonium heptamolybdate precursors and subsequently deposited onto alumina particles, as described in our previous work [28]. The as-prepared catalyst was placed in a stainless-steel mesh container and positioned inside a quartz tube CVD reactor. The furnace was heated at a rate of 10 °C min−1 under a continuous argon flow of 500 mL min−1 until the temperature reached 700 °C. Subsequently, acetylene gas was introduced at a flow rate of 50 mL min−1 for 1 h to initiate CNT growth. After the reaction, the acetylene flow was stopped while the argon flow was maintained until the system cooled to room temperature. The obtained MWCNTs were thermally purified at 400 °C for 1 h to remove amorphous carbon. Afterwards, the product was treated with 6 M HCl under ultrasonic bath assistance to remove residual metal catalyst particles. Finally, the purified MWCNTs were dried in air for 24 h.
2.3. Preparation of Bi2WO6/MWCNTs Nanocomposite
MWCNTs and Bi2WO6 nanocomposite, as described in our previously published article [29]. In brief, MWCNTs were manufactured via the chemical vapor deposition (CVD) approach. Ammonium heptamolybdate and cobalt nitrate were employed as precursors for obtaining molybdenum and cobalt, then subsequently deposited onto alumina. The composite of Co/Mo/Al2O3 was put in a mesh holder before being introduced into a quartz CVD tube with acetylene for 1 h using a constant argon environment. The final product underwent purification and functionalization using hydrochloric and nitric acids, respectively. Bi2WO6/MWCNTs nanocomposite was made by calculating the amounts of Na2WO4⋅2H2O and Bi (NO3)3⋅5H2O that had to dissolve in water that was distilled and a solution of acetic acid, respectively. Purified MWCNTs were incorporated into solution B around 30 min while continuously stirring; solution A was dropped into suspension B. The suspension’s pH was then balanced to 10 utilizing a 2.5 M NaOH solution. The product was next moved into an autoclave lined with Teflon for 24 h at 200 °C. The resulting substance was rinsed using ethanol and distilled water before drying at 75 °C overnight. The ultimate Bi2WO6/MWCNT nanocomposite weight ratio was 90/10%.
2.4. Fabrication of (PES/Bi2WO6/MWCNTs) Ultrafiltration Membranes
PES/Bi2WO6/MWCNTs asymmetric membranes for the ultrafiltration system were constructed utilizing the traditional (NIPS) non-solvent-induced phase separation, as described in our earlier article [30]. In brief, a doping solution using (20 wt.%) PES and an appropriate amount of Bi2WO6/MWCNTs nanocomposite using DMAc as a solvent. To make the solution, a particular quantity of Bi2WO6/MWCNTs was added in the solvent. For 30 min, the mixture was sonicated to ensure appropriate dispersal. Table 1 shows the membrane casting content. Bi2WO6/MWCNTs were completely crushed and disappeared for two hours in DMAc. Then PES was introduced into the earlier mixture and physically stirred around for approximately 24 h. Following removal of bubbles, the casting mixture was evenly distributed at a specified thickness of 200 μm over the glass plate utilizing an automatic coating applicator. The plates for casting were immersed at 25 ± 5 °C in distilled water. To eliminate any remaining solvent, the membranes were thoroughly cleansed and immersed in distilled water over 48 h [30].
Table 1.
Membrane composition.
2.5. Evaluation of Membrane Performance
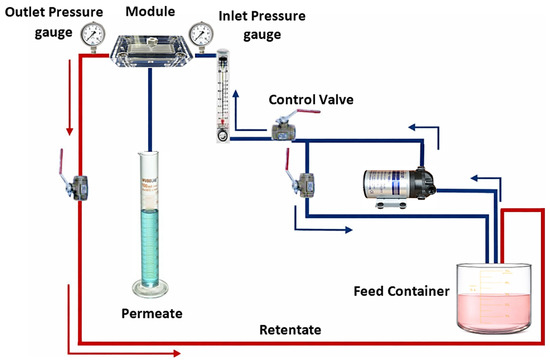
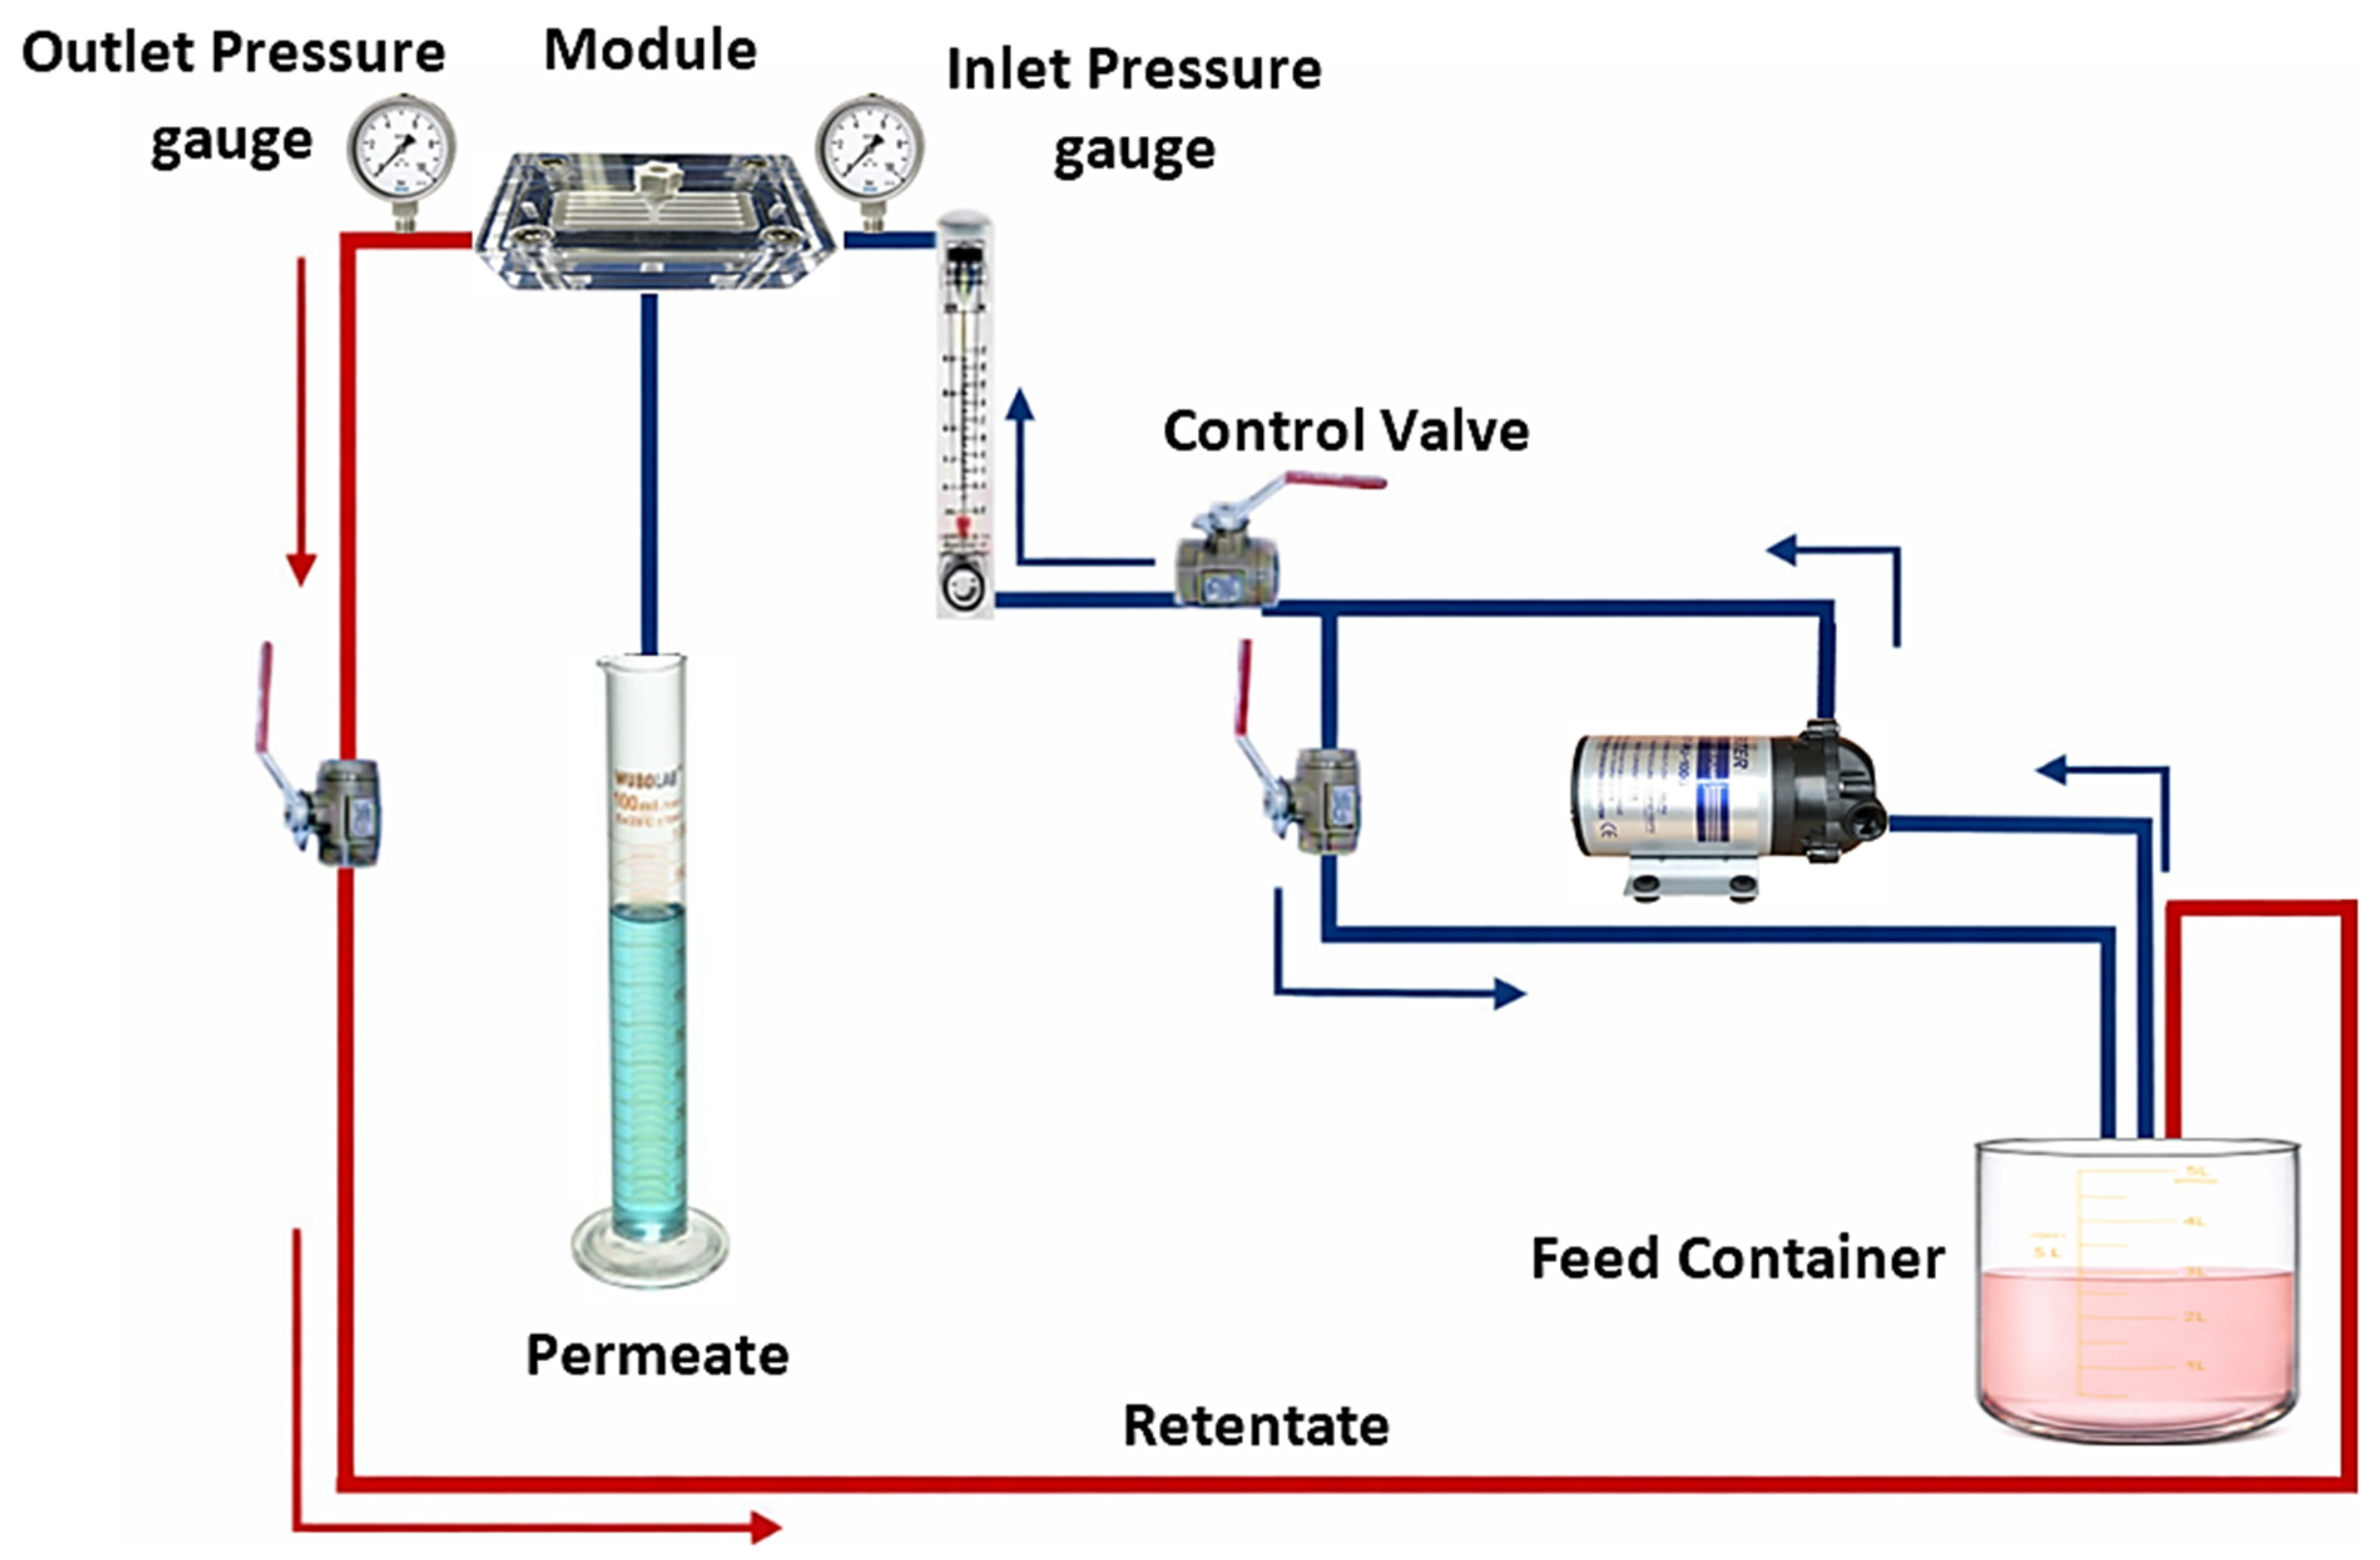
Scheme 1 shows a cross-flow system of purifying having an efficient surface area of 24 cm2 that was utilized for testing the effectiveness of membranes during ambient temperature. The permeate performance of the membrane was investigated employing PWF tests and MR solution purification at levels of 50, 100, and 150 ppm. The (J) flux of permeate was determined utilizing Equation (1) [30]:
Scheme 1.
A diagram representation of the UF setup.
Q: the permeate volume obtained (m3) over time (t), while the membrane effective area (0.002 m2).
The MR dye solution rejection was estimated using Equation (2):
where Cp and Cf are the levels of permeate and solution of dye, respectively.
3. Design of Experimental
A statistical and mathematical methodology was employed using Response Surface Methodology (RSM) to design the experimental setup. The Central Composite Design (CCD) was selected for its ability to effectively fit second-order (quadratic) equations and to study both the linear and interaction effects of factors over a wide range of values. Additionally, CCD includes axial (star) points, allowing for a more detailed analysis of variable conditions [31]. This proved especially useful for evaluating and improving the impact of the level of MR dye, operating pressure, and Bi2WO6/MWCNTs content on the membrane performance.
The RSM design is used to assess how various operating conditions affect the response. Furthermore, compared to a full factorial experimental design of a comparable level, RSM has the benefit of requiring fewer experimental runs. Furthermore, the final goal of RSM was to find the region that meets the requirements of operation or the optimal operational conditions of the system. RSM significantly reduces the costs of material and time when in comparison with the “one factor at a time” technique [32]. The analyses were performed using Design-Expert® Software (version 7.0). To assess the impact they have on membrane flux and removal proportion, the present work concentrated on improving different operation variables, such as MR dye content (50 to 150 ppm), operating pressure (5 to 9 bar), and Bi2WO6/MWCNTs level (0 to 0.1 wt.%). Furthermore, the study examined various operation factors that interacted to influence the outcome. Table 2 shows the results of the experiment and parameter values. To identify the essential parameters for operation, a series of experiments were performed utilizing the ultrafiltration membrane method, all of them modifying just one factor and keeping the other variables constant.
Table 2.
Codes and the variable levels.
The goal of the technique of optimization called response surface methodology was designed to evaluate the effect of various variables (predictors) on the flow and rejection percentage operation. Table 3 provides details for the 20 runs on the historical information. The information supplied is used as design points in order to estimate and optimize dye flux and rejection. Historical-data RSM design has the advantage of allowing users to identify the points of design employing any or all of the factors of trial information. Unlike various forms of RSM designs, historical data design allows for an infinite number of design features [33].
Table 3.
Experimental points of information and responses.
4. Results and Discussion
4.1. Performance of Membrane
The pure water flux (PWF) of all PES/Bi2WO6/MWCNTs nanocomposite membranes was consistently higher than that of the pristine PES membrane. The incorporation of nanoparticles significantly enhanced membrane permeability, even at low Bi2WO6/MWCNT loadings. This improvement in flux can be attributed to increased membrane hydrophilicity and modifications in pore structure induced by the presence of the nanofillers, which facilitated water transport across the membrane. The results indicate that the pure water flux (PWF) increased significantly with the incorporation of Bi2WO6/MWCNTs into the membrane matrix. Specifically, the flux rose from 20.42 L·m−2·h−1 for the unmodified membrane to a maximum value of 65.5 L·m−2·h−1 for the modified membrane. As discussed previously, this improvement in water flux is consistent with the enhanced hydrophilicity, as well as the increased pore size and porosity of the fabricated membranes. After adding 0.1% Bi2WO6/MWCNTs, the pure water flux decreased. High Bi2WO6/MWCNTs content led to pore blockage, resulting in lower pure water flux [34].
4.2. Regression Analysis, ANOVA, and the Plot of Fitted Response
The tests of ANOVA were conducted utilizing Design-Expert®. As demonstrated in Table 4 and Table 5, the outcomes of ANOVA results of flux and rejection (%) are based on Bi2WO6/MWCNTs wt.%, MR dye levels, and operating pressure variables. The findings of the table of ANOVA contain a specific p-value for every factor that was predicted in the design configuration. The results obtained have been utilized to predict the formulas of mathematics. Equations (3) and (4) show the regression relationships between membrane flow and rejection (%) as an expression of the actual parameters.
where the MR dye content (ppm) is A, the Bi2WO6/MWCNTs weight percentage is B, and the operating pressure (bar) is C.
Flux = +17.02807 − 0.017898 × A + 1164.43864 × B − 2.57943 × C − 0.51500 × A × B − 1.37500 × 10⁻³ × A × C + 16.37500 × B × C − 4.36364 × 10⁻⁵ × A2 − 8203.63636 × B2 + 0.36023 × C2
Rejection = +78.83205 + 0.10092 × A + 431.95909 × B − 0.79795 × C − 0.050000 × A × B − 1.50000 × 10⁻³ × A × C + 18.25000 × B × C − 2.79091E−004 × A2 − 3569.09091 × B2 − 0.068182 × C2
Table 4.
Statistical analysis (ANOVA) for flux of membrane.
Table 5.
Statistical analysis (ANOVA) for membrane rejection.
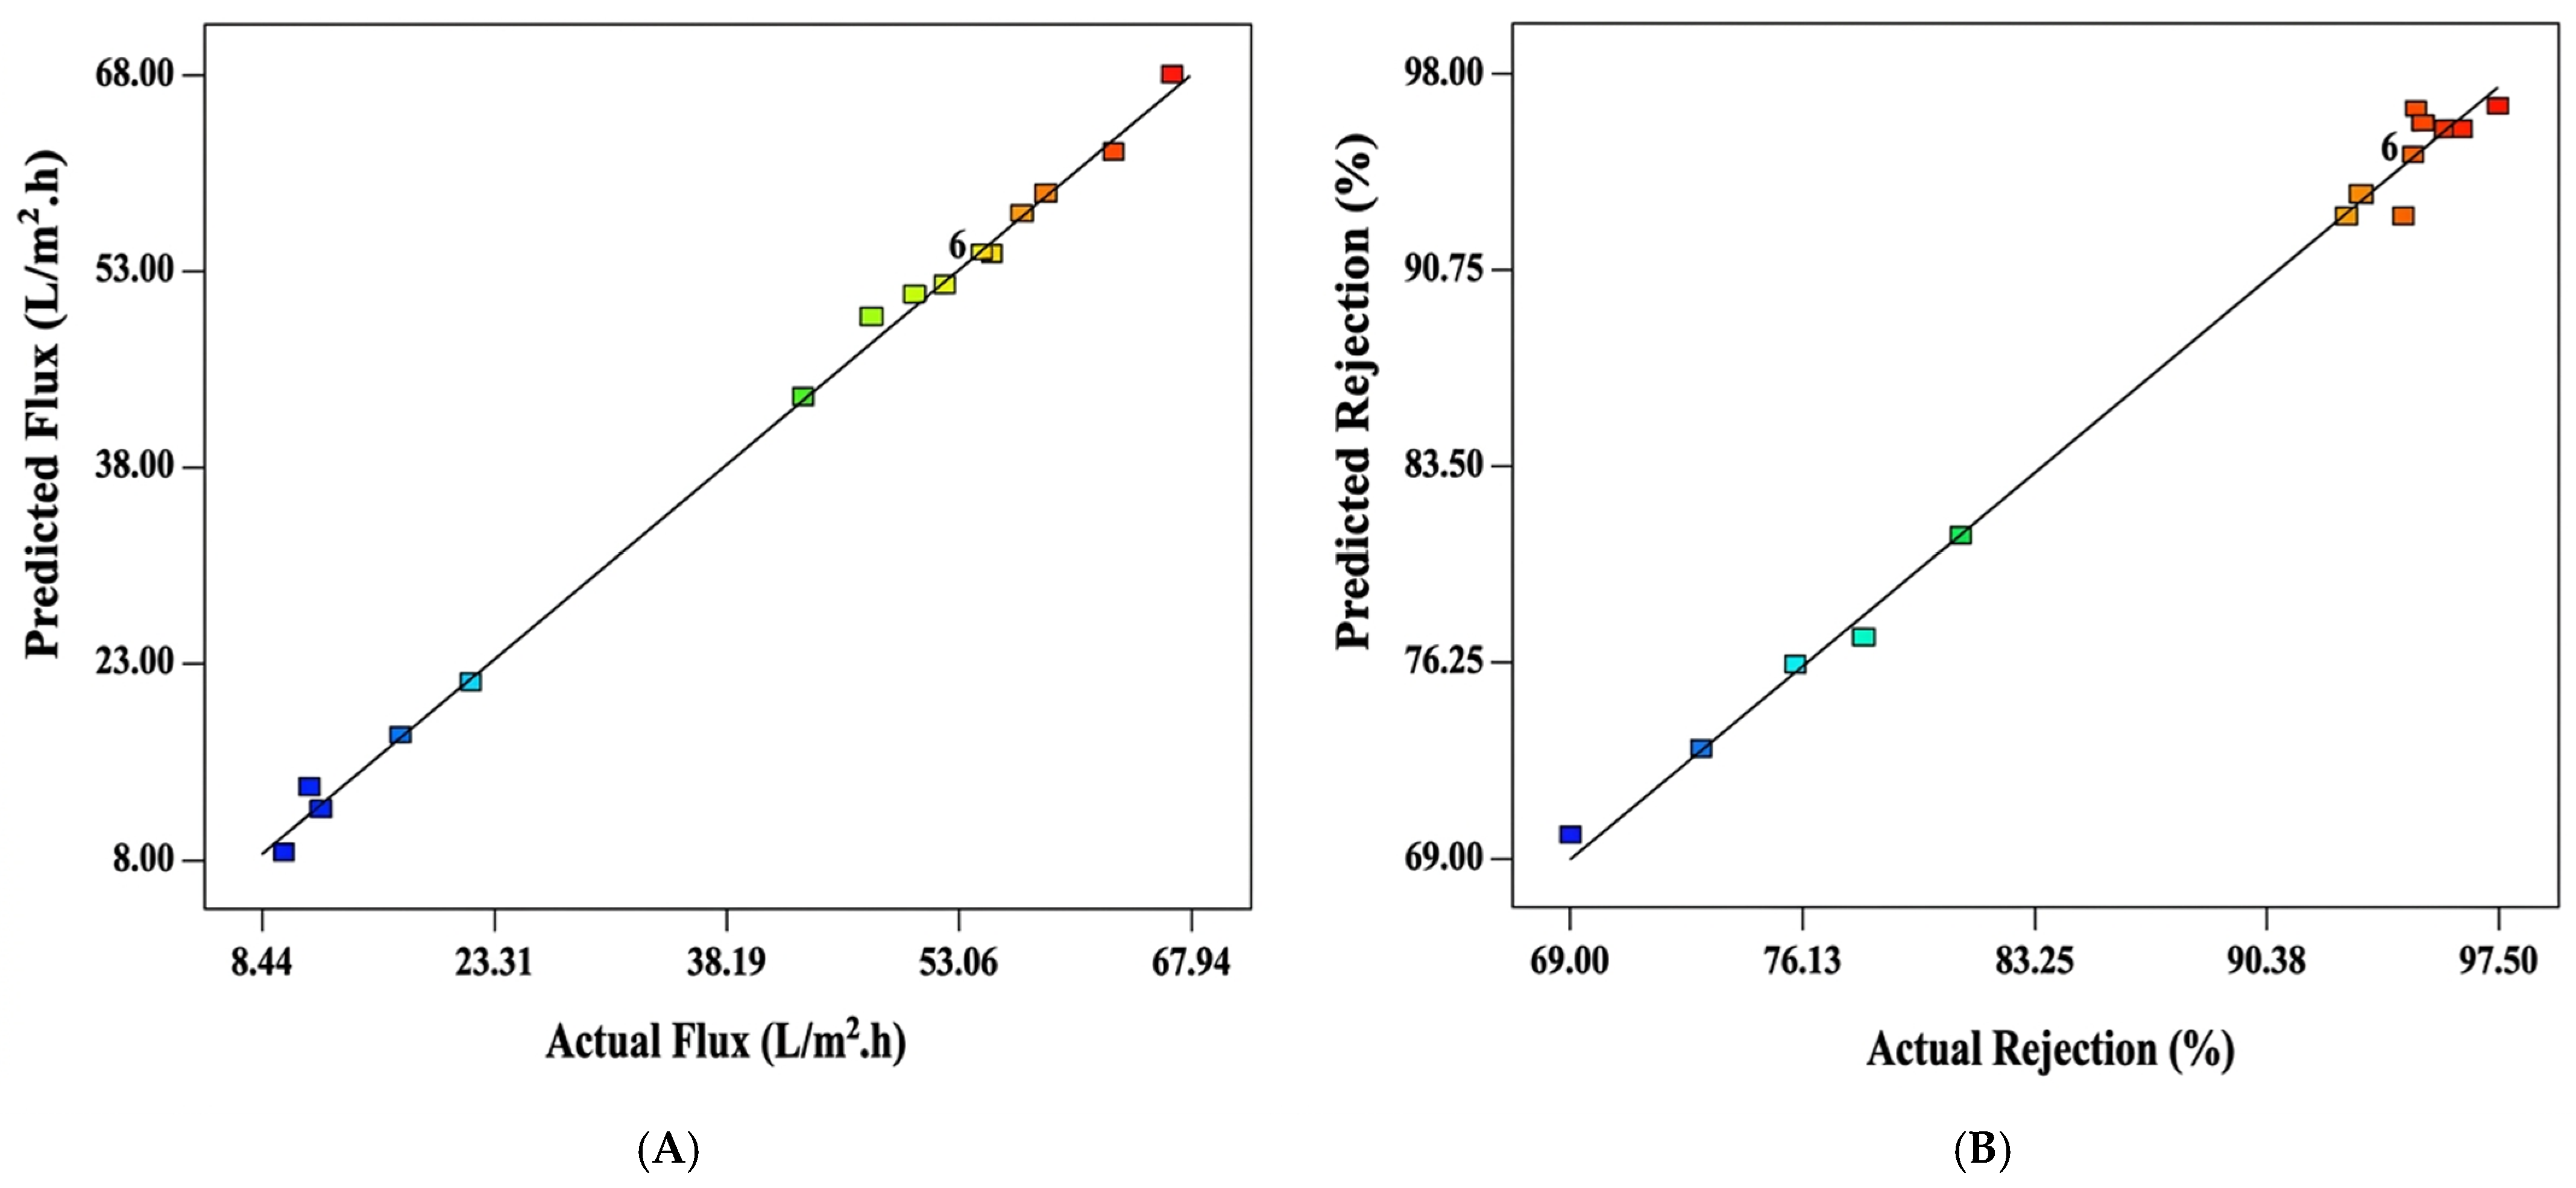
In Equation (3), negative variable items reflect their adverse effect upon the flow, whilst positive variable items show the positive effect they have. A positive indicator within the variable component of the fourth equation implies an advantageous effect, whereas a sign that is negative shows a negative effect with regard to removal. The flow and removal percentage equations obtained a coefficient of correlation R-squared value of 99.77% and 99.37%, respectively. Additionally, the values of Adjusted R-squared (Adj. R2) were 98.81% and 99.56%, respectively. It exhibited an appropriate increase and strong agreement via the values of R2. The findings show both the flow and removal equations are valid in statistical terms and can accurately predict the efficiency of the ultrafiltration membrane. The regression analysis findings reveal that the rejection (%) and permeate flux models accurately and precisely fit the experimental data [35].
In addition, Table 4 and Table 5 indicate that the value of the predicted R-squared (Pred. R2) correlation coefficient for each model is in close agreement with the (adj.—R2) correlation value.
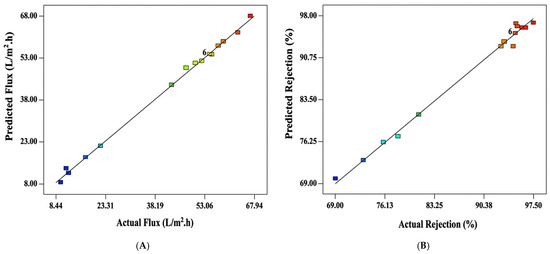
The Design-Expert® software (version 7.0) used a linear regression function to predict the flux and rejection%. Figure 1A illustrates the predicted and actual data of the flow and removal of MR dye%. As illustrated in Figure 1B, the flux of membrane and removal percentage of actual and predicted levels are strongly mathematically agreed. The previously mentioned result and the large R2 (99.77% and 99.37% for permeate flux and rate of rejection) for the membrane, the finding demonstrates the significant potential of the model to predict and optimize flow and removal % [36].
Figure 1.
Predicted and actual data of the (A) the flux of membrane and (B) rejection %.
4.3. Main Effects Plot
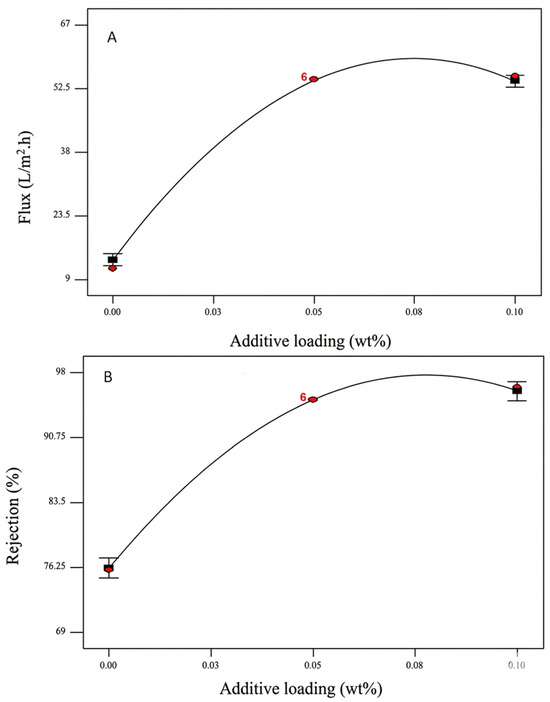
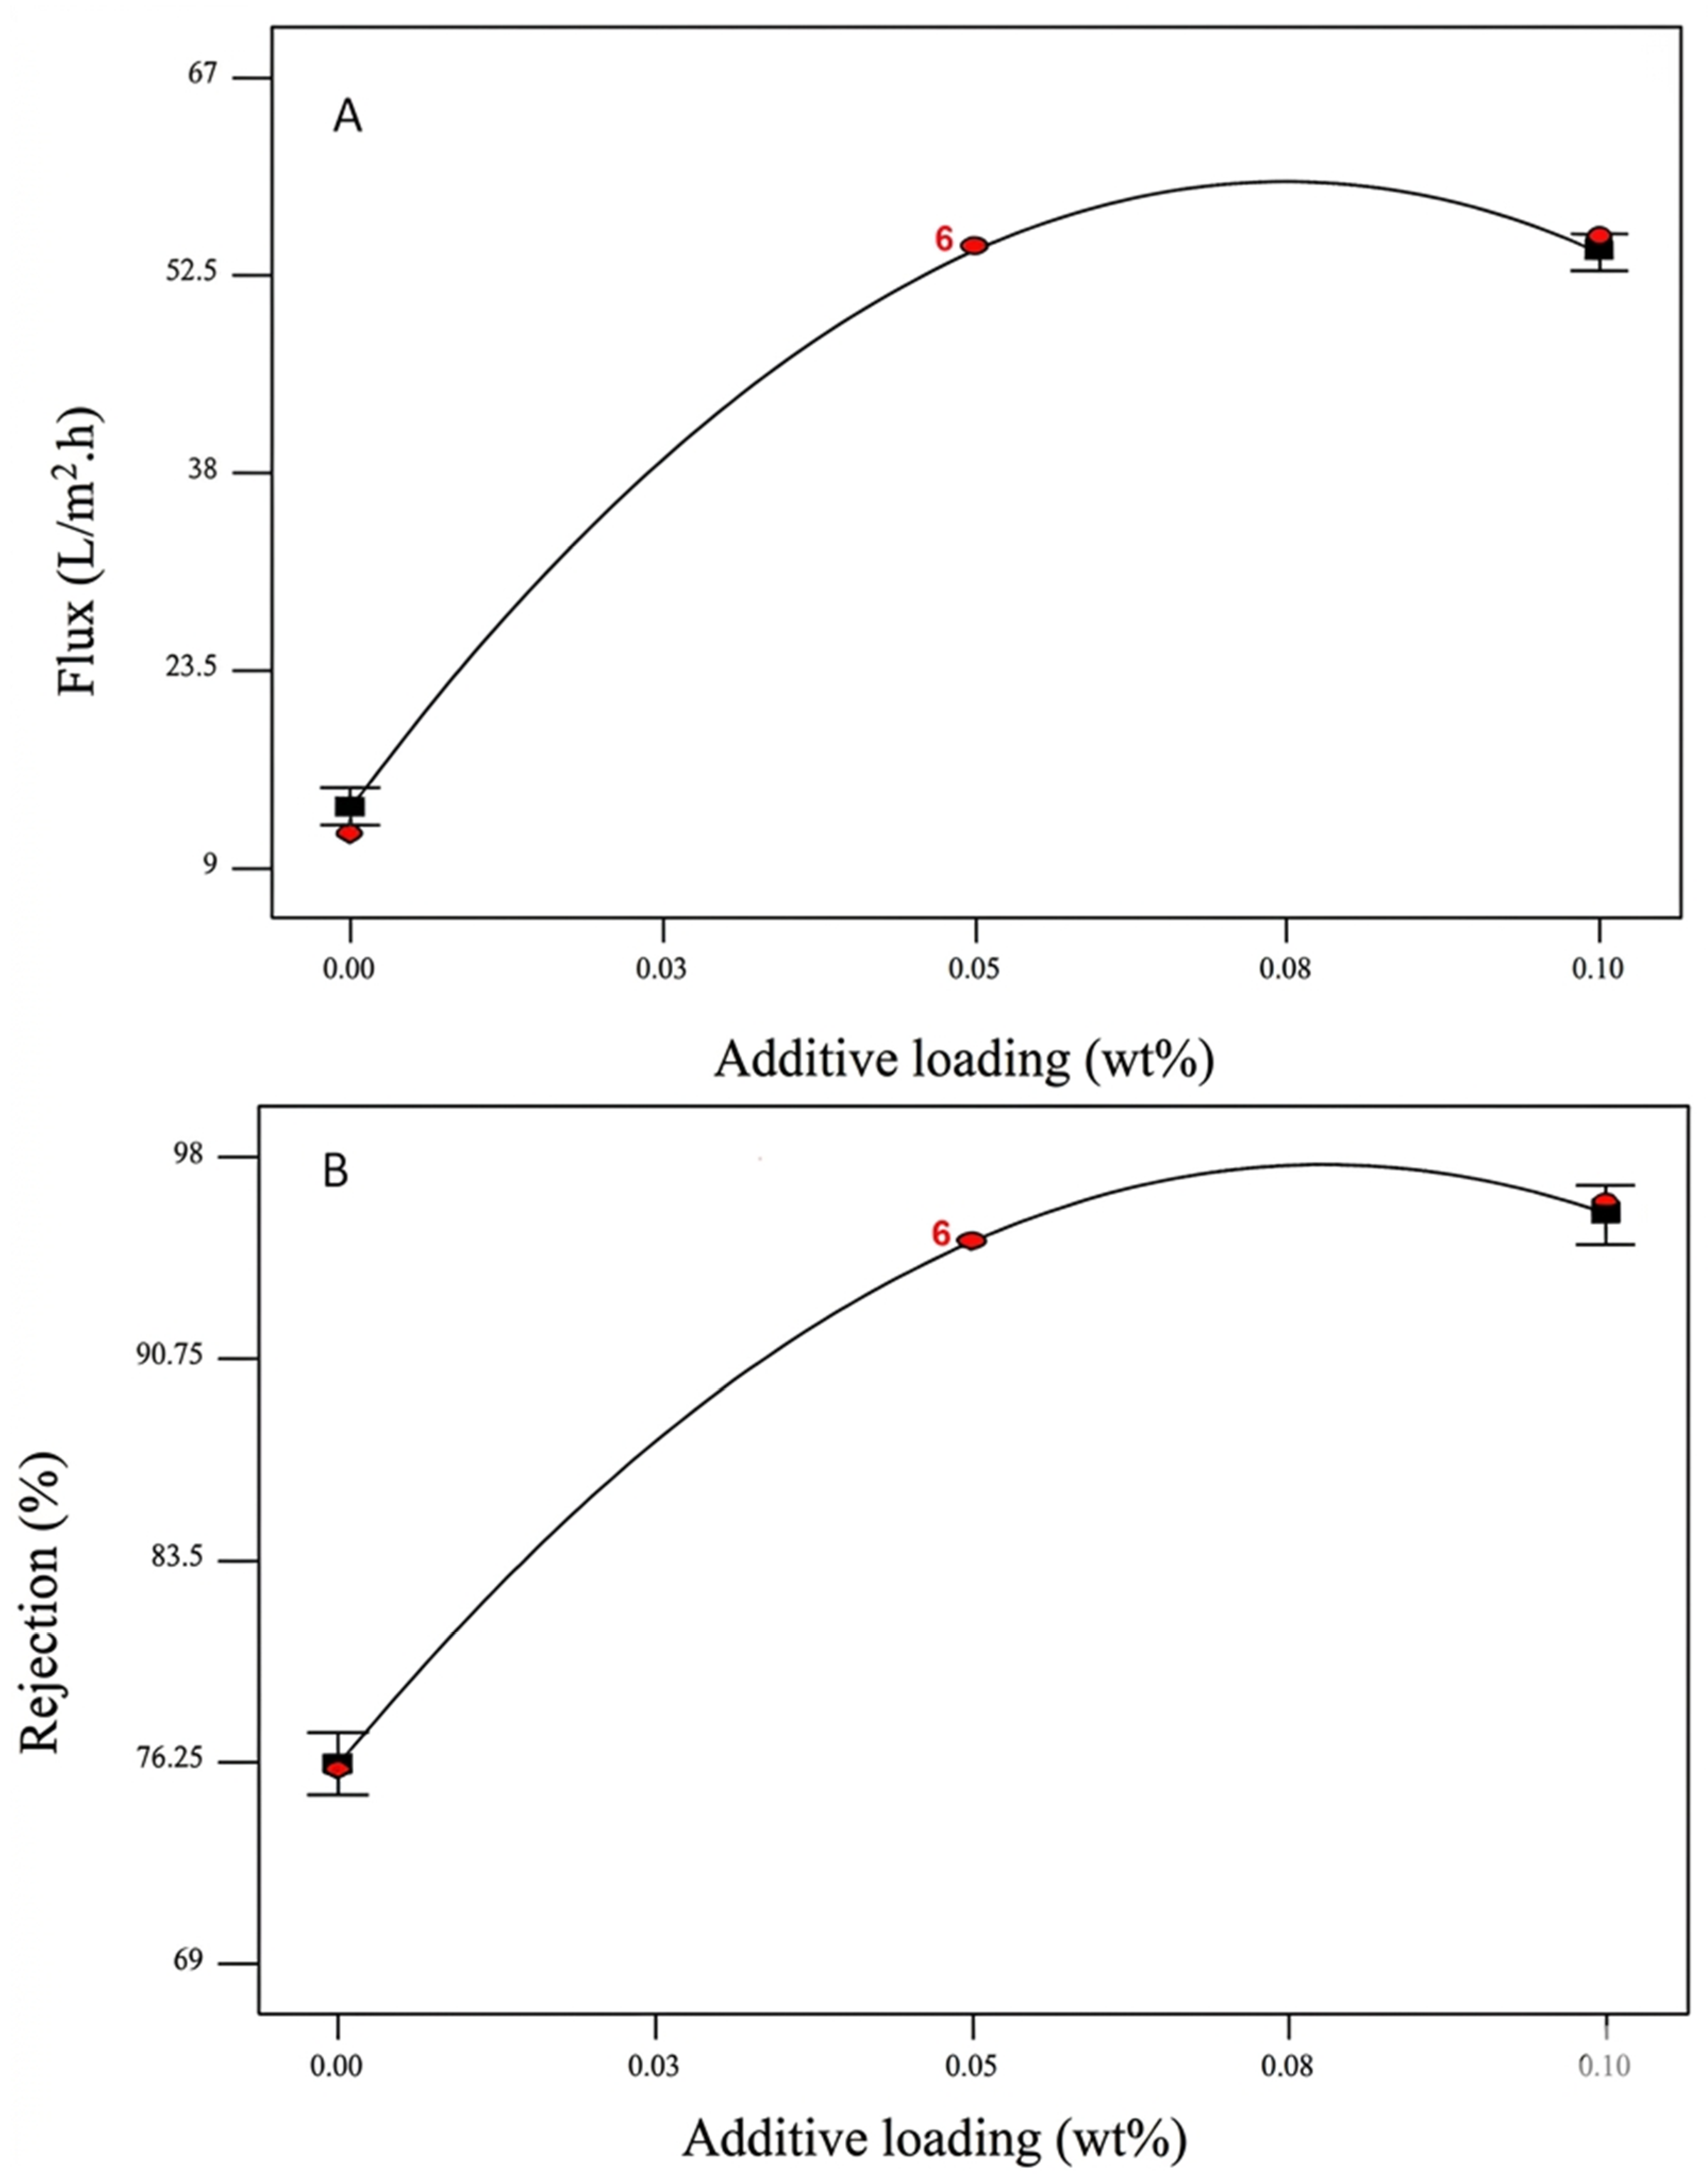
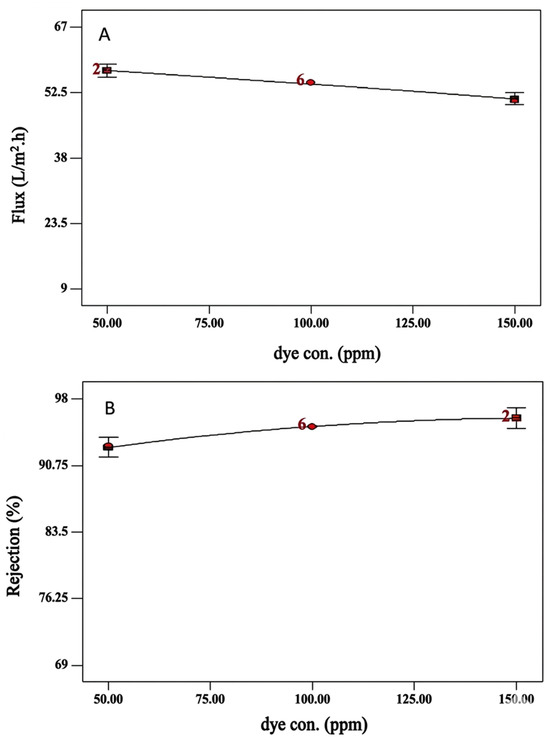
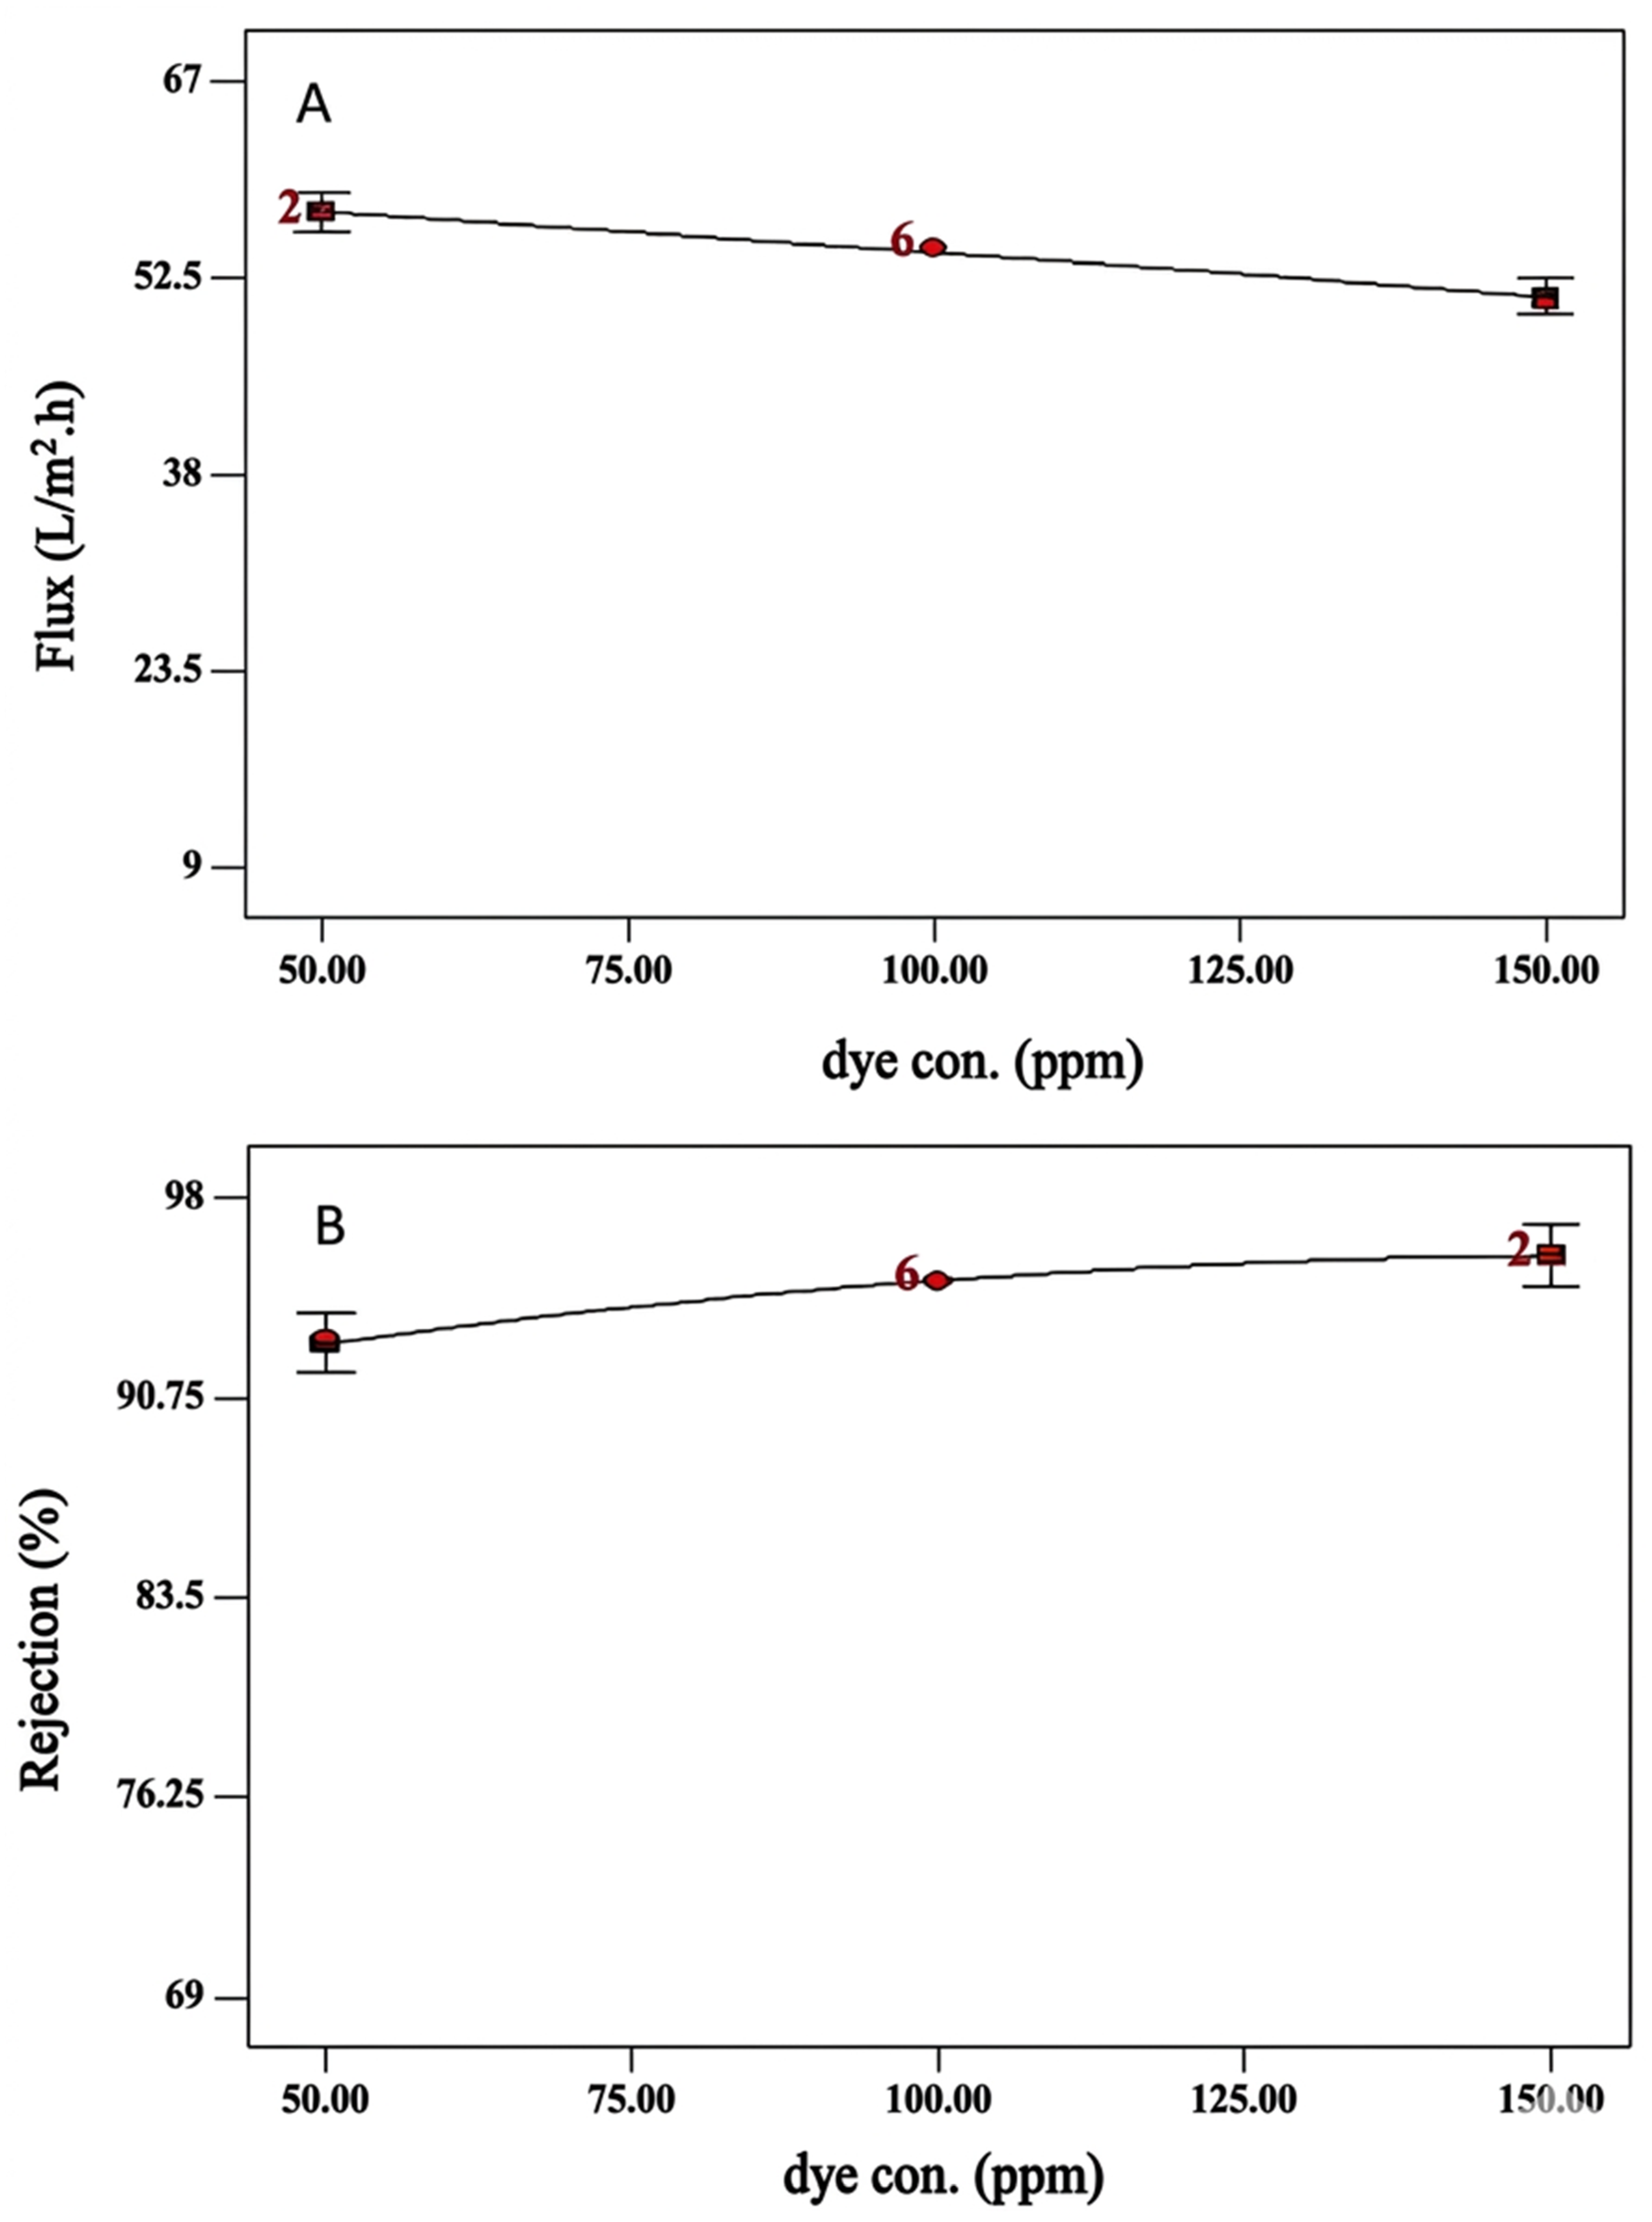
Figure 2, Figure 3 and Figure 4 demonstrate the way Design-Expert® software analyzes the influence of the test settings and the way they interact. The effect of the variable was explored by changing a single factor while leaving the others unchanged. A slope of zero indicates that the parameter has a negligible influence as the parameter is changed through (low to high) levels. Nevertheless, in the response, the one slope indicates that the parameter provides a positive influence.
Figure 2.
With a fixed dye content of 100 ppm and a pressure of 7 bar, the additive loading impacts (A) flow and (B) rejection percentage.
Figure 3.
With a fixed pressure of 7 bar and an additive loading of 0.05 weight percent, the dye concentration (ppm) affects (A) flow and (B) rejection percentage.
Figure 4.
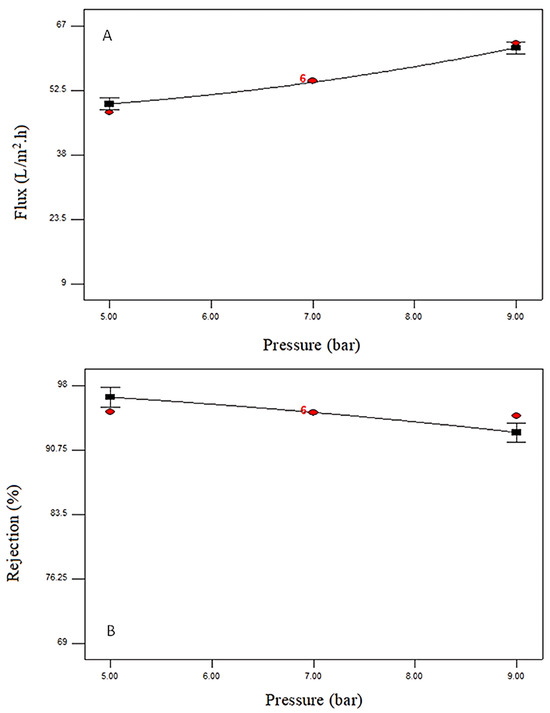
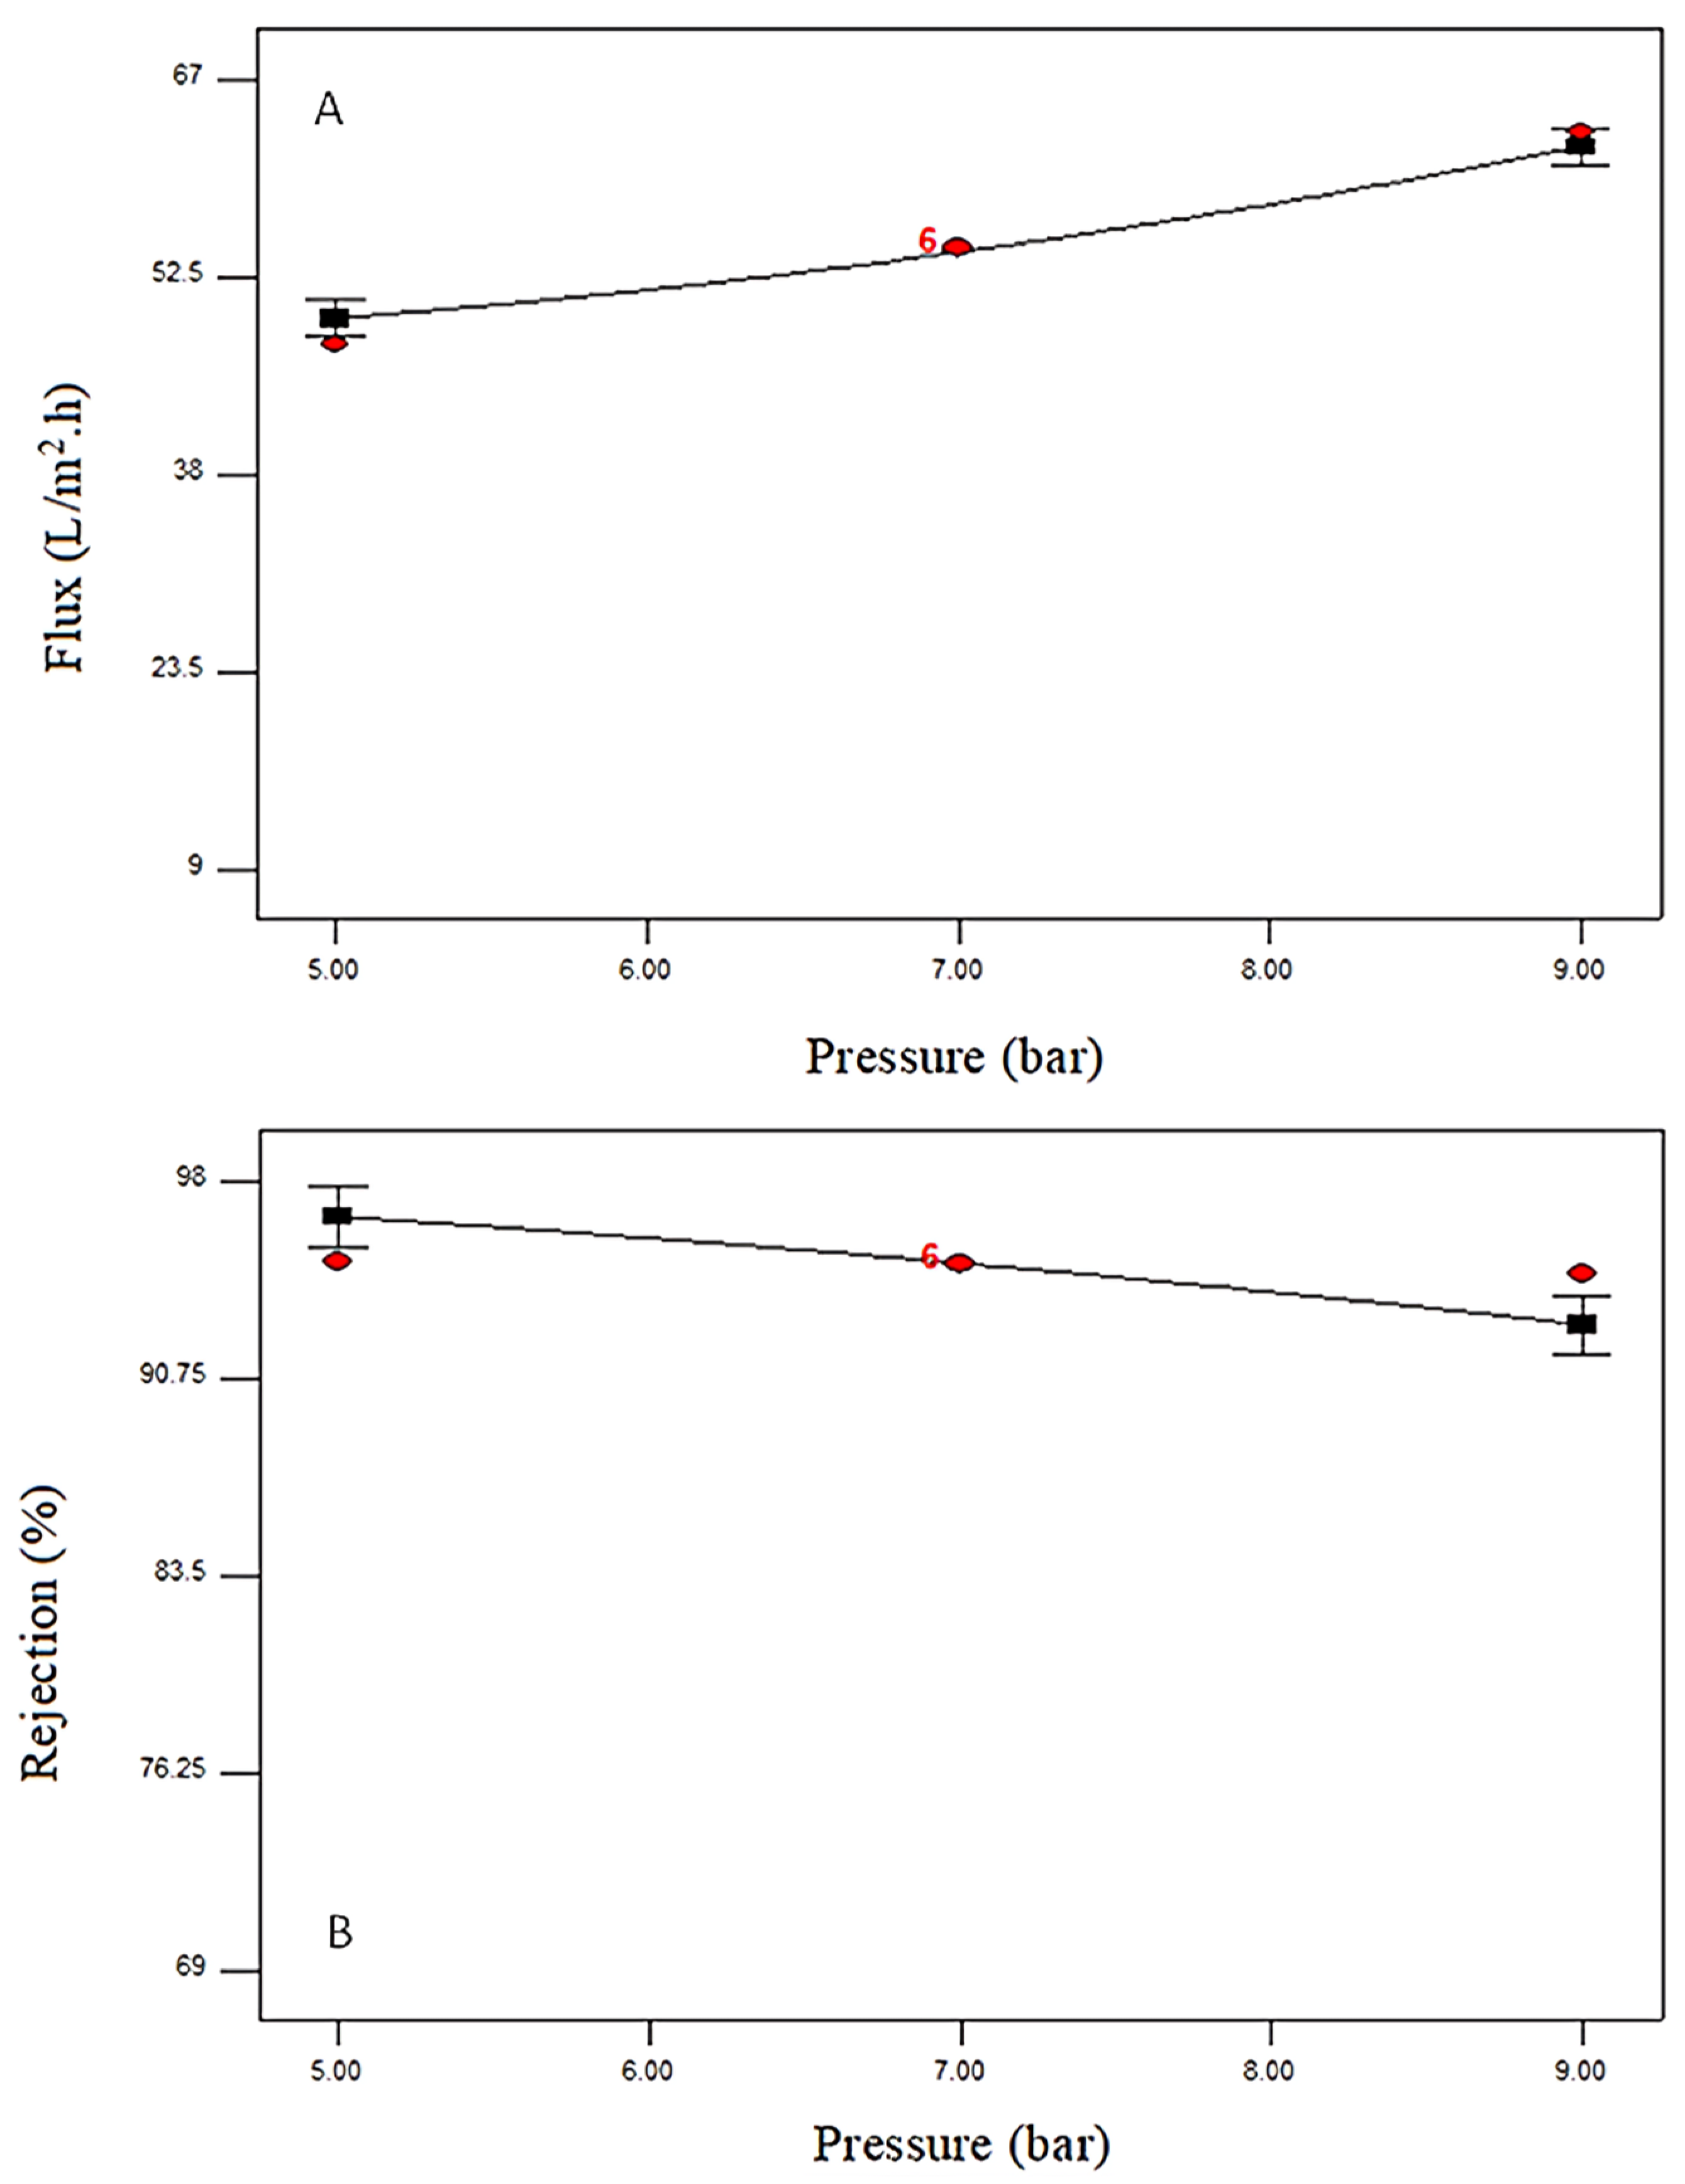
With a fixed concentration of 100 ppm and an additional loading of 0.05 weight percent, the pressure influences (A) flux and (B) rejection %.
Figure 2A shows how the flow rose when the load of additive rose with 0.05 wt.%. The porosity of the membrane, hydrophilic properties, and average pore size were enhanced via raising the amount of Bi2WO6/MWCNTs during the casting of PES solutions. As the amount of additive was raised to 0.1 wt.%, the flux decreased due to the agglomeration of Bi2WO6/MWCNTs on the membrane surface, leading to a decrease in porosity, hydrophilicity, and pore size [37]. In addition, the effect of loading content on the flux and rejection % of the membrane is shown in Figure 2B., which demonstrates the influence of an unchanged MR dye level at 100 ppm and a pressure of 7 bar. The rejection % of MR dye of membranes increased as the loading content rose to 0.1 wt.%. This propensity could be linked to hydrophilic Bi2WO6/MWCNTs, which increase the hydrophilic properties of the surface of the membrane [38,39].
Figure 3A,B demonstrate the connection between flow and rejection (%) of membranes having an unchanged operating pressure of 7 bar and a 0.05 wt.% loading content. The flow reduced when the dye content rose from (50–150 ppm). The flux reduced because dye molecules accumulated upon the membrane surface. Furthermore, the membrane rejection rate (%) grew when the content of dye increased between (50 and 150) ppm. The presence of molecules of dye can lead to the creation of a thin, dense layer across the surface of the membrane, increasing the total rejection rate [40].
At a fixed MR dye feed concentration of (100 ppm) and an additive amount of 0.05 weight percent, Figure 4A,B illustrate how changing the pressure from 5 to 9 bars affects the flux and percentage rejection of the membrane. When the pressure increased from 5–9 bar, flux increased. Flux and the pressure difference across the membrane are directly related in the diffusion and solution model. However, as the pressure rose from 5–9 bar, the membrane’s rejection percentage slightly dropped [41,42].
4.4. Influence of Pressure, Feed MR Dye Concentration of, and Bi2WO6/MWCNTs Loading Content upon Membrane Flux and Rejection %
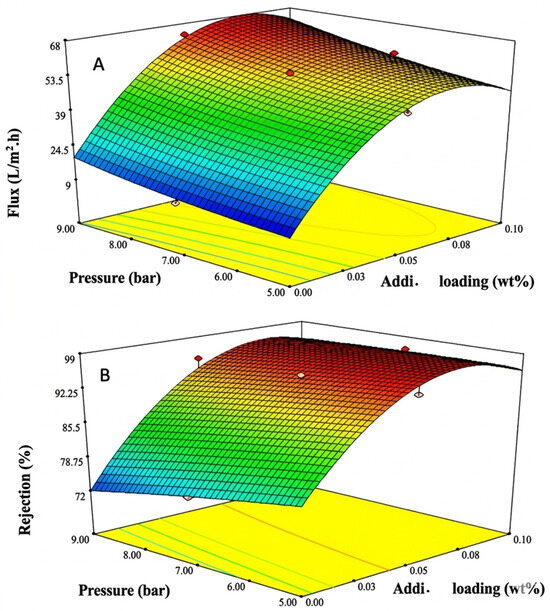
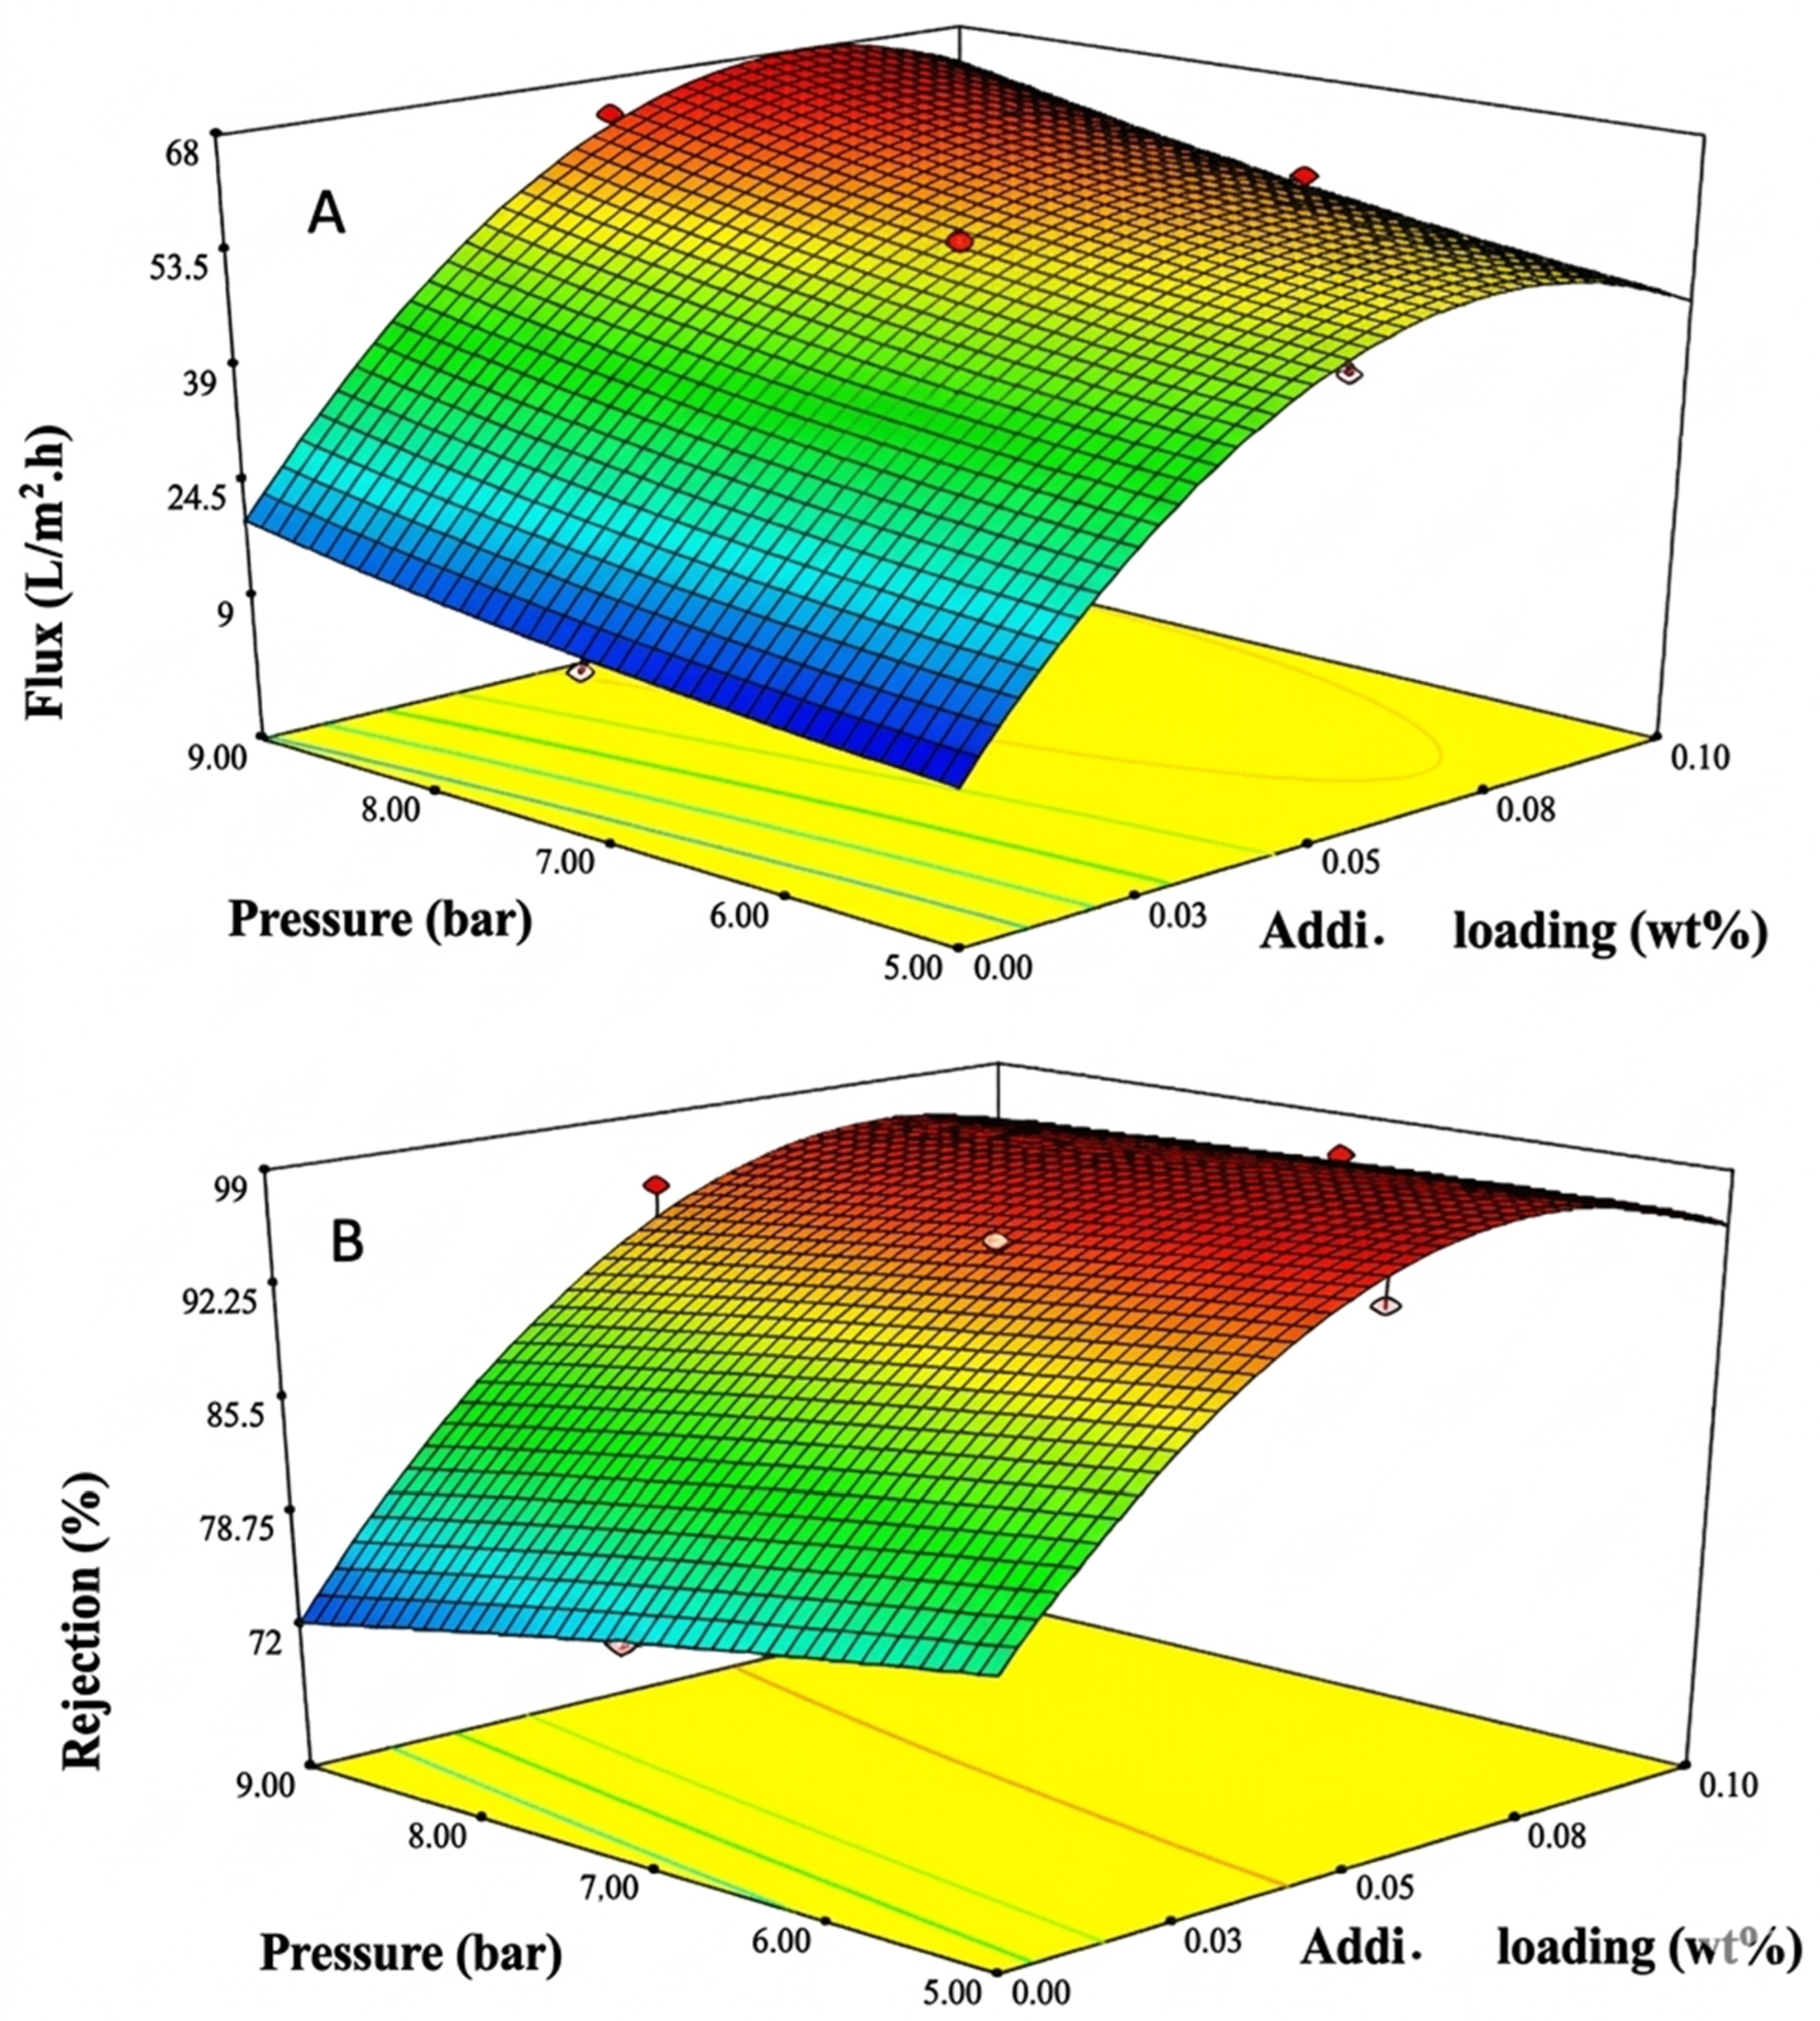
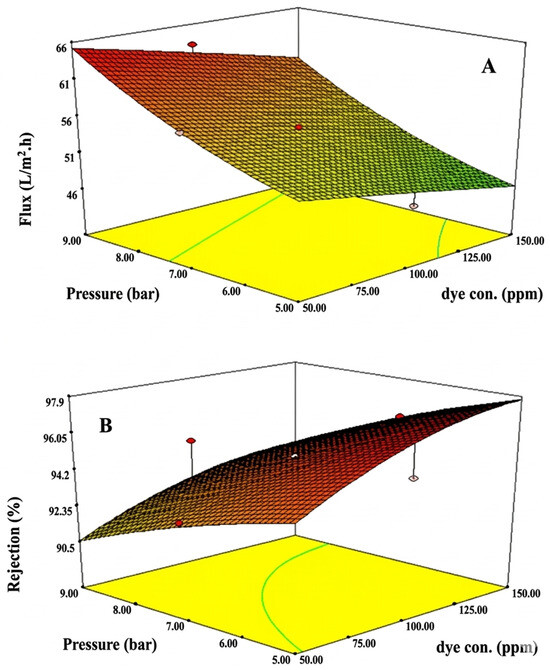
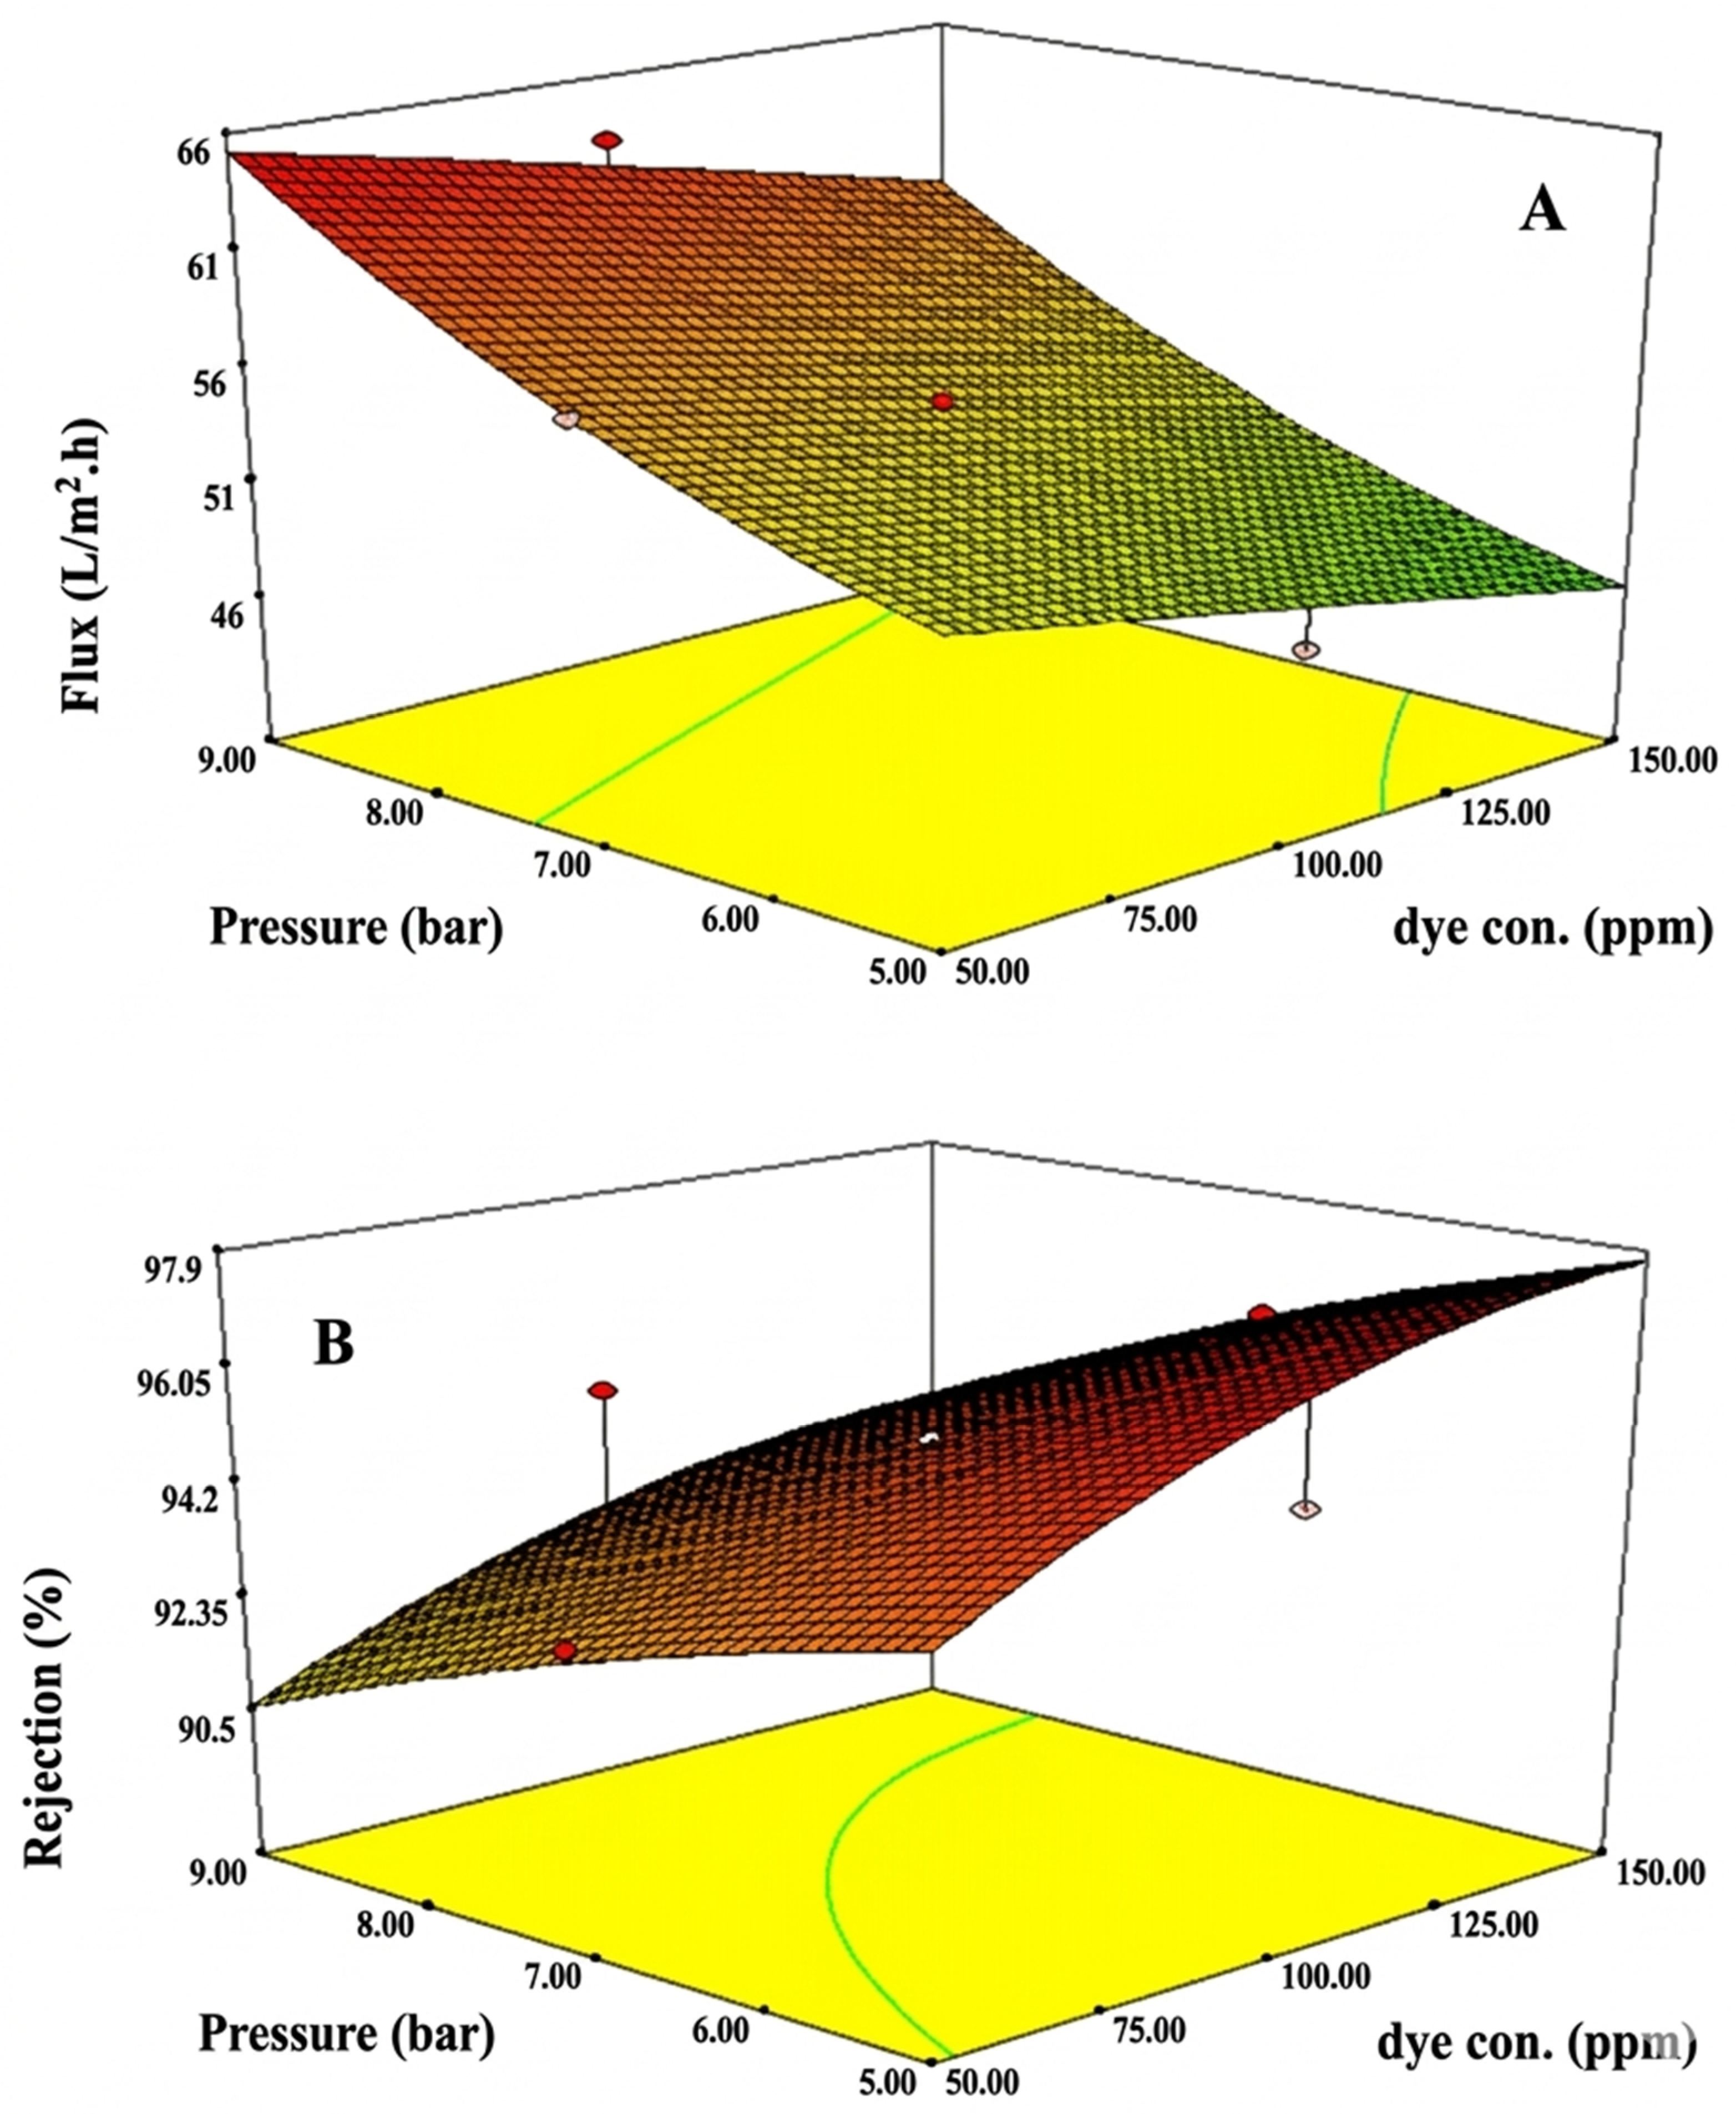
A three-dimensional solid can be used to display the dye solution flux and rejection %. Figure 5, Figure 6 and Figure 7 display the MR dye rejection percentage and permeate flux with the two factors. The response plot’s main objective is to determine the optimum operating factors that can be represented through the additive’s content (wt.%), dye level, and pressure, leading to the highest permeate flux and the percentage of dye rejection.
Figure 5.
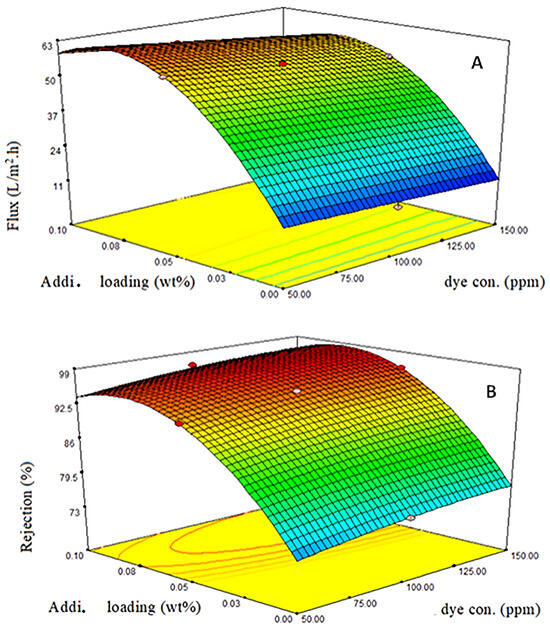
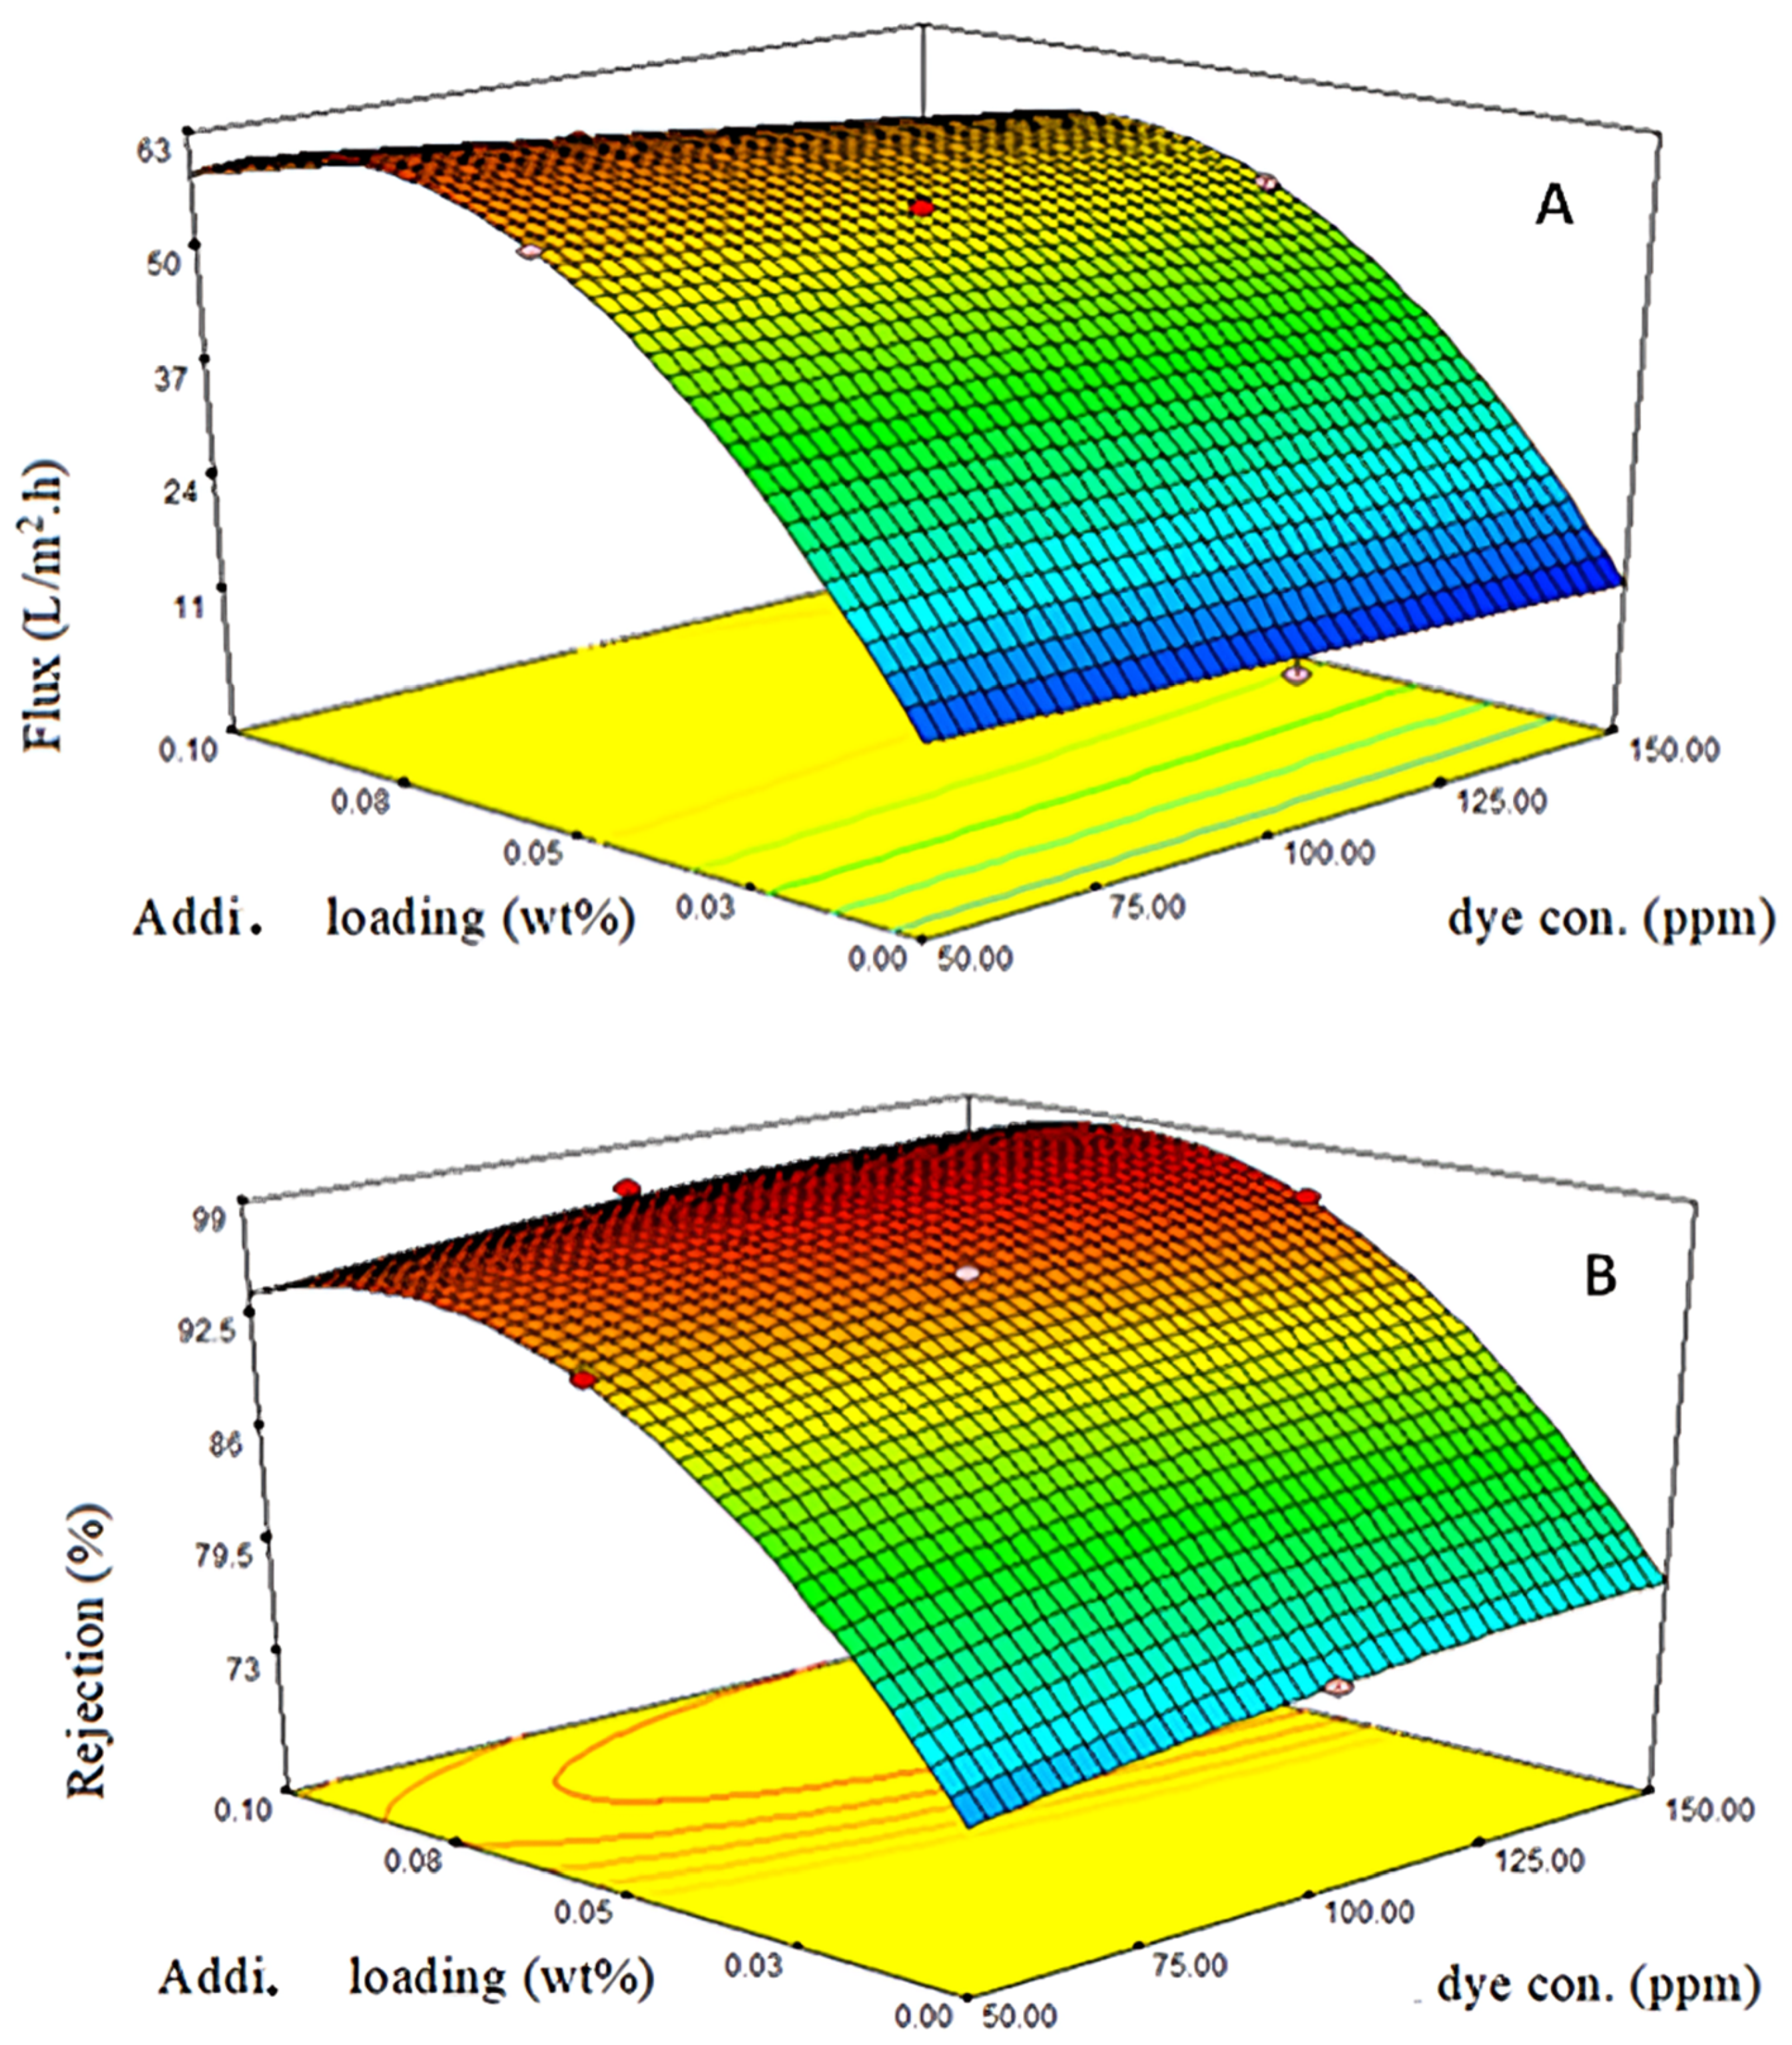
The effects of additive content and feed dye concentration on (A) flow and (B) rejection (%) at seven bars of pressure.
Figure 6.
Impact of additives and pressure on (A) flow and (B) rejection (%) at 100 ppm concentration.
Figure 7.
Dye concentration and operating pressure have an impact on (A) flux and (B) rejection (%) with an additive content of 0.05 weight percent.
Figure 5A shows a response surface diagram of the permeate flux at constant pressure that shows the impact of the dye content and additive concentration. It was demonstrated that increasing the additive content to 0.05 and 0.1 weight percent and decreasing the dye concentration will increase the permeate flux response. Raising the amount of Bi2WO6/MWCNTs in the PES dope solution improved the porosity of the membrane, average pore size, and hydrophilic properties. In contrast, since the concentration of additive has been raised to 0.1 weight percent, the flow was reduced because the additives aggregated on the PES membranes’ surface, reducing their porosity, pore size, and hydrophilicity [32].
Figure 5B illustrates when the dye rejection % response increased at a fixed pressure when the concentration of dye was lowered, and the amount of additive was increased to 0.05 weight percent. Elliptical contour plotting illustrates the relationship between dye feed content and additive concentration. Additionally, when the Bi2WO6/MWCNTs concentration was elevated to 0.1 weight percent, the MR dye rejection increased to about 93.4%. Because dye molecules form a thin, compact layer on the surface of the membrane, the overall rejection rate can be raised [42,43].
At an unchanged dye conc. of 100 ppm. The effect between the coupling of the interaction of the loading content and the pressure upon the flux of permeate is shown by the 3-D plot of the response surface, Figure 6A. When the additive level rose to 0.1 weight percent, the flux of permeate improved greater than the pressure. Increasing the Bi2WO6/MWCNTs concentration in the solution of PES, increasing the membrane’s average pore size, hydrophilicity, and porosity, and increasing the pressure all work together to improve the flux of permeate. The increased shear stress on the surface of the membrane is the cause of this. In addition, the elliptical shape of the contour plots produces a noticeable interplay between the pressure and the additive content [44].
When the dye concentration remains constant, Figure 6B response surface plot illustrates when the quantity of additives and pressure impact the rate of rejection. Increasing the additive concentration to 0.05 weight percent enhanced the rejection, whereas raising the pressure reduced it. However, increasing the additive concentration to 0.1 weight percent enhanced the rejection even under high pressure.
Figure 7A response surface diagram illustrates how pressure and dye content impact the flux of permeate. As the concentration of dye rises and the pressure falls, the flux of permeate is decreased. A pressure drop from 9–5 bar considerably decreased the flux, although an increase in the concentration of dye made it less efficient, as the pressure caused a slight decrease in flux. However, the contour maps’ structure of parallel straight lines is what prevents these factors from interacting.
The pressure and dye content also affect the dye rejection %, as seen in the response surface plot in Figure 7B. As a result, the rejection rate reduced with greater pressures, and the rate of rejection rose when the dye content increased. The molecules of dye on the surface of the membrane might produce a thin, compact coating, leading to raising the total rate of rejection, causing the rise in rejection [45].
4.5. Optimizing and Validity of the Ultrafiltration Method
Regarding methods for optimization, the desirability function technique has been utilized to optimize many responses in scientific and engineering fields. The approach combines responses to individual desirability based on a single parameter inside a scale that ranges between (1 and 0). The optimum operating circumstances are determined through choosing variables that are nearest, where one value indicates the optimal case. In contrast, as the result is close to 0, either all or some of the replies were beyond the targeted range [46].
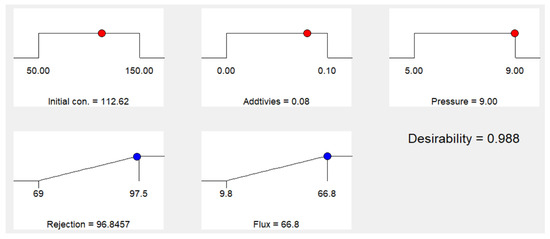
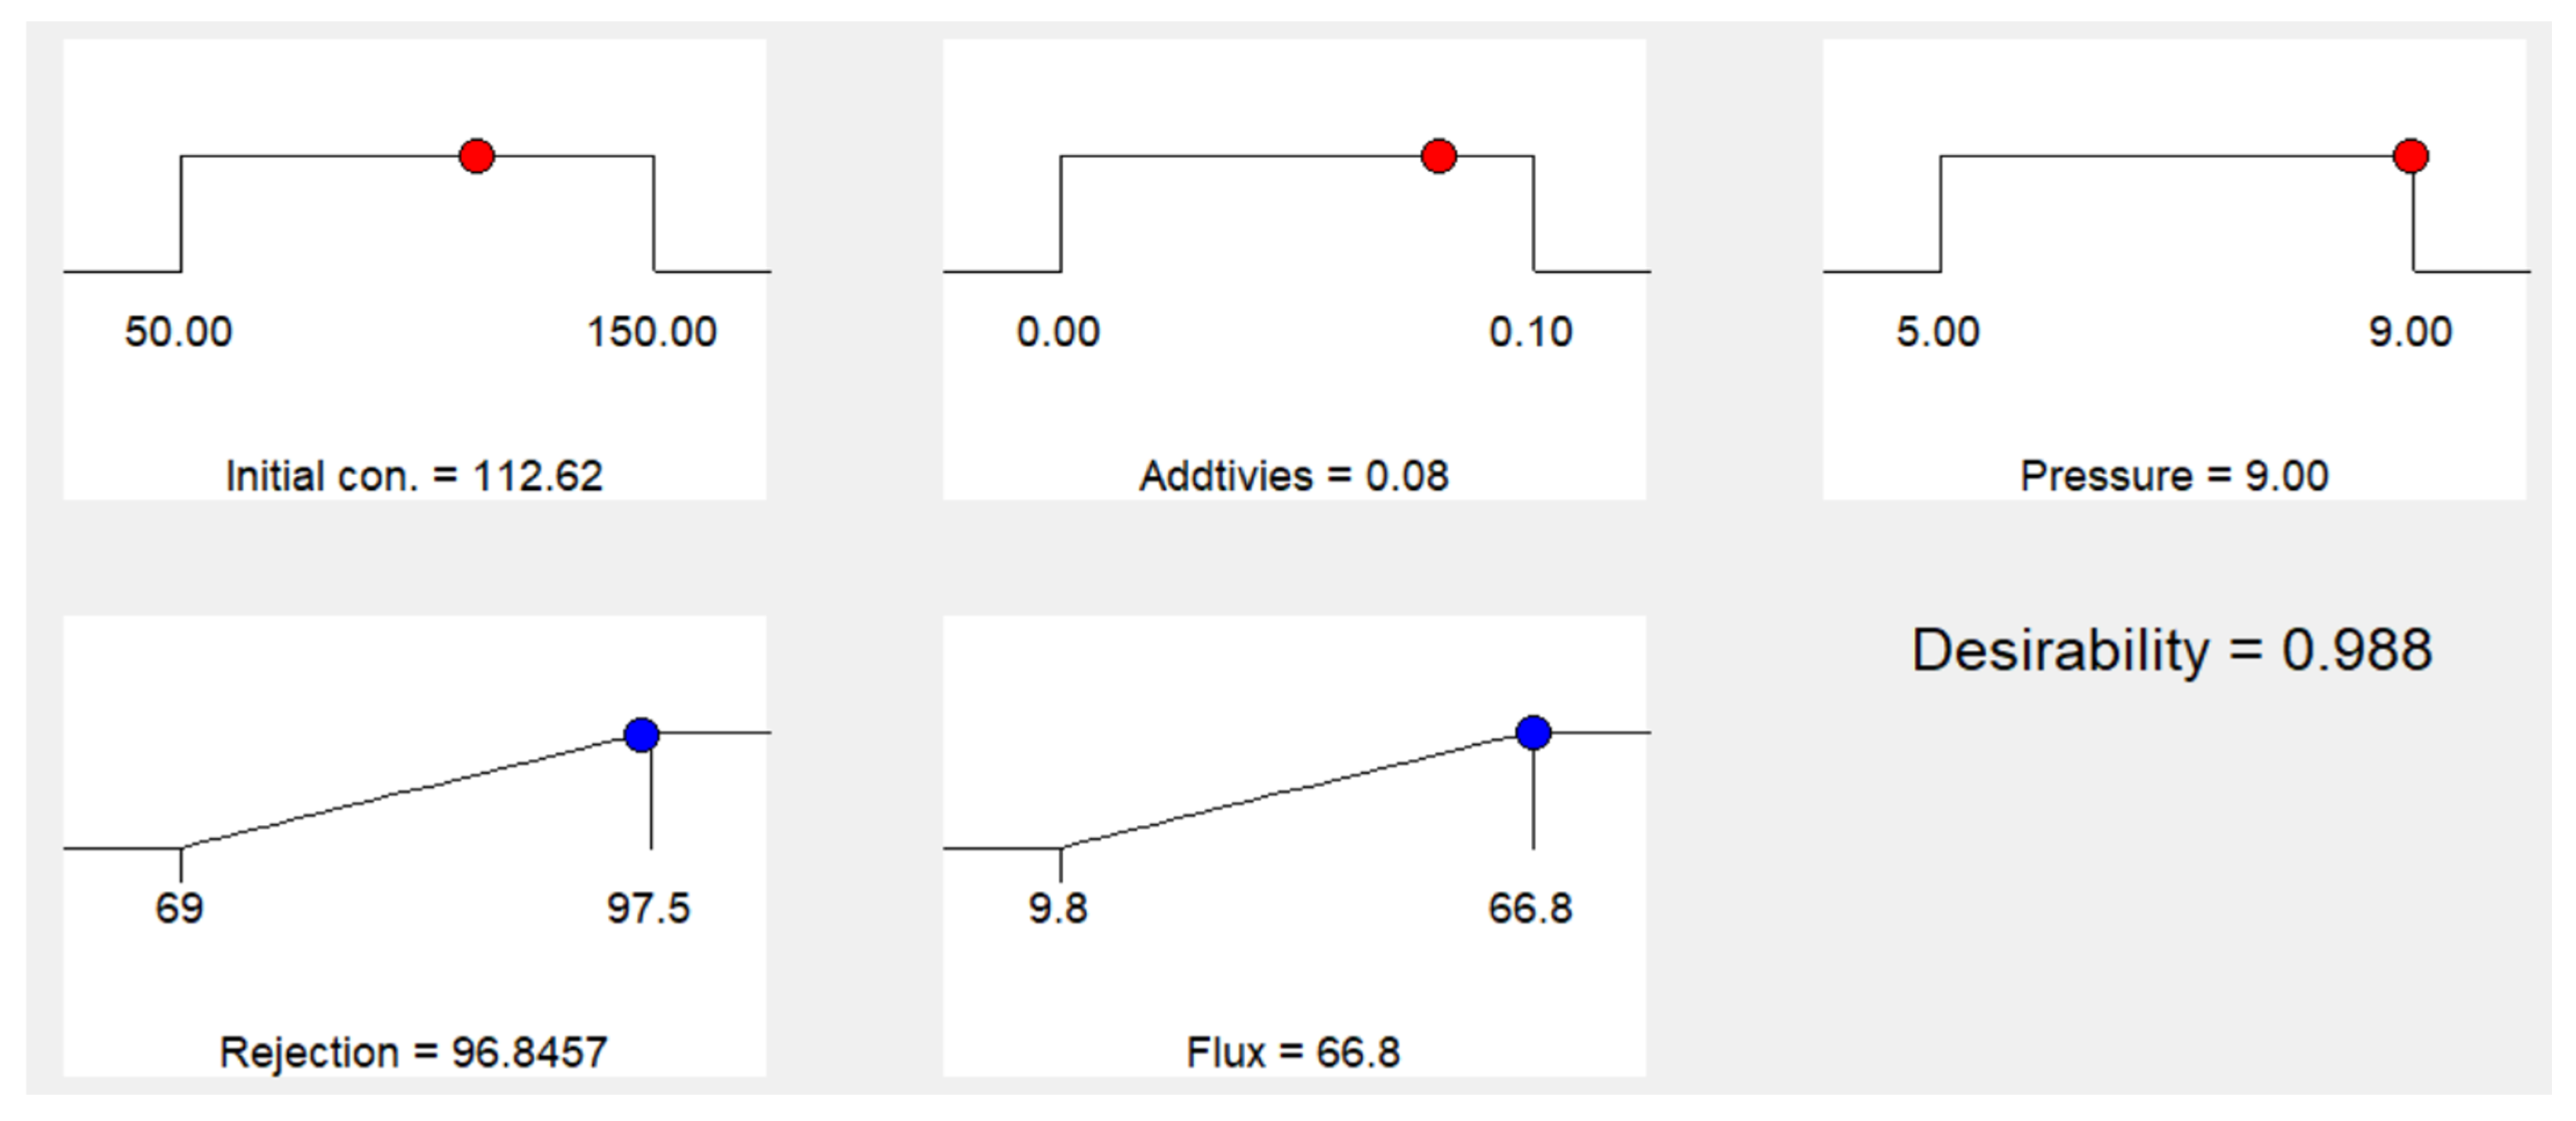
The objective of the desirability of both current responses (permeate flux and removal) was calculated by Design-Expert® software, which merged the individual desirability to a single parameter, like shown in Figure 8. The optimum conditions for operation investigated (i.e., MR dye concentration, concentration of additive, and pressure) are illustrated within the figure that follows. The result expected that all three factors would significantly enhance the flux of permeate and removal factor. Furthermore, the above model was validated via performing flow and rate of rejection tests under the optimum operating requirements suggested. Table 6 shows a 1.36% difference between the observed value (65.9 L/m2.h) and the predicted flow (66.8 L/m2.h) for membranes. In addition, the result of the experiment (95.2) was 1.4% less compared to the predicted rate of rejection (96.8457). The minor percentage error shows the validity and utility of the created model RSM.
Figure 8.
Three factors are optimized by using an appropriate ramp.
Table 6.
Predictive and experimental results for flux and rate of rejection at optimal conditions.
5. Comparison to Previous Studies
Table 7 shows the phase inversion kinetics and membrane shape have been shown to be strongly impacted by the addition of hydrophilic additives to the polymer casting solution. For example, adding water as a nonsolvent additive to polysulfone membranes changed the asymmetric structure of the membrane matrix and increased porosity. Similarly, solvent–nonsolvent exchange is accelerated during phase inversion by hydrophilic additions like PEG, PVP, and inorganic nanoparticles, resulting in finger-like macrovoid formations and increased permeability. All things considered, these investigations verify that regulating water interaction in the casting solution is a useful method for adjusting membrane morphology, hydrophilicity, and filtration efficiency.
Table 7.
Comparison with previous studies.
6. Conclusions
A novel poly-ether-sulfone membrane was developed by the use of a phase-inversion approach. To enhance membrane properties, such as permeation performance, rejection efficiency, and fouling resistance, hydrophilic Bi2WO6/MWCNTs nanocomposites were incorporated into the PES membrane. The results of this work demonstrate that Bi2WO6/MWCNTs nanocomposite UF membranes are suitable for effective MR dye removal.
The process’s overall efficiency was improved by the combined use of ANOVA and RSM, which are useful statistical and mathematical techniques. The impact of operational factors upon the rejection of MR dye and flux of permeate of PES/Bi2WO6/MWCNTs membranes in the ultrafiltration method was examined from an optimization perspective. Transmembrane pressure, MR dye concentration, and Bi2WO6/MWCNTs weight percentage were found to have the greatest effects on MR dye flux and rejection. A mathematical method was improved for evaluating the flux and the rate of rejection. The findings demonstrate that both rejection % and flow are influenced by a variety of parameters. The optimal values indicate that the membrane flux is 66.8 L.m−2.h−1 and the rejection percentage is 96.8457 using an additive loading wt.% (0.08), a content of dye (112.62) ppm, and (9) bar transmembrane pressure. These findings highlight the practical potential of Bi2WO6/MWCNTs-modified PES membranes as an effective and scalable strategy for improving membrane permeability, antifouling resistance, and dye removal efficiency, making them promising candidates for sustainable industrial wastewater treatment applications.
Author Contributions
Conceptualization, M.A.S. (Mohammed Ahmed Shehab) and K.T.R.; methodology, M.A.S. (Mohammed Ahmed Shehab) and K.T.R.; software, K.T.R. and A.A.A. (Adnan A. AbdulRazak); validation, K.T.R. and A.A.A. (Adnan A. AbdulRazak); formal analysis, M.A.S. (Mohammed A. Salih), M.A.S. (Mohammed Ahmed Shehab), M.Y.G., K.T.R., M.A., A.A.A. (Ali A. Abdulabbas); investigation, M.A.S. (Mohammed A. Salih), M.A.S. (Mohammed Ahmed Shehab), M.Y.G., K.T.R., M.A., A.A.A. (Ali A. Abdulabbas) and A.A.A. (Adnan A. AbdulRazak); resources, M.A.S. (Mohammed A. Salih), M.A.S. (Mohammed Ahmed Shehab), M.Y.G., A.A.A. (Ali A. Abdulabbas) and A.A.A. (Adnan A. AbdulRazak); data curation, A.A.A. (Adnan A. AbdulRazak); writing—original draft preparation, M.A.S. (Mohammed Ahmed Shehab), M.Y.G., K.T.R., and A.A.A. (Adnan A. AbdulRazak); writing—review and editing, M.A.S. (Mohammed Ahmed Shehab), K.T.R., and A.A.A. (Adnan A. AbdulRazak); visualization M.A.S. (Mohammed A. Salih), M.A.S. (Mohammed Ahmed Shehab), K.T.R., M.A., A.A.A. (Ali A. Abdulabbas), and A.A.A. (Adnan A. AbdulRazak) All authors have read and agreed to the published version of the manuscript.
Funding
This research received no external funding.
Data Availability Statement
The data supporting this article has been included within the article.
Conflicts of Interest
Author Ali A. Abdulabbas was employed by the company State Company of Fertilizers South Region. The remaining authors declare that the research was conducted in the absence of any commercial or financial relationships that could be construed as a potential conflict of interest.
References
- Ramin, E.; Faria, L.; Gargalo, C.L.; Ramin, P.; Flores-Alsina, X.; Andersen, M.M.; Gernaey, K.V. Water innovation in industrial symbiosis—A global review. J. Environ. Manag. 2024, 349, 119578. [Google Scholar] [CrossRef] [Scilit] [PubMed]
- Singh, P.K.; Kumar, U.; Kumar, I.; Dwivedi, A.; Singh, P.; Mishra, S.; Shekhar Seth, C.; Sharma, R.K. Critical review on toxic contaminants in surface water ecosystem: Sources, monitoring, and its impact on human health. Environ. Sci. Pollut. Res. 2024, 31, 56428–56462. [Google Scholar] [CrossRef] [Scilit] [PubMed]
- Abid, M.F.; Al-Naseri, S.K.; Al-Sallehy, Q.F.; Abdulla, S.N.; Rashid, K.T. Desalination of Iraqi surface water using nanofiltration membranes. Desalin. Water Treat. 2011, 29, 174–180. [Google Scholar] [CrossRef] [Scilit]
- Younas, A.; Kumar, L.; Deitch, M.J.; Qureshi, S.S.; Shafiq, J.; Ali Naqvi, S.; Kumar, A.; Amjad, A.Q.; Nizamuddin, S. Treatment of Industrial Wastewater in a Floating Treatment Wetland: A Case Study of Sialkot Tannery. Sustainability 2022, 14, 12854. [Google Scholar] [CrossRef] [Scilit]
- Kavitha, G.; Govindhan, M.; Premkumar, S. Dye pollution and its implications for human health, aquatic ecosystems, and sustainable wastewater treatment: A comprehensive review. J. Water Process Eng. 2025, 80, 109071. [Google Scholar] [CrossRef] [Scilit]
- Alsukaibi, A.K.D. Various Approaches for the Detoxification of Toxic Dyes in Wastewater. Processes 2022, 10, 1968. [Google Scholar] [CrossRef] [Scilit]
- Periyasamy, A.P. Recent Advances in the Remediation of Textile-Dye-Containing Wastewater: Prioritizing Human Health and Sustainable Wastewater Treatment. Sustainability 2024, 16, 495. [Google Scholar] [CrossRef] [Scilit]
- Al-Kadhi, N.S.; Abdelrahman, E.A.; Shah, R.K. Efficient basic red 46 dye removal using smart novel nanocomposite. J. Indian Chem. Soc. 2026, 103, 102369. [Google Scholar] [CrossRef] [Scilit]
- Padaki, M.; Murali, R.S.; Abdullah, M.S.; Misdan, N.; Moslehyani, A.; Kassim, M.A.; Hilal, N.; Ismail, A.F. Membrane technology enhancement in oil-water separation. A review. Desalination 2015, 357, 197–207. [Google Scholar] [CrossRef] [Scilit]
- Akinyemi, B.T.; Ogundele, O.D.; Afolabi, A.B. Advancements in Sustainable Membrane Technologies for Enhanced Remediation and Wastewater Treatment: A Comprehensive Review. Acadlore Trans. Geosci. 2023, 2, 196–207. [Google Scholar] [CrossRef] [Scilit]
- Asghar, N.; Hussain, A.; Nguyen, D.A.; Ali, S.; Hussain, I.; Junejo, A.; Ali, A. Advancement in nanomaterials for environmental pollutants remediation: A systematic review on bibliometrics analysis, material types, synthesis pathways, and related mechanisms. J. Nanobiotechnol. 2024, 22, 26. [Google Scholar] [CrossRef] [Scilit] [PubMed]
- Foorginezhad, S. Advances Environmental Science Emerging membrane technologies for sustainable water treatment: A review on recent advances. Environ. Sci. Adv. 2025, 4, 530–570. [Google Scholar] [CrossRef] [Scilit]
- Kumar, P.; Singh, J. Chapter 14—Membrane fouling control using integrated aop-membrane systems. In Advanced Oxidation Process-Based Integrated and Hybrid Technologies for Degradation of Pharmaceuticals and Personal Care Products; Elsevier: Amsterdam, The Netherlands, 2025; pp. 193–210. [Google Scholar] [CrossRef] [Scilit]
- Sisay, E.J.; Al-Tayawi, A.N.; László, Z.; Kertész, S. Recent Advances in Organic Fouling Control and Mitigation Strategies in Membrane Separation Processes: A Review. Sustainability 2023, 15, 13389. [Google Scholar] [CrossRef] [Scilit]
- Song, J.; Zhao, W.; Zhou, L.; Meng, H.; Wang, H.; Guan, P.; Li, M.; Zou, Y.; Feng, W.; Zhang, M.; et al. Rational Materials and Structure Design for Improving the Performance and Durability of High Temperature Proton Exchange Membranes (HT-PEMs). Adv. Sci. 2023, 10, 2303969. [Google Scholar] [CrossRef] [Scilit]
- Nawaz, A.; Farhan, A.; Maqbool, F.; Ahmad, H.; Qayyum, W.; Ghazy, E.; Rahdar, A.; Díez-Pascual, A.M.; Fathi-karkan, S. Zinc oxide nanoparticles: Pathways to micropollutant adsorption, dye removal, and antibacterial actions—A study of mechanisms, challenges, and future prospects. J. Mol. Struct. 2024, 1312, 138545. [Google Scholar] [CrossRef] [Scilit]
- Malafatti, J.O.D.; Tavares, F.A.; Neves, T.R.; Mascarenhas, B.C.; Quaranta, S.; Paris, E.C. Modified Silica Nanoparticles from Rice Husk Supported on Polylactic Acid as Adsorptive Membranes for Dye Removal. Materials 2023, 16, 2429. [Google Scholar] [CrossRef] [Scilit]
- Shi, S.; Jian, K.; Fang, M.; Guo, J.; Rao, P.; Li, G. SiO2 Modification of Silicon Carbide Membrane via an Interfacial In Situ Sol—Gel Process for Improved Filtration Performance. Membranes 2023, 13, 756. [Google Scholar] [CrossRef] [Scilit]
- Abdullah, R.R.; Shabeeb, K.M.; Alzubaydi, A.B.; Figoli, A.; Criscuoli, A.; Drioli, E.; Alsalhy, Q. Characterization of the Efficiency of Photo-Catalytic Ultrafiltation PES Membrane Modified with Tungsten Oxide in the Removal of Tinzaparin Sodium. Eng. Technol. J. 2022, 40, 1633–1641. [Google Scholar] [CrossRef] [Scilit]
- Biyik, S. Effect of Cubic and Hexagonal Boron Nitride Additions on the Synthesis of Ag–SnO2 Electrical Contact Material. J. Nanoelectron. Optoelectron. 2019, 14, 1010–1015. [Google Scholar] [CrossRef] [Scilit]
- Ge, R.; Huo, T.; Gao, Z.; Li, J.; Zhan, X. GO-Based Membranes for Desalination. Membranes 2023, 13, 220. [Google Scholar] [CrossRef] [Scilit]
- Al-Ani, F.H.; Alsalhy, Q.F.; Raheem, R.S.; Rashid, K.T.; Figoli, A. Experimental investigation of the effect of implanting TiO2-NPs on PVC for long-term uf membrane performance to treat refinery wastewater. Membranes 2020, 10, 77. [Google Scholar] [CrossRef] [Scilit] [PubMed]
- Bhattacharyya, S.; Donato, L.; Chakraborty, S.; Calabrò, V.; Davoli, M.; Algieri, C. Synergistic Efficiency of TiO2-GO Nanocomposite Membranes in Dye Degradation for Sustainable Water Pollution Remedy. Earth Syst. Environ. 2025, 9, 639–652. [Google Scholar] [CrossRef] [Scilit]
- Jiang, H.; He, J.; Deng, C.; Hong, X.; Liang, B. Advances in Bi2WO6-Based Photocatalysts for Degradation of Organic Pollutants. Molecules 2022, 27, 8698. [Google Scholar] [CrossRef] [Scilit] [PubMed]
- Shahabadi, S.M.S.; Reyhani, A. Optimization of operating conditions in ultrafiltration process for produced water treatment via the full factorial design methodology. Sep. Purif. Technol. 2014, 132, 50–61. [Google Scholar] [CrossRef] [Scilit]
- Jawad, S.K.; Rashid, K.T.; Toma, M.A.; Razak, A.A.A.; Shehab, M.A.; Ghadhban, M.Y.; Al-Lami, M.; Mahmood, A.; Mohammed, H.H.; Hmood, A.A.; et al. Optimal operating conditions of PES/BiFeO3 mixed matrix membrane for treating dye-contaminated wastewater. Results Eng. 2025, 26, 105246. [Google Scholar] [CrossRef] [Scilit]
- Yahia, Y.; Rashid, K.T.; Shehab, M.A.; Razak, A.A.A.; Ghadhban, M.Y.; Al-Lami, M.; Taher Al-Mayyah, M.A.; Salih, M.A.; Mohammed, H.H.; Mahmood, A. Treating wastewater contaminated with congo red (CR) dye using an optimized polyethersulfone/propolis (bee glue) PES/PRS ultrafiltration membrane. RSC Adv. 2025, 15, 23174–23186. [Google Scholar] [CrossRef] [Scilit]
- Mohammed, M.I.; Abdul Razak, A.A.; Shehab, M.A. Synthesis of Nanocatalyst for Hydrodesulfurization of Gasoil Using Laboratory Hydrothermal Rig. Arab. J. Sci. Eng. 2017, 42, 1381–1387. [Google Scholar] [CrossRef] [Scilit]
- Ghadhban, M.Y.; Shehab, M.A.; Abdulabbas, A.A.; Rashid, K.T.; Abdulrazak, A.A.; Nánai, L.; Kocserha, I. A novel Bi2WO6/MWCNTs-decorated PES photocatalytic membrane for efficient dye removal. J. Membr. Sci. 2026, 741, 125100. [Google Scholar] [CrossRef] [Scilit]
- Valizadeh, K.; Heydarinasab, A.; Hosseini, S.S.; Bazgir, S. Preparation of modified membrane of polyvinylidene fluoride (PVDF) and evaluation of anti-fouling features and high capability in water/oil emulsion separation. J. Taiwan Inst. Chem. Eng. 2021, 126, 36–49. [Google Scholar] [CrossRef] [Scilit]
- Veza, I.; Spraggon, M.; Fattah, I.R.; Idris, M. Response surface methodology (RSM) for optimizing engine performance and emissions fueled with biofuel: Review of RSM for sustainability energy transition. Results Eng. 2023, 18, 101213. [Google Scholar] [CrossRef] [Scilit]
- Guo, Y.; Xue, Q.; Zhang, H.; Wang, N.; Chang, S.; Wang, H.; Pang, H.; Chen, H. Treatment of real benzene dye intermediates wastewater by the Fenton method: Characteristics and multi-response optimization. RSC Adv. 2018, 8, 80–90. [Google Scholar] [CrossRef] [Scilit]
- Karunakaran, A.; Mungray, A.A.; Garg, M.C. Effects of temperature, pH, feed, and fertilizer draw solution concentrations on the performance of forward osmosis process for textile wastewater treatment. Water Environ. Res. 2021, 93, 2329–2340. [Google Scholar] [CrossRef] [Scilit] [PubMed]
- Shah, L.A.; Malik, T.; Siddiq, M.; Haleem, A.; Sayed, M.; Naeem, A. TiO2 nanotubes doped poly(vinylidene fluoride) polymer membranes (PVDF/TNT) for efficient photocatalytic degradation of brilliant green dye. J. Environ. Chem. Eng. 2019, 7, 103291. [Google Scholar] [CrossRef] [Scilit]
- Rashid, K.T.; Rahman, S.B.A.; Alsalhy, Q.F. Optimum Operating Parameters for Hollow Fiber Membranes in Direct Contact Membrane Distillation. Arab. J. Sci. Eng. 2016, 41, 2647–2658. [Google Scholar] [CrossRef] [Scilit]
- Shabeeb, K.M.; Noori, W.A.; Abdulridha, A.A.; Majdi, H.S.; Al-Baiati, M.N.; Yahya, A.A.; Rashid, K.T.; Nemeth, Z.; Hernadi, K.; Alsalhy, Q.F. Novel partially cross-linked nanoparticles graft co-polymer as pore former for polyethersulfone membranes for dyes removal. Heliyon 2023, 9, e21958. [Google Scholar] [CrossRef] [Scilit]
- Noori, W.A.; Yahya, A.A.; Alzubaidy, K.S.; Jawad, N.H.; Al-Juboori, R.A.; Rashid, K.T.; Abdulridha, A.A.; Al-Baiati, M.N.; Al-Saadi, S.; Alsalhy, Q.F. Phthalic Anhydride Glycerol as a pore former for enhancing the surface and morphology of PVC ultrafiltration membrane. Desalin. Water Treat. 2025, 321, 101069. [Google Scholar] [CrossRef] [Scilit]
- Zhang, M.; Liu, Z.; Gao, Y.; Shu, L. Ag modified g-C3N4 composite entrapped PES UF membrane with visible-light-driven photocatalytic antifouling performance. RSC Adv. 2017, 7, 42919–42928. [Google Scholar] [CrossRef] [Scilit]
- Rowley, J.; Abu-Zahra, N.H. Synthesis and characterization of polyethersulfone membranes impregnated with (3-aminopropyltriethoxysilane) APTES-Fe3O4 nanoparticles for As(V) removal from water. J. Environ. Chem. Eng. 2019, 7, 102875. [Google Scholar] [CrossRef] [Scilit]
- Yahia, Y.; Rashid, K.T.; Toma, M.A.; Shakhir, K.S.; Albayati, T.M.; Saady, N.M.C.; Zendehboudi, S. A novel green propolis (bee glue) nanoparticles mixed with poly (ether-sulfone) ultrafiltration membrane for wastewater Eriochrome Black T (EBT) and Congo Red (CR) dye treatment. J. Environ. Chem. Eng. 2025, 13, 115913. [Google Scholar] [CrossRef] [Scilit]
- Abdelkader, B.A.; Antar, M.A.; Khan, Z. Nanofiltration as a Pretreatment Step in Seawater Desalination: A Review. Arab. J. Sci. Eng. 2018, 43, 4413–4432. [Google Scholar] [CrossRef] [Scilit]
- Li, Y.; Zhao, Y.; Wang, H.; Wang, M. The application of nanofiltration membrane for recovering lithium from salt lake brine. Desalination 2019, 468, 114081. [Google Scholar] [CrossRef] [Scilit]
- Zhang, S.; Liu, Y.; Li, D.; Wang, Q.; Ran, F. Water-soluble MOF nanoparticles modified polyethersulfone membrane for improving flux and molecular retention. Appl. Surf. Sci. 2020, 505, 144553. [Google Scholar] [CrossRef] [Scilit]
- Aziz, A.A.; Mokhter, M.A.; Ghazali, A.I.; Hanaffi, N. Removal of Remazol Brilliant Blue R Dye from Water Using Eggshell Mixed Matrix Membrane through Filtration and Adsorption. J. Appl. Membr. Sci. Technol. 2024, 28, 17–31. [Google Scholar] [CrossRef] [Scilit]
- Saleem, A.G.; Al-Jubouri, S.M. Separation performance of cationic and anionic dyes from water using polyvinylidene fluoride-based ultrafiltration membrane incorporating polyethylene glycol. Desalin. Water Treat. 2024, 319, 100546. [Google Scholar] [CrossRef] [Scilit]
- Shakor, Z.M.; AbdulRazak, A.A.; Shuhaib, A.A. Optimization of process variables for hydrogenation of cinnamaldehyde to cinnamyl alcohol over a Pt/SiO2 catalyst using response surface methodology. Chem. Eng. Commun. 2022, 209, 827–843. [Google Scholar] [CrossRef] [Scilit]
- Yunos, M.Z.; Harun, Z.; Basri, H.; Ismail, A.F. Effects of Water as Non-Solvent Additive on Performance of Polysulfone Ultrafiltration Membrane. Adv. Mater. Res. 2012, 488–489, 46–50. [Google Scholar] [CrossRef] [Scilit]
- Keskin, B.; Ormancı-Acar, T.; Türken, T.; Imer, D.Y.; Koyuncu, I. Effect of wetting agent on the dye filtration performance of ultrafiltration membrane. Water Sci. Technol. 2020, 82, 577–586. [Google Scholar] [CrossRef] [Scilit]
- Garcia-Ivars, J.; Alcaina-Miranda, M.I.; Iborra-Clar, M.I.; Mendoza-Roca, J.A.; Pastor-Alcañiz, L. Enhancement in hydrophilicity of different polymer phase-inversion ultrafiltration membranes by introducing PEG/Al2O3 nanoparticles. Sep. Purif. Technol. 2014, 128, 45–57. [Google Scholar] [CrossRef] [Scilit]
- Arahman, N.; Mulyati, S.; Fahrina, A.; Muchtar, S.; Yusuf, M.; Takagi, R.; Matsuyama, H.; Hadi Nordin, N.A.; Bilad, M.R. Improving Water Permeability of Hydrophilic PVDF Membrane Prepared via Blending with Organic and Inorganic Additives for Humic Acid Separation. Molecules 2019, 24, 4099. [Google Scholar] [CrossRef] [Scilit]

Disclaimer/Publisher’s Note: The statements, opinions and data contained in all publications are solely those of the individual author(s) and contributor(s) and not of MDPI and/or the editor(s). MDPI and/or the editor(s) disclaim responsibility for any injury to people or property resulting from any ideas, methods, instructions or products referred to in the content. |
© 2026 by the authors. Licensee MDPI, Basel, Switzerland. This article is an open access article distributed under the terms and conditions of the Creative Commons Attribution (CC BY) license.