Article

Influence of Ethanol on Ultrasound-Assisted Extraction of Bioactive Compounds from Cocoa Pod Husk and Their Antioxidant, Antihypertensive, and Antihyperglycemic Activity


by
Fanny Adabel González-Alejo
1,
Areli Carrera-Lanestosa
1,*,
Mario Moscosa-Santillán
2,
Ricardo García-Alamilla
3,
Jesús Alfredo Araujo-León
4,
Diakaridia Sangaré
5,
Juan José Acevedo-Fernández
6 and
Pedro García-Alamilla
1,*
1
Academic Division of Agriculture and Livestock Science, Universidad Juárez Autónoma de Tabasco (UJAT), Carret. Villahermosa-Teapa Km 25, Ra. La Huasteca, Villahermosa 86280, Tabasco, Mexico
2
Faculty of Chemical Sciences, Autonomous University of San Luis Potosí, Ave. Dr. Nava #6, San Luis Potosí 78210, San Luis Potosí, Mexico
3
National Technological Institute of Mexico, Instituto Tecnológico de Ciudad Madero, Petrochemical Research Center, Prol. Bahía de Aldahir y Av. De las Bahías, Parque de la Pequeña y Mediana Industria, Altamira 89600, Tamaulipas, Mexico
4
Integrative Biology Unit, Scientific Research Center of Yucatán (CICY), Mérida 97205, Yucatán, Mexico
5
Centre de Coopération Internationale en Recherche Agronomique pour le Développement (CIRAD), UPR BioWooEB, 73 rue Jean-François Breton, F-34398 Montpellier, France
6
Faculty of Medicine, Autonomous University of the State of Morelos, Calle Leñeros s/n, Col. Los Volcanes, Cuernavaca 62359, Morelos, Mexico
*
Authors to whom correspondence should be addressed.
ChemEngineering 2026, 10(4), 43; https://doi.org/10.3390/chemengineering10040043
Submission received: 6 January 2026 / Revised: 2 February 2026 / Accepted: 27 February 2026 / Published: 27 March 2026
(This article belongs to the Topic Separation Techniques and Circular Economy)

Abstract

Cocoa pod husk (CPH), a major agro-industrial residue, contains valuable bioactive compounds whose recovery can support sustainable waste valorization. This study evaluated the influence of increasing ethanol concentrations on the ultrasound-assisted extraction (UAE) of bioactive compounds from CPH and their antioxidant, antihypertensive, and antihyperglycemic activity. Dried and milled CPH was extracted using ethanol–water mixtures (0–100% ethanol) under fixed ultrasonic conditions. Cocoa pod husk powder characterization and the resulting extracts were analyzed in terms of chemical composition (lignocellulosic compounds, proximate and elemental composition, and bromatological composition), antioxidant capacity, and in vivo antihypertensive and antihyperglycemic effects in Wistar rats. The results showed that solvent polarity strongly modulated extraction efficiency: absolute ethanol yielded the highest phenolic (171.43 mg GAE/g) and flavonoid (132.05 mg QE/g) content, whereas hydroalcoholic mixtures, particularly 50:50, enhanced overall antioxidant performance, especially in FRAP. The chemical analysis results showed the selective recovery of compounds such as quercetin, hesperidin, and theobromine, and FTIR-PCA results revealed distinct solvent-dependent chemical profiles. In vivo assays indicated modest blood pressure stabilization and a more pronounced antihyperglycemic effect after chronic administration. Overall, UAE proved an effective, rapid, and solvent-efficient method for CPH valorization, highlighting its potential for producing natural antioxidants applicable to food, nutraceutical, and cosmetic formulations.

1. Introduction

Cocoa is the raw material used to make chocolate. It is oval in shape and, depending on the variety, varies in color and number of seeds. During cocoa post-harvest, significant amounts of residual biomass are produced: for example, approximately 80% of the pod is considered a residue [1]. Cocoa residual biomass comprises three main residues, the pod husk (CPH), mucilaginous liquids, and the bean husk [2,3], with the pod husk representing the largest fraction, accounting for 65 to 75% of the pod’s total mass [4]. This factor is of particular importance because roughly 4.3 million tons of dry cocoa beans are produced globally [5], and, based on the findings of Mansur et al. [6], for every ton of dry beans, 10 tons of CPH are generated.
Cocoa pod husk is generally disposed of by open dumping near or inside plantations, where it is used as fertilizer for the soil [6]. However, during its degradation, pollutants are generated, such as carbon dioxide and leachates that promote the development of microorganisms and pests that negatively impact plantations [6,7]. Inadequate management of residual CPH impacts the health of plantations due to the fact that many diseases thrive on decaying organic matter, such as black pod and stem canker disease caused by Phytophthora palmivora, Colletotrichum rot disease, and witches’ broom disease caused by Moniliophthora perniciosa. These diseases contribute to significant economic losses, since they impact up to 60% of total production [8,9,10]. Efficient management of residual biomass is thus necessary, with research focusing on the reuse and valorization of waste such as CPH. At present, due to its high cellulose and pectin content, cocoa pod husk has been used for the production of biodegradable packaging materials such as paper and biofilms, in addition to the production of bioethanol and polyhydroxyalkanoates [11,12]. Similarly, lignin from CPH has proven to be an important resource for the generation of compounds such as nanolignin, a high-value material with applications in bioplastics, adhesives, and antioxidants within a circular economy model [13].
Cocoa pod husk is also a great archetype of residual biomass that can enable global utilization of this waste. In several studies, researchers have reported the presence of compounds with bioactive properties such as dietary fiber, which, based on the findings of Delgado-Ospina et al. [14], although not providing nutrients or energy, aids intestinal function by modulating the intestinal microbiota, regulates intestinal transit—its presence in the intestine improves glycemic and lipid control—and provides the body with a feeling of satiety.
In comparison with phenolic compounds and flavonoids, which are natural protectors that aid the body in staying healthy at the cellular, metabolic, and systemic levels [15,16,17,18,19,20,21], methylxanthines do not provide essential nutrients. However, based on the findings of Afzal et al. [22], these molecules affect some physiological processes since their consumption stimulates the central nervous system; theobromine, in particular, has vasodilatory and bronchodilatory properties.
The polysaccharide pectin is an abundant compound in CPH and has been primarily used for the development of films for food coating; however, its low methylation rates suggest that pectin extracted from CPH is also viable for biofuel production [23,24]. Lastly, based on the findings of Aprila-Fajrin et al. [25], glycosides, such as saponins, in CPH extracts exhibit significant phytochemical properties and biological activities since they have a high capacity to inhibit α-glucosidase, making them a candidate for functional food development focused on hyperglycemia management.
The above findings verify CPH’s antioxidant potential, which refers to the ability of a substance to neutralize reactive oxygen species and protect biological systems from oxidative stress [16,20,21,26]. This antioxidant capacity influences the anti-wrinkle potential of CPH extracts [20,27] and their anti-hyperglycemic potential [25] and antihypertensive effect [28], which, in most studies, has been associated with the presence of phenols and flavonoids, but, in the case of CPH, involves its alkaloids.
Regarding proximate composition, fresh pod husks contain high moisture (87.06%) and carbohydrate (11.03%) content, but low levels of crude protein (0.31%), lipids (0.12%), and ash (1.48%) [29]. Another important aspect of the pod husk is its structural composition. This residue presents a rigid structure due to the presence of lignocellulosic compounds such as cellulose, hemicellulose, and lignin, highlighting the potential of CPH in sustainable practices [30]. It is essential to consider the challenges in its processing and the need for efficient bio-conversion technologies to fully exploit its benefits, as the degree of research development on this type of biomass remains at the laboratory stage.
Bioactive compounds from CPH can be extracted using conventional or emerging methods [31]. However, most of these methods present disadvantages due to the use of petroleum-derived solvents, although solvents play a crucial role in the extraction efficiency, selectivity, and stability of bioactive compounds [32]. Furthermore, conventional extraction methods require large amounts of energy in the form of heat to perform extraction, which increases energy costs. With the aim of increasing and improving the extraction efficiency of these compounds, heat energy and petroleum-derived solvents are used in combination, which increases processing costs, and the extracted compounds may be marked by chemical contamination due to trace amounts of solvent [33,34] that often limit their use and application in food, cosmetics, or pharmaceuticals.
In solid–liquid extraction processes, the particle size of the residual biomass is a key factor, since smaller particles increase the surface area, improving solvent penetration and extraction efficiency [35,36].
In several studies, researchers have extracted bioactive compounds from fresh or dried CPH using techniques such as re-maceration [20], supercritical fluid extraction [19], hydrolysis [37], microwave-assisted extraction [21], and heat-assisted extraction [34,38]. These green bioactive compound extraction methods have been widely employed to enhance efficiency and sustainability, while simultaneously maintaining the integrity of the compounds and retaining their antioxidant properties associated with health benefits.
Another procedure widely used to obtain bioactive compounds from residual biomass is ultrasound-assisted extraction [39,40], an efficient, fast, selective, sustainable, and versatile method with a range of applications and with minimal damage to the structure and activity of the bioactive compounds [41,42]. This type of extraction involves the diffusion of ultrasonic waves ranging from 20 kHz to 100 MHz, resulting in fragmentation of the residual biomass and particle size reduction [43]. This phenomenon facilitates collision between particles and ultrasonic waves and thus mass transfer; the resulting degradation of the particles enables the solvent to solubilize the present compounds [43]. Similarly, the sonocapillary and sonoporation effects that occur during the process enhance the permeation of the solvent into the particle membranes; the rupture of the cell walls increases the surface area available for solvent penetration, enabling more efficient extraction of bioactive compounds [44,45]. Ultrasound-assisted extraction can therefore enhance the development of an efficient and selective process for extracting bioactive compounds from CPH. In this work, the objective was to evaluate the influence of increasing ethanol concentrations on the ultrasound-assisted extraction (UAE) of bioactive compounds from CPH and their antioxidant, antihypertensive and antihyperglycemic activities.

2. Materials and Methods

2.1. Sample Collection and Pretreatment

A total of 25 kg of fresh CPH from the Chontalpa region in the state of Tabasco, Mexico (18.160194, −93.619617) were collected. The cocoa pod husk was washed vigorously with distilled water and placed under direct sun-drying for seven days. Subsequently, due to its toughness, the dried CPH was ground in two stages: the first stage was performed in a manual grain mill (Surtek, MOGRA1, El Salto, Jalisco, Mexico) and the second stage in a spice mill (Hamilton Beach, 80350R, Glen Allen, VA, USA, Manufactured in Grupo HB PS, S.A. de C.V., Mexico City, Mexico). A classification by particle size was performed using sieves to obtain sizes of 840, 425, 250, 180, and 149 μm. The classified powders were stored refrigerated at −14 °C. Particle size selection was based on preliminary extraction by agitation tests (Figure S1). A quantity of 0.5 g of each particle size was extracted with 50 mL of distilled water at room temperature for two hours; the extracts were filtered, and the total content of phenols and flavonoids, as well as the antioxidant activity, was evaluated by DPPH. Based on the results obtained, the 425 μm size was selected because the particle size reduction in the CPH–water mixture formed a viscous complex with a gel-like appearance that limited the separation of the extract by filtration and centrifugation.

2.2. Characterization of the CPH

Cocoa pod husk was characterized by chemical-bromatological analysis, proximate analysis, elemental analysis, bioactive compound analysis, antioxidant capacity analysis, and FT-IR spectroscopy.

2.2.1. Chemical-Bromatological Analysis

The cocoa pod husk powder was analyzed under the standards established by Mexican standards and the fat [46], protein [47], fiber [48], and ash [49] content was determined as a percentage.

2.2.2. Analysis of Extractable and Lignocellulosic Compounds

The extractable compounds, hemicellulose, lignin, and cellulose, were determined according to the protocol described by Li et al. [50] and Selvaraju and Bakar [51], which validated the techniques described below:
Extractables determination: A total of 3 g of CPH (W0) were leached with a benzene/ethanol mixture (2:1 by volume) at room temperature for three hours. Then, the sample was filtered and left to air dry. The dried residue was placed in an oven (Felisa, FE-291, Zapopan, Jalisco, Mexico) at 105 °C for 24 h until constant weight. Finally, the residue was cooled and weighed (W1) and the content of extractables was calculated with the following equation:
%   Extractables   =   W 0     W 1 W 0   ×   100
Hemicellulose determination: In a flask, 150 mL of NaOH solution (2%) was added with one g of the residue (W2) from the extractables’ determination. The mixture was placed in a reflux system and kept boiling for 3.5 h. The solid residue obtained from filtration was washed with distilled water to remove Na+ ions and was dried in an oven (Felisa, FE-291, Zapopan, Jalisco, Mexico) at 105 °C for 24 h until constant weight. The weight registered after the process was labelled as W3 and the percentage of hemicellulose was calculated with the following equation:
% Hemicellulose = W 2 W 3 W 2 × ( 100 % Extractables )
Lignin determination: For the determination of lignin, 1 g of powder was taken from the extractables determination and placed in a flask until constant weight (W4). Subsequently, 30 mL of sulfuric acid (72%) was added to the sample, and it was refrigerated at 8–15 °C for 24 h. After this time, the sample was placed in a larger container and diluted with 300 mL of distilled water. The sample was then boiled for one hour, making sure to maintain the initial volume. Once the process was finished, the sample was allowed to cool and filtered, the filtered residue was washed to remove sulfate ions and the clean residue was left to dry until a constant weight was obtained, the weight of the residue was assigned as W5 and the percentage of lignin was calculated with the following equation:
% Lignin = W 5 W 4 × ( 100 % Extractables )
Cellulose determination: The cellulose content of the sample was determined by difference using the following Equation (4):
% Cellulose = 100 % Extractables % Hemicellulose % Lignin

2.2.3. Proximate and Elemental Analysis

Proximate analysis was conducted following the methods of the European standards, with moisture content (MC) determined by the NF EN ISO 18134-3 standard [52], ash content by the NF EN ISO 18122 standard [53], volatile matter (VM) by the NF EN ISO 18123 [54] standard, and fixed carbon (FC) calculated by difference using the formula (5):
FC   ( % )   =   100 [ MC   ( % )   +   ash   content   ( % )   +   VM ]
The final analysis was conducted using an organic elemental analyzer (CHNS Elemental Vario Macro Cube, Langenselbold, Germany) following the European NF EN ISO 16948 standard [55]. All procedures were performed in triplicate, and the results were averaged from these replicates.

2.3. Determination of Bioactive Compounds in CPH Extracts Obtained by UAE

The cocoa pod husk extracts were reconstituted at a concentration of 10 mg/mL regarding the ethanol:water solvent ratios with which they were extracted (see Section 2.8). The diluted extracts were stored under refrigeration until analysis.
Total phenolic compounds determination: Total phenolic compounds was determined according to the method by Othman et al. [56]. A 200 µL aliquot of diluted extract was taken and mixed with 1.5 mL of Folin–Ciocalteu reagent. After five minutes, 1.5 mL of NaHCO3 (0.55 M) was added. The mixture was left to stand for 90 min in the dark at room temperature and its absorbance was measured at 715 nm in a spectrophotometer (Thermo Spectronic, Genesys 10 vis, Rochester, NY, USA). The calibration curve ranged from 0.02–0.1 mg/mL (Curve calibration y = 0.0038x − 0.0003; R2 > 0.99), expressed in gallic acid equivalents (GAE).
Total flavonoid content determination: Total flavonoids content was determined according to the method by Zhishen et al. [57], with modifications. 0.2 mL of the diluted extract was mixed with 0.8 mL of distilled water and 0.15 mL of NaNO2 (5%) and left to stand for five minutes. Then, 0.15 mL of AlCl3 (10%) was added and, after six minutes, 2 mL of NaOH (4%) was added to the mixture. The volume of the mixture was made up to five mL with distilled water. The absorbance was measured at 410 nm in a spectrophotometer (Thermo Scientific, UV-Vis Genesys 10S, Beijing, China). The content was expressed in milligram equivalents of quercetin (mg EqQ/g), using a calibration curve with quercetin (20–100 mg/mL; Curve calibration y = 0.001x − 0.0109; R2 > 0.99).
Theobromine and caffeine determination: The content of theobromine (TB) and caffeine (CF) in CPH extracts was determined using the technique by Peralta-Jiménez et al. [58], with modifications. One mL of extract of the above-described concentration was taken, and 10 mL of distilled water at 80 °C and 0.5 mL of Carrez 1 reagent were added. After cooling, the mixture was centrifugated at 7280× g (HERMLE, Z 326 K, Gosheim, Germany) and 0.5–0.7 g NaHCO3 was added to the supernatant. After 10 min, this new mixture was centrifuged under the conditions previously described and the new supernatant was made up to 10 mL. Five mL were taken and adjusted with NaOH (8%) to a pH between 12.5–12.7, subsequently 5 mL of chloroform was added. The mixture was subjected to ultrasonic extraction at 80 °C and 160 W for 30 s and then centrifuged, obtaining two phases: an aqueous one with the presence of theobromine and an organic one for caffeine.
TB quantification was conducted by taking 80 µL of the aqueous phase, completing them up to two mL with deionized water, and the absorbance was measured at 273 nm. 200 µL of the organic phase was taken for the determination of CF, completing them up to two mL with chloroform, and the absorbance was measured at 276 nm. The TB and CF calibration curves were performed in a range of 0–50 µg of standard from methylxanthines mentioned (Curves calibration y = 0.037x + 0.0046; R2 > 0.99 and y = 0.0597x + 0.0127 R2 > 0.99, respectively)

2.4. Antioxidant Capacity Determination

DPPH assay: Antioxidant capacity by DPPH (1,1-diphenyl-2-picrylhydrazyle) was determined according to the methodology of Shimada et al. [59]. The DPPH radical (0.1 mM) was prepared, then an aliquot of 150 μL of extract was taken and mixed with 1350 μL of the DPPH radical, the sample was left to stand in the dark for 30 min and the absorbance was read at 517 nm. The results were expressed in Trolox Equivalent Antioxidant Capacity (TEAC), the Trolox standard was performed at a concentration of 30–55 mM (Curve calibration y = −0.002x + 1.0407; R2 > 0.96).
ABTS assay: The determination of antioxidant capacity using the ABTS radical (2,2′-azino-bis (3-ethylbenzothiazoline-6-sulfonic acid) was conducted as described by Pukalskas et al. [60]. A phosphate salt buffer solution (PBS 0.01 M, pH 7.4) was made to prepare a solution of ABTS at 7 mM, which was subsequently mixed with 5 mL of potassium persulfate (2.45 mM) and left to stand for 16–17 h in the dark at room temperature to produce the ABTS radical. The ABTS radical was diluted in PBS and the absorbance was adjusted to 0.800 ± 0.03 in a spectrophotometer (Thermo Scientific, UV-Vis Genesys 10S, Beijing, China) at 734 nm. With the ABTS radical adjusted, the antioxidant capacity was measured. 10 μL of extract was mixed with 990 μL of the ABTS radical and, after 6 min, the absorbance was read to be the same as the above-mentioned. The results were expressed in Trolox Equivalent Antioxidant Capacity (TEAC), the Trolox standard was performed at a concentration of 0.5–3.5 mM (Curve calibration y = −0.2041x + 0.7037; R2 > 0.98).
FRAP assay: FRAP radical assay (Benzie et al. [61] and Thaipong et al. [62]) was performed using a 10:1:1 ratio mixture of acetate buffer (300 mM/L, pH 3.6), TPTZ (2,4,6-tripyridyl-s-triazine, 10 mM/L), and FeCl3 · 6H2O (20 mM/L) and incubated at 37 °C for 10 min in the dark.
For the determination of antioxidant capacity, the methodology by Thaipong et al. [62], was followed, where 150 μL of extract was mixed with 2850 μL of FRAP, the mixture was left to stand for 30 min in the dark, and the absorbance was read at 593 nm. The results were expressed in Trolox Equivalent Antioxidant Capacity (TEAC), the Trolox standard was performed at a concentration of 30–55 mM (Curve calibration y = 0.0021x + 0.021; R2 > 0.99).

2.5. Evaluation of Antihypertensive and Antidiabetic Activity In Vivo

To evaluate the antidiabetic and antihypertensive effects of CPH extracts, one of the extracts was selected for application as a treatment for both diseases; the decision was based on the optimal balance of solvent concentration, so the extract chosen was the one obtained with the ethanol–water solvent ratio of 50:50. The study included 25 two-month-old Wistar rats (300–320 g), housed under controlled conditions at 22 °C with a 12 h light/dark cycle. For eight weeks, spontaneous hypertension and diabetes mellitus were induced by the dietary addition of L-name (40 mg/kg of body weight) and streptozotocin (60 mg/kg of body weight), respectively. At the end of this period, the rats presented obesity, elevated blood pressure, and hyperglycemia.
This study was approved by the Committee for the Care and Use of Laboratory Animals (CCUAL-FM-UAEM) and adhered to the Mexican Official Standard NOM-062-ZOO-1999 [63], along with all applicable federal and institutional regulations, with the project “Estandarización de modelos experimentales con enfermedades asociadas al sindrome metabólico: obesidad, diabetes e hipertensión” [Ethical approval no. (005/018)]. This ensured the ethical treatment and welfare of the laboratory animals throughout the study.
The extracts were administered intragastrically, so a dose of 15 mg (dry extract/kg of body weight) was added to the pellet diet ad libitum. Chandra et al. [64] was used to measure the postprandial effect on blood pressure and glucose levels.
Antihypertensive Effect: Blood pressure was measured at the base of the tail in the experimental rats using a noninvasive Kent Scientific CODA Standard sphygmomanometer (Torrington, Connecticut), specifically designed for precise blood pressure monitoring, alongside a Científica Senna device (Mexico City, Mexico). Measurements were taken weekly for four consecutive weeks throughout the treatment period to ensure consistent and reliable data collection.
Antihyperglycemic Effect: The impact of the cocoa pod husk extracts on glucose metabolism was assessed using the oral glucose tolerance test (OGTT) performed on days 1 and 30 of the protocol. Rats were fasted for 8 h before receiving 25 mg/kg of the extract along with 1 g/kg of starch. The positive control group was administered 0.5 mg/kg of acarbose plus the same starch dose. Blood glucose levels were recorded at 15, 30, 45, 60, and 120 min post-administration via capillary blood samples analyzed with a digital glucometer (Accu-Chek Active, Roche, Kunshan, Jiangsu, China).

2.6. Flavonoid and Organic Acid Profiling of Extracts by UHPLC

The quantification of flavonoids and organic acids of the extracts obtained was performed in a Thermo Scientific Ultimate 3000 UHPLC system (Thermo Fisher Scientific, Waltham, MA, USA), coupled to a UV/Vis detector, using HPLC grade methanol, acetonitrile, and water, with an acidified mobile phase using acetic acid.
The dry extracts were dissolved at a concentration of 20 mg/mL of dry extract in the extraction solvents previously described. A 50 µL aliquot of extract was injected onto a Hypersil GOLD C18 column (Thermo Fisher Scientific). The sample was eluted at a flow rate of 350 µL/min, using a gradient of 0.1% acetic acid-water (solvent A), 0.1% acetic acid-methanol (solvent B), and 0.1% acetic acid-acetonitrile (solvent C). The elution system started with 100% solvent A for two min, increasing the proportion of organic solvent to 80% of solvent B and 20% of solvent C during the 2 to 16 min; the quantification of flavonoids and organic acids was performed with the standards hesperidin, hesperetin, naringin, naringenin, quercetin, vanillic acid, and 4-hydroxybenzoic acid with purity higher than 99%. To validate HPLC method, standard calibration curves were generated in the concentration range of 0.5–5.0 µg/mL and the validation results showed that the quality control for the flavonoids analyzed is acceptable and meets the requirements of ICH-Q2A for validating analytical methods.

2.7. Characterization of Extracts by FTIR Spectroscopy

The dry extracts were analyzed by Fourier Transform infrared spectrophotometry with an ATR accessory (PerkinElmer, Frontier, Waltham, MA USA). An amount of 0.2 g of dry extract was placed on the ATR unit glass and 32 scans were performed in the 4000–400 cm−1 range, with a resolution of 4 cm−1 [65]. The dry extracts were read in triplicate, the spectra obtained were processed to absorbance, the baseline was corrected by the software PerkinElmer Spectrum Versión 10.5.4 included in the equipment, smoothing was carried out, and finally the data were normalized to obtain a data matrix with 3600 signals per 15 extract readings, which were used to perform a PCA analysis. The generated data was then processed in the MetaboAnalyst 6.0 software, which were used to perform a multivariate analysis of Principal Component Analysis (PCA).

2.8. Extraction of Bioactive Compounds from CPH Residual Biomass

The extraction experiments were based on a completely randomized design with three replicates and with ethanol:water solvent ratios 0:100, 25:75, 50:50, 75:25 and 100:0. Experimental randomization was performed with MINITAB (20. 3 version, USA). The extraction was performed in an ultrasonic disruptor (Jinan BIOBASE, Biotech Co., Ltd., Jinan, Shandong, China), with fixed conditions of temperature (25 °C), time (30 min), duty cycles (3 s), power (50%), volume (100 mL), and CPH (3 g).
The extracts obtained were concentrated by rotoevaporation under vacuum conditions and at a temperature ranging from 26–30 °C. Subsequently, the concentrated extract was dried at 50 °C to constant weight and the extraction yield was calculated by the following Equation (6):
%   Y i e l d =   Residual   biomass   dry   extract   weight   Residual   CPH   biomass   weight     ×   100
The dried extracts were stored refrigerated (−14 °C) for analysis.

2.9. Data Analysis

The results of extraction with different concentrations of ethanol were analyzed by Analysis Of Variance (ANOVA); differences between pod husk extracts were analyzed by Tukey’s test in the SAS® OnDemand for Academics software. Moreover, a Pearson’s correlation analysis was performed to measure the relationship between the extraction solvent and the study variables.
The FTIR spectra were analyzed in Origin 8.5.1 software for the assignment of the signals present in each extract. The integration of MetaboAnalyst 6.0, FTIR, and chemometric techniques significantly enhances the analysis and differentiation of FTIR signals associated with functional groups. The MetaboAnalyst web-based platform serves as a powerful tool for metabolomics data processing, allowing the interpretation of complex data sets derived from various analytical methods, including FTIR spectroscopy. This combination facilitates a more in-depth understanding of the chemical composition and antioxidant properties of CPH extracts. Therefore, a multivariate analysis of the data obtained was conducted using a matrix that was entered into the MetaboAnalyst 6.0 platform, where the data read for each extract with their respective repetitions were arranged in rows and the FTIR signals in the columns; the input data were previously normalized for a better distribution of the data.

3. Results and Discussion

3.1. Characterization of CPH

The characterization of cocoa pod biomass facilitates the identification of bioactive components and the optimization of extraction processes. By determining the most effective solvents and methods, this approach unlocks functional benefits and transforms agricultural residue into a high-value resource. Initial characterization of our CPH sample revealed a crude protein content of 53.0 ± 1.7 g/kg of dry matter, which is low compared with the 91.4 ± 1.7 g/kg of dry matter reported by Alemawor et al. [66] but similar to the value reported by Sobamiwa et al. [67], with 59.0 ± 4.0 g/kg of dry matter recorded in whole CPH. Regarding fat content, 73.1 ± 0.7 g/kg of dry matter was recorded, a value higher than that reported by Sobamiwa et al. [67], who obtained a value of 12.0 ± 1.0 g/kg of dry matter. In our sample, the ash content was recorded as 80.3 ± 1.0 g/kg of dry matter; in comparison, Alemawor et al. [66] reported a value of 90.7 ± 0.4 g/kg dry matter and Sobamiwa et al. [67] reported a value of 91.0 ± 3.0 g/kg of dry matter. Lastly, we obtained a fiber content of 232.0 ± 13.6%, a value considered low compared to the 357.4 ± 0.9 g/kg dry matter reported by Alemawor et al. [66] but similar to the value of 226.0 +7.0 g/kg of dry matter reported by Sobamiwa et al. [67]. Our CPH proximal composition results show differences with respect to those of other authors due to the structural attributes of CPH being related to the protective layer of the pod, which acts as a defense mechanism against physical and chemical agents, microorganisms, insects, and environmental factors [68]. In the whole cocoa pod husk, bioactive compounds and methylxanthines were also found to be present, molecules that are valued in research for their functional and therapeutic properties, as such properties make them ideal candidates for developing products beneficial to human health. The total polyphenols content in the CPH was 120.58 ± 6.84 mg GAE/g of dry matter, with this value being higher than those obtained by Martínez et al. [69], who reported values of 2.06–2.27 and 3.52–3.65 mg/g of dry matter for ethanolic and methanol–acetone extracts, respectively. Literature on total flavonoid content in CPH remains limited. In the present study, values of 15.81 ± 0.90 mg QE/g of dry matter were obtained; in comparison, Karim et al. [70] reported total flavonoid content of 22.42 ± 0.99 mg RE/g of dry matter, values that are slightly higher than those reported in this study. In terms of theobromine and caffeine content in CPH, we recorded values of 88.47 ± 0.06 μg TB/g and 78.67 ± 0.05 μg CF/g, respectively. These values exceeded those obtained by Nguyen et al. [29], who obtained a value of 67.9 μg TB/g of dry matter. Regarding caffeine, cocoa pod husk presented significantly lower values compared to cocoa husks, as reported by González-Alejo et al. [71], with values of 15, 850 ± 0.002 μg/g of dry matter, which is primarily due to the composition of the residue. From these findings, it is evident that the bioactive richness of CPH supports its use as a raw material for the recovery of these compounds using extraction methods such as direct ultrasound, a technique that complements this work due to its efficiency, speed, and low environmental impact. This characterization enabled the selection of appropriate conditions for the recovery of bioactive compounds of interest.
In terms of the results of the extractable and lignocellulosic composition analysis, we obtained values of 16.84% for total extractables, 14.20% for hemicellulose, 46.65% for lignin, and 22.30% for cellulose. The sample extractable values were similar to those reported by Ouattara et al. [37], who obtained a value of 13.26% for total extractables. These values are lower than those reported by Titiloye et al. [72], who reported a value of 23.66% in terms of extractable content in CPH. Lignin was the most abundant compound among the lignocellulosic compounds of CPH, showing higher values than those reported by Holguin-Posso et al. [73], who obtained values between 20.95% and 29.83%. In our sample, hemicellulose and cellulose contents were found to be similar to the values reported by Holguin-Posso et al. [73]: 11.38% and 15.88% for hemicellulose and 16.20% and 25.02% for cellulose. Differences in the composition of CPH biomasses are attributable to various factors, including genetic diversity, environmental conditions, and processing methods, as reported by Zhang et al. [74]. These variations are crucial to understanding the possible applications of CPH in different industries, mainly in the energy industry, since the total extractables, together with the lignin content, enable the release of carbohydrates from the biomass, which can produce fermentation inhibitors, such as phenolic compounds, during the fermentation process [73,75].
The cocoa pod husk was also characterized through proximate and elemental analyses, with the results shown in Table 1 for the CPH sample examined in the present study and the comparison with those reported by other authors. In this analysis, we focus on the physicochemical characteristics of the pod husk, which is crucial to understanding its potential as residual biomass for energy production or in other industrial applications such as the extraction of bioactive compounds. Our cocoa pod husk moisture results were similar to those reported in several studies. This variable is important for the energy sector, as it indicates that CPH is characterized by moderate moisture content and will therefore not affect combustion efficiency.
Regarding volatile matter, the results are generally consistent across studies, excluding the study by Akam et al. [76], whose analysis was conducted on briquettes made from CPH combined with cassava starch. The presence of the binder likely influenced the variation in results. This parameter is significant because it indicates that briquettes from CPH release various combustion gases during the combustion process. At the initial combustion stage, the biomass emits gases, such as CO2 and CO, water vapor, light hydrocarbons (e.g., CH4, C2H6, and H2), and organic compounds such as aldehydes, alcohols, and alkenes, gases commonly released in the combustion of other biomass materials [78]. These characteristics highlight its potential as a valuable energy source.
In fixed carbon, notable differences in the percentages were observed in the reported studies, with Londoño-Larrea et al. [75] reporting the closest value to those of the present study. The importance of fixed carbon is that it represents the portion of the fuel that remains as a solid after combustion of the volatile matter and is a key factor in energy yield. Moreover, ash content, which represents the inorganic segment of the CPH that is not combustible, was similar to that reported by Londoño-Larrea et al. [75] but differed almost twofold compared to that obtained by Adjin-Tetteh et al. [77], which is relatively higher compared to the results of other studies. Ash content is related to a higher amount of minerals, which leads to a lower calorific value in combustion, as ash does not contribute to energy generation [78]. In fact, the characteristics of CPH make it an excellent model for combustion processes, such as drying, combustion in boilers and ovens, or biochar production.
Our elemental analysis results are shown in Table 1. The carbon content reported in this work is similar to that obtained by Londoño-Larrea et al. [75] and Adjin-Tetteh et al. [77]. The carbon element is key to energy potential, as higher levels in CPH generally correspond to greater heat generation capacity. In the case of the H element, a value of 4.62% was obtained, which was lower than the result obtained by Londoño-Larrea et al. [75] but higher than that reported by Adjin-Tetteh et al. [77]. Hydrogen is an indicator of the moisture content of CPH because it can combine with oxygen to form water; however, it can also contribute to combustion.
Nitrogen forms part of natural organic compounds, such as proteins, amino acids, alkaloids, or structural nitrogen compounds. It is not an energy component; however, its presence is critical because it determines the behavior of biomass during combustion or pyrolysis [75]. The values reported in this work are similar to the percentages obtained by Londoño-Larrea et al. [75] and Adjin-Tetteh et al. [77]; although this element does not contribute directly to calorific value, it is capable of forming nitrogen oxides, which are highly polluting; biomass with >2% N can generate significant NOx emissions. Values of 1.2–1.7%, as found in the aforementioned studies, are within an acceptable range; however, if this biomass is to be produced on a large scale, appropriate control would be required. No sulfur was found in the CPH; however, Londoño-Larrea et al. [75] and Adjin-Tetteh et al. [77] found trace amounts of this compound. The absence of sulfur is a positive attribute from an environmental standpoint, as it prevents the formation of SO2, which contributes to acid rain.
The oxygen content reported in this work was 47.89%, similar to the value reported by Adjin-Tetteh et al. [77]. Cocoa pod husk contains a substantial percentage of carbon and volatile matter, which makes it an interesting material for energy production by means of combustion or pyrolysis [6,79]. However, the relatively high ash content could be a drawback in terms of waste management and efficiency. Some notable variations exist between different studies, which may be caused by differences in samples, processing methods, or environmental conditions.

3.2. Effect of Increasing the Level of Ethanol on the UAE of CPH Extracts

Our analysis of variance (ANOVA) results showed significant differences (p ≤ 0.05) in the effect of increasing the level of ethanol on the UAE of CPH extracts across the study variables (Table 2), indicating that this factor affected the yield and bioactive compounds extracted in the CPH extracts. The highest extraction yields were obtained from ethanol–water solvent ratios of 25:75 with 12.63 ± 0.80% and 0:100 with 12.24 ± 1.89%, followed by 75:25 and 50:50 with 11.31 ± 0.26% and 10.19 ± 2.09%, respectively. Lastly, the 100:0 ratio resulted in a yield of 7.43 ± 1.15%. Additionally, a strong correlation between gradually increasing ethanol and extraction yield was estimated through Pearson’s correlation coefficient (0.83), showing that, as ethanol concentration increased, yield decreased. This finding demonstrates the influence of the solvent ratio on the ultrasonic extraction yield. These results are higher than those reported by Valadez-Carmona et al. [19], who obtained a yield of 0.52%, using an ethanol–water (1:30) solvent ratio to extract bioactive compounds by means of supercritical extraction in CPH powder.
The total content and bioactive compound profile of the extracts obtained with the different solvent ratios are shown in Table 2. The total polyphenol content and total flavonoid content of the 100:0 ratio were significantly (p ≤ 0.05) higher, outperforming the hydroalcoholic fractions and the aqueous medium. These variables are strongly correlated with one another, and our Pearson correlation analysis results indicated that changes in the ethanol–water ratio are closely linked to TPC (r = 0.99) and TFC (r = 0.98). Extraction solvents are known to be crucial in solid–liquid separation processes, as their chemical characteristics allow the desired compounds to be dissolved in mixtures, enabling their separation and purification [34,80,81]. Such findings led to the hypothesis that the proportion of ethanol in the solvent ratios would positively affect the extraction of phenolic compounds and flavonoids.
In this study, the total polyphenol content values were higher than those obtained by Nguyen et al. [16], who produced aqueous extracts using microwave-assisted extraction, obtaining 49.93 g EC/g of dry cocoa pod husk in their extract. Based on the results of several studies, phenolic compounds and most flavonoids are substances with a high affinity for ethanol because they possess hydroxyl groups (–OH) in their chemical structures, which makes them partially polar. Ethanol is a polar–apolar solvent, with the ability to interact with polar compounds due to its –OH groups, in addition to being able to interact with apolar compounds due to its hydrocarbon chain [82,83]. From the above findings, it can be concluded that ethanol is an effective compound for dissolving and extracting phenolic compounds and flavonoids.
The highest theobromine concentration was found in the 50:50 ethanol–water ratio, and the lowest was obtained in the 25:75 ratio. In this case, the Pearson correlation analysis result was 0.44, indicating a weak positive correlation between solvent ratios and theobromine extraction; for caffeine, in comparison, it was only detected using the UV-Vis method in the pure solvent ratios. Nguyen et al. [29] stated in their study that the solubility of theobromine has a limited effect in water and that its polarity can be improved by using hydroalcoholic mixtures, dissolving the –C=O and –CH3 type bonds present in theobromine, which have a low molecular weight. The authors found that the theobromine content obtained from CPH was 67.9 μg/g TB of pod husk extracts. Regarding caffeine, no studies were found that reported the presence of caffeine in CPH extracts; however, in cocoa husk residues, values of 5.11–6.13 μg/g TB have been reported by Botella-Martínez et al. [84].
The phenolic compound profile (Table 2) showed that the highest quercetin concentration was obtained with the extract with water (0:100), and the lowest concentration was observed with the 50:50 ratio. Pearson correlation analysis results showed that quercetin yielded a value of r = 0.45, indicating a moderate positive correlation; however, when correlated with naringin, the value of r = 0.78 increased, implying that the presence of naringin is positively associated with the presence of quercetin. These quercetin values are lower than the values obtained by El-Lateef et al. [85], who reported a value of 11.25 μg/g in ethanolic extracts. In the case of hesperetin, the highest concentration was obtained with pure water (0:100), and the lowest concentration was obtained with the 50:50 ratio. Regarding naringenin, the correlation analysis showed a very low correlation (r = −0.01); the highest concentration was obtained with the 75:25 ratio, and the 100:0 and 25:75 ratios presented the lowest values.
The highest hesperidin concentration was obtained with the 100:0 ratio, and the lowest was observed with the 25:75 ratio; these data presented a low negative correlation value of r = 0.39. When correlating this variable with hesperetin values, the correlation value increased to r = 0.74, a high value, with this factor being related to the fact that both flavonoids are structurally related, which can be derived from similar extraction conditions. The highest concentration of naringin was obtained in the extract with a solvent ratio of 100:0; in comparison, the lowest concentration was observed in the extract with a ratio of 75:25. The correlation between naringin concentration and solvent composition was very low (r = −0.02), suggesting that there is no significant linear relationship between these two factors. However, a high positive correlation was found between naringin and quercetin (r = 0.78), indicating that both compounds could be present in similar concentrations or influenced by similar extraction conditions. Regarding vanillic acid, the highest concentration was observed in the extract obtained with the solvent ratio of pure ethanol, whereas the lowest concentration was recorded in the extract prepared with pure water. Vanillic acid concentration presented a high negative correlation with solvent ratio (r = −0.76), in addition to a high negative correlation with TPC (r = −0.86) and TFC (r = −0.87). These results indicate that a higher water content in the solvent significantly reduces the extraction of vanillic acid, in addition to the overall levels of phenolic and flavonoid compounds. Lastly, the presence of p-hydroxybenzoic acid was also detected in the extracts, with the highest concentration observed in the extract obtained with pure ethanol (100:0); in comparison, the lowest concentration was found with the 25:75 ratio. Similar to vanillic acid, p-hydroxybenzoic acid showed a high negative correlation with solvent ratio (r = −0.75), in addition to a high negative correlation with TPC (r = −0.77) and TFC (r = −0.85). However, a positive correlation was also observed with hesperidin (r = 0.72) and vanillic acid (r = 0.78), suggesting a possible association between these compounds as a function of extraction conditions.
The solvent ratio was crucial for the extraction of specific bioactive compounds; based on our results, an ethanol–water solvent ratio of 100:0 appears to be effective for the extraction of phenolic compounds and flavonoids, whereas pure water may be preferable for certain compounds such as quercetin and hesperetin, indicating possible extraction conditions based on specific solvent ratios with which beneficial compounds present in biomasses such as CPH can be selectively extracted.

3.3. Antioxidant Activity

The antioxidant activity of the CPH extracts is summarized in Table 3. The highest antioxidant activity based on the DPPH assay was obtained with the 100:0 ratio, followed by the 50:50 ratio, whereas the lowest value was presented with the 25:75 ratio. We recorded higher values than those reported by other authors, such as Aprila-Fajrin et al. [25], who reported values ranging from 15.1 to 770.8 μM TE/g in ethanolic extracts of CPH under convection drying, microwave drying, freeze-drying, and fresh conditions; conversely, Abdul-Karim et al. [20] reported DPPH concentrations between 10.80 and 87.07 μg/mL of hydroalcoholic extract (80%) obtained by means of shaking. We conducted a Pearson correlation test of antioxidant activity using the DPPH assay; the obtained values of TPC, TFC, and TB were examined and coefficients of 0.78, 0.74, and 0.81 were obtained. These findings suggest that these compounds exhibit a strong correlation, with the antioxidant capacity determined using the DPPH assay, since the results are in agreement with the amount of TPC and TFC due to these compounds providing a higher number of electrons, primarily hydrogen, to stabilize the radical.
All extracts showed very high and similar activity in the ABTS assay, regardless of the extraction solvent ratio. The Pearson correlation test results for TPC, TFC, and TB with respect to ABTS antioxidant activity were 0.14, 0.075, and −0.13, respectively, representing a weak relationship between the variables studied. This finding is expected, given the similarity of the results for each extract. However, based on the findings of Liu et al. [86], the cavitation produced via supercritical fluid extraction can degrade the lignin structure present in biomasses such as CPH. Since cocoa pod husk is the only lignocellulosic material containing an aromatic skeleton, phenolic monomers can be obtained from CPH, which may influence the antioxidant activity of the extracts obtained in this study. In their study, Valadez-Carmona et al. [19] reported 215 μM TE/g in a hydroalcoholic extract (ethanol 13.7%) obtained by means of supercritical extraction. The differences between the two green methods may be dependent on the extraction conditions, since the aim of the study was to determine the extraction selectivity of phenolic compounds. In another study by Valadez-Carmona et al. [15], ABTS values between 30.6 and 112.4 μM TE/g in fresh and dried pod husk extracts using several different methods were reported. Although the ABTS results of this work are close to 100% antioxidant activity in all extracts, this could be attributed to the robust mechanism for assessing the total antioxidant capacity of various substances.
Regarding the FRAP assay, the correlation values of TPC, TFC, and TB were very low at −0.50, −0.45, and 0.34, with these results indicating that the antioxidant capacity determined by means of FRAP is not a function of the content of these molecules. However, depending on the solvent composition, the highest value was found with the ethanol–water ratio of 50:50 and the lowest with the ethanol–water ratio of 100:0. The results of the ethanol–water ratio extracts for 0:100, 25:75, and 50:50 are higher than those reported by Quiroz-Reyes et al. [39], who extracted bioactive compounds by means of ultrasound with an acidified methanol–water mixture (50:50) on cocoa beans, suggesting that the iron reduction capacity is much higher in mixed solvents than in an ethanol–water solvent ratio of 100:0. However, Abdul-Karim et al. [20] produced hydroalcoholic extracts (ethanol 80%) by means of shaking and measured their antioxidant activity via FRAP at different concentrations, recording values between 390.94 and 729.57 μM TE/g, which confirms that cocoa pods generally contain higher levels of phenolic compounds, surpassing beans and husks [87].

3.4. Antihypertensive and Antidiabetic Activity In Vivo

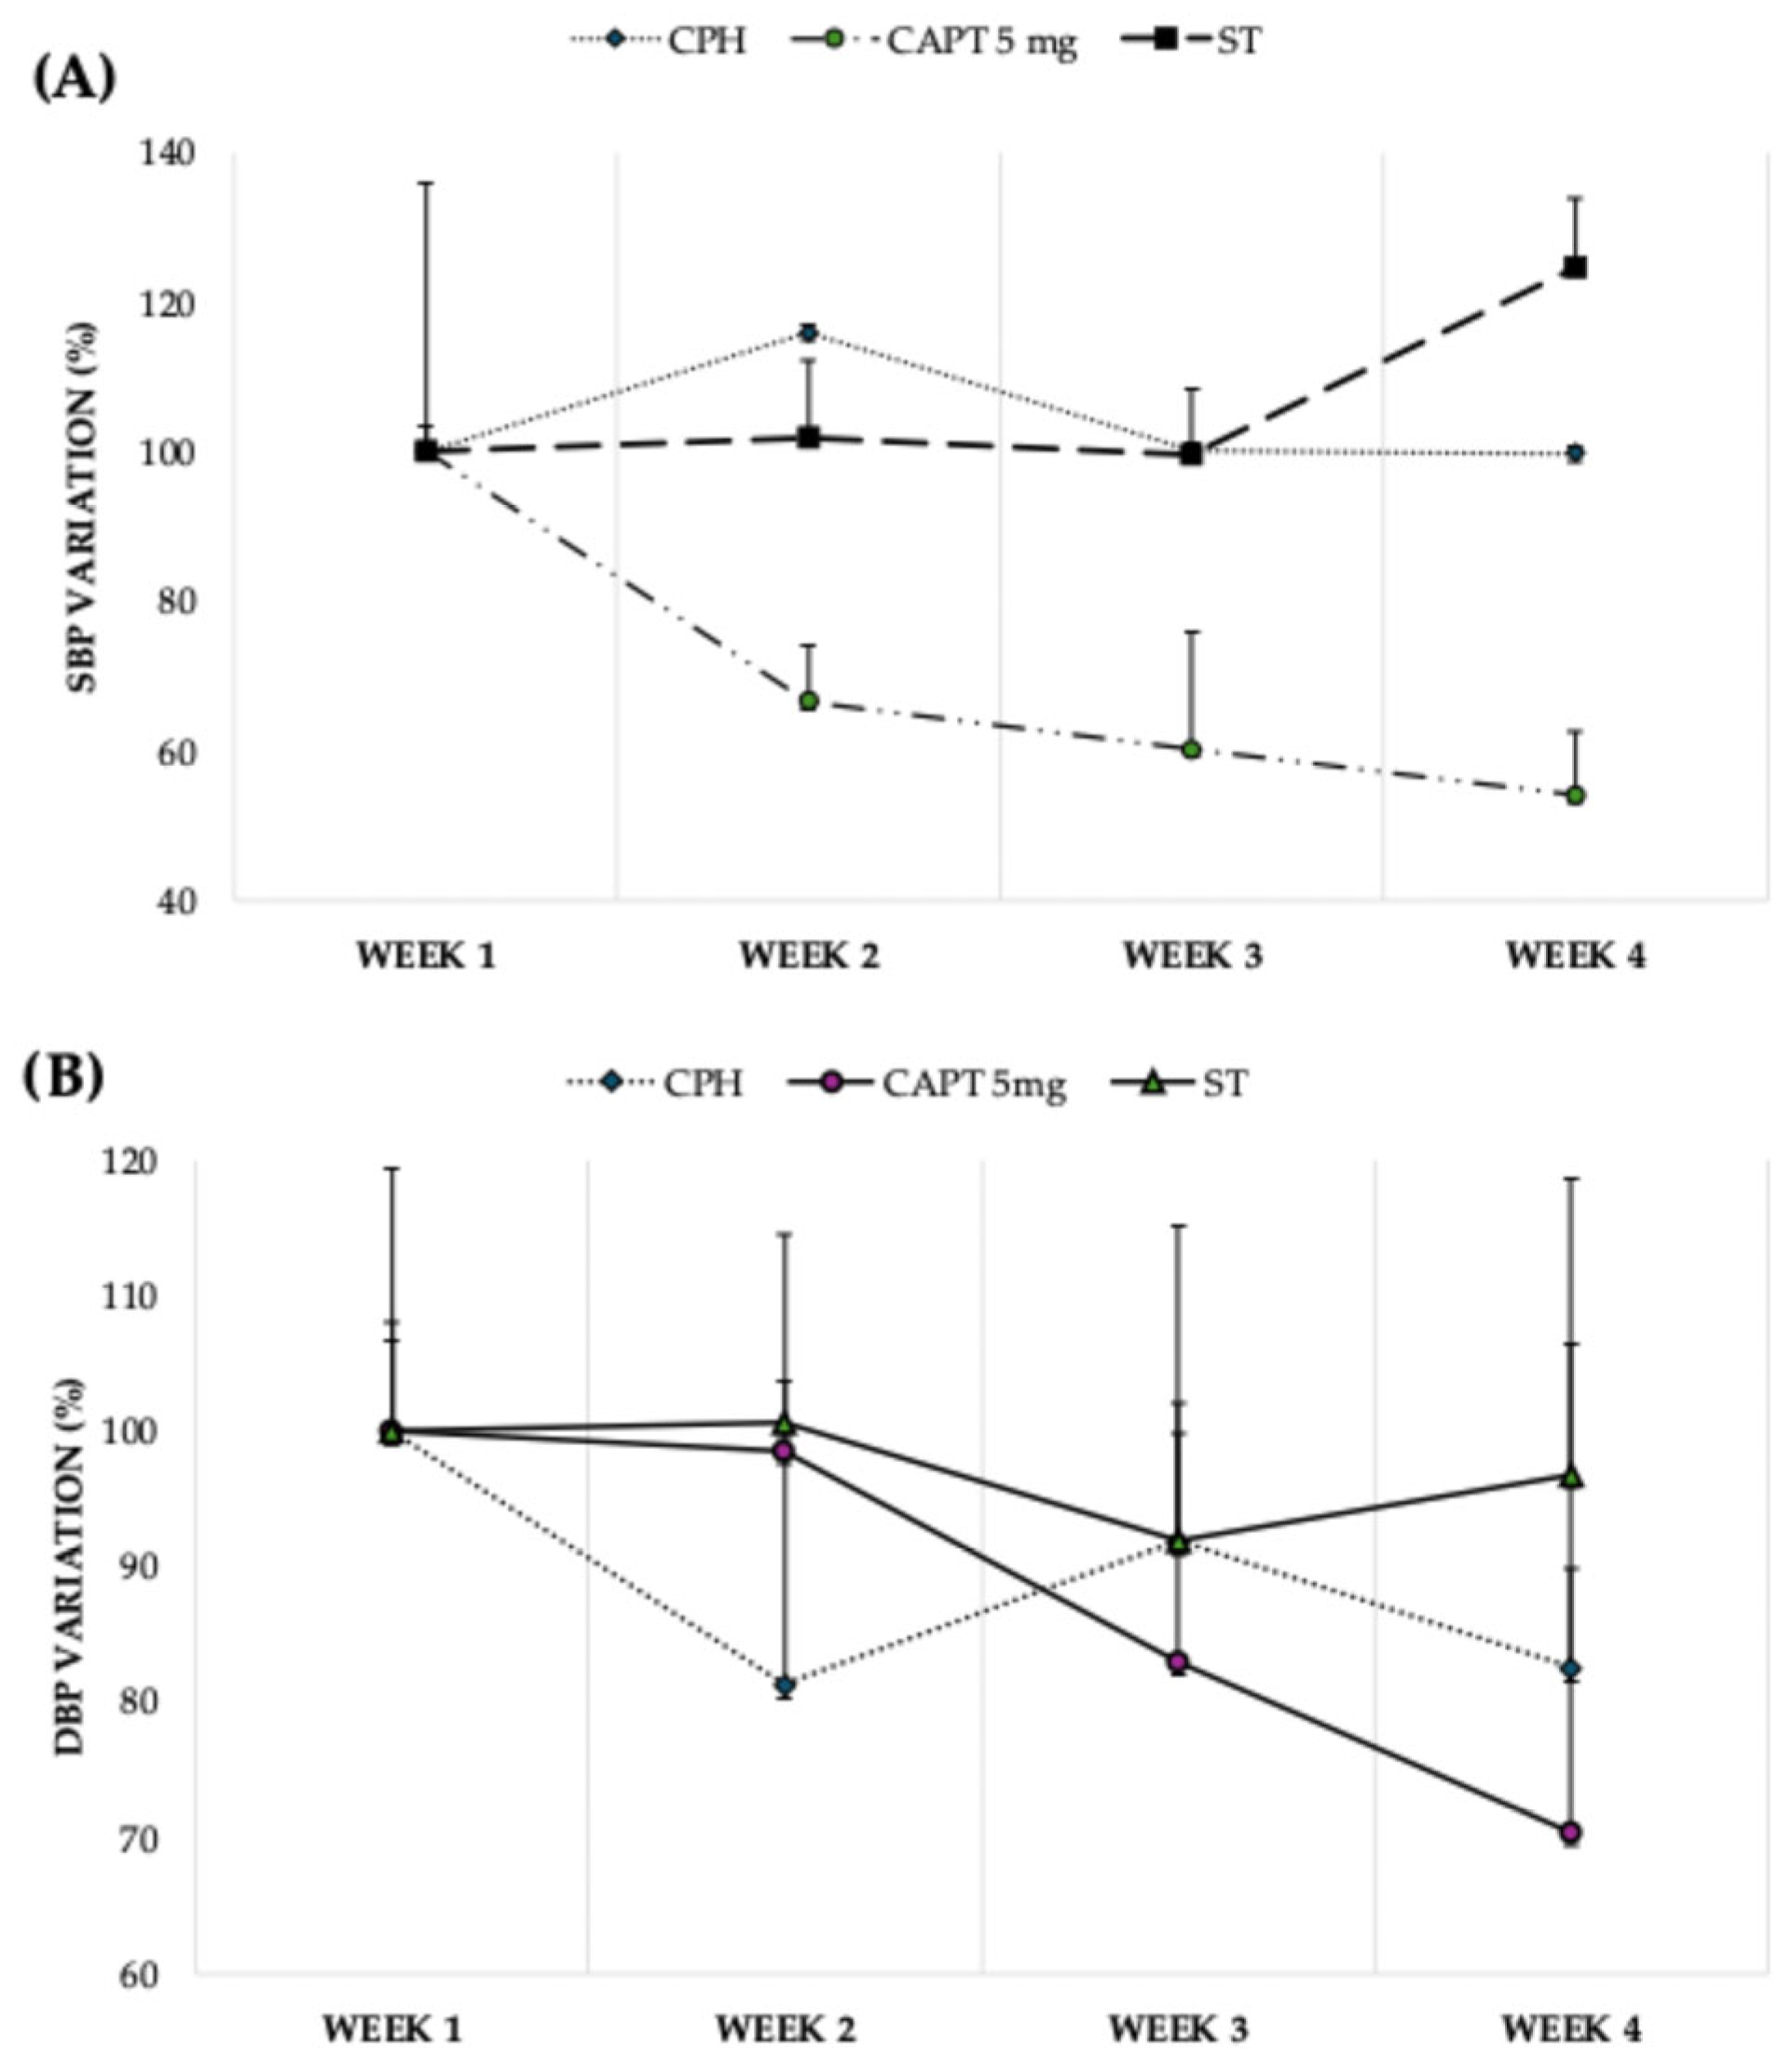
The results presented in Figure 1 illustrate the antihypertensive effect of cocoa pod husk extracts, demonstrating the change in systolic (SBP) and diastolic (DBP) blood pressure over four weeks of treatment with 15 mg/kg body weight of the extract. As expected, the rats in the control treatment (captopril) exhibited a potent antihypertensive response, with a 34.64% reduction in SBP during the first week and a sustained decrease of 45.92% by the end of the experiment, equivalent to a reduction of 107 mmHg. The results presented in Figure 1A show that, in the second week of CPH treatment, SBP increased by 15.96%; however, by week 4, SBP levels had stabilized, remaining close to baseline values.
In contrast, the untreated group showed a 20.11% increase in SBP relative to baseline, corresponding to a rise of 45 mmHg after 4 weeks. Regarding DBP (Figure 1B), cocoa pod husk extract induced an approximate 17.5% reduction (28 mmHg) by week 4, demonstrating a moderate antihypertensive effect compared to the reference drug, which induced a 29.63% reduction (40 mmHg). As expected for an angiotensin-converting enzyme (ACE) inhibitor, captopril produced a marked and sustained reduction in both SBP and DBP, lowering SBP by roughly 46% and DBP by roughly 30% by the end of the experiment.
In this regard, Ruvira et al. [88] reported that cocoa pod extract reduced blood pressure in elderly hypertensive rats by enhancing cardiovascular expression of endothelial nitric oxide synthase (eNOS) and nuclear factor erythroid 2-related factor 2 (Nrf2). In their study, SBP measured based on tail plethysmography in 18-month-old male and female MUN rats decreased by 25 mmHg in males (184 to 159 mmHg) after supplementation with cocoa pod extract (250 mg/kg/day for 2 weeks, 5 days/week); in comparison, females showed a slight increase of 5 mmHg (135 to 140 mmHg). Notably, blood pressure reduction occurred only in males. The authors attributed this effect to increased expression of eNOS and Nrf2 in cardiovascular tissues and elevated GSH levels, though they did not rule out direct antioxidant effects of the extract’s bioactive compounds. In comparison, in the present study conducted on Wistar rats, no significant effect was observed on SBP, although DBP decreased, possibly due to differences in animal age and the much lower extract dose used (15 mg/kg).
In another study conducted on Wistar rats, researchers evaluated the antihypertensive activity of an ethyl acetate fraction of cocoa pod extract in L-NAME-induced hypertensive males [89]. Baseline SBP (180.17 mmHg) and DBP (125.79 mmHg) decreased to 125.33 mmHg and 88.00 mmHg, respectively, in rats receiving 25 mg/kg of the fraction—an effect comparable to that of 25 mg/kg captopril. This strong activity was attributed to the high total polyphenol content enriched in the ethyl acetate fraction. Medium-polarity solvent partitions, such as ethyl acetate, often concentrate metabolites such as flavonoid aglycones, terpenes, and less polar phenolics, resulting in enhanced biological activity [25]. The modest DBP reduction observed in our study may therefore be related to the comparatively lower concentration of bioactive compounds in our extract.
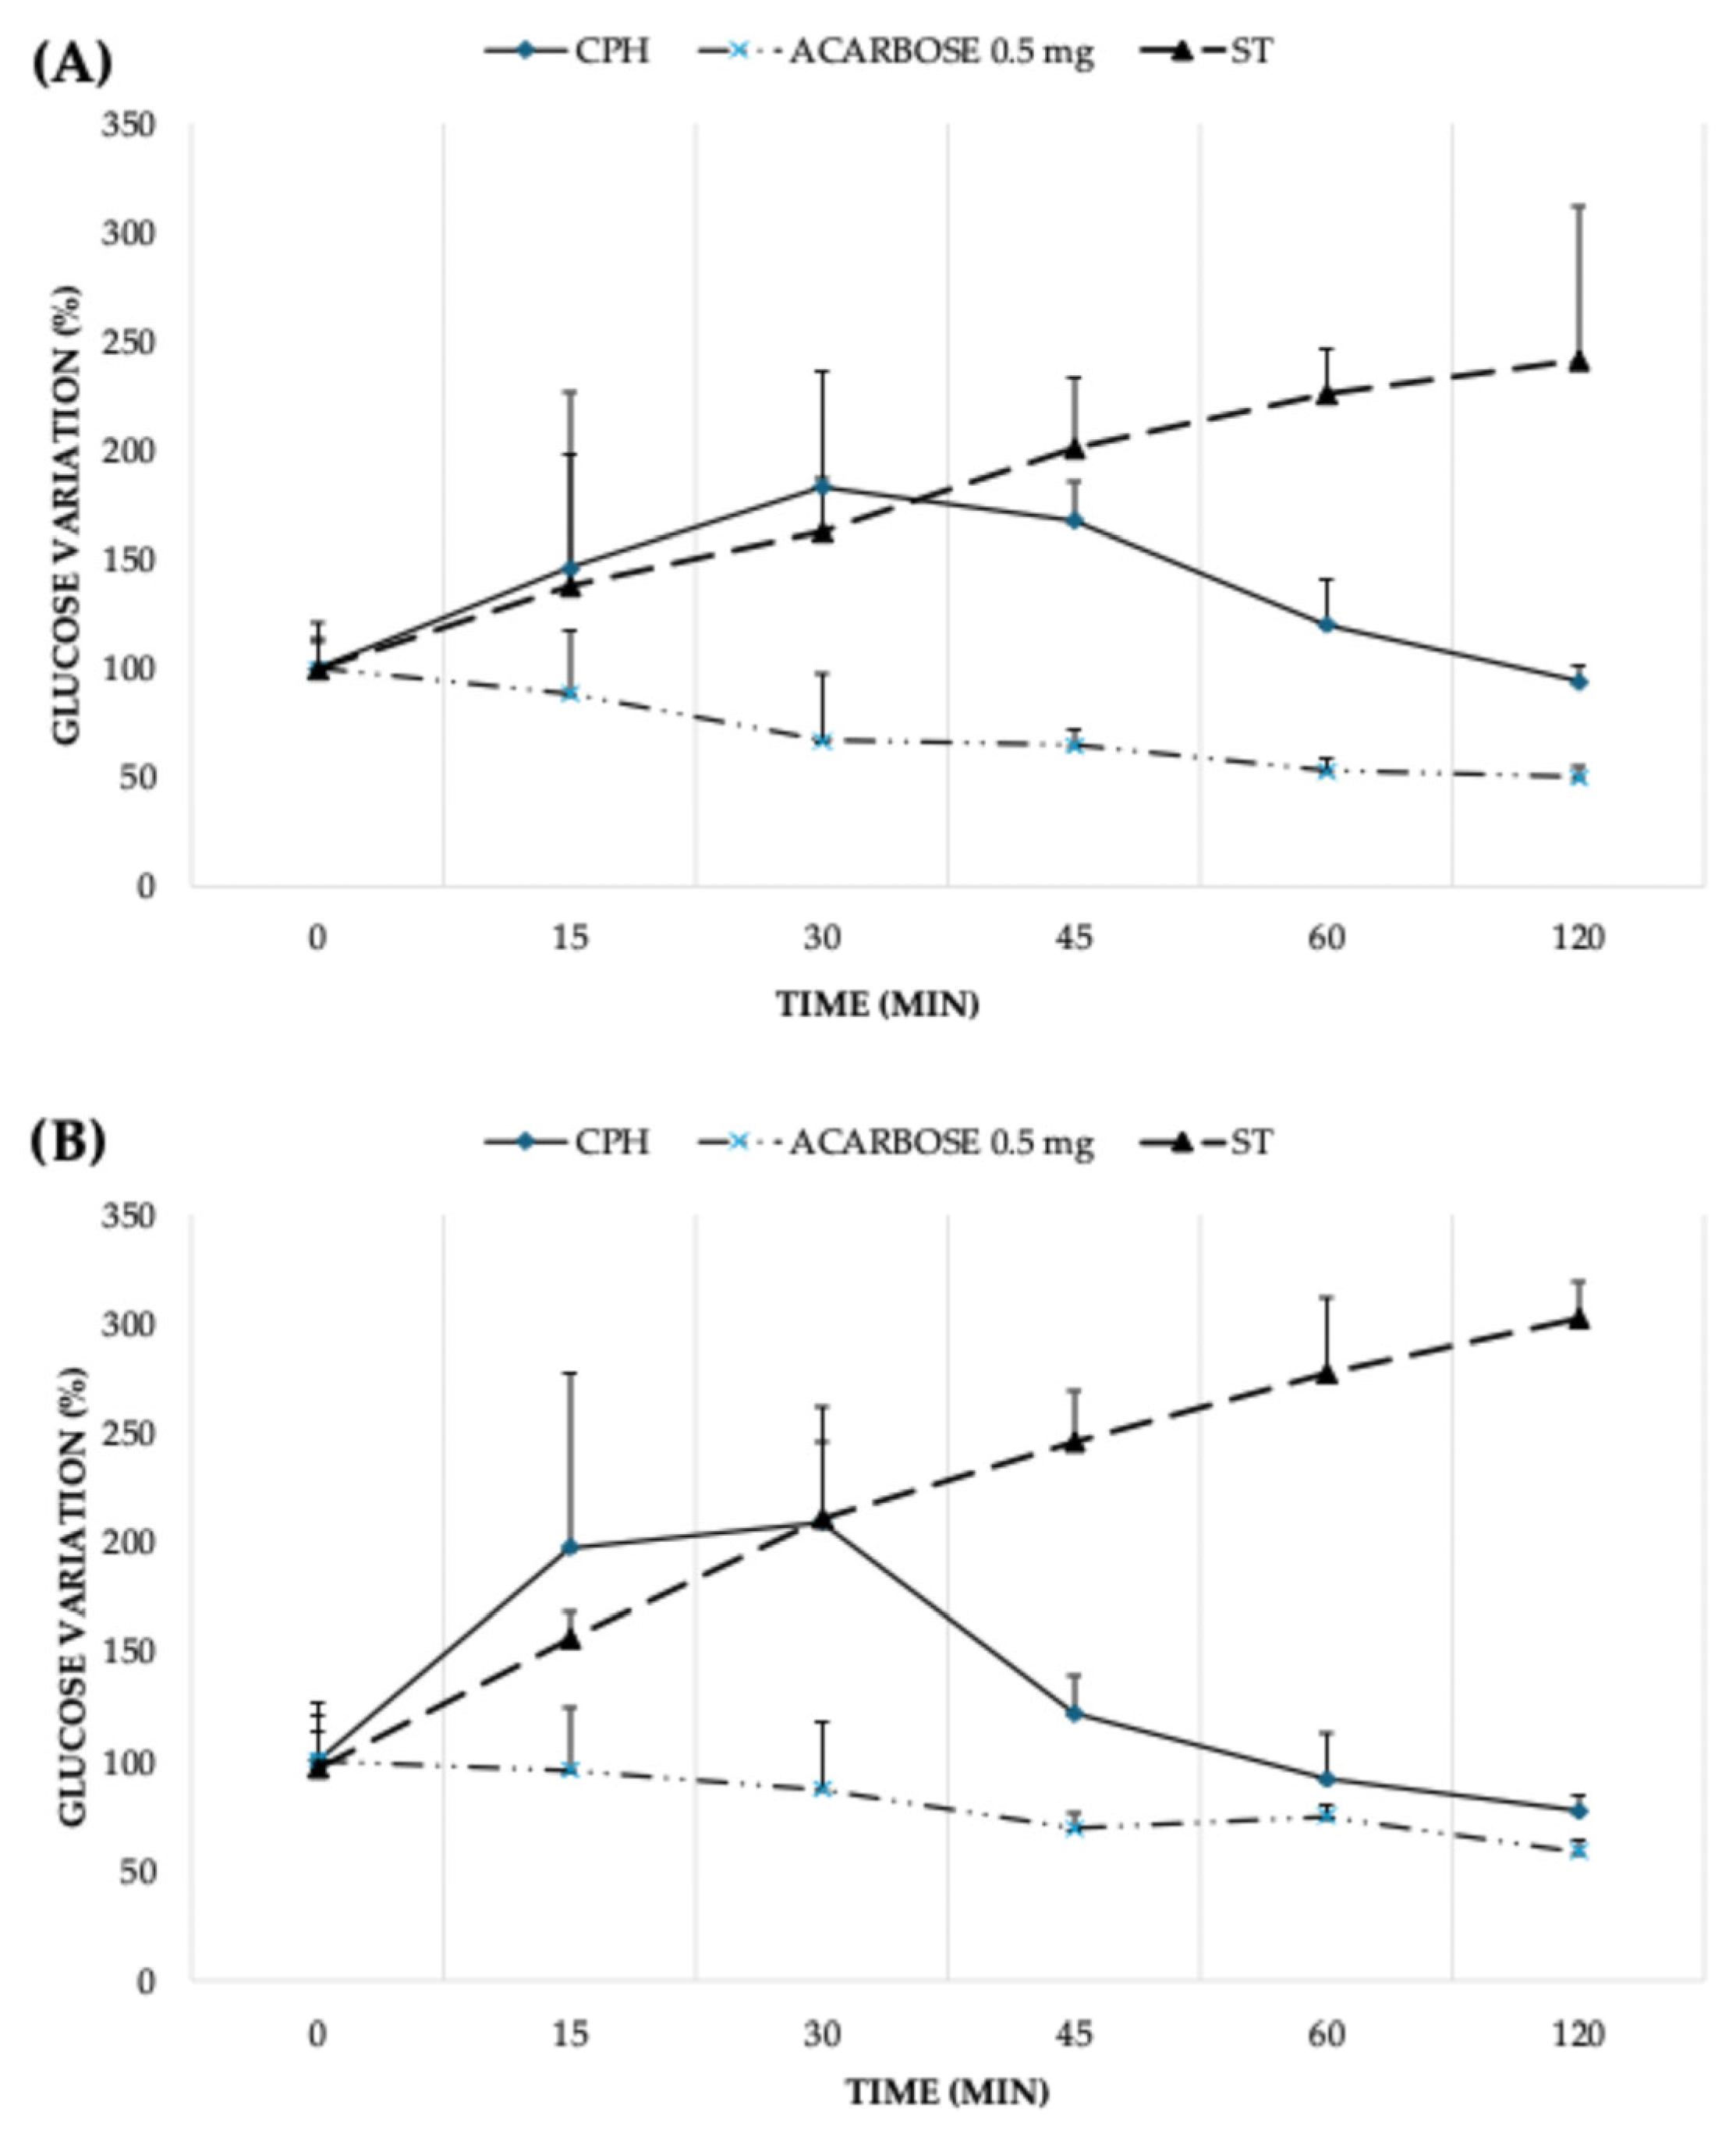
The results of the oral glucose tolerance test (OGTT) performed on day 1 (Figure 2A) of the experiment are shown in Figure 2. Rats treated with CPH showed an increase in postprandial glucose at 30 min, followed by an antihyperglycemic response beginning at minute 45, ultimately showing a 5.8% decrease in blood glucose by minute 120 compared to initial values. In contrast, in the OGTT performed on day 30 (after 4 weeks of treatment), as shown in Figure 2B, a 23.42% reduction in blood glucose relative to baseline was recorded, indicating that chronic administration of the extract produced a stronger antihyperglycemic effect than acute administration.
When compared with the untreated diabetic group (ST), the latter showed poor glycemic control, with blood glucose rising by 141% at minute 120, resulting in severe hyperglycemia. Moreover, the reference drug (acarbose) produced a 50% reduction in postprandial glucose on day 1 and a 42% reduction at minute 120 on day 30.
Aprila-Fajrin et al. [25] evaluated an ethanolic cocoa pod extract and reported that the normotensive and hypertensive control groups exhibited increases rather than decreases in fasting blood glucose levels. The greatest reduction was observed in the group receiving 750 mg/kg (29.58%), followed by those receiving 500 mg/kg (24.37%) and 250 mg/kg (22.63%) [25].
In a similar vein, Yamashita et al. [90] conducted an OGTT to evaluate procyanidins extracted from cocoa liquor and its fractions. In the control group, plasma glucose increased to 150% at 15 min after the glucose load and then gradually declined. Administration of 10 mg/kg procyanidins suppressed the rise at 15 min. The high-polymer fraction significantly suppressed glucose levels (to 100%) between 5 and 60 min, while the low-polymer fraction reduced levels to 75% between 15 and 30 min. At a lower dose (1 mg/kg), the high-polymer fraction suppressed glucose at 15 min; in comparison, the low-polymer fraction suppressed it at both 15 and 30 min. Procyanidins, abundant polyphenols in cocoa, are widely recognized as major contributors to this antihyperglycemic activity.

3.5. FTIR Spectroscopy

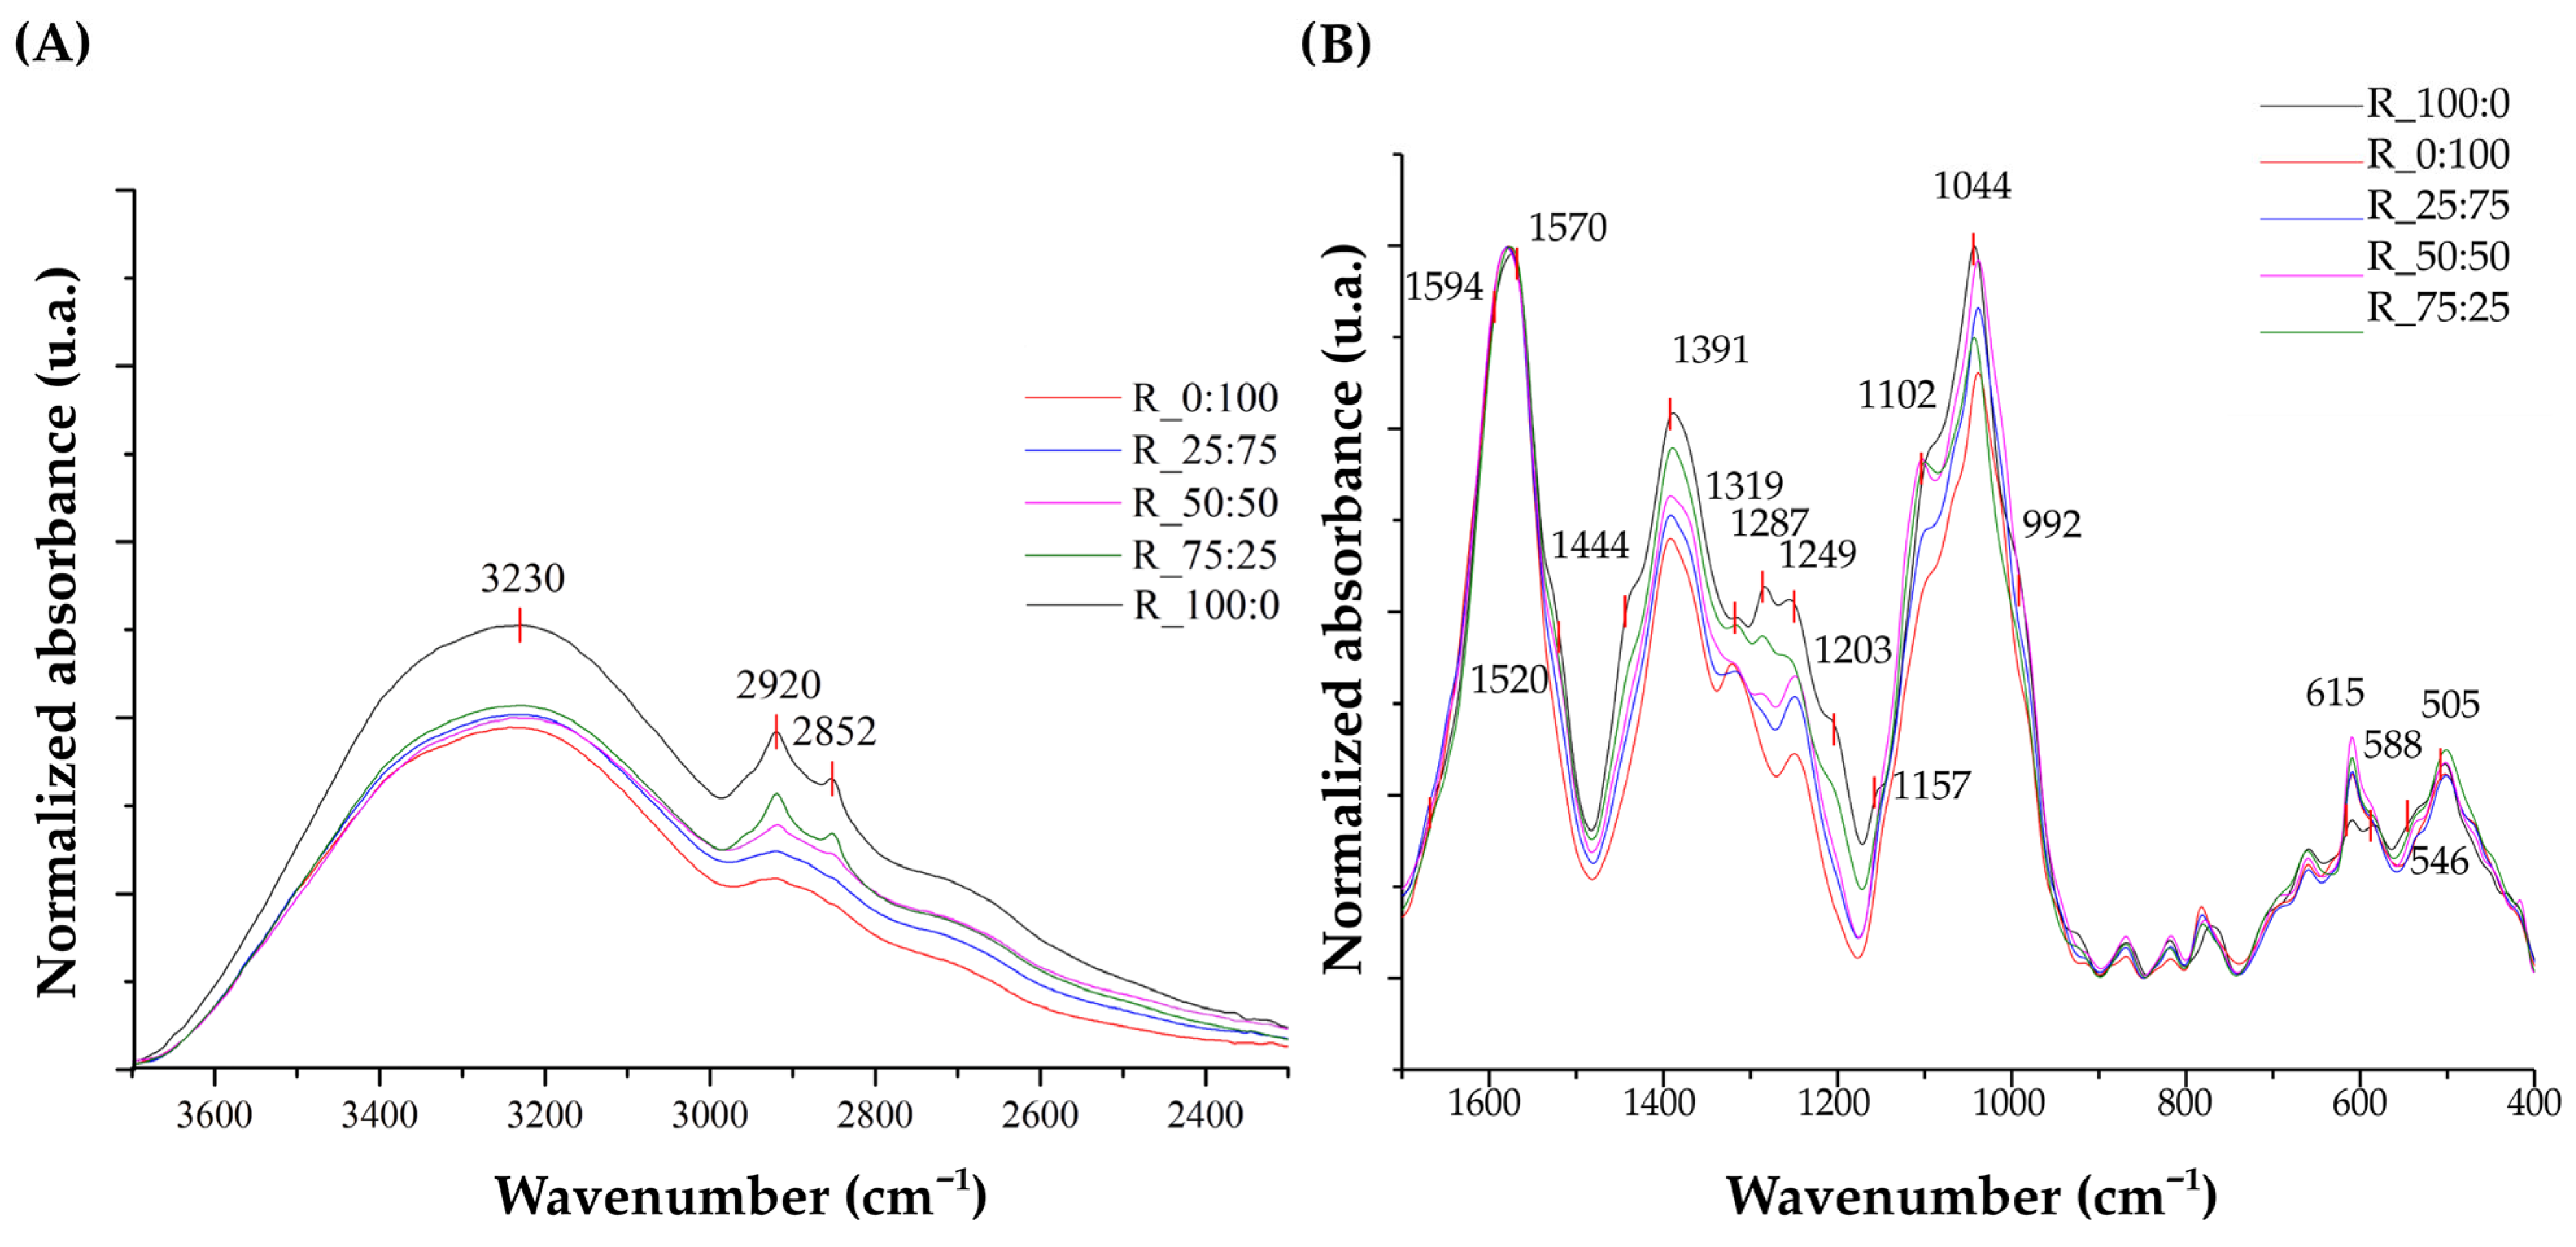
The signals found in the dried CPH extracts obtained using ultrasound are shown in Figure 3. Figure 3A shows in the functional group region a signal at 3230 cm−1 associated with the –OH stretching band, attributable to phenolic compounds, alcohols, and hydrogen-bonded residual water [76]. This signal is more intense in the 100:0 solvent ratio (R_100:0), which is associated with higher polyphenol content in the dry extract in which pure ethanol was used, which is demonstrated by the results presented in Table 2. Two signals at 2920 and 2852 cm−1 were also identified. These peaks are attributed to antisymmetric and symmetric type stretches of –CH2 [91,92], which are associated with the presence of lipid and aliphatic compounds. Similar to the case of the band at 3230 cm−1, the peaks are more pronounced in the ethanol-rich extracts (R_100:0 and R_75:25), with this factor being related to the polarity of the ethanol–water solvent ratio of 100:0, since it is better able to extract lipophilic compounds.
The fingerprint region of the dried extracts between wavelengths of 1700 and 400 cm−1, with signals at 1594, 1570, and 1520 cm−1, is shown in Figure 3B. These vibrations are associated with aromatic C=C stretches and are typical bands of phenolic compounds [76], indicated by the results presented in Table 2. They are more intense at R_100:0 and decrease with higher water content.
The second band is found at a peak of 1391 cm−1, which exhibits a 1444 cm−1 shoulder associated with –CH2 deformation related to lipid or CPH structural compounds [91]. Thereafter, signals at 1319 and 1287 cm−1, which are likely –C–O vibrations and O–H deformations [93], typical in phenolic compounds, are also present in the spectrum.
Signals found at 1249, 1203, and 1157 cm−1 belong to stretching of C–O functional groups of esters or alcohols and CH2 bending vibrations [76,91].
The peak found at 1044 cm−1 presents a shoulder at 1102 cm−1; this signal is related to the C–O–C functional group, common in carbohydrates such as cellulose and hemicellulose and its intensity indicates higher solubility and extraction of sugars in water-rich solvent ratios (R_0:100 and R_25:75). In addition, this signal also exhibits a second shoulder related to out-of-plane bending of the –HC=CH–(trans) bonds associated with acetylene groups of aromatic compounds [76].
Lastly, the region located between 615 and 505 cm−1 also showed changes based on the solvent ratio used in the extraction. This region has complex bands, which are associated with out-of-plane deformations and aromatic skeletons or structural compounds of the CPH itself.

3.6. Multivariate Analysis

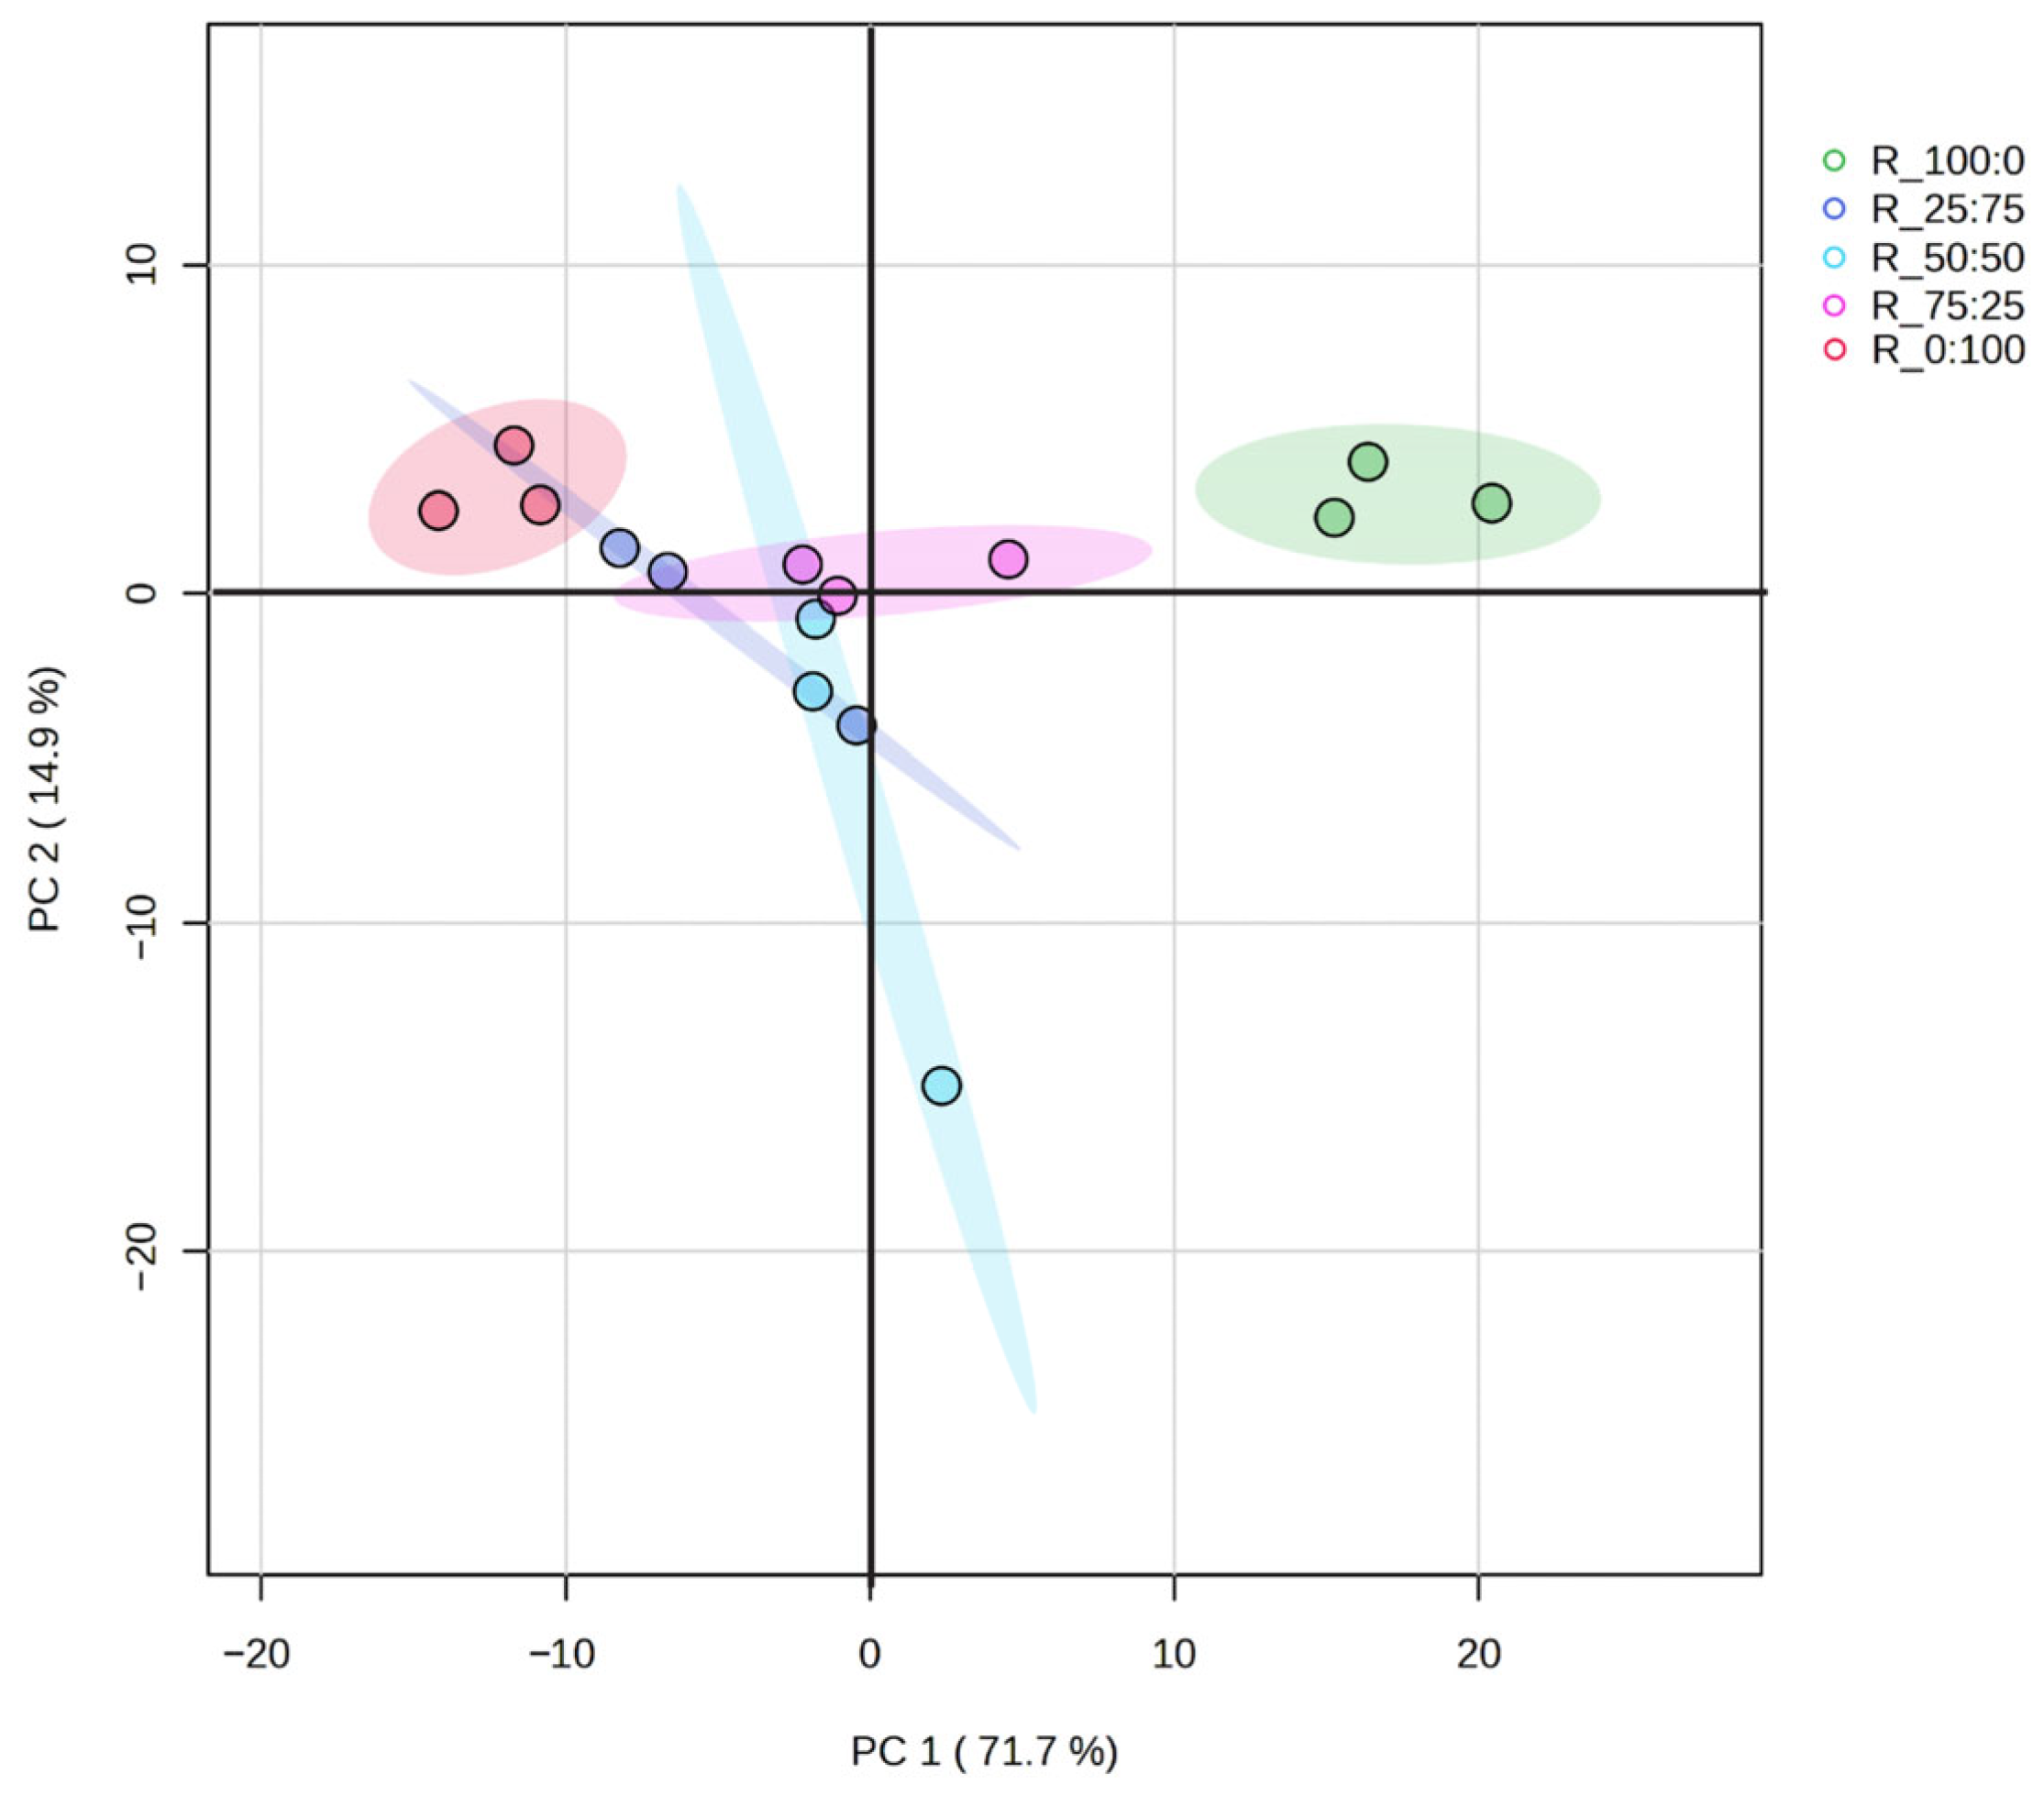
The CPH extracts are visually grouped in Figure 4 based on their chemical solvent similarity. The first principal components (PC1 and PC2) explain 86.6% of the total variability of the data, with values of 71.7% and 14.9%. Two groups and four sub-groupings are observed within one of them, which correspond to the extracts of each ethanol–water solvent ratio. The pure mixtures R_100:0 and R_0:100 occupy positions between the extremes, and the separation from the pure composition of the solvents is clear, which is consistent with the fact that they extract different types of compounds.
Furthermore, from the PCA results, it can be observed that the ethanol–water solvent ratios R_25:75 and R_50:50 present a greater dispersion in their repetitions, which indicates greater variability in their chemical profile. Regarding the extract obtained from the solvent ratio R_75:25, it is located near the center and acts as a transition point between the extracts.
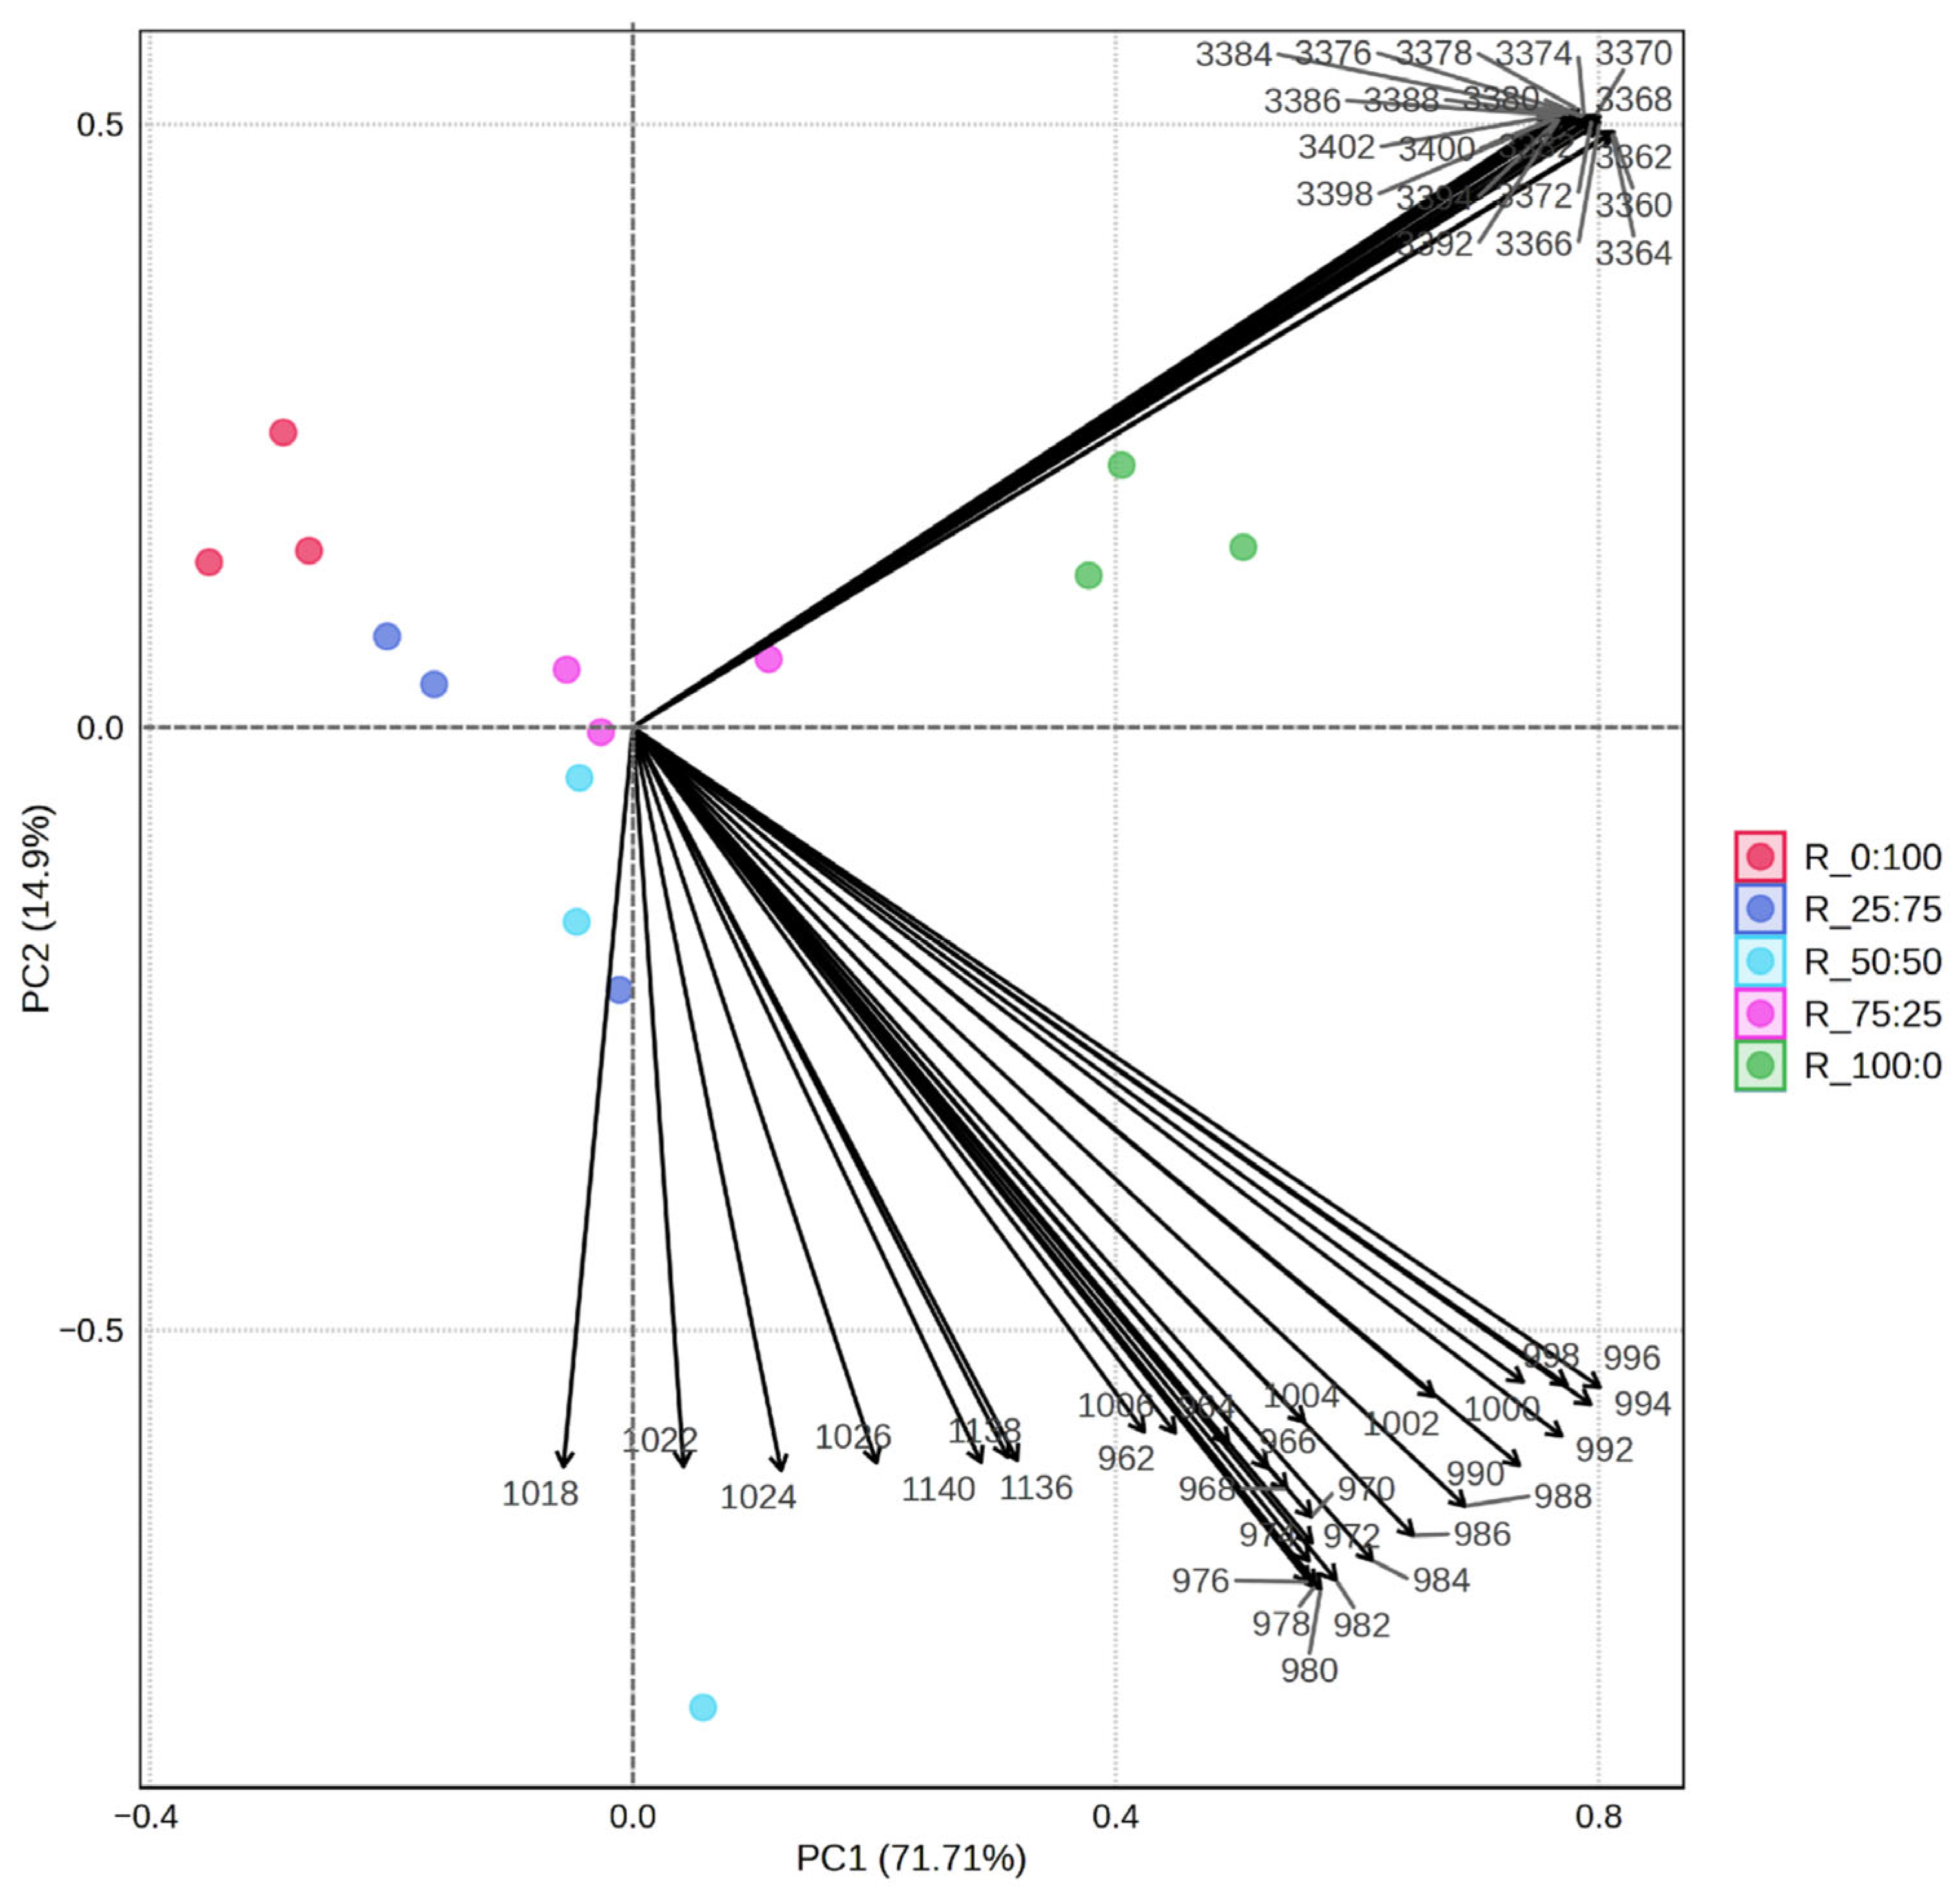
The PCA loading plot (Figure 5) reveals that the separation of extracts is governed by two primary chemical features. PC1, accounting for 71.71% of the total variance, is heavily weighted by signals in the 1140–970 cm−1 range. These vectors represent the C–O and C–C stretching vibrations characteristic of the fingerprint region, specifically correlating with the skeletal structures of polyphenolic flavonoids and carbohydrate moieties. The high magnitude of these loadings in the positive direction of PC1 indicates that these specific bioactive metabolites are significantly more concentrated in the R_100:0 and R_75:25 extracts compared to the aqueous-heavy ratios. Simultaneously, the cluster of loadings between 3402 and 3360 cm−1 corresponds to the stretching vibrations of hydroxyl (–OH) groups. The alignment of these vectors with the R_100:0 (pure ethanol) samples suggests a high degree of solvent–solute interaction, likely due to the extraction of free phenolic monomers, which possess multiple H-bonding sites. The clear spatial differentiation between the 1140–970 cm−1 subgroups (subgroup 1: 962–1140 cm−1 and subgroup 2: 1000–964 cm−1) further suggests that the different proportions of ethanol and water not only change the concentration but also selectively divide different classes of bioactive compounds based on their molecular polarity [91,94].
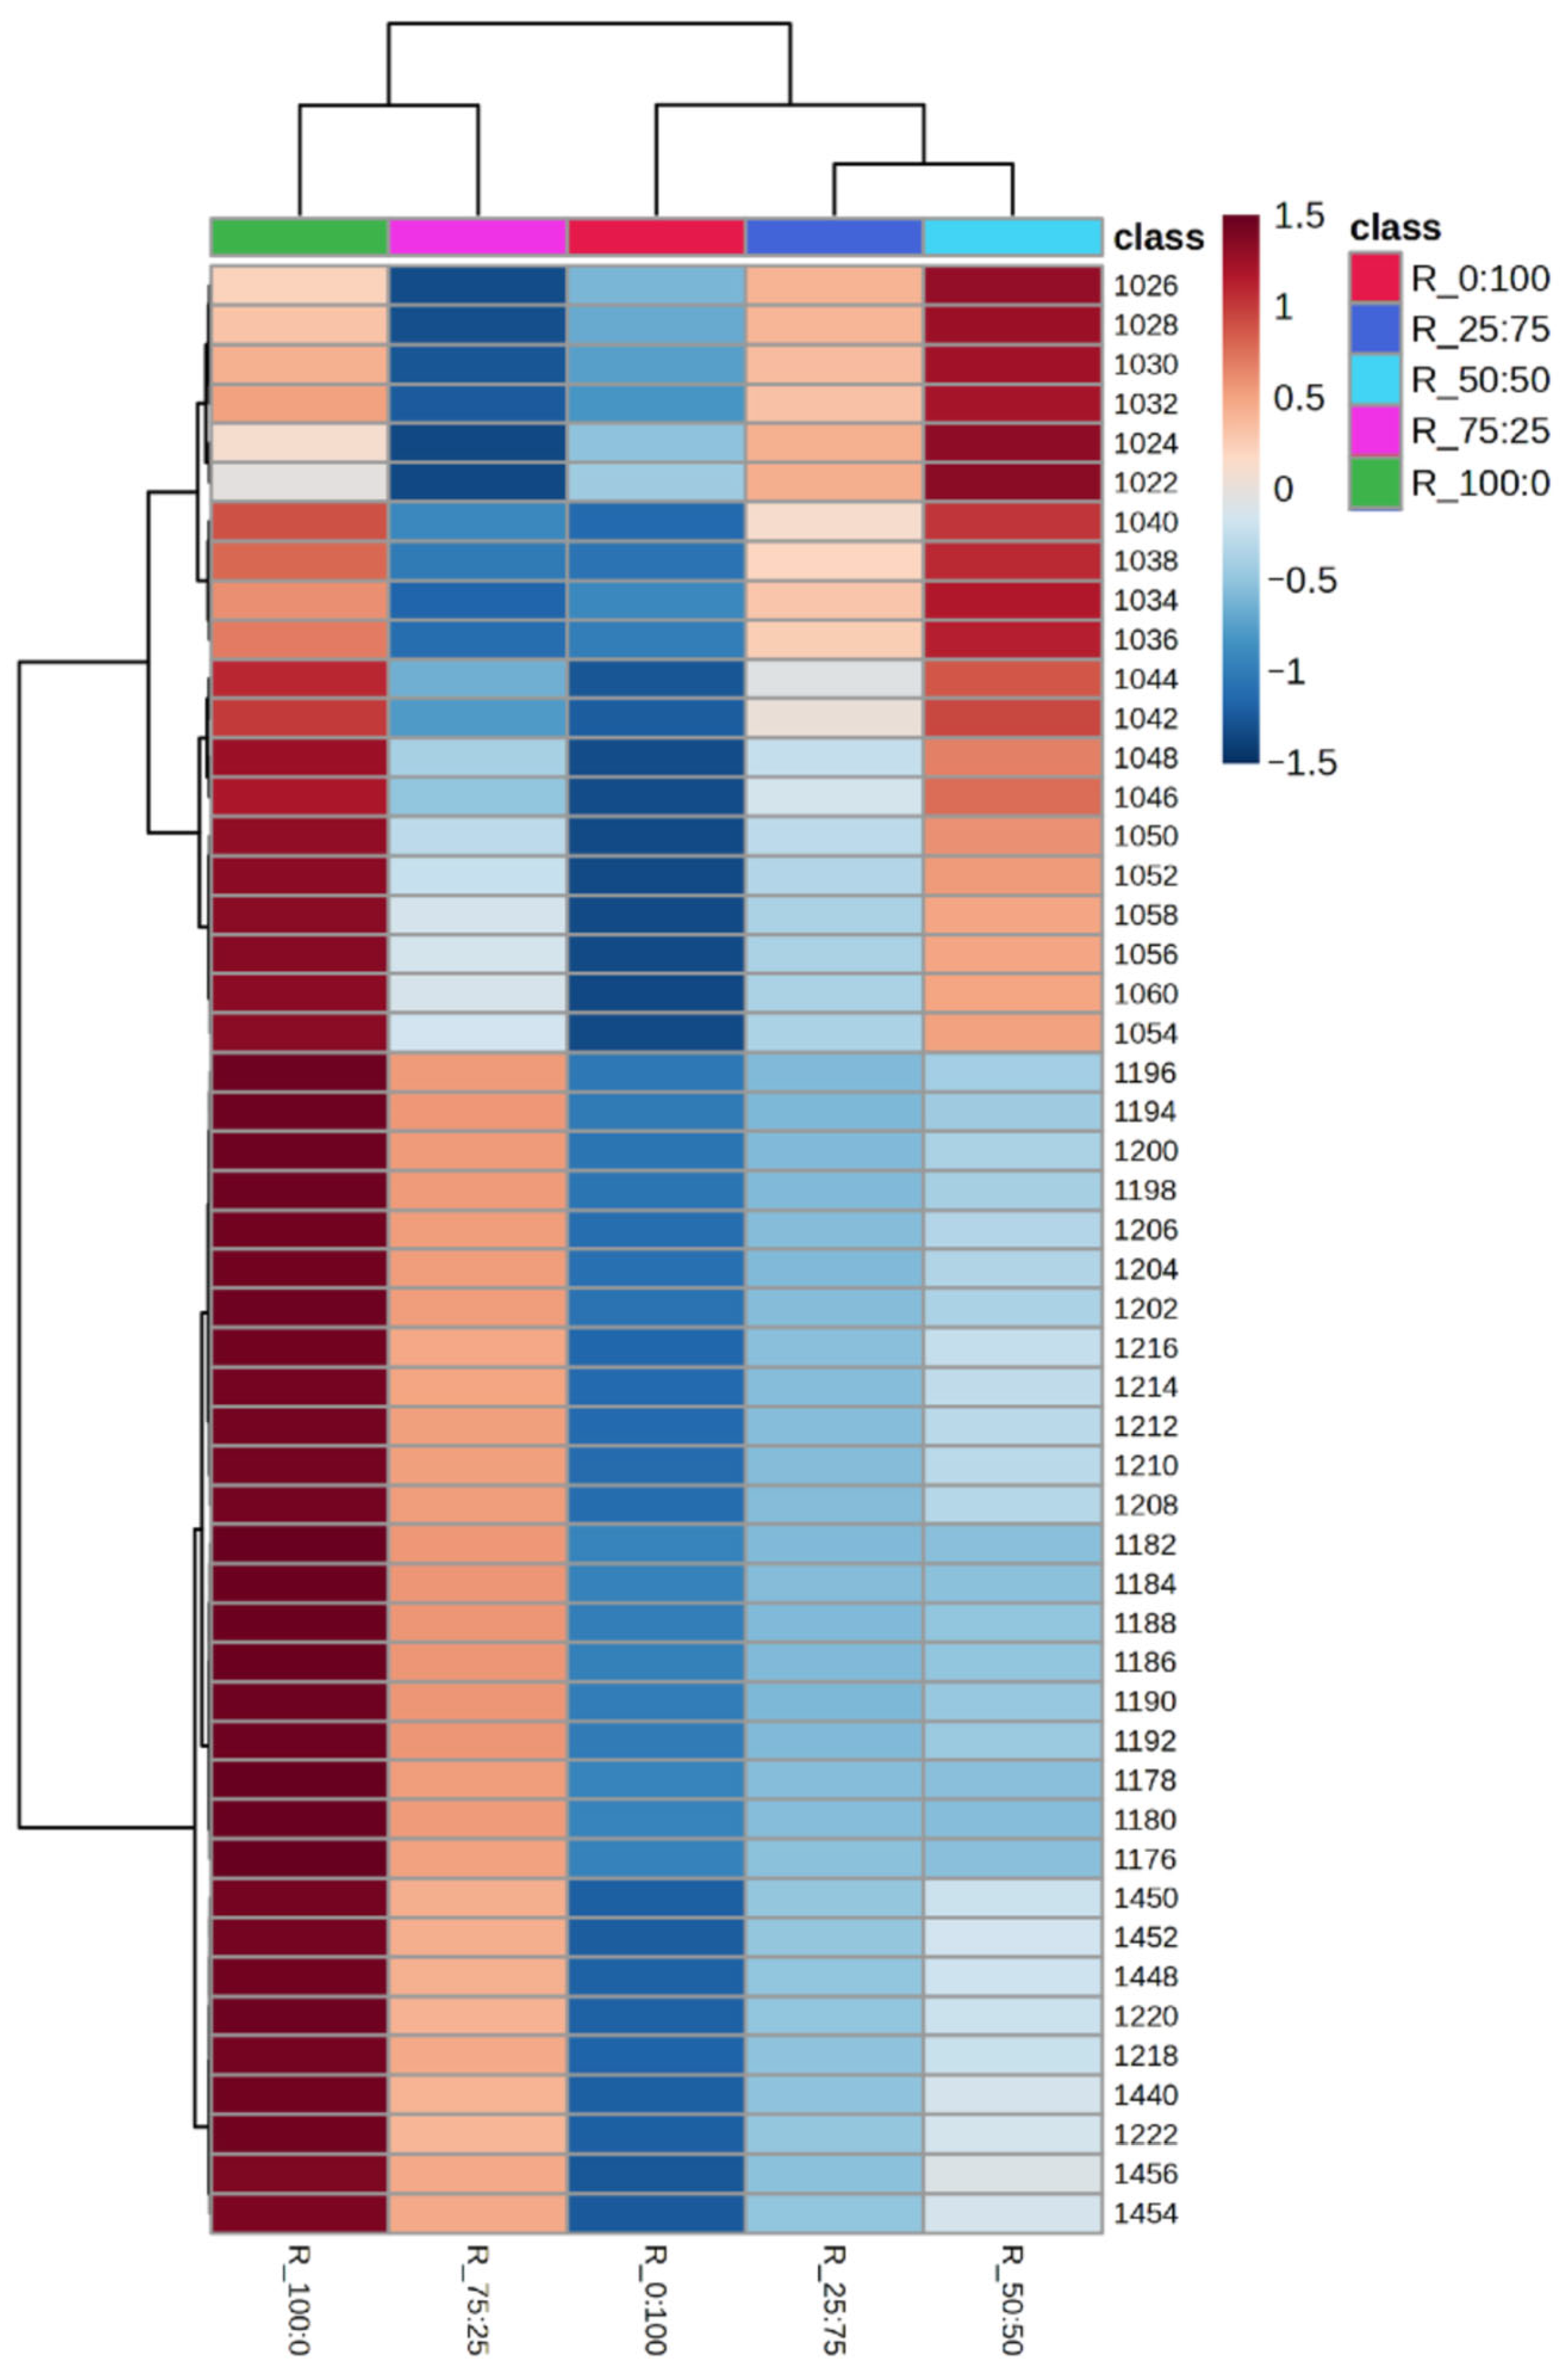
Lastly, the heat map of the 50 most representative FTIR signals in the CPH extracts is presented in Figure 6. The colors in the heat map represent the highest values relative to the average of the analyzed data; the blue color indicates the lowest values relative to the average, and the light or white tones represent values close to the average. The map shows a clear clustering between the different mixing ratios, with significant differentiation between the extremes of the pure solvent ratios (R_0:100 and R_100:0). Two main clusters, with corresponding sub-clusters, are shown in Figure 4, further indicating that each treatment influenced the functional groups differently. The spectral signals in the 1026–1054 cm−1 and 1182–1218 cm−1 regions show significant variations in intensity that could be related to changes in the chemical composition of the samples due to the effect of the extraction as a function of the solvent used and, hence, the formation of differentiated groups. The hierarchical clustering of both samples and bands suggests that spectral signals respond progressively to mixing ratios, allowing for possible differentiation between treatments.

4. Conclusions

The results presented in this study confirm that cocoa pod husk is a high-potential agro-industrial residue for the recovery of bioactive compounds through ultrasound-assisted extraction. Our findings reveal solvent-dependent recovery patterns: absolute ethanol maximized the yield of total phenolics (171.43 mg GAE/g) and flavonoids (132.05 mg QE/g), whereas a 50:50 hydroalcoholic mixture optimized the balance between extraction efficiency and antioxidant capacity (DPPH: 503.52 μM TE/g; FRAP: 880.79 μM TE/g). Chemical profiling via FTIR and PCA identified the selective recovery of key metabolites, such as theobromine, quercetin, and hesperidin, with ethanolic extracts showing a distinctive prevalence of hydroxyl groups (3230 cm−1).
Beyond chemical characterization, in vivo evaluations demonstrated the functional potential of these extracts. While antihypertensive effects were modest, significant antihyperglycemic activity was observed following chronic administration, resulting in a 23.4% reduction in blood glucose levels by day 30. Compared to conventional methods, UAE provided superior extraction rates and reduced processing times without the need for toxic solvents. Consequently, this sustainable bioprocess positions CPH-derived extracts as viable, eco-friendly ingredients for the nutraceutical, cosmetic, and functional food industries.

Supplementary Materials

The following supporting information can be downloaded at: https://www.mdpi.com/article/10.3390/chemengineering10040043/s1, Figure S1: Bioactive compounds and antioxidant activity of cocoa pod husk extracts at different granulometries.

Author Contributions

The authors: F.A.G.-A., A.C.-L., M.M.-S., R.G.-A., J.A.A.-L., D.S., J.J.A.-F. and P.G.-A., contributed to the conception and design of the study. The conceptualization and supervision were conducted by P.G.-A., R.G.-A. and M.M.-S. The methodology and data validation of the study were developed by F.A.G.-A., A.C.-L., J.A.A.-L., D.S. and J.J.A.-F. The first draft of the manuscript was written by F.A.G.-A., P.G.-A. and A.C.-L. P.G.-A. and F.A.G.-A. was responsible for the project’s administration, with both resource contributions and funding acquisition: A.C.-L. and P.G.-A. The autors: F.A.G.-A., A.C.-L., M.M.-S., R.G.-A., J.A.A.-L., D.S., J.J.A.-F. and P.G.-A., participated in the review and editing of the final manuscript. All authors have read and agreed to the published version of the manuscript.

Funding

This research was funded by Consejo de Ciencia y Tecnología del Estado de Tabasco (CCyTET), through the “Programa para el Desarrollo por la Ciencia, la Tecnología y la Innovación del Estado” with number of project: PRODECTI-2022-01/07, and by Fondo Mixto of CONACYT-Gobierno de Tabasco No. TAB-2018-01-01-84312. Fanny Adabel González-Alejo received scholarship No. 706480 from Secretariat of Science, Humanities, Technology and Innovation (SECIHTI).

Data Availability Statement

Enquiries about data availability should be directed to the authors.

Conflicts of Interest

The manuscript was written and reviewed with the participation of all the authors, who declare that they have no conflicts of interest that would compromise the validity of the results presented.

References

  1. de Araújo Veloso, M.C.R.; Pires, M.R.; Villela, L.S.; Scatolino, M.V.; de Paula Protásio, T.; Mendes, L.M.; Júnior, J.B.G. Potential Destination of Brazilian Cocoa Agro-Industrial Wastes for Production of Materials with High Added Value. Waste Manag. 2020, 118, 36–44. [Google Scholar] [CrossRef]
  2. Lu, F.; Rodriguez-Garcia, J.; Van Damme, I.; Westwood, N.J.; Shaw, L.; Robinson, J.S.; Warren, G.; Chatzifragkou, A.; McQueen Mason, S.; Gomez, L.; et al. Valorisation Strategies for Cocoa Pod Husk and Its Fractions. Curr. Opin. Green Sustain. Chem. 2018, 14, 80–88. [Google Scholar] [CrossRef]
  3. Tovar, A.M.; Valencia, L.F.; Villa, A.L. Life Cycle Assessment of Colombian Cocoa Pod Husk Transformation into Value-Added Products. Bioresour. Technol. Rep. 2024, 25, 101772. [Google Scholar] [CrossRef]
  4. Yadav, A.; Sharma, V.; Tsai, M.L.; Sharma, D.; Nargotra, P.; Chen, C.W.; Sun, P.P.; Dong, C.D. Synergistic Microwave and Acidic Deep Eutectic Solvent-Based Pretreatment of Theobroma cacao Pod Husk Biomass for Xylooligosaccharides Production. Bioresour. Technol. 2024, 400, 130702. [Google Scholar] [CrossRef]
  5. International Cocoa Organization Statistics. Available online: https://www.icco.org/statistics/ (accessed on 1 October 2024).
  6. Mansur, D.; Tago, T.; Masuda, T.; Abimanyu, H. Conversion of Cacao Pod Husks by Pyrolysis and Catalytic Reaction to Produce Useful Chemicals. Biomass Bioenergy 2014, 66, 275–285. [Google Scholar] [CrossRef]
  7. Mariatti, F.; Gunjević, V.; Boffa, L.; Cravotto, G. Process Intensification Technologies for the Recovery of Valuable Compounds from Cocoa By-Products. Innov. Food Sci. Emerg. Technol. 2021, 68, 102601. [Google Scholar] [CrossRef]
  8. Garcés-Fiallos, F.R.; Moreira-Morrillo, A.A.; Vera-Coello, D.I.; Solís-Hidalgo, Z.K.; Canchignia-Martínez, H.F.; Cedeño-Moreira, Á.V. Cacao Diseases Caused by Fungi and Fungi-like in Latin American Agrosystems. In Sustainable Cacao Cultivation in Latin America, 1st ed.; Routledge: London, UK, 2024; pp. 143–167. [Google Scholar] [CrossRef]
  9. Hebbar, P.K. Cacao Diseases: A Global Perspective from an Industry Point of View. Phytopathology 2007, 97, 1658–1663. [Google Scholar] [CrossRef] [PubMed]
  10. Jayalakshmi, K.; Adivappar, A.; Nagarajappa, N.; Raju, J.; Narasimhamurthy, H.B.; Narayanaswamy, P.; Shivanna, S.; Ravindra, H. Occurrence and Distribution of Black Pod Rot of Cocoa (Theobromae cocoa L.) in Southern Transition Zone of Karnataka. J. Appl. Nat. Sci. 2017, 9, 1901–1904. [Google Scholar] [CrossRef][Green Version]
  11. Ramos, L.H.; Cisneros-Yupanqui, M.; Santisteban Soto, D.V.; Lante, A.; Favaro, L.; Casella, S.; Basaglia, M. Exploitation of Cocoa Pod Residues for the Production of Antioxidants, Polyhydroxyalkanoates, and Ethanol. Fermentation 2023, 9, 843. [Google Scholar] [CrossRef]
  12. Dewan, A.; Malik, M.; Shobhit; Chaudhary, V.; Sharma, A. Packaging Applications of Cocoa Pod Husk. In Agro-Wastes for Packaging Applications, 1st ed.; CRC Press: Boca Raton, FL, USA, 2024; pp. 264–287. [Google Scholar] [CrossRef]
  13. Valladares-Diestra, K.K.; Porto de Souza Vandenberghe, L.; Ricardo Soccol, C. A Biorefinery Approach for Pectin Extraction and Second-Generation Bioethanol Production from Cocoa Pod Husk. Bioresour. Technol. 2022, 346, 126635. [Google Scholar] [CrossRef]
  14. Delgado-Ospina, J.; Lucas-González, R.; Viuda-Martos, M.; Fernández-López, J.; Pérez-Álvarez, J.Á.; Martuscelli, M.; Chaves-López, C. Bioactive Compounds and Techno-Functional Properties of High-Fiber Co-Products of the Cacao Agro-Industrial Chain. Heliyon 2021, 7, e06799. [Google Scholar] [CrossRef]
  15. Valadez-Carmona, L.; Plazola-Jacinto, C.P.; Hernández-Ortega, M.; Hernández-Navarro, M.D.; Villarreal, F.; Necoechea-Mondragón, H.; Ortiz-Moreno, A.; Ceballos-Reyes, G. Effects of Microwaves, Hot Air and Freeze-Drying on the Phenolic Compounds, Antioxidant Capacity, Enzyme Activity and Microstructure of Cacao Pod Husks (Theobroma cacao L.). Innov. Food Sci. Emerg. Technol. 2017, 41, 378–386. [Google Scholar] [CrossRef]
  16. Nguyen, V.T.; Tran, A.X.; Le, V.A.T. Microencapsulation of Phenolic-Enriched Extract from Cocoa Pod Husk (Theobroma cacao L.). Powder Technol. 2021, 386, 136–143. [Google Scholar] [CrossRef]
  17. Hernández-Hernández, C.; Morales-Sillero, A.; Fernández-Bolaños, J.; Bermúdez-Oria, A.; Morales, A.A.; Rodríguez-Gutiérrez, G. Cocoa Bean Husk: Industrial Source of Antioxidant Phenolic Extract. J. Sci. Food Agric. 2019, 99, 325–333. [Google Scholar] [CrossRef] [PubMed]
  18. Ji, H.; Dong, C.; Yang, G.; Pang, Z. Valorization of Lignocellulosic Biomass toward Multipurpose Fractionation: Furfural, Phenolic Compounds, and Ethanol. ACS Sustain. Chem. Eng. 2018, 6, 15306–15315. [Google Scholar] [CrossRef]
  19. Valadez-Carmona, L.; Ortiz-Moreno, A.; Ceballos-Reyes, G.; Mendiola, J.A.; Ibáñez, E. Valorization of Cacao Pod Husk through Supercritical Fluid Extraction of Phenolic Compounds. J. Supercrit. Fluids 2018, 131, 99–105. [Google Scholar] [CrossRef]
  20. Abdul Karim, A.; Azlan, A.; Ismail, A.; Hashim, P.; Abd Gani, S.S.; Zainudin, B.H.; Abdullah, N.A. Phenolic Composition, Antioxidant, Anti-Wrinkles and Tyrosinase Inhibitory Activities of Cocoa Pod Extract. BMC Complement. Altern. Med. 2014, 14, 381. [Google Scholar] [CrossRef]
  21. Nguyen, V.T.; Pham, T.D.; Vu, L.B.; Nguyen, V.H.; Tran, N.L. Microwave-Assisted Extraction for Maximizing the Yield of Phenolic Compounds and Antioxidant Capacity from Cacao Pod Husk (Theobroma cacao L.). Curr. Nutr. Food Sci. 2020, 17, 225–237. [Google Scholar] [CrossRef]
  22. Afzal, H.S.; Uttra, A.M.; Qasim, S.; Malik, A.; Mobashar, A. Theobromine as a Multi-Target Therapeutic Agent: Analgesic, Anti-Inflammatory, and Anti-Arthritic Potential with Network Pharmacology Insights. Ann. Pharm. Fr. 2025, 83, 1114–1129. [Google Scholar] [CrossRef]
  23. Barrios-Rodríguez, Y.F.; Salas-Calderón, K.T.; Orozco-Blanco, D.A.; Gentile, P.; Girón-Hernández, J. Cocoa Pod Husk: A High-Pectin Source with Applications in the Food and Biomedical Fields. ChemBioEng Rev. 2022, 9, 462–474. [Google Scholar] [CrossRef]
  24. Vriesmann, L.C.; de Mello Castanho Amboni, R.D.; de Oliveira Petkowicz, C.L. Cacao Pod Husks (Theobroma cacao L.): Composition and Hot-Water-Soluble Pectins. Ind. Crops Prod. 2011, 34, 1173–1181. [Google Scholar] [CrossRef]
  25. Fajrin, F.A.; Holidah, D.; Nurhidayah, H.; Wulansari, P.S.; Restanto, D.P.; Azkiyah, L.; Witono, Y.; Nugraha, A.S. The Ethanol Extract of Cocoa Pod Husk Minimizes Hyperalgesia and Blood Glucose Levels in Diabetic Neuropathy Model through Transient Receptor Protein Vanilloid (TRPV)-1. Saudi Pharm. J. 2024, 32, 102097. [Google Scholar] [CrossRef]
  26. Nguyen, V.T.; Thi Tran, P.T. Characterization of Microencapsulated Powders Rich in Saponins from Cocoa Pod Husk (Theobroma cacao L.) and Medicinal Plant an Xoa (Helicteres Hirsuta Lour.). Heliyon 2024, 10, e32703. [Google Scholar] [CrossRef]
  27. Abdul Wahab, N.; Abdul Rahman, R.; Ismail, A.; Mustafa, S.; Hashim, P. Assessment of Antioxidant Capacity, Anti-Collagenase and Anti-Elastase Assays of Malaysian Unfermented Cocoa Bean for Cosmetic Application. Nat. Prod. Chem. Res. 2014, 2, 1000132. [Google Scholar] [CrossRef]
  28. Jumar, A.; Schmieder, R.E. Cocoa Flavanol Cardiovascular Effects Beyond Blood Pressure Reduction. J. Clin. Hypertens. 2016, 18, 352–358. [Google Scholar] [CrossRef]
  29. Nguyen, V.T.; Nguyen, N.H. Proximate Composition, Extraction, and Purification of Theobromine from Cacao Pod Husk (Theobroma cacao L.). Technologies 2017, 5, 14. [Google Scholar] [CrossRef]
  30. Díaz-González, A.; Luna, M.Y.P.; Morales, E.R.; Saldaña-Trinidad, S.; Blanco, L.R.; de la Cruz-Arreola, S.; Pérez-Sariñana, B.Y.; Robles-Ocampo, J.B. Assessment of the Pretreatments and Bioconversion of Lignocellulosic Biomass Recovered from the Husk of the Cocoa Pod. Energies 2022, 15, 3544. [Google Scholar] [CrossRef]
  31. Patra, A.; Abdullah, S.; Pradhan, R.C. Review on the Extraction of Bioactive Compounds and Characterization of Fruit Industry By-Products. Bioresour. Bioprocess. 2022, 9, 14. [Google Scholar] [CrossRef] [PubMed]
  32. Zampar, G.G.; Zampar, I.C.; Beserra da Silva de Souza, S.; da Silva, C.; Bolanho Barros, B.C. Effect of Solvent Mixtures on the Ultrasound-Assisted Extraction of Compounds from Pineapple by-Product. Food Biosci. 2022, 50, 102098. [Google Scholar] [CrossRef]
  33. Kyzas, G.Z.; Matis, K.A. Green Separation and Extraction Processes: Part I. Processes 2020, 8, 374. [Google Scholar] [CrossRef]
  34. Nguyen, V.T. Mass Proportion, Proximate Composition and Effects of Solvents and Extraction Parameters on Pigment Yield from Cacao Pod Shell (Theobroma cacao L.). J. Food Process. Preserv. 2015, 39, 1414–1420. [Google Scholar] [CrossRef]
  35. Zaiter, A.; Becker, L.; Petit, J.; Zimmer, D.; Karam, M.C.; Baudelaire, É.; Scher, J.; Dicko, A. Antioxidant and Antiacetylcholinesterase Activities of Different Granulometric Classes of Salix alba (L.) Bark Powders. Powder Technol. 2016, 301, 649–656. [Google Scholar] [CrossRef]
  36. Fiori, L.; Basso, D.; Costa, P. Seed Oil Supercritical Extraction: Particle Size Distribution of the Milled Seeds and Modeling. J. Supercrit. Fluids 2008, 47, 174–181. [Google Scholar] [CrossRef]
  37. Ouattara, L.Y.; Kouassi, E.K.A.; Soro, D.; Yao, K.B.; Fanou, G.D.; Drogui, A.P.; Tyagi, D.R. Optimization of Thermochemical Hydrolysis of Potassium Hydroxide-Delignified Cocoa (Theobroma cacao L) Pod Husks under Low Combined Severity Factors (CSF) Conditions. Sci. Afr. 2023, 22, e01908. [Google Scholar] [CrossRef]
  38. Vriesmann, L.C.; de Oliveira Petkowicz, C.L. Cacao Pod Husks as a Source of Low-Methoxyl, Highly Acetylated Pectins Able to Gel in Acidic Media. Int. J. Biol. Macromol. 2017, 101, 146–152. [Google Scholar] [CrossRef]
  39. Quiroz-Reyes, C.N.; Aguilar-Méndez, M.Á. Continuous Ultrasound and Pulsed Ultrasound: Selective Extraction Tools to Obtain Enriched Antioxidants Extracts from Cocoa Beans (Theobroma cacao L.). Innov. Food Sci. Emerg. Technol. 2022, 80, 103095. [Google Scholar] [CrossRef]
  40. Wani, K.M.; Uppaluri, R.V.S. Efficacy of Ultrasound-Assisted Extraction of Bioactive Constituents from Psidium Guajava Leaves. Appl. Food Res. 2022, 2, 100096. [Google Scholar] [CrossRef]
  41. Carreira-Casais, A.; Otero, P.; Garcia-Perez, P.; Garcia-Oliveira, P.; Pereira, A.G.; Carpena, M.; Soria-Lopez, A.; Simal-Gandara, J.; Prieto, M.A. Benefits and Drawbacks of Ultrasound-Assisted Extraction for the Recovery of Bioactive Compounds from Marine Algae. Int. J. Environ. Res. Public Health 2021, 18, 9153. [Google Scholar] [CrossRef]
  42. Borrás-Enríquez, A.J.; Reyes-Ventura, E.; Villanueva-Rodríguez, S.J.; Moreno-Vilet, L. Effect of Ultrasound-Assisted Extraction Parameters on Total Polyphenols and Its Antioxidant Activity from Mango Residues (Mangifera indica L. Var. Manililla). Separations 2021, 8, 94. [Google Scholar] [CrossRef]
  43. Chen, J.; Zhang, X.; Chen, Y.; Zhao, X.; Anthony, B.; Xu, X. Effects of Different Ultrasound Frequencies on the Structure, Rheological and Functional Properties of Myosin: Significance of Quorum Sensing. Ultrason. Sonochem. 2020, 69, 105268. [Google Scholar] [CrossRef]
  44. Shen, L.; Pang, S.; Zhong, M.; Sun, Y.; Qayum, A.; Liu, Y.; Rashid, A.; Xu, B.; Liang, Q.; Ma, H.; et al. A Comprehensive Review of Ultrasonic Assisted Extraction (UAE) for Bioactive Components: Principles, Advantages, Equipment, and Combined Technologies. Ultrason. Sonochem. 2023, 101, 106646. [Google Scholar] [CrossRef]
  45. Sethi, S.; Rathod, V.K. Recent Advancements in Ultrasound-Assisted Biomolecule Extraction from Prokaryotic and Eukaryotic Cells: A Review. Prep. Biochem. Biotechnol. 2024, 56, 135–161. [Google Scholar] [CrossRef]
  46. NMX-F-615-NORMEX-2018; Alimentos-Determinación de Extracto Etereo (Método Soxhlet) en Alimentos-Método de Prueba. Diario Oficial de la Federación: Mexico City, Mexico, 2018. Available online: https://www.dof.gob.mx/nota_detalle.php?codigo=5565079 (accessed on 21 June 2025).
  47. NOM-F-68-S-1980; Alimentos Determinación de Proteínas. Diario Oficial de la Federación: Mexico City, Mexico, 1980. Available online: https://dof.gob.mx/nota_detalle.php?codigo=4858024 (accessed on 21 June 2025).
  48. NOM-F-90-S-1978; Determinación de Fibra Cruda en Alimentos. Diario Oficial de la Federación: Mexico City, Mexico, 1978. Available online: https://www.dof.gob.mx/nota_detalle.php?codigo=4799842 (accessed on 21 June 2025).
  49. NMX-F-607-NORMEX-2020; Alimentos-Determinación de Cenizas en Alimentos-Método de Prueba. Diario Oficial de la Federación: Mexico City, Mexico, 2020. Available online: https://www.dof.gob.mx/nota_detalle.php?codigo=5641716 (accessed on 21 June 2025).
  50. Li, S.; Xu, S.; Liu, S.; Yang, C.; Lu, Q. Fast Pyrolysis of Biomass in Free-Fall Reactor for Hydrogen-Rich Gas. Fuel Process. Technol. 2004, 85, 1201–1211. [Google Scholar] [CrossRef]
  51. Selvaraju, G.; Bakar, N.K.A. Production of a New Industrially Viable Green-Activated Carbon from Artocarpus Integer Fruit Processing Waste and Evaluation of Its Chemical, Morphological and Adsorption Properties. J. Clean. Prod. 2017, 141, 989–999. [Google Scholar] [CrossRef]
  52. ISO 18134-3:2023; Solid Biofuels—Determination of Moisture Content—Part 3: Moisture in General Analysis Sample. International Organization for Standardization: Geneva, Switzerland, 2023.
  53. ISO 18122:2022; Solid Biofuels—Determination of Ash Content. International Organization for Standardization: Geneva, Switzerland, 2022. Available online: https://www.iso.org/standard/61515.html (accessed on 6 January 2026).
  54. ISO 18123:2015; Solid Biofuels—Determination of the Content of Volatile Matter. International Organization for Standardization: Geneva, Switzerland, 2015. Available online: https://www.iso.org/es/contents/data/standard/08/31/83192.html?browse=tc (accessed on 6 January 2026).
  55. ISO 16948:2015; Solid Biofuels—Determination of Total Content of Carbon, Hydrogen and Nitrogen. International Organization for Standardization: Geneva, Switzerland, 2015. Available online: https://www.iso.org/standard/58004.html (accessed on 6 January 2026).
  56. Othman, A.; Ismail, A.; Abdul Ghani, N.; Adenan, I. Antioxidant Capacity and Phenolic Content of Cocoa Beans. Food Chem. 2007, 100, 1523–1530. [Google Scholar] [CrossRef]
  57. Jia, Z.; Tang, M.; Wu, J. The Determination of Flavonoid Contents in Mulberry and Their Scavenging Effects on Superoxide Radicals. Food Chem. 1999, 64, 555–559. [Google Scholar] [CrossRef]
  58. Peralta-Jiménez, L.; Cañizares-Macías, M.P. Ultrasound-Assisted Method for Extraction of Theobromine and Caffeine from Cacao Seeds and Chocolate Products. Food Bioprocess Technol. 2013, 6, 3522–3529. [Google Scholar] [CrossRef]
  59. Shimada, K.; Fujikawa, K.; Yahara, K.; Nakamura, T. Antioxidative Properties of Xanthan on the Autoxidation of Soybean Oil in Cyclodextrin Emulsion. J. Agric. Food Chem. 1992, 40, 945–948. [Google Scholar] [CrossRef]
  60. Pukalskas, A.; Van Beek, T.A.; Venskutonis, R.P.; Linssen, J.P.H.; Van Veldhuizen, A.; De Groot, A. Identification of Radical Scavengers in Sweet Grass (Hierochloe odorata). J. Agric. Food Chem. 2002, 50, 2914–2919. [Google Scholar] [CrossRef] [PubMed]
  61. Benzie, I.F.F.; Strain, J.J. The Ferric Reducing Ability of Plasma (FRAP) as a Measure of “Antioxidant Power”: The FRAP Assay. Anal. Biochem. 1996, 239, 70–76. [Google Scholar] [CrossRef]
  62. Thaipong, K.; Boonprakob, U.; Crosby, K.; Cisneros-Zevallos, L.; Byrne, D.H. Comparison of ABTS, DPPH, FRAP, and ORAC Assays for Estimating Antioxidant Activity from Guava Fruit Extracts. J. Food Compos. Anal. 2006, 19, 669–675. [Google Scholar] [CrossRef]
  63. NOM-062-ZOO-1999; Especificaciones Técnicas para la Producción, Cuidado y Uso de los Animales de Laboratorio. Diario Oficial de la Federación: Mexico City, Mexico, 1999. Available online: https://www.gob.mx/cms/uploads/attachment/file/203498/NOM-062-ZOO-1999_220801.pdf (accessed on 30 June 2025).
  64. Chandra, S.; Singh, A.K.; Singh, M.; Das, P.; Singh, S.; Pandey, H.P.; Singh, R.G. Prolonged Elevated Postprandial Sugar Augments Severity in Kidney Disease: A North Indian Hospital-Based Study. Ren. Fail. 2014, 36, 50–54. [Google Scholar] [CrossRef]
  65. Hinestroza, H.P.; Urena-Saborio, H.; Zurita, F.; de León, A.A.G.; Sundaram, G.; Sulbarán-Rangel, B. Nanocellulose and Polycaprolactone Nanospun Composite Membranes and Their Potential for the Removal of Pollutants from Water. Molecules 2020, 25, 683. [Google Scholar] [CrossRef]
  66. Alemawor, F.; Dzogbefia, V.P.; Oddoye, E.O.K.; Oldham, J.H. Enzyme Cocktail for Enhancing Poultry Utilisation of Cocoa Pod Husk. Sci. Res. Essay 2009, 4, 555–559. [Google Scholar]
  67. Sobamiwa, O.; Longe, O.G. Utilization of Cocoa-Pod Pericarp Fractions in Broiler Chick Diets. Anim. Feed Sci. Technol. 1994, 47, 237–244. [Google Scholar] [CrossRef]
  68. Vásquez, Z.S.; de Carvalho Neto, D.P.; Pereira, G.V.M.; Vandenberghe, L.P.S.; de Oliveira, P.Z.; Tiburcio, P.B.; Rogez, H.L.G.; Góes Neto, A.; Soccol, C.R. Biotechnological Approaches for Cocoa Waste Management: A Review. Waste Manag. 2019, 90, 72–83. [Google Scholar] [CrossRef] [PubMed]
  69. Martínez, R.; Torres, P.; Meneses, M.A.; Figueroa, J.G.; Pérez-Álvarez, J.A.; Viuda-Martos, M. Chemical, Technological and in Vitro Antioxidant Properties of Cocoa (Theobroma cacao L.) Co-Products. Food Res. Int. 2012, 49, 39–45. [Google Scholar] [CrossRef]
  70. Karim, A.A.; Azlan, A.; Ismail, A.; Hashim, P.; Abdullah, N.A. Antioxidant Properties of Cocoa Pods and Shells. Malays. Cocoa J. 2014, 8, 49–56. [Google Scholar]
  71. González-Alejo, F.A.; Barajas-Fernández, J.; Olán-Acosta, M.A.; Lagunes-Gálvez, L.M.; García-Alamilla, P. Supercritical Fluid Extraction of Fat and Caffeine with Theobromine Retention in the Cocoa Shell. Processes 2019, 7, 385. [Google Scholar] [CrossRef]
  72. Titiloye, J.O.; Abu Bakar, M.S.; Odetoye, T.E. Thermochemical Characterisation of Agricultural Wastes from West Africa. Ind. Crops Prod. 2013, 47, 199–203. [Google Scholar] [CrossRef]
  73. Holguín Posso, A.M.; Macías Silva, J.C.; Castañeda Niño, J.P.; Mina Hernandez, J.H.; Fajardo Cabrera de Lima, L.P. Characterization and Implementation of Cocoa Pod Husk as a Reinforcing Agent to Obtain Thermoplastic Starches and Bio-Based Composite Materials. Polymers 2024, 16, 1608. [Google Scholar] [CrossRef]
  74. Zhang, D.; Motilal, L. Origin, Dispersal, and Current Global Distribution of Cacao Genetic Diversity. In Cacao Diseases: A History of Old Enemies and New Encounters, 1st ed.; Springer: Cham, Switzerland, 2016; pp. 3–31. [Google Scholar] [CrossRef]
  75. Londoño-Larrea, P.; Villamarin-Barriga, E.; García, A.N.; Marcilla, A. Study of Cocoa Pod Husks Thermal Decomposition. Appl. Sci. 2022, 12, 9318. [Google Scholar] [CrossRef]
  76. Akam, N.G.; Diboma, B.S.; Mfomo, J.Z.; Ndiwe, B.; Bôt, B.V.; Biwolé, A.B. Physicochemical Characterization of Briquette Fuel Produced from Cocoa Pod Husk Case of Cameroon. Energy Rep. 2024, 11, 1580–1589. [Google Scholar] [CrossRef]
  77. Adjin-Tetteh, M.; Asiedu, N.; Dodoo-Arhin, D.; Karam, A.; Amaniampong, P.N. Thermochemical Conversion and Characterization of Cocoa Pod Husks a Potential Agricultural Waste from Ghana. Ind. Crops Prod. 2018, 119, 304–312. [Google Scholar] [CrossRef]
  78. Mendoza Martinez, C.L.; Alves Rocha, E.P.; Oliveira Carneiro, A.C.; Borges Gomes, F.J.; Ribas Batalha, L.A.; Vakkilainen, E.; Cardoso, M. Characterization of Residual Biomasses from the Coffee Production Chain and Assessment the Potential for Energy Purposes. Biomass Bioenergy 2019, 120, 68–76. [Google Scholar] [CrossRef]
  79. Sangaré, D.; Bostyn, S.; Moscosa Santillán, M.; García-Alamilla, P.; Belandria, V.; Gökalp, I. Comparative Pyrolysis Studies of Lignocellulosic Biomasses: Online Gas Quantification, Kinetics Triplets, and Thermodynamic Parameters of the Process. Bioresour. Technol. 2022, 346, 126598. [Google Scholar] [CrossRef]
  80. Cvjetko Bubalo, M.; Vidović, S.; Radojčić Redovniković, I.; Jokić, S. New Perspective in Extraction of Plant Biologically Active Compounds by Green Solvents. Food Bioprod. Process. 2018, 109, 52–73. [Google Scholar] [CrossRef]
  81. Cardoso, R.V.; da Silva, D.V.T.; Santos-Sodré, S.J.L.; Pereira, P.R.; Freitas, C.S.; Moterle, D.; Kanis, L.A.; Silva, L.H.M.; Rodrigues, A.M.C.; Paschoalin, V.M.F. Green Ultrasound-Assisted Extraction of Bioactive Compounds from Cumari-Do-Pará Peppers (Capsicum chinense Jacq.) Employing Vegetable Oils as Solvents. Foods 2024, 13, 2765. [Google Scholar] [CrossRef]
  82. da Silva, C.; Prasniewski, A.; Calegari, M.A.; de Lima, V.A.; Oldoni, T.L.C. Determination of Total Phenolic Compounds and Antioxidant Activity of Ethanolic Extracts of Propolis Using ATR–FT-IR Spectroscopy and Chemometrics. Food Anal. Methods 2018, 11, 2013–2021. [Google Scholar] [CrossRef]
  83. Rachmawaty; Mu’Nisa, A.; Hasri; Pagarra, H.; Hartati; Maulana, Z. Active Compounds Extraction of Cocoa Pod Husk (Theobroma cacao L.) and Potential as Fungicides. J. Phys. Conf. Ser. 2018, 1028, 012013. [Google Scholar] [CrossRef]
  84. Botella-Martínez, C.; Lucas-Gonzalez, R.; Ballester-Costa, C.; Pérez-álvarez, J.Á.; Fernández-López, J.; Delgado-Ospina, J.; Chaves-López, C.; Viuda-Martos, M. Ghanaian Cocoa (Theobroma cacao L.) Bean Shells Coproducts: Effect of Particle Size on Chemical Composition, Bioactive Compound Content and Antioxidant Activity. Agronomy 2021, 11, 401. [Google Scholar] [CrossRef]
  85. El-Lateef, H.M.A.; Khalaf, M.M.; Taleb, M.F.A.; Gouda, M. Chromatographic Fingerprinting of Cacao Pod Husk Extracts (Theobroma cacao L.): Exploring Antibacterial, Antioxidant, and Antidiabetic Properties with In Silico Molecular Docking Analysis. Appl. Biochem. Biotechnol. 2024, 196, 7375–7403. [Google Scholar] [CrossRef]
  86. Liu, B.; Du, B.; Sun, Y.; Zhu, M.; Yang, Y.; Wang, X.; Zhou, J. Ultrasound Acoustic Cavitation Enhances Depolymerization of Organosolv Lignin to Phenolic Monomers and Low Molecular Weight Lignin Bio-Oils. Fuel Process. Technol. 2020, 203, 106387. [Google Scholar] [CrossRef]
  87. Ortega, N.; Romero, M.P.; MacIà, A.; Reguant, J.; Anglès, N.; Morelló, J.R.; Motilva, M.J. Obtention and Characterization of Phenolic Extracts from Different Cocoa Sources. J. Agric. Food Chem. 2008, 56, 9621–9627. [Google Scholar] [CrossRef]
  88. Ruvira, S.; Rodríguez-Rodríguez, P.; Ramiro-Cortijo, D.; Martín-Trueba, M.; Martín-Cabrejas, M.A.; Arribas, S.M. Cocoa Shell Extract Reduces Blood Pressure in Aged Hypertensive Rats via the Cardiovascular Upregulation of Endothelial Nitric Oxide Synthase and Nuclear Factor (Erythroid-Derived 2)-like 2 Protein Expression. Antioxidants 2023, 12, 1698. [Google Scholar] [CrossRef] [PubMed]
  89. Nwaso-Sunday, E.O.; Adeoye, R.I.; Olasehinde, O.R.; Afolabi, O.B.; Arise, R.O. Modulatory Effect of Ethylacetate Fraction from Theobroma cacao Pod Husk on Blood Pressure in L-NAME-Induced Hypertensive Rats Using in Vivo and in Silico Approaches. J. Appl. Pharm. Sci. 2024, 14, 245–252. [Google Scholar] [CrossRef]
  90. Yamashita, Y.; Okabe, M.; Natsume, M.; Ashida, H. Cacao Liquor Procyanidins Prevent Postprandial Hyperglycaemia by Increasing Glucagon-like Peptide-1 Activity and AMP-Activated Protein Kinase in Mice. J. Nutr. Sci. 2019, 8, e2. [Google Scholar] [CrossRef]
  91. Irnawati, I.; Riyanto, S.; Martono, S.; Rohman, A. The Employment of FTIR Spectroscopy and Chemometrics for the Classification and Prediction of Antioxidant Activities of Pumpkin Seed Oils from Different Origins. J. Appl. Pharm. Sci. 2021, 11, 100–107. [Google Scholar] [CrossRef]
  92. Md Salim, R.; Asik, J.; Sarjadi, M.S. Chemical Functional Groups of Extractives, Cellulose and Lignin Extracted from Native Leucaena Leucocephala Bark. Wood Sci. Technol. 2021, 55, 295–313. [Google Scholar] [CrossRef]
  93. Amezcua-Allieri, M.A.; Aburto, J.; Torres-García, E. Phenomenological Thermokinetic Analysis of Coffee Husk Pyrolysis: A Study Case. J. Therm. Anal. Calorim. 2022, 147, 12187–12199. [Google Scholar] [CrossRef]
  94. Thummajitsakul, S.; Paensanit, P.; Saeieo, T.; Sirirat, J.; Silprasit, K. FTIR and Multivariate Analysis of Total Phenolic Content, Antioxidant and Anti-Amylase Activities of Extracts and Milk of Glycine max L. and Phaseolus vulgaris L. Electron. J. Biotechnol. 2023, 64, 69–75. [Google Scholar] [CrossRef]
Figure 1. Systolic and diastolic blood pressure variation: (A) Systolic blood pressure variation; (B) diastolic blood pressure variation.
Chemengineering 10 00043 g001
Figure 2. Glucose in blood variation. (A) Glucose in blood variation on first day; (B) glucose in blood variation at thirty days.
Chemengineering 10 00043 g002
Figure 3. FTIR spectra of the CPH extracts obtained by means of EAU with different solvents. (A) Functional group region, (B) fingerprint region.
Chemengineering 10 00043 g003
Figure 4. Principal component analysis of FTIR signals from CPH extracts.
Chemengineering 10 00043 g004
Figure 5. The loading plot of PCA from FTIR signals from CPH extracts.
Chemengineering 10 00043 g005
Figure 6. Heat map of the FTIR signals of CPH extracts.
Chemengineering 10 00043 g006
Table 1. Proximate ultimate analysis (wt.%) of raw CPH.
This WorkAkam et al. [76]Londoño-Larrea et al. [75]Adjin-Tetteh et al. [77]
Proximate analysis (wt.%)
Moisture content (MC)10.60 ± 2.0710.5010.5011.07
Volatile matter (VM)66.24 ± 0.9334.7059.4061.73
Fixed carbon (FC)25.50 ± 1.85 a58.8021.4010.96 a
Ash8.26 ± 0.116.508.8016.24
Ultimate analysis Ash-free (wt.%)
Carbon46.16 ± 0.0553.2041.5048.70
Hydrogen4.62 ± 0.045.206.200.75
Nitrogen1.36 ± 0.00-1.691.19
Sulfur--0.200.97
Oxygen47.89 ± 0.0034.4041.6048.39
a by difference.
Table 2. Bioactive compounds of CPH extracts.
Solvent Ratio
(Ethanol:Water)
0:10025:7550:5075:25100:0
UV-Vis spectrophotometry analysis
TPC (mg/g)50.52 ± 1.04 e94.52 ± 0.63 d109.79 ± 3.37 c132.73 ± 3.92 b171.43 ± 2.12 a
TFC (mg/g)47.65 ± 7.09 e83.81 ± 8.81 d94.21 ± 6.35 c113.85 ± 4.25 b132.05 ± 13.36 a
TB (μg/g)12.65 ± 0.05 cd11.57 ± 0.05 d21.84 ± 0.08 a14. 63 ± 0.73 bc16.79 ± 0.02 b
CF (μg/g)4.46 ± 0.02NDNDND6.35 ± 0.02
UHPLC-UV-DAD analysis
Quercetin (μg/g)3.95 ± 0.04 a2.94 ± 0.03 b0.81 ± 0.04 e1.82 ± 0.03 d2.81 ± 0.03 c
Hesperetin (μg/g)5.87 ± 0.09 a2.87 ± 0.02 d1.96 ± 0.03 e4.96 ± 0.08 b3.84 ± 0.03 c
Naringenin (μg/g)4.79 ± 0.05 b2.94 ± 0.08 d4.13 ± 0.44 c7.02 ± 0.20 a2.83 ± 0.17 d
Hesperidin (μg/g)14.96 ± 0.32 ab8.89 ± 0.33 c9.6 ± 1.02 c14.15 ± 0.35 b16.57 ± 0.84 a
Naringin (μg/g)6.21 ± 0.21 b5.13 ± 0.27 c3.8 ± 0.07 d3.78 ± 0.13 d6.97 ± 0.17 a
Vanillic acid (μg/g)30.85 ± 0.31 d35.83 ± 0.73 b36.58 ± 0.34 b33.44 ± 0.81 c43.45 ± 0.50 a
p-hydroxybenzoic acid (μg/g)18.96 ± 0.28 b18.32 ± 0.47 c19.08 ± 0.58 b19.03 ± 0.19 b20.82 ± 0.12 a
Tukey’s test (p ≤ 0.05), identical letters in rows show no significant differences. ND: Not detected under UV-Vis technique.
Table 3. Antioxidant activity of CPH extracts assessed by means of DPPH, ABTS, and FRAP.
Solvent Ratio
(Ethanol:Water)
DPPHABTSFRAP
μM TE/gμM TE/gμM TE/g
0:100442.35 ± 1.50 d482.61 ± 0.59 a395.40 ± 7.53 c
25:75433.52 ± 1.61 e483.40 ± 1.23 a642.22 ± 7.86 b
50:50489.85 ± 1.50 b482.61 ± 1.02 a880.79 ± 9.65 a
75:25465.85 ± 0.50 c482.02 ± 0.34 a108.57 ± 7.66 d
100:0503.52± 0.58 a483.40 ± 1.23 a57.62 ± 2.38 e
Tukey’s test (p ≤ 0.05), equal letters in rows show no significant differences.
Disclaimer/Publisher’s Note: The statements, opinions and data contained in all publications are solely those of the individual author(s) and contributor(s) and not of MDPI and/or the editor(s). MDPI and/or the editor(s) disclaim responsibility for any injury to people or property resulting from any ideas, methods, instructions or products referred to in the content.