


Abstract
Surface water quality assessment using physicochemical thresholds often misses the joint biological effects of complex mixtures of constituents. This study integrated regulatory, cellular, and radiological evaluations across a full annual cycle in the Karadere-Kastamonu irrigation reservoir, Türkiye. Twenty-one physicochemical parameters were monitored monthly, dissolved radon was screened, and primary rat bone marrow-derived mesenchymal stem cells were exposed to sterile-filtered, non-enriched water across seven concentrations (0.01–0.5% v/v). Cellular responses were evaluated using the 3-(4,5-dimethylthiazol-2-yl)-2,5-diphenyltetrazolium bromide (MTT) assay, Live/Dead staining, and cell density quantification from hematoxylin–eosin (HE) preparations. Under the regulation’s worst-parameter rule, the reservoir was Class I for nine months, Class II for one month, and Class III for two months, and radon remained well below the drinking-water parametric value. However, sterile-filtered reservoir water induced distinct cellular responses: while there was no effect at 24 h, 72 h exposure increased MTT reduction to 119.1% of control at the lowest dose tested, with no further increase at higher doses. Cell density, measured in the HE series, was reduced at every dose to 67–86% of control across the seven doses (mean 76%) and in every quarter. In the Live/Dead preparations, propidium iodide-positive nuclei remained below 1.4% in every condition with no difference detected from untreated controls. An exploratory estimate of metabolic activity per cell, derived from two endpoints measured in different cultures, exceeded unity in all four quarters (1.22 to 1.65), with its confidence interval excluding unity in two. The reduction was already present at 0.01% v/v and did not deepen over a 50-fold concentration range. We conclude that regulatory classification and the cell-based response are complementary, non-redundant descriptors of the same water: a water body may be Class I on every regulated parameter in a given month while measurably altering mammalian cell behavior, so the two assessments should be read together rather than one being taken as a proxy for the other.
1. Introduction
Freshwater reservoirs constructed for irrigation occupy an ambiguous position in water management. They are engineered impoundments, yet they function as lentic ecosystems; they are formally classified as agricultural infrastructure, yet in practice they support cage aquaculture, livestock watering, and, in rural catchments, informal domestic abstraction. Compared with natural lakes, artificial impoundments respond more rapidly to catchment pressures because their hydrological residence time, morphometry, and shoreline land use are all determined by anthropogenic design rather than by long-term geomorphological equilibrium; small impoundments of this kind in Türkiye have been monitored on that basis [1]. This combination of ecological sensitivity and multi-purpose human contact makes irrigation reservoirs a monitoring priority that remains underrepresented in the international water quality literature compared with rivers and natural lakes.
Water quality in such systems is almost universally assessed through a compliance paradigm: a defined panel of physicochemical parameters is measured, each value is compared with a regulatory threshold, and the water body is assigned a quality class. In Türkiye, this is operationalized through the Surface Water Quality Regulation (SWQR), which mirrors the logic of the EU Water Framework Directive (WFD, 2000/60/EC) and its Environmental Quality Standards (EQS). The approach is transparent, legally enforceable, and analytically mature. Its limitation, however, is structural rather than technical. EQS-type standards discriminate between acceptable and unacceptable concentrations of individual, pre-selected substances, but cannot capture the many thousands of compounds that may be present in a water body, nor the joint biological action of those compounds as mixtures [2,3]. A water body may therefore be classified as compliant for every measured parameter while remaining biologically active, or conversely be downgraded for a single parameter that carries little consequence for the organisms actually exposed.
Effect-based methods (EBM) were developed precisely to close this gap. By measuring an integrated biological response rather than a list of concentrations, EBMs capture mixture effects and the contributions of unmonitored chemicals, and are now formally recommended as a complement to chemical monitoring under the WFD [4,5]. Their operational deployment, however, has converged on a narrow methodological configuration: reporter-gene assays addressing specific modes of action, applied to solid-phase-extracted and enriched water samples, and benchmarked against effect-based trigger values [6,7]. Two consequences follow. First, enrichment by solid-phase extraction selects for the fraction retained by the sorbent, thereby altering the exposure matrix: polar, volatile, and inorganic constituents, including the nutrient and ionic load that dominate agricultural catchments, are largely lost, so the tested sample is no longer the water that organisms encounter [8]. Second, in situ deployment in aquatic systems is logistically demanding, whether the instrument is a physicochemical sensor package or a biological assay [9,10], and effect-based deployments are typically reported as single or seasonal snapshots at a temporal resolution coarser than the monthly cycle on which regulatory monitoring itself operates. As a result, we are not aware of a published dataset in which a regulatory verdict and a biological verdict are generated from the same water, at the same sampling event, repeatedly across a full hydrological year. Without such a dataset, the central practical question, whether regulatory classification predicts biological outcome, cannot be tested; it can only be asserted.
The choice of a biological model determines what an effect-based signal means [9]. Most environmental in vitro testing employs immortalized or tumor-derived lines, which are robust and inexpensive but are established by processes that dismantle intrinsic growth control, commonly through disruption of the p53/pRb axis. The resulting cells are prone to chromosomal instability and aneuploidy, show altered cell-cycle dynamics and increased stress tolerance, and may change in their susceptibility to toxicants as genetic variation accumulates with passage, so that comparative studies conclude they are not substitutable for primary cells in testing applications [11,12,13]. Our model choice followed a different logic, derived from the exposure route itself. If ingested water is treated as a transiently administered reactive medium rather than as an inert solvent, then the tissues of consequence are those it reaches after absorption. The intestinal epithelium and the hepatocytes encounter it first, but both are barrier and biotransformation compartments, constitutively adapted to xenobiotic flux. The first tissue to encounter whatever survives first-pass metabolism without such adaptation is the circulating and marrow-resident compartment: erythrocytes, which are anucleate and therefore uninformative for viability endpoints, and the bone marrow stroma, which is highly perfused, non-detoxifying, and continuously proliferative. Bone marrow-derived mesenchymal stem cells (bmMSCs) were selected on this reasoning, which concerns the tissue reached rather than the concentration reaching it; the latter was not estimated here. bmMSCs are additionally non-transformed, retain intact genomic stress-response pathways [11], have been validated as a basal cytotoxicity platform that meets ICCVAM performance criteria [14,15,16], and have been used to profile responses to environmental xenobiotics, including agricultural herbicides [17].
A consequence of using a progenitor population is that the direction of the response cannot be read naively. In cytotoxicity screening, viability values below the control are interpreted as adverse, while values above the control are routinely dismissed as assay noise or a nutrient artifact. Neither interpretation is safe here. Suspended and dissolved constituents of surface water include ions that participate directly in cellular energy metabolism—orthophosphate, magnesium, calcium, and potassium among them—so a metabolic stimulus is mechanistically plausible rather than anomalous. It is equally important, however, not to over-read such a signal. The tetrazolium reduction assay reports mitochondrial dehydrogenase activity rather than cell number, and an increase in that signal is compatible with at least three distinct states: upregulation of oxidative metabolism within a constant cell population, a mitochondrial stress response, and genuine proliferation. These cannot be separated by the assay itself. We therefore adopt the conservative reading throughout, and refer to an elevated signal as increased metabolic activity rather than as proliferation. The distinction matters beyond terminology. Should the response prove proliferative, sustained mitogenic stimulation of a progenitor compartment would raise the question of tumor promotion, since non-genotoxic carcinogenesis operates precisely by stimulating clonal expansion without direct DNA damage [18,19,20]. Resolving which of the three states underlies the signal requires molecular endpoints, and we identify this as the principal question arising from our findings.
A further consideration, rarely integrated into either paradigm, is radiological. Waters draining metamorphic and schistose bedrock can mobilize naturally occurring radionuclides, and radon is the most mobile of these in the aqueous phase. Where a cellular response is observed, radiological screening indicates whether natural radioactivity is a plausible contributing stressor, an inferential step that chemical monitoring alone cannot supply.
The present study was designed to address this gap using the Karadere Irrigation Reservoir (Kastamonu, northern Türkiye) as a model system. The reservoir drains a schist-dominated catchment of forested slopes and agricultural land, and supports two commercial cage trout operations, making it a setting in which regulatory classification carries immediate economic consequences. Over twelve consecutive months, water was collected monthly from three stations representing the inflow, the deepest zone, and the dam wall. For each sample, we determined 21 physicochemical parameters, applied a multi-endpoint bioassay battery to primary rat bmMSCs exposed to sterile-filtered, non-enriched water across a seven-point dose range, and screened for dissolved radon.
We tested three hypotheses: (i) that the response of primary mammalian stem cells to sterile-filtered reservoir water is dose-dependent and non-monotonic, comprising low-dose stimulation as well as high-dose suppression, rather than being uniformly cytotoxic; (ii) that exposure alters the number of cells as well as their metabolic activity, so that the two must be measured separately; and (iii) that regulatory water quality classification, which is set by the single worst-performing parameter in a given month and is therefore stable across most of the year, does not predict the biological response. Sampling was carried out monthly throughout a complete hydrological year because the catchment imposes a strong seasonal structure on the water: winter precipitation is stored as snow and delivered by melting in spring; inflow declines and dissolved ions concentrate through the summer; autumn rainfall resumes; and fertilizer is applied twice annually to the cultivated land of the upstream catchment. A targeted search of the literature found no previous studies that had generated parallel regulatory, cellular, and radiological assessments of the same freshwater body at a monthly resolution over a complete annual cycle.
2. Materials and Methods
2.1. Study Area
The Karadere Dam Irrigation Reservoir is located within the boundaries of Donalar village, Taşköprü district, Kastamonu Province, in the Western Black Sea region of northern Türkiye, approximately 17 km northwest of the district center (Figure 1). The reservoir lies at an altitude of 750–810 m, depending on its seasonal water level. The dam was constructed between 1998 and 2003 on the Karadere Stream, which is fed by six tributaries and itself discharges into the Gökırmak River. It is an earth-fill embankment structure with an embankment volume of 2,850,000 m3 and a height of 90 m above the streambed. At the normal operating level, the reservoir extends along an 8 km valley with a surface area of 1.10 km2. The scheme supplies pressurized pipe-network irrigation to approximately 6449 ha of agricultural land serving some 20 villages. Two commercial net-cage rainbow trout facilities operate on the reservoir [21].
Figure 1.
Karadere Irrigation Reservoir (Kastamonu, northern Türkiye) and the five sampling stations. (a) The reservoir with Stations 1–3, sampled monthly for twelve months (circles), and Stations 4 and 5, sampled once for radon determination (triangles). (b) Location of the reservoir relative to the city of Kastamonu. (c) Location within Türkiye and the Black Sea region. In (b,c), the markers indicate the locations of the reservoir and the city of Kastamonu. Base imagery: Google Earth (Image © 2026 Airbus; Data SIO, NOAA, U.S. Navy, NGA, GEBCO; Image Landsat/Copernicus). Station markers, labels and the legend were added by the authors.
The reservoir margin is formed by rock outcrops overlain by forest, and no cultivation is carried out on the shoreline itself; the cultivated land of the catchment lies upstream of the impoundment, on the valley floor of the Karadere Stream and its tributaries, where fields adjoin the channel in the villages of Alamabatak, Alamaşişli, and Alamakayış. According to local accounts, these riparian fields are inundated in some years when snowmelt raises the discharge of the feeding streams in late winter and spring, while the reservoir level falls in late summer and autumn as inflow declines. The bedrock, which is of Paleozoic and Upper Cretaceous Mesozoic origin, comprises green schists, red radiolarite-bearing schists, and weakly metamorphosed spilites; the northern sector consists of conglomerate together with gray sandy and clayey schists and loose sediments. Soils are chestnut-colored forest soils, humus-rich and suited to cultivation. The forest management plan for the area describes the northern part of the region as steep and stony, with shallow to moderately deep soils of up to about 60 cm, and as mountainous ground unsuited to cultivation, spanning elevations of 350 to 1323 m; that range describes the wider region rather than the reservoir itself, which lies at 750–810 m. The dominant forest species are Pinus nigra subsp. pallasiana, Pinus sylvestris, and Quercus sp. The regional climate is Western Black Sea transitional; long-term meteorological records (Kastamonu station, 1975–2006) give a mean annual air temperature of 9.7 °C and mean annual precipitation of 449.6 mm [21].
2.2. Sampling Stations and Sampling Regime
Three stations were established to represent the reservoir as a whole (Figure 1): Station 1 at the northern inflow, where the Karadere Stream enters the reservoir; Station 2 near the center of the reservoir, at the deepest point; and Station 3 in the southern sector at the dam wall. These three stations were sampled monthly from April 2021 to March 2022, covering one complete hydrological year, for physicochemical and cell-based analyses. Two further stations, Station 4 on the eastern shore, opposite the deepest point, and Station 5 on the western shore between the deepest point and the dam, were sampled on a single occasion during the study year. Their coordinates are given in Table 1.
Table 1.
Geographic coordinates of the sampling stations (WGS-84, decimal degrees).
Sample containers and measuring instruments were prepared 24 h before each sampling event by immersion in an acid solution, rinsing with ultrapure water, and oven drying. Immediately before collection, each container was rinsed with reservoir water. Samples were collected 15 cm below the water surface, with the bottle oriented against the flow and filled by gravity into 3 L polyethylene bottles with plastic caps. Samples were transported under cold chain and reached the Central Research Laboratory (MERLAB), Kastamonu University, within 8 h of collection, where they were held at +4 °C until analysis.
On the day of arrival, a 20 mL aliquot was withdrawn from each sample bottle for cell-based work, clarified through filter paper, and sterilized by passage through a sterile syringe filter (Corning Inc., Corning, NY, USA) with 0.22 µm pore size. The sterile filtrates were held at +4 °C until use and were brought to 37 °C immediately before dosing, so that adding them did not alter the temperature of the culture medium. MTT assays were performed within the month of collection, on that month’s filtrate. For the hematoxylin–eosin series, the monthly sterile filtrates of each quarter were combined in equal proportions per station, into a quarterly pool. The four pools were applied to the cells together, in a single experiment carried out after the final sampling in March 2022; each filtrate was therefore held at +4 °C from its month of collection until that experiment, the April filtrate for about eleven months longer than the March filtrate. Live/Dead staining was performed within the monthly series and not on the pools.
2.3. Physicochemical Analyses
Dissolved oxygen, pH, salinity, temperature, and electrical conductivity are subject to change on standing and were therefore measured in situ at the moment of collection with a HACH HQ40D portable multi-parameter meter (Hach, Loveland, CO, USA) fitted with a PHC10105 gel-filled pH electrode, a CDC40105 conductivity cell and an LDO10105 luminescent dissolved-oxygen probe. The meter was calibrated before each sampling event following the manufacturer’s procedure. The manufacturer’s stated measuring ranges are 0–14 for pH, 0.01 µS/cm to 200 mS/cm for conductivity, 0–42‰ for salinity, 0.1–20.0 mg/L for dissolved oxygen, and 0–60 °C for temperature, with the last having an accuracy of ±0.3 °C. The meter was configured to a dissolved-oxygen resolution of 0.01 mg/L, and readings were recorded to two decimal places for pH, dissolved oxygen, and conductivity, and to one decimal place for salinity and temperature. Oxygen saturation was calculated from the measured temperature using the Benson–Krause solubility relationship, with the barometric correction applied at 780 m, the midpoint of the reservoir’s operating elevation. Monthly precipitation and air temperature for the sampling year were taken from the Taşköprü meteorological station and are supplied in Data S1; their association with the nutrient series was examined by Spearman rank correlation with Benjamini–Hochberg correction.
The following parameters were determined in the laboratory: chemical oxygen demand (COD), total suspended solids (TSS), biochemical oxygen demand (BOD), chloride, sulfate, sulfite, phosphate, sodium, potassium, calcium, magnesium, total hardness, total alkalinity, nitrite, nitrate, and ammonium nitrogen. Nitrite, nitrate, ammonium nitrogen, magnesium, sulfite, sulfate, sodium, calcium, potassium, and phosphate were quantified on the day of arrival using a WTW 7600 UV-VIS spectrophotometer (WTW, Weilheim, Germany) with commercial spectrometric and photometric test kits, following the manufacturer’s standard protocol for each parameter. Chloride and biochemical oxygen demand were determined on the same instrument. Nitrite-N was determined with a Merck Spectroquant photometric test (Merck KGaA, Darmstadt, Germany), whose stated working range is 0.002–1.00 mg/L NO2-N; this lower working limit coincides with the Class I/II boundary of the regulation, and nitrite values at or below it are reported as not resolvable against that boundary. Ammonium-N values fell below the working range of the kit used; they are reported as obtained and are only treated as evidence that ammonium-N lies far below its Class I limit. TSS was determined gravimetrically after a coarse pre-filtration followed by filtration through a 0.45 µm membrane filter. Total alkalinity was determined by titration with sulfuric acid and total hardness by EDTA titration, both expressed as mg/L CaCO3. COD was determined by the dichromate method, digesting the organic load with potassium dichromate and titrating the residual dichromate with ferrous ammonium sulfate. In addition to the five in situ parameters, 16 physicochemical variables were determined for each of the 36 monthly station samples. The laboratory determinations were carried out by the Water Quality Laboratory of the Central Research Laboratory (MERLAB), Kastamonu University, using the kits and procedures described above. Results were returned to two decimal places for the major ions, chemical and biochemical oxygen demand, and suspended solids; three for orthophosphate; four for nitrite-N; and five for ammonium-N. Eight determinations were returned as zero: ammonium-N in 3 of 36 samples, orthophosphate in 4 of 36, and biochemical oxygen demand in 1 of 36. These represent values below the service laboratory’s reporting limit and were carried through the analyses as zero.
Water quality classes were assigned to each parameter in accordance with the Turkish Surface Water Quality Regulation [22]. The regulation assigns a water body the class of its poorest-performing parameter. We applied this rule at the station level: a month was assigned the class corresponding to the worst value recorded at any of the three stations in that month, so a single station exceeding a threshold determined the class for that month.
2.4. Radon Determination
Radon activity concentration in water was determined at the Nuclear Physics Laboratory, Faculty of Science, Kastamonu University. Sample bottles were tightly capped in the field and transported at ambient temperature. Measurements were made with an AlphaGUARD PQ 2000PRO portable radon monitor (Genitron Instruments, Frankfurt am Main, Germany) fitted with the AquaKIT water-degassing accessory and the Alpha pump. The monitor uses a 0.56 L pulse ionization chamber held at +750 V, with the sample gas entering by diffusion through a glass-fiber filter that excludes progeny and dust; its stated measuring range is 2 Bq/m3 to 2 × 10⁶ Bq/m3 and its maximum measurement uncertainty is 3%. Laboratory background was measured before each determination. The system was then operated in flow mode: the water sample was injected into the degassing vessel, and the pump was run at 0.3 L/min for 10 min, with the radon activity concentration recorded every minute. After the pump was stopped, the monitor was left running for a further 20 min. This 30 min cycle was repeated 3 times per sample, and the reported value is the mean across cycles. Because the degassed radon is diluted into the air volume of the closed loop and a fraction remains in the aqueous phase, the activity concentration in the water was not read directly from the monitor but calculated from the measured air activity, the laboratory background, the internal volume of the measuring system, the sample volume and the temperature-dependent radon partition coefficient, following the relation given by Seid et al. [23]. The partition coefficient was obtained from the Weigel expression as a function of sample temperature.
2.5. Cells and Ethical Statement
Rat bone marrow-derived mesenchymal stem cells (bmMSC) were obtained from the cell bank of the Tissue Engineering, Biomaterials and Stem Cell Laboratory within MERLAB, Kastamonu University. The cells had originally been isolated from Wistar rats in a previous project approved by the Kastamonu University Local Ethics Committee for Animal Experiments (KÜ-HADYEK; 19 February 2018, protocol 2018/12), and had since been cryopreserved in liquid nitrogen at passage 3. Cells from this same bank, under the same ethics protocol, were used and characterized in two earlier graduate studies from this laboratory [24,25], in which they were shown to be plastic-adherent, to display the spindle-shaped fibroblastic morphology that is characteristic of bone marrow stroma, and to undergo osteogenic differentiation, confirmed by alkaline phosphatase activity, glycosaminoglycan and hyaluronic acid assays, histological and immunohistochemical staining, and scanning electron microscopy. Immunophenotypic marker data from the source project are not presented here; the characterization relied on in the present study is the one reported in those studies. No new animal experiment was performed for the present study. Under Articles 4(u) and 8(k) of the Regulation on the Working Procedures and Principles of Animal Experiments Ethics Committees (Official Gazette no. 28914, 15 February 2014), the use of surplus material that has already been obtained under a prior approval is not subject to ethics committee approval; KÜ-HADYEK confirmed this position in writing on 2 March 2023 (Decision 2023/2-6). For every monthly assay, a separate vial was thawed from the same passage-3 cryostock so that all exposures were performed on passage-4 cells of identical culture age; no serial passaging was carried out across the twelve-month series. All cell work was carried out under sterile conditions in a Class II laminar-flow biosafety cabinet (Nuaire, Plymouth, MN, USA) with incubation in a Nuaire CO2 incubator (Nuaire, Plymouth, MN, USA).
Cells were harvested from T-75 tissue culture flasks, yielding approximately 6–7 × 10⁵ cells per flask. An aliquot was stained with trypan blue and counted on a Thoma hemocytometer. Cells were seeded into 96-well plates at 5 × 10³ cells per well and incubated overnight to allow attachment; plates were inspected the following morning before dosing. Unless otherwise stated, all chemicals and reagents, including α-MEM, trypan blue, the MTT reagent, and the hematoxylin and eosin stains, were obtained from Sigma-Aldrich (St. Louis, MO, USA), and tissue culture plastics from SPL Life Sciences (Pocheon, Republic of Korea).
2.6. Preparation and Dosing of Water Samples
The culture medium used throughout, both for the stocks and for the untreated controls, was α-MEM reconstituted from powder with distilled water, so that the only water in the control wells was distilled and the dosed wells differed from them solely by the addition of reservoir water. Two stock solutions were prepared for each station and sampling month from the sterile filtrate. Stock 1 consisted of a 10 µL water sample in 990 µL α-MEM (1% v/v water); Stock 2 consisted of a 100 µL water sample in 900 µL α-MEM (10% v/v water). Doses are expressed throughout as microliters of reservoir water per milliliter of culture medium (µL/mL). Stock 1 was applied at three doses, 0.1, 0.2, and 0.5 µL/mL, corresponding to 10, 20, and 50 µL of stock per mL of medium, and Stock 2 at four doses, 0.75, 1, 2, and 5 µL/mL, corresponding to 7.5, 10, 20, and 50 µL of stock per mL of medium. The resulting exposure range is therefore 0.01–0.5% v/v of sterile-filtered reservoir water. Each dose was applied in triplicate for every station and month. Fresh medium was added to each well before the stock dose, and the total well volume was adjusted to 250 µL. Dosed plates were incubated at 37 °C, 5% CO2, and 90% relative humidity.
Cultures maintained in α-MEM alone, without the addition of reservoir water or any other reagent, served as the reference control against which the control-normalized MTT signal was calculated; the comparison is therefore between a medium made up with distilled water and the same medium carrying a small addition of reservoir water. No reference cytotoxic agent was included as a positive control; the reasoning is set out in Section 4.4.
2.7. MTT Assay
Mitochondrial dehydrogenase activity was assessed using the MTT assay (Sigma-Aldrich, St. Louis, MO, USA) following the protocol of Taher Mohamed and Emin (2024) [26]. Assays were performed after 24 h (day 1) and 72 h (day 3) of exposure, on the monthly filtrate, within the month of collection. Before each assay, cultures were photographed under an inverted phase-contrast microscope. Spent medium was removed and replaced with fresh medium containing MTT reagent at 10% of the total volume, and the plates were returned to the incubator for 4 h. Formazan crystal formation was photographed, the medium was carefully aspirated without disturbing the crystals, and the crystals were dissolved in MTT solvent (1% HCl in 2-propanol). Absorbance was read at 570 nm on a BioTek Synergy HTX multi-mode reader (BioTek Instruments, Winooski, VT, USA). The control-normalized MTT signal was calculated relative to the untreated control according to Equation (1), as applied in our earlier work [27]:
Control-normalized MTT signal (%) = (Abssample/Abscontrol) × 100
2.8. Live/Dead and Hematoxylin–Eosin Staining
Two staining endpoints were obtained, each at the end of a 72 h exposure, and each from cultures used for that endpoint alone. The two procedures cannot share wells, since Live/Dead staining requires living cells whereas hematoxylin–eosin staining requires fixation, and they also belong to different exposures (Section 2.2). Live/Dead staining was carried out within the monthly series, on cultures exposed in the month of collection to that month’s sterile filtrate, in May, July, November and February. Hematoxylin–eosin staining was carried out on cultures exposed to the quarterly pools in the single experiment that followed the final sampling in March 2022. The MTT assay used its own wells (Section 2.7), so no well contributed to more than one endpoint. Live/Dead staining was applied to living, unfixed cultures. The medium was removed, the monolayer was rinsed, the Hoechst 33342/propidium iodide mixture was applied directly to the living cells, and imaging followed immediately. No fixative was used at any stage of this procedure, since propidium iodide labels every nucleus once the membrane has been permeabilized and the exclusion endpoint would have been destroyed by fixation. Each examined month was stained and imaged together with one untreated control field, exposed and processed alongside it, giving four control fields in all. Within a month, a separate control was not imaged for every station and dose, so that single control field served all three stations and all seven doses of that month. For hematoxylin–eosin staining, the medium was removed at the end of the exposure, the monolayer was fixed, and staining followed on the fixed preparations. Because all four quarterly pools were exposed in the same experiment, they share one set of three untreated control wells, one per station, and were stained together.
Live/Dead analysis was performed with a Hoechst 33342/propidium iodide kit (Sigma-Aldrich, St. Louis, MO, USA). Hoechst 33342 is membrane-permeant and stains the nuclei of intact cells, with early-apoptotic nuclei appearing brighter owing to chromatin condensation; propidium iodide is excluded by intact membranes and stains late-apoptotic and necrotic nuclei. One month was examined in each season: May, July, November, and February. Within each of these months, the complete dose series was examined, all seven doses at each of the three stations, giving 83 exposed fields; the February series lacks the highest dose at Station 1, for which no preparation was available. One field was imaged per condition, and four untreated control fields were imaged as described above, for a total of 87 fields. Live/Dead staining was viewed under the Leica DMIL100 phase-contrast microscope with fluorescence attachment (Leica Microsystems, Wetzlar, Germany) at a magnification of 10×.
Hematoxylin–eosin (HE) staining was performed across the full design: all seven doses plus the untreated control, at each of the three stations, for each of the four quarterly pools. Wells were washed with distilled water and excess water removed; 50 µL of hematoxylin was applied for 5 min, then washed with distilled water; and 50 µL of eosin was applied for 4 min. Stained cultures were imaged under the Leica DM700 light microscope (Leica Microsystems, Wetzlar, Germany) at 10× magnification.
2.9. Image-Based Quantification
Two quantitative endpoints were derived from the stained cultures. Cell density was determined from the HE images, which cover the full dose range, and the loss of membrane integrity was determined from the propidium iodide channel of the Live/Dead images.
For cell density, each HE image was converted to grayscale and a local background estimated by median filtering; the background-subtracted image was smoothed with a Gaussian kernel and thresholded to isolate hematoxylin-positive nuclei. Touching nuclei were separated by watershed segmentation of the Euclidean distance transform, seeded on local distance maxima, and objects outside a fixed size range were excluded as debris or unresolved clusters. Counts are expressed as nuclei per mm2 of field area and normalized to the untreated control well of the same station, which was processed identically. Consistency of illumination across the experiment was verified by comparing the median grayscale value of each panel (with a coefficient of variation of 4–6% within each quarter). Metabolic activity per cell was calculated as the ratio of the control-normalized MTT signal to normalized cell density, both expressed relative to the untreated control. Because cell density was assessed on the quarterly pools while the MTT signal was assessed on the monthly filtrates, the two measurements do not derive from an identical exposure event; no MTT assay was performed on the quarterly pools themselves. The ratio was therefore computed at the quarterly resolution, using the mean of the three monthly MTT values within each quarter, and should be interpreted as a quarterly level approximation rather than a measurement tied to a single exposure event.
For membrane integrity, a red-specific signal was derived from the propidium iodide channel as R − max(G, B); diffuse background was removed by median-filter subtraction; discrete foci were segmented by intensity thresholding followed by connected-component analysis with a size filter, and the scale-bar region was masked. Counts are expressed both as events/mm2 and as a percentage of the Hoechst-positive nuclei counted in the same field, the latter normalizing for differences in confluence between fields. The 83 exposed fields were compared with the four untreated control fields by the Mann–Whitney U test, and the association between dose and the percentage of propidium iodide-positive nuclei was assessed by Spearman’s rank correlation. The sensitivity of the counts to the segmentation threshold was examined by repeating the analysis at 4, 5, and 6 robust standard deviations above the local background median. Because one field was imaged per condition, comparisons between individual stations or individual months were not made. The Hoechst channel of the same 87 fields was segmented to obtain nuclear morphometry, median nuclear area, the coefficient of variation in nuclear intensity, the fraction of dim nuclei, and nuclear solidity, so that chromatin condensation and nuclear fragmentation could be assessed independently of the propidium iodide signal. All image analysis was performed in Python 3.11 using scikit-image 0.22; image files were coded and analysis was blind to treatment.
2.10. Statistical Analysis
Monthly and seasonal means and standard deviations were calculated for each physicochemical parameter. Each station-month–dose combination was assayed in three technical replicate wells on the same plate; these were averaged prior to statistical analysis, yielding a single value per station-month (n = 36) as the experimental unit for all comparisons against control and between doses. Well-level replicates were not treated as independent observations. Because the seven doses were applied to aliquots of the same station-month sample, observations across doses are not independent. Differences in cellular response were therefore tested by repeated-measures analysis of variance with the station-month sample as the subject and dose as the within-subject factor; departure from sphericity was assessed, and probabilities were corrected by the Greenhouse–Geisser procedure. The proportion of variance attributable to differences between station-month samples is reported as an intraclass correlation coefficient. Pairwise dose comparisons were made with paired t-tests and corrected by the Benjamini–Hochberg false-discovery-rate procedure. Every assay plate carried its own untreated control wells, and the MTT signal was expressed relative to the control assayed in the same block, so that samples processed together share a common reference; between-month differences are reported descriptively rather than as tested contrasts. The shape of the dose–response relationship was examined descriptively. Because concentrations below the lowest tested dose were not examined and no formal dose–response model was fitted, the observed pattern is described rather than classified, and no hormetic or non-monotonic classification is claimed [28,29].
The distribution of each variable was assessed by the Shapiro–Wilk test. Eighteen of the twenty-two variables entering the correlation analysis, including the cellular response variable, departed significantly from normality (p < 0.05), and several showed pronounced skew or floor effects. Spearman’s rank correlation was therefore adopted as the primary measure of association between physicochemical variables and cellular response. Pearson product–moment correlations were computed in parallel as a sensitivity analysis and are reported in Supplementary Table S1. Correction for multiple comparisons across the twenty-one physicochemical variables used the Benjamini–Hochberg false discovery rate procedure. The covariance structure of the physicochemical panel was explored by principal component analysis on standardized variables. Statistical significance was accepted at p < 0.05. All statistical and image analyses were performed in Python 3.11 using NumPy 1.26, SciPy 1.11, pandas 2.1, and scikit-image 0.22; the analysis scripts are provided as Data S1. Two further sources of dependence were taken into account. First, the three stations sampled in a given month share that month’s weather, inflow and reservoir condition, so the thirty-six station-month samples are not thirty-six independent draws. Partitioning the variance of the station-month means at 72 h showed that 73% of it lies between months and 27% between stations within a month. The dose analysis was therefore repeated with the month as the experimental unit, averaging the three stations (n = 12), which is the most conservative treatment of this dependence; the outcome is reported alongside the station-month analysis in Section 3.3. Second, the untreated control is itself a sample. For the HE endpoint, the control consisted of three wells, one per station, exposed in the same experiment as the four quarterly pools, imaged in the same session and shared across them; their densities were 8051, 6258 and 6799 nuclei/mm2 at Stations 1 to 3, with a mean of 7036 and a coefficient of variation of 13%. Each exposed panel was therefore normalized to the control well of its own station, and the control’s own standard error was propagated into the derived ratios reported in Section 3.3.2. Doses were compared with the control by one-sample t-tests on the station-normalized values (n = 12 panels per dose: four quarters × three stations) with Benjamini–Hochberg correction, and, because three control wells give the control term only two degrees of freedom, the pooled comparison is additionally described by the number of exposed panels falling below the control. Differences between quarters were tested by repeated-measures analysis of variance with station as the subject, and differences between stations in the tetrazolium signal at 72 h in the same way with month as the subject. The association between dose and cell density was assessed by Spearman correlation across the seven dose means. Because the four pools were exposed in a single experiment and stained in one session against one shared control, comparisons between quarters are internally valid for this endpoint, unlike the monthly MTT series, although the pools had been held at +4 °C for different lengths of time. Nitrite-N values at or below the lower working limit of the determination, 0.002 mg/L, cannot be resolved against that limit. They were carried into the descriptive statistics and the correlation analysis at their reported values, which is the convention the service laboratory applied; thirty-three of the thirty-six station-month values lie at or below that limit, so the variable is heavily left-censored and we tested whether the treatment of those values alters the result. Replacing every value at or below the limit by the limit itself, by half the limit, or by zero moves the rank correlation between nitrite-N and cellular response from −0.35 to −0.17 across the thirty-six station-months (p = 0.034 to p = 0.32), and from −0.41 to +0.04 across the twelve monthly means. Nitrite-N is therefore reported descriptively and is not used as evidence of association anywhere in this work; it was in any case not significant after false discovery rate correction (q = 0.051). Its only role is the June classification, which rests on the three June values that lie within the working range of the method; because the limit coincides with the Class I/II boundary of the regulation, these months are reported as months in which an exceedance was not demonstrated, rather than as months in which compliance was confirmed.
3. Results
3.1. In Situ Measurements at the Sampling Stations
Five parameters that were subject to change on standing, dissolved oxygen, pH, salinity, water temperature, and electrical conductivity, were measured in the field at the moment of collection at each of the three stations in each of the twelve months. Annual summaries are given in Table 2 and monthly means in Table 3.
Table 2.
Annual summary of in situ parameters at Karadere Reservoir (n = 36 station-months). Water quality classes follow the Turkish Surface Water Quality Regulation (SWQR).
Table 3.
Monthly in situ parameters. Values are the mean ± SD across the three sampling stations (n = 3 stations per month).
Dissolved oxygen remained high throughout the year, with monthly means ranging from 11.00 mg/L in September to 13.76 mg/L in May, and never approached the 8 mg/L threshold separating Class I from Class II. The seasonal minimum in late summer and the maximum in spring follow the expected inverse relationship with water temperature. Station means were essentially identical (12.45–12.46 mg/L), and the between-station standard deviations of dissolved oxygen and pH did not exceed 0.03 mg/L and 0.03 units, respectively, which is a few times the resolution at which the readings were recorded. Because all samples were drawn from approximately 15 cm below the surface, these data establish horizontal uniformity among the three sampling points at that depth; they do not characterize the vertical structure of the water column, and no inference about whole-reservoir mixing is drawn from them.
Monthly mean water temperature ranged from 4.07 °C in January to 19.67 °C in August, and no individual station exceeded 20 °C in any month, placing the reservoir in Class I on this criterion throughout the year and within the tolerance range for the rainbow trout cultured on site.
Electrical conductivity and salinity followed the seasonal temperature cycle. Monthly mean conductivity rose from 222 µS/cm in April to 348 µS/cm in October before falling to an annual minimum of 194 µS/cm in March; salinity followed the same trajectory, from 0.20‰ in January to 0.60‰ in August. Table 2 gives the corresponding station-level minima and maxima. Both remained well within Class I limits, with conductivity never exceeding 350 µS/cm, compared with a Class I threshold of 400 µS/cm.
pH was the only in situ parameter to depart from Class I at any point in the year. Values increased progressively from 8.08 in January to a maximum of 8.59 in October, then fell again through the winter. Four of the thirty-six station-month measurements exceeded the Class I–II ceiling of 8.5: Station 3 in September (8.51) and all three stations in October (8.55, 8.57, and 8.59). Applying the worst-parameter rule at station level, the reservoir is assigned Class III for pH in September, on the single station value of 8.51, and again in October, when all three stations exceeded the ceiling; it remains within Class I-II on this parameter in the other ten months. The gradual rise through the growing season and the sharp decline in November are consistent with the photosynthetic drawdown of dissolved carbon dioxide, although the present measurements neither establish that mechanism nor exclude an external contribution.
Between-station variation was negligible for every in situ parameter. Station means differed by less than 0.02 mg/L for dissolved oxygen, 0.04 pH units, 0.23 °C, and 3.4 µS/cm, with Station 3 at the dam wall being marginally the warmest and most conductive, and Station 1 at the inflow marginally the coolest. The reservoir therefore behaved as a single hydrochemical unit at this sampling resolution, and temporal rather than spatial variation dominated.
3.2. Laboratory Physicochemical Analyses
Sixteen parameters were determined in the laboratory on each of the 36 station-month samples (Table 4; monthly means for every parameter are given in Table S2). Every laboratory parameter for which the regulation sets a class limit met the Class I criteria, with a single exception; the remainder, identified in Table 4, are not classified by the regulation. In June, nitrite-N exceeded the 0.002 mg/L Class I limit at all three stations, at 0.0024, 0.0029, and 0.0031 mg/L, values that lie within the working range of the method, although close to its lower limit. In every other month, the highest value recorded at any station was at or below 0.0020 mg/L, that is, at or below the lower working limit of the determination, which coincides with the Class I boundary; those months cannot be resolved against the boundary and are assigned Class I on this parameter. June is therefore the only month in which the Class I nitrite limit was exceeded at values lying within the working range of the method.
Table 4.
Annual summary of laboratory-determined physicochemical parameters. Mean ± SD, minimum, and maximum are computed across all 36 station-month samples, not across monthly means. Class limits are those set by the Turkish Surface Water Quality Regulation, as applicable.
3.2.1. Organic Load
Chemical and biochemical oxygen demand were both low throughout the year. COD averaged 2.83 ± 1.43 mg/L with a maximum monthly mean of 5.72 mg/L in June, less than a quarter of the 25 mg/L Class I ceiling. BOD averaged 0.85 ± 0.56 mg/L and peaked at 1.57 mg/L, again in June, against a Class I limit of 4 mg/L. Both fell to near-zero values in the winter months (BOD 0.03–0.23 mg/L from December to March). Total suspended solids never exceeded 2.48 mg/L. The reservoir is therefore not subject to appreciable organic pollution.
3.2.2. Nutrients
Nitrogen species showed the clearest seasonal structure among parameter groups. Nitrate-N rose from 1.56 mg/L in April to 2.49 mg/L in May and 3.96 mg/L in June, then fell to 1.78 mg/L in July and remained between 0.16 and 1.18 mg/L for the rest of the year. All 36 station-month measurements, therefore, fall within Class I (≤5 mg/L). Nitrite-N followed the same trajectory at three orders of magnitude lower concentration, with a June maximum of 0.0031 mg/L. Three of the 36 measurements, all in June, exceeded the 0.002 mg/L Class I limit and fell in the Class II range of 0.002–0.01 mg/L; the remaining 33 lay at or below 0.002 mg/L, which is also the lower working limit of the determination, and are reported as not resolvable against the Class I boundary. Ammonium-N was negligible throughout, never exceeding 0.0007 mg/L against a Class I limit of 0.2 mg/L.
Orthophosphate followed a different and later trajectory. Concentrations were negligible from January to March (0.000–0.003 mg/L), rose through the summer, and peaked at 0.172 mg/L in November before declining again. The reservoir thus carries two distinct nutrient signals in the annual cycle: a nitrogen-dominated pulse in late spring and a phosphorus-dominated pulse in autumn. No chlorophyll a measurement, phytoplankton count, or trophic-state index was determined in this study, so trophic status cannot be assigned; the recorded nutrient concentrations provide no indication of enrichment despite the two operating trout farms.
3.2.3. Ionic Composition and Hardness
The reservoir is a moderately hard-water system. Total hardness averaged 115.3 ± 7.1 mg/L CaCO3 and total alkalinity averaged 117.9 ± 7.3 mg/L CaCO3, with both varying by about 20% throughout the year and peaking in September. Calcium averaged 19.9 ± 5.1 mg/L with a pronounced June maximum of 31.0 mg/L, well below the 75 mg/L level recommended as an upper bound for surface waters. Magnesium averaged 15.5 ± 3.6 mg/L, peaking at 20.8 mg/L in July. These concentrations are consistent with the carbonate and sulfate mineralogy of the catchment, and the ionic sum they represent, approximately 3.1 meq/L, agrees with the measured electrical conductivity of 274.6 µS/cm. Sodium, potassium, chloride, sulfate, and sulfite all remained far below any applicable limit; the highest recorded sodium concentration, 25.6 mg/L in June, is a fifth of the 125 mg/L Class I threshold.
3.2.4. The June Convergence
A striking feature of the dataset is that nine of the sixteen laboratory parameters, COD, BOD, nitrate, nitrite, ammonium, sulfate, sodium, potassium, and calcium, reach their annual maximum in the same month, June, and that the reservoir’s only nutrient departure from Class I, the Class II nitrite assignment, falls in the same period. Magnesium peaks in July, and the ionic parameters remain elevated through the summer. This convergence is consistent with a single seasonal driver rather than independent fluctuation in each parameter. One candidate is the first of the two annual fertilizer applications made on the cultivated land of the upstream catchment, which adjoins the channels that feed the impoundment and therefore drains directly into it, coinciding with declining reservoir volume as irrigation abstraction begins; the autumn phosphate maximum may correspond to the second application.
For the purposes of the present study, the important observation is that this convergence produces a well-defined annual gradient in ionic content, calcium, magnesium, and conductivity, varying by factors of 2.6, 2.2, and 1.8, respectively, between their annual minima and maxima, against which the cellular response can be evaluated (Figure 2).
Figure 2.
Monthly variation in selected physicochemical parameters. Points are means ± SD of the three stations. (a) Oxygen and temperature; (b) pH and conductivity; (c) nitrogen and phosphorus pulses; (d) ionic and organic load. Dotted lines mark the Class I ceiling of the Surface Water Quality Regulation for the left-hand variable of the panel: pH 8.5 in (b) and nitrate-N 5 mg L−1 in (c). Background shading indicates the sampling quarter (April–June, July–September, October–December, January–March).
3.2.5. Dissolved Radon
Radon activity concentration was determined on a single occasion at five stations distributed across the reservoir. Station means ranged from 4 ± 1 to 7 ± 4 Bq/L, with a reservoir mean of 5.4 Bq/L (station values and the calculation in Table S2); uncertainties are the standard deviation of the three measurement cycles performed on each sample. The relative uncertainties of the station means, 20 to 57%, exceed the differences between stations, so the stations are not distinguished from one another and the reservoir mean is the value carried forward.
3.3. Cellular Response to Sterile-Filtered Reservoir Water
Primary rat bmMSCs were exposed to sterile-filtered reservoir water across a seven-point dose range spanning 0.01–0.5% v/v, at each station in every month of the sampling year, yielding 108 wells per dose (three technical replicate wells per station-month, averaged before analysis; n = 36 station-months is the experimental unit for all comparisons). Unless a particular month or quarter is named, values reported in this section combine all twelve monthly sampling events. The MTT signal was expressed relative to untreated cultures assayed in the same block. The response differed markedly between the two exposure durations (Table 5; Figure 3a).
Table 5.
Control-normalized MTT signal of primary rat bmMSCs after 24 h and 72 h of exposure to sterile-filtered reservoir water. Values combine all twelve monthly sampling events at all three stations (n = 36 station-months per dose, the triplicate technical-well mean for each station-month) and are means ± SEM relative to the untreated control assayed in the same block (100%); significance from a one-sample t-test against 100.
Figure 3.
Control-normalized MTT signal of primary rat bmMSCs exposed to sterile-filtered reservoir water. (a) All twelve monthly sampling events at all three stations combined (n = 36 station-months per dose, technical-well triplicates averaged before analysis; means ± SEM relative to the untreated control assayed in the same block); *** p < 0.001 against control. (b) The same 72 h data, resolved by sampling quarter (April–June, July–September, October–December, and January–March); means ± SEM of the nine station-months of each quarter. The dashed line indicates the untreated control level (100%).
Observations within a station-month sample were strongly correlated: the intraclass correlation coefficient for the station-month sample was 0.754, so three-quarters of the variance in the 72 h data lay between samples rather than between doses within a sample. All dose comparisons were therefore made within samples. Averaged over the whole sampling year, no dose significantly altered the signal at 24 h; the 4–7% reductions apparent from 0.5 to 5 µL/mL were not significant, and repeated-measures analysis of variance confirmed that dose was not a source of variation at this time point (F(6, 210) = 1.49, p = 0.18; Greenhouse–Geisser corrected p = 0.22). At 72 h, the pattern reversed and dose became a highly significant factor (F(6, 210) = 11.63, p = 3.1 × 10⁻¹¹; Greenhouse–Geisser ε = 0.667, corrected p = 3.5 × 10⁻⁸), driven by an elevation at the lowest dose. The MTT signal at 0.1 µL/mL reached 119.1 ± 4.6% of control (p = 2.2 × 10⁻⁴; Benjamini–Hochberg q = 1.5 × 10⁻³ across the seven dose-versus-control tests). The elevation at 0.2 µL/mL (107.6 ± 4.4%) did not reach significance (p = 0.095, q = 0.25). Paired post hoc comparisons across all 21 dose pairs identified ten significant differences after false discovery rate correction across that family, and the 0.1 µL/mL dose differed from every one of the other six (q ≤ 2.6 × 10⁻³). Repeating the dose analysis with the month as the experimental unit, averaging the three stations so that the dependence among stations sampled in the same month cannot contribute, left the conclusion unchanged: dose remained highly significant at 72 h (F(6, 66) = 7.07, Greenhouse–Geisser corrected p = 1.2 × 10⁻³) and non-significant at 24 h (corrected p = 0.43). The response is therefore not a graded trend across the dose range but a discrete, time-dependent elevation confined to the lowest, most diluted exposure.
The profile is described here rather than classified: the MTT signal increased at the lowest exposure tested and did not increase further at higher exposures. Concentrations below 0.1 µL/mL were not tested, so the data neither indicate a threshold nor allow a formal dose–response classification [29]. The elevation was statistically robust (119% of control) and confined to the lowest exposure, with values at all higher doses not significantly different from control. Critically, the elevation cannot be attributed to nutrient supplementation from the added water: the ionic and nutrient mass delivered at these dilutions is negligible relative to the culture medium, and a nutritional mechanism would, in any case, predict a response that increases with dose, a pattern that was not observed.
Because the tetrazolium assay reports mitochondrial dehydrogenase activity rather than cell number, this elevation is interpreted throughout as increased metabolic activity. Whether it reflects upregulation of oxidative metabolism in a constant cell population, a mitochondrial stress response, or genuine proliferation cannot be resolved by the present endpoints.
The low-dose elevation at 72 h was in the same direction at each of the three sampling stations (113.8%, p = 0.109; 121.7%, p = 0.021; 121.9%, p = 0.027, at Stations 1–3, respectively), reaching significance at two of the three, with Station 1 showing the same trend without reaching significance on its own. Between-station differences in overall response were not significant at 72 h (repeated-measures analysis with month as the subject, F(2, 22) = 0.88, p = 0.43), with mean MTT signals of 101.5%, 104.4% and 108.1% at Stations 1, 2 and 3, respectively. The dose–response resolved by sampling quarter is shown in Figure 3b.
The tetrazolium assay reports mitochondrial dehydrogenase activity summed across the entire well and cannot distinguish a change in cell number from a change in individual cell activity. To separate the two, cell density was quantified from the hematoxylin–eosin preparations, which cover the complete design of seven doses and an untreated control at three stations in each of four quarters. Because all four quarterly pools were exposed in a single experiment and stained in one session against one shared set of three untreated control wells, the density data are directly comparable across quarters in plating and staining, although the pools had been held at +4 °C for different lengths of time (Section 2.2).
3.3.1. Exposure Reduces Cell Density Across the Dose Range and in Every Quarter
The three untreated control wells, one per station, reached densities of 8051, 6258 and 6799 nuclei/mm2 at Stations 1 to 3, a mean of 7036. Across the 84 exposed panels, density averaged 5307 nuclei/mm2. With each panel expressed relative to the control well of its own station, exposure reduced density to 76.2 ± 3.0% of control (mean ± SEM of the twelve station-quarter means). Every one of the seven doses differed significantly from the control (q ≤ 0.036; Table 6), and the reduction was present in every quarter, with no significant difference between quarters (repeated-measures analysis with station as the subject, F(3, 6) = 1.20, p = 0.39; Figure 4a). Representative preparations and the segmentation applied to them are shown in Figure 5; the complete set of preparations for the four quarterly pools is given in Figure S1a–d and the segmentation workflow in Figure S2. The reduction is also evident without reference to any model: 77 of the 84 exposed panels fell below the control mean and 67 fell below even the lowest of the three control wells. The control for this endpoint comprises three wells, one per station, so the absolute magnitude of the reduction is less tightly constrained than its direction; with the control’s own variability propagated, the ratio of exposed to control density is 0.75 with a 95% confidence interval of 0.64 to 0.87.
Figure 4.
Cell number and metabolic activity by sampling quarter. (a) Cell density in HE-stained cultures after 72 h, each panel expressed relative to the untreated control well of its own station (8051, 6258 and 6799 nuclei/mm2 at Stations 1 to 3); bars are means ± SEM of the three stations for the quarterly pool named. (b) The exploratory estimate of activity per cell, one value per quarter, calculated as the ratio of the mean MTT signal of that quarter’s three monthly sampling events to the cell density of the corresponding quarterly HE pool; error bars are 95% confidence intervals propagated from the standard errors of both components, taken over station-months and station pools as in Table 7, together with that of the shared untreated control. The two endpoints come from different cultures, so the ratio is an exploratory estimate and is not resolved by dose; its point value exceeds unity in all four quarters and its confidence interval excludes unity in two. Dashed lines indicate the control level (100%) in (a) and unity in (b).
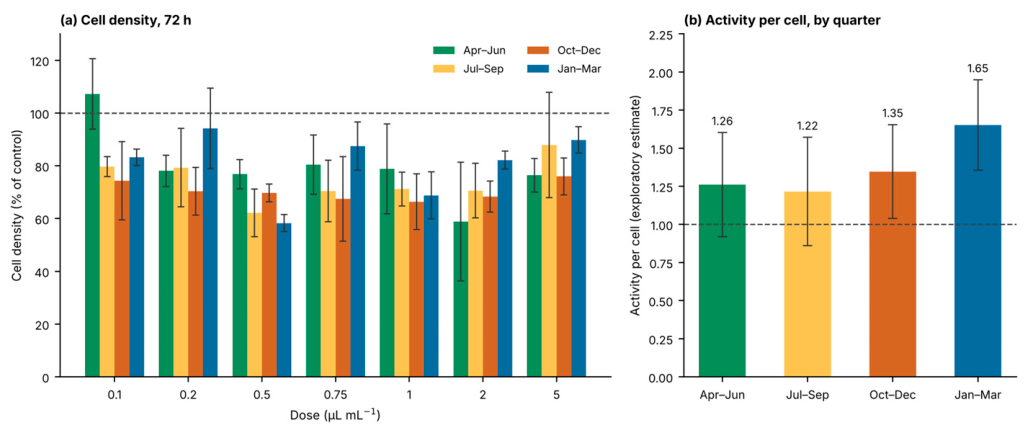
Figure 5.
Hematoxylin–eosin preparations after 72 h of exposure, and the segmentation used to quantify them. Panels show the April–June quarterly pool, the equal-volume mixture of the April, May, and June samples, at three stations under three conditions selected a priori to span the dose range: untreated control, lowest dose (0.1 µL/mL), and highest dose (5 µL/mL); measured nuclear density is inset. The bottom row shows the central region of the same three Station 1 fields at higher magnification with segmentation boundaries overlaid in green. Nuclear densities are computed over the whole field, including cell-free regions such as the pale area at the left of the Station 1 panel at 5 µL/mL. Scale bars: 100 µm (upper rows) and 25 µm (segmentation row); images acquired at 0.704 µm per pixel.
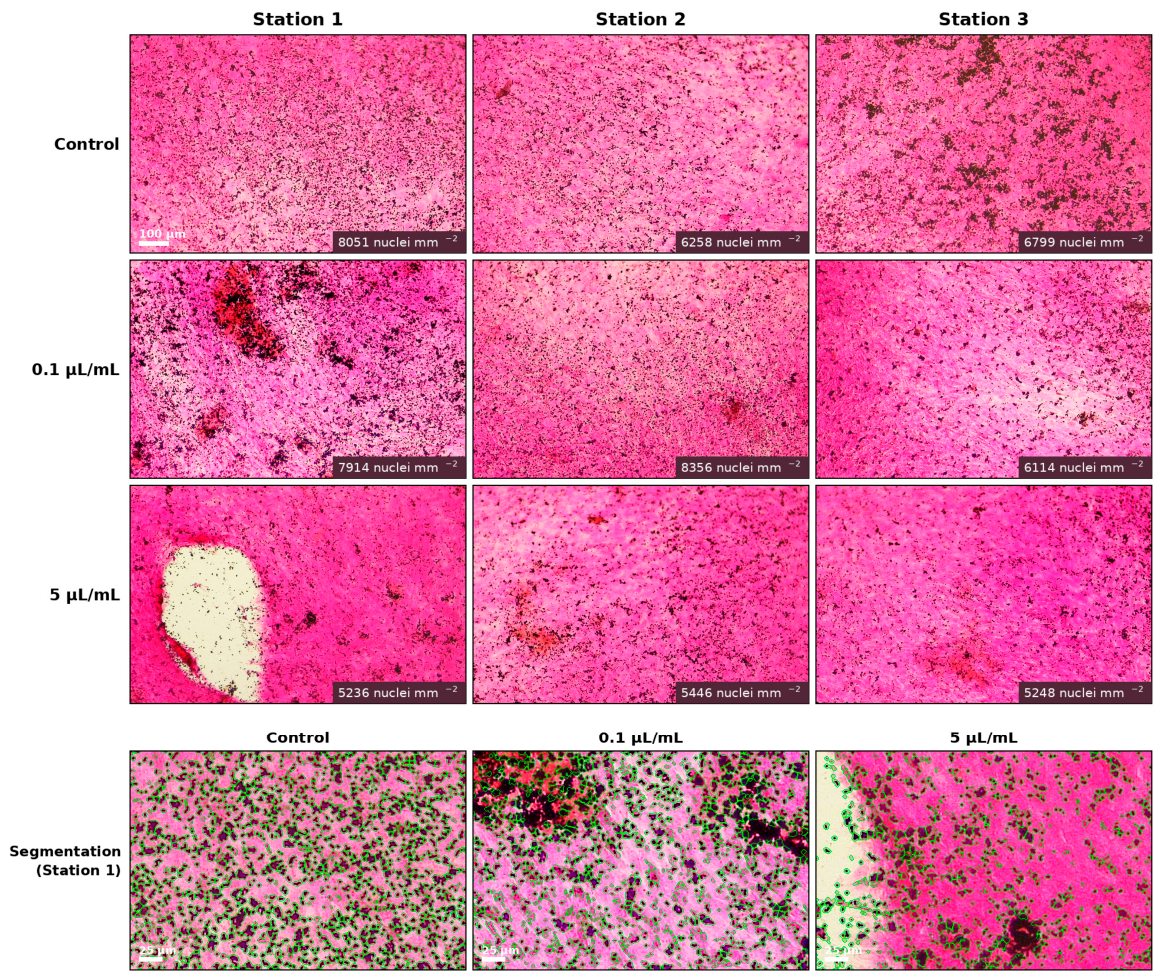
Table 6.
Cell density in HE-stained cultures after 72 h of exposure. Each panel is expressed as a percentage of the untreated control well of its own station (8051, 6258 and 6799 nuclei/mm2 at Stations 1 to 3; mean 7036). Each quarterly value is the mean of the three stations for the named pool (April–June, July–September, October–December, or January–March). q-values are from one-sample t-tests on the station-normalized values across the twelve panels per dose (four quarters × three stations), with Benjamini–Hochberg correction across the seven doses.
Table 7.
Exploratory estimate of metabolic activity per cell. The two endpoints were obtained from different preparations of the same water: the MTT signal from the monthly filtrates and the cell density from the corresponding quarterly HE pool, both expressed relative to the untreated control. Their ratio is therefore a derived estimate rather than a directly measured quantity. Values are mean ± SEM for each endpoint, computed over the independent units of each quarter: the nine station-months for the MTT signal and the three station pools for cell density, with each unit being the mean of its seven doses. The dose-level values within a unit are repeated observations of the same sample and are not counted as independent. The 95% confidence interval of the ratio was obtained by propagating the relative standard errors of its two terms together with that of the shared untreated control. The point estimate exceeds unity in all four quarters and the interval excludes unity in two.
The reduction did not deepen with concentration. Across the seven dose means, the rank correlation between dose and density was weak and not significant (ρ = −0.25, p = 0.59), and the lowest dose tested, 0.1 µL/mL, corresponding to 0.01% v/v reservoir water, had already produced a 14% reduction. The reduction was therefore already present at the lowest exposure examined and did not deepen across a fifty-fold rise in concentration. We describe this pattern without classifying it: concentrations below 0.1 µL/mL were not tested, so the data do not locate a threshold, and the absence of a significant association with dose does not establish that the full effect had been reached at the lowest concentration. Between-station scatter within a quarter was comparable in magnitude to the differences between doses, and comparisons between individual doses were accordingly not attempted.
3.3.2. An Exploratory Estimate of Metabolic Activity per Cell
Placing the two measurements side by side constrains the interpretation of the tetrazolium signal. At 72 h, the MTT signal did not fall significantly below control at any dose and reached 119.1% at 0.1 µL/mL, while cell density over the same period was reduced to 67–86% of control. These two endpoints were obtained from different preparations of the same water—MTT from the monthly filtrates and cell density from the quarterly pools, which were held for correspondingly longer—so their ratio is not a directly measured quantity. It is reported here as an exploratory derived estimate, computed per quarter with the standard errors of both terms and of the shared untreated control propagated into its confidence interval; the standard errors are taken over the independent units of each quarter, the nine station-months for the tetrazolium signal and the three station pools for density, not over the dose-level observations within them. The estimate is 1.26 (95% CI 0.92–1.60) in April–June, 1.22 (0.86–1.57) in July–September, 1.35 (1.04–1.65) in October–December and 1.65 (1.36–1.95) in January–March (Table 7). The point estimate exceeds unity in all four quarters; the confidence interval excludes unity in two (Figure 4b).
No evidence of lysis was found. Propidium iodide-positive events were sparse across seasons, stations, and doses, with a median of 0.18% of the nuclei counted in the same field with no difference detected from the untreated controls (Table 8). No increase in membrane-compromised cells was detectable in the fields examined at 72 h. The endpoint is, by construction, a measurement of the adherent population at the end of the exposure: the Live/Dead protocol required the medium to be removed and the monolayer rinsed before the dyes were applied, so any cells that had detached during the exposure were carried away with the medium and could not be labeled. The observation therefore did not exclude cell death occurring earlier in the exposure, or loss of cells into the medium. Suppression of proliferation and cell-cycle arrest remained consistent with the lower cell number, and distinguishing among these possibilities required molecular endpoints that were not measured here.
Table 8.
Membrane integrity assessed by Hoechst 33342/propidium iodide staining after 72 h of exposure. Live/Dead staining was carried out on one monthly sample per season (May, July, November, February), at all seven doses and all three stations, giving 83 exposed fields; one untreated control field was imaged for each of the four months. One field was imaged per condition, at 1.46 µm per pixel (field 1.387 × 1.034 mm), containing 645–2323 nuclei. Values are propidium iodide-positive events expressed as a percentage of the nuclei counted in the same field, given as median (range).
3.3.3. Membrane Integrity Evaluation
Loss of plasma membrane integrity was assessed by propidium iodide exclusion in cultures counterstained with Hoechst 33342. Each of the four examined months was stained and imaged with its own untreated control field; comparisons were therefore made within a month, between exposed fields and the control of that month, and not between months. One month was examined per season, May, July, November and February, and within each month the complete dose series was examined at all three stations, giving 83 exposed and four control fields (Figure 6; the complete set of panels and the corresponding segmentation overlays are given in Figure S3, and the field-by-field counts in Table S3).
Figure 6.
Live/Dead staining of bmMSCs after 72 h of exposure to sterile-filtered reservoir water at 5 µL/mL (0.5% v/v), the highest dose tested, from Stations 1–3 of the Karadere Dam Irrigation Reservoir, with the untreated control field imaged in the same month. Live/Dead staining was performed on single monthly samples, one per season (May, July, November, and February), at all seven doses; the panels shown are from the May sample. Nuclei of all cells are stained with Hoechst 33342 (blue) and membrane-compromised cells with propidium iodide (red); the third column shows the merged image, and the fourth the propidium iodide channel, with every focus counted by the segmentation routine circled in green, so that the counts can be checked against the images. Each propidium iodide panel is annotated with the number of positive events, the number of nuclei in the same field, and their ratio. PI channel images were background-subtracted using a rolling ball (radius: 60 px), and all PI panels were displayed within the same intensity range; Hoechst panels were unmodified. Scale bars, 200 µm. The complete set of Live/Dead panels for all four months, all three stations, and all seven doses, together with the untreated controls and the corresponding segmentation overlays, is provided in Figure S3.
Propidium iodide-positive nuclei were scarce under every condition. Expressed as a percentage of the nuclei counted in the same field, propidium iodide-positive nuclei had a median of 0.18% across the 83 exposed fields (range 0 to 1.34%) against a median of 0.33% in the four untreated control fields (range 0 to 0.66%); no difference was detected between the two distributions (Mann–Whitney U, p = 0.50), and only two of the 83 exposed fields exceeded 1% (Table 8). In absolute terms, this corresponds to 0 to 13.2 events/mm2 in the exposed fields and 0 to 6.3 events/mm2 in the controls, in fields containing 645 to 2323 Hoechst-positive nuclei. The percentage of positive nuclei did not increase with dose; if anything, it declined slightly across the seven-point series (Spearman’s ρ = −0.26, p = 0.018), the opposite of the expected direction for a concentration-dependent cytotoxic effect. The counts were insensitive to the segmentation threshold, being identical at four, five, and six robust standard deviations above the background in all 87 fields. Nuclear counts in these fields were used to normalize the propidium iodide events and are not a density endpoint: exposed fields contained a mean of 1748 nuclei against 1594 in the four control fields, so they did not reproduce the reduction measured in the hematoxylin–eosin series and were not an independent estimate of it. The two series came from different wells, from monthly filtrates rather than from the quarterly pools, which were held at +4 °C for correspondingly longer, from living rather than fixed cultures, and from a different microscope and field size, 0.704 against 1.46 µm per pixel, so that absolute densities differed by four- to six-fold between the two series; each month, moreover, was represented by a single control field. The reduction in cell density reported above rests on the hematoxylin–eosin series alone, and the Live/Dead preparations are used here only for the membrane-integrity endpoint for which they were acquired. Hoechst staining showed the compact, evenly distributed nuclear profile characteristic of intact monolayers, without the chromatin condensation, nuclear fragmentation, or cell rounding that accompany advanced apoptosis or necrosis. Quantitative nuclear morphometry of the same fields supported this reading (Table S4). Nuclear solidity, the measure most sensitive to the lobation and fragmentation of apoptotic nuclei, was 0.953 in exposed fields and 0.956 in controls, and rose rather than fell with dose (ρ = +0.30, p = 0.005). The median nuclear area was smaller in exposed than in control fields (168 versus 217 µm2, p = 0.022), but this difference tracked field confluence rather than treatment: across all 87 fields, median nuclear area was strongly inversely related to the number of nuclei in the field (ρ = −0.78, p = 4 × 10⁻¹⁹) and showed no relationship with dose (ρ = −0.10, p = 0.39). The fraction of dim nuclei behaved in the same way, being lower in exposed fields than in controls (0.029 versus 0.177) and determined almost entirely by confluence (ρ = −0.86 with nuclei per field). No morphometric index varied with dose in a direction consistent with apoptosis.
Because one field was imaged per condition, the counts were low in absolute terms, and the differences between individual fields were of the same order as the Poisson variation expected at these numbers; no individual station or month was therefore identified as differing from any other, and the ratios between single exposed fields and their controls were not interpreted. The data support the negative statement, which is consistent across all 87 fields: exposure to sterile-filtered reservoir water at every concentration tested and in every season did not produce a detectable population of membrane-compromised cells.
3.4. Temporal Variation in Cellular Response and Its Relationship to Water Chemistry
3.4.1. Response Varies Across the Year
Cellular response varied across the sampling year. Monthly means at 72 h ranged from 80.5% of the control in May to 147.2% in March, a spread substantially larger than the dose effect (Figure S4). Each value is expressed relative to the untreated control assayed alongside it, and its standard error is taken over the three stations. Because the twelve sampling events were not all processed on a single occasion, these monthly values are presented as descriptions rather than as tested contrasts (Table 9).
Table 9.
Monthly mean cellular response at 72 h, with the water quality class assigned in that month. Class is the poorest among the parameters that the regulation classifies. Values are means ± SEM over the three stations, with each station contributing the mean of its seven doses, relative to the untreated control assayed in the same block; the dose-level values within a station are repeated observations of the same sample.
3.4.2. Association with Physicochemical Descriptors
Across the full dataset, sixteen of the twenty-one physicochemical variables were significantly negatively correlated with cellular response at unadjusted p < 0.05, of which thirteen remained significant after Benjamini–Hochberg correction, the strongest being calcium (ρ = −0.73), temperature (ρ = −0.67), chemical oxygen demand (ρ = −0.66), salinity (ρ = −0.65), and biochemical oxygen demand (ρ = −0.65). Principal component analysis of the physicochemical panel returned a first component accounting for 52.7% of the variance and loading positively on biochemical oxygen demand, chemical oxygen demand, alkalinity, hardness, salinity, temperature, and calcium, representing an axis of combined ionic and organic load that peaks in the growing season. This component correlated negatively with cellular response (ρ = −0.63). Because most variables departed from normality, Spearman coefficients are reported throughout; Pearson coefficients, computed as a sensitivity analysis, returned the same significance decisions for all twenty-one variables, with a mean absolute difference of 0.073 between the two measures (Supplementary Table S1).
The consistency of direction is the substantive observation: every variable reaching significance did so negatively, indicating that the cellular response was highest when ionic content, organic load, and temperature were lowest. Which of these covarying descriptors drives the relationship cannot be determined from a design in which they rise and fall together across the year, and no such attribution is made.
Cell density measured from the hematoxylin–eosin preparations provides a separate check, because all four pools were exposed in a single experiment and stained in one session against one shared set of three control wells; the four quarters are therefore directly comparable with one another. Density showed no significant difference between quarters (repeated-measures analysis with station as the subject, F(3, 6) = 1.20, p = 0.39), with means of 80.6% of control in the January–March pool, 79.5% in April–June, 74.5% in July–September, and 70.4% in October–December. The reduction in cell number was thus present throughout the year, whereas the metabolic response measured by tetrazolium reduction varied with the quarter in which the sample was taken.
3.4.3. Regulatory Classification and Biological Response
Applying the SWQR rule that a water body takes the class of its poorest-performing parameter, the reservoir was assigned Class I for nine months, Class II for one month, and Class III for two months. The single Class II month, June, was driven solely by nitrite-N, with every other parameter remaining within Class I limits. The two Class III months, September and October, were driven solely by pH, which exceeded the 8.5 threshold at one station in September and at all three in October, reaching a maximum of 8.59. Classification, therefore, moved within a narrow band, sitting at Class I for three-quarters of the year and reaching Class III in two months.
The cellular response was not correspondingly narrow, and the months carrying the poorest classification were not those producing the most extreme responses. September and October, the two months assigned to Class III, returned 87.8% and 91.5%, values that fall within the 80.5% to 147.2% range recorded across the nine Class I months. June, the only Class II month, returned 95.5%. Across the year, the biological response varied by 67 percentage points while the classification moved between only three adjacent categories, and the ordering of the two measures did not correspond.
This dissociation is the central observation of the present study. What the monthly series shows is that the class assigned to a month, which is set by its single worst parameter, does not track the cellular response; the individual chemical descriptors, by contrast, are strongly associated with it (Section 3.4.2). Classification and biological response are therefore non-redundant descriptors of the same water, and the former does not substitute for the latter. With nine Class I months, one Class II and two Class III, the class–response relationship could not be tested statistically and is described rather than modeled. Establishing which constituents drive the biological variation will require a design in which the descriptors that covary through the year can be separated.
4. Discussion
4.1. The Reservoir Is Horizontally Uniform and Oxygen-Supersaturated at the Sampled Depth
The five parameters measured in situ describe a water body that is hydrologically simple and biologically active. Between-station differences were negligible for every parameter, under 0.02 mg/L for dissolved oxygen, 0.04 pH units, 0.23 °C, and 3.4 µS/cm, despite the stations spanning the inflow, the deepest point and the dam wall, a transect of about 2.5 km. Along that transect, and at the depth sampled, the reservoir therefore behaves as a single hydrochemical unit, and all variation in consequence is temporal rather than spatial. This is an important precondition for the present study: it means that a monthly sample from any station characterizes the water to which the cultures were exposed, and that the seasonal signal is not confounded by within-reservoir heterogeneity.
Dissolved oxygen was not merely adequate but persistently in excess of atmospheric equilibrium. The reservoir lies at an elevation band of approximately 750–810 m above sea level, and saturation, calculated from measured temperatures using the Benson–Krause solubility relationship [30], with the barometric correction applied at 780 m, ranged from 107% in January and February to 141% in June. Every month of the year exceeded equilibrium, and the annual mean was 124%; the result is insensitive to the exact elevation, varying by about one percentage point across the 750–810 m range. Supersaturation was lowest in midwinter, at 107–117% from December to February, and rose to 119–141% from April to October. Sustained supersaturation of this magnitude, and its concentration in the growing season, is unlikely to arise from physical reaeration alone and is consistent with substantial photosynthetic oxygen production.
The pH record corroborates this: values rose steadily through the growing season from 8.08 in January to a maximum of 8.59 in October, then fell sharply through November as production declined. Progressive drawdown of dissolved carbon dioxide by primary producers is a plausible explanation for a rise in this shape, and the only departures from Class I status recorded in the in situ dataset, pH above 8.5 at one station in September and at all three in October, are consistent with biological activity within the reservoir, though we did not measure the primary production that would demonstrate it, and an external contribution cannot be excluded.
Electrical conductivity and salinity trace the hydrological year described for this catchment. Winter precipitation in the Western Black Sea uplands accumulates as snow rather than entering the reservoir directly; melting in early spring delivers a large volume of dilute water, and conductivity accordingly falls to its annual minimum of 194 µS/cm in March. Through the summer, inflow declines while evaporation and irrigation abstraction continue, and dissolved ions concentrate, carrying conductivity to 348 µS/cm by October. The return of autumn rainfall reverses the trend within a single month, with conductivity falling to 283 µS/cm in November. Salinity follows a similar trajectory, peaking earlier, from 0.20‰ in January to 0.60‰ in August. Water temperature remained below 20 °C at every station in every month, within the tolerance range of the rainbow trout farmed on the reservoir and comfortably within Class I.
4.2. Two Nutrient Pulses, a June Convergence, and the Fingerprint of Catchment Management
The laboratory parameters confirm that the reservoir carries little organic pollution. Chemical oxygen demand peaked at 5.7 mg/L against a Class I ceiling of 25 mg/L, biochemical oxygen demand at 1.6 mg/L against a ceiling of 4 mg/L, and total suspended solids never exceeded 2.5 mg/L. These values indicate little organic input despite the agricultural land in the catchment. The dataset does contain a clear, twice-repeated nutrient signal.
Nitrogen and phosphorus followed different and non-overlapping trajectories. Nitrate-N rose from 1.56 mg/L in April through 2.49 mg/L in May to an annual maximum of 3.96 mg/L in June, then fell to 1.78 mg/L in July and remained between 0.16 and 1.18 mg/L for the remainder of the year, staying within Class I throughout. Orthophosphate, by contrast, was negligible through the winter (0.000–0.003 mg/L from January to March), rose through the summer, and reached 0.172 mg/L in November. Two annual applications of fertilizer of differing composition are made on the cultivated land of the upstream catchment, the first in early summer and the second between September and November, and the sequence of the two nutrient maxima is consistent with them.
Monthly precipitation measured at the Taşköprü meteorological station during the sampling year (April 2021 to March 2022) ranged from 19.8 mm in November to 95.7 mm in August. Nutrient concentrations were not associated with rainfall in that record. Nitrate showed no relationship with precipitation in the month of sampling (ρ = +0.12, p = 0.71) or in the preceding month (ρ = +0.23, p = 0.47), and across the four nutrient variables and both precipitation windows, no rank correlation reached significance (smallest p = 0.059; minimum Benjamini–Hochberg q = 0.44). Nitrate and orthophosphate nevertheless reached their maxima at different times of year, nitrate in June and orthophosphate in November.
A second and equally informative feature is the convergence of nine of the sixteen laboratory parameters, chemical and biochemical oxygen demand, nitrate, nitrite, ammonium, sulfate, sodium, potassium, and calcium, on their annual maxima in the same month. Independent fluctuation in nine variables is unlikely to produce such a coincidence; a single seasonal driver could. June combines the nitrogen maximum with the onset of irrigation abstraction and the concentration of dissolved ions in a declining water volume, with both mechanisms acting in the same direction. Calcium is the clearest illustration: it rose from 11.9 mg/L in January to 31.0 mg/L in June, a 2.6-fold range, while remaining far below the 75 mg/L level recommended as an upper bound for surface waters. Magnesium behaved similarly over a 2.2-fold range, and total hardness averaged 115 mg/L CaCO3 across the year, placing the reservoir firmly among moderately hard waters.
Despite two commercial cage trout operations and demonstrable annual nutrient inputs, the measured nutrient concentrations did not accumulate across the study year. Oxygen supersaturation is consistent with photosynthetic production, organic load remained low, ammonium was negligible throughout, and orthophosphate returned to undetectable levels each winter. Trophic status, residence time and flushing rate were not determined, so the pattern is reported as being consistent with nutrient pulses being flushed or assimilated rather than accumulating.
4.3. Radiological Screening
The relevant comparator for radon in water intended for human consumption is the parametric value of 100 Bq/L established by Council Directive 2013/51/Euratom; the measured values correspond to 4–7% of that value, approximately twenty-fold below it. The catchment is underlain by green schists, radiolarite-bearing schists, and weakly metamorphosed spilites rather than by uranium-enriched lithologies, and the observed values are consistent with that geology and of the same order as the activities reported for bottled natural mineral and spring waters sold in Türkiye [23,31]. Radon was determined on a single occasion, without seasonal replication and without calculation of annual effective dose, and is therefore presented as a screening determination. Within that scope, the radon data give no indication that the water is radiologically enriched, so natural radioactivity is not a plausible contributor to its biological activity—an observation that chemical monitoring alone could not have supplied.
4.4. Choice of the Biological Model and of the Control Design
The interpretation of any effect-based measurement depends on what the biological model is taken to represent, and the model used here was selected based on the exposure route rather than convenience [32,33,34]. As set out in the Introduction, the bone marrow stroma is the first tissue reached by whatever survives first-pass metabolism that is neither a barrier nor a biotransformation compartment; it is highly perfused, non-detoxifying and continuously proliferative, and it constitutes the regenerative reserve of the organism. Primary mesenchymal stem cells retain a stable lineage-specific expression profile, with intact DNA-repair and cell-cycle gene expression, through early passages, the range used here, whereas the susceptibility of immortalized lines to toxicants can drift with passage, which matters directly for a bioassay whose purpose is to register an effect. Bone marrow-derived mesenchymal stem cells are, on this reasoning, the physiologically appropriate target, and they are additionally non-transformed, retain intact genomic stress-response pathways, and have been validated as a basal cytotoxicity platform meeting ICCVAM performance criteria [14,15,16].
The control design follows from the same reasoning. A reference cytotoxic agent, the positive control in pharmacological screening, establishes where a test compound ranks on a potency scale relative to a substance with a known effect. That comparison presupposes a question that this study was not asking. No therapeutic agent was under evaluation, no potency ranking was sought, and there is no meaningful reference substance against which the biological activity of natural reservoir water could be scaled. The question posed was different and prior: whether environmental water, at dilutions at which it would ordinarily be assumed inert, elicits any measurable cellular response at all.
No claim about assay sensitivity is made on the basis of the environmental samples themselves, since an unknown sample cannot establish the performance of the assay that measures it. Nor was the direction of the response presupposed. The same approach applied to a different catchment produced a proliferative rather than a cytotoxic response [34], so the issue is whether water behaves as a reactive medium and in which direction, not how strongly it kills; an assay used in this way is not calibrated against a toxicant, because the expected answer is not a degree of toxicity. The absence of a reference cytotoxicant bears most directly on the propidium iodide readout, which returned a null result: no independent demonstration is available that it would have registered membrane damage had membrane damage been present, and the absence of membrane-compromised cells should be read with that in mind. The untreated cultures maintained in α-MEM without additions served as the reference against which all MTT values were expressed and were assayed in the same block as the samples they normalized.
Using a non-transformed progenitor population raises the question of proliferative stimulation and, by extension, of tumor promotion, since sustained mitogenic signaling in a stem cell compartment is the defining mechanism of non-genotoxic carcinogenesis [18,19,20]. The present data do not support such an interpretation. Quantification of cell density in the hematoxylin–eosin series showed that exposure reduced rather than increased the cell number in those cultures. Cell number was not measured in the tetrazolium cultures themselves, so whether the elevated signal reflects greater activity per cell is examined below as only an exploratory estimate.
4.5. A Time-Dependent, Low-Dose Cellular Response to Water at Extreme Dilution
The cellular data describe a response that is neither absent nor conventionally cytotoxic. After 24 h of exposure, no dose raised the tetrazolium signal above control, and a non-significant reduction of 4–7% was evident at the five doses from 0.5 to 5 µL/mL (Table 5); dose was not a significant source of variation at this time point (F(6, 210) = 1.49, p = 0.18; Greenhouse–Geisser corrected p = 0.22). After 72 h, the pattern had reversed. Dose became a highly significant factor (F(6, 210) = 11.63, p = 3.1 × 10⁻¹¹; Greenhouse–Geisser ε = 0.667, corrected p = 3.5 × 10⁻⁸), driven by an elevation confined to the lowest exposure: the MTT signal reached 119.1 ± 4.6% of control at 0.1 µL/mL (q = 1.5 × 10⁻³); a similar elevation at 0.2 µL/mL (107.6 ± 4.4%) did not reach significance (q = 0.25). The same conclusion follows when the month is used as the experimental unit. Of the twenty-one pairwise comparisons across the dose range, ten were significant after false discovery rate correction, and six of these involved the 0.1 µL/mL dose, which differed from every other dose tested (q ≤ 2.6 × 10⁻³). The elevation is therefore confined to one end of the range tested and requires time to develop.
Two features indicate that this is a property of the water rather than of the experiment. The low-dose elevation at 72 h was in the same direction at all three stations (113.8%, 121.7%, and 121.9%, at Stations 1–3 respectively), reaching significance at two of the three (p = 0.021 and p = 0.027) and showing the same trend without reaching significance at the third (p = 0.109), so it does not depend on any single location within the reservoir. It also cannot be attributed to nutrient supplementation by the added water. At the highest dose applied, 0.5% v/v, the orthophosphate delivered to the culture amounts to 0.00088 mg/L (calculated at the annual maximum of 0.175 mg/L), compared with approximately 96 mg/L already present in α-MEM, roughly one thousandth of one percent of the medium’s own content. More decisively, a nutritional mechanism predicts a response that increases with the dose, and the observed response is largest for the smallest addition.
The observed profile is described here rather than classified. A response at the lowest tested concentration does not establish a threshold, because lower concentrations were not examined, and no formal dose–response model was fitted [28,35]. What can be said is descriptive: the elevation is statistically robust, is confined to the lowest exposure tested, and is not detected at higher exposures. It is essential, however, to be precise about what is being stimulated. The tetrazolium assay reports mitochondrial dehydrogenase activity summed across the well, and an increase in that signal is equally compatible with more cells, with more active cells, or with a mitochondrial stress response. The assay cannot distinguish between them.
Quantification of cell density in the hematoxylin–eosin preparations bears on this question: in those cultures, the cell number fell rather than rose. Across 84 exposed panels, density averaged 76% of the untreated control when each panel was referenced to the control well of its own station, with every one of the seven doses significantly below control (q ≤ 0.036) and 77 of the 84 panels falling below the control mean. Because the four quarterly pools were exposed in a single experiment and stained in a single session against one shared set of three control wells, the four quarters are directly comparable here, and no significant difference between them was detected (F(3, 6) = 1.20, p = 0.39). The pools had been held at +4 °C for different lengths of time, the April–June pool longest, and no difference that was attributable to holding time was detected either. The quarterly ordering of density, January–March 80.6%, April–June 79.5%, July–September 74.5%, and October–December 70.4%, runs inversely to the quarterly mean orthophosphate, but four quarters are too few to test that correspondence.
Placing the two measurements side by side is informative, but the comparison has to be made with care. At 72 h, the hematoxylin–eosin cultures contained roughly three-quarters as many cells as their controls, while the tetrazolium signal in the monthly cultures did not fall significantly below control. Had the two observations come from the same wells, they would imply cells that are individually more active; because they were measured in different cultures, monthly for tetrazolium and quarterly for density, their ratio is an exploratory estimate rather than a measurement of activity in the same cells. Computed per quarter and reported with the uncertainty of both terms and of the shared control propagated, that estimate exceeds unity in all four quarters, and its confidence interval excludes unity in two of them (Table 7). The ratio is therefore an estimate rather than a demonstration that individual cells became more active, and it cannot settle whether the cell number changed in the monthly tetrazolium cultures, in which density was never measured.
The direction of the cell density result raises an obvious question about the mechanism, and the membrane integrity data answer part of it. A population reduced to three-quarters of its control could, in principle, reflect cell death, and the tetrazolium assay alone cannot exclude that possibility, since a smaller number of surviving cells with elevated activity and a larger number of cells with normal activity are not distinguishable by a bulk metabolic readout. Propidium iodide exclusion addresses this directly because loss of plasma membrane integrity is the defining feature of necrosis and the terminal stage of apoptosis, and it is detected regardless of the cell’s metabolic state.
Across 87 fields spanning four seasons, three stations, the complete seven-point dose series, and the untreated controls, propidium iodide-positive nuclei accounted for a median of 0.18% of the nuclei present in exposed fields and 0.33% in control fields, a difference that was not significant, and only two of the 83 exposed fields exceeded 1%. Cultures exposed across the full concentration range, the highest dose included, did not differ detectably from their untreated controls in this respect, and the percentage of positive nuclei did not rise with the dose. No population of membrane-compromised cells was detectable at 72 h, which makes widespread lysis at that time point an unlikely explanation for the reduction in the cell number, though it does not exclude death earlier in the exposure or cells lost to the medium, which the protocol removes before staining. The morphological evidence points in the same direction: the nuclei that remained attached retained the compact, regularly spaced appearance of an intact monolayer, without the condensation and fragmentation that accompany advanced apoptosis.
Three observations, therefore, have to be reconciled: fewer cells in the hematoxylin–eosin series, a tetrazolium signal that did not fall with them, and no evidence of membrane failure. Cytotoxicity in the conventional sense does not account well for this combination. Suppression of proliferation would, as would arrest of the cell cycle: in either case, the culture accumulates fewer cells over the 72 h exposure without any cells being killed, and the cells that are present may upregulate oxidative metabolism as part of an adaptive or stress-associated response. The time course is consistent with such an interpretation, since no effect was detectable at 24 h and the divergence appeared only by 72 h, which is the interval over which a difference in division rate would become visible as a difference in cell number. Early apoptosis cannot be excluded on the present evidence, because a cell in the early phase retains membrane integrity and would not be labeled by propidium iodide; distinguishing these possibilities requires molecular endpoints such as caspase activation, annexin V binding, or cell cycle analysis, which were not included in this study.
Two limitations bound this conclusion. One field was imaged per condition, so the counts support the comparison between exposed and control fields as groups and the test for a dose trend, but not comparisons between individual stations or individual months; the finding is the consistent absence of a membrane-compromised population rather than any difference between particular conditions. Live/Dead staining was performed on one month per season rather than on all twelve, so the series resolves season and dose but not month-to-month variation. Within those bounds, no loss of membrane integrity was detected at any concentration tested, in any season or at any station. Early apoptosis and senescence remain compatible with these data, since neither necessarily involves loss of membrane integrity within the exposure window, and neither was measured directly.
A final feature of the response deserves emphasis because of its practical implications. The reduction in cell density did not deepen with concentration: across the seven dose means, the rank correlation between dose and density was weak and not significant (ρ = −0.25, p = 0.59), and the lowest dose examined, 0.1 µL/mL, or 0.01% v/v reservoir water, had already produced a significant reduction, and a fifty-fold increase in concentration did not deepen it. A response of this shape is not captured by the logic of concentration limits, which presumes that the effect scales with exposure.
4.6. Chemical Classification and Biological Response Are Non-Redundant Descriptors
Set against the physicochemical record, the cellular data describe a dissociation. On the regulatory criterion, the reservoir was a stable, good-quality water body: Class I in nine of the twelve months, Class II in one and Class III in two, with every departure driven by a single parameter: nitrite-N in June, and pH in September and October, the latter exceeding 8.5 by a maximum of 0.09 units. A monitoring program reporting these results would describe a year of consistently good water quality.
The biological response over the same period was not constant. Monthly means at 72 h ranged from 80.5% to 147.2% of control, and the months carrying the poorest classification were not those producing the largest responses: September and October, the two Class III months, returned 87.8% and 91.5%, and June, the only Class II month, returned 95.5%, all lying within the range recorded across the nine Class I months. December to March, four consecutive months in which no parameter departed from Class I, spanned 98.1% to 147.2%. Regulatory classification, which is determined by the single worst-performing parameter in a given month, was therefore essentially constant, whereas the biological response was not.
Of the parameters for which the regulation sets a limit, all met Class I in every month except nitrite-N, in June, and pH, in September and October; salinity and the other descriptors that the regulation does not classify are necessarily excluded from that count. Chemical classification and biological response are non-redundant descriptors of the same water. The first assesses whether measured constituents fall within agreed-upon thresholds; the second assesses whether the water, as a whole and unmodified, alters the behavior of mammalian cells. A water body can satisfy the first while producing a measurable and reproducible effect under the second, and in the nine Class I months of the present dataset, the cellular response ranged from 80.5% to 147.2% of control.
This is the argument that has driven the development of effect-based methods within the Water Framework Directive [4,5], and the present study extends it in two respects. First, the response was elicited by sterile-filtered, non-enriched water rather than by solid-phase extracts, so it reflects the matrix as encountered rather than a concentrated and chemically selected fraction of it. Second, the effect appeared at 0.01% v/v, a dilution at which surface water would ordinarily be treated as inert, and did not intensify over a fifty-fold concentration range. Neither observation would have been available from a chemical panel, however comprehensive.
4.7. Suitability for Trout and Mammals
The reservoir supports two commercial cage rainbow trout operations, and the physicochemical record explains why. The water temperature never exceeded 20 °C; dissolved oxygen remained above 11 mg/L and above atmospheric equilibrium in every month; ammonium was negligible throughout; and pH stayed within the range tolerated by salmonids. By the criteria that matter to a cold-water fish, this is good water, and the aquaculture operating on it is direct empirical confirmation.
That conclusion, however, answers a narrower question than the one that the reservoir’s use actually poses. The scheme delivers irrigation water to approximately 6449 ha of agricultural land serving some twenty villages; livestock are watered from it; and in rural catchments of this kind, informal domestic abstraction is common. The endpoints from which surface water quality classes are derived are, in large part, those of aquatic ecosystem protection, fish, invertebrates, and algae, supplemented, for individual substances, by human toxicological reference values applied one compound at a time. Neither strand tests the water as a whole against mammalian tissue. A Class I assignment, therefore, certifies that measured constituents fall within thresholds established for those purposes; it does not, and does not claim to, establish that the water is biologically inert to a mammal.
This gap is the second reason for choosing the biological model. A fish cell line would have addressed a question already answered, and answered favorably, by the trout farms themselves. What was not available from any existing line of evidence was a mammalian readout: whether water that is demonstrably suitable for salmonid culture produces a measurable response in the cells of a warm-blooded animal that drinks it. Primary bone marrow-derived mesenchymal stem cells provide that readout in a compartment that is non-transformed, non-detoxifying, and continuously renewing, and that a mammal cannot replace if the compartment is impaired.
The data show that the two questions have different answers. The same water that sustains commercial trout production reduced the mesenchymal stem cell density to approximately three-quarters of the control, at a dilution of 0.01% v/v and without a detectable dependence on concentration across a fifty-fold range, while the tetrazolium signal did not fall significantly below control. An exploratory estimate of activity per cell, derived from two endpoints measured in different cultures, exceeds unity in all four quarters. The present data are not a demonstration that the water is unsafe for people or livestock. Cell culture omits the dilution that occurs during ingestion, the gut’s absorption barriers, hepatic first-pass metabolism, and the homeostatic buffering of an intact organism, and no inference about drinking water safety can be drawn from an in vitro observation alone. What the data do establish is narrower and still consequential: this water is not biologically inert with respect to mammalian cells, the effect is reproducible across a full annual cycle and across three spatially separated stations, and none of it is visible in the overall class verdict, which moved only between three adjacent classes across the year.
For a reservoir whose water reaches human populations through irrigation, livestock, and, in places, direct use, that asymmetry seems worth recording. It argues not for reclassifying the reservoir, which the chemical evidence does not support, but for treating suitability for aquaculture and suitability for mammalian consumption as separate determinations, each resting on distinct evidence.
4.8. Limitations
Several constraints bear on the interpretation of these results and are set out in full here.
The first concerns the monthly cellular series. The MTT signal was expressed relative to the untreated control assayed in the same block, which is the appropriate normalization and removes plate-level differences in absolute signal, but the twelve monthly sampling events were not all processed on a single occasion. Between-month differences are therefore reported descriptively in this study rather than as tested contrasts, and no constituent of the water is identified as the driver of the temporal variation. The correlations reported in Section 3.4 are consistent in direction, with every significant coefficient being negative, and are offered on the same descriptive basis. Studies seeking to establish the chemistry-to-response link should assay all samples together, or include a common reference sample throughout, so that monthly comparisons carry the same weight as the dose and density contrasts reported here.
The second concerns the replication of the untreated controls. The hematoxylin–eosin endpoint rests on three control wells, one per station, shared across the four quarterly pools, and the Live/Dead endpoint rests on one control field per examined month. This bounds both endpoints in the same way: the direction of the effect is well supported, by every dose and every quarter for density and by every field for membrane integrity, but the absolute magnitude of the density reduction is loosely constrained, and the Live/Dead comparison can establish only that no difference was detected, not that none exists. No reference cytotoxicant was included; as set out in Section 4.4, this leaves the null propidium iodide result without an independent demonstration that the readout would have registered membrane damage. The third concerns the relationship between the two image-based endpoints. The Hoechst nuclear counts in the Live/Dead fields do not reproduce the density reduction measured in the hematoxylin–eosin series. The two are not measurements of the same quantity, for the reasons set out in Section 3.3.3, and are not treated as mutually confirmatory; the density result rests on the hematoxylin–eosin series alone. Four further constraints should be noted. Measurement uncertainty for the individual physicochemical values was not reported by the service laboratory. The study examined a single reservoir over a single hydrological year. What this bounds is not the measurements themselves but the reference frame available for reading them: no body of comparable datasets is yet available from which a typical range of cellular response for impoundments of this kind could be derived, and establishing such a range will require the same measurements across more water bodies and more years. That accumulation has begun in our own laboratory: the same approach applied to a lotic system in a different catchment produced a proliferative rather than a suppressive response [34], which indicates both that the measurement transfers between water bodies and that the direction of the response is a property of the water rather than of the assay. Further impoundments and streams in the same region are being sampled under the same protocol as continuing work in our laboratory. The correlations between water chemistry and cellular response are exploratory: most physicochemical variables covary with season and with each other, so an association cannot be attributed to any individual constituent. Finally, a single cell type from a single species was used; extending the battery to a human primary or induced-pluripotent-derived mesenchymal population would strengthen extrapolation, and molecular endpoints would be required to determine whether the reduction in cell number reflects suppressed proliferation or cell-cycle arrest.
5. Conclusions
A twelve-month study of the Karadere Irrigation Reservoir combined conventional physicochemical monitoring, a primary mammalian stem cell bioassay applied to sterile-filtered reservoir water, and radiological screening. The components were drawn from the same water but not at a common temporal resolution: the physicochemical panel and the tetrazolium assay were monthly, the hematoxylin–eosin density series used quarterly pools, Live/Dead staining was performed in one month per season, and radon was determined on a single occasion. The three hypotheses set out in the Introduction are answered as follows. The first was supported only in part: at 72 h, the tetrazolium signal increased at the lowest exposure tested and did not increase further at higher exposures, and within the range tested, up to 0.5% v/v, it did not fall significantly below control. Because concentrations below the lowest dose were not examined, this pattern is described rather than assigned a formal dose–response classification. The cell number fell while the tetrazolium signal did not, so the two had to be measured separately, and the class assigned to a month did not track the biological responses. Four conclusions follow.
First, by conventional criteria, the reservoir is a good-quality water body. Among the parameters for which the regulation sets a class limit, all but nitrite-N and pH met Class I in every month, and the overall classification was Class I in nine months, Class II in one, and Class III in two. The Class II assignment in June was driven by nitrite alone, and the Class III assignments in September and October by pH, which exceeded 8.5 by at most 0.09 units. Organic load remained low throughout; the three sampling stations were uniform at the sampled depth; and dissolved radon averaged 5.4 Bq/L, approximately twenty-fold below the drinking-water parametric value of 100 Bq/L. Nitrate and orthophosphate reached their maxima at different times of year, in June and November, respectively. Two fertilizer applications are made annually on the cultivated land of the upstream catchment, and this timing is consistent with that practice, but the present measurements do not establish the link.
Second, the same water is not biologically inert. Primary bone marrow-derived mesenchymal stem cells exposed to it developed, over 72 h but not 24 h, a reproducible reduction in cell density to about 76% of control, measured in the hematoxylin–eosin series, while the tetrazolium signal did not fall significantly below control. An exploratory estimate of metabolic activity per cell, derived from two endpoints measured in different cultures and reported with the uncertainty of both terms and of the shared control propagated, exceeded unity in point estimate in all four quarters, with its confidence interval excluding unity in two of them. Propidium iodide staining of 83 exposed and 4 untreated fields showed membrane-compromised cells at below 1.4% of nuclei in every condition, with no difference detected from the untreated controls, so no population of membrane-compromised cells was detectable at the end of the exposure; because the staining protocol removes the medium beforehand, this applies to the adherent population and does not exclude cells lost earlier. The mechanism underlying the lower cell density was not determined: suppressed proliferation, cell-cycle arrest, senescence and early apoptosis all remain possible and none were measured directly. The reduction was already present at 0.01% v/v and did not deepen across a fifty-fold increase in concentration, a shape that concentration-based limit values are not designed to detect.
Third, the two descriptions did not track one another. Within a set of four consecutive months assigned Class I on every parameter, the cellular response varied by 49 percentage points, while the months carrying the only Class III assignments produced responses within the range of Class I months. Chemical classification and biological response are non-redundant descriptors of the same water: the first establishes whether measured constituents fall within the agreed thresholds, and the second whether the water as a whole alters mammalian cell behavior. Neither substitutes for the other.
Fourth, the practical implication is specific rather than alarming. The in vitro observations do not by themselves bear on the safety of the reservoir (Section 4.7). What the data support is that suitability for aquaculture, amply demonstrated here by both the physicochemical record and two operating trout farms, and suitability for mammalian consumption are separate determinations resting on separate evidence, and that a reservoir supplying irrigation water to 6449 ha, watering livestock, and subject to informal domestic use warrants the second as well as the first. For routine application, the design used here can be lightened. Because the cellular response was already present at the lowest exposure tested and did not deepen across a fifty-fold increase in concentration, a single dose carries most of the information that the dose series carried in this reservoir; and a monthly baseline year of the kind reported here, once established, could reasonably be followed by seasonal sampling restricted to the parameters that showed the strongest associations with the cellular response, together with a single-dose tetrazolium test. The dose for such a test would be identified for each water body from an initial dose series, since the direction of the response has differed between water bodies in our earlier work. This reduced design remains to be validated.
Resolving the mechanism underlying the reduced cell density is the natural next step and is tractable using established endpoints: caspase-3/7 activity or annexin V labeling for apoptosis, senescence-associated β-galactosidase for senescence, and Ki-67 or EdU incorporation for proliferation. Effect-based work on non-enriched surface water with primary mammalian cells is at an early stage; the present study extends an initial single-endpoint tetrazolium screen [34] to a multi-endpoint battery applied across a full annual cycle, and mechanistic endpoints are the next step.
Supplementary Materials
The following supporting information can be downloaded at https://www.mdpi.com/article/10.3390/toxics14110957/s1: Table S1: Association between physicochemical variables and cellular response; Table S2: Monthly physicochemical measurements, and dissolved radon at the five stations; Figure S1a–d: Complete set of hematoxylin–eosin preparations for the four quarterly pools; Figure S2: Segmentation workflow applied to the hematoxylin–eosin preparations; Figure S3: Complete Live/Dead dataset and the segmentation used to quantify it; Table S3: Complete Live/Dead dataset; Table S4: Nuclear morphometry of the Live/Dead fields; Figure S4: Monthly MTT reduction at 72 h across the sampling year; Data S1: Analysis scripts and tabulated outputs.
Author Contributions
Conceptualization, N.E., E.M. and A.E.G.; methodology, N.E., A.E.G. and E.M.; formal analysis, A.E.G., E.M. and N.E.; investigation, A.E.G.; resources, N.E. and E.M.; data curation, A.E.G.; writing—original draft preparation, N.E.; writing—review and editing, N.E., A.E.G. and E.M.; visualization, A.E.G.; supervision, N.E.; project administration, N.E. All authors have read and agreed to the published version of the manuscript.
Funding
This research received no external funding.
Institutional Review Board Statement
No new animal experiment was conducted in this study. The bone marrow-derived mesenchymal stem cells used were surplus cryopreserved material from a previous project approved by the Local Ethics Committee for Animal Experiments of Kastamonu University (KÜ-HADYEK, protocol 2018/12, 19 February 2018). KÜ-HADYEK reviewed their reuse and determined that it was not subject to ethics committee approval under Articles 4(u) and 8(k) of the Regulation on the Working Procedures and Principles of Animal Experiments Ethics Committees (Decision 2023/2-6, 2 March 2023).
Informed Consent Statement
Not applicable.
Data Availability Statement
The original contributions presented in this study are included in the article and the Supplementary Materials. The well-level absorbance data, the aggregated exposure design, the hematoxylin–eosin and Live/Dead counts, the nuclear morphometry, the physicochemical series, the radon determinations and the meteorological series are provided as Data S1, together with the scripts that generate every statistic reported here. The raw micrographs are available from the corresponding author upon request.
Acknowledgments
The authors thank the Central Research Laboratory (MERLAB) of Kastamonu University for analytical support, and Aslı Kurnaz for her help with the radon determinations at the Nuclear Physics Laboratory of the Faculty of Science. During the preparation of this manuscript, the authors used Claude (Anthropic; Opus 5.5) to assist with editing the text, writing the Python scripts for the statistical and image analyses (provided as Data S1), and preparing the figures and the graphical abstract from the authors’ own experimental measurements and micrographs. The study design, all experimental work and measurements, and the interpretation of the results are the authors’ own; the analyses were checked by the authors. The authors reviewed and verified all outputs, edited the text as necessary, and take full responsibility for the accuracy, integrity, and content of this publication.
Conflicts of Interest
The authors declare no conflicts of interest.
Abbreviations
The following abbreviations are used in this manuscript:
| bmMSCs | Bone marrow mesenchymal stem cells |
| HE | Hematoxylin–Eosin |
| SWQR | Surface Water Quality Regulation |
| EQS | Environmental Quality Standards |
| EBM | Effect-based methods |
| WFD | EU Water Framework Directive |
| COD | Chemical oxygen demand |
| TSS | Total suspended solids |
| BOD | Biochemical oxygen demand |
| SD | Standard deviation |
| SEM | Standard error of the mean |
| DO | Dissolved oxygen |
| ICCVAM | Interagency Coordinating Committee on the Validation of Alternative Methods |
References
- Mutlu, E.; Demir, T.; Kutlu, B.; Yanık, T. Determination of Water Quality Parameters in Sivas-Kurugöl Lake. Turk. J. Agric.-Food Sci. Technol. 2013, 1, 37–43. [Google Scholar] [CrossRef] [Scilit]
- Brack, W.; Dulio, V.; Ågerstrand, M.; Allan, I.; Altenburger, R.; Brinkmann, M.; Bunke, D.; Burgess, R.M.; Cousins, I.; Escher, B.I.; et al. Towards the Review of the European Union Water Framework Directive: Recommendations for More Efficient Assessment and Management of Chemical Contamination in European Surface Water Resources. Sci. Total Environ. 2017, 576, 720–737. [Google Scholar] [CrossRef] [Scilit] [PubMed]
- Escher, B.I.; Aït-Aïssa, S.; Behnisch, P.A.; Brack, W.; Brion, F.; Brouwer, A.; Buchinger, S.; Crawford, S.E.; Du Pasquier, D.; Hamers, T.; et al. Effect-Based Trigger Values for in Vitro and in Vivo Bioassays Performed on Surface Water Extracts Supporting the Environmental Quality Standards (EQS) of the European Water Framework Directive. Sci. Total Environ. 2018, 628–629, 748–765. [Google Scholar] [CrossRef] [Scilit] [PubMed]
- Wernersson, A.S.; Carere, M.; Maggi, C.; Tusil, P.; Soldan, P.; James, A.; Sanchez, W.; Dulio, V.; Broeg, K.; Reifferscheid, G.; et al. The European Technical Report on Aquatic Effect-Based Monitoring Tools under the Water Framework Directive. Environ. Sci. Eur. 2015, 27, 7. [Google Scholar] [CrossRef] [Scilit]
- Brack, W.; Aissa, S.A.; Backhaus, T.; Dulio, V.; Escher, B.I.; Faust, M.; Hilscherova, K.; Hollender, J.; Hollert, H.; Müller, C.; et al. Effect-Based Methods Are Key. The European Collaborative Project SOLUTIONS Recommends Integrating Effect-Based Methods for Diagnosis and Monitoring of Water Quality. Environ. Sci. Eur. 2019, 31, 10. [Google Scholar] [CrossRef] [Scilit]
- Escher, B.I.; Neale, P.A. Effect-Based Trigger Values for Mixtures of Chemicals in Surface Water Detected with In Vitro Bioassays. Environ. Toxicol. Chem. 2021, 40, 487–499. [Google Scholar] [CrossRef] [Scilit] [PubMed]
- Neale, P.A.; Escher, B.I.; de Baat, M.L.; Enault, J.; Leusch, F.D.L. Effect-Based Trigger Values Are Essential for the Uptake of Effect-Based Methods in Water Safety Planning. Environ. Toxicol. Chem. 2023, 42, 714–726. [Google Scholar] [CrossRef] [Scilit] [PubMed]
- Neale, P.A.; Brack, W.; Aït-Aïssa, S.; Busch, W.; Hollender, J.; Krauss, M.; Maillot-Maréchal, E.; Munz, N.A.; Schlichting, R.; Schulze, T.; et al. Solid-Phase Extraction as Sample Preparation of Water Samples for Cell-Based and Other in Vitro Bioassays. Environ. Sci. Process. Impacts 2018, 20, 493–504. [Google Scholar] [CrossRef] [Scilit] [PubMed]
- Connon, R.E.; Geist, J.; Werner, I. Effect-Based Tools for Monitoring and Predicting the Ecotoxicological Effects of Chemicals in the Aquatic Environment. Sensors 2012, 12, 12741–12771. [Google Scholar] [CrossRef] [Scilit] [PubMed]
- Perra, N.; Giusto, D.; Anedda, M. A Survey of Modern Data Acquisition and Analysis Systems for Environmental Risk Monitoring in Aquatic Ecosystems. Sensors 2026, 26, 1566. [Google Scholar] [CrossRef] [Scilit] [PubMed]
- Suali, L.; Chia, Y.; Rustin, C.; Lem, F.F.; Ching, X.J.; Mansur, M.A.B.; Henry, Z.A.; Chan, M.K.S.; Wong, M.B.F.; Pan, S.Y. Primary Cell Cultures versus Immortalized Cell Lines: Critical Comparative Insights into Biological Fidelity and Translational Applications. Biotech. Histochem. 2026, 101, 429–455. [Google Scholar] [CrossRef] [Scilit] [PubMed]
- Czekanska, E.M.; Stoddart, M.J.; Ralphs, J.R.; Richards, R.G.; Hayes, J.S. A Phenotypic Comparison of Osteoblast Cell Lines versus Human Primary Osteoblasts for Biomaterials Testing. J. Biomed. Mater. Res. A 2014, 102, 2636–2643. [Google Scholar] [CrossRef] [Scilit] [PubMed]
- Harper, J.M. Primary Cell Culture as a Model System for Evolutionary Molecular Physiology. Int. J. Mol. Sci. 2024, 25, 7905. [Google Scholar] [CrossRef] [Scilit] [PubMed]
- Scanu, M.; Mancuso, L.; Cao, G. Evaluation of the Use of Human Mesenchymal Stem Cells for Acute Toxicity Tests. Toxicol. Vitr. 2011, 25, 1989–1995. [Google Scholar] [CrossRef] [Scilit] [PubMed]
- Sharma, S.; Venkatesan, V.; Prakhya, B.M.; Bhonde, R. Human Mesenchymal Stem Cells as a Novel Platform for Simultaneous Evaluation of Cytotoxicity and Genotoxicity of Pharmaceuticals. Mutagenesis 2015, 30, 391–399. [Google Scholar] [CrossRef] [Scilit] [PubMed]
- Christodoulou, I.; Goulielmaki, M.; Kritikos, A.; Zoumpourlis, P.; Koliakos, G.; Zoumpourlis, V. Suitability of Human Mesenchymal Stem Cells Derived from Fetal Umbilical Cord (Wharton’s Jelly) as an Alternative In Vitro Model for Acute Drug Toxicity Screening. Cells 2022, 11, 1102. [Google Scholar] [CrossRef] [Scilit] [PubMed]
- Uwazie, C.C.; Pirlot, B.M.; Faircloth, T.U.; Patel, M.; Parr, R.N.; Zastre, H.M.; Hematti, P.; Moll, G.; Rajan, D.; Chinnadurai, R. Effects of Atrazine Exposure on Human Bone Marrow-Derived Mesenchymal Stromal Cells Assessed by Combinatorial Assay Matrix. Front. Immunol. 2023, 14, 1214098. [Google Scholar] [CrossRef] [Scilit] [PubMed]
- Shaw, I.C.; Jones, H.B. Mechanisms of Non-Genotoxic Carcinogenesis. Trends Pharmacol. Sci. 1994, 15, 89–93. [Google Scholar] [CrossRef] [Scilit] [PubMed]
- Hernández, L.G.; van Steeg, H.; Luijten, M.; van Benthem, J. Mechanisms of Non-Genotoxic Carcinogens and Importance of a Weight of Evidence Approach. Mutat. Res./Rev. Mutat. Res. 2009, 682, 94–109. [Google Scholar] [CrossRef] [Scilit] [PubMed]
- Rundhaug, J.E.; Fischer, S.M. Molecular Mechanisms of Mouse Skin Tumor Promotion. Cancers 2010, 2, 436–482. [Google Scholar] [CrossRef] [Scilit] [PubMed]
- Emin Güzel, A. Using Sediment and Cytotoxic Analysis in Determination of Water Quality and Its Effect on the Livings in Karadere Dam Pond (Taşköprü-Kastamonu). Ph.D. Thesis, Kastamonu University, Kastamonu, Türkiye, 2023. [Google Scholar]
- Ministry of Forestry and Water Affairs of the Republic of Türkiye. Regulation Amending the Surface Water Quality Management Regulation; No. 29327; Official Gazette of the Republic of Türkiye: Ankara, Türkiye, 2015. [Google Scholar]
- Seid, A.M.A.; Turhan, Ş.; Kurnaz, A.; Bakır, T.K.; Hançerlioğulları, A. Radon Concentration of Different Brands of Bottled Natural Mineral Water Commercially Sold in Turkey and Radiological Risk Assessment. Int. J. Environ. Anal. Chem. 2022, 102, 7469–7481. [Google Scholar] [CrossRef] [Scilit]
- Nural, K. Design of Biomimetic Scaffolds for Bone Tissue Engineering and Investigation of Their Inductive Effect on Osteocytes. Master’s Thesis, Kastamonu University, Kastamonu, Türkiye, 2021. [Google Scholar]
- Özelçağlayan, E. Enhancement of the Osteogenic Differentiation Capacity of Bone Marrow Mesenchymal Stem Cells by Osteo-Mimetic Culture Medium Design. Master’s Thesis, Kastamonu University, Kastamonu, Türkiye, 2022. [Google Scholar]
- Taher Mohamed, S.A.; Emin, N. Effects of Using Collagen and Aloe Vera Grafted Fibroin Scaffolds on Osteogenic Differentiation of Rat Bone Marrow Mesenchymal Stem Cells in SBF-Enriched Cell Culture Medium. Biomed. Mater. 2024, 19, 015011. [Google Scholar] [CrossRef] [Scilit] [PubMed]
- Islak, S.; Houssain, H.; Emin, N.; Yazar, H.; Danacı, H.C.; Koç, V. Microstructural, Mechanical, and Biocompatibility Properties of Ti–Cu/B4C Composites for Biomedical Applications. Mater. Chem. Phys. 2024, 319, 129417. [Google Scholar] [CrossRef] [Scilit]
- Calabrese, E.J. Hormesis and Medicine. Br. J. Clin. Pharmacol. 2008, 66, 594–617. [Google Scholar] [CrossRef] [Scilit] [PubMed]
- Calabrese, E.J.; Baldwin, L.A. Hormesis: U-Shaped Dose Responses and Their Centrality in Toxicology. Trends Pharmacol. Sci. 2001, 22, 285–291. [Google Scholar] [CrossRef] [Scilit] [PubMed]
- Benson, B.B.; Krause, D. The Concentration and Isotopic Fractionation of Oxygen Dissolved in Freshwater and Seawater in Equilibrium with the Atmosphere1. Limnol. Oceanogr. 1984, 29, 620–632. [Google Scholar] [CrossRef] [Scilit]
- Turhan, Ş.; Kurnaz, A.; Aydın, E. Assessment of Internal Radiation Exposure Caused by Radon in Commercially Bottled Spring Waters Consumed in Turkey. Int. J. Environ. Health Res. 2024, 34, 1215–1226. [Google Scholar] [CrossRef] [Scilit] [PubMed]
- Escher, B.I.; Blanco, J.; Caixach, J.; Cserbik, D.; Farré, M.J.; Flores, C.; König, M.; Lee, J.; Nyffeler, J.; Planas, C.; et al. In Vitro Bioassays for Monitoring Drinking Water Quality of Tap Water, Domestic Filtration and Bottled Water. J. Expo. Sci. Environ. Epidemiol. 2023, 34, 126–135. [Google Scholar] [CrossRef] [Scilit] [PubMed]
- Lundqvist, J.; Lavonen, E.; Mandava, G.; Selin, E.; Ejhed, H.; Oskarsson, A. Effect-Based Monitoring of Chemical Hazards in Drinking Water from Source to Tap: Seasonal Trends over 2 Years of Sampling. Environ. Sci. Eur. 2024, 36, 45. [Google Scholar] [CrossRef] [Scilit]
- Emin, N.; Mutlu, E.; Güzel, A.E. Determination the Effectiveness of the Cytotoxic Analysis on the Water Quality Assessments. Turk. J. Agric.-Food Sci. Technol. 2020, 8, 478–483. [Google Scholar] [CrossRef] [Scilit]
- Calabrese, E.J.; Baldwin, L.A. Applications of Hormesis in Toxicology, Risk Assessment and Chemotherapeutics. Trends Pharmacol. Sci. 2002, 23, 331–337. [Google Scholar] [CrossRef] [Scilit] [PubMed]
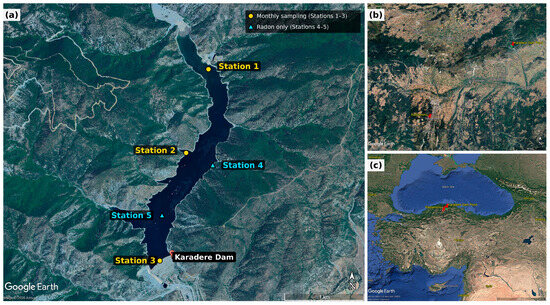
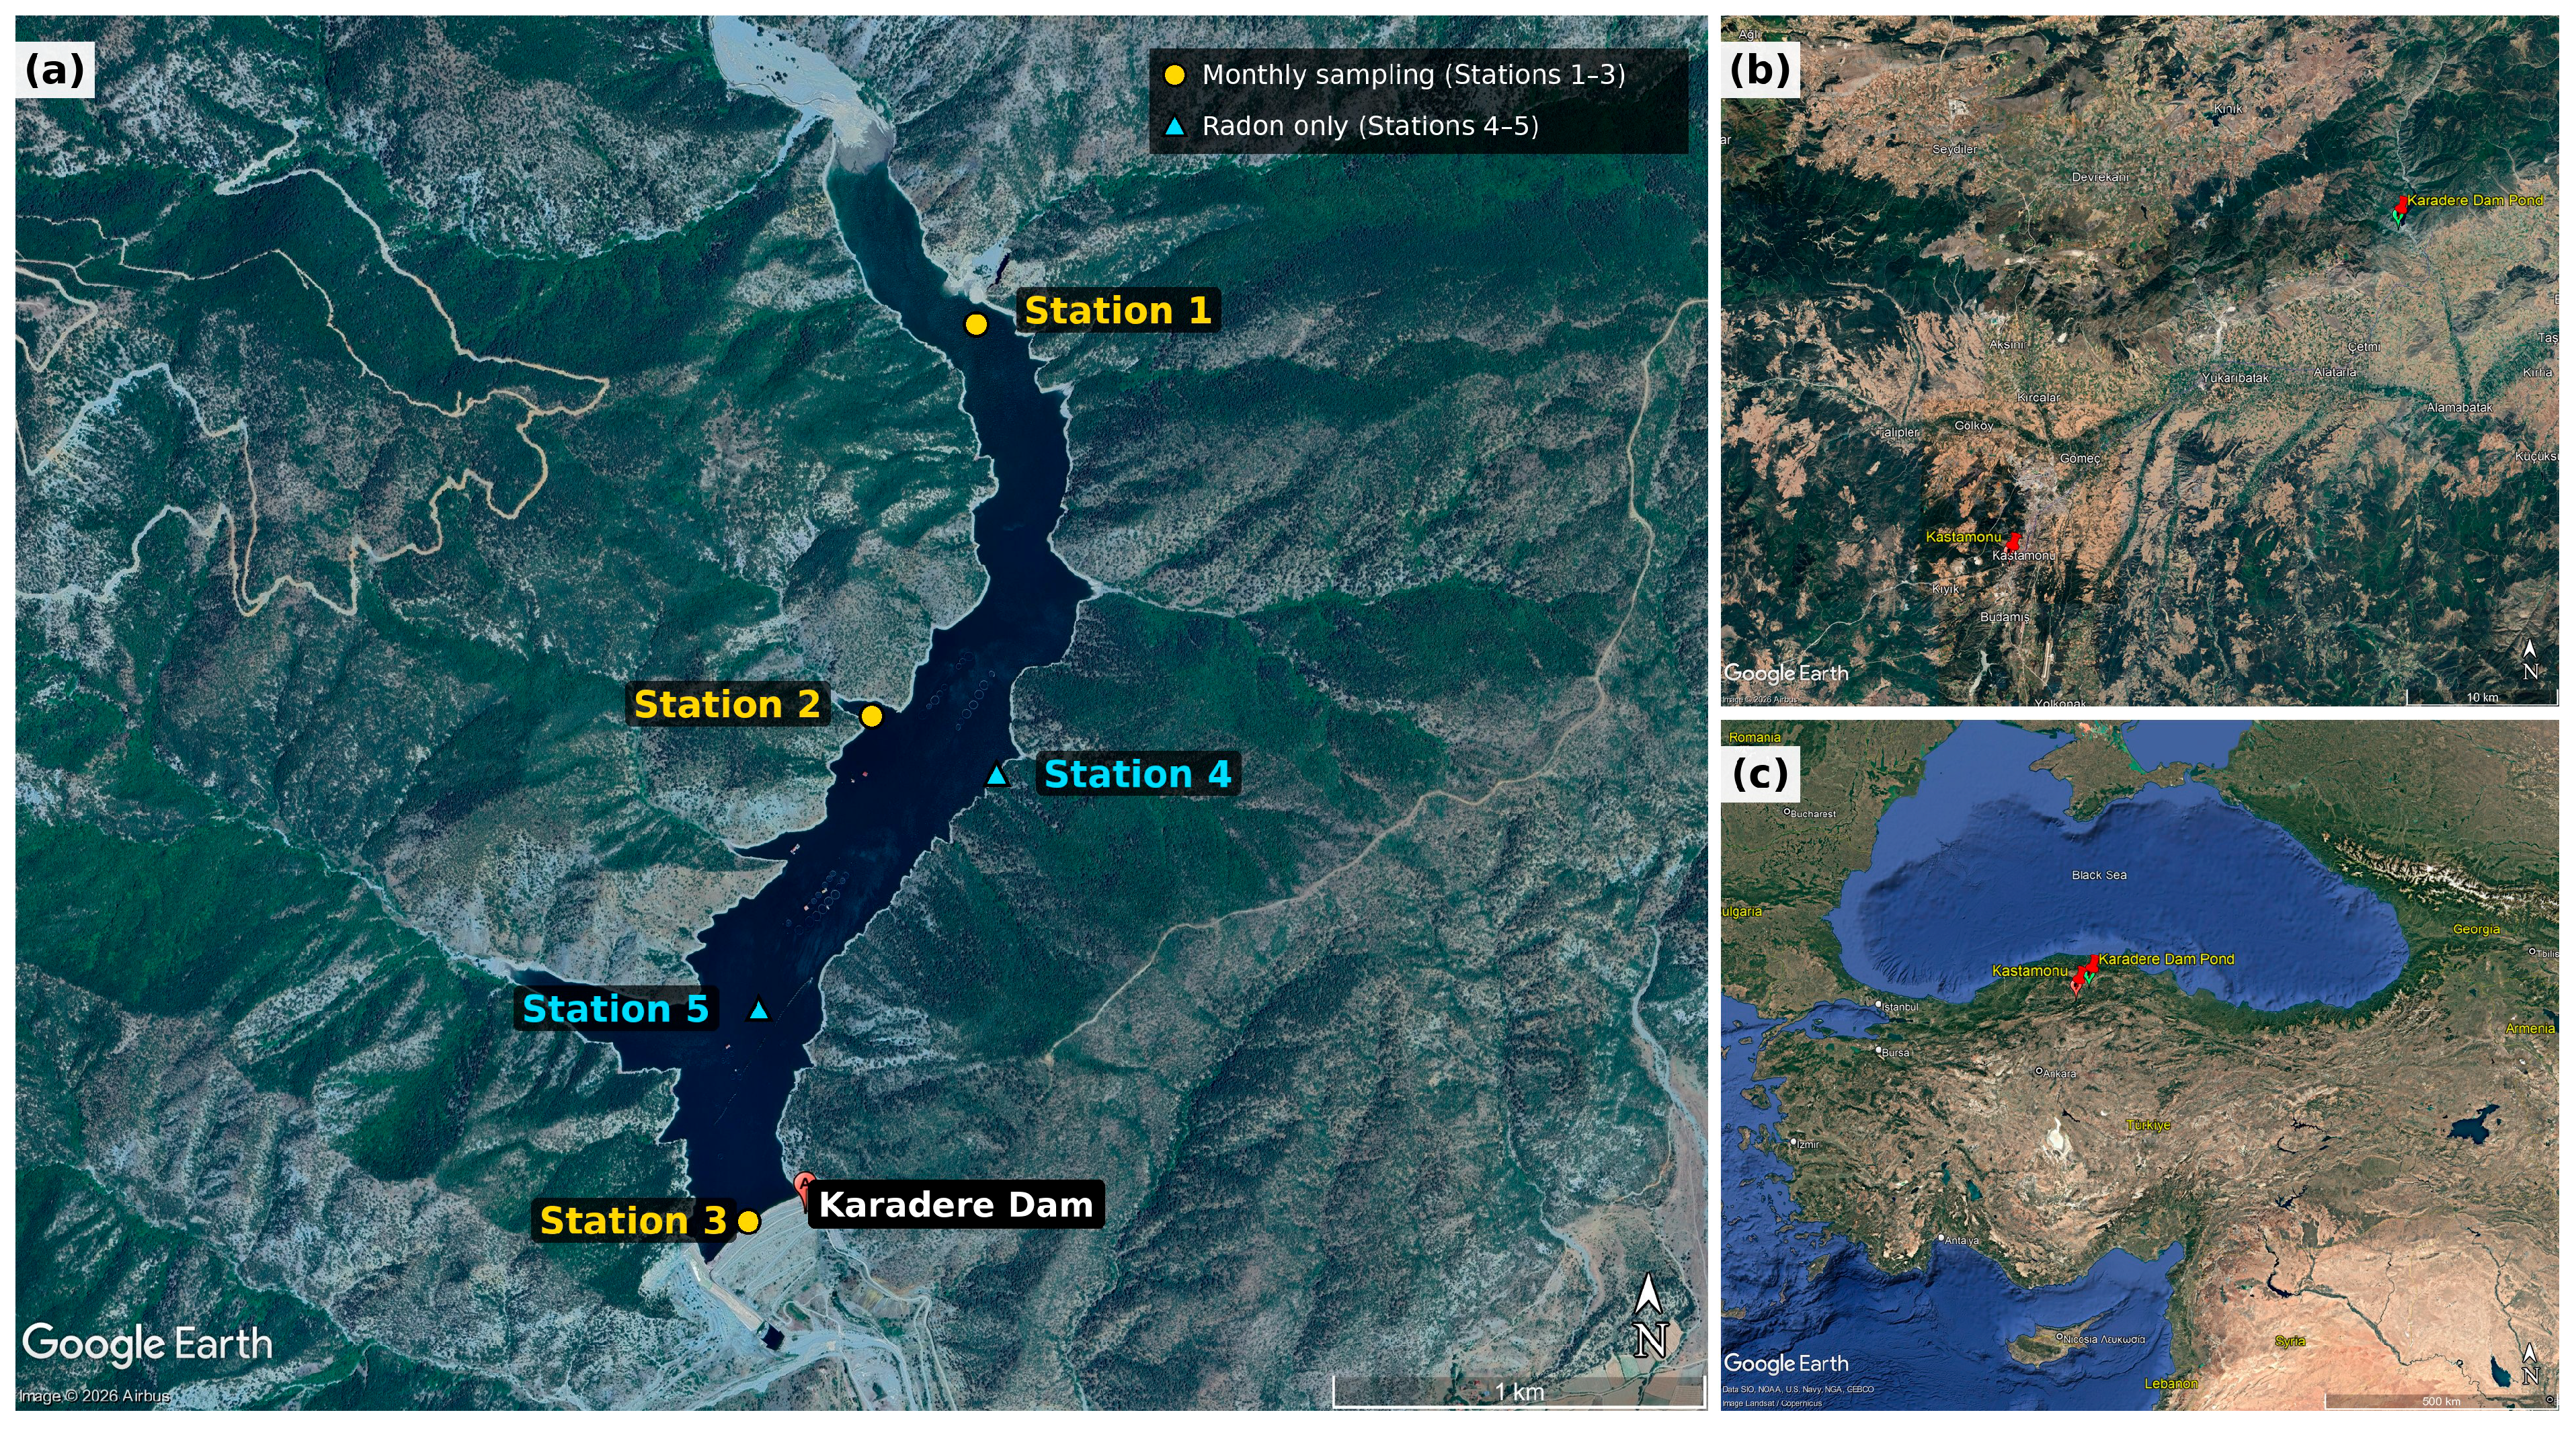
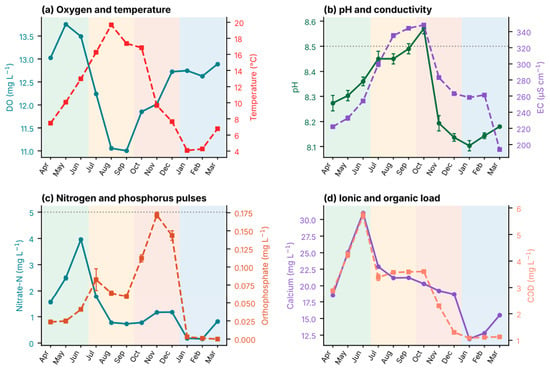
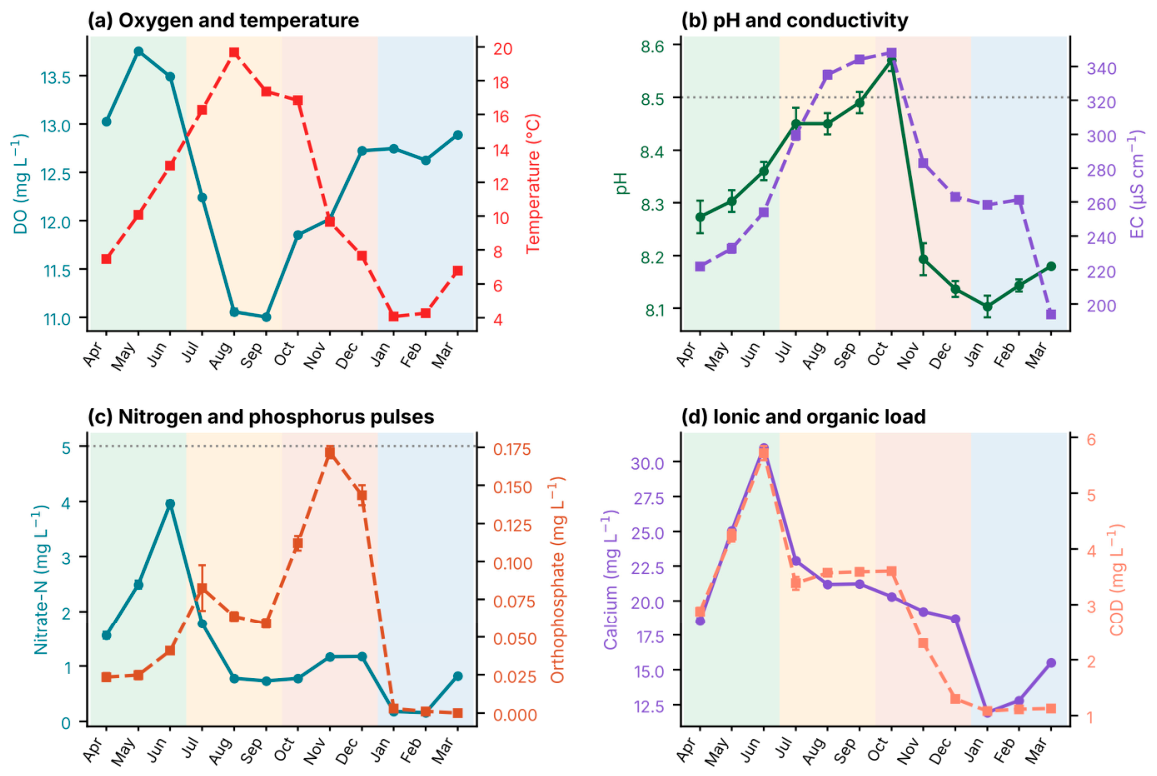
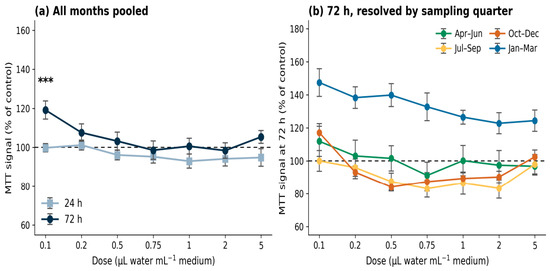
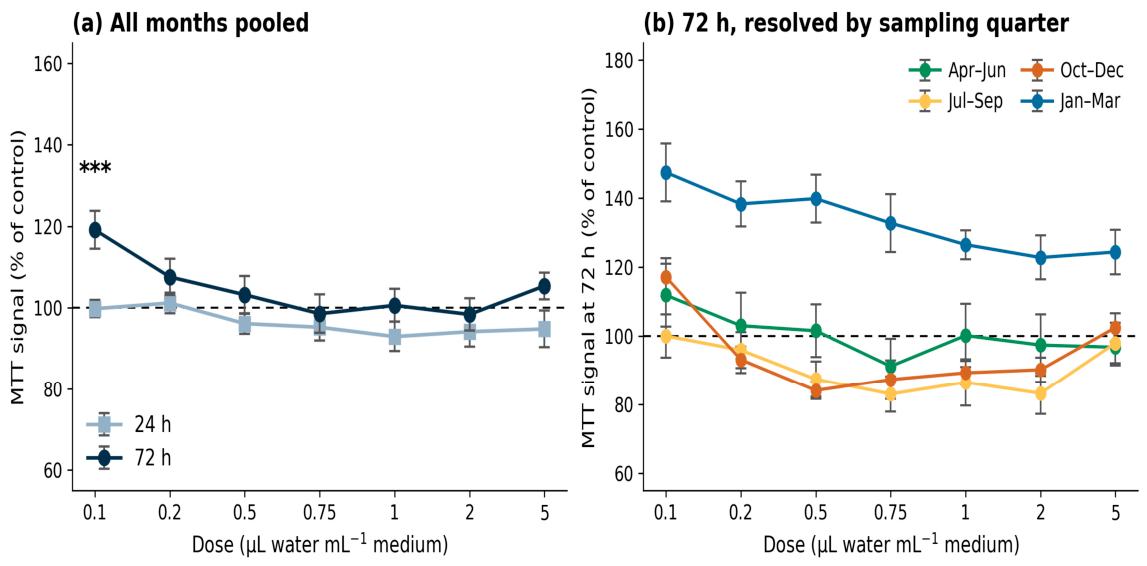
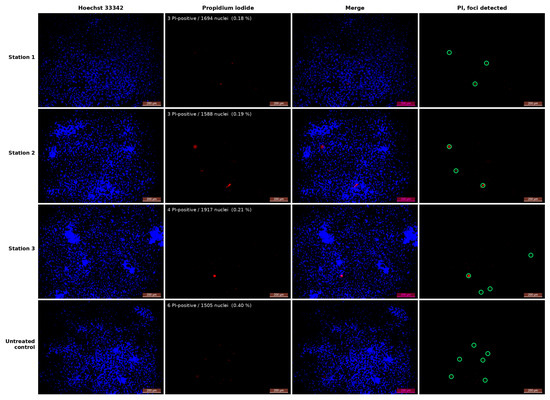
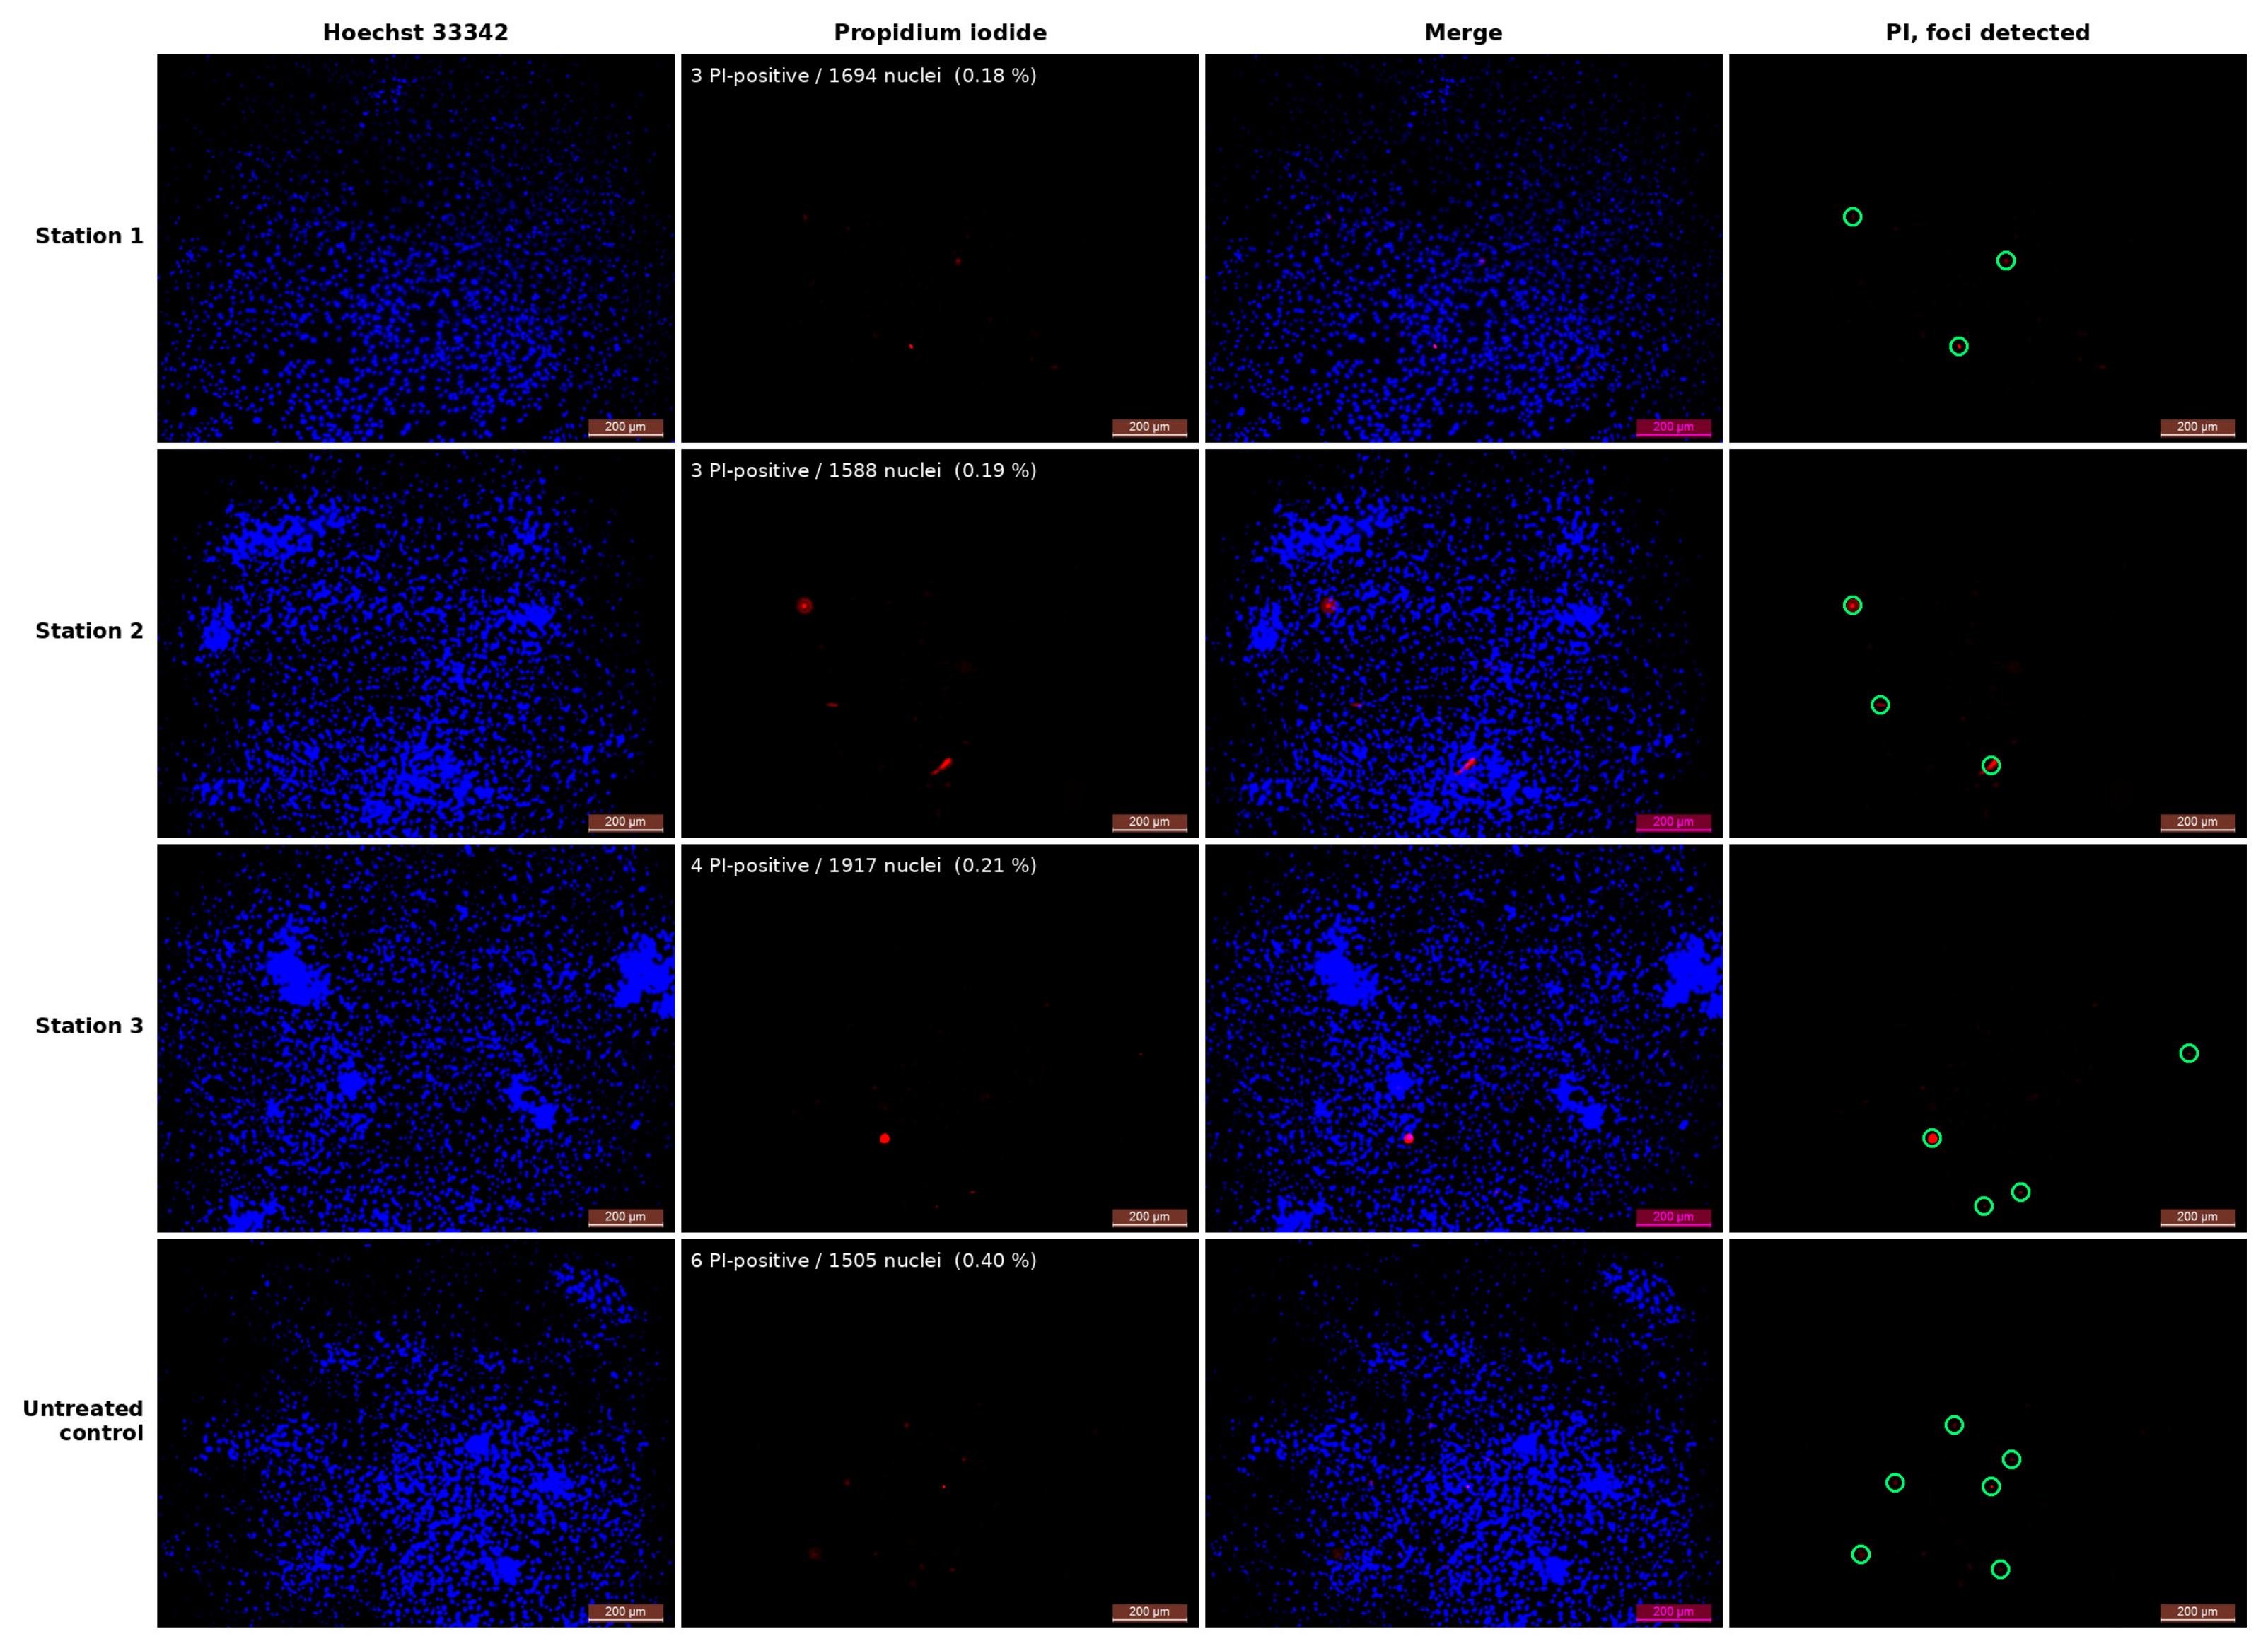

Disclaimer/Publisher’s Note: The statements, opinions and data contained in all publications are solely those of the individual author(s) and contributor(s) and not of MDPI and/or the editor(s). MDPI and/or the editor(s) disclaim responsibility for any injury to people or property resulting from any ideas, methods, instructions or products referred to in the content. |
© 2026 by the authors. Licensee MDPI, Basel, Switzerland. This article is an open access article distributed under the terms and conditions of the Creative Commons Attribution (CC BY) license.