


Abstract
Background: Road transport accounts for 73% of transport-related greenhouse gas emissions within the EU, 27% of which are attributable to heavy-duty vehicles. In order to reduce emissions in the area of heavy-duty commercial vehicles, electrifying the fleet offers a perspective. As part of a cooperation between TU Berlin, Siemens and BLG Logistics within the Mobility2Grid research campus, an analysis was carried out to determine how an exemplary BLG depot for regional logistics transport with six diesel trucks can be converted to battery–electric trucks. Methods: This analysis was conducted under a fixed depot schedule with defined dwell times and charging opportunities, with the aim of developing practical recommendations for the acquisition of suitable vehicles and infrastructure. To this end, simulations were carried out using the eFlips consumption and depot simulation software developed at TU Berlin. Results and Conclusions The results show that electrification for regional logistics transport can already be fully implemented with the current state of the art technology and that neither very large batteries nor very high charging powers are required for technically feasible and economically balanced operation. Notably, the cost-optimal battery capacities identified (approximately 200–230 kWh) are currently smaller than those of commercially available 40 t electric trucks, revealing a gap between the model-optimal configuration and present market offerings. Based on the identified optimal configuration, a life cycle assessment (LCA) is conducted to evaluate the environmental impact of fleet electrification. Over a 10-year lifetime, the battery–electric fleet reduces cumulative greenhouse gas emissions by approximately 53% compared to the diesel baseline, with operational-phase savings clearly outweighing higher production-related emissions. The combined techno-economic and environmental assessment provides a structured decision basis for depot-centered fleet electrification.
1. Introduction
Road transport dominates transport-related greenhouse gas (GHG) emissions. Recent EU-wide assessments show that road transport accounts for roughly three-quarters of transport GHG emissions (73.1% in 2024), underlining the central role of road-based mobility in overall sector emissions [1]. Within road transport, heavy-duty trucks and buses contribute a disproportionately large share of CO2 emissions (27% of EU road transport emissions in 2024), despite their comparatively small fleet share [1]. Against this background, the electrification of depot-centric, schedule-driven regional logistics fleets offers a near-term mitigation lever.
Building on this context, the electrification of heavy-duty freight transport raises a planning problem for logistics operators: the economic and operational feasibility of battery–electric trucks depends on the joint configuration of vehicle energy storage, depot charging infrastructure, and charging strategy under real schedules. Therefore, the decarbonization of heavy-duty road freight transport is becoming a crucial challenge for logistics service providers and policymakers [2,3]. Battery electric trucks have shown their feasibility in long haul and regional operations, but large-scale applications are still restricted by operational uncertainties, complexity of planning and dimensioning of charging infrastructure and the demand for an economical operation of the transports [4,5]. Regional short-range supply logistics are typically characterized by short and frequent tours, predetermined departure and arrival times, fixed loading and unloading times, high truck utilization and repetitive schedules for transports between a logistics hub and several target locations (e.g., production facility) [6,7]. These characteristics offer potential for the design and dimensioning of electrified trucking operations. In this context, the network configuration (i.e., choice of battery capacity, loading infrastructure, loading strategy) is a key factor for investment and operational costs. Typically, this design task has several degrees of freedom and should be addressed as a multidimensional optimization problem. Decisions about truck battery capacity, charging infrastructure size and charging strategies must be made jointly to align all factors and avoid over- or undersizing. Recent work shows that infrastructure availability, grid capacity and charging power are critical parameters for the feasibility of battery–electric trucks (BETs) [8]. For regional short-range supply networks, these design factors have to be addressed jointly during the planning phase.
However, despite the growing interest in electric freight transportation, existing optimization approaches often focus on long-haul operations, public charging networks or the operative vehicle routing, rather than the network design of a regional supply network with fixed schedules [9,10,11]. Due to the high inherent complexity, which is caused by the number of possible variable design decision factors, heuristic approaches seem to be more suitable than an exact analytical solution for this multidimensional optimization problem. Specifically, evolutionary algorithms like genetic algorithms (GAs) have been widely applied to vehicle routing and logistics network optimization due to their robustness in solving complex, multi-parameter problems. Recent work has demonstrated their suitability for electric vehicle routing problems and for modeling charging-related constraints in freight networks [12,13]. Nevertheless, no existing study was found that integrates GA-based optimization with a joint optimization of battery capacity and depot charging infrastructure under real-world schedule-feasibility constraints using simulation-based evaluation. This paper addresses this particular topic by introducing a novel GA-based optimization approach for configuring an electrified regional supply network. By considering varying battery capacities of trucks, the charging infrastructure and different charging strategies, the approach allows for a joint optimization of investment and operational costs. The approach is validated using a real-world case study from BLG Logistics, evaluating both the algorithm’s performance and the resulting optimal configuration for the specific use case.
Beyond techno-economic feasibility, the environmental performance of depot electrification must be assessed from a life-cycle perspective. While battery–electric trucks eliminate tailpipe emissions, higher manufacturing-related emissions—particularly from battery production—shift part of the environmental burden to earlier lifecycle stages. Therefore, this study complements the techno-economic optimization with an LCA of the optimized depot configuration, thereby linking operational feasibility, annualized costs, and lifecycle greenhouse gas emissions within one decision-oriented framework.
Taken together, these techno-economic and environmental perspectives can be condensed into two guiding questions that frame the present study. First, can a fixed-schedule regional logistics depot be electrified with current state-of-the-art technology, and how can battery capacity, charging power, and the number of chargers be configured jointly to keep the annualized system cost low while maintaining schedule feasibility? Second, how does the resulting cost-efficient configuration perform in terms of life-cycle greenhouse-gas emissions compared with the existing diesel fleet? To address these questions, the following sections introduce the case study and the simulation-based optimization framework before presenting and discussing the results.
2. Description of the Case Study
BLG Logistics Group is a leading provider of logistics services in Germany, operating numerous depots for automotive and industrial customers. The particular site in this case study is located nearby Berlin and serves as a regional distribution hub, connecting the BLG depot with customer locations. The site was selected for analysis because its operational profile is representative of a broad class of regional distribution operations: a fixed daily schedule with predefined departure and arrival times, repetitive short round trips, fixed loading and unloading windows, high vehicle utilization, and deterministic dwell times that allow charging to be planned with little uncertainty. Together with its clearly defined transport schedule, these characteristics make the site a well-suited reference case for assessing depot-centered electrification.
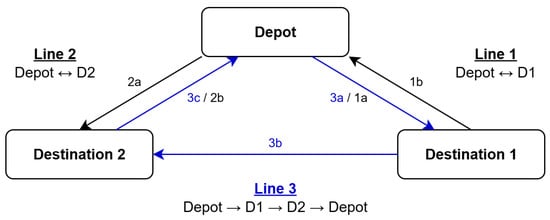
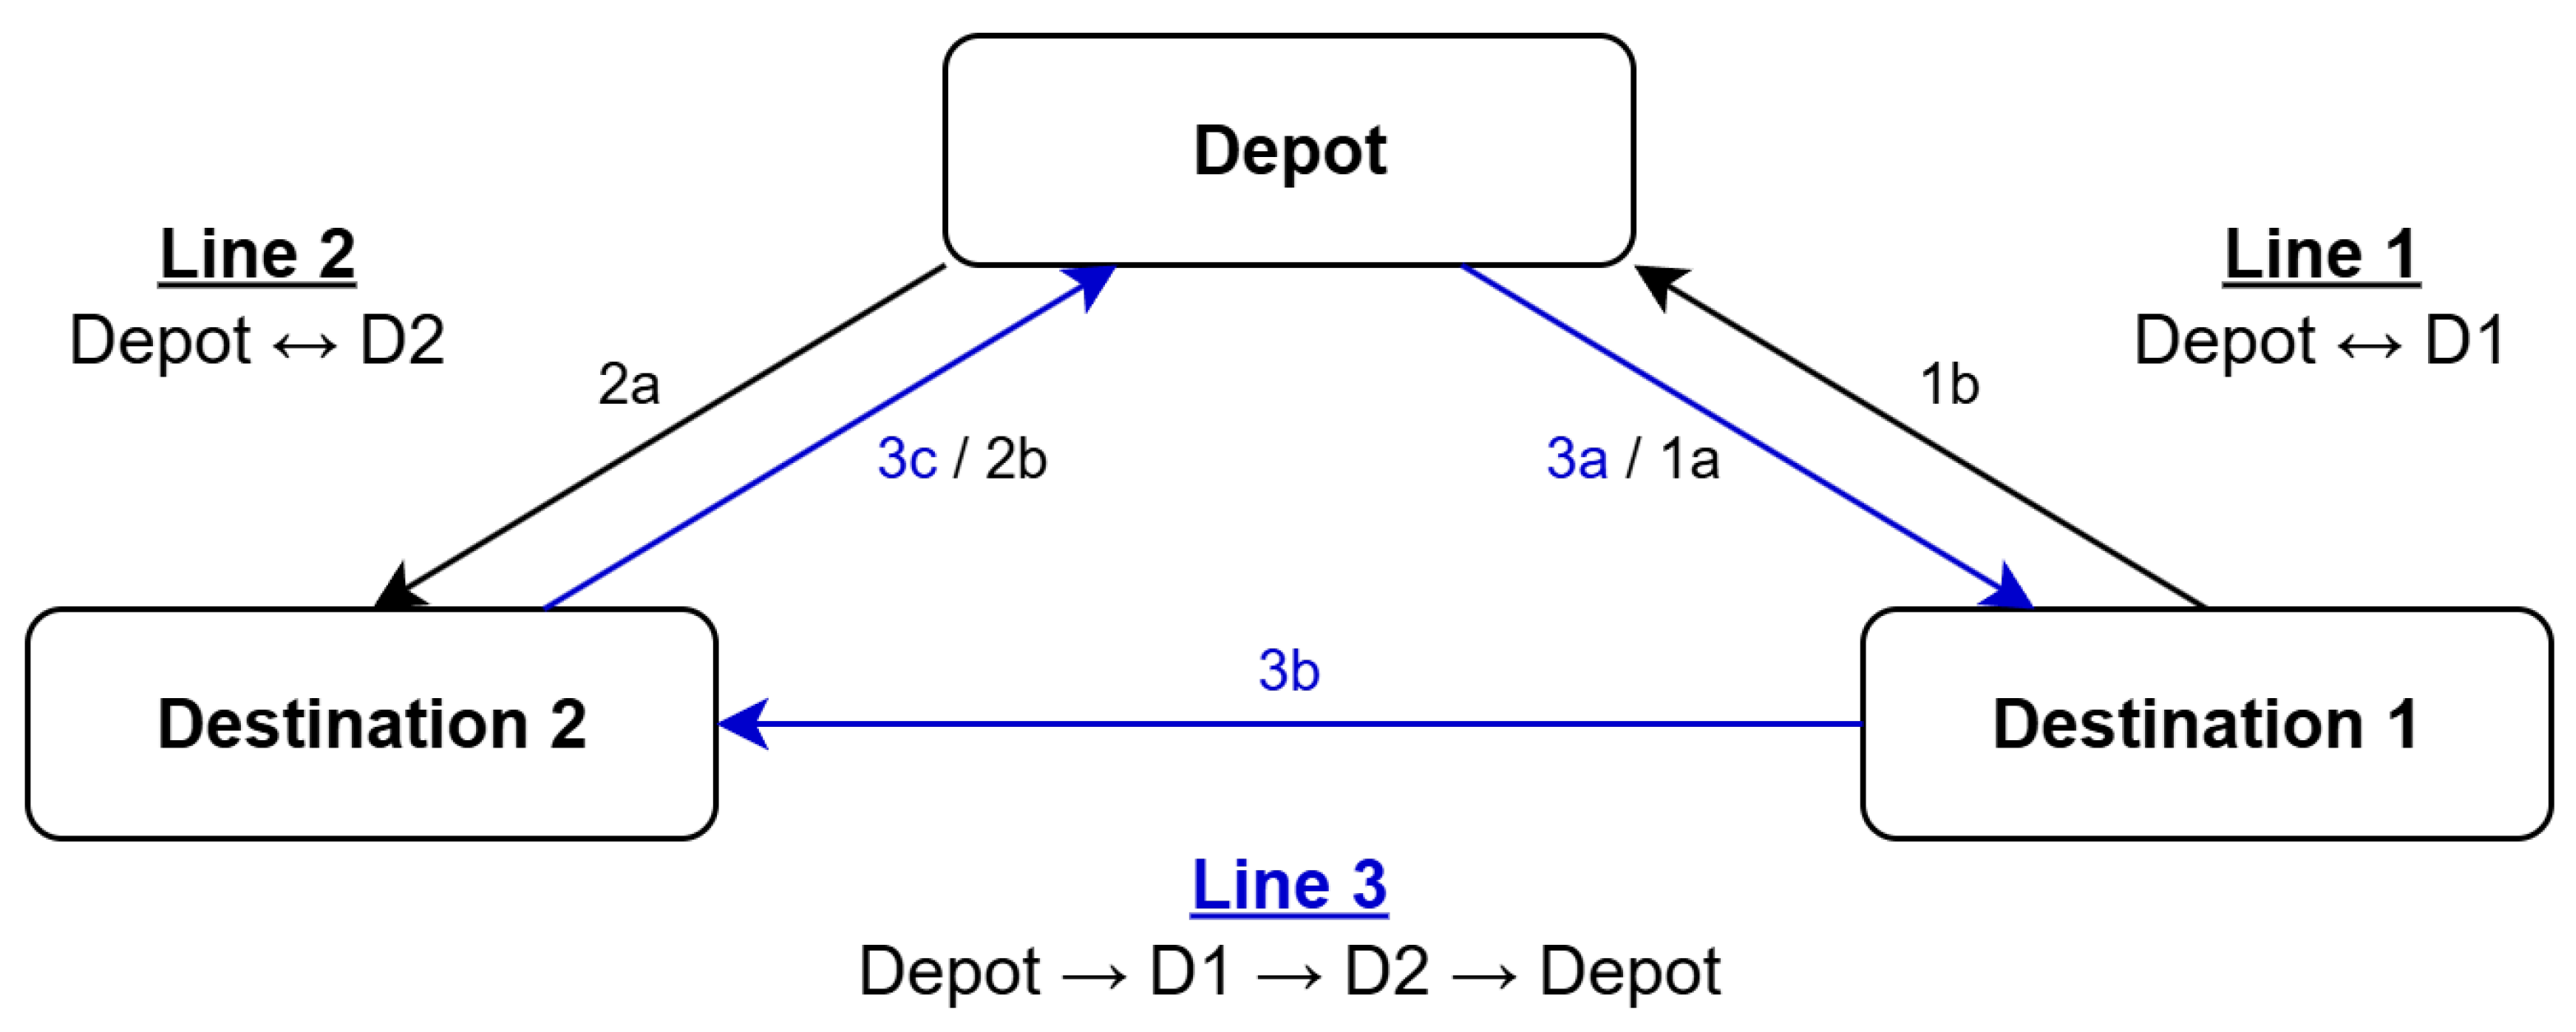
The investigated transport task consists of daily round trips between the depot and two customer destinations, as depicted in Figure 1. The predefined schedule includes fixed departure and arrival times between 5:30 a.m. and 8:30 p.m., resulting in a recurring driving pattern of approximately 300 km per vehicle per day, with individual round trips of approximately 37 km. Each vehicle performs two tours at the beginning of the shift, followed by a short break of 30 min. Subsequently, four additional tours are completed before a second 30 min break. In the later part of the day, one to two additional tours are carried out, depending on route assignment and demand. To serve customers in a flexible way, three different routes can be driven, where Line 1 is a round trip to Destination 1, Line 2 a round trip to Destination 2, and Line 3 a round trip to serve both destinations. The three lines and their direction are dictated by the predefined operational schedule provided by BLG. The reverse sequence (Depot→D2→D1→Depot) does not occur in this schedule and is therefore not considered. As the lines enter the analysis only through the resulting daily mileage and the fixed timetable, the chosen orientation has no further effect on the simulation results.
Figure 1.
Routes between depot and customer sites.
Charging of the battery–electric trucks can take place during the two short breaks as well as during the approximately 9 h overnight parking period at the depot. As the duty cycle and break structure are fixed, charging events can be planned deterministically, reducing uncertainty and limiting the need for battery oversizing.
The current fleet comprises six conventional trucks, which are considered for a one-to-one replacement by battery–electric vehicles in the electrification scenario. The case study aims to evaluate the electrification potential of the existing truck fleet and to determine economically and technically feasible vehicle and charging infrastructure configurations.
3. Method
This section presents the methodological framework developed and applied in this study. The approach combines a detailed simulation of depot operations and vehicle energy consumption with an optimization algorithm designed to identify cost-efficient configurations for the usage of electric trucks in logistics. The method integrates technical, economic, and operational parameters to evaluate different infrastructure layouts and fleet compositions under realistic boundary conditions.
3.1. eFlips
The simulation software eFlips, developed at the Technical University of Berlin, is used to perform the analysis [14]. The tool was originally developed for the electrification of bus depots and is adapted in this study for logistics applications. eFlips enables a detailed representation of depot operations and route schedules through a consumption-based simulation of electric commercial vehicles. This allows modeling both the number and power rating of charging stations as well as determining optimal battery sizes for vehicle fleets under given schedules. With the help of a genetic algorithm, eFlips identifies optimal combinations of infrastructure and vehicle characteristics. Variable parameters include energy consumption, charging infrastructure, charging capacities, number of parking spaces, depot layout, and operational processes. eFlips is particularly suitable for the analysis of complex depots and schedules that involve interdependent vehicle and charging operations.
3.2. Genetic Algorithm for Fleet Optimization
The optimization algorithm developed as part of this study is based on a genetic approach designed to minimize the total annualized system costs. Each individual in the population represents a configuration of system parameters, including battery capacity, charging power, the number of charging stations, and parking positions. The algorithm iteratively evolves these configurations through selection, crossover, and mutation to identify the cost-optimal solution.
3.2.1. Fitness Evaluation
The fitness of each individual is evaluated using a custom cost function. This function consolidates the most relevant influencing factors identified for the economic operation of depot-based charging for battery–electric heavy-duty vehicles (Section 3.3). It quantifies trade-offs between infrastructure investment, vehicle acquisition, and labor costs within a unified cost framework. A simulation-based approach is employed to calculate this cost function: the eFlips depot simulation is executed for the proposed parameter set to obtain schedule feasibility and the required fleet size . The objective is to minimize the annualized total cost ; therefore, the GA maximizes the fitness value . Parameter combinations that lead to infeasible schedules (e.g., state-of-charge violations, delayed trips, or unstable simulation behavior) are penalized by assigning a large cost value, effectively removing them from selection pressure.
3.2.2. Selection, Crossover, and Mutation
Parent selection is performed via tournament selection with a tournament size of . For each offspring pair, two parents are selected independently as the fittest individuals among k randomly sampled competitors. The offspring are generated using one-point crossover, where a split point is sampled uniformly from the chromosome indices and genetic material is exchanged accordingly.
Mutation is applied with probability per mating event. If mutation is triggered, both offspring are mutated. A mutation changes (i) battery-related genes (battery size and derived charging curve limit), (ii) charging-related genes (charging power and charger count), or (iii) both groups simultaneously, each with equal probability. This mutation operator maintains feasibility with respect to discretization and depot power constraints by re-sampling parameters from their admissible ranges. The values of the tournament size () and the mutation probability () were selected based on preliminary experiments with different settings. They provided a robust balance between selection pressure and population diversity and led to stable, reproducible convergence for the considered case study.
3.3. Target Function for Optimization
By conducting an expert workshop with system stakeholders, a suitable target cost function is derived. The resulting formulation enables a holistic assessment of different system architectures and guides the algorithm toward economically balanced configurations:
Here, denotes the infrastructure cost as a function of charging power, while represents the vehicle cost estimated as a function of battery size. is the number of required vehicles, and , , and denote the hourly wage, daily working hours, and annual number of working days, respectively. The weighting factors , , and balance the influence of each cost component, and defines the depreciation period. The first two terms represent annualized CAPEX using straight-line depreciation over . The third term represents annual labor expenses and is therefore already expressed on a yearly basis. This third term captures driver labor costs only. Maintenance costs, energy costs and electricity price structures, and tax-specific effects such as depreciation schedules and resale values are not part of the optimization objective and are discussed as limitations of the cost model in Section 5.2. Here, refers to the technical and operational service life assumed for planning purposes (BLG standard) and not to a tax depreciation period. All variables and parameters used in the cost model are summarized in Table 1.
Table 1.
Definition of variables and factors used in the cost model.
3.4. Cost Functions
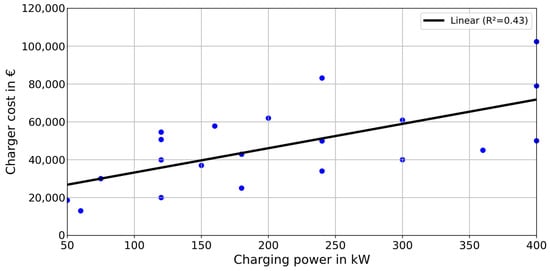
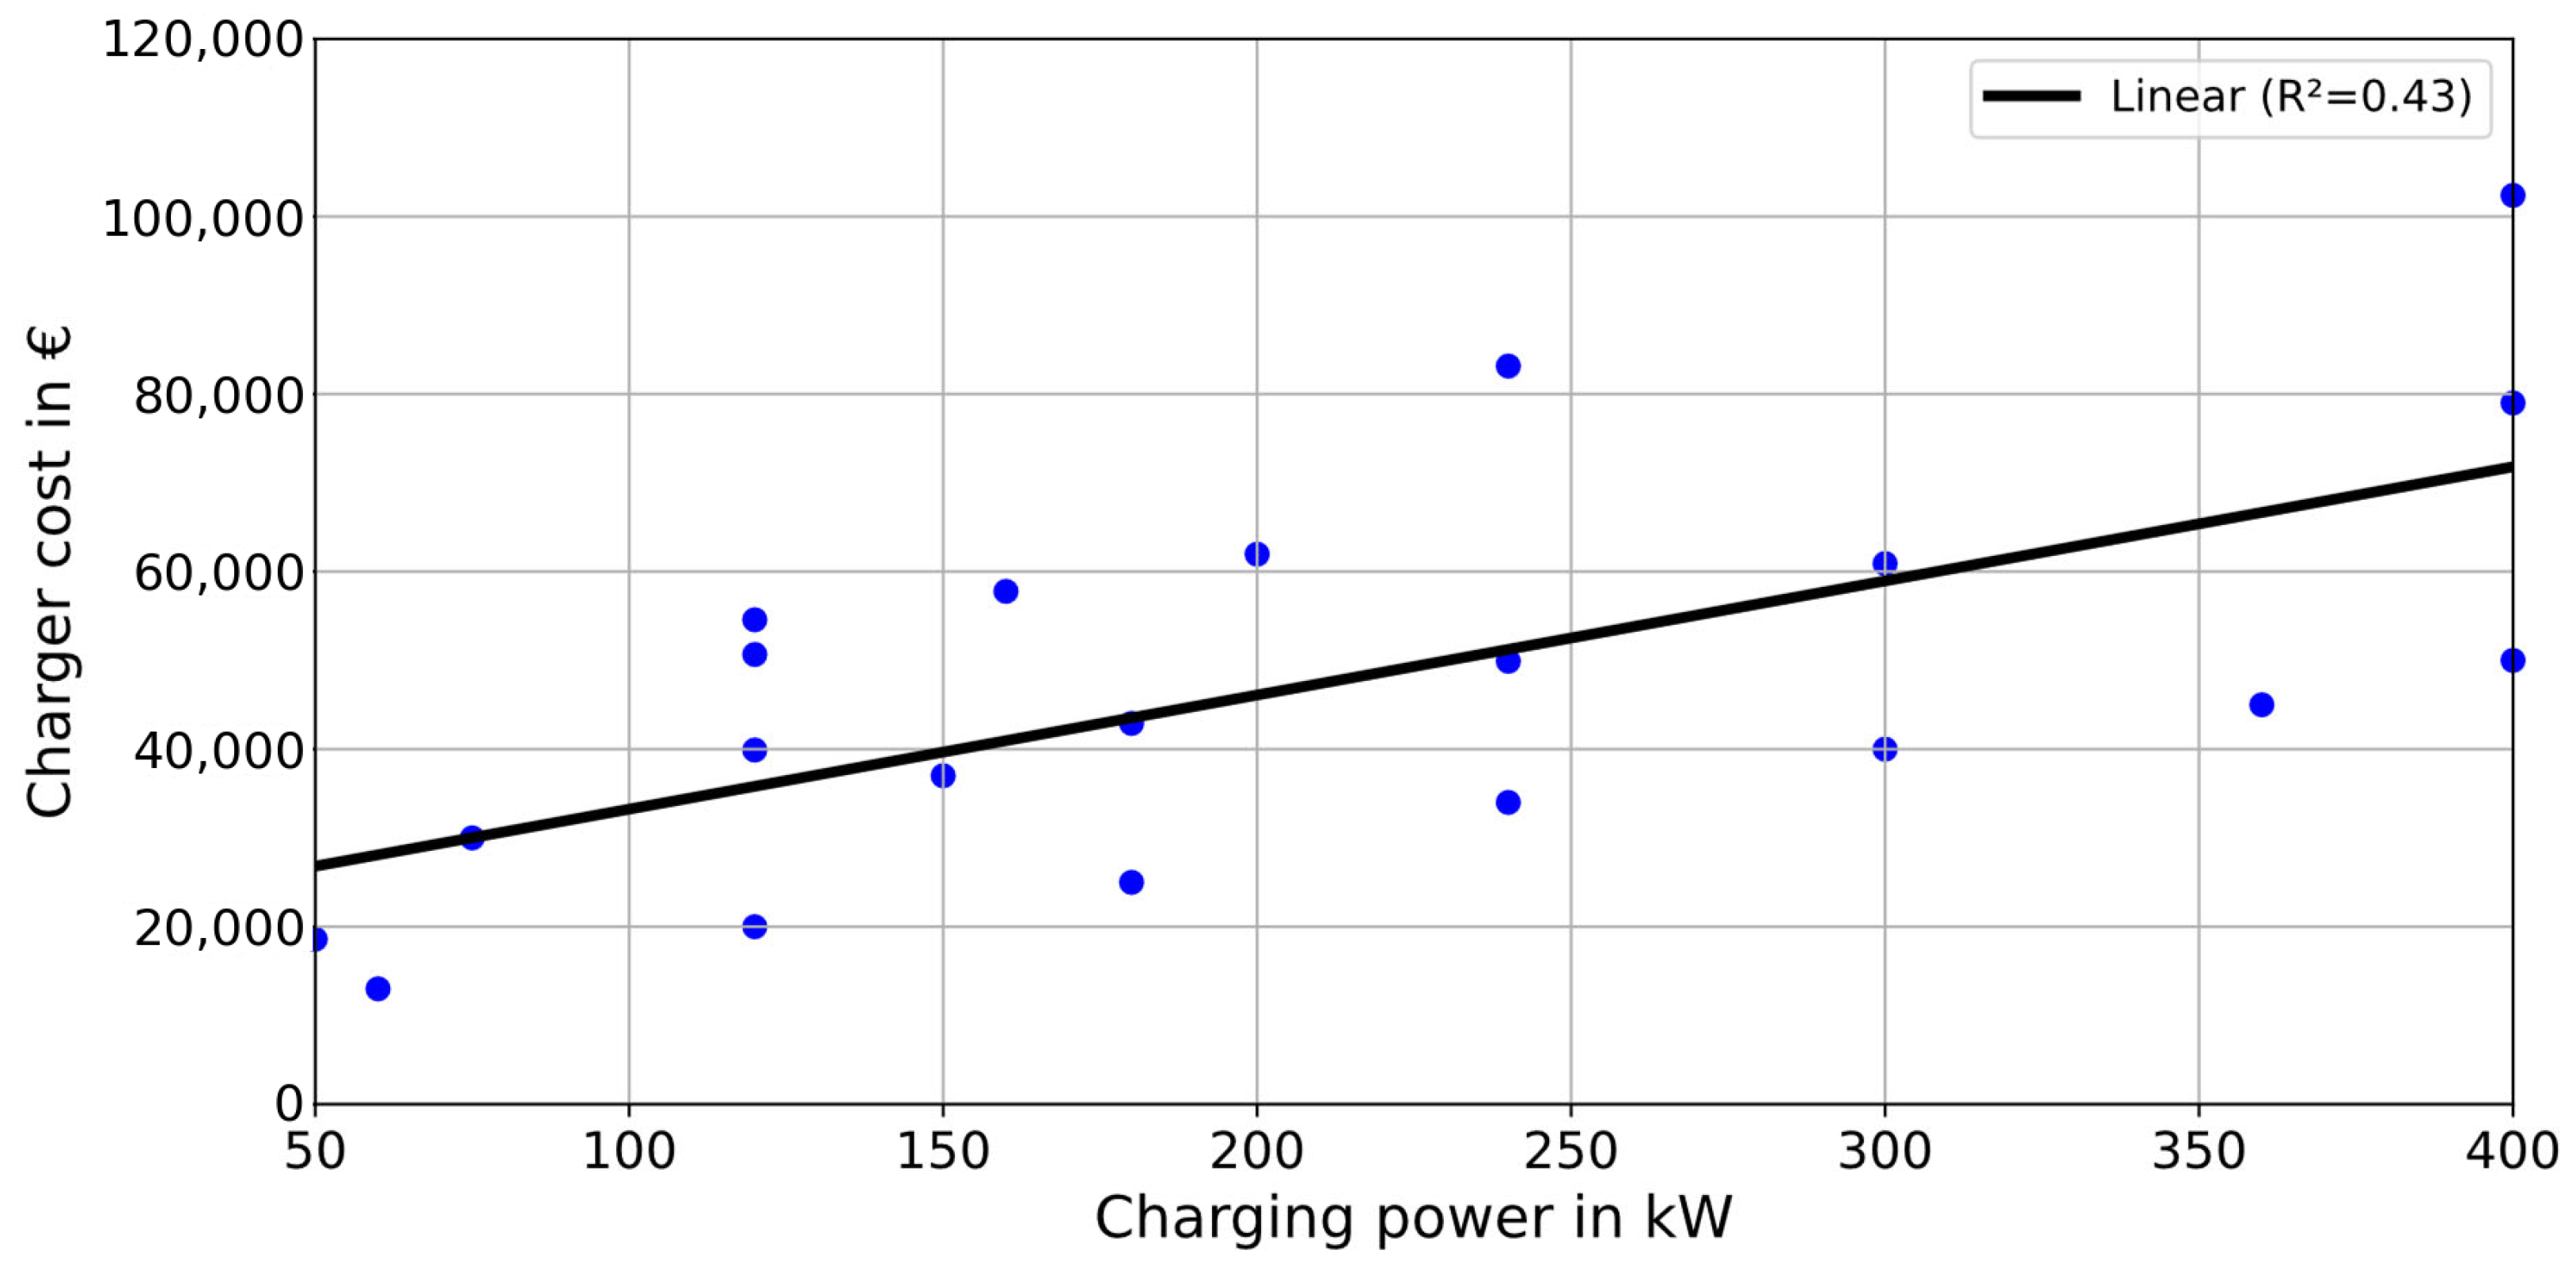
Based on market research (see Table A1), cost data for DC charging stations were collected in the power range from 50 kW to 400 kW. A linear regression model was applied to derive the cost function , as illustrated in Figure 2. The resulting regression captures the relationship between infrastructure cost and charging power, described by Equation (2).
Figure 2.
Regression of charger cost as a function of charging power.
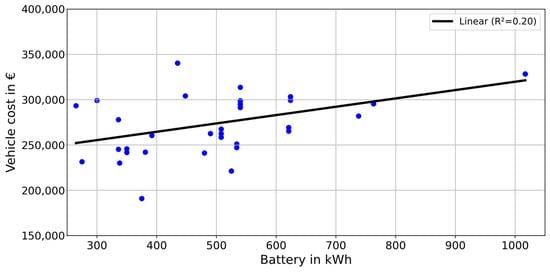
A similar regression approach was used to determine vehicle costs for electric trucks using data points from My eRoads for vehicles above 26 t [15]. Figure 3 shows the corresponding dataset and linear fit, which relates total vehicle cost to installed battery capacity as described by Equation (3).
Figure 3.
Regression of truck cost as a function of battery capacity.
The described methodology provides a flexible framework that combines empirical cost modeling and algorithmic optimization to assess techno-economic trade-offs in fleet and infrastructure planning. In the following section, this method is applied to a real-world use case to evaluate its performance under practical conditions.
3.5. Simulation Setup
The simulation setup follows the real-world schedule using the eFlips tool described in Section 3. Following the schedule, all opportunities, including the short 30 min brakes, are used to charge the vehicles. Table 2 shows the simulation parameters. To approximate the consumption of the electric trucks, the estimation method of Le Corguille et al. is used, which is based on real-world data [16]. According to this framework, the consumption is approximated to be 1.5 kWh/km for a 40 t vehicle driving 80 km/h at −5 degrees Celsius on a level road. This value is intentionally conservative and represents a worst-case winter condition. It is used only to determine the required battery size so that schedule feasibility is maintained even on the most demanding days. The annual average consumption is expected to be notably lower, and for the LCA, a more representative cross-seasonal average value of 1.2 kWh/km is therefore applied. Effects of grade, traffic, payload variability, and auxiliary loads beyond the referenced framework are not explicitly modeled and are thus implicitly covered by the conservative assumption. Battery capacity, charging power and number of charging stations are treated as variable parameters within the optimization algorithm.
Table 2.
Parameters for simulation.
3.6. LCA Methodology
The LCA builds on the optimized electrification scenario derived from the eFlips study, which serves as the fixed technical and operational basis. A comparative cradle-to-grave LCA is conducted to assess GHG emissions of the battery–electric truck fleet relative to the existing diesel fleet.
A harmonized lifetime of ten years is assumed for both the vehicles and the charging infrastructure. GHG emissions are quantified across three life cycle phases—production, operation, and end of life—allowing for a transparent comparison of the two drivetrain concepts. The savings are expressed in tons of CO2e over the lifetime. Operational emissions are calculated based on diesel fuel consumption for the conventional fleet and electricity consumption for the battery–electric fleet.
The functional unit is the provision of the depot’s transport service over the assumed ten-year service life, i.e., the operation of the full six-vehicle fleet, with each vehicle covering a lifetime mileage of approximately 750,000 km, and all results are reported at the fleet level. The system boundary covers the trucks (glider, drivetrain, and traction battery) and the depot charging infrastructure, whereas depot buildings, road infrastructure, and maintenance are excluded. Production and end-of-life emissions are derived from component-specific factors [4,19], and use-phase emissions from the simulated energy and fuel consumption multiplied by the respective carrier emission factor for diesel [20] and for the scenario-dependent German electricity mix [4]. Greenhouse-gas emissions expressed as CO2e (global warming potential) serve as the single environmental indicator.
To reflect uncertainty in electricity generation, multiple German electricity mix scenarios are considered, including a current reference mix (2023) and projected future emission scenarios for 2030 and 2050, as published in [4]. All assumptions and input parameters used in the assessment are documented in Appendix A.3.
4. Results
Using the methodology described in Section 3, feasible electrification strategies for the considered logistics depot are identified. The results are structured into three parts: the performance and convergence behavior of the genetic algorithm, a comparison of the most cost-effective solutions, and a sensitivity analysis with respect to the weighting factors of the cost function.
4.1. Performance of the Optimization Algorithm
A genetic algorithm is employed to identify suitable combinations of battery capacity and charging infrastructure based on the total cost function . Two key selection mechanisms can be observed during the optimization process.
First, infeasible individuals are eliminated during the simulation stage. These correspond to combinations of battery size and charging power that cannot satisfy the operational schedule, as the vehicle state of charge (SOC) would drop below zero at some point during the simulation. Second, among the feasible individuals, the cost evaluation disfavors solutions with oversized batteries or excessively high charging power, thereby guiding the population towards cost-efficient configurations.
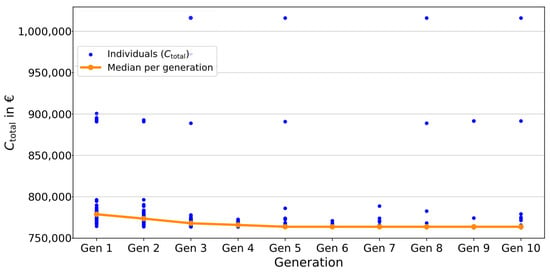
Figure 4 shows the evolution of the cost function over ten generations for a population size of 100. In the initial generation, a wide spread of cost values is observed, reflecting the random initialization of the population. Already by the second generation, low-cost individuals dominate the population, indicating strong selective pressure. While occasional cost spikes occur due to mutation, the overall population converges rapidly. A stable solution is effectively reached after approximately five generations. The population size of 100 and the limit of ten generations were likewise selected on the basis of preliminary runs: these settings reliably reach the near-optimal region, whereas larger populations or additional generations did not improve the identified solution but only increased computation time.
Figure 4.
Cost function over ten generations.
Based on this preliminary assessment, the battery capacity search space is reduced to a range between 200 and 240 kWh, as solutions outside this interval are consistently dominated in terms of cost. For the subsequent detailed analysis, the number of generations is limited to five with a reduced population size of 40 individuals in order to improve computational efficiency while maintaining solution quality.
4.2. Comparison of the Most Cost Effective Solutions
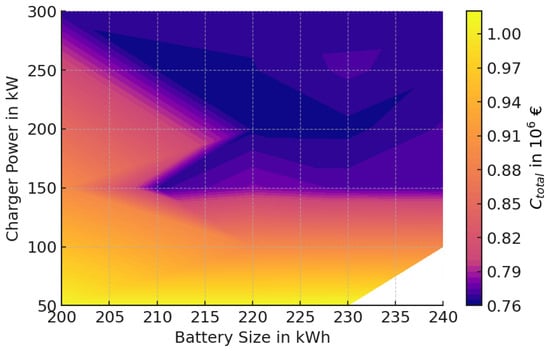
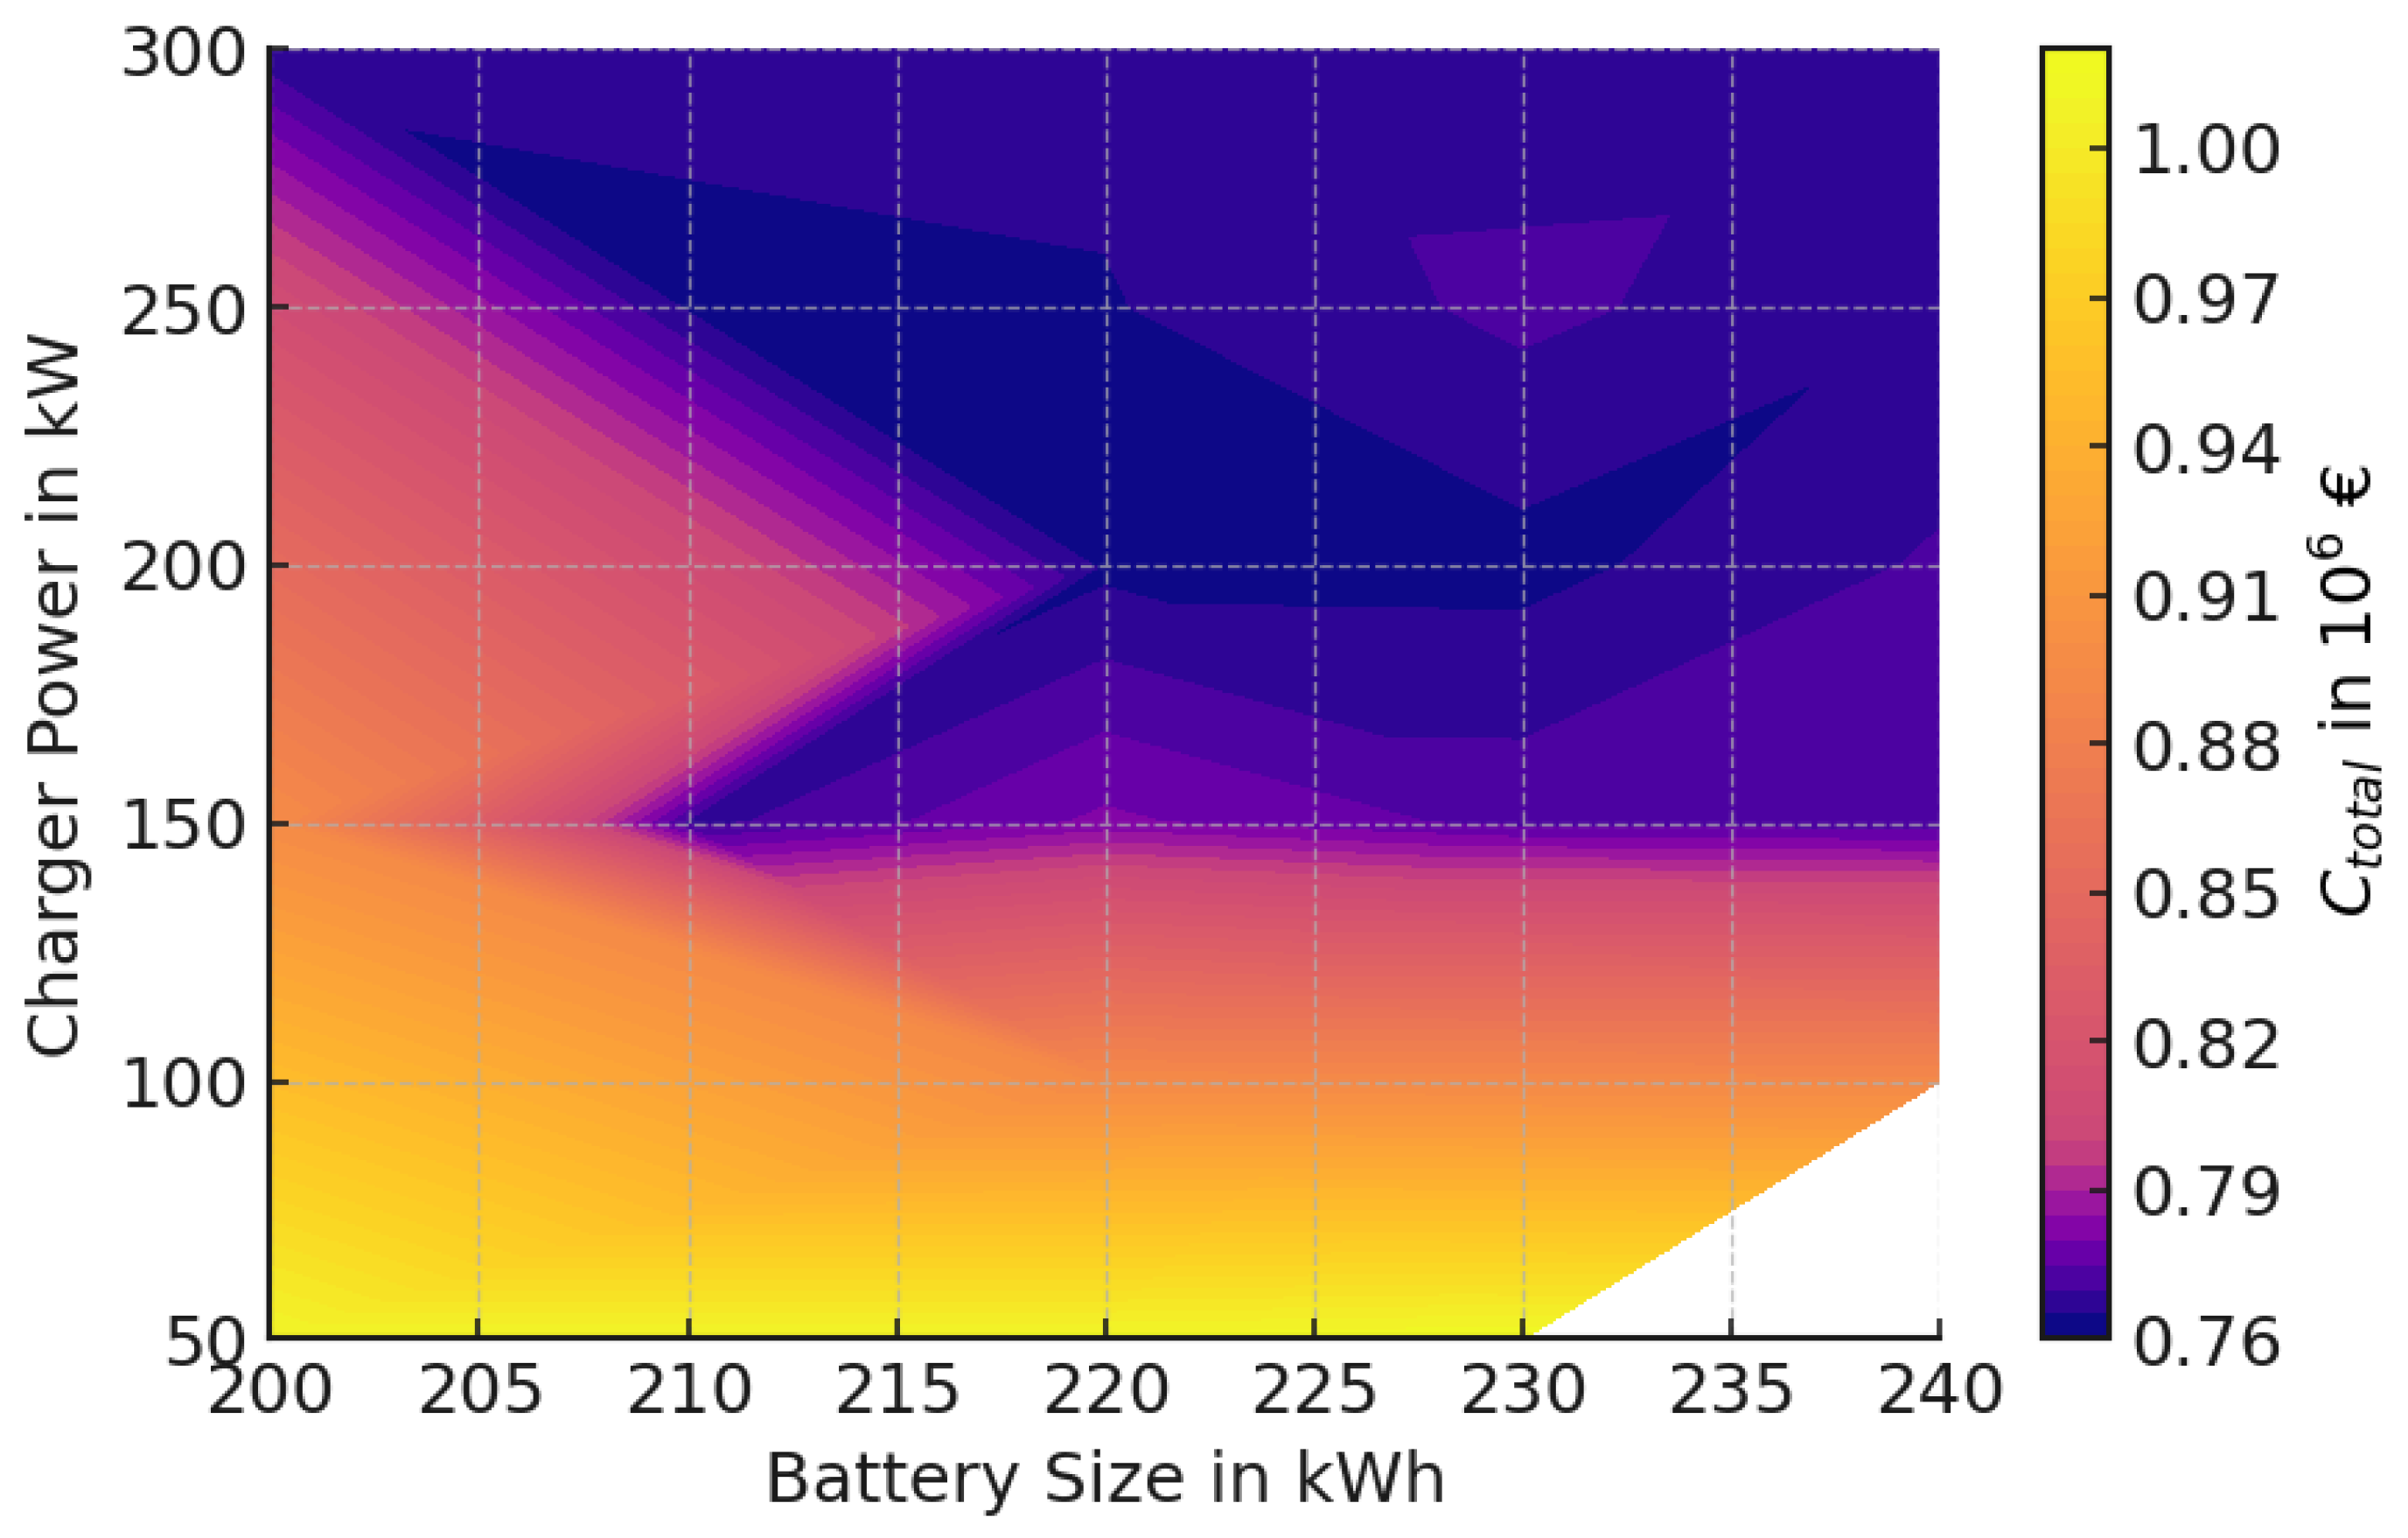
Figure 5 presents the resulting cost landscape of the total cost function in the vicinity of the optimum. Dark blue regions indicate low-cost solutions, while brighter colors correspond to higher total costs. White areas indicate parameter combinations that were either not sampled by the GA or were infeasible under schedule constraints.
Figure 5.
Total cost function as a function of battery capacity and charger power.
The results reveal a broad region of near-optimal solutions rather than a single isolated optimum. In particular, charging powers between approximately 200 and 250 kW consistently yield low total costs across a range of battery capacities. In contrast, charging powers below 150 kW result in significantly higher cost values. This can be attributed to longer charging times, which necessitate either larger battery capacities or additional chargers to maintain operational feasibility. Table 3 summarizes the most cost-effective solutions identified in this parameter range. The globally best solution that was found combines a battery capacity of 220 kWh with three chargers rated at 200 kW each. Several alternative configurations exhibit cost deviations of less than 1%, highlighting that the optimization problem admits multiple economically competitive solutions.
Table 3.
Lowest values achieved by simulating five generations with a population size of 40.
From a system perspective, the results show that cost-optimal solutions are not defined by extreme values of battery capacity or charging power, but by coordinated parameter sets that simultaneously satisfy schedule feasibility and cost constraints. The interaction among battery size, charging power, and charger count determines whether short dwell times can be utilized effectively without oversizing individual components.
4.3. Exemplary State-of-Charge Trajectory
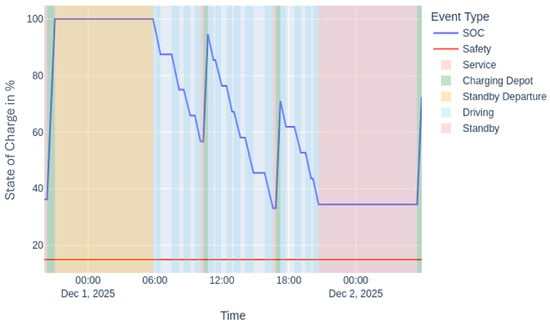
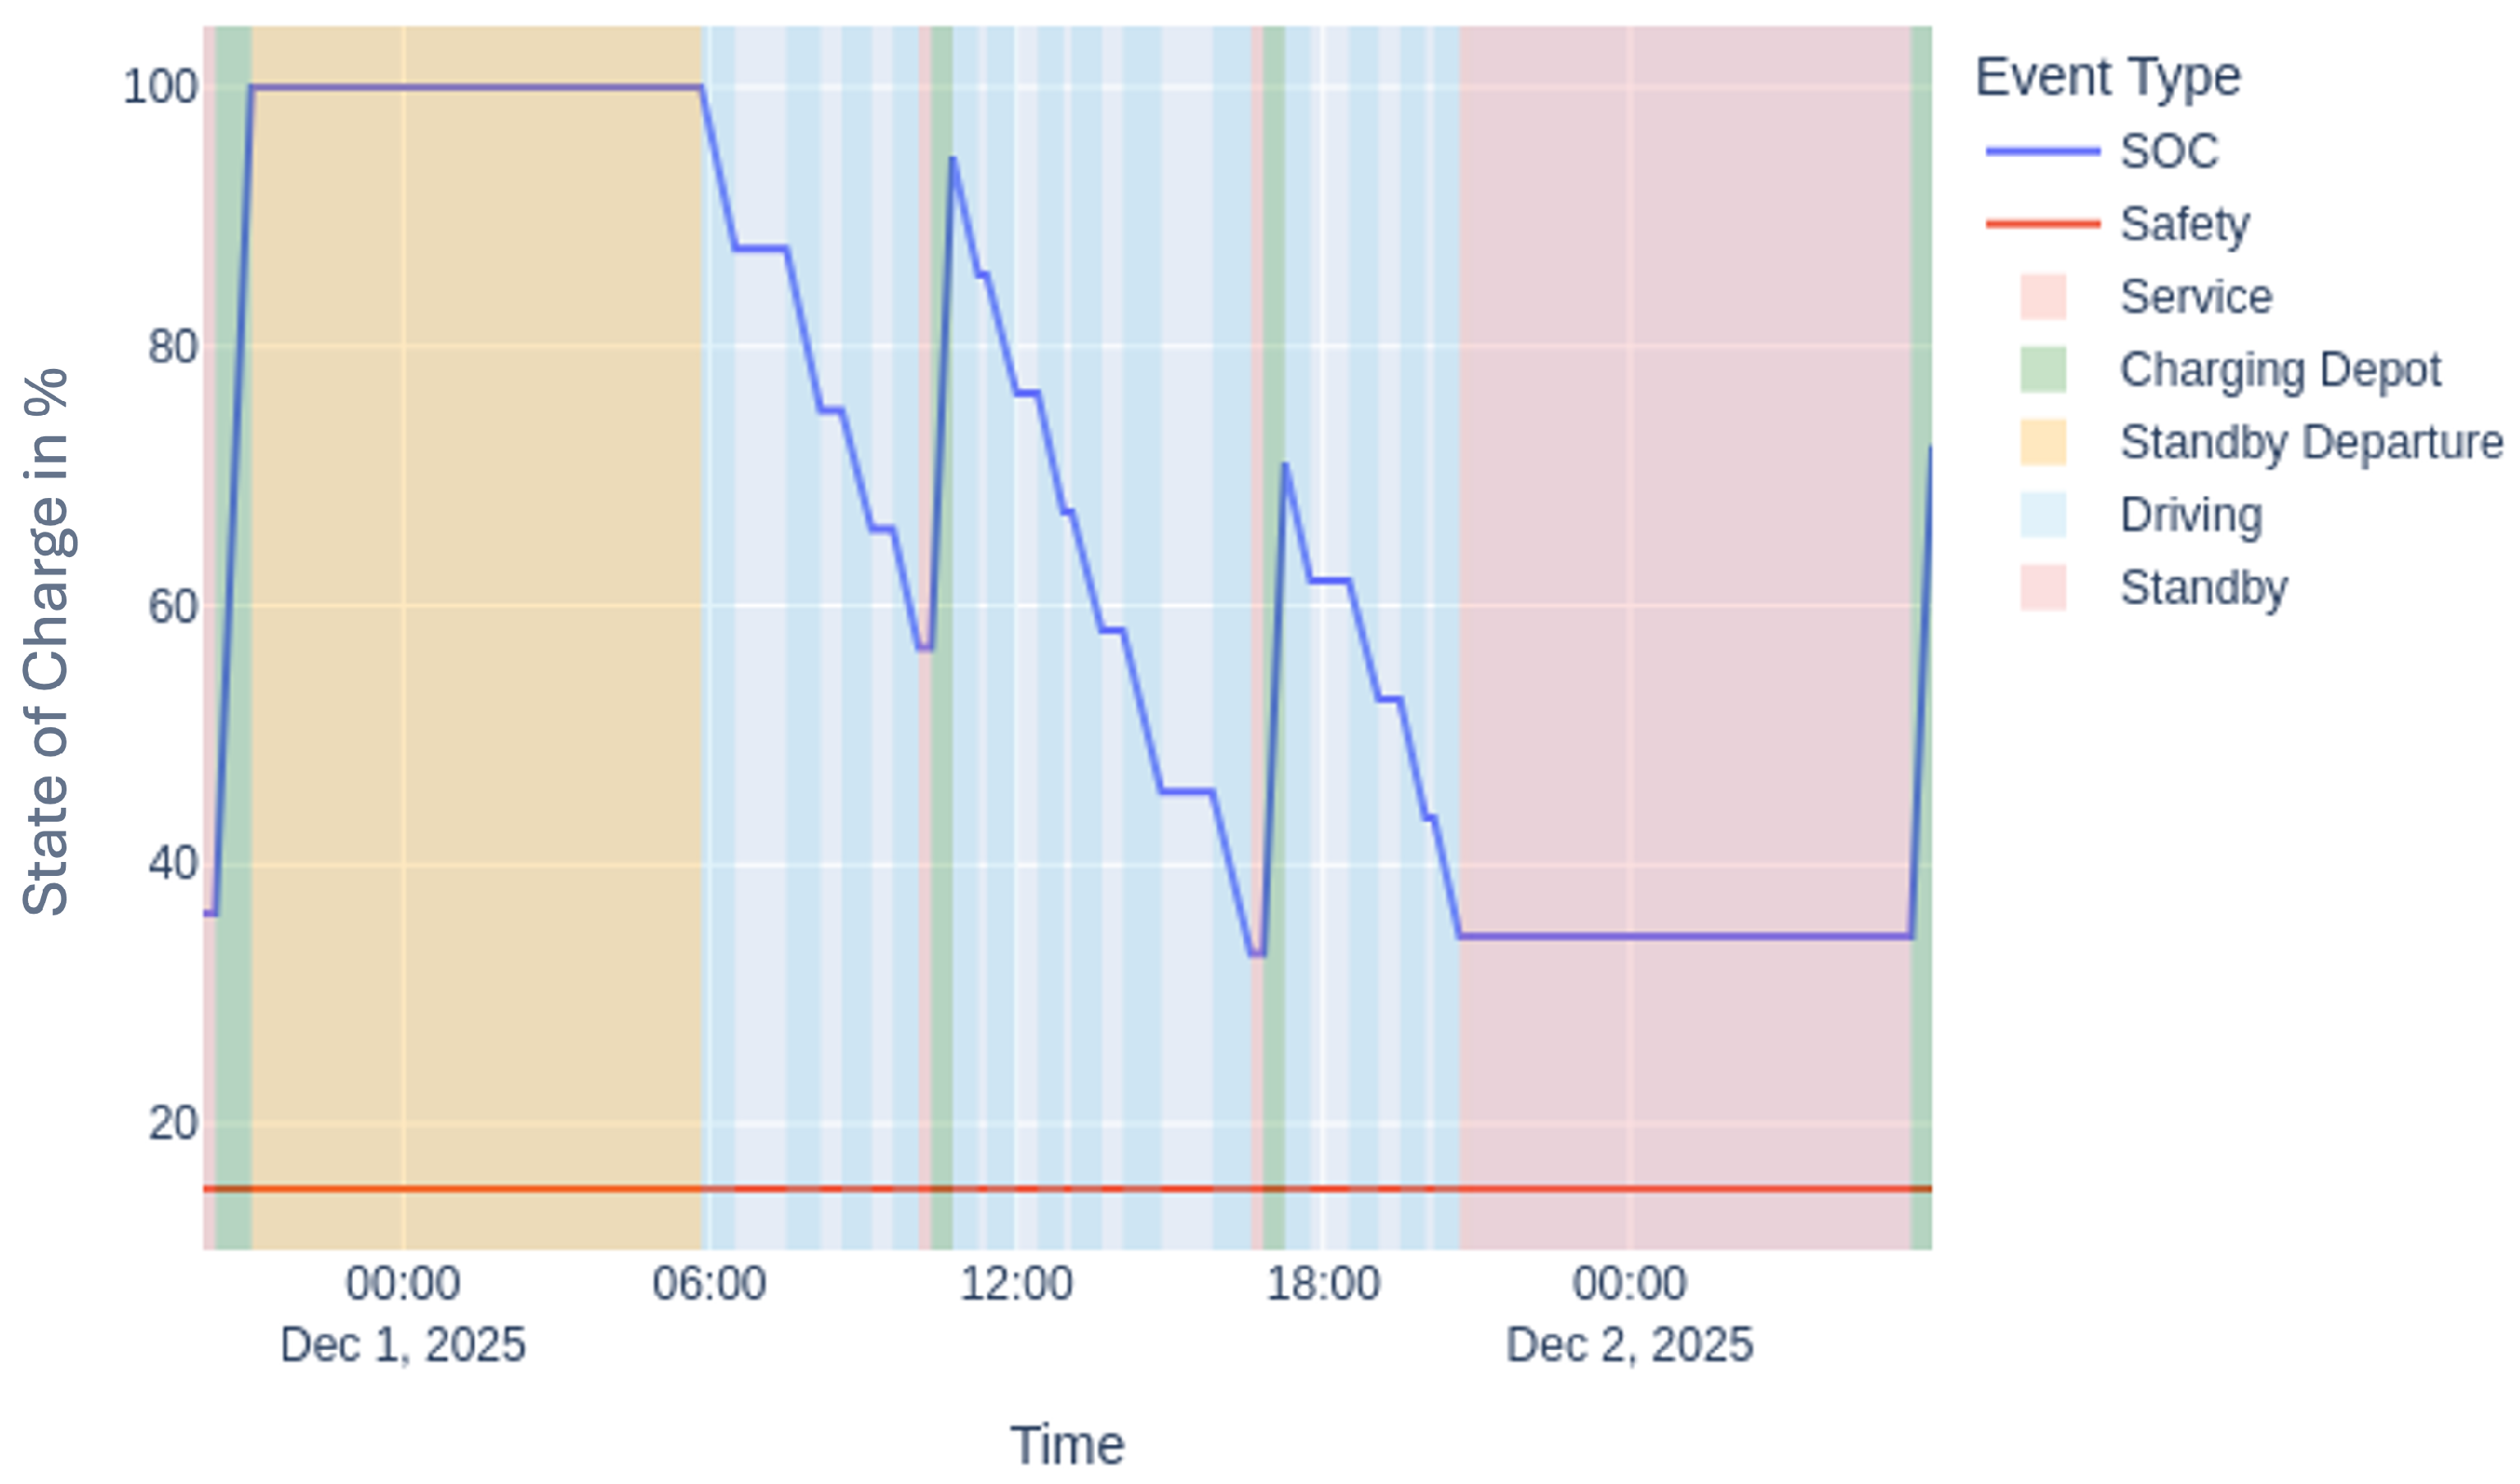
Figure 6 illustrates the state-of-charge trajectory of one representative vehicle over an exemplary day. In the eFlips framework, three days are simulated in sequence to capture inter-day charging dependencies and to avoid artificial boundary effects.
Figure 6.
Exemplary SOC trajectory for a representative vehicle (220 kWh/200 kW).
Two daytime charging events in the depot are visible, each resulting in an SOC increase of approximately 35 percentage points. These intermediate charging processes occur during scheduled breaks and are sufficient to ensure operational feasibility for the subsequent service blocks. The figure also reveals two distinct overnight charging strategies. On the left-hand side, the vehicle is fully charged in the evening and remains at 100% SOC until departure the next morning. On the right-hand side, the vehicle remains at a comparatively low SOC level overnight and is charged to full capacity shortly before morning departure. Both strategies are operationally valid and are flexibly utilized by the eFlips algorithm depending on charger availability, fleet synchronization, and depot power constraints. This illustrates that the simulation framework dynamically adapts charging timing to the overall system configuration.
4.4. Depot Power Demand and Charging Occupancy
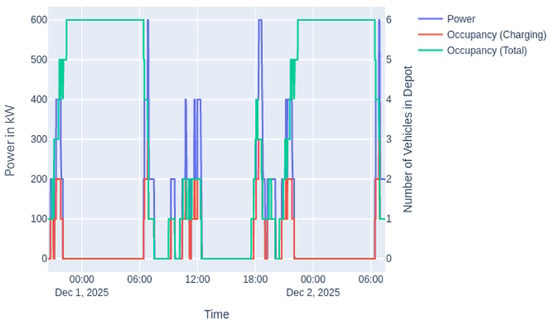
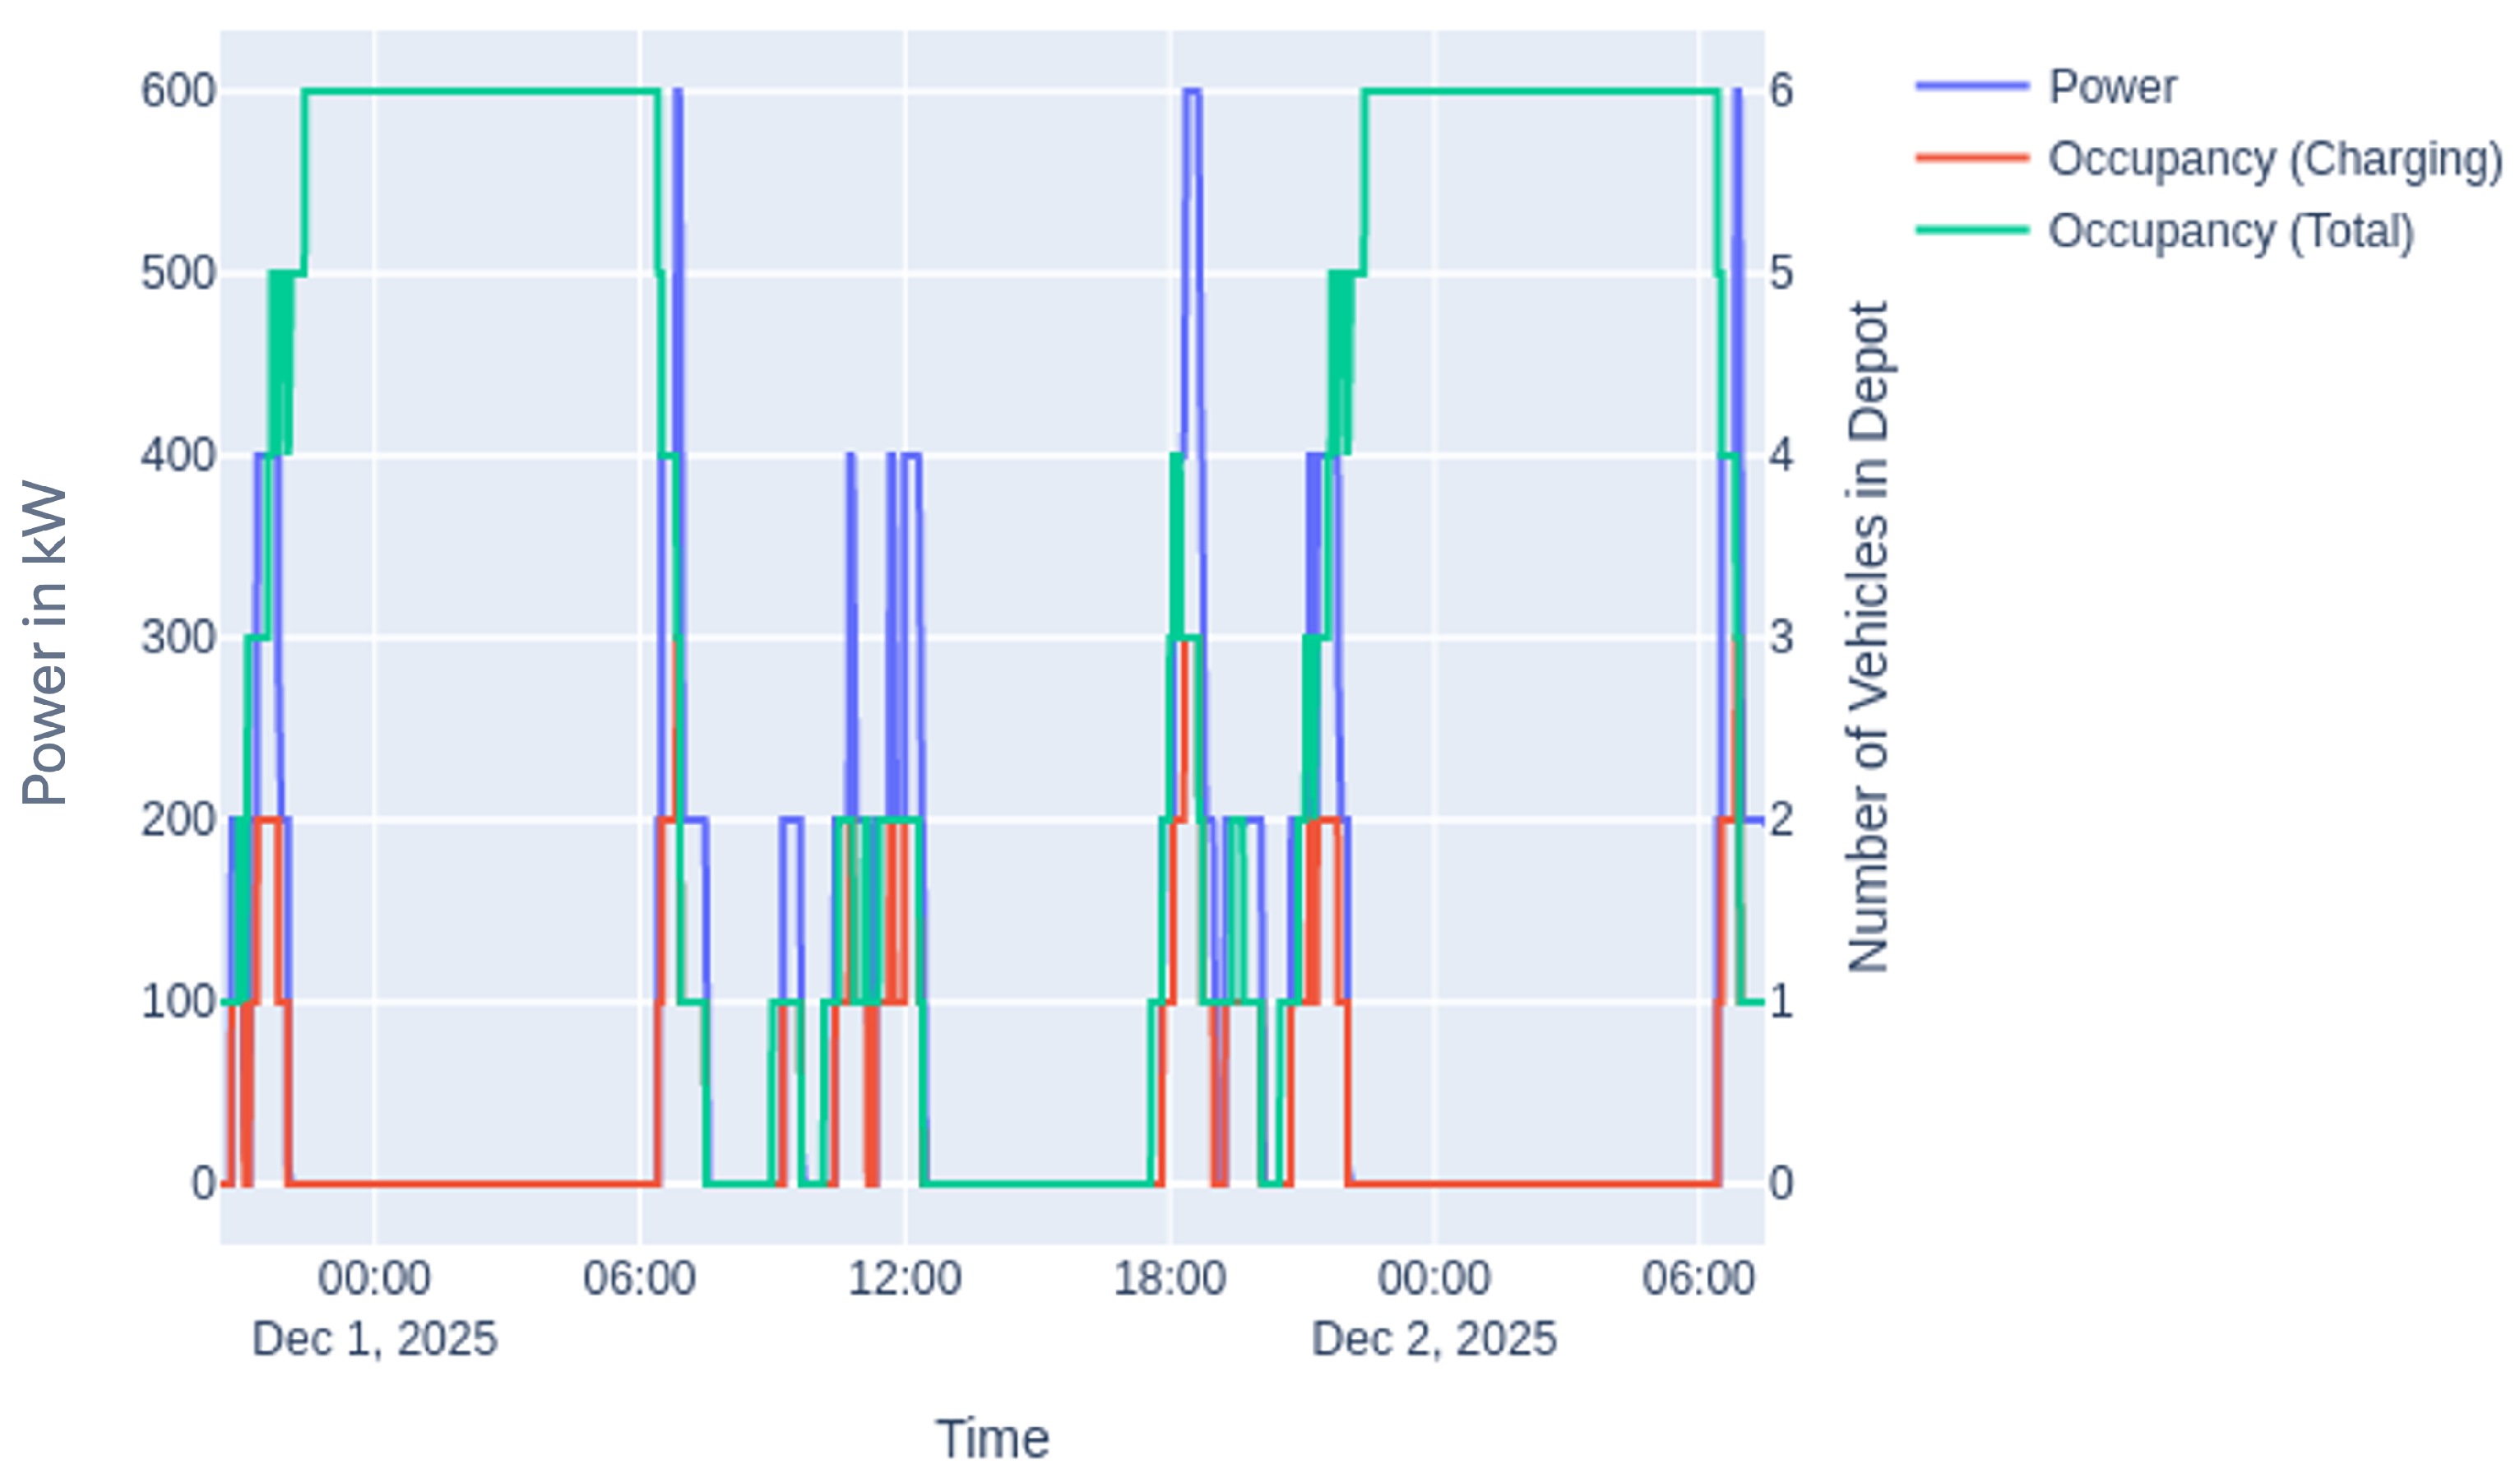
Figure 7 shows the aggregated power demand together with the number of vehicles charging and the total depot occupancy over time. Short power peaks of up to 600 kW occur when three vehicles charge simultaneously, typically around 6 a.m. and 6 p.m. These peaks are limited to short time windows and coincide with synchronized arrival or departure phases in the operational schedule.
Figure 7.
Power demand and depot occupancy.
Outside these brief intervals, charging events are temporally distributed due to the staggered trip schedules of the vehicles. As a result, simultaneous charging is generally limited to one or two vehicles, leading to moderate power levels for most of the day. This distribution effect reduces sustained parallel charging demand; however, temporary load spikes indicate that the transport task can be further optimized using smart charging and schedule optimization.
4.5. Sensitivity Analysis
To assess the robustness of the identified solutions, a sensitivity analysis with respect to the weighting factors , , and of the cost function is conducted. The weighting factors are not derived from empirical data but are deliberately chosen scenario weights that represent different company-specific priorities. In the base case, , in which the objective equals the actual summed annualized cost. The values in Table 4 are illustrative variations used to probe the robustness of the optimal configuration. The weighting factors are intentionally varied to reflect different economic perspectives: configurations with increased emphasis on infrastructure investment (), vehicle acquisition costs (), or labor costs (), respectively. This allows evaluating how changes in cost assumptions or company-specific priorities influence the resulting optimal system configuration. In practical terms, increasing favors solutions with fewer or lower-power chargers, whereas higher values of or shift the optimization towards configurations that reduce vehicle count or charging-induced downtime.
Table 4.
Lowest values for different weighting factor combinations of the genetic algorithm.
Table 4 summarizes the lowest-cost solutions for three representative weighting configurations. As expected, the absolute value of varies significantly between scenarios due to the different scaling of cost components. However, the structure of the optimal solutions remains largely consistent across all weighting cases. Battery capacities between 200 and 230 kWh combined with charging powers of 200 to 300 kW repeatedly emerge as favorable configurations, despite shifts in the relative importance of infrastructure, vehicle, and operational costs.
Overall, the sensitivity analysis indicates that the optimization results are robust against moderate changes in cost assumptions. While the weighting factors influence the relative ranking of near-optimal solutions, they do not fundamentally alter the underlying design space: small batteries combined with medium-to-high-power charging infrastructure offer the best compromise between operational feasibility and total cost for the considered depot scenario. This suggests that the identified configurations are not an artifact of a specific cost weighting, but rather reflect structurally well-balanced solutions for the considered depot scenario.
4.6. LCA Analysis of Best Solution Found
To evaluate the environmental implications of fleet electrification beyond technical and economic feasibility, a comparative LCA was conducted based on the optimized electrification scenario for the described logistics depot case (Replacing the six 40 t diesel trucks with six battery–electric trucks, each with a 220 kWh battery capacity, in combination with three 200 kW chargers). While the optimization ensures operational viability, the LCA provides a comprehensive assessment of long-term GHG impacts over the full service life of the fleet.
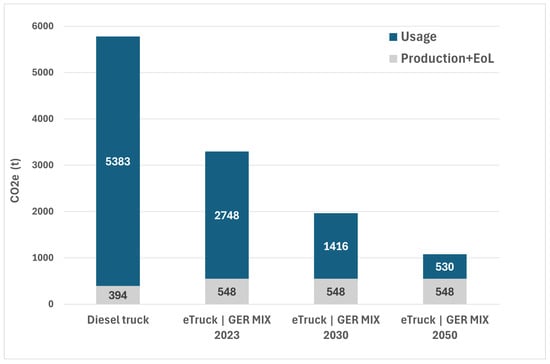
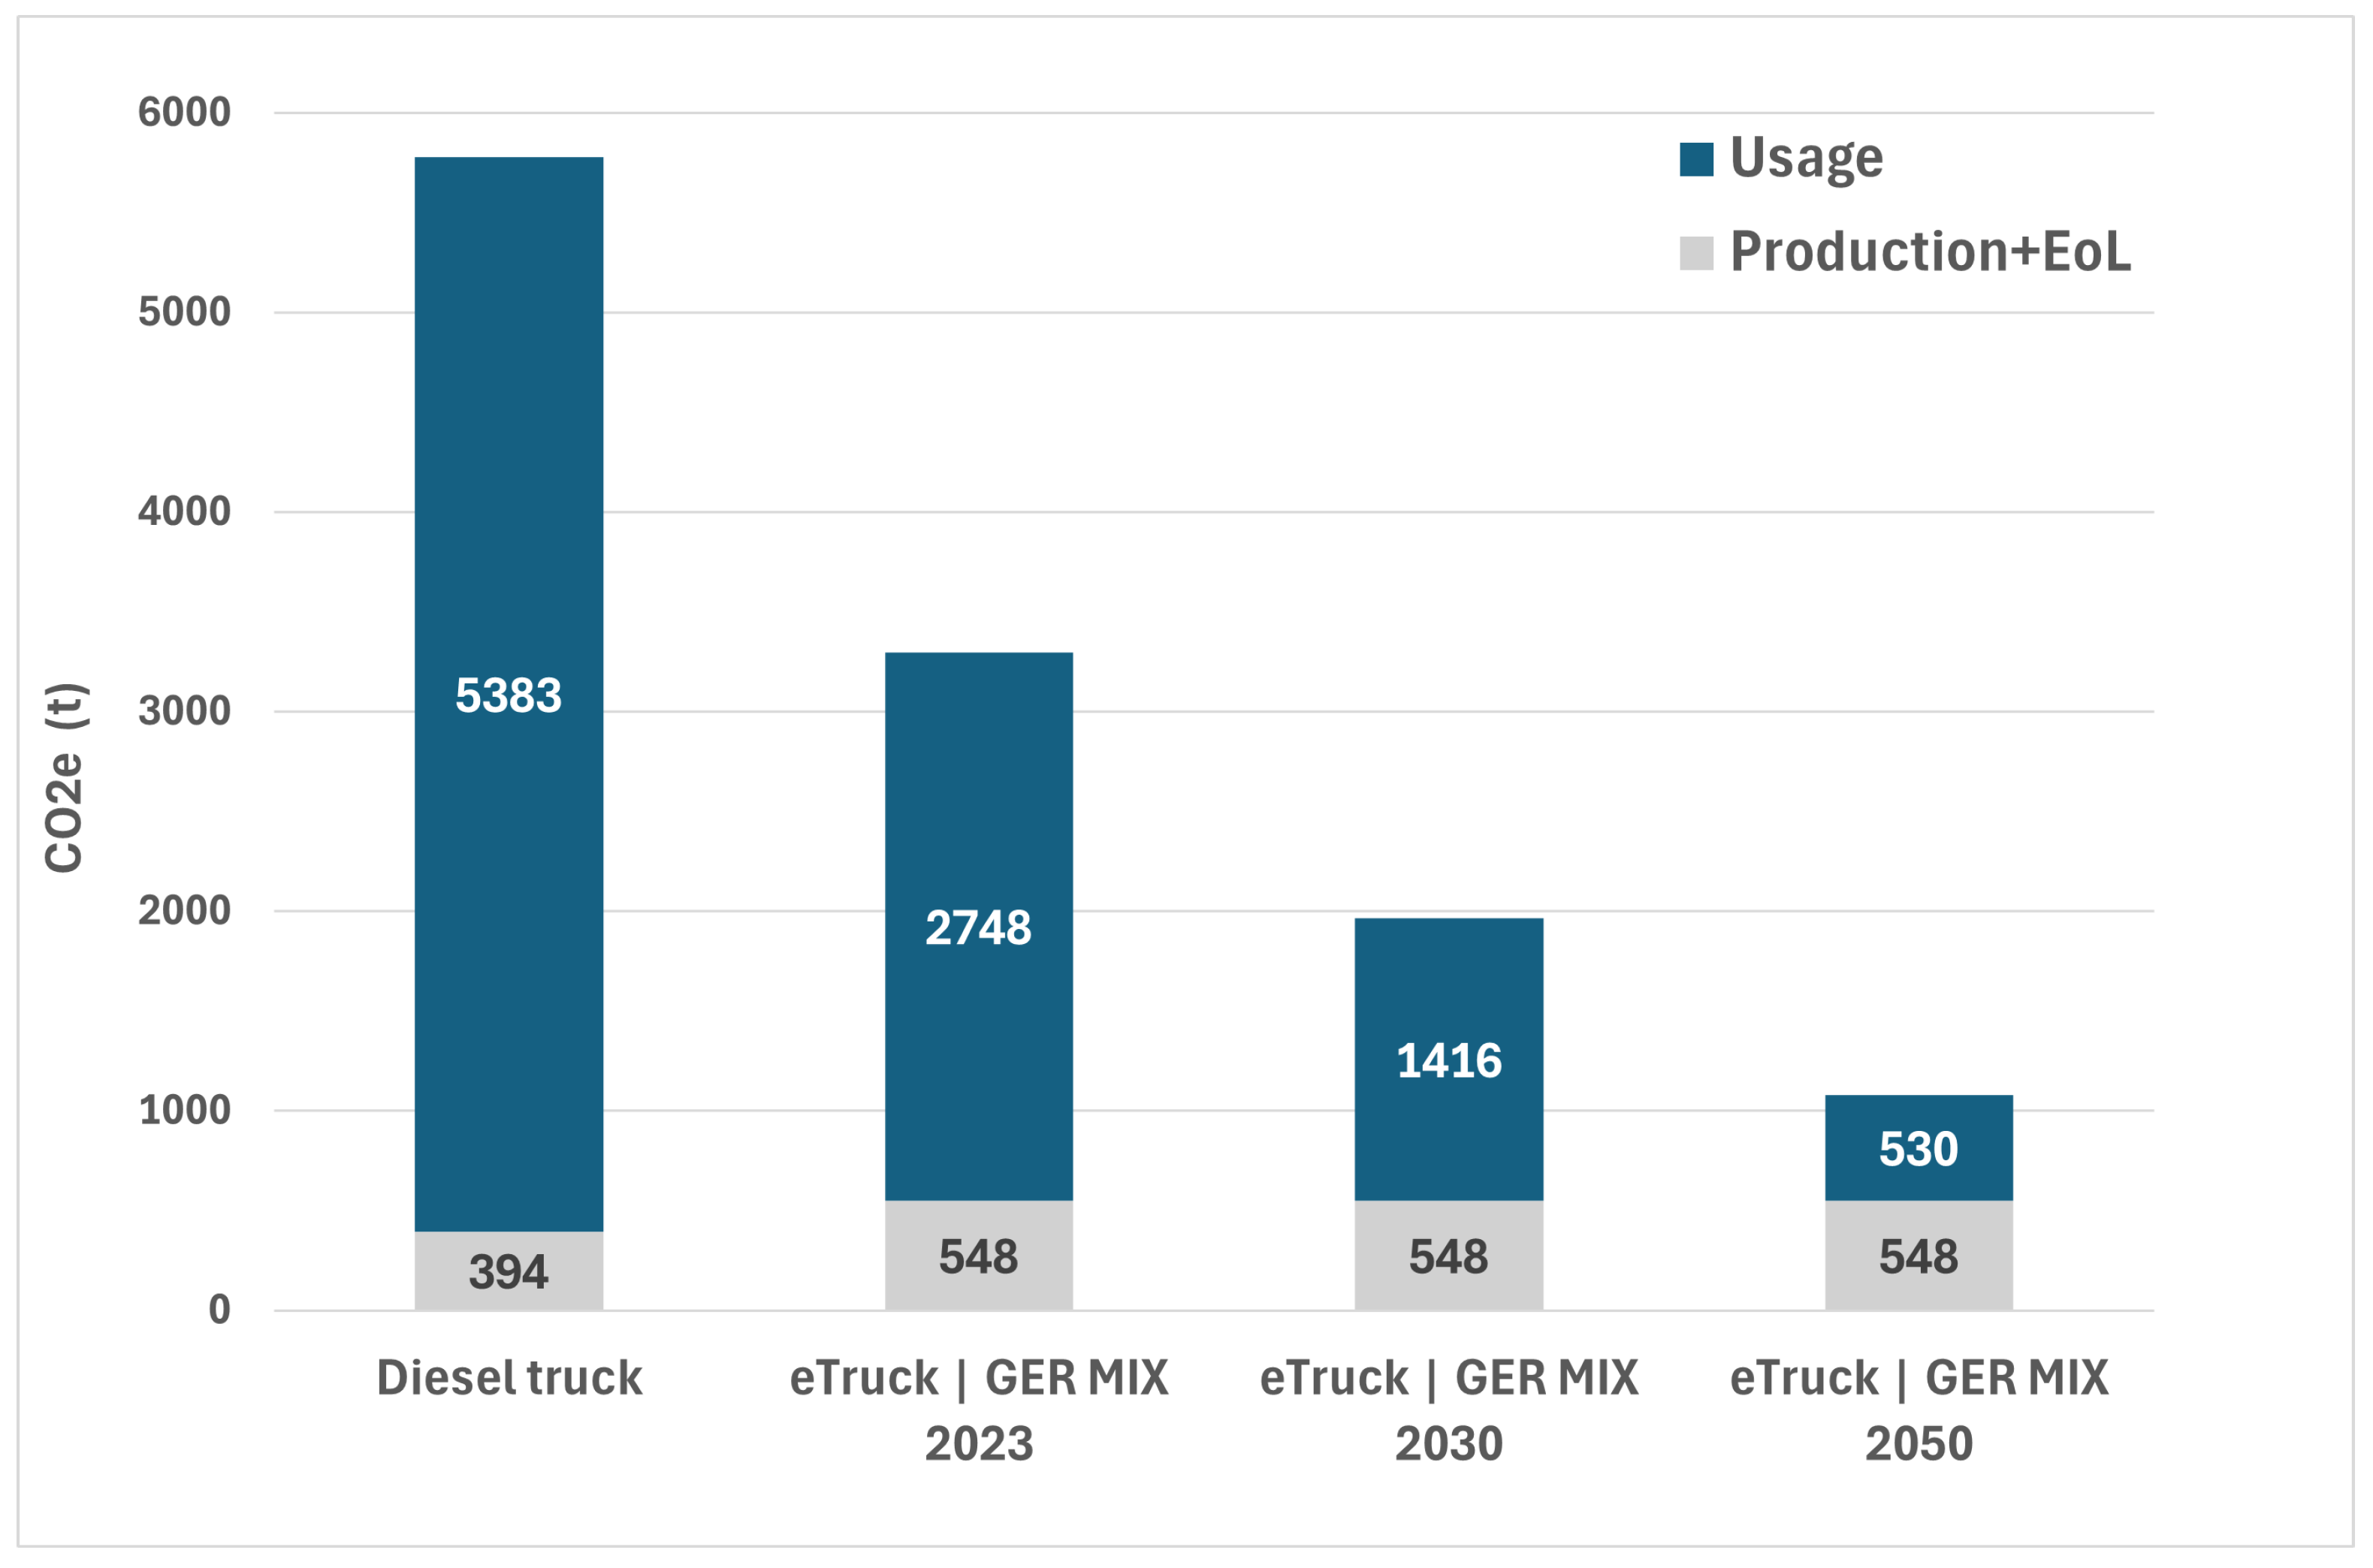
The consolidated life cycle results provide a comprehensive comparison of GHG emissions for the entire fleet over its projected service duration. As shown in Figure 8, the transition to an all-electric fleet results in a cumulative CO2e emissions reduction of approximately 53% relative to the diesel baseline when using the current electricity mix. This reduction is primarily driven by significantly lower emissions during the operational phase, which dominates total life cycle emissions for both fleet concepts.
Figure 8.
Comparison of CO2e emissions from the current diesel truck fleet and the potential e-truck fleet, including HPCs (high power chargers), based on the eFlips optimization results over the total kilometers driven during the vehicle lifetime.
Emissions associated with vehicle production and end of life account for a comparatively small share of total life cycle emissions of approximately 5% for diesel trucks and 18% for battery–electric trucks. Although the battery–electric fleet emits higher combined production and end-of-life emissions (548 t CO2e) than the diesel fleet (394 t CO2e), these additional upfront emissions are outweighed by operational savings over the full life cycle. The contribution of the charging infrastructure to total emissions is negligible, reflecting its high operational efficiency of approximately 95%.
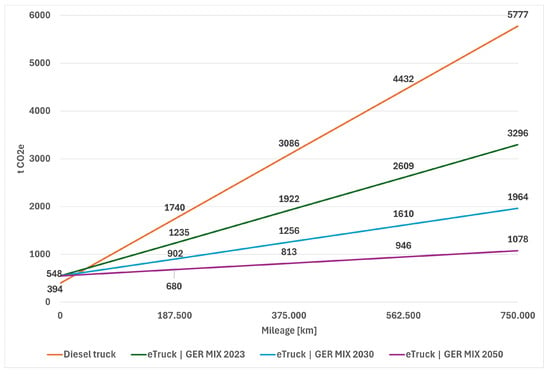
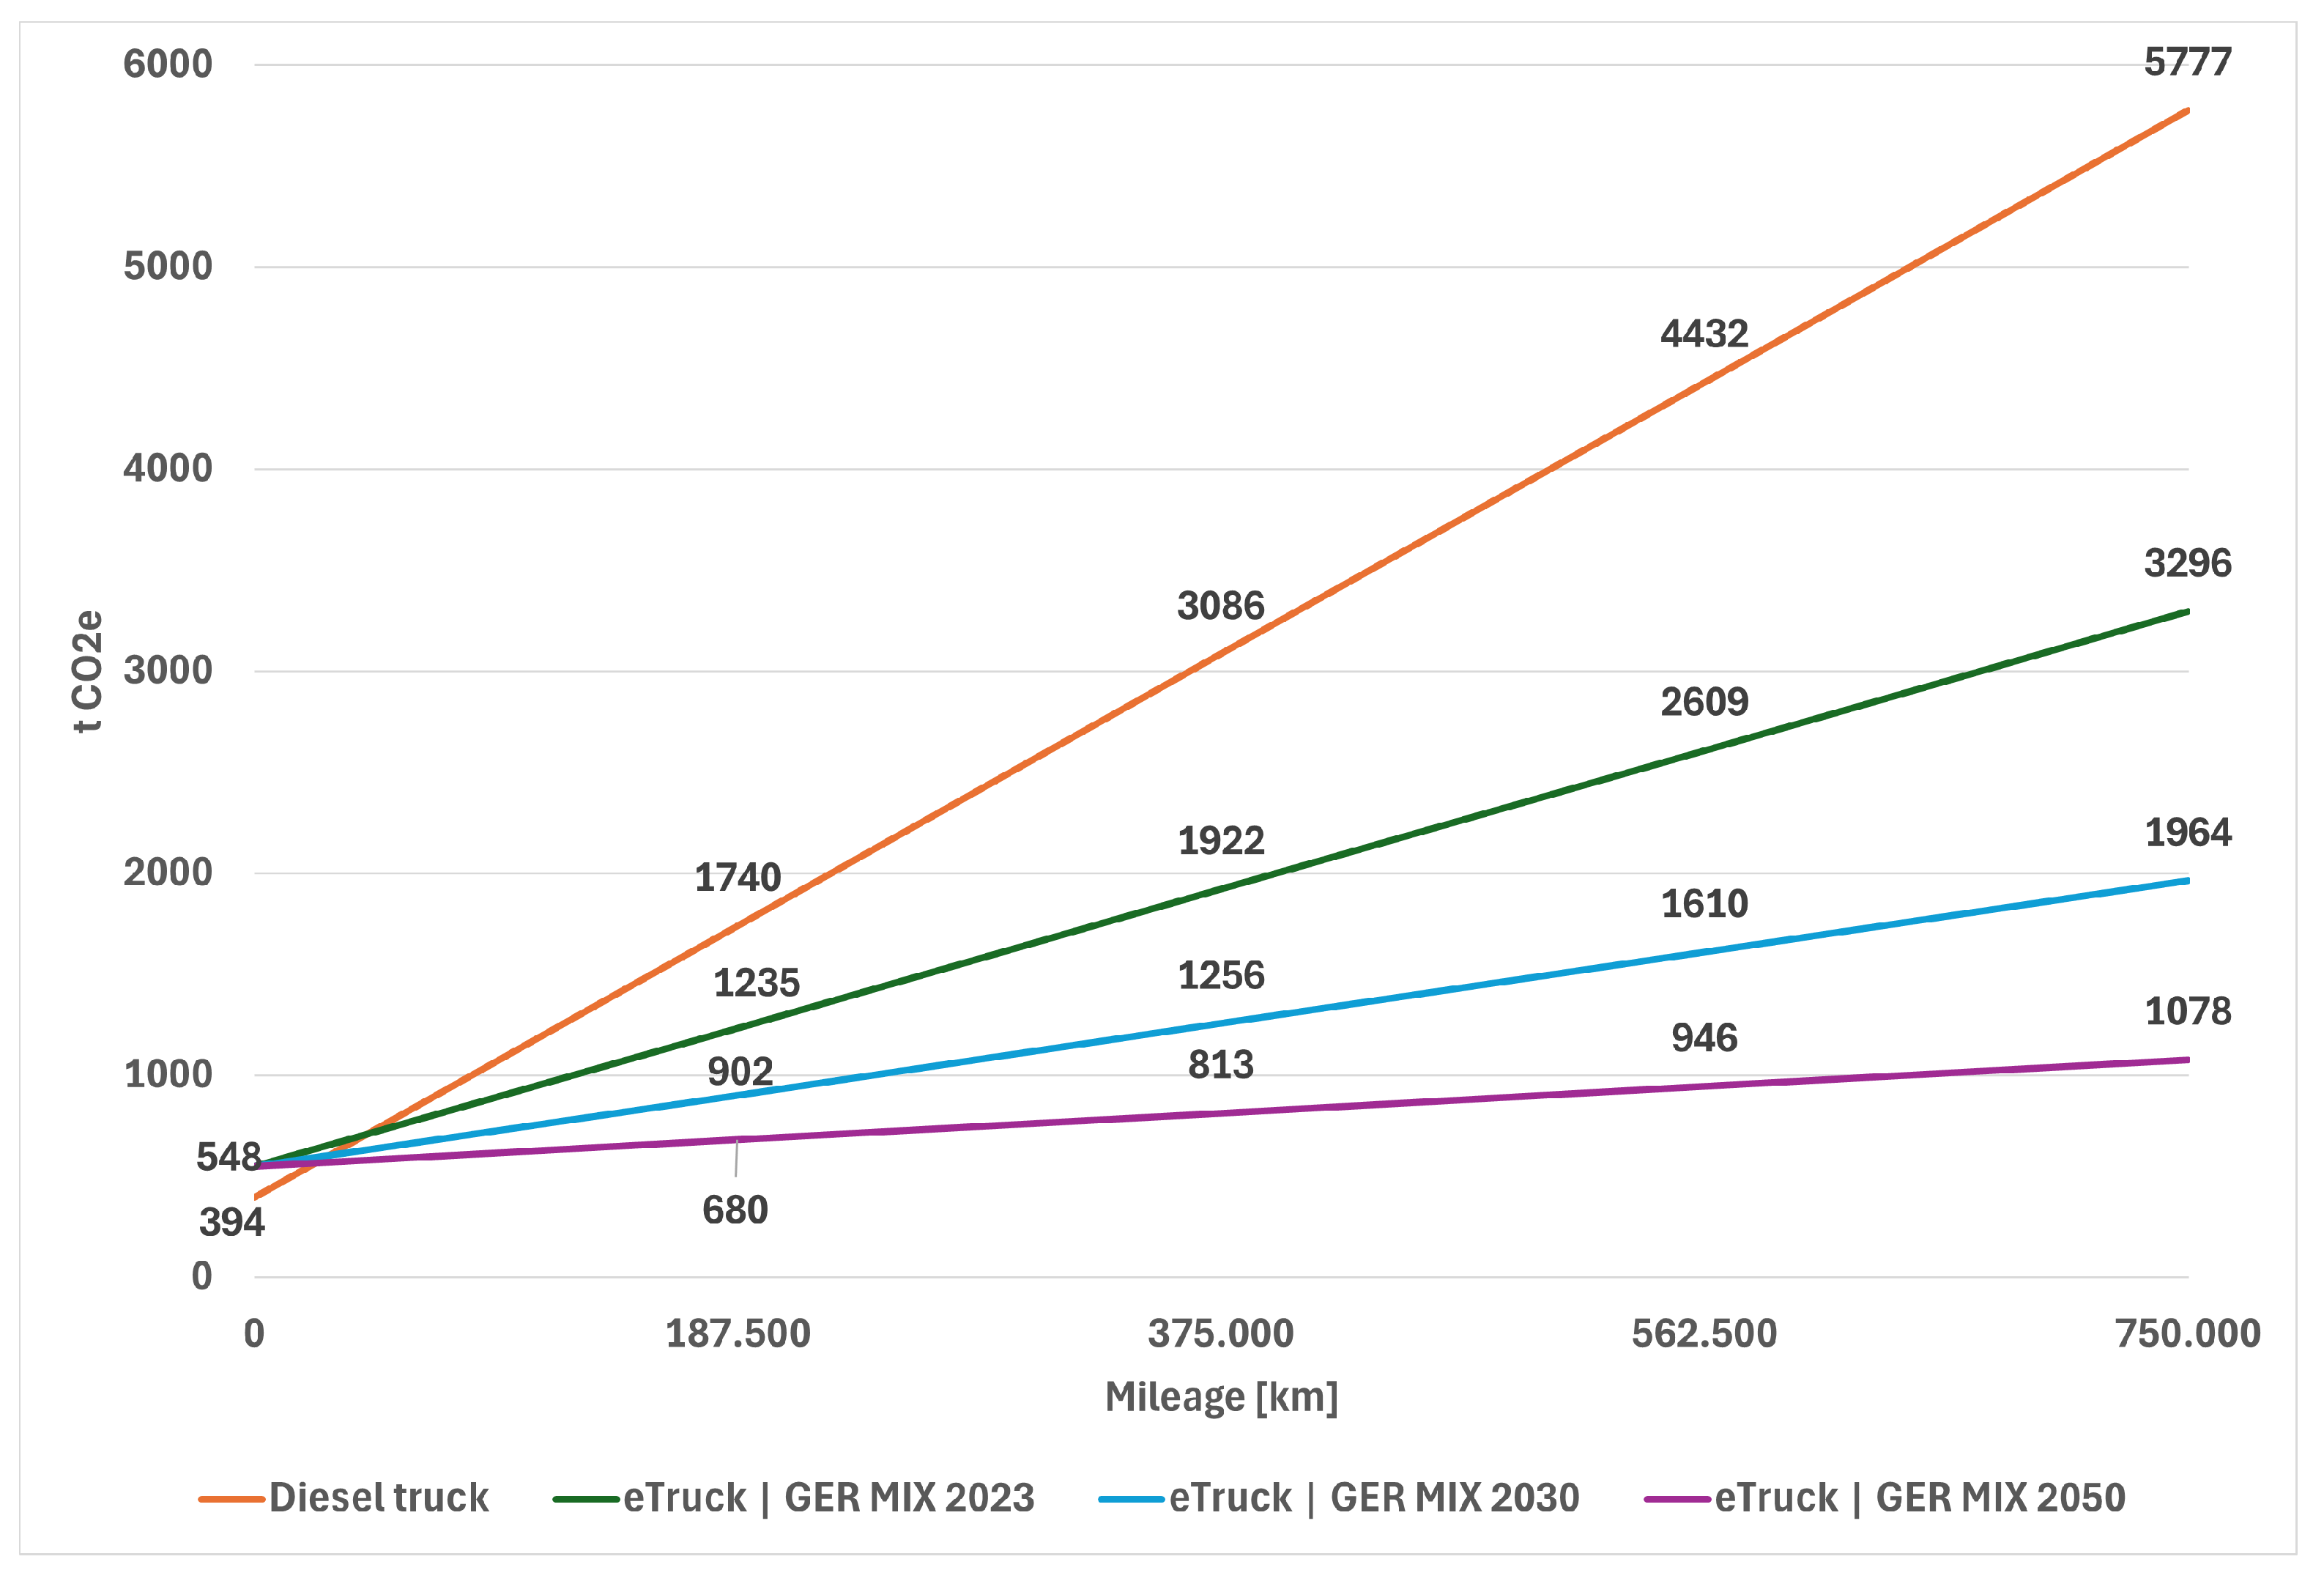
Figure 9 shows the cumulative CO2e emissions of diesel and battery–electric trucks over their entire service life as a function of distance traveled. In the application analyzed, each truck travels approximately 300 km per day and approximately 75,000 km per year. Under these operating conditions, battery electric trucks achieve a clear environmental advantage after just a few tens of thousands of kilometers driven. Even if the trucks were operated with a lower annual mileage during their service life, the additional production-related emissions would still be quickly offset by the lower operating emissions.
Figure 9.
Comparison of CO2e emissions from the current diesel truck fleet and the potential e-truck fleet, including HPCs, based on the eFlips optimization results over the total kilometers driven during the vehicle lifetime.
Overall, the LCA results show that the electrification of the fleet at the depot would lead to significant and reliable long-term greenhouse gas reductions.
5. Discussion
5.1. Reflection and Contextualization of Results
The optimization results for the depot indicate that technically feasible electrification can be achieved with a range of parameter combinations, and that economically competitive solutions form a solution matrix rather than a single isolated design point. Across the explored parameter space, the most cost-effective configurations repeatedly combine small battery capacities (approximately 200–230 kWh) with depot DC charging powers in the range of roughly 200–300 kW and several charging points, while maintaining schedule feasibility in the simulation. This near-optimal region is relevant from a planning perspective because it implies implementation flexibility: if a specific charging power level or charger count cannot be realized due to site constraints, alternative configurations exist with low deviations regarding the proposed cost function.
It should be noted that this study is based on a single, in-depth case study. The specific numerical optimum—battery capacity, charging power, and charger count—is therefore case-specific and should not be generalized directly. The underlying methodological framework and the qualitative findings, in particular the existence of a broad near-optimal solution region and the strong coupling between battery capacity, charging power, and charger count, are, however, transferable to other fixed-schedule regional logistics depots that share the operational characteristics described in Section 2. Inductive generalization to the wider population of logistics sites would require applying the framework to a larger and more diverse sample of depots.
When comparing these findings to closely related studies, two aspects stand out. First, studies suggest that for a large share of freight operations, depot charging at relatively low charging power can already cover most energy demand, because vehicles have long parking times at depots. For example, Speth et al. simulate 2410 representative German truck driving profiles and report that most charging events require only low charging power (night charging predominantly at ≤44 kW, with higher power mainly required for a smaller subset of vehicles during the day), while megawatt charging becomes relevant primarily for long-haul use cases [21]. Nevertheless, our study suggests that there are relevant use cases besides long-haul operations that will require charging powers significantly above 44 kW to enable the most cost-efficient configurations.
Second, and more specifically, the present study differs from these contributions in its optimization perspective. Speth et al. focus on identifying the lowest required charging power for large-scale driving profiles under assumed range and charging availability scenarios, i.e., an infrastructure-centric requirement analysis [21]. Scherrer et al. focus on empirically eliciting company requirements and barriers via survey and interviews, rather than algorithmically co-optimizing vehicle–infrastructure portfolios [22]. By contrast, the approach presented in this study explicitly treats vehicle battery capacity, charger power, and charger count as coupled decision variables, and evaluates them under schedule feasibility constraints with a unified cost objective. This multi-parameter optimization reveals interactions that scenario-based or single-dimension requirement studies cannot quantify directly: for instance, low charging power may be technically sufficient in general, but it can become economically dominated in tightly scheduled operations if it increases the need for additional chargers or larger batteries to maintain feasibility.
5.2. Critical Discussion of the Method and Cost Function
While the genetic algorithm converges quickly and yields stable near-optimal regions in the presented case study, the interpretation of results must be tied to the assumptions embedded in the cost function. The objective aggregates annualized infrastructure costs, annualized vehicle costs, and annual labor-related operating costs into a single metric. This is a pragmatic formulation for comparing configurations, but it implies two limitations that matter for real-world decision-making.
First, the infrastructure cost component is modeled as a charger cost regression primarily dependent on charger power. In practice, the total cost of depot charging infrastructure is also influenced by site-specific grid connection requirements, the availability of medium-voltage capacity, and the lead time and cost of grid reinforcement. The Fraunhofer ISI/Öko-Institut depot-charging report explicitly emphasizes that locally available grid capacity varies strongly and that grid connection for depot charging can take several years; it also notes that costs for grid connection depend on local conditions and can be substantial, especially for the first connection to a new grid node [23]. Scherrer et al. similarly identify the lack of medium-voltage connections for fast charging at home depots as a key challenge for logistics companies [22]. Because such effects are not explicitly represented in the current cost function, the model may underestimate the economic penalty of high simultaneous peak power in cases where grid upgrades are required.
Second, the cost function focuses on CAPEX-related terms and labor cost, but does not explicitly include electricity prices or demand charges. Vehicle and charger maintenance are likewise not represented in the objective. Because the fixed schedule requires the same six vehicles across all feasible configurations, vehicle maintenance does not affect their relative ranking, and the only configuration-dependent contribution, stemming from the number of chargers, is assumed to be small compared with the dominant acquisition costs. The depot-charging report highlights that total costs depend on electricity price structures and network charges and that smart charging can become important when grid availability is limited [23]. In particular, the short simultaneous charging peaks observed in the case study (up to approximately 600 kW, Figure 7) affect not only the required grid-connection capacity but also the peak-load-based demand charges of German electricity contracts. Peak loads, therefore, influence operating expenditure and not only capital expenditure. The absence of these terms in the objective does not invalidate the optimization, but it changes what “optimal” means: the GA identifies solutions optimal under the assumed cost structure, not necessarily under a full total-cost-of-ownership model. Moreover, the cost model used to identify the cost-optimal vehicle and infrastructure configuration does not account for tax-specific depreciation schedules or for residual and resale values. These factors would be relevant for a full total-cost-of-ownership comparison with a conventional diesel fleet, which was not the goal of this study.
A further practical asymmetry concerns scalability. A diesel fleet can be scaled almost continuously by adding or removing individual vehicles at low marginal effort. In contrast, scaling a battery–electric fleet is subject to integer constraints on the number of chargers, stepwise increments of fixed infrastructure cost, and grid-connection capacities that can only be adjusted with considerable lead time. This asymmetry implies that charging infrastructure for electric trucks must be planned more proactively than for a comparable diesel operation. Rather than dimensioning the grid connection and depot infrastructure for the present fleet only, the expected future growth of the electric truck fleet should already be anticipated at the planning stage. In practice, a newly installed grid connection should therefore be specified with sufficient capacity reserve to accommodate later fleet expansion, thereby avoiding costly and time-consuming grid reinforcement or re-connection at a later point. Where a larger grid connection is not feasible, alternative measures to limit the peak grid demand should be explored, for instance, the use of stationary battery storage to buffer charging peaks (peak shaving) or smart charging strategies that distribute charging events over time.
5.3. Market Realism: Battery Sizes and the “Optimum Gap”
A key practical constraint for implementing the mathematically optimal solutions identified is that commercially available heavy-duty battery–electric trucks in the 40 t class typically offer battery capacities that are substantially larger than the 200–230 kWh region identified as cost-optimal in this model.
For example, Volvo specifies the FH Electric with a battery capacity of 360–540 kWh [24]. MAN specifies the eTGX with an installed battery capacity of up to approximately 534 kWh and CCS2 charging capability in the high-power range [25]. At the fleet-market level, ICCT reports that for heavy tractor-trailers used in EU goods transport use cases, the average battery size decreased from 592 kWh in 2024 to 532 kWh in 2025 [26]. This evidence supports the conclusion that the cost-optimal battery sizes found by the present model are currently below typical market offerings for 40 t electric trucks.
This “optimum gap” has two implications. First, procurement decisions are discrete: depots cannot buy a 220 kWh 40 t truck if no such product exists. Second, larger real-world batteries can relax charging-power requirements. A vehicle with 400–600 kWh installed capacity offers more energy buffer for winter conditions and schedule disturbances, and therefore may technically allow lower depot charging power while still meeting the schedule. However, within the cost function used in this paper, such a shift is not necessarily optimal, because the vehicle-cost term increases with battery capacity. Consequently, real market vehicles may move the solution away from the modeled optimum in terms of , even if they reduce infrastructure requirements. This should be interpreted as a limitation of current market offerings relative to an unconstrained design optimum, not as a contradiction of the simulation results.
5.4. Integration of Techno-Economic and Environmental Performance
The combined analysis of finding viable solutions and performing an LCA demonstrates that the economically optimized configuration also achieves substantial environmental benefits over its lifecycle. Although battery–electric trucks exhibit higher manufacturing emissions due to battery production, the operational-phase emission reductions dominate over the assumed 10-year lifetime.
For the particular case, the cost-optimal configuration (220 kWh, three 200 kW chargers) not only satisfies schedule feasibility but also yields substantial lifecycle GHG reductions, indicating that operationally robust depot electrification can align cost and climate objectives for regional duty cycles. This finding reinforces that depot-based electrification in regional logistics is not only technically feasible and economically viable under realistic assumptions, but also environmentally advantageous in the medium term. Importantly, the LCA results indicate that even under conservative electricity-mix assumptions, cumulative emission parity with diesel vehicles is reached within a few years of operation.
However, similar to the cost model, the LCA results depend on assumptions regarding electricity emission factors and vehicle lifetime. In particular, battery degradation over the service life is not modeled explicitly. A pronounced capacity fade could require a battery replacement within the assumed ten-year lifetime, which would increase both production-related emissions and costs. As all feasible configurations operate at a comparable daily mileage and energy throughput, degradation is expected to affect them similarly and is therefore of secondary importance for the configuration comparison, although it is relevant for the absolute lifetime assessment. Future integration of dynamic electricity scenarios, battery aging, and battery second-life considerations could further refine the environmental assessment, as reusing batteries after their first vehicle life would allow the production-related emissions to be allocated across multiple use phases and thereby lower the production-phase burden attributed to the fleet.
5.5. Actionable Recommendation for the Logistics Depot
A practical deployment strategy for the studied case of BLG should therefore combine the optimization insights (coordination of charging power and charger count under schedule constraints) with market-available vehicle platforms and site constraints. In summary, the recommended pathway is: (i) procure an available 40 t BEV platform such as Volvo FH Electric, MAN eTGX or Mercedes-Benz eActros 600 (or an equivalent vehicle in the same battery-size class), (ii) implement a multi-charger depot concept with at least three charging points and power allocation consistent with the schedule, and (iii) conduct an early grid feasibility and connection-lead-time assessment, as grid availability is repeatedly identified as a major real-world constraint for depot-based electrification in Germany [22,23].
6. Conclusions and Outlook
This paper presented a simulation-based genetic algorithm framework to co-optimize battery capacity, depot charging infrastructure, and fleet requirements for electrifying a fixed-schedule regional logistics depot. For the investigated case (six 40 t trucks, each operating on a fixed schedule of approximately 300 km per truck per day), the optimization converged reliably and identified a near-optimal region with small battery capacities and medium depot DC charging powers. The best solution found combined a 220 kWh battery with three 200 kW chargers, while several alternative configurations remained within less than 1% cost deviation, indicating practical flexibility in implementation.
By integrating a life cycle assessment of the optimized scenario, the analysis further shows that depot electrification yields significant greenhouse gas reductions over the vehicle lifetime, despite higher manufacturing emissions of battery–electric trucks. The combined techno-economic and environmental evaluation highlights that regional depot-centered electrification can simultaneously achieve operational feasibility, economic viability, and substantial climate benefits. From a practitioner perspective, however, realizing these benefits in practice hinges on the timely availability of a sufficient grid connection, which is repeatedly found to be the main real-world bottleneck for depot-based electrification. An early grid feasibility and connection-lead-time assessment is therefore recommended as a key first step.
The discussion highlighted that these results represent an unconstrained techno-economic optimum under the used cost function and schedule-feasibility assumptions, whereas real vehicle procurement is restricted to discrete market offerings that typically feature larger battery capacities. Future research should integrate discrete market vehicle options, site-specific grid constraints, dynamic electricity pricing, and evolving electricity emission factors into a unified optimization framework. Among these, restricting the battery-capacity search space to commercially available vehicle platforms is the most tractable next step, as the required data can be drawn directly from manufacturer specifications and existing real-world fleet datasets. Incorporating site-specific grid-connection constraints and dynamic electricity pricing constitutes a second stage that depends on utility-specific grid and tariff data, whereas updated electricity emission factors can be taken from established scenario projections. Pursued together, these extensions would further increase practical decision support for logistics operators. Overall, the proposed approach provides a methodology framework for depot-centric logistics operations and supports decision-making for the phased transition towards battery–electric heavy-duty fleets.
Author Contributions
Conceptualization, A.G. and L.D.; methodology, L.D. and A.G.; software, L.D.; validation, L.D., A.G., M.G. and M.H.; formal analysis, L.D., M.H. and V.L.; investigation, L.D., M.H. and V.L.; data curation, L.D.; resources, M.G. and M.H.; writing—original draft preparation, L.D.; writing—review and editing, A.G., M.G., M.H., V.L., D.F. and D.G.; visualization, L.D. and M.H.; supervision, D.G.; project administration, A.G. and D.G. All authors have read and agreed to the published version of the manuscript.
Funding
This research was funded by the Federal Ministry of Research, Technology and Space of the Federal Republic of Germany as part of the Research Campus Mobility2Grid [www.mobility2grid.de (accessed on 10 March 2026)], funding code: 03SF0674A.
Institutional Review Board Statement
Not applicable.
Informed Consent Statement
Not applicable.
Data Availability Statement
Used software is available at https://github.com/mpm-tu-berlin/eflips-depot (accessed on 15 June 2026). The data that support the findings of this study are property of BLG Logistics Group and are subject to commercial confidentiality. Consequently, the data are not publicly available. Interested researchers may contact the authors or BLG directly for further information regarding the conditions of data access.
Acknowledgments
ChatGPT-5 was used to improve the language and formatting of text and figures. The content of our research remains unaffected by this.
Conflicts of Interest
Author Michael Görges was employed by BLG Logistics Group AG & Co. KG. Author Marius Held and Volkmar Lüthen were employed by Siemens AG. The remaining authors declare that the research was conducted in the absence of any commercial or financial relationships that could be construed as a potential conflict of interest. The authors declare that this study received funding from [Federal Ministry of Research, Technology and Space of the Federal Republic of Germany]. The funding sponsors had no role in the design of the study; in the collection, analyses, or interpretation of data; in the writing of the manuscript; or in the decision to publish the results.
Abbreviations
The following abbreviations are used in this manuscript:
| AFIR | Alternative Fuels Infrastructure Regulation |
| BET | Battery–Electric Truck |
| BEV | Battery–Electric Vehicle |
| CAPEX | Capital Expenditure |
| CCS | Combined Charging System |
| CO2 | Carbon Dioxide |
| CO2e | Carbon Dioxide Equivalent |
| DC | Direct Current |
| EU | European Union |
| EVRP | Electric Vehicle Routing Problem |
| GA | Genetic Algorithm |
| GHG | Greenhouse Gas |
| HDV | Heavy-Duty Vehicle |
| HPC | High-Power Charger |
| ICCT | International Council on Clean Transportation |
| LCA | Life Cycle Assessment |
| LFP | Lithium Iron Phosphate |
| MCS | Megawatt Charging System |
| SOC | State of Charge |
| TCO | Total Cost of Ownership |
| TU | Technische Universität |
Appendix A
Appendix A.1. Dataset for Charger Regression
Table A1.
Overview of commercially available DC fast charging stations used for cost comparison.
Appendix A.2. eFlips Optimization Data (Logistics Depot)
Table A2.
eFlips optimization parameters for the logistics depot.
Appendix A.3. LCA Data
Table A3.
Life cycle assessment (LCA) input data for 40 t trucks and charging infrastructure.
Appendix A.4. Emission Factors
Table A4.
Emission factors for fuels and electricity mixes.
References
- Transport & Environment (T&E). State of European Transport 2025. Technical Report. 2025. Available online: https://www.transportenvironment.org/uploads/files/State-of-Transport-2025.pdf (accessed on 12 February 2026).
- European Parliament and the Council of the European Union. Regulation (EU) 2023/1804 of the European Parliament and of the Council of 13 September 2023 on the Deployment of Alternative Fuels Infrastructure and Repealing Directive 2014/94/EU. 2023. Available online: https://eur-lex.europa.eu/legal-content/EN/TXT/PDF/?uri=CELEX:32023R1804&qid=1771345783294 (accessed on 3 November 2025).
- Göckeler, K.; Steinbach, I.; Görz, W.; Hacker, F.; Mottschall, M. StratES—Szenarien für die Elektrifizierung des Straßengüterverkehrs. Technical Report, Öko-Institut e.V. 2023. Available online: https://www.oeko.de/fileadmin/oekodoc/StratES-Szenarien-Elektrifizierung-Strassengueterverkehr.pdf (accessed on 20 January 2025).
- Syré, A.M.; Göhlich, D. Decarbonization of Long-Haul Heavy-Duty Truck Transport: Technologies, Life Cycle Emissions, and Costs. World Electr. Veh. J. 2025, 16, 76. [Google Scholar] [CrossRef] [Scilit]
- Menter, J.; Fay, T.A.; Grahle, A.; Göhlich, D. Long-Distance Electric Truck Traffic: Analysis, Modeling and Designing a Demand-Oriented Charging Network for Germany. World Electr. Veh. J. 2023, 14, 205. [Google Scholar] [CrossRef] [Scilit]
- Gudehus, T. Logistik: Grundlagen · Strategien · Anwendungen [Logistics: Foundations · Strategies · Applications], 4th ed.; Springer: Berlin/Heidelberg, Germany, 2010. [Google Scholar] [CrossRef] [Scilit]
- Wiendahl, H.P.; Lutz, S. Production in Networks. CIRP Ann. 2002, 51, 573–586. [Google Scholar] [CrossRef] [Scilit]
- Pihlatie, M.; Ranta, M.; Rahkola, P.; Åman, R. Zero-Emission Truck Powertrains for Regional and Long-Haul Missions. World Electr. Veh. J. 2023, 14, 253. [Google Scholar] [CrossRef] [Scilit]
- Balazadeh Meresht, N.; Moghadasi, S.; Munshi, S.; Shahbakhti, M.; McTaggart-Cowan, G. Advances in Vehicle and Powertrain Efficiency of Long-Haul Commercial Vehicles: A Review. Energies 2023, 16, 6809. [Google Scholar] [CrossRef] [Scilit]
- Bhardwaj, S.; Mostofi, H. Technical and Business Aspects of Battery Electric Trucks—A Systematic Review. Future Transp. 2022, 2, 382–401. [Google Scholar] [CrossRef] [Scilit]
- Tietz, T.; Fay, T.A.; Schlenther, T.; Göhlich, D. Electric Long-Haul Trucks and High-Power Charging: Modelling and Analysis of the Required Infrastructure in Germany. World Electr. Veh. J. 2025, 16, 96. [Google Scholar] [CrossRef] [Scilit]
- Fries, M.; Kruttschnitt, M.; Lienkamp, M. Operational Strategy of Hybrid Heavy-Duty Trucks by Utilizing a Genetic Algorithm to Optimize the Fuel Economy Multiobjective Criteria. IEEE Trans. Ind. Appl. 2018, 54, 3668–3675. [Google Scholar] [CrossRef] [Scilit]
- Fadranski, D.; Tietz, T.; Göhlich, D. Methodology for Optimizing Charging Infrastructure Distribution for Long-Haul Freight Traffic based on Multi-Agent Simulation and Evolutionary Bi-Objective Optimization. Procedia Comput. Sci. 2025, 257, 951–958. [Google Scholar] [CrossRef] [Scilit]
- Heide, L.; Guo, S.; Göhlich, D. From Simulation to Implementation: A Systems Model for Electric Bus Fleet Deployment in Metropolitan Areas. World Electr. Veh. J. 2025, 16, 378. [Google Scholar] [CrossRef] [Scilit]
- My eRoads Vehicle Database. Available online: https://www.my-e-roads.de/en/export/fahrzeuge (accessed on 1 October 2025).
- Le Corguillé, J.; Hacker, F.; Göckeler, K.; Mottschall, M.; Dolinga, T. Real-World Data Analysis of Energy Consumption, Activity and Charging Patterns of Battery Electric Trucks Operating in Germany. Research Report, Öko-Institut e.V., Berlin. 2025. Available online: https://www.oeko.de/fileadmin/oekodoc/Real-world-data-analysis-of-battery-electric-trucks.pdf (accessed on 3 November 2025).
- Smart Freight Centre. Guidelines—Charging Infrastructure for Truck Depots. Technical Report. 2023. Available online: https://smart-freight-centre-media.s3.amazonaws.com/documents/Guidelines-Charging-Infrastructure-for-Truck-Depots.pdf (accessed on 1 October 2025).
- Bundesministerium der Justiz. § 3 Arbeitszeitgesetz (ArbZG)—Arbeitszeit der Arbeitnehmer. 1994. Available online: https://www.gesetze-im-internet.de/arbzg/__3.html (accessed on 3 February 2026).
- SICHARGE D—Environmental Product Declaration. Available online: https://cache.industry.siemens.com/dl/files/549/109972549/att_1290856/v1/SICHARGE_D_-_ENVIRONMENTAL_PRODUCT_DECLARATION.pdf (accessed on 1 October 2025).
- Umweltbundesamt. CO2MON: CO2-Emissionen von Kraftstoffen (Diesel). Available online: https://secure.umweltbundesamt.at/co2mon/co2mon.html (accessed on 1 February 2026).
- Speth, D.; Plötz, P. Depot Slow Charging Is Sufficient for Most Electric Trucks in Germany. Transp. Res. Part D Transp. Environ. 2024, 128, 104078. [Google Scholar] [CrossRef] [Scilit]
- Scherrer, A.; Helferich, M.; Speth, D.; Link, S. Requirements of German Logistics Companies for Charging Battery-Electric Trucks: Results of a Combined Survey and Interview Study. Technical Report Working Paper Sustainability and Innovation No. S 03/2024, Fraunhofer Institute for Systems and Innovation Research ISI. 2024. Available online: https://publica-rest.fraunhofer.de/server/api/core/bitstreams/cfced06d-4ffe-4b81-9812-634a0b758154/content (accessed on 11 February 2026).
- Hacker, F.; Gnann, T.; Le Corguillé, J.; Stephan, A.; Kappler, L.; Mottschall, M.; Plötz, P. Truck Depot Charging. Technical Report, Fraunhofer ISI and Öko-Institut. 2025. Available online: https://www.transportenvironment.org/uploads/files/TE_truck-depot-charging_final-report.pdf (accessed on 11 February 2026).
- Volvo Trucks. Volvo FH Electric Specifications. 2026. Available online: https://www.volvotrucks.com/en-en/trucks/electric/volvo-fh-electric.html (accessed on 11 February 2026).
- MAN Truck & Bus. MAN eTGX—Electric Long-Haul Truck Specifications. 2026. Available online: https://www.man.eu/de/de/lkw/alle-modelle/der-man-tgx/spezifikation/spezifikationen-tgx.html (accessed on 3 February 2026).
- Ragon, P.L. Real-World Use Cases for Zero-Emission Heavy Tractor-Trailers for Goods Transport in the EU. Technical Report, International Council on Clean Transportation (ICCT). 2025. Available online: https://theicct.org/wp-content/uploads/2025/08/ID-359-%E2%80%93-EU-goods-transport_report_final.pdf (accessed on 11 February 2026).
- Alpitronic Hypercharger HYC50 (Up to 50 kW). Available online: https://www.energieloesung.de/p/alpitronic-hypercharger-hyc50-dc-wallbox-bis-50-kw-eichrecht-individuelle-varianten_12710.1 (accessed on 1 October 2025).
- BLACKBOX-DC-DUO DC Charging Station. Available online: https://www.stark-in-strom.de/products/supercharger-30-40-kw-dc-ladestation-schnellladegerat-blackbox-dc-eichrechtskonform-kopie (accessed on 1 October 2025).
- DC Fast Charging Station SIS-FC (60–200 kW). Available online: https://www.stark-in-strom.de/products/dc-schnelladegerat-ac-dc-ladesaule-sis-fc-60-200-kw-dc (accessed on 1 October 2025).
- Supercharger DC Charging Station (Up to 400 kW). Available online: https://www.stark-in-strom.de/products/supercharger-60-300-kw-dc-ladestation-schnellladegerat-eichrechtskonform-kopie (accessed on 1 October 2025).
- Alpitronic Hypercharger HYC150 (150 kW). Available online: https://www.wireload.de/shop/DC-Ladestation-Alpitronic-Hypercharger-HYC150-150KW-2x-CCS2-Kabel-BMDV-Forderung-p595052444 (accessed on 1 October 2025).
- WIRELOAD SC120 DC Charging Station. Available online: https://www.wireload.de/shop/DC-Ladestation-WIRELOAD-SC120-120KW-2x-CCS2-Kabel-inkl-Payment-Terminal-p702605445 (accessed on 1 October 2025).
- WIRELOAD SC180 DC Charging Station. Available online: https://www.wireload.de/shop/DC-Ladestation-WIRELOAD-SC180-180KW-2x-CCS2-Kabel-inkl-Payment-Terminal-p702615804 (accessed on 1 October 2025).
- WIRELOAD SC240 DC Charging Station. Available online: https://www.wireload.de/shop/DC-Ladestation-WIRELOAD-SC240-240KW-2x-CCS2-Kabel-inkl-Payment-Terminal-p702615799 (accessed on 1 October 2025).
- WIRELOAD SC300 DC Charging Station. Available online: https://www.wireload.de/shop/DC-Ladestation-WIRELOAD-SC300-300KW-2x-CCS2-Kabel-inkl-Payment-Terminal-p712203763 (accessed on 1 October 2025).
- WIRELOAD SC360 DC Charging Station. Available online: https://www.wireload.de/shop/DC-Ladestation-WIRELOAD-SC360-360KW-2x-CCS2-Kabel-inkl-Payment-Terminal-p702617775 (accessed on 1 October 2025).
- WIRELOAD SC400 DC Charging Station. Available online: https://www.wireload.de/shop/DC-Ladestation-WIRELOAD-SC400-400KW-2x-CCS2-Kabel-inkl-Payment-Terminal-p712199277 (accessed on 1 October 2025).
- Gewiss I-Fast 120 kW DC Charging Station. Available online: https://wsu-industrials.com/gewiss-gwj9242e-i-fast-120kw-2xccs2-2x250a-eichrechtskonform (accessed on 1 October 2025).
- EkoEnergetyka Axon Easy 120 kW DC Charging Station. Available online: https://www.mobilityhouse.com/de_de/ekoenergetyka-axon-easy-120-kw-dc-ladestation.html (accessed on 1 October 2025).
- Siemens Sicharge D DC Charging Station (8EM5000-3EF02-0AB0). Available online: https://www.mytvshop.de/Heim-und-Garten/Elektromobilitaet/Elektromobilitaet-Ladeinfrastruktur/Ladestationen-Saeulen/Siemens-8EM5000-3EF02-0AB0-Sicharge-D-Kompakt-Ladegeraet-IEC-Basistyp-installierte::3020987.html (accessed on 1 October 2025).
- Alpitronic Hypercharger HYC200. Available online: https://www.connect-gp-joule.de/shop/dc-ladestationen/alpitronic/hyc200/alpitronic-hypercharger-hyc200-2-dc-ladestation/gp10710 (accessed on 1 October 2025).
- Alpitronic Hypercharger HYC400-4. Available online: https://www.connect-gp-joule.de/shop/ladestationen/hyc400-dc-ladestation/alpitronic-hypercharger-hyc400-4-dc-ladestation-mit-kartenterminal/gp10628 (accessed on 1 October 2025).
- Alpitronic Hypercharger HYC150-1. Available online: https://www.mobilityhouse.com/de_de/alpitronic-hypercharger-hyc150-2-dc-ladestation.html (accessed on 1 October 2025).
- EkoEnergetyka Axon Easy 240 kW DC Charging Station. Available online: https://www.mobilityhouse.com/de_de/ekoenergetyka-axon-easy-240-dc-ladestation.html (accessed on 1 October 2025).

Disclaimer/Publisher’s Note: The statements, opinions and data contained in all publications are solely those of the individual author(s) and contributor(s) and not of MDPI and/or the editor(s). MDPI and/or the editor(s) disclaim responsibility for any injury to people or property resulting from any ideas, methods, instructions or products referred to in the content. |
© 2026 by the authors. Licensee MDPI, Basel, Switzerland. This article is an open access article distributed under the terms and conditions of the Creative Commons Attribution (CC BY) license.