


Abstract
Commercially produced complementary foods (CPCFs) are increasingly used during complementary feeding, yet evidence integrating nutritional composition, ingredient formulation, declared micronutrient fortification, economic accessibility, and alignment with international nutritional criteria remains limited in Mexico. This study evaluated 122 CPCFs available in the Mexican market, including purees (56.6%), snacks (22.1%), beverages (13.9%), and cereals (7.4%). Nutritional composition, ingredient lists, and declared micronutrient fortification were obtained from product labels; four price indicators were calculated, and applicable products were assessed using the WHO Europe Nutrient and Promotion Profile Model (NPPM). Snacks had the highest mean energy, carbohydrate, and protein contents, whereas beverages provided the lowest nutritional contribution. Purees showed the greatest ingredient diversity and the highest total sugar content, while cereals exhibited the highest frequency of declared iron, calcium, and vitamin C fortification. Food price metrics varied according to the indicator used: snacks were the most expensive per 100 g but the least costly per 100 kcal and gram of protein. NPPM assessment identified category-specific nutritional priorities, with energy density, sodium, total fat, added free sugars or sweeteners, and protein contributing differently to non-compliance. This multidimensional evaluation provides evidence to support category-specific reformulation, improved labeling, and informed regulatory and complementary feeding decisions.
1. Introduction
The first 1000 days, from conception to the first two years of life, are a foundational period that shapes growth, brain development, and lifelong metabolic and dietary patterns [1,2]. Nutrition during this period plays a fundamental role in shaping both immediate and long-term health outcomes [3,4]. The World Health Organization (WHO) and UNICEF recommend exclusive breastfeeding for the first six months of life, followed by the introduction of nutritionally adequate, safe, and age-appropriate complementary foods while breastfeeding continues [5]. After six months, breast milk alone is insufficient to meet infants’ increasing nutritional requirements, making complementary foods an essential source of energy and key nutrients for optimal growth and development [1,6]. The nutritional quality of these foods may influence not only children’s physical and cognitive development but also the formation of long-term eating habits and dietary patterns [7].
The global market for commercially produced complementary foods (CPCFs) has expanded rapidly, driven by urbanization, rising maternal employment, convenience, and greater availability [2,8]. This expansion is increasingly evident in middle-income countries such as Mexico, where the retail value of the baby food market has increased. A national study reported that 87.2% of parents had purchased infant formula or baby foods within the 30 days preceding the survey, indicating the widespread use of these products in Mexico [9]. Given their growing role in infant diets and their potential to complement or displace homemade foods, evaluating the nutritional quality of CPCFs has therefore become a public health priority.
CPCFs, including purees, infant cereals, snacks, and beverages, vary substantially in formulation and nutritional composition across countries and product categories [2,6]. Many products rely predominantly on fruit purees, water, cereals, flours, and starches, often complemented with modified starches, flavorings, acidity regulators, and micronutrient fortification; meanwhile, vegetables with naturally bitter flavors remain underrepresented [6,10]. This variability has raised nutritional concerns, including the frequent use of sugar-contributing ingredients, low energy density in some purees, excessive sodium in certain savory products, and the growing presence of ultra-processed formulations [2,11,12,13].
To address these concerns, the WHO developed a nutrient and promotion profile model that established criteria for evaluating CPCFs based on their energy density and sugar, sodium, and fat content [10]. Nevertheless, available evidence remains fragmented, as most studies examine nutrient composition, sugar content, or marketing practices separately. Few have integrated product formulation, nutritional quality, affordability, and compliance with WHO recommendations within a single analytical framework, particularly in Latin America, where evidence remains scarce. This study evaluated CPCFs marketed in Mexico by analyzing their composition, nutritional quality, compliance with the WHO Nutrient and Promotion Profile Model, and retail price. By integrating these dimensions, the study provides context-specific evidence to identify gaps in the nutritional quality and energy (calorie) cost of CPCFs and contribute to public health and regulatory policies aimed at improving product formulation, promoting informed food choices, and supporting healthier complementary feeding practices.
2. Materials and Methods
2.1. Product Selection and Data Collection
CPCFs available on the Walmart® Mexico website were identified from August to December 2025. The search was conducted using postal code 01219 to specify product availability. Eligible products were those marketed specifically for infants or young children and displaying a recommended age of consumption on the package. All products available on the website that met these criteria were included. Walmart Mexico was selected because it is one of the largest retail chains in the country, with a presence across all 32 states and a broad consumer base. Its extensive market presence makes it a relevant source for examining CPCFs available through mainstream retail channels in Mexico [14]. Although product availability was assessed using a single postal code in Mexico City, this approach allowed us to standardize the search conditions.
Label information was extracted and recorded in a Microsoft Excel database, including food category, recommended age, product type, organic claim, brand, product name, package size and type, ingredient list, retail price, nutrition declaration reference amount, energy, carbohydrates, total fat, total and added sugars, protein, dietary fiber, sodium, vitamin C, calcium, iron, and allergen declarations. Products were classified into four broad food categories according to their product name, presentation, and physical characteristics as described on the package: purees, snacks (including cookies, puffs, and toast-like snacks), beverages, and cereals (including products marketed as infant cereals).
A second researcher independently verified all records against photographs of the original labels from January to May 2026.
A total of 122 products met the eligibility criteria and were included in the final dataset: 69 purees, 27 snacks, 17 beverages, and 9 cereals.
2.2. Ingredient Characterization
Ingredient lists were extracted directly from product labels. Under the Codex General Standard for the Labelling of Prepackaged Foods (CXS 1-1985) [15], Regulation (EU) No 1169/2011, the U.S. Food and Drug Administration (21 CFR 101.4) [16], and the Mexican Official Standard NOM-051-SCFI/SSA1-2010 (Secretaría de Economía & Secretaría de Salud, 2010, as amended in 2020) [17], ingredients must be declared in descending order by weight at the time of manufacture. The first listed ingredient was therefore considered the predominant component of each product.
Ingredient names were translated into English and harmonized to account for spelling differences, synonyms, and variations in nomenclature. Ingredients were classified by primary food source or technological function as: fruits, vegetables, cereals, flours and starches, proteins, oils and fats, sweeteners, vitamins, minerals, emulsifiers and stabilizers, additives and preservatives, spices and flavorings, and other ingredients. Fruit juice concentrates were classified according to their fruit source for ingredient characterization; however, they were considered sources of free sugars in the NPPM assessment.
Ingredient frequencies were calculated overall and by food category in beverages, cereals, purees, and snacks, to compare formulation patterns. Each ingredient was counted once per product, regardless of how many times related terms appeared in the ingredient list. Ingredient lists were also screened for declared sources of selected micronutrients used for product fortification.
Declared Micronutrient Fortification
Products were classified as containing declared micronutrient fortification when their ingredient lists included at least one recognized source of iron, calcium, or vitamin C. Lists were systematically screened using predefined keywords corresponding to the most common fortification compounds. Iron-related terms included iron, ferrous sulfate, ferrous fumarate, and ferric pyrophosphate; calcium-related terms included calcium carbonate, tricalcium phosphate, calcium citrate, and calcium lactate; and vitamin C-related terms included ascorbic acid, sodium ascorbate, and calcium ascorbate. Synonymous and orthographic variants were also considered.
For each micronutrient, fortification frequency was calculated as the proportion of products within each category containing at least one declared source. Ingredient lists were used instead of nutrition facts because the quantitative declaration of vitamins and minerals quantities is not mandatory for all CPCFs marketed in Mexico, and most products did not report their specific micronutrient content.
2.3. Nutritional Composition and Price Analysis
Nutritional composition was obtained from the nutrition declaration on each product label and standardized to 100 g or 100 mL according to the declared reference amount.
Retail prices were recorded at the time of data collection and verified using online retail listings. Prices were converted from Mexican pesos (MXN) to U.S. dollars (USD) using the official exchange rate of MXN 17.46 per USD reported by the Bank of Mexico on 1 July 2025 [18].
Four price indicators were calculated: (1) retail price per package, (2) price per 100 g or 100 mL, (3) price per 100 kcal, and (4) price per gram of protein. Price per 100 g or 100 mL was calculated by dividing the package price by its net content and multiplying by 100. Price per 100 kcal was calculated by dividing the package price by its total energy content and multiplying by 100. Price per gram of protein was calculated by dividing the package price by its total protein content. Products reporting zero protein (n = 12) and one puree reporting protein content as Statistical significance was established at p < 0.05. A sensitivity analysis was also performed by excluding beverages from the comparison of price per gram of protein.
2.4. Evaluation According to the WHO Europe Nutrient and Promotion Profile Model
The nutritional suitability of CPCFs was assessed using the WHO Europe Nutrient and Promotion Profile Model (NPPM) for infants and young children [10]. Products were assigned to their corresponding relevant NPPM subcategory defined in Part A: Content and Front-of-Pack Labeling: dry cereals and starches (1), dairy foods (2), fruit- and vegetable-based products (3.1 and 3.2), savory meals (4.1–4.5), dry or semi-dry snacks (5.2), and beverages (8).
Products were assigned to the corresponding NPPM categories based on their product name and first listed ingredient. The categories included dairy foods, drinks, dry cereals and starches, savory meals or meal components, and snacks and finger foods.
Products were evaluated against the nutrient thresholds applicable to their subcategory, including energy density, sodium, total sugars, added free sugars or sweeteners, protein, and total fat. Compliance was determined using the nutritional information declared on the product label. Each product was classified as compliant or non-compliant with each applicable criterion. Non-applicable criteria were recorded as such, and products lacking sufficient data were classified as “insufficient data”.
Beverages were classified under NPPM subcategory 8 but were not evaluated against the nutrient thresholds because the model considers them unsuitable for promotion to infants and young children [10]. The compliance variables were recorded as not applicable. Compliance percentages were calculated only for products with sufficient information for each applicable criterion.
2.5. Statistical Analysis
Categorical variables were presented as frequencies and percentages. Nutritional composition data were presented as means and 95% confidence intervals (CIs), whereas price indicators were reported as medians and interquartile ranges (IQRs). Normality was assessed using the Shapiro–Wilk test.
Differences in nutritional composition and price indicators across product categories were evaluated using the Kruskal–Wallis test. Significant results were followed by Dunn’s post hoc test with Bonferroni adjustment for pairwise comparisons. Statistical significance was established at p < 0.05. A sensitivity analysis was also performed by excluding beverages from the comparison of price per gram of protein.
Ingredient composition was summarized as absolute frequencies according to food category and visualized using bar charts. Differences in the frequency of declared micronutrient fortification (iron, calcium, and vitamin C) among product categories were evaluated using Pearson’s chi-square test. The strength of association was assessed using Cramer’s V. Declared micronutrient fortification frequencies were visualized using grouped bar charts.
NPPM compliance was summarized as frequencies and percentages among evaluable products. Patterns of non-compliance across NPPM subcategories were visualized using heat maps, whereas overall compliance by nutritional criterion was summarized using stacked bar charts. Micronutrient fortification frequencies were visualized using grouped bar charts.
All statistical analyses and graphical visualizations were performed using Python version 3.11 (Python Software Foundation, Wilmington, DE, USA) with the pandas (version 2.2.3), NumPy (version 2.4.6), SciPy (version 1.16.3), scikit-posthocs (version 0.17.1), Matplotlib (version 3.10.0), and Seaborn libraries (version 0.13.2).
3. Results
3.1. Nutritional Composition of CPCFs
A total of 122 CPCFs products were evaluated: 69 purees (56.6%), 27 snacks (22.1%), 17 beverages (13.9%), and 9 cereals (7.4%). Regarding the recommended minimum age of consumption, products labeled for infants aged ≥6 months were the most common (n = 64, 52.5%), followed by those labeled for ≥12 months (n = 28, 23.0%) and ≥8 months (n = 19, 15.6%) (Table 1).
Table 1.
Characteristics of CPCFs marketed in Mexico.
The nutritional composition differed markedly among food categories (Table 2), reflecting their distinct nutritional purposes and formulation strategies. Snacks had the highest mean energy, carbohydrates, and protein contents (390.0 kcal/100 g, 76.0 g/100 g, and 6.86 g/100 g, respectively). In contrast, beverages had the lowest mean values for these nutrients (42.0 kcal/100 g, 7.27 g/100 g, and 0.1 g/100 g, respectively). Cereals and snacks had higher mean fat and sodium contents than beverages and purees. Snacks also had the highest mean fiber content (1.78 g/100 g), whereas beverages had the lowest (0.42 g/100 g).
Table 2.
Nutritional composition of CPCFs according to food category.
Differences were also observed for nutrients considered critical by the WHO nutrient and promotion profile model. Although total sugar content did not differ significantly across food categories (p = 0.379), added sugar content differed significantly by category (p < 0.001). Snacks had the highest mean added sugar content (4.75 g/100 g; 95% CI: 2.76–6.74), followed by beverages (3.47 g/100 g; 95% CI: 1.55–5.38) and purees (1.01 g/100 g; 95% CI: 0.29–1.73). No added sugars were reported in cereals.
3.2. Ingredient Composition and Formulation Patterns
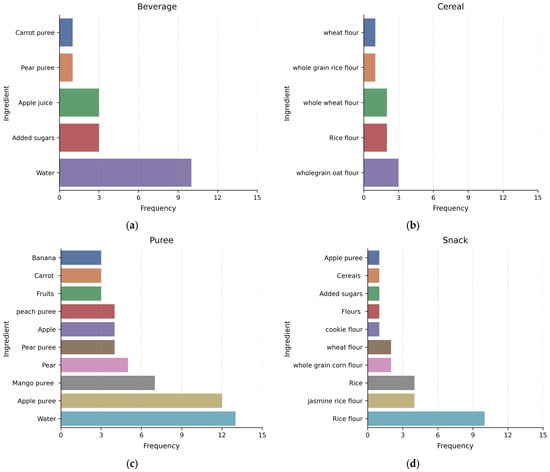
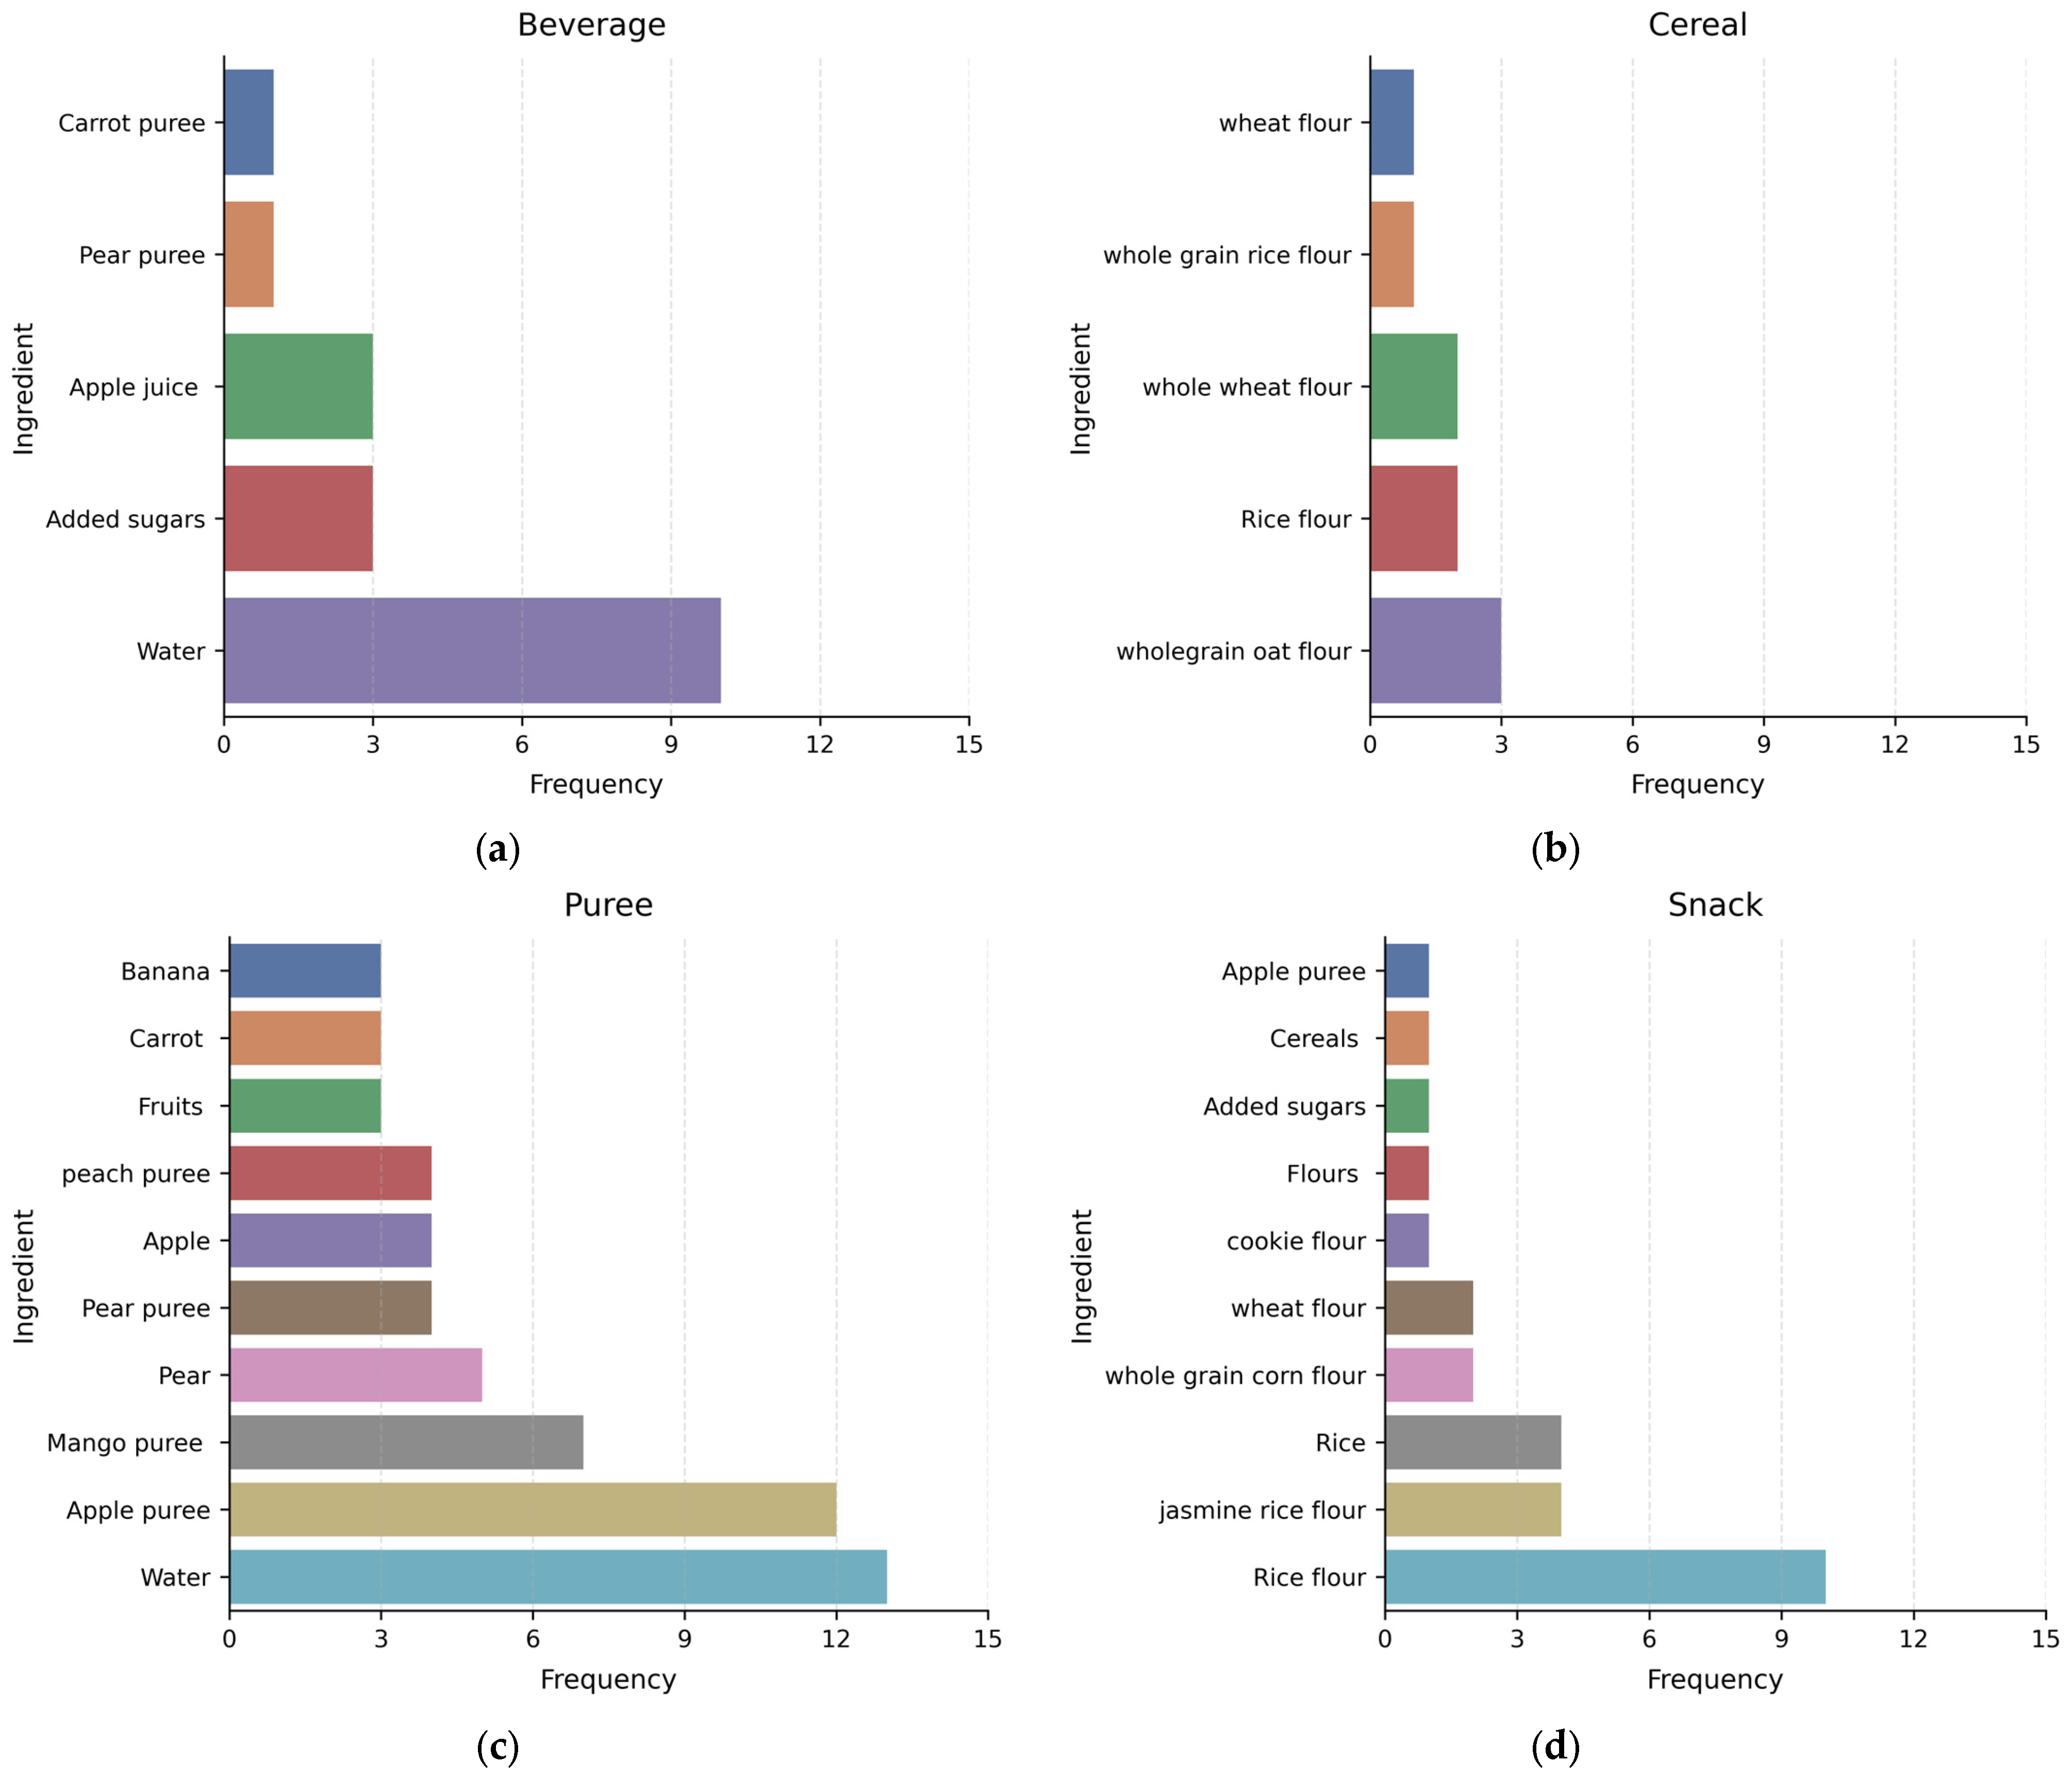
Ingredient composition revealed distinct formulation strategies among CPCF categories (Figure 1 and Figure 2). Because ingredients are listed in descending order by weight, the first listed ingredient was used as an indicator of the predominant ingredient in each formulation. Water was the most frequent primary ingredient in beverages, followed by added sugars and apple juice. In cereal products, the most frequent first ingredients were whole-grain oat flour, rice flour, and whole wheat flour. Purees showed a range of predominant ingredients, with water and apple puree appearing the most frequently. Snack products were consistently formulated using cereal-derived ingredients, with rice flour representing the predominant base ingredient.
Figure 1.
Frequency of the most common first-listed ingredients in CPCFs by food category. (a) Beverages; (b) cereals; (c) purees; and (d) snacks. Ingredients are listed on product labels in descending order by weight. Bars indicate the number of products in each category in which the ingredient was listed first. Only the ten most frequent ingredients per category are shown.
Figure 2.
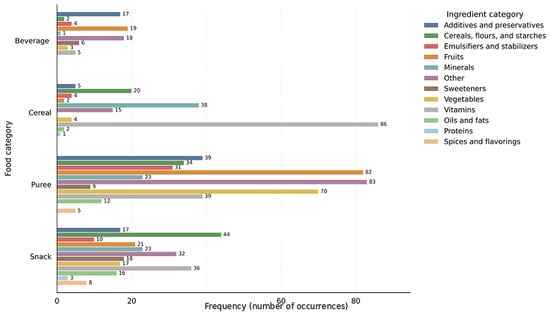
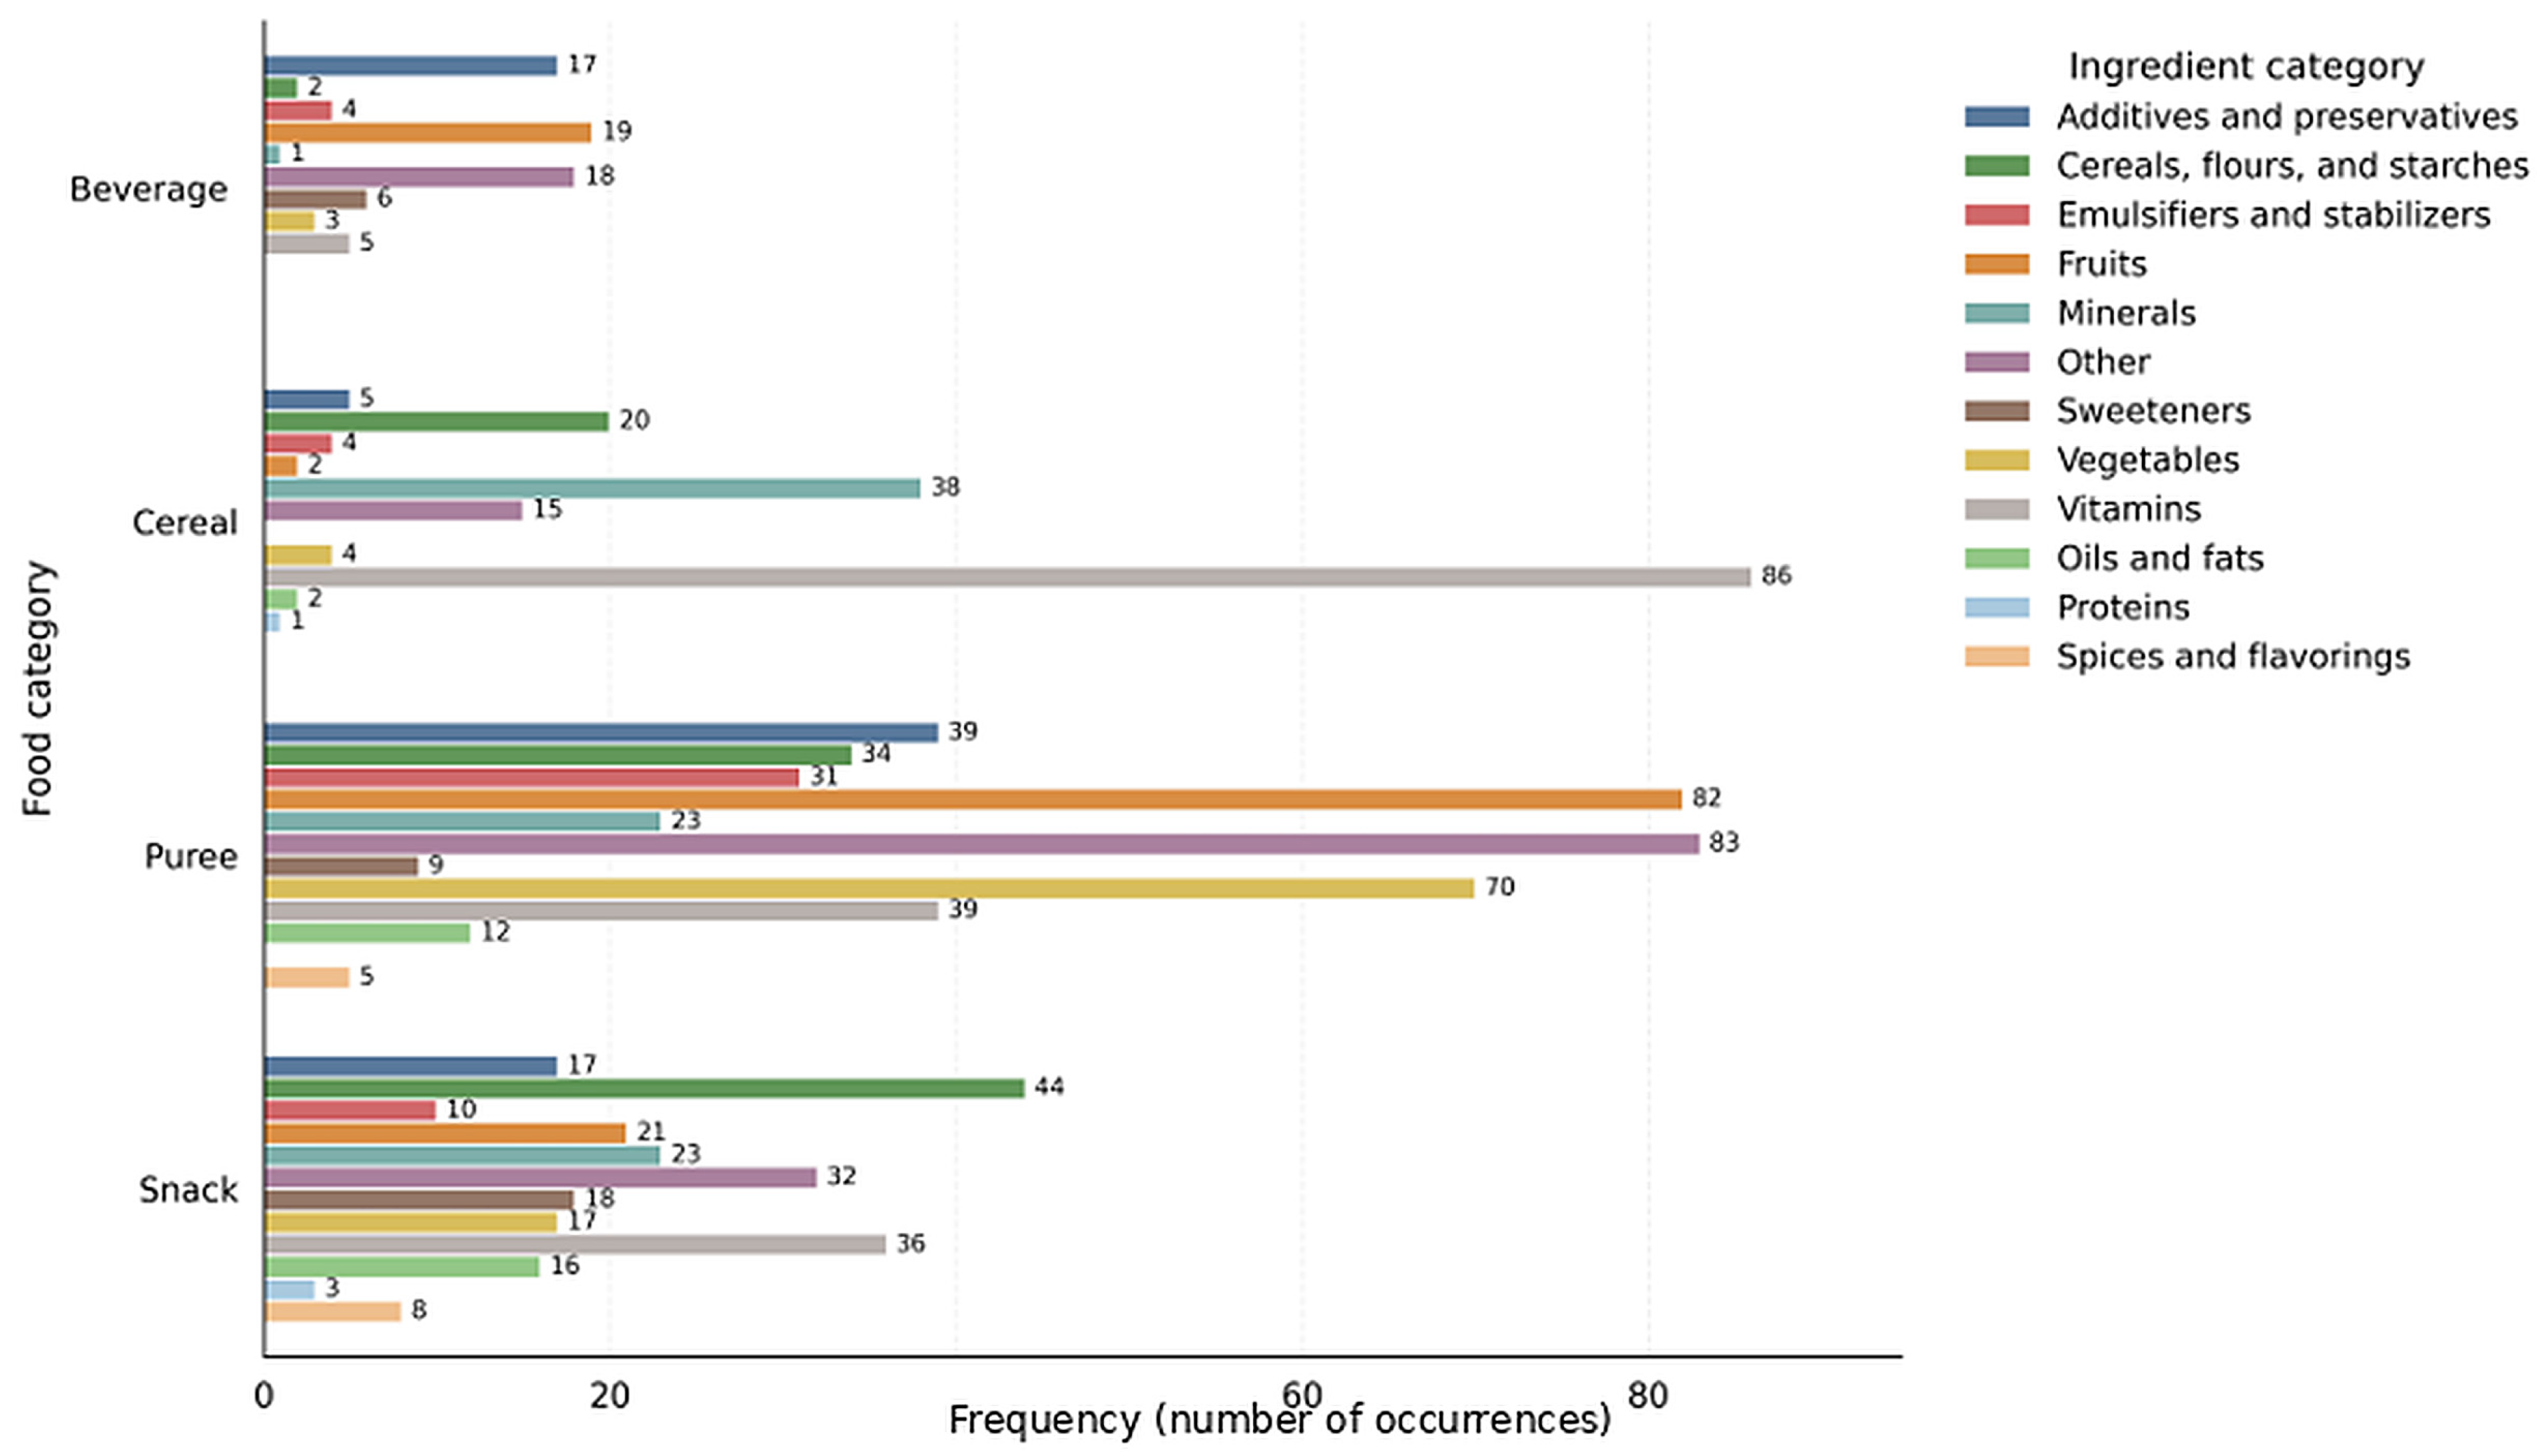
Frequency of ingredient categories identified in the complete ingredient lists of CPCFs, by food category. Bars indicate the number of listed ingredients classified within each ingredient category.
Analysis of the complete ingredient lists showed variations in formulation among product categories (Figure 2). In purees, fruits, vegetables, additives and preservatives, and “other” ingredients were frequently reported. Cereals had high frequencies of vitamins and minerals, whereas cereal-, flour-, and starch-based ingredients were frequently reported in both cereals and snacks. In beverages, fruit ingredients, additives and preservatives, and “other” ingredients were among the most frequently reported categories. Overall, results show that commercial baby food categories are not only nutritionally distinct but also differ considerably in their formulation strategies, highlighting the heterogeneous composition of products currently available in the Mexican market.
Declared Micronutrient Fortification
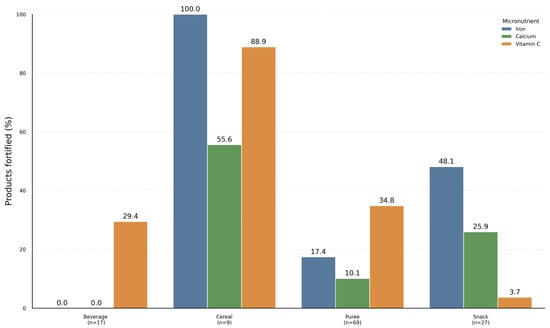
The frequency of declared micronutrient fortification varied across CPCF categories (Figure 3). Iron fortification was identified in all cereal products (100%), followed by snacks (48.1%) and purees (17.4%); no beverages declared added iron. Calcium fortification was less frequent overall but was most common in cereals (55.6%), followed by snacks (25.9%) and purees (10.1%), while no beverages contained declared calcium sources. Vitamin C was the most frequently declared micronutrient in cereals (88.9%), followed by purees (34.8%) and beverages (29.4%), whereas only 3.7% of snacks declared vitamin C fortification. The frequency of fortification differed significantly among product categories for iron (χ2 = 16.57, p = 0.0009), calcium (χ2 = 13.49, p = 0.0037), and vitamin C (χ2 = 23.27, p < 0.001). The corresponding Cramer’s V values (0.47–0.60) indicated moderate to strong associations between product category and micronutrient fortification.
Figure 3.
Percentage of CPCFs in each category with iron-, calcium-, or vitamin C-fortifying ingredients listed on the product label.
3.3. Food Price Metrics
Price indicators differed significantly across CPCF categories (p < 0.001; Table 3). Cereal products had the highest median retail price per package (USD 3.54), followed by snacks (USD 3.14), whereas beverages and purees had the lowest median prices (USD 1.1 and USD 1.17, respectively). The category ranking changed when prices were expressed relative to product weight and energy content. Snacks had the highest median price per 100 g or mL (USD 7.55), whereas beverages had the lowest (USD 0.57). Cereals and beverages had the highest median prices per 100 kcal (USD 3.34 and USD 3.27, respectively), while snacks had the lowest (USD 0.81).
Table 3.
Price indicators of CPCFs according to food category.
A similar trend was observed when protein content was evaluated (p < 0.001). Beverages had the highest median price per gram of protein (USD 4.60), followed by purees (USD 1.37) and cereals (USD 1.22); snacks had the lowest (USD 0.40). Overall, the relative price CPCFs depended on the indicator used: beverages and purees had the lowest median prices per package, whereas snacks had the highest price per unit of weight but the lowest prices per unit of energy and protein. A sensitivity analysis excluding beverages showed that differences in price per gram of protein remained significant among cereals, purees, and snacks (Kruskal–Wallis test, H = 34.14, p < 0.001).
3.4. Compliance of CPCFs in the Mexican Market with the WHO Europe Nutrient and Promotion Profile Model (NPPM)
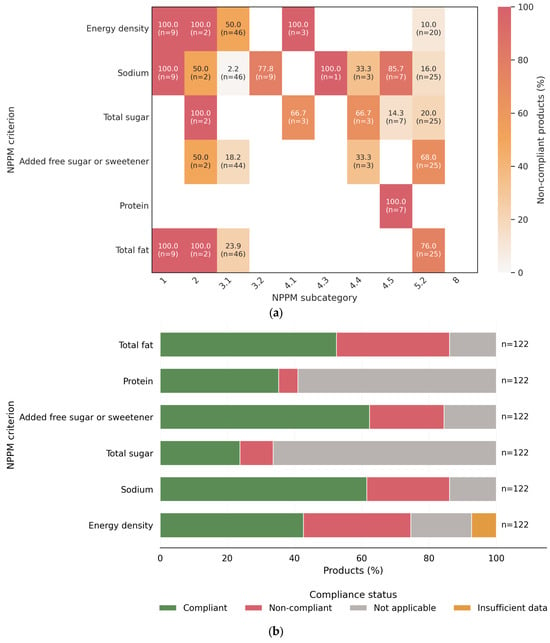
Compliance with the NPPM varied across CPCFs subcategories (Figure 4a). Because the NPPM establishes nutrient thresholds according to product type, compliance was assessed within each applicable subcategory.
Figure 4.
Compliance with the NPPM nutrient criteria among CPCFs. (a) Percentage of products that did not meet each applicable criterion, by NPPM subcategory. Percentages were calculated among evaluable products; products in subcategory 8 were excluded because the criteria were not applicable. Labels show the percentage and number of products (n). (b) Overall distribution of compliance status (compliant, non-compliant, not applicable, or insufficient data) for each nutrient criterion; n = 122.
Dry cereals (subcategory 1) showed the highest levels of non-compliance, with all evaluated products failing the criteria for energy density, sodium, and total fat. Among dairy-based products (subcategory 2), all products failed the criteria for energy density, total sugar, and total fat; half failed the sodium criterion, and half exceeded the limit for added free sugars or sweeteners.
Among fruit- and vegetable-based products, fruit-based purees (subcategory 3.1) showed moderate non-compliance with energy density (50.0%), total fat (23.9%), and added free sugars or sweeteners (18.2%); non-compliance for sodium was uncommon (2.2%). In contrast, vegetable-based purees (subcategory 3.2) showed non-compliance primarily for sodium (77.8%), with no non-compliance identified for the other criteria assessed in this subcategory.
Non-compliance also varied between savory meal subcategories. In products in which the named protein source was not the principal ingredient (subcategory 4.4), non-compliance was observed for sodium (100%), total sugar (66.7%), and added free sugars or sweeteners (33.3%). Among products consisting primarily of a named protein source (subcategory 4.5), all failed the protein criterion (100%), and most failed the sodium criterion (85.7%).
Snack products (subcategory 5.2) showed a distinct pattern: non-compliance was relatively uncommon for energy density (10.0%), sodium (16%), and total sugar (20.0%), but most failed the criteria for total fat (76.0%) and added free sugars or sweeteners (68.0%), indicating that non-compliance with the criteria for total fat and added/free sugars or sweeteners was particularly prevalent among commercially available snack products.
The overall distribution of compliance across all evaluated products is summarized in Figure 4b. Sodium and added free sugars or sweeteners showed the highest overall compliance, with approximately two-thirds of applicable products meeting the corresponding WHO criteria. In contrast, energy density and total fat exhibited the largest proportions of non-compliant products. In contrast, evaluation of total sugar and protein was limited to specific NPPM subcategories because these criteria do not apply to all commercial baby food types.
Overall, non-compliance with the NPPM varied by both nutrient criterion and product subcategory. The criteria associated with non-compliance therefore differed according to product formulation, underscoring the value of assessing products within their applicable subcategories.
4. Discussion
4.1. Nutritional Composition of CPCFs
The nutritional composition of CPCFs available in the Mexican market differed substantially among product categories. These differences indicate that the nutritional concerns associated with CPCFs are category-specific and should be interpreted according to the role that each product is expected to play during complementary feeding. Energy content showed the clearest contrasts among categories. Snacks had the highest mean energy, consistent with previous studies reporting that dry snacks, biscuits, and similar products are considerably more energy-dense than wet spoonable foods [12]. Their low moisture content and predominance of cereal-based ingredients partly explain their high energy density. Diets high in energy density have been associated with increased energy intake because individuals tend to consume a relatively constant weight of food despite differences in energy density, which may contribute to excess body weight. This finding is particularly relevant because snacks represented 22.1% of the products identified in the Mexican market. A previous study in Mexico indicates that an increase in energy density leads to a higher energy intake, a concept referred to as “passive overconsumption” and weight gain, and estimates that the energy density difference implies 88 additional kilocalories in daily energy intake of children with overweight compared to normal-weight children [19].
Beverages exhibited the lowest energy, carbohydrate, and protein contents. However, despite their low energy content, these products represent a source of liquid calories, which have been associated with lower satiety and higher subsequent intake compared with solid foods. Therefore, their low energy should not be interpreted as a nutritional advantage. The availability of commercial beverages specifically marketed for infants and young children is concerning because these products may displace water without providing a substantial nutritional contribution. Moreover, sweetened beverages and fruit-based drinks may increase exposure to free sugars, reinforce preferences for sweet tastes, and contribute to dental caries and excessive weight gain [2,6]. However, concerns regarding sugar exposure were not limited to beverages. In the present study, purees exhibited the highest mean total sugar content, consistent with international evidence showing that commercial products containing processed fruit are frequently characterized by high sugar content and predominantly sweet flavor profiles [20,21]. These findings are relevant for the Mexican population; results from a Mexican birth-cohort study found that among children ≤2 years, added sugar intake ≥7 g/d was associated with suboptimal growth, central adiposity, and less favorable eating behaviors [22].
Snacks also exhibited the highest mean protein content, although protein concentration alone does not indicate protein quality or the contribution of protein-rich ingredients to the formulation. Previous evaluations have reported that some savory CPCFs contain only 8–10% meat or fish by weight, even when these ingredients are highlighted in the product name [23]. Protein has also been reported to increase with the recommended age of consumption and with a shift from simple purees to more complex meals containing meat and cereals [21]. Thus, evaluation of protein content should be complemented by analysis of protein sources and their relevance within the formulation.
Cereals and snacks had higher fat and sodium contents than beverages and purees, in agreement with the category-dependent differences reported in other markets [21,24]. Scully et al. [24] reported that only 38% of toddler foods met sodium recommendations compared with 90% of infant foods. Early exposure to sodium is relevant because repeated consumption of salty foods may contribute to the development of preferences for saltier tastes [20]. Similarly, although total fat content provides useful information, it does not describe lipid quality. Previous studies have identified high saturated and trans-fat content and insufficient DHA availability, highlighting the need for future studies to evaluate fatty acid composition [1,20,21]. Puree showed the highest mean dietary fiber content (1.4 g/100 g), likely reflecting the greater contribution of fruit- and vegetable-derived ingredients. However, these apparently favorable characteristics should be considered together alongside total sugar content.
4.2. Ingredient Composition and Formulation Patterns
Ingredient composition confirmed that nutritional differences among CPCFs food categories were closely related to distinct formulation strategies. Water, fruit purees, and cereal-derived ingredients were the main formulation bases, although their relative importance differed across categories. This pattern agrees with other studies reporting that CPCFs frequently rely on a relatively limited range of base ingredients, particularly water, apple and pear purees and cereal flours or starches [20,25,26]. However, the present results also revealed important category-specific patterns, particularly the predominance of water in beverages and several purees, the extensive use of rice-derived ingredients in snacks, and the high frequency of vitamins and mineals in cereal products. Water was the predominant ingredient in beverages and was also the most frequently declared first ingredient in purees. It is used technologically to adjust consistency and facilitate the production of smooth, spoonable products, and similar formulation patterns have been reported for commercial purees and pouch-based meals [10,20]. However, its predominance in some purees may partly explain their comparatively low energy density, as discussed in the previous section. For consumers and caregivers, interpreting both sources of information together may support more informed product selection, particularly by identifying whether water, fruit purees, cereal flours, or added sugars contribute to the predominant components of the formulation.
Fruit-based ingredients were particularly frequent in purees and beverages, with apple and mango purees among the most common predominant ingredients. The frequent use of apple puree agrees with previous studies showing that apple and pear are widely used as formulation bases in commercial fruit products [20,26]. In the present study, mango puree was also identified as one of the most frequent ingredients in purees. This may reflect mango’s availability and cultural familiarity in the Mexican context and suggests that alongside globally common formulations based on apples and pears, CPCFs may also incorporate ingredients associated with regional dietary patterns. Manufacturers generally tend to favor naturally sweet fruits and vegetables, including banana, mango, carrot, sweet potato, and pumpkin, whereas bitter green vegetables are less frequently used alone and are often combined with sweeter ingredients [25,26,27]. This formulation pattern is consistent with the high total sugar content observed in purees. Cereal products and snacks showed a different formulation pattern, with cereal flours and grains representing their predominant ingredients. Whole oat, rice, and wheat flours were the main bases of cereal products, whereas rice flour and other rice-derived ingredients predominated in these products. Gutiérrez [28] identified rice, corn, wheat, oats, and barley as the principal grains used in commercial foods for infants and young children.
Although chemical contaminants were not evaluated in this study, rice-based foods have been identified as important contributors to dietary exposure to inorganic arsenic [29]. Therefore, the high frequency of rice-derived ingredients identified in CPCFs sold in the Mexican market supports the need for future studies assessing contaminant exposure and risk from consuming these products, particularly for inorganic arsenic. A previous report from the U.S. and other countries showed that the highest median concentrations of arsenic and Cadmium were detected in rice snacks and rice baby cereal, respectively [30]. Analysis of the complete ingredient list also showed substantial differences in formulation complexity. Purees exhibited the greatest ingredient diversity and high frequencies of fruits and vegetables, but also additives, preservatives, and ingredients classified as “other”. The complexity of some formulations was particularly notable, with individual commercial baby food containing up to 12 ingredients, indicating that products commonly perceived as simply fruit- or vegetable-based foods may involve more complex formulations. Additives and preservatives also appeared frequently in beverages, whereas they were less common in snacks. The lower frequency observed in snacks may be partly related to the dry nature and lower moisture content of this product category, which may reduce the technological need for preservation compared with high-moisture products. Data on the health effects of food additives in infants and children are limited; however, infants and young children may be more vulnerable to their potential adverse effects because of their physiological immaturity [31].
In contrast, cereals were characterized by extensive vitamin and mineral fortification, and micronutrient fortification was also observed in snack products. This pattern is consistent with other studies identifying infant cereals as one of the most frequently fortified CPCF categories, commonly providing iron, calcium, zinc, and B vitamins [6,27]. The early complementary feeding period represents an important stage for sensory learning and the acceptance of new flavors. International recommendations emphasize exposure to a variety of individual foods and flavors, particularly vegetables, and discourage formulation strategies in which less familiar or bitter flavors are systematically masked by sweet fruit ingredients [10]. This is particularly relevant to the present findings, as apple puree and other sweet fruit ingredients were frequently identified as predominant formulation components. At the same time some products contained considerably complex ingredient mixtures. Although multi-ingredient formulations are not inherently nutritionally inadequate, simpler and more recognizable formulations may facilitate exposure to individual flavors and help caregivers better understand the product’s actual composition. Greater transparency in product naming and ingredient declaration is therefore important, particularly when the ingredients emphasized on the front of the package do not represent the formulation’s predominant components [10,24].
Although Mexico’s NOM-131-SSA1-2012 [32] establishes sanitary, nutritional, and labeling requirements for infant formulas and foods intended for infants and young children, important opportunities remain to strengthen the accessibility, clarity, and transparency of nutritional information provided to caregivers. While the regulation establishes specific requirements for the quantitative declaration of micronutrients in infant formulas, these provisions do not uniformly extend to all complementary foods intended for infants and young children. Furthermore, certain products in these categories are exempt from the supplementary front-of-package nutrition labeling requirements established under NOM-051-SCFI/SSA1-2010 Secretaría de Economía & Secretaría de Salud, 2010, as amended in 2020 [17]. This regulatory framework highlights the need to strengthen front-of-package information specifically designed for this vulnerable population. Infancy and early childhood represent critical periods of rapid physical growth, neurological development, and the establishment of dietary preferences, during which both inadequate and excessive nutrient intake may have long-term health consequences [33,34]. Clear, standardized, and easily interpretable front-of-package information could help parents and caregivers identify age-appropriate products, compare their nutritional composition, and make informed purchasing decisions without relying primarily on promotional claims or information presented in complex nutrition tables. Greater efforts to identify nutrients, such as iron, zinc, and calcium, alongside information on added sugars, sodium, and other nutrients of concern, could facilitate the identification of products that better meet the nutritional needs of infants and young children. Moreover, standardized front-of-package labeling could encourage manufacturers to improve product formulations, enhance accountability, and reduce potentially misleading nutritional or health claims [35]. From a public health and regulatory perspective, strengthening these requirements would represent an important opportunity to promote transparency, support appropriate complementary feeding practices, and protect child health during a particularly sensitive developmental period.
Declared Micronutrient Fortification
The prevalence of declared micronutrient fortification differed markedly among product categories, with cereals showing the highest frequency of added iron, calcium, and vitamin C. This agrees with studies from Southeast Asia and Europe, where cereal-based complementary foods are the primary vehicles for micronutrient fortification because they target nutrients commonly inadequate during complementary feeding, particularly iron [6,18]. Iron, calcium, and Vitamin C are prioritized because CPCFs are expected to provide a substantial portion of infant micronutrient requirements after six months of age, when endogenous iron stores become depleted and nutrient demands increase [23]. Cereal products are commonly introduced as one of the first complementary foods and have a stable dry matrix that facilitates micronutrient fortification [1,23]. In contrast, the low prevalence of iron and calcium fortification in purees and the absence of these micronutrients in beverages are consistent with reports from Italy and Australia, where these product categories rarely contain added minerals [2,20]. Iron fortification is particularly relevant because infant iron requirements increase after six months of age. Frequent addition of vitamin C, especially in cereals, may further enhance non-heme iron absorption [1,36]. However, declaring added micronutrients does not necessarily indicate adequate nutritional value, as the bioavailability of fortified iron and calcium is substantially lower than that of human milk and may be further reduced by inhibitors such as phytates and dietary fiber in plant-based products [27]. Furthermore, the quantitative content of iron, calcium, and vitamin C was not consistently reported on product labels as current Mexican labeling regulations generally do not require manufacturers to declare these values unless specific nutritional claims are made. Consequently, although this study identified products containing declared sources of these micronutrients, it was not possible to determine the amounts added.
4.3. Food Price Metrics
Food price metrics differed substantially among CPCF categories, depending on whether price was considered per package, product weight, or nutritional contribution. Cereals and snacks had the highest retail prices per package, whereas beverages and purees appear more affordable based on purchased price alone. However, these differences changed after standardization by weight, energy, and protein content, demonstrating that retail price provides only a partial assessment of economic value. This distinction is particularly relevant because caregivers select CPCFs within a broader context in which cost, nutritional value, convenience, and available time may simultaneously influence food choices [2,37,38].
Snacks showed the clearest contrast between price and nutritional cost. They were substantially more expensive per 100 g than other categories but had the lowest per 100 kcal and per gram of protein; a similar pattern was reported in Canada, where cookies and teething biscuits were among the most expensive CPCFs on a weight basis [39]. Snacks exhibited the highest energy, carbohydrate, and protein contents and were predominantly based on cereal- and rice-derived ingredients. However, their apparent economic efficiency should not be interpreted as an indicator of greater nutritional quality, particularly because this category was also characterized by high energy density and added sugars. Thus, snacks illustrate an important trade-off in which inexpensive energy and protein may coexist with nutritional characteristics of concern.
The opposite patterns were observed for beverages. Despite having the lowest price per package and per 100 mL, beverages were the most expensive category per gram of protein and, together with cereals, among the most expensive per 100 kcal. Therefore, their low retail price should not be used as an indicator of economic efficiency or nutritional value. Commercial beverages, by nature, provide comparatively expensive energy and protein while offering limited nutritional contribution and potentially competing with water as a complementary feeding option; this is consistent with the NPPM, which classifies beverages as not appropriate for promotion for infants and young children [10].
Purees also showed a discrepancy between purchasing price and energy cost. Their relatively low package price and moderate price per 100 g may suggest a lower purchasing cost. However, their cost increased when expressed per 100 kcal per gram of protein. The increasing use of CPCFs is also associated with their convenience, portability, longer shelf life, and reduced preparation requirements. For families in which caregivers have limited time because of employment, childcare responsibilities, or inflexible work schedules, preparing complementary foods at home requires planning, shopping, cooking, storage, and cleaning. Under these circumstances, commercial products may be more accessible in practice despite their higher direct monetary cost [27,39].
Direct comparison of the present results with previous studies is limited, because economic evaluations of CPCFs have generally focused on retail price or price per unit weight, whereas price per 100 kcal and price per gram of protein have rarely been evaluated directly [20,40]. Available evidence indicates substantial price variation. Some authors have reported that a price premium is associated more with convenience and infant-specific marketing than with functionality [38]. The present study demonstrated that the least expensive product at the point of purchase is not necessarily the most economical source of energy or protein, while a low cost per calorie may coexist with less favorable nutritional characteristics.
4.4. Compliance with the WHO Europe Nutrient and Promotion Profile Model
The evaluation of CPCFs available in the Mexican market against the NPPM revealed that nutritional suitability cannot be characterized by a single compliance pattern. Instead, the criteria driving non-compliance differed substantially across product subcategories, reinforcing the importance of applying category-specific thresholds rather than treating all CPCFs as a homogeneous group. This approach is particularly relevant because previous international evaluations have reported generally low overall alignment with the NPPM, with approximately one-quarter to less than half of evaluated products meeting all applicable nutritional criteria in markets including the United Kingdom, United States, Australia, Portugal, Malta and several South Asian Countries [6,11,13,41]. Although the NPPM was developed by the WHO Regional Office for Europe, its application to products marketed in Mexico provides a relevant international reference for assessing their nutritional suitability. Considering the absence of a specific Model in Mexico, the NPPM provides a framework for identifying nutritional concerns. The results for cereals showed that non-compliance was not uniform across all nutritional dimensions. Protein content ranged from 4.50 to 4.81 g/100 kcal, with all products remaining below the NPPM maximum threshold of 5.5 g/100 kcal, indicating full compliance with the protein criterion. Sodium concentrations ranged from 30.61 to 52.55 mg/100 kcal, placing most products within or close to the NPPM limit of ≤50 mg/100 kcal as eaten. Although all products complied with the protein criterion, they failed to meet the NPPM criteria for energy density, sodium, and total fat. This is particularly relevant because, although infant cereals are commonly fortified and considered nutritionally valuable complementary foods, their nutritional contribution depends not only on fortification but also on preparation and dilution practices, which may influence the nutritional composition of the food as consumed.
Energy density was also an important concern among fruit-based purees, with half of the products failing the corresponding criterion. This finding is consistent with previous studies reporting low energy density in commercial fruit purees and other spoonable products, frequently attributed to their high-water content [10,23]. The present ingredient analysis supports this interpretation, as water was frequently identified as a predominant ingredient in purees. For vegetable-based products classified in subcategory 3.2, the NPPM also considers the proportion of added water; however, this criterion could not be directly evaluated because the quantitative proportion of water was not declared on the labels. Notably, two products listed water as the first ingredient, suggesting that it was the largest component by weight. Although this does not allow determination of whether the NPPM limit was exceeded, it highlights an important limitation of label-based assessment and demonstrates how incomplete quantitative ingredient information may prevent full evaluation of product suitability. Sugar-related noncompliance also varied among product types. Dairy-based products showed complete non-compliance with the total sugar criterion, whereas added free sugars or sweeteners contributed to non-compliance in fruit-based purees, savory products, and particularly snacks. Previous studies have similarly identified excessive sugar and sugar-contributing ingredients as major causes of NPPM non-compliance. In the United Kingdom, only 59% of evaluated products complied with total sugar criteria, while approximately 44% of products in the United States exceeded recommendations [11,41]. The high non-compliance of snacks with the added free sugars or sweeteners criterion in the present study is also consistent with previous evidence identifying snacks and finger foods among the least aligned categories [24,41]. These results agree with the nutritional composition analysis of the present study, in which snacks were the only broad category with a mean added sugar content above zero.
Interpreting snack compliance also requires considering serving size. Unlike criteria expressed per 100 g or 100 kcal, the NPPM energy criterion for snacks is evaluated per serving. In the present sample, serving sizes varied substantially, ranging from approximately 5 to 30 g, although most products recommended servings close to 7 g. In addition, products from one brand did not declare a serving size. This variability is important because the same product may appear more or less favorable depending on the declared portion, and very small serving sizes may allow compliance with a per-serving energy threshold despite high energy density. Therefore, compliance with snack energy criteria should be interpreted together with serving size and consumption patterns rather than as an isolated indicator of nutritional suitability.
Total fat was another major source of non-compliance, particularly among snacks, with 76% failing the corresponding criterion. Together with their high energy density and frequent presence of added sugars or sweeteners, the NPPM assessment identifies snacks as a category with multiple simultaneous nutritional concerns. This is particularly relevant because snacks represented 22.1% of the products included in the study. Previous international assessments have similarly reported poorer alignment among snacks, finger-food, and toddler-oriented products than among foods intended for younger infants [24,41]. Sodium showed relatively high overall compliance, but the aggregated result concealed marked differences among subcategories. Vegetable-based purees and products consisting primarily of a named protein source showed particularly high sodium non-compliance. International evidence also shows considerable variability in sodium compliance according to product category and target age, with poorer performance frequently reported among toddler foods than infant-specific products [11,24]. The present findings therefore reinforce the importance of examining sodium within specific formulation types rather than relying exclusively on overall compliance percentages.
The complete failure of products in subcategory 4.5 to meet the protein criteria deserves particular attention. Although these products were classified as consisting primarily of a named protein source, none met the corresponding NPPM requirement. International evaluations have similarly identified insufficient protein in some savory CPCFs and considerable differences in protein compliance among markets [11,42]. This result also reinforces a finding from the ingredient analysis: product category and product name alone may not adequately indicate the formulation’s nutritional contribution. Therefore, evaluating of both ingredient hierarchy and nutrient composition is necessary to determine whether prominently presented protein sources make a nutritionally meaningful contribution.
Beverages require a different interpretation from all other product categories. They were retained in the database but not included in the nutrient compliance calculations because the NPPM classifies drinks and beverages as not appropriate for promotion to infants and young children [10]. Therefore, the absence of compliance results for beverages does not represent missing products or favorable nutritional performance. Instead, it reflects the position of the model that these products should not be promoted for this population.
Applying the NPPM provides an internationally relevant benchmark for identifying these priorities and contributes evidence for future discussions on the nutritional quality, formulation, and regulation of foods marketed for infants and young children in Mexico.
4.5. Implications and Recommendations
The present findings indicate that improvement strategies for CPCFs should be category-specific. For manufacturers, the main priorities identified in this study include improving the energy density of products in which water represents a major formulation component, reducing added free sugars and sweeteners in snacks and fruit-based products, and controlling total fat and sodium in the categories with the highest NPPM non-compliance. Reformulation should also favor greater flavor diversity, including vegetable-dominant and simpler formulations, rather than relying extensively on sweet fruit bases that may mask fewer familiar flavors [10,43]. In addition, the high frequency of rice-derived ingredients identified in snacks supports the need for future surveillance of inorganic arsenic and other contaminants in these products.
From a regulatory perspective, the category-specific patterns of non-compliance identified using the NPPM highlight the need for more specific criteria for foods marketed to infants and young children in Mexico. Priorities include clearer regulation of added sugars and sweetening ingredients, category-specific sodium and fat limits, standardized serving-size declarations, and greater transparency regarding formulation characteristics that cannot currently be assessed from labels, such as the proportion of added water. Greater consistency between product names, front-of-package presentation, and predominant ingredients would also allow caregivers to evaluate better the actual composition of these foods [10,11].
For caregivers, the combined evaluation of nutrient composition, ingredients, and price demonstrates that product selection should not rely exclusively on package price or individual nutrient claims. The least expensive products were not necessarily the most economical sources of energy or protein, while inexpensive energy could coexist with less favorable nutritional characteristics. Reading the ingredient list together with the nutrition declaration may therefore support better-informed choices. Nevertheless, recommendations should recognize that commercial foods offer convenience, portability, and reduced preparation time for families facing time and work constraints. Thus, the objective should not be to discourage their use entirely, but to improve product formulation, strengthen regulation, and provide caregivers with clearer information to support appropriate selection within a varied complementary diet.
5. Conclusions
This study demonstrates that evaluating CPCFs through a single dimension, such as nutrient composition or price alone, provides an incomplete assessment. The integration of nutrient composition, ingredient formulation, declared micronutrient fortification, food price metrics, and the NPPM revealed distinct nutritional strengths and limitations across product categories that would not have been identified using any individual approach.
These findings indicate that category-specific reformulation priorities are needed. For example, vegetable-based purees and savory meals should prioritize sodium reduction, whereas snack products should prioritize lowering total fat and eliminating added free sugars. Likewise, improving energy density remains an important opportunity for several product categories intended for complementary feeding.
Although the NPPM is not currently adopted as a regulatory standard in Mexico, its application identified specific nutritional targets that could inform future product development, voluntary reformulation initiatives, and evidence-based policy discussions. The multidimensional framework presented here may also help health professionals interpret commercial complementary foods beyond individual nutritional claims or product price.
Author Contributions
Conceptualization, R.M.M.-M. and A.C.; methodology, S.B.-M., R.M.M.-M. and A.C.; formal analysis, S.B.-M. and R.M.M.-M.; data curation, R.M.M.-M. and A.C.; writing—original draft preparation, S.B.-M. and R.M.M.-M.; writing—review and editing, R.M.M.-M. and A.C.; supervision, A.C. and R.M.M.-M.; funding acquisition, R.M.M.-M. and A.C. R.M.M.-M. and A.C. contributed equally to this article. All authors have read and agreed to the published version of the manuscript.
Funding
This research received financial support from Universidad Iberoamericana through the Extraordinary Call to Promote the Development or Consolidation of Research Projects, under the project entitled “Evaluation and Validation of X-ray Fluorescence Methodology for the Quantification of Lead in Infant Formula and Foods for Children under 24 Months”.
Institutional Review Board Statement
Not applicable.
Informed Consent Statement
Not applicable.
Data Availability Statement
The data presented in this study are available on request from the corresponding authors due to their being part of a larger project, “Evaluation and Validation of X-ray Fluorescence Methodology for the Quantification of Lead in Infant Formula and Foods for Children under 24 Months,” which includes additional data not analyzed or reported in this article.
Conflicts of Interest
The authors declare that they have no conflicts of interest from any commercial or financial relationships.
Abbreviations
The following abbreviations are used in this manuscript:
| WHO | World Health Organization |
| CPCFs | Commercially produced complementary foods |
| NPPM | WHO Europe Nutrient and Promotion Profile Model |
| IQR | Interquartile range |
References
- Abd El-Aziz, N.M.; Mansour, H.M.M.; Elbakatoshy, M.R.; Mehany, T.; Zannou, O.; Tahergorabi, R.; Shehata, M.G. Comparative nutritional analysis and sensory evaluation of three baby foods with low allergen ingredients for infants. Food Chem. X 2025, 28, 102533. [Google Scholar] [CrossRef] [Scilit]
- Brunacci, K.A.; Salmon, L.; McCann, J.; Gribble, K.; Fleming, C.A.K. The big squeeze: A product content and labelling analysis of ready-to-use complementary infant food pouches in Australia. BMC Public Health 2023, 23, 656. [Google Scholar] [CrossRef] [Scilit]
- Christian, P.; Mullany, L.C.; Hurley, K.M.; Katz, J.; Black, R.E. Nutrition and maternal, neonatal, and child health. Semin. Perinatol. 2015, 39, 361–372, Correction in Semin. Perinatol. 2015, 39, 505. [Google Scholar] [CrossRef] [Scilit]
- Rossiter, C.; Cheng, H.; Appleton, J.; Campbell, K.J.; Denney-Wilson, E. Addressing obesity in the first 1000 days in high risk infants: Systematic review. Matern. Child Nutr. 2021, 17, e13178. [Google Scholar] [CrossRef] [Scilit]
- World Health Organization. WHO Guideline for Complementary Feeding of Infants and Young Children 6–23 Months of Age; World Health Organization: Geneva, Switzerland, 2023. [Google Scholar]
- Bassetti, E.; Blankenship, J.; White, J.M.; Sweet, L.; Threapleton, D.; Pries, A.M. Benchmarking the nutrient composition and labelling practices of dry or instant cereals for older infants and young children across seven Southeast Asian countries. Matern. Child Nutr. 2023, 19, e13603. [Google Scholar] [CrossRef] [Scilit]
- Lutter, C.K.; Grummer-Strawn, L.; Rogers, L. Complementary feeding of infants and young children 6 to 23 months of age. Nutr. Rev. 2021, 79, 825–846. [Google Scholar] [CrossRef] [Scilit]
- Brand-Williamson, J.; Parrett, A.; Sibson, V.; Garcia, A.L. Commercial baby foods: Nutrition, marketing and motivations for use—A narrative review. Matern. Child Nutr. 2025, 21, e70059. [Google Scholar] [CrossRef] [Scilit]
- Unar-Munguía, M.; Santos-Guzmán, A.; Mota-Castillo, P.J.; Ceballos-Rasgado, M.; Tolentino-Mayo, L.; Sachse Aguilera, M.; Cobo Armijo, F.; Barquera, S.; Bonvecchio, A. Digital marketing of formula and baby food negatively influences breast feeding and complementary feeding: A cross-sectional study and video recording of parental exposure in Mexico. BMJ Glob. Health 2022, 7, e009904. [Google Scholar] [CrossRef] [Scilit]
- World Health Organization. Nutrient and Promotion Profile Model: Supporting Appropriate Promotion of Food Products for Infants and Young Children 6–36 Months in the WHO European Region; World Health Organization Regional Office for Europe: Copenhagen, Denmark, 2022. [Google Scholar]
- Bozkir, C.; Esin, K.; Threapleton, D.; Cade, J.E. Evaluating alignment of UK commercial baby food products with the WHO nutrient and promotion profile model. Eur. J. Pediatr. 2025, 184, 128. [Google Scholar] [CrossRef] [Scilit]
- Grammatikaki, E.; Wollgast, J.; Caldeira, S. High levels of nutrients of concern in baby foods available in Europe that contain sugar-contributing ingredients or are ultra-processed. Nutrients 2021, 13, 3105. [Google Scholar] [CrossRef] [Scilit]
- Pace, L.; Bica, M.; Williams, J.; Hutchinson, J.; Cade, J.E.; Wickramasinghe, K.; Vassallo, C.; Breda, J. High levels of sugar and salt in commercial baby foods in Malta: Results from a pilot study using the World Health Organization draft nutrient profile model. Malta Med. J. 2020, 32. Available online: https://www.mmsjournals.org/index.php/mmj/article/view/315 (accessed on 1 August 2026).
- Cantoral, A.; Betanzos-Robledo, L.; Collado-López, S.; García-Martínez, B.A.; Lamadrid-Figueroa, H.; Mariscal-Moreno, R.M.; Díaz-Ruiz, A.; Ríos, C.; Téllez-Rojo, M.M. Lead levels in the most consumed Mexican foods: First monitoring effort. Toxics 2024, 12, 318. [Google Scholar] [CrossRef] [Scilit]
- Codex Alimentarius Commission. General Standard for the Labelling of Pre-Packaged Foods, CXS 1 -1985; FAO/WHO: Rome, Italy, 1985; Revised 2024; Available online: https://www.fao.org/fao-who-codexalimentarius/sh-proxy/en/?lnk=1&url=https%3A%2F%2Fworkspace.fao.org%2Fsites%2Fcodex%2FStandards%2FCXS+1-1985%2FCXS_001e.pdf (accessed on 1 August 2026).
- U.S. Food and Drug Administration. 21 CFR § 101.4—Food; Designation of Ingredients. In Code of Federal Regulations; Title 21, Part 101.4; U.S. Government Publishing Office: Washington, DC, USA, 2025. Available online: https://www.ecfr.gov/current/title-21/section-101.4 (accessed on 1 August 2026).
- Secretaría de Economía; Secretaría de Salud. Norma Oficial Mexicana NOM-051-SCFI/SSA1-2010, Especificaciones Generales de Etiquetado para Alimentos y Bebidas No Alcohólicas Preenvasados—Información Comercial y Sanitaria; Diario Oficial de la Federación: Ciudad de México, Mexico, 2010. Available online: https://www.dof.gob.mx/normasOficiales/7953/seeco11_C/seeco11_C.htm (accessed on 1 August 2026).
- Bank of Mexico. Average Exchange Rate for the Period (CF86). 2026. Available online: https://www.banxico.org.mx/SieInternet/consultarDirectorioInternetAction.do?accion=consultarCuadro&idCuadro=CF86&locale=es§or=6 (accessed on 1 October 2026).
- Aburto, T.C.; Cantoral, A.; Hernández-Barrera, L.; Carriquiry, A.L.; Rivera, J.A. Usual dietary energy density distribution is positively associated with excess body weight in Mexican children. J. Nutr. 2015, 145, 1524–1530. [Google Scholar] [CrossRef] [Scilit]
- Antignani, A.; Francavilla, R.; Vania, A.; Leonardi, L.; Di Mauro, C.; Tezza, G.; Cristofori, F.; Dargenio, V.N.; Scotese, I.; Palma, F.; et al. Nutritional assessment of baby food available in Italy. Nutrients 2022, 14, 3722. [Google Scholar] [CrossRef] [Scilit]
- Fernando Ceccon, L.; Kebbe, M. Characterising nutritional composition and labelling of packaged infant foods in Canada. J. Nutr. Sci. 2025, 14, e10037. [Google Scholar] [CrossRef] [Scilit]
- Barragán-Vázquez, S.; Ramírez-Silva, I.; Olvera-Mayorga, G.; Ancira-Moreno, M.; Dommarco, J.A.R.; Cantoral, A.; Ávila-Jiménez, L.; Terrazas Meraz, M.A.; Moran, S.A.H.; Threapleton, D. Early life added sugars and associated appetite, satiety, growth and adiposity in the first 2 years of life. Nutrients 2026, 18, 833. [Google Scholar] [CrossRef] [Scilit]
- World Health Organization Regional Office for Europe. Ending Inappropriate Promotion of Commercially Available Complementary Foods for Infants and Young Children between 6 and 36 Months in Europe; World Health Organization Regional Office for Europe: Copenhagen, Denmark, 2019. [Google Scholar]
- Scully, M.; Jinnette, R.; McAleese, A.; Schmidtke, A. Snack foods for Australian infants and toddlers: Prevalence, processing, and nutritional quality. Health Promot. Int. 2025, 40, daaf188. [Google Scholar] [CrossRef] [Scilit]
- Bakke, A.J.; Carney, E.M.; Higgins, M.J.; Moding, K.; Johnson, S.L.; Hayes, J.E. Blending dark green vegetables with fruits in commercially available infant foods makes them taste like fruit. Appetite 2020, 150, 104652. [Google Scholar] [CrossRef] [Scilit]
- Garcia, A.L.; McLean, K.; Wright, C.M. Types of fruits and vegetables used in commercial baby foods and their contribution to sugar content. Matern. Child Nutr. 2016, 12, 838–847. [Google Scholar] [CrossRef] [Scilit]
- Maslin, K.; Venter, C. Nutritional aspects of commercially prepared infant foods in developed countries: A narrative review. Nutr. Res. Rev. 2017, 30, 138–148. [Google Scholar] [CrossRef] [Scilit]
- Gutiérrez, T.J. Food Science, Technology and Nutrition for Babies and Children; Springer International Publishing: Berlin/Heidelberg, Germany, 2020. [Google Scholar] [CrossRef] [Scilit]
- Collado-López, S.; Hernández, M.F.R.; Mariscal-Moreno, R.M.; Téllez-Rojo, M.M.; Betanzos-Robledo, L.; Luna, M.R.; Cantoral-Preciado, A. Concentrations of heavy metals in processed baby foods and infant formulas worldwide: A scoping review. Nutr. Rev. 2026, 84, 448–461. [Google Scholar] [CrossRef] [Scilit]
- TatahMentan, M.; Nyachoti, S.; Godebo, T.R. Elemental composition of toxic and essential elements in rice-based baby foods from the United States and other countries: A probabilistic risk analysis. Food Chem. Toxicol. 2024, 188, 114677. [Google Scholar] [CrossRef] [Scilit]
- Trasande, L.; Shaffer, R.M.; Sathyanarayana, S. Food additives and child health. Pediatrics 2018, 142, e20181410. [Google Scholar] [CrossRef] [Scilit]
- Secretaría de Salud. Norma Oficial Mexicana NOM-131-SSA1-2012, Productos y Servicios. Fórmulas para Lactantes, de Continuación y para Necesidades Especiales de Nutrición. Alimentos y Bebidas No Alcohólicas para Lactantes y Niños de Corta Edad. Disposiciones y Especificaciones Sanitarias y Nutrimentales. Etiquetado y Métodos de Prueba; Diario Oficial de la Federación: Ciudad de México, Mexico, 2012. Available online: https://www.dof.gob.mx/nota_detalle.php?codigo=5267447&fecha=10/09/2012 (accessed on 1 August 2026).
- Schwarzenberg, S.J.; Georgieff, M.K. Advocacy for improving nutrition in the first 1000 days to support childhood development and adult health. Pediatrics 2018, 141, e20173716. [Google Scholar] [CrossRef] [Scilit]
- Anzman-Frasca, S.; Ventura, A.K.; Ehrenberg, S.; Myers, K.P. Promoting healthy food preferences from the start: A narrative review of food preference learning from the prenatal period through early childhood. Obes. Rev. 2018, 19, 576–604. [Google Scholar] [CrossRef] [Scilit]
- Reyes, M.; Smith Taillie, L.; Popkin, B.; Kanter, R.; Vandevijvere, S.; Corvalán, C. Changes in the amount of nutrient of packaged foods and beverages after the initial implementation of the Chilean Law of Food Labelling and Advertising: A nonexperimental prospective study. PLoS Med. 2020, 17, e1003220. [Google Scholar] [CrossRef] [Scilit]
- Gómez-Martín, M.; Arboleya, S.; Gueimonde, M.; González, S. Nutritional composition of processed baby foods targeted at infants from 0–12 months. J. Food Compos. Anal. 2019, 79, 55–62. [Google Scholar] [CrossRef] [Scilit]
- Harris, J.L.; Romo-Palafox, M.J.; Gershman, H.; Kagan, I.; Duffy, V. Healthy snacks and drinks for toddlers: A qualitative study of caregivers’ understanding of expert recommendations and perceived barriers to adherence. Nutrients 2023, 15, 1006. [Google Scholar] [CrossRef] [Scilit]
- Hässig-Wegmann, A.; Román, S.; Sanchez-Siles, L.; Siegrist, M. From store to home: Insights into parental baby snack choices. Appetite 2025, 214, 108219. [Google Scholar] [CrossRef] [Scilit]
- Lee, J.J.; Middleton, C.G.; Mulligan, C.; Vergeer, L.; Hammond, L.; L’Abbé, M.R. A cross-sectional analysis of the nutritional quality and prices of commercial infant and toddler food products in the Canadian food supply. Paediatr. Child Health 2025, 30, 421–427. [Google Scholar] [CrossRef] [Scilit]
- Neve, K.L.; Coleman, P.; Hawkes, C.; Vogel, C.; Isaacs, A. What shapes parental feeding decisions over the first 18 months of parenting: Insights into drivers towards commercial and home-prepared foods among different socioeconomic groups in the UK. Appetite 2024, 196, 107260. [Google Scholar] [CrossRef] [Scilit]
- Coyle, D.H.; Shahid, M.; Parkins, K.; Hu, M.; Padovan, M.; Dunford, E.K. An evaluation of the nutritional and promotional profile of commercial foods for infants and toddlers in the United States. Nutrients 2024, 16, 2782. [Google Scholar] [CrossRef] [Scilit]
- Leszczyńska, P.M.; de las Heras-Delgado, S.; Shyam, S.; Threapleton, D.; Cade, J.; Salas-Salvadó, J.; Babio, N. Nutritional content and promotional practices of foods for infants and young children on the Spanish market: A cross-sectional product evaluation. Eur. J. Pediatr. 2025, 184, 333. [Google Scholar] [CrossRef] [Scilit]
- Hutchinson, J.; Rippin, H.; Threapleton, D.; Jewell, J.; Kanamäe, H.; Salupuu, K.; Caroli, M.; Antignani, A.; Pace, L.; Vassallo, C.; et al. High sugar content of European commercial baby foods and proposed updates to existing recommendations. Matern. Child Nutr. 2021, 17, e13020. [Google Scholar] [CrossRef] [Scilit]

Disclaimer/Publisher’s Note: The statements, opinions and data contained in all publications are solely those of the individual author(s) and contributor(s) and not of MDPI and/or the editor(s). MDPI and/or the editor(s) disclaim responsibility for any injury to people or property resulting from any ideas, methods, instructions or products referred to in the content. |
© 2026 by the authors. Licensee MDPI, Basel, Switzerland. This article is an open access article distributed under the terms and conditions of the Creative Commons Attribution (CC BY) license.