


Abstract
Organophosphorus pesticide residues severely threaten agricultural products. Thus, it is important to explore sensitive and efficient analytical detection methods for target detection. In this study, a lychee-like gold core-manganese oxide shell structure (Au@MnOx) was synthesized, which displays prominent oxidase (OXD)-like activity. It is able to catalyze 3,3′,5,5′-tetramethylbenzidine (TMB) oxidation to a blue product (oxTMB) without the need for hydrogen peroxide. Malathion can inhibit acid phosphatase (ACP) activity, reduce L-ascorbic acid (AA) production, weaken the color-quenching effect, and restore blue color to the system. Based on this “signal inhibition-recovery” mode, a colorimetric sensor was constructed and applied to quantitatively analyze malathion in food matrices, with a limit of detection (LOD) of 1.51 ng/mL. The average recoveries of malathion in cucumber and cabbage samples were in the ranges of 97.2–104.5% and 99.4–102.5%, respectively, with all relative standard deviations (RSDs) less than 7%. This study provides a sensitive and efficient colorimetric detection strategy for malathion, which has significant application value in the field of food safety.
1. Introduction
As a widely used compound worldwide [1,2], organophosphate pesticides (OPs) are essential for controlling crop diseases, insect pests, and weeds [3,4]. However, the actual production and extensive use of OPs are not carried out in accordance with the regulations, resulting in excessive residues being found in agricultural products and the ecological environment [5,6]. More seriously, once these residual pesticides enter an organism through the food chain [7], they will harm the human immune system and endocrine system and can even cause cancer. In addition, OPs can irreversibly inhibit cholinesterasethe activity, which causes acetylcholine to accumulate in the body [8,9]. Meanwhile, they impair the normal regulatory function of the nervous system and bring serious risks to human health [10,11]. Moreover, the harmful components of pesticides entering water, soil, and other environments will also cause pollution of nature, destroy the ecological balance, and affect biodiversity. Developing sensitive, reliable, and rapid detection approaches for pesticide residues is critical to guarantee food safety and maintain the ecological environment.
Traditional instrument-based detection methods for pesticide residues have high precision and accuracy [12,13,14]. However, large instruments and equipment are expensive, have high maintenance costs, long testing cycles, and require complex sample pretreatment processes that require professional operators, making it hard to carry out on-site detection at the grassroot level [15,16]. Nanoenzymes are a type of enzyme mimic that can exhibit catalytic performances analogous to natural enzymes at the nanoscale, and they are essentially nanomaterials [17,18,19]. In recent years, nanoenzymes have shown extensive application potential in biomedical detection, agricultural product safety, environmental monitoring, and other areas due to their high stability, strong compatibility, and ability to simulate various enzyme activities [20,21,22,23]. As a fast and portable detection method, the colorimetric method features intuitive visible results and is well suited for field on-site detection [24]. The combination of nanoenzymes and colorimetric methods not only presents excellent potential for analytical and monitoring research but also gives rise to a series of high-performance nanoenzyme colorimetric sensing strategies [25,26]. Compared with traditional methods, the nanozyme-based colorimetric method is usually simple to operate, fast in response, and low in cost [27]. It does not require large-scale equipment, which is extremely conducive to the development of portable sensor devices [28,29,30]. In addition, nanozymes have excellent stability and are easy to synthesize and store on a large scale [31,32]. These advantages significantly enhance the reliability and service life of sensors. Therefore, exploring the application of nanozymes in colorimetric sensing is of great significance and research value.
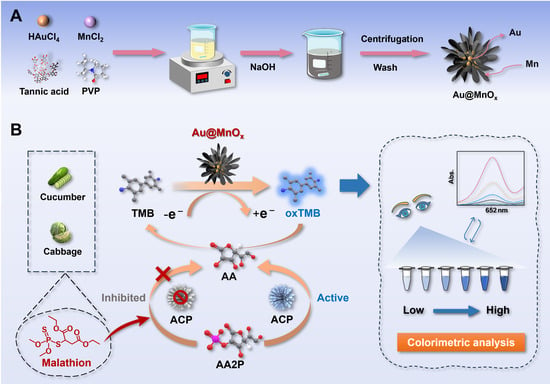
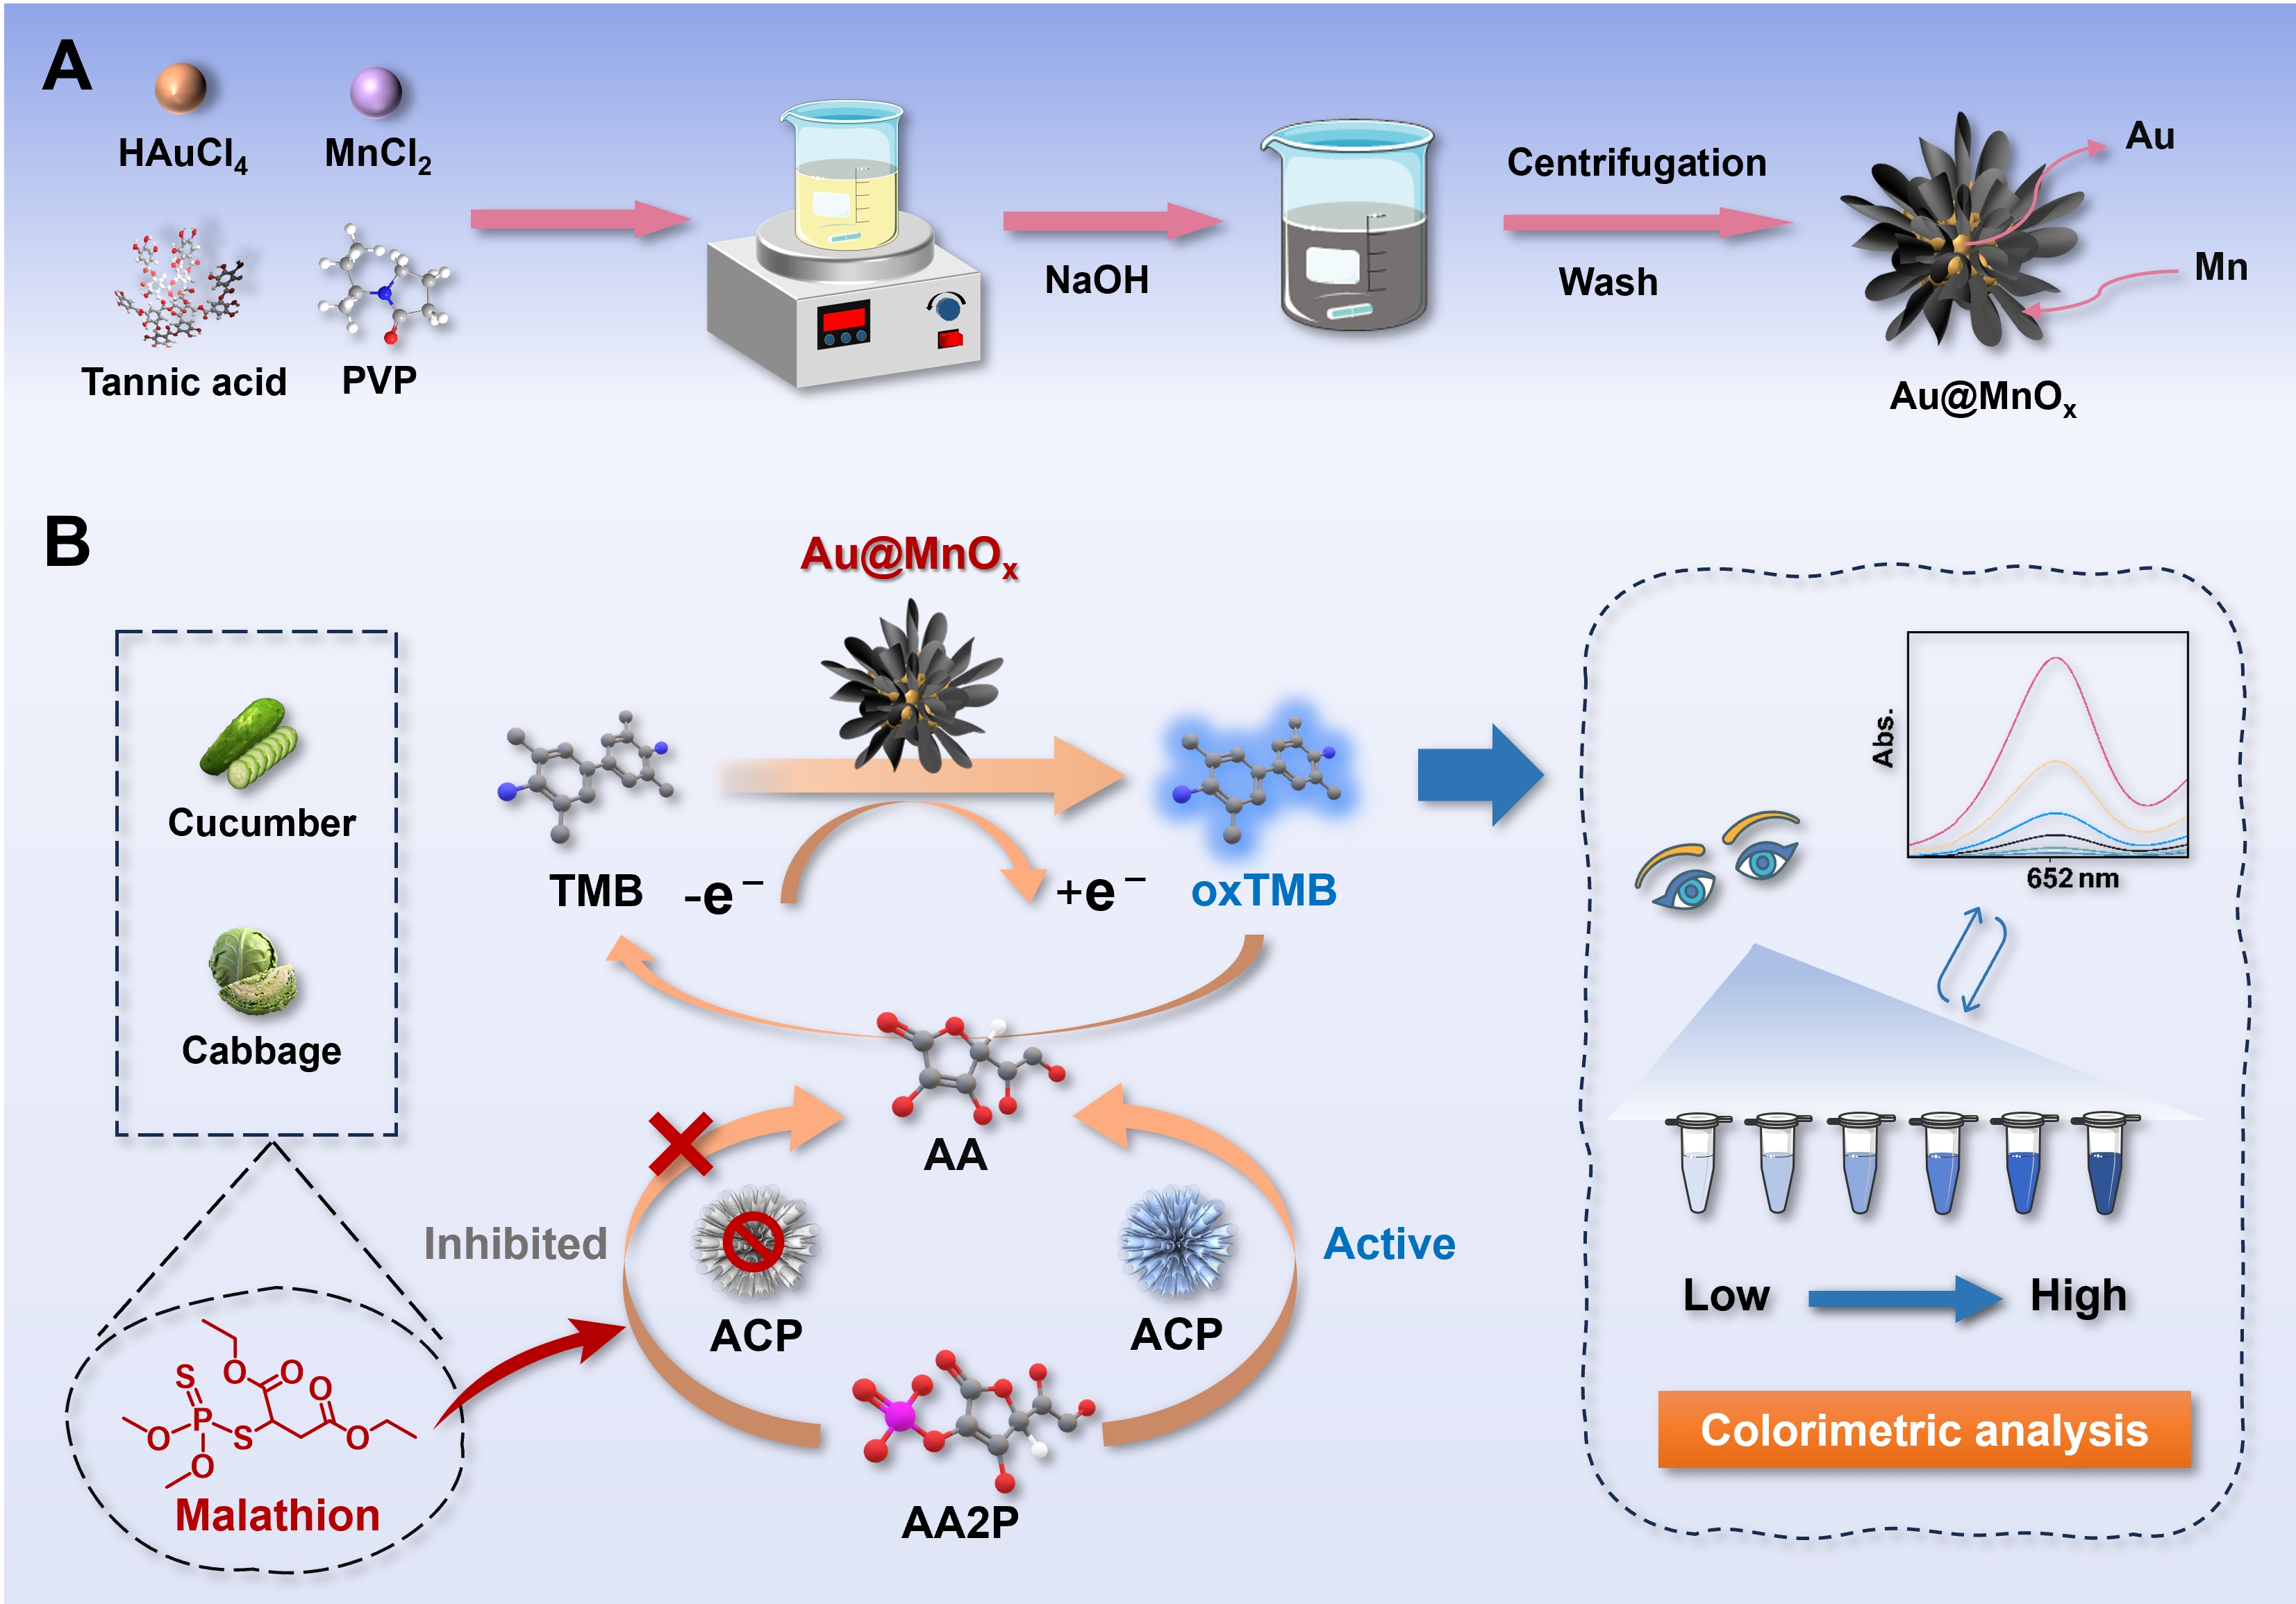
In this study, a lychee-like gold core-manganese shell structure (Au@MnOx) has been synthesized (Scheme 1A). Subsequently, a colorimetric sensing platform using Au@MnOx was established (Scheme 1B). The Au@MnOx nanozyme exhibits excellent oxidase (OXD)-like activity. It can catalyze the oxidation of 3,3′,5,5′-tetramethylbenzidine (TMB) to form blue oxidized TMB (oxTMB) through electron transfer, without the participation of hydrogen peroxide. L-ascorbic acid-2-phosphate (AA2P) can be hydrolyzed by acid phosphatase (ACP) to yield ascorbic acid (AA). AA can effectively reduce oxTMB and compete with nanoenzyme activity, resulting in color fading of the solution. When malathion is present in the system, ACP activity can be suppressed, which reduces the yield of AA. This process further weakens the quenching effect of the color reaction, allowing the system to restore a blue color. Based on this, the colorimetric sensing platform was established to detect residues of malathion.
Scheme 1.
Schematic diagram of (A) synthesis of Au@MnOx nanoenzyme and (B) the construction of a colorimetric probe for malathion residue detection based on the Au@MnOx nanozyme.
2. Materials and Methods
2.1. Apparatus and Reagents
The micromorphology of Au@MnOx was analyzed by transmission electron microscopy (TEM) (FEI Talos F200x, Thermo Fisher Scientific, Waltham, MA, USA). The surface elemental composition and chemical valence state of Au@MnOx were analyzed using X-ray photoelectron spectroscopy (XPS) (ESCALAB 250Xi, Thermo Fisher Scientific, Waltham, MA, USA). X-ray diffraction (XRD) (D8 ADVANCE, Bruker, Karlsruhe, Germany) was used to characterize the crystal structure of nanozymes. Fourier transform infrared spectroscopy (FTIR) (Nicolet IS10, Thermo Fisher Scientific, Waltham, MA, USA) was used to characterize the functional groups and chemical bond information on the Au@MnOx surface. Ultraviolet-visible spectroscopy was used to measure UV–visible (UV-vis) spectra using a spectrophotometer (UV-1800, Shimadzu, Kyoto, Japan).
Gold chloride trihydrate (HAuCl4·3H2O), manganese chloride (MnCl2·4H2O), tartaric acid (TA), polyvinyl pyrrolidone (PVP, MW~10,000), sodium hydroxide (NaOH), sodium tetraborate decahydrate, boric acid, 3,3′,5,5′-tetramethylbenzidine (TMB), 2,2′-azinobis(3-ethylbenzthiazoline-6-sulfonic acid) (ABTS), o-phenylenediamine (OPD), benzoquinone (BQ), L-Histidine (L-His), isopropanol (IPA), ethylenediaminetetraacetic acid disodium salt (EDTA-2Na), L-ascorbic acid 2-phosphate (AA2P), and acid phosphatase (ACP) were purchased from Aladdin Biochemical Technology Co., Ltd. (Shanghai, China). Malathion, triazophos (TZP), phorate (PHO), isofenphos-methyl (IFM), parathion-methyl (PRM), parathion (PRT), and dicofol (DIC) were acquired from TMRM Quality Inspection Technology Co., Ltd. (Changzhou, China).
2.2. Synthesis of Au@MnOx
Au@MnOx was synthesized by following a previously documented procedure with minor modifications [33]. Briefly, HAuCl4·3H2O solution (1%, w/v) was added to 15 mL of ultrapure water under continuous stirring until the mixture was well mixed. After that, MnCl2·4H2O solution (100 mM), tartaric acid (TA, 0.58 mM), and polyvinylpyrrolidone (PVP, 1 mM, MW 10,000) were added to the mixture in sequence with constant stirring. Thereafter, NaOH solution (100 mM) was introduced into the mixture. Immediately upon addition, the solution gradually turned from pale yellow into grayish-black. Under constant stirring, the mixture was maintained at room temperature for 30 min. After the reaction was complete, the obtained product was separated and collected by centrifugation at 5000× g for 20 min. Then the supernatant was discarded, and the resultant product was washed and purified with ultrapure water three times to remove the remaining reactants, ensuring that the product was evenly dispersed during washing. Finally, the washed product was dispersed in boric acid buffer (200 mM, pH 8.0) for later use.
2.3. OXD-like Activity of Au@MnOx
The OXD-like performance of Au@MnOx was measured via the steady-state dynamics method. In the reaction system, the concentration of Au@MnOx remains constant, and TMB solutions of different concentrations are added separately. After rapid mixing, the reaction system absorbance at a wavelength of 652 nm was immediately monitored over time with a UV–visible (UV-vis) spectrophotometer. The initial reaction rate (v) was measured based on the amount of oxidized TMB (oxTMB) produced per unit time. Specifically, the value of v was derived from the absorbance change rate at 652 nm and the corresponding molar extinction coefficient of oxTMB at this wavelength, in accordance with the Lambert–Beer law. The values of kinetic parameters Km and Vmax were determined by fitting v against substrate concentration ([S]) according to the Michaelis–Menten equation as follows (Equation (1)):
To obtain linear fitting results and facilitate accurate calculation of the kinetic parameters, the experimental data were further processed by using the Lineweaver–Burk double reciprocal plotting approach (2) to calculate Vmax and Km:
2.4. Colorimetric Detection of Malathion
The experimental procedure for colorimetric determination of malathion was performed as follows. Briefly, 10 μL ACP solution (40 U/L) and serial concentrations of malathion solution (50 μL) were thoroughly mixed with 700 μL of 100 mM NaAc-HAc buffer (pH 4.0). Then, the resulting mixture was vortexed until homogeneous and then incubated at 37 °C for 20 min. After the incubation process was finished, the reaction system was supplemented with 10 μL AA2P solution (6 mM), 70 μL Au@MnOx (100 μg/mL), and 300 μL TMB solution (3 mM). The reaction was further continued for another 20 min at 37 °C to ensure sufficient reaction. Finally, UV-vis spectral scanning was performed to acquire the absorption profiles of the reaction mixtures.
2.5. Pretreatment of Actual Samples
To confirm whether the proposed colorimetric method is feasible, this study selected cucumber and cabbage for malathion spiked recovery experiments. Fresh cucumbers and cabbages were obtained from a supermarket in Chuzhou. In the spiked recovery experiment, the spiked concentrations of samples were 0.1, 0.5, and 2.0 μg/g, respectively. The specific preprocessing process for the sample was as follows. First, the edible portion of each sample was homogenized with a tissue homogenizer at 12,000 rpm for 2 min. Subsequently, 10.0 g of the homogenized sample was accurately weighed and transferred into a 50 mL polytetrafluoroethylene centrifuge tube. After adding 20 mL of acetonitrile, the mixture was vortexed at 2500 rpm for 2 min. Then, 0.1 g of activated carbon powder was added, and vortexing was continued for another 1 min to fully adsorb pigments from the sample. The mixture was then centrifuged at 4500× g for 10 min at room temperature. The supernatant was carefully collected and filtered through a 0.22 μm hydrophilic polyethersulfone (PES) syringe filter. An aliquot of 0.5 mL filtrate was taken and dried under nitrogen flow at 40 °C. Finally, the residue was reconstituted with 0.5 mL of 100 mM NaAc-HAc buffer (pH 4.0), and the reconstituted solution was subjected to the subsequent colorimetric assay.
3. Results
3.1. Synthesis and Characterization of Au@MnOx
As illustrated in Scheme 1A, the Au@MnOx with lychee-like structures were prepared by one-step co-reduction and co-precipitation methods. In this synthetic system, TA served as a critical reductant, while PVP functioned as a steric stabilizer to prevent agglomeration of the as-synthesized nanocomposites. Specifically, NaOH solution was introduced to rapidly raise the system pH to the alkaline range. Under such alkaline conditions, TA efficiently reduced Au3+ ions to Au atoms, which further aggregated to form cores. Simultaneously, Mn2+ ions were oxidized and precipitated in the alkaline and oxidizing atmosphere, with the Au acting as heterogeneous nucleation sites. During material synthesis, the reaction system undergoes a rapid color change from pale yellow to grayish black, which may be due to the generation of gold nanoparticles and the encapsulation of manganese oxide shells.
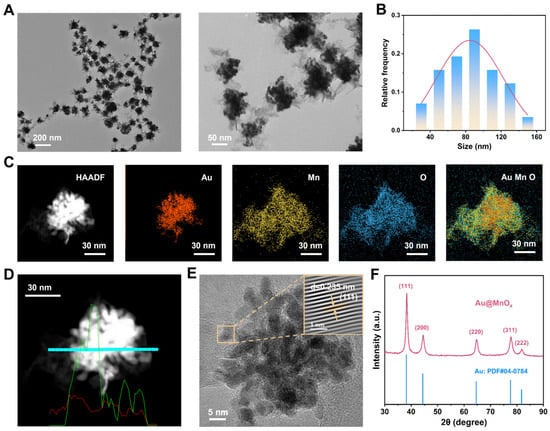
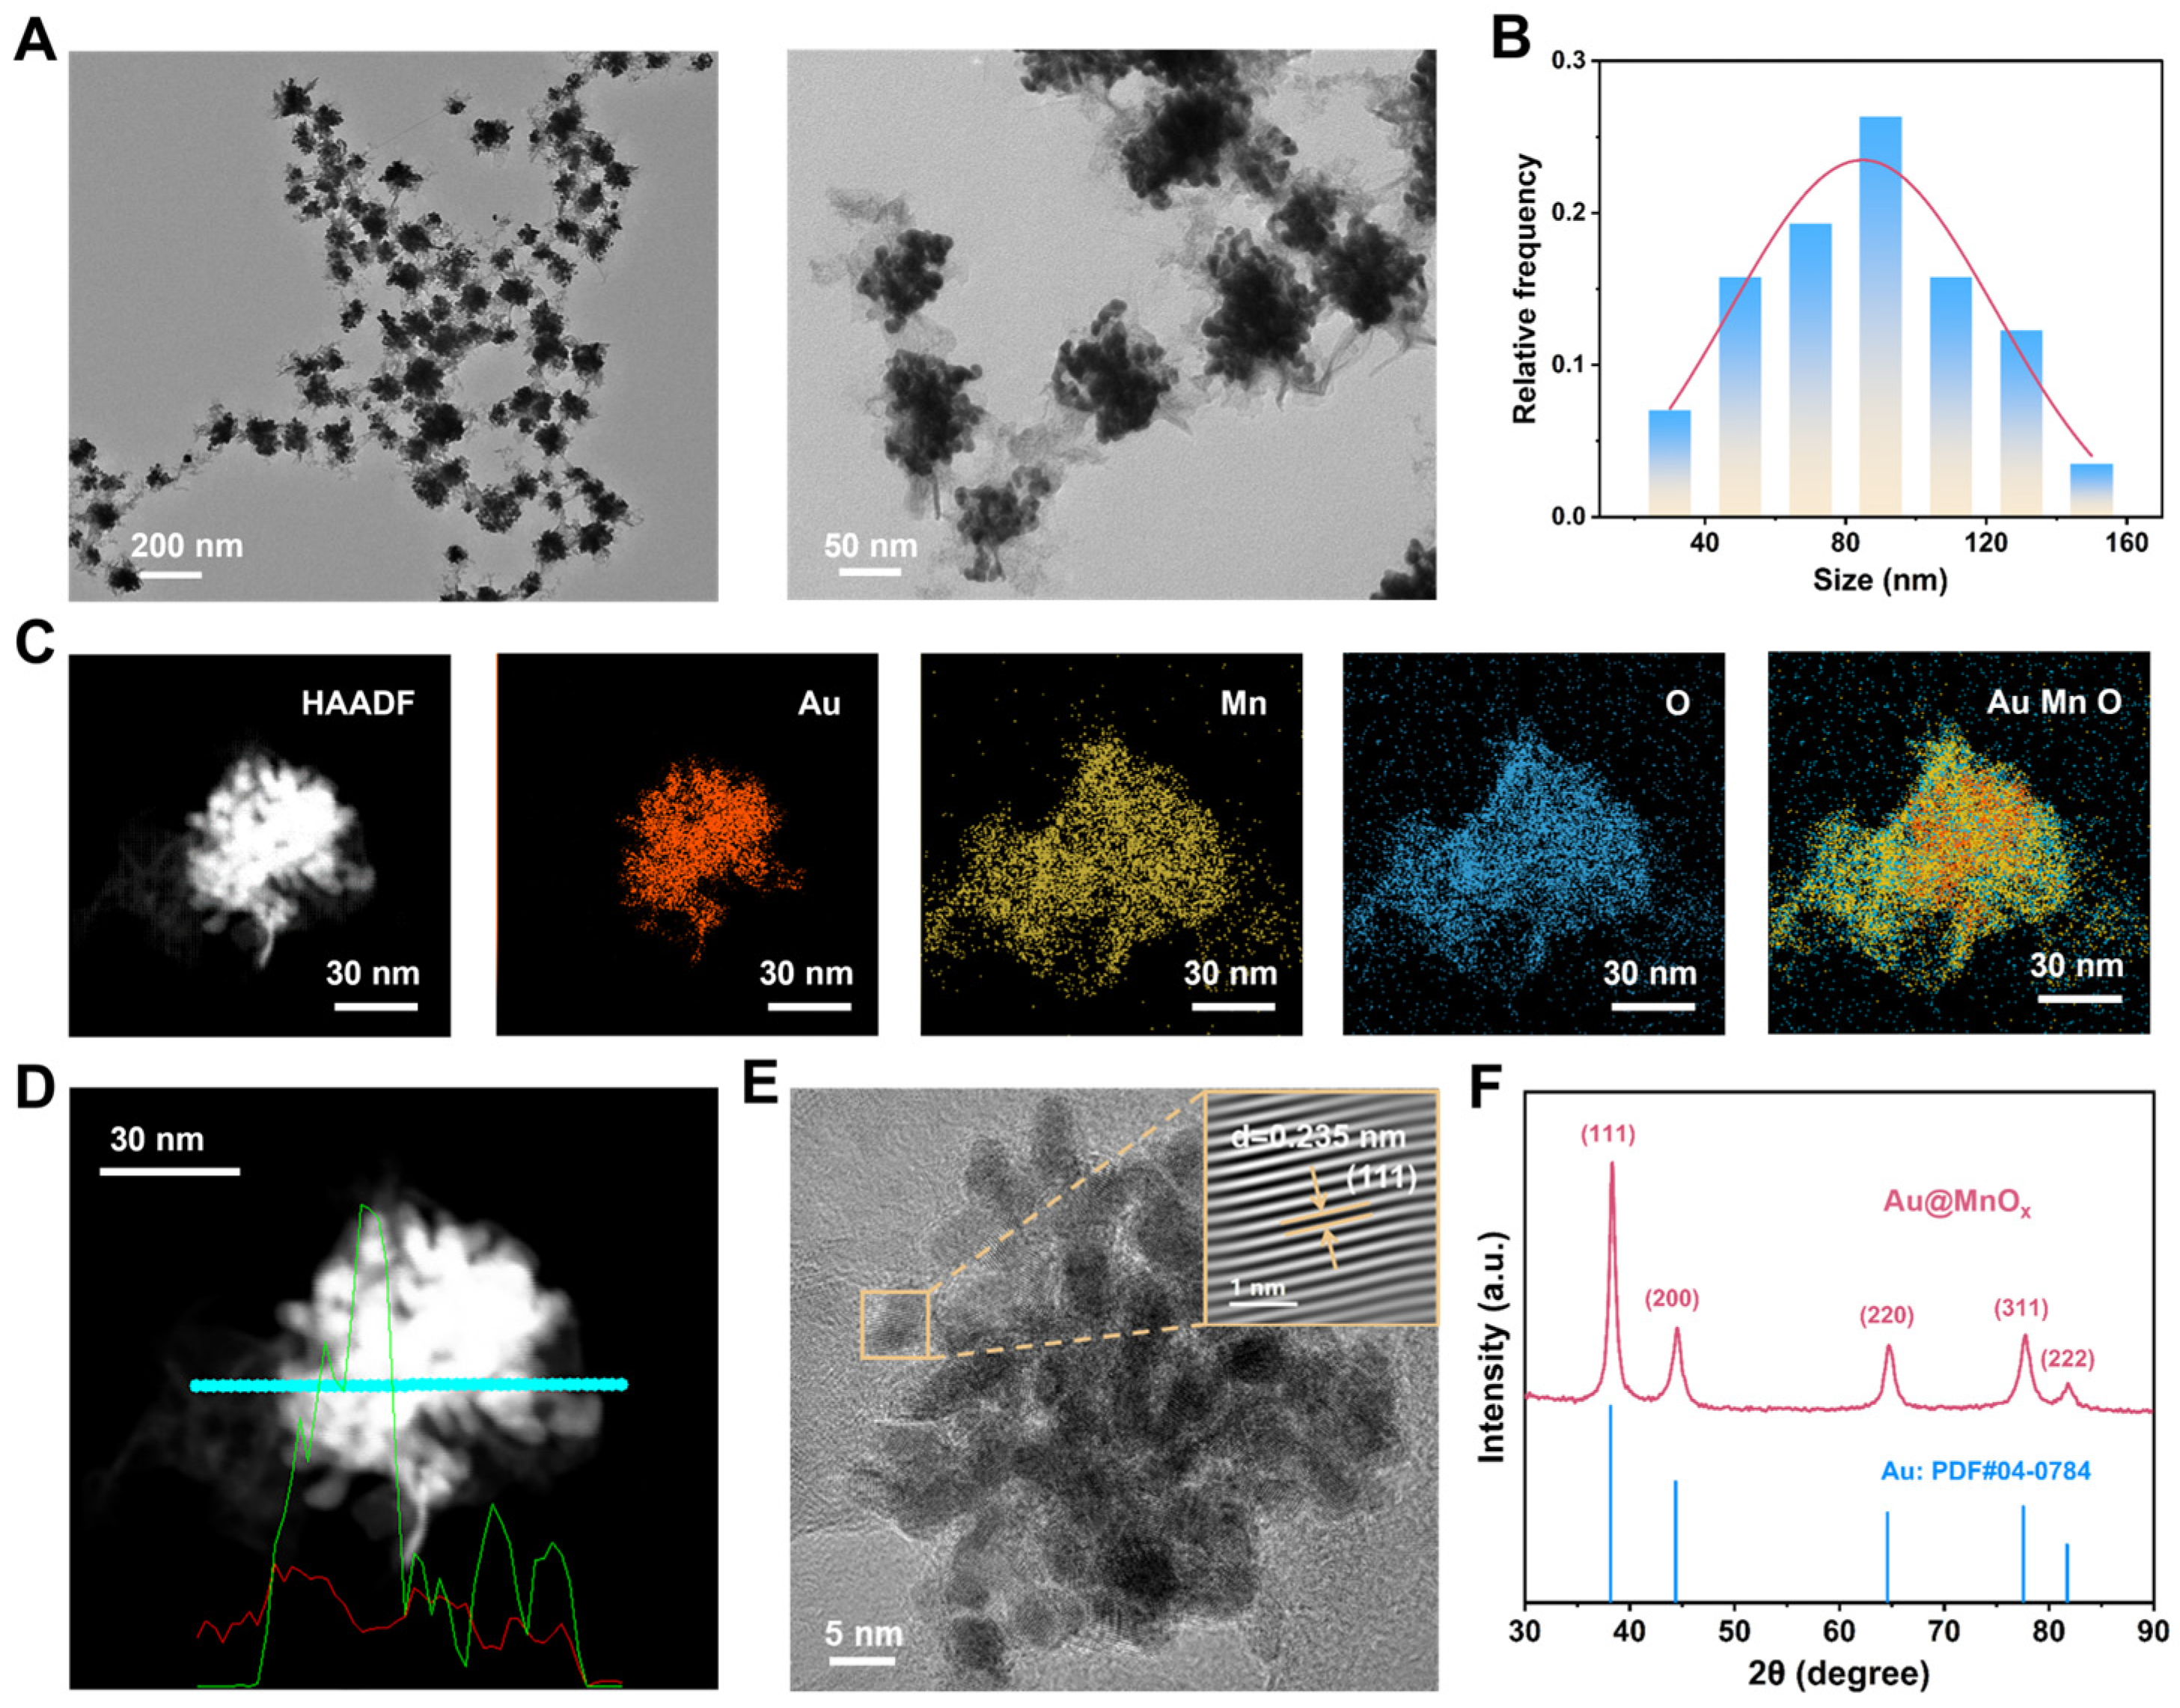
Transmission electron microscopy (TEM) was adopted to characterize the structural and morphological features of Au@MnOx. As shown in Figure 1A, Au@MnOx exhibited good dispersibility and uniform size, and individual particles can be observed to have a distinct lychee-like morphology and clear core–shell nanostructure. The particle size distribution histogram (Figure 1B) showed a mean particle diameter of 86 nm. Elemental distribution was characterized by means of high-angle annular dark field scanning transmission electron microscopy (HAADF-STEM) coupled with energy-dispersive spectroscopy (EDS). The EDS element mapping (Figure 1C) confirms the formation of the Au core and the manganese oxide (MnOx) shell. This result was further validated by the EDS line scan spectrum (Figure 1D). Quantitative EDS analysis (Figure S1) showed that the atomic percentages (At%) of O, Mn, and Au in the sample were 38.86%, 31.35%, and 29.79%, respectively, confirming the presence of all target elements in the Au@MnOx.
Figure 1.
The characterization of Au@MnOx. (A) TEM images of Au@MnOx (Left: low magnification; Right: high magnification). (B) Particle size distribution histogram of Au@MnOx. (C) HAADF-STEM image and corresponding EDS elemental mapping of Au@MnOx. (D) EDS line scan profile of a single Au@MnOx. The cyan line denotes the scanning track, while the green and red curves represent the line signals of Au and Mn elements, respectively. (E) High-resolution TEM (HR-TEM) image of Au@MnOx (Inset: lattice fringes of the Au (111) plane). (F) XRD pattern of Au@MnOx.
HR-TEM imaging (Figure 1E) displayed clear lattice fringes, and the measured lattice stripe spacing was 0.235 nm, which matched well with the (111) crystal plane of metallic Au [34,35]. This result was further validated by using XRD characterization. As presented in Figure 1F, the characteristic diffraction peaks located at 38.2°, 44.4°, 64.6°, and 77.6° were attributed to the (111), (200), (220), and (311) crystal planes of face-centered cubic (FCC) metallic Au (JCPDS No. 04-0784) [36,37,38], respectively, demonstrating the high crystallinity of the Au component in the composite material [39]. It is worth noting that no characteristic diffraction peaks corresponding to MnOx were detected in the XRD pattern, indicating that the MnOx component may exist in an amorphous state. These structural features enable sufficient exposure of active sites, thereby significantly improving the catalytic properties of Au@MnOx.
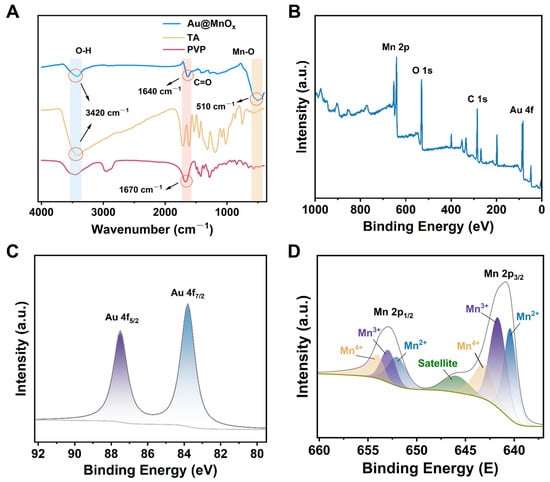
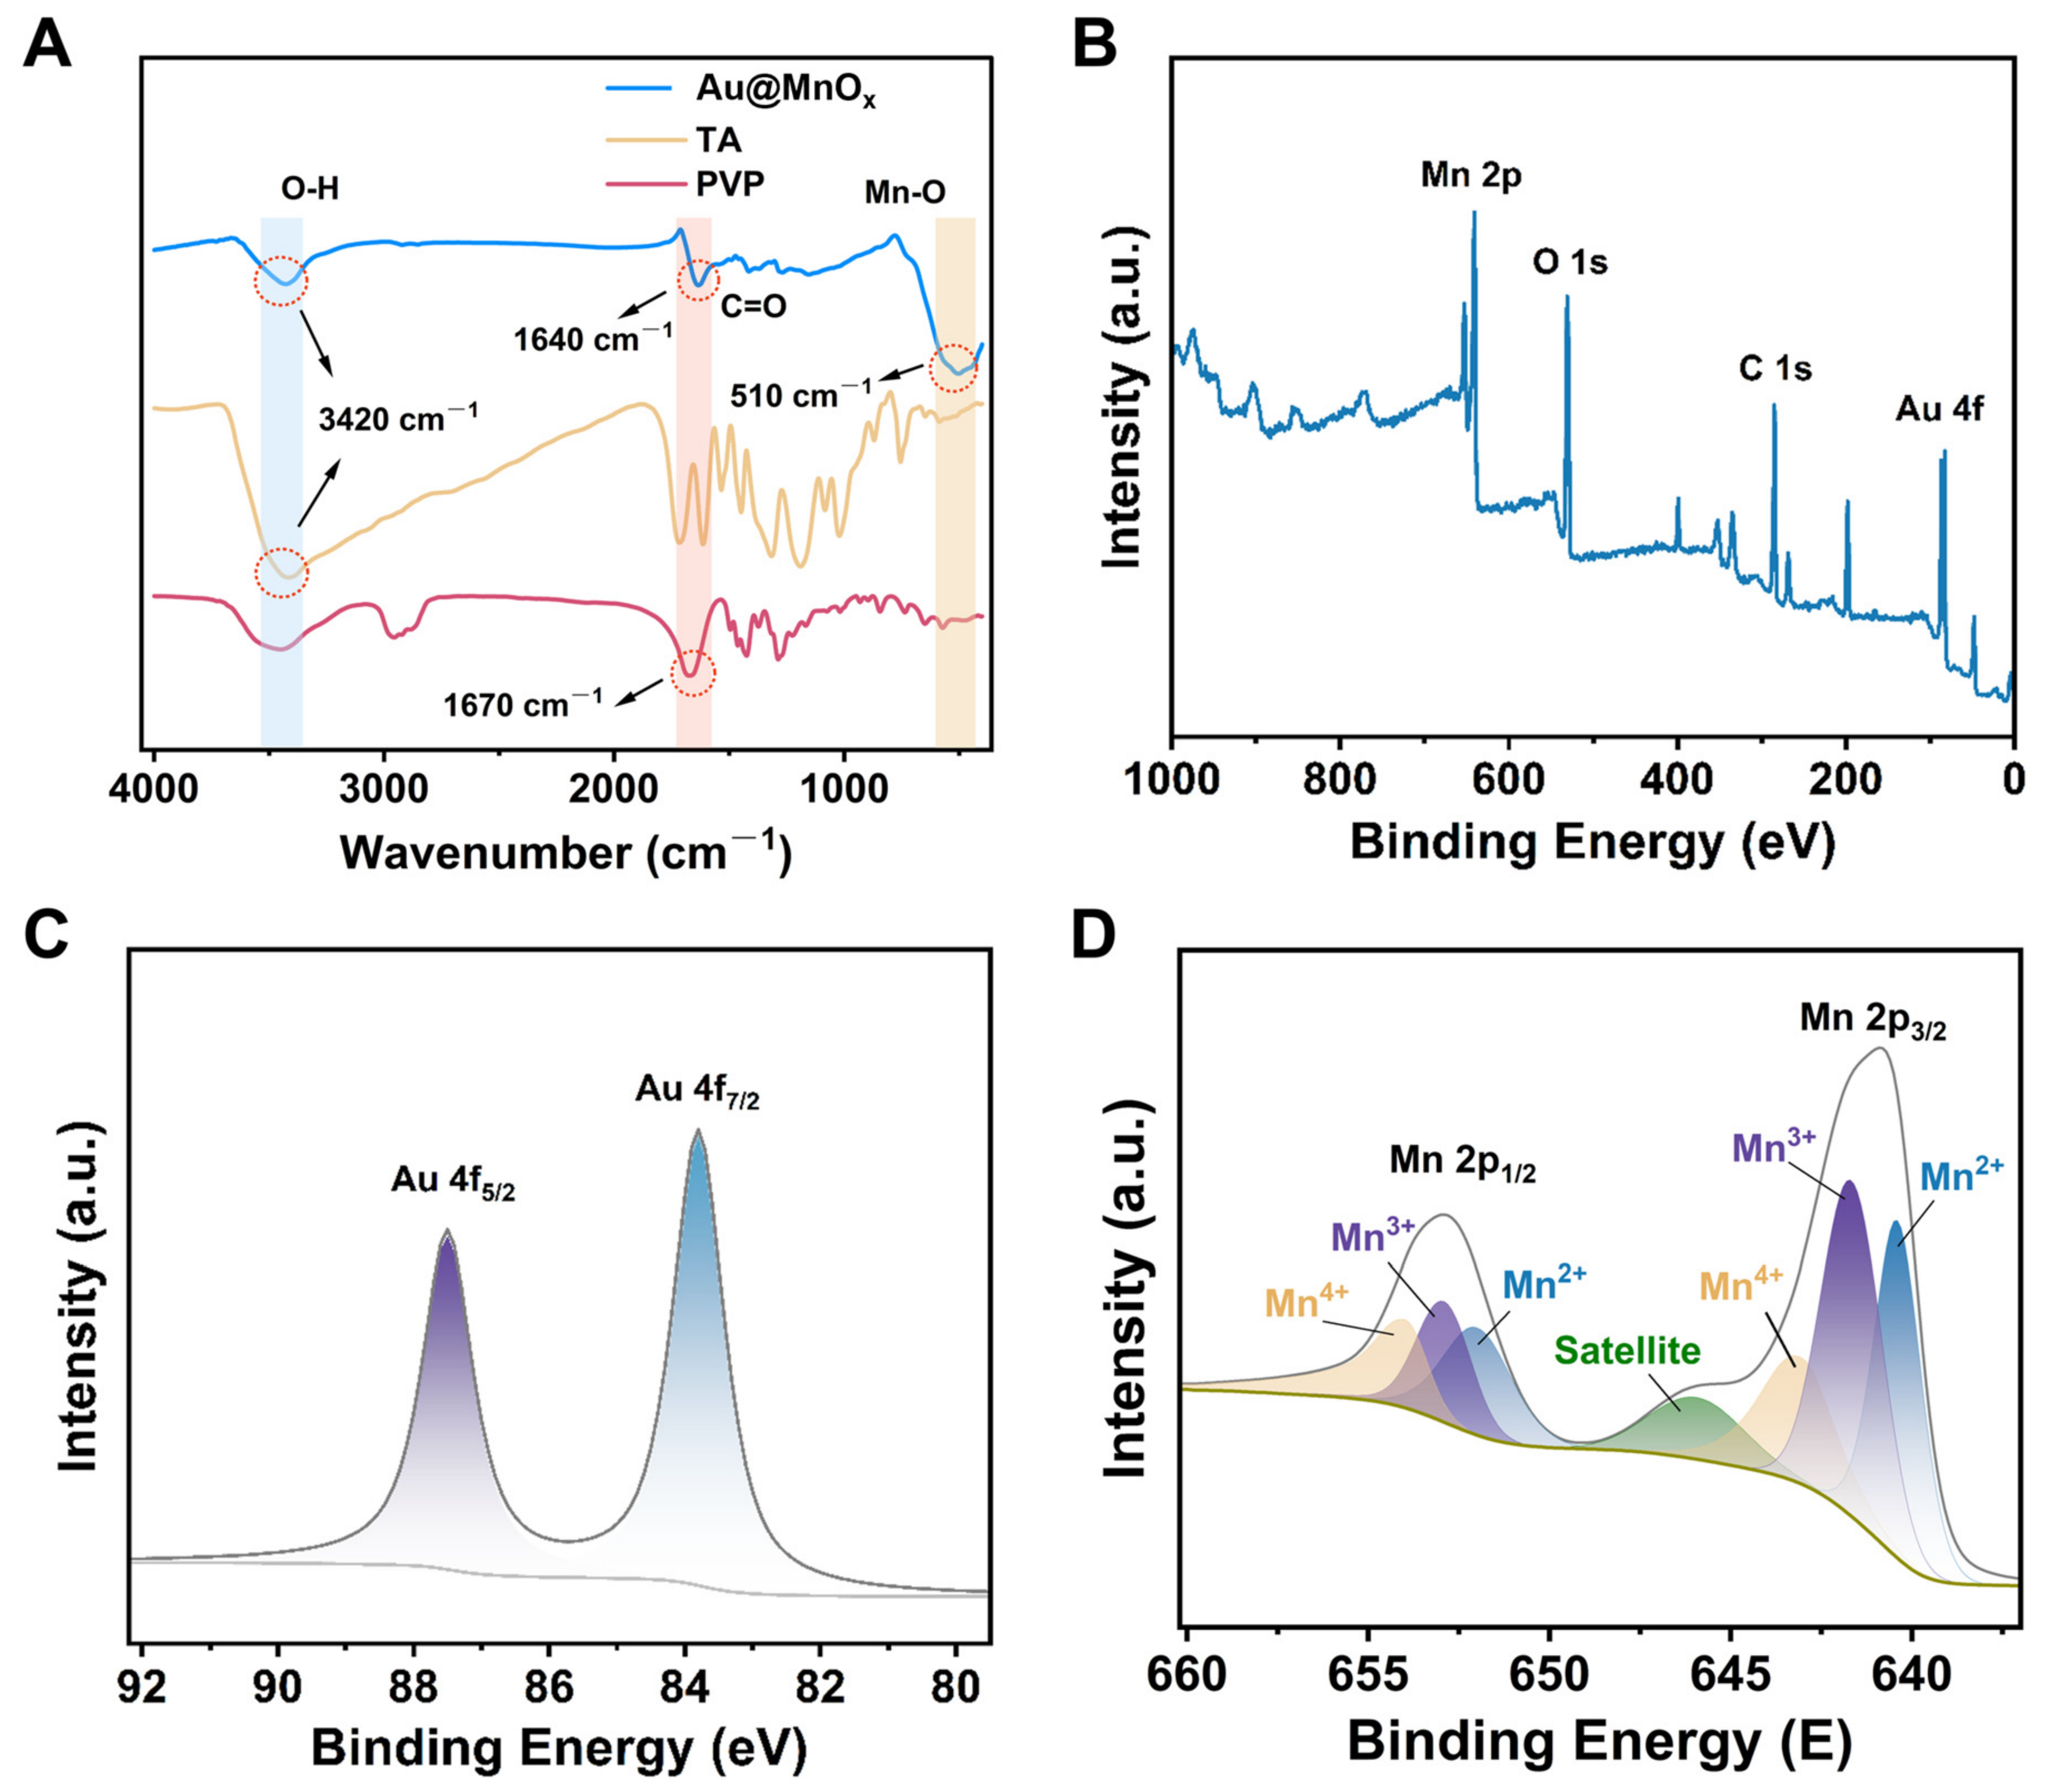
FTIR was used to further investigate the surface chemical groups of Au@MnOx (Figure 2A). The broad absorption signal appearing at around 510 cm−1 is attributed to the characteristic stretching vibration of the Mn-O bond, indicating the presence of MnOx. Combined with XRD analysis results, MnOx may mainly exist in an amorphous state. The absorption band around 1640 cm−1 originates from the C=O stretching vibration of PVP. Compared with pure PVP, the characteristic C=O absorption peak of PVP in Au@MnOx shifts significantly towards lower wave numbers, indicating the interaction between PVP and nanocomposite materials. In addition, the broad hydroxyl stretching vibration band at approximately 3400 cm−1 provides evidence for the presence of TA in Au@MnOx.
Figure 2.
Structural and elemental characterizations of Au@MnOx. (A) FTIR spectra of Au@MnOx, pure TA, and PVP. (B) XPS full-survey spectrum of Au@MnOx. High-resolution XPS spectra of (C) Au 4f and (D) Mn 2p.
Next, XPS was utilized for the elemental composition analysis of Au@MnOx. The results verified that the material mainly consists of Mn, Au, O, and C elements (Figure 2B). Furthermore, the high-resolution Au 4f energy spectrum (Figure 2C) exhibited typical double peaks of spin–orbit splitting located at 83.6 eV and 87.5 eV, which were assigned to Au 4f7/2 and Au 4f5/2 [40,41], respectively. The obtained value matches well with the characteristic splitting energy of metallic Au, indicating the presence of metallic Au in Au@MnOx. Both the Au 4f7/2 and Au 4f5/2 spectra present as single symmetric peaks, without the characteristic signal of high-valence Au3+, demonstrating that Au3+ ions from HAuCl4 were completely reduced to metallic Au0 during the synthesis process [42,43]. The high-resolution Mn 2p spectrum (Figure 2D) displayed typical spin–orbit splitting features, where Mn 2p3/2 and Mn 2p1/2 were clearly distinguished with a peak separation of approximately 11 eV [44,45], which is consistent with the characteristic spin–orbit splitting of manganese oxides. Peak fitting of the Mn 2p3/2 and Mn 2p1/2 regions further revealed that the Mn species on the surface of Au@MnOx coexist in three valence states, namely Mn2+, Mn3+, and Mn4+.
3.2. Catalytic Activity and Kinetics of Au@MnOx
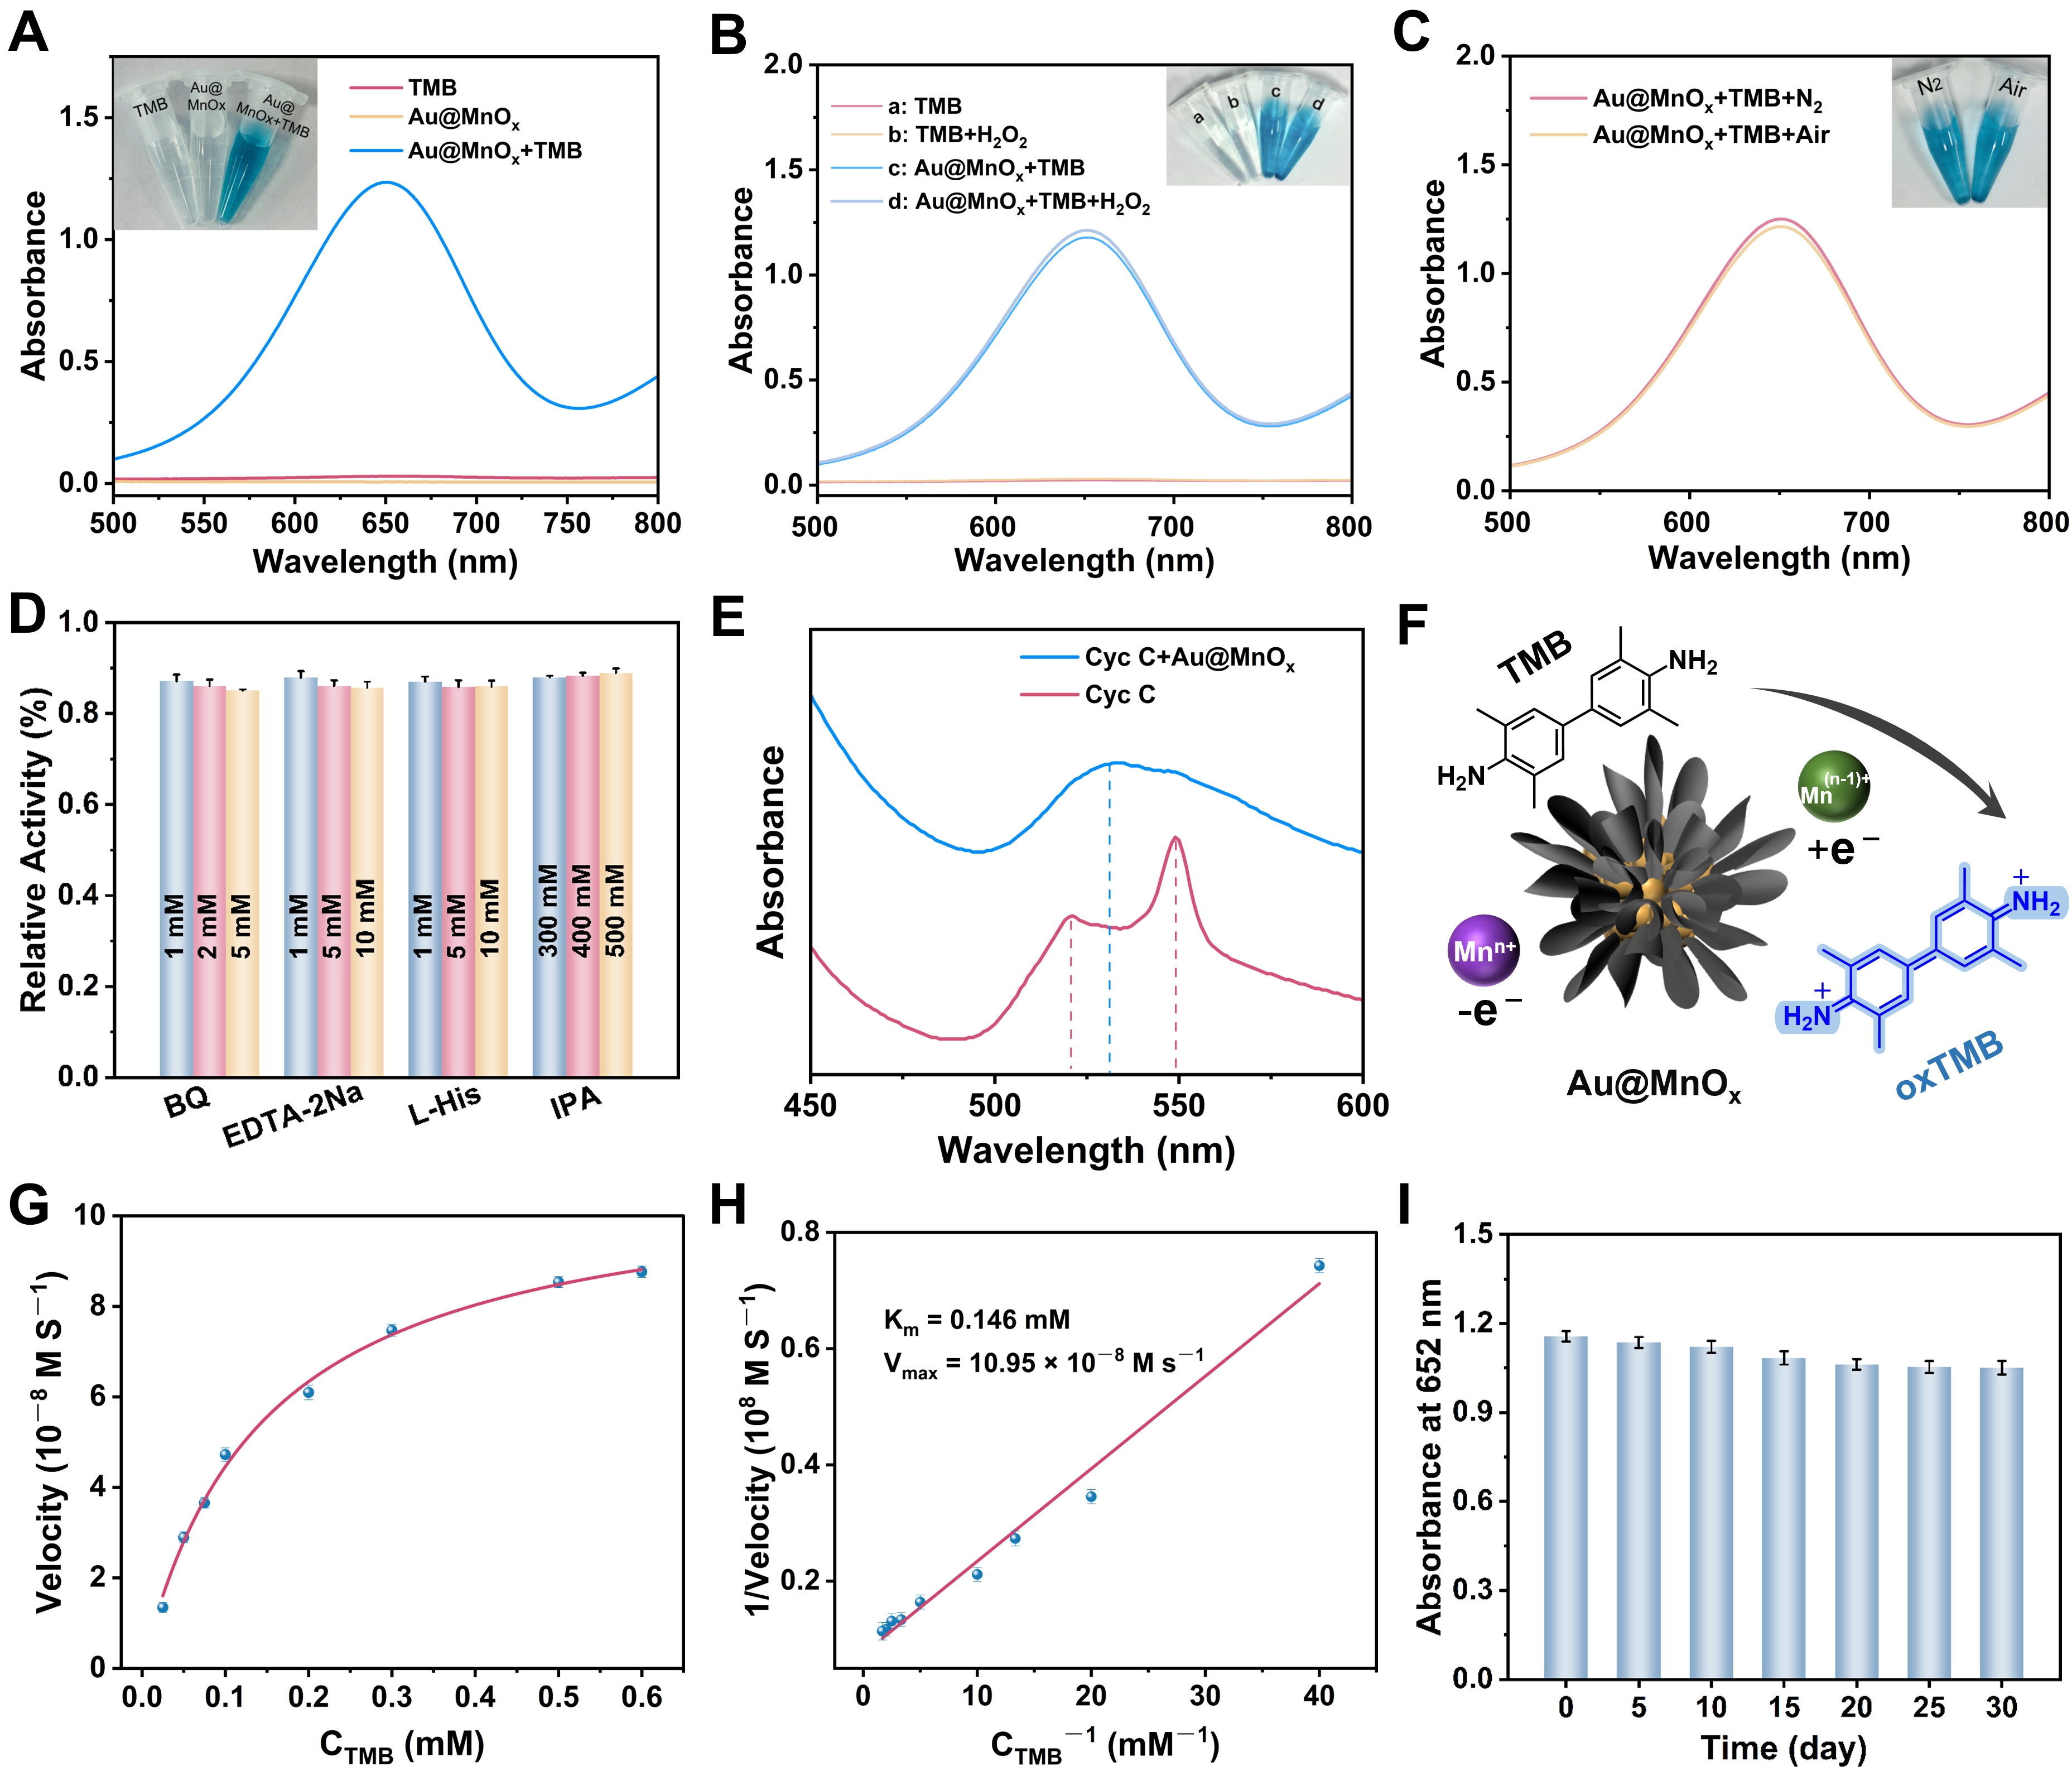
To screen the optimal substrate, cross-validation was performed with OPD and ABTS serving as auxiliary substrates. The results (Figure S2) demonstrate that the reaction system of Au@MnOx with TMB displays a distinct absorption peak centered at 652 nm, and the inset exhibits an obvious blue color, which is visually observable. Therefore, TMB was identified as the optimal catalytic substrate. The UV-vis absorption spectra for different reaction systems are displayed in Figure 3A. The experimental group with TMB catalyzed by Au@MnOx exhibited a distinct characteristic absorption peak at 652 nm, along with a distinct blue color visible to the naked eye, confirming that the Au@MnOx possessed efficient catalytic activity toward TMB oxidation.
Figure 3.
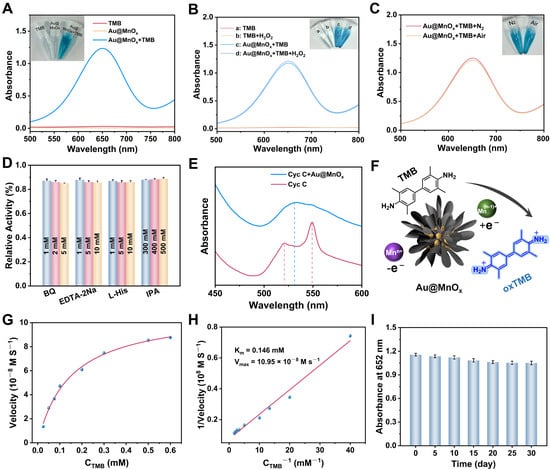
Catalytic activity and mechanism of Au@MnOx. (A) UV-Vis absorption spectra of different reaction systems. Experimental conditions: pH 4.0 HAc-NaAc buffer, 3 mM TMB, 100 μg/mL Au@MnOx. (B) Effect of H2O2 on the TMB oxidation catalyzed by Au@MnOx. (C) Oxygen dependence of the catalytic reaction confirmed by deoxygenation experiments. (D) Influence of various reactive oxygen species (ROS) scavengers on the catalytic activity of Au@MnOx. (E) UV-Vis absorption spectra of Cyt C in the absence and presence of Au@MnOx. (F) Schematic illustration of the catalytic mechanism for TMB oxidation via the direct electron transfer pathway mediated by Au@MnOx. (G) Steady-state enzymatic kinetics of Au@MnOx towards the TMB substrate. (H) Lineweaver–Burk plot for the catalytic reaction of Au@MnOx. (I) Storage stability assessment of Au@MnOx.
To further clarify the intrinsic enzyme-like catalytic type of Au@MnOx, H2O2-dependent experiments and deoxygenation experiments were conducted. When Au@MnOx and TMB were added, a prominent absorption peak appeared at 652 nm (curve c), which can be assigned to the characteristic signal of oxTMB. As illustrated in the inset of Figure 3B, the reaction system exhibited a distinct blue color. Upon further introduction of H2O2 into the above system, the shape and intensity of the absorption peak were almost identical to those of curve c. This phenomenon suggests that H2O2 made no additional contribution to the catalytic reaction. In the deoxygenation experiment, after introducing nitrogen for deoxygenation, the system still showed a clear absorption peak at 652 nm (Figure 3C). This indicates that the reaction of Au@MnOx that catalyzed the oxidation of TMB is independent of O2, and the catalytic oxidation ability may stem from the inherent redox properties of the Au@MnOx itself.
3.3. Catalytic Mechanism and Performance of Au@MnOx
To clarify the underlying catalytic mechanism of Au@MnOx in the TMB color reaction, reactive oxygen species (ROS) scavenging experiments were conducted. Specifically, benzoquinone (BQ), ethylenediaminetetraacetic acid (EDTA-2Na), L-histidine (L-His), and isopropanol (IPA) were used to scavenge singlet oxygen (1O2), holes, superoxide anion radicals (O2·−), and hydroxyl radicals (·OH), respectively. Under different concentration gradients, none of the four tested scavengers exhibited inhibition of the catalytic activity of Au@MnOx (Figure 3D). This result suggested that Au@MnOx-catalyzed TMB oxidation may originate from non-radical pathways. We further used cytochrome C (Cyt C) as the electron acceptor probe to investigate the electron transfer ability of Au@MnOx. The results showed that the system containing only Cyt C exhibited characteristic absorption peaks in the reduced state at 520 nm and 550 nm (Figure 3E) [46,47]. Upon the addition of Au@MnOx, the reaction system displayed a 530 nm characteristic absorption signal of oxidized Cyt C, while the characteristic signals at 520 nm and 550 nm exhibited obvious attenuation. This phenomenon indicates that Au@MnOx can accept electrons from Cyt C through direct electron transfer. In summary, the catalytic oxidation of TMB by Au@MnOx is achieved through direct electron transfer driven by the material’s native redox performance. We propose that the catalytic oxidation of TMB likely follows a direct electron transfer pathway (Figure 3F), with multivalent manganese species in Au@MnOx involved in the electron transfer.
Furthermore, critical experimental parameters, including reaction buffer, substrate TMB concentration, Au@MnOx dosage, and reaction temperature, were systematically optimized. Firstly, the influence of buffer type on the color development reaction of TMB catalyzed by Au@MnOx was investigated. The results suggested that the maximum absorbance was recorded in the HAc-NaAc buffer (Figure S3). Then, the pH and concentration of the HAc-NaAc buffer were systematically optimized (Figure S4). As indicated in Figure S4A, the absorbance of oxTMB reached its highest at pH 4.0. On this basis, the optimization results of buffer concentration (Figure S4B) showed that the absorbance reached a plateau at an HAc-NaAc concentration of 100 mM. Under the optimal buffer conditions, the concentrations of the TMB substrate and Au@MnOx were optimized and screened. As displayed in Figure S5A, the absorbance signal at 652 nm reached the maximum at 3 mM. The optimization results of Au@MnOx concentration (Figure S5B) showed that the absorption intensity of 652 nm gradually enhanced as the Au@MnOx concentration increased exhibiting concentration-dependent behavior. Finally, the incubation time and temperature of the colorimetric sensing system were optimized and screened. The absorbance signal at 652 nm reached a stable state after 15 min of reaction (Figure S6A). The results in Figure S6B reveal that the absorbance reaches its maximum at 37 °C. Extremely high temperatures can induce a decline in the catalytic activity of Au@MnOx. Therefore, 37 °C was confirmed to be the optimal reaction temperature.
To assess the OXD-like catalytic capability of Au@MnOx, the steady-state kinetic behavior of its TMB catalytic reaction was systematically studied (Figure 3G). The Lineweaver–Burk double reciprocal plot (Figure 3H) exhibited an excellent linear fitting performance with a correlation coefficient (R2) up to 0.998. The calculated Km and Vmax values were 0.146 mM and 10.95 × 10⁻⁸ M·s−1, respectively. Compared to most nanozymes documented in prior studies, Au@MnOx exhibits a lower Km value [30,47,48,49], indicating stronger substrate affinity, while maintaining a considerable Vmax [50,51], which demonstrates excellent OXD-like catalytic performance (Table S1). In addition, the storage stability of Au@MnOx was also measured (Figure 3I). After 30 days of storage, the TMB catalytic reaction system containing Au@MnOx maintained stable absorbance at a wavelength of 652 nm, indicating that the catalytic activity of nanoenzymes has long-term stability.
3.4. Construction of Detection Probe
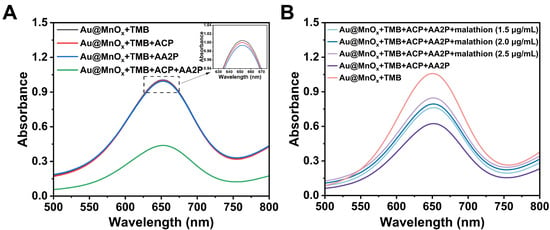
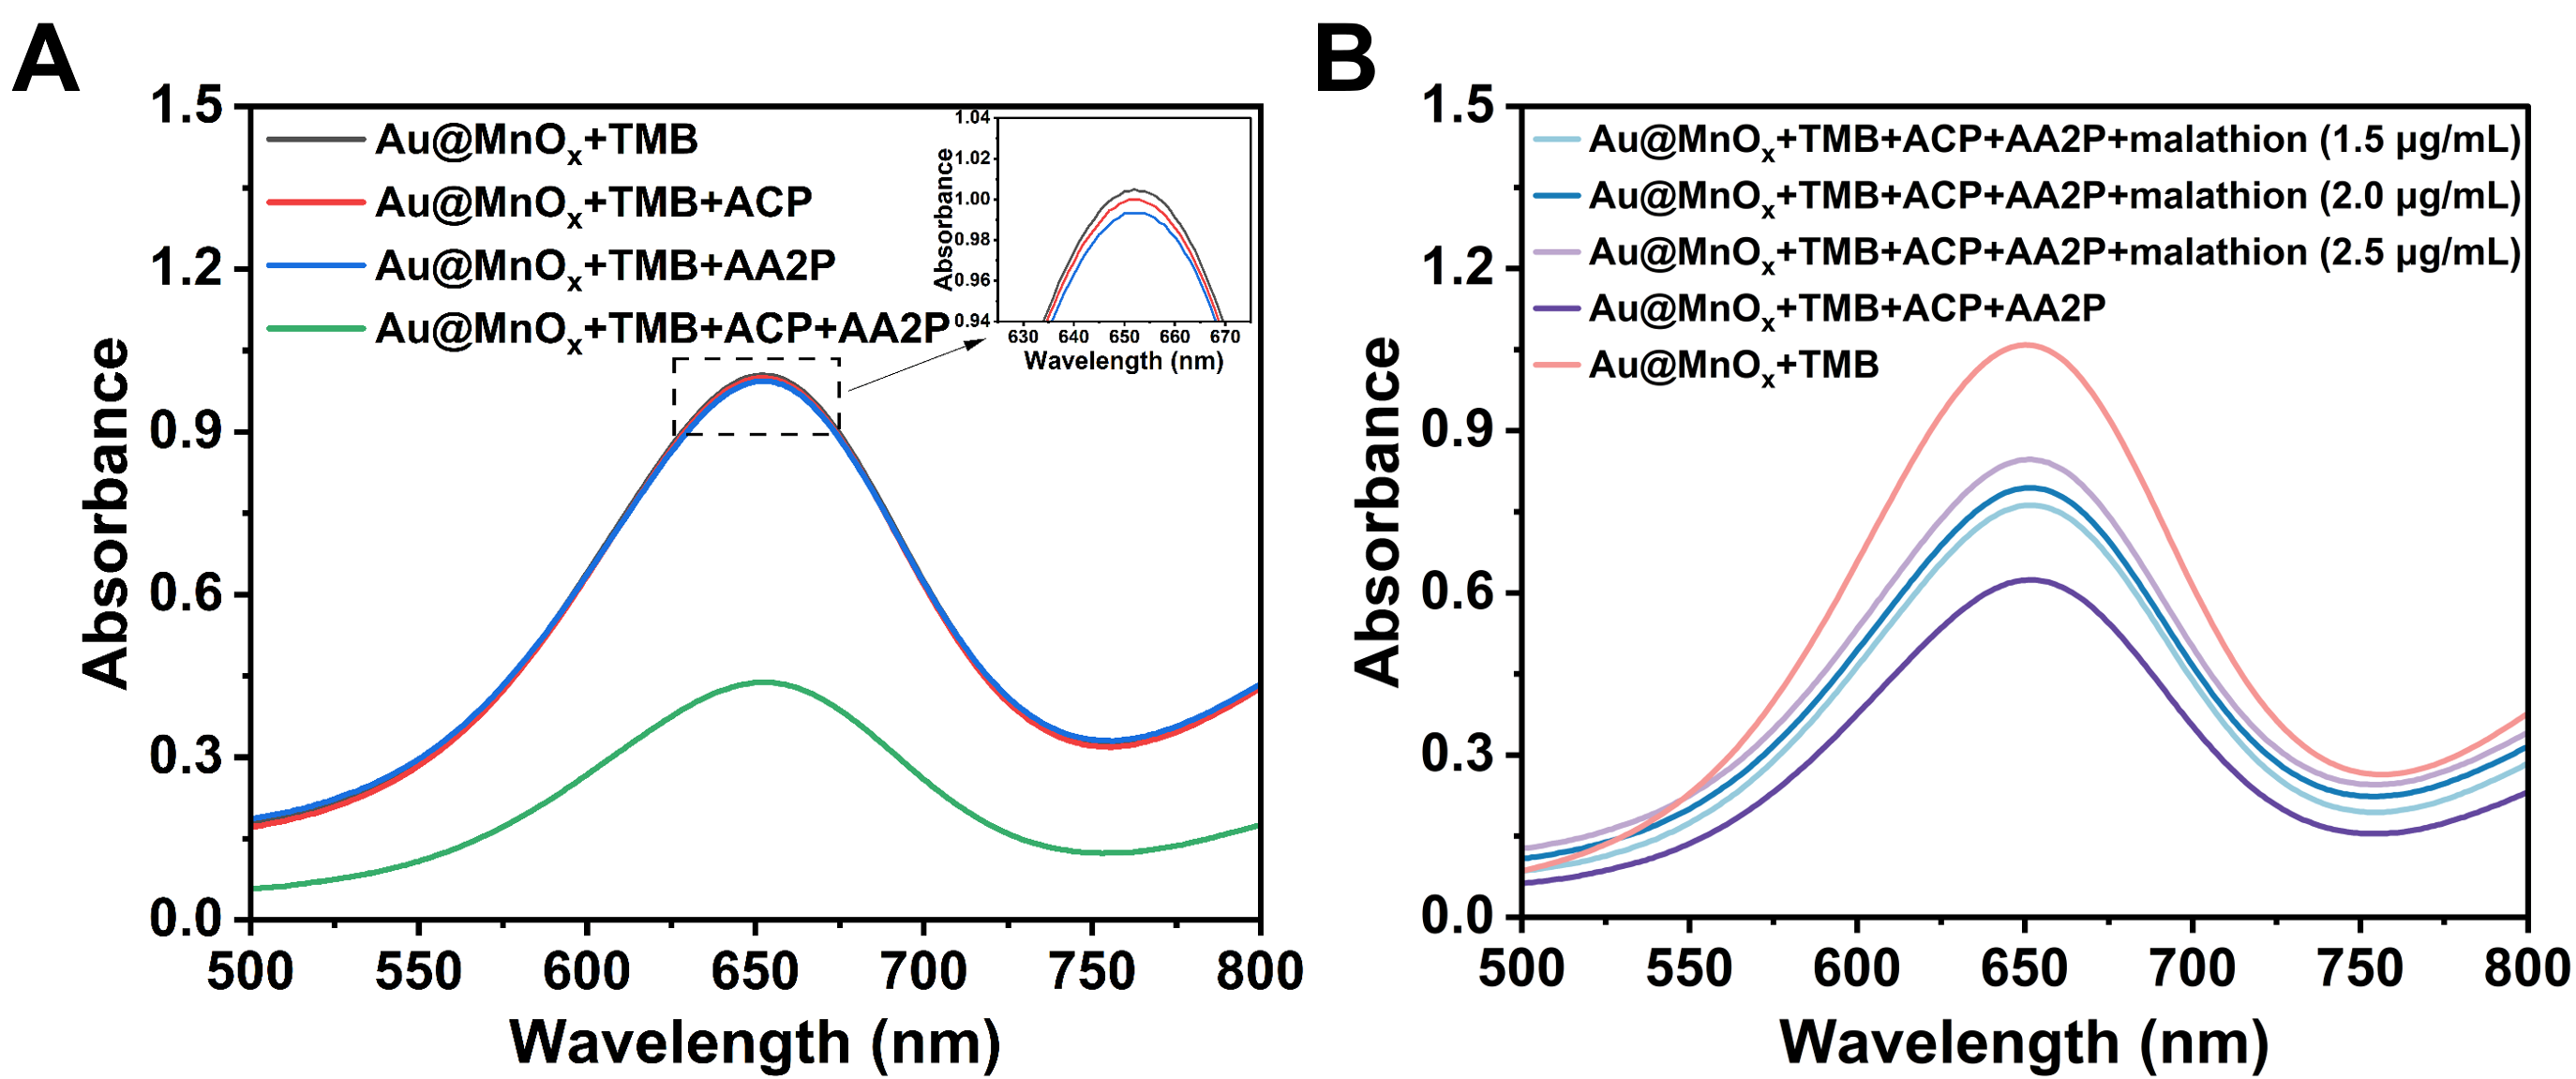
Based on the excellent catalytic OXD-like property of Au@MnOx, the colorimetric sensing platform was established for the determination of malathion. As presented in Scheme 1B, Au@MnOx exhibits high catalytic activity toward TMB oxidation to form oxTMB, and the solution system appeared blue and showed an obvious characteristic absorption signal located at 652 nm, which served as the signal output. ACP can specifically hydrolyze substrate AA2P to generate AA with strong reducibility. When ACP and AA2P coexist, a large amount of AA was generated to effectively reduce oxTMB, resulting in blue fading and an obvious reduction at 652 nm, and the signal was quenched (Figure 4A). After adding malathion (Figure 4B), the blue of the system was gradually restored, accompanied by a matched enhancement at 652 nm. The above result demonstrates that malathion is capable of inhibiting ACP activity efficiently, which reduces AA generation and further recovers the color response signal. In addition, increasing the concentration of malathion leads to a slow upward trend at 652 nm. On the basis of the above sensing mechanism, the colorimetric platform can quantitatively determine the concentration of malathion via an absorbance measurement at 652 nm.
Figure 4.
Feasibility verification of the colorimetric assay for malathion detection. UV-vis absorption spectra of (A) different reaction systems and (B) the sensing system in the presence of varying concentrations (1.5, 2.0, and 2.5 μg/mL) of malathion.
3.5. Optimization of Probe Detection Conditions
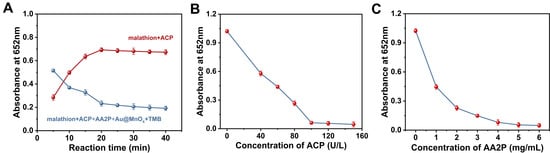
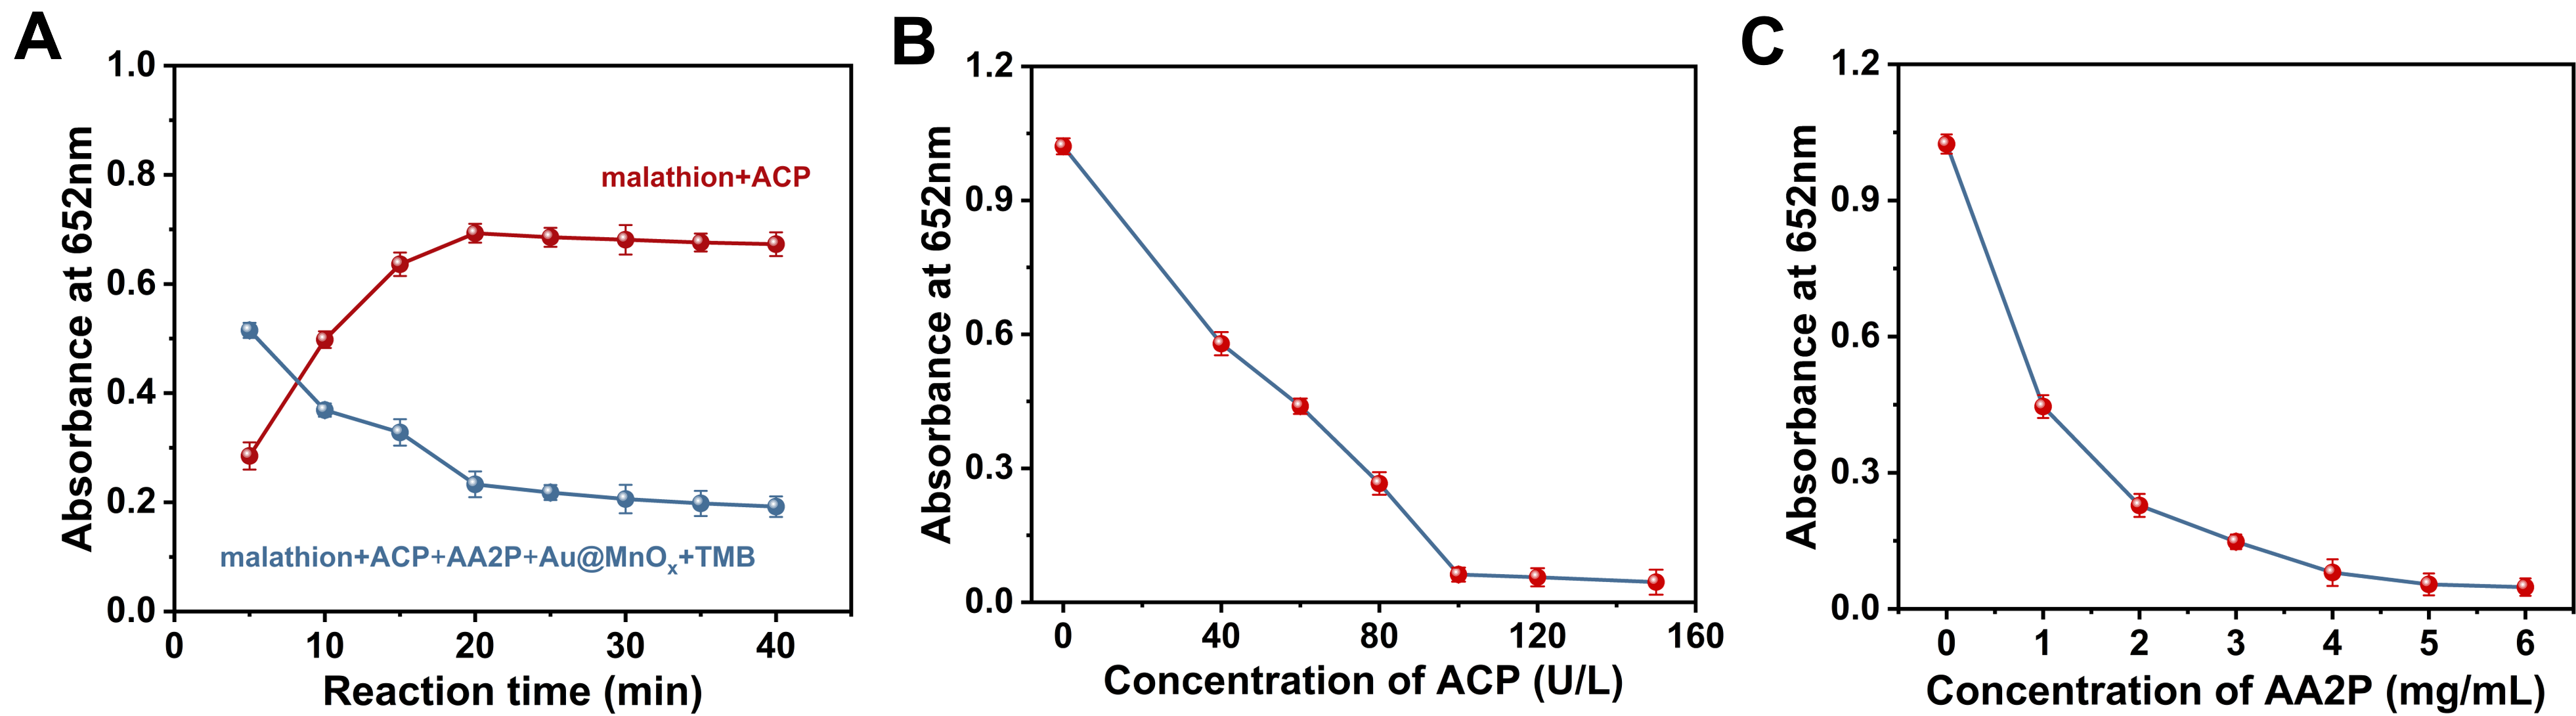
The key detection parameters that affect colorimetric performance, including reaction time and reagent concentrations, were subjected to systematic optimization. It is shown in Figure 5A that the reaction time for malathion to inhibit ACP activity (red curve) and the TMB colorimetric reaction time (blue curve) were both optimized. This indicated that the inhibition of ACP activity by malathion was basically completed when the reaction lasted for 20 min. Similarly, the competitive reaction between AA and nanoenzymes tended to stabilize at 20 min. Overall, it can be determined that the time for both incubation reactions was 20 min. The AA derived from AA2P hydrolysis by ACP can quench the colorimetric signal. Accordingly, the concentrations of ACP and AA2P were key parameters influencing probe detection. With the increase in ACP concentration, a remarkable reduction in absorbance at 652 nm was observed for the detection system (Figure 5B). As ACP concentration increased to 100 U/L, the absorbance value reached its lowest, indicating that oxTMB was almost completely reduced. Therefore, 100 U/L was confirmed to be the most suitable working concentration of ACP. Likewise, with the increase in AA2P concentration, the absorbance value at 652 nm gradually decreased and reached a steady state at 5 mg/mL, indicating that at this concentration, hydrolysis product AA was enough to completely restore oxTMB and cause the system color to fade away (Figure 5C). All optimization experiments above were performed in three independent replicates (n = 3), and the coefficient of variation (CV) of all measured results was less than 15%, showing acceptable reproducibility.
Figure 5.
Optimization of key experimental parameters for the colorimetric malathion assay. (A) Optimization of the incubation time for malathion with ACP, followed by the subsequent colorimetric reaction optimization, monitored by the absorbance changes at 652 nm. (B) Effect of ACP concentration on the absorbance of the sensing system. (C) Effect of AA2P concentration on the absorbance of the sensing system. All experiments were performed in 100 mM NaAc-HAc buffer (pH 4.0) at 37 °C.
3.6. Analytical Performance of the Probe
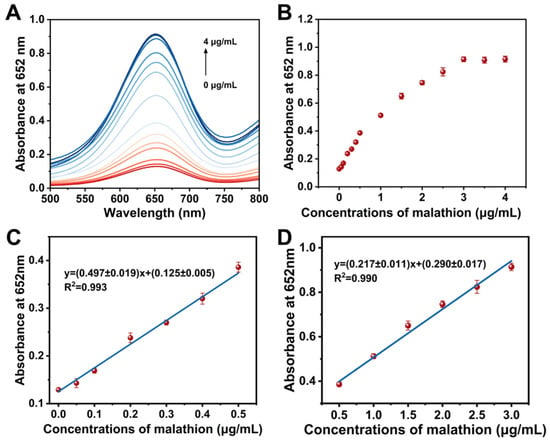
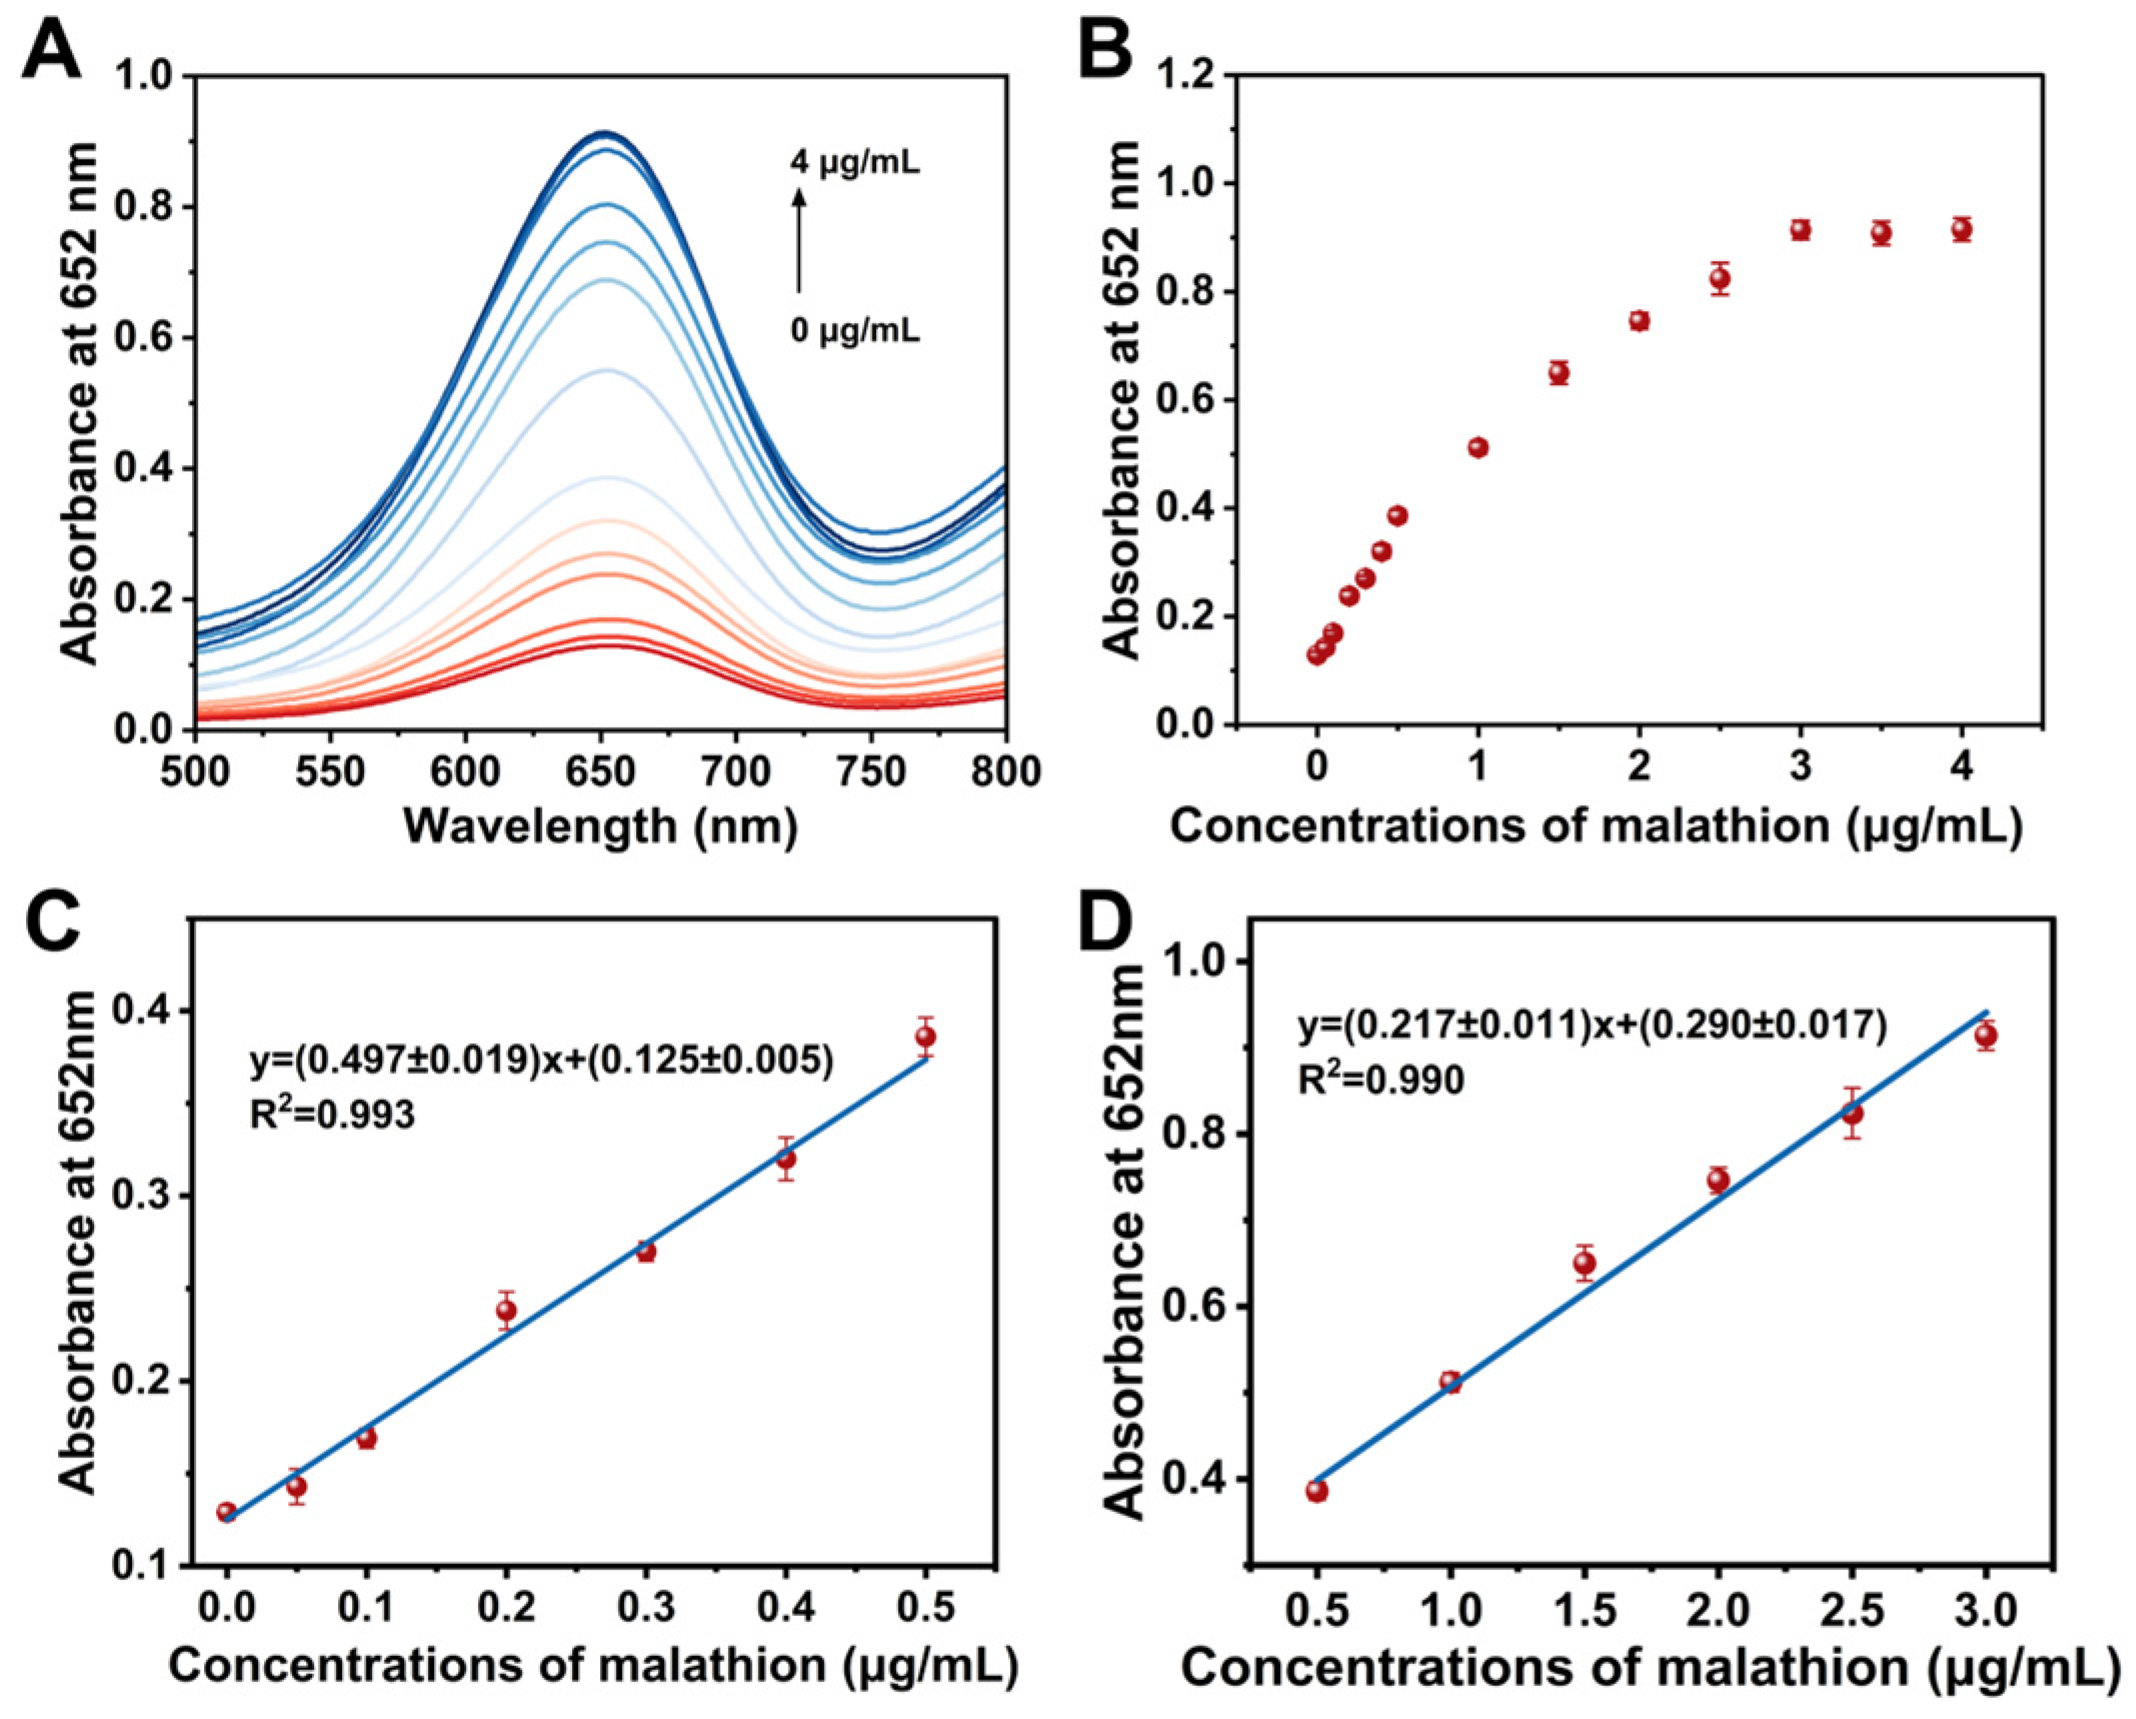
Under optimized experimental parameters, the sensing capability of the established platform toward malathion was investigated. In Figure 6A, the 652 nm absorption intensity of oxTMB increased with rising malathion concentration. The effect mainly stems from malathion inhibiting ACP activity, resulting in suppressed AA generation and increased oxTMB generation. The scatter plot in Figure 6B further indicated that the absorbance signal at 652 nm correlated linearly and positively with malathion levels. Two distinct linear ranges were identified for the proposed sensor. As shown in Figure 6C, a high-sensitivity linear range was observed for malathion from 0 to 0.5 μg/mL, accompanied by a linear regression fitting equation of y = (0.497 ± 0.019)x + (0.125 ± 0.005) (R2 = 0.993). And in Figure 6D, a broader linear range was identified in the concentration range of 0.5–3.0 μg/mL, with a linear fitting equation of y = (0.217 ± 0.011)x + (0.290 ± 0.017) (R2 = 0.990). This segmented linear response can be tentatively attributed to the change in the degree of ACP inhibition by malathion. Considering that segmented fitting achieves better linear correlation and most data points match the two calibration curves well, segmented linear calibration was adopted in this study. In the concentration range of 0–0.5 μg/mL, malathion can rapidly inhibit ACP activity, reduce AA production, and weaken the bleaching effect of oxTMB, exhibiting high sensitivity. When the concentration exceeds 0.5 μg/mL, the inhibitory effect on ACP gradually weakens. Further increasing the concentration of malathion can only slightly change the AA yield and absorbance, leading to a decreased slope. According to the 3σ/S method, the limit of detection (LOD) of the developed probe toward malathion was determined to be 1.51 ng/mL, where σ represents the standard deviation of blank sample measurements and S denotes the slope of the calibration curve. This LOD was considerably lower than the statutory maximum residue limits (MRLs) specified in GB 2763-2026 (National Food Safety Standard–Maximum Residue Limits for Pesticides in Food) [52], where the MRLs of malathion in cucumber and cabbage are 0.2 mg/kg and 0.5 mg/kg, respectively. In comparison with other reported probes for OP detection summarized in Table S2, the proposed colorimetric system possesses a wider linear range and a lower LOD [5,53,54,55,56]. Therefore, the developed Au@MnOx-based probe demonstrates excellent detection sensitivity toward malathion and is fully competent for practical detection demands.
Figure 6.
Analytical performance of the developed colorimetric sensor for malathion detection. (A) UV-vis absorption spectra of the sensing system with different concentrations of malathion (0–4 μg/mL). (B) The corresponding absorbance values at 652 nm as a function of malathion concentration. (C,D) The linear calibration plots of absorbance at 652 nm versus malathion concentration in the ranges of 0–0.5 μg/mL and 0.5–3.0 μg/mL, respectively.
3.7. Specificity and Anti-Interference Ability
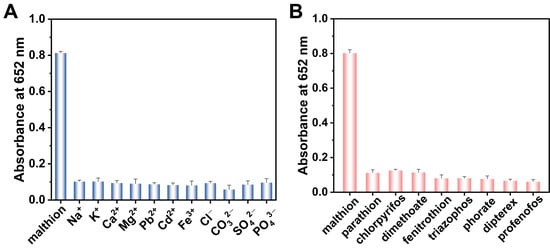
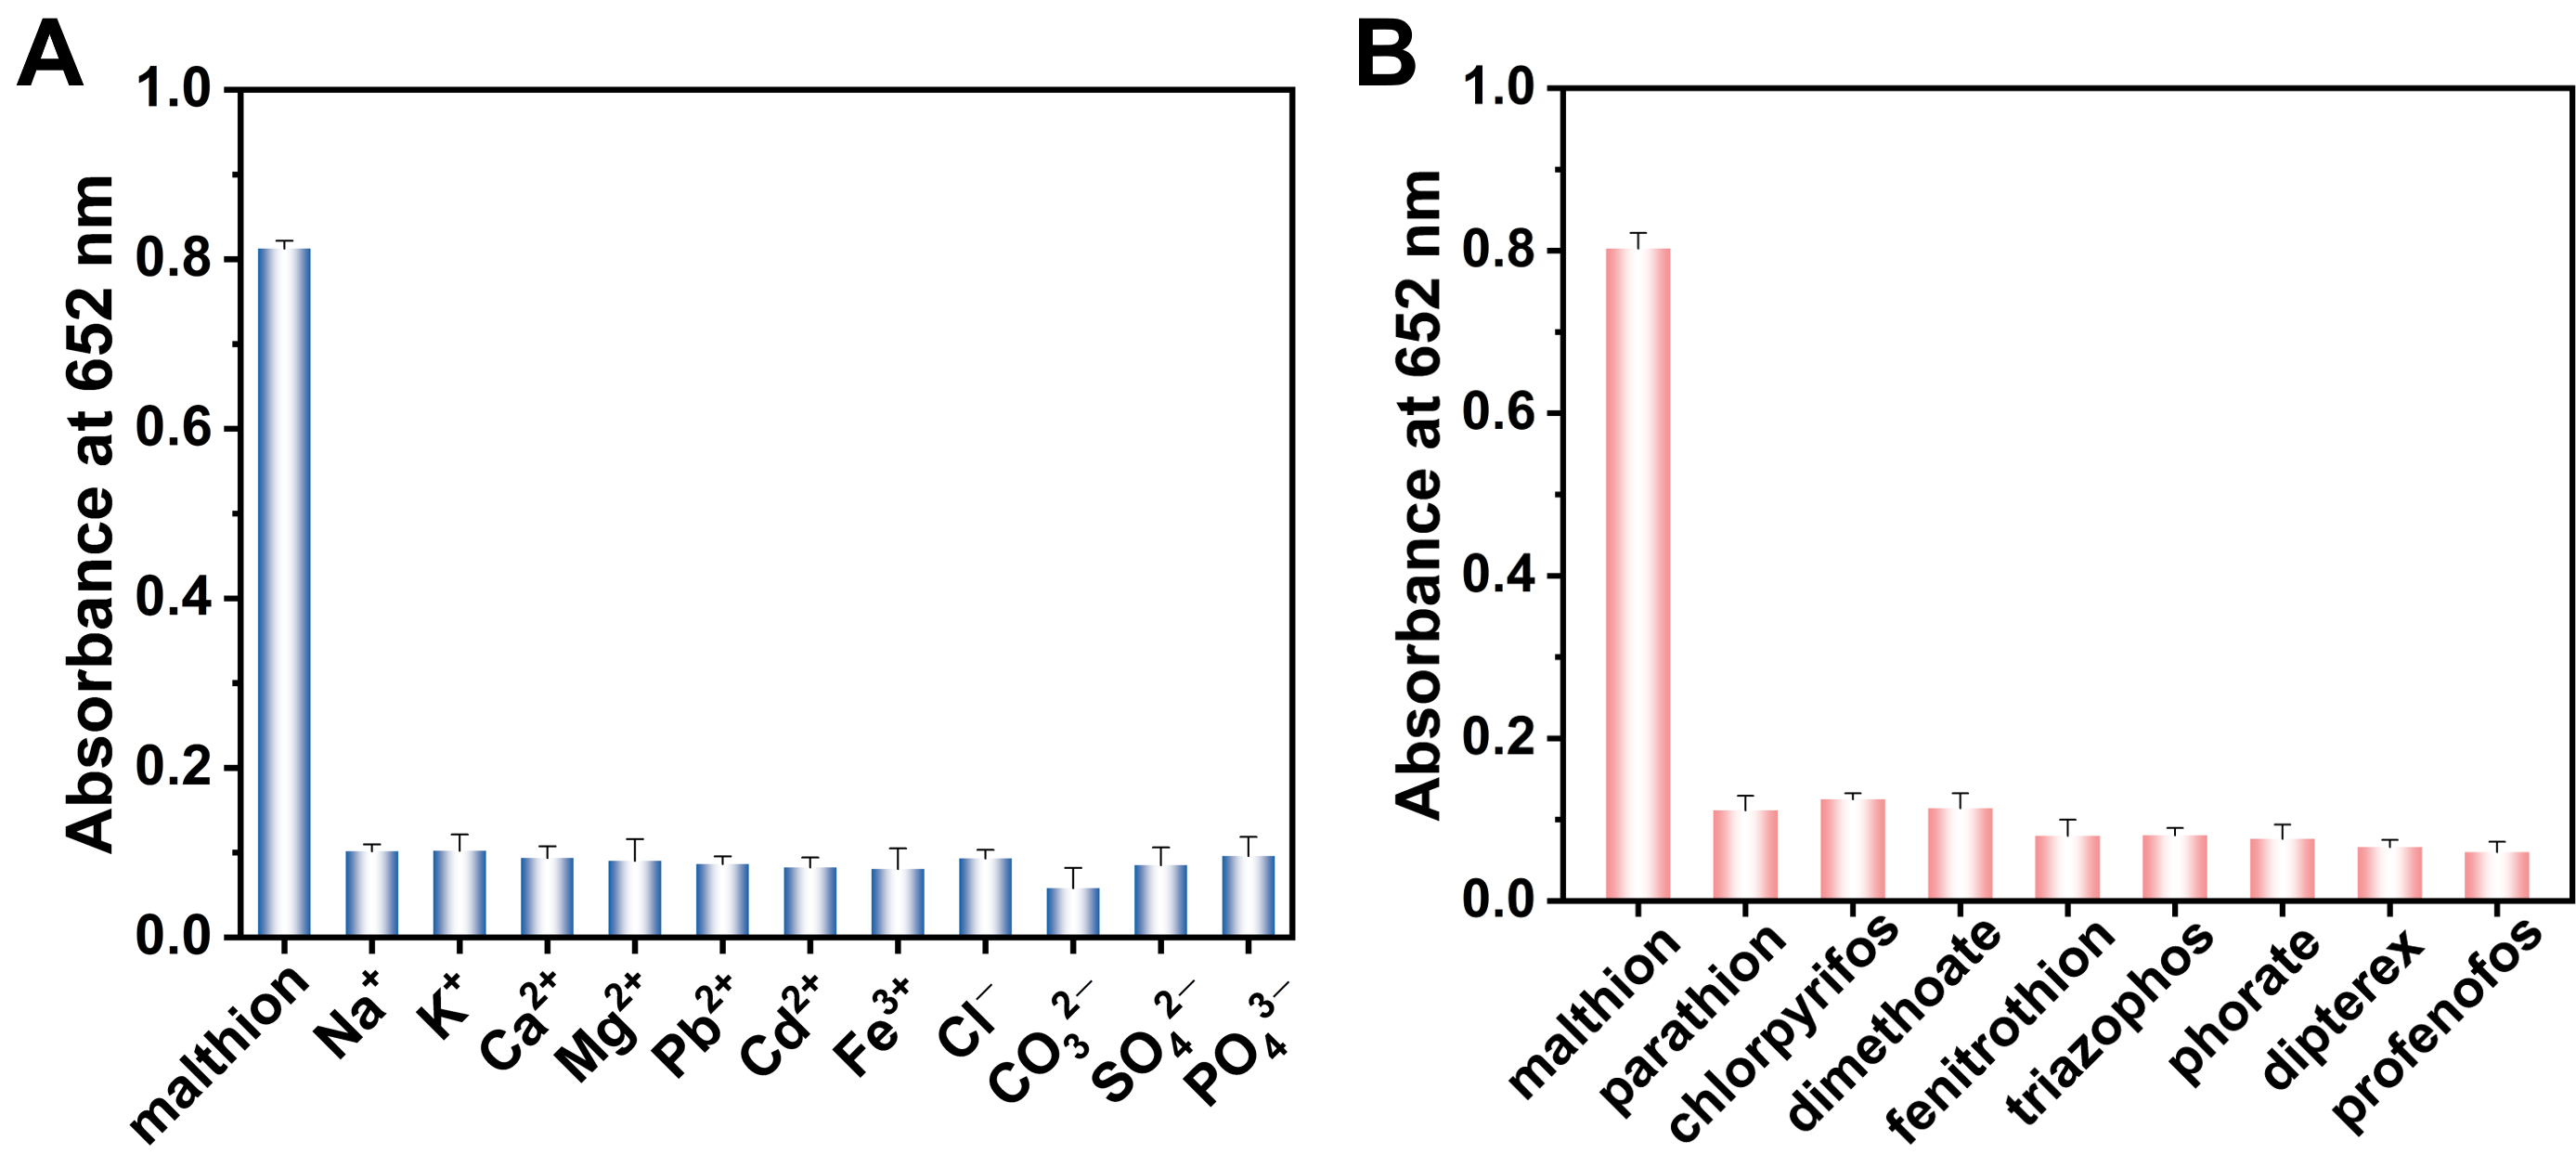
The accuracy and reliability of the detection approach depend on both its specificity and anti-interference performance. Therefore, the specificity and anti-interference capability of the proposed probe were systematically assessed by introducing common coexisting substances typically present in actual samples. The selected interfering substances include some normal ions (Na+, K+, Ca2+, Mg2+, Pb2+, Cd2+, Fe3+, Cl−, CO32−, SO42−, PO43−) as well as other OPs (parathion, chlorpyrifos, dimethoate, methanethion, triazophos, metalaxyl, dichlorvos, methamidophos). Under the same experimental conditions, malathion and each interfering substance were added to the probe system at the same concentration, respectively, and the 652 nm absorbance responses were collected and compared simultaneously. As indicated in Figure 7, compared to the effect of malathion, the changes in absorbance values caused by common ions and organic phosphorus pesticides can be ignored. These results indicate that the sensing probe exhibits acceptable anti-interference performance toward malathion under the test conditions set in this study. It should be noted that the molecular recognition and anti-interference mechanisms underlying the selectivity of this sensing system remain to be further elucidated.
Figure 7.
Specificity and anti-interference performance of the malathion colorimetric sensing platform. (A) Influence of coexisting ions and (B) selectivity against other OPs on the absorbance at 652 nm. Malathion: 2 μg/mL; interfering substances: 10 μg/mL; n = 3.
3.8. Analysis of Malathion in Actual Sample
For the assessment of the real-sample detection capability of the established malathion colorimetric sensing system, this work conducted spiked recovery experiments by adding three gradient concentration levels of malathion standard solution (0.1, 0.5, and 2.0 μg/g) to blank samples of cucumber and cabbage, respectively. As summarized in Table S3, the average recoveries for malathion in cucumber and cabbage samples ranged from 97.2% to 104.5% and 99.4% to 102.5%, respectively, and all relative standard deviations (RSDs) were kept below 7%. The above results demonstrate no significant matrix interference during the analysis. Therefore, based on the results of spiked recovery experiments in this study, the colorimetric method can quantify malathion residues in cucumber and cabbage, which is expected to provide technical support for the rapid detection of malathion residues in food.
4. Conclusions
In conclusion, this work successfully synthesized Au@MnOx with excellent OXD-like activity. On this basis, a H2O2-free colorimetric sensing platform, namely the Au@MnOx/TMB/ACP/AA2P system, was developed for malathion detection. The sensing mechanism relies on the redox reaction between the specific hydrolysis product AA of ACP and oxTMB. Coupled with the suppression of ACP activity induced by malathion, a “signal inhibition-recovery” mode regulated by AA and malathion was designed, which achieved high-sensitivity determination of malathion in food matrices. It is worth noting that the detection readout only requires simple optical measurement without large or expensive analytical instruments, and the entire procedure can be completed within 40 min. The developed approach achieved a considerably low LOD value of 1.51 ng/mL, which is superior to the results reported in the previous literature. Therefore, this study provides technical support for the quantitative detection of malathion in food. In addition, the developed malathion colorimetric probe demonstrated satisfactory precision and recovery in actual sample analysis, which met the demands of practical analytical requirements. Overall, this method has significant potential and practical value in the field of food safety, achieving quick and sensitive measurement of malathion.
Supplementary Materials
The following supporting information can be downloaded at https://www.mdpi.com/article/10.3390/foods15213967/s1. Figure S1: EDS spectrum and quantitative elemental analysis of Au@MnOx.Figure S2: UV-vis absorption spectra of the oxidation of different chromogenic substrates catalyzed by Au@MnOx. Experimental conditions: pH 4.0 HAc-NaAc buffer, 3 mM TMB, 100 μg/mL Au@MnOx.Figure S3: Effect of buffer solution type on the catalytic oxidation of TMB by Au@MnOx.Figure S4: Effect of (A)pH value and (B)concentration of HAc-NaAc buffer on the catalytic oxidation of TMB by Au@MnOx.Figure S5: Optimization of (A) TMB concentration and (B) Au@MnOx concentration on the catalytic chromogenic performance.Figure S6: Effect of (A) reaction time and (B) temperature on the catalytic chromogenic performance of Au@MnOx toward TMB.Table S1: Kinetic parameters of the Au@MnOx and other nanozymes catalysts.Table S2: Comparison of analytical performance with other OPs detection methods.Table S3: Recovery and precision of the proposed method for malathion detection in actual food samples.
Author Contributions
Conceptualization, L.L.; methodology, L.L. and X.W.; validation, X.W. and L.-J.W.; formal analysis, X.W. and L.-J.W.; investigation, L.L. and X.W.; resources, L.L. and G.-Y.X.; data curation, L.L. and X.W.; writing—original draft preparation, X.W. and L.-J.W.; writing—review and editing, L.L.; visualization, L.L.; supervision, G.-Y.X.; project administration, L.L.; funding acquisition, L.L. and G.-Y.X. All authors have read and agreed to the published version of the manuscript.
Funding
This research was funded by the National Natural Science Foundation of China (32603503), the Project of Science and Technology Innovation Team of Anhui Science and Technology University (2023KJCXTD003), the project of Research on Precise and Rapid Detection Technologies for Typical Pesticide Residues in Agricultural Products (No. 882053), the Talent Introduction Project from Anhui Science and Technology University (No. SPYJ202202).
Institutional Review Board Statement
Not applicable.
Informed Consent Statement
Not applicable.
Data Availability Statement
The original contributions presented in the study are included in the article/Supplementary Material; further inquiries can be directed to the corresponding author.
Conflicts of Interest
The authors declare no conflicts of interest.
References
- He, H.; Bi, S.; Gao, F.; Zhao, Y. Target-induced inhibition of electron donor PEC sensing platform for ultrasensitive detection of organophosphorus pesticides. Sens. Actuator B-Chem. 2025, 444, 138499. [Google Scholar] [CrossRef] [Scilit]
- Xue, J.; Mao, K.; Tang, Z.; Hu, J.; Zhang, H. Machine-learning-assisted CRISPR/Cas12a biosensors for monitoring organophosphorus pesticide degradation. Anal. Chem. 2025, 97, 21491–21501. [Google Scholar] [CrossRef] [Scilit] [PubMed]
- Chen, D.; Mao, Y.; Qu, P.; Wang, A.; Mei, L.; Feng, J. Bimetallic AuPt alloy/rod-like CeO2 nanojunctions with high peroxidase-like activity for colorimetric sensing of organophosphorus pesticides. Mikrochim. Acta 2023, 190, 220. [Google Scholar] [CrossRef] [Scilit] [PubMed]
- Jiang, J.; Deng, K.; Duan, R.; An, C.; Dao, F.; Huang, J. Iron/manganese-zeolitic imidazolate framework (Fe/Mn-ZIF) nanozyme combined with acetylcholinesterase for colorimetric rapid detection of organophosphorus pesticides. Food Chem. 2025, 473, 143090. [Google Scholar] [CrossRef] [Scilit] [PubMed]
- Jiang, W.; Feng, Y.; Jiang, C.; Li, H.; Wang, Z.; Xiao, Y.; Lan, W.; Liu, Y. Platinum-nickel nanoparticle-based oxidase-like nanozyme for colorimetric/photothermal dual-mode detection of organophosphorus pesticides. Sens. Actuators B Chem. 2024, 412, 135861. [Google Scholar] [CrossRef] [Scilit]
- Bai, Y.; Nie, S.; Gao, W.; Li, N.; Zhu, P.; Zhang, L.; Yu, J. Enzyme-nanozyme cascade flow reactor synergy with deep learning for differentiation and point-of-care testing of multiple organophosphorus pesticides. Adv. Funct. Mater. 2024, 35, 2419499. [Google Scholar] [CrossRef] [Scilit]
- Deng, P.; Qian, Y.; Guo, W.; Sun, X.; Zheng, J.; Liu, S.; Li, K.; Gu, S.; Liu, Y.; Zhu, H. Integrated biomonitoring of organophosphate mixtures reveals food-driven exposure and hormetic oxidative responses in urban adults. Environ. Sci. Technol. 2026, 60, 5285–5295. [Google Scholar] [CrossRef] [Scilit] [PubMed]
- Cai, Y.; Zhu, H.; Zhou, W.; Qiu, Z.; Chen, C.; Qileng, A.; Li, K.; Liu, Y. Capsulation of Au with AIE effect into metal–organic framework for the marriage of a fluorescence and colorimetric biosensor to detect organophosphorus pesticides. Anal. Chem. 2021, 93, 7275–7282. [Google Scholar] [CrossRef] [Scilit] [PubMed]
- Zhao, Y.; Li, R.; Tang, J.; Liu, M.; Zhang, B.; Chen, J.; Ren, S.; Ma, Q.; Sun, Z.; Weng, H. MOF-enabled magnetic-fluorescent sensors for on-site organophosphorus/carbamate pesticide detection in fruits and vegetables. Food Chem. 2025, 493, 145935. [Google Scholar] [CrossRef] [Scilit] [PubMed]
- Wen, S.; Zhang, H.; Yu, S.; Ma, J.; Zhu, J.; Zhou, Y. Nanozyme coating-gated multifunctional COF composite based dual-ratio enhanced dual-mode sensor for highly sensitive and reliable detection of organophosphorus pesticides in real samples. J. Hazard. Mater. 2024, 480, 135791. [Google Scholar] [CrossRef] [Scilit] [PubMed]
- Xu, W.; Cai, X.; Wu, Y.; Wen, Y.; Su, R.; Zhang, Y.; Huang, Y.; Zheng, Q.; Hu, L.; Cui, X.; et al. Biomimetic single Al-OH site with high acetylcholinesterase-like activity and self-defense ability for neuroprotection. Nat. Commun. 2023, 14, 6064. [Google Scholar] [CrossRef] [Scilit] [PubMed]
- Bu, C.; Ma, L.; Zhang, W.; Hua, Y.; Zeng, H.; Han, Y.; Jia, R.; Zhao, Q.; Wang, Q.; Ruan, Y.; et al. Multi-media distribution, source apportionment, and risk assessment of legacy and current-use organophosphorus pesticides in typical agricultural watersheds of China. Water Res. 2026, 293, 125415. [Google Scholar] [CrossRef] [Scilit] [PubMed]
- Zhao, J.; Mao, X.; Zhang, Q.; Xiao, W.; Yan, A.; Hu, J.; Jiang, S.; Li, H.; Wang, Y. A convenient and effective method for determining organophosphorus pesticides in citrus fruits based on a novel dispersive solid phase extraction using UiO-66/Alg bead as the sorbent. Food Chem. 2024, 438, 137991. [Google Scholar] [CrossRef] [Scilit] [PubMed]
- Zheng, W.; Bakker, W.; Jin, M.; Wang, J.; Rietjens, I.M.C.M. Organophosphate pesticides modulate gut microbiota and influence bile acid metabolism in an in vitro fermentation model. Environ. Int. 2025, 199, 109469. [Google Scholar] [CrossRef] [Scilit] [PubMed]
- Hong, C.; Wu, S.; Chen, S.; Lin, Z.; Chen, Q. Highly sensitive colorimetric method for the detection of organophosphorus pesticides based on H2O2 etching of silver-coated gold nanostars. Sens. Actuators B Chem. 2025, 425, 137004. [Google Scholar] [CrossRef] [Scilit]
- Bian, X.; Chen, D.; Han, L. Taking full advantage of the structure and multi-activities of mineralized microbial surface-displayed enzymes: Portable three-in-one organophosphate pesticides assay device. Chem. Eng. J. 2022, 429, 132317. [Google Scholar] [CrossRef] [Scilit]
- Ayaz, S.; Ulucay, S.; Uzer, A.; Dilgin, Y.; Apak, R. A novel acetylcholinesterase inhibition based colorimetric biosensor for the detection of paraoxon ethyl using CUPRAC reagent as chromogenic oxidant. Talanta 2024, 266, 124962. [Google Scholar] [CrossRef] [Scilit] [PubMed]
- Zhao, F.; Wang, L.; Li, M.; Wang, M.; Liu, G.; Ping, J. Nanozyme-based biosensor for organophosphorus pesticide monitoring: Functional design, biosensing strategy, and detection application. Trac. Trends Anal. Chem. 2023, 165, 117152. [Google Scholar] [CrossRef] [Scilit]
- Liu, S.; Zhou, J.; Yuan, X.; Xiong, J.; Zong, M.; Wu, X.; Lou, W. A dual-mode sensing platform based on metal–organic framework for colorimetric and ratiometric fluorescent detection of organophosphorus pesticide. Food Chem. 2024, 432, 137272. [Google Scholar] [CrossRef] [Scilit] [PubMed]
- Shin, H.; Woo, J.; Hong, S.; Yoo, S.; Cho, H.; Hong, B.H.; Hwang, Y.J.; Min, D. Colorimetric detection of cancer biomarker by using porous Mn–N–C single-atom nanozyme with peroxidase-like activity. Talanta 2025, 292, 127946. [Google Scholar] [CrossRef] [Scilit] [PubMed]
- Wang, C.; Shen, W.; Li, Z.; Xia, X.; Li, J.; Xu, C.; Zheng, S.; Gu, B. 3D film-like nanozyme with a synergistic amplification effect for the ultrasensitive immunochromatographic detection of respiratory viruses. ACS Nano 2024, 18, 25865–25879. [Google Scholar] [CrossRef] [Scilit] [PubMed]
- Li, X.; Yang, X.; Wu, J.; Yang, Z.; Zhu, X. A novel four-channel sensor array with dual enzymes and dual modes for evaluating total antioxidant capacity in foods. ACS Sens. 2025, 10, 2883–2894. [Google Scholar] [CrossRef] [Scilit] [PubMed]
- Zhang, L.; Sun, Y.; Zhang, Z.; Shen, Y.; Li, Y.; Ma, T.; Zhang, Q.; Ying, Y.; Fu, Y. Portable and durable sensor based on porous MOFs hybrid sponge for fluorescent-visual detection of organophosphorus pesticide. Biosens. Bioelectron. 2022, 216, 114659. [Google Scholar] [CrossRef] [Scilit] [PubMed]
- Cai, T.; Chen, G.; Zhou, L.; Tang, J.; Liu, J.; Yang, H. Smartphone-assisted sensing array based on covalent organic framework-enhanced AuPtPd hybrid oxidase-mimic nanozyme for controllable quantitative detection of acephate residue and bioaccumulation in wheat. Chem. Eng. J. 2026, 527, 171760. [Google Scholar] [CrossRef] [Scilit]
- Liu, C.; Cao, X.; Ma, X.; Wang, Y.; Zhang, M.; Qiu, J.; Chen, J.; Xue, H. Bioinspired Cerium nanozyme microenvironment regulation for efficient dephosphorylation and detection of organophosphorus pesticides. Small 2025, 21, 2411212. [Google Scholar] [CrossRef] [Scilit] [PubMed]
- Lei, M.; Ding, X.; Liu, J.; Tang, Y.; Chen, H.; Zhou, Y.; Zhu, C.; Yan, H. Trace amount of Bi-doped core-shell Pd@Pt mesoporous nanospheres with specifically enhanced peroxidase-like activity enable sensitive and accurate detection of acetylcholinesterase and organophosphorus nerve agents. Anal. Chem. 2024, 96, 6072–6078. [Google Scholar] [CrossRef] [Scilit] [PubMed]
- Alula, M.T.; Lemmens, P.; Hendricks-Leukes, N.R.; Motalaote, T.; Etzkorn, M.; Wilson, L.R.; Babuseng, F. Gold nanoparticles loaded filter paper: A recyclable nanozyme for colorimetric determination of Hg2+ in tap water and beef. Food Control 2025, 176, 111349. [Google Scholar] [CrossRef] [Scilit]
- Ma, X.; Wang, J.; Xiao, Z.; Xu, X.; Song, M.; Gao, K.; Li, T. Smartphone-assisted colorimetric sensor based on bimetallic FeCu-NC nanozyme for detection of tannic acid in food samples. J. Food Compos. Anal. 2025, 148, 108442. [Google Scholar] [CrossRef] [Scilit]
- Jing, W.; Qiang, S.; Jia, Z.; Shi, Q.H.; Meng, X.; Yu, M.; Ma, H.; Zhao, K.; Dai, Y. Smartphone-integrated nanozymes sensor array for high throughput recognition of organophosphorus pesticides. Sens. Actuator B-Chem. 2023, 389, 133857. [Google Scholar] [CrossRef] [Scilit]
- Wu, S.; Khan, M.A.; Huang, T.; Liu, X.; Kang, R.; Zhao, H.; Cao, H.; Ye, D. Smartphone-assisted colorimetric sensor arrays based on nanozymes for high throughput identification of heavy metal ions in salmon. J. Hazard. Mater. 2024, 480, 135887. [Google Scholar] [CrossRef] [Scilit] [PubMed]
- Wang, J.; Fang, P.; Li, L.; Li, L. Colorimetric nanozyme sensor based on chain-like PtNi nanoparticles for nitrite ion detection in food samples. Food Chem. 2025, 487, 144715. [Google Scholar] [CrossRef] [Scilit] [PubMed]
- Mu, S.; Yang, Y.; Han, T.; Liu, J.; Zhu, Z.; Zheng, H.; Zhang, H. Synergistic surface ligand modification of Ni-Pt bimetallic nanozymes: Enhanced catalytic activity and versatile detection of penicillin. Sens. Actuator B-Chem. 2025, 423, 136724. [Google Scholar] [CrossRef] [Scilit]
- Liu, S.; Liao, Y.; Zhang, Y.; Shu, R.; Zhang, M.; Luo, X.; Sun, C.; Dou, L.; Luo, L.; Sun, J.; et al. Engineered collaborative size regulation and shape engineering of tremella-like Au-MnOx for highly sensitive bimodal-type lateral flow immunoassays. Small 2023, 19, 2301598. [Google Scholar] [CrossRef] [Scilit] [PubMed]
- Jiang, W.; Zhu, W.; Yang, Q.; Wu, W.; Hou, X. An electrochemical/colorimetric dual-mode sensor for the detection of AFB1 in agricultural products based on CoFe2O4@Au nanoparticles and smartphone imaging. Food Chem. 2025, 474, 143201. [Google Scholar] [CrossRef] [Scilit] [PubMed]
- Chen, Z.; Lai, K.; Wang, A.; Ji, H.; Yu, S.; Fang, Z.; Liu, D.; Peng, J.; Lai, W. Electron transfer-driven nanozymes boost biosensor sensitivity via a synergistic signal amplification strategy. ACS Nano 2025, 19, 9282–9291. [Google Scholar] [CrossRef] [Scilit] [PubMed]
- Zhu, Y.; Fang, Z.; Bai, J.; Wang, L.; Chen, J.; Zhang, Z.; Wang, Q.; Sheng, W.; Pan, X.; Gao, Z.; et al. Orally administered functional polyphenol-nanozyme-armored probiotics for enhanced amelioration of intestinal inflammation and microbiota dysbiosis. Adv. Sci. 2025, 12, 2411939. [Google Scholar] [CrossRef] [Scilit] [PubMed]
- Zhang, X.; Lyu, Y.; Li, J.; Yang, X.; Lan, Z.; Chen, Z. Bimetallic nanozymes-integrated parachute-like Au2Pt@PMO@ICG Janus nanomotor with dual propulsion for enhanced tumor penetration and synergistic PTT/PDT/CDT cancer therapy. Adv. Funct. Mater. 2024, 34, 2406059. [Google Scholar] [CrossRef] [Scilit]
- Wang, H.; Yao, C.; Fan, J.; He, Y.; Wang, Z. One-pot synthesis of AuPt@FexOy nanoparticles with excellent peroxidase-like activity for development of ultrasensitive colorimetric lateral flow immunoassay of cardiac troponin I. Biosens. Bioelectron. 2023, 237, 115508. [Google Scholar] [CrossRef] [Scilit] [PubMed]
- Liang, H.; Chen, L.; Chen, X.; Zhang, H.; Wang, X.; Deng, H.; Xiong, X.; Wang, Y.; Li, C. Near-infrared photoelectrochemical and colorimetric dual-mode aptasensor for determining osteopontin based on Er-MOF nanoballs@gold nanoparticles and Au2Pt nanozymes. Sens. Actuator B-Chem. 2024, 414, 135887. [Google Scholar] [CrossRef] [Scilit]
- Yang, Q.; Zuo, W.; Song, J.; Zeng, S.; Meng, X.; Ding, Z.; Hu, Q.; Tan, X.; Zhang, D.; Dai, J.; et al. Dual-enhanced lateral flow immunoassay: Synergizing oriented antibody anchoring and nanozyme catalytic amplification for ultrasensitive cancer detection. Anal. Chem. 2025, 97, 16942–16949. [Google Scholar] [CrossRef] [Scilit] [PubMed]
- Wu, Q.; Sun, F.; Kong, H.; Liu, B.; Jiang, Z.; Zhang, P.; Wang, Y. NIR-responsive AuAgPt plasmonic nanozyme: Colorimetric/photothermal dual-signal sensing array for discriminating and detecting sulfur-containing compounds. Anal. Chem. 2026, 98, 9027–9037. [Google Scholar] [CrossRef] [Scilit]
- Wu, F.; Wang, H.; Lv, J.; Shi, X.; Wu, L.; Niu, X. Colorimetric sensor array based on Au2Pt nanozymes for antioxidant nutrition quality evaluation in food. Biosens. Bioelectron. 2023, 236, 115417. [Google Scholar] [CrossRef] [Scilit] [PubMed]
- Hong, C.; Chen, L.; Wu, C.; Yang, D.; Dai, J.; Huang, Z.; Cai, R.; Tan, W. Green synthesis of Au@WSe2 hybrid nanostructures with the enhanced peroxidase-like activity for sensitive colorimetric detection of glucose. Nano Res. 2022, 15, 1587–1592. [Google Scholar] [CrossRef] [Scilit]
- Rong, M.; Huang, Y.; Zhuang, X.; Ma, Y.; Xie, H.; Wu, Y.; Niu, L. AND logic-gate-based Au@MnO2 sensing platform for tetracyclines with fluorescent and colorimetric dual-signal readouts. Sensor. Actuat. B-Chem. 2023, 393, 134204. [Google Scholar] [CrossRef] [Scilit]
- Chen, Y.; Xia, Y.; Liu, Y.; Tang, Y.; Zhao, F.; Zeng, B. Colorimetric and electrochemical detection platforms for tetracycline based on surface molecularly imprinted polyionic liquid on Mn3O4 nanozyme. Biosens. Bioelectron. 2022, 216, 114650. [Google Scholar] [CrossRef] [Scilit] [PubMed]
- Dai, S.; Hu, M.; Zhang, W.; Lei, Z. Selective colorimetric detection of carbosulfan based on its hydrolysis behavior and Ti3C2/AuPt nanozyme. Anal. Chim. Acta 2025, 1336, 343519. [Google Scholar] [CrossRef] [Scilit] [PubMed]
- Kang, G.; Zhao, D.; Wang, H.; Liu, F.; Wang, T.; Chen, C.; Lu, Y. Malathion detection based on polydopamine enhanced oxidase-mimetic activity of palladium nanocubes. Talanta 2023, 262, 124730. [Google Scholar] [CrossRef] [Scilit] [PubMed]
- Wang, X.; Zang, X.; Wang, X.; Zhang, W.; Fang, Y.; Cui, B. Molecularly imprinted electrochemiluminescence-colorimetric dual-mode sensor based on Mn@NC nanozyme amplification for the detection of phoxim. Chem. Eng. J. 2024, 500, 156817. [Google Scholar] [CrossRef] [Scilit]
- Chang, D.; Yan, Y.; Feng, J.; Pei, J.; Yang, X.; Liu, Y.; Shi, L.; Shuang, S.; Dong, C. Magnetic carbon dots nanozyme coupled in-situ growth strategy: Colorimetric/ratiometric fluorescent/photothermal multi-model detection of Microcystin-LR. Sens. Actuator B-Chem. 2025, 443, 138224. [Google Scholar] [CrossRef] [Scilit]
- Guan, J.; Tao, T.; Zhou, N.; Liu, X.; Hu, J.; Huang, C.; Han, Y.; Gan, T.; Xiong, Y. S-doped Fe single atoms as efficient peroxidase-like nanozymes for colorimetric detection of oxytetracycline. Chem. Commun. 2026, 62, 3834–3838. [Google Scholar] [CrossRef] [Scilit] [PubMed]
- Xu, R.; Yang, Y.; Xu, M.; Tao, Y.; Deng, C.; Li, M.; Wei, D.; Deng, Y.; Lv, J.; Wu, C.; et al. Screening and discrimination of phenolic acids using bimetallic nanozymes based colorimetric sensor array. Sens. Actuator B-Chem. 2024, 420, 136484. [Google Scholar] [CrossRef] [Scilit]
- Standard’s GB 2763-2026; National Food Safety Standard-Maximum Residue Limits for Pesticides in Food. National Health Commission of the People’s Republic of China, Ministry of Agriculture and Rural Affairs, State Administration for Market Regulation: Beijing, China, 2026.
- Xu, Y.; Jia, X.; Yang, S.; Cao, M.; He, B.; Ren, W.; Suo, Z. An aptasensor with colorimetric and electrochemical dual-outputs for malathion detection utilizing peroxidase-like activity of Fe-MOF. Food Chem. X 2024, 24, 101835. [Google Scholar] [CrossRef] [Scilit] [PubMed]
- Wang, X.; Yu, H.; Li, Q.; Tian, Y.; Gao, X.; Zhang, W.; Sun, Z.; Mou, Y.; Sun, X.; Guo, Y.; et al. Development of a fluorescent sensor based on TPE-Fc and GSH-Au for the detection of organophosphorus pesticide residues in vegetables. Food Chem. 2024, 431, 137067. [Google Scholar] [CrossRef] [Scilit] [PubMed]
- Jin, C.; Yang, S.; Zheng, J.; Chai, F.; Tian, M. A smartphone-assisted portable on-site detection system for organophosphorus pesticides in vegetables and fruits based on all-in-one paper-based sensors: 2,2-dichlorovinyl dimethyl phosphate as a model. Food Chem. 2024, 459, 140369. [Google Scholar] [CrossRef] [Scilit] [PubMed]
- Lin, X.; Zou, J.; Zhu, G.; Pang, L.; Chen, Y.; Huang, Y. Cu-MOFs nanozyme with POD-like activity for the enrichment, identification, and intelligent colorimetric detection of omethoate. Food Biosci. 2025, 72, 1276–1288. [Google Scholar] [CrossRef] [Scilit]
Disclaimer/Publisher’s Note: The statements, opinions and data contained in all publications are solely those of the individual author(s) and contributor(s) and not of MDPI and/or the editor(s). MDPI and/or the editor(s) disclaim responsibility for any injury to people or property resulting from any ideas, methods, instructions or products referred to in the content. |
© 2026 by the authors. Licensee MDPI, Basel, Switzerland. This article is an open access article distributed under the terms and conditions of the Creative Commons Attribution (CC BY) license.