


Abstract
Perennial Salicornia species are promising halophytic food resources, but comparative information on their mineral and bioactive composition remains limited. We characterized elemental composition, total phenolic content, individual phenolic compounds in aerial tissues and seeds, fatty acid profiles, and seed morphology in selected taxa from seven perennial Salicornia species collected across Mediterranean, Atlantic, and inland saline habitats. Elemental composition was assessed by ICP-MS in 68 samples from 18 sites. Na, K, Mg, and Ca dominated the elemental profile, while species-related differences were detected for K, Ca, Fe, Ni, and Ba; fruiting samples showed lower Fe, As, Sr, Ba, and Pb concentrations. Total phenolic content ranged from 2.579 to 3.924 mg GAE/g DW. Several glycosylated flavonoids were identified: isoquercetin and rutin were the major forms, whereas luteolin-7-O-glucoside and apigenin-7-O-glucoside occurred only sporadically. In seeds, rutin and isoquercetin together accounted for 65.1–96.2% of quantified phenolics. Eleven fatty acids were identified, with substantial contributions of linoleic and α-linolenic acids in several samples. These results expand the compositional and taxonomic knowledge of perennial Salicornia and support their potential as alternative food resources.
1. Introduction
The genus Salicornia L. (Salicornioideae Ulbr., Amaranthaceae Juss.) currently comprises 56 accepted taxa according to the taxonomic treatment adopted by the Plants of the World Online database [1]. Although some authors continue to recognize Salicornia and Sarcocornia as separate genera [2,3,4], the present study follows the POWO classification, in which both the annual species (Salicornia) and the perennial species (Sarcocornia) are included within the genus Salicornia [5]. These taxa are halophytes, plants adapted to environments with high salt concentrations, such as coastal salt marshes and inland saline lakes. Species identification in the field is particularly challenging because of their high morphological similarity, which has resulted in frequent taxonomic confusion and inconsistent treatments among national floras. This taxonomic uncertainty also has practical implications beyond field studies, particularly in the context of the increasing international trade in seeds. Accurate identification is therefore essential for determining the origin and taxonomic identity of commercially traded plant material.
Species of Salicornia and Sarcocornia have long been consumed by coastal communities and, more recently, have gained considerable attention as premium gastronomic ingredients. Because of their close morphological resemblance, both groups are frequently marketed and consumed under the same commercial name. Annual Salicornia species are currently the most commonly consumed and are widely marketed as marsh samphire or sea asparagus because of their valued flavor and texture [6]. However, perennial species may also be of considerable interest because their higher productivity and year-round availability could facilitate their cultivation and commercialization. Accordingly, a better understanding of their nutritional and bioactive profiles is essential for assessing their potential in sustainable food production [7].
Ethnobotanical studies conducted throughout Europe, North Africa, and several Asian regions have emphasized the importance of Salicornia species in traditional diets and folk medicine, reflecting a rich body of local ecological knowledge [4,8]. These halophytes are recognized as valuable sources of nutrients, particularly minerals and dietary fiber, as well as a wide range of bioactive compounds, including fatty acids, and phenolic compounds, like flavonoids, which are largely responsible for their health-promoting properties [9,10,11]. Evidence from both in vitro experiments and animal models indicates that their extracts may contribute to glycemic control by improving insulin sensitivity, highlighting their potential as natural alternatives or complementary agents to conventional antidiabetic therapies [12,13]. Although Salicornia europaea remains the most extensively investigated species [14], increasing attention has recently been directed towards the perennial ones, such as Salicornia fruticosa [15] and Salicornia perennis [8,10], particularly regarding their antioxidant and antidiabetic properties and their potential as sources of health-promoting phytochemicals.
Recent studies by our research team have shown that Salicornia and related genera can accumulate substantial concentrations of essential macro- and micronutrients, including Na, K, Mg, Ca, Fe, Mn, and Zn [16,17,18]. The association of several of these elements with distinct crystalline mineral phases suggests that biomineralization contributes to nutrient sequestration and ion homeostasis under saline conditions. Fe is particularly noteworthy, as its accumulation has been associated with crystalline iron phases and electron-dense structures consistent with ferritin iron cores in chloroplasts [17,18]. Overall, the coexistence of crystalline mineral phases and chloroplast-localized ferritin supports the role of complementary mineral-and protein-based mechanisms in maintaining nutrient homeostasis and protecting against ionic and oxidative stress in these halophytes.
In the present study, we investigated seven perennial Salicornia species that are frequently misidentified, namely S. alpini, S. carinata, S. hispanica, S. fruticosa, S. lagascae, S. perennis, and S. pruinosa. Plant material was collected from several locations across the western Mediterranean region and adjacent Atlantic coasts, including Spain, Portugal, France, Sardinia (Italy), and Tunisia. The main objective of this study was to characterize the macro- and micronutrient composition of the profile of bioactive compounds including fatty acids, and phenolic compounds in these species, while extending the phenolic characterization to seeds. This approach allowed us to evaluate their nutritional value and their potential as emerging food resources for human consumption.
2. Materials and Methods
2.1. Sample Collection and Preparation
Specimens of Salicornia alpini, S. carinata, S. hispanica, S. fruticosa, S. lagascae, S. perennis, and S. pruinosa were collected from the populations listed in Table 1.
Table 1.
Collection information of each sample used in this study: code, origin (country, province and specific site) and WGS84 coordinates.
Sampling was conducted at different times of the year over several consecutive years. Voucher specimens were prepared for all collections and deposited in the Faculty of Pharmacy of the Complutense University of Madrid Herbarium (MAF). Most collections were made during the fruiting season (autumn and winter) between 2019 and 2025, but vegetative and flowering samples were also collected.
Analyzed plant material was vegetative (succulent photosynthetic stems) with or without flowers and fruits. For seed analyses, seeds were carefully separated from the infructescence, cleaned by sieving, and manually sorted to remove damaged seeds and other impurities.
Samples intended for these chemical analyses were processed as follows. Fresh samples were dried in a forced-air oven at 40 ± 5 °C for 35 h, ground to a particle size of ≤1 mm, thoroughly homogenized, and stored in sterile, airtight plastic containers at 4 °C until chemical analysis.
2.2. Seed Optical Stereomicroscopy
Seed morphological and micromorphological characterization was performed by optical stereomicroscopy. The Olympus SZX10 stereomicroscope, fitted with an Olympus SC30 camera (Olympus Corporation, Tokyo, Japan), was used to take photographs. Measurements were made using ImageJ (Java 1.8.0).
2.3. Inductively Coupled Plasma Mass Spectrometry (ICP-MS)
These analyses were carried out using the optimized methodology reported by [19]. Approximately 500 mg of dry powered plant material was digested in a Teflon tube in a mixture of 8 mL of 65% HNO3 and 2 mL of 30% H2O2 inside an MLS Ethos 1600 URM Milestone high-pressure microwave digester (Milestone S.r.l., Sorisole, Italy). The volume of each sample was subsequently adjusted to 25 mL with deionized water.
Na, Mg, K, Ca, Mn, Fe, Ni, Cu, Zn, As, Sr, Ba and Pb concentrations were determined in aliquots of the solutions obtained for each sample by ICP-MS using an ICP ELAN-600 PE Sciex Instrument (Toronto, ON, Canada) and expressed as mg kg−1 dry weight (DW). This technique has an inherent error of 15%.
2.4. Total Phenolic Compounds (TPCs)
Total phenolic content was determined by the Folin–Ciocalteu method [20] using gallic acid as the recommended standard [21]. A 0.5 mL aliquot of methanolic extract was taken from the extracts obtained previously, and 2.5 mL of Folin–Ciocalteu reagent was added, and left to react for 3 min. Then, 2 mL of Na2CO3 solution was added and mixed in a Heidolph shaker (Berlin, Germany). The solution was incubated at a temperature of 40 °C and stored in the dark for 1h. The absorbance was measured at 765 nm with a spectrophotometer, and the results were expressed as gallic acid equivalents (G.A.E.s).
2.5. Determination of Bioactive Compounds
2.5.1. Preparation of Methanol Extract
Five hundred milligrams of dried plant sample were extracted with a solution of 40 mL of methanol at 25 °C. It was kept in magnetic stirring for 60 min. The extracts were filtered using a Whatman No. 4 filter. The solid residue was recovered and extracted with 40 mL methanol. The extracts were filtered again and combined and evaporated (35 °C under vacuum of the methanolic extracts), then redissolved with methanol to obtain a 30 mg/mL extract solution, from which different dilutions were made (from 0.03125 mg/mL to 16 mg/mL). The extractions were performed in triplicate and were stored at 4 °C until the execution of the analyses.
2.5.2. Gas Chromatography Coupled with Mass Spectrometry (GC-MS) for Fatty Acid Analysis
Fatty acid analysis was performed using a 436GC gas chromatograph (Bruker Daltonics, Bremen, Germany) coupled to an EVOQ-TQ Premium EI&CI mass spectrometer (Bruker Daltonics). Data acquisition and processing were carried out using Bruker Mass Spectrometry Workstation software (version 8.2.1).
Chromatographic separations were achieved on an Rxi-5Sil MS capillary column (30 m × 0.25 mm i.d., 0.25 μm film thickness; Restek, Bellefonte, PA, USA). Helium was used as the carrier gas at a constant flow rate of 1.0 mL min−1. Samples were injected using a COMBI-PAL autosampler (Bruker Daltonics GmbH & Co. KG, Bremen, Germany; serial number 328847) with an injection volume of 1.0 μL in split mode (1:100). The injector temperature was maintained at 280 °C.
The oven temperature program was as follows: initial temperature of 80 °C, held for 5 min; ramped to 150 °C at 20 °C min−1 and held for 20 min; then increased to 200 °C at 1 °C min−1 without a holding step; finally increased to 300 °C at 10 °C min−1 and held for 10 min. The total run time was 98.5 min.
Mass spectrometric detection was performed using electron ionization (EI) at 70 eV. Mass spectra were acquired over an m/z range of 40–650. The transfer line and ion source temperatures were maintained at 250 °C and 200 °C, respectively. A solvent delay between 5 and 15 min was applied depending on the analytical sequence.
Fatty acid identification was accomplished by comparison of retention times and mass spectra with those obtained from the Supelco 37 Component FAME Mix standard (Sigma-Aldrich, St. Louis, MO, USA). Additional confirmation was achieved through spectral matching with the NIST mass spectral library. Quantification was carried out using external standard calibration curves for each identified compound. Calibration standards were prepared from authentic commercial reference materials, and analyte concentrations in the samples were calculated from the corresponding calibration curve.
The limits of detection (LOD) and quantification (LOQ) were not experimentally determined in the present study. Quantification was performed using external standard calibration curves for each analyte. Since the limits of detection (LOD) and quantification (LOQ) were not experimentally established, the lowest calibration point of the external standard calibration curve was considered as the practical lower limit of quantification (LOQ) for each analyte. This level corresponded to 50 ng for most fatty acid methyl esters (FAMEs), whereas for C24:0 and C18:3, it was 250 ng.
2.5.3. High-Performance Liquid Chromatography–Electrospray Ionization Mass Spectrometry (HPLC-MS/ESI) for Flavonoid and Hydroxycinnamic Acids Analysis
Flavonoids were analyzed by high-performance liquid chromatography coupled to tandem mass spectrometry (HPLC-MS/MS) using an EVOQ Elite mass spectrometer (Bruker, Bremen, Germany) equipped with an electrospray ionization (ESI) source. Chromatographic separation was performed on an ACE 3 C18 column (150 × 3.0 mm, 3 μm particle size) maintained at 25 °C.
The mobile phase consisted of water containing 0.1% acetic acid (solvent A) and acetonitrile containing 0.1% acetic acid (solvent B). The gradient elution program was as follows: 0.0 min, 90% A; 0.5 min, 90% A; 5.0 min, 50% A; 10.0 min, 50% A; 15.0 min, 0% A; 17.0 min, 0% A; 17.2 min, 90% A; and 20.0 min, 90% A. The flow rate was 0.4 mL min−1.
Mass spectrometric detection was carried out in negative electrospray ionization mode (ESI−) using a targeted MS/MS method. Compound identification was based on the characteristic fragmentation patterns obtained from the corresponding deprotonated molecular ions ([M−H]−). The ion source parameters were set as follows: source type, HESI; spray voltage, −4500 V (negative mode); cone temperature, 350 °C; cone gas flow, 40 arbitrary units; heated probe temperature, 400 °C; probe gas flow, 50 arbitrary units; nebulizer gas flow, 60 arbitrary units; and exhaust gas, ON.
Phenolic compounds, flavonoids, and hydroxycinnamic acids were analyzed by HPLC-ESI-MS/MS using a triple quadrupole mass spectrometer operating in multiple reaction monitoring (MRM) mode. Compound identification was achieved by comparison with authentic commercial standards. For each analyte, the precursor-to-product ion transitions, collision energies (CEs), and retention times under the chromatographic gradient conditions employed are summarized in Appendix A.
Since the mass spectrometer used was a unit-resolution triple quadrupole instrument, identification was based on the combination of retention time and characteristic MRM transitions. As analyses were performed using a low-resolution mass spectrometer, mass error criteria in parts per million (ppm) were not used, since these parameters are typically reserved for high-resolution mass spectrometry measurements.
2.5.4. Calculation of Fatty Acid Nutritional Quality Indices
Nutritional quality indices were calculated from the relative abundance of individual fatty acids. The PUFA/SFA ratio was calculated as the sum of polyunsaturated fatty acids divided by the sum of saturated fatty acids and provides a general measure of the relative contribution of these two fatty-acid classes. The index of atherogenicity (IA) was calculated as [C12:0 + 4(C14:0) + C16:0]/[ΣMUFA + ΣPUFA], giving greater weight to the saturated fatty acids considered to have the highest atherogenic potential. The hypocholesterolemic/hypercholesterolemic ratio (h/H) was calculated as [C18:1 + ΣPUFA]/[C12:0 + C14:0 + C16:0] and expresses the balance between fatty acids generally considered favorable and those associated with hypercholesterolemic effects. Higher PUFA/SFA and h/H values and lower IA values indicate a more favorable fatty-acid profile.
2.6. Descriptive and Graphical Analyses
2.6.1. ICP Data
The dataset comprised 68 analytical portions from 46 independent plants representing seven Salicornia species collected at 18 sampling sites. The individual plant was considered the statistical unit. When multiple portions were available, their valid elemental concentrations were averaged arithmetically before statistical analysis. Concentrations were expressed as mg kg−1 dry weight (DW). Instrumental non-detects (reported as 0.000) were treated as missing values and were not imputed. Consequently, 46 plants were available for 11 elements, 45 for Pb, and 30 for As.
Arithmetic means, standard deviations (SDs), medians, and ranges were calculated overall and by species. Absolute elemental profiles were represented by species medians and interquartile ranges (Q1–Q3) on a logarithmic scale. Relative profiles were calculated as log2(species median/genus reference), where the genus reference was the geometric mean of the seven species-specific medians for each element, thereby assigning equal weight to each species.
2.6.2. Statistical Analysis for ICP-Data
Element-specific concentrations were analyzed after log10 transformation. Interspecific differences were assessed using linear mixed-effects models (LMMs), with species as a fixed effect and sampling site as a random intercept. Models were fitted by restricted maximum likelihood (REML). For As, a linear model (LM) was used because the estimated random-intercept variance was zero. Global species effects were evaluated using F tests, with Satterthwaite denominator degrees of freedom for LMMs. The resulting 13 p values were adjusted using the Benjamini–Hochberg false discovery rate (FDR) procedure. Model-estimated marginal means and 95% confidence intervals (CIs) were back-transformed to obtain geometric mean concentration estimates. Pairwise comparisons were considered exploratory rather than confirmatory.
Phenological associations were assessed using additive models including species and phenological stage (vegetative or fruiting) as fixed effects and sampling site as a random intercept, except for As, which was analyzed using an LM adjusted for species. Species × phenology interactions were not included because of incomplete representation of phenological stages across species. Effects were expressed as fruiting-to-vegetative concentration ratios with 95% CIs. A separate Benjamini–Hochberg correction was applied to the 13 phenological tests. Statistical significance was defined as FDR-adjusted p < 0.05; confidence intervals were not multiplicity-adjusted.
Model convergence, singularity, and residual distributions were examined using numerical diagnostics, residual-versus-fitted plots, and Q–Q plots. Potentially influential observations and sampling sites were assessed through targeted sensitivity analyses.
For the phenological association with As, leave-one-plant-out analysis was performed by refitting the species-adjusted LM after excluding each of the 30 plants individually. An additional analysis was restricted to 11 plants from four species–site combinations containing both phenological stages, using an LM with species–site combination and phenology as fixed effects.
Statistical analyses were performed using R version 4.6.1 (R Core Team, 2026) within the RStudio integrated development environment (version 2026.07.1, Build 147; Posit Software, PBC). Linear mixed-effects models were fitted using the lme4 (version 2.0-6) and lmerTest (version 3.2-1) packages, and estimated marginal means were calculated using emmeans (version 2.0.4). Data manipulation and visualization were performed using dplyr (version 1.2.1), tidyr (version 1.3.2), and ggplot2 (version 4.0.3).
2.6.3. Phenolic Compounds Data
For each sample of plant tissues, two technical replicates were averaged. For Salicornia fruticosa (SFRU_NAB_02), chlorogenic acid, hydroxytyrosol, and salicylic acid concentrations were based on a single valid measurement because of an injection failure in the second replicate.
Total quantified phenolic content was calculated as the sum of the mean concentrations of the 18 compounds analyzed and expressed in ng/mg. The relative abundance of each compound was calculated as a percentage of the total quantified content. Given its predominance across samples, isoquercetin was also compared with the combined concentration of the remaining 17 compounds.
For each sample of seeds, two technical replicates were averaged. The total quantified content was calculated as the sum of the concentrations of quercetin, rutin, isoquercetin, and salicylic, ferulic, and chlorogenic acids, expressed in ng/mg. The relative contribution of each compound was expressed as a percentage of that sum, and the combined contribution of rutin and isoquercetin was calculated using the unrounded values. Differences in total content were expressed as the ratio of the highest to the lowest value.
3. Results
3.1. Elemental Composition and ICP-MS Analysis
3.1.1. Dataset and Overall Elemental Composition
The dataset comprised 68 analytical portions from 46 independent plants representing seven perennial Salicornia species collected at 18 sampling sites (Table 2). The number of plants varied among species, ranging from two in S. perennis, S. lagascae, and S. fruticosa to 24 in S. carinata. Twenty-seven plants were classified as vegetative and 19 as fruiting. Both phenological stages were represented in five species, whereas S. perennis was represented exclusively by vegetative plants and S. lagascae by fruiting plants.
Table 2.
Sampling structure of the Salicornia dataset. Number of independent plants, analytical portions, and sampling sites for each species, together with the distribution of plants between vegetative and fruiting stages. When multiple portions were available for an individual plant, elemental concentrations were averaged on the original scale before statistical analysis. Two sampling sites (La Rábida and San Juan del Puerto) were shared by S. alpini and S. pruinosa. Phenological counts refer to independent plants rather than analytical portions.
The overall elemental composition was dominated by Na, K, Mg, and Ca (Table 3; Figure 1). Median concentrations were 72,132 mg kg−1 DW for Na, 17,014 for K, 16,560 for Mg, and 8536 for Ca. The remaining elements decreased in plant tissues in the following order: Fe, Sr, Mn, Zn, Cu, Ba, Ni, Pb, and As.
Table 3.
Overall elemental composition of the studied Salicornia samples. Element concentrations are expressed as mg kg−1 dry weight (DW) and were summarized at the plant level. For plants represented by multiple analytical portions, concentrations were first averaged on the original scale so that each plant contributed a single independent observation. Values are reported as the arithmetic mean ± standard deviation (SD), median, and minimum–maximum range. n indicates the number of plants with a valid measurement for each element.
Figure 1.
Absolute elemental concentration profiles of the seven Salicornia species. Points represent species-specific median concentrations, and error bars indicate the interquartile range (Q1–Q3), calculated from plant-level observations. When multiple analytical portions were available for a plant, concentrations were first averaged on the original scale. Elements are ordered from highest to lowest overall median concentration in the complete genus dataset. Element concentrations are expressed as mg kg−1 dry weight (DW) and plotted on a logarithmic scale. Lines connect medians for visual guidance only.
Substantial variability was observed, particularly for As, Pb, and Fe, whose arithmetic means considerably exceeded their medians. The greatest discrepancies occurred for As (mean: 10.0; median: 0.425 mg kg−1 DW) and Pb (mean: 3.21; median: 0.553 mg kg−1 DW), reflecting strongly right-skewed distributions and the presence of high individual concentrations.
Although Na was the predominant element in all seven species, their elemental concentration profiles showed considerable descriptive variation (Table 4; Figure 1 and Figure 2). Salicornia perennis exhibited particularly high median Fe and Ba concentrations, whereas S. lagascae showed the highest median K, Ca, and Sr concentrations. Salicornia pruinosa had the lowest median concentrations of all four major elements (Na, K, Mg, and Ca), together with the highest median Pb concentration. The species-balanced relative profiles (Figure 2) further highlighted elevated relative As and Pb concentrations in S. pruinosa, Fe and Ba in S. perennis, and Ni and Cu in S. alpini. These patterns describe the observed elemental profiles without implying statistically confirmed differences among species.
Table 4.
Species-specific descriptive statistics for elemental concentrations in the seven Salicornia species. Values are presented as arithmetic mean ± standard deviation (SD) and median and are expressed as mg kg−1 dry weight. Non-detects were excluded on an element-by-element basis; consequently, sample sizes for As, Sr and Pb may be lower than the total number of samples available for each species.
Figure 2.
Relative elemental concentration profiles of the seven Salicornia species. Heatmap of log2-transformed ratios relative to a species-balanced genus reference, calculated as the median of the seven species-specific median concentrations. A value of 0 indicates that the species median equals the reference; positive values indicate relative enrichment (+1, two-fold; +2, four-fold), whereas negative values indicate relative depletion (−1, one-half; −2, one-quarter of the reference concentration).
3.1.2. Differences in Elemental Concentrations Among Species
Global tests indicated nominal species effects (p < 0.05) for K (F6,12.45 = 3.85, p = 0.021), Ca (F6,4.98 = 6.90, p = 0.026), As (F6,23 = 3.34, p = 0.016), and Ba (F6,7.33 = 7.25, p = 0.009). However, none of these effects remained statistically significant after Benjamini–Hochberg correction across the 13 elements (FDR-adjusted p = 0.084 for all four). No nominal species effect was detected for the remaining nine elements (Table 5).
Table 5.
Global tests of interspecific differences in elemental concentrations among Salicornia species. Elemental concentrations were analyzed after log10 transformation using linear mixed-effects models with species as a fixed effect and sampling site as a random intercept. For As, the sampling-site variance collapsed to zero; therefore, a linear model including species as the fixed effect was used. For mixed-effects models, denominator degrees of freedom and F tests were obtained using the Satterthwaite approximation. Reported p values correspond to the global species effect for each element. False discovery rate (FDR)-adjusted p values were calculated across the 13 elemental tests using the Benjamini–Hochberg procedure. LMM, linear mixed-effects model; LM, linear model; FDR, false discovery rate.
Model-estimated marginal means nevertheless revealed substantial variation among species for K, Ca, As, and Ba (Figure 3; Appendix B). Estimated K concentrations ranged from 4175 mg kg−1 DW in S. pruinosa to 31,930 mg kg−1 DW in S. lagascae, while the corresponding Ca estimates ranged from 4497 to 18,401 mg kg−1 DW. For As, the lowest estimated concentration was observed in S. carinata (0.137 mg kg−1 DW), whereas S. perennis and S. pruinosa showed higher estimates (4.19 and 4.10 mg kg−1 DW, respectively). The highest estimated Ba concentration was observed in S. perennis (59.8 mg kg−1 DW).
Figure 3.
Plant-level concentrations and model-estimated marginal means for K, Ca, As, and Ba among the seven studied Salicornia species. Gray points represent individual plant-level observations. Dark green points and vertical bars represent model-estimated marginal means and their 95% confidence intervals, respectively. Elemental concentrations were analyzed after log10 transformation. Models included species as a fixed effect and sampling site as a random intercept, except for As, which was analyzed using a linear model because the estimated sampling-site variance was zero. Model estimates and confidence intervals were back-transformed to the original concentration scale. Concentrations are expressed as mg kg−1 dry weight (DW), and the y-axis is displayed on a logarithmic scale.
Confidence intervals were frequently wide, particularly for species represented by few independent plants, indicating considerable uncertainty in the estimated concentrations. Accordingly, these patterns were interpreted descriptively, and no pairwise interspecific differences were considered statistically confirmed following FDR correction.
3.1.3. Associations Between Phenological Stage and Elemental Concentrations
Phenological stage was associated with differences in the model-estimated concentrations of several elements (Table 6). Nominally significant associations (p < 0.05) were observed for As, Sr, Ba, and Pb, with lower estimated concentrations in fruiting than in vegetative plants. The fruiting-to-vegetative concentration ratios were 0.110 for As (95% CI: 0.032–0.377; p = 0.0012), 0.423 for Sr (95% CI: 0.204–0.876; p = 0.0221), 0.488 for Ba (95% CI: 0.286–0.832; p = 0.0101), and 0.409 for Pb (95% CI: 0.202–0.827; p = 0.0145). However, after Benjamini–Hochberg correction across the 13 elements, only As remained statistically significant (FDR-adjusted p = 0.0157). The adjusted p values for Sr, Ba, and Pb were 0.0718, 0.0629, and 0.0629, respectively. No significant phenological association was detected for the remaining nine elements.
Table 6.
Associations between phenological stage and elemental concentrations in the seven studied Salicornia species. Elemental concentrations (mg kg−1 dry weight, DW) were analyzed at the individual plant level after log10 transformation. Linear mixed-effects models (LMMs) included species and phenological stage as fixed effects and sampling site as a random intercept. Arsenic (As) was analyzed using a linear model (LM) because the estimated sampling-site variance was zero. Phenological effects are expressed as back-transformed concentration ratios between fruiting and vegetative plants (Fruit/Vegetative), with corresponding 95% confidence intervals (CIs). Ratios greater than 1 indicate higher model-estimated concentrations in fruiting plants, whereas ratios below 1 indicate lower concentrations. Degrees of freedom for LMMs were estimated using the Satterthwaite approximation. p-values were adjusted across the 13 elemental tests using the Benjamini–Hochberg false discovery rate (FDR) procedure. Confidence intervals were not adjusted for multiple comparisons. Sample sizes (n) represent independent plants with valid measurements for each element. Only As, in bolds, remained statistically significant after FDR correction (adjusted p < 0.05).
The association between phenological stage and As concentration was further examined through sensitivity analyses. All 30 leave-one-plant-out models retained nominal statistical significance (p < 0.05), with fruiting-to-vegetative concentration ratios ranging from 0.063 to 0.153, indicating that the association was not driven by any single observation. However, when the analysis was restricted to 11 plants from four species–site combinations containing both phenological stages, the estimated ratio remained below one (0.136), but the association was no longer statistically significant (95% CI: 0.010–1.881; p = 0.112).
The interpretation of the As association is constrained by the uneven distribution of phenological stages across species and sampling sites, together with the structured occurrence of non-detects. In particular, all 16 missing As measurements corresponded to S. carinata, leaving only eight plants of this species with valid As concentrations. Although the estimated association was consistent in direction across sensitivity analyses, the restricted comparison showed considerable uncertainty, limiting the strength of conclusions regarding phenological differences in As accumulation.
3.1.4. Variability in Elemental Concentrations
Substantial variability in elemental concentrations was observed among individual plants, particularly for several trace elements (Table 3 and Table 4). This was especially evident in S. pruinosa, which showed pronounced dispersion in As (mean ± SD: 34.9 ± 62.6 mg kg−1 DW; median: 4.14 mg kg−1 DW) and Pb (12.9 ± 16.7 mg kg−1 DW; median: 8.00 mg kg−1 DW). The highest As concentration (181 mg kg−1 DW) was recorded in plant PRU_06 from Carabelas, whereas the highest Pb concentration (51.9 mg kg−1 DW) occurred in plant PRU_08 from Isla Cristina. Additional S. pruinosa plants from different sampling sites also exhibited elevated As concentrations, indicating that high As values were not restricted to a single individual.
Considerable uncertainty was also evident in several model-based estimates, as reflected by wide confidence intervals, particularly in species represented by few independent plants (Figure 3; Appendix B). Sampling was unevenly distributed among species and localities, with most sites represented by a single species. These features limited the precision of interspecific estimates and complicated the separation of species-related variation from differences associated with sampling sites.
3.2. Total Phenolic Content (TPC)
The TPC of the perennial Salicornia samples ranged from 2.579 to 3.924 mg GAE/g DW across populations from Atlantic and Mediterranean coastal areas of Spain and Tunisia and inland areas of central Spain (Table 7). TPC values were relatively consistent across the analyzed samples, with the highest value recorded in S. hispanica from Villena (SHIS_ALI_04) and the lowest in S. lagascae from Santa Pola (SLAG_ALI_03).
Table 7.
Total phenolic content (TPC; mg GAE/g DW) in perennial Salicornia samples. Values are means ± SD.
3.3. Phenolic Compounds
Plant Tissues
Eighteen compounds were quantified in 13 samples representing seven species (Figure 4 and Figure 5). Total concentrations ranged from 36.1 ng/mg in Salicornia perennis from Corralejo (SPER_CNR_01) to 14,385.3 ng/mg in S. fruticosa from Korba (SFRU_NAB_01). Flavonoids were generally the predominant group, from 55.3% in S. lagascae (SLAG_ALI_03) to 99.3% in S. alpini (SALP_TUN_02). Conversely, phenolic acids were more variable and dominated only in SPER_CNR_01 (73.3% vs. 19.1%). Lignans and the remaining compounds made minor contributions to most samples.
Figure 4.
Concentration of isoquercetin and the combined concentration of the other 17 compounds in the samples analyzed. The total length of each bar represents the total quantified concentration.
Figure 5.
Relative composition of the phenolic profile after excluding isoquercetin. Percentages were calculated relative to the combined concentration of the remaining 17 compounds. The color scale represents the relative contribution (%) of each compound to this secondary profile.
Several glycosylated flavonoids were identified. Isoquercetin and rutin were widespread and quantitatively predominant, whereas luteolin-7-O-glucoside and apigenin-7-O-glucoside were detected only sporadically.
Isoquercetin was the predominant compound in 12 of the 13 samples, accounting for 51.6–98.6% of their total quantified content (Figure 4). The highest total concentrations were therefore largely attributed to this compound. The only exception was S. perennis from Corralejo (SPER_CNR_01), in which vanillic acid predominated and isoquercetin accounted for 19.1% of the total.
After isoquercetin, chlorogenic acid and rutin were the most abundant compounds, both occurring in all samples. The combined contribution of phenolic acids was particularly high in S. lagascae from Santa Pola (SLAG_ALI_03) and S. perennis from Órzola (SPER_CNR_02), accounting for 41.9% and 30.1% of the total, respectively. Excluding isoquercetin from the profile provided a clearer representation of the variation in less abundant compounds among samples (Figure 5).
3.4. Seeds
3.4.1. Salicornia Seed Morphology
The genus Salicornia is widely distributed in salt marshes and saline inland habitats and includes annual and perennial species [22]. Seed testa ornamentation is a valuable micromorphological character for species discrimination [3]. As shown in Figure 6, S. lagascae has a verrucate testa with rounded and conical papillae, S. fruticosa has short hair mainly along the margins, and S. pruinosa has short hairs covering the entire seminal surface. S. perennis and S. alpini are characterized by long, dense hairs. Here, we recognize Salicornia at species rank, following the nomenclatural combination previously proposed in [23]. This taxon differs from S. alpini in its strongly carinated leaves and seed characters. S. carinata has significantly smaller seeds and shorter, thinner ap-pressed trichomes (mean length and width: 53.8 and 17.4 µm, respectively) than S. alpini (88.9 and 21.7 µm, respectively) [3].
Figure 6.
Optical images of seed detail of S. carinata (a,b) SCAR_TOL_11; S. alpini (c,d) SALP_TUN_01; S. lagascae (e,f) SLAG_MEN_01; S. perennis (g,h) SPER_HUE_01; S. pruinosa (i,j) SPRU_SAN_01; S. fruticosa SFRU_SAR_01 (k,l).
3.4.2. Phenolic Compounds in Seeds
Six phenolic compounds were quantified in the seeds: the flavonoids quercetin, rutin, and isoquercetin, and the phenolic acids salicylic, ferulic, and chlorogenic (Table 8). The profiles were dominated by rutin and isoquercetin, which together accounted for between 65.1% and 96.2% of the total of the six quantified compounds. The total content ranged from 1618 ng/mg in S. pruinosa from the Río Tinto estuary (SPRU_HUE_08) to 10,790 ng/mg in S. fruticosa from Sardinia (SFRU_SAR_01).
Table 8.
Total concentration and relative composition of the six phenolic compounds quantified in seeds.
S. alpini sample (SALP_TUN_01) was dominated by rutin and isoquercetin, which accounted for 44.5% and 51.7% of the total quantified content, respectively, and together reached 96.2%. In contrast, the S. carinata samples exhibited contrasting profiles. At Laguna Larga (SCAR_TOL_10), isoquercetin predominated, accounting for 54.6%, while at Laguna de Tírez (SCAR_TOL_11), rutin predominated, accounting for 67.6%, accompanied by greater contributions from ferulic and chlorogenic acids.
The five S. pruinosa samples were dominated by rutin, whose contribution ranged from 58.5% to 64.3%. The main differences among populations were observed for isoquercetin, ranging from 6.0% to 29.6%, and for ferulic and chlorogenic acids. Overall, the samples differed both in their total content and in the relative composition of the six quantified compounds.
3.5. Fatty Acid Composition
The fatty acids identified in the analyzed perennial Salicornia species comprised saturated fatty acids (SFAs), monounsaturated fatty acids (MUFAs), and polyunsaturated fatty acids (PUFAs) (Figure 7).
Figure 7.
Relative composition of fatty acid classes across the studied localities. Saturated fatty acids (SFAs) included C12:0 (lauric acid), C14:0 (myristic acid), C16:0 (palmitic acid), C17:0 (margaric acid), C18:0 (stearic acid), C20:0 (arachidic acid), C22:0 (behenic acid), and C24:0 (lignoceric acid); monounsaturated fatty acids (MUFAs) included C18:1 (oleic acid); and polyunsaturated fatty acids (PUFAs) included C18:2 (linoleic acid) and C18:3 (α-linolenic acid). Each bar represents the percentage contribution of these three classes to the total fatty acid profile of a sample and sums to 100%.
Across the samples studied, lipid profiles were generally characterized by a predominance of SFAs or PUFAs, whereas MUFAs remained minor. S. alpini and S. carinata showed relatively similar intermediate profiles, although the proportion of PUFAs was higher in S. carinata (47.7%) than in S. alpini (38.8%). The clearest deviations from this general pattern were observed in S. lagascae from Santa Pola (SLAG_ALI_03), in which palmitic acid (C16:0) was the most abundant fatty acid, and S. perennis from Murraceira (SPER_FDF_01), which showed an exclusively saturated profile dominated by lignoceric acid (C24:0). Overall, the differences observed among localities highlighted marked intraspecific variation.
The most diverse class was the saturated fatty acids (SFAs), among which eight compounds were identified: lauric acid (C12:0), myristic acid (C14:0), palmitic acid (C16:0), margaric acid (C17:0), stearic acid (C18:0), arachidic acid (C20:0), behenic acid (C22:0), and lignoceric acid (C24:0). Among the monounsaturated fatty acids, only oleic acid (C18:1) was detected, and MUFAs never exceeded 12.5% (Figure 7). The polyunsaturated fatty acids identified were linoleic acid (C18:2) and α-linolenic acid (C18:3).
Palmitic acid (C16:0) was detected in all analyzed samples, whereas stearic acid (C18:0) and lauric acid (C12:0) were detected in 13 and 14 samples, respectively. These fatty acids were therefore among the most common constituents of the lipid profiles of the Salicornia species studied (Figure 8). On the other hand, margaric acid (C17:0) and arachidic acid (C20:0) were mainly detected in S. alpini, S. carinata, S. fruticosa, and S. hispanica. Arachidic acid was also detected in both populations of S. lagascae, whereas margaric acid was absent from this species. Neither compound was detected in the S. perennis samples.
Figure 8.
Relative fatty acid profile across the studied localities. The heatmap represents the abundance of C12:0 (lauric acid), C14:0 (myristic acid), C16:0 (palmitic acid), C17:0 (margaric acid), C18:0 (stearic acid), C18:1 (oleic acid), C18:2 (linoleic acid), C18:3 (α-linolenic acid), C20:0 (arachidic acid), C22:0 (behenic acid), and C24:0 (lignoceric acid), expressed as a percentage of the total fatty acid content of each sample. Darker shades indicate a greater relative contribution.
In S. pruinosa, both fatty acids were absent from the Murraceira sample (SPRU_FDF_01) but present in the population from Isla Cristina (SPRU_HUE_11) (Figure 8).
Myristic acid (C14:0) and behenic acid (C22:0) were detected in most samples, occurring in 11 and 12 of the 15 samples, respectively, generally at low-to-moderate relative abundances. In contrast, lignoceric acid (C24:0) showed substantial variation among samples. Although it was absent from seven samples, it accounted for 55.0% of the total fatty acid profile in S. perennis from Murraceira (SPER_FDF_01), 20.3% in S. perennis from Lobos (SPER_CNR_03), and 19.9% in S. pruinosa from Murraceira (SPRU_FDF_01). This marked variation highlights the contribution of long-chain saturated fatty acids to the lipid profiles of some populations.
Regarding the polyunsaturated fatty acids, linoleic acid (C18:2) was detected in 14 of the 15 analyzed samples, whereas α-linolenic acid (C18:3) was present in 9 samples. When detected, both compounds frequently account for substantial proportions of the total fatty acid profile, with the highest relative abundances recorded for linoleic acid in S. fruticosa from Hammamet (SFRU_NAB_02; 49.4%) and for α-linolenic acid in S. perennis from La Santa (SPER_CNR_04; 48.6%). Their frequent occurrence and substantial relative contribution suggest a potential nutritional interest of the lipid fraction of the species studied.
Total fatty acid concentration also varied widely. S. fruticosa from Hammamet (SFRU_NAB_02) reached 46.0 ng mg−1, more than three times the value recorded in Korba (SFRU_NAB_01; 13.3 ng mg−1). S. carinata, S. perennis from Órzola (SPER_CNR_02), and S. alpini (SALP_TUN_02) showed similar values, ranging from 11.4 to 12.8 ng mg−1. S. hispanica and S. pruinosa displayed intermediate concentrations, whereas S. lagascae showed low and relatively consistent values. The lowest concentrations were recorded in S. perennis from Murraceira (SPER_FDF_01) and Corralejo (SPER_CNR_01) at 2.8 and 3.0 ng mg−1, respectively (Figure 9).
Figure 9.
Total fatty acid concentration across the studied localities. Bars show the sum of the quantified fatty acids in each sample, grouped by species. Values are expressed as ng mg−1.
The nutritional quality indices showed marked variation among populations (Table 9). The highest PUFA/SFA ratios were recorded in S. hispanica from El Hondo (1.94), S. perennis from Órzola (1.89), S. fruticosa from Hammamet (1.80), and S. perennis from La Santa (1.73). These populations also showed relatively low IA values (0.20–0.89) and high h/H ratios (2.20–5.01). In contrast, S. lagascae populations from Urbanova and Santa Pola exhibited the lowest PUFA/SFA ratios (0.24–0.27), the highest IA values (2.10–2.20), and the lowest h/H ratios (0.84–0.87). A similarly less favourable profile was observed in S. pruinosa from Isla Cristina. In S. perennis from Murraceira, PUFA and MUFA were not detected, resulting in a PUFA/SFA ratio and h/H ratio of zero, whereas IA could not be calculated.
Table 9.
Nutritional quality indices of fatty acids across the studied populations.
4. Discussion
4.1. Elemental Composition
The elemental composition of the seven Salicornia species was dominated by Na, K, Mg, and Ca, with median concentrations of 72,132, 17,014, 16,560, and 8536 mg kg−1 DW, respectively. This pattern is consistent with the ion-accumulating strategy of succulent euhalophytes, in which Na plays an important role in osmotic adjustment, growth, and succulence [24]. Nevertheless, the relative abundance of Ca and Mg appears to vary among Salicornioideae. Mg exceeded Ca in our samples and in Portuguese material examined by Lopes et al. [10], whereas the opposite relationship was reported for Spanish Salicornia populations [25] and several Italian glassworts [26]. These observations suggest that the relative accumulation of divalent cations is not constant across taxa and growing environments.
Although the species exhibited different elemental concentration profiles, no statistically significant interspecific effects remained after correction for multiple testing. K, Ca, As, and Ba showed nominal species effects, but all four had FDR-adjusted p values of 0.084. Nevertheless, some descriptive patterns were consistent with previous observations. For example, the relatively low K and Ca concentrations in S. pruinosa (medians of 6734 and 4270 mg kg−1 DW, respectively) were comparable to those reported for populations from the Río Tinto salt marshes [16]. Other noteworthy observations included the elevated Fe and Ba concentrations in S. perennis and Ni concentrations in S. alpini. Previous studies have documented substantial variation in metal accumulation among Salicornioideae [27], as well as Fe biomineralization and intracellular Fe storage in S. pruinosa [16,28]. However, the small number of independent plants available for several species and the wide confidence intervals of some model estimates prevent these patterns from being interpreted as confirmed species-specific characteristics.
A particularly important feature of the present study was the substantial variability observed among individual plants and sampling locations. Unlike plants cultivated under controlled conditions, the specimens analyzed here originated from wild populations occupying diverse environments, including coastal salt marshes and inland endorheic saline lagoons, under Atlantic and Mediterranean climatic influences and on substrates of potentially different mineral composition. Variation in soil chemistry, salinity, flooding frequency, and nutrient availability could therefore contribute to the observed heterogeneity. Previous studies have demonstrated associations between environmental conditions and mineral accumulation in S. carinata [29] and other edible halophytes [26]. However, these environmental factors were not directly quantified in the present study, preventing their individual contributions from being established.
This environmental heterogeneity is particularly relevant to S. pruinosa, which exhibited markedly right-skewed distributions of As and Pb, including maximum concentrations of 181 and 51.9 mg kg−1 DW, respectively. Several sampled populations of this species originated from the Tinto–Odiel marsh system, an environment historically affected by metal-rich drainage and elevated concentrations of potentially toxic elements [27,30]. Exposure to metal-enriched sediments may have contributed to some of the elevated concentrations observed, although this interpretation remains hypothetical because corresponding soil and water chemistry data were unavailable. The variation observed within S. pruinosa emphasizes the potential importance of local substrate characteristics, element bioavailability, and plant uptake and compartmentalization processes. It also highlights the limitations of extrapolating elemental concentrations from individual wild populations to an entire species.
Phenological stage represented another potential source of variation. Although As, Sr, Ba, and Pb showed nominal associations with phenology, only As remained statistically significant after FDR correction. Fruiting plants exhibited an approximately 89% lower model-estimated As concentration than vegetative plants after adjustment for species identity (concentration ratio = 0.110; 95% CI: 0.032–0.377). This association was maintained in all leave-one-plant-out analyses but was no longer statistically significant when the comparison was restricted to species–site combinations containing both phenological stages. The limited within-site replication, incomplete representation of phenological stages across species, and concentration of non-detectable As measurements in S. carinata therefore constrain its interpretation. Although developmental variation in mineral accumulation has been documented in Salicornia brachiata [31], the present findings do not establish a direct physiological effect of phenological stage on As accumulation.
From a nutritional perspective, the mineral concentrations indicate potential value as food ingredients, although they must be considered alongside the high Na content. Using the overall arithmetic mean concentrations, 100 g of dried plant material would contain approximately 1627 mg K, 1684 mg Mg, 936 mg Ca, and 53.5 mg Fe. Compared with the European Food Safety Authority (EFSA) dietary reference values for adults, these amounts correspond to approximately 47% of the adequate intake (AI) for K, 481–561% of the AI for Mg, 94–99% of the population reference intake (PRI) for Ca, and 334–486% of the PRI for Fe, depending on age or sex [32]. Manganese and Cu could also contribute appreciably to dietary mineral intake, whereas Zn would provide a more modest contribution. However, the same 100 g of dried material would contain approximately 8.30 g Na, more than four times the EFSA safe and adequate adult intake of 2 g/day [33]. Species-specific comparisons also revealed differences in the balance between essential minerals and Na. Salicornia carinata showed a comparatively favorable Mg/Na ratio, together with a relatively high K/Na ratio, whereas S. lagascae exhibited the highest K/Na and Ca/Na ratios. Nevertheless, these descriptive patterns should not be interpreted as confirmed interspecific differences, and the elevated Na concentrations across all species remain an important nutritional limitation. Furthermore, these calculations are illustrative rather than serving-size recommendations, because actual nutritional contributions depend on consumption amounts, processing, mineral bioaccessibility, and the overall dietary context.
Food safety is therefore a critical consideration, particularly for material harvested from potentially contaminated environments. The maximum concentrations recorded for As, Pb, and Ni were 181, 51.9, and 21.3 mg kg−1 DW, respectively. For comparison, European Union legislation establishes maximum concentrations of 0.30 mg kg−1 for Pb and 0.50 mg kg−1 for Ni in the general category of leafy vegetables, expressed on a fresh-weight basis [34,35]. However, the applicability of these categories to the studied perennial Salicornia species and their potential food products requires confirmation. Furthermore, the absence of moisture measurements prevents direct conversion of the present dry-weight concentrations to fresh-weight equivalents. Consequently, regulatory compliance cannot be established from these data alone. Nevertheless, the elevated concentrations observed in certain plants warrant particular attention, particularly because of the health implications of chronic Pb exposure and dietary Ni exposure, including adverse reactions in Ni-sensitized individuals [30]. In addition, the present study measured total As without distinguishing inorganic from organic forms. Because inorganic As is of particular toxicological concern, chemical speciation would be necessary for a more specific dietary risk assessment [34].
Potentially excessive exposure to essential elements should also be considered when evaluating dried or concentrated plant products. The highest observed Mn and Cu concentrations (267 and 160 mg kg−1 DW, respectively) correspond to 26.7 and 16.0 mg per 100 g of dried material. These amounts exceed the EFSA adult safe intake level of 8 mg/day for Mn and the approximately 5 mg/day Cu intake considered unlikely to result in copper retention, respectively [36,37]. Importantly, EFSA has not established a tolerable upper intake level for Mn, and exceeding its safe intake level does not necessarily imply adverse health effects. Similarly, the concentrations of Sr and Ba, which reached 1077 and 108 mg kg−1 DW, respectively, suggest that these elements should also be considered when assessing exposure from concentrated plant products. However, these comparisons involve hypothetical consumption of material containing the highest observed concentrations, rather than established serving sizes or measured dietary exposures. They should therefore be interpreted as indications of potential exposure concerns, not evidence of toxicity.
Taken together, these findings highlight the need to evaluate both the nutritional potential and elemental safety of Salicornia before its use as food. The substantial variability observed among wild populations suggests that elemental composition may depend strongly on growing conditions, particularly substrate chemistry and element availability. Accordingly, food production should preferably rely on controlled cultivation systems with appropriate monitoring of soils or growing substrates and irrigation water, followed by systematic elemental quality control of harvested biomass and derived products [10,30]. Particular attention should be given to Na, As, Pb, and Ni, together with other elements that may reach elevated concentrations in dried or concentrated preparations. Such measures would help ensure more consistent mineral composition while minimizing exposure to potentially harmful elements.
4.2. Total Phenolic Content
Environmental conditions are another major source of variation in phenolic accumulation. Halophytes develop under multiple abiotic stresses, including high salinity, intense irradiation, and episodic water limitation, all of which can modify oxidative metabolism and stimulate the production of phenolic compounds involved in antioxidant protection [10]. In Salicornia, differences in phenolic content among populations have likewise been associated with contrasting environmental conditions, particularly salinity and exposure to other environmental stresses [38]. These responses occur together with broader metabolic adjustments, including changes in lipid metabolism. Accordingly, the presence of appreciable TPC values in all populations analyzed here is consistent with the recognized capacity of Salicornia to synthesize antioxidant phenolics and further supports its interest as a source of bioactive compounds with potential applications in functional foods.
The TPC values obtained in the present study were consistent with those previously reported for glassworts from the Iberian Peninsula. Annual Salicornia populations showed values ranging from 2.989 to 4.209 mg GAE/g DW [39], while perennial species previously treated in the former recognized Sarcocornia showed values between 3.231 and 3.892 mg GAE/g DW [38]. The range recorded here, 2.579–3.924 mg GAE/g DW, largely overlapped these earlier findings.
TPC values were relatively similar across the species and populations examined. Particularly close values were recorded between the two populations of S. lagascae, S. fruticosa, and S. hispanica.
These results expand the available information on the phenolic content of perennial Salicornia. Given the recognized contribution of phenolic compounds to the antioxidant properties of halophytes, the concentrations recorded support the potential of perennial Salicornia as a source of bioactive compounds [40,41,42].
4.3. Phenolic Compounds
A total of 18 phenolic compounds were quantified in the analyzed plant material, including hydroxybenzoic and hydroxycinnamic acids, flavonoids, the lignan pinoresinol, and hydroxytyrosol. Chlorogenic acid and rutin were detected in all samples, whereas the other phenolic acids and flavonoids showed greater variation in occurrence and concentration among taxa and populations. This broad profile is consistent with previous studies of annual and perennial Salicornia species [10,38,39,42,43].
Among the phenolic acids, ferulic and chlorogenic acids showed the most relevant concentrations in the present study. Ferulic acid was detected in all analyzed samples, extending previous reports in which it was identified only in particular halophytic taxa, Arthrocaulon macrostachyum, a genus closely related to Salicornia [38]. Its widespread occurrence is noteworthy because ferulic acid has been associated with antioxidant defense and cell-wall reinforcement in plants. In S. europaea, salinity altered phenylpropanoid metabolism and significantly increased ferulic acid concentrations in the roots [44]. This response may provide a physiological context for the frequent occurrence of ferulic acid in the perennial Salicornia taxa analyzed here, although its specific role in these species remains to be established.
Chlorogenic acid was also detected across the analyzed taxa and reached its highest concentrations in S. perennis from Lanzarote and Fuerteventura (Canary Island, Spain). Comparable values occurred in some Atlantic and Mediterranean populations of S. pruinosa, S. hispanica, S. carinata, and S. fruticosa, although the concentrations were generally low. Chlorogenic acid has previously been reported on annual Salicornia species and may contribute to their antioxidant capacity [43,44]. Its concentration can nevertheless vary according to tissue, developmental stage, salinity, and geographic origin. The occurrence of chlorogenic acid in the perennial Salicornia taxa examined here therefore extends the information available for this group, particularly for the less frequently studied species.
The flavonoid profile was dominated by quercetin derivatives. Isoquercetin was detected in all samples and reached its highest concentrations in S. carinata, S. alpini, and S. fruticosa, whereas lower values were generally observed in the other analyzed taxa, including S. perennis, S. pruinosa, S. hispanica, and S. lagascae. Rutin was also detected in all samples, although its concentration varied considerably, while free quercetin occurred at much lower levels. Apigenin, apigenin-7-O-glucoside, luteolin, and luteolin-7-O-glucoside were detected only sporadically. The widespread occurrence of rutin and isoquercetin agrees with previous reports identifying quercetin and its glycosylated derivatives as recurrent constituents of annual and perennial Salicornia [4,38,39,43,45,46]. Their greater abundance than free quercetin is consistent with the predominance of glycosylated forms in the analyzed tissues.
The seeds analyzed in the present study contained salicylic, ferulic, and chlorogenic acids, together with the flavonoids quercetin, rutin, and isoquercetin. Rutin and isoquercetin were the predominant compounds and together accounted for 65.1–96.2% of the total quantified content, although their relative contributions varied among taxa and populations. Previous studies on annual Salicornia seeds have mainly focused on total phenolic and flavonoid contents, antioxidant and cytotoxic activities, or seed-oil composition [11,47,48,49]. In contrast, the present study provides information on individual phenolic acids and flavonoids in the seeds of perennial Salicornia taxa. To the best of our knowledge, this is the first report of these individual phenolic acids in the seeds of the taxa investigated here.
4.4. Fatty Acids
In the present study, eleven fatty acids were identified in the analyzed Salicornia species, including saturated fatty acids (SFAs), monounsaturated fatty acids (MUFAs), and polyunsaturated fatty acids (PUFAs).
Recent studies on halophytes support the view that variation in lipid profiles may form part of the physiological response to environmental stress. In Salicornia europaea, salt exposure has been associated with substantial remodeling of lipid metabolism and changes in membrane lipid composition that may contribute to membrane stability and ionic homeostasis under saline conditions [50]. Likewise, variation in fatty acid composition has been observed under different cultivation and environmental conditions in Salicornia species [51,52].
Palmitic acid (C16:0) was detected in all analyzed samples and was one of the most consistently occurring saturated fatty acids, in agreement with previous studies reporting C16:0 as a major saturated fatty acid in several species of the genus [3,32]. In addition to its previously reported occurrence in S. perennis and S. alpini, the present study confirms its presence in S. carinata, S. fruticosa, S. hispanica, and S. lagascae. The highest concentration was recorded in S. fruticosa (6.16 ng mg−1). Likewise, lauric acid (C12:0) and stearic acid (C18:0) were detected in 14 and 13 of the 15 samples analyzed, respectively, indicating that these saturated fatty acids are common components of the lipid profile of the species examined.
Interestingly, margaric acid (C17:0) was detected in several Salicornia species inhabiting Mediterranean coastal salt marshes and inland saline habitats, including S. alpini, S. carinata, S. fruticosa, and S. hispanica, as well as in one population of S. pruinosa. Previous studies had already reported this fatty acid in S. perennis subsp. perennis and S. perennis subsp. alpini from Portuguese populations [4,45]. In the present study, however, margaric acid was absent from all analyzed populations of S. perennis. These findings suggest that the occurrence and abundance of margaric acid may vary among species and populations and may also be influenced by environmental conditions characteristic of different saline habitats.
Among the monounsaturated fatty acids, oleic acid (C18:1) was identified, whereas palmitoleic acid (C16:1) was not detected in any of the analyzed Salicornia samples. This contrasts with previous reports from Portuguese populations of S. perennis and S. alpini, in which palmitoleic acid was identified [4,45]. Differences in fatty acid composition among populations may be influenced by species-specific responses and environmental conditions. In Salicornia ramosissima, for example, fatty acid profiles have been shown to vary in response to temperature and CO2 conditions, although no significant changes attributable to salinity or drought were detected in that study [52]. Cultivation conditions may also modify lipid composition [51].
Several analyzed samples exhibited high proportions of polyunsaturated fatty acids (PUFAs), particularly linoleic acid (C18:2) and α-linolenic acid (C18:3). High concentrations of both fatty acids were recorded in S. carinata, S. fruticosa, and S. perennis. Notably, S. hispanica, especially the population collected at San Felipe Neri, showed elevated concentrations of linoleic acid (4.16 ng mg−1) and α-linolenic acid (2.17 ng mg−1). Changes in the degree of fatty acid unsaturation are considered part of the adaptive response of halophytes to saline environments because they can contribute to maintaining membrane properties under stress conditions [38,50,53].
Beyond their physiological role in plants, polyunsaturated fatty acids are bioactive compounds of considerable nutritional interest. Previous studies on Salicornia have highlighted the nutritional relevance of lipid profiles rich in unsaturated fatty acids and their potentially favorable atherogenic and thrombogenic indices [4]. Other studies have also associated fatty acids identified in these plants with different biological activities [38].
The three indices revealed clear population-level differences in lipid quality. S. hispanica from El Hondo, S. fruticosa from Hammamet, and S. perennis from Órzola and La Santa showed particularly favourable profiles, combining high PUFA/SFA and h/H values with low IA values. These patterns were associated with a substantial contribution of linoleic and α-linolenic acids and highlight the nutritional interest of selected perennial Salicornia populations, in agreement with previous findings for the edible halophyte S. ramosissima [54].
Therefore, the substantial contribution of PUFAs, particularly linoleic and α-linolenic acids, observed in several Salicornia species further supports their potential as functional foods and as valuable sources of nutritionally relevant bioactive compounds.
5. Conclusions
This study provides a comparative characterization of the mineral and bioactive composition of seven perennial Salicornia species across multiple populations and environments. A common elemental profile dominated by Na, K, Mg, and Ca was accompanied by species-related differences in K, Ca, Fe, Ni, and Ba and by phenology-related variation in several trace elements, showing that perennial Salicornia cannot be represented by a single elemental profile.
The lipid quality indices based on the PUFA/SFA ratio, the atherogenicity index (AI), and the hypocholesterolemic/hypercholesterolemic ratio (h/H) revealed highly favorable lipid profiles in the perennial Salicornia species, particularly S. hispanica, S. fruticosa, and S. perennis. These patterns were associated with a substantial contribution of linoleic and α-linolenic acids, highlighting the nutritional potential of perennial Salicornia populations.
The analysis of phenolic compounds revealed moderate total contents but marked variation in the individual compounds. Several glycosylated flavonoids were identified. Isoquercetin and rutin were the predominant forms in the aerial tissues, whereas luteolin-7-O-glucoside and apigenin-7-O-glucoside occurred only sporadically. Rutin and isoquercetin were also the predominant phenolic compounds among those quantified in the seeds.
A key contribution of this study is the inclusion of data on the fatty acid, phenolic compound, and flavonoid contents of perennial Salicornia species, namely S. alpini, S. carinata, S. fruticosa, S. hispanica, S. lagascae, S. perennis, and S. pruinosa. Given the scarcity of available data on phenolic compounds and flavonoids in the seeds of annual Salicornia species, our study provides, for the first time, data on these compounds in the seeds of these seven perennial species.
Author Contributions
Conceptualization, V.d.l.F., L.R. and E.R.; methodology, V.d.l.F., L.R., E.R., C.P. and N.R.; software, L.R., E.R., C.P. and N.R.; validation,; V.d.l.F., L.R., E.R., C.P., N.R. and R.A.; formal analysis, L.R., E.R., C.P. and N.R.; investigation V.d.l.F., L.R., E.R., C.P. and N.R.; resources, N.R. and R.A.; data curation V.d.l.F., L.R., E.R., C.P. and N.R.; writing—original draft preparation, V.d.l.F., L.R., E.R. and R.A.; writing—review and editing V.d.l.F., L.R., E.R. and R.A.; visualization, V.d.l.F., L.R. and E.R.; supervision, R.A.; project administration, N.R.; funding acquisition, R.A. and L.R. All authors have read and agreed to the published version of the manuscript.
Funding
This research was funded by the Spanish State Research Agency (Agencia Estatal de Investigación, AEI), grant number PID2022-136607NB-I00, and by the 2016 Grant Program of the Vicerrectorado de Investigación e Innovación, Universidad Francisco de Vitoria.
Institutional Review Board Statement
Not applicable.
Informed Consent Statement
Not applicable.
Data Availability Statement
The original contributions presented in this study are included in the article. Further inquiries can be directed to the corresponding authors.
Acknowledgments
During the preparation of this manuscript, the authors used Chat GPT 5.6 for the purpose of improving and correcting the writing. The authors have reviewed and edited the output and take full responsibility for the content of this publication.
Conflicts of Interest
The authors declare no conflicts of interest. The funders had no role in the design of the study; in the collection, analyses, or interpretation of data; in the writing of the manuscript; or in the decision to publish the results.
Abbreviations
The following abbreviations are used in this manuscript:
| DW | Dry weight |
| MUFAs | Monounsaturated fatty acids |
| PUFAs | Polyunsaturated fatty acids |
| POWO | Plants of the World Online |
| SFAs | Saturated fatty acids |
| TPC | Total Phenolic Content |
Appendix A
Table A1.
Enumeration of authentic trading patterns treated. For each analyte, the precursor-to-product ion transitions, collision energies (CE), and retention times of the phenolic compounds analyzed by HPLC-ESI-MS/MS.
Appendix B
Table A2.
Model-estimated marginal mean elemental concentrations for the seven studied Salicornia species. Estimated marginal means (EMMs) and 95% confidence intervals were obtained from models fitted to log10-transformed plant-level concentrations and were subsequently back-transformed to the original concentration scale (mg kg−1 dry weight). For all elements except As, models included species as a fixed effect and sampling site as a random intercept; As was analyzed using a linear model because the sampling-site variance was estimated as zero. Back-transformed EMMs represent model-based estimates on the original scale and should not be interpreted as arithmetic sample means.
References
- Royal Botanic Gardens, Kew Salicornia L. Available online: https://powo.science.kew.org/taxon/urn:lsid:ipni.org:names:329966-2 (accessed on 21 April 2026).
- Ventura, Y.; Sagi, M. Halophyte Crop Cultivation: The Case for Salicornia and Sarcocornia. Environ. Exp. Bot. 2013, 92, 144–153. [Google Scholar] [CrossRef] [Scilit]
- De La Fuente, V.; Rufo, L.; Rodríguez, N.; Sánchez-Mata, D.; Franco, A.; Amils, R. A Study of Sarcocornia A.J. Scott (Chenopodiaceae) from Western Mediterranean Europe. Plant Biosyst.—Int. J. Deal. All Asp. Plant Biol. 2016, 150, 343–356. [Google Scholar] [CrossRef] [Scilit]
- Custódio, L.; Rodrigues, M.J.; Pereira, C.G.; Castañeda-Loaiza, V.; Fernandes, E.; Standing, D.; Neori, A.; Shpigel, M.; Sagi, M. A Review on Sarcocornia Species: Ethnopharmacology, Nutritional Properties, Phytochemistry, Biological Activities and Propagation. Foods 2021, 10, 2778. [Google Scholar] [CrossRef] [Scilit] [PubMed]
- Royal Botanic Gardens, Kew Plants of the World Online. Available online: http://www.plantsoftheworldonline.org (accessed on 21 April 2026).
- Parsons, R. As the Planet Warms, a Humble Sea Bean Is Proving to Be a Promising Superfood. Smithsonian Magazine, 10 March 2026. Available online: https://www.smithsonianmag.com/innovation/as-the-planet-warms-a-humble-sea-bean-is-proving-to-be-a-promising-superfood-180988301/ (accessed on 21 April 2026).
- Fernandes, E.; Trentin, R.; Rodrigues, M.J.; Castañeda-Loaiza, V.; Pereira, C.; Sisay, T.A.; Standing, D.; Sagi, M.; Shpigel, M.; Custódio, L. Ecotype Impacts Agronomic and Nutritional Traits of Sarcocornia perennis under Saline Greenhouse Cultivation Conditions. ACS Agric. Sci. Technol. 2025, 5, 1285–1302. [Google Scholar] [CrossRef] [Scilit]
- Antunes, M.; Gago, C.; Guerreiro, A.; Sousa, A.; Julião, M.; Miguel, M.; Faleiro, M.; Panagopoulos, T. Nutritional Characterization and Storage Ability of Salicornia ramosissima and Sarcocornia perennis for Fresh Vegetable Salads. Horticulturae 2021, 7, 6. [Google Scholar] [CrossRef] [Scilit]
- Fredsgaard, M.; Kaniki, S.E.K.; Antonopoulou, I.; Chaturvedi, T.; Thomsen, M.H. Phenolic Compounds in Salicornia spp. and Their Potential Therapeutic Effects on H1N1, HBV, HCV, and HIV: A Review. Molecules 2023, 28, 5312. [Google Scholar] [CrossRef] [Scilit] [PubMed]
- Lopes, M.; Silva, A.S.; Séndon, R.; Barbosa-Pereira, L.; Cavaleiro, C.; Ramos, F. Towards the Sustainable Exploitation of Salt-Tolerant Plants: Nutritional Characterisation, Phenolics Composition, and Potential Contaminants Analysis of Salicornia ramosissima and Sarcocornia perennis Alpini. Molecules 2023, 28, 2726. [Google Scholar] [CrossRef] [Scilit] [PubMed]
- Jeewanthi, P.; Navod, N.; Madhushantha, S.; Attanayake, R.; Perera, D.; Paranagama, P. Valorizing Salicornia brachiata Seeds: A Rich Source of Polyphenols, Essential Fatty Acids, and Therapeutic Bioactivities. Int. J. Food Sci. 2026, 2026, 2940708. [Google Scholar] [CrossRef] [Scilit] [PubMed]
- Lee, D.; Park, J.; Lee, S.; Kang, K. In Vitro Studies to Assess the α-Glucosidase Inhibitory Activity and Insulin Secretion Effect of Isorhamnetin 3-O-Glucoside and Quercetin 3-O-Glucoside Isolated from Salicornia herbacea. Processes 2021, 9, 483. [Google Scholar] [CrossRef] [Scilit]
- Kim, S.; Lee, E.-Y.; Hillman, P.F.; Ko, J.; Yang, I.; Nam, S.-J. Chemical Structure and Biological Activities of Secondary Metabolites from Salicornia europaea L. Molecules 2021, 26, 2252. [Google Scholar] [CrossRef] [Scilit] [PubMed]
- Rahmani, R.; Arbi, K.E.; Aydi, S.S.; Hzami, A.; Tlahig, S.; Najar, R.; Aydi, S.; Debouba, M. Biochemical Composition and Biological Activities of Salicornia europaea L. from Southern Tunisia. Food Meas. 2022, 16, 4833–4846. [Google Scholar] [CrossRef] [Scilit]
- Cioni, E.; Lela, L.; Russo, D.; Camangi, F.; De Leo, M.; Milella, L.; Braca, A. Exploring Salicornia Species as Potential Health-promoting Food: Chemical Fingerprinting and Assessment of Their Bioactivities. J. Sci. Food Agric. 2026, 106, 4744–4755. [Google Scholar] [CrossRef] [Scilit] [PubMed]
- De La Fuente, V.; Rufo, L.; Sánchez-Gavilán, I.; Ramírez, E.; Rodríguez, N.; Amils, R. Plant Tissues and Embryos Biominerals in Sarcocornia pruinosa, a Halophyte from the Río Tinto Salt Marshes. Minerals 2018, 8, 505. [Google Scholar] [CrossRef] [Scilit]
- Ramírez, E.; Rodríguez, N.; De La Fuente, V. Arthrocnemum Moq.: Unlocking Opportunities for Biosaline Agriculture and Improved Human Nutrition. Plants 2024, 13, 496. [Google Scholar] [CrossRef] [Scilit] [PubMed]
- Sánchez-Gavilán, I.; Sánchez-Mata, M.D.C.; Rodríguez, N.; De La Fuente, V. Amino Acids, Ferritin, and Mineral Oxalates in Edible Salicornia patula Young Shoots: Chemical Characterization and Nutritional Implications. Food Chem. 2025, 497, 146966. [Google Scholar] [CrossRef] [Scilit] [PubMed]
- Zuluaga, J.; Rodríguez, N.; Rivas-Ramirez, I.; De La Fuente, V.; Rufo, L.; Amils, R. An Improved Semiquantitative Method for Elemental Analysis of Plants Using Inductive Coupled Plasma Mass Spectrometry. Biol. Trace Elem. Res. 2011, 144, 1302–1317. [Google Scholar] [CrossRef] [Scilit] [PubMed]
- Slinkard, K.; Singleton, V.L. Total Phenol Analysis: Automation and Comparison with Manual Methods. Am. J. Enol. Vitic. 1977, 28, 49–55. [Google Scholar] [CrossRef] [Scilit]
- Andrés-Lacueva, C.; Medina-Remon, A.; Llorach, R.; Urpi-Sarda, M.; Khan, N.; Chiva-Blanch, G.; Zamora-Ros, R.; Rotches-Ribalta, M.; Lamuela-Raventós, R.M. Phenolic Compounds: Chemistry and Occurrence in Fruits and Vegetables. In Fruit and Vegetable Phytochemicals; De La Rosa, L.A., Alvarez-Parrilla, E., González-Aguilar, G.A., Eds.; Wiley: Hoboken, NJ, USA, 2009; pp. 53–88. [Google Scholar]
- Piirainen, M.; Liebisch, O.; Kadereit, G. Phylogeny, Biogeography, Systematics and Taxonomy of Salicornioideae (Amaranthaceae/Chenopodiaceae)—A Cosmopolitan, Highly Specialized Hygrohalophyte Lineage Dating Back to the Oligocene. Taxon 2017, 66, 109–132. [Google Scholar] [CrossRef] [Scilit]
- Ramírez, E.; Rufo, L.; Sánchez-Mata, D.; Sánchez-Gavilán, I.; De La Fuente, V. Arthrocnemum macrostachyum Plant Communities in the Iberian Peninsula, Balearic and Canary Islands (Spain and Portugal). In Tools for Landscape-Scale Geobotany and Conservation; Pedrotti, F., Box, E.O., Eds.; Geobotany Studies; Springer International Publishing: Cham, Switzerland, 2021; pp. 231–245. [Google Scholar]
- Lv, S.; Nie, L.; Fan, P.; Wang, X.; Jiang, D.; Chen, X.; Li, Y. Sodium Plays a More Important Role than Potassium and Chloride in Growth of Salicornia europaea. Acta Physiol. Plant 2012, 34, 503–513. [Google Scholar] [CrossRef] [Scilit]
- Sánchez-Gavilán, I.; Rufo, L.; Rodríguez, N.; De La Fuente, V. On the Elemental Composition of the Mediterranean Euhalophyte Salicornia patula Duval-Jouve (Chenopodiaceae) from Saline Habitats in Spain (Huelva, Toledo and Zamora). Environ. Sci. Pollut. Res. 2021, 28, 2719–2727. [Google Scholar] [CrossRef] [Scilit] [PubMed]
- Duri, L.G.; Botticella, L.; Lazzizera, C.; Perrino, E.V.; Giancaspro, A.; Cammerino, A.R.B.; Bonasia, A.; Elia, A.; Conversa, G. Nutritional Characterization of Annual and Perennial Glassworts from the Apulia Region (Italy). Foods 2025, 14, 3433. [Google Scholar] [CrossRef] [Scilit] [PubMed]
- De La Fuente, V.; Rufo, L.; Rodríguez, N.; Amils, R.; Zuluaga, J. Metal Accumulation Screening of the Río Tinto Flora (Huelva, Spain). Biol. Trace Elem. Res. 2010, 134, 318–341. [Google Scholar] [CrossRef] [Scilit] [PubMed]
- De La Fuente, V.; Rufo, L.; Rodríguez, N.; Ramírez, E.; Sánchez-Gavilán, I.; Amils, R. Differential Iron Management in Monocotyledon and Dicotyledon Plants from the Río Tinto Basin. Protoplasma 2020, 257, 889–900. [Google Scholar] [CrossRef] [Scilit] [PubMed]
- Rufo, L.; Iglesias-López, M.T.; De La Fuente, V. The Endemic Halophyte Sarcocornia carinata Fuente, Rufo & Sánchez-Mata (Chenopodiaceae) in Relation to Environmental Variables: Elemental Composition and Biominerals. Plant Soil 2021, 460, 189–209. [Google Scholar] [CrossRef] [Scilit]
- Sanjosé, I.; Navarro-Roldán, F.; Montero, Y.; Ramírez-Acosta, S.; Jiménez-Nieva, F.J.; Infante-Izquierdo, M.D.; Polo-Ávila, A.; Muñoz-Rodríguez, A.F. The Bioconcentration and the Translocation of Heavy Metals in Recently Consumed Salicornia ramosissima J. Woods in Highly Contaminated Estuary Marshes and Its Food Risk. Diversity 2022, 14, 452. [Google Scholar] [CrossRef] [Scilit]
- Rathore, A.P.; Chaudhary, D.R.; Jha, B. Alteration in Phenological Parameters, Above- and Belowground Biomass, Nutrient Contents, and Their Pools with Phenological Stages of Salicornia brachiata Roxb. Ecol. Res. 2021, 36, 701–719. [Google Scholar] [CrossRef] [Scilit]
- European Food Safety Authority (EFSA). DRV Finder: Dietary Reference Values for the EU; European Food Safety Authority (EFSA): Parma, Italy, 2018.
- EFSA Panel on Nutrition, Novel Foods and Food Allergens (NDA); Turck, D.; Castenmiller, J.; de Henauw, S.; Hirsch-Ernst, K.; Kearney, J.; Knutsen, H.K.; Maciuk, A.; Mangelsdorf, I.; McArdle, H.J.; et al. Dietary Reference Values for Sodium. EFSA J. 2019, 17, e05778. [Google Scholar] [CrossRef] [Scilit] [PubMed]
- EFSA Panel on Contaminants in the Food Chain (CONTAM); Schrenk, D.; Bignami, M.; Bodin, L.; Chipman, J.K.; del Mazo, J.; Grasl-Kraupp, B.; Hogstrand, C.; Hoogenboom, L.; Leblanc, J.; et al. Update of the Risk Assessment of Inorganic Arsenic in Food. EFSA J. 2024, 22, e8488. [Google Scholar] [CrossRef] [Scilit] [PubMed]
- European Commission. Commission Regulation (EU) 2023/915 of 25 April 2023 on maximum levels for certain contaminants in food and repealing Regulation (EC) No 1881/2006. Off. J. Eur. Union 2023, L119, 103–157. [Google Scholar]
- EFSA Panel on Nutrition, Novel Foods and Food Allergens (NDA); Turck, D.; Bohn, T.; Castenmiller, J.; de Henauw, S.; Hirsch-Ernst, K.; Knutsen, H.K.; Maciuk, A.; Mangelsdorf, I.; McArdle, H.J.; et al. Scientific Opinion on the Tolerable Upper Intake Level for Manganese. EFSA J. 2023, 21, e8413. [Google Scholar] [CrossRef] [Scilit] [PubMed]
- EFSA Scientific Committee; More, S.J.; Bampidis, V.; Benford, D.; Bragard, C.; Halldorsson, T.I.; Hernández-Jerez, A.F.; Bennekou, S.H.; Koutsoumanis, K.; Lambré, C.; et al. Re-evaluation of the Existing Health-based Guidance Values for Copper and Exposure Assessment from All Sources. EFSA J. 2023, 21, e7728. [Google Scholar] [CrossRef] [Scilit] [PubMed]
- Sánchez-Gavilán, I.; Ramírez Chueca, E.; De La Fuente García, V. Bioactive Compounds in Sarcocornia and Arthrocnemum, Two Wild Halophilic Genera from the Iberian Peninsula. Plants 2021, 10, 2218. [Google Scholar] [CrossRef] [Scilit] [PubMed]
- Sánchez-Gavilán, I.; Ramírez, E.; De La Fuente, V. Bioactive Compounds in Salicornia patula Duval-Jouve: A Mediterranean Edible Euhalophyte. Foods 2021, 10, 410. [Google Scholar] [CrossRef] [Scilit] [PubMed]
- Barroca, M.J.; Guiné, R.P.F.; Amado, A.M.; Ressurreição, S.; Da Silva, A.M.; Marques, M.P.M.; De Carvalho, L.A.E.B. The Drying Process of Sarcocornia perennis: Impact on Nutritional and Physico-Chemical Properties. J. Food Sci. Technol. 2020, 57, 4443–4458. [Google Scholar] [CrossRef] [Scilit] [PubMed]
- Oliveira-Alves, S.C.; Andrade, F.; Prazeres, I.; Silva, A.B.; Capelo, J.; Duarte, B.; Caçador, I.; Coelho, J.; Serra, A.T.; Bronze, M.R. Impact of Drying Processes on the Nutritional Composition, Volatile Profile, Phytochemical Content and Bioactivity of Salicornia ramosissima J. Woods. Antioxidants 2021, 10, 1312. [Google Scholar] [CrossRef] [Scilit] [PubMed]
- Castañeda-Loaiza, V.; Oliveira, M.; Santos, T.; Schüler, L.; Lima, A.R.; Gama, F.; Salazar, M.; Neng, N.R.; Nogueira, J.M.F.; Varela, J.; et al. Wild vs Cultivated Halophytes: Nutritional and Functional Differences. Food Chem. 2020, 333, 127536. [Google Scholar] [CrossRef] [Scilit] [PubMed]
- Silva, A.M.; Lago, J.P.; Pinto, D.; Moreira, M.M.; Grosso, C.; Cruz Fernandes, V.; Delerue-Matos, C.; Rodrigues, F. Salicornia ramosissima Bioactive Composition and Safety: Eco-Friendly Extractions Approach (Microwave-Assisted Extraction vs. Conventional Maceration). Appl. Sci. 2021, 11, 4744. [Google Scholar] [CrossRef] [Scilit]
- Duan, H.; Tiika, R.J.; Tian, F.; Lu, Y.; Zhang, Q.; Hu, Y.; Cui, G.; Yang, H. Metabolomics Analysis Unveils Important Changes Involved in the Salt Tolerance of Salicornia europaea. Front. Plant Sci. 2023, 13, 1097076. [Google Scholar] [CrossRef] [Scilit] [PubMed]
- Barreira, L.; Resek, E.; Rodrigues, M.J.; Rocha, M.I.; Pereira, H.; Bandarra, N.; Da Silva, M.M.; Varela, J.; Custódio, L. Halophytes: Gourmet Food with Nutritional Health Benefits? J. Food Compos. Anal. 2017, 59, 35–42. [Google Scholar] [CrossRef] [Scilit]
- Patel, S. Salicornia: Evaluating the Halophytic Extremophile as a Food and a Pharmaceutical Candidate. 3 Biotech 2016, 6, 104. [Google Scholar] [CrossRef] [Scilit] [PubMed]
- Kang, S.; Kim, D.; Lee, B.H.; Kim, M.-R.; Chiang, M.; Hong, J. Antioxidant Properties and Cytotoxic Effects of Fractions from Glasswort (Salicornia herbacea) Seed Extracts on Human Intestinal Cells. Food Sci. Biotechnol. 2011, 20, 115–122. [Google Scholar] [CrossRef] [Scilit]
- El-Araby, R.; Rezk, A.I.; El-Enin, S.A.A.; Nofal, O.A.; El-Nasharty, A.B. Comparative Evaluation of Salicornia bigelovii Oil Planted under Different Treatments. Bull. Natl. Res. Cent. 2020, 44, 133. [Google Scholar] [CrossRef] [Scilit]
- Sahastrabudhe, H.; Gajjar, A.; Rathod, A.K.; Rathod, M.R.; Srinivasan, M.; Dhimmar, A.; Manna, M.; Dodiya, P.J.; Prasad, K.; Shinde, P.B. Evaluation of Anti-Diabetic and Anti-Obesity Potential of Salicornia brachiata Roxb. Seed Oil. Plant Foods Hum. Nutr. 2025, 80, 131. [Google Scholar] [CrossRef] [Scilit] [PubMed]
- Yang, L.; Wang, Y.; Bai, Y.; Yang, J.; Gao, Y.; Hou, C.; Gao, M.; Gu, X.; Liu, W. Lipid Metabolism Improves Salt Tolerance of Salicornia europaea. Ann. Bot. 2025, 135, 789–802. [Google Scholar] [CrossRef] [Scilit] [PubMed]
- Castilla-Gavilán, M.; Muñoz-Martínez, M.; Zuasti, E.; Canoura-Baldonado, J.; Mondoñedo, R.; Hachero-Cruzado, I. Yield, Nutrients Uptake and Lipid Profile of the Halophyte Salicornia ramosissima Cultivated in Two Different Integrated Multi-Trophic Aquaculture Systems (IMTA). Aquaculture 2024, 583, 740547. [Google Scholar] [CrossRef] [Scilit]
- Mesa-Marín, J.; Mateos-Naranjo, E.; Carreiras, J.; Feijão, E.; Duarte, B.; Matos, A.R.; Betti, M.; Del Rio, C.; Romero-Bernal, M.; Montaner, J.; et al. Interactive Temperature and CO2 Rise, Salinity, Drought, and Bacterial Inoculation Alter the Content of Fatty Acids, Total Phenols, and Oxalates in the Edible Halophyte Salicornia ramosissima. Plants 2023, 12, 1395. [Google Scholar] [CrossRef] [Scilit] [PubMed]
- Sui, N.; Li, M.; Li, K.; Song, J.; Wang, B.S. Increase in Unsaturated Fatty Acids in Membrane Lipids of Suaeda salsa L. Enhances Protection of Photosystem II under High Salinity. Photosynthetica 2010, 48, 623–629. [Google Scholar] [CrossRef] [Scilit]
- Ricardo, F.; Veríssimo, A.; Maciel, E.; Domingues, M.; Calado, R. Fatty Acid Profiling as a Tool for Fostering the Traceability of the Halophyte Plant Salicornia ramosissima and Contributing to Its Nutritional Valorization. Plants 2024, 13, 545. [Google Scholar] [CrossRef] [Scilit] [PubMed]
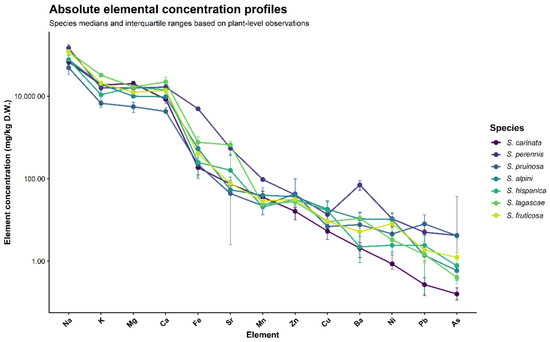
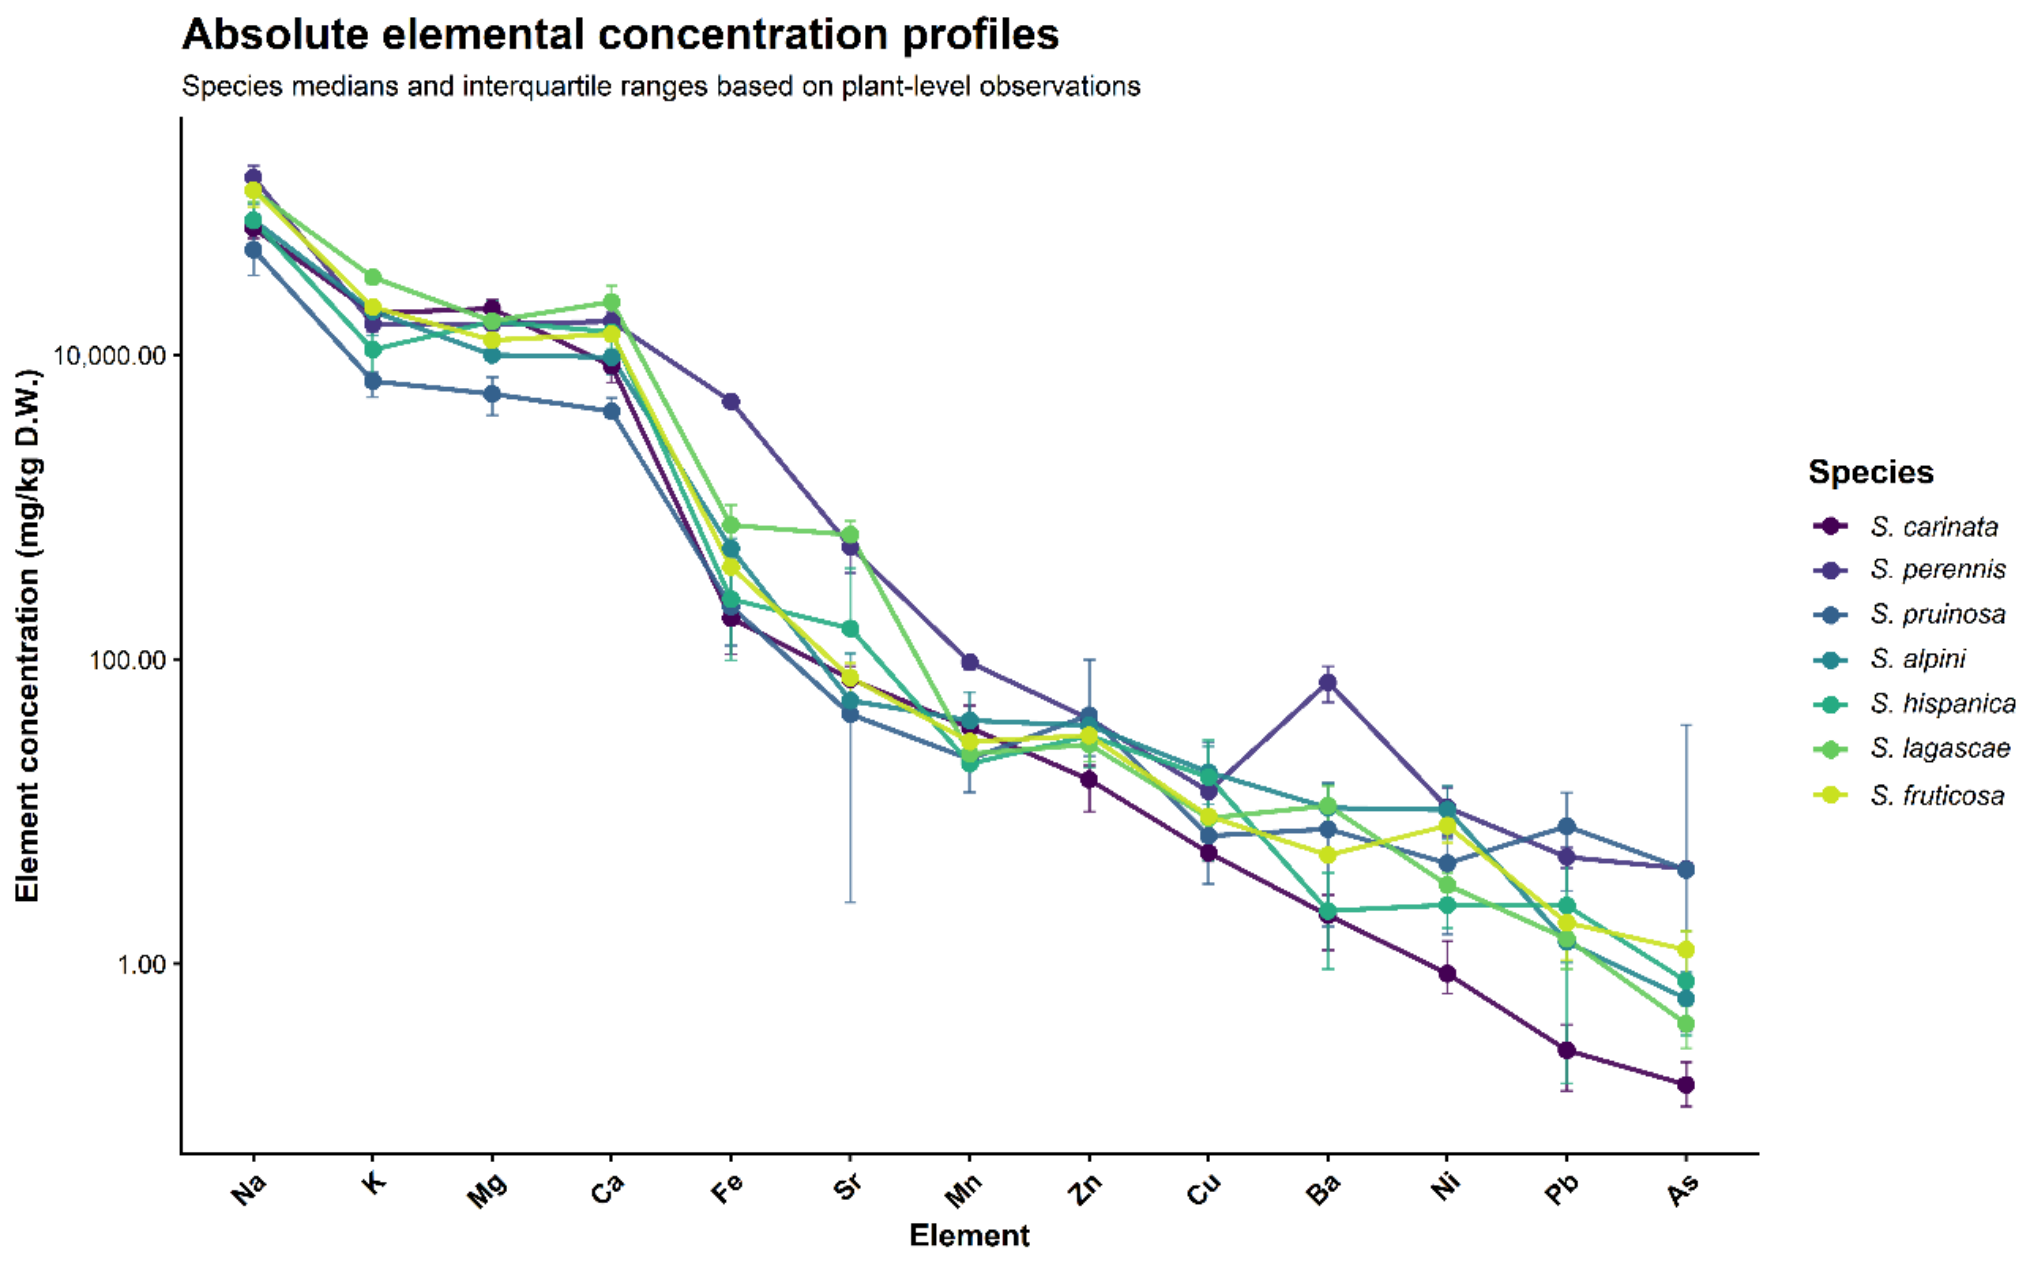
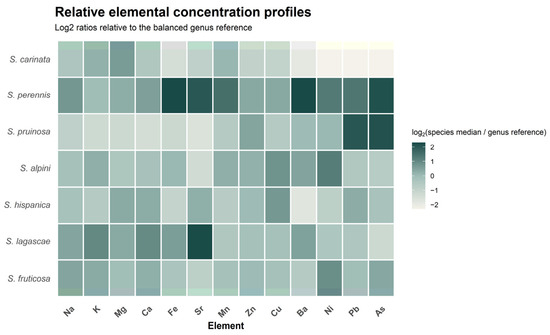
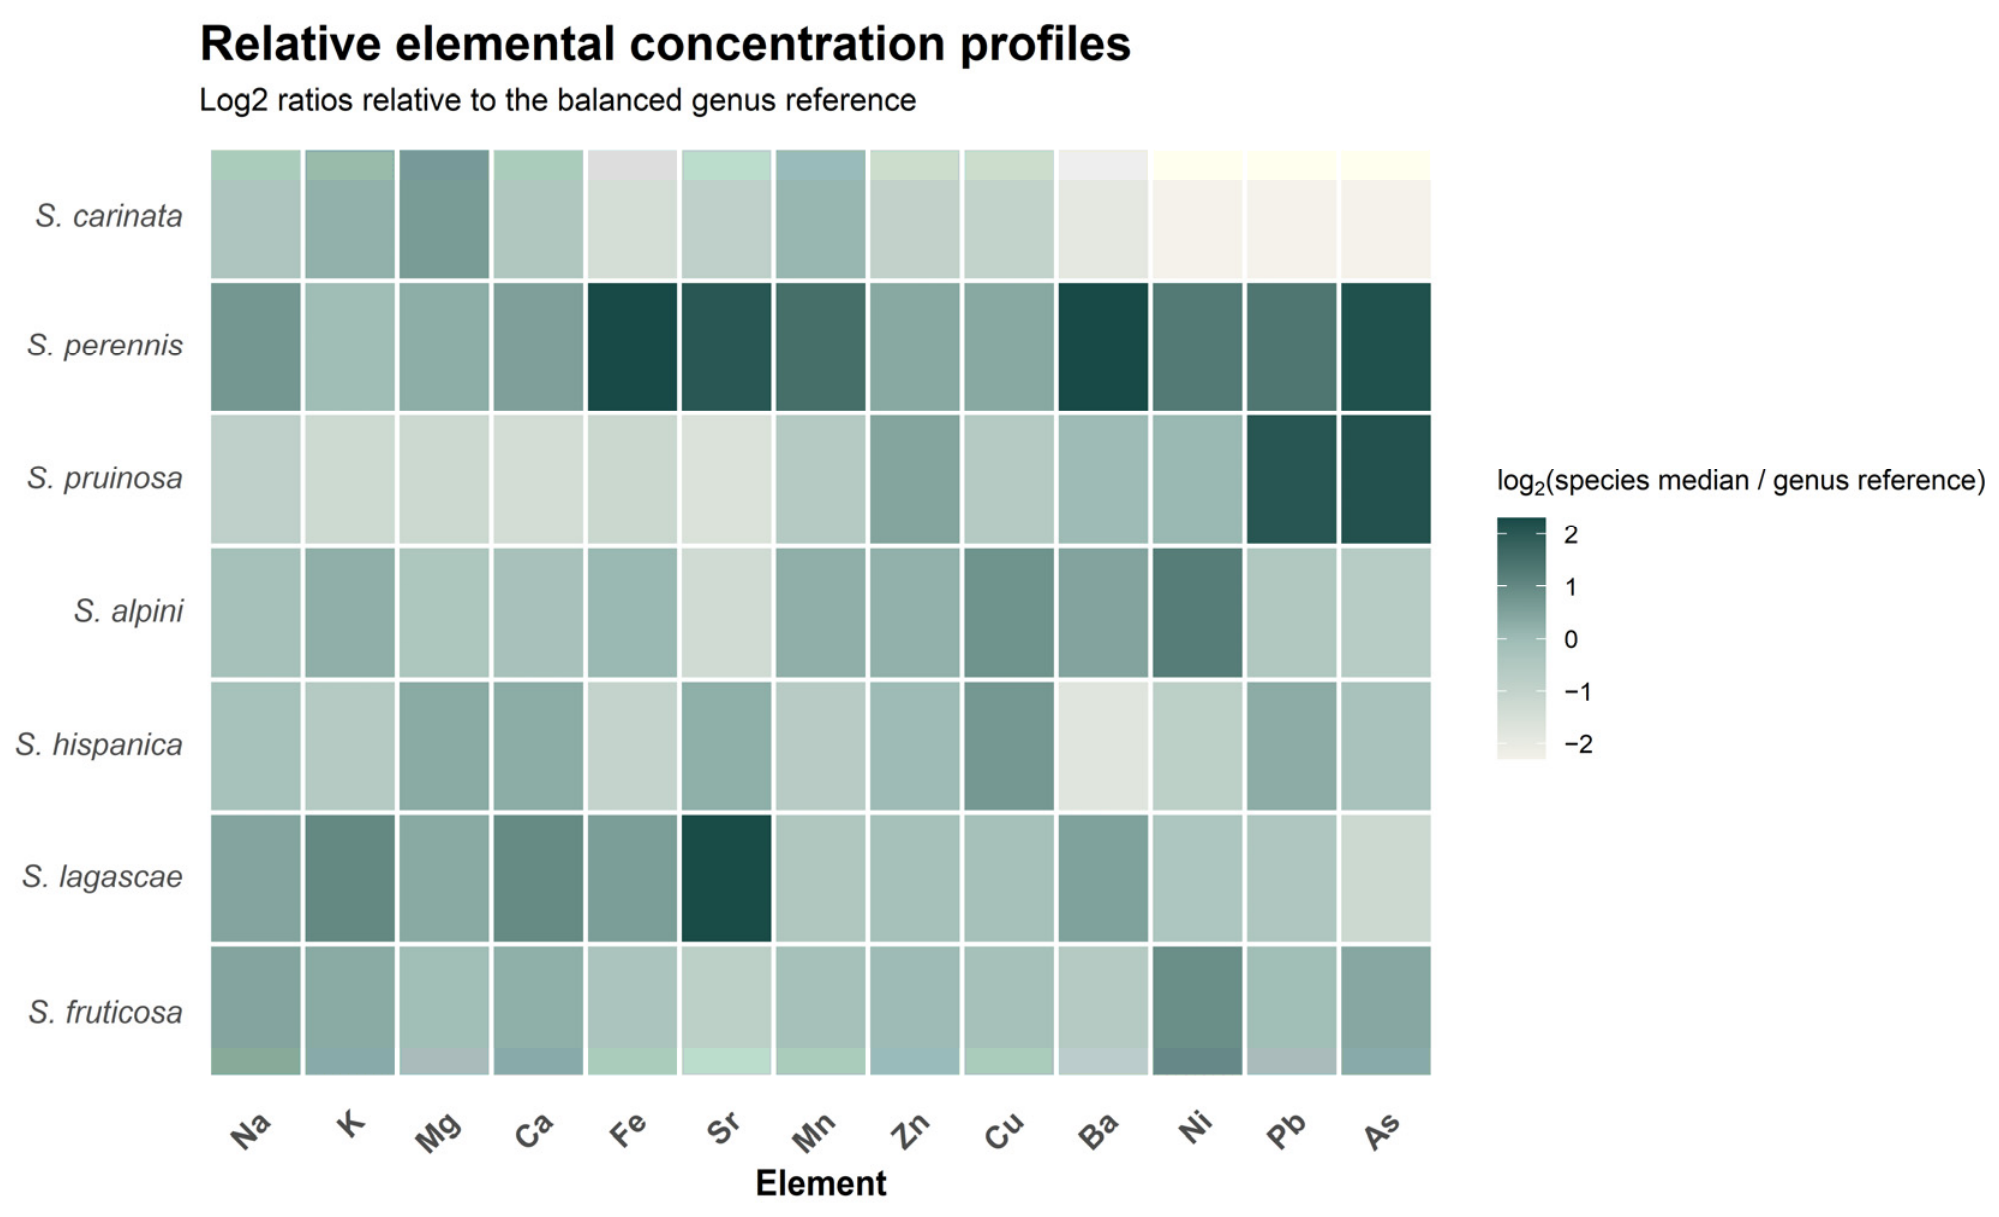
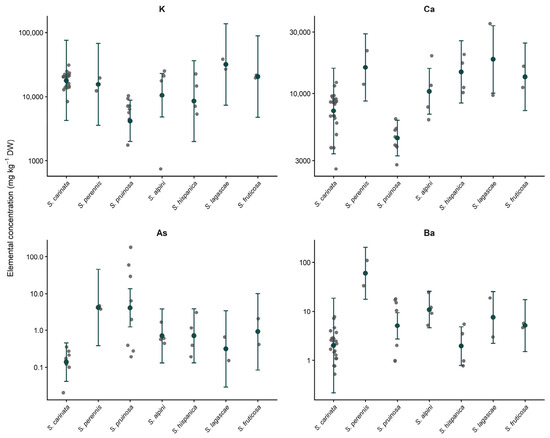
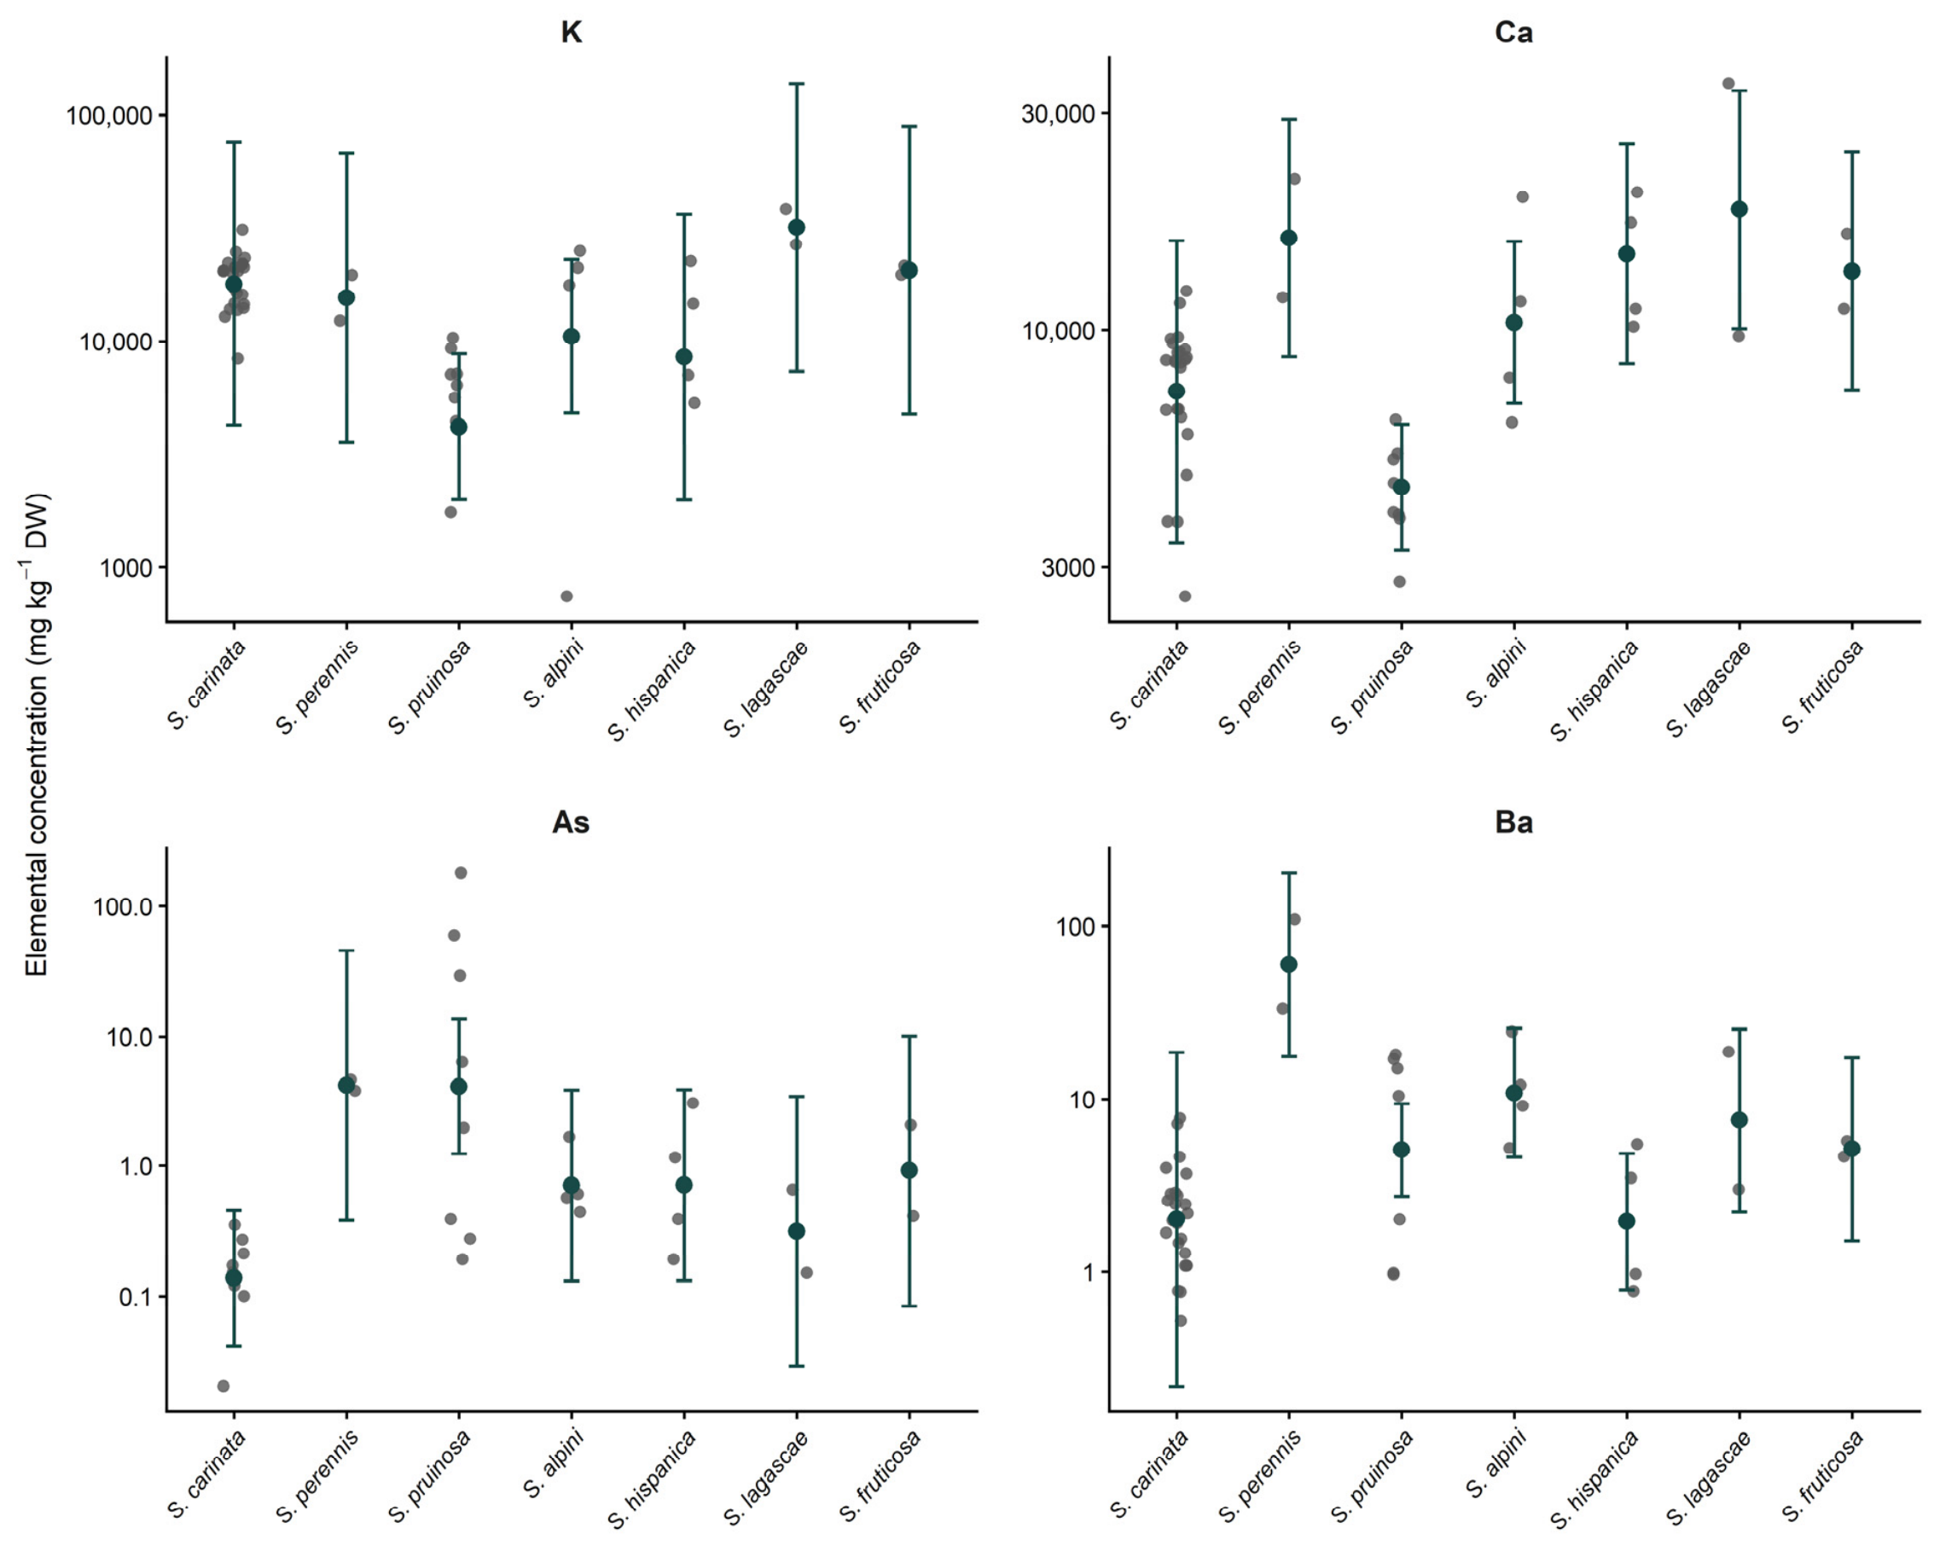
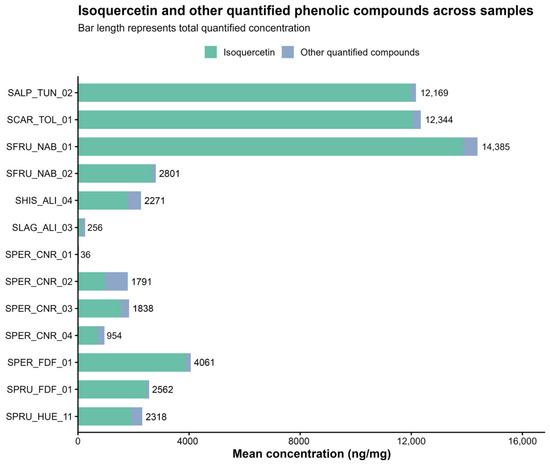
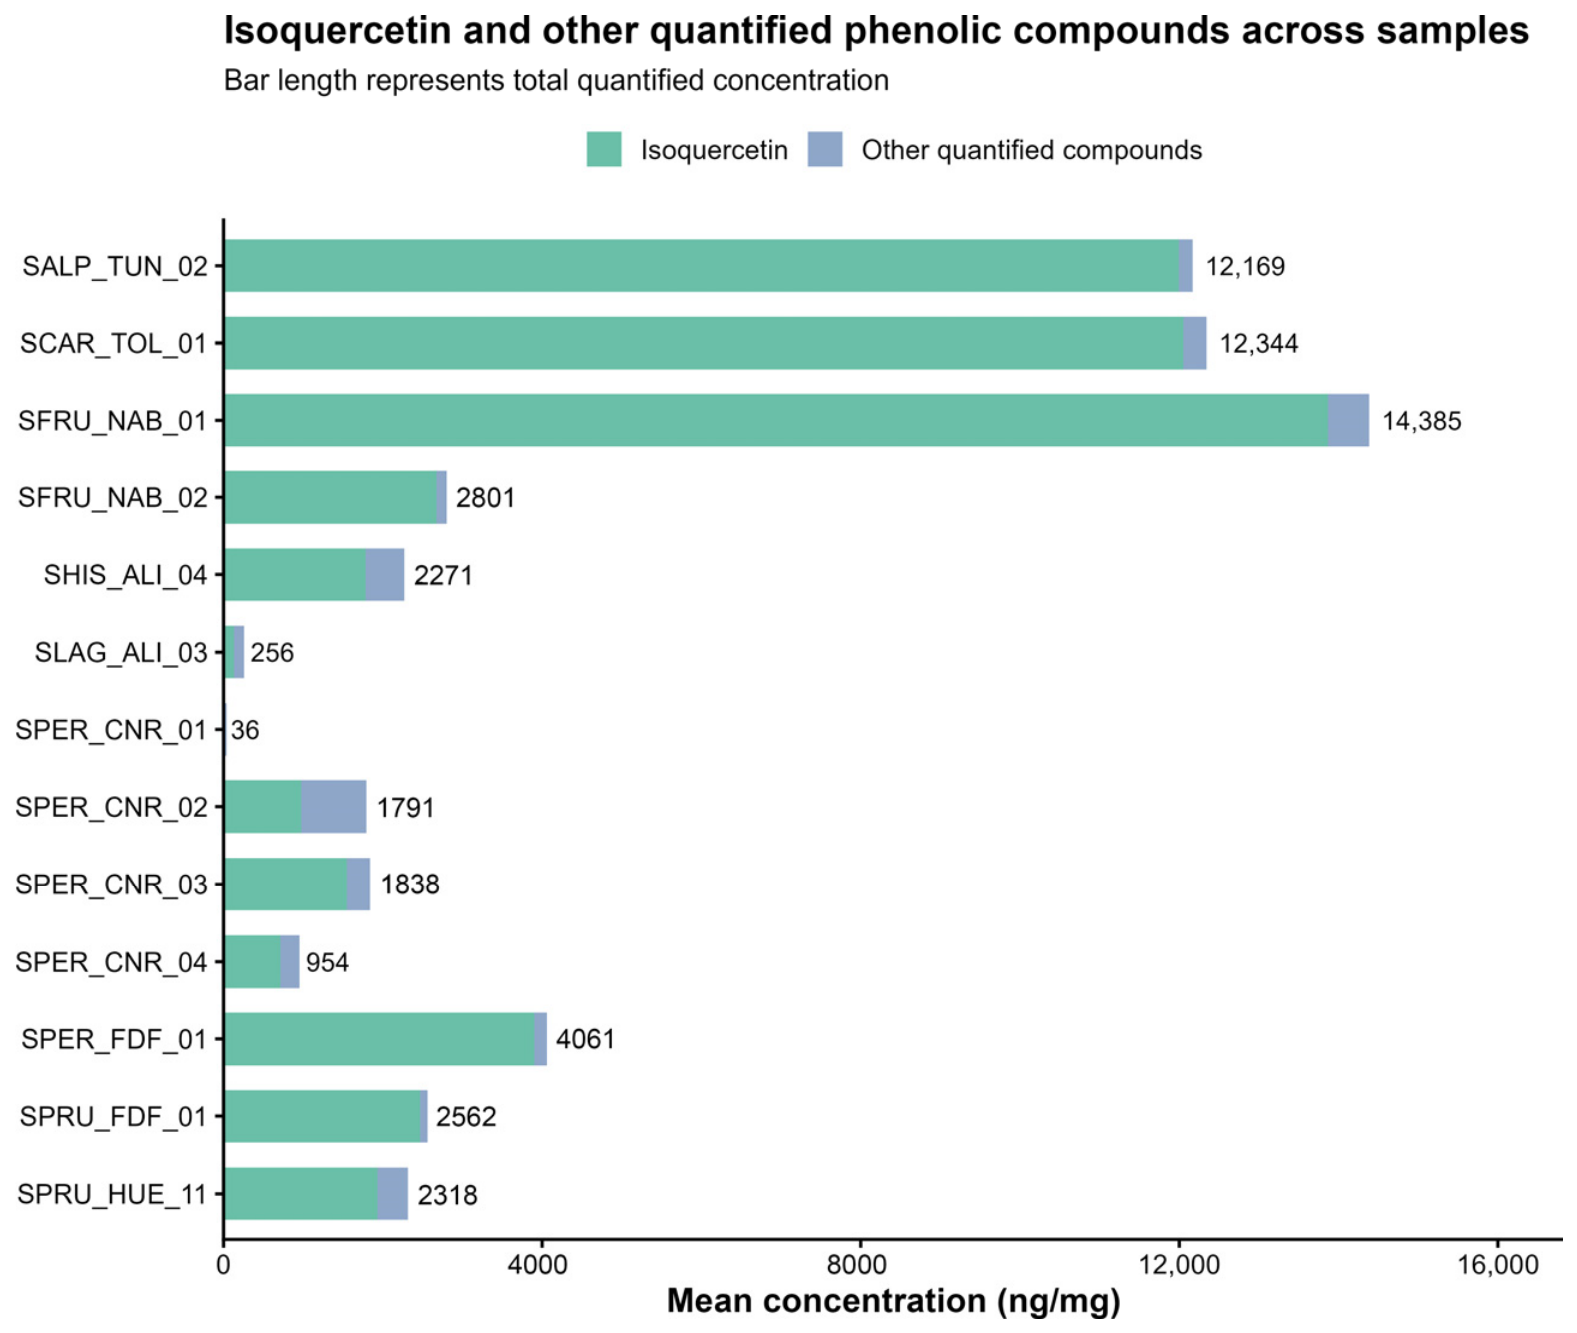
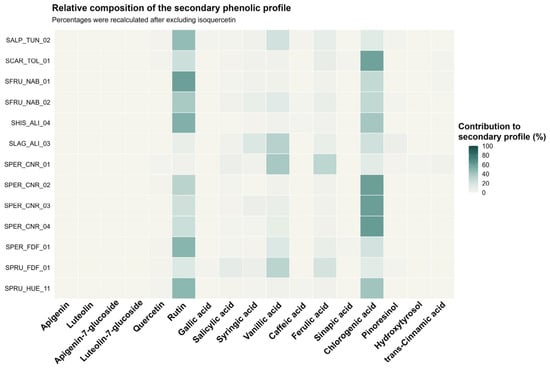
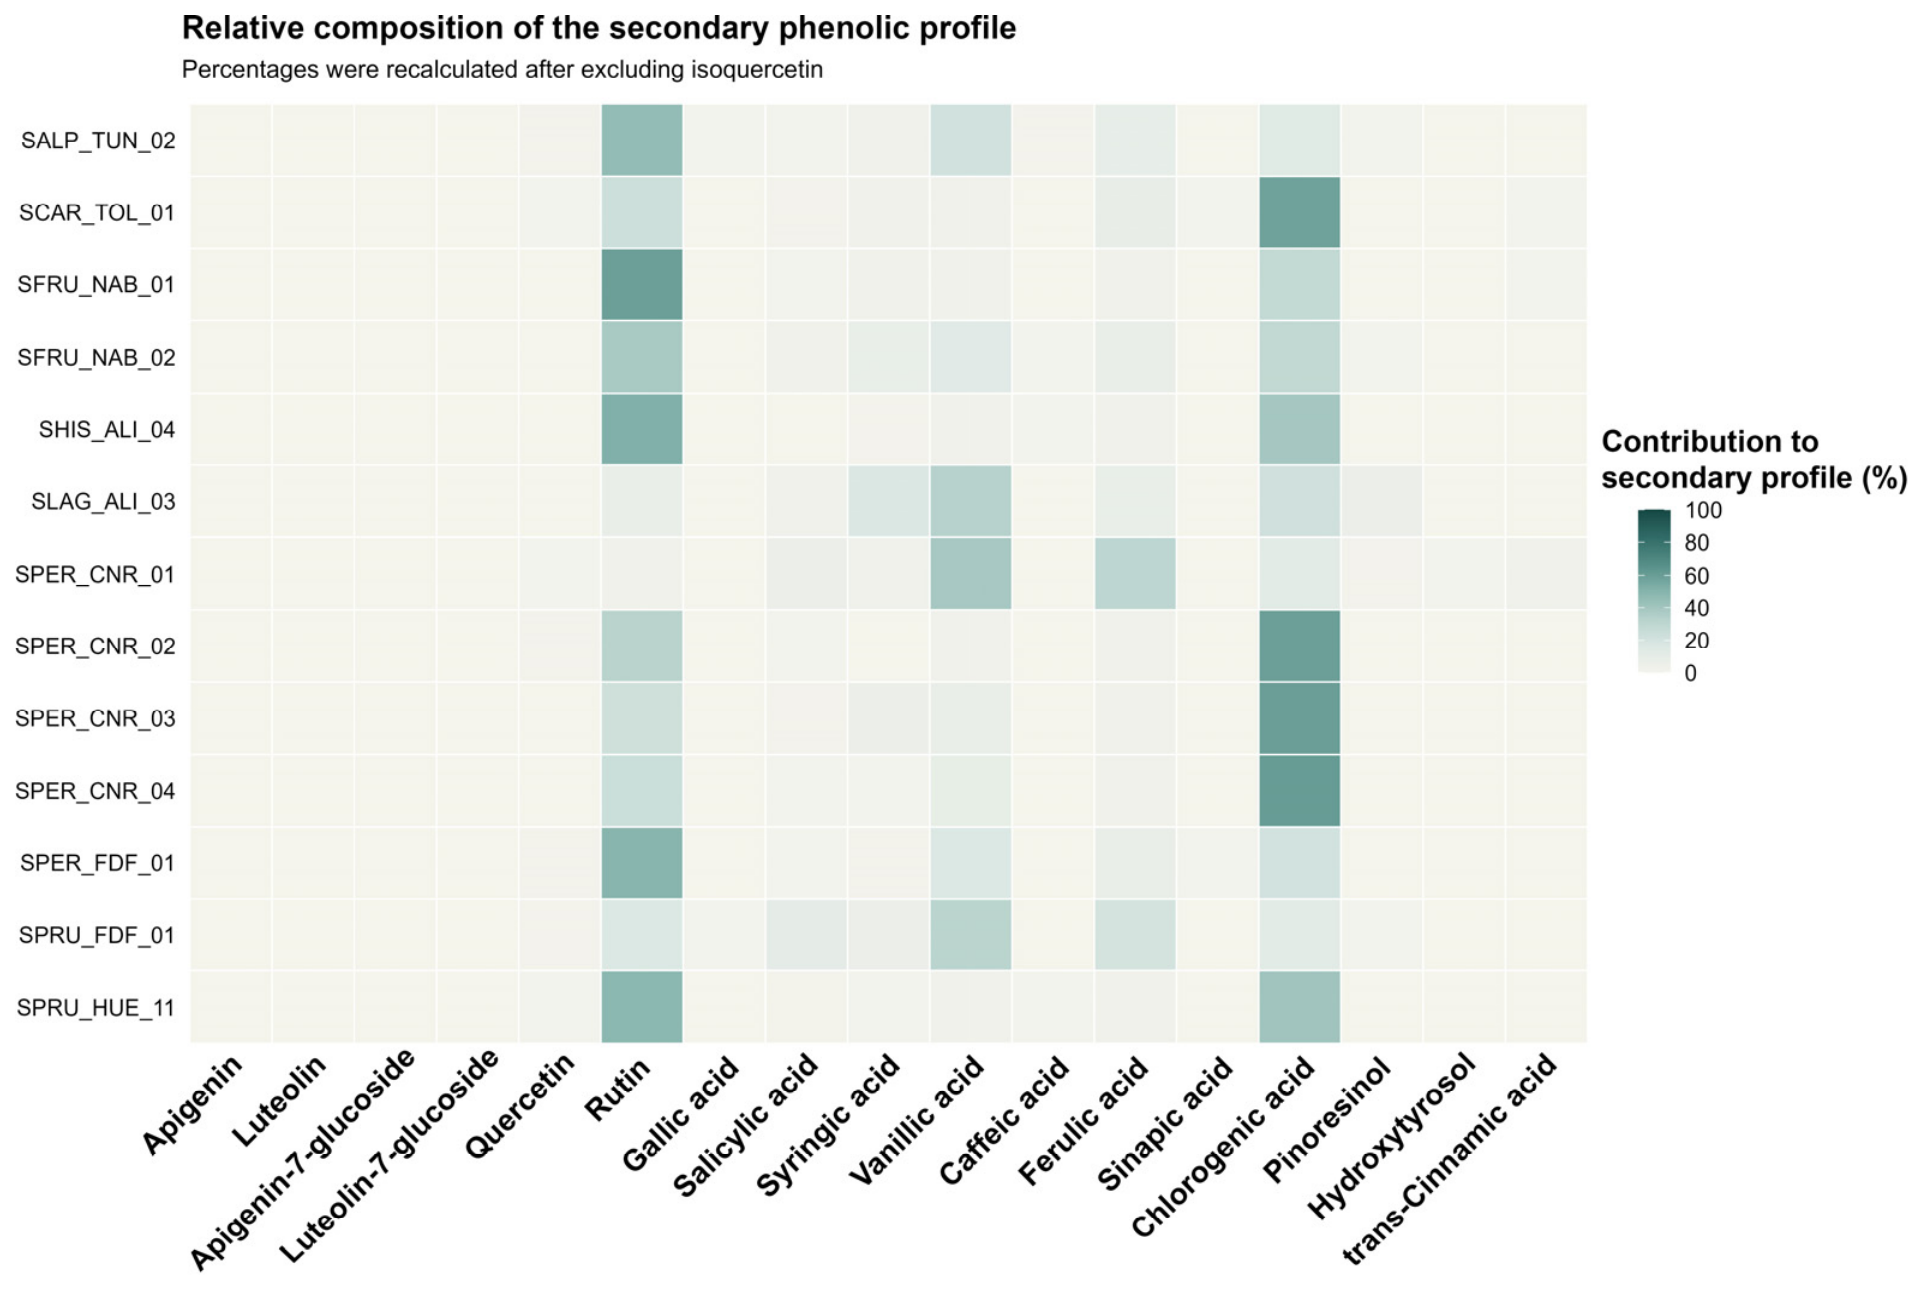
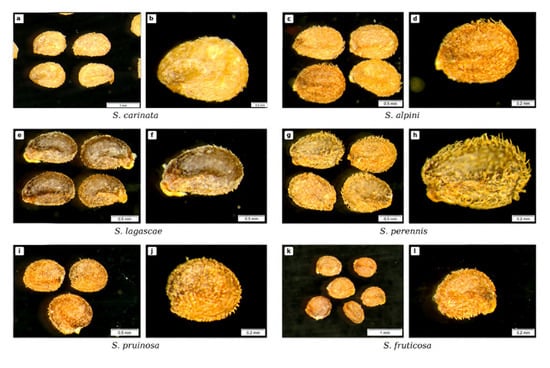
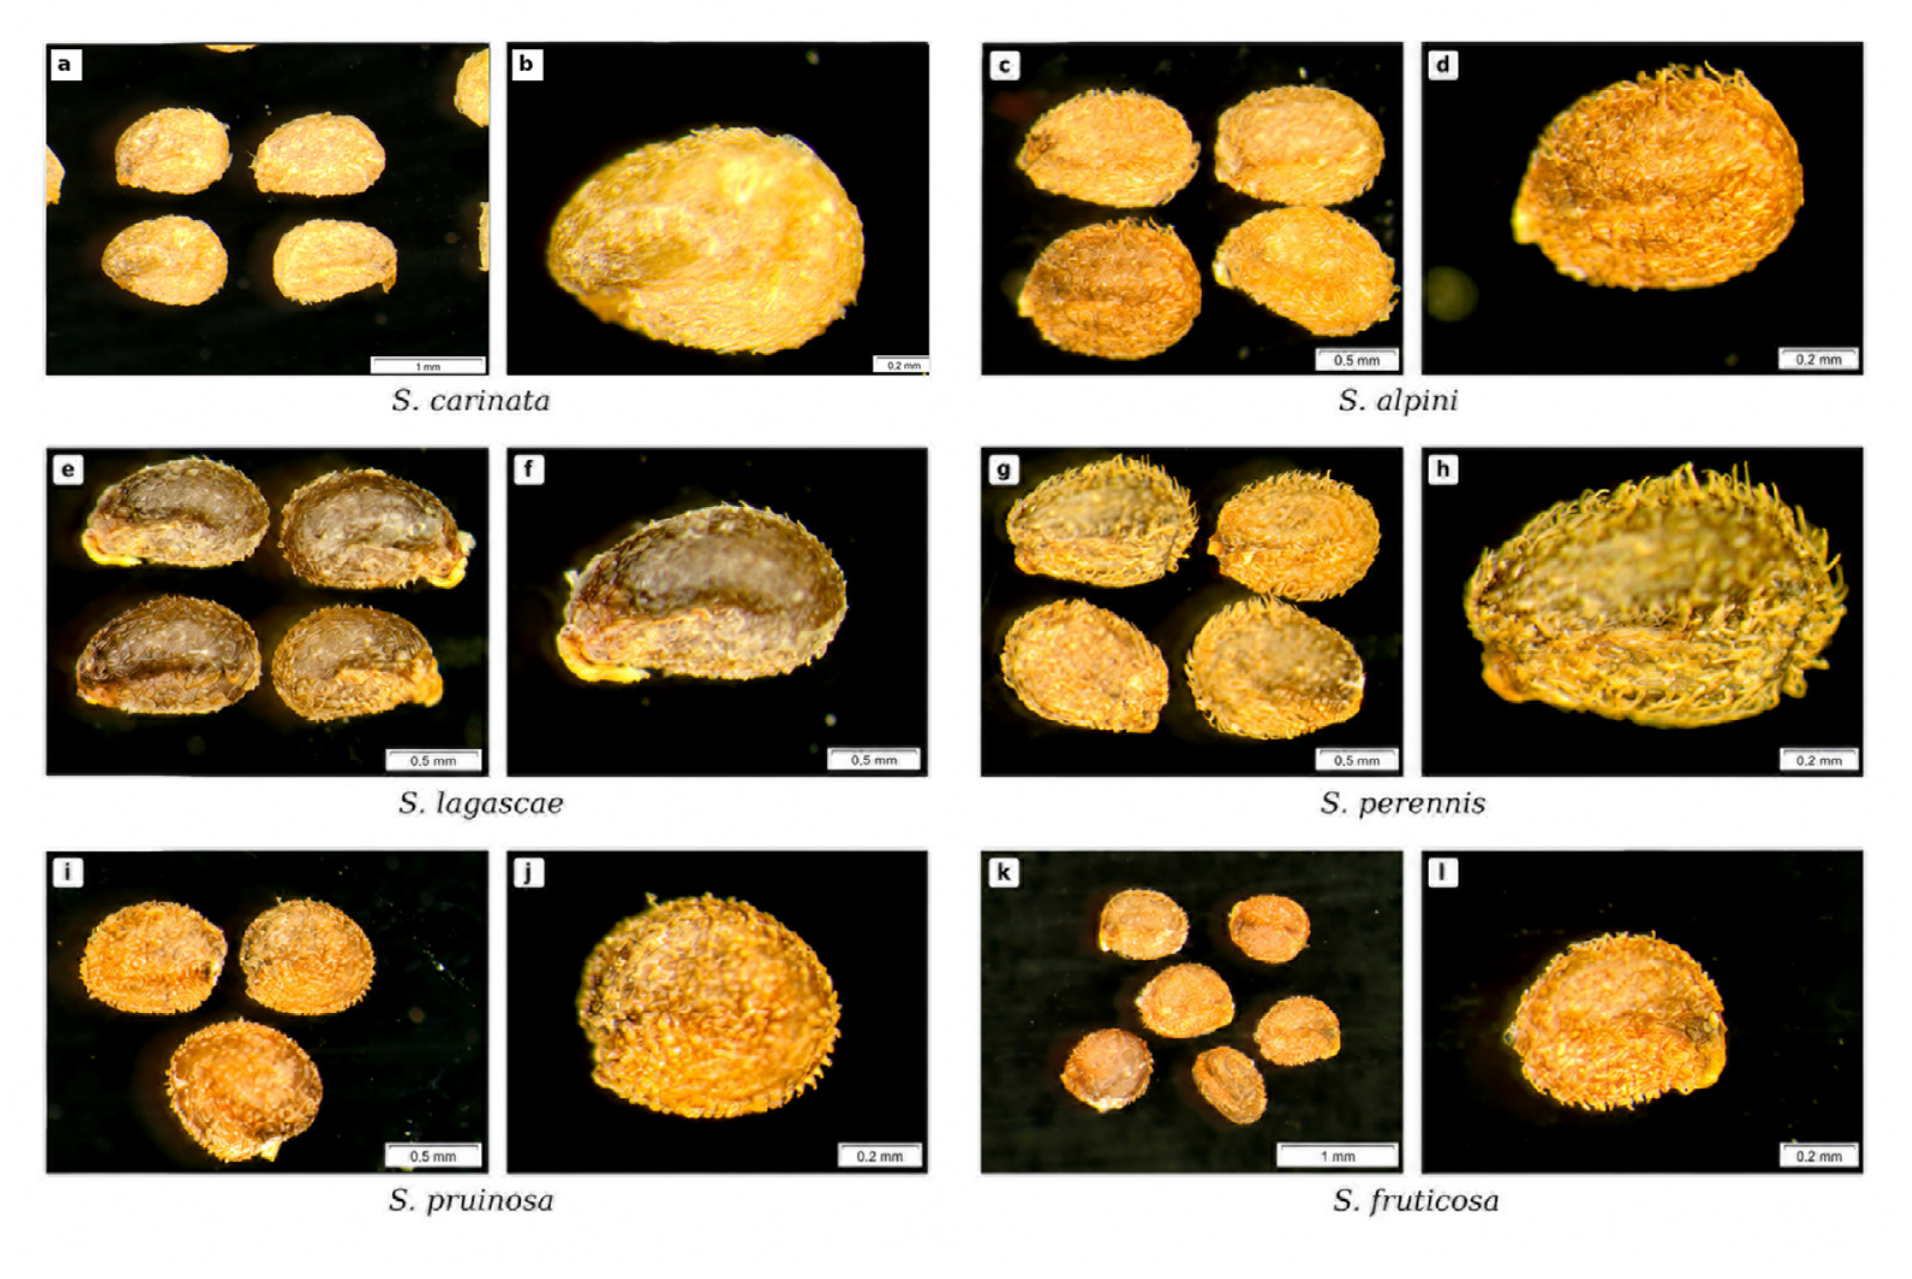
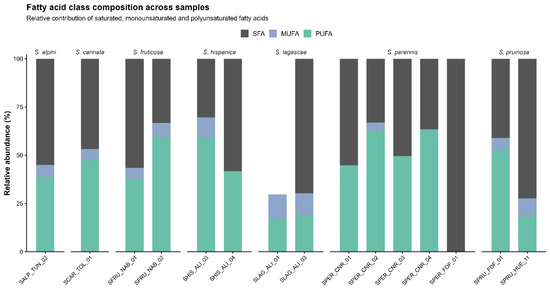
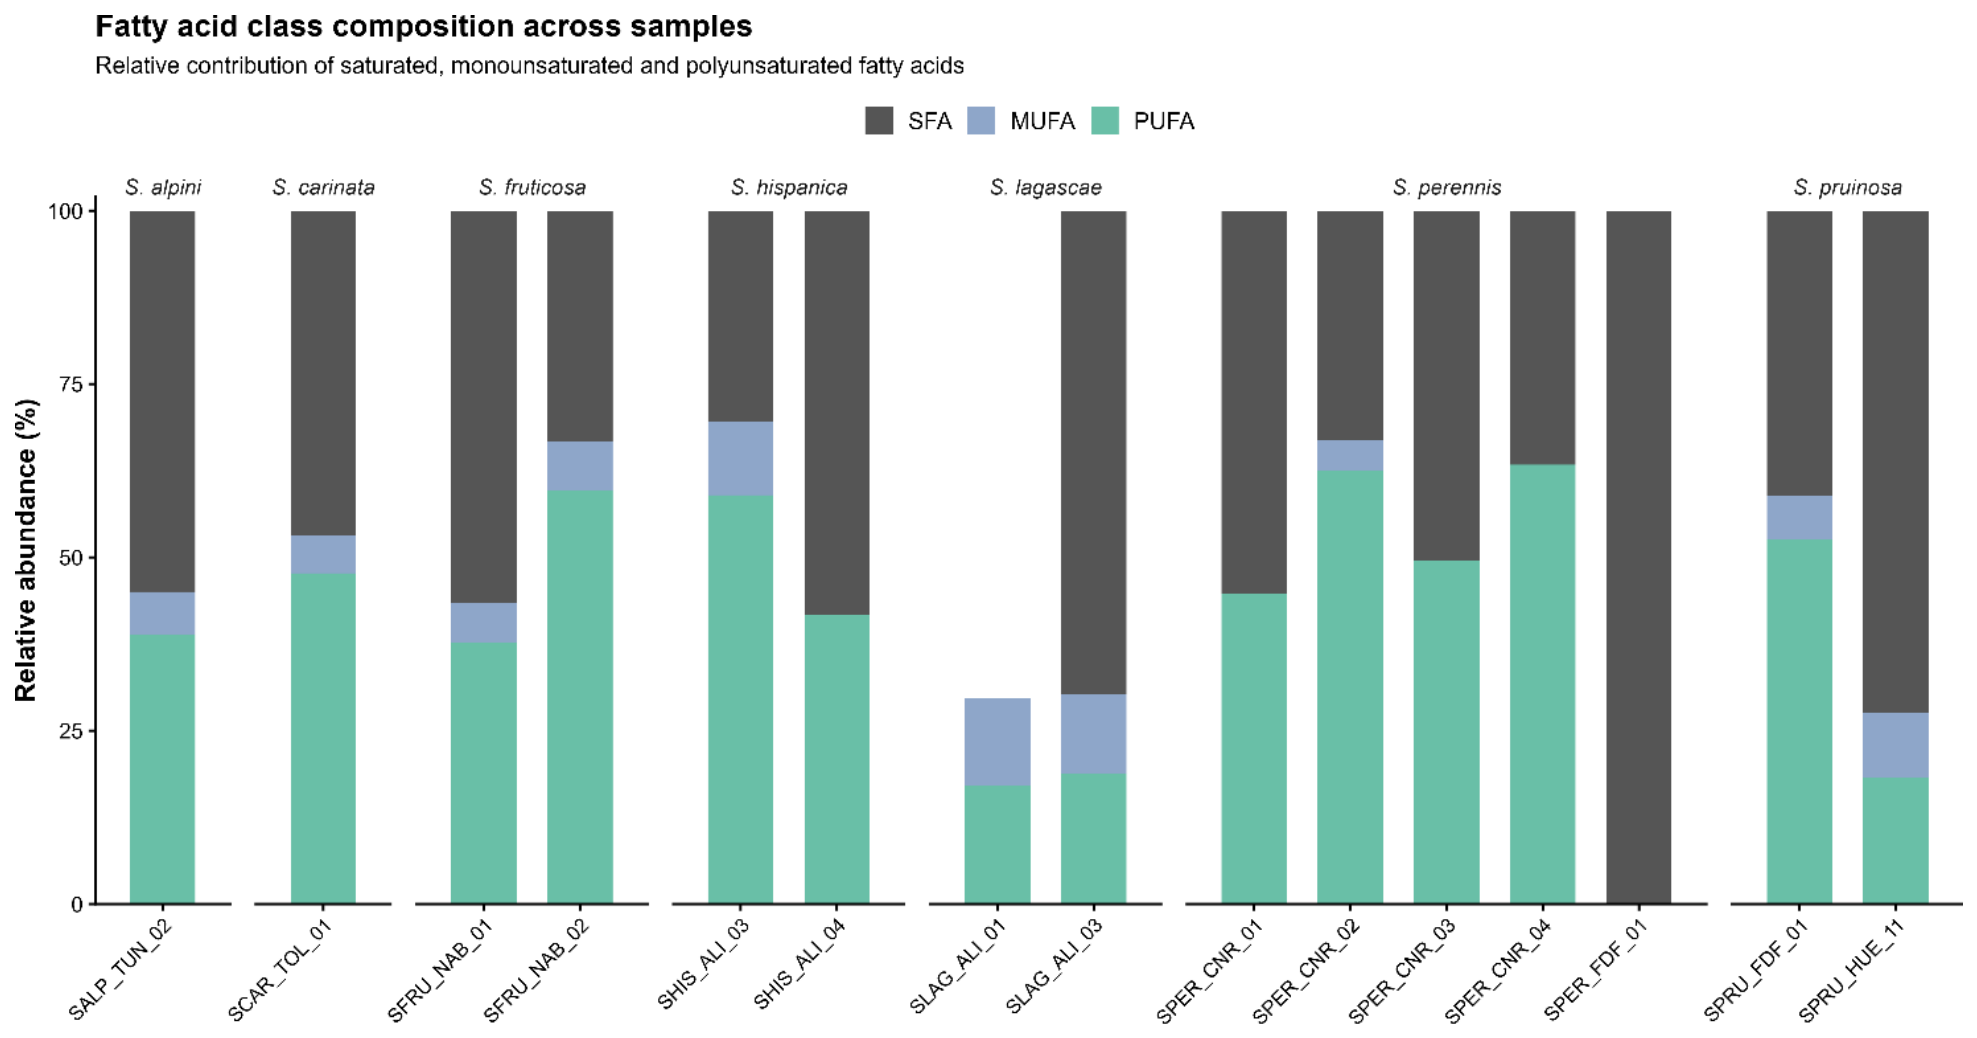
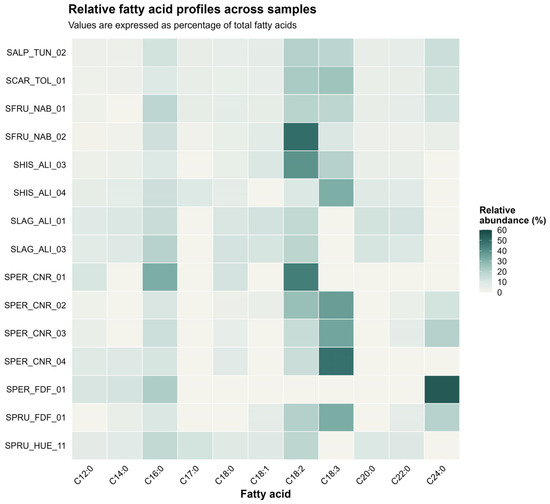
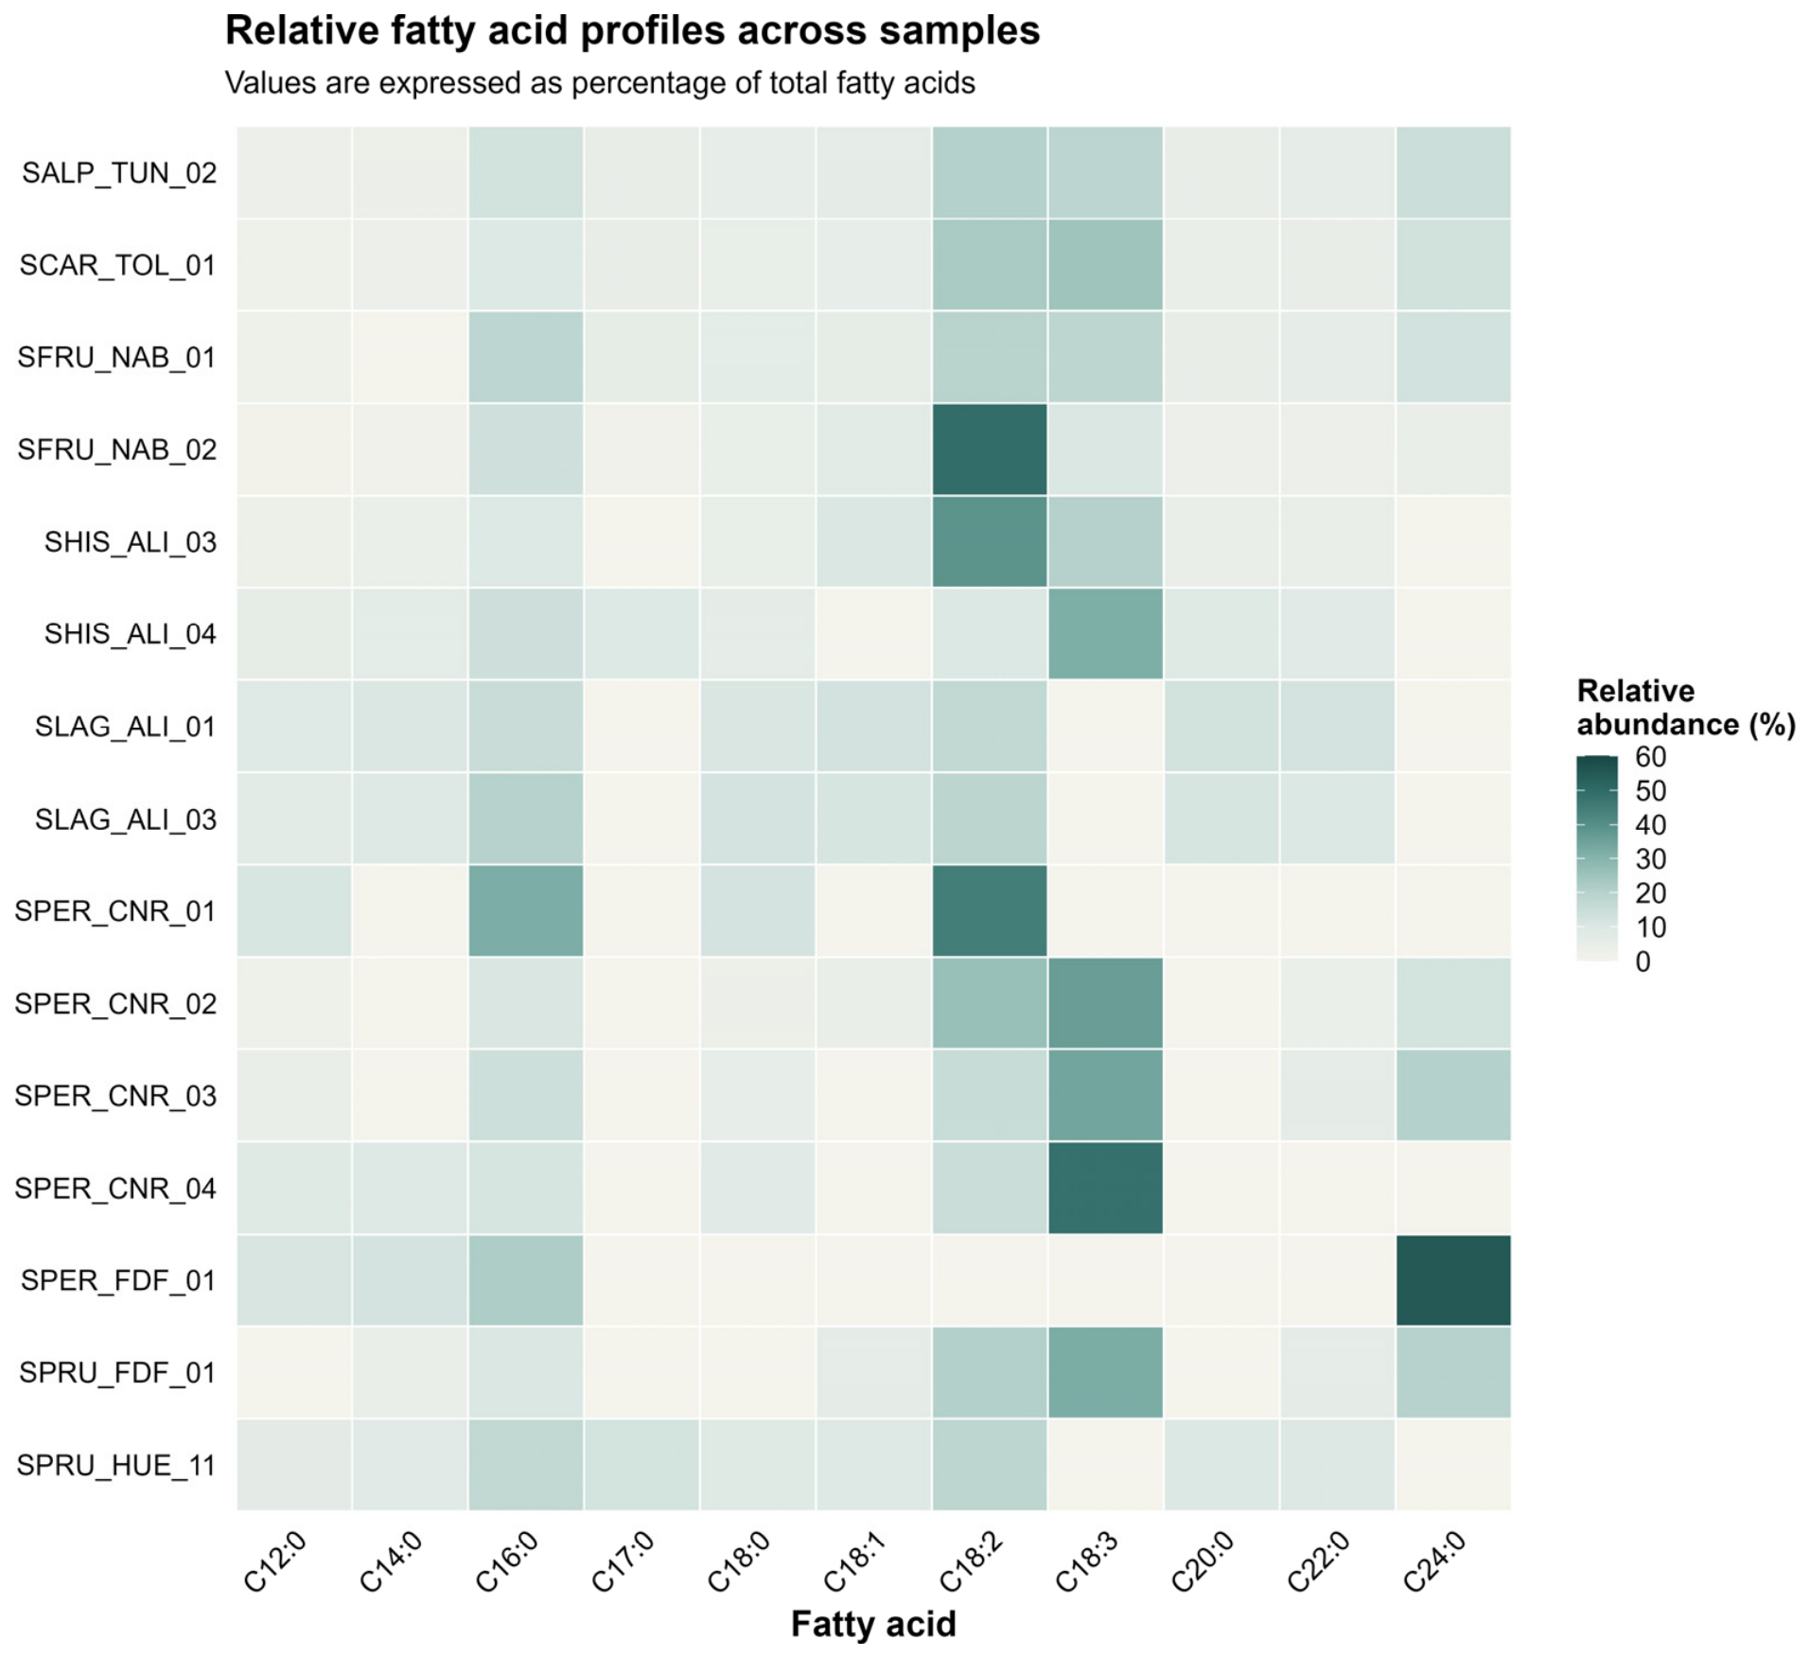
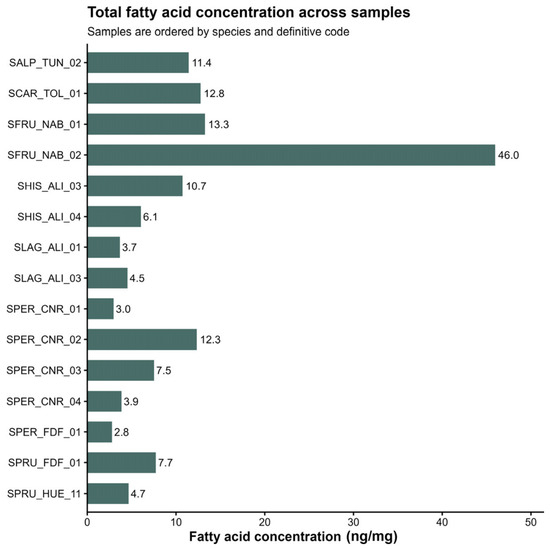
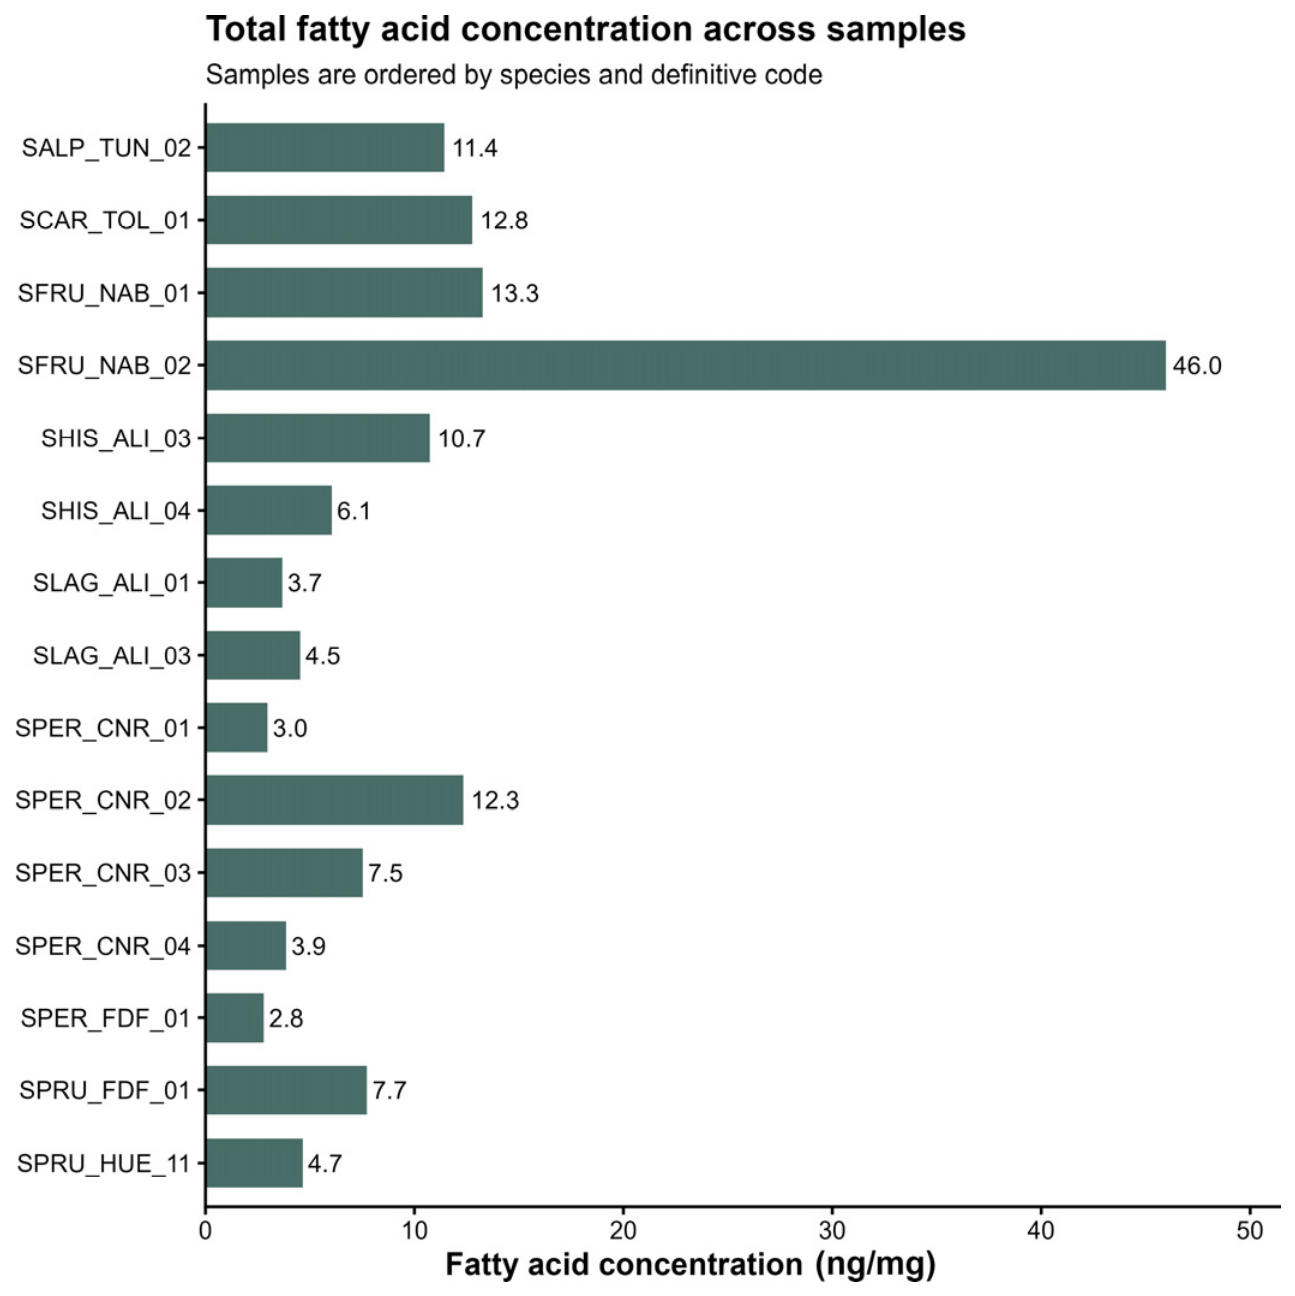

Disclaimer/Publisher’s Note: The statements, opinions and data contained in all publications are solely those of the individual author(s) and contributor(s) and not of MDPI and/or the editor(s). MDPI and/or the editor(s) disclaim responsibility for any injury to people or property resulting from any ideas, methods, instructions or products referred to in the content. |
© 2026 by the authors. Licensee MDPI, Basel, Switzerland. This article is an open access article distributed under the terms and conditions of the Creative Commons Attribution (CC BY) license.