


Abstract
Pre-packaged fermented soybean whey-based tofu (FSW-tofu) was stored under dynamic temperature conditions (4–20 °C) that simulated typical supermarket and e-commerce cold-chain transport modes. Changes in total viable count (TVC), psychrophilic bacterial count (PBC), hardness, springiness, chewiness, and water-holding capacity were monitored over 35 d, and a hybrid prediction model integrating mechanistic kinetics with machine learning was established. Results indicated that both temperature fluctuation amplitude and frequency significantly affected microbial proliferation and textural degradation. Under the e-commerce mode, exposure to 20 °C accelerated the TVC, reaching 5 lg CFU/g at 17 d, earlier than under the supermarket mode (27 d). However, the sustained low-temperature stress in the supermarket mode caused more profound degradation of the protein gel network, leading to more severe textural deterioration at the equivalent TVC threshold. The Baranyi–Roberts–Ratkowsky non-isothermal growth model and quality response functions served as the base framework, while random forest and gradient boosting trees were used for residual correction, yielding a coupled mechanistic-data-driven model. Independent validation yielded R2 > 0.89 and relatively low RMSE, confirming the model’s good generalization and predictive accuracy. This approach combines mechanistic interpretability with machine learning accuracy to provide a rapid assessment tool for the cold-chain quality management of FSW-tofu.
1. Introduction
Fermented soybean whey-based tofu (FSW-tofu) is a traditional soybean product that is curdled using fermented soybean whey, which is itself derived from the whey squeezed out during tofu processing. Owing to its fine texture, rich soybean aroma, and absence of chemical additives, FSW-tofu aligns well with current consumer trends toward “clean-label” products and the industrialization of traditional foods; consequently, its market share has grown steadily in recent years [1,2]. Compared with tofu made with coagulants such as Ca2+ and Mg2+, FSW-tofu offers distinct advantages in retaining natural nutrients, including soybean isoflavones and oligosaccharides. However, its high moisture content (typically > 80%) and abundant protein (approximately 6–8%) provide an ideal nutritional basis for microbial growth [3,4]. More importantly, FSW-tofu itself has a slightly acidic pH (5.0–5.5), a range that is particularly favorable for the growth of most spoilage bacteria (e.g., Pseudomonas spp. and Enterobacteriaceae). In the absence of chemical preservatives, FSW-tofu is highly susceptible to quality deterioration during post-processing storage and distribution, rendering its dependence on and sensitivity to cold-chain transportation significantly greater than that of other soybean products [5,6].
The quality deterioration of FSW-tofu is a complex process that is dominated by microorganisms and influenced by multiple interacting factors. Extracellular proteases produced by microbial metabolism can degrade β-conglycinin (7S) and glycinin (11S) within the soybean protein gel network, disrupting the hydrophobic interactions, disulfide bonds, and hydrogen bonds that maintain gel structure, which directly leads to decreased hardness and loss of springiness [7]. Concurrently, polar groups exposed during protein degradation alter the charge distribution of the gel network, weakening its physical water-holding capacity (WHC), which manifests as reduced WHC and increased water loss [8]. In addition, free radicals generated from lipid oxidation may further induce protein cross-linking or cleavage, thereby exacerbating textural deterioration [9]. The rates of all these deteriorative reactions are positively correlated with temperature. However, actual cold-chain transportation involves multiple stages, including factory cooling, refrigerated transport, distribution center storage, retail refrigeration, and last-mile delivery, with substantial temperature variations across these stages (4–20 °C) [10,11]. Thus, FSW-tofu products are continuously exposed to dynamic, non-isothermal temperature conditions, and these fluctuations render microbial growth kinetics highly complex: elevated temperatures not only increase the specific growth rate but also shorten the lag phase, while subsequent cooling cannot fully “reverse” the textural deterioration incurred during prior high-temperature exposure [11,12]. Traditional predictive models based on constant temperature conditions or conventional quality evaluation methods are incapable of accurately capturing the actual deterioration progression under such temperature memory effects.
Predictive microbiology has provided effective theoretical tools for assessing food quality under dynamic temperature conditions, and the field has undergone continuous evolution from classical models to intelligent algorithms [13]. At the classical modeling stage, researchers have primarily employed primary models such as Baranyi–Roberts and Logistic to describe changes in microbial counts over time, combined with secondary models like the Ratkowsky square-root model, Arrhenius-type equations, or the Huang square-root model to depict the effect of temperature on growth rates. These approaches have been successfully applied to predict non-isothermal growth in perishable foods such as meat and aquatic products [14]. For instance, Sun et al. [15] used a modified Baranyi model to simulate the dynamic growth of microorganisms in tilapia under cold-chain temperature fluctuations, while Huang et al. [16] developed a growth kinetic model for Clostridium perfringens in cooked beef during cooling by integrating the Runge–Kutta method and Monte Carlo simulation. In the subsequent intelligent algorithm-assisted stage, researchers have introduced machine learning methods (including random forest, gradient boosting trees, support vector regression, and artificial neural networks) into predictive frameworks [17,18]. Machine learning can automatically capture high-order interactions and nonlinear responses, compensating for the systematic biases of classical kinetic models when faced with complex and non-stationary temperature profiles, thereby further expanding the application boundaries of predictive models [18,19].
Nevertheless, research on predictive modeling specifically for fresh tofu, and particularly for FSW-tofu, remains significantly lagging. A few studies have examined the quality changes in FSW-tofu at constant temperatures; for example, Huang et al. [20] investigated the refrigerated quality of FSW-tofu at 4 °C, and Zeng et al. [21] reported the retarding effect of ε-polylysine on the increase in total viable count (TVC) in pre-packaged FSW-tofu. However, these studies were all confined to isothermal conditions. To date, no systematic study has reported the microbial growth patterns, quality response characteristics, or predictive models for FSW-tofu under realistic dynamic temperature fluctuations during cold-chain transportation, nor has there been any methodological exploration that combines classical predictive microbiology frameworks with machine learning approaches for the FSW-tofu system. This gap not only limits the academic understanding of the mechanisms driving quality deterioration in FSW-tofu but also hinders the scientific management of quality risks during cold-chain processes in the industry.
Therefore, pre-packaged FSW-tofu was used as the research object in this study, and dynamic temperature fluctuations (4–20 °C) from two typical cold-chain transport modes (supermarket and e-commerce) were simulated. The changes in TVC, psychrophilic bacterial count (PBC), WHC, and textural properties (hardness, springiness, chewiness) during storage were systematically analyzed. On this basis, the Baranyi–Roberts primary model and the Ratkowsky secondary model were coupled to construct a non-isothermal microbial growth kinetic model, and a mechanism-driven prediction framework for quality responses was established. Furthermore, a composite machine learning model combining random forest and gradient boosting trees was introduced for residual correction of the mechanistic predictions, ultimately yielding a comprehensive dynamic prediction model for the cold-chain quality of FSW-tofu that offers both mechanistic interpretability and high predictive accuracy. The Baranyi–Roberts model was selected for its ability to characterize the lag-phase perturbation caused by temperature fluctuations, while the Ratkowsky model was chosen for its robust description of temperature dependence on microbial growth rates. Random forest and gradient boosting trees were adopted for their proven capability to capture nonlinear interactions and resistance to overfitting with small-to-medium datasets. This study aims to elucidate the core drivers of quality deterioration in FSW-tofu under different cold-chain transportation modes and to provide scientific evidence and technical support for optimizing cold-chain processes, establishing quality monitoring checkpoints, and rapidly assessing quality deterioration at the retail level
2. Materials and Methods
2.1. Materials and Reagents
Canadian non-GMO soybeans (protein content 38%) were purchased from the Wanyue Import and Export Trade Co., Ltd. (Yueyang, China). Fermented soybean whey (total acid content: 4.49 ± 0.1 g/L; protease content: 9.51 ± 0.2 U/mL) was obtained from the Hunan Provincial Key Laboratory of Soybean Products Processing and Safety (Shaoyang, China). Plate count agar (PCA) was purchased from Guangdong Huankai Microbial Technology Co., Ltd. (Guangzhou, China). All other chemical reagents were purchased from Sinopharm Chemical Reagent Co., Ltd. (Shanghai, China).
2.2. Equipment
The following equipment was used: soymilk integrated equipment (SJJ-20, Kangdeli Intelligent Technology (Zhejiang) Co., Ltd., Jiaxing, China); texture analyzer (TA1, Lloyd Instruments Ltd., Bognor Regis, UK); homogenizer (Sicentz-150, Ningbo Scientz Biotechnology Co., Ltd., Ningbo, China); thermostatic incubator (BOI-250, Shanghai Santeng Instruments Co., Ltd., Shanghai, China); reverse-pressure high-temperature sterilizer (ZY-50S, Zhejiang Xinfeng Medical Equipment Co., Ltd., Shaoxing, China); and centrifuge (TGL18S, Changsha Yingtai Instrument Co., Ltd., Changsha, China).
2.3. Sample Preparation
The FSW-tofu was prepared according to the following procedure. Soybeans were soaked in deionized water (1:3, w/v) at 25 °C for 8 h, then ground with water (1:5, w/v) using a soymilk-integrated equipment (SJJ-20). The resulting slurry was filtered through a 200-mesh sieve, and the filtrate was boiled at 105 °C for 5 min. Fermented soybean whey was added to the boiled soymilk at a ratio of 1:4 (v/v) at 85 °C with gentle stirring until coagulation was complete. The curd was transferred into molds, pressed for 2 h under 0.5 kPa, and cooled to obtain the FSW-tofu [1].
The FSW-tofu was cut into blocks (250 g; 7.0 × 10.0 × 4.0 cm) and aseptically packaged into sterile polyethylene containers, and randomly assigned to six experimental groups (350 pieces in each group). Each container was supplemented with approximately 90 g of an immersion solution containing 0.2% chitosan oligosaccharide (COS) (pH 5.0, 2 mg/mL, w/w) [6,22]. After sealing and packaging, the tofu samples were quickly subjected to reverse-pressure sterilization (85 °C, 0.1 MPa gauge pressure, 30 min), cooled to room temperature, and then refrigerated.
2.4. Sample Dynamic Storage Temperature and Time Setting
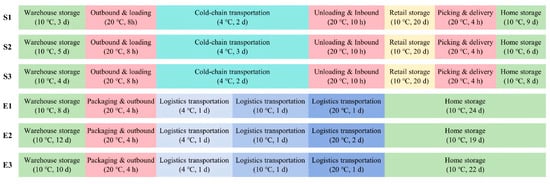
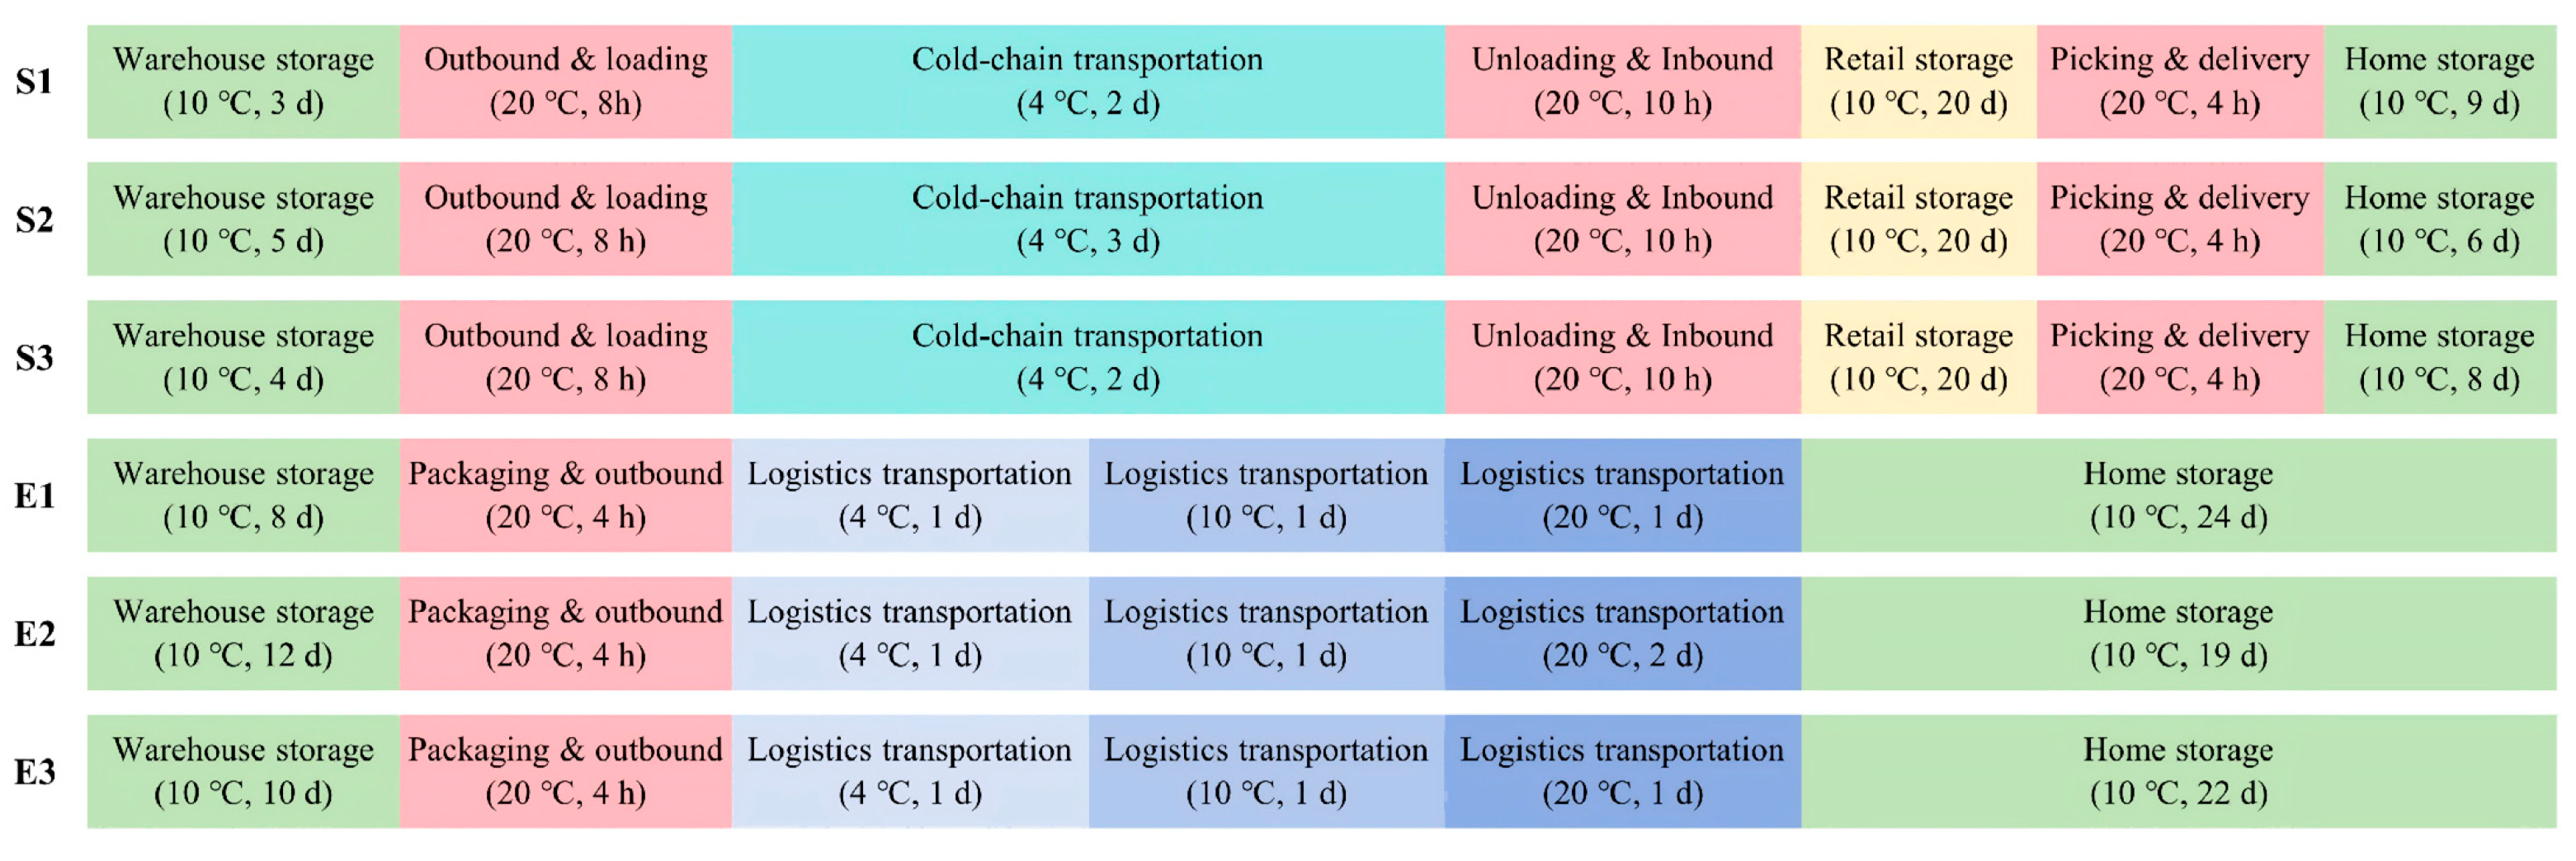
Based on temperature monitoring of pre-packaged FSW-tofu during various distribution stages under different sales and transport modes (supermarket and e-commerce), the temperature variation range was determined to be 4–20 °C. In the supermarket mode, the temperature settings for each stage were as follows: warehouse storage at 10 °C, outbound and loading at 20 °C, cold-chain transportation at 4 °C, unloading and inbound at 20 °C, retail storage at 10 °C, picking and delivery at 20 °C, and home storage at 10 °C. In the e-commerce mode, the settings were as follows: warehouse storage at 10 °C, packaging and outbound at 20 °C, logistics transportation (4 °C on 1 d, 10 °C on 2 d, and 20 °C on 3–4 d), and household storage at 10 °C. Based on the temperature fluctuations in the different sales and cold-chain transport modes, six experimental groups were designed (S1, S2, S3 for supermarket mode; E1, E2, E3 for e-commerce mode), with storage temperature and time settings as shown in Figure 1. Samples from each group were randomly taken every 24 h of storage for the determination of TVC, PBC, textural properties, and WHC. Among them, groups S1, S2, E1, and E2 were used for the construction of the prediction model (training set, 4 out of 6 groups, approximately 67% of the total data), while groups S3 and E3 were used for model validation and real-time quality prediction algorithm testing (validation set, 2 out of 6 groups, approximately 33% of the total data).
Figure 1.
Temperature and time settings for different cold-chain transport modes of fermented soybean whey-based tofu.
2.5. Determination of TVC and PBC
A 5.0 g sample of FSW-tofu was aseptically weighed and homogenized with 45 mL saline (0.85%) for 5 min. All homogenates were serially diluted ten-fold with saline (0.85%). Then, 0.1 mL of the diluted sample was spread onto PCA and incubated at 37 °C for 48 h to determine the TVC [21].
Following the method of Na et al. [23], a 5.0 g FSW-tofu sample was mashed and placed into a conical flask containing 45 mL of sterile diluent and sterile glass beads. After homogenization and thorough shaking, ten-fold serial dilutions were prepared. An appropriate dilution (1 mL) was pipetted onto sterile Petri dishes, with two plates per dilution, and PCA was poured. After the agar solidified, the plates were inverted and incubated at 4 °C for 3 d to determine the PBC. Characteristic colonies from the plates were further verified by incubation at 37 °C; counts were considered valid only if no growth occurred at 37 °C.
2.6. Determination of Water-Holding Capacity
FSW-tofu samples were cut into 3 mm slices, and surface moisture was blotted with filter paper. Approximately 2.00 g of the slice (recorded as m1) was weighed and centrifuged at 15 °C and 6000 rpm for 10 min. After centrifugation, the sample mass (recorded as m2) was weighed [1]. WHC was calculated as the percentage of the sample mass after centrifugation relative to that before centrifugation, i.e., the ratio of m2 to m1. Each sample was measured in triplicate, and the average value was reported.
2.7. Determination of Textural Properties
Textural properties (hardness, springiness, and chewiness) of FSW-tofu were determined using a three-point sampling method with a texture analyzer. The measurement conditions were as follows: TPA (texture profile analysis) mode, a P35 cylindrical flat-bottom probe, preload stress of 0.05 N, compression and return speeds of 60 mm/min and 50 mm/min, respectively, and a 5 s interval between two compressions [6].
2.8. Statistical Analysis
All measurements were performed with three biological replicates (independent samples), and the data were expressed as mean ± standard deviation (SD). Given that each temperature trajectory was applied to a single group, the statistical inferences are primarily applicable to the specific temperature patterns tested. Data organization and preliminary processing were conducted using Origin software. For the mechanistic modeling, the Baranyi–Roberts primary model coupled with the Ratkowsky square-root secondary model was applied to describe non-isothermal microbial growth, while quality parameters (hardness, springiness, chewiness, and WHC) were first represented using parsimonious baseline response functions. Temperature-dependent and microbial-related deviations that were not explicitly represented by these baseline functions were subsequently captured by the machine learning residual-correction layer. Nonlinear regression was performed to estimate the kinetic parameters. The training dataset (groups S1, S2, E1, and E2) was used to calibrate the model, while the independent validation sets (groups S3 and E3) were strictly withheld for subsequent performance testing. It is important to emphasize that data splitting was performed at the trajectory/group level, not at the level of individual observations.
To improve prediction accuracy, a hybrid model was developed by incorporating random forest and gradient boosting tree algorithms for residual correction, with hyperparameters optimized via cross-validation on the training data. Model performance on the validation sets was evaluated using the coefficient of determination (R2), root mean square error (RMSE), mean absolute error (MAE), mean absolute percentage error (MAPE), and, for microbial counts, bias factor (Bf) and accuracy factor (Af). All statistical analyses and model development were carried out using Python (version 3.9), with supplementary graphical work performed in Origin (version 9.1).
3. Results and Discussion
3.1. Effects of Different Logistics Modes on Microorganisms in FSW-Tofu
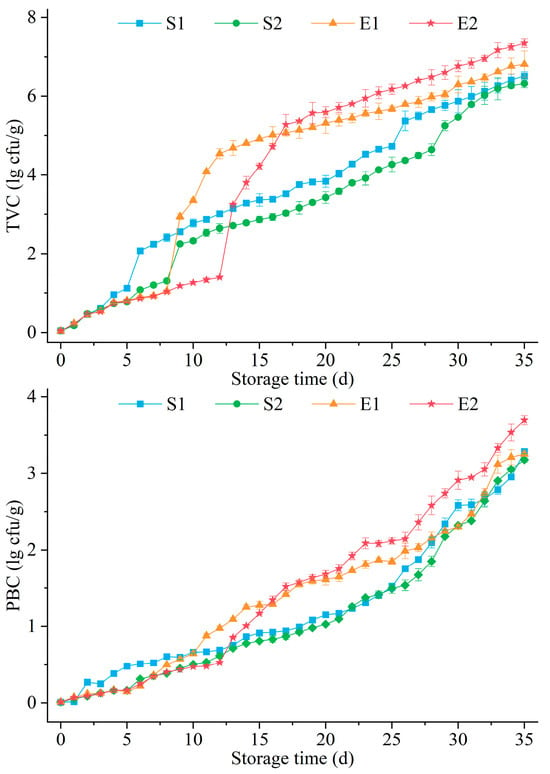
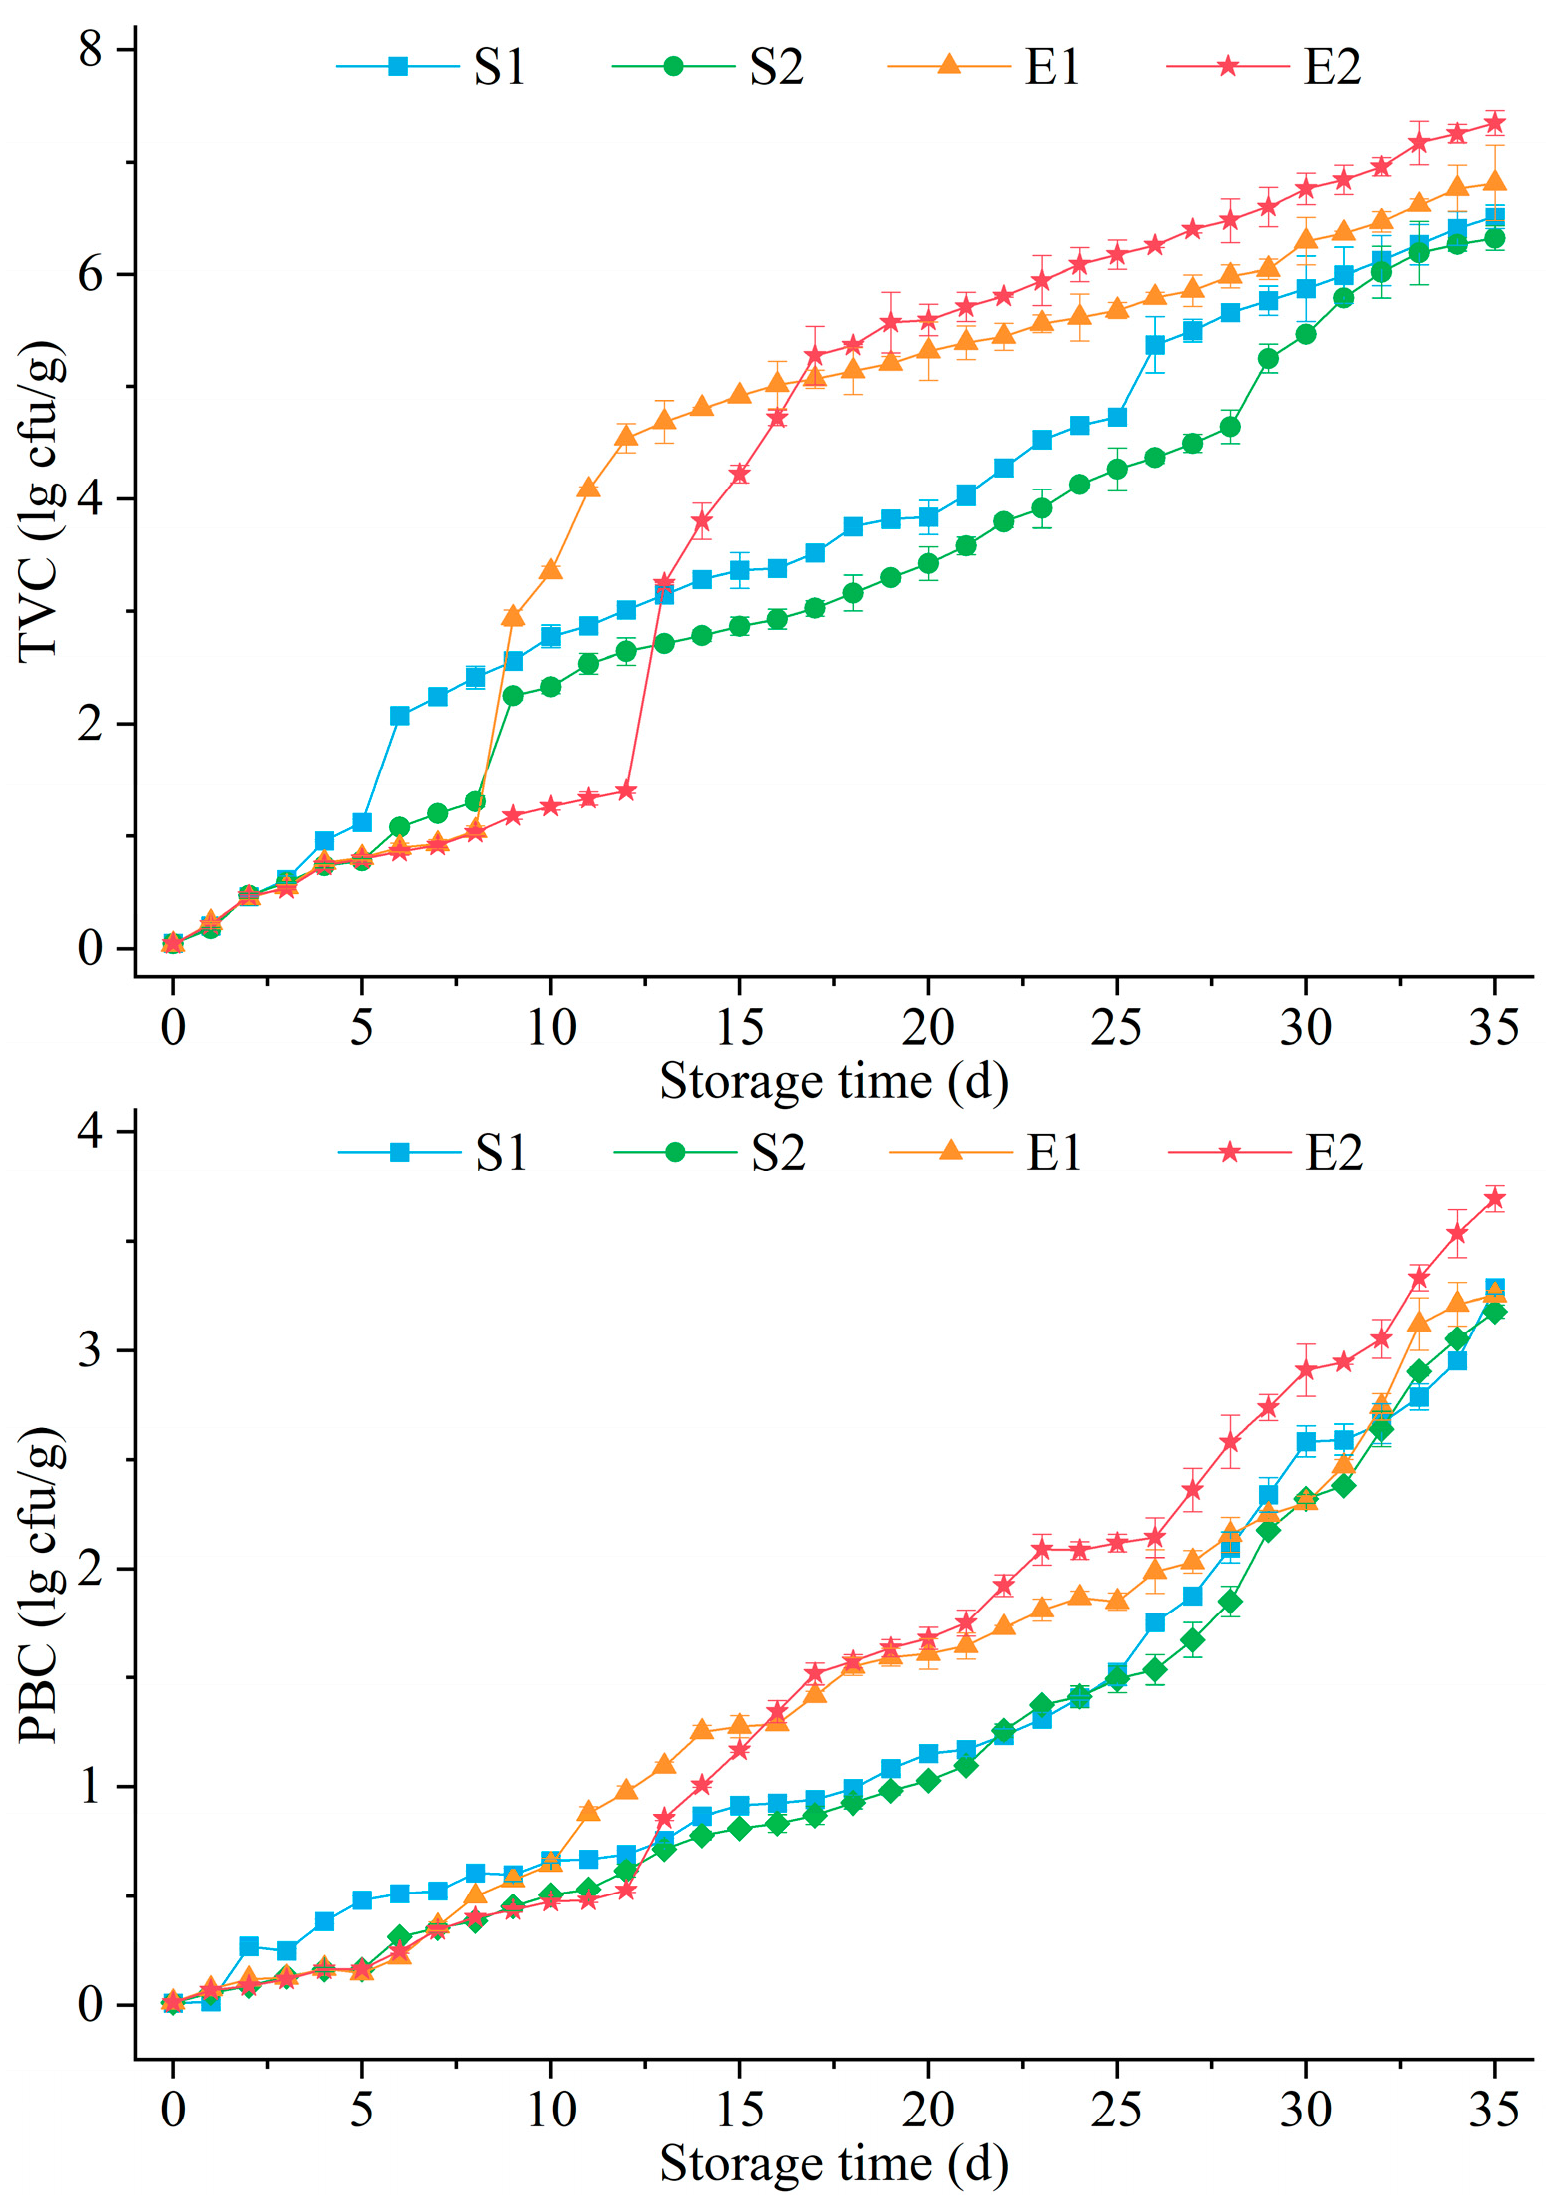
The changes in TVC and PBC of FSW-tofu under different cold-chain transport modes are presented in Figure 2. With increasing storage time, both TVC and PBC in the four experimental groups (S1, S2, E1, and E2) exhibited continuous upward trends, although the growth rates differed significantly among the logistics modes. After 35 d of storage, the TVC for groups S1, S2, E1, and E2 reached 6.51, 6.32, 6.82, and 7.35 lg CFU/g, respectively. Among these, group S2 showed the slowest TVC increase, whereas group E2 exhibited the most rapid growth, with counts significantly higher than those of the other three groups during the later storage period (after 25 d). In this study, the TVC threshold of 5 lg CFU/g was adopted as a TVC-based spoilage criterion, which specifies this value as the microbiological quality limit for commercial acceptability [6,21]. The four groups surpassed this threshold at approximately 24 d (S1), 27 d (S2), 20 d (E1), and 17 d (E2), respectively. The differences in TVC growth rates among the four groups were closely related to their respective cold-chain temperature fluctuation patterns. Group E2 experienced a high-temperature exposure (20 °C) on 4 d, and although the product was subsequently transferred to household storage at 10 °C, the earlier high temperature had already led to a substantial increase in the initial microbial load and shortened the lag phase of microbial growth. In contrast, group S2 experienced relatively small temperature fluctuations throughout the entire process (the temperature in each supermarket-mode stage was relatively stable), and the sustained low temperature effectively suppressed microbial proliferation. Kim et al. [24] reported that packaged tofu stored at 5, 13, and 23 °C showed faster increases in TVC at higher temperatures; the time from the end of shelf-life to reaching the initial spoilage level (106 CFU/g) was 25 d at 5 °C, whereas it took only 1 d at 23 °C. This finding is consistent with the present observation that more severe temperature fluctuations led to faster microbial growth. Furthermore, Bang et al. [25] also demonstrated that during simulated last-mile delivery, the use of ice packs significantly mitigated temperature rise and microbial growth, thereby delaying the quality deterioration of tofu.
Figure 2.
Changes in TVC and PBC in FSW-tofu under different logistics modes.
In terms of PBC changes, the four groups showed trends similar to those of TVC, albeit with relatively smaller overall increases. After 35 d of storage, PBC for S1, S2, E1, and E2 reached 3.29, 3.18, 3.26, and 3.70 lg CFU/g, respectively. Notably, during the later storage period (after 25 d), the PBC growth rate in group E2 accelerated markedly and became significantly higher than those of the other three groups. This phenomenon may be attributed to the fact that psychrophilic bacteria can maintain metabolic activity at low temperatures [26]; the larger microbial population resulting from prior high-temperature fluctuations, when subsequently transferred to low-temperature storage, allowed psychrophiles to gradually become the dominant flora. The PBC growth rate in group S1 during the mid-to-late storage period (15–35 d) was slightly higher than that in group S2, which may be related to the short-term temperature fluctuation (20 °C) experienced during the outbound and loading stage in group S1, indicating that even brief high-temperature exposure can exert cumulative effects on psychrophilic bacterial growth. While the present study did not perform species-level microbial identification, the differential growth patterns of TVC and PBC across temperature trajectories suggest that the dominant spoilage populations vary with temperature history, with psychrophilic bacteria becoming increasingly prevalent under prolonged low-temperature storage.
Soybean products are characterized by high water activity, low acidity, and high protein content, making them highly susceptible to rapid microbial growth and consequent spoilage [6,9]. Temperature fluctuations during cold-chain transportation of FSW-tofu accelerate microbial proliferation, and higher temperatures lead to faster microbial growth and more pronounced increases in TVC. Huang et al. [20] reported that FSW-tofu without added preservatives had a shelf-life of only 5 d at 4 °C. In the present study, after treatment with COS soaking solution and reverse-pressure sterilization, the initial TVC of the product was controlled at an extremely low level (<0.05 lg CFU/g), which significantly extended the microbial safety period, indicating that the pre-sterilization and bacteriostatic treatments were effective. Nevertheless, temperature fluctuations during cold-chain transport still caused notable microbial proliferation. Zeng et al. [21] also demonstrated that the addition of ε-polylysine could effectively delay the increase in TVC in pre-packaged FSW-tofu during refrigerated storage. In summary, the frequency and magnitude of temperature fluctuations during cold-chain transportation exerted a significant effect on microbial growth in FSW-tofu (p < 0.05); more severe fluctuations and longer exposure to elevated temperatures resulted in faster microbial proliferation and a shorter time for the product to reach the spoilage threshold. The product investigated in this study is a preserved FSW-tofu formulation containing 2 g/L COS and subjected to an 85 °C, 30 min thermal treatment; thus, the findings are specific to this product system and should not be directly extrapolated to untreated fresh FSW-tofu without further validation.
3.2. Effects of Different Logistics Modes on Textural Properties of FSW-Tofu
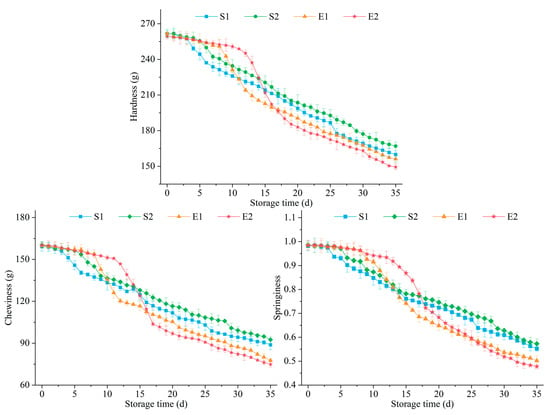
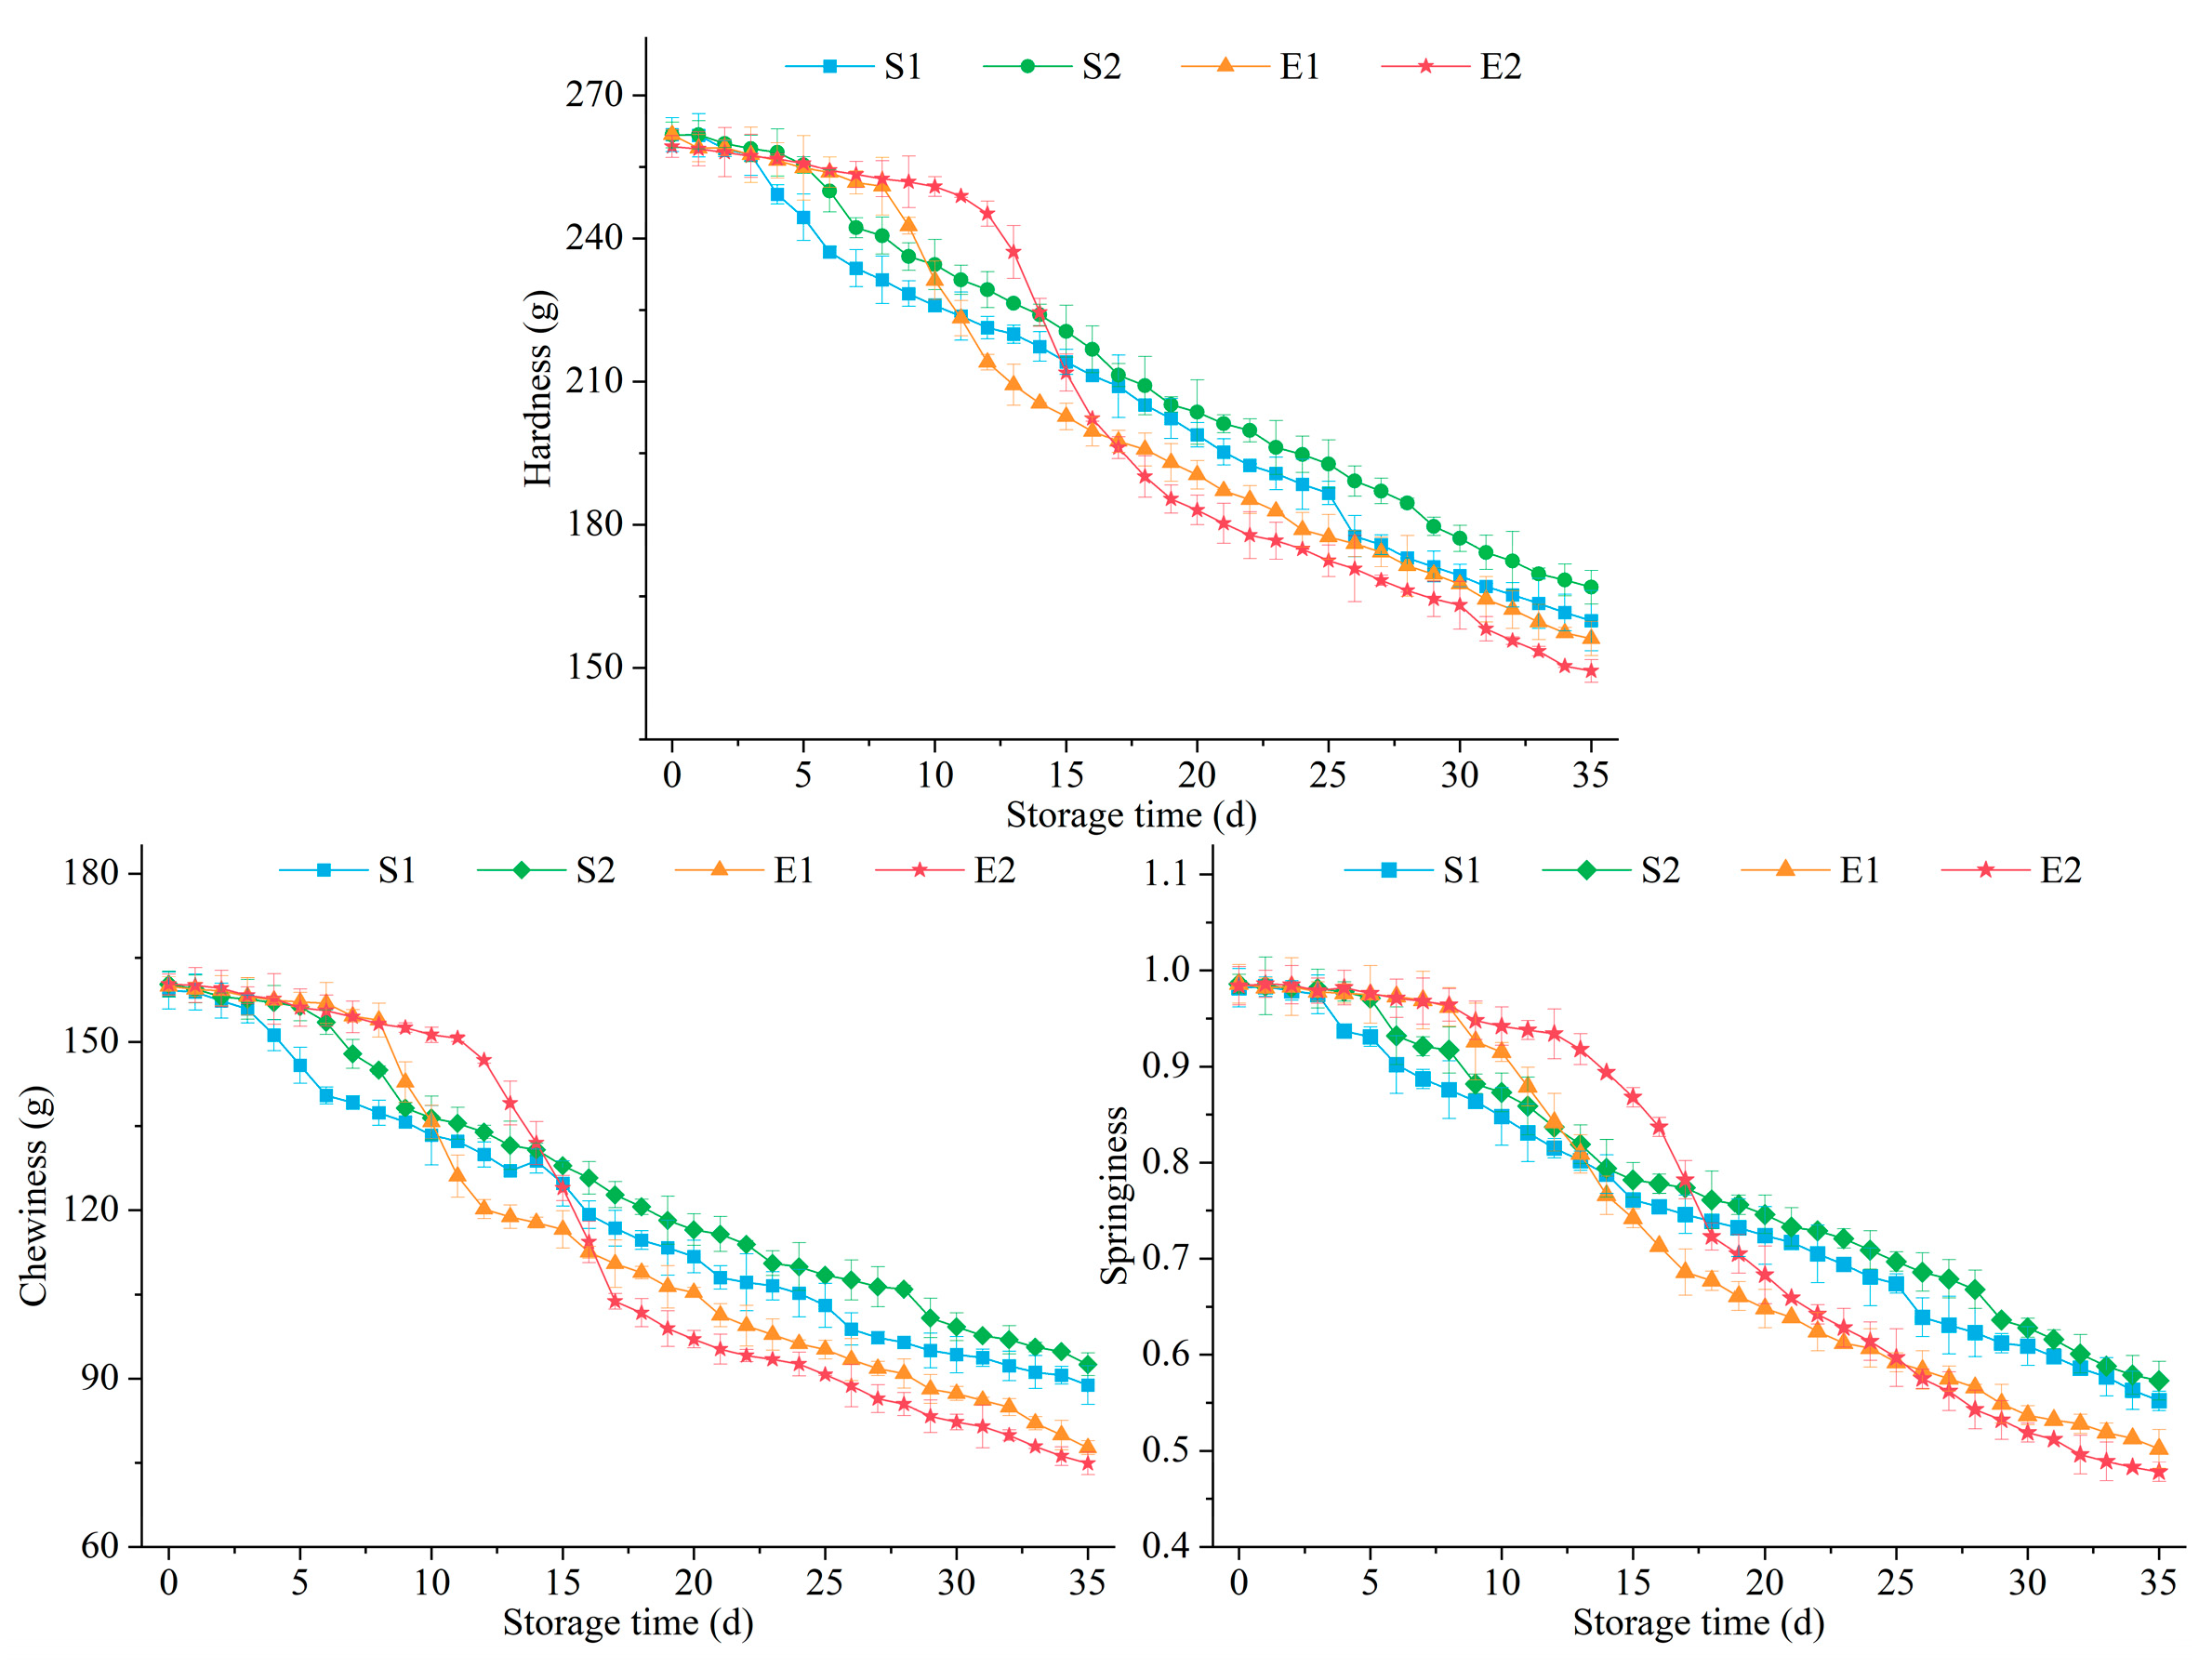
The changes in textural properties (hardness, chewiness, and springiness) of FSW-tofu under different cold-chain transport modes are presented in Figure 3. With increasing storage time, the hardness, chewiness, and springiness of the four experimental groups all exhibited continuous declining trends, although the rates of decline differed significantly among the logistics modes. The initial hardness of groups S1, S2, E1, and E2 ranged from 259.26 to 261.77 g, and after 35 d of storage, the hardness decreased to 159.87 g, 166.89 g, 156.13 g, and 149.35 g, respectively, corresponding to reductions of 38.9%, 36.2%, 40.3%, and 42.4%. Among the four groups, group E2 showed the most pronounced decrease in hardness, particularly during the mid-to-late storage period (10–25 d), where its hardness values were significantly lower than those of the other three groups; group S2 exhibited the slowest decline and maintained relatively higher hardness throughout the entire storage period. Kim et al. [24] reported that the hardness of packaged tofu decreased sharply with increasing temperature and extended storage time, and the onset of visible decomposition coincided with the reduction in hardness. The decrease in tofu hardness is closely associated with the disruption of the protein gel network, because the gel structure of tofu is primarily maintained by soybean proteins through hydrophobic interactions, disulfide bonds, and hydrogen bonds, while the proteases produced by microbial metabolism degrade these proteins and destroy the gel network, leading to reduced hardness [5,27]. Group E2 experienced more severe temperature fluctuations during e-commerce logistics (from 4 °C to 10 °C to 20 °C), and the elevated temperatures accelerated microbial proliferation and protease secretion, thereby expediting the degradation of the protein gel network. In contrast, groups S1 and S2 under the supermarket mode experienced relatively constant temperatures (mainly in the range of 4–10 °C), which inhibited microbial activity and slowed protein degradation, thus resulting in better retention of hardness. In addition, protein oxidation is also an important factor contributing to the decline in tofu hardness. Recent studies have revealed the key role of protein oxidation in the deterioration of tofu gel during refrigerated storage, where it disrupts the gel network structure and causes textural quality degradation [28,29]. Research on seasoned dried tofu has also indicated that lipid-induced protein oxidation, which in turn alters the protein gel network structure, is a major mechanism underlying quality deterioration [9].
Figure 3.
Changes in textural properties of FSW-tofu under different logistics modes.
The changes in chewiness of FSW-tofu across all experimental groups followed a pattern similar to that of hardness. Group E2 exhibited the most substantial reduction, from an initial value of 160.27 g to 74.89 g, representing a decrease of 53.3%; group S2 showed the slowest decline, from 160.28 g to 92.54 g. Notably, the chewiness of groups E1 and E2 decreased at an accelerated rate during the mid-to-late storage period (after 15 d), which may be attributed to the enhanced microbial metabolic activity and accelerated protein degradation resulting from temperature fluctuations under the e-commerce mode. Huang et al. [20] found that the hardness and chewiness of FSW-tofu increased significantly during the first 3 d of refrigeration at 4 °C and then began to decrease. However, no such initial increase in hardness or chewiness was observed in the present study, which may be due to the reverse-pressure sterilization and COS soaking treatment applied in this experiment; the pre-sterilization effectively suppressed early microbial activity, causing the textural indicators to display a continuous decline from the outset of storage. Jiang et al. [30] also demonstrated that hardness and chewiness are key indicators affecting the quality changes in soybean products during storage.
The decrease in springiness of FSW-tofu followed the same trend as hardness and chewiness, with group E2 showing the most dramatic reduction and group S2 the most gradual decline. After 35 d of storage, the reductions reached 51.4% and 41.9%, respectively. The loss of springiness reflects the loss of elasticity in the tofu gel network, primarily caused by protein degradation, which reduces the cross-linking points within the gel network, thereby depriving the tofu of its original resilience and recoverability [9,31]. Compared with hardness, the decline in springiness was relatively more gradual, suggesting that the elastic structure of the tofu gel network is somewhat less sensitive to microbial degradation than the hardness indicator.
In summary, the textural properties of FSW-tofu exhibited a continuous deterioration trend during storage, and temperature fluctuation was the key factor accelerating textural degradation. This finding is consistent with the conclusion that temperature significantly affects hardness, adhesiveness, and chewiness in studies on Premna microphylla Turez jelly [32]. The deterioration of textural properties in FSW-tofu is primarily attributable to three causes: first, proteases produced by microbial metabolism directly degrade soybean proteins and destroy the gel network structure; second, free radicals generated from lipid oxidation induce protein oxidative denaturation, further exacerbating gel structure disruption; and third, increased moisture content and decreased protein content lead to reduced gel strength [33]. Therefore, maintaining temperature stability during cold-chain transport is critically important for preserving the textural quality of FSW-tofu.
3.3. Effects of Different Logistics Modes on Water-Holding Capacity of FSW-Tofu
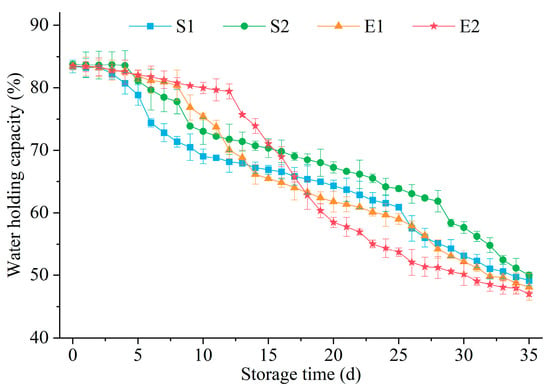
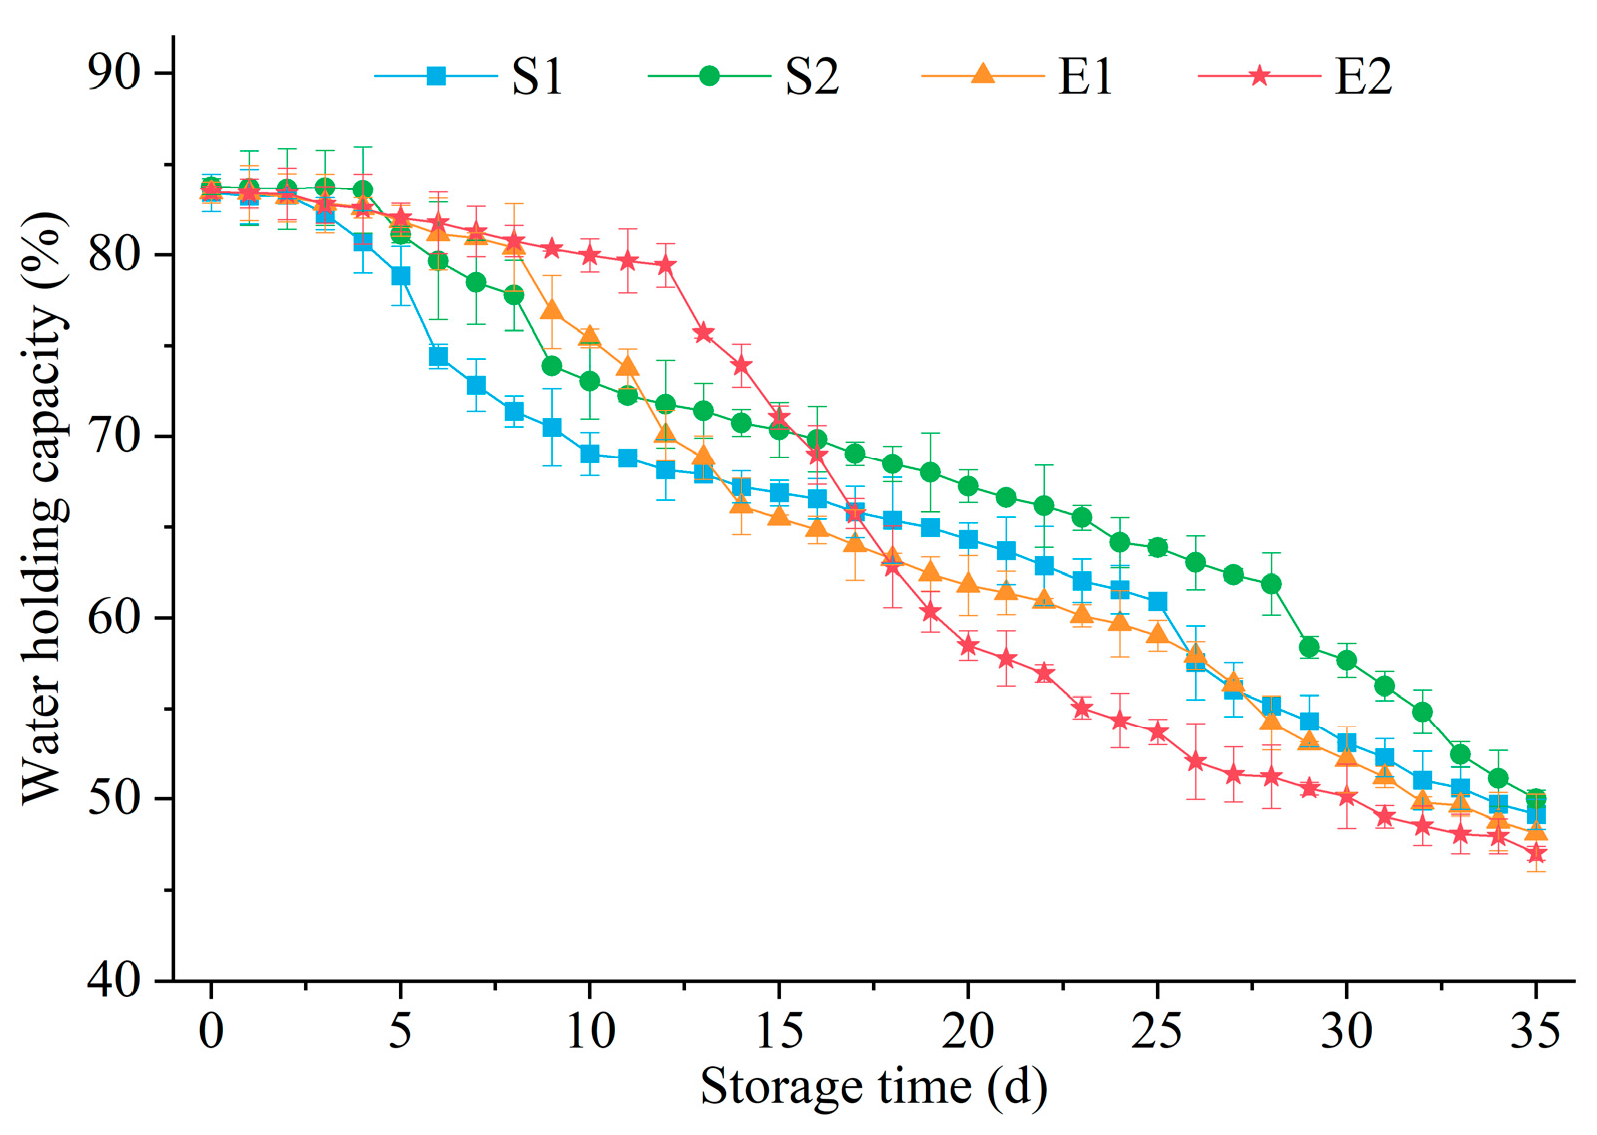
The changes in WHC of FSW-tofu under different cold-chain transport modes are presented in Figure 4. With increasing storage time, the WHC of all four experimental groups exhibited continuous declining trends, although the rates and patterns of decline differed significantly among the logistics modes. Among the four groups, group E2 showed the most pronounced decrease in WHC, with the decline rate accelerating notably during the later storage period (after 25 d), reaching 47.04% after 35 d of storage; group S2 exhibited the slowest decline and maintained relatively higher WHC throughout the entire storage period. This result indicates that the relatively stable low-temperature environment (4 to 10 °C) under the supermarket mode was beneficial for preserving the WHC of FSW-tofu, whereas the severe temperature fluctuations under the e-commerce mode (particularly the 20 °C high-temperature exposure) significantly accelerated the decline in WHC. Notably, group E1 showed a relatively slow decrease in WHC during the early-to-mid storage period (0–15 d), but the decline rate accelerated markedly during the later period (15–35 d), with the final WHC only slightly higher than that of group E2. This may be because group E1 experienced low-temperature environments of 4 °C and 10 °C during the initial 2 d of logistics transport, which inhibited microbial growth to some extent. However, the 20 °C high-temperature exposure on day 3 led to a substantial increase in the microbial population. Even after the product was subsequently transferred to household storage at 10 °C, the microorganisms maintained relatively high metabolic activity, continuously degrading proteins and disrupting the gel network structure. This phenomenon suggests that even a single episode of high-temperature exposure during cold-chain transport may exert long-term adverse effects on the WHC of FSW-tofu.
Figure 4.
Changes in water-holding capacity of FSW-tofu under different logistics modes.
The WHC of tofu primarily depends on the physical entrapment of water by the protein gel network. When proteases produced by microbial metabolism degrade soybean proteins, the gel network structure is disrupted, and the water originally trapped within the network is gradually released, leading to a decline in WHC [34]. Studies have shown that during storage, soybean proteins undergo oxidative reactions, resulting in conformational changes and an overall decrease in gel strength and hardness [28]. In addition, free radicals generated from lipid oxidation can induce protein oxidative denaturation, alter protein molecular conformation, and further weaken the water-retaining capacity of the gel network [9,31]. Using low-field nuclear magnetic resonance, Zeng et al. [21] found that during refrigerated storage of FSW-tofu, immobilized water gradually transformed into free water, and the decline in WHC was closely related to the changes in water status. This finding is consistent with the observations in the present study, where the disruption of the protein gel network weakened the gel’s ability to retain water, resulting in a continuous decline in WHC. The decrease in WHC of FSW-tofu is the combined result of microbial protease degradation, protein oxidation, and water status transformation. Therefore, during cold-chain transportation and retail distribution, it is essential not only to control the storage temperature but also to pay close attention to the frequency and magnitude of temperature fluctuations in order to maximize the preservation of WHC and ensure product quality.
3.4. Construction of Microbial Growth Kinetic Models and Quality Response Models for FSW-Tofu
3.4.1. Development and Evaluation of Microbial Growth Kinetic Models
To quantify the quality deterioration process of FSW-tofu under dynamic temperature conditions, the primary task was to accurately describe the growth behavior of the core variable, namely, microorganisms. In this study, the Baranyi–Roberts primary growth model was selected to describe the dynamic evolution of TVC and PBC. This model collectively characterizes the transition of microorganisms from the adaptation phase to the growth phase through the maximum specific growth rate (μmax), the maximum microbial count (Nmax), and the lag-adaptation state function (Q). However, during actual cold-chain transportation, the environmental temperature fluctuates dynamically over time, and μmax is not a constant. Therefore, the Ratkowsky power-law temperature response model was employed to describe the effect of temperature on μmax, and the real-time temperature was substituted into the Baranyi–Roberts model to achieve simulation of microbial growth under non-isothermal conditions. Furthermore, considering that the cold-chain temperature mainly fluctuates within the range of 4–20 °C, and to reduce the excessive amplification effect of short-term high-temperature exposure in the secondary model, the temperature response exponent was set to 1.5. The advantage of this combination lies in the fact that the Baranyi–Roberts model can effectively characterize the disturbance of temperature fluctuations on the microbial lag phase through the initial lag-state parameter (h0), while the Ratkowsky model provides a robust mathematical relationship between temperature and the maximum specific growth rate (μmax). The integration of these two models enables dynamic simulation of microbial growth under time-varying temperature conditions [35,36], with the specific calculations presented in Equations (1)–(4):
In the above equations, N is the real-time microbial count; Nmax is the maximum microbial count; N0 is the initial microbial count; t is the storage time; Q is the lag-adaptation state function; Q0 is the initial lag-adaptation state; Qmax is the saturation value of the lag state; T is the real-time–temperature; μmax(T) is the maximum specific growth rate at the real-time temperature; h0 is the initial lag-state parameter; b is the temperature response coefficient; Tmin is the minimum growth temperature of the microorganism; 1.5 is temperature response exponent.
Based on the measured data from the four training groups (S1, S2, E1, and E2), the key kinetic parameters of the models were first estimated by fitting (Table 1). The results showed that the growth model parameters for TVC and PBC (e.g., Nmax, μmax, Qmax) all passed extremely significant tests (p < 0.001), and the confidence intervals of the parameters were relatively narrow, indicating good statistical stability and biological plausibility of the models. It is noteworthy that although the Ratkowsky model parameters b_TVC (0.0100) and Tmin_TVC (0.4704) did not pass the significance tests (p = 0.092 and p = 0.426, respectively), this did not undermine the practical utility of the model. This is because these two parameters function as a synergistic pair in practical application; together, they define the temperature-response boundary for TVC growth, and their joint confidence interval effectively covers the temperature range encountered in actual cold-chain conditions. Compared with testing each parameter individually, the overall predictive performance of the model (as demonstrated in the validation results in Section 3.5) serves as a more critical indicator of its applicability. In addition, the Tmin for PBC was estimated at 5.66 °C, which is markedly higher than the 0.47 °C for TVC. This finding reveals the biological basis for the relatively high metabolic activity of psychrophilic bacteria at low temperatures and also explains why the proportion of PBC gradually increased during the later storage period (low-temperature stage) from a modeling perspective.
Table 1.
Performance parameters of the prediction model on the training set.
3.4.2. Construction of Response Prediction Models for Quality Indicators
Microbial growth is not the endpoint of quality deterioration but rather the driving factor. To establish a quantitative relationship from the “cause” (microbial proliferation) to the “effect” (quality deterioration), response models for quality attributes were constructed based on experimental data. The core concept was to assume that the decline in quality parameters (hardness, springiness, chewiness, and WHC) is the cumulative result of microbial metabolic activity, as measured by total viable counts. Accordingly, response models for WHC (Wt), hardness (Ht), chewiness (Ct), and springiness (St) of FSW-tofu were established separately, with the specific calculations presented in Equations (5)–(8):
In the above equation, W is the WHC; t is the storage time; Weq is the equilibrium WHC; W0 is the initial WHC; kW is the primary WHC transfer coefficient; kW2 is the secondary WHC transfer coefficient.
In the above equation, H is the hardness; t is the storage time; H0 is the initial hardness; kH is the hardness decay coefficient; Nt is the bacterial count at storage time t; N0 is the initial bacterial count.
In the above equation, C is the chewiness; t is the storage time; C0 is the initial chewiness; kC is the bacterial influence coefficient; Nt is the bacterial count at storage time t; N0 is the initial bacterial count; kCH is the hardness transfer coefficient; H0 is the initial hardness; Ht is the hardness at storage time t.
In the above equation, S is the springiness; t is the storage time; S0 is the initial springiness; MN(t) is the microbial influence value at storage time t; MH(t) is the hardness influence value at storage time t; MW(t) is the water-holding capacity influence value at storage time t; Mt(t) is the time influence value at storage time t; MT(T) is the temperature influence term at real-time temperature T.
The specific formulations of MN(t), MH(t), MW(t), Mt(t), and MT(T) are given in Equations (9)–(13):
In the above equation, Nt is the bacterial count at storage time t; N0 is the initial bacterial count; kS is the influence coefficient of bacterial count on springiness; kS_sig is the shape parameter of the sigmoid function.
In the above equation, Ht is the hardness at storage time t; H0 is the initial hardness; kSH is the transfer coefficient between hardness and springiness.
In the above equation, Wt is the WHC at storage time t; W0 is the initial WHC; kSW is the transfer coefficient between WHC and springiness.
In the above equation, kS_time is the influence coefficient of time on springiness; t is the storage time.
In the above equation, kS_temp is the influence coefficient of temperature on springiness; T is the real-time temperature.
It should be noted that the WHC response model was formulated exclusively as a function of storage time, in contrast to the other quality response models that incorporate microbial or textural variables. This decision was based on two considerations. First, WHC reflects the progressive physical disruption of the protein gel network caused by the cumulative action of extracellular proteases over time, which, unlike microbial count itself, does not follow an exponential growth pattern but rather a gradual, time-dependent deterioration trajectory [34,36]. Second, preliminary analysis revealed that microbial count alone was a poor predictor of WHC decline (R2 = 0.41), whereas time-based fitting provided excellent performance (R2 = 0.94). This is biologically plausible because the gel network degradation that governs WHC is a cumulative process driven by the total protease activity accumulated over the entire storage period, which correlates more strongly with time than with instantaneous microbial counts. Temperature effects on WHC are indirectly embedded in the model through the experimental grouping design, as the rate parameters kW and kW2 were separately estimated for each temperature trajectory in the training dataset, capturing the differential deterioration rates caused by distinct temperature histories. Thus, while the WHC model is structurally simpler than the other quality response models, it remains consistent with the underlying physical mechanism and provides accurate predictions for the temperature ranges tested.
The model construction results indicated that each quality response model exhibited good fitting ability to the training data (Table 2). Taking the hardness response model as an example, its decay coefficient kH was 0.1967, implying that for each logarithmic increase in TVC, hardness decreased by approximately 19.7%, which is highly consistent with the declining trend of hardness shown in Figure 3. The chewiness response model further revealed its multi-factor-driven deterioration characteristics: it was affected not only directly by TVC (kC = 9.77) but also indirectly through the decline in hardness (kCH ≈ 1.0), indicating that the disruption of the gel network structure was the primary cause of chewiness loss. The springiness response model, on the other hand, constructed a more comprehensive framework that integrated multiple influences, including microbial counts, hardness, WHC, storage time, and temperature. Although the significance levels of the two parameters kS_temp and kS_sig in this model (p = 0.159 and p = 0.104) did not reach the conventional statistical criteria, their inclusion as components of the model system helped to improve the overall robustness of the predictions. Overall, the quality response models successfully converted the “invisible” microbial growth into “visible” changes in texture and WHC, thereby providing a quantitative tool for model-based quality monitoring in subsequent applications.
Table 2.
Kinetic parameters of the microbial growth kinetic models and quality response models.
3.5. Establishment and Validation of Dynamic Prediction Models for FSW-Tofu Quality
3.5.1. Construction of the Hybrid Mechanistic-Machine Learning Model
Purely mechanism-based models often suffer from insufficient prediction accuracy when confronted with complex, non-linear actual cold-chain fluctuations [18,37]. To address this issue, a novel hybrid modeling strategy was introduced in this study, incorporating a machine learning residual-correction mechanism following the principle of “mechanistic model first for preliminary prediction, then machine learning for bias correction”. Specifically, the mechanistic models (microbial kinetics and quality responses) established in Section 3.4 were first used to generate preliminary predictions for the quality indicators, providing baseline values. Subsequently, a composite machine learning model, with random forest and gradient boosting trees as the core algorithms, was constructed. Its input feature matrix (X) included not only basic variables such as time and temperature, but also mechanistic model predictions, temperature change rates, and interaction terms among the various quality indicators. The task of this machine learning model was to learn the residuals (i.e., observed value minus mechanistic prediction) between the mechanistic predictions and the measured values, and finally to output the corrected final predictions (Equation (14)). This design preserves the biological interpretability of the mechanistic models while leveraging the powerful non-linear fitting capability of machine learning to effectively capture the complex fluctuation effects that mechanistic models fail to describe.
In the above equation, ŷj is the final predicted value for the j-th quality indicator; fkin,j(t,T) is the kinetic or quality response model prediction for the j-th indicator at storage time t and real-time temperature T; gj(X) is the machine learning residual-correction function for the j-th indicator; X is the feature matrix composed of time, temperature, mechanistic predictions, interaction terms, and rates of change.
3.5.2. Model Prediction Performance Evaluation and Validation
The prediction performance of the models was evaluated using MSE, RMSE, MAPE, Bf, Af, and R2. The specific calculations are presented in Equations (15)–(20).
In the above equations, n is the number of samples; i is the sample index; yi is the i-th actual observed value; ŷi is the i-th predicted value.
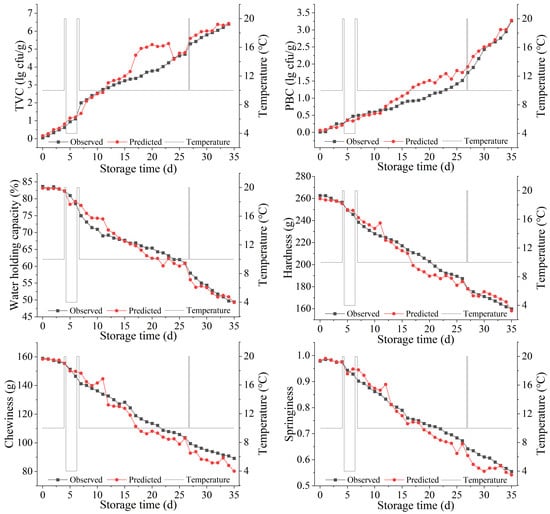
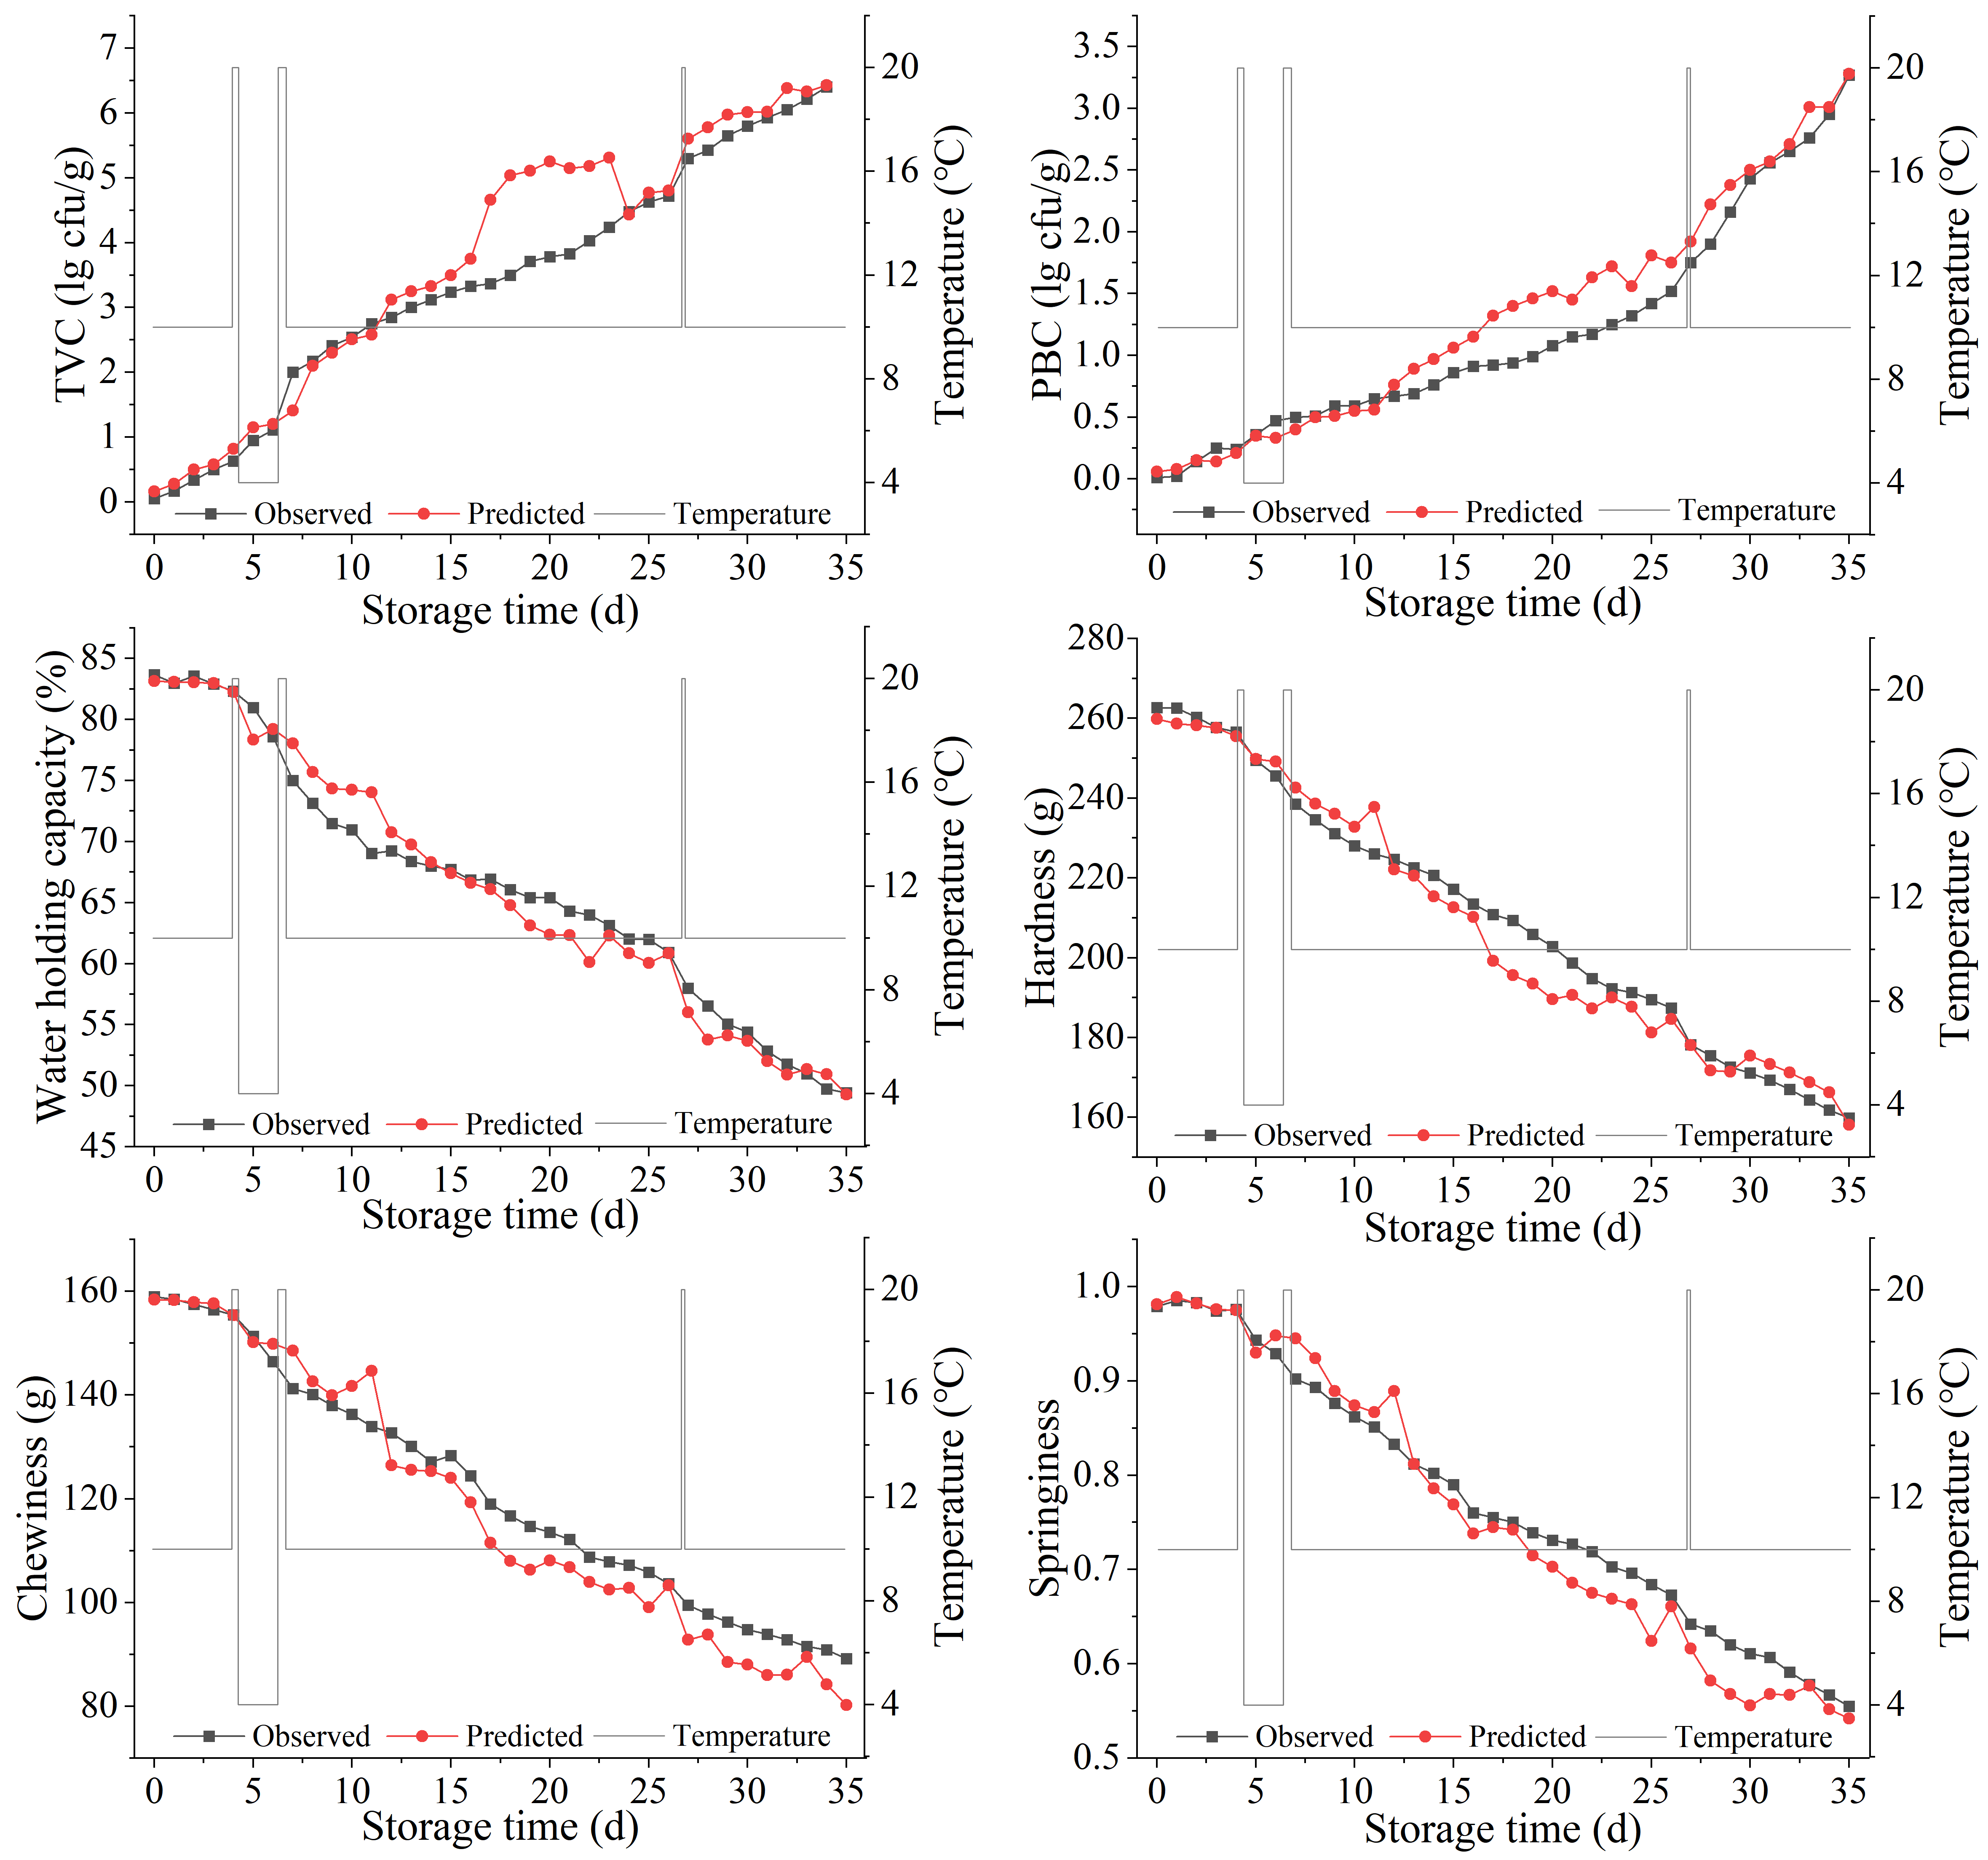
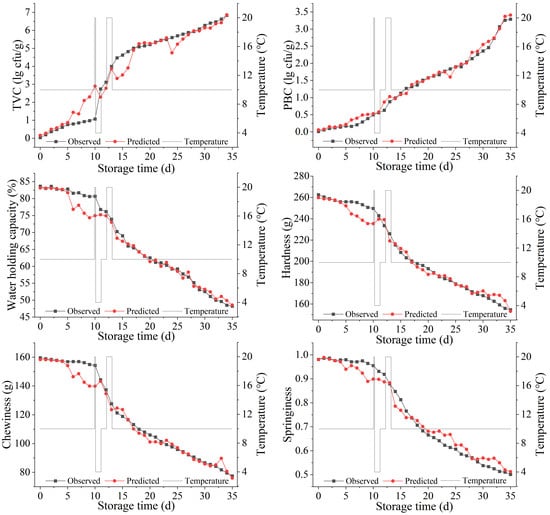
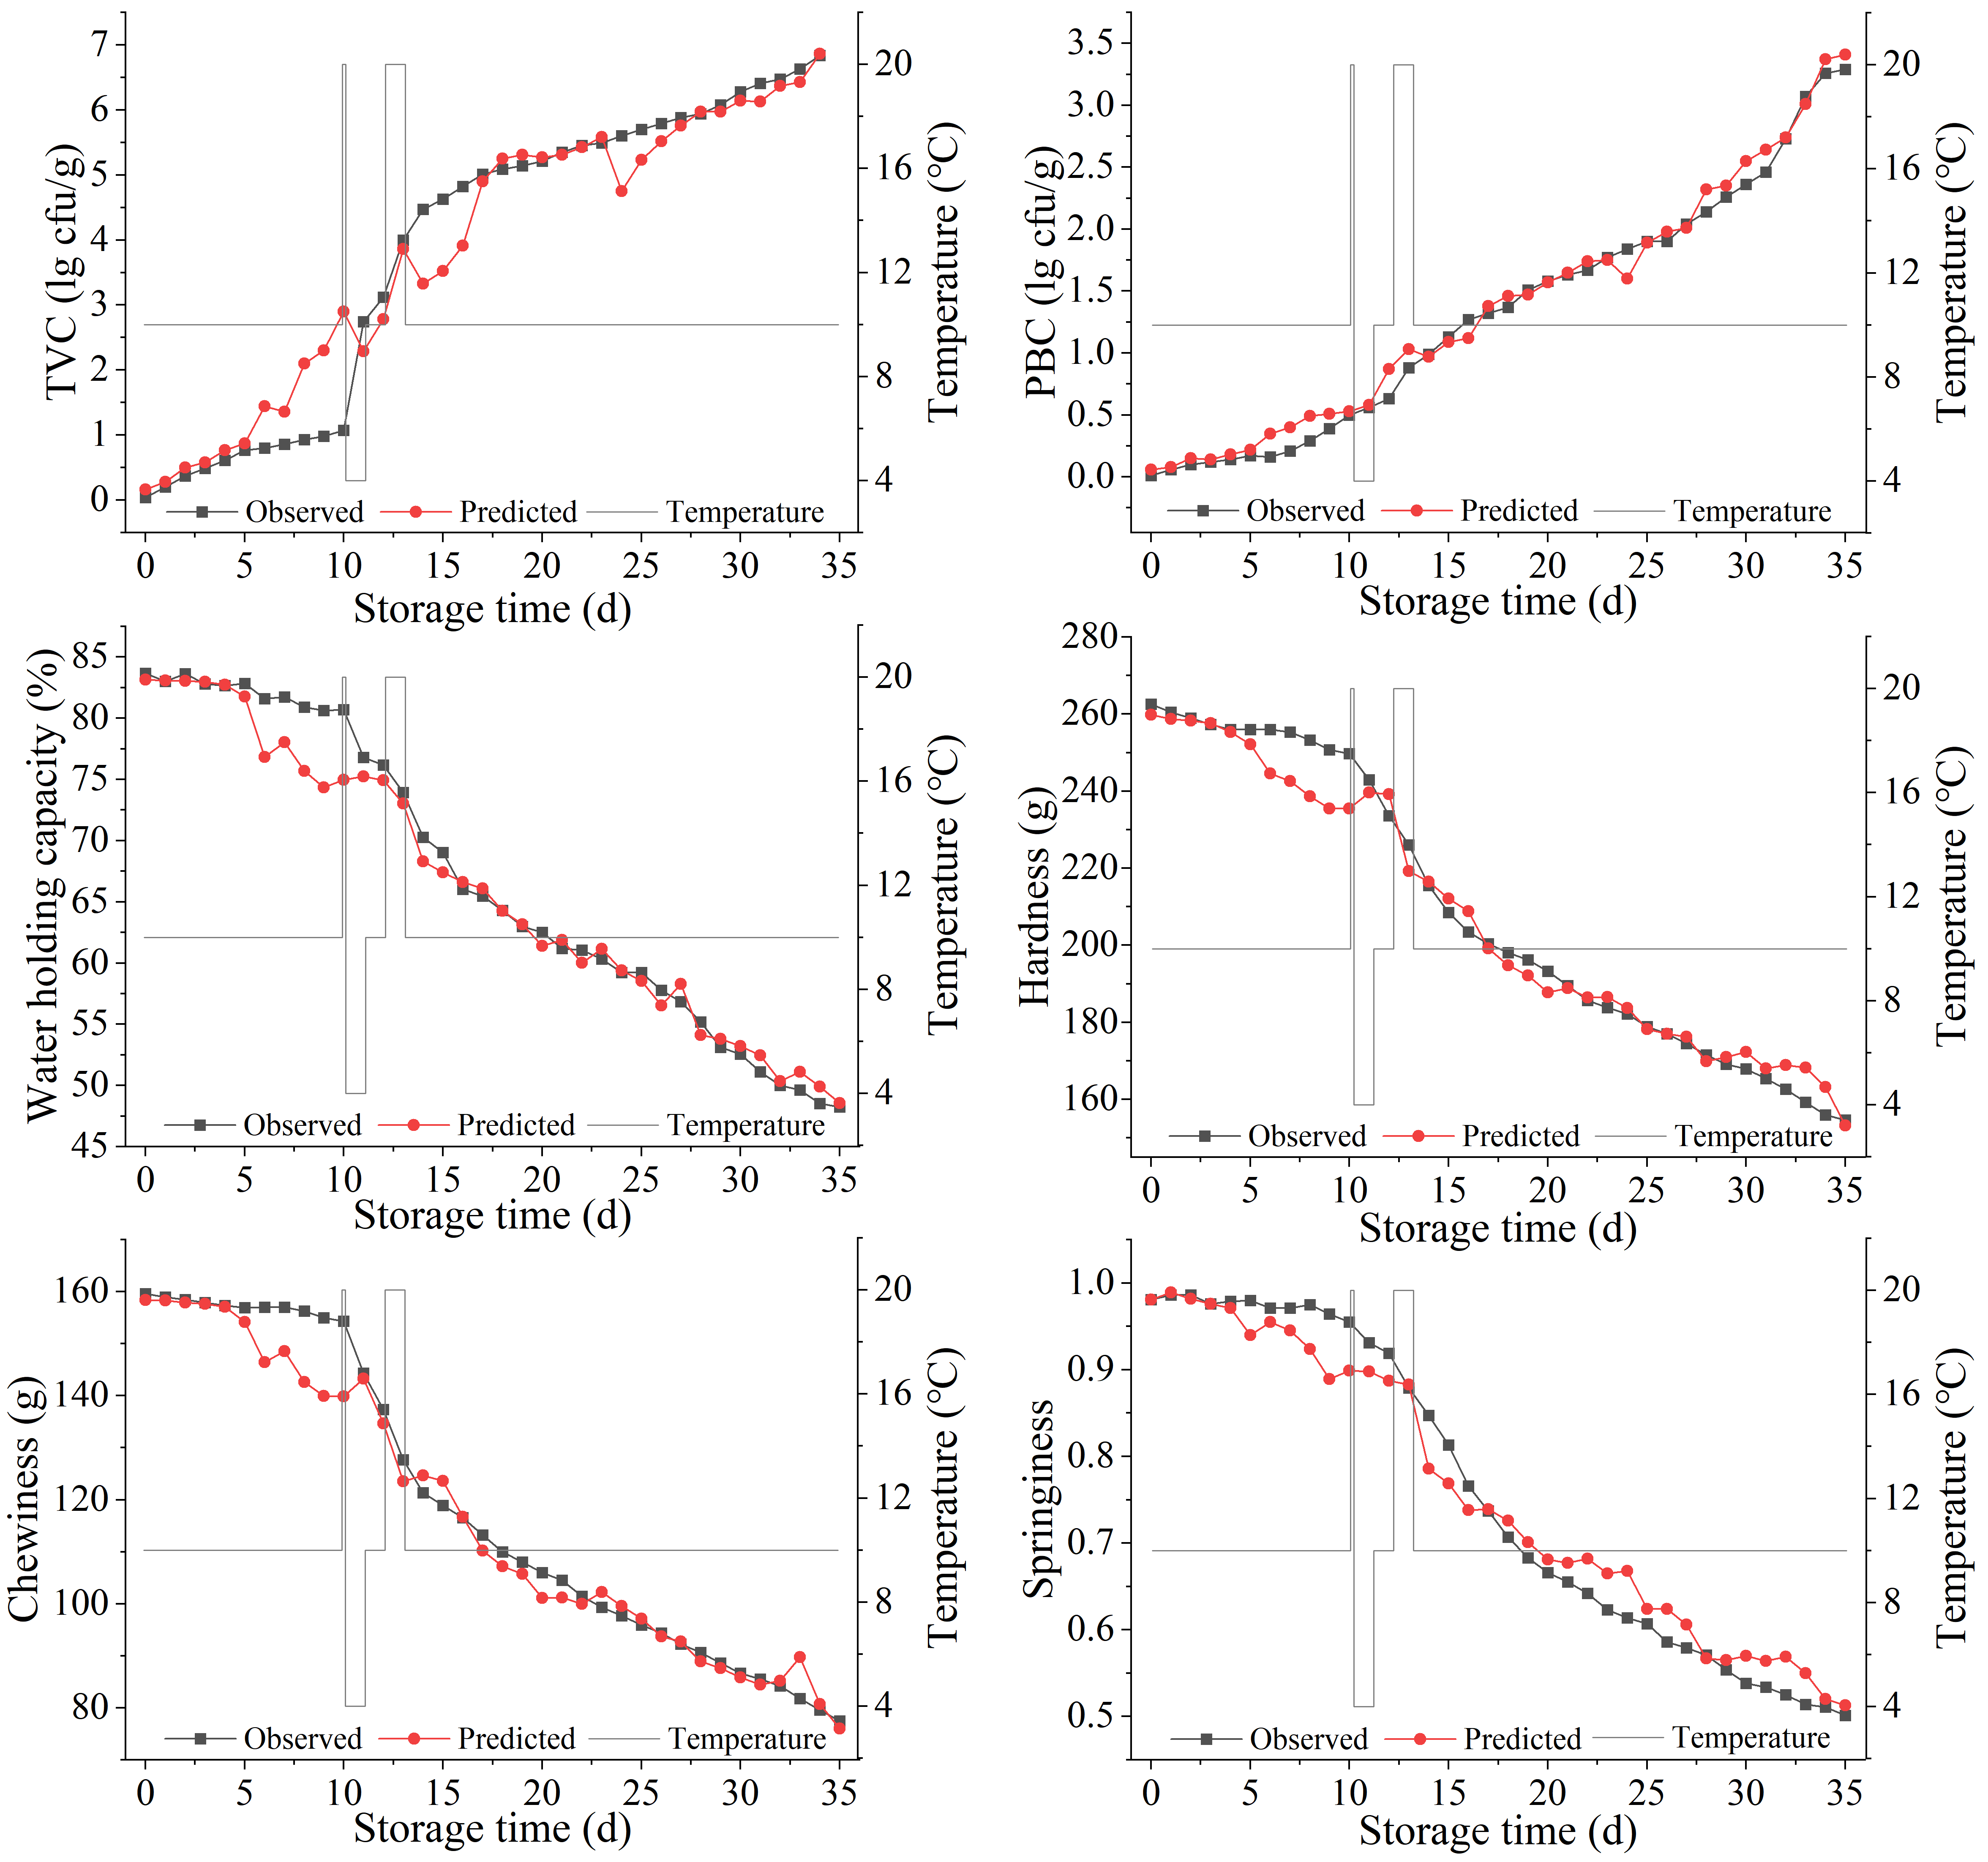
To comprehensively validate the generalization ability of the constructed hybrid model (mechanistic and machine learning), it was applied to the completely independent validation datasets S3 and E3, which had not been used in model training. As shown in Table 3 and Figure 5 and Figure 6, the model accurately captured the overall trends of TVC and PBC changes. In groups S3 and E3, the R2 values for TVC predictions were 0.8924 and 0.9395, respectively, while those for PBC were 0.9236 and 0.9863, indicating that the model could explain the vast majority of the data variability. The relatively higher MAPE values observed during early storage (when microbial concentrations were low) reflect the known sensitivity of MAPE to small denominators rather than systematic prediction errors; this is a well-recognized limitation in predictive microbiology and does not compromise the overall model validity. More importantly, the RMSE values for TVC (0.5594–0.7956 lg CFU/g) and PBC (0.1231–0.2210 lg CFU/g), together with Bf values close to one (0.9476–1.2553) and Af values within acceptable ranges (1.0389–1.3009), collectively demonstrate satisfactory predictive accuracy.
Figure 5.
Fitting results of measured and predicted values for microbial and quality indicators of FSW-tofu in validation set S3.
Figure 6.
Fitting results of measured and predicted values for microbial and quality indicators of FSW‑tofu in validation set E3.
For the quality indicators, the model performed exceptionally well in predicting hardness, springiness, chewiness, and WHC. In both validation sets, the R2 values for all quality indicators exceeded 0.93, and RMSE values remained at relatively low levels. For instance, the MAPE for hardness and springiness ranged between 2.0% and 3.7%, which was much lower than the error level for the microbial indicators. This demonstrates that the quality response models, driven by microbial predictions, provide a robust and accurate transmission of predictions.
Furthermore, when comparing the performance metrics of the training set (Table 1) and the validation set (Table 3), no significant decline was observed in R2, RMSE, Bf, or Af for any of the indicators. This indicates that the model did not suffer from overfitting and successfully learned the universal patterns of quality deterioration induced by temperature fluctuations, showing good adaptability to different cold-chain transport modes.
Table 3.
Performance parameters of the prediction model on the validation set.
3.6. Construction of Rapid Texture-Based Assessment Indicators Anchored to TVC-Based Spoilage Thresholds
The preceding models have accurately described the complete chain of how “temperature fluctuations induce microbial growth, which in turn leads to quality deterioration”. However, in practical industrial applications, the timeliness and complexity of microbial testing remain major bottlenecks. Therefore, this section aims to extract simplified indicators from the established models that can be used for rapid on-site assessment. In this study, a TVC of 5 lg CFU/g was established as the TVC-based spoilage threshold for FSW-tofu transitioning from “acceptable” to “unacceptable” [6,21], a threshold that carries important quality and commercial significance. During model validation, we extracted the corresponding measured quality data at the time when TVC first reached or exceeded this threshold in validation groups S3 and E3 (Table 4).
Table 4.
Quality parameters of FSW-tofu at the TVC spoilage threshold in each experimental group.
Analysis of the data in Table 4 reveals a seemingly counter-intuitive phenomenon: the textural properties, including hardness, springiness, and chewiness of FSW-tofu in group E (e-commerce mode) were significantly superior to those in group S (supermarket mode) under the condition of an identical TVC threshold (approximately 5.0–5.3 lg CFU/g). For example, at a TVC of 5.01 lg CFU/g in group E3, the springiness was 0.737, whereas at a TVC of 5.30 in group S3, the springiness was only 0.642. This does not imply that the e-commerce mode better preserves quality; rather, it reveals a key mechanism: under rapid deterioration modes, microbial counts and textural changes are not fully synchronized. Samples in group E experienced severe temperature fluctuations, allowing microorganisms to grow rapidly and cross the threshold within a relatively short period (16–17 d), during which degradation of the protein gel network was still in its early stages and texture remained relatively intact. In contrast, samples in group S were subjected to sustained mild low-temperature stress, providing microorganisms with a longer period (27 d) to secrete proteases and conduct a more thorough “chronic” hydrolysis of the protein network, resulting in more severe textural damage by the time equivalent bacterial counts were reached.
This finding carries important practical implications. It demonstrates that a single texture value cannot serve as a universally applicable “rigid” indicator of quality change. This phenomenon also indirectly suggests that the composition of the spoilage microbiota, rather than total count alone, may influence the extent of textural degradation at equivalent TVC levels, a hypothesis that will be addressed in our ongoing studies. However, through the predictive models established in this study, it is possible to dynamically calculate the theoretical texture values corresponding to the time when TVC reaches 5 lg CFU/g, based on the specific time–temperature history of a given batch, thereby providing a “dynamic” rapid assessment reference for that batch. For instance, for products that have experienced a mild cold-chain pattern similar to group S, when springiness declines to approximately 0.64, caution should be exercised as the TVC-based spoilage threshold may have been reached; whereas for products that have experienced greater fluctuations similar to group E, the threshold is reached when springiness is still at approximately 0.73.
Therefore, the “rapid assessment indicator” constructed in this study is not a set of fixed numerical values, but rather a dynamic determination method coupled with the predictive model. Quality control personnel in enterprises can input real-time monitored texture data into the trained hybrid model to back-calculate the estimated current TVC or to predict the remaining time before the microbial threshold is reached at the given texture level. This approach is more scientific and reliable than simply relying on empirical critical texture values and provides an efficient decision-support tool for quality monitoring in cold-chain logistics. Future work will further strengthen the present findings by incorporating species-level microbial identification to elucidate the composition of spoilage microbiota under different temperature trajectories, as well as metabolite profiling to directly characterize the biochemical pathways of quality deterioration. Additional temperature trajectory replications and production batches would also enhance the statistical robustness and generalizability of the model.
4. Conclusions
This study addressed the non-isothermal quality deterioration problem of pre-packaged FSW-tofu (containing 2 g/L COS, sterilized at 85 °C, 0.1 MPa, 30 min) during cold-chain transportation. The findings and the predictive model developed herein are specifically applicable to this preserved product formulation and processing conditions; extrapolation to untreated fresh FSW-tofu or products with different preservation treatments requires further validation. By simulating two typical logistics modes (supermarket and e-commerce), the differential driving effects of temperature fluctuation frequency and amplitude on microbial proliferation and textural degradation were systematically revealed. Through the integration of the Baranyi–Roberts–Ratkowsky non-isothermal kinetic model with a machine learning residual-correction algorithm, a hybrid dynamic prediction model covering TVC, PBC, hardness, springiness, chewiness, and WHC was successfully constructed. Validation results demonstrated that the model exhibited good generalization ability on independent datasets (R2 > 0.9). On this basis, using TVC = 5 lg CFU/g as the TVC-based spoilage threshold, a dynamic texture-based rapid assessment method specific to given temperature histories was further proposed, effectively overcoming the limitations of conventional fixed thresholds in practical applications. This study provides a scientifically sound and practically applicable new tool for cold-chain quality monitoring and rapid freshness assessment of FSW-tofu and similar fresh soybean products. Moreover, the results highlight that temperature stability is critical for preserving quality, and the established hybrid model can serve as a decision-support tool for enterprises to predict remaining shelf-life based on real-time temperature monitoring data.
Author Contributions
Conceptualization, L.Z. and Z.H.; methodology, D.Z. and H.C.; software, D.Z. and L.F.; validation, X.Z. (Xiaojie Zhou) and H.C.; formal analysis, Z.H., D.Z. and F.L.; investigation, D.Z. and X.Z. (Xiaohu Zhou); resources, L.F. and F.L.; data curation, H.C. and F.L.; writing—original draft, D.Z. and L.F.; writing—review and editing, Z.H. All authors have read and agreed to the published version of the manuscript.
Funding
This research was funded by the Natural Science Foundation of Hunan Province (No. 2025JJ70243), the Science and Technology Plan Project of Shaoyang (No. 2024GZ1001, 2024PT4043), the Local Science and Technology Development Fund Project of Central Guidance (No. 2024ZYC0014).
Institutional Review Board Statement
Not applicable.
Informed Consent Statement
Not applicable.
Data Availability Statement
The original contributions presented in this study are included in the article. Further inquiries can be directed to the corresponding author.
Acknowledgments
The authors would like to thank Shaoyang University, Hunan Provincial Key Laboratory of Soybean Products Processing and Safety Control, and Hunan Engineering Research Center of Green Processing and Equipment of Hunan-Style Food for providing facilities and equipment. During the preparation of this manuscript, the authors used AI-assisted language polishing tools (GPT-5.5 and DeepSeek-V3) for the purposes of grammar correction and wording refinement. The authors have reviewed and edited all AI-generated suggestions and take full responsibility for the final content of this publication.
Conflicts of Interest
Author Liu Fan and author Fengwu Li were employed by the company Yanjinpuzi Food Co., Ltd. They participated in the sample preparation and collection work in this study. The role of the company was to provide research materials and support for sample production. The remaining authors declare that the research was conducted in the absence of any commercial or financial relationships that could be construed as potential conflicts of interest.
References
- Huang, Z.R.; Liu, H.Y.; Zhao, L.Z.; He, W.Y.; Zhou, X.J.; Chen, H.; Zhou, X.H.; Zhou, J.S.; Liu, Z.X. Evaluating the effect of different processing methods on fermented soybean whey-based tofu quality, nutrition, and flavour. LWT 2022, 158, 113139. [Google Scholar] [CrossRef] [Scilit]
- Yang, Y.; Wang, B.; Fu, Y.; Shi, Y.G.; Chen, F.L.; Guan, H.N.; Liu, L.L.; Zhang, C.Y.; Zhu, P.Y.; Liu, Y.; et al. HS-GC-IMS with PCA to analyze volatile flavor compounds across different production stages of fermented soybean whey tofu. Food Chem. 2020, 346, 128880. [Google Scholar] [CrossRef] [Scilit] [PubMed]
- Fei, Y.T.; Li, L.; Chen, L.Y.; Zheng, Y.; Yu, B.N. High-throughput sequencing and culture-based approaches to analyze microbial diversity associated with chemical changes in naturally fermented tofu whey, a traditional Chinese tofu-coagulant. Food Microbiol. 2018, 76, 69–77. [Google Scholar] [CrossRef] [Scilit] [PubMed]
- Wu, H.; Dong, J.J.; Dai, Y.Q.; Liu, X.L.; Zhou, J.Z.; Xia, X.D. Effects of lactic acid bacteria fermented yellow whey on the protein coagulation and isoflavones distribution in soymilk. Food Chem. 2021, 334, 127484. [Google Scholar] [CrossRef] [Scilit] [PubMed]
- Baghdady, G.S.; Wang, J.Y.; Dai, Y.Q.; Cao, Y.X.; He, Z.Y.; Cai, Y.M.; Dong, M.S.; Wang, D.Y.; Xia, X.D. Effect of Physical and Chemical Properties of Kombucha-Fermented Soy Whey on the Quality of Tofu. Cereal Chem. 2026, 103, 473–486. [Google Scholar] [CrossRef] [Scilit]
- Zhong, Q.L.; Zeng, W.; He, X.X.; Wen, M.; Chen, H.; Wang, J.R.; Zhao, D.; Huang, Z.R.; Xie, L.; Liu, B.B.; et al. Effects of chitosan oligosaccharides on the refrigerated quality of pre-packaged tofu under different pH values. Food Ferment. Ind. 2025, 51, 284–293. [Google Scholar]
- Dai, Y.Q.; Xu, Z.; Wang, Z.; Li, X.N.; Dong, J.J.; Xia, X.D. Effects of fermentation temperature on bacterial community, physicochemical properties and volatile flavor in fermented soy whey and its coagulated tofu. LWT 2023, 173, 114355. [Google Scholar] [CrossRef] [Scilit]
- Li, Y.; Wan, Y.L.; Mamu, Y.; Xu, J.T.; Guo, S.T. Aggregation and gelation of soymilk protein after alkaline heat treatment: Effect of coagulants and their addition sequences. Food Hydrocolloid. 2023, 135, 108178. [Google Scholar] [CrossRef] [Scilit]
- Huang, Z.R.; Zhou, H.P.; Jiang, Q.H.; He, W.Y.; Zhou, X.H.; Chen, H.; Zhou, X.J.; Li, M.; Liu, B.B.; Zhou, J.S.; et al. Study on the quality change and deterioration mechanism of leisure dried tofu under different storage temperature conditions. LWT 2022, 172, 114257. [Google Scholar] [CrossRef] [Scilit]
- Chu, Y.M.; Ding, Z.Y.; Wang, J.F.; Xie, J.; Ding, Y.T. Factors affecting the quality of frozen large yellow croaker (Pseudosciaena crocea) in cold chain logistics: Retention time and temperature fluctuation. Food Chem. X. 2023, 18, 100742. [Google Scholar] [CrossRef] [Scilit] [PubMed]
- Cao, Y.R.; Chen, M.T.; Li, J.L.; Liu, W.P.; Zhu, H.S.; Liu, Y.J. Continuous monitoring of temperature and freshness in cold chain transport based on the dual-responsive fluorescent hydrogel. Food Chem. 2023, 438, 137981. [Google Scholar] [CrossRef] [Scilit] [PubMed]
- Li, Y.; Zhang, L.W.; He, Y.F.; Zhang, L.L.; Liu, X.X.; Shang, N. Effect of UV-Ozone disinfection on the quality of Northern shrimp (Pandalus borealis) under sudden state of cold chain transportation. Food Bioprod. Process. 2025, 150, 285–295. [Google Scholar] [CrossRef] [Scilit]
- Ali, R.M.; Shoaib, M.; Mansoor, F.; Bashir, S.; Arshad, H. Emerging Trends in Food Microbiology: A Review of Nanotechnology, Predictive Modeling, and Risk Assessment. J. Food Process. Eng. 2026, 49, e70519. [Google Scholar] [CrossRef] [Scilit]
- Liu, Q.; Zhu, Y.D.; Ma, H.J.; Yang, S.F.; Zhao, L.J.; Liang, D.; Sun, L.X.; Gai, Z.Y.; Li, M.Y. Development of Real-Time Freshness Prediction Model for Prepackaged Sauced Pig Head Meat in the Cold Chain. Food Sci. 2025, 46, 244–251. [Google Scholar]
- Sun, M.G.; Chen, D.Y.; Liu, L.X.; Wang, T.; Guo, Y.H.; Xie, Y.F.; Yao, W.R.; Yu, H. Effects of O2/CO2 transmission rate of BOPA/LDPE or PE film on shelf life and quality attributes of fresh-cut cherry radish. Food Biosci. 2023, 51, 102171. [Google Scholar] [CrossRef] [Scilit]
- Huang, L.H. Direct construction of predictive models for describing growth of Salmonella Enteritidis in liquid eggs: A one-step approach. Food Control. 2015, 57, 76–81. [Google Scholar] [CrossRef] [Scilit]
- He, X.W.; Hu, X.R.; Mao, K.M.; Zhang, J.W.; Gao, J.; Chitrakar, B.; Cheng, H.H.; Sang, Y.X. Machine learning-driven microbial community synthesis: A new paradigm for intelligent upgrading of food fermentation. Trends Food Sci. Tech. 2026, 169, 105569. [Google Scholar] [CrossRef] [Scilit]
- Okoye, C.O.; Abhadiomhen, S.E.; Ezenwanne, B.C.; Chen, X.F.; Jiang, H.F.; Wu, Y.F.; Jiang, J.X. Machine learning-based predictive modeling of foodborne pathogens and antimicrobial resistance in food microbiomes using omics techniques: A systematic review. Food Res. Int. 2025, 221, 117255. [Google Scholar] [CrossRef] [Scilit] [PubMed]
- Bansal, S.; Rodriguez, C.Z.; Thompson-Witrick, K.A.; Wang, Y.; Taft, D.H.; Zhang, B.C. Machine learning-powered multi-omics for food microbiology and smarter food safety. Trends Food Sci. Tech. 2025, 163, 105145. [Google Scholar] [CrossRef] [Scilit]
- Huang, B.L.; Wang, J.; Liao, Z.L.; Wang, L.; Zhong, Q.P.; Fang, X. Changes in the Quality of Acid Whey Tofu during Refrigerated Storage. Mod. Food Sci. Technol. 2020, 36, 263–270. [Google Scholar]
- Zeng, W.; Zhong, Q.L.; He, X.X.; Wang, J.R.; Chen, H.; Zhao, D.; Huang, Z.R.; Zhou, X.J.; Lin, B.L.; Zhou, J.S. Effect of ε-polylysine on refrigerated quality of pre-packaged fermented soybean whey-based tofu. Food Ferment. Ind. 2025, 51, 206–215. [Google Scholar]
- Wu, J.; Zeng, W.; Liu, S.C.; Chen, H.; Wu, J.H.; Wei, L.Y.; He, C.J.; Zhao, D.; Huang, Z.R.; Wang, J.R. Nisin improves the storage quality of refrigerated pre-packaged fermented soybean whey-tofu—Food safety, texture, and flavor. Front. Nutr. 2026, 13, 1807620. [Google Scholar] [CrossRef] [Scilit] [PubMed]
- Na, S.; Kim, J.H.; Jang, H.J.; Park, H.J.; Oh, S.W. Shelf life extension of Pacific white shrimp (Litopenaeus vannamei) using chitosan and epsilon-polylysine during cold storage. Int. J. Biol. Macromol. 2018, 115, 1103–1108. [Google Scholar] [CrossRef] [Scilit] [PubMed]
- Kim, S.J.; Kim, S.H.; Bang, W.S. Changes in quality of expired tofu during storage at different temperatures. J. Food Sci. Technol. 2022, 54, 142–148. [Google Scholar]
- Bang, S.H.; Park, J.; Sung, J.M.; Park, M.K.; Ahn, J.H.; Oh, S.M. Passive insulation strategies for tofu: Thermal and quality stability under simulated delivery. Food Sci. Biotechnol. 2026, 35, 949–961. [Google Scholar] [CrossRef] [Scilit] [PubMed]
- Cai, Z.C.; Wang, Y.Y.; Liao, G.H.; Wang, J.M. Effects of cold plasma-activated solution on microbial amounts and diversity of Tilapia fillets at refrigerator storage. LWT 2024, 213, 117047. [Google Scholar] [CrossRef] [Scilit]
- Wu, T.; Huang, Z.R.; Zhao, L.Z.; Zhou, X.H.; Chen, H.; Zhou, X.J.; Li, M.; Zhou, J.S.; Lin, Y.Y. Effects of the marinating process on the quality characteristics and bacterial community of leisure dried tofu. Foods 2023, 12, 841. [Google Scholar] [CrossRef] [Scilit] [PubMed]
- Hu, F.F.; Wang, L.; Ancheta, L.B.; Ogawa, Y. Effects of Matrix Structure on Protein Digestibility and Antioxidant Property of Different Soybean Curds During In Vitro Digestion. J. Agric. Food Chem. 2024, 72, 7364–7373. [Google Scholar] [CrossRef] [Scilit] [PubMed]
- Xu, Y.; Wang, Z.J.; Qi, B.K.; Ran, A.Q.; Guo, Z.W.; Jiang, L.Z. Effect of Oxidation on Quality of Chiba Tofu Produced by Soy Isolate Protein When Subjected to Storage. Foods 2020, 9, 1877. [Google Scholar] [CrossRef] [Scilit] [PubMed]
- Jiang, Q.H.; Zhao, L.Z.; Li, H.Q.; Bu, Y.F. Research on quality changes and spoilage mechanism of leisure soybean food during storage. Food Mach. 2015, 31, 116–119. [Google Scholar]
- Zeng, J.A.; Zhou, X.H.; Liu, Y.; Wei, B.; Diao, X.R.; Chen, J.; Sun, S.H.; Li, X.J.; Zhang, X.J.; Zhou, X.J.; et al. Metal-Phenolic Networks Delay the Oxidation of Alkaline High-Protein Gel Foods: Improving the Quality of Coated Tofu. Gels 2026, 12, 383. [Google Scholar] [CrossRef] [Scilit] [PubMed]
- Wang, W.; Zhao, W.Q.; Tian, Y.; He, L.C.; Chen, Y.Y. Shelf-life prediction model of Premna microphylla Turez jelly. Food Mach. 2024, 40, 94–102. [Google Scholar]
- Bu, Y.F.; Li, W.Q.; Xie, L.L.; Zhao, L.Z. Research on quality change of leisure dried Tofu during storage. Food Mach. 2016, 32, 115–118. [Google Scholar]
- Yang, T.L.; Qu, Z.H.; Bian, Y.Q.; Yue, D.H.; Zhang, Y.F.; Chen, G.Y.; Li, S.H.; Chen, Y. Effect of dielectric barrier discharge cold plasma on the thin sheet of bean curd during storage: Improve the physical properties, flavor composition, and microbial safety. J. Food Sci. 2025, 90, e70182. [Google Scholar] [CrossRef] [Scilit] [PubMed]
- Tarlak, F.; Ozdemir, M.; Melikoglu, M. Predictive modelling for the growth kinetics of Pseudomonas spp. on button mushroom (Agaricus bisporus) under isothermal and non-isothermal conditions. Food Res. Int. 2020, 130, 108912. [Google Scholar] [CrossRef] [Scilit] [PubMed]
- Hussein, A.; Possas, A.; Hassanien, A.A.; Shaker, E.M.; Valero, A. Assessing Listeria monocytogenes growth kinetics in rice pudding at different storage temperatures. Int. J. Food Microbiol. 2023, 404, 110346. [Google Scholar] [CrossRef] [Scilit] [PubMed]
- Belarbi, H.; Algoet, V.; Neri, J.; Kebede, F.; dos Reis, A.R.; Sun, G.X.; van de Wiele, N.; Cakmak, I.; Laing, G.D. Machine learning-driven smart colorimetric sensor arrays for food freshness monitoring: Advances, challenges, and future prospects. Food Chem. 2026, 525, 150400. [Google Scholar] [CrossRef] [Scilit] [PubMed]

Disclaimer/Publisher’s Note: The statements, opinions and data contained in all publications are solely those of the individual author(s) and contributor(s) and not of MDPI and/or the editor(s). MDPI and/or the editor(s) disclaim responsibility for any injury to people or property resulting from any ideas, methods, instructions or products referred to in the content. |
© 2026 by the authors. Licensee MDPI, Basel, Switzerland. This article is an open access article distributed under the terms and conditions of the Creative Commons Attribution (CC BY) license.