


Abstract
The optical response of skin tissue in the near-ultraviolet to short-wave infrared band (350–2350 nm) contains rich physiological information such as hemodynamics, hydration status, and lipid metabolism. However, due to limitations in detector technology, conventional spectroscopic systems often use a single type of detector: silicon-based CCD (effective wavelength ≤ 1100 nm) captures visible blood features but cannot cover the long-wave vibration bands of water/lipids, while InGaAs (effective wavelength ≥ 900 nm) is sensitive to long-wave water/lipid absorption but misses the strong blood absorption in the visible region. This spectral detector segmentation leads to a separation of blood features from tissue background signals. In addition, traditional single source-probe distance measurement only probes one depth and cannot observe tissue information at different depths by varying the source-probe distance. This study employs a dual-spectrometer splicing architecture to achieve seamless continuous spectral measurement across 350–2350 nm by amplitude registration and normalization in the overlapping region. Using the thumb, palm, and arm as representative sites, we systematically analyzed spectral differences under varying vascular densities and fat backgrounds and successfully extracted absorption features of major chromophores including blood, water, and lipids. The results showed that the dual-spectrometer splicing method achieved smooth transitions in the overlapping region across different sites, validating its reliability. Spectral differences across sites were mainly characterized by hemoglobin absorption features in the visible region and water/lipid vibrational absorption features in the short-wave infrared region. These findings demonstrate the feasibility of dual-spectrometer splicing for broadband tissue spectral acquisition, enabling simultaneous capture of multi-component signals, and providing a new technical approach for non-invasive tissue composition analysis.
1. Introduction
Spectral technology has been widely used in the field of biomedical engineering because of its noninvasive, rapid and informative characteristics [1]. When light interacts with biological tissues, absorption, scattering and reflection occur; the absorption spectrum carries quantitative information about histochemical composition, while the scattering spectrum reflects microstructural characteristics [2]. Skin is the largest and most superficial organ of the human body, and its optical properties are determined by melanin in the epidermis, blood components (oxygenated and deoxyhemoglobin) in the dermis, and water and lipids distributed in all layers [3]. In the past few decades, diffuse reflectance spectroscopy and related spectral imaging technology have been widely used in noninvasive skin assessment, from the diagnosis of pigmented lesions to hemodynamic monitoring, and some of these technologies have been translated into clinical practice [4,5].
The optical properties of skin exhibit a strong wavelength dependence, which has been extensively studied using both theoretical models and experimental measurements. In the visible light region (400–700 nm), melanin and hemoglobin are the main absorbers, controlling skin color and erythema [3,4]. The spatially resolved diffuse reflectance distribution observed in this region can be quantitatively explained by diffusion theoretical models. For in vivo tissue data analysis, a reflectance-based model is typically employed. For thin ex vivo tissue samples (e.g., measured using an integrating sphere), both reflectance and transmission data are required to inversely derive the absorption and scattering coefficients [6]. However, the applicability of diffusion models is limited at shorter visible wavelengths (e.g., <600 nm), particularly in darker skin tissues, where the diffusion approximation may become invalid due to enhanced absorption and increased scattering anisotropy. In the near-infrared region (700–1000 nm), the absorption of hemoglobin decreases significantly, and tissue scattering becomes dominant, forming a well-known “optical window” in biomedical optics [7,8]. Entering the short-wavelength infrared region (1000–2500 nm), the vibrational absorption of water molecules and lipid molecules (such as the first-order frequency doubling of O–H bonds and the stretching vibration of C–H bonds) began to dominate the spectral shape [9]. Accurate prediction of light propagation and photon transport in multilayer skin structures requires Monte Carlo modeling techniques, which have been widely validated by experimental measurements in tissue simulators [10]. Understanding the absorption and scattering properties of these chromophores, as well as their distribution with depth, is the basis of optical skin characterization and noninvasive diagnosis. In recent years, short-wavelength infrared spectroscopy and imaging technology have developed rapidly in biological tissue characterization, with lower scattering loss and stronger water/lipid contrast, thus opening up new possibilities for deep tissue analysis [11,12].
In fact, the absorption characteristics of blood are not limited to the visible light region: oxyhemoglobin shows strong absorption in the Soret band and Q band of the visible light region, while there are also weak absorption bands in the near-infrared region [13]. Deoxyhemoglobin has a characteristic peak near 760 nm, which constitutes the physical basis of pulse oximetry [14]. However, the measured diffuse reflectance spectrum is a composite signal, in which the absorption contributions of blood, water and lipids are intertwined. Accurate separation of these chromophore-specific signals requires accurate determination of wavelength-dependent absorption and reduced scattering coefficients by inverse reconstruction based on an appropriate light transmission model [15,16]. Accordingly, it has high academic value and application potential to build a set of spectral system with continuous coverage from visible light to short-wave infrared, and simultaneously obtain complete information of blood components and tissue background under the same measurement conditions. In recent years, studies have reported the systematic measurement of the full spectrum absorption characteristics of common chromophores in the visible light to short-wavelength infrared range, and established a biological absorption spectrum database spanning the visible light to near-infrared region [17], which provides an important reference for similar work in this study.
At present, tissue spectroscopy systems are mainly divided into two categories due to the limitation of detector technology. One uses silicon-based CCD (charge coupled device) detectors, which usually cover the range of 200–1100 nm [18]; the short-wave cutoff of common models is 350–400 nm, and the long-wave cutoff is 1000–1100 nm. This range can clearly distinguish the characteristic absorption peaks of oxygenated and deoxyhemoglobin in the visible region, but it cannot capture the long-wave vibration bands of water and lipids, nor can it obtain the molecular vibration absorption above 1100 nm. The other type uses InGaAs (indium gallium arsenic) array detectors, which usually cover 900–1700 nm, and some high-end models can be extended to 2500 nm [19]. This range is highly sensitive to water vibration absorption and lipid C–H bond absorption [9,19], but it cannot directly detect the visible light intensity absorption of blood. A few commercial systems (such as ASD FieldSpec Series) have achieved full coverage of 350–2500 nm through double detector splicing. However, these systems were originally designed for remote sensing or material analysis. When applied to skin tissue measurement, they still face challenges in spectral splicing accuracy, probe depth control, and discrimination between blood signals and water/lipid background [20]. Therefore, integrating silicon detectors and InGaAs detectors into one instrument is a practical technical route to achieve wide spectral coverage [21].
In the diffuse reflectance spectrum, the average penetration depth of photons is positively correlated with the light-source probe distance [22]. In diffuse reflectance, a larger source–detector distance corresponds to a longer photon path, so detected photons have sampled deeper tissue layers. However, this trend does not continue indefinitely. Beyond a certain distance, the signal drops sharply due to absorption and scattering losses, making the SNR too low for reliable detection. In practice, the penetration depth gain saturates, especially in the strong water absorption bands beyond 1400 nm. Therefore, the choice of source–detector distance is always a trade-off between depth sensitivity and signal strength. When the distance between the light source and probe is small, the detected photons are mainly confined to the superficial dermis; as the distance increases, photons can penetrate deeper dermis or even subcutaneous tissue, thereby enhancing the signal weight from the deep blood and fat layers. In addition to single point spectral measurements, diffuse reflectance spectroscopy has been extended to assess skin hydration status and sensation, demonstrating the potential of multi parameter spectral analysis for comprehensive skin characterization [23]. Monte Carlo simulation has been widely used to optimize the light-source probe distance design and verify the prediction of diffusion theory for the evaluation of optical properties of shallow skin [10,24,25]. The basic principle of photon migration in turbid media is comprehensively described in biomedical optics textbooks [26], and time-domain diffuse reflectance spectroscopy can obtain depth information by measuring photon flight time [27]. However, the complexity and cost of the time-domain scheme is much higher than that of the spatially resolved configuration.
In addition, there are significant differences in the optical properties of skin between different anatomic sites, which are due to the different tissue structures [3]. The photothermal response of laser-irradiated tissue is determined by wavelength-dependent absorption and scattering properties, which highlights the necessity of characterizing the optical behavior of specific sites for therapeutic and diagnostic applications [28]. In addition, optical transparency technology, which reduces tissue scattering by controlling refractive index mismatch, also revealed how structural heterogeneity, including stratum corneum thickness and dermal composition, regulates light penetration and signal interpretation [29]. Skin thickness, vascular density, fat content and stratum corneum structure vary greatly in different body parts [30]. For example, the cuticle of the palm is thicker, intermediate between the thumb and arm, reflecting the structural gradient between these anatomic locations. The fingertip (thumb) has a dense capillary network, rich blood supply and thin cuticle, with almost no fat layer. It is one of the best skin sites for noninvasive optical measurement [4]. In contrast, the arm has a thicker subcutaneous fat layer, lower vascular density, and more obvious water signal, which has been widely used for water/lipid analysis [19]. A comprehensive review on the optical properties of biological tissues provides a fundamental understanding for interpreting these site-dependent spectral changes [31]. These differences provide an ideal experimental scenario for verifying the sensitivity of the broadband spectral system to distinguish different tissue components.
Based on the above considerations, two spectrometers were selected in this study, covering 350–1000 nm (silicon-based CCD) and 900–2350 nm (extended InGaAs), respectively. Through median alignment in the overlapping region (about 900–1000 nm), seamless continuous spectral output was achieved. At the same time, three kinds of optical-fiber light-source probe distances (spacing 220 μm) were designed. By measuring the spectra of the thumb, palm and arm, the expression patterns of absorption characteristics under different tissue backgrounds were analyzed, and the influence of light-source probe distance change on the sensitivity of deep tissue components was investigated. This work shows the feasibility of cross-band continuous spectroscopy combined with variable light-source probe distance, and is expected to provide new technical ideas for noninvasive quantitative analysis of blood glucose, blood oxygen and tissue components.
2. Materials and Methods
2.1. Experimental Device
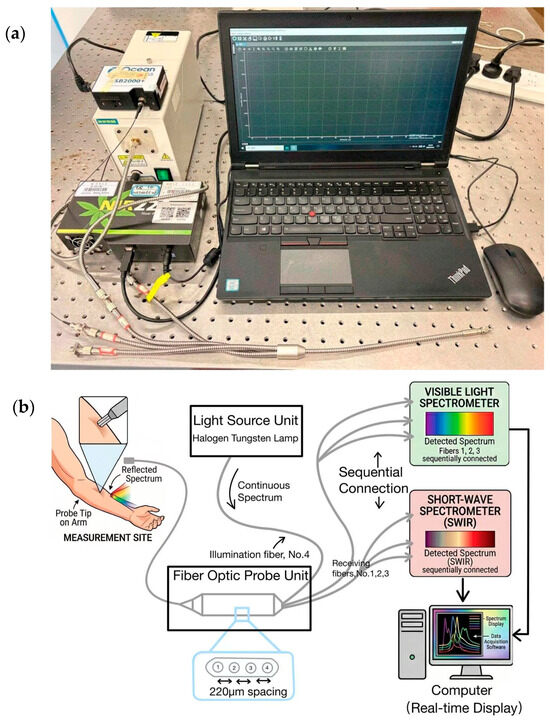
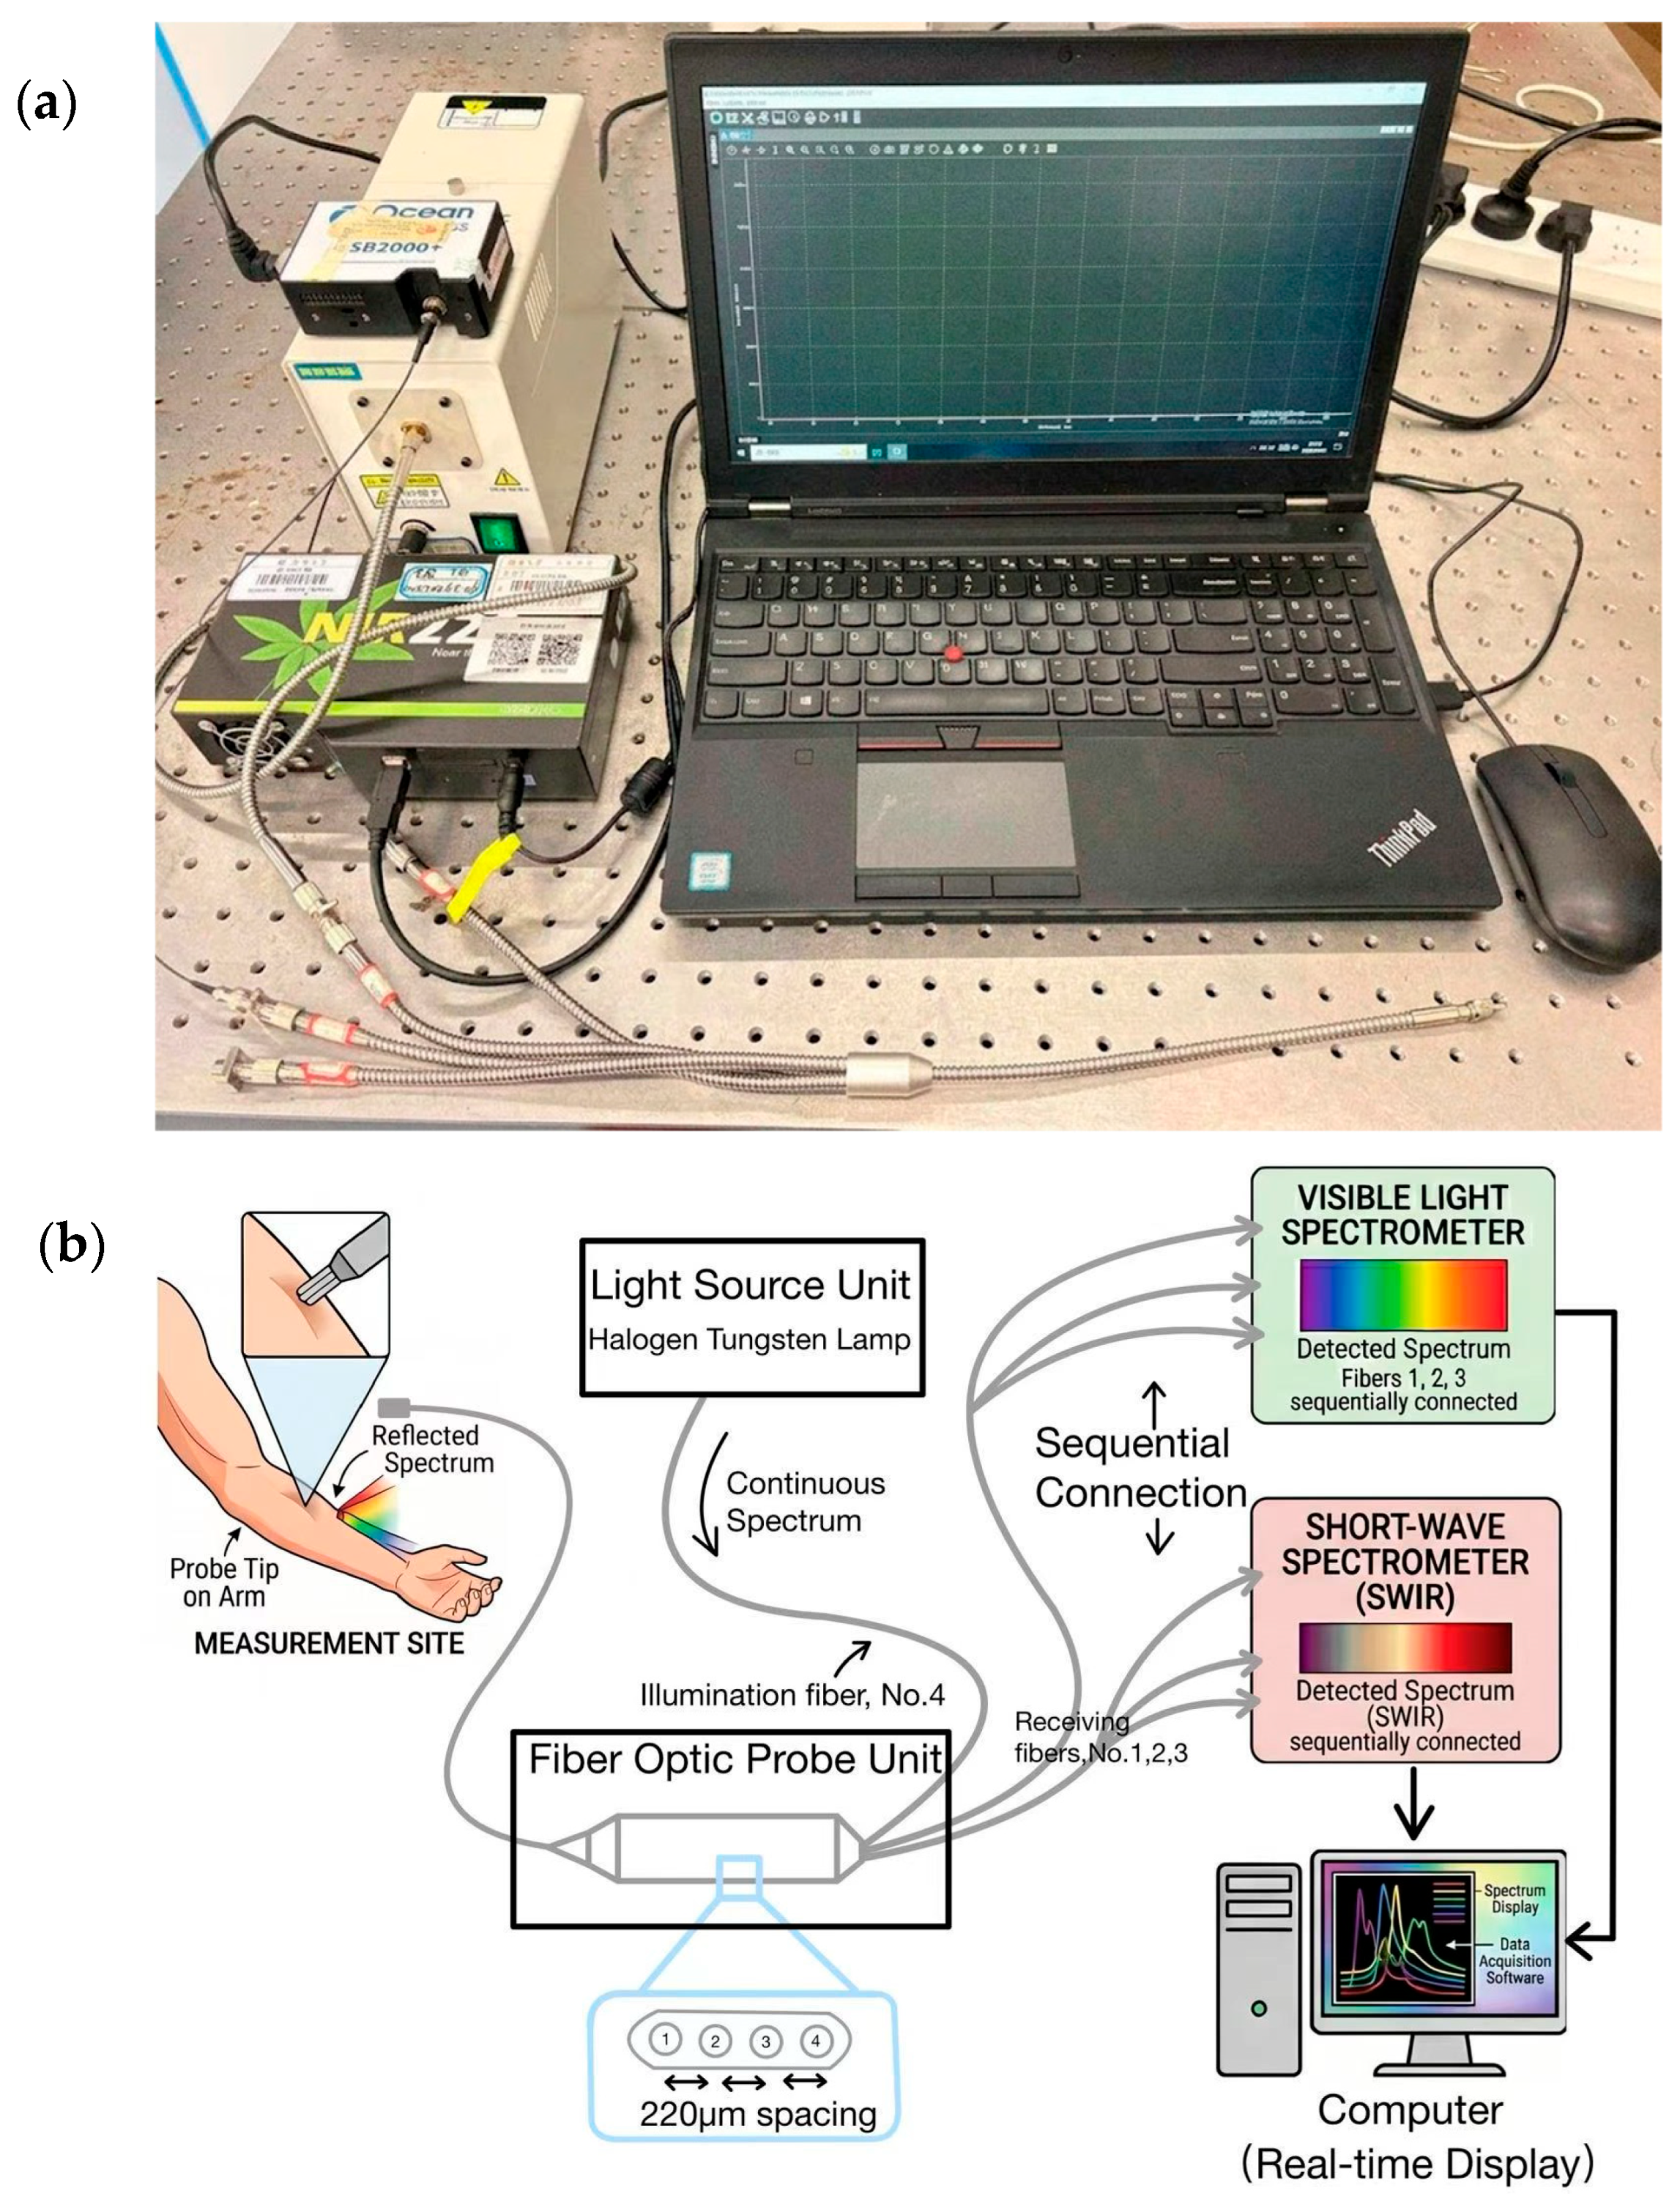
The experimental system primarily consists of a light source, an optical fiber probe, and two spectrometers (Figure 1). Figure 1a presents a photograph of the experimental setup, while Figure 1b shows the corresponding optical path and hardware connection diagram. The system employs a dual-side optical fiber bundle design: the probe end integrates four optical fibers, with one serving as the illumination fiber (No. 4) and the other three as receiving fibers (No. 1, No. 2, and No. 3) for measuring the target areas of volunteers; the instrument end connects to the light source and spectrometers. The light source uses a halogen tungsten lamp, delivering continuous white light through fiber No. 4.
Figure 1.
Experimental setup of the multi-source-distance spectroscopy system. (a) Photograph of the actual device; (b) schematic diagram of the fiber-optic probe and spectrometer configuration.
The three receiving fibers were manually plugged into the visible or SWIR spectrometer one at a time. This means measurements at different distances were taken sequentially, not simultaneously. The fiber spacing is 220 μm (center-to-center). Unlike commercial systems such as the ASD FieldSpec, which use fixed internal beam-splitting, our external switching design is simpler and more flexible. We can pair any receiving fiber with either spectrometer and change the setup without modifying the hardware. This gives us both multi-distance and broad-band capability at low cost. The system employs two spectrometers: a visible spectrometer (Ocean USB2000+ VIS-NIR, wavelength range 350–1000 nm, optical resolution 1.5 nm) and a short-wave infrared spectrometer (ideaoptics NIR20S, wavelength range 900–1900 nm, optical resolution 4.7 nm). The spectrometers are connected to a computer, which displays the collected spectra in real time.
2.2. Subjects and Measurement Sites
The experiment selected three parts for measurement: the thumb pulp (i.e., the central raised area of the distal phalanx of the thumb), the central area of the palm, and the inner side of the arm. Each part was measured with No. 1, No. 2 and No. 3 optical fibers in turn, and each group of measurements was repeated three times to take the average. During the measurement process, the contact pressure between the probe and the skin was kept consistent to avoid blood flow changes caused by pressure variations. All measurements were completed at room temperature, and the subject began to measure after sitting for 10 min to eliminate the immediate effect of activity on blood flow. All 14 volunteers were of Asian Han ethnicity, with Fitzpatrick skin types III–IV (ranging from light to medium skin tones). No individuals with dark skin (types V–VI) were included. The study was approved by the Ethics Committee of Hainan Medical College for preliminary experiments on clinical testing. All volunteers were informed of the experimental procedures and provided consent prior to measurement.
2.3. Data Acquisition Process
Each part was collected in the following order:
- ➀
- : Turn off the light source, collect the signal that the probe has not contacted any object, and deduct the environmental noise and dark current of the detector.
- ➁
- : The light source is turned on, the probe is vertically aligned with the standard white board (made of polytetrafluoroethylene (PTFE) with a nominal reflectance > 99%; Labsphere SRS-99 series), and the maximum diffuse reflection signal is collected.
- ➂
- : When the light source is turned on, the probe vertically contacts the skin with the same pressure to collect the diffuse reflection signal.
- ➃
- The measurements were repeated at least three times for each part, and the average value was used for subsequent analysis to reduce the contact pressure and position deviation.
2.4. Data Processing and Spectrum Splicing
2.4.1. Calculation of Relative Diffuse Reflectance
The relative diffuse reflectance of each wavelength λ is calculated according to the following formula:
is the skin measurement signal, is the standard white board reference signal, and is the dark background signal. All signals are intensity values (in counts) at the same wavelength. This ratio is dimensionless and represents the relative reflectance of the tissue with respect to the standard white board.
This ratio is dimensionless and represents the relative reflectance of the tissue with respect to the standard white board. Under normal measurement conditions, the relative reflectance falls within the range of 0 to 1 [3,15,32]. In our dataset, the vast majority of wavelength points (350–2100 nm) fall within this normal range. Reflectance values exceeding 1 are only observed in the 2100–2350 nm range, which is the extreme long-wave end where the spectrometer’s quantum efficiency drops sharply and both the reference and skin signals approach the noise floor, making their ratio unstable. This only occurs in this noisy long-wave region and does not affect our analysis, which focuses on relative absorption dip depths and spectral shapes in the 350–2100 nm range rather than relative reflectance values in the 2100–2350 nm region.
2.4.2. Spectrum Splicing
The splicing steps are as follows:
- The median values of the short-wave spectrum (350–1000 nm) and long-wave spectrum (900–2350 nm) in the overlapping region of 900–1000 nm were calculated, respectively;
- Calculate the offset factor: offset = median (short-wave spectrum in overlap region) − median (long-wave spectrum in overlap region);
- Align the whole long-wave spectrum with offset;
- Keep short-wave data in the overlapping area (or take the average of the two, and keep short-wave in this paper). We kept the short-wave data in the overlap region instead of averaging both. The short-wave spectrometer has better SNR and stability in this range. Averaging would not improve the data; it would only pull the good data down. In rare cases (<1%) in which the short-wave reading was saturated or noisy, we used the average as a fallback.
The overlap region (900–1000 nm) was selected because both spectrometers maintain a sufficient signal-to-noise ratio in this range, and it is sufficiently wide (100 nm) to provide a robust statistical basis for median-based alignment.
- 5.
- Combined to generate 350–2350 nm continuous spectra;
- 6.
- In the resulting part, the overlapping region (880–1020 nm) was locally magnified to visually inspect the spectral continuity across the stitching point, providing a qualitative assessment of the splicing quality.
2.5. Data Analysis Methods
The analysis of spectral data primarily includes three aspects: single-subject spectral decomposition, source–detector distance comparison, and population heterogeneity assessment. First, using a typical subject (Subject W) as an example, short-wave (350–1000 nm) and long-wave (900–2350 nm) diffuse reflectance spectra of the thumb, palm, and arm were plotted. By comparing the features with standard absorption spectra of oxyhemoglobin, deoxyhemoglobin, water, and lipids, the dominant absorption mechanisms and regional differences across various bands were identified. Second, the full-band spectra under three source–detector distances (220, 440, 660 μm) were compared to examine how changing the source–detector distance affects different absorption bands (strong hemoglobin absorption zone, strong water absorption zone, and lipid absorption zone). Local magnification plots of the overlapping region (880–1020 nm) were used to verify the spectral stitching quality and consistency under multiple source–detector distances. Finally, reflectance spectra from three body regions of 14 subjects were aggregated statistically, calculating the mean spectra and standard deviations (Mean ± SD) for each region. This analysis of individual variation characteristics across anatomical sites provided a basis for establishing subsequent stratified calibration models.
Peak-to-valley ratios were calculated as the reflectance at the designated peak wavelength divided by the reflectance at the corresponding valley wavelength. Measurements obtained using fibers 3, 2, and 1 were assigned to source–detector separations of 220, 440, and 660 μm, respectively. Because the three measurements were obtained from the same volunteers, source–detector separation was analyzed as a within-subject factor. One-way repeated-measures ANOVA and Friedman tests were performed separately for each anatomical site and spectral feature. Linear within-subject slopes, paired effect sizes, and 95% confidence intervals were also calculated to distinguish general distance-related differences from monotonic distance trends.
3. Results
3.1. Multi-Site Spectral Fingerprint of Single Subject: Hemoglobin Q-Band in Visible Near-Infrared Region and Water Lipid Vibration Band in Short-Wave Infrared Region
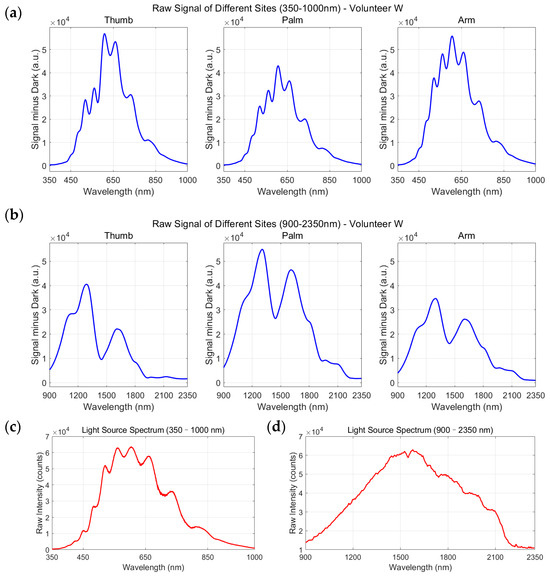
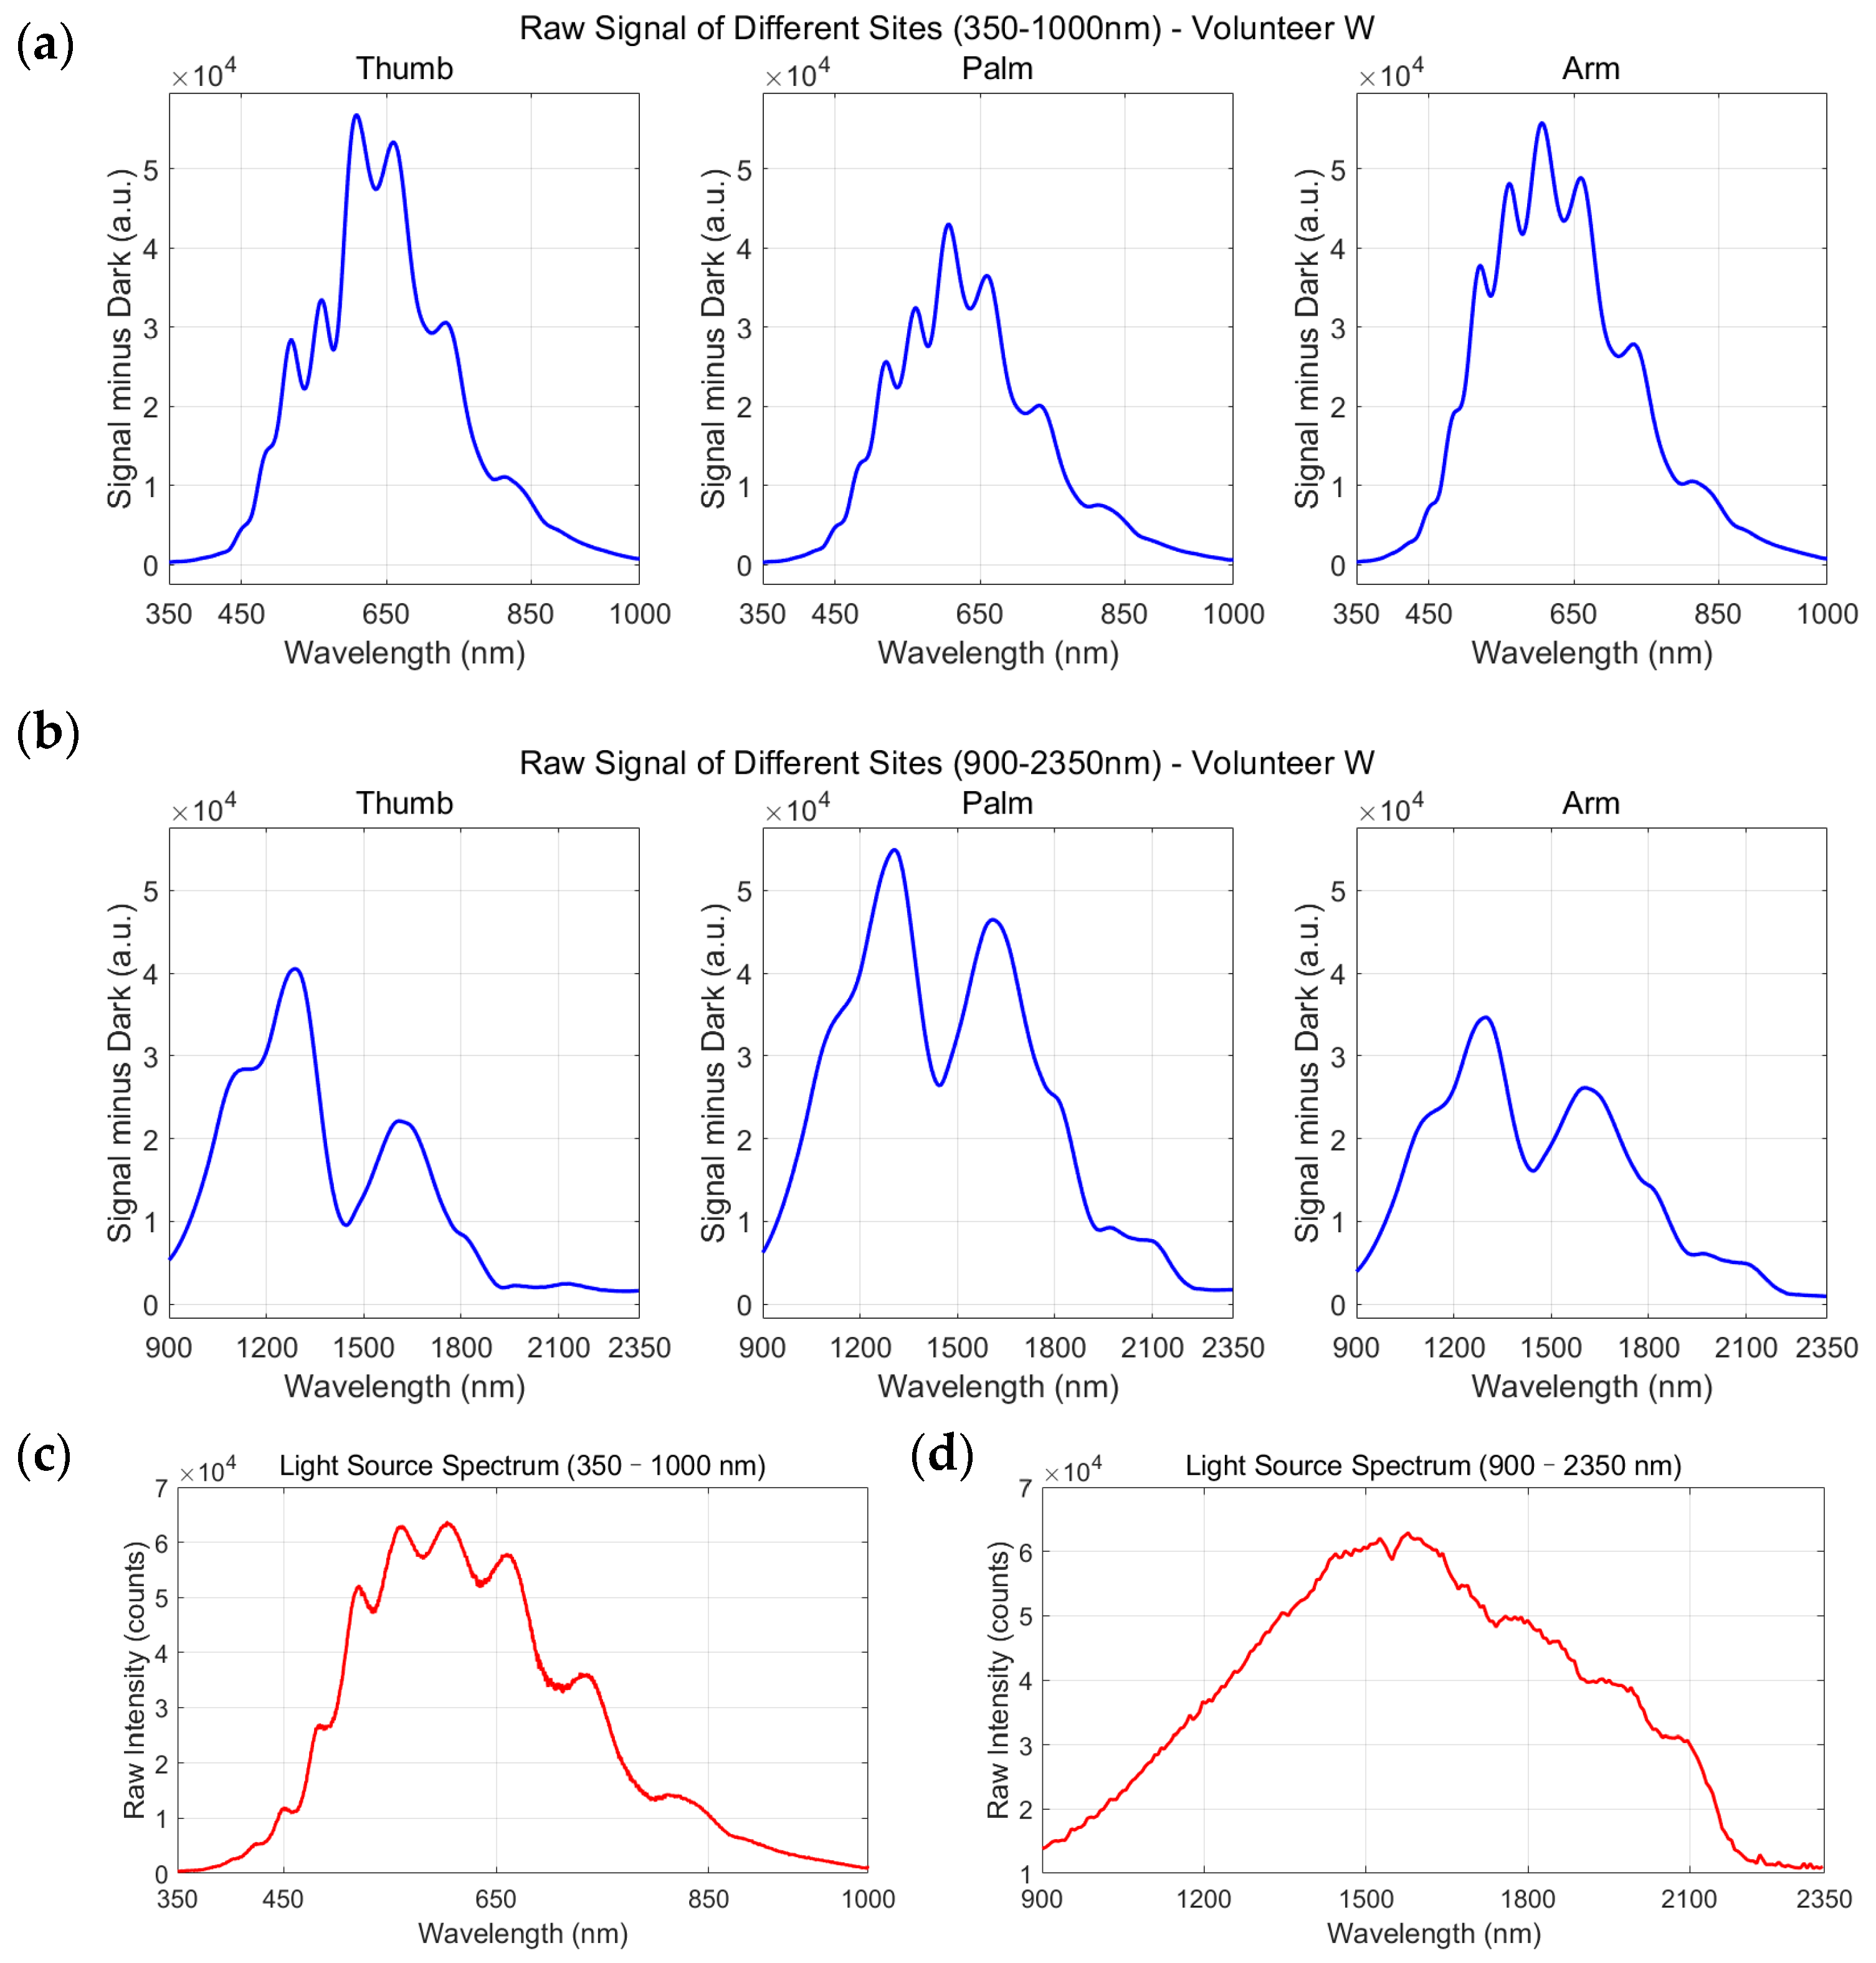
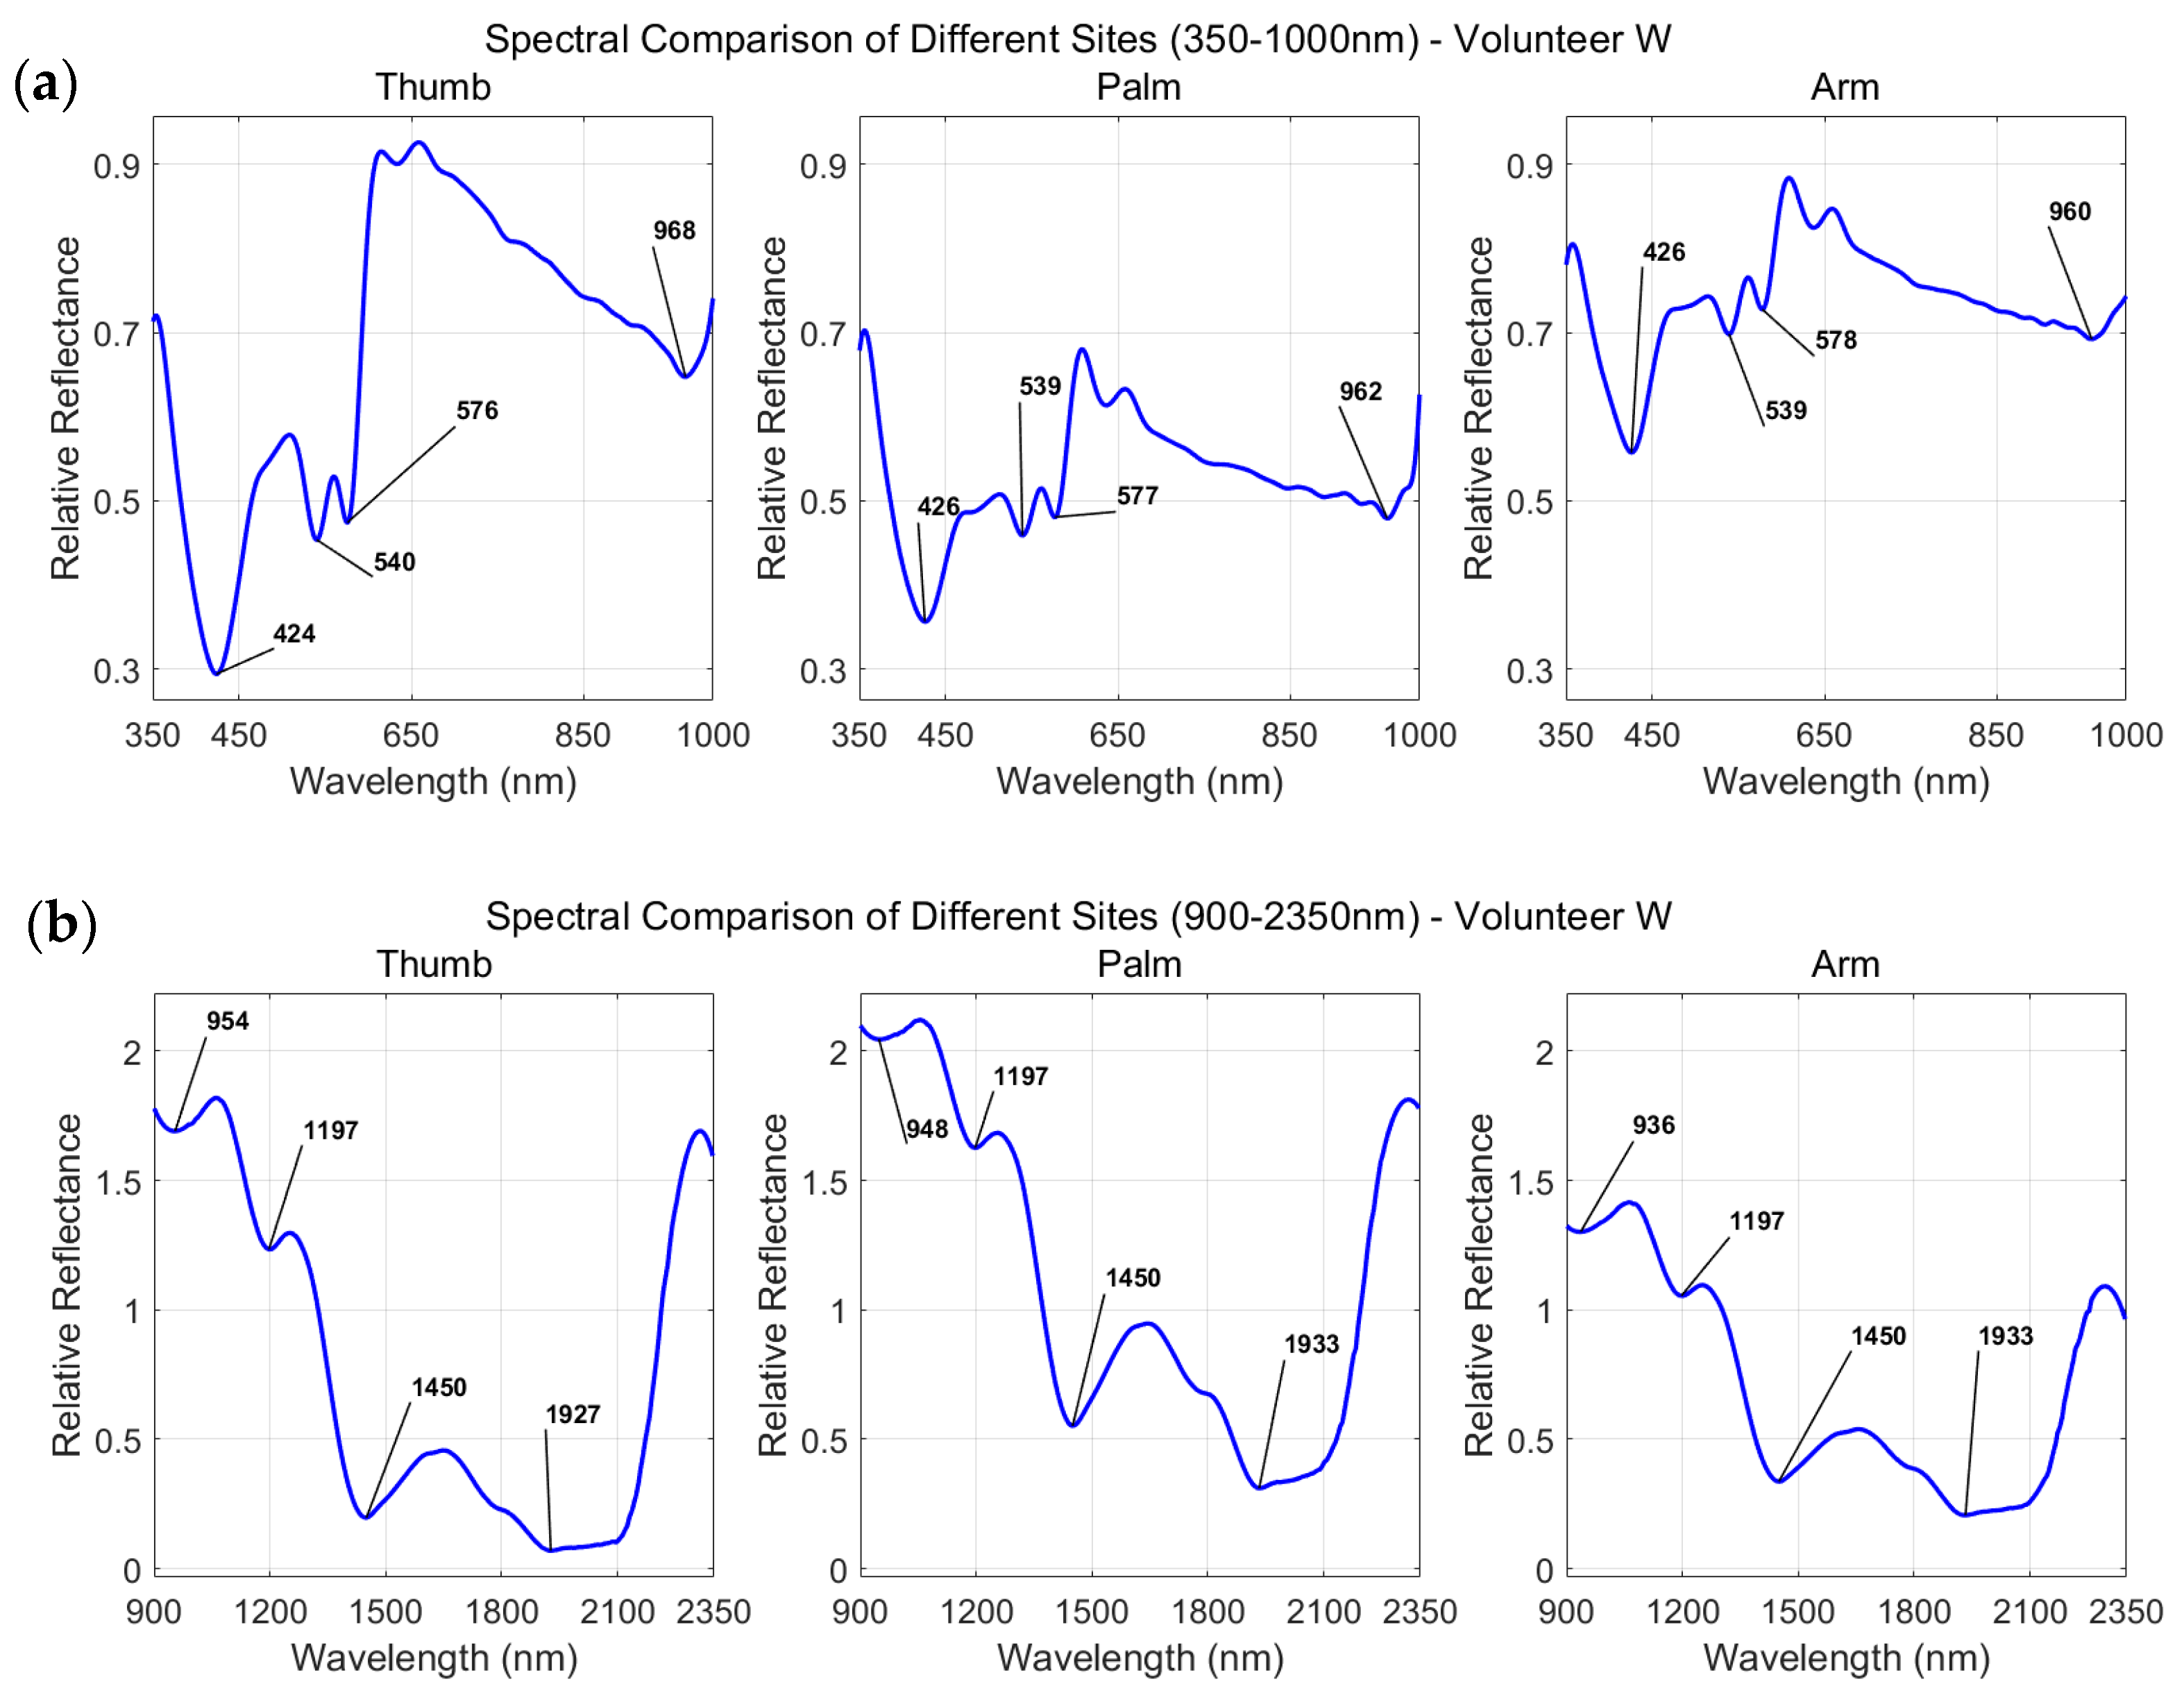
In order to explore the differences in the optical properties of different anatomical parts over a wide spectral range, the absolute diffuse reflectance spectra of subject W in the thumb, palm and arm were collected in this study. As shown in Figure 2, the spectral data are divided into short wave (350–1000 nm) and long wave (900–2350 nm) for display. Figure 2a (short band) clearly reveals the characteristic spectral fingerprint of hemoglobin; in particular, within the 400–600 nm range, the thumb exhibits a pronounced reflectance dip, consistent with its dense superficial microvascular network. In contrast, due to the thicker stratum corneum and deeper vascular distribution, the overall reflection intensity of the palm is high and the absorption characteristics are relatively gentle.
Figure 2.
The absolute reflectance spectra and light source spectra of subject W at different body parts (thumb, palm, arm): (a) short-band (350–1000 nm) absolute reflectance spectra; (b) long-band (900–2350 nm) absolute reflection spectrum; (c) short-band light source spectrum; (d) long-band light source spectrum. (The data shown correspond to the nearest receiving fiber, with a source–detector distance of 220 μm).
Figure 2b (long band) highlights the water and lipid vibrational bands in the short-wavelength infrared region. The strong absorption peaks around 1450 nm and 1940 nm were mainly dominated by the first-order octave and combined frequency of tissue water, and the signals were significant and stable among different parts. In the observation of lipid absorption characteristics, the spectrum shows obvious band dependence: the second-order frequency-doubling absorption band of the C-H bond located near 1210 nm exhibits a clearly resolved absorption dip; meanwhile, in the 1700–1760 nm range, a weaker but observable reflectivity depression caused by the first-order frequency doubling and combined frequency of the C-H bond can also be identified. The 1210 nm feature is more prominent than the 1717 nm feature under our current measurement conditions. This lipid feature is most evident in the arm, but more faint in the thumb and palm, consistent with the differences in subcutaneous fat layer thickness and epidermal scattering characteristics across sites.
To eliminate systematic errors and ensure that the above spectral features are derived from the tissue itself rather than instrument artifacts, Figure 2b and Figure 2d respectively show the synchronously collected light source reference spectra. Figure 2c corresponds to the short band light source output, which maintains high intensity and flat radiation characteristics in the visible region, ensuring the high signal-to-noise ratio acquisition of the hemoglobin Q band; Figure 2d corresponds to the output of the long-band light source. Its spectral profile shows that the light source near 1200 nm still maintains sufficient and stable radiation flux without obvious attenuation, which further confirms that the invisibility of the lipid signal at 1200 nm is the result of the joint action of tissue optical properties and molecular vibration intensity, rather than the system limitation. In contrast, the light source near 1700 nm also maintained an effective radiation output, making the weak lipid absorption there leave identifiable traces in the reflection spectrum. By comparing the absolute reflection spectrum with the light source reference, it can be confirmed that the observed hemoglobin absorption valley, the strong absorption peak of water and the weak lipid characteristics near 1700 nm are the true reflection of the inherent optical properties of tissues, which supports the reliability of multi-site spectral fingerprint acquisition and the consistency of spectral interpretation.
3.2. Multi-Distance Spectral Response of Single Subject: Full-Band Characterization and Splicing Verification
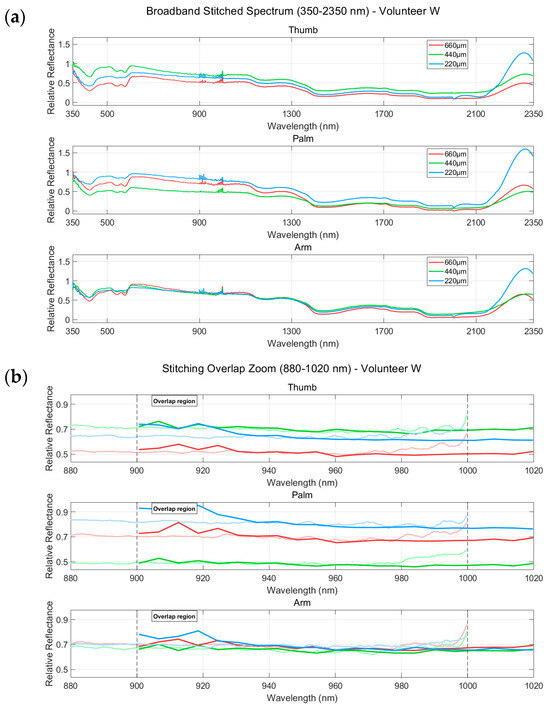
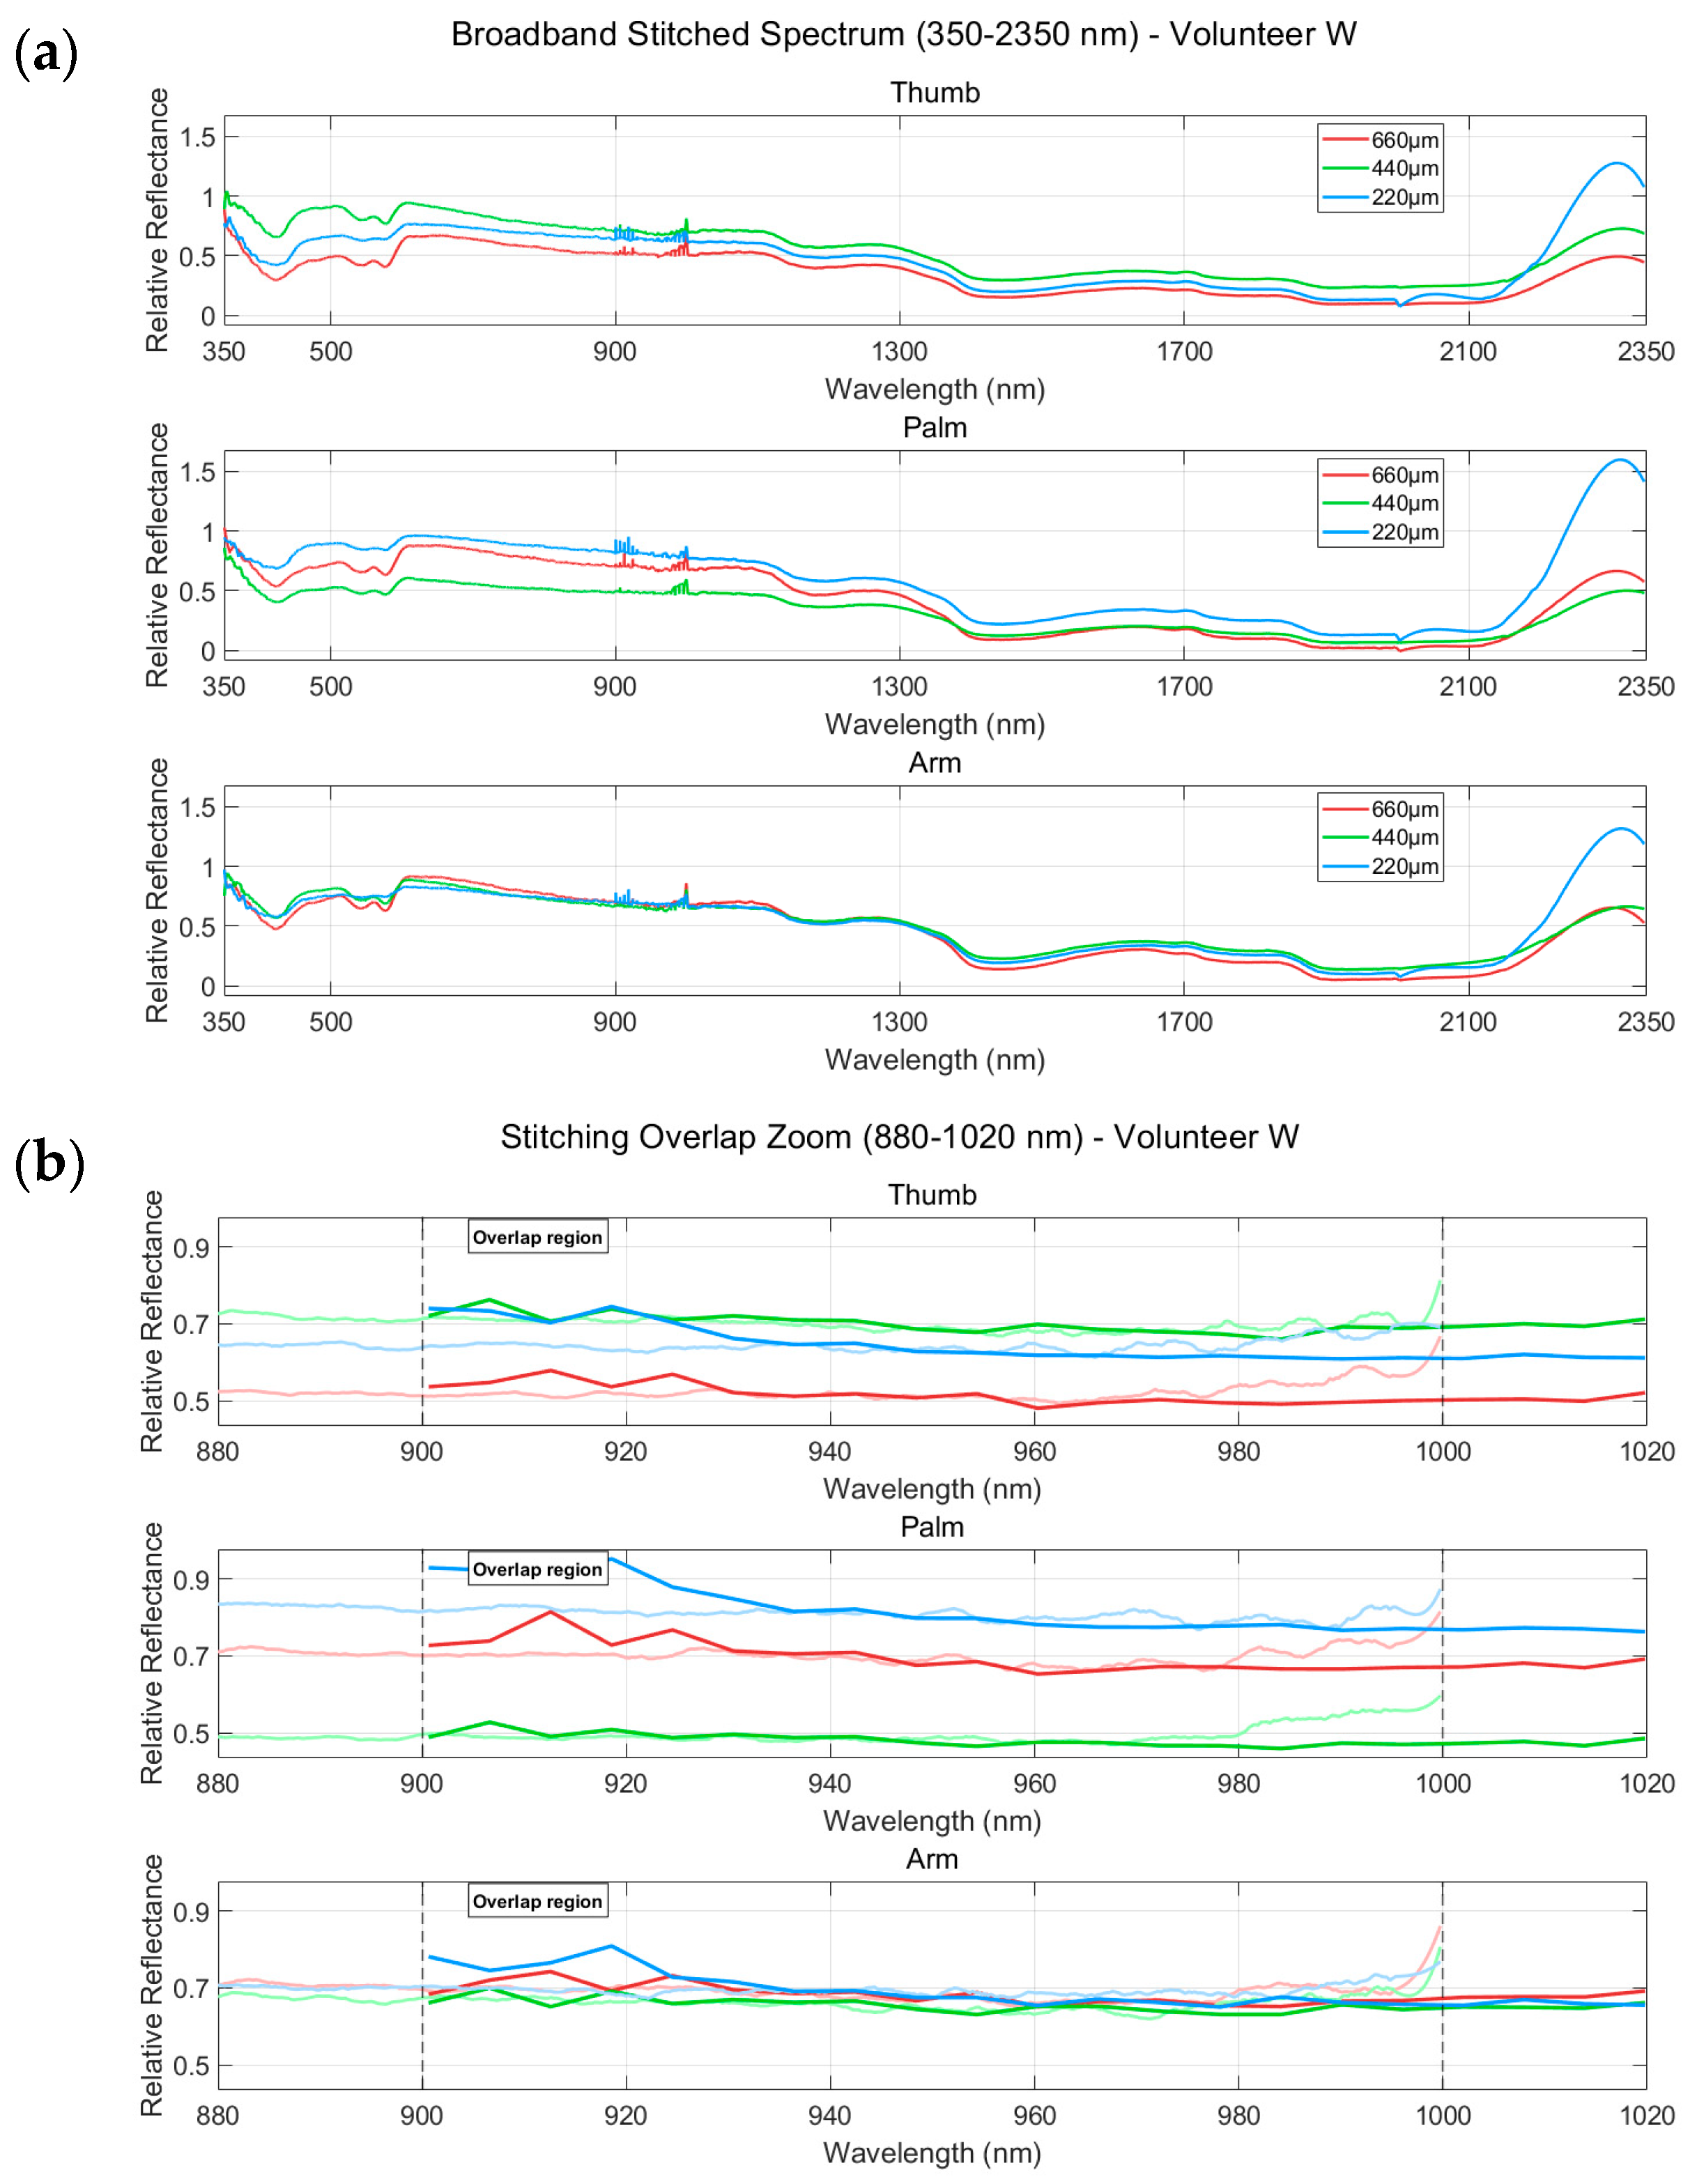
It should be noted that, because the three receiving fibers were measured sequentially by insertion and removal, with variations in contact pressure and coupling conditions each time, the absolute reflectance intensities at different distances are not directly comparable. This study therefore focuses on analyzing the relative dip depth of absorption peaks (ratios) as a function of source–detector distance. This ratio-based analysis reflects the cumulative absorption effect of specific components along the photon path length in tissue and is independent of absolute incident light intensity, thus effectively avoiding the intensity fluctuations introduced by the insertion/removal procedure.
In the short wavelength range (Figure 3a), as the source–detector distance increases, the photon penetration depth increases and the optical path length extends, leading to enhanced cumulative absorption by chromophores such as blood and water, manifested as deeper absorption dips. Specifically, in the strong hemoglobin-absorption region (500–600 nm) and the characteristic water-absorption valley (near 970 nm), the dip depths in the thumb and palm regions increase noticeably with increasing distance, indicating that the spectral contributions from blood and water in deeper tissues gain greater weight as the penetration depth increases. In the arm, because the subcutaneous fat layer is thick and the tissue structure is relatively uniform, the three spectral curves are highly overlapped in the full band range, and the difference in absorption valley depth between different distances is small, which may be related to the high scattering characteristics of the arm fat layer, leading to the convergence of photon path distribution.
Figure 3.
Multi-range reflectance spectral response and splicing verification for subject W at different body parts (thumb, palm, arm). (a) Distance-dependent spectral characteristics of full-band spectrum (350–2350 nm) measured at source–detector distances of 220 μm, 440 μm, and 660 μm (corresponding to receiving fibers No. 3, No. 2, and No. 1, respectively); (b) spectral consistency verification in the overlap region (880–1020 nm). Thin lines: short-wave spectrometer data; thick lines: long-wave spectrometer data after amplitude alignment. The dashed lines mark the overlap boundaries (900 nm and 1000 nm).
We observed that the spectra at 980 nm and 1020 nm remain largely unchanged across different source–detector distances. This suggests that in this wavelength window, the signal is mainly determined by the tissue itself, with little depth dependence. That said, we cannot fully exclude contributions from instrumental factors such as spectrometer sensitivity, integration time, or the lamp spectrum. Still, the fact that the consistency holds for all three distances supports our interpretation that tissue properties dominate at these wavelengths. This depth-insensitive characteristic allows the measured values of these two bands to serve as reference points for spectral calibration or for normalization processing to eliminate measurement bias caused by small differences in contact pressure or probe position, thereby improving the stability and comparability of spectral data.
Figure 3b highlights the spectral stitching validation results in the wide overlap region (880–1020 nm). At the overlap boundaries (marked by dashed lines), the spectral curves for each site show smooth transitions without noticeable jumps or discontinuities, confirming that the stitching between the short-wave and long-wave spectra is appropriate. The thumb, palm, and arm all maintain good continuity at their respective stitching points, demonstrating the reliability of the stitching method across different tissue backgrounds.
To quantitatively support this observation, we calculated the residual discontinuity at the stitching point (~950 nm), defined as the absolute reflectance difference between the short-wave and long-wave spectra after amplitude alignment, across all three anatomical sites and three source–detector distances. The results, show a mean residual discontinuity of 0.0061 ± 0.0045 (range: 0.0007 to 0.0129) across all nine measurements. This value is negligibly small—at least two orders of magnitude smaller than the typical reflectance signal level (~0.3–0.9) in the overlap region—confirming that the spectral curves transition smoothly across the stitching point without any visible jump. These quantitative results, together with the visual inspection in Figure 3b, demonstrate the reliability of the stitching method across different tissue backgrounds and source–detector distances.
3.3. Preliminary Study on Population Spectral Heterogeneity: Site Specificity and Individual Variation Stratification
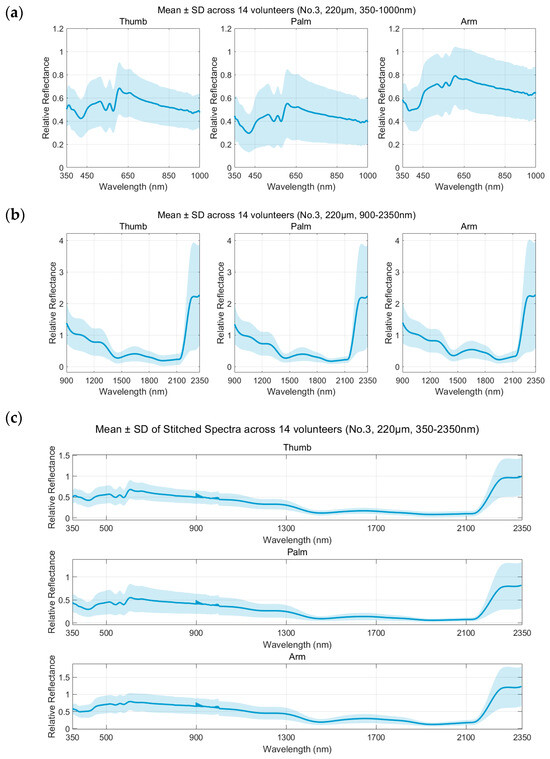
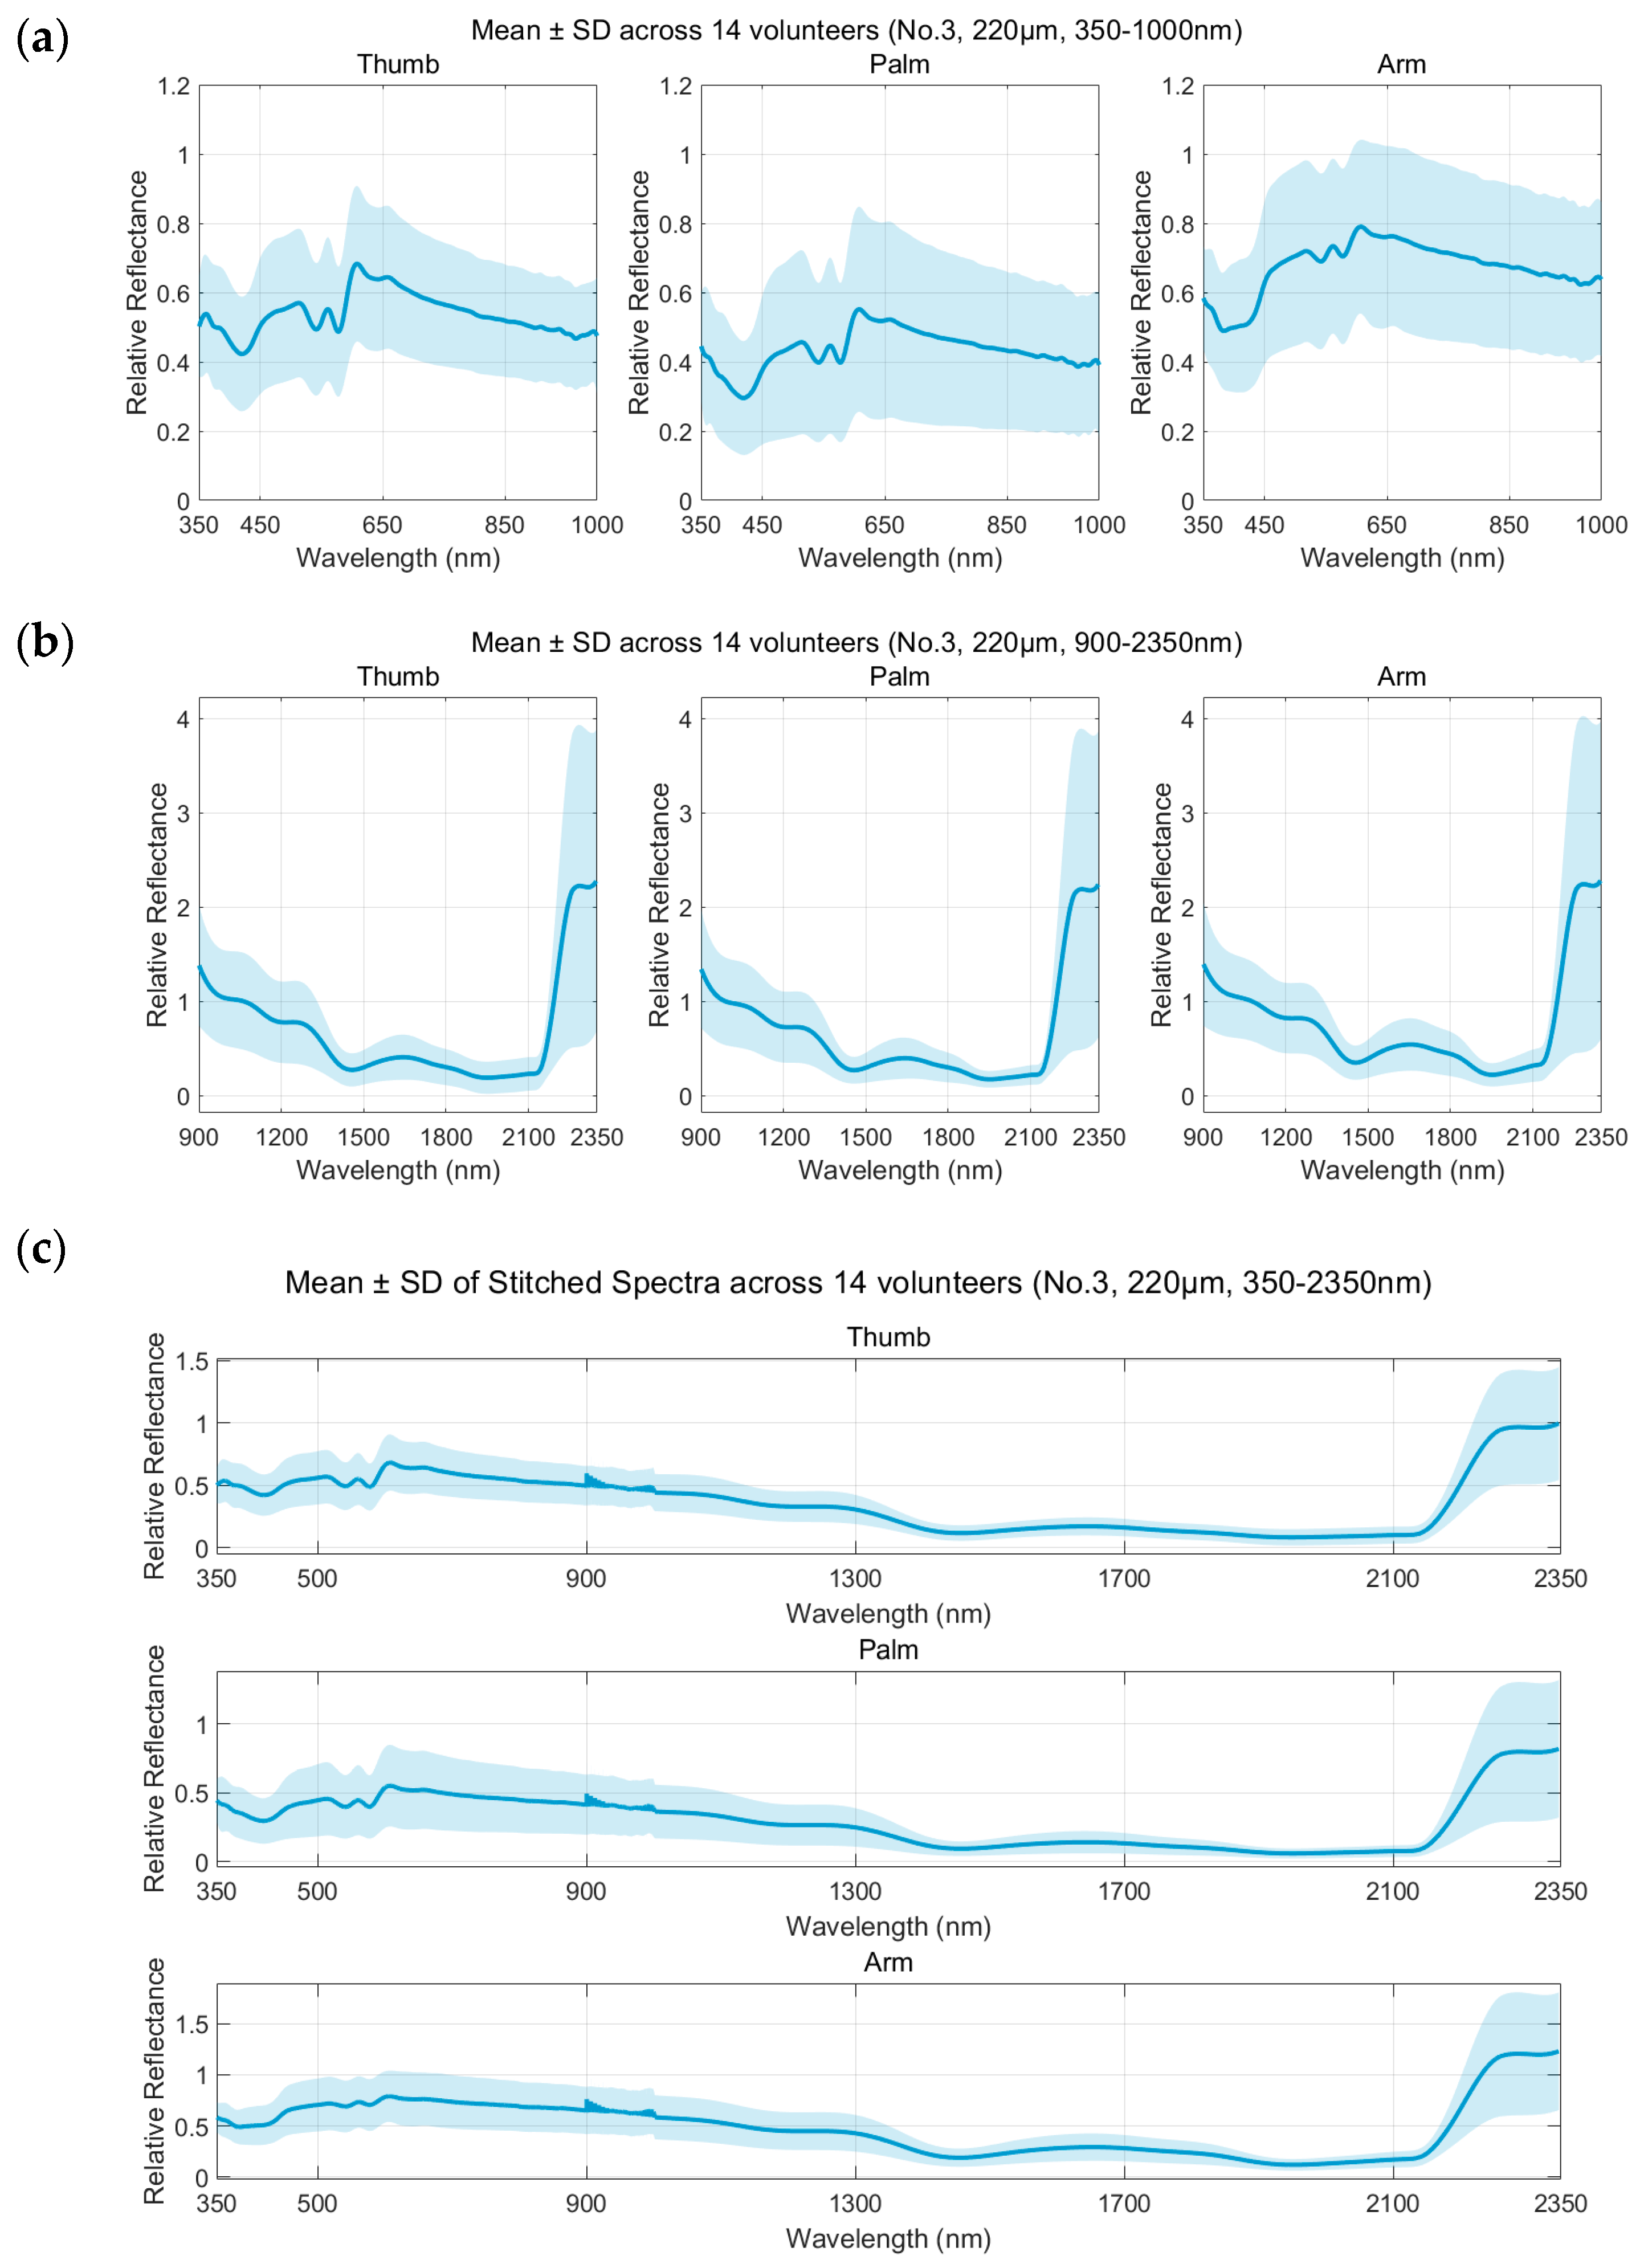
We averaged the reflectance spectra from all 14 subjects for each site (thumb, palm, arm), and plotted the mean ± SD in Figure 4. One thing to note here is that the rise in reflectance beyond 2100 nm is not real. It is an artifact caused by the SWIR detector sensitivity dropping off sharply in this range. Both the reference and sample signals are close to the noise floor, and their ratio becomes unstable. We address this again in the Discussion.
Figure 4.
Average reflectance spectrum distribution of different body parts (thumb, palm, arm) of 14 subjects (mean ± standard deviation). (a) Short band (350–1000 nm); (b) long band (900–2350 nm); (c) full band-splicing spectrum (350–2350 nm).
From the full-band concatenated spectrum (Figure 4c), although there are differences in skin pigmentation and microstructure among different subjects, all samples exhibit highly consistent characteristic absorption peaks. In the visible region (Figure 4a), the bimodal reflectance dips at 542 nm and 577 nm are prominent in the thumb and palm areas, with a narrow standard deviation range, suggesting that the fingertip region exhibits highly stable and reproducible spectral features across the population due to its abundant capillary network. In contrast, the reflectance of the arm in the visible light range is generally higher, and the curve is smoother, reflecting its relatively lower blood volume fraction.
In the short-wave infrared region (Figure 4b), the spectral features are dominated by the harmonic and combination-band absorption of water and lipids, but the intensity differences in different absorption peaks reveal the dynamic range characteristics of the spectrum. Around 970 nm and 1200 nm, the absorption valley of water is relatively flat and not obvious. This “weak absorption window” allows photons to penetrate deeper tissue layers, thereby retaining more information about subcutaneous lipids (such as around 1210 nm) and scattering characteristics. On the contrary, at 1450 nm and 1920 nm, the absorption of water is extremely strong, resulting in a sharp decrease in reflectance to near baseline, exhibiting almost saturated absorption characteristics. Although this strong absorption limits the detection depth, it also provides a highly sensitive feature anchor point for accurately defining the moisture content of the epidermis.
In addition, individual variation (standard deviation shadow) shows an increasing trend in the long wavelength range, especially in the arm area. This heterogeneity may stem from individual differences in subcutaneous fat layer thickness: arms are typically covered with varying thicknesses of fat layers, resulting in significant fluctuations in lipid absorption characteristics among different subjects. Due to the thin and relatively uniform fat layer, the standard deviation of the spectrum of the thumb area is smaller in the infrared region than that of the arm, suggesting reduced inter-individual variability.
In summary, the spectral analysis of the 14-person group confirmed the feasibility of non-invasive detection based on broadband spectroscopy. Although there are differences in baseline reflectance and scattering background among individuals, the characteristic absorption peak positions of key biochemical components (blood, water, lipids) have high robustness. In addition, the differences in spectral response of different anatomical parts suggest that when establishing a universal detection model, it is necessary to perform layered calibration based on the optical characteristics of different parts.
4. Discussion
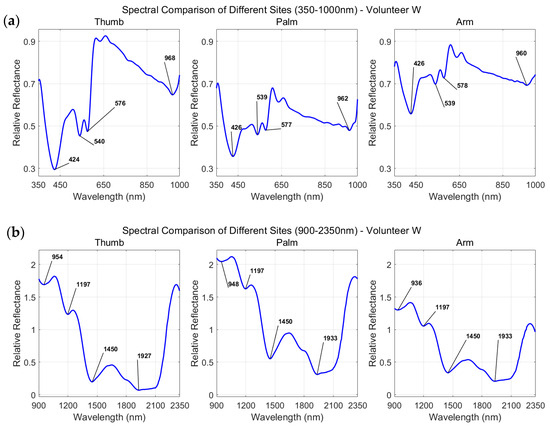
In the short wavelength range (Figure 5a), the thumb shows the most pronounced hemoglobin absorption dips at 500–600 nm, consistent with its high vascular density, thin stratum corneum, and minimal fat layer, which makes blood signals more identifiable in reflectance spectra. The arm exhibits higher reflectance and smoother curves than the thumb or palm, which reflects the lower blood volume fraction in the arm tissue. The palm falls between the two.
Figure 5.
Relative reflectance spectrum distribution of subject W at different body parts (thumb, palm, arm): (a) short band (350–1000 nm) and (b) long band (900–2350 nm).
In the long wavelength range (Figure 5b), the spectral features are dominated by molecular vibrational absorption of water and lipids. The strong absorption peaks near 1450 nm and 1940 nm correspond to the first overtone and combination vibrations of O-H bonds in water molecules. At these bands, the reflectance drops noticeably across all sites, indicating relatively shallow photon penetration depths, with signals mainly originating from the epidermis and superficial dermis. The vibrational absorption features of lipid C-H bonds can be observed near both 1210 nm and 1717 nm, with the absorption dip at 1210 nm being more clearly resolved. The lipid feature near 1717 nm appears relatively weak under the current measurement conditions, likely due to the small intrinsic absorption cross-section of lipids in this band, combined with masking by the residual absorption background of water molecules.
Taken together, the short-wave and long-wave results indicate that different spectral bands have distinct sensitivities to tissue components: the short-wave region mainly reflects blood-related information, while the long-wave region highlights water and lipid signals. Through dual-spectrometer stitching, continuous spectra covering the visible to short-wave infrared range can be obtained in a single measurement, enabling simultaneous access to information on blood, water, and lipids. The spectral differences across anatomical sites are also consistent with their structural characteristics—the thumb is vascular-rich, the arm has a thick fat layer, and the palm falls between the two—which aligns with previously reported variations in skin optical properties that depend on vascular density, fat layer thickness, and collagen organization [3,31]. These findings further validate the feasibility of broadband continuous spectroscopy for distinguishing different tissue backgrounds.
The present results indicate that source–detector separation influences the measured spectral contrast, but the effect is not uniform across spectral features or anatomical sites. The 518/422 nm and 606/579 nm ratios generally increased at larger separations, which may reflect changes in the sampled tissue volume and the relative contribution of deeper tissue layers. However, the 562/537 nm ratio exhibited a non-monotonic response, particularly at the thumb and palm. This finding suggests that the observed changes cannot be attributed solely to an increase in optical penetration depth. Variations in probe contact pressure, local tissue composition, coupling conditions, and wavelength-dependent scattering may also contribute to the distance-dependent response.
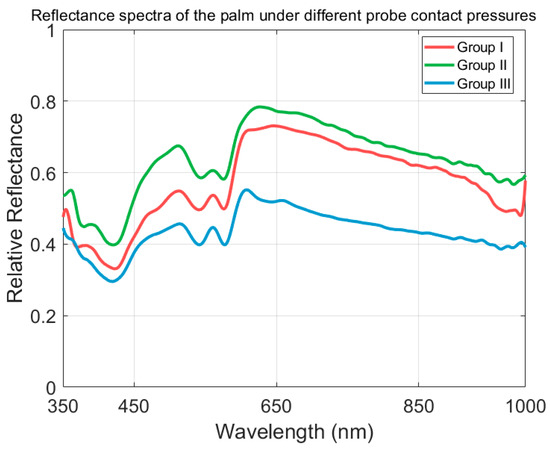
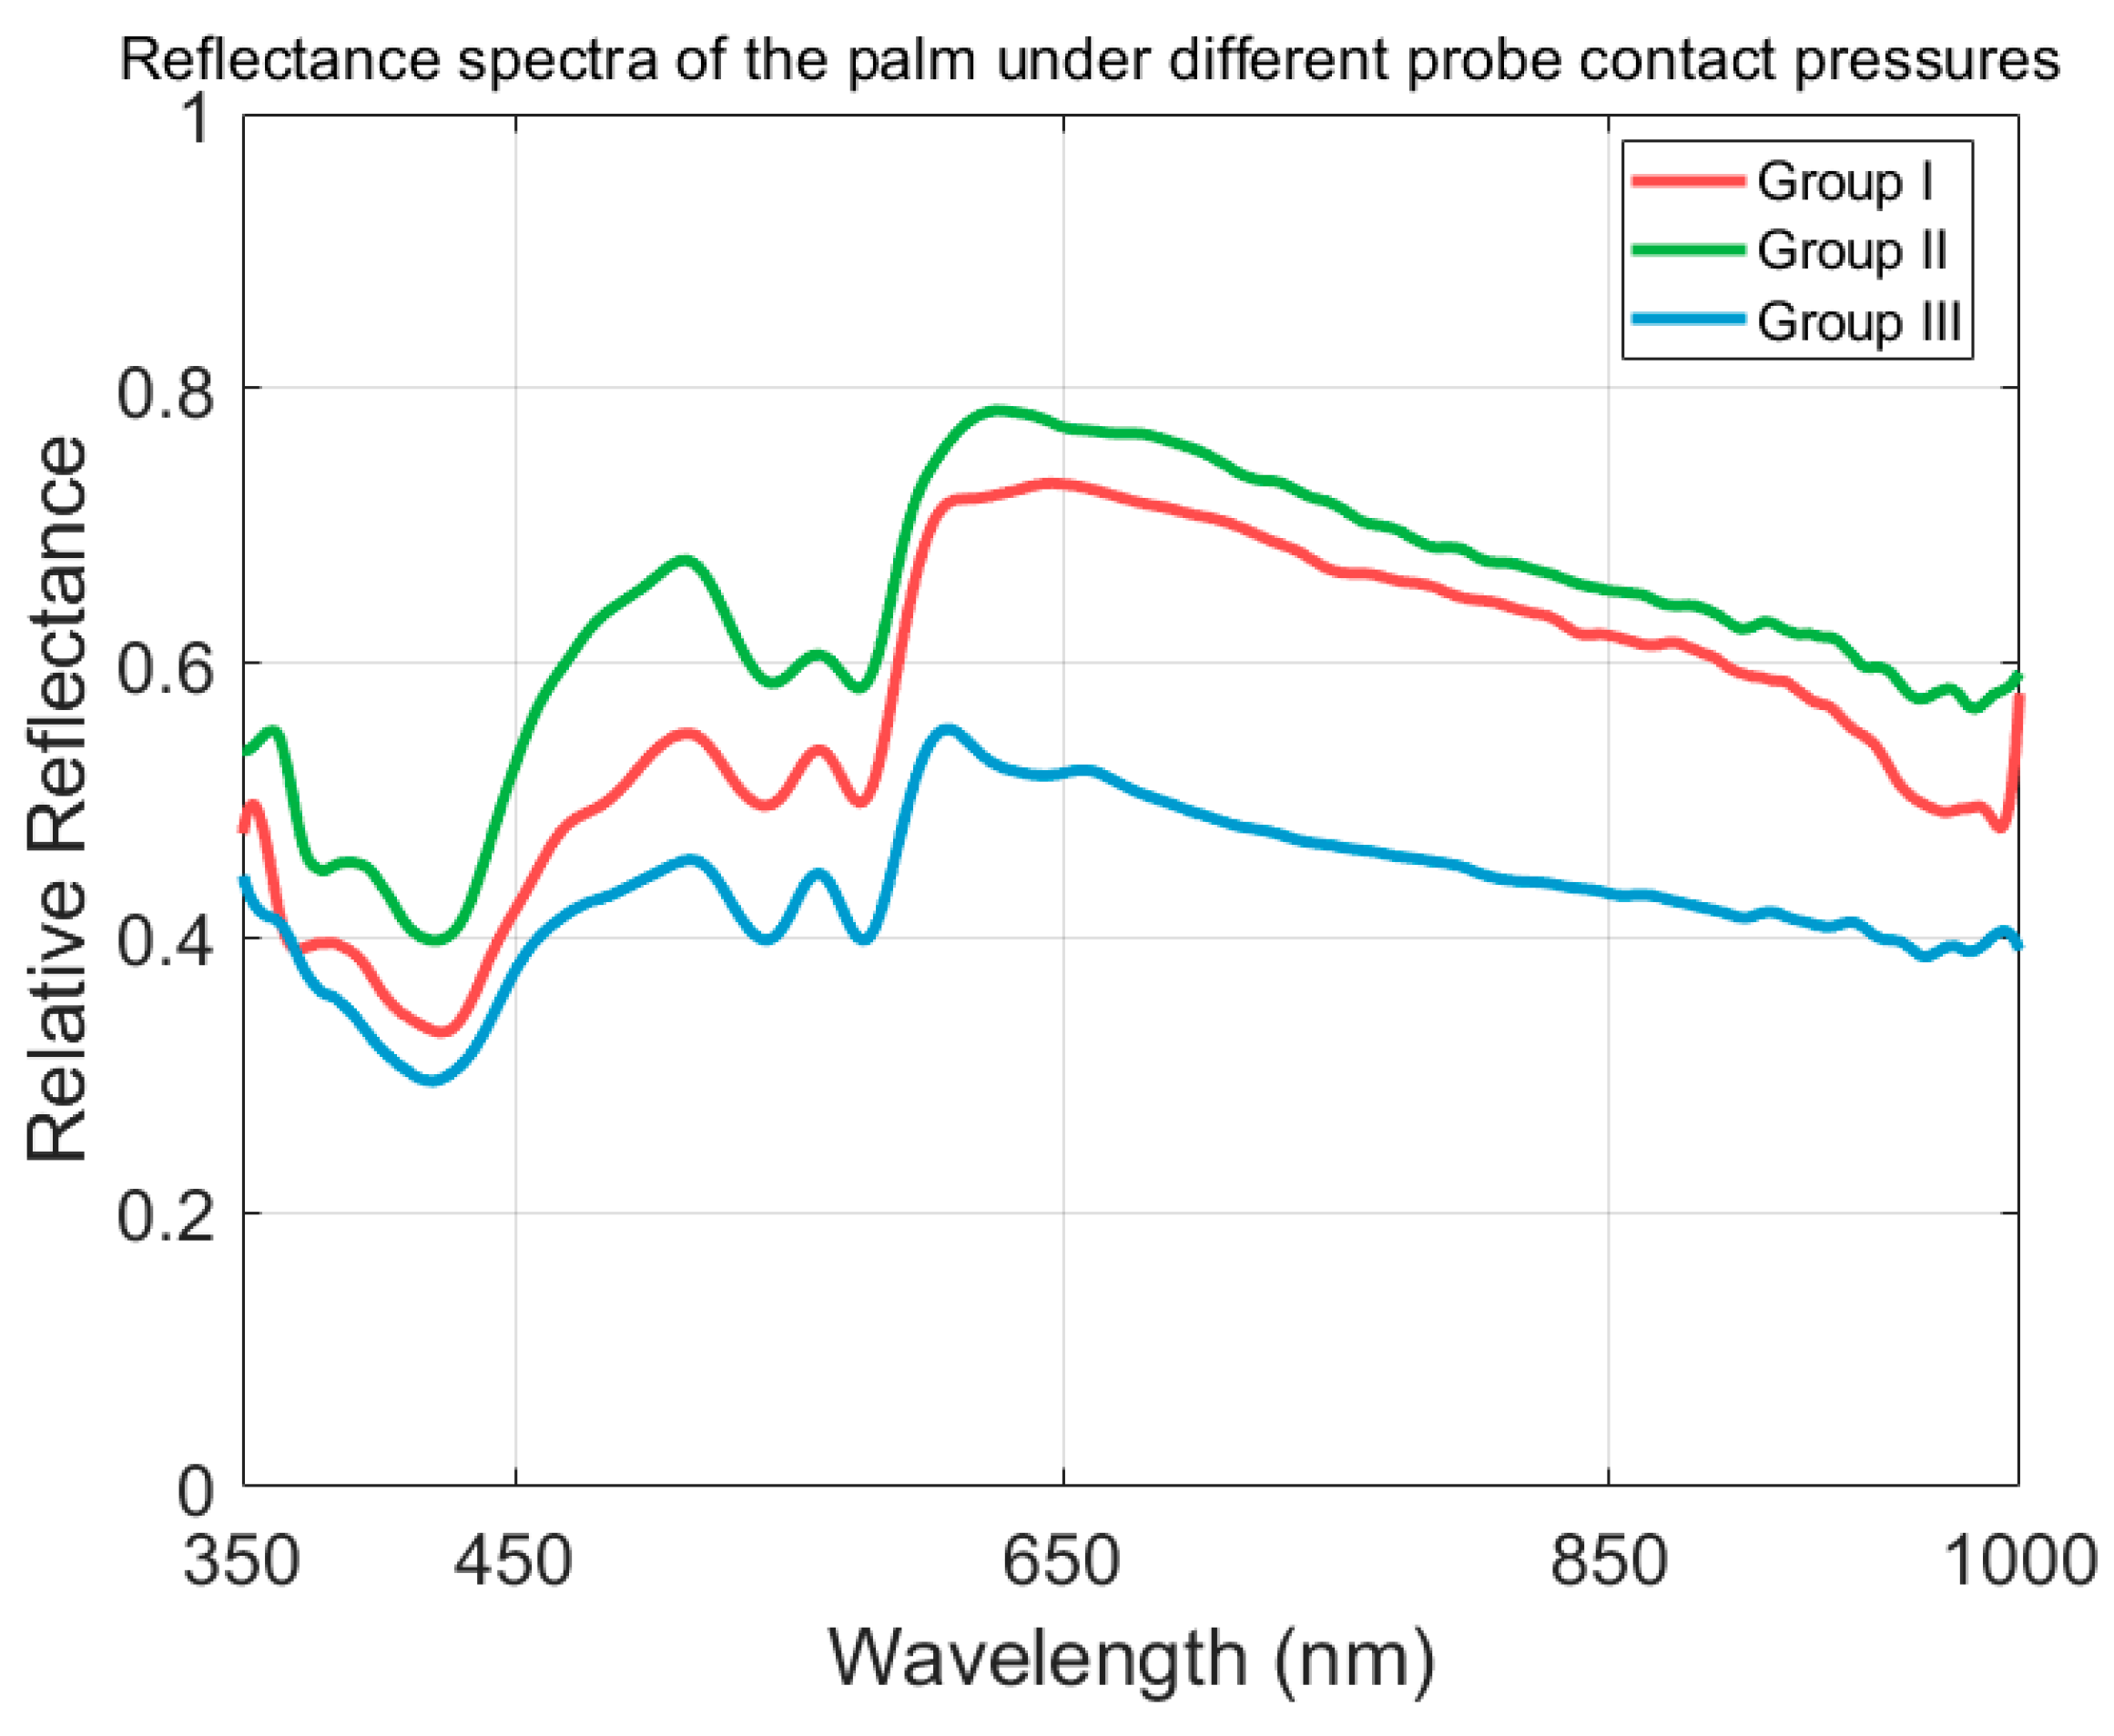
To further evaluate the potential influence of contact-pressure variations on our measurements, we measured the reflectance spectrum of the same subject (palm) at the same source–detector separation under three different probe contact pressures (Figure 6). As expected, increased contact pressure led to higher overall reflectance intensity, which can be attributed to local blood displacement and the consequent reduction in absorption. Importantly, despite these intensity shifts, the relative positions and depths of the characteristic absorption features remain largely unchanged across the three pressure conditions. This observation confirms that contact pressure primarily affects the absolute reflectance baseline rather than the spectral shape or relative peak-to-valley features that form the basis of our analysis, supporting our use of peak-to-valley ratios as the primary metric for comparison across different measurement sessions.
Figure 6.
Reflectance spectra of the palm under different probe contact pressures (Subject X, No. 3220 μm, 350–1000 nm).
This study is positioned as a method validation, so several limitations should be noted. The 14-subject, single-time-point dataset provides a moderate-scale descriptive basis but does not support strict statistical inference. Previous studies on skin diffuse reflectance spectroscopy have emphasized the importance of adequate sample size and rigorous statistical design for reliable tissue characterization [15,25]. Reflectance measurements were not absolutely calibrated. Physiological parameters such as blood pressure, heart rate, and skin temperature were not recorded simultaneously. The signal-to-noise ratio at the long-wave end (>2000 nm) decreased. In future work, we plan to further expand the sample size to 30–50 subjects and incorporate venous blood biochemical markers as references for quantitative inverse modeling. To translate this method into clinical use—for burn depth assessment, flap circulation monitoring, or diabetic foot screening—dedicated probes and discrimination algorithms will need to be developed.
In addition to these clinical considerations, from a technical perspective, further standardization of the measurement procedure would also be beneficial. In future work, we plan to incorporate a force sensor or a motorized probe-holder to better control contact pressure during measurements, thereby further improving measurement reproducibility and reducing potential pressure-induced variability.
5. Conclusions
This study independently built a broadband spectral measurement system covering wavelengths from 350 nm to 2350 nm. By combining dual spectrometers, high-resolution continuous spectral acquisition of skin tissue from visible light to short-wave infrared bands has been achieved. Based on the measurement and analysis of three typical parts of the thumb, palm, and arm, the feasibility, and unique advantages of wideband continuous spectroscopy in distinguishing tissue components were verified.
Our results reveal a fundamental shift in the dominant absorption mechanism across different spectral bands: the Q absorption band of oxygenated hemoglobin dominates in the 500–600 nm range, and the absorption valley depths near 542 nm and 577 nm directly reflect local blood volume fraction; after 900 nm, the vibrational absorption of water molecules replaces hemoglobin as the main chromophore, forming strong absorption features at 1450 nm and 1900–1940 nm; and lipid C-H vibrational absorption was observed at both 1150–1250 nm (centered around 1210 nm) and 1700–1750 nm, with the 1210 nm feature being more clearly resolved. This cross-band dominant conversion cannot be fully captured by a single band system, and the self-consistent constraint framework provided by continuous spectroscopy lays the data foundation for distinguishing signals from blood, water, and lipids.
In terms of regional differences, the thumb spectrum is dominated by hemoglobin-related features, consistent with its abundant peripheral vascular network; the arm becomes a “stable window” dominated by water/lipids due to its thick fat layer and strong scattering background; and the palm serves as an intermediate state that provides a scattering baseline reference. The high consistency of arm long-band spectra between individuals further suggests that this area is suitable for establishing a universal tissue optical model across individuals.
Source–detector separation significantly affected the measured peak-to-valley ratios across the three anatomical sites. The 518/422 nm and 606/579 nm features generally increased with increasing separation, whereas the 562/537 nm feature exhibited a non-monotonic response. Thus, source–detector separation should be considered an important measurement parameter, but its effect is feature- and site-dependent and should not be interpreted solely as a direct indicator of tissue penetration depth.
Our system acquires blood, water, and lipid information together in one measurement. This could be useful for applications like non-invasive glucose sensing, blood oxygen monitoring, and tissue composition analysis. For clinical use, the contact-based design is a limitation, but we think it can be addressed with sterile probe covers or a non-contact adapter. For acute burns or post-surgical flaps where contact is not allowed, a transparent isolation membrane would allow measurements without touching the tissue. We plan to expand the sample size and build a quantitative inversion model in future work.
In particular, introducing more rigorous vector electric field Monte Carlo simulations can further refine quantitative analysis in highly scattering anisotropic tissues. In addition, to achieve practical bedside applications of this technology, integration with miniaturized optical platforms in the future may provide low-cost and portable solutions for community health screening and dynamic physiological monitoring [33,34,35].
Author Contributions
Conceptualization, G.L., Y.L. and F.C.; methodology, G.L. and W.L.; software, G.L.; validation, G.L. and Y.L.; formal analysis, G.L. and W.L.; investigation, G.L. and Y.L.; resources, F.C.; data curation, G.L.; writing—original draft preparation, G.L.; writing—review and editing, G.L., Y.L. and F.C.; visualization, G.L.; supervision, Y.L. and F.C.; project administration, F.C.; funding acquisition, F.C. and Y.L. All authors have read and agreed to the published version of the manuscript.
Funding
This project was funded by the Hebei Natural Science Foundation (F2026201070), the National Natural Science Foundation of China (NSFC-62465009), and the Hainan Provincial Sanya Yazhou Bay Science and Technology Innovation Joint Project (ZDYF2025GXJS136).
Institutional Review Board Statement
The study was approved by the Ethics Committee of Hainan Medical College for preliminary experiments involving clinical testing of patients with diabetes (protocol code 2025-K72-01).
Data Availability Statement
Data are available upon request from the authors.
Acknowledgments
During the preparation of this manuscript, the authors used DeepSeek V3.2 for the purposes of drafting the Introduction Section and describing the experimental setup in Figure 1. The authors have reviewed and edited the output and take full responsibility for the content of this publication.
Conflicts of Interest
The authors declare no conflicts of interest.
References
- Setchfield, K.; Thomsen, B.; Lindegaard, J.; Mogensen, M.; Jemec, G.B.E. Relevance and utility of the in-vivo and ex-vivo optical properties of the skin reported in the literature: A review [Invited]. Biomed. Opt. Express 2023, 14, 3555–3583. [Google Scholar] [CrossRef] [Scilit] [PubMed]
- Tuchin, V.V. Tissue Optics: Light Scattering Methods and Instruments for Medical Diagnosis, 3rd ed.; SPIE Press: Bellingham, WA, USA, 2015. [Google Scholar] [CrossRef] [Scilit]
- Bashkatov, A.N.; Genina, E.A.; Tuchin, V.V. Optical properties of skin, subcutaneous, and muscle tissues: A review. J. Innov. Opt. Health Sci. 2011, 4, 9–38. [Google Scholar] [CrossRef] [Scilit]
- Buendia-Aviles, S.; Cunill-Rodríguez, M.; Delgado-Atencio, J.A.; González-Gutiérrez, E.; Arce-Diego, J.L.; Fanjul-Vélez, F. Evaluation of Diffuse Reflectance Spectroscopy Vegetal Phantoms for Human Pigmented Skin Lesions. Sensors 2024, 24, 7010. [Google Scholar] [CrossRef] [Scilit] [PubMed]
- Ilișanu, M.-A.; Moldoveanu, F.; Moldoveanu, A. Multispectral Imaging for Skin Diseases Assessment—State of the Art and Perspectives. Sensors 2023, 23, 3888. [Google Scholar] [CrossRef] [Scilit] [PubMed]
- Farrell, T.J.; Patterson, M.S.; Wilson, B. A diffusion theory model of spatially resolved, steady-state diffuse reflectance for the noninvasive determination of tissue optical properties in vivo. Med. Phys. 1992, 19, 879–888. [Google Scholar] [CrossRef] [Scilit] [PubMed]
- Smith, A.M.; Mancini, M.C.; Nie, S. Bioimaging: Second window for in vivo imaging. Nat. Nanotechnol. 2009, 4, 710–711. [Google Scholar] [CrossRef] [Scilit] [PubMed]
- Sordillo, L.A.; Pu, Y.; Pratavieira, S.; Budansky, Y.; Alfano, R.R. Deep optical imaging of tissue using the second and third near-infrared spectral windows. J. Biomed. Opt. 2014, 19, 056004. [Google Scholar] [CrossRef] [Scilit] [PubMed]
- Hale, G.M.; Querry, M.R. Optical constants of water in the 200-nm to 200-μm wavelength region. Appl. Opt. 1973, 12, 555–563. [Google Scholar] [CrossRef] [Scilit] [PubMed]
- Althobaiti, M. Estimation of the Differential Pathlength Factor for Human Skin Using Monte Carlo Simulations. Diagnostics 2023, 13, 309. [Google Scholar] [CrossRef] [Scilit] [PubMed]
- Sordillo, L.A.; Sordillo, P.P.; Budansky, Y.; Pu, Y.; Alfano, R.R. Shortwave infrared optical windows for evaluation of benign and malignant tissues. J. Biomed. Opt. 2017, 22, 045002. [Google Scholar] [CrossRef] [Scilit] [PubMed]
- Shi, L.; Sordillo, L.A.; Rodriguez-Contreras, A.; Alfano, R. A review of short-wave infrared spectroscopy and imaging methods for biological tissue characterization. J. Biomed. Opt. 2015, 20, 030901. [Google Scholar] [CrossRef] [Scilit] [PubMed]
- Prahl, S. Optical Absorption of Hemoglobin. Available online: https://omlc.org/spectra/hemoglobin/ (accessed on 20 May 2026).
- Bashkatov, A.N.; Genina, E.A.; Kochubey, V.I.; Tuchin, V.V. Optical properties of human skin, subcutaneous and mucous tissues in the wavelength range from 400 to 2000 nm. J. Phys. D Appl. Phys. 2005, 38, 2543–2555. [Google Scholar] [CrossRef] [Scilit]
- Zonios, G.; Dimou, A. Light scattering spectroscopy of human skin in vivo. Opt. Express 2009, 17, 1256–1267. [Google Scholar] [CrossRef] [Scilit] [PubMed]
- Cai, F.; Yu, J.; He, S. Vectorial electric field Monte Carlo simulations for focused laser beams (800 nm–2220 nm) in a biological sample. Prog. Electromagn. Res. 2013, 142, 667–681. [Google Scholar] [CrossRef] [Scilit]
- Salomatina, E.; Jiang, B.; Novak, J.; Yaroslavsky, A.N. Optical properties of normal and cancerous human skin in the visible and near-infrared spectral range. J. Biomed. Opt. 2006, 11, 064026. [Google Scholar] [CrossRef] [Scilit] [PubMed]
- Steffen, R.; Jackman, K.A.; Krausz, E. Design and application of a high-precision, broad spectral range CCD-based absorption spectrometer with millisecond time resolution. Meas. Sci. Technol. 2008, 19, 075601. [Google Scholar] [CrossRef] [Scilit]
- Troy, T.L.; Thennadil, S.N. Optical properties of human skin in the near infrared wavelength range of 1000 to 2200 nm. J. Biomed. Opt. 2001, 6, 167–176. [Google Scholar] [CrossRef] [Scilit] [PubMed]
- Geldof, F.; Dashtbozorg, B.; Hendriks, B.H.W.; Sterenborg, H.J.C.M.; Ruers, T.J.M. Layer thickness prediction and tissue classification in two-layered tissue structures using diffuse reflectance spectroscopy. Sci. Rep. 2022, 12, 1698. [Google Scholar] [CrossRef] [Scilit] [PubMed]
- Babu, S.; Vengalathunadakal, S.K.; Nair, S.K. Design and development of portable handheld multimodal spectroscopic probe system for skin tissue analysis. Rev. Sci. Instrum. 2020, 91, 075002. [Google Scholar] [CrossRef] [Scilit] [PubMed]
- Kienle, A.; Lilge, L.; Patterson, M.S.; Hibst, R.; Steiner, R.; Wilson, B.C. Spatially resolved absolute diffuse reflectance measurements for noninvasive determination of the optical scattering and absorption coefficients of biological tissue. Appl. Opt. 1996, 35, 2304–2314. [Google Scholar] [CrossRef] [Scilit] [PubMed]
- Chen, Y.Y.; Tzeng, S.Y.; Yen, Y.Y.; Lin, C.Y.; Wang, C.C.; Chang, H.C. Non-invasive assessment of skin hydration and sensation with diffuse reflectance spectroscopy. Sci. Rep. 2023, 13, 20149. [Google Scholar] [CrossRef] [Scilit] [PubMed]
- Flock, S.T.; Patterson, M.S.; Wilson, B.C.; Wyman, D.R. Monte Carlo modeling of light propagation in highly scattering tissues—I: Model predictions and comparison with diffusion theory. IEEE Trans. Biomed. Eng. 1989, 36, 1162–1168. [Google Scholar] [CrossRef] [Scilit] [PubMed]
- Hennessy, R.; Goth, W.; Sharma, M.; Markey, M.K.; Tunnell, J.W. Effect of probe geometry and optical properties on the sampling depth for diffuse reflectance spectroscopy. J. Biomed. Opt. 2014, 19, 107002. [Google Scholar] [CrossRef] [Scilit] [PubMed][Green Version]
- Wang, L.V.; Wu, H.I. Biomedical Optics: Principles and Imaging; Wiley: Hoboken, NJ, USA, 2007. [Google Scholar] [CrossRef] [Scilit]
- Pifferi, A.; Contini, D.; Mora, A.D.; Farina, A.; Spinelli, L.; Torricelli, A. New frontiers in time-domain diffuse optics. J. Biomed. Opt. 2016, 21, 091310. [Google Scholar] [CrossRef] [Scilit] [PubMed]
- Welch, A.J.; van Gemert, M.J.C. Optical-Thermal Response of Laser-Irradiated Tissue, 2nd ed.; Springer: Dordrecht, The Netherlands, 2011. [Google Scholar] [CrossRef] [Scilit]
- Xia, Q.; Zhu, D.; Chen, D. In vivo skin optical clearing for improving imaging and light-induced therapy: A review. J. Biomed. Opt. 2023, 28, 060901. [Google Scholar] [CrossRef] [Scilit] [PubMed]
- Banas, K.; Banas, A.M.; Pastorin, G.; Hong, N.M.; Gupta, S.; Dziedzic-Kocurek, K.; Breese, M.B.H. Sensing the Changes in Stratum Corneum Using Fourier Transform Infrared Microspectroscopy and Hyperspectral Data Processing. Sensors 2024, 24, 7054. [Google Scholar] [CrossRef] [Scilit] [PubMed]
- Cheong, W.F.; Prahl, S.A.; Welch, A.J. A review of the optical properties of biological tissues. IEEE J. Quantum Electron. 1990, 26, 2166–2185. [Google Scholar] [CrossRef] [Scilit] [PubMed]
- Witteveen, M.; Faber, D.J.; Sterenborg, H.J.C.M.; Ruers, T.J.M.; van Leeuwen, T.G.; Post, A.L. Opportunities and pitfalls in (sub)diffuse reflectance spectroscopy. Front. Photonics 2022, 3, 964719. [Google Scholar] [CrossRef] [Scilit]
- Cai, F.; Wang, T.; Lu, W.; Zhang, X. High-resolution mobile bio-microscope with smartphone telephoto camera lens. Optik 2020, 207, 164449. [Google Scholar] [CrossRef] [Scilit]
- Singhal, C.M.; Kaushik, V.; Awasthi, A.; Zalke, J.B.; Palekar, S.; Rewatkar, P.; Srivastava, S.K.; Kulkarni, M.B.; Bhaiyya, M.L. Deep Learning-Enhanced Portable Chemiluminescence Biosensor: 3D-Printed, Smartphone-Integrated Platform for Glucose Detection. Bioengineering 2025, 12, 119. [Google Scholar] [CrossRef] [Scilit] [PubMed]
- Abbasi, R.; Hu, X.; Zhang, A.; Dummer, I.; Wachsmann-Hogiu, S. Optical Image Sensors for Smart Analytical Chemiluminescence Biosensors. Bioengineering 2024, 11, 912. [Google Scholar] [CrossRef] [Scilit] [PubMed]
Disclaimer/Publisher’s Note: The statements, opinions and data contained in all publications are solely those of the individual author(s) and contributor(s) and not of MDPI and/or the editor(s). MDPI and/or the editor(s) disclaim responsibility for any injury to people or property resulting from any ideas, methods, instructions or products referred to in the content. |
© 2026 by the authors. Licensee MDPI, Basel, Switzerland. This article is an open access article distributed under the terms and conditions of the Creative Commons Attribution (CC BY) license.