Article

Optimising Material Ratios for Full-Colour 3D-Printed Dental Restorations


Institute for Laser Technologies in Medicine and Metrology at the University of Ulm, Helmholtzstr. 12, D-89081 Ulm, Germany
*
Author to whom correspondence should be addressed.
Photonics 2026, 13(9), 879; https://doi.org/10.3390/photonics13090879
Submission received: 19 August 2026 / Revised: 10 September 2026 / Accepted: 15 September 2026 / Published: 17 September 2026
(This article belongs to the Special Issue Computational Optical Imaging: Progress and Future Prospects)

Abstract

Accurate colour reproduction remains a challenge in manufactured dental restorations because tooth appearance depends on wavelength-dependent absorption and scattering, geometry, illumination, and viewing conditions. We present a measurement- and simulation-based workflow for determining 3D-printable multi-material compositions. We demonstrate our workflow by reproducing the appearance of the 16 VITA classical A1–D4 shade guide colours with a set of six Stratasys Vero and VeroUltra photopolymers. Each reference tooth was recorded in a photobox using a camera with six narrow-band spectral filters spanning 450 nm to 700 nm. A physics-based, GPU-accelerated Monte Carlo light transport simulation was then used inversely to recover the six material concentrations that minimised the CIE Δ E 2000 colour difference between the measured and simulated appearance considering all six wavelength bands. Additionally, we compared four colour optimisation strategies for determining material compositions. We further investigated metamerism in the colour optimisation by independently the illuminant and comparing a single- and double-light-source setup. These variations produced substantial changes in the resulting colour differences. With the given material set, the resulting mixtures reproduced all 16 teeth across the shade guide with a mean colour difference of CIE Δ E 2000 = 2.76 ± 0.88 over the evaluated tooth regions. Crucially, the printing materials require optical characterisation only once, after which new target teeth need only be spectrally measured to determine their printable compositions. More broadly, the framework provides a general route from spectral measurements to physically realisable multi-material reproductions, extending beyond dental applications.

1. Introduction

Customisation of tooth colour is an important aspect of dental restoration manufacturing [1]. Existing approaches range from manual staining and characterisation techniques [2,3] to computational colour reproduction using multi-material 3D-printing systems [4]. Compared with the conventional manual approaches, computational methods have the potential to reduce production time and reliance on specialised personnel and expertise, while improving the reproducibility and consistency of the resulting restorations. In addition to satisfying functional requirements, a dental restoration should reproduce the visual characteristics of natural teeth and integrate with the surrounding dentition [5].
Accurate reproduction of tooth colour remains challenging because real tooth appearance cannot be described by a single surface colour. Instead, it primarily results from wavelength-dependent absorption and scattering within enamel and dentine, together with the thickness and geometry of these tissues [6]. Enamel modifies the lightness and chromaticity of the underlying dentine [7], while the orientation and distribution of dentinal tubules influence light attenuation, scattering, and the local refractive index of dentine [8]. Variations in material composition or internal structure may therefore affect the perceived colour of a restoration [9]. Previous research has addressed both the acquisition and communication of natural tooth colour and the selection or spatial arrangement of materials required to reproduce a target appearance [10,11,12,13].
Additive manufacturing provides a means of controlling the composition of a restoration during fabrication. However, many dental printing processes are based on a limited number of predefined resins and offer only restricted control over colour and translucency [14]. Multi-material jetting extends this capability by combining several photopolymers in different proportions [11,15]. Simon et al. [4] recently investigated colour matching and biomimicry for multi-material dental 3D printing using the same set of Stratasys photopolymers considered in this work, but employed a different approach for determining and spatially distributing the printable materials. They first characterise the printing process using flat, layered test specimens designed to mimic the enamel–dentine–root structure of a tooth, and use the measured slab appearance to train a forward model that can approximate the appearance of corresponding layered tooth geometries. A learning-based backward model then determines the enamel and dentine layer colours required to reproduce target surface colours for prescribed layer thicknesses and translucencies, while a morphable star-shape parametrisation is used to embed these layers within the tooth geometry prior to multi-material slicing and printing. Determining a suitable composition for 3D printing is challenging because the relationship between material concentrations and observed colour is influenced by the optical properties, object geometry, illumination, and viewing conditions [16].
In this work, we developed a measurement- and simulation-based workflow for determining 3D-printable material compositions that reproduce the colour appearance of the 16 teeth in the VITA classical A1–D4 shade guide. These reference teeth were recorded in a photobox using a camera equipped with a set of narrow-band spectral filters [17]. Six images covering wavelengths from 450 n m to 700 n m were acquired for each tooth. The light source, camera position, sample geometry, holder, and background were represented in the corresponding simulation model, enabling direct comparison between the measured and simulated appearances of the teeth [18]. This workflow requires only that the material set be characterised once and that the reference tooth be recorded. Other material sets or additional materials can be treated in the same way.
We also compared and theoretically evaluated four strategies for determining the material composition, using a homogeneous tooth restoration material not related to the VITA shade guide, whose absorption and scattering coefficients were characterised spectrally resolved with an integrating sphere: directly matching the intrinsic optical properties, matching the ratio of the reduced scattering coefficient to the absorption coefficient, approximating the spectral reflectance, and minimising the perceptual colour difference in CIE L*a*b* colour space.
We modelled each VITA restoration tooth as a monolithic, homogeneous volume composed of a single material mixture. This simplification avoided introducing assumptions about the internal structure or spatial distribution of materials within the restoration. We then iteratively optimised a material mixture formed from Stratasys Vero cyan, magenta, yellow, and clear materials and VeroUltra black and white. The previously determined wavelength-dependent optical properties of these materials [16] were combined according to the material concentrations in the mixture. At each iteration, a graphics processing unit (GPU)-accelerated Monte Carlo (MC) simulation numerically solved the radiative transfer equation (RTE) [19] and predicted the spectrally resolved appearance under the measurement conditions [16,17,20]. This physics-based rendering approach accounts for volumetric absorption and scattering, object geometry, and reflection and refraction at material interfaces.
Based on the comparison of the colour optimisation strategies, the final VITA shade-guide matching was performed using a gradient-based optimisation [21] to vary the material concentrations and minimise the CIE Δ E 2000 value [22,23,24] between the measured and simulated colours. We then compared the photographed teeth and forward renderings of the best-fit material compositions, together with the calculated Δ E maps, the resulting absorption and reduced scattering coefficients, and the material concentrations computed in this study for 3D printing the restorations.

2. Materials and Methods

In this section, we briefly review the theory and methods used to compute light transport, optimise colour, and perform the measurements. These include the MC algorithm used to render light transport, the different colour optimisation strategies, the Levenberg–Marquardt fitting algorithm, and the measurement setup used.

2.1. Monte Carlo Light Transfer Simulation

To compute physics-based light transport in turbid media, we used a GPU-accelerated MC simulation [20] that provides a numerical solution of the RTE. This MC software was developed in-house and has been validated extensively against another MC software package [25] and an analytical RTE solution [26]. The software was developed using OpenCL [27], allowing the simulations to be distributed across multiple GPUs. Simulation execution is managed through a Python 3.12 interface, which starts separate OpenCL kernels on each GPU. The eight NVIDIA A10 GPUs employed in this study (NVIDIA Corporation, Santa Clara, CA, USA; NVIDIA A10 GPU, 24 GB GDDR6 VRAM) are located in a single server. Because individual MC simulations are statistically independent [28], the GPUs can operate without exchanging data during execution. The examined media are described in the context of the RTE by their optical properties [29], namely the scattering and absorption coefficients μ s and μ a , the refractive index n, and the scattering phase function. In this case, the Henyey–Greenstein phase function [30], characterised by the anisotropy factor g, was chosen as the scattering phase function. In what follows, we use the reduced scattering coefficient μ s μ s ( 1 g ) . Interactions between media with different refractive indices were handled using the Fresnel equations [31]. The geometry of the 3D scene was incorporated into the simulation via a tetrahedron-based characterisation of the objects and their material distributions. Within this MC framework, light propagation is represented by individual energy packets, referred to as photons, which are traced through the medium under variable lighting and viewing conditions. As demonstrated in [16,20], this approach produces rendered images exhibiting good agreement with actual photographs, with the agreement quantified using the CIE Δ E 2000 colour-difference metric, hereafter referred to as Δ E [22,23,24]. A more detailed description of the method and examples of previous applications can be found in [16,17,20].

2.2. Colour Optimisation Strategies and Levenberg–Marquardt Fitting

We aim to reproduce the colour appearance of measured samples using a given set of materials that can be combined in arbitrary concentrations and printed in arbitrary geometries. In this study, we used the Stratasys PolyJet materials VeroCyan, VeroMagenta, VeroYellow, and VeroClear, together with VeroUltraBlack and VeroUltraWhite (Stratasys Ltd., Minnetonka, MN, USA) [32,33]. Although these particular materials are not biocompatible, comparable sets of biocompatible materials, including materials specifically intended for dental applications, can be used with the proposed workflow in exactly the same manner. The wavelength-dependent optical properties of these materials were characterised in a previous study [16]. This study also demonstrated that the optical properties of a material mixture can be expressed as a linear combination of the optical properties of its constituents, provided that the constituent materials are randomly distributed throughout the volume at a sufficiently fine voxel resolution. The Stratasys J826 printer used in the above study provides sufficient printing resolution to realise such distributions. Let N denote the number of available printing materials, and let
c = c i i = 0 N = c 1 , , c N T
be the vector of material concentrations. The concentrations are constrained by
c i 0 i N and i = 0 N c i = 1 .
Under the linear-mixture approximation, the absorption and reduced scattering coefficients of the mixture are given by
μ a , mix λ , c = c i μ a , i ( λ ) , μ s , mix λ , c = c i μ s , i ( λ ) ,
where Einstein’s summation convention was used. Here, μ a , i and μ s , i are the absorption and reduced scattering coefficients of the i-th constituent material, respectively. The resulting mixture parameters, together with the refractive index and scattering phase function, define the material model used in the MC simulation. A colour-optimisation strategy is then required to determine the concentrations c i that provide the best agreement with the reference sample. Four strategies that can be combined with our MC light-transport and inverse-rendering framework are considered: directly matching the optical properties, matching the ratio of the reduced scattering coefficient to the absorption coefficient, approximation of the spectral reflectance, and minimisation of the perceptual colour difference in L a b space. These approaches were previously discussed in detail by Glöckler et al. [34]. Here, we describe the general approach used to formulate mixtures of our Stratasys materials to match the colour of a reference material.
In the first strategy, the optical properties of the mixture of the six Stratasys materials are fitted directly to those of the reference material, whose scattering and absorption properties can, for example, be determined using an integrating sphere [25,35]. No information about the geometry, illumination, or detection setup is required for this approach. In the following, this procedure is referred to as the “direct method”. Since VeroUltraWhite is the only material used to control scattering in the available set, the reduced scattering and absorption coefficients were fitted sequentially. Firstly, the concentration c w of VeroUltraWhite was determined by scaling its scattering coefficient. Let w denote the material index corresponding to VeroUltraWhite. The reduced scattering coefficient of the material mixture μ s , mix ( λ , c w ) is then given by
μ s , mix ( λ , c w ) = c w μ s , w ( λ ) .
The root-mean-square error (rmse) between μ s , mix ( λ , c w ) and the reduced scattering coefficient of the reference material μ s , ref ( λ ) is
J s , direct ( c w ) = 1 | Λ | λ Λ c w μ s , w ( λ ) μ s , ref ( λ ) μ s , ref ( λ ) 2 1 / 2 .
The optimum concentration of VeroUltraWhite is then given by
c w , = arg min 0 c w 1 J s , direct ( c w ) .
Here, Λ is the set of considered wavelengths and | Λ | is the number of wavelengths. All wavelengths are weighted equally. The concentration of VeroUltraWhite was then fixed at c w , . Secondly, the absorption contribution associated with this concentration was also fixed. The absorption coefficient of the direct mixture is
μ a , direct ( λ , c ) = c i μ a , i ( λ ) + c w , c w μ a , w ( λ ) ,
where the second term effectively fixes the contribution of the white material to μ a , direct ( λ , c ) to the optimum white concentration. The rmse between the absorption coefficient of the mixture and that of the reference material μ a , ref ( λ ) is
J a , direct ( c ) = 1 | Λ | λ Λ μ a , direct ( λ , c ) μ a , ref ( λ ) μ a , ref ( λ ) 2 1 / 2 .
The optimal concentration vector is then given by
c direct = arg min c   J a , direct ( c ) .
Direct matching of the optical properties is the most physically comprehensive approach because, if all relevant optical properties are reproduced accurately, the resulting light transport is expected to remain valid across different illumination conditions, viewing conditions, and geometries. Ideally, this approach avoids metamerism caused by differences in the underlying spectral response of the material. However, it requires the optical properties of the reference material to be known, as well as a sufficiently diverse set of absorbers and scatterers that can be mixed to reproduce the wavelength dependence of the absorption and reduced scattering coefficients of the reference material to be available. Because the mixture properties can be evaluated directly using Equation (8), no MC simulation is required during this optimisation.
The second strategy optimises the ratio of the reduced scattering coefficient to the absorption coefficient, defined for the mixture and the reference material as
R mix ( λ , c ) = c i μ s , i ( λ ) c i μ a , i ( λ ) , R ref ( λ ) = μ s , ref ( λ ) μ a , ref ( λ ) .
For an ideal semi-infinite medium, the reflection is a function of the ratio of μ s to μ a . Since the perceived colour is determined by the spectral distribution of the reflected light, this ratio can therefore also be used to approximate the colour of the medium. The rmse between the ratio of the mixture of the 3D-printed materials and that of the reference material is
J ratio ( c ) = 1 | Λ | λ Λ R mix ( λ , c ) R ref ( λ ) R ref ( λ ) 2 1 / 2 .
The optimal concentration vector is then given by
c ratio = arg min c   J ratio ( c ) .
The third strategy determines the material concentrations by matching the simulated spectral reflectance to the measured reflectance of the reference sample. The geometry of the reference sample is assumed to be known and is reproduced in the MC model. The geometry and measurement configuration remain fixed throughout the optimisation and are therefore omitted from the following notation. The simulated spectral reflectance is given by
R sim λ , c = M μ a , mix λ , c , μ s , mix λ , c ,
where M denotes the MC model. The agreement between the simulated and measured reflectance spectra is quantified using the rmse
J R c i = 1 | Λ | λ Λ R sim λ , c i R ref ( λ ) R ref ( λ ) 2 1 / 2 ,
where R ref ( λ ) is the spectral reflectance of the reference material. The optimal concentration vector is then given by
c R = arg min c   J R c .
For highly scattering samples, the reflectance may be comparatively insensitive to small changes in sample geometry, as light does not penetrate deeply into the sample [34].
The fourth strategy directly minimises the perceptual colour difference between the reference and the simulated sample. The simulated and reference colours are represented by the L a b vectors sim ( c ) and ref . These colour vectors are obtained as described in [18]. The cost function is defined as the colour difference:
J Δ E c = Δ E sim ( c ) , ref ,
where Δ E denotes the CIE Δ E 2000 colour-difference metric [22,23,24]. The optimal concentration vector is then given by
c Δ E = arg min c   J Δ E c .
This optimisation determines the material concentrations that provide the smallest perceptual colour difference for the fixed illumination spectrum, observer, geometry, and viewing configuration. However, it is also the most computationally expensive strategy because each evaluation of the cost function requires a full-spectrum MC simulation and subsequent colorimetric processing. Furthermore, the resulting composition is optimised for the selected observation conditions and is not necessarily optimal under a different illuminant or viewing configuration. Each iteration of this optimisation computes the spectral simulation output from 450 n m to 700 n m in steps of 50 n m . From these data, a complete image was rendered for the current material composition. As described in [18], the simulated spectral data was extrapolated from 450 n m to 400 n m , providing a defined lower boundary for interpolation across the visible spectrum.
The underlying optimisation algorithm was configured as in our previous work [17]. It uses the gradient-based framework described by Transtrum and Sethna [21]. As in our previous work, scaling relations are employed to calculate the required gradients [36,37]. These gradients describe the change in the simulated output caused by variations in the material concentrations. Consequently, through the optical property scaling relations, each MC simulation provides information about both the current material composition and the effects of variations in the material components.
To enforce the unity-sum constraint during the gradient variation of the concentrations in Equation (2), the optimisation variables are expressed as ratios relative to the concentration of the first material. For i = 1 , , N , the ratios are defined as
r i = c i c 1 , where r i 0
and explicitly c 1 > 0 . The concentration of the first material was parametrised in terms of N 1 independent ratios as
c 1 = 1 + j = 1 N r j 1 .
The concentrations of the remaining materials are then given by
c i = r i 1 + j = 1 N r j 1 .
This parameterisation reduces the number of independent optimisation variables from N to N 1 and ensures that the reconstructed concentrations satisfy the constraints in Equation (2).

2.3. Spectral Detection Setup and Photobox Configuration

In this work, we aim to reproduce the colour appearance of the 16 tooth colours in the VITA classical shade guide (VITA Zahnfabrik H. Rauter GmbH & Co. KG, Bad Säckingen, Germany; VITA classical A1–D4 shade guide [38]). The measured data of the investigated shade-guide teeth used in this study were recorded with a spectrally filtered detection setup. This setup was previously described and validated in [18]. The thorough investigation of its theoretical limits and the inverse method with which optical properties can be recovered from the data obtained with this setup can be found in [17]. Here, only a short summary of the setup and its configuration in a photobox is provided.
The photobox was illuminated using an LED panel with a fully characterised spectral intensity distribution [20]. Image acquisition was performed with an IDS camera (IDS Imaging Development Systems GmbH, Obersulm, Germany; U3-3060CP-M-GL Rev.2.2) equipped with a 25 mm lens (Edmund Optics, Barrington, NJ, USA; 25 mm Focal Length Lens, 1″ Sensor Format, #63-246). The spectral sensitivity of this camera was previously determined [18]. A set of hard-coated bandpass filters (Thorlabs, Newton, NJ, USA; Hard-Coated VIS/NIR Bandpass Filter Kit, FKBV10) was positioned in front of the lens. The filters were housed in a motorised filter wheel (Edmund Optics, Barrington, NJ, USA; USB/RS-232 Motorised Filter Wheel, #23-646), which allowed the filters to be changed without altering the camera position. This configuration enabled images to be acquired at discrete wavelength bands centred around the indicated wavelength of the filters. In this study, filters with a full width at half maximum (FWHM) of 10 n m were used, covering centre wavelengths from 450 n m to 700 n m in approximately 50 n m intervals.
The shade-guide teeth were then placed upright in front of the detection setup and centred in the field of view (FOV) of the camera. To ensure the best positioning of the samples, a specially designed holder was 3D printed. This holder was taken into account in the simulation. The optical properties of the grey printing material were determined with an integrating sphere [25,35]. A white silicone cube with known optical properties [39] was placed behind the teeth to provide a well-defined background. These optical properties were used in the MC simulation. The photobox configuration and the sample holder are shown schematically in Figure 1.
We set the parameters of the photobox, as defined in Figure 1, to the following values: for the light source we chose d l = 39.0   c m , ϑ l = π 4 , and φ l = 3 π 4 and for the camera d C = 18.0   c m , ϑ C = π 2 , and φ C = π 2 . With this choice, the camera looked directly at the tooth’s front surface with the illumination placed at an angle to the right and the white cube positioned behind the tooth as the background. Positioning within the photobox was performed manually by generating an overlay of the full simulated scene geometry and displaying it in the camera live view to align the measurement with the simulation as closely as possible. We then recorded six images, using the six spectral filters, of each of the 16 teeth and used these as inputs for our colour optimisation.
As described in [18], accurately simulating the image intensity data I camref requires knowledge of the filter transmission profiles combined with the camera sensitivity. This combined response is denoted by the filter function F λ 0 ( λ ) . Following [18], the camera-reference intensity is given by
I camref ( λ 0 ) = VS d λ I ( λ ) F λ 0 ( λ ) L ( λ ) VS d λ F λ 0 ( λ ) L ( λ ) ,
where I ( λ ) is the intensity obtained from the MC simulation at wavelength λ , and λ 0 denotes the centre wavelength. The quantity L ( λ ) represents the spectral intensity distribution of the light source. The integration is performed over the visible spectrum (VS) in order to include all filter contributions, as the filter profiles are non-ideal. In this work, Equation (21) was used to match the simulated reflectance to the recorded images.

3. Results

3.1. Theoretical Evaluation of Colour Optimisation Strategies

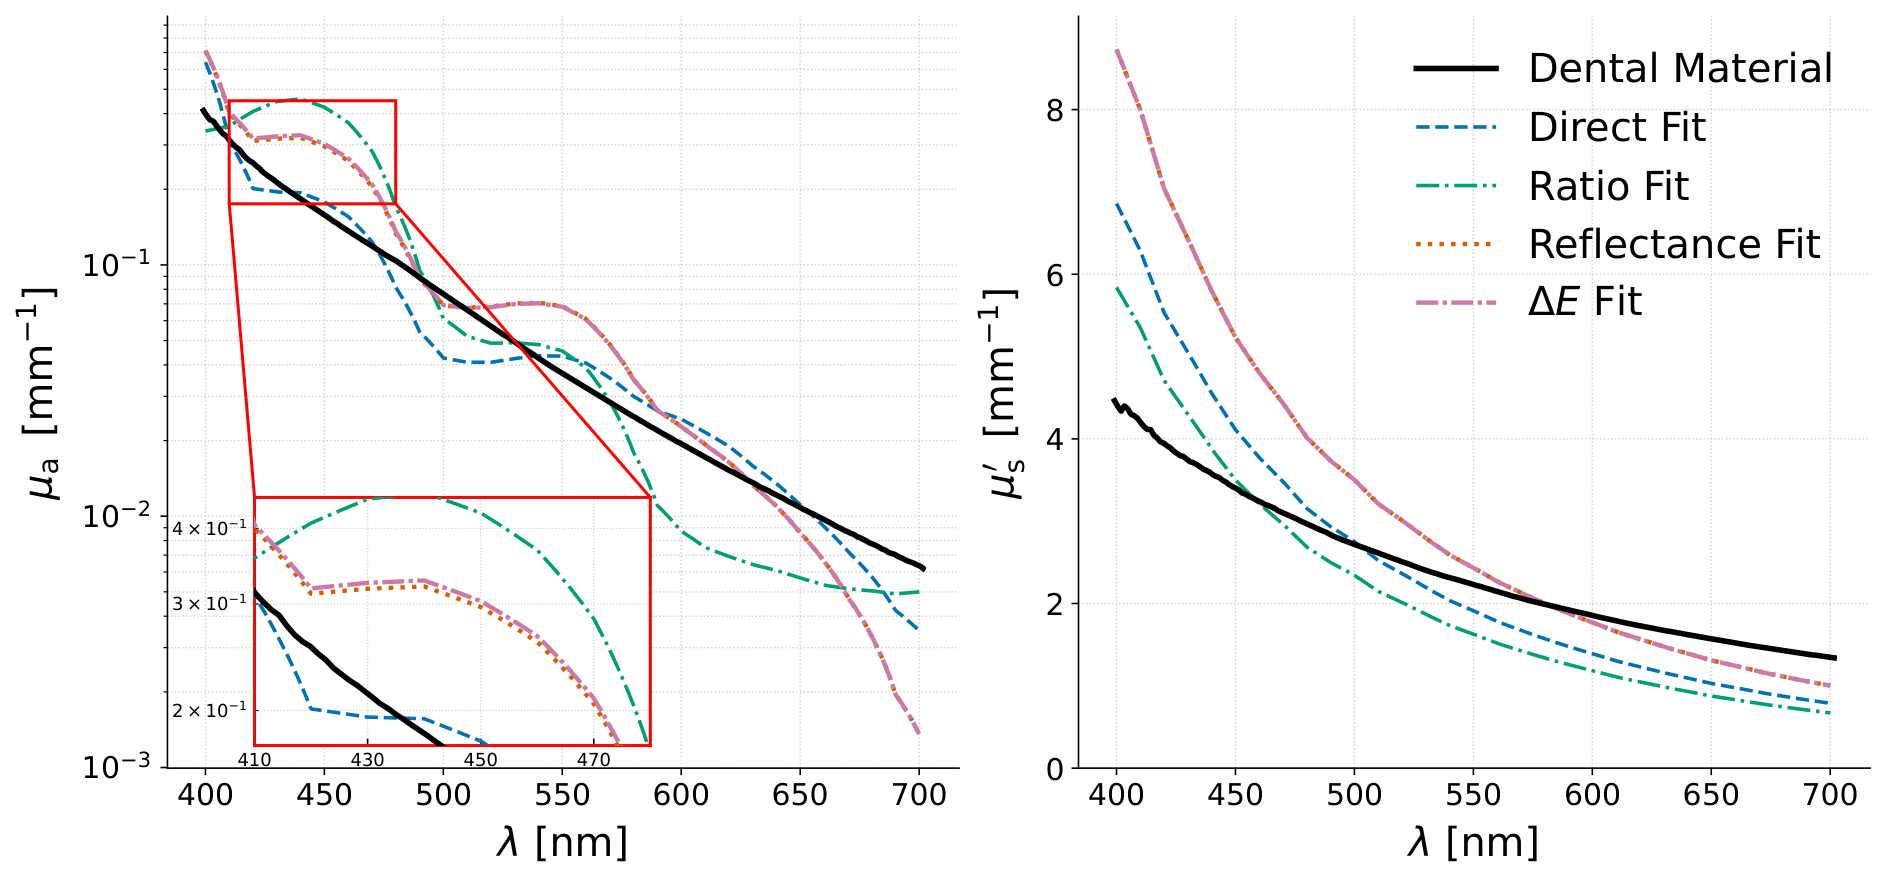
We have evaluated the four colour optimisation strategies outlined in Section 2.2 using measurements of a separate dental restoration material, unrelated to the VITA teeth, from which we calculated a rendering that served as the reference for this evaluation. The reduced scattering and absorption coefficients were determined with an integrating sphere and are shown in black in Figure 2, for which we have assumed a value of g = 0.75 . Firstly, we matched the reduced scattering and absorption coefficient curves directly; secondly, we matched the ratio R = μ s / μ a . These first two methods were performed over the full wavelength range from 400 n m to 700 n m , using a step size of 1 n m . Next, we ran the fits that optimised the reflectance and colour difference, for which we assumed the geometry of the teeth from the VITA classical shade guide. The 3D geometry was acquired with the ZEISS COMET L3D (Carl Zeiss Industrielle Messtechnik GmbH, Oberkochen, Germany; ZEISS COMET L3D). The results are also shown in Figure 2. The third and fourth methods were performed at seven wavelengths ranging from 400 n m to 700 n m in 50 n m intervals to imitate the measurements with the camera described in Section 3.3.
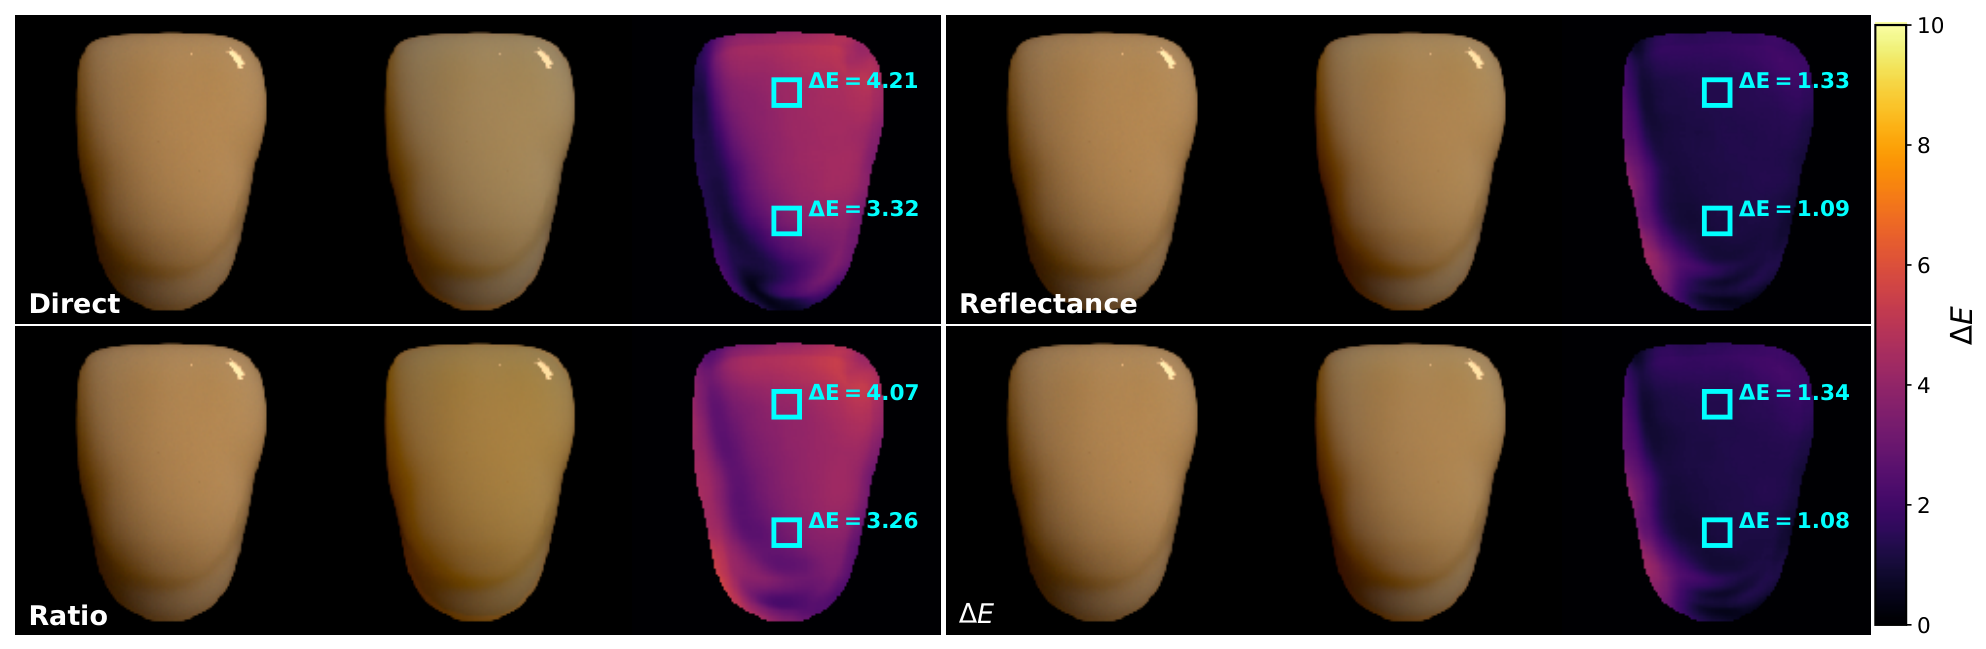
The μ a results follow the dental restoration material’s μ a approximately, whereas the μ s results reproduce its spectral behaviour only to a limited extent. This is because our material set, given by the Stratasys printer, contains only one scattering material. Thus, the shape of our fitted μ s curve cannot change. We can only scale the overall magnitude of the curve. To better evaluate the results of the different strategies, we compare forward renderings, for which we chose the LED panel of our photobox as the illuminant, computed with the obtained reduced scattering and absorption coefficients, to the simulation with the measured properties of the dental restoration material, shown in Figure 3. There are mismatches in both the refractive index and anisotropy factor between the dental material and the 3D printing materials in our set. The refractive indices of the dental material and 3D printing materials at 400 n m are n ref ( 400   n m ) = 1.545 and n mat ( 400   n m ) = 1.505 , respectively. The anisotropy factor of the dental material was assumed to be 0.75, while the anisotropy factors of the reconstruction materials are approximately 0.4, as previously determined in [16]. The direct and ratio optical property matching methods do not account for these differences, which may therefore result in increased Δ E values. In contrast, the reflectance and colour-difference optimisation methods can compensate for reflectance and colour errors due to the refractive index mismatch by adjusting the concentrations accordingly.
We find that the optimisation approaches produce different results when we compute the mean Δ E value over the entire tooth and within two ROIs near the base and top of the tooth, as marked in Figure 3. The results are listed in Table 1. As described in Section 2.2, direct optical property matching theoretically produces the best results but due to the limitations of our material set, particularly the availability of only one scattering material, we can only produce moderate Δ E values. Nonetheless, we find a well-reproduced translucency on the left side of the tooth, due to the best match of the optical properties. Here, we use the term translucency to refer specifically to the contribution of photons that are transmitted through the tooth material and then contribute to its colour appearance. In the following, we therefore refer to discrepancies in such regions as translucency errors, distinguishing them from colour differences that arise predominantly from reflected light. Conversely, the ratio fit yields a slightly better colour match in the middle of the tooth but increases the error in translucency. Both the reflectance and Δ E optimisations produce better results regarding the colour in the middle and on the right side of the teeth. Yet, this comes at the cost of slightly increased translucency errors on the left side. With the limitations of each method in mind, we chose to optimise the Δ E values in the subsequent fits.

3.2. Metamerism of the Colour Optimisation

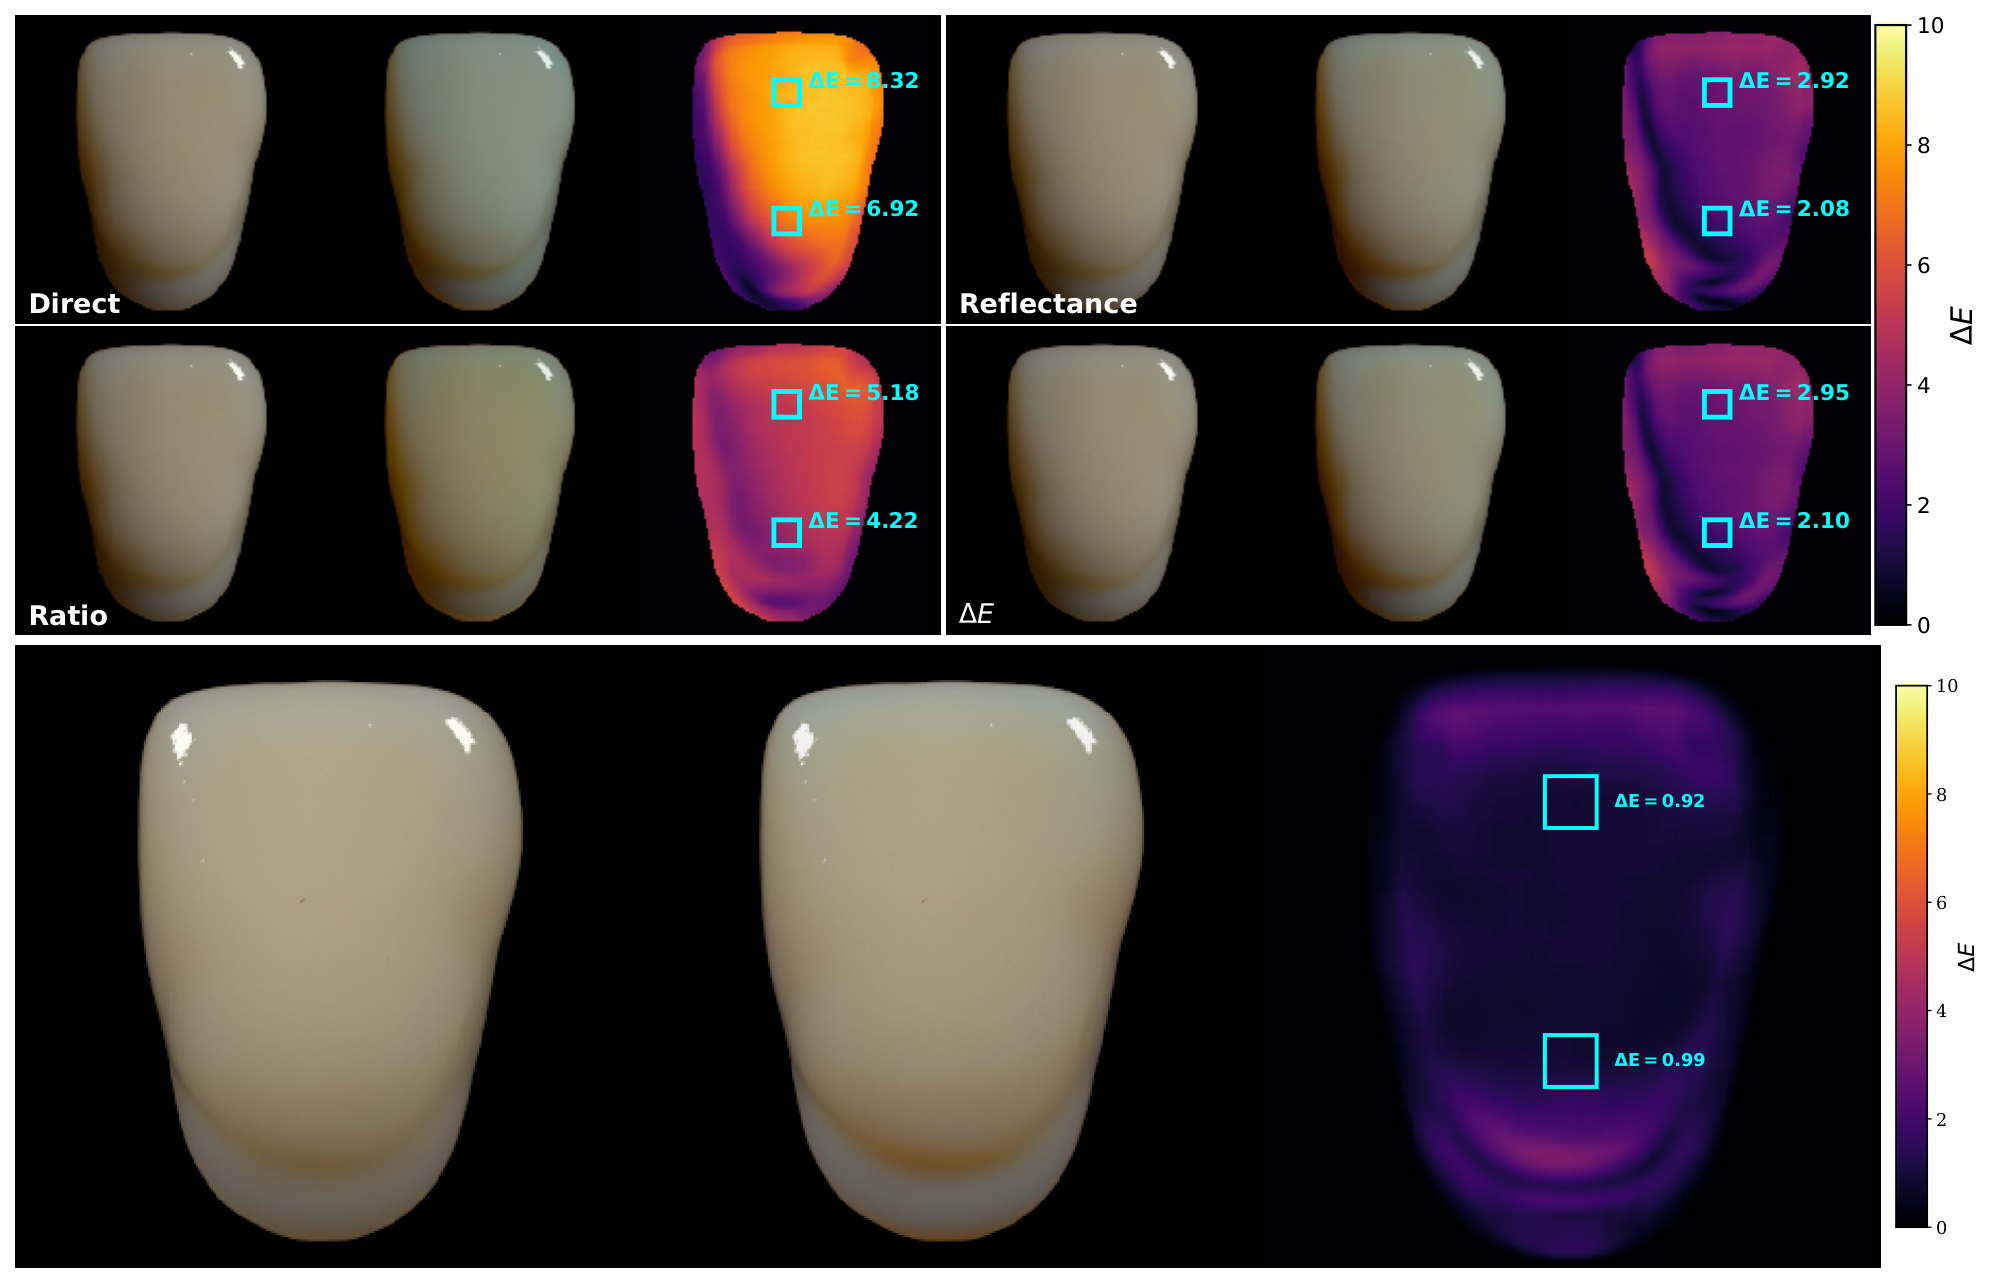
Next, we investigated the metamerism affecting the Δ E optimisation. For this, we examined two variations of the lighting setup. Firstly, we changed the illumination characteristics of the light source used for the forward renderings from the previously measured LED-panel illumination to a standard D65 illuminant. The resulting images are shown in the upper part of Figure 4.
For the same optical properties, we now obtain new colour differences listed in Table 2. The results show that changing the illuminant can influence the colour difference because different illuminants have different spectral intensity distributions and therefore weight the contributions of discrepancies in the optical properties differently. This can increase or decrease the colour difference. The main difference between our LED panel and D65 illumination lies in the spectral weighting at different wavelengths. For example, shorter wavelengths contribute only weakly using our LED panel [18], whereas they are weighted much more strongly under D65 illumination. Consequently, colour differences arising from mismatches in the optical properties in this spectral range are amplified under D65. For example, the direct matching method exhibits the largest increase in Δ E when changing the illuminant. This can be attributed to the mismatch in the reduced scattering coefficient towards 400 n m , while the absorption coefficient remains well matched, cf. Figure 2. The resulting increase in reflectance is visible as a bluish hue in the rendering shown in Figure 4. In contrast, the ratio method also exhibits a scattering mismatch at shorter wavelengths, but this is compensated, by design, by a corresponding increase in absorption.
Secondly, we changed the setup from one light source to two light sources on opposite sides of the tooth while keeping the material exactly the same. This was done to illustrate how the lighting setup can mask the error in translucency. We used the optical properties from the Δ E optimisation from Figure 4 with the double-light-source setup and obtained substantially reduced colour differences of Δ E ¯ = 1.24 , Δ E ¯ top = 0.92 , and Δ E ¯ bottom = 0.99 , shown in the lower part of Figure 4. This is a direct result of the light-source arrangement, which masks the contribution of photons travelling through the tooth to the previously unilluminated side. Illuminating the tooth from both sides reduces their relative contribution to the observed colour appearance.

3.3. Shade Guide Fit Results

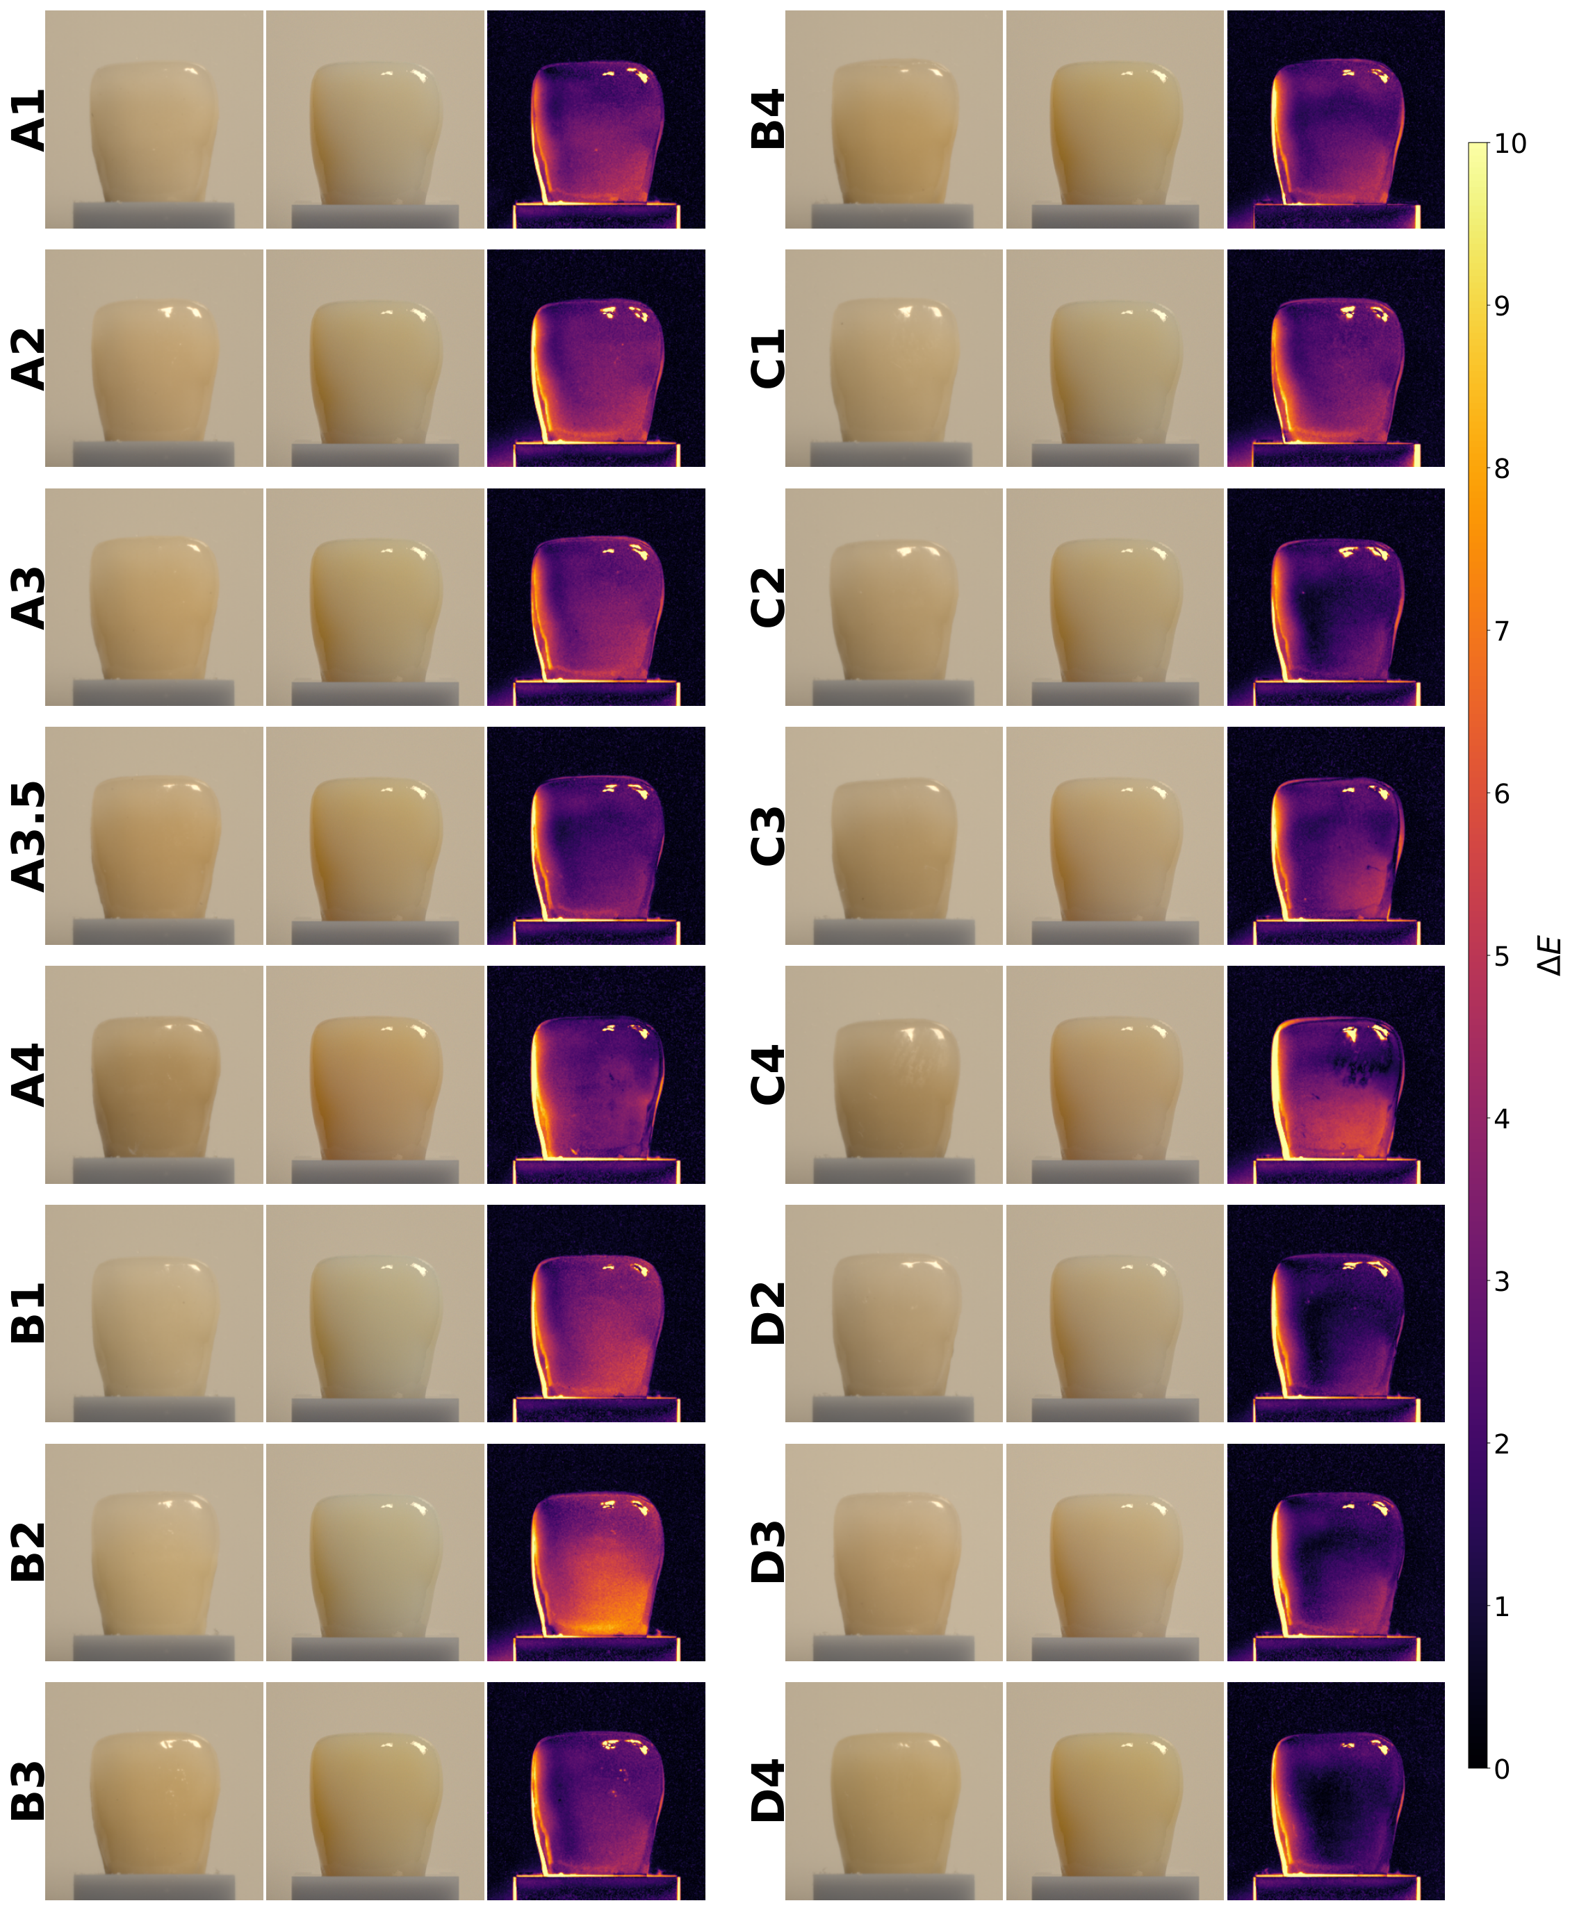
As described in Section 2.3, we recorded a full set of spectrally filtered images for each of the 16 teeth in the VITA classical shade guide in our photobox. The photobox configuration and the tooth holder are described in Section 2.3 and Figure 1. The six spectral images were then combined to produce sRGB images, shown on the left in each triplet in Figure 5. This procedure is described in detail in [18].
We then used a full 3D model of the tooth, the background cube, and the holder to simulate the scene recorded in the photobox and ran the Δ E optimiser to recover the concentrations of the materials of the Stratasys printer that best match the colour appearance of each tooth. For the initial parameters, we started with uniformly distributed concentrations of 1/6. The brightness calibration to match the simulation to the photographs was performed by removing the tooth and the grey holder and then recording the white background cube. Since the optical properties of the cube material are known very accurately, the corresponding scene was rendered and used as an independent measurement to calibrate all images. This procedure is described in detail in [18,20]. Using the hardware mentioned in Section 2.1 and our chosen initial values, the fit typically converges within 10 to 25 iterations. For each wavelength, 2 × 10 9 photons are simulated to ensure good statistical accuracy. Since each iteration involves computations at six wavelengths, a single iteration takes approximately 12 min. Renderings of the best-fit result for each tooth colour are shown in the middle image of each triplet in Figure 5. The corresponding Δ E maps are also shown. The colour difference on the background cube remains well below Δ E = 1 . The holder shows slightly elevated Δ E values with peaks at the edges where it is slightly misaligned. However, apart from the edges, the colour difference remains Δ E 1 . Two areas of the tooth consistently show elevated Δ E values: the upper-right region, where specular reflections occur, and the left side, where translucency errors appear most prominently. The specular reflections mostly have the same shape as those shown in the renderings. However, their position, shape, and size vary in the photographs because of differences between the surfaces of the recorded teeth and their representation in the 3D scan, as well as misalignment between the photographs and simulations.
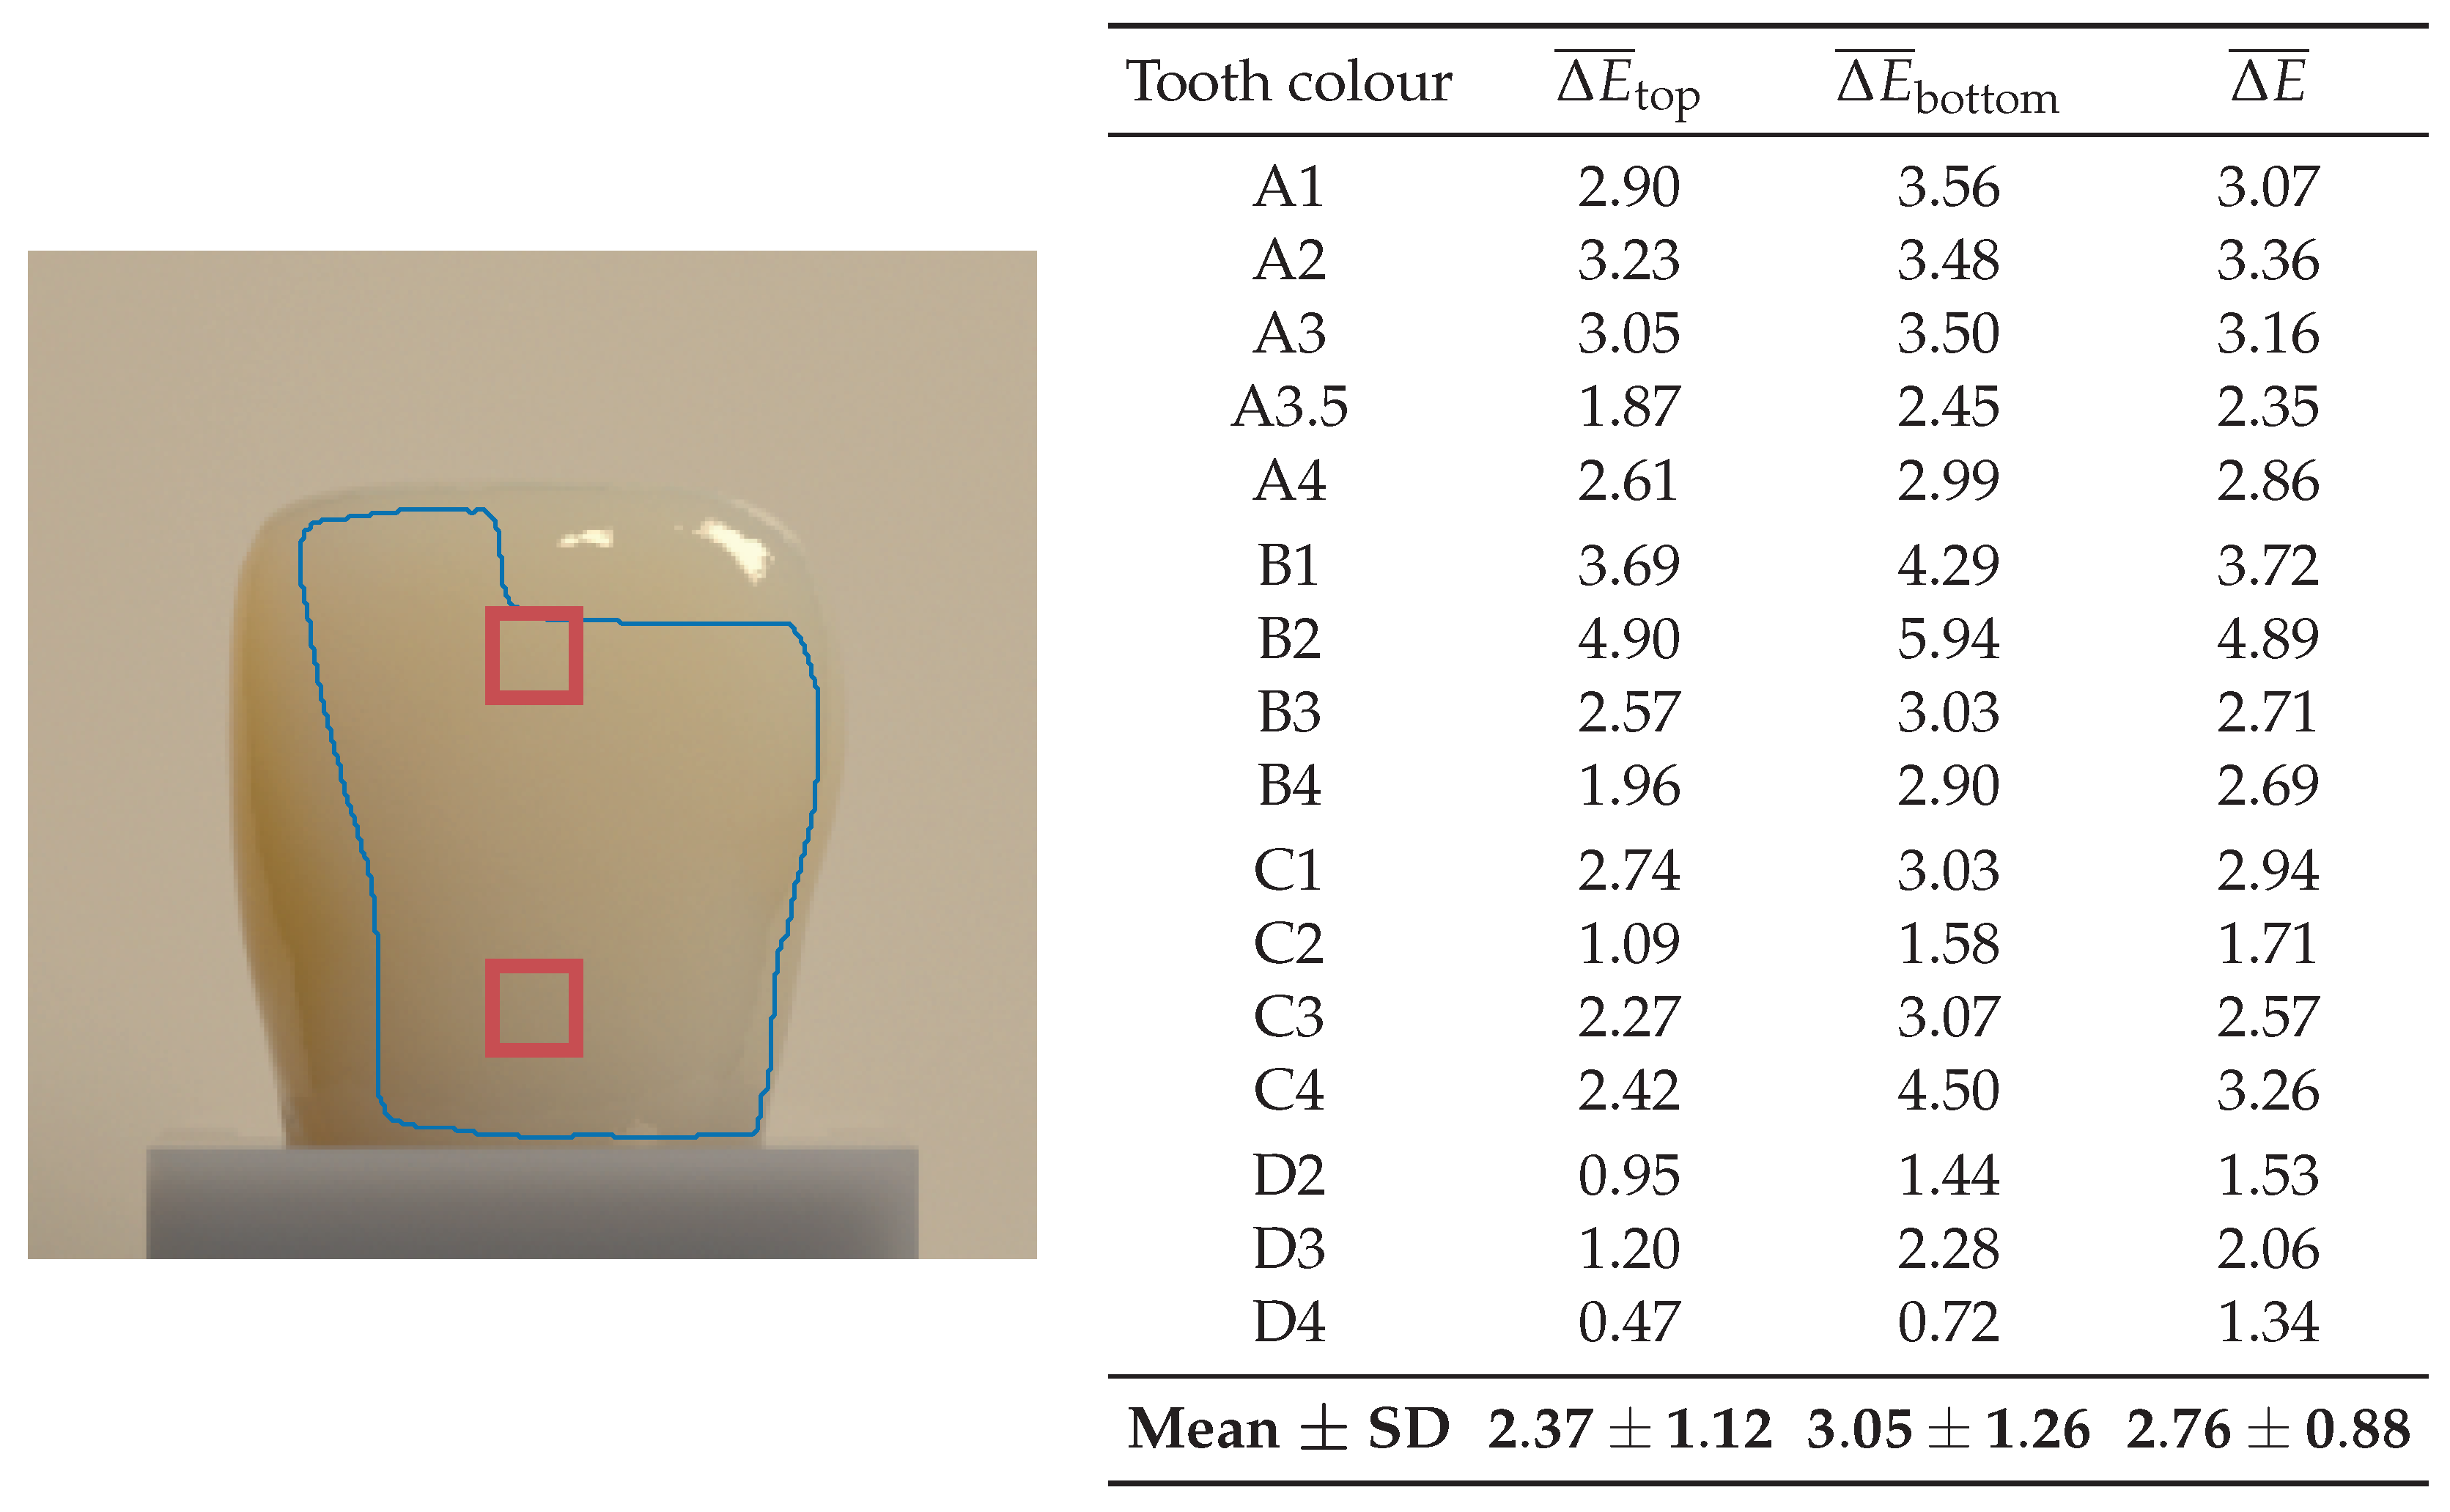
The regions of the tooth that we then examined to compute the colour differences between the shade-guide teeth and the fitted restoration material compositions are shown in Figure 6. In the marked blue region, we excluded both areas that showed systematically increased colour differences. Again, we defined two additional ROIs: one close to the top and one close to the bottom of the tooth. The resulting Δ E values for these three ROIs are listed in the table shown in Figure 6.
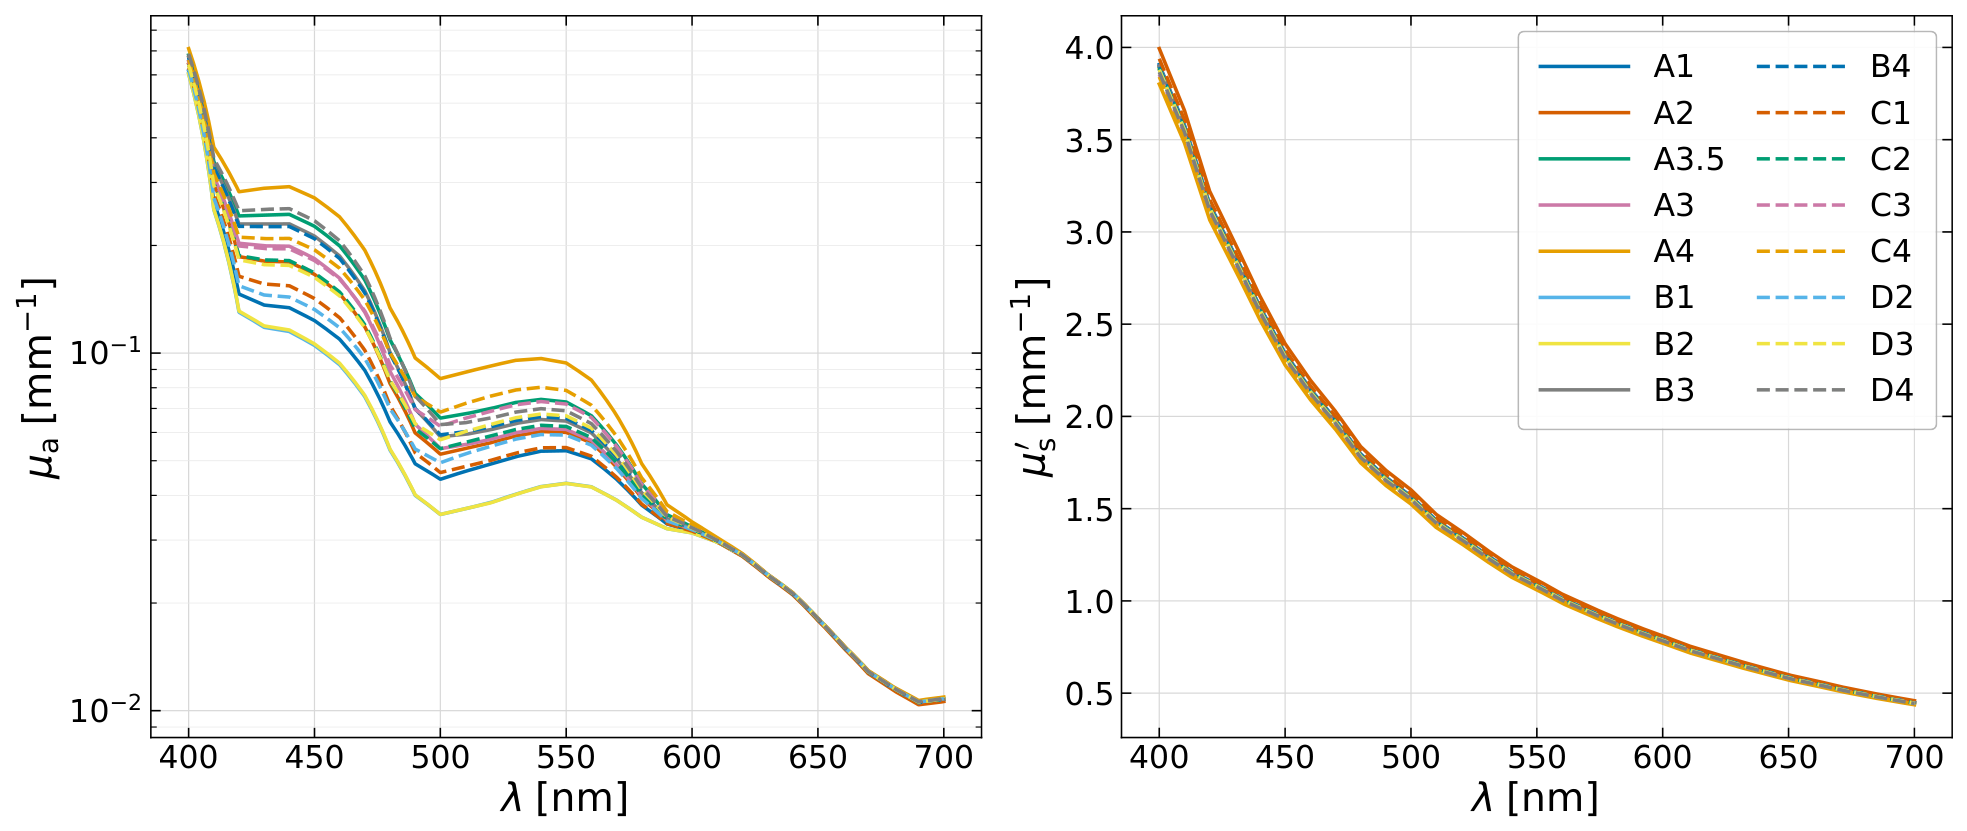
Additionally, we show the resulting μ a and μ s curves for each fitted colour in Figure 7. We find that the reduced scattering does not vary substantially between the tooth colours, but we can see clear differences in the absorption curves over the range of 400 n m to 600 n m , with the curves being nearly identical at wavelengths above 600 n m . Looking at the absorption curves of the Stratasys materials [16], the two main components for this absorption behaviour above 600 n m are cyan and clear.
The corresponding recovered concentrations of the six materials are listed in Table 3. These values represent the proportions of each material in the mixtures that can be 3D printed to fabricate the restorations shown in Figure 5. The results indicate that the black material contributes only minimally across all iterations, suggesting that it could be omitted from the material set without substantially affecting the reproduction of the target tooth colour range. This demonstrates that our method cannot only determine suitable material concentrations, but also identify materials that are unnecessary for reproducing a given colour range. Such information enables a principled preselection of materials, which is particularly useful in practical systems where only a limited number of materials can be made available simultaneously.

4. Discussion

In this work, we presented a measurement- and simulation-based workflow for determining multi-material compositions of a 3D printer that reproduce the colour appearance of dental shade-guide teeth. Spectrally resolved images of the 16 teeth of the VITA classical A1–D4 shade guide were recorded under controlled illumination and viewing conditions and compared with corresponding MC renderings. By iteratively varying the concentrations of six characterised Stratasys Vero and VeroUltra materials, we recovered a homogeneous, monolithic material composition for each tooth colour that can, in principle, be directly transferred to a compatible multi-material printing system.
We first compared four approaches for determining the material composition: direct matching of the optical properties, matching of their ratio, matching of the spectral reflectance, and minimisation of the perceptual colour difference. Although matching the intrinsic optical properties would theoretically provide the greatest independence from geometry and illumination, its performance was restricted by the available material set. In particular, VeroUltraWhite was the only constituent that provided control over scattering, meaning that the wavelength dependence of the reduced scattering coefficient could be scaled but not spectrally altered. The reflectance and colour-based methods could compensate for discrepancies in scattering and differences in refractive index because errors in the different optical properties are compensated mutually. We therefore selected the Δ E -based approach for the shade-guide optimisation.
For the 16 VITA tooth colours, the recovered mixtures produced, for the illuminant and lighting setup in our photobox, a mean colour difference within the evaluated tooth region of approximately Δ E ¯ = 2.76 across all teeth. The lowest colour differences were obtained for D4, D2, and C2, while B2 showed the largest remaining discrepancy. Thus, the achievable accuracy varied across the shade guide rather than following a uniform trend. Nevertheless, the simulations provided an individual printable material formulation for each reference tooth. The recovered optical properties further indicated that the tooth colour differences were governed predominantly by variations in absorption between approximately 400 n m and 600 n m , while the reduced scattering coefficients varied comparatively little. Above approximately 600 n m , the absorption curves were also largely similar. This suggests that the same base material with different added absorbers might have been used in the manufacture of the shade guide. Using the examined material set and homogeneous tooth model, differentiation between the VITA tooth colours is achieved mainly through changes in the coloured absorbing materials rather than through changes in scattering. The resulting concentrations constitute concrete manufacturing parameters rather than only a colour description and may therefore serve as input for subsequent printing experiments.
Several factors explain the remaining differences between the recorded and rendered teeth. Elevated Δ E values occurred consistently near specular highlights and along translucent edge regions. The specular deviations are likely caused by differences between the scanned and actual tooth surfaces and by residual errors in the alignment of the camera, light source, tooth, and simulation geometry. Even small geometric deviations can alter the position, shape, and intensity of a specular reflection. Furthermore, we observed that the shape of the teeth varied between the different teeth in the shade guide.
The investigation of metamerism demonstrates that the recovered compositions must be interpreted in relation to the optimisation conditions. When the illuminant was changed from the calibrated LED panel to D65, the mean colour difference of the theoretical Δ E -optimised material increased from 1.47 to 2.73. Conversely, introducing a second light source reduced the value to 1.24 by decreasing the relative contribution of transmitted light and thereby masking discrepancies in translucency. Consequently, a low colour difference under one illumination configuration does not necessarily imply that the material reproduces the intrinsic optical behaviour of the reference. The current mixtures are optimised to reproduce appearance under the defined photobox conditions and may show different agreement under clinical lighting, daylight, or illumination from multiple directions. This dependence is particularly relevant for dental restorations, which are viewed under a wide range of lighting conditions. This can be addressed by developing 3D printing materials with optical properties that more closely match those of real teeth, for which our workflow can also be used. Additionally, simultaneous colour optimisation across a comprehensive set of illuminants and lighting configurations could yield a solution that is largely insensitive to these metamerism effects.
Despite these limitations, the presented approach offers several practical advantages. The optical properties of the available printing materials need to be characterised only once. A new target tooth can subsequently be recorded with the spectrally selective camera setup, after which the optimisation provides the material concentrations required to approximate its appearance. In contrast to manual shade selection or empirical trial-and-error printing, the workflow establishes a quantitative connection between a measured tooth, a physics-based prediction of its appearance, and a printable material formulation. The computational cost of the optimisation should also be considered when assessing the practical applicability of the workflow. In the present implementation, determining the composition for a single tooth required approximately two to five hours, depending on the number of optimisation iterations. These runtimes were obtained using deliberately non-informative initial concentrations, with all six constituent materials initialised uniformly at 1/6, reflecting the assumption that no prior knowledge of the target composition was available. The required number of iterations could therefore be reduced by using informed initial compositions that are already closer to the expected tooth appearance, for example, based on previously optimised restorations or an approximate initial colour match. In addition, the computational time is strongly dependent on the available hardware and degree of parallelisation. In particular, the MC simulations for the six evaluated wavelengths can be performed concurrently within each iteration, providing a straightforward route to substantially shorter runtimes on systems with sufficient computational resources. Alternatively, a neural network could be trained using simulated data generated by our workflow, providing a fast means of computing the colour match for a given material set included within the range of the training data. Simulation times on the order of seconds or less appear feasible for recovering the concentrations of 3D-printed materials. Our workflow could therefore be used by dental laboratories, restoration manufacturers, or material developers to determine starting compositions for customised crowns, denture teeth, veneers, or other aesthetic restorations. Although demonstrated here for dental colour reproduction, the workflow itself is not specific to dental applications. In principle, it can be applied to any object or application for which a target colour appearance is to be reproduced using a given set of characterised constituent materials. The method may also support the development and evaluation of material libraries for new multi-material printing systems. For example, in dental applications, the optical properties of the 3D-printing materials should be selected to more closely match those of established restoration teeth or, ideally, those of natural teeth.
Future work should first validate the calculated concentrations through physical printing of the 16 shade-guide teeth and comparison with both the simulations and the original references. Measurements under multiple illuminants would make it possible to quantify metamerism and to formulate an optimisation objective that considers several lighting conditions simultaneously. For the dental application studied in this work, expanding the material set with additional independently controllable scatterers and absorbers with more diverse spectral behaviour would improve the ability to reproduce both absorption and scattering and may provide more stable appearance across illuminants. More generally, for colour appearance reproduction, increasing the number of available materials would be ideal. Importantly, the composition of such an extended material set need not be selected heuristically. Within our workflow, candidate constituent materials can be evaluated with respect to a prescribed target colour range to quantify their contribution to the attainable reproduction space and to identify redundant or insufficiently informative components. This enables the material basis to be systematically optimised for a given application, yielding application-specific material sets that balance reproduction capability against constraints on the number of independently addressable materials. Denser spectral acquisition could likewise capture narrow spectral features that are not resolved by the six wavelengths used in this work.
A further important development will be the transition from a homogeneous material model to spatially varying and layered restorations, such as the star-shaped descriptor for layering used by Simon et al. [4]. Separate enamel- and dentine-like regions, local control of translucency, or voxel-wise material optimisation could reproduce the internal optical structure of teeth, such as tubules, more closely and reduce the systematic errors observed at translucent edges. Such models could be informed by three-dimensional geometry and colour data acquired with improved spectral intraoral scanners or dedicated extraoral measurement systems. Automated registration of the measured tooth and the simulation geometry would also reduce errors around highly curved surfaces and specular reflections. Further, the workflow could be integrated into a digital dental manufacturing chain in which a patient-specific tooth is measured, the spatial material distribution is calculated, and the resulting restoration is manufactured with minimal manual colour adjustment.

5. Conclusions

In conclusion, the results of this work demonstrate that our physics-based inverse rendering and measurement setup translates the colour appearance of dental shade references into specific multi-material printing compositions. Even with the simplifying assumption of a homogeneous tooth and a limited set of printing materials, the method reproduced the general appearance of all 16 VITA classical shades with moderate perceptual colour differences. With physical print validation, improved material sets, multi-illuminant optimisation, and spatially resolved material models, the approach could provide a practical basis for reproducible and increasingly automated colour customisation of additively manufactured dental restorations. More generally, because the workflow is based on measured target appearance and characterised constituent materials rather than on application-specific dental parameters, the same approach could be extended to other colour-critical reproduction tasks in which accurate and reproducible colour appearance matching is required.

Author Contributions

P.N.: Conceptualisation, Methodology, Software, Formal Analysis, Resources, Data Curation, Writing—Original Draft. D.H.: Software, Validation, Writing—Review and Editing. M.W.: Resources, Data Curation. J.J.: Resources, Data Curation. F.F.: Resources, Data Curation. A.K.: Conceptualisation, Supervision, Validation, Writing—Review and Editing. All authors have read and agreed to the published version of the manuscript.

Funding

This research was funded by the Deutsche Forschungsgemeinschaft (DFG, German Research Foundation)—Project number 494559609.

Data Availability Statement

The data underlying the results presented in this paper are not publicly available at this time but may be obtained from the authors upon reasonable request.

Conflicts of Interest

The authors declare no conflicts of interest.

References

  1. Fondriest, J. Shade Matching in Restorative Dentistry: The Science and Strategies. Int. J. Periodontics Restor. Dent. 2003, 23, 467–479. [Google Scholar]
  2. EL-Etreby, A.S. Intraoral characterization of monolithic ceramics: The “Triple R” protocol. Future Dent. J. 2018, 4, 268–273. [Google Scholar] [CrossRef] [Scilit]
  3. El-Etreby, A.; McLaren, E.A. A Step-by-Step Technique to Create an Ideal Color Match, Form, and Surface Texture to All-Ceramic Restorations. J. Esthet. Restor. Dent. 2024, 36, 65–77. [Google Scholar] [CrossRef] [Scilit] [PubMed]
  4. Simon, A.; Chen, D.; Urban, P.; Duveiller, V.; Lübbe, H. Color Matching and Biomimicry for Multi-Material Dental 3D Printing. In Proceedings of the Special Interest Group on Computer Graphics and Interactive Techniques (SIGGRAPH Conference Papers ′25); Association for Computing Machinery: New York, NY, USA, 2025; pp. 1–11. [Google Scholar] [CrossRef] [Scilit]
  5. Vichi, A.; Louca, C.; Corciolani, G.; Ferrari, M. Color Related to Ceramic and Zirconia Restorations: A Review. Dent. Mater. 2011, 27, 97–108. [Google Scholar] [CrossRef] [Scilit] [PubMed]
  6. Joiner, A.; Hopkinson, I.; Deng, Y.; Westland, S. A review of tooth colour and whiteness. J. Dent. 2008, 36, 2–7. [Google Scholar] [CrossRef] [Scilit] [PubMed]
  7. Battersby, P.D.; Battersby, S.J. Measurements and modelling of the influence of dentine colour and enamel on tooth colour. J. Dent. 2015, 43, 373–381. [Google Scholar] [CrossRef] [Scilit] [PubMed]
  8. Hariri, I.; Sadr, A.; Shimada, Y.; Tagami, J.; Sumi, Y. Effects of structural orientation of enamel and dentine on light attenuation and local refractive index: An optical coherence tomography study. J. Dent. 2012, 40, 387–396. [Google Scholar] [CrossRef] [Scilit] [PubMed]
  9. Tabatabaian, F. Color in Zirconia-Based Restorations and Related Factors: A Literature Review. J. Prosthodont. 2018, 27, 201–211. [Google Scholar] [CrossRef] [Scilit] [PubMed]
  10. Tabatabaian, F.; Beyabanaki, E.; Alirezaei, P.; Epakchi, S. Visual and Digital Tooth Shade Selection Methods, Related Effective Factors and Conditions, and Their Accuracy and Precision: A Literature Review. J. Esthet. Restor. Dent. 2021, 33, 1084–1104. [Google Scholar] [CrossRef] [Scilit] [PubMed]
  11. Brunton, A.; Arikan, C.A.; Tanksale, T.M.; Urban, P. 3D Printing Spatially Varying Color and Translucency. ACM Trans. Graph. 2018, 37, 157. [Google Scholar] [CrossRef] [Scilit]
  12. McLaren, E.A.; Figueira, J.; Goldstein, R.E. A technique using calibrated photography and photoshop for accurate shade analysis and communication. Compend. Contin. Educ. Dent. 2017, 38, 106–113. [Google Scholar] [PubMed]
  13. Jorquera, G.J.; Atria, P.J.; Galán, M.; Feureisen, J.; Imbarak, M.; Kernitsky, J.; Cacciuttolo, F.; Hirata, R.; Sampaio, C.S. A Comparison of Ceramic Crown Color Difference Between Different Shade Selection Methods: Visual, Digital Camera, and Smartphone. J. Prosthet. Dent. 2022, 128, 784–792. [Google Scholar] [CrossRef] [Scilit] [PubMed]
  14. Marinello, C.P.; Brugger, R. Digital removable complete denture—An overview. Curr. Oral Health Rep. 2021, 8, 117–131. [Google Scholar] [CrossRef] [Scilit]
  15. Brunton, A.; Arikan, C.A.; Urban, P. Pushing the Limits of 3D Color Printing: Error Diffusion with Translucent Materials. ACM Trans. Graph. 2015, 35, 4. [Google Scholar] [CrossRef] [Scilit] [PubMed]
  16. Kissel, A.; Nguyen, P.; Hevisov, D.; Foschum, F.; Kienle, A. Optical property-based rendering of 3D prints. Opt. Express 2025, 33, 15187–15206. [Google Scholar] [CrossRef] [Scilit] [PubMed]
  17. Nguyen, P.; Hevisov, D.; Foschum, F.; Kienle, A. Recovering the Reduced Scattering and Absorption Coefficients of Turbid Media from a Single Image. Photonics 2025, 12, 1118. [Google Scholar] [CrossRef] [Scilit]
  18. Nguyen, P.; Hevisov, D.; Wagner, M.; Jelken, J.; Foschum, F.; Kienle, A. Validation of a Single-Image Inverse Rendering Setup for Optical Property Estimation in Turbid Materials. Photonics 2026, 13, 242. [Google Scholar] [CrossRef] [Scilit]
  19. Chandrasekhar, S. Radiative Transfer; Courier Corporation: North Chelmsford, MA, USA, 2013. [Google Scholar]
  20. Hevisov, D.; Foschum, F.; Wagner, M.; Kienle, A. Physically accurate rendering of translucent objects. Opt. Express 2025, 33, 22791–22804. [Google Scholar] [CrossRef] [Scilit] [PubMed]
  21. Transtrum, M.K.; Sethna, J.P. Improvements to the Levenberg-Marquardt algorithm for nonlinear least-squares minimization. arXiv 2012, arXiv:1201.5885. [Google Scholar]
  22. Has, M. Color management-current practice and the adoption of a new standard. Proc. TAGA 1995, 2, 748–771. [Google Scholar]
  23. Gómez-Polo, C.; Muñoz, M.P.; Luengo, M.C.L.; Vicente, P.; Galindo, P.; Casado, A.M.M. Comparison of the CIELab and CIEDE2000 color difference formulas. J. Prosthet. Dent. 2016, 115, 65–70. [Google Scholar] [CrossRef] [Scilit] [PubMed]
  24. Sharma, G.; Wu, W.; Dalal, E.N. The CIEDE2000 color-difference formula: Implementation notes, supplementary test data, and mathematical observations. Color Res. Appl. 2005, 30, 21–30. [Google Scholar] [CrossRef] [Scilit]
  25. Foschum, F.; Bergmann, F.; Kienle, A. Precise determination of the optical properties of turbid media using an optimized integrating sphere and advanced Monte Carlo simulations. Part 1: Theory. Appl. Opt. 2020, 59, 3203–3215. [Google Scholar] [CrossRef] [Scilit] [PubMed]
  26. Liemert, A.; Reitzle, D.; Kienle, A. Analytical solutions of the radiative transport equation for turbid and fluorescent layered media. Sci. Rep. 2017, 7, 3819. [Google Scholar] [CrossRef] [Scilit] [PubMed]
  27. Khronos Group: OpenCL for Parallel Programming of Heterogeneous Systems. 2026. Available online: https://www.khronos.org/opencl/ (accessed on 11 August 2026).
  28. Metropolis, N.; Ulam, S. The Monte Carlo method. J. Am. Stat. Assoc. 1949, 44, 335–341. [Google Scholar] [CrossRef] [Scilit]
  29. Martelli, F.; Binzoni, T.; Del Bianco, S.; Liemert, A.; Kienle, A. Light Propagation Through Biological Tissue and Other Diffusive Media: Theory, Solutions, and Validations; SPIE Press: Bellingham, WA, USA, 2022. [Google Scholar]
  30. Henyey, L.G.; Greenstein, J.L. Diffuse radiation in the galaxy. Astrophys. J. 1941, 93, 70–83. [Google Scholar] [CrossRef] [Scilit]
  31. Fresnel, A.J. Mémoire sur la loi des Modifications que la Réflexion Imprime à la Lumière Polarisée; De l’Imprimerie De Firmin Didot Fréres: Paris, France, 1834. [Google Scholar]
  32. Stratasys. Vero PolyJet Materials. Available online: https://www.stratasys.com/en/materials/materials-catalog/polyjet-materials/vero/ (accessed on 25 July 2026).
  33. Stratasys. VeroUltra PolyJet Materials. Available online: https://www.stratasys.com/en/materials/materials-catalog/polyjet-materials/veroultra/ (accessed on 25 July 2026).
  34. Glöckler, F.; Reitzle, D.; Gierke, A.M.; Kienle, A. Radiative transfer equation-based color prediction and color adjustment strategies. J. Opt. Soc. Am. 2023, 40, 549–559. [Google Scholar] [CrossRef] [Scilit] [PubMed]
  35. Bergmann, F.; Foschum, F.; Zuber, R.; Kienle, A. Precise determination of the optical properties of turbid media using an optimized integrating sphere and advanced Monte Carlo simulations. Part 2: Experiments. Appl. Opt. 2020, 59, 3216–3226. [Google Scholar] [CrossRef] [Scilit] [PubMed]
  36. Amendola, C.; Maffeis, G.; Farina, A.; Spinelli, L.; Torricelli, A.; Pifferi, A.; Sassaroli, A.; Fanelli, D.; Tommasi, F.; Martelli, F. Application limits of the scaling relations for Monte Carlo simulations in diffuse optics. Part 1: Theory. Opt. Express 2023, 32, 125–150. [Google Scholar] [CrossRef] [Scilit] [PubMed]
  37. Amendola, C.; Maffeis, G.; Farina, A.; Spinelli, L.; Torricelli, A.; Pifferi, A.; Sassaroli, A.; Fanelli, D.; Tommasi, F.; Martelli, F. Application limits of the scaling relations for Monte Carlo simulations in diffuse optics. Part 2: Results. Opt. Express 2024, 32, 26667–26689. [Google Scholar] [CrossRef] [Scilit] [PubMed]
  38. VITA Zahnfabrik. VITA Classical A1-D4 Farbskala. 2026. Available online: https://www.vita-zahnfabrik.com/de/VITA-classical-A1-D4-Farbskala-35430.html (accessed on 27 July 2026).
  39. Wagner, M.; Fugger, O.; Foschum, F.; Kienle, A. Development of silicone-based phantoms for biomedical optics from 400 to 1550 nm. Biomed. Opt. Express 2024, 15, 6561–6572. [Google Scholar] [CrossRef] [Scilit] [PubMed]
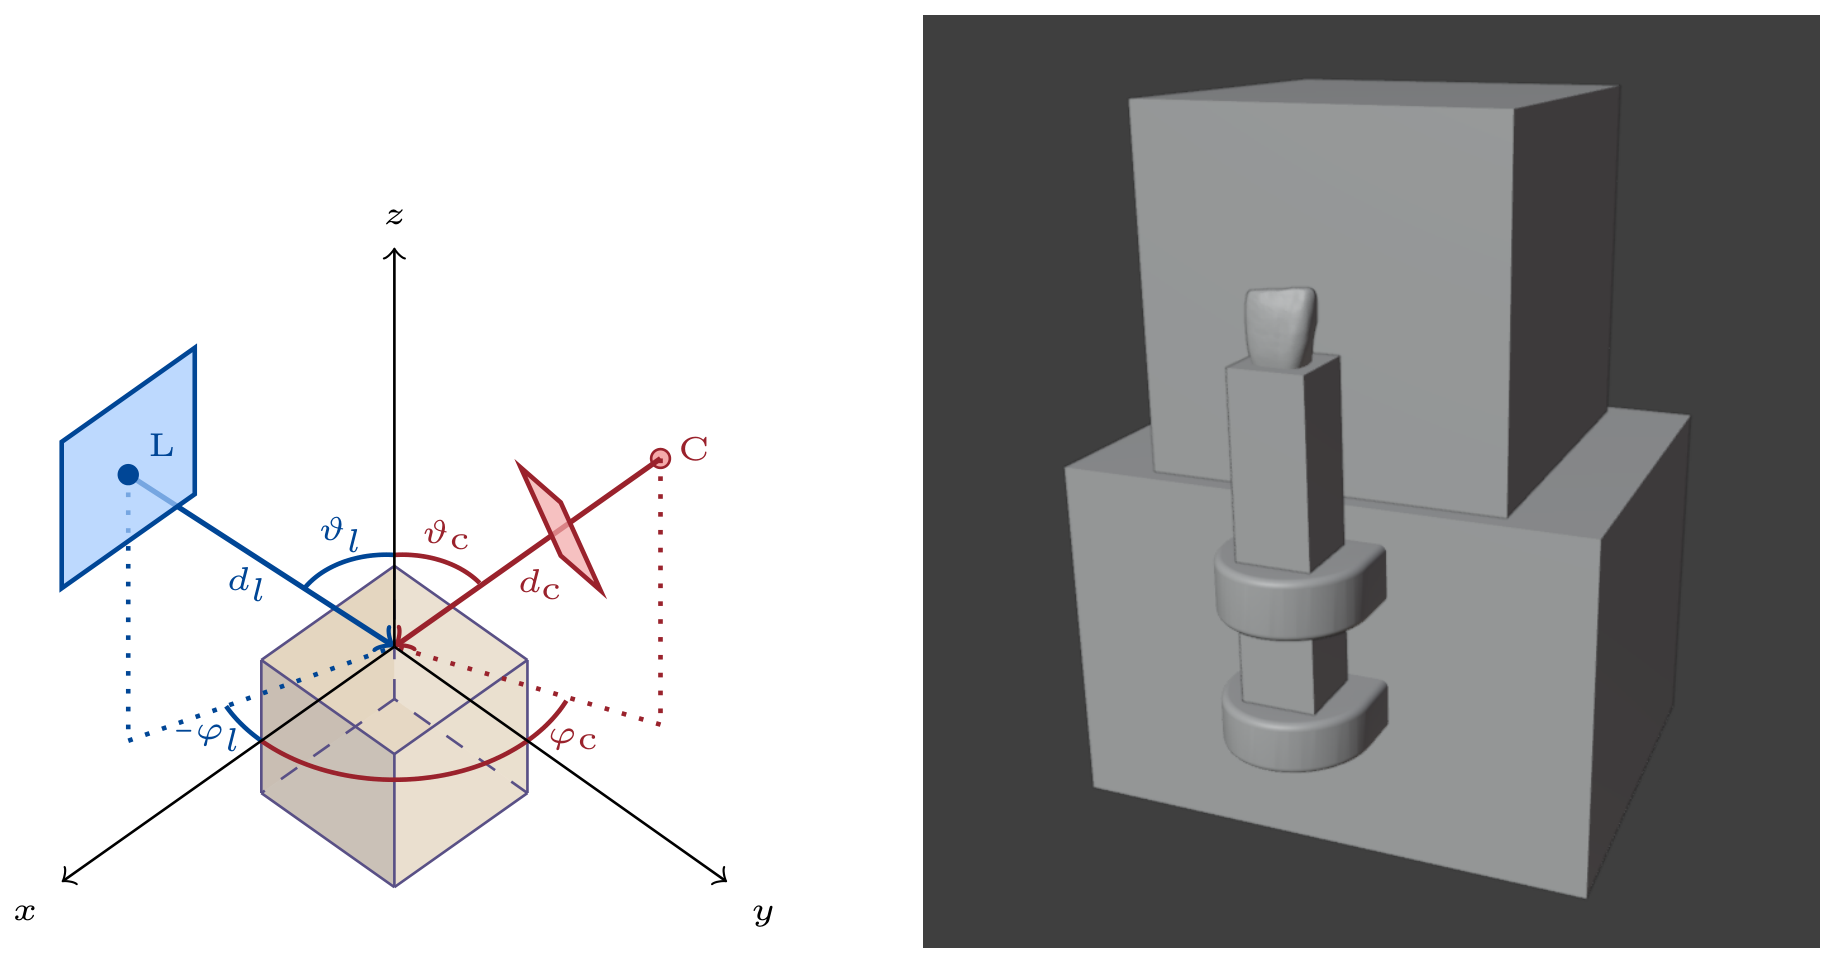
Figure 1. Schematic representation of the experimental setup used in this study. The left panel shows the general configuration of the photobox. The green spot indicates the position of the camera aperture (C), defined by the spherical coordinates ( d C , ϑ C , φ C ) . The blue spot indicates the position of the centre of the light source (L), defined by the spherical coordinates ( d l , ϑ l , φ l ) . The green rectangle represents the bandpass filters positioned in the light path towards the detector. The surface normals of both the light source and the camera are directed towards the origin. The right panel shows the 3D model of the tooth holder with a tooth placed inside. The origin of the photobox was defined as the centre of the 3D tooth model.
Photonics 13 00879 g001
Figure 2. Comparison of the recovered absorption (left) and reduced scattering (right) coefficients of the different colour optimisation strategies. The optical properties of the dental restoration material, determined with an integrating sphere, are shown as solid black lines. The results of the reflectance and Δ E optimisation are very similar, which is illustrated in the inset plot on the left.
Photonics 13 00879 g002
Figure 3. Colour differences of the forward renderings of the recovered optical properties compared to a forward rendering of the dental restoration material under the LED panel illuminant. The dental restoration material is shown on the left in each of the triplets; the fitted materials are shown in the middle in the order of direct matching (upper left), ratio matching (lower left), reflectance matching (upper right), and Δ E matching (lower right). In the Δ E maps on the right, two ROIs have been marked and the mean Δ E values are displayed next to them. All Δ E maps use the same colour scale on the right.
Photonics 13 00879 g003
Figure 4. (Upper): Colour differences of the forward renderings of the recovered optical properties, recovered under the LED panel, compared to a forward rendering of the dental restoration material under a D65 illuminant. The dental restoration material is shown on the left in each of the triplets; the fitted materials are shown in the middle in the order of direct matching (upper left), ratio matching (lower left), reflectance matching (upper right), and Δ E matching (lower right). In the Δ E maps on the right, two ROIs have been marked and the mean Δ E values are displayed next to them. (Lower): Comparison of forward renderings under a double-light-source setup and a D65 illuminant. The optical properties were taken from the Δ E matching in the upper part of this figure. The Δ E maps in the upper and lower sections use the colour scales shown on the right.
Photonics 13 00879 g004
Figure 5. Comparison of sRGB images of photographed (left) and rendered (middle) teeth from the VITA classical shade guide with the corresponding Δ E maps (right). The photographs were taken with the spectral filter setup. Each Δ E map is normalised with respect to the global colour scale on the right side. The tooth colour is noted to the left of each triplet. The colour differences for the background and the grey holder are Δ E 1 .
Photonics 13 00879 g005
Figure 6. Regions used for the colour-difference analysis of the Δ E maps shown in Figure 5. The corresponding mean Δ E values for each tooth colour are listed in the table on the right. The blue region denotes the Δ E ¯ region, whereas the red squares mark the top Δ E ¯ top and bottom Δ E ¯ bottom regions. The final row reports the mean and sample standard deviation across the 16 tooth colours.
Photonics 13 00879 g006
Figure 7. Absorption (left) and reduced scattering (right) coefficient curves of the recovered material mixtures from the Δ E fit for each of the tooth colours of the VITA classical shade guide.
Photonics 13 00879 g007
Table 1. Colour differences of the comparison of the renderings shown in Figure 3 under the LED panel illuminant.
Optimisation Δ E ¯ top Δ E ¯ bottom Δ E ¯
Direct4.213.323.25
Ratio4.073.263.75
Reflectance1.331.091.46
Δ E 1.341.081.47
Table 2. Colour differences of the comparison of the renderings shown in the upper part of Figure 4.
Optimisation Δ E ¯ top Δ E ¯ bottom Δ E ¯
Direct8.326.926.31
Ratio5.184.224.66
Reflectance2.922.082.71
Δ E 2.952.102.73
Table 3. Material concentrations, given in percent, of the six Stratasys 3D printing materials, VeroCyan, VeroMagenta, VeroYellow, VeroClear, VeroUltraBlack, and VeroUltraWhite, recovered from the Δ E fit for each tooth colour of the VITA classical shade guide. The VeroUltraBlack concentrations are reported in percent with a factor of 10 3 .
Tooth Colour c Cyan [%] c Magenta [%] c Yellow [%] c White [%] c Clear [%] c Black [ 10 3 %]
A10.280.750.364.8093.822.00
A20.270.920.514.9093.391.40
A30.280.950.584.7993.412.10
A3.50.281.250.734.7892.972.10
A40.281.780.884.6792.392.70
B10.280.490.304.7794.172.30
B20.280.490.304.7794.172.30
B30.281.030.684.7993.222.00
B40.281.060.674.7893.212.10
C10.280.780.434.8493.681.90
C20.280.980.524.7793.462.20
C30.281.220.564.7393.212.40
C40.281.390.604.7293.012.50
D20.280.890.394.7693.682.30
D30.281.090.494.7693.372.20
D40.281.150.764.7593.062.30
Disclaimer/Publisher’s Note: The statements, opinions and data contained in all publications are solely those of the individual author(s) and contributor(s) and not of MDPI and/or the editor(s). MDPI and/or the editor(s) disclaim responsibility for any injury to people or property resulting from any ideas, methods, instructions or products referred to in the content.