


Abstract
A high-performance plasmonic surface plasmon resonance (SPR) sensor with a tunable detection range is suggested in this paper. It uses gold (Au) in conjunction with yttrium lithium fluoride (YLiF4) as the adhesive layers, ensuring better sensing performance. We examined the impact of attachment-enhancing material on the sensor’s performance through simulation. According to the results, the AuYLiF4 combination has a maximum wavelength sensitivity (WS) of 24,000 nm/RIU within the analyte refractive index (RI) range of 1.33–1.335 by measuring shifts in their respective resonance wavelengths, which are distinctive at the sensing medium’s RI. Additionally, the proposed sensor attained a maximum amplitude sensitivity (AS) of 848.94 /RIU at RI = 1.33 and a figure of merit (FoM) of 111.6/RIU, achieved at maximum confinement loss. Furthermore, the suggested sensor’s application-oriented sensing performance is examined for blood plasma and krypton, showcasing its capacity to identify minute changes in RI using both wavelength and amplitude interrogation. Other key performance metrics, such as detection accuracy (DA), resolution, and full width at half maximum (FWHM), are also assessed. The sensor’s high sensitivity to analyte RI (1.33,1.335) demonstrates its ability to detect even minute variations in the sensing environment, making it well-suited for precise biomolecule sensing applications.
1. Introduction
Over the last few decades, a lot of research has been done on developing reliable, affordable biosensors that can detect extremely low analyte concentrations. Numerous sensors using a variety of technologies have been developed and manufactured to track and identify fluids and cells. Because of their promising characteristics, photonic crystal fibers (PCFs) based on photonic crystals (PhCs) have become popular options among these technologies [1,2]. PCFs are incredibly small, resistant to electromagnetic interference, can monitor over long distances, require small amounts of analytes, allow for structural design flexibility and integrate easily into a variety of systems. For applications involving optical data processing—that is, the manipulation of data using optical signals—PCFs have therefore become more and more desirable choices. A popular and highly successful sensing technique in recent years has been the combination of PCF and the surface plasmon resonance (SPR) phenomenon [3]. Several industries, including food safety, environmental monitoring, and biomedical research, could undergo a revolution thanks to SPR-based PCF biosensors [4,5]. PCF biosensors have a high sensitivity for identifying analytes and biomolecules. Accurate measurements of RI changes are made possible by the interaction of the evanescent field with the analyte on the PCF surface. Because of their high sensitivity, these sensors can detect incredibly low analyte concentrations, which makes them useful for medical diagnostics. Furthermore, their label-free detection, integration capabilities, selectivity, and real-time monitoring make them an effective tool for the targeted detection of a variety of analytes, creating new opportunities for bio sensing applications [6,7]. SPR-based PCF sensors have advanced significantly over time, utilizing a range of plasmonic materials and geometries. Single-sided flat (D-/quasi-D-shaped) PCF sensors have been designed for various applications [8,9,10]. Their improved fabrication feasibility and streamlined metal layer deposition procedure on the external flat area are the main causes of this interest. Nowadays, researchers focus on the investigation and application of the distinct optical properties displayed by two-dimensional (2D) nanomaterials like MoS2, graphene, and antimonene in the field of biosensing. These initiatives are meant to enhance the sensor’s ability to identify biological materials. However, there are some drawbacks to these materials, such as poor biocompatibility, high hydrophobicity, and difficulties with surface functionalization. To tackle these problems, scientists have focused on MXene, which offers a potential remedy. The scientific community has taken a strong interest in MXene materials in recent years because of their beneficial optical characteristics [11,12]. The advantages of PCF-SPR sensors over traditional prism SPR sensors [13] include their small size, label-free sensing, quick response time, high sensitivity, and high resolution. Moreover, the structure can be optimized by altering the metal coating and internal structure with various materials to improve the coupling between the plasma mode and the fundamental mode and, consequently, the performance [14]. The most widely used plasma materials for stimulating SPR phenomena are silver (Ag) and Au, which are coated on the PCF surface [15,16,17]. Although silver has sharper resonance loss peaks and is more likely to corrode in humid environments, which reduces detection accuracy, Au has advantages in terms of chemical stability and biocompatibility [18]. The silver can be shielded from corrosion by applying a high dielectric titanium dioxide (TiO2) film outside the metal layer, which also greatly improves the SPR sensor’s performance [19,20]. The sensing mechanisms of SPR-based PCF sensors are primarily classified as internal and external sensing. External sensing occurs when the analyte comes into direct contact with the PCF’s exterior, whereas internal sensing occurs when the analyte is filled into air holes inside the PCF to create sensing channels [21]. The inability to easily evacuate and refill the chosen air holes during measurement, as well as the challenge of producing an internal metal-coated PCF-SPR sensor, are some of the drawbacks of internal sensing.
This paper proposes a plasma sensor that uses YLiF4 as an adhesion material. The sensor uses a polarization technique and has dual polarization modes. A scanner may adjust its RI detection range by filling some air gaps in the top layer with a minor analyte at a particular RI. This paper also discusses the effects of different dielectric layers on the performance of the sensor for the given structural parameters and provides a comparative analysis of the sensor performance concerning two different dielectric layers. This sensor with a YLiF4 dielectric layer has excellent sensing capabilities, ensuring that it is effective for the detection of different biochemical, medical diagnostic, and other fluid analytes, and is suitable for biomedicine, environmental monitoring, and food safety due to its versatile characteristics.
2. Sensor Geometry and Theoretical Modelling
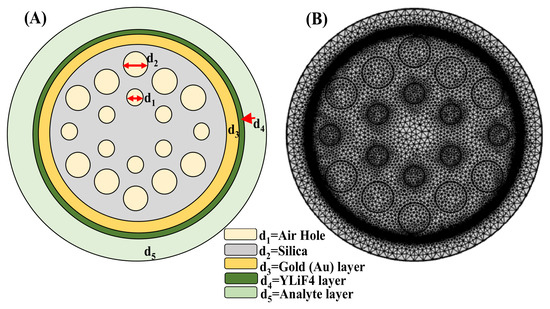
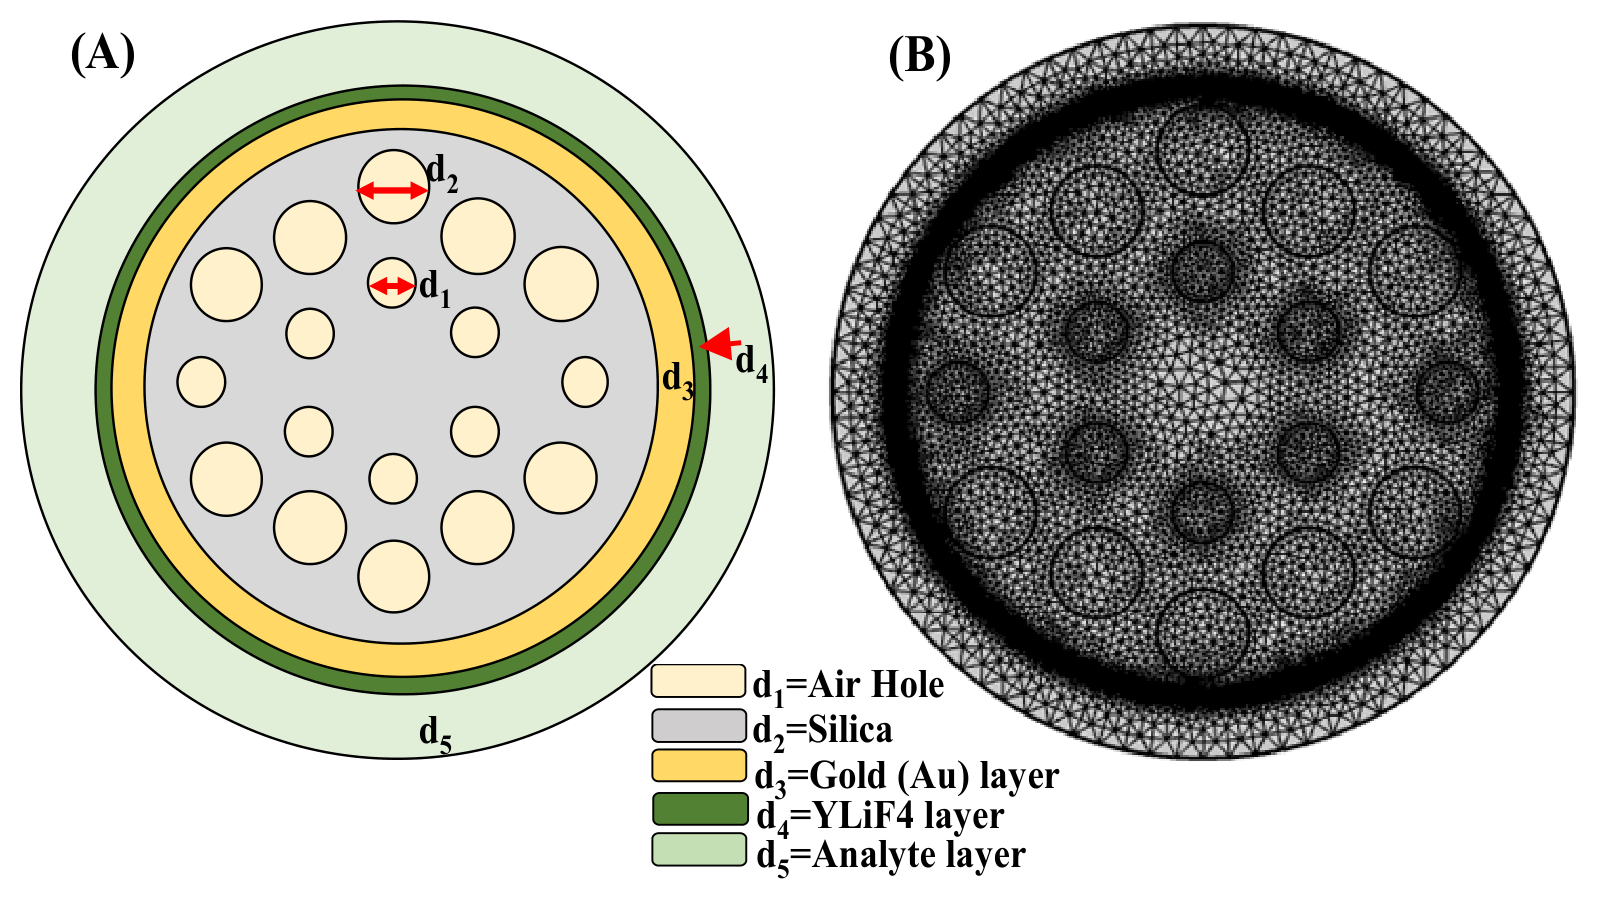
Figure 1 shows the schematic of the suggested SPR sensor, which is intended to detect analytes in the sensing layer with high sensitivity. Surface plasmons at the metal–dielectric interface are excited by incident light in the sensor setup, which uses a CaF2 prism as the coupling medium due to its low RI, wide transparency range and excellent optical transmission [22]. A thin layer of Au serves as the plasmon-supporting metal layer. Due to its strong plasmonic resonance in the visible and near-infrared spectrum, high conductivity, and relative affordability when compared to Ag and Cu, a thin layer of Au is selected as the metallic layer that supports plasmons [22]. Despite being more oxidation-prone than Ag or Au, Cu’s stability and lifetime are greatly increased when combined with protective 2D materials like graphene or BP, all the while preserving sharp resonance dips. The engineered configuration of air holes surrounding the fiber core gives a PCF-SPR structure its distinctive sensing properties. The periodic air-hole structure of a PCF offers more control over the guided optical field’s effective RI, modal confinement, and spatial distribution than a conventional optical fiber, where the modal properties are primarily dictated by the core and cladding materials. The air holes alter the fiber’s local electromagnetic environment and enable the guided mode to be designed in accordance with the plasmonic sensing structure’s specifications. A portion of the guided field interacts with the metal/dielectric/analyte interface through its evanescent component when a plasmonic layer is added to the PCF’s exterior. This interaction is thus disturbed and the phase-matching condition between the guided mode and the SPP mode is altered by a change in the analyte RI. A discernible shift in the confinement-loss peak or resonance wavelength results from the ensuing change in mode coupling. As a result, the PCF geometry offers a significant degree of flexibility for improving and managing light–analyte interaction, which is especially useful for extremely sensitive RI sensing.
Figure 1.
PCF sensor: (A) 2D cross-sectional view; (B) mesh characteristics.
The mesh structure and cross-sectional design of a plasmonic sensor based on PCF are shown in Figure 1. The schematic arrangement of the sensor, which consists of several concentric layers and internal air holes, is depicted in Figure 1A. The innermost region contains a periodic arrangement of air holes with a diameter d1 = 0.5 µm, embedded within a silica layer denoted by d2 = 0.75 µm. A thin Au layer, known as d3, surrounds the silica core with a 20–30 nm thickness, facilitating SPR, a crucial sensing mechanism. Beyond the Au coating is a layer of YLiF4 (d4 = 20–30 nm thickness), which has been used in fluorescence and laser materials and may improve optical performance. The analyte region, designated d5, is the outermost layer to which the target substances are introduced; any alteration in this layer’s RI affects the optical response of the sensor. Figure 1B displays the sensor’s mesh model, which is probably utilized for simulations using the finite element method (FEM). With denser mesh elements close to crucial layers like the Au and analyte regions to ensure higher accuracy, this meshing enables precise numerical analysis of electromagnetic wave propagation and SPR characteristics. Because of the highly sensitive detection made possible by the combination of PCF design and plasmonic coating, the structure can be used in chemical analysis and biosensing applications.
The permittivity of Au is determined by the Drude–Lorentz model using Equation (1). The Au parameter values are shown in Table 1 [21].
The fused silica RI can be determined using the Sellmeier Equation (2), where λ is the free-space wavelength; A1, A2, A3, B1, B2, and B3 stand for Sellmeier Coefficient values shown in Table 2 [23].
Table 1.
Drude–Lorentz model parameter values.
Table 2.
Determined the performance parameter with various thicknesses of the Au and YLiF4 layer.
As shown in Table 2, ΓL = frequency spectrum, ΩL = oscillator strength, ωD = plasma frequency, γD = damping frequency, ω = angular frequency, ε∞ = high frequency permittivity and ∆ε = weighted coefficient.
The RI of YLiF4 can be ascertained by applying Sellmeier dispersion Equation (3), where X1, X2, X3, Y1, and Y2 stand for Sellmeier coefficient values. The coefficient values are shown in Table 3 [24].
Table 3.
Sellmeier coefficient for fused silica and YLiF4.
3. Numerical Model Demonstration and Role of PCF Geometry in Light–Matter Interaction
An independent validation study was conducted using a previously reported PCF-SPR sensor that theoretically demonstrated sensing properties in order to confirm the dependability of the numerical approach used in this work. The reference structure was chosen because the published literature contains information on its geometrical configuration, plasmonic coating, operating wavelength range, and theoretical RI sensing results. Before applying the same numerical framework to the suggested Au/YLiF4-based PCF-SPR sensor, this validation aims to evaluate the dependability of the FEM, material modeling, mode analysis, and resonance-tracking procedure used in the current study. The structural parameters described in the corresponding theoretical study were used to replicate the geometry of the chosen reference PCF-SPR sensor. The reported thickness and complex RI data were used to introduce the plasmonic metal layer, while the wavelength-dependent RI of the silica PCF background was used to model it. The effective refractive indices of the fundamental core-guided mode and SPP mode were computed over the wavelength range examined theoretically using the finite element method to implement the numerical model. The coupling between the SPP mode and the fundamental core mode was used to determine the sensing response. Phase matching takes place when the real part of the core mode’s effective RI approaches that of the SPP mode, which causes a significant transfer of energy from the guided mode to the plasmonic mode. A clear resonance feature in the confinement-loss spectrum is produced by this mode coupling. For every analyte RI, the maximum confinement-loss peak was used to calculate the resonance wavelength. The theoretically measured results published in the literature were compared with the simulated results for the reference structure. The comparison between the corresponding wavelengths derived from the current FEM model and the theoretically reported resonance wavelengths is shown in Table 1 and Table 2. The adopted model can accurately predict the principal sensing behaviour of a PCF-SPR structure, as confirmed by the numerical results that replicate the theoretically observed variation of the resonance wavelength with analyte RI.
The periodic air-hole structure is an important part of the suggested PCF-SPR sensor since it offers more control over the guided optical mode’s propagation characteristics. The air holes create a strong RI contrast between the surrounding air regions and the silica background, which causes the PCF cross-section to have an engineered modal distribution. It is possible to control the effective RI and confinement properties of the fundamental mode by carefully choosing the air-hole diameter, pitch, number of air-hole rings, and core dimensions. A portion of the guided optical mode’s electromagnetic field extends toward the outer surface as an evanescent field, but the guided optical mode primarily propagates through the central silica region in the suggested structure. This evanescent field can interact with the plasmonic mode because the plasmonic Au layer and YLiF4 dielectric layer are present at the sensing interface. When the guided mode’s effective RI gets closer to the SPP mode’s RI, the interaction gets stronger. Energy is transferred from the core-guided mode to the plasmonic mode under this phase-matching condition, resulting in a prominent confinement-loss resonance. This mode-coupling condition is directly affected by the analyte RI. The SPP effective index is changed when the analyte RI varies because this also affects the sensing environment’s effective RI. The phase-matching wavelength shifts as a result. RI sensing in the suggested PCF-SPR configuration is based on this mechanism. Thus, by offering modal engineering and allowing control over the overlap between the guided field and the plasmonic sensing interface, the periodic air-hole structure indirectly enhances sensing. Additionally, compared to a traditional optical fiber, the PCF geometry offers more flexibility for adjusting the detection range. The effective modal index is altered by variations in the air-hole dimensions and spacing, whereas the plasmonic-mode characteristics and coupling strength are altered by variations in the Au and YLiF4 thicknesses. Consequently, the resonance wavelength can be shifted and the sensing response changed over a desired RI range by simultaneously optimizing the PCF geometry and plasmonic/dielectric layers.
4. Performance Parameters
Confinement loss(CL): The confinement loss in an enclosure can be used to measure the excitation of surface plasmons (SPs). It is a key parameter to assess the performance of the sensor and can be calculated using the formula in Equation (4) [23].
CL = 8.686 × k0 × Im(Neff) × 104 (dB/cm)
Here, λ represents the wavelength, Im(Neff) represents the imaginary component of the effective mode index and the propagation constant in free space is k0 = 2 × π/λ.
Amplitude sensitivity (SA): It is one of the critical performance parameters for refractometric sensing. It can be calculated using Equation (5).
where T(λ,nk) represents the overall confinement loss for a specific wavelength, and ∂(λ,nk) is used to denote the difference between two neighboring loss spectra, due to a small variation of nk.
Wavelength sensitivity (Sλ): It is described as the ratio of a shift in wavelength to the analyte RI of the sensor and can be calculated using Equation (6).
Here, ∆λpeak is the difference between two nearby wavelengths, and ∆nk is the difference between the nearby RIs.
Resolution (R): Equation (7) can be used to measure the resolution.
Here, ∆λmin = 0.01 refers to the spectral resolution, while ∆nk = 0.01 is the analyte RI variation.
Figure of merit (FoM): Equation (8) denotes the formula to express FoM, another crucial performance metric for determining a sensor’s detection limit. FoM is also called the Quality factor of the sensor.
A more sensitive detection limit is indicated by a higher FoM value. As the equation suggests, a significant FoM may be attained for higher sensitivity.
Full width at half maxima (FWHM): The FWHM is another crucial metric for assessing a sensor’s sensing capabilities. Its value should be as low as possible for improved precision and sensing. The spectral breadth of the SPR curve at half of its highest intensity is known as the FWHM.
5. Results Analysis
The finite element method (FEM) and wavelength interrogation method are used in this section to analyze the simulated structure and sensing performance. With the aid of COMSOL Multi physics 6.1 Multiphysics software, one can ascertain the evanescent fields and various mode field distributions, primarily the SPP mode, coupling mode, and fundamental mode. For an analyte RI of 1.33, the y-polarized 2D and 3D visuals of field distribution in three distinct modes, i.e., core mode, SPP mode, and resonance mode, at varying YLiF4 thicknesses are illustrated in Figure 2a–c. The robust relationship between the SPP and core modes is evident for high sensitivity and confinement loss.
The modal properties of the suggested PCF structure provide additional insight into the sensing mechanism. The PCF geometry and material composition determine the effective index of the fundamental guided mode in the absence of analyte-induced perturbation. This effective index and the electromagnetic field’s spatial distribution are further controlled by the periodic air holes. The optical environment around the plasmonic layer varies as the analyte RI rises, changing the SPP effective index. The phase-matching condition is satisfied at a specific wavelength when the guided mode and SPP mode’s effective indices get closer to one another. A maximum in confinement loss results from strong energy transfer from the fundamental mode to the SPP mode.
Figure 2.
Dispersion of electric field (ns = 1.33) in (a) core mode, (b) SPP mode, and (c) resonance mode at various YLiF4 thicknesses.
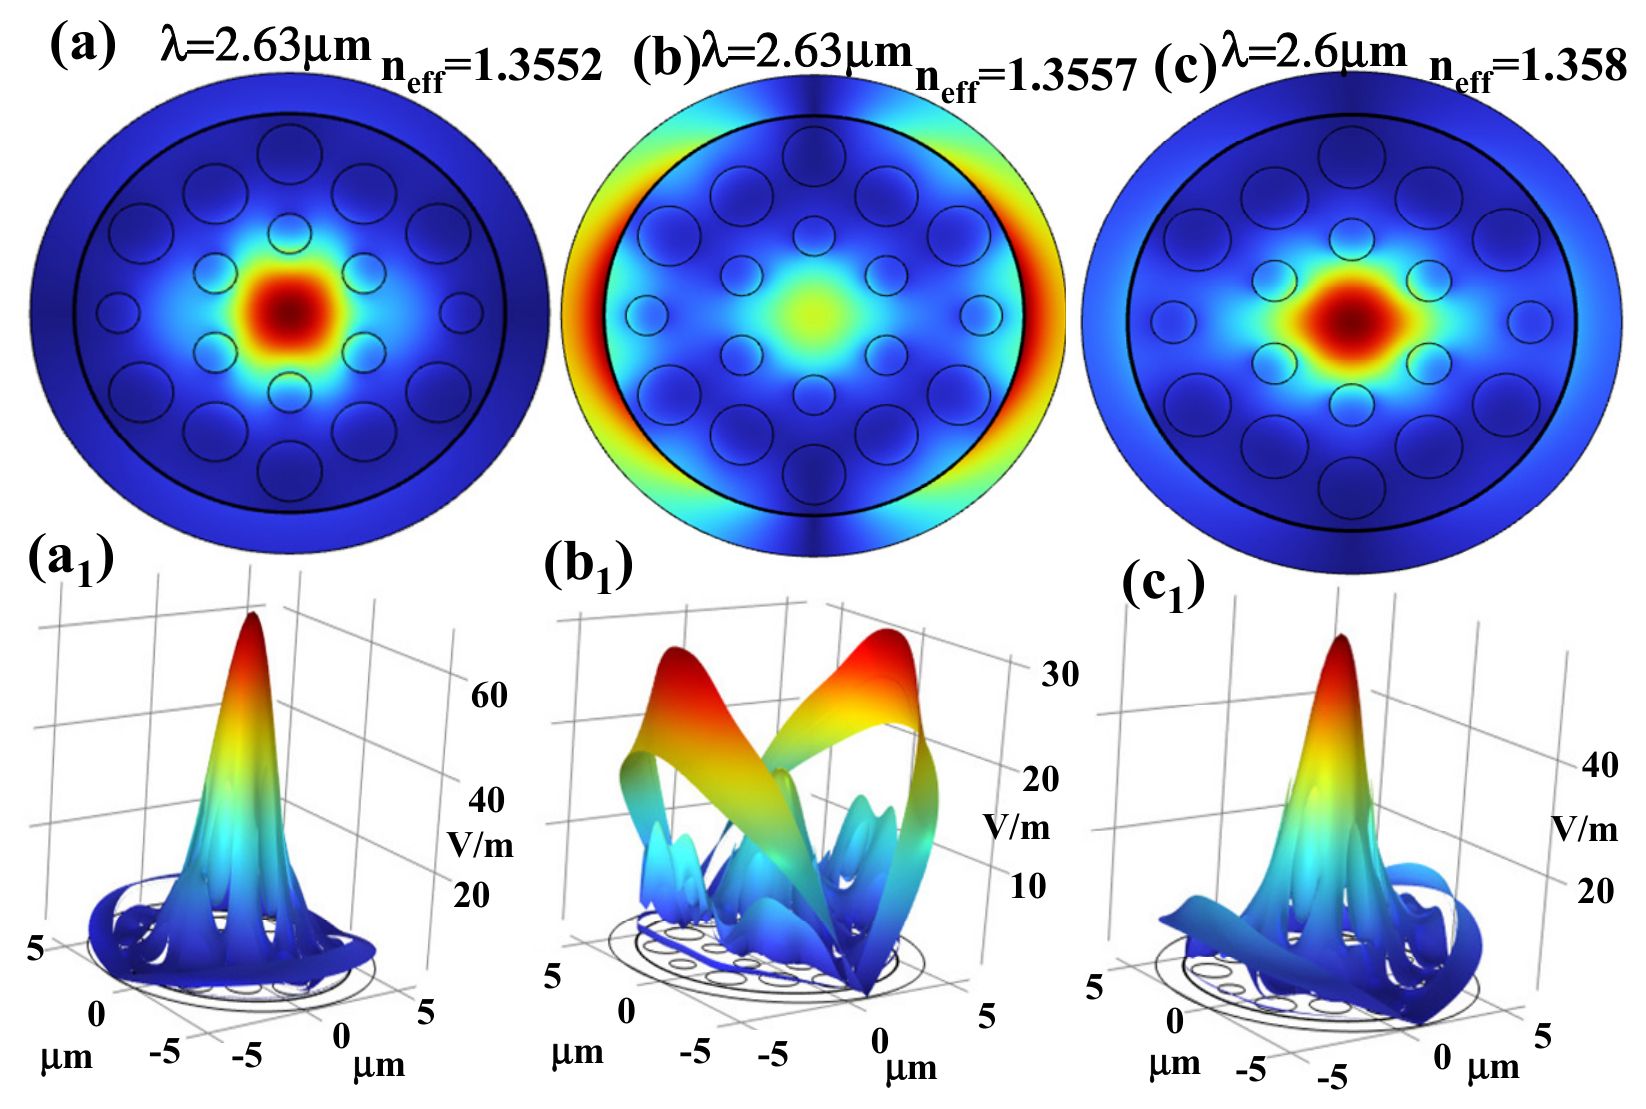
Figure 3, Figure 4 and Figure 5a–c show the proposed sensor’s dispersion relationship. The blue solid line signifies the real component of the effective mode index Re (neff), which causes dispersion; the black curve represents the imaginary component that displays confinement loss with various thicknesses of Au and YLiF4. With 20 nm Au thickness, the maximum confinement losses corresponding to YLiF4 thicknesses of 20 nm, 25 nm, and 30 nm are 72.36 dB/cm, 67.89 dB/cm, and 139.43 dB/cm, respectively, as depicted in Figure 3a–c. For a Au thickness of 25 nm, the corresponding losses increase to 142.48 dB/cm, 137.98 dB/cm, and 132.81 dB/cm, as shown in Figure 4a–c. In a similar manner, with 30 nm Au thickness, the confinement losses further rise to 146.19 dB/cm, 142.59 dB/cm, and 139.43 dB/cm for YLiF4 thicknesses of 20 nm, 25 nm, and 30 nm, respectively, as illustrated in Figure 5a–c. Overall, for all YLiF4 thicknesses, confinement loss increases as the Au thickness increases from 20 nm to 30 nm. This pattern implies that higher confinement losses resulting from thicker Au layers may affect the sensor performance and efficiency. Furthermore, the data show that changes in confinement loss are also influenced by variations in YLiF4 thickness, with the effect being more noticeable at thicker Au layers. An important factor in determining the sensor’s optical characteristics and performance is the thickness of the Au layer. Light propagation efficiency may be lowered by thicker Au layers because they increase confinement loss. This demonstrates the significance of precisely adjusting the thickness of the Au layer to strike a balance between reducing losses and obtaining the required optical properties for particular applications.
Figure 3.
Effective index and confinement loss at a fixed thickness of Au = 20 nm with various thicknesses of YLiF4: (a) 20 nm, (b) 25 nm, and (c) 30 nm.
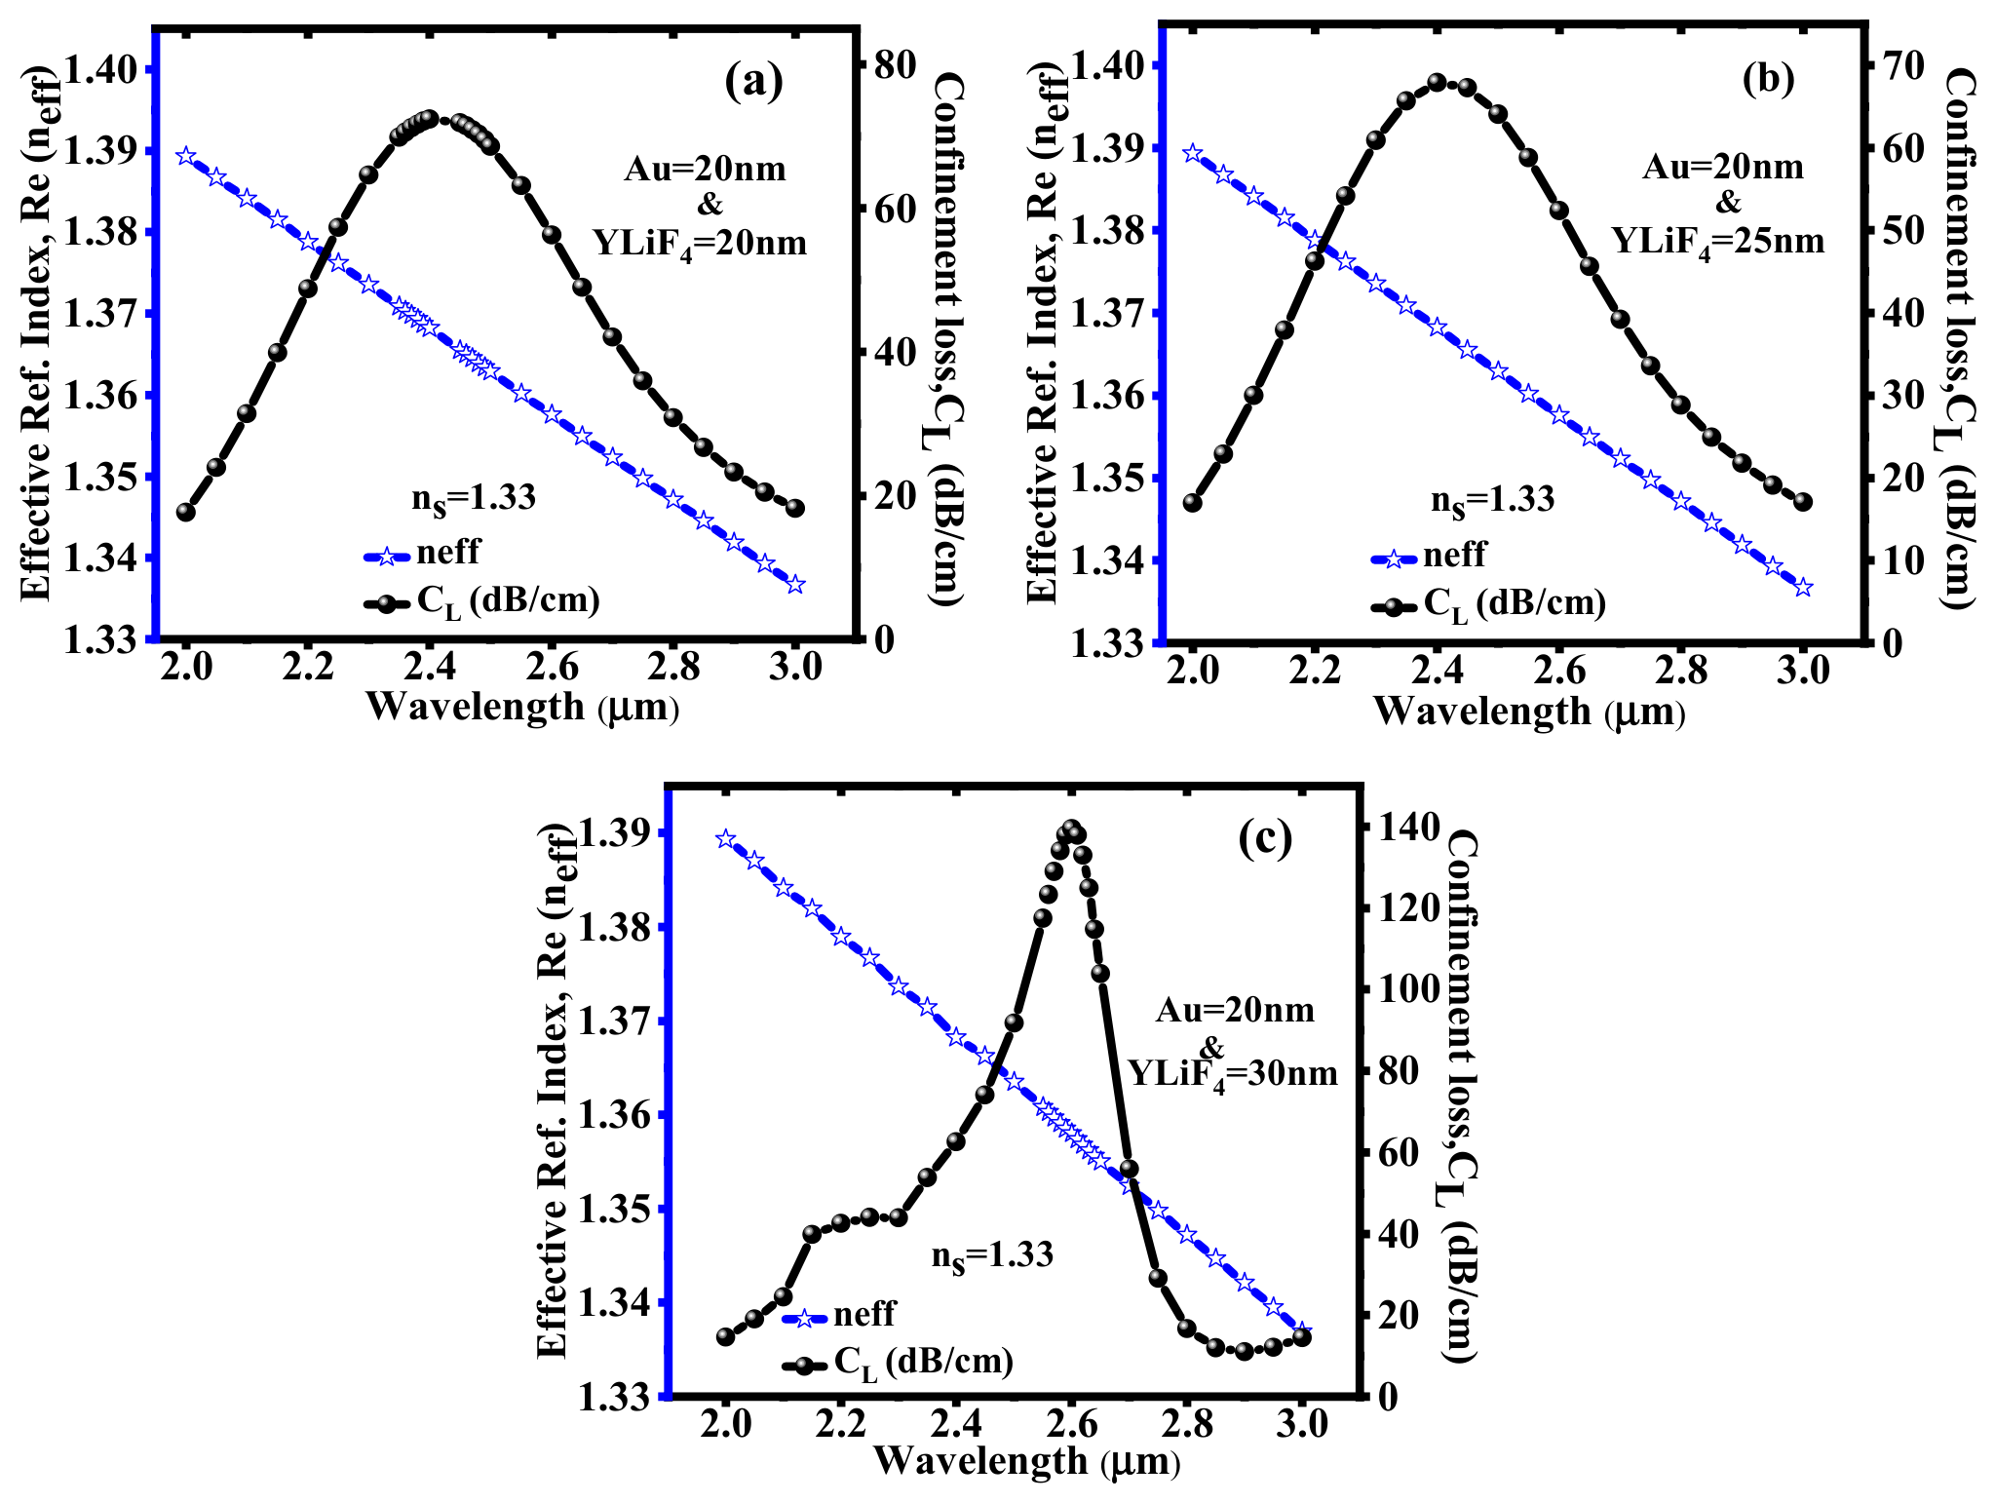
Figure 4.
Effective index and confinement loss at a fixed thickness of Au = 25 nm with various thicknesses of YLiF4: (a) 20 nm, (b) 25 nm, and (c) 30 nm.
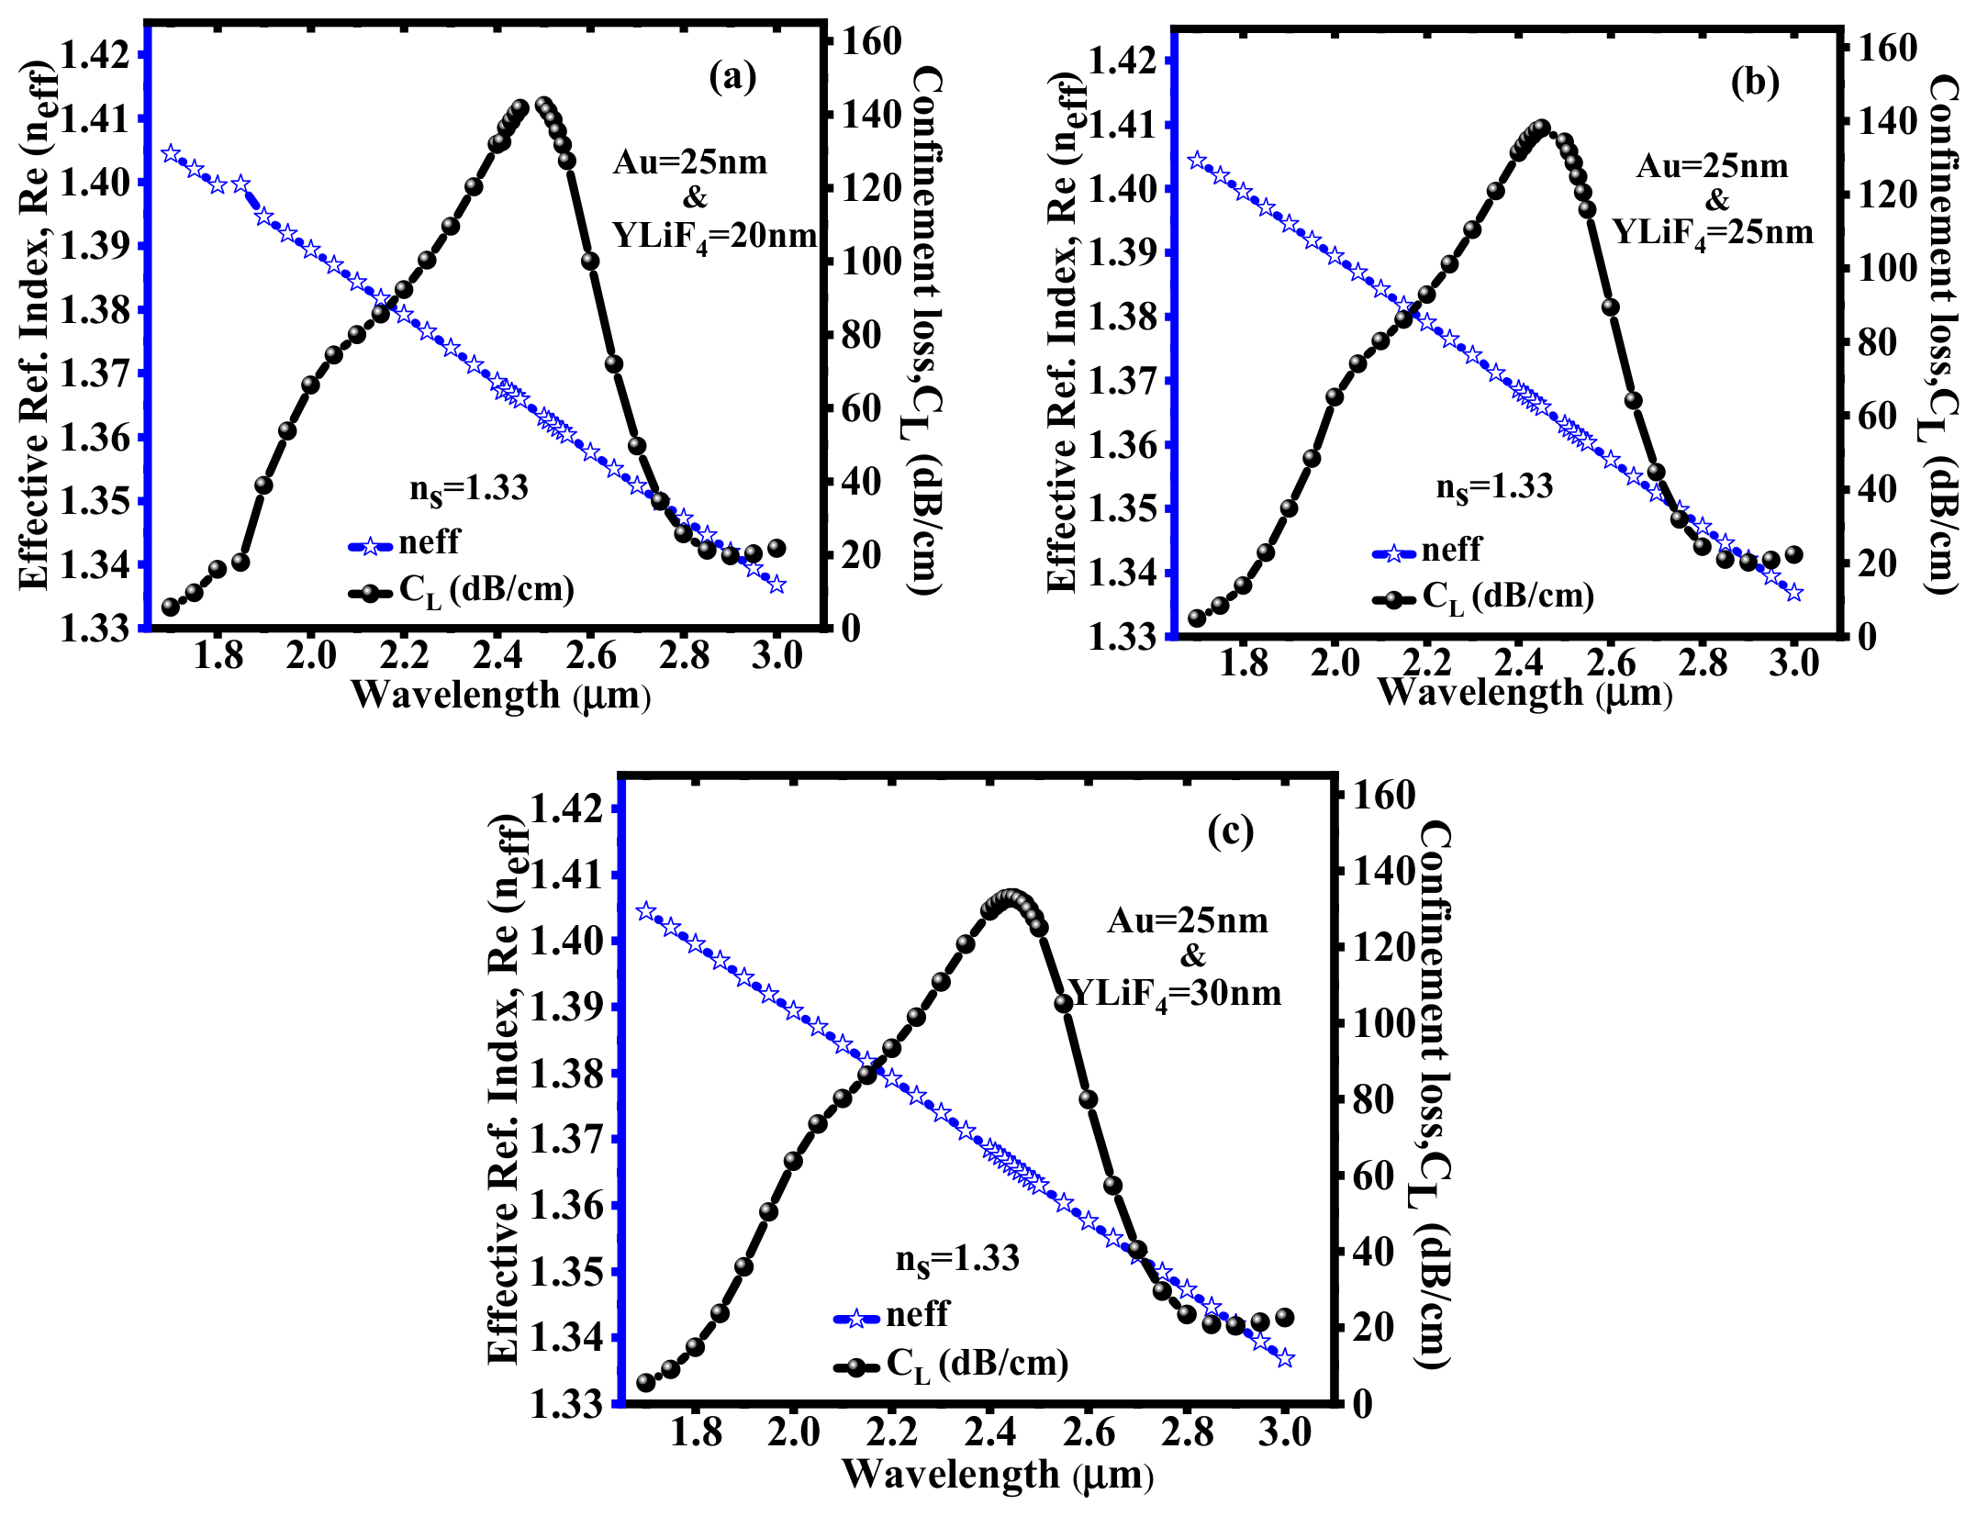
Figure 5.
Effective index and confinement loss at a fixed thickness of Au = 30 nm with various thicknesses of YLiF4: (a) 20 nm, (b) 25 nm, and (c) 30 nm.
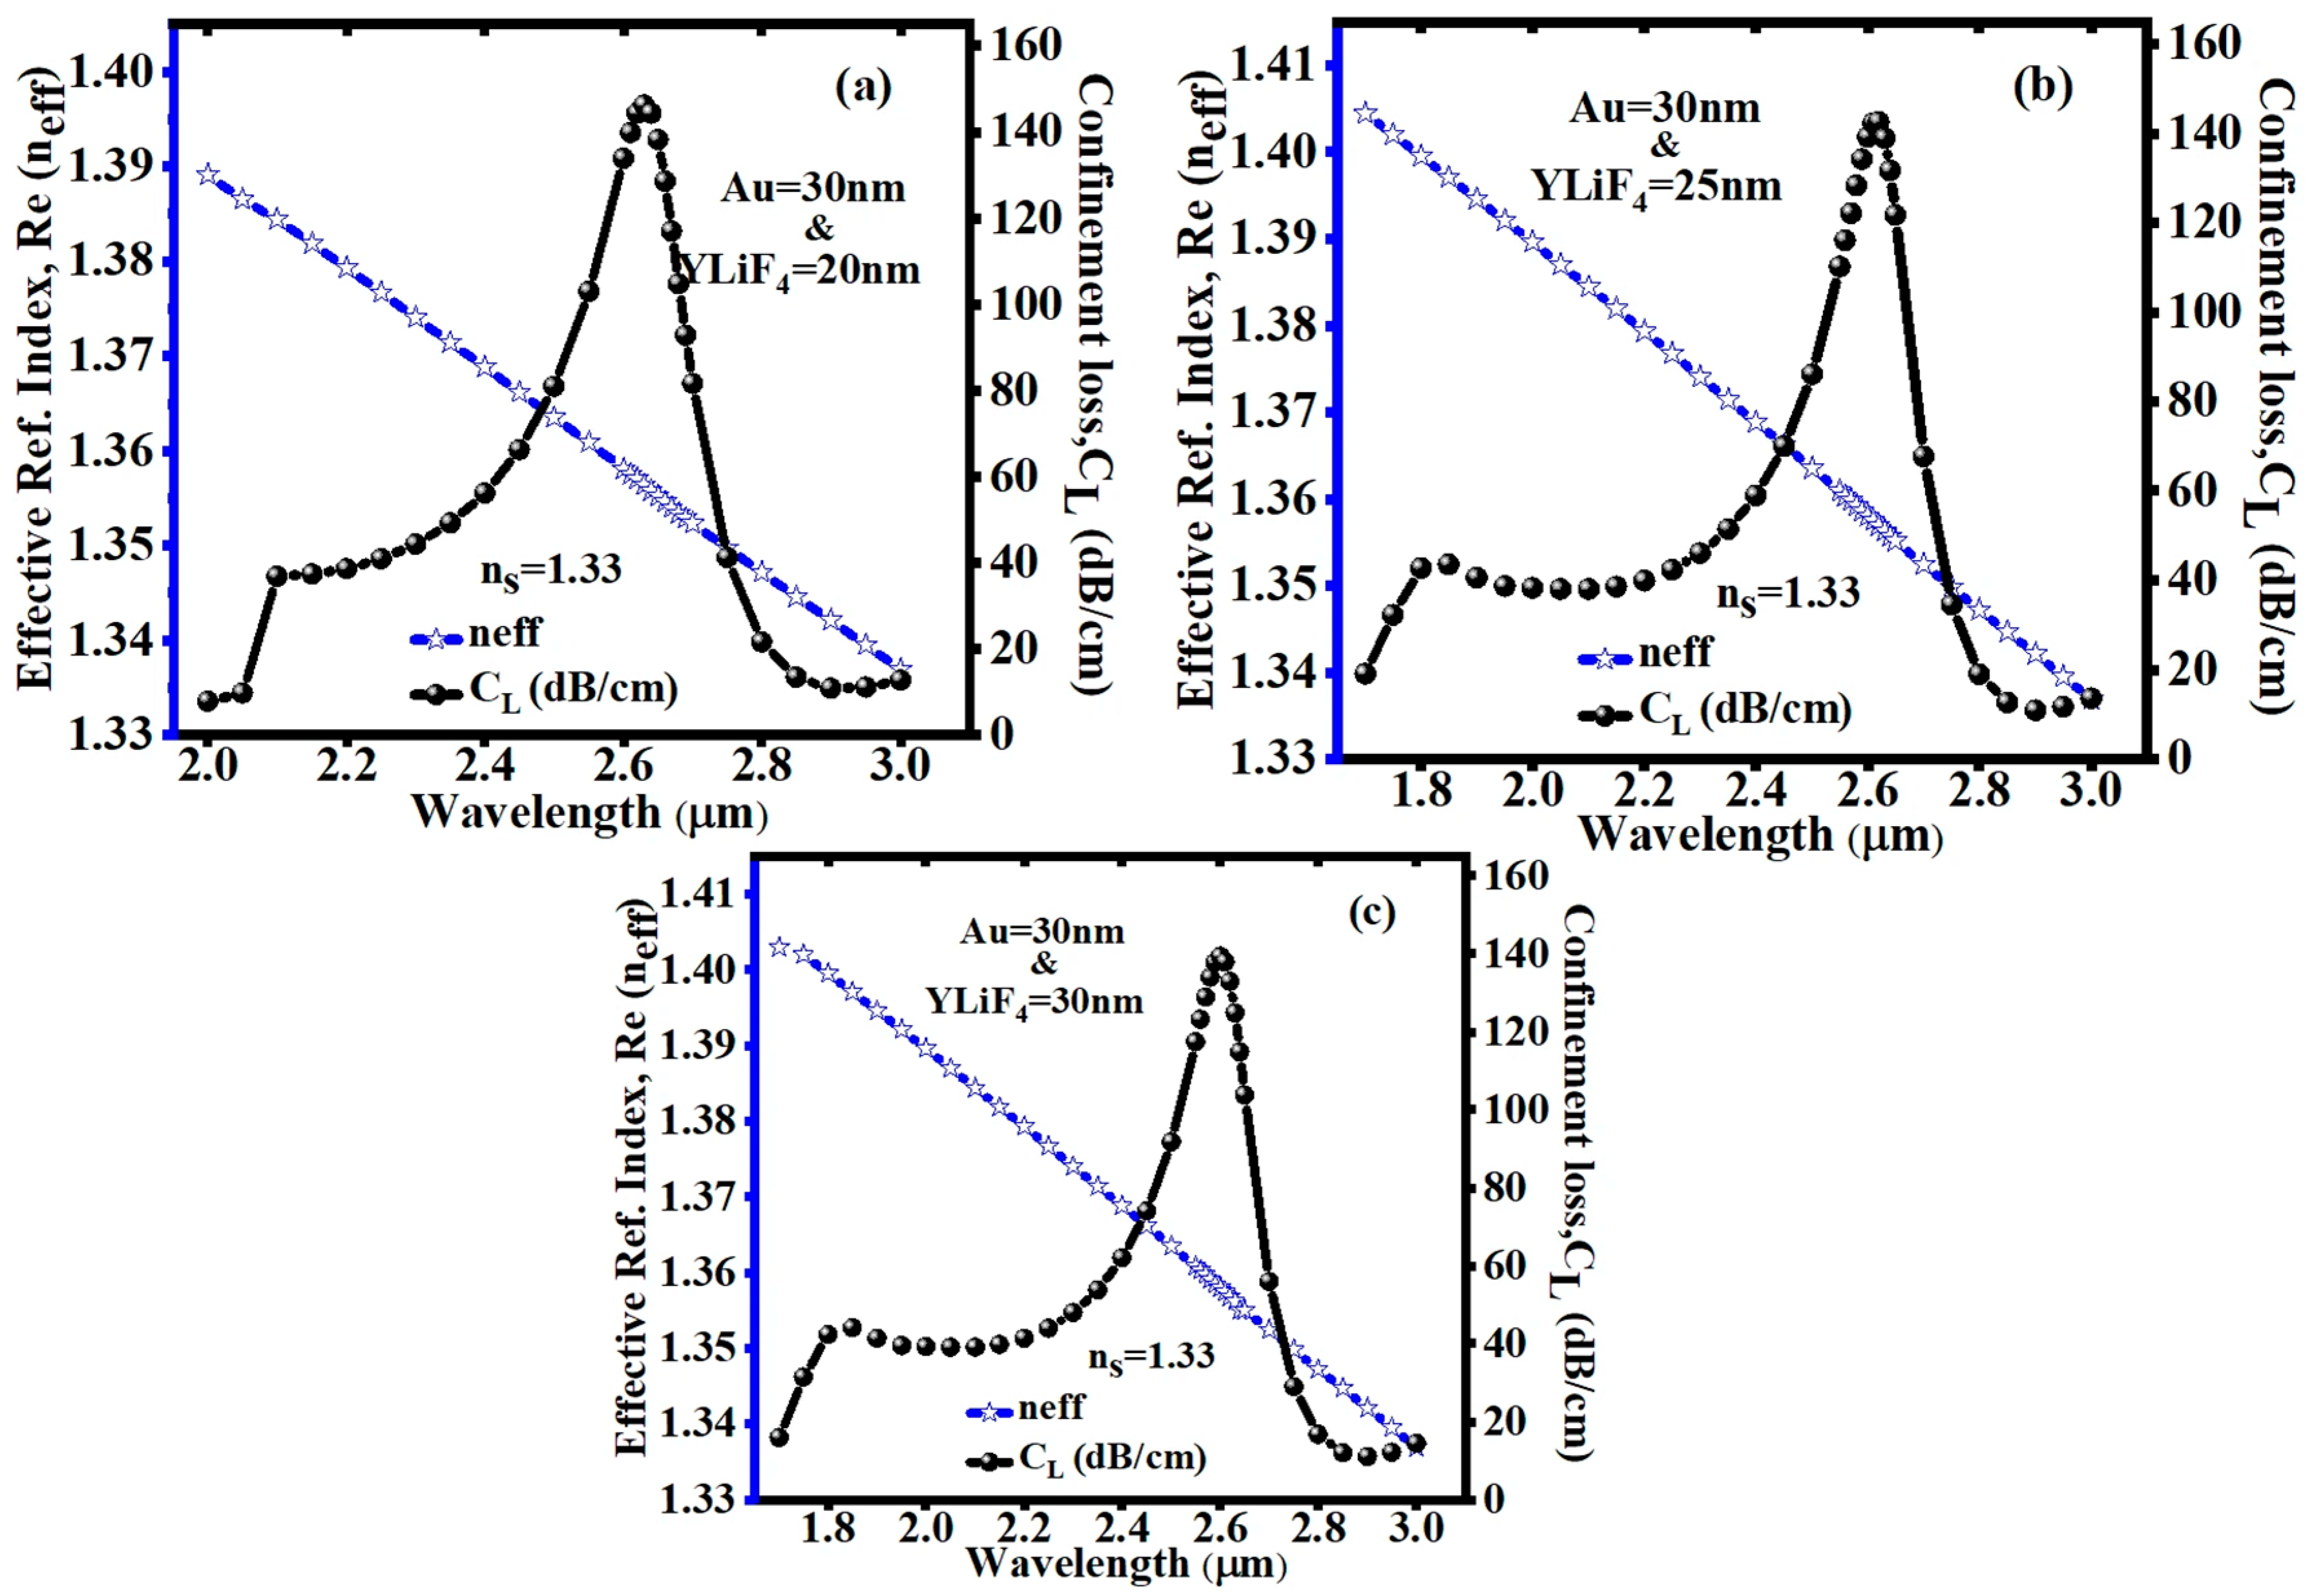
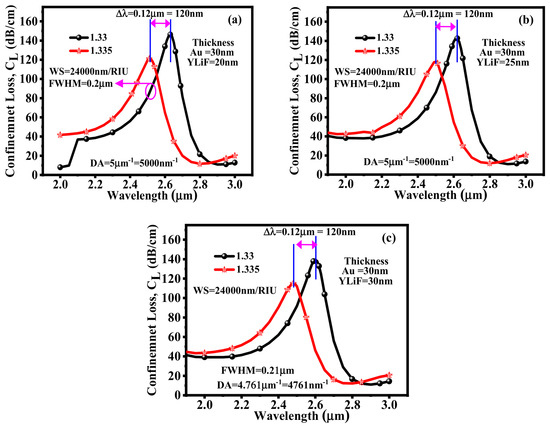
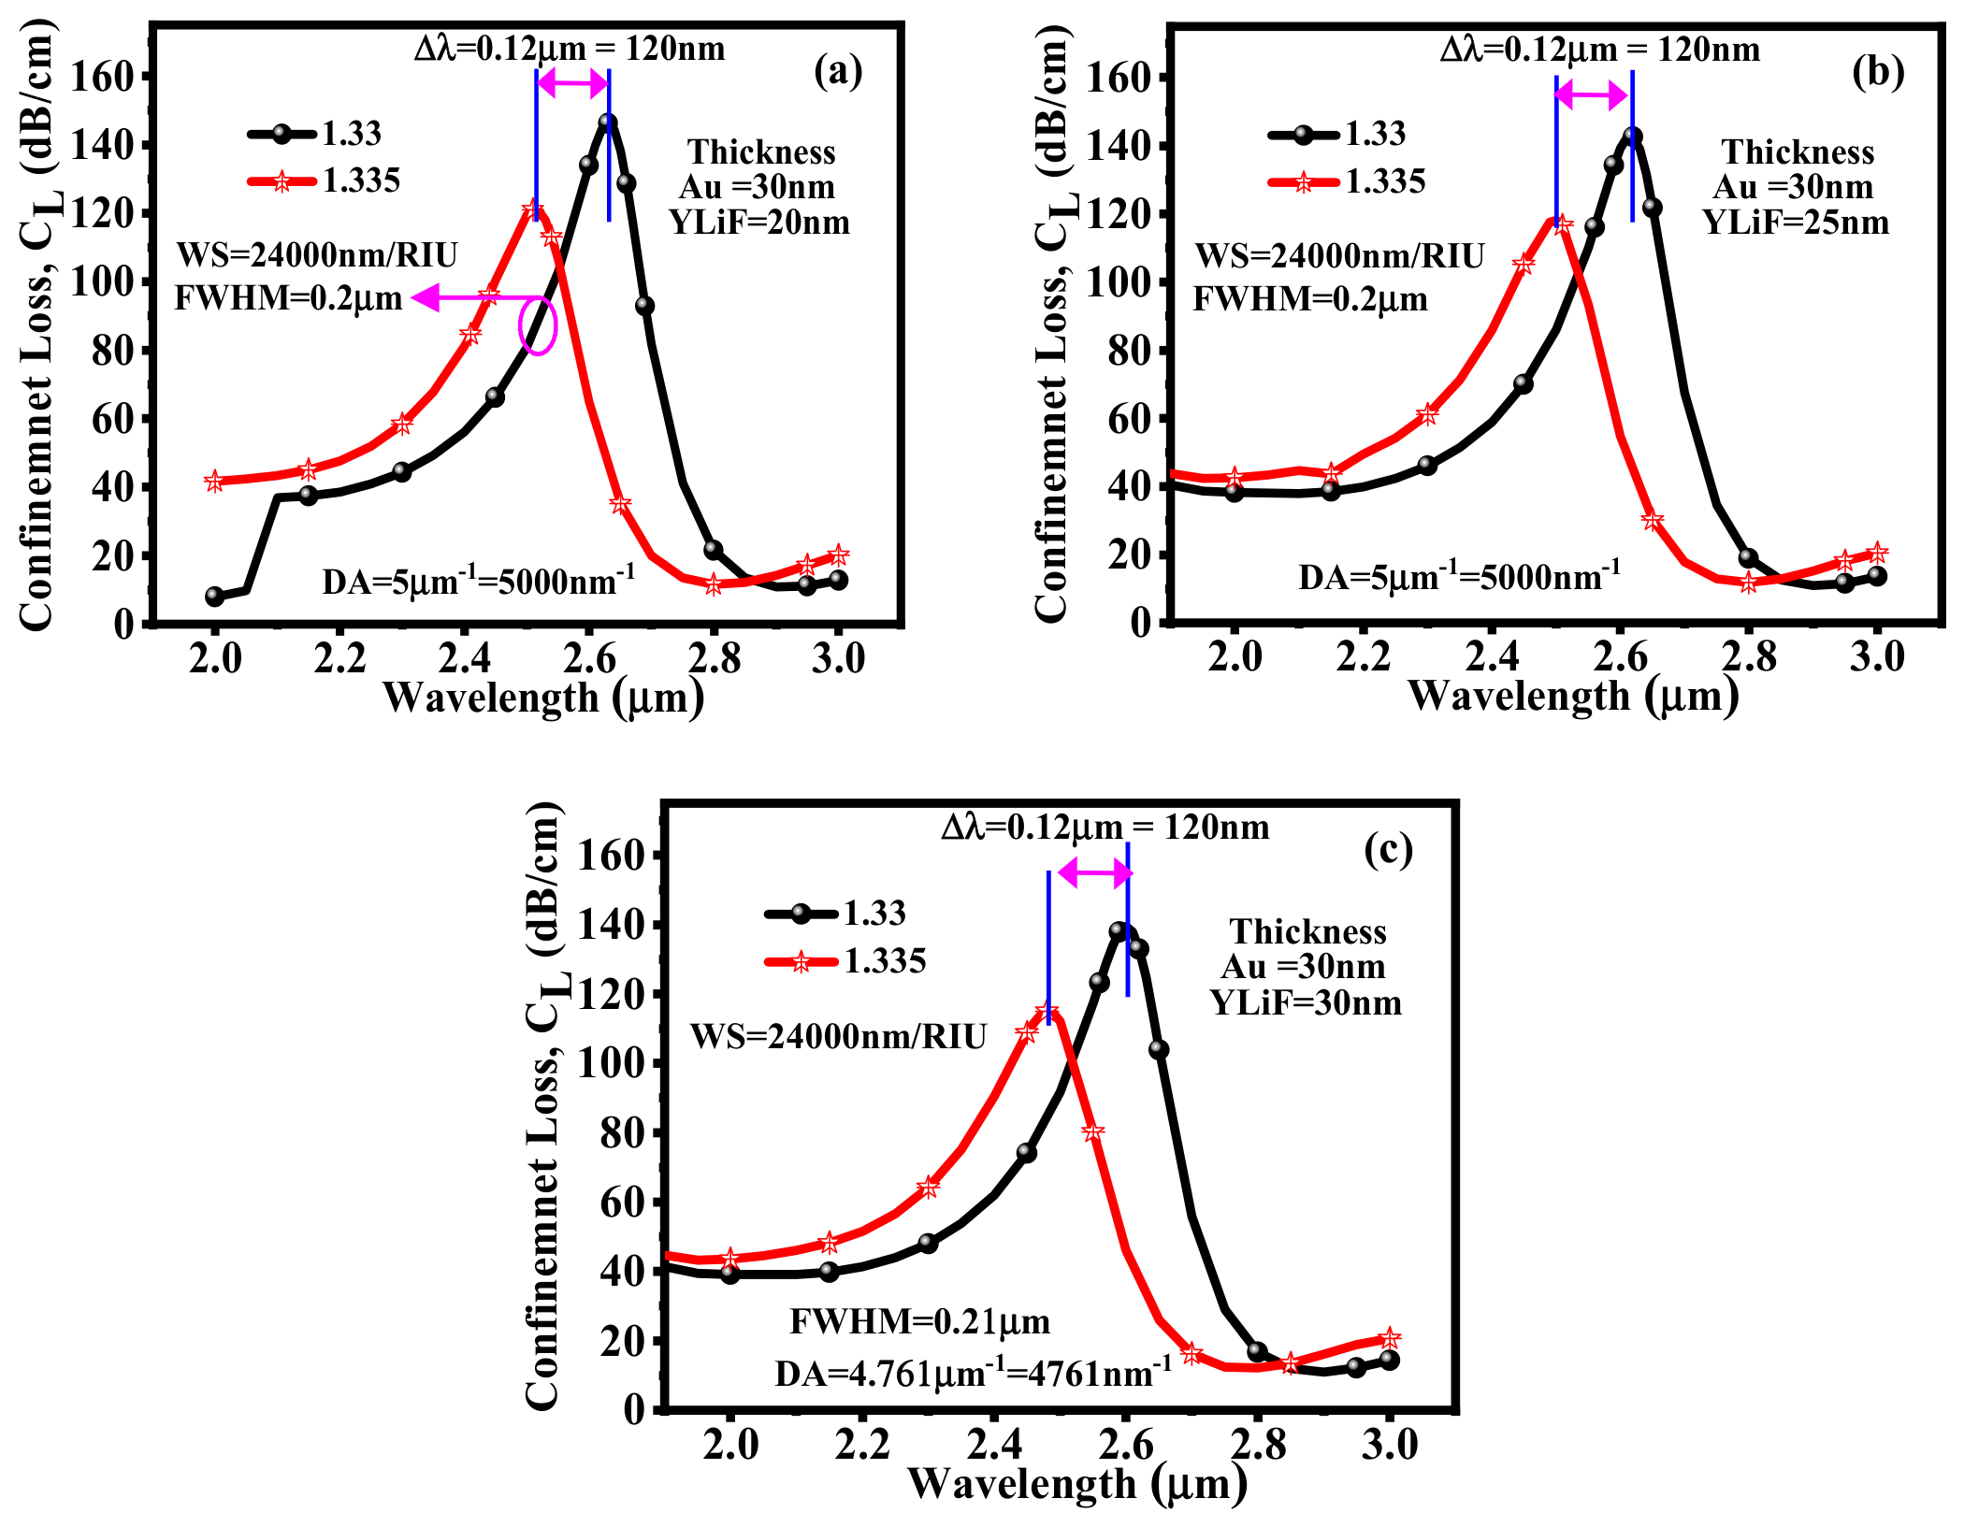
Figure 6a–c illustrate how the effective RI’s real part and confinement loss vary across 1.330–1.335. This illustration highlights distinct peaks of confinement loss for each RI of an analyte. These peaks occur at resonance wavelengths where the real fraction of effective RI of the core-guided mode aligns with that of the SPP mode. Consequently, the distinctive loss peaks serve as a distinguishing factor, enabling the differentiation of the RI of an analyte. As depicted in Figure 6a, the acquired resonant peaks for an analyte RI of 1.330 and 1.335 occur at resonance wavelengths of 2.63 µm and 2.51 µm, respectively, with their corresponding peak loss values of 146.19 dB/cm and 121.01 dB/cm, respectively. These results are obtained for 30 nm and 20 nm thicknesses of Au and YLiF4 layers. As a result, a maximum wavelength shift of 120 nm in the resonant peak is observed, enabling the maximum sensitivity of 24,000 nm/RIU. Similarly, Figure 6b demonstrates that for the same analyte RIs with 30 nm and 25 nm thicknesses of the Au and YLiF4 layer, maximum loss values of 142.52 dB/cm and 118.03 dB/cm are reported. Here, the wavelength shift in the resonant peak is also 120 nm, resulting in a maximum sensitivity of 24,000 nm/RIU. Figure 6c reveals the confinement loss characteristics concerning the same analyte RIs with 30 nm and 30 nm thicknesses of the Au and YLiF4 layer. In this illustration, the guided mode loss peaks corresponding to the RI of 1.330 and 1.335 are identified at resonance wavelengths of 2.60 µm and 2.48 µm, respectively. Further, with various thicknesses of the Au and YLiF4 layer, other crucial parameters such as FWHM and DA are calculated and depicted in Figure 6a–c.
Figure 6.
Variation in confinement loss at a fixed thickness of Au =30 nm with various thicknesses of YLiF4: (a) 20 nm, (b) 25 nm, and (c) 30 nm.
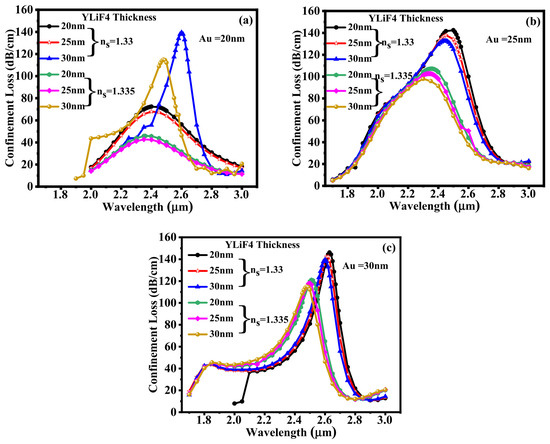
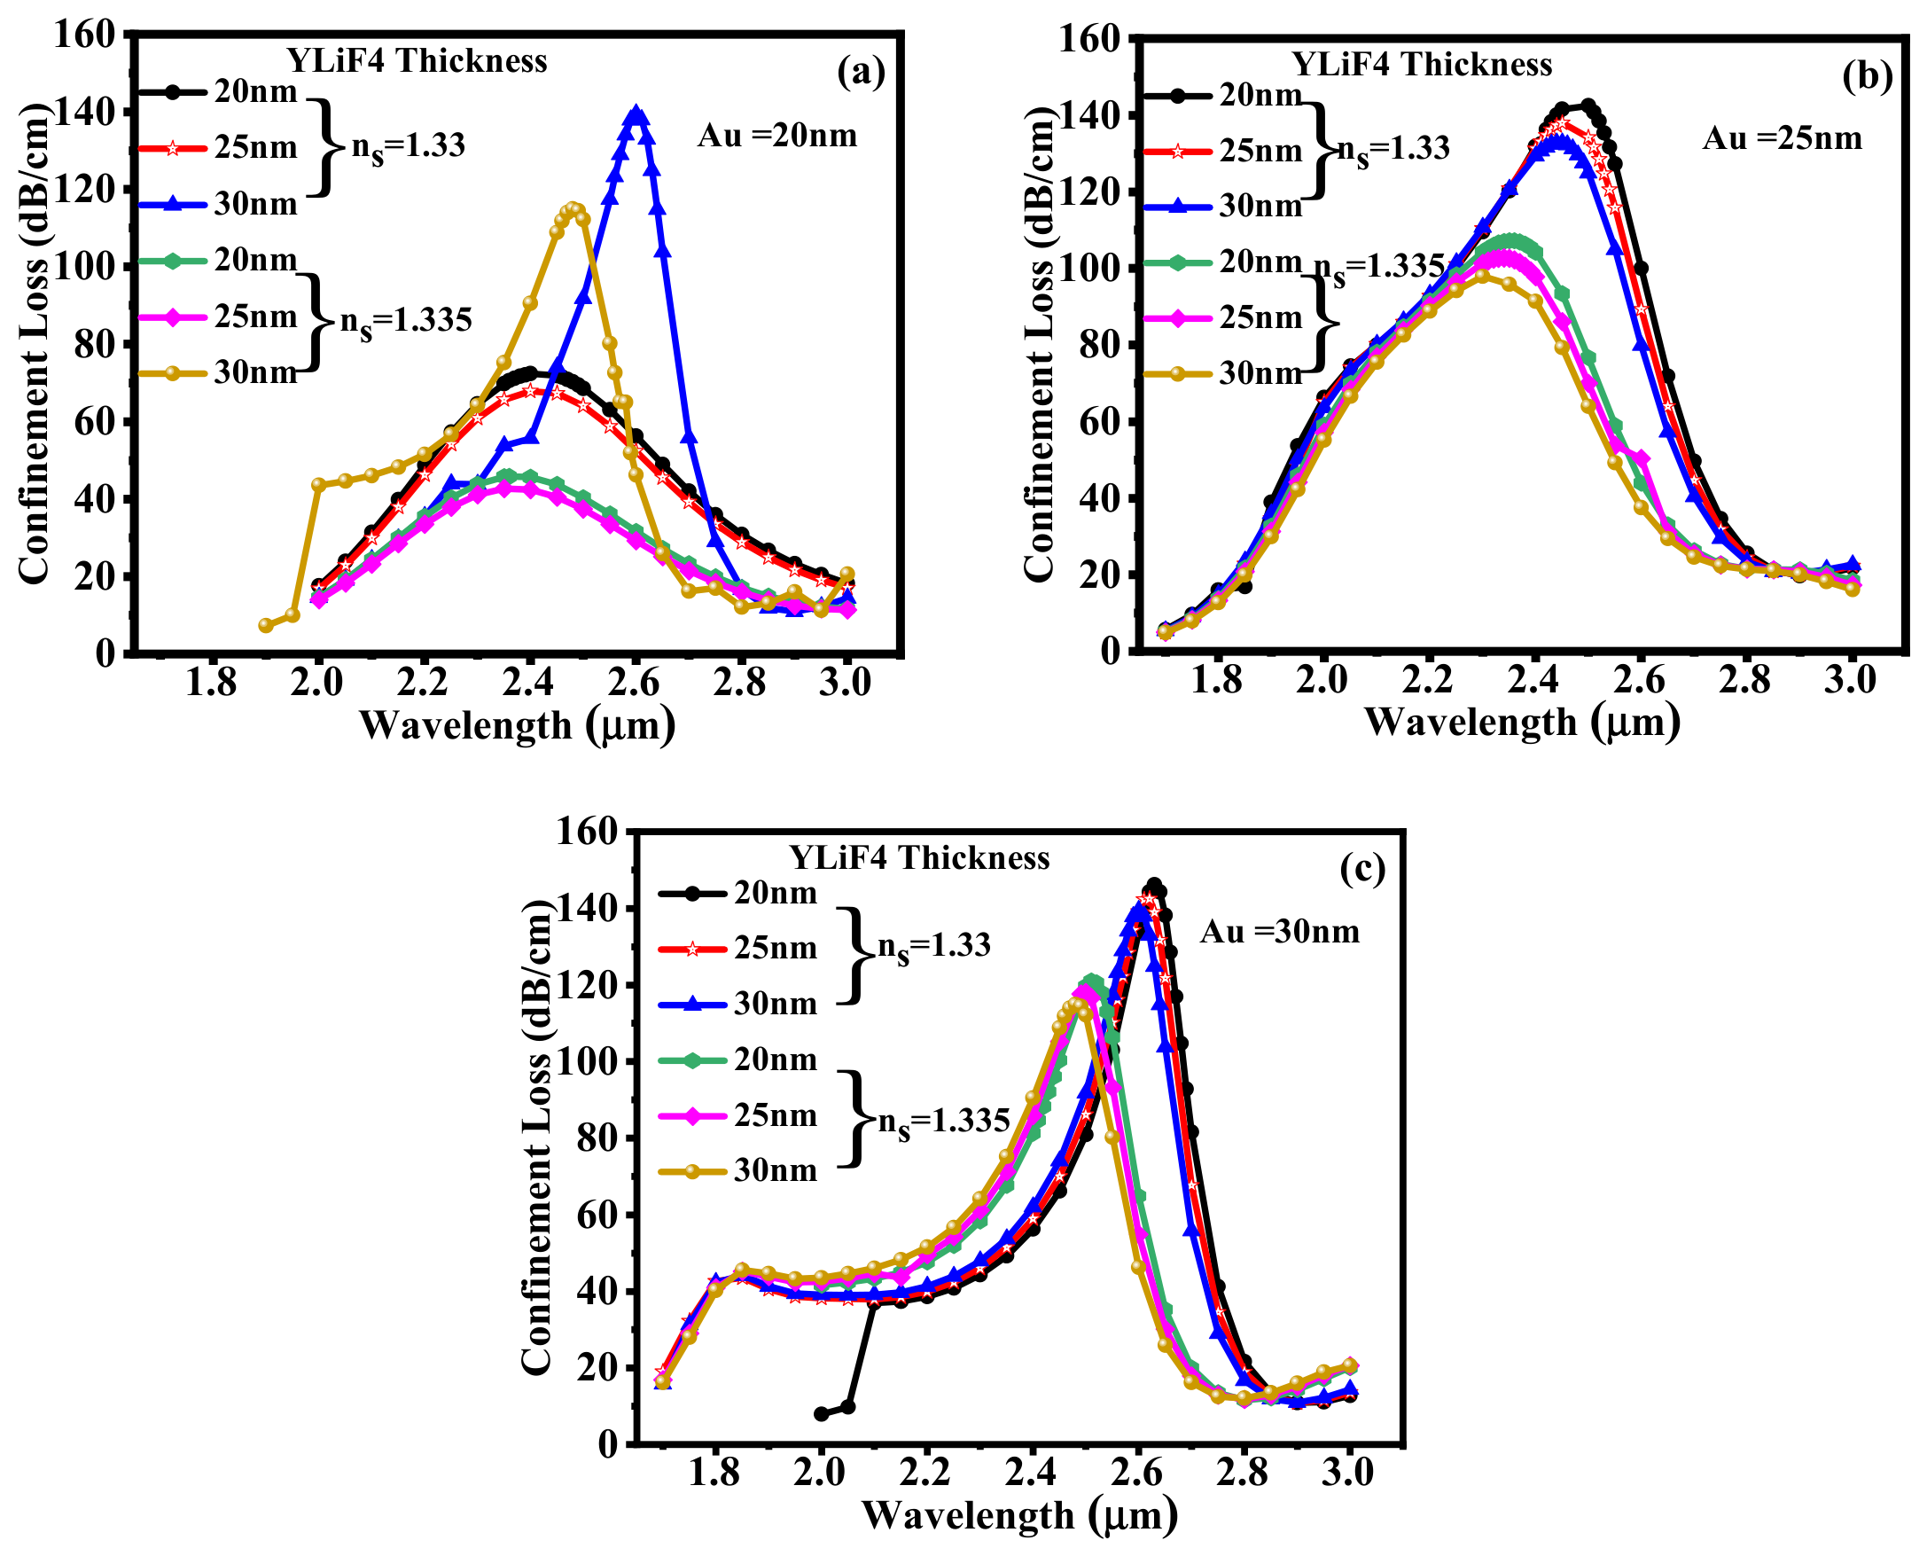
Confinement loss and amplitude sensitivity of the proposed sensor for the RI variation from 1.330 to 1.335 with various thicknesses of YLiF4 are displayed in Figure 7a–c. As illustrated in Figure 7a, the sensor’s confinement loss characteristics are plotted for a fixed Au layer thickness of 20 nm and varying YLiF4 layer thicknesses of 20 nm, 25 nm, and 30 nm. As the YLiF4 layer thickness increases for an analyte RI of 1.33, the confinement loss rises as well. In addition, the sensor configuration with a 30 nm Au thickness exhibits the highest peak loss and a discernible shift in the resonance wavelength. This trend points to stronger plasmonic coupling and improved field confinement with increasing thickness of the YLiF4 layer. A similar behaviour is noticed for an analyte RI of 1.335, although the resonance peak is further shifted as a result of the slight increase in RI. Further, we have plotted the confinement loss characteristics at a 25 nm and 30 nm Au thickness as shown in Figure 7b,c. The maximum confinement loss is obtained at an RI of 1.33 SM. As illustrated in Figure 7a–c, every configuration displays a strong resonance peak in the wavelength range of 2.5 µm to 2.7 µm. The 25 nm and 30 nm layers exhibit nearly overlapping high-loss curves at ns = 1.33, where the peak confinement loss slightly increases with the YLiF4 thickness. Notably, the confinement loss variations in the analyte’s RI are demonstrated by the slight shift of the resonance peaks toward longer wavelengths for ns = 1.335. According to the trend, the resonance is sharper and more defined at a thicker Au layer (30 nm), with minimal variation in peak intensity across YLiF4 thicknesses. The YLiF4 and Au layers at 30 nm exhibit the highest peak loss of 146.19 dB/cm at ns = 1.33. The result analysis demonstrates that the proposed sensor is very effective in precise biochemical and environmental sensing applications because of its high sensitivity to both the YLiF4 thickness and the analyte’s RI. This sensitivity enables the detection of even the smallest changes in the sensing medium (ns = 1.33, 1.335).
Figure 7.
Confinement loss at a fixed thickness of (a) Au =20 nm, (b) Au =25 nm, and (c) Au =30 nm with various thicknesses of YLiF4 = 20 nm, 25 nm, and 30 nm.
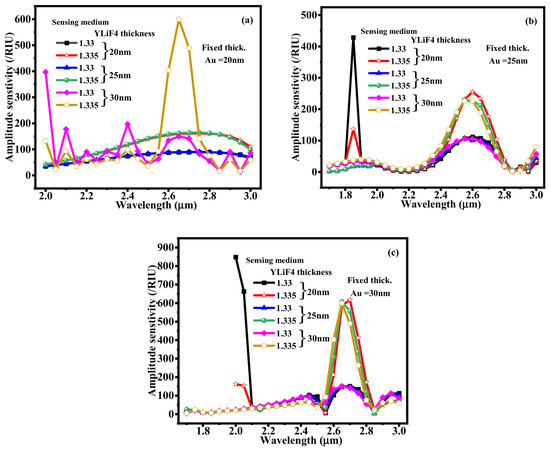
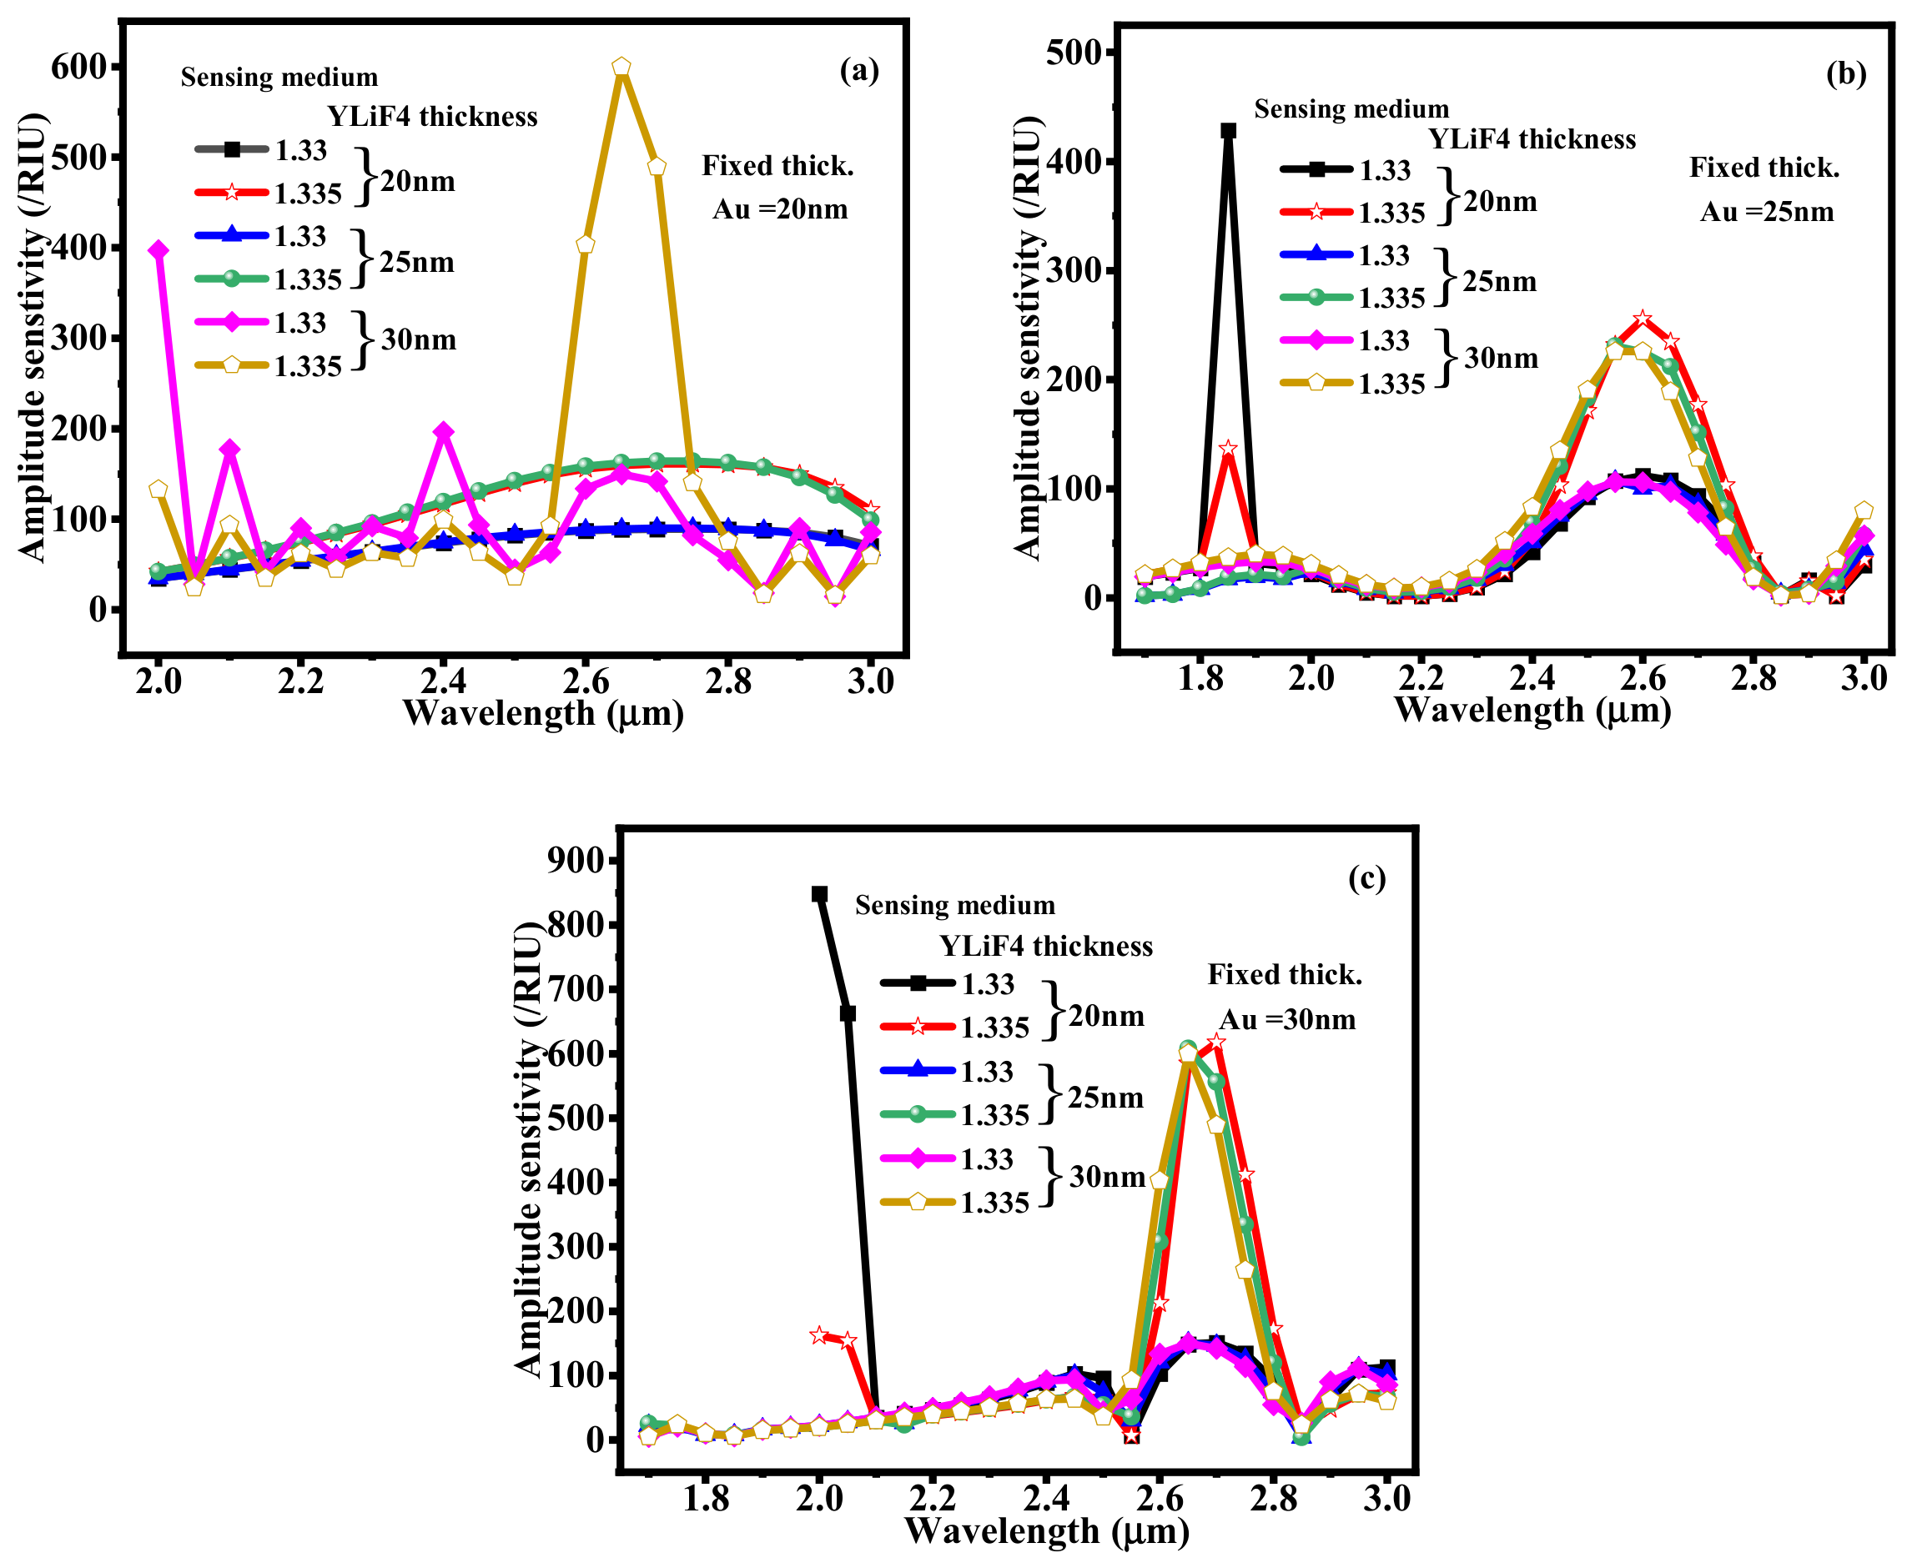
Figure 8a–c show the amplitude sensitivity of the suggested plasmonic sensor for different YLiF4 thicknesses (20 nm, 25 nm, and 30 nm) under various analyte RI values (1.33 and 1.335), with fixed Au layer thicknesses of 20 nm, 25 nm, and 30 nm, respectively. With a Au layer fixed at 20 nm, Figure 8a displays moderate variations in amplitude sensitivity. The highest peak (489.30/RIU) is seen at a 30 nm YLiF4 thickness and RI of 1.335 at a 2.7 µm wavelength, suggesting enhanced field interaction at this alignment. Figure 8b, where Au and YLiF4 layer thicknesses are kept at 25 nm and 20 nm, shows a sharp amplitude sensitivity (428.60/RIU) spike at 1.85 µm for an analyte RI of 1.33. Further, Figure 8c, where Au is fixed at 30 nm, indicates a noticeable and narrow peak at a 2 µm wavelength. The configuration with a 20 nm YLiF4 layer and an analyte RI of 1.33 produces the highest amplitude sensitivity of around 848.94/RIU across all cases. These findings show how significantly the YLiF4 thickness and analyte RI affect the resonance wavelength. This indicates the sensor’s high sensitivity potential and tunability for detecting minute RI changes.
Figure 8.
Amplitude sensitivity with various YLiF4 thicknesses of 20 nm, 25 nm, and 30 nm at (a) Au = 20 nm, (b) Au = 25 nm, and (c) Au = 30 nm, respectively.
6. Application-Oriented Sensing Analysis (Krypton and Plasma Sensing)
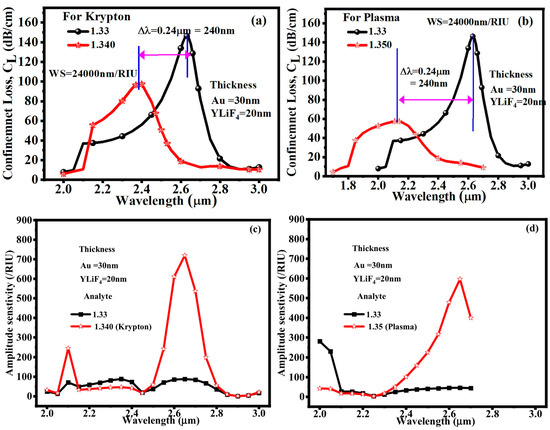
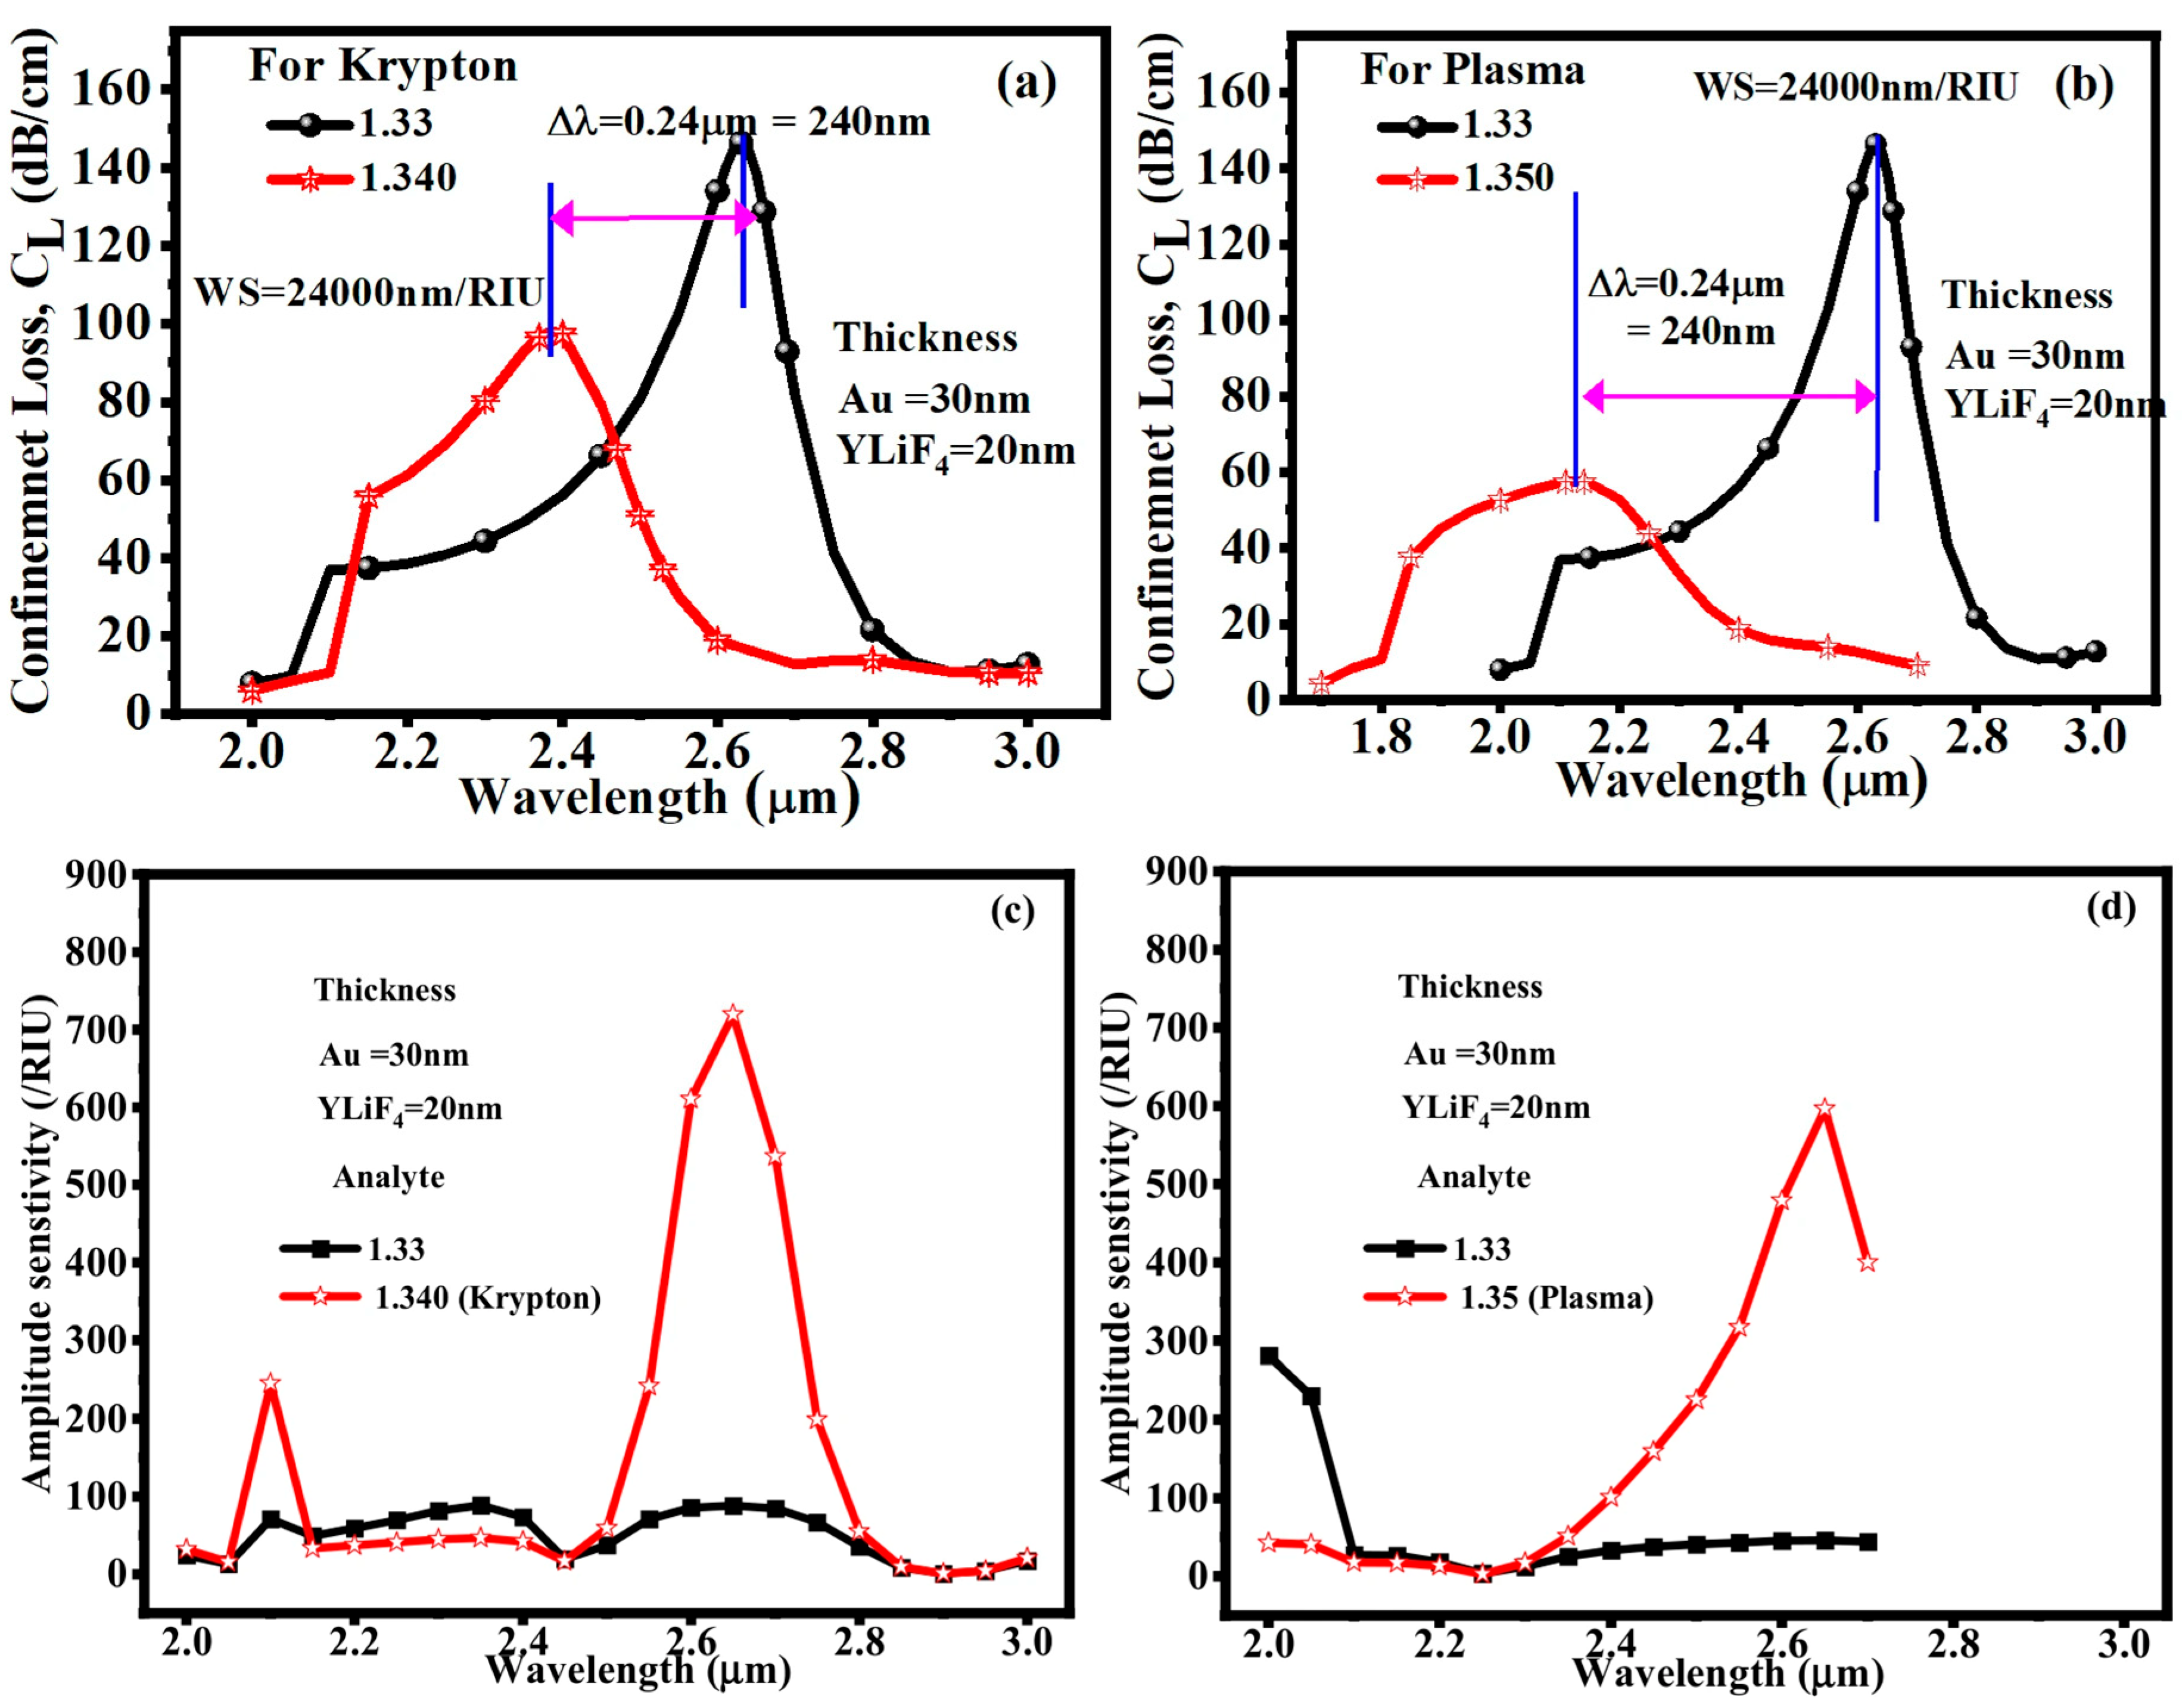
Krypton and blood plasma can be regarded as distinct analyte environments for assessing the RI sensing capability of the suggested fiber structure in the context of PCF sensor applications. Blood plasma, with an RI of roughly 1.350, represents a biologically significant liquid analyte, while krypton, with an approximate RI of 1.340, can be used as a representative gaseous analyte or reference medium. A PCF sensor works by tracking changes in optical parameters, such as the transmission spectrum, resonance wavelength, confinement loss, or effective RI, that arise from variations in the RI of the analyte that has penetrated the fiber’s air holes or sensing channels. Thus, it is possible to use the difference between RI = 1.340 for krypton and RI = 1.350 for blood plasma to show that the sensor can differentiate between various surrounding media. The PCF can be further functionalized with appropriate biorecognition layers for biomedical applications in order to identify blood-related components or biomarkers, where variations in biomarker concentration result in quantifiable variations in RI. Because of its high light–analyte interaction and strong sensitivity to small RI changes, the suggested PCF sensor has potential uses in gas sensing, liquid RI monitoring, and label-free biomedical detection. The application-oriented sensing performance of the suggested PCF-SPR sensor for krypton and blood plasma at fixed Au and YLiF4 thicknesses of 30 nm and 20 nm, respectively, is shown in Figure 9a-d. A resonance wavelength shift of roughly 0.24 μm (240 nm) is produced for krypton when the analyte RI increases from 1.330 to 1.340. This corresponds to a wavelength sensitivity of roughly 24,000 nm/RIU. Strong RI-dependent coupling between the guided mode and the plasmonic mode is indicated by a noticeable shift in confinement loss. The corresponding amplitude-sensitivity spectrum shows a strong intensity-based sensing response, reaching about 700 RIU−1 around 2.65–2.70 μm. The ability of the suggested Au/YLiF4-PCF structure to react to slight variations in the RI of a biologically relevant sensing medium is also confirmed by the plasma-oriented response, which shows a notable resonance shift and increased amplitude sensitivity when compared to the reference analyte. Overall, these findings show that the suggested sensor can be studied using both amplitude and wavelength interrogation, expanding its use beyond traditional RI sensing.
Figure 9.
Au = 30 nm and YLiF4 = 20 nm thickness for (a) confinement loss for krypton, (a,b) confinement loss for plasma, (c) amplitude sensitivity for krypton; (d) amplitude sensitivity for plasma, respectively.
7. Comparison with Conventional PCF SPR Structure and Existing Structure
A comparatively homogeneous core-cladding structure with a plasmonic coating applied to the fiber surface is typically used in a conventional optical-fiber SPR sensor. The dimensions and RIs of the cladding and core in such a configuration largely dictate the modal properties. As a result, there is not much room for independent control over the modal distribution and the interaction between the guided field and the plasmonic interface. On the other hand, a periodic configuration of air holes in the suggested PCF-SPR structure offers more control over the electromagnetic-field distribution and effective modal index. The guided mode’s confinement and its interaction with the sensing interface can be altered by engineering the air-hole geometry. Because the dielectric YLiF4 layer alters the optical environment of the plasmonic interface and the PCF geometry regulates the guided-mode properties, this structural flexibility is especially helpful when paired with the Au/YLiF4 structure. Therefore, the combined effect of PCF-based modal engineering and Au/YLiF4 plasmonic coupling, rather than just the use of YLiF4, is the main advantage of the proposed structure. The advantages of the dielectric layer would still be present in a conventional fiber with the same YLiF4 layer, but the structural degrees of freedom for regulating the guided mode and phase-matching condition would be significantly reduced. As a result, the suggested PCF structure offers a more adaptable platform for modifying the detection range and resonance response. The suggested PCF-SPR sensor’s sensing capabilities are contrasted with those of previously published sensors in Table 4. With a maximum wavelength sensitivity of 24,000 nm/RIU, the suggested sensor operates over a comparatively wide wavelength range of 1700–3000 nm. Additionally, it offers a very low resolution of 1.98 × 10⁻⁷ RIU, suggesting the ability to identify minuscule variations in RI. Additionally, the strong sensing performance of the suggested design is demonstrated by the obtained FoM of 111.6/RIU. Overall, the comparison shows that, in comparison to the reported sensors, the suggested PCF-SPR sensor provides the best combination of high wavelength sensitivity, excellent resolution, and high FoM.
Table 4.
Performance comparison between the suggested PCF-SPR sensors and existing sensors.
8. Conclusions
This study offers a label-free, non-invasive method for precise chemical and biochemical sensing using a solid-core PCF-based sensor. The device’s sensing parameters, such as amplitude sensitivity, wavelength sensitivity, FWHM, and FoM, are significantly improved for the SM’s RI of 1.33 and 1.335. Even minute RI changes (∆RI = 0.005) yield a pronounced shift in the loss peak magnitude and resonance wavelength, demonstrating the sensor’s high detectability. The simulation result indicates that a wavelength sensitivity of 24,000 nm/RIU for the SM’s RI of 1.33 and 1.335, with a corresponding resonance at 1.14 µm, is obtained by optimizing the YLiF4 thickness (20–30 nm). The proposed sensor offers a resolution of 1.98 × 10⁻⁷ RIU, an FWHM of 210 nm, and an FoM of 111.6/RIU. Furthermore, the maximum amplitude sensitivity of 848.94 /RIU is attained with a 30 nm thickness of Au and YLiF4, outperforming comparable PCF sensors stated in the literature. To further illustrate the useful potential of the suggested PCF-SPR sensor, application-oriented sensing analysis was carried out for krypton and blood plasma. The obtained results demonstrate significant variations in the amplitude sensitivity and confinement-loss spectra as the analyte RI varies. A maximum wavelength sensitivity of 50,000 nm/RIU and an amplitude sensitivity of 596.26/RIU were attained for the RI of 1.33–1.35 under consideration. These outcomes provide evidence that further tuning of PCF’s geometry, lattice orientation, and the thickness of the metal layer can drive sensitivity even higher, paving the way for next-generation sensing platforms.
Author Contributions
Conceptualization, R.K., and S.S.; Methodology, R.K., and S.S.: validation, R.K., And M.S.; formal analysis, R.K. and K.L.H.; investigation, K.L.H. and M.S.; resources, K.L.H. and M.S.; data curation, visualization, R.K.; Writing—original draft preparation, R.K., and S.S. Writing—review and editing, M.S. and K.L.H.; Supervision M.S., project administration, K.L.H. and M.S.; funding acquisition, K.L.H., and M.S. All authors have read and agreed to the published version of the manuscript.
Funding
This work was supported by the Dong-A University research fund.
Institutional Review Board Statement
Not applicable.
Informed Consent Statement
Not applicable.
Data Availability Statement
The original contributions presented in this study are included in the article. Further inquiries can be directed to the corresponding author(s).
Conflicts of Interest
The authors declare no conflicts of interest.
References
- Zhang, Y.N.; Zhao, Y.; Lv, R.Q. A Review for Optical Sensors Based on Photonic Crystal Cavities. Sens. Actuators A Phys. 2015, 233, 374–389. [Google Scholar] [CrossRef] [Scilit]
- Mohammed, N.A.; Khedr, O.E.; El-Rabaie, E.S.M.; Khalaf, A.A.M. Literature Review: On-Chip Photonic Crystals and Photonic Crystal Fiber for Biosensing and Some Novel Trends. IEEE Access 2022, 10, 47419–47436. [Google Scholar] [CrossRef] [Scilit]
- Agrawal, A.K.; Suchitta, A.; Dhawan, A. Enhanced SPR-Based Localized and Bulk Sensing Using a Plasmonic Nanopillar Array with Spacer. IEEE Sens. J. 2021, 22, 6491–6508. [Google Scholar] [CrossRef] [Scilit]
- Yasli, A.; Akowuah, E.K.; Haxha, S.; Ademgil, H. Photonic Crystal Fiber Based Surface Plasmon Sensor Design and Analyze with Elliptical Air Holes. In 2016 HONET-ICT; IEEE: New York, NY, USA, 2016; pp. 75–78. [Google Scholar] [CrossRef] [Scilit]
- Singh, S.; Kaur, V. Photonic Crystal Fiber Sensor Based on Sensing Ring for Different Blood Components: Design and Analysis. In 2017 Ninth International Conference on Ubiquitous and Future Networks (ICUFN); IEEE: New York, NY, USA, 2017; pp. 399–403. [Google Scholar] [CrossRef] [Scilit]
- Roni, T.A.; Hassan, R.; Faisal, M. Dual-Side Polished SPR Biosensor with Wide Sensing Range. In 2020 11th International Conference on Electrical and Computer Engineering (ICECE); IEEE: New York, NY, USA, 2020; pp. 487–490. [Google Scholar] [CrossRef] [Scilit]
- Dash, J.N.; Jha, R. Highly Sensitive D Shaped PCF Sensor Based on SPR for near IR. Opt. Quantum Electron. 2016, 48, 1–7. [Google Scholar] [CrossRef] [Scilit]
- Santos, D.F.; Guerreiro, A.; Baptista, J.M. SPR Microstructured D-Type Optical Fiber Sensor Configuration for Refractive Index Measurement. IEEE Sens. J. 2015, 15, 5472–5477. [Google Scholar] [CrossRef] [Scilit]
- Patnaik, A.; Senthilnathan, K.; Jha, R. Graphene-Based Conducting Metal Oxide Coated D-Shaped Optical Fiber SPR Sensor. IEEE Photonics Technol. Lett. 2015, 27, 2437–2440. [Google Scholar] [CrossRef] [Scilit]
- Wu, J.; Li, S.; Wang, X.; Shi, M.; Feng, X.; Liu, Y. Ultrahigh Sensitivity Refractive Index Sensor of a D-Shaped PCF Based on Surface Plasmon Resonance. Appl. Opt. 2018, 57, 4002. [Google Scholar] [CrossRef] [Scilit]
- Mumtaz, F.; Roman, M.; Zhang, B.; Abbas, L.G.; Dai, Y.; Ashraf, M.A.; Fiaz, M.A.; Kumar, A. MXene (Ti3C2Tx) Coated Highly-Sensitive D-Shaped Photonic Crystal Fiber Based SPR-Biosensor. Photonics Nanostructures-Fundam. Appl. 2022, 52, 101090. [Google Scholar] [CrossRef] [Scilit]
- Kumar, A.; Verma, P.; Jindal, P. Surface Plasmon Resonance Biosensor Based on a D-Shaped Photonic Crystal Fiber Using Ti3C2Tx MXene Material. Opt. Mater. 2022, 128, 112397. [Google Scholar] [CrossRef] [Scilit]
- Homola, J.; Yee, S.S.; Gauglitz, G. Surface Plasmon Resonance Sensors: Review. Sens. Actuators B Chem. 1999, 54, 3–15. [Google Scholar] [CrossRef] [Scilit]
- Zhao, E.; Jia, P.; Ebendorff-Heidepriem, H.; Li, H.; Huang, P.; Liu, D.; Yang, X.; Liu, L.; Guan, C. Localized Surface Plasmon Resonance Sensing Structure Based on Gold Nanohole Array on Beveled Fiber Edge. Nanotechnology 2017, 28, 435504. [Google Scholar] [CrossRef] [Scilit]
- Dash, J.N.; Jha, R. Graphene-Based Birefringent Photonic Crystal Fiber Sensor Using Surface Plasmon Resonance. IEEE Photonics Technol. Lett. 2014, 26, 1092–1095. [Google Scholar] [CrossRef] [Scilit]
- Liu, C.; Su, W.; Wang, F.; Li, X.; Yang, L.; Sun, T.; Mu, H.; Chu, P.K. Theoretical Assessment of a Highly Sensitive Photonic Crystal Fibre Based on Surface Plasmon Resonance Sensor Operating in the Near-Infrared Wavelength. J. Mod. Opt. 2019, 66, 1–6. [Google Scholar] [CrossRef] [Scilit]
- Lu, Y.; Yang, X.; Wang, M.; Yao, J. Surface Plasmon Resonance Sensor Based on Hollow-Core PCFs Filled with Silver Nanowires. Electron. Lett. 2015, 51, 1675–1677. [Google Scholar] [CrossRef] [Scilit]
- Rifat, A.A.; Amouzad Mahdiraji, G.; Chow, D.M.; Shee, Y.G.; Ahmed, R.; Adikan, F.R.M. Photonic Crystal Fiber-Based Surface Plasmon Resonance Sensor with Selective Analyte Channels and Graphene-Silver Deposited Core. Sensors 2015, 15, 11499–11510. [Google Scholar] [CrossRef] [Scilit]
- Wang, T.; Zhang, M.; Liu, K.; Jiang, J.; Zhao, Y.; Ma, J.; Liu, T. The Effect of the TiO2 Film on the Performance of the Optical Fiber SPR Sensor. Opt. Commun. 2019, 448, 93–97. [Google Scholar] [CrossRef] [Scilit]
- Zhou, L.; Zhou, J.; Lai, W.; Yang, X.; Meng, J.; Su, L.; Gu, C.; Jiang, T.; Pun, E.Y.B.; Shao, L.; et al. Irreversible Accumulated SERS Behavior of the Molecule-Linked Silver and Silver-Doped Titanium Dioxide Hybrid System. Nat. Commun. 2020, 11, 1785. [Google Scholar] [CrossRef] [Scilit]
- Rifat, A.A.; Ahmed, R.; Mahdiraji, G.A.; Adikan, F.R.M. Highly Sensitive D-Shaped Photonic Crystal Fiber-Based Plasmonic Biosensor in Visible to near-IR. IEEE Sens. J. 2017, 17, 2776–2783. [Google Scholar] [CrossRef] [Scilit]
- Nisha, A.; Maheswari, P.; Subanya, S.; Anbarasan, P.M.; Rajesh, K.B.; Jaroszewicz, Z. Ag-Ni Bimetallic Film on CaF2 Prism for High Sensitive Surface Plasmon Resonance Sensor. Photonics Lett. Pol. 2021, 13, 58–60. [Google Scholar] [CrossRef] [Scilit]
- Singh, S.; Chaudhary, B.; Kumar, R.; Upadhyay, A.; Kumar, S. A Numerical Analysis of Rectangular Open Channel Embedded TiO2-Au-MXene Employed PCF Biosensor for Brain Tumor Diagnosis. IEEE Sens. J. 2024, 24, 16047–16054. [Google Scholar] [CrossRef] [Scilit]
- Radhakrishnan, T. Temperature Variation of the Refractive Index of Lithium Fluoride. Proc. Indian Acad. Sci.—Sect. A 1950, 31, 224–228. [Google Scholar] [CrossRef] [Scilit]
- Chu, S.; Nakkeeran, K.; Abobaker, A.M.; Aphale, S.S.; Babu, P.R.; Senthilnathan, K. Design and Analysis of Surface-Plasmon-Resonance-Based Photonic Quasi-Crystal Fiber Biosensor for High-Refractive-Index Liquid Analytes. IEEE J. Sel. Top. Quantum Electron. 2019, 25, 1–9. [Google Scholar] [CrossRef] [Scilit]
- Rifat, A.A.; Haider, F.; Ahmed, R.; Mahdiraji, G.A.; Mahamd Adikan, F.R.; Miroshnichenko, A.E. Highly Sensitive Selectively Coated Photonic Crystal Fiber-Based Plasmonic Sensor. Opt. Lett. 2018, 43, 891. [Google Scholar] [CrossRef] [Scilit]
- Sardar, M.R.; Faisal, M. Dual-Core Dual-Polished PCF-SPR Sensor for Cancer Cell Detection. IEEE Sens. J. 2024, 24, 9843–9854. [Google Scholar] [CrossRef] [Scilit]

Disclaimer/Publisher’s Note: The statements, opinions and data contained in all publications are solely those of the individual author(s) and contributor(s) and not of MDPI and/or the editor(s). MDPI and/or the editor(s) disclaim responsibility for any injury to people or property resulting from any ideas, methods, instructions or products referred to in the content. |
© 2026 by the authors. Licensee MDPI, Basel, Switzerland. This article is an open access article distributed under the terms and conditions of the Creative Commons Attribution (CC BY) license.