


Abstract
Terahertz time-domain spectroscopy (THz-TDS) is a widely used technique for characterizing a broad range of materials in the terahertz frequency region. Conventional THz-TDS requires both reference and sample signals to extract optical parameters such as refractive index and absorption coefficient. Determining optical anisotropy, specifically birefringence and linear dichroism, typically requires separate measurements of the optical parameters of the sample parallel and perpendicular to the terahertz electric field. This process increases measurement time and depends heavily on a stable reference scan. In this work, we present a simple and accurate method to directly obtain birefringence and linear dichroism without the need for a reference measurement. The proposed approach extracts anisotropic parameters solely from the sample signals by analyzing the differential phase delay and amplitude attenuation between orthogonally polarized terahertz electric field components. We validate this method experimentally using optically anisotropic materials such as TiO2 and bamboo samples and confirm that the results agree closely with those from conventional reference-based THz-TDS. This technique offers a practical route to measure the optical anisotropy of materials, particularly in situations where acquiring a reference signal is challenging.
1. Introduction
The terahertz region of the electromagnetic spectrum lies between the microwave and infrared bands, typically spanning frequencies from 0.1 to 10 THz. Recent advances in ultrafast lasers, photoconductive and nonlinear optical materials have enabled reliable generation and detection of terahertz waves, leading to rapid growth of terahertz technology. The low photon energy, sensitivity to molecular vibrations, and transparency of terahertz waves in many dielectric materials make terahertz technology an important tool for sensing, imaging, communication, and material characterization [1].
Terahertz time-domain spectroscopy (THz-TDS) is widely used to extract material parameters such as refractive index and absorption coefficient. It has been applied to a diverse range of materials, including crystals, polymers, pharmaceuticals, and biomaterials [2,3,4]. In many of these materials, the optical response depends on the polarization direction of the incident terahertz field. This optical anisotropy is commonly characterized by birefringence and linear dichroism. Birefringence refers to the difference in refractive index between orthogonally polarized waves, while linear dichroism describes the corresponding difference in absorption. These parameters provide valuable information on molecular alignment, structural order, and internal anisotropy in both natural and engineered materials [5,6,7,8].
In conventional THz-TDS, extraction of the refractive index and absorption coefficient requires two measurements. A sample measurement is recorded when the terahertz wave interacts with the sample under investigation, while a reference measurement is recorded without the sample. The optical parameters are then extracted from their ratio [9,10,11]. For anisotropic materials, this process must be performed for two orthogonal polarization states, either by rotating the sample or by changing the polarization of the terahertz beam [12,13,14,15,16]. While terahertz time-domain spectroscopic ellipsometry has been demonstrated as an alternative for characterizing optical anisotropy [17,18,19,20], it requires specialized polarization optics, and careful system calibration, making it significantly more complex than a standard THz-TDS setup. In conventional THz-TDS approaches, multiple measurements are required, which increases the data acquisition time and requires a stable system and precise sample alignment. Because the optical parameters are obtained by comparing sample and reference waveforms, any fluctuation in source power, detector response, or environmental conditions between measurements can introduce significant errors, particularly when a reproducible reference scan is difficult or impossible to obtain [21,22,23]. Such limitations are particularly relevant in practical scenarios, where the sample cannot be removed from the beam path to acquire a reference scan, biological samples that degrade or change between successive measurements, and measurements where environmental instability makes it difficult to maintain reproducible conditions between reference and sample acquisitions.
To overcome these limitations, we present a simple and robust reference-free method for directly extracting birefringence and linear dichroism from THz-TDS measurements. A reference-free approach eliminates the need for a separate reference waveform and allows anisotropic parameters to be extracted directly from sample measurements. The method exploits the relative phase delay and amplitude attenuation between orthogonally polarized terahertz signals transmitted through the sample. By relying solely on the differential response between polarization states, the proposed approach avoids the need for a reference waveform while remaining compatible with standard THz-TDS setups. This provides a practical and accurate route for characterizing optical anisotropy in a wide range of materials.
2. Experiment
2.1. Terahertz Time Domain Spectroscopy
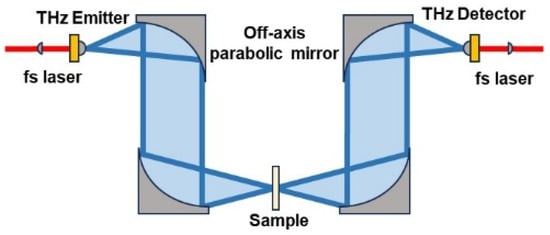
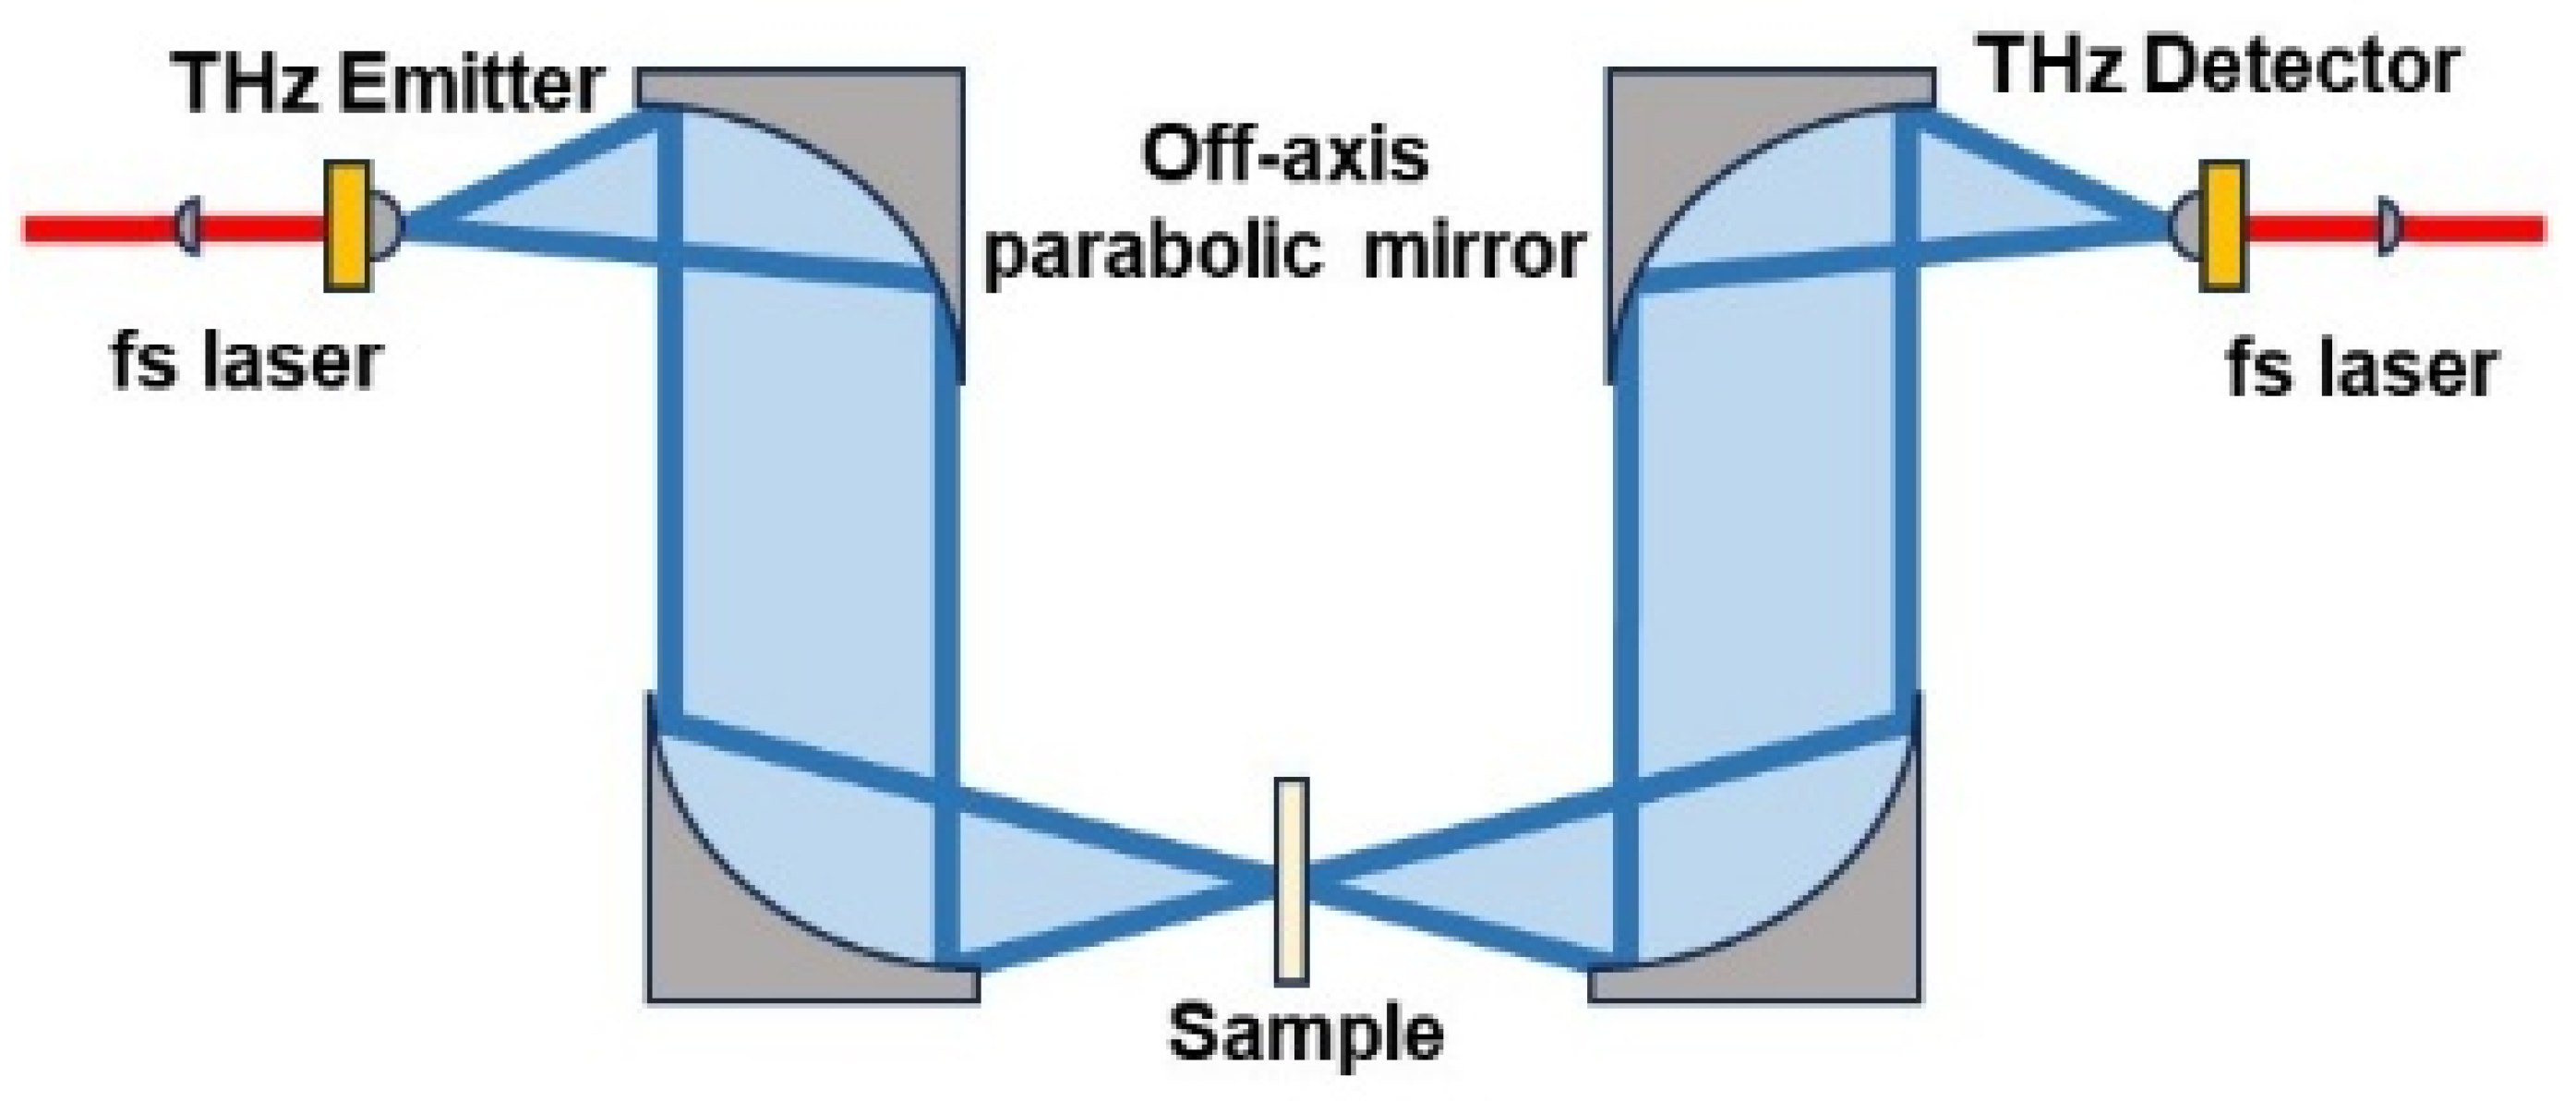
A standard terahertz time-domain spectroscopy system operating in transmission mode is employed to measure the optical constants, including refractive index and absorption coefficient, of the TiO2 and bamboo samples, as shown in Figure 1. The system is based on a compact femtosecond fiber laser with a central wavelength of 780 nm, pulse duration shorter than 100 fs, repetition rate of 50 MHz, and an average output power of 20 mW. Terahertz waves are generated and detected using low-temperature-grown GaAs photoconductive antennas. The output of the femtosecond laser is divided into two equal halves using a beam splitter. One half is used to excite the emitter antenna, while the other half is directed through a mechanical delay stage before illuminating the detector antenna. The emitted terahertz pulse is collimated and focused on the sample using a pair of off-axis parabolic mirrors. After transmission through the sample, the terahertz beam is again collimated and refocused onto the detector antenna using a second pair of off-axis parabolic mirrors. Terahertz time-domain waveforms are acquired using a step-scanning mechanical delay stage, with each waveform consisting of 1024 time-domain points sampled at 40 fs intervals. The frequency resolution of the system is approximately 24 GHz. The system has a dynamic range of approximately 60 dB and covers a frequency range of up to 3 THz when measured in air. Measurements were performed at room temperature under atmospheric pressure in ambient air without nitrogen purging or humidity control.
Figure 1.
Schematic diagram of the terahertz time domain spectroscopy (THz-TDS) system used in the measurement.
2.2. Birefringence and Linear Dichroism
In a standard transmission mode terahertz time domain spectroscopy (THz-TDS), a reference signal is measured when there is nothing on the path of the terahertz wave, while a sample signal is measured when the terahertz wave is transmitted through the sample under investigation. Let ESam(t) and ERef(t) denote the time domain sample and reference signals, then their Fourier transformed spectra are written as
respectively, where φSam(ω) and φRef(ω) are sample and reference phase spectra respectively. The transmittance T(ω) of the sample is defined as the ratio of sample intensity spectrum ISam(ω) to reference intensity spectrum IRef(ω) written as
Next, the absorption coefficient is then calculated from the transmittance as
where d is the sample thickness. The refractive index is calculated from the phase difference between the sample and reference signals as
where c is the speed of light and ω = 2πf is the angular frequency.
ESam(ω) = |ESam(ω)| exp{iφSam(ω)}
ERef(ω) = |ERef(ω)| exp{iφRef(ω)}
Birefringence and linear dichroism are manifestations of optical anisotropy in materials, where the refractive index and absorption coefficient depend on the polarization direction of the incident electromagnetic wave. Birefringence arises from polarization-dependent phase velocities, leading to a relative phase delay between orthogonally polarized components, while linear dichroism originates from polarization-dependent absorption. Birefringence is commonly quantified as the difference between refractive indices measured along two principal optical axes of the material, written as
where ne and no are extraordinary and ordinary refractive indices, respectively. Using the expression of refractive index given above, the birefringence can be computed directly from the phase spectra of the two orthogonally polarized sample signals as
where φe (ω) and φo (ω) are the phase spectra along the extraordinary and ordinary axes of the sample, respectively. Similarly, the linear dichroism is calculated as [8]
where |Ee(ω)| and |Eo(ω)| are the transmitted terahertz electric field amplitudes along the extraordinary and ordinary axes, respectively. From these equations, it is evident that the birefringence and linear dichroism can be calculated solely from the two orthogonally polarized sample signals, without requiring reference measurement, unlike in the conventional THz-TDS approach.
3. Results and Discussion
To demonstrate the validity of the proposed method, birefringence and linear dichroism are evaluated for two well-known optically anisotropic materials with distinct physical origins of anisotropy. Titanium dioxide (TiO2) is a widely studied birefringent crystal used in optical coatings, photonics, and nonlinear optics. Its refractive index differs along the ordinary and extraordinary axes, making it a suitable reference material for evaluating anisotropy extraction methods [24]. Bamboo is selected as a structurally anisotropic biological material in which the alignment of cellulose fibers gives rise to both birefringence and linear dichroism in the terahertz region [25]. These anisotropic properties originate from the elongated cellular structure and polarization-dependent dielectric response of the fibers. The selection of TiO2 and bamboo provides a robust validation of the proposed technique by representing both crystalline and structural forms of optical anisotropy.
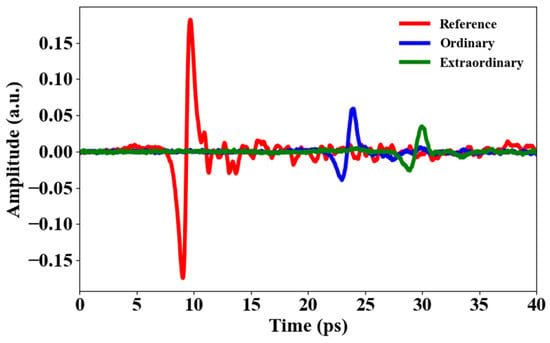
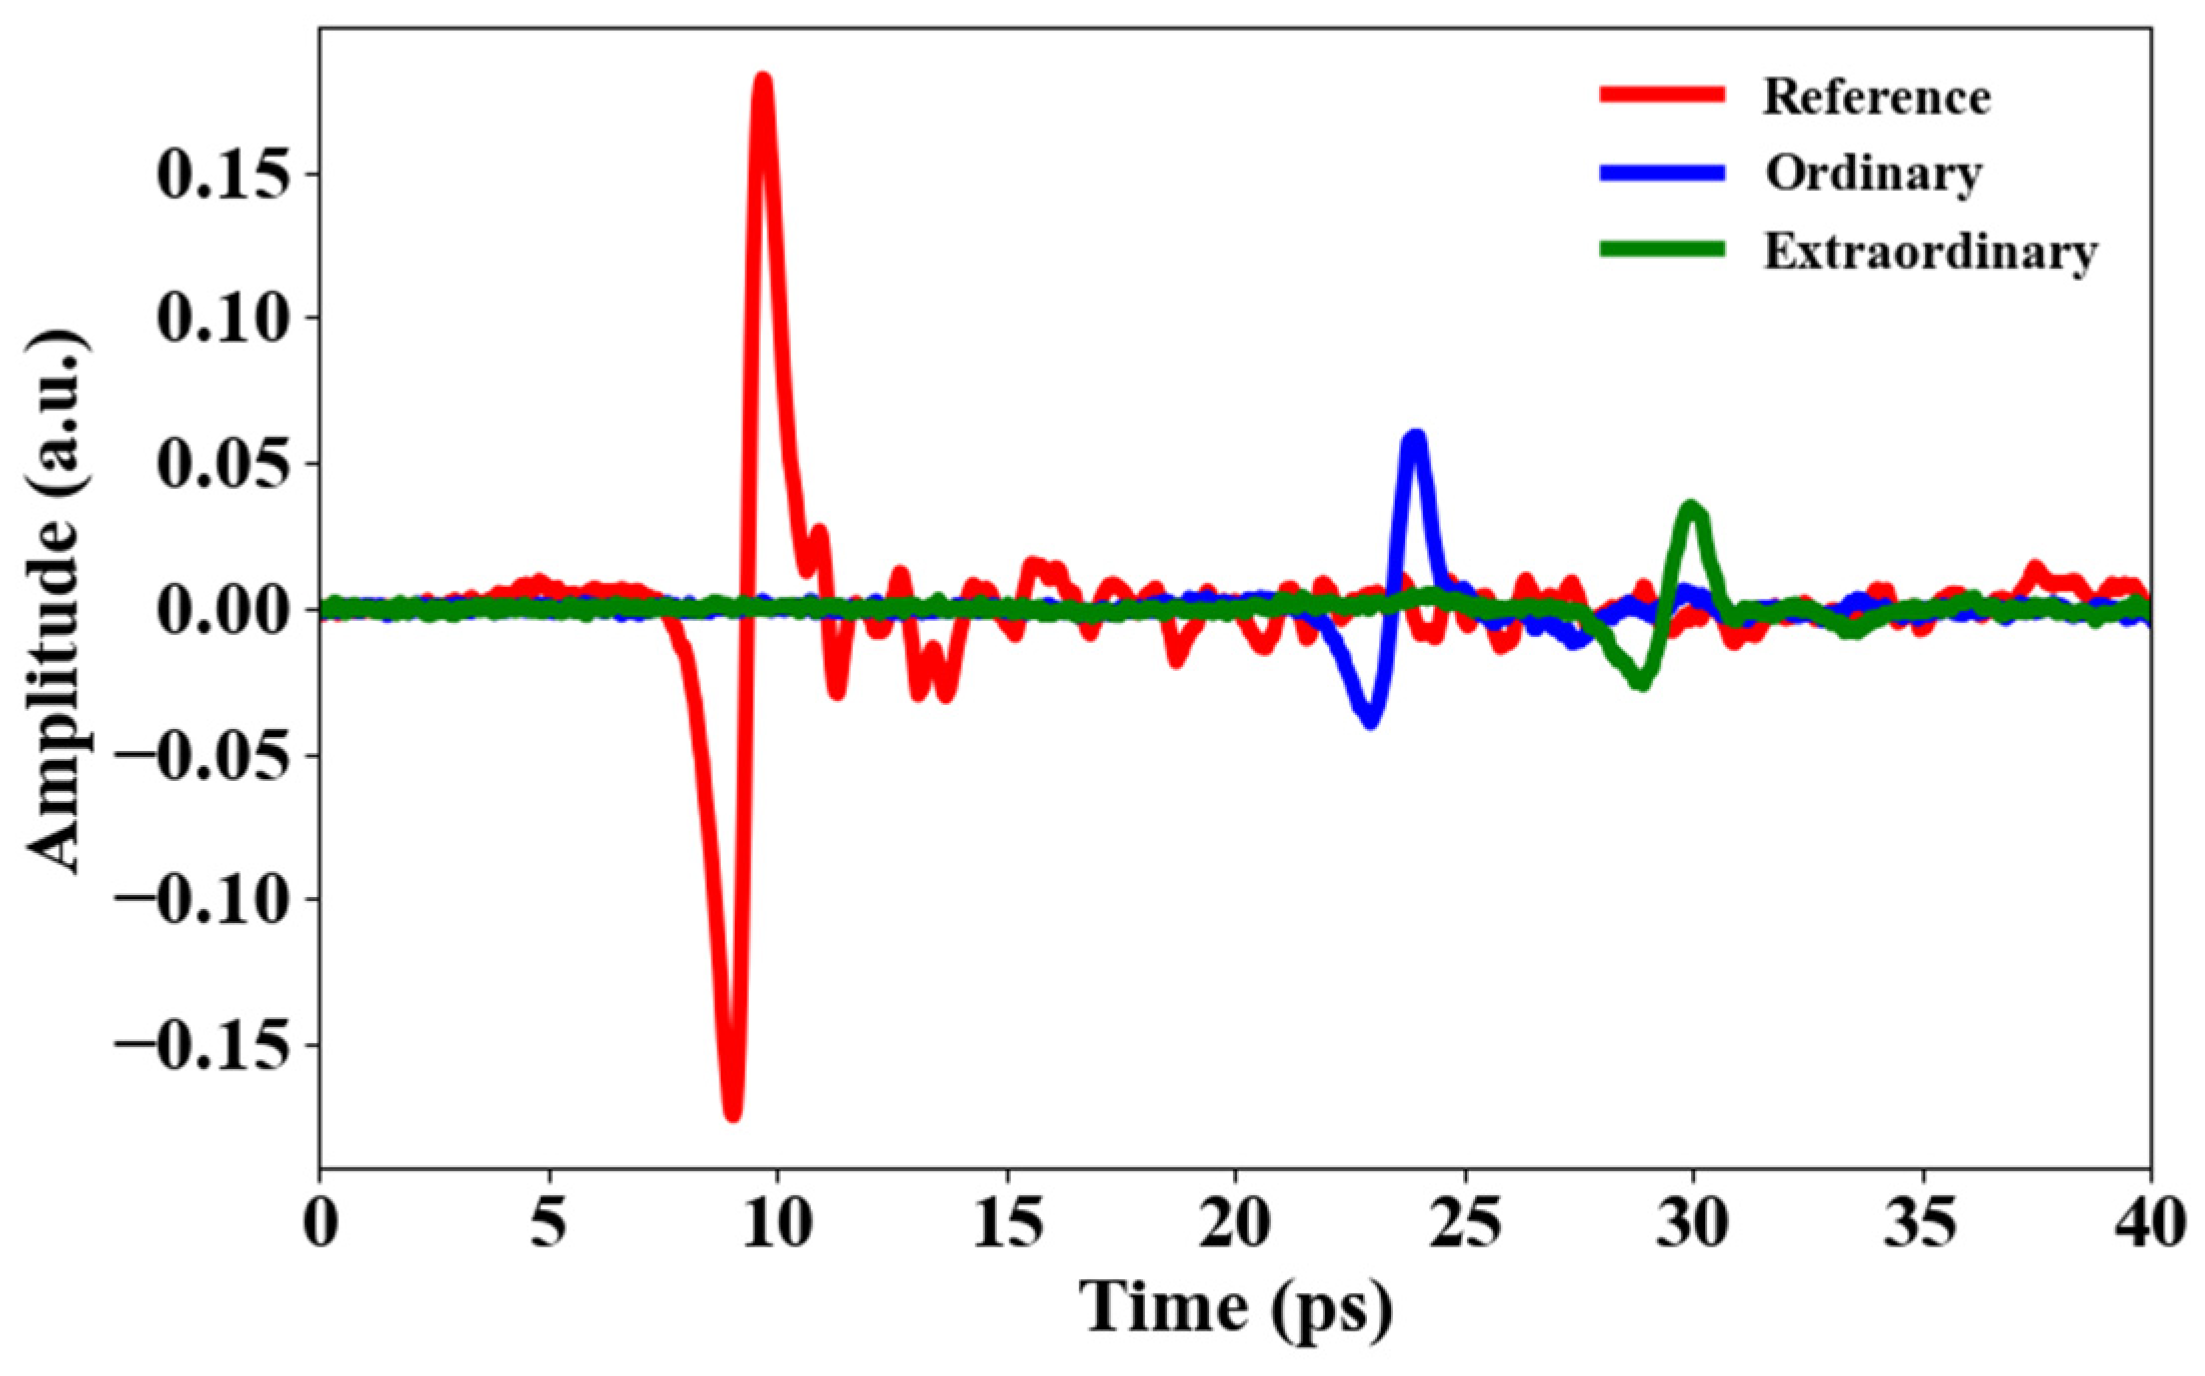
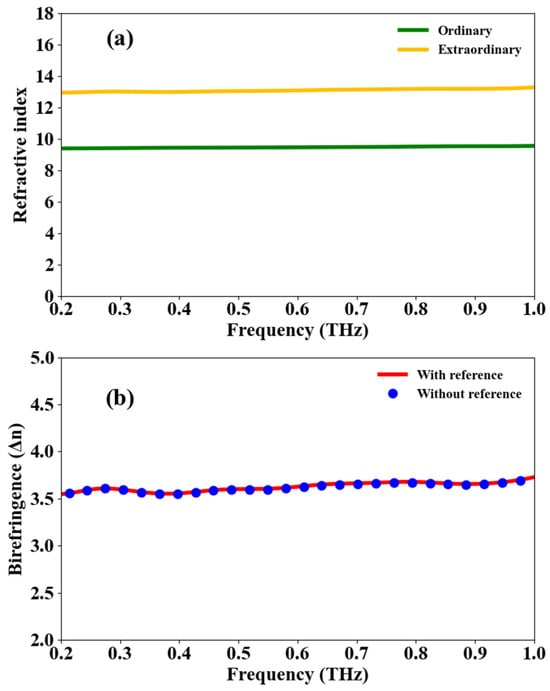
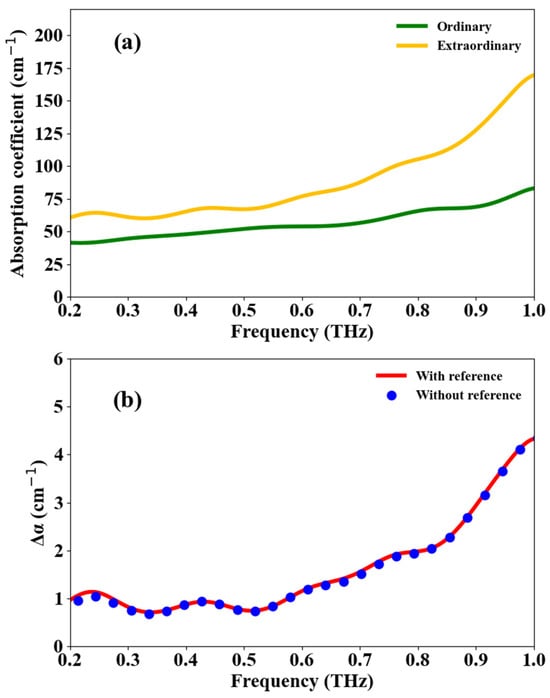
Figure 2 shows the time domain terahertz pulses transmitted through the 0.5 ± 0.05 mm thick rutile TiO2 crystal with (110) orientation for two orthogonal components of the electric field, together with the reference signal. Since the optical axis of the crystal is known, the sample was first aligned to measure the terahertz properties along the ordinary axis, then rotated by 90 degrees to obtain the properties along the extraordinary axis. These signals are analyzed to obtain the birefringence and linear dichroism. Figure 3a shows the refractive indices of TiO2 crystal measured along ordinary and extraordinary axes using conventional reference-based THz-TDS. A clear difference is observed between the two polarization directions across the measured terahertz frequency range, confirming the strong optical anisotropy of the crystal. Using the phase difference between the two orthogonal polarization states, the birefringence was calculated without using a reference signal. The resulting birefringence spectra are shown in Figure 3b. The birefringence obtained with the reference-free method closely matches that derived from the conventional reference-based approach over the entire frequency range. Furthermore, the obtained birefringence values are consistent with the previously reported values for rutile TiO2 in the terahertz frequency range [26]. This agreement confirms that the phase information required to extract birefringence is preserved in the relative phase delay between orthogonally polarized sample signals. Similarly, Figure 4a shows the absorption coefficients of TiO2 crystal measured along ordinary and extraordinary axes using standard THz-TDS. Figure 4b presents the linear dichroism calculated using both methods. The reference-free results follow the same frequency dependence and magnitude as the conventional results, indicating that polarization-dependent absorption can be accurately extracted from the relative amplitude attenuation without requiring a separate reference measurement.
Figure 2.
Reference and sample time domain terahertz waveforms. The sample signals are measured by rotating the TiO2 sample.
Figure 3.
(a) Refractive indices of the TiO2 crystal measured along ordinary and extraordinary axes. (b) Birefringence of the crystal calculated with and without using reference signals.
Figure 4.
(a) Absorption coefficients of the TiO2 crystal measured along ordinary and extraordinary axes. (b) Linear dichroism of the crystal calculated with and without using reference signals.
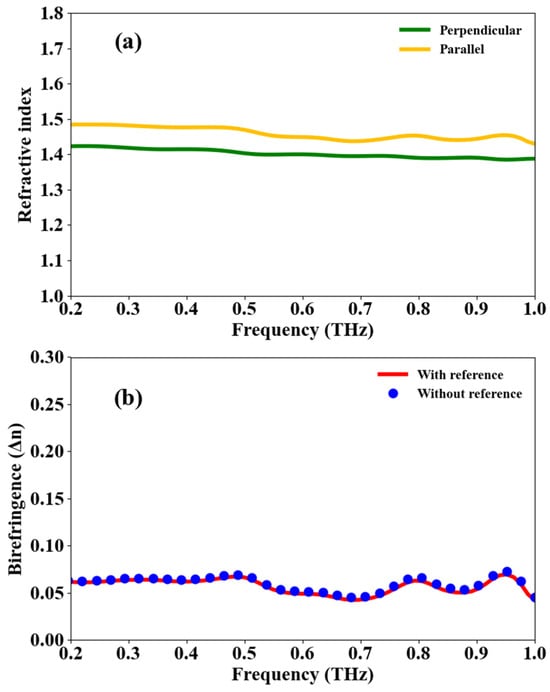
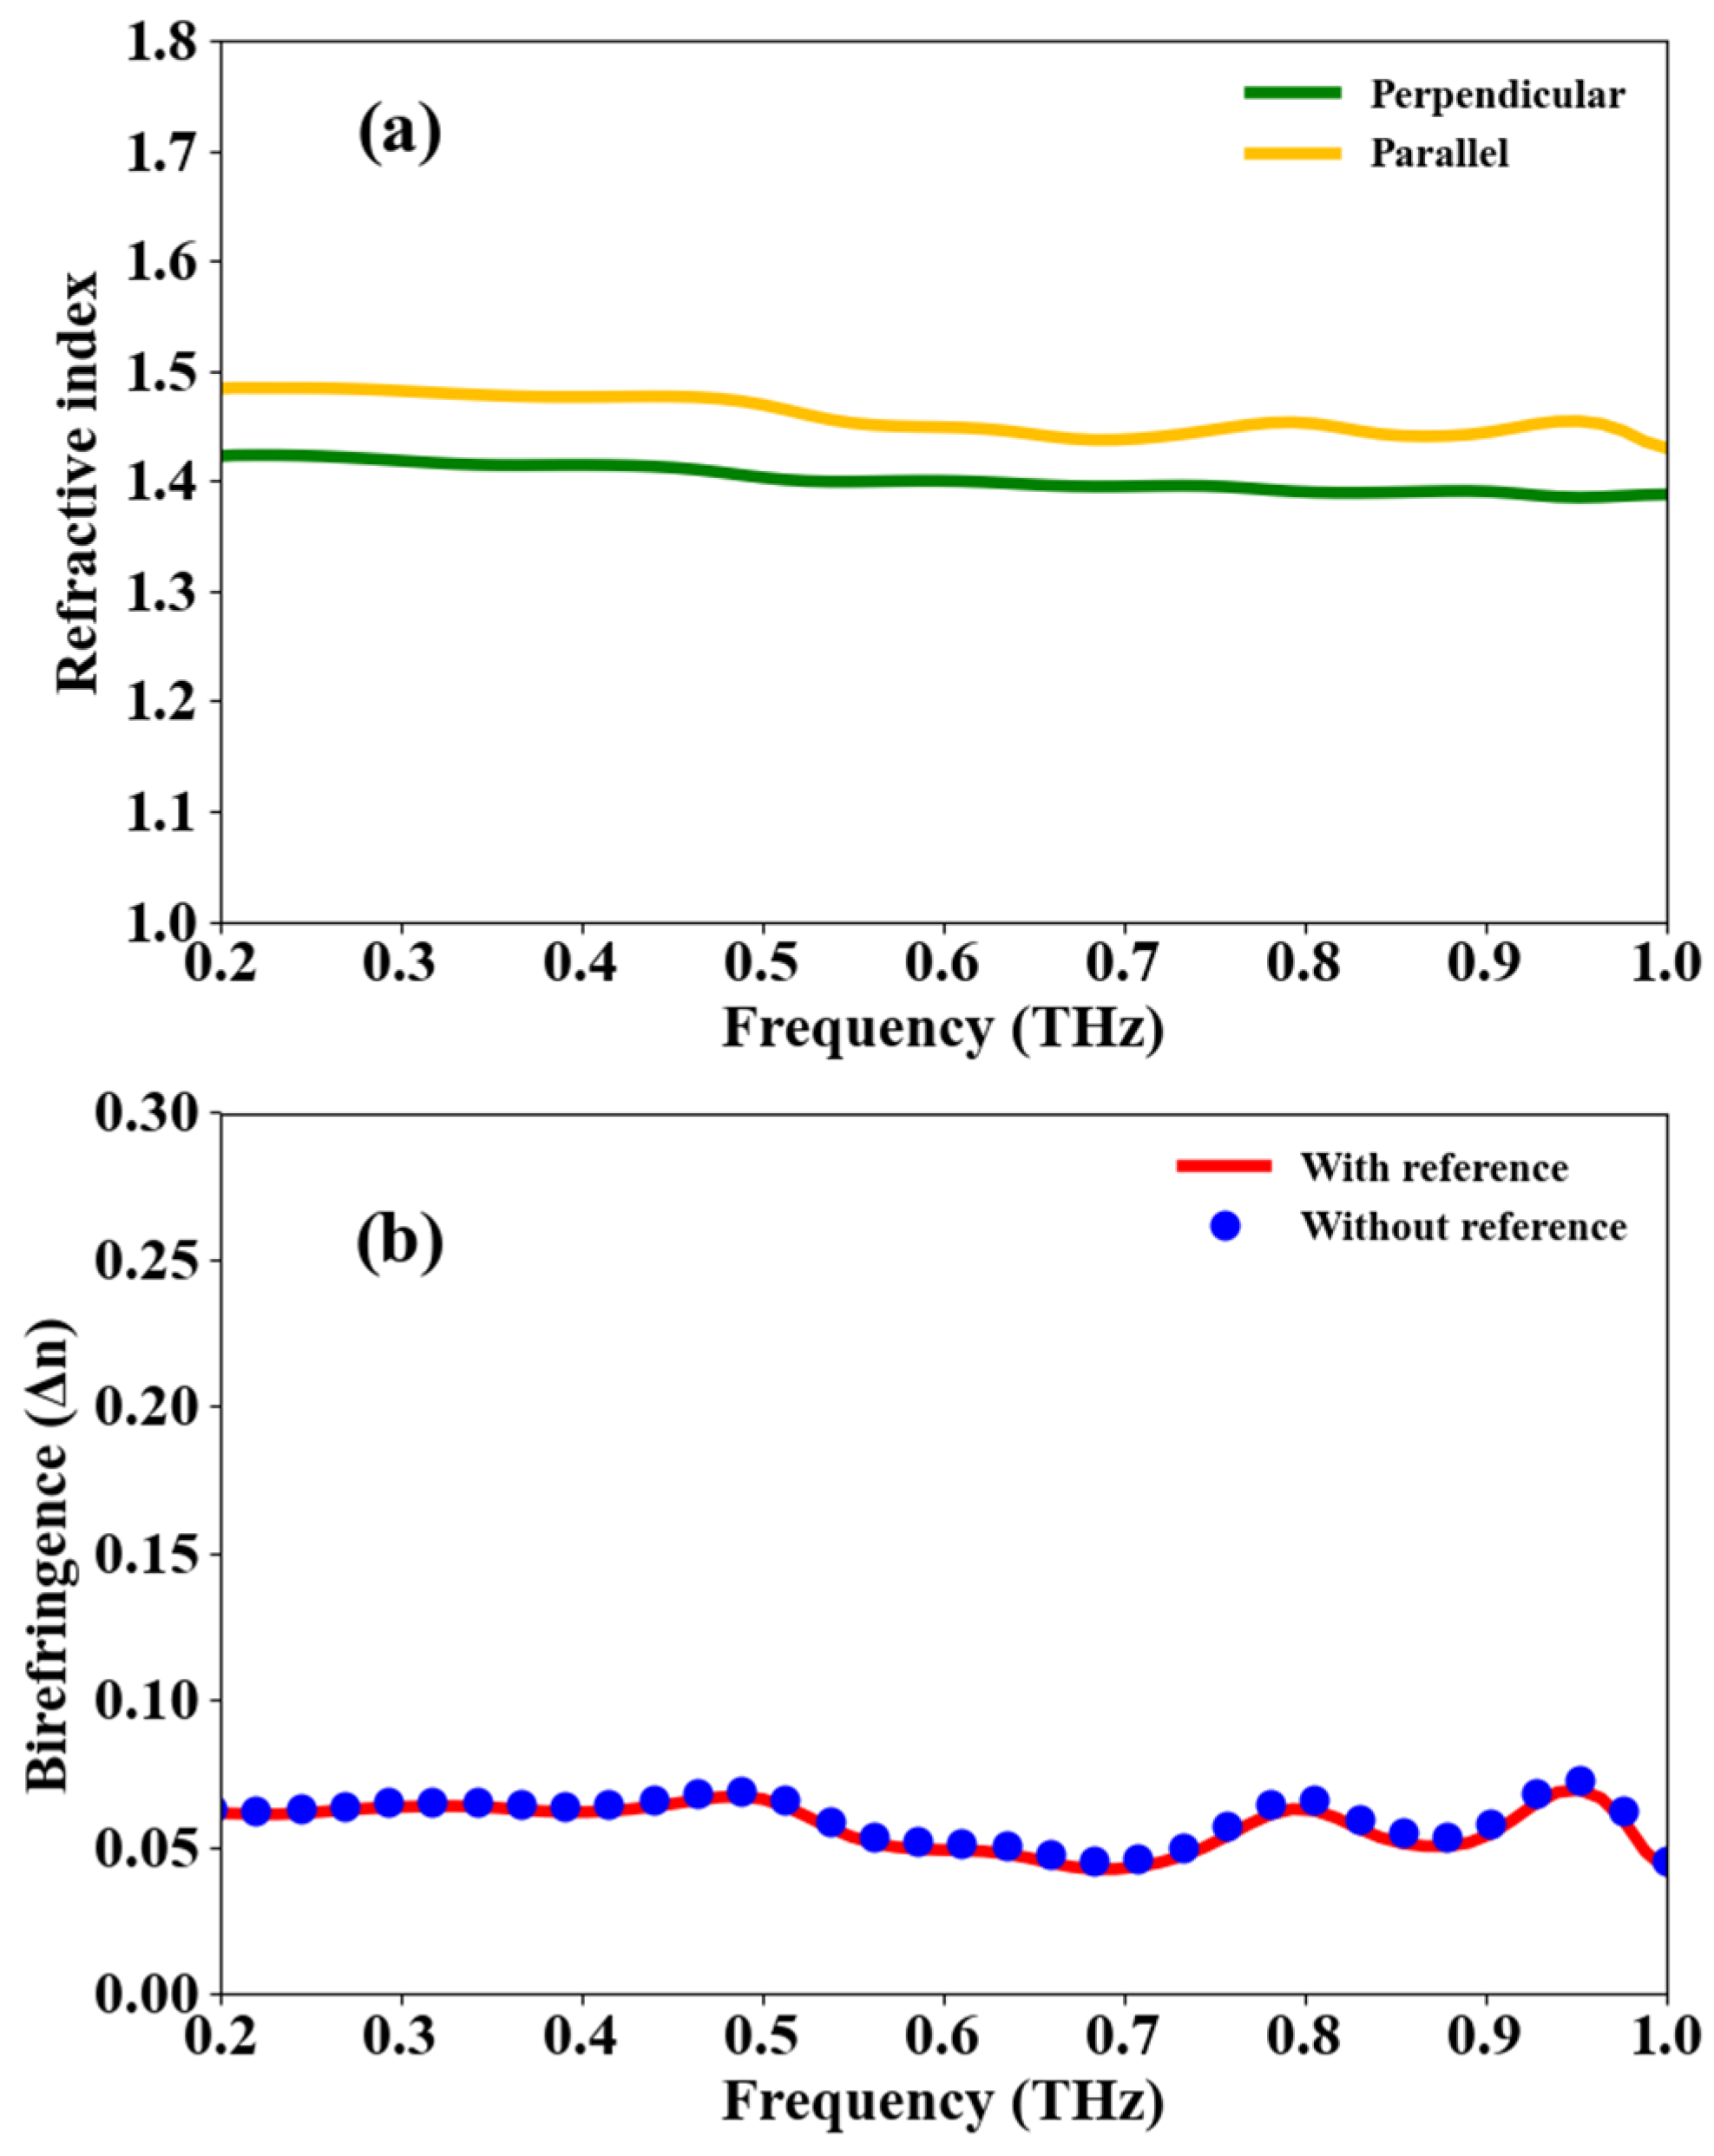
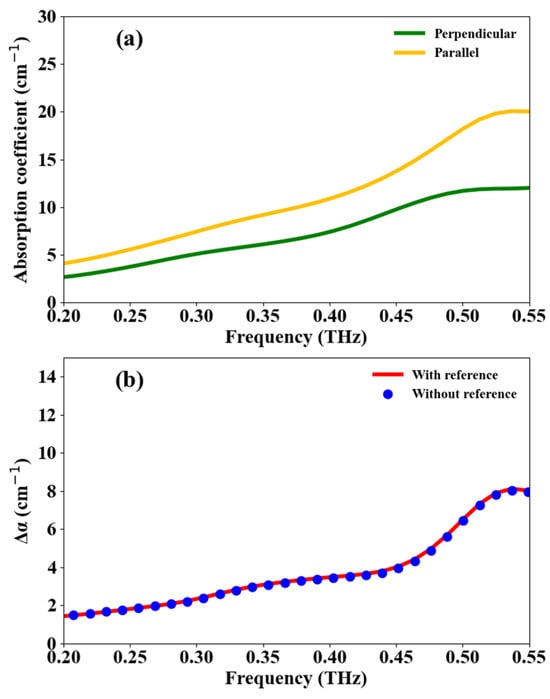
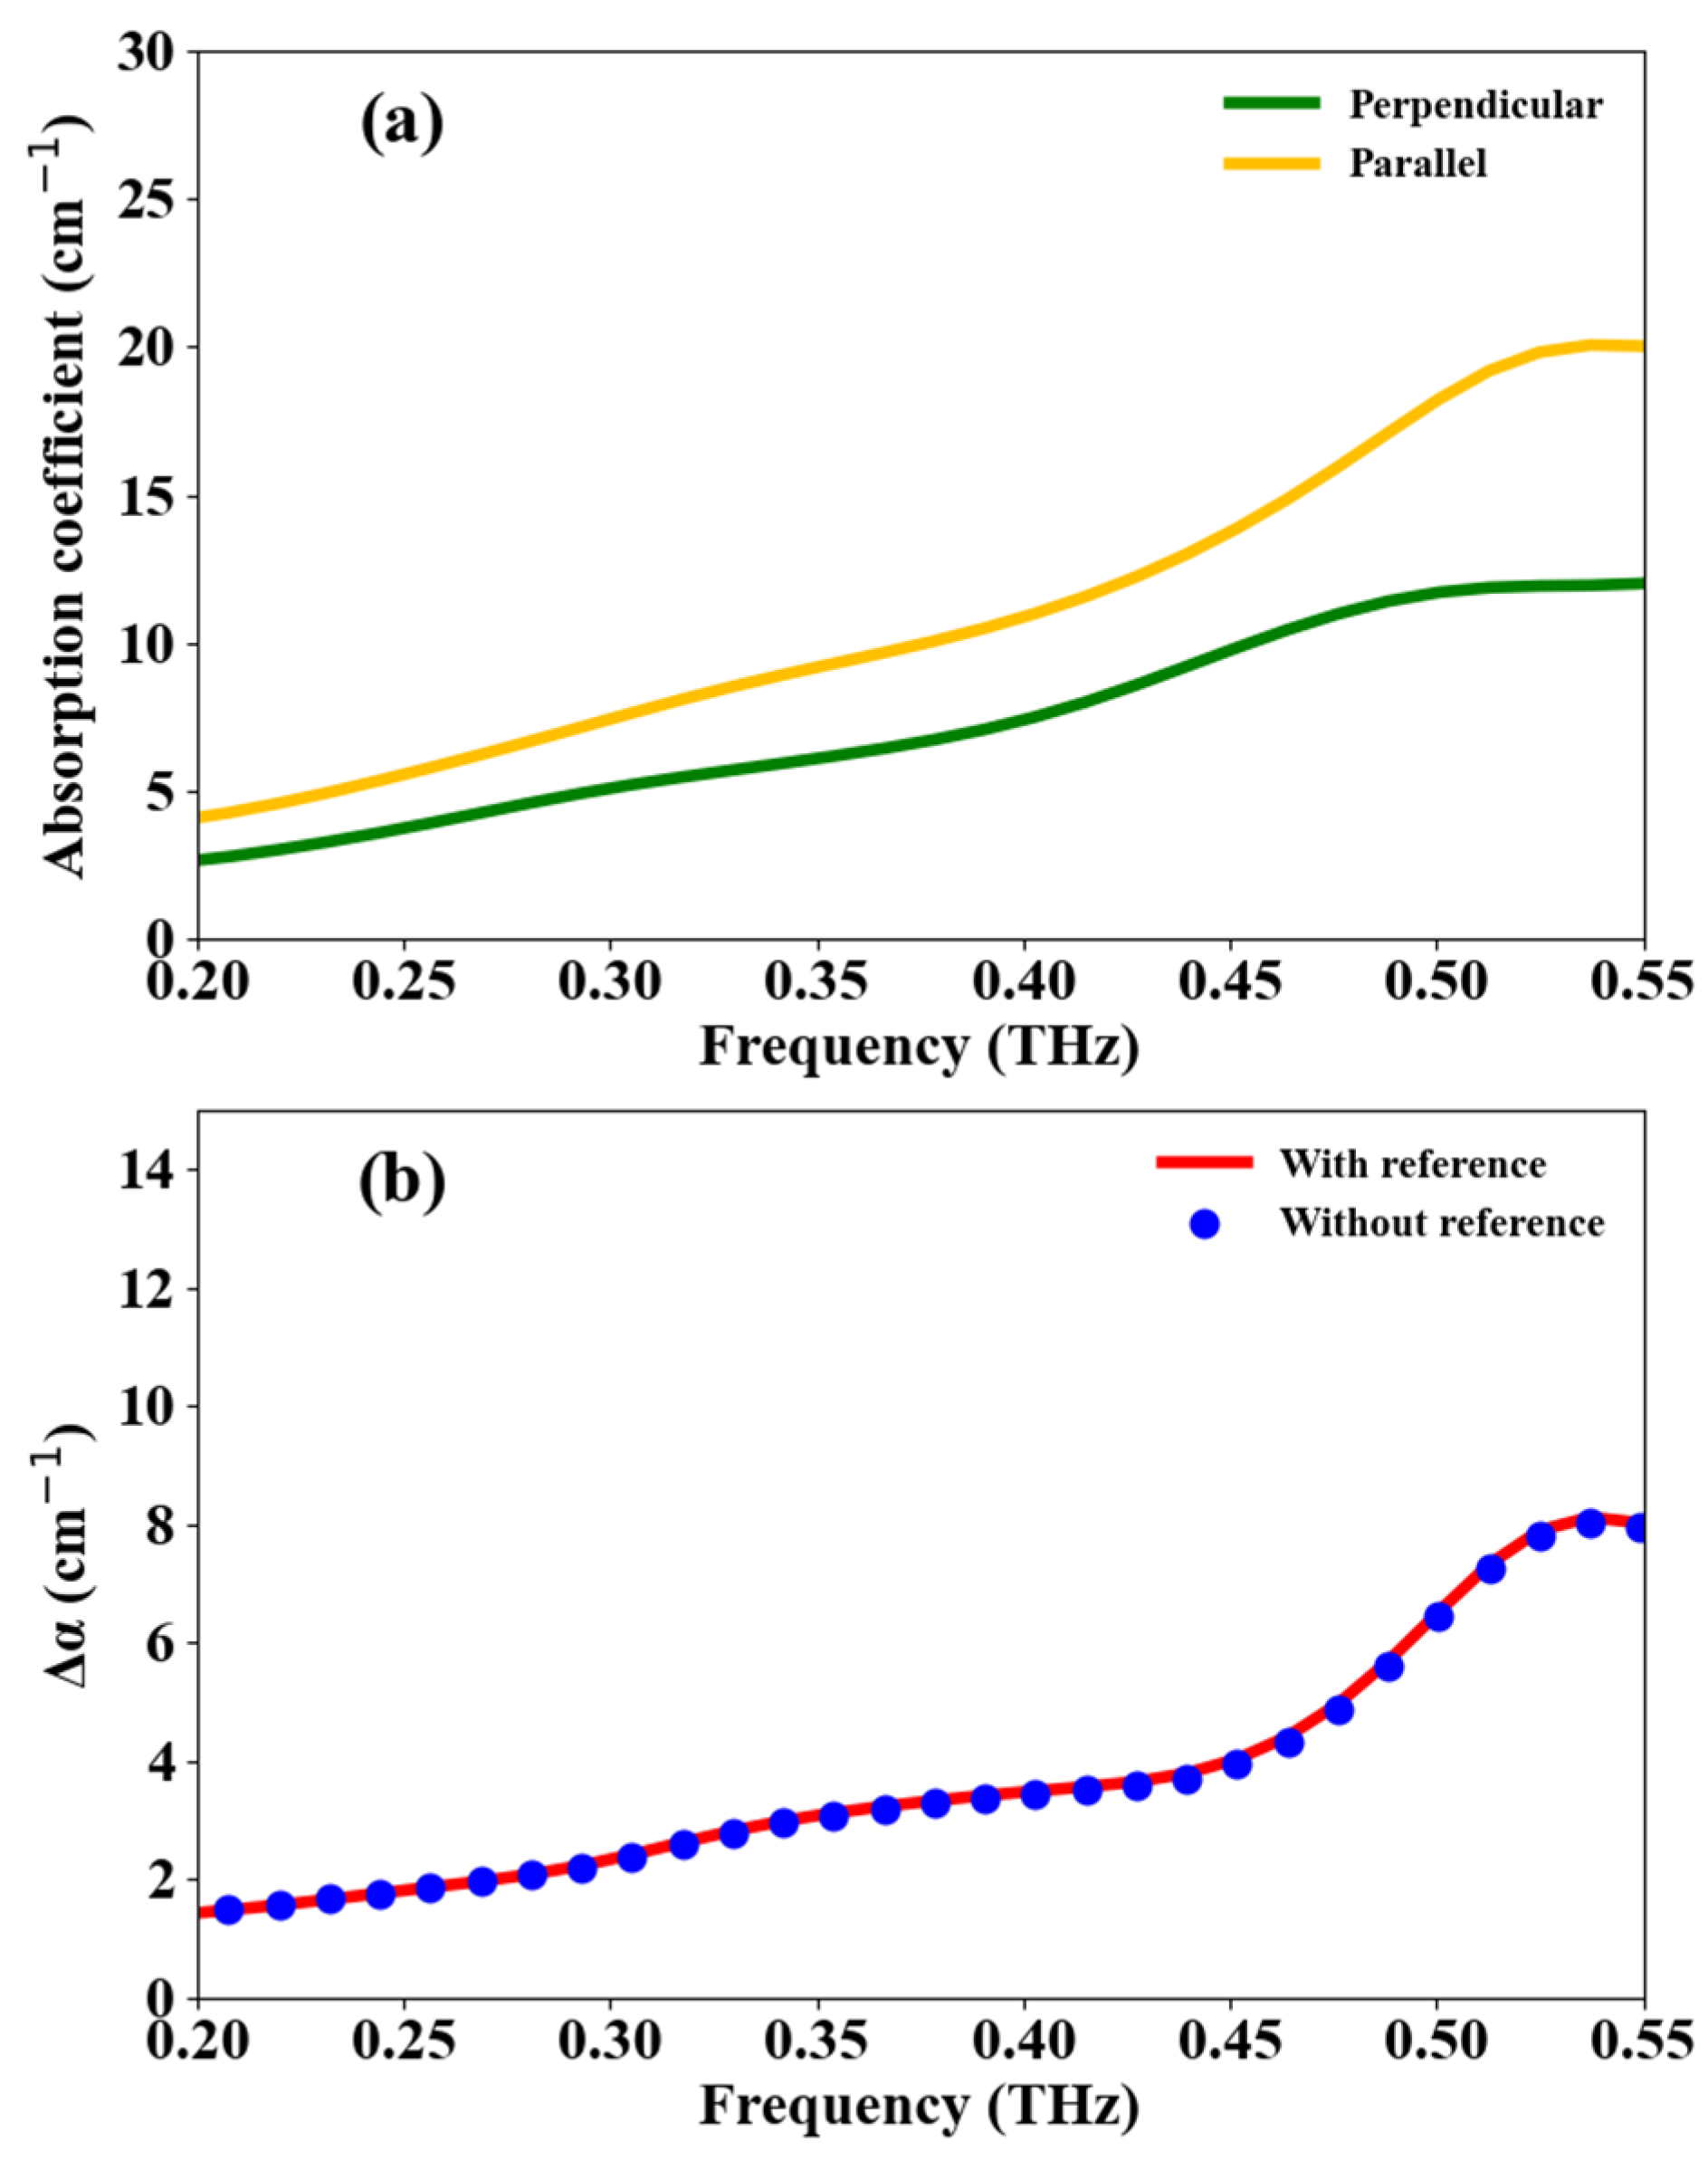
Figure 5a presents the refractive indices of 2.15 ± 0.09 mm thick bamboo sample measured parallel and perpendicular to the fiber direction using conventional reference-based THz-TDS. In contrast to crystalline TiO2, the observed anisotropy in bamboo originates from the preferential alignment of cellulose fibers within its cellular structure, which leads to a polarization-dependent dielectric response in the terahertz frequency range. This structural anisotropy results in distinct refractive index values for the two polarization directions. The bamboo sample was oriented in such a way that the terahertz electric field was aligned parallel to the fiber direction for the first measurement and then rotated by 90 degrees to align the electric field perpendicular to the fibers for the second measurement. The birefringence is obtained from the relative phase delay between the orthogonal polarization components without using a reference signal, and the resulting spectra are shown in Figure 5b. The reference-free birefringence closely follows the values obtained from the conventional reference-based analysis across the measured frequency range, confirming the applicability of the proposed method to biologically derived anisotropic materials. Figure 6a shows the corresponding absorption coefficients measured parallel and perpendicular to the fiber direction using standard THz-TDS. Figure 6b shows the linear dichroism calculated using both approaches. The agreement between the two results demonstrates that polarization-dependent absorption in bamboo can be reliably extracted from relative amplitude differences, even in materials with complex internal structure, without requiring a separate reference measurement. The obtained birefringence and linear dichroism values are consistent with our previously reported results [25]. In both samples, the results are presented up to 1 THz. This is attributed to the combined effect of high absorption and large refractive index in TiO2, which leads to significant Fresnel reflection losses, and to the strong absorption of the bamboo sample beyond this frequency.
Figure 5.
(a) Refractive indices of the bamboo sample measured parallel and perpendicular to the fiber direction. (b) Birefringence of the bamboo calculated with and without using reference signals.
Figure 6.
(a) Absorption coefficients of the bamboo measured parallel and perpendicular to the fiber direction. (b) Linear dichroism of the bamboo calculated with and without using reference signals.
4. Conclusions
In this work, we demonstrate a simple and robust reference-free method to directly measure birefringence and linear dichroism using terahertz time-domain spectroscopy. By exploiting the differential phase delay and amplitude attenuation between orthogonally polarized terahertz signals, the proposed approach extracts anisotropic optical parameters without requiring a separate reference measurement, thereby eliminating errors introduced by system drift and environmental fluctuations between measurements. The method was validated experimentally using two samples with distinct physical origins of anisotropy: a birefringent TiO2 crystal, where anisotropy arises from the crystal structure, and a bamboo sample, where anisotropy originates from the preferential alignment of cellulose fibers. In both cases, the reference-free results show close agreement with those obtained from conventional reference-based THz-TDS, confirming the validity and accuracy of the method. This reference-free technique reduces measurement complexity and sensitivity to system instability and is well suited for rapid and practical characterization of optically anisotropic materials in the terahertz frequency range. While the proposed method offers several practical advantages, it is worth noting that prior knowledge of the principal optical axes of the sample is required, and the accuracy of the extracted parameters depends on the signal quality of both orthogonal polarization measurements. In further work, the proposed method can be extended to reflection geometry, which would enable measurements on highly absorbing samples.
Author Contributions
Conceptualization, S.R.T. and M.S.; methodology, M.S.; software, M.S.; validation, S.R.T. and T.S.; writing—original draft preparation, M.S. and S.R.T.; writing—review and editing, T.S.; visualization, M.S.; supervision, S.R.T.; project administration, S.R.T.; funding acquisition, S.R.T. and T.S. All authors have read and agreed to the published version of the manuscript.
Funding
This work was partially supported by the Japan Society for the Promotion of Science under Grant 26K07619. Part of this work was also supported by a Marine Informatics Research Program provided by Grants for Revitalization of Regional Universities and Industries (Suruga Bay Marine DX Advanced Hub initiative).
Data Availability Statement
The data presented in this study are available on reasonable request from the corresponding author.
Acknowledgments
The authors would like to thank Ryota Kimura for his help in experiments during the initial phase of this study.
Conflicts of Interest
The authors declare no conflicts of interest.
References
- Koch, M.; Mittleman, D.M.; Ornik, J.; Castro-Camus, E. Terahertz time-domain spectroscopy. Nat. Rev. Meth. Prim. 2023, 3, 48. [Google Scholar] [CrossRef] [Scilit]
- Wietzke, S.; Jansen, C.; Reuter, M.; Jung, T.; Kraft, D.; Chatterjee, S.; Fischer, B.M.; Koch, M. Terahertz spectroscopy on polymers: A review of morphological studies. J. Mol. Struct. 2011, 1006, 41–51. [Google Scholar] [CrossRef] [Scilit]
- Zeitler, J.A.; Taday, P.F.; Newnham, D.A.; Pepper, M.; Gordon, K.C.; Rades, T. Terahertz pulsed spectroscopy and imaging in the pharmaceutical setting—A review. J. Pharm. Pharmacol. 2010, 59, 209–223. [Google Scholar]
- Hashimoto, K.; Ishai, P.B.; Bründermann, E.; Tripathi, S.R. Dielectric property measurement of human sweat using attenuated total reflection terahertz time domain spectroscopy. Biomed. Opt. Express 2022, 13, 4572–4582. [Google Scholar] [CrossRef] [Scilit] [PubMed]
- Wiesauer, K.; Jordens, C. Recent Advances in Birefringence Studies at THz Frequencies. J. Infrared Millim. Terahertz Waves 2013, 34, 663–681. [Google Scholar] [CrossRef] [Scilit]
- Ouchi, A.; Tripathi, S.R. Terahertz circular dichroism spectroscopy of 3D chiral metallic microstructures fabricated using high precision CNC machining. IEEE J. Microw. 2025, 5, 108–115. [Google Scholar] [CrossRef] [Scilit]
- Jördens, C.; Scheller, M.; Wietzke, S.; Romeike, D.; Jansen, C.; Zentgraf, T.; Wiesauer, K.; Reisecker, V.; Koch, M. Terahertz spectroscopy to study the orientation of glass fibres in reinforced plastics. Compos. Sci. Technol. 2010, 70, 472–477. [Google Scholar] [CrossRef] [Scilit]
- Lowry, S.N.; Reid, M.E.; Collier, C.M. Dichroism mapping at terahertz frequencies via polarization-sensitive computational imaging. Opt. Lett. 2025, 50, 4402–4405. [Google Scholar] [CrossRef] [Scilit] [PubMed]
- Jepsen, P.; Fischer, B.M. Dynamic range in terahertz time-domain transmission and reflection spectroscopy. Opt. Lett. 2025, 30, 29–31. [Google Scholar]
- Withayachumnankul, W.; Naftaly, M. Fundamentals of measurement in terahertz time-domain spectroscopy. J. Infrared Millim. Terahertz Waves 2014, 35, 610–637. [Google Scholar]
- Tripathi, S.R.; Aoki, M.; Takeda, M.; Asahi, T.; Hosako, I.; Hiromoto, N. Accurate complex refractive index with standard deviation of ZnTe measured by terahertz time domain spectroscopy. Jpn. J. Appl. Phys. 2013, 52, 042401. [Google Scholar] [CrossRef] [Scilit]
- Mamrashev, A.; Minakov, F.; Nikolaev, N.; Antsygin, V. Terahertz Time-Domain Polarimetry for Principal Optical Axes of Anisotropic Crystals. Photonics 2021, 8, 213. [Google Scholar] [CrossRef] [Scilit]
- Zhao, G.; Savini, G.; Yu, Y.; Li, S.; Zhang, J.; Ade, P. A dual-port THz Time Domain Spectroscopy System optimized for recovery of a sample’s Jones matrix. Sci. Rep. 2019, 9, 2099. [Google Scholar] [CrossRef] [Scilit] [PubMed]
- Mosley, W.; Failla, M.; Prabhakaran, D.; Lloyd-Hughes, J. Terahertz spectroscopy of anisotropic materials using beams with rotatable polarization. Sci. Rep. 2017, 7, 12337. [Google Scholar] [CrossRef] [Scilit] [PubMed]
- Ou, H.; Stantchev, R.I.; Chen, X.; Blu, T.; Semtsiv, M.; Masselink, W.T.; Serrano, A.H.; Costa, G.; Young, J.; Chopra, N.; et al. Simultaneous measurement of orthogonal terahertz fields via an emission multiplexing scheme. Opt. Express 2024, 32, 5567–5581. [Google Scholar] [CrossRef] [Scilit] [PubMed]
- Castro-Camus, E.; Johnston, M.B. Extraction of the anisotropic dielectric properties of materials from polarization-resolved terahertz time-domain spectra. J. Opt. A Pure Appl. Opt. 2009, 11, 105206. [Google Scholar] [CrossRef] [Scilit]
- Chen, H.; Wang, K.; Chen, X.; Fang, G. Real-time and calibration-free generalized terahertz time-domain spectroscopic ellipsometry. Appl. Phys. Lett. 2024, 124, 111106. [Google Scholar] [CrossRef] [Scilit]
- Neshat, M.; Armitage, N.P. Terahertz time-domain spectroscopic ellipsometry: Instrumentation and calibration. Opt. Express 2012, 20, 29063–29075. [Google Scholar] [CrossRef] [Scilit] [PubMed]
- Chen, X.; Parrott, E.P.J.; Huang, Z.; Chan, H.-P.; Pickwell-MacPherson, E. Robust and accurate terahertz time-domain spectroscopic ellipsometry. Photonics Res. 2018, 6, 768–775. [Google Scholar] [CrossRef] [Scilit]
- Guo, Q.; Zhang, Y.; Lyu, Z.; Zhang, D.; Huang, Y.; Meng, C.; Zhao, Z.; Yuan, J. THz time-domain spectroscopic ellipsometry with simultaneous measurements of orthogonal polarizations. IEEE Trans. Terahertz Sci. Technol. 2019, 9, 422–429. [Google Scholar] [CrossRef] [Scilit]
- Takeda, M.; Tripathi, S.R.; Aoki, M.; Hiromoto, N. Exploration of the origin of random error in spectrum intensity measured with THz-TDS. In Proceedings of the 35th International Conference on Infrared, Millimeter, and Terahertz Waves, Rome, Italy, 5–10 September 2010; pp. 1–2. [Google Scholar] [CrossRef] [Scilit]
- Withayachumnankul, W.; Fischer, B.M.; Lin, H.; Abbott, D. Uncertainty in terahertz time-domain spectroscopy measurement. J. Opt. Soc. Am. B 2008, 25, 1059–1072. [Google Scholar] [CrossRef] [Scilit]
- Tripathi, S.R.; Aoki, M.; Mochizuki, K.; Hosako, I.; Asahi, T.; Hiromoto, N. Practical method to estimate the standard deviation in absorption coefficients measured with THz time-domain spectroscopy. Opt. Commun. 2010, 283, 2488–2491. [Google Scholar] [CrossRef] [Scilit]
- Zhelnov, V.A.; Chernomyrdin, N.V.; Katyba, G.M.; Gavdush, A.A.; Bukin, V.V.; Garnov, S.V.; Spektor, I.E.; Kurlov, V.N.; Skorobogatiy, M.; Zaytsev, K.I. Hemispherical rutile solid immersion lens for terahertz microscopy with superior 0.06-0.11 λ resolution. Adv. Opt. Mat. 2024, 12, 2300927. [Google Scholar]
- Ichikawa, H.; Takeya, K.; Tripathi, S.R. Linear dichroism and birefringence spectra of bamboo and its use as a wave plate in the terahertz frequency region. Opt. Mat. Express 2023, 13, 966–981. [Google Scholar] [CrossRef] [Scilit]
- Jördens, C.; Scheller, M.; Wichmann, M.; Mikulics, M.; Wiesauer, K.; Koch, M. Terahertz birefringence for orientation analysis. Appl. Opt. 2009, 48, 2037–2044. [Google Scholar] [CrossRef] [Scilit] [PubMed]
Disclaimer/Publisher’s Note: The statements, opinions and data contained in all publications are solely those of the individual author(s) and contributor(s) and not of MDPI and/or the editor(s). MDPI and/or the editor(s) disclaim responsibility for any injury to people or property resulting from any ideas, methods, instructions or products referred to in the content. |
© 2026 by the authors. Licensee MDPI, Basel, Switzerland. This article is an open access article distributed under the terms and conditions of the Creative Commons Attribution (CC BY) license.