


Abstract
In this paper, we propose and demonstrate a sensitivity-enhanced sensing interrogation scheme based on an Optoelectronic oscillator (OEO), in which a switchable dual-passband microwave photonic filter (MPF) is introduced into the loop. The switchable dual-passband MPF is a combination of a modified fiber Mach–Zehnder interferometer (FMZI), an electro-optical modulator (EOM), a roll of dispersion compensating fiber (DCF), and a photodetector (PD). The dual-passband switching of the MPF can be achieved by simply adjusting the polarization state via rotating a polarization controller (PC) in the FMZI. The sensitivity can be improved by a factor of two by tracking the frequency corresponding to the central frequency of the high-frequency passband relative to the low-frequency passband. Temperature-sensing experiments were conducted to verify the concept of enhanced sensitivity. Experimental results on temperature sensing show that tracking low- and high-frequency OEO signals yields sensitivities of 5.23 MHz/°C and 10.84 MHz/°C, respectively, and temperature resolutions of 0.009 °C and 0.004 °C, thereby increasing sensitivity and resolution.
1. Introduction
In recent years, owing to their inherent advantages of low cost, fast response, and immunity to electromagnetic interference (EMI), optical fiber sensors have received widespread attention [1]. Among optical fiber sensors, fiber Bragg grating (FBG) [2,3,4,5] and interferometer-based optical fiber sensors [6,7,8,9,10] are the two main categories widely studied by researchers. FBG-based optical fiber sensors obtain information by monitoring the power or central wavelength shift of the reflected optical signal. While FBG-based optical fiber sensors perform well, their manufacturing requires precise settings, such as phase masks and lasers, which add to the cost. In addition, FBGs are susceptible to environmental factors such as temperature and strain, and thus, cross-sensitivity needs to be avoided. Moreover, the sensitivity of the FBG-based approach is relatively low compared to interferometer-based optical fiber sensors. Therefore, interferometer-based optical fiber sensors with low cost, simple fabrication, and high sensitivity have attracted much research attention. Different types of optical fiber interferometer-based sensors have been successfully proposed and validated, such as the Mach–Zehnder interferometer (MZI) [9,10], the Sagnac interferometer (SI) [6], and the Fabry–Perot interferometer (FPI) [8]. With significant advantages, such as a simple structure, high sensitivity, and ease of fabrication compared to other fiber-optic sensors, MZI-based optical fiber sensors have been widely studied in recent years. The most basic fiber MZI structure consists of two optical couplers (OCs) combined with two fiber arms of varying lengths. While optical fiber MZI-based sensing approaches offer many advantages, the reported interrogation techniques rely on wavelength and optical power detection. Therefore, the demodulation speed and resolution are strongly limited by the performance of the optical spectrum analyzer (OSA).
In recent years, microwave photonic technology has attracted widespread attention because of its high-resolution demodulation ability. Among them, sensing systems based on optoelectronic oscillators (OEOs) have become widely studied due to their high speed and high resolution. OEO-based optical fiber sensors convert the measurands into the electrical domain, where the demodulation speed is greatly improved. This advantage is attributed to the high-Q characteristic of the OEO loop, which enables the generation of ultra-narrow linewidth microwave signals and facilitates high-resolution frequency tracking. In addition, because the resolution of the instrument in the electrical domain can reach the Hz level, it is possible to track smaller frequency movements, where the resolution is improved compared to the scheme demodulated in the optical domain. A variety of OEO-based sensing systems have been proposed and verified, such as temperature sensing systems [11,12], strain sensing systems [13], refractive index sensing systems [14], Vital-Sign Detection [15], and Magnetic Field Sensing [16]. OEO-based sensing demodulation can be divided into two categories: one maps the measurands to the loop delay [12,13,15,16,17,18], and the other to the shift of the microwave photonic filter (MPF) in the loop [11,19,20]. The measurands are determined by tracking the generated OEO frequency. In general, MPF-based OEO schemes are more sensitive than loop-delay-mapped schemes. For example, in Ref. [12], the sensitivity of the delay-mapping-based method is only 26.5 kHz/°C. In contrast, the sensitivity of MPF-based OEO for temperature sensors reported in Ref. [11] reaches 3.73 MHz/°C. At present, a number of schemes have been proposed to improve the sensitivity of OEO by using the Vernier effect to amplify the delay-mapping-based OEO loop, but the sensitivity is still not comparable to that of the MPF-based OEO method [21,22,23].
In this paper, we propose a sensitivity-enhanced sensing interrogation system based on a single-frequency OEO with switchable operating frequencies incorporating a dual-passband MPF. The key to this scheme is to connect the modified fiber Mach–Zehnder interferometer (FMZI) and OEO to further improve the sensitivity and resolution of the sensing system. The fundamental concept is to translate the change in the free spectral range (FSR) of MZI into the movement of the central frequency of the dual-passband MPF, i.e., the movement of the signal frequency of the resulting OEO. Since modified FMZI can switch between two FSRs and one mixed state, the resulting MPF can also be flexibly switched between two single passbands and one dual-passband. When one of the arms of the FMZI acts as a sensing arm, the sensitivity of the high-frequency passband of the MPF is twice that of the low-frequency passband. When the gain of the loop reaches the oscillation threshold, OEO begins to oscillate. In order to verify the feasibility of the solution, we performed temperature sensing. Experimental results prove a temperature sensor with a sensitivity of 10.84 MHz/°C by tracking high-frequency OEO signals, and 5.23 MHz/°C by tracking low-frequency OEO signals. By tracking high-frequency OEO signals, the sensitivity of the modified FMZI-based OEO scheme can be improved by a factor of two, and the resolution can also be improved by a factor of two in comparison with the traditional FMZI-based OEO scheme.
2. Experimental Setup and Operation Principle
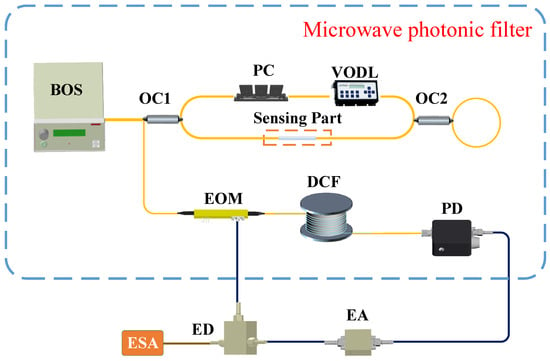
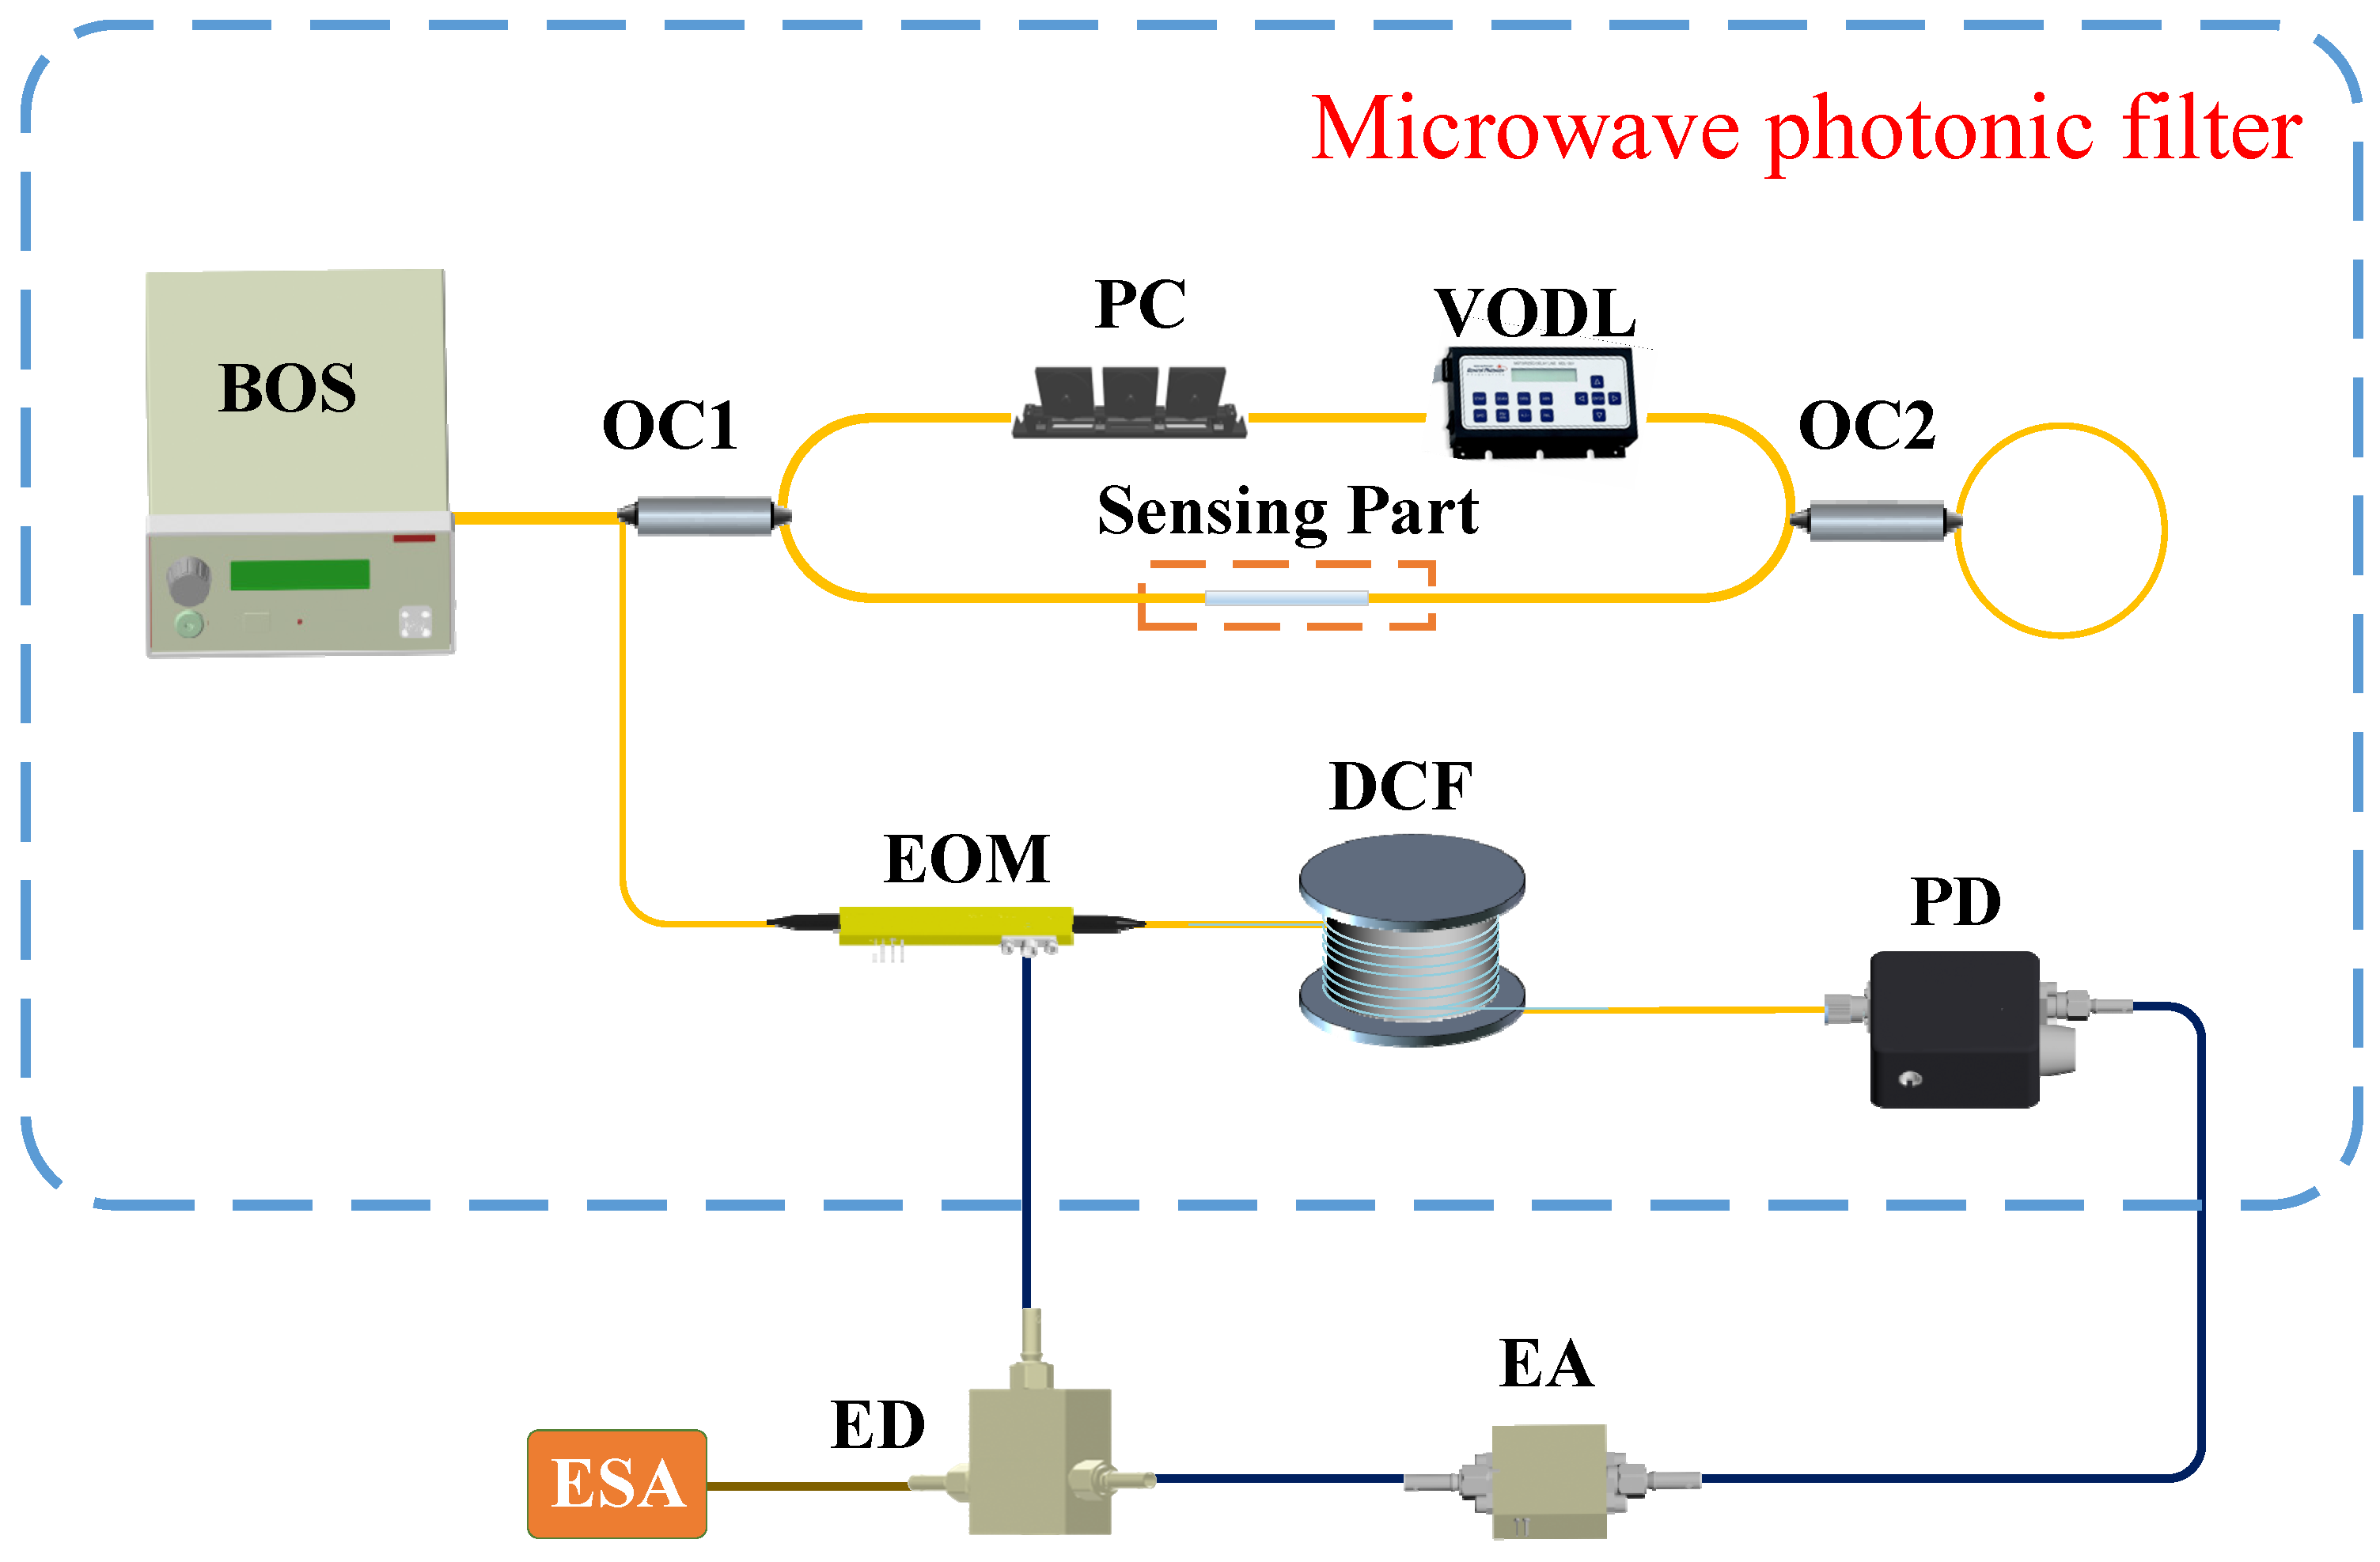
The schematic of the proposed dual-passband MPF-based OEO for sensitivity-improvement sensing system is shown in Figure 1. The light from the broadband light source (BOS) is coupled into OC1 and split into two beams: one is used as the sensing arm, and the other is for reference. The upper arm is connected to the PC, and a section of single-mode fiber (SMF) in the lower arm is placed in an incubator, with the temperature held constant. The sensing fiber is a standard SMF without cladding removal and is placed in an incubator where it is uniformly exposed to temperature variation. A temperature change induces variations in both the fiber’s refractive index and physical length, thereby affecting the interferometer’s optical path difference. The two beams merged in OC2, and the transmitted light was reflected back to FMZI, which consists of two fiber arms of varying lengths and two OCs. Then, it passes through an electro-optical modulator (EOM), which is biased at the quadrature point, a section of dispersion-compensating fiber (DCF), and, finally, the optical signal is converted into an electrical signal by a photodetector (PD). The electrical signal is amplified by an electrical amplifier (EA) and then divided into two parts by an electrical divider (ED). One part is fed back to the EOM to close the loop, while the other is sent to the electrical spectrum analyzer (ESA) for observation. The other output is to the electrical spectrum analyzer (ESA) for observation.
Figure 1.
Configuration of the dual-passband MPF-based OEO for a temperature sensing system.
First, as shown by the blue dotted box in Figure 1, MPF is a combination of BOS, modified FMZI, EOM, DCF, and PD. The frequency response of the MPF can be expressed as follows [24]:
where is the optical spectrum of the BOS. is the transfer function of the dispersive medium. represents the transmittance of the optical spectrum slicer. In our experiment, it represents the transmission function of the modified FMZI, which can be given as follows [25]:
where , and are the effective refractive indices of the two axes of the fiber, k is the wave number, and represents the length of the shorter arm within the FMZI, respectively. is the angle of linearly polarized light, is the coupling ratio of OC2, illustrates the angle of rotation of the light after passing through the PC, and is the phase difference.
According to the previous reports [11,23], the central frequency of the dual passband of the MPF is given by the following:
in which the following applies:
where represents the dispersion of the DCF, and is the wavelength of the incident light wave and the effective refractive index of the SMF, is the initial length difference of the FMZI. According to Equations (3) and (4), the following can be deduced: , .
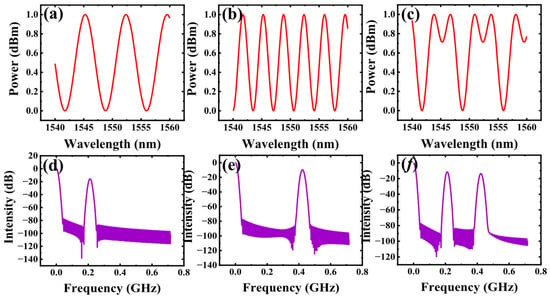
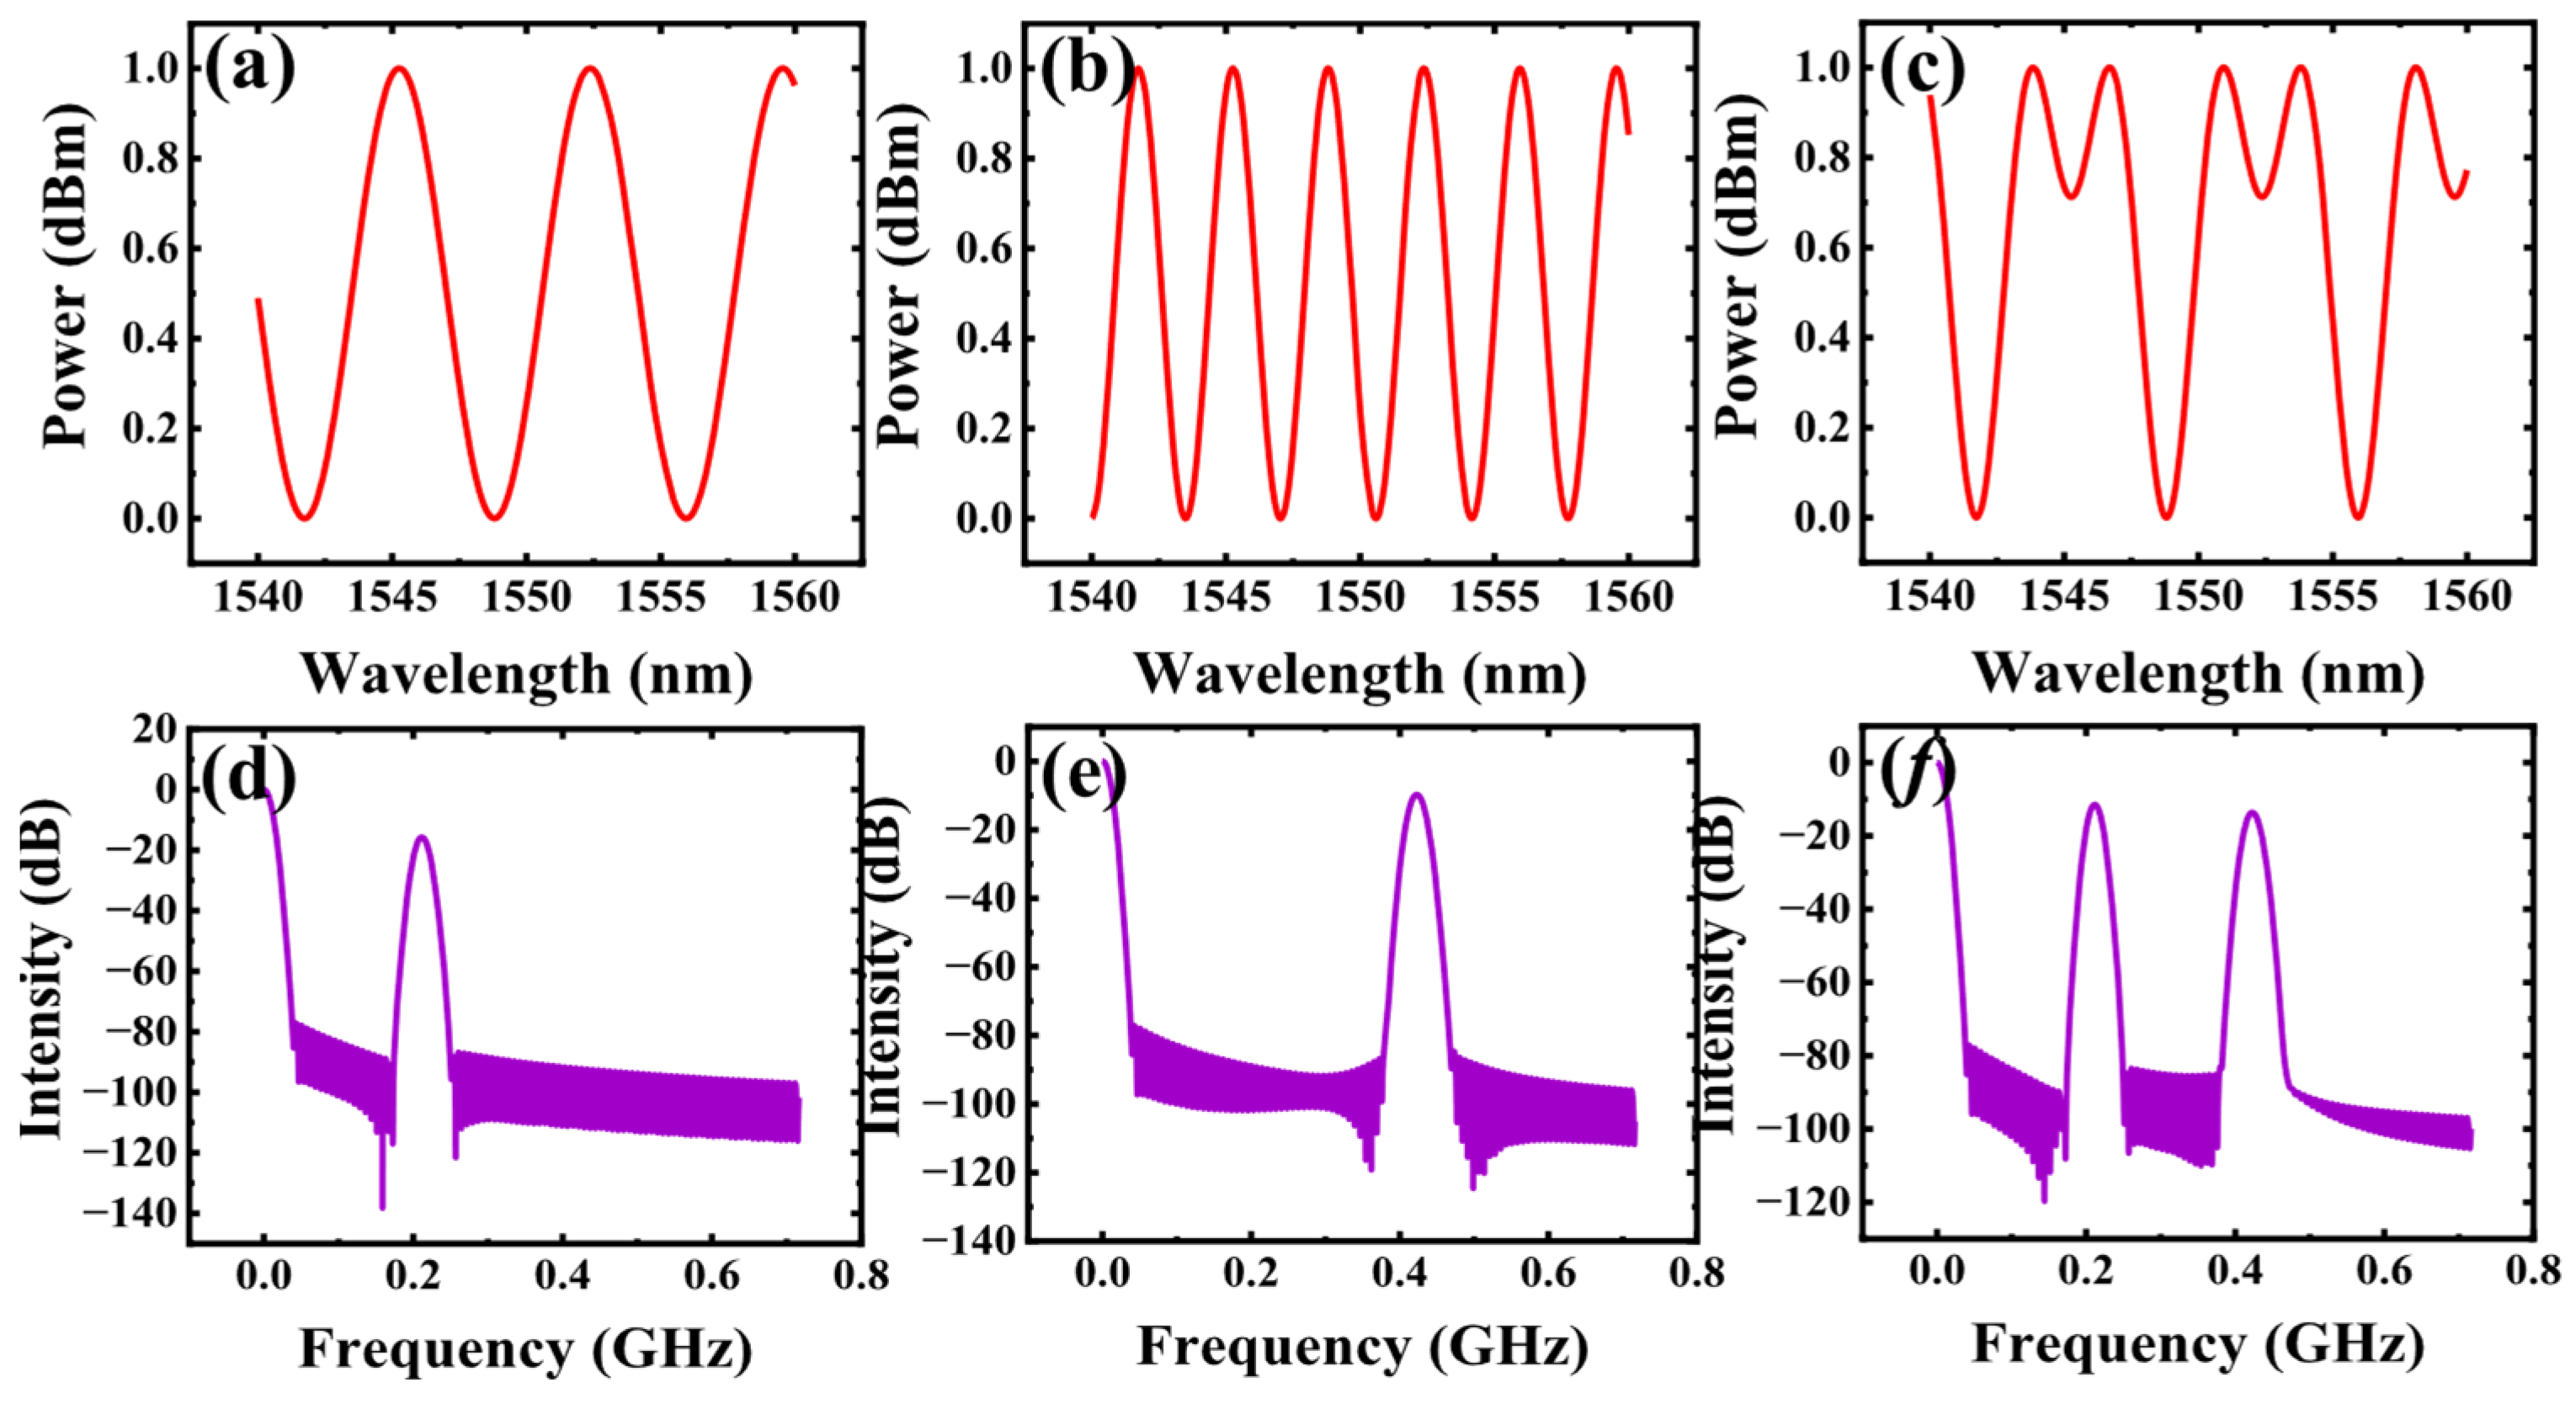
Figure 2 shows the simulated frequency response and the corresponding optical spectrum result of the dual passband MPF based on Equation (1) and Equation (2), respectively. The Figure 2a–c are represented as simulated spectra corresponding to the MPF operating in the low-frequency passband, high-frequency passband, and dual-passband. The frequency response of the MPF operates in the low-frequency passband, high-frequency passband, and dual-passband as shown in Figure 2d–f. In the simulation, a MATLAB (R2023b, MathWorks, Natick, MA, USA)-based numerical model is employed. The optical wavelength is set from 1540 nm to 1560 nm with a central wavelength of 1550 nm. The effective refractive index is taken as 1.468. The length difference between the two arms of the FMZI is set to 0.23 mm, and the thermo-optic coefficient and thermal expansion coefficient are 6.6 × 10⁻⁶/°C and 0.55 × 10⁻⁶/°C, respectively. The polarization state is controlled by a fiber polarization controller and is manually adjusted to achieve the desired interference condition, where different polarization states correspond to the single-passband and dual-passband responses shown in Figure 2.
Figure 2.
The simulated corresponding optical spectrum at three different polarization states when dual passband MPF is operated at (a) lower passband, (b) higher passband, (c) dual passband. The simulated frequency responses of the generated dual passband MPF operated at (d) lower passband, (e) higher passband, (f) dual passband.
The sensitivity of the central frequency of the two-passband MPF, as well as the frequency of OEO, can be expressed as follows:
where α (∼0.55 × 10⁻⁶/°C) and ξ (∼6.45 × 10⁻⁶/°C) are the thermal expansion coefficient and the thermo-optic coefficient of silica. represents the length of the sensing part placed in an incubator. We can see that the sensitivity of the two frequencies has the following relationship: .
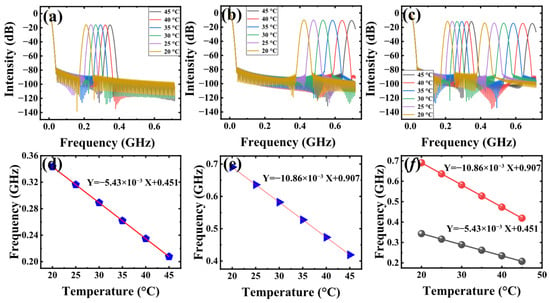
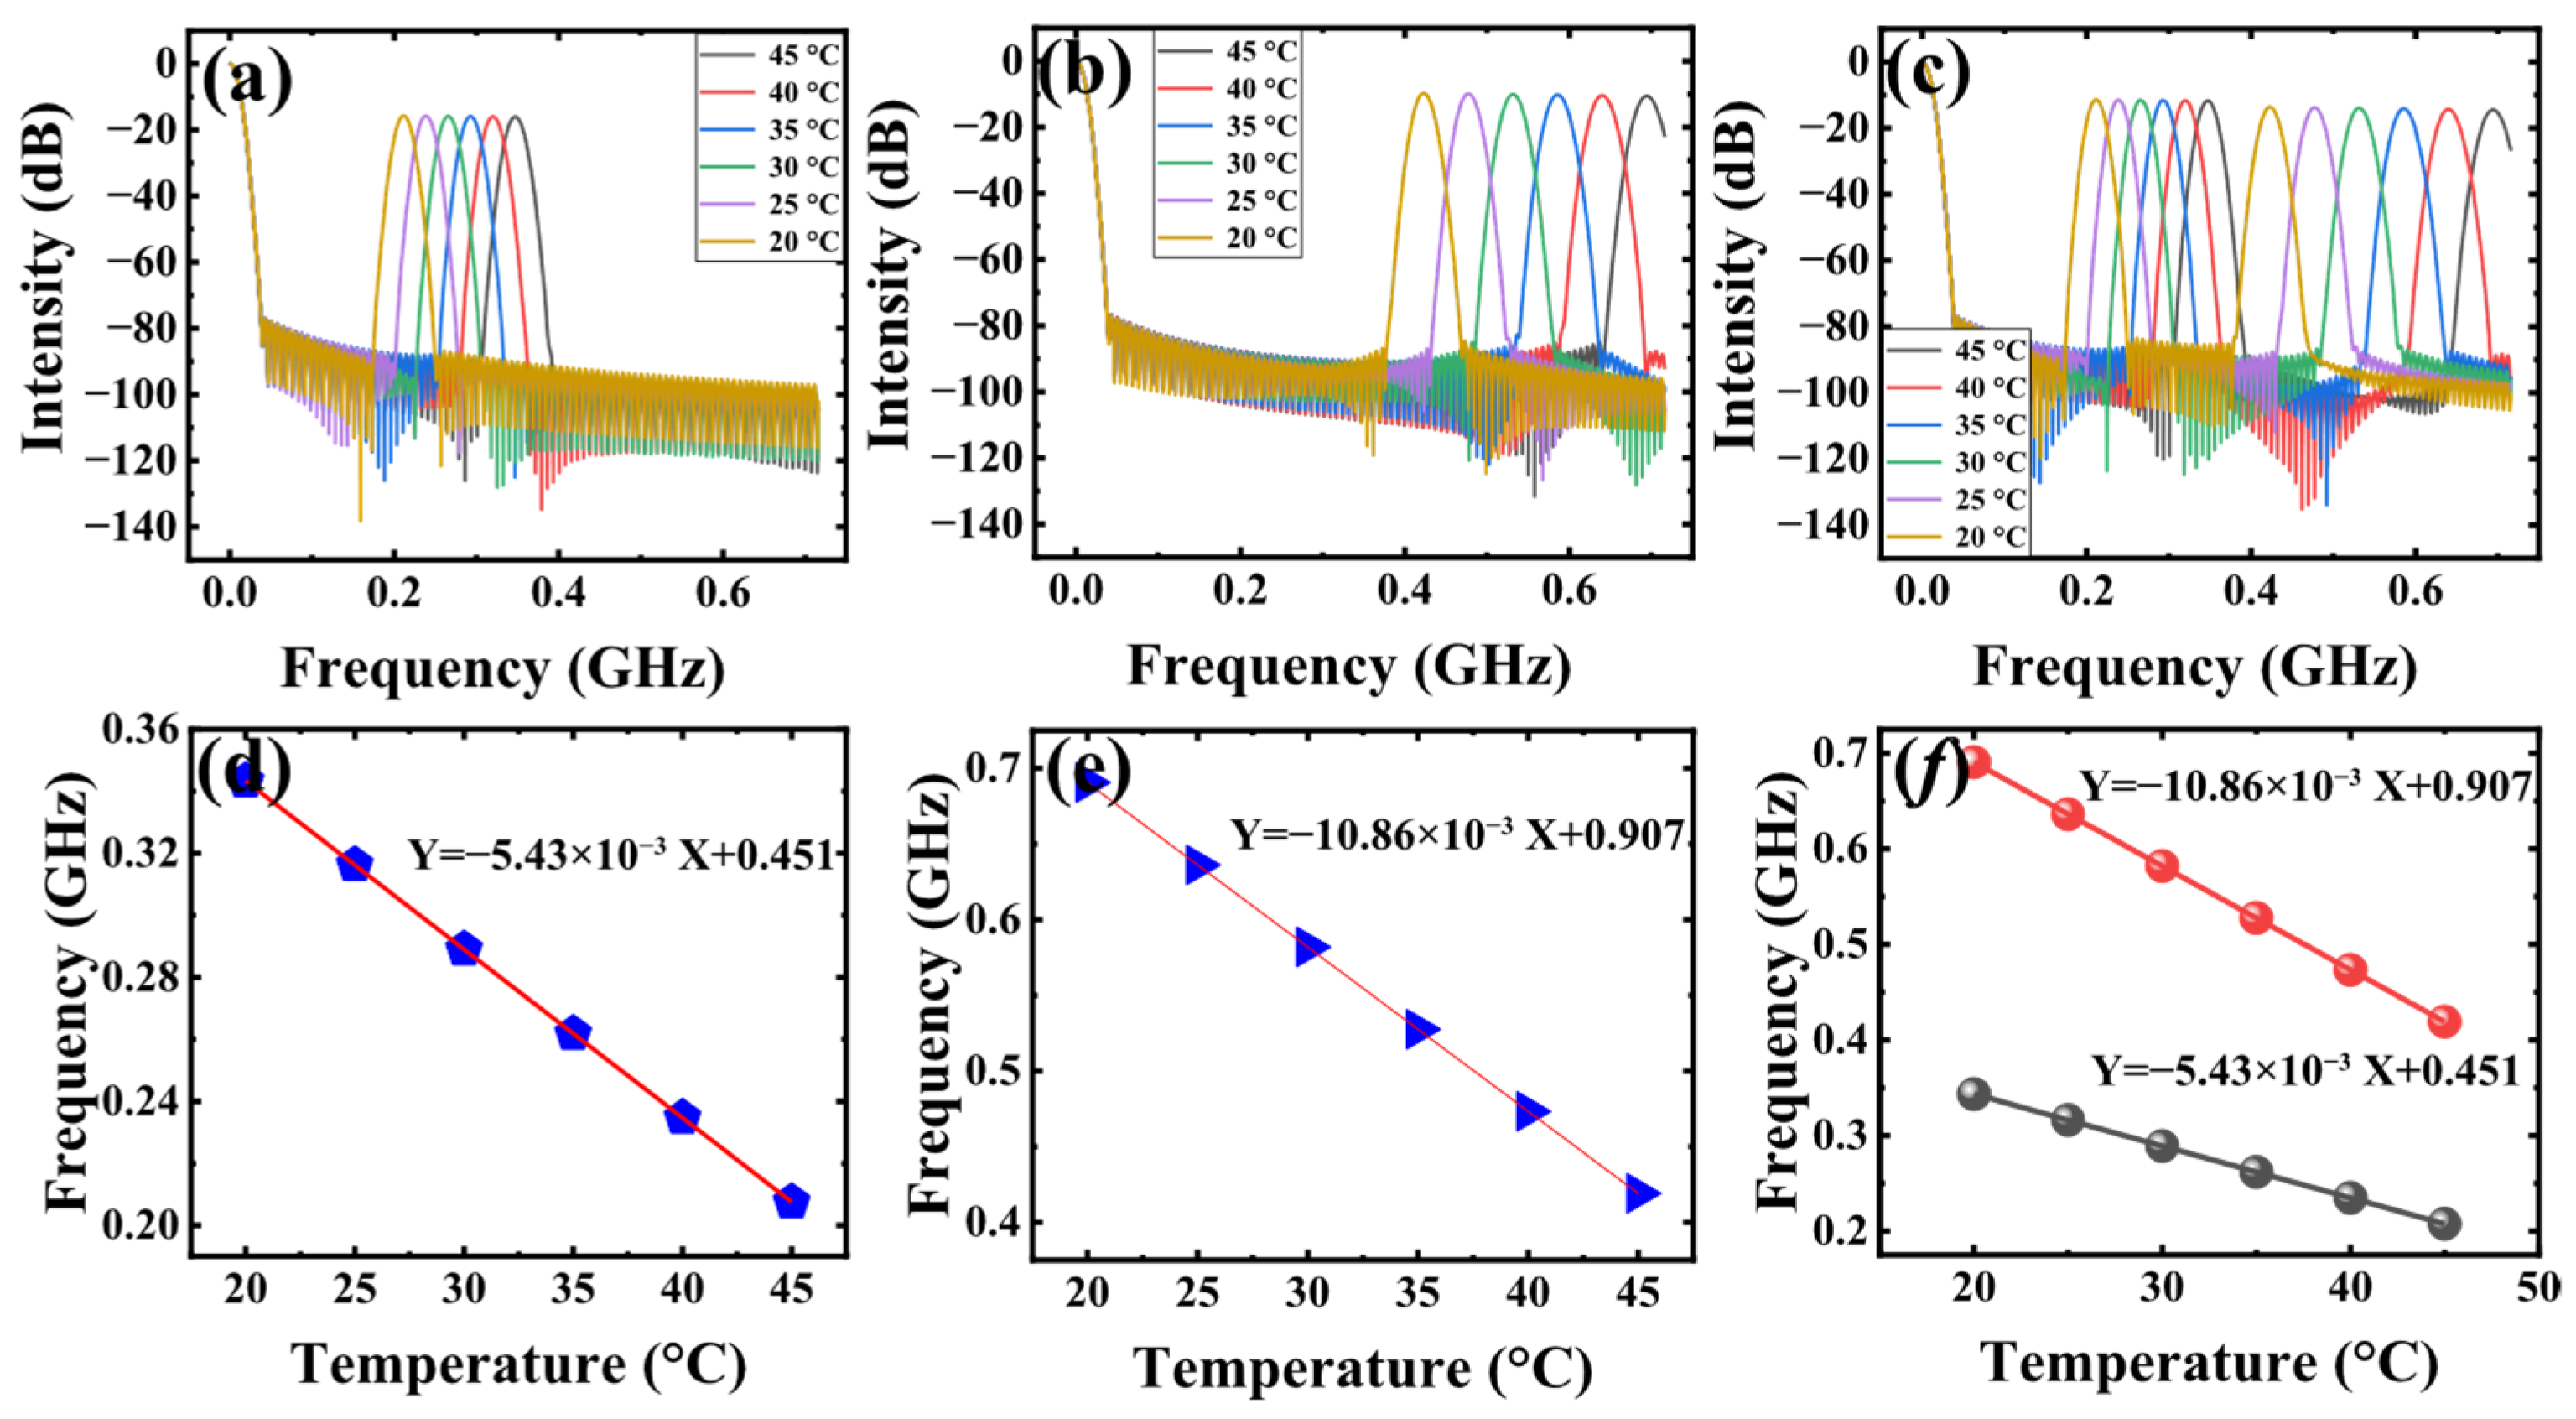
Next, we simulated the frequency response of two single passbands and a dual-passband at different temperatures, as shown in Figure 3. In the simulation, the length of the sensing SMF used is 85 cm, and the effective refractive index of the fiber is 1.465. Figure 3a–c represent the simulated frequency response of an MPF operating in the low-frequency passband, high-frequency passband, and dual-passband states with a temperature range of 30 °C to 50 °C, respectively. Figure 3d,e shows the relationship between the central frequency of MPF and temperature operating in the low-frequency passband and high-frequency passband, respectively. The blue pentagons and triangles represent the simulated data, and the red lines represent the fitted curves. The simulated fitting curve shows that the sensitivity of the low-frequency passband is 5.43 MHz/°C and the sensitivity of the high-frequency passband is 10.86 MHz/°C, which conforms to Equation (5). The fitting curve of dual-passband MPF is shown in Figure 3f, and the fitting sensitivity of the two passbands and the sensitivity of switching to the single passband are equal, which are 5.43 MHz/°C and 10.86 MHz/°C, respectively. The black dots and red dots in Figure 3f represent the low-frequency passband and high-frequency passband data in the simulated dual passband MPF, respectively, while the black and red lines are the fitting curves.
Figure 3.
The simulated temperature sensing with MPF when (a) only the lower passband is in operation, (b) only the higher passband is in operation, and (c) dual passband is in operation. The corresponding fitting curve when operated at (d) lower passband, (e) higher passband, and (f) dual passband.
And the corresponding resolution of the two frequencies can be expressed as follows:
where is the mode spacing of the OEO. As can be seen from Equations (5) and (6), higher sensitivity and better resolution can be obtained by tracking the high frequency in the OEO.
3. Experimental Results and Discussions
3.1. Optical Spectral and Oscillation Characteristics
The sensitivity improvement temperature sensing experiment based on the setup shown in Figure 1 is carried out. A BOS (QPHOTONICS QSDM-1550-15, Ann Arbor, MI, USA) with a central wavelength of 1550 nm is used as the optical source, and the two OCs used in the loop are both 2 × 2 (OC1, 50:50; OC2, 40:60). In our experiment, the VODL (General Photonics MDL-002, Chino, CA, USA, 0–168 mm) is employed to precisely adjust the length difference between the two arms of FMZI. A length of 85 cm SMF was used as the sensing part, which is placed in an incubator. The broadband optical source used in this work has a 3 dB bandwidth of approximately 39 nm. Within this spectral range, the FMZI maintains sufficient interference visibility, enabling stable MPF responses. The EOM (Oclaro, San Jose, CA, USA) we used has a 10 GHz bandwidth and 3.5 V half-wave voltage. The EOM is biased at the quadrature point to ensure linear modulation, and the modulation depth is kept small to maintain operation within the linear region. The length and total dispersion of the DCF are 4 km and 665 ps/nm at 1550 nm. The responsivity of the PD (Conquer KG-PT, Beijing, China) in the loop is 0.8 A/W at 1550 nm. The EA (Gwave, GLNA003050-30-27, Beijing, China) has a 35 dB gain, and we use the ESA (N9010A, Santa Rosa, CA, USA) for observation of the electrical signal.
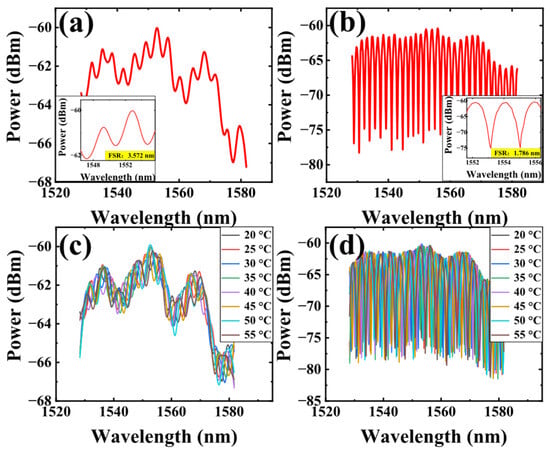
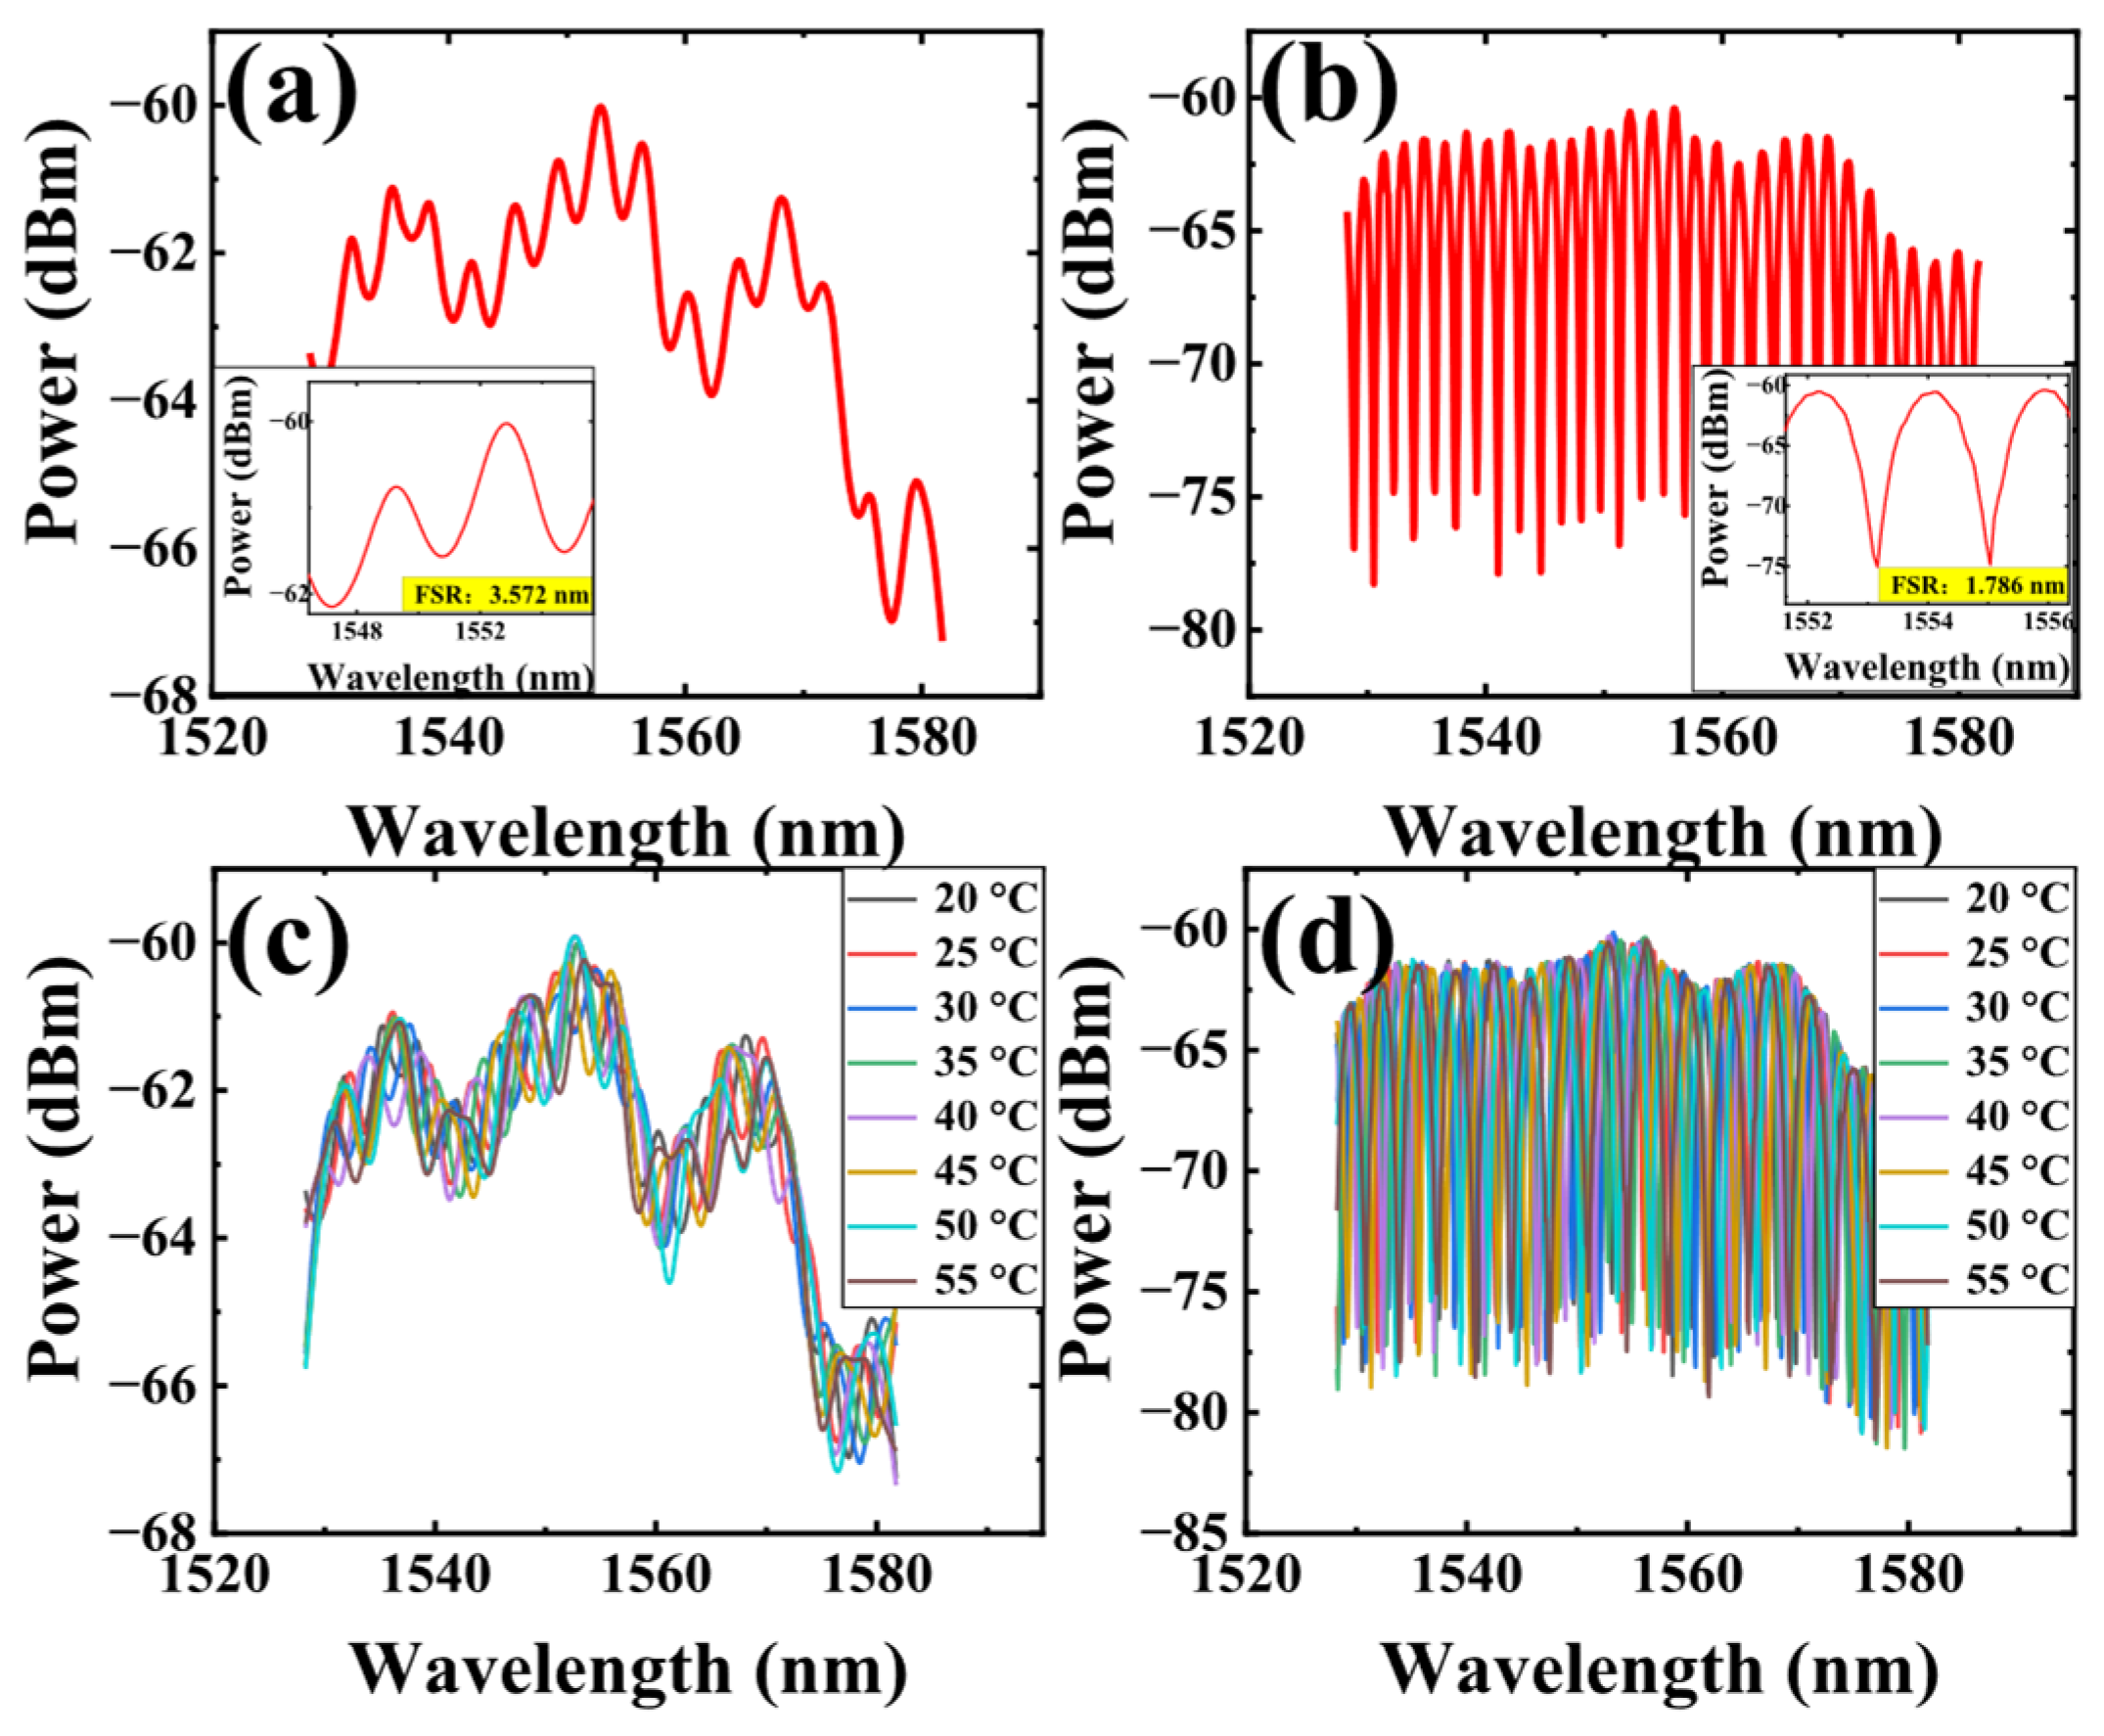
First, when the temperature in the incubator is 25 °C, the resulting optical spectra are recorded, as shown in Figure 4a,b. By rotating the PC in FMZI, the optical spectrum of two different FSRs can be obtained. The zoom-in view of the sliced spectrum in Figure 4a shows that the FSR is 3.572 nm, and the length difference between the two arms can be calculated to be 0.46 mm. The zoom-in view in Figure 4b shows that its FSR is 1.786 nm, and the length difference is calculated to be 0.92 mm. Figure 4c shows the recorded optical spectrum in the state when the FSR is 3.572 nm, with the temperature of the incubator rising from 20 °C to 55 °C with a step of 5 °C. The theoretical calculation shows that the sensitivity should be 15.21 nm/°C, which is far beyond the range of a single FSR, and thus the corresponding temperature of the spectrum cannot be resolved by Figure 4c. The recorded optical spectrum in the state when switching the FSR to 1.786 nm and the temperature of the incubator rises from 20 °C to 55 °C with a step of 5 °C is shown in Figure 4d. The theoretical calculation shows that the sensitivity of Figure 4d should be 15.231 nm/°C, which is also beyond the range of a single FSR, and the corresponding temperature of the spectrum cannot be resolved. The optical power shown in Figure 4 represents the spectral distribution rather than the total optical power. After photodetection, the signal is amplified by the electrical amplifier in the loop, resulting in a higher electrical signal level.
Figure 4.
Optical spectrum at two different polarization states in 25 °C (a) when switching to FSR of 3.572 nm and (b) when switching to FSR of 1.786 nm, (c) optical spectrum at different temperatures when FSR is 3.572 nm, (d) optical spectrum at different temperatures when FSR is 1.786 nm.
It should be noted that the optical spectra shown in Figure 4c,d are composed of multiple interference components with different FSRs. However, the polarization controller is used to enhance one dominant component; the residual components cannot be completely suppressed. As a result, the spectral evolution with temperature is not a simple rigid wavelength shift, but involves amplitude redistribution and local feature deformation. Therefore, it is difficult to extract a unique and physically meaningful wavelength-shift parameter from the overall optical spectrum. In this work, the sensing information is instead mapped into the frequency domain, where the corresponding passbands can be clearly separated and quantitatively tracked.
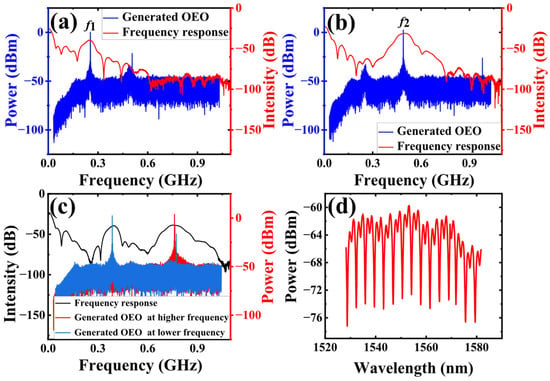
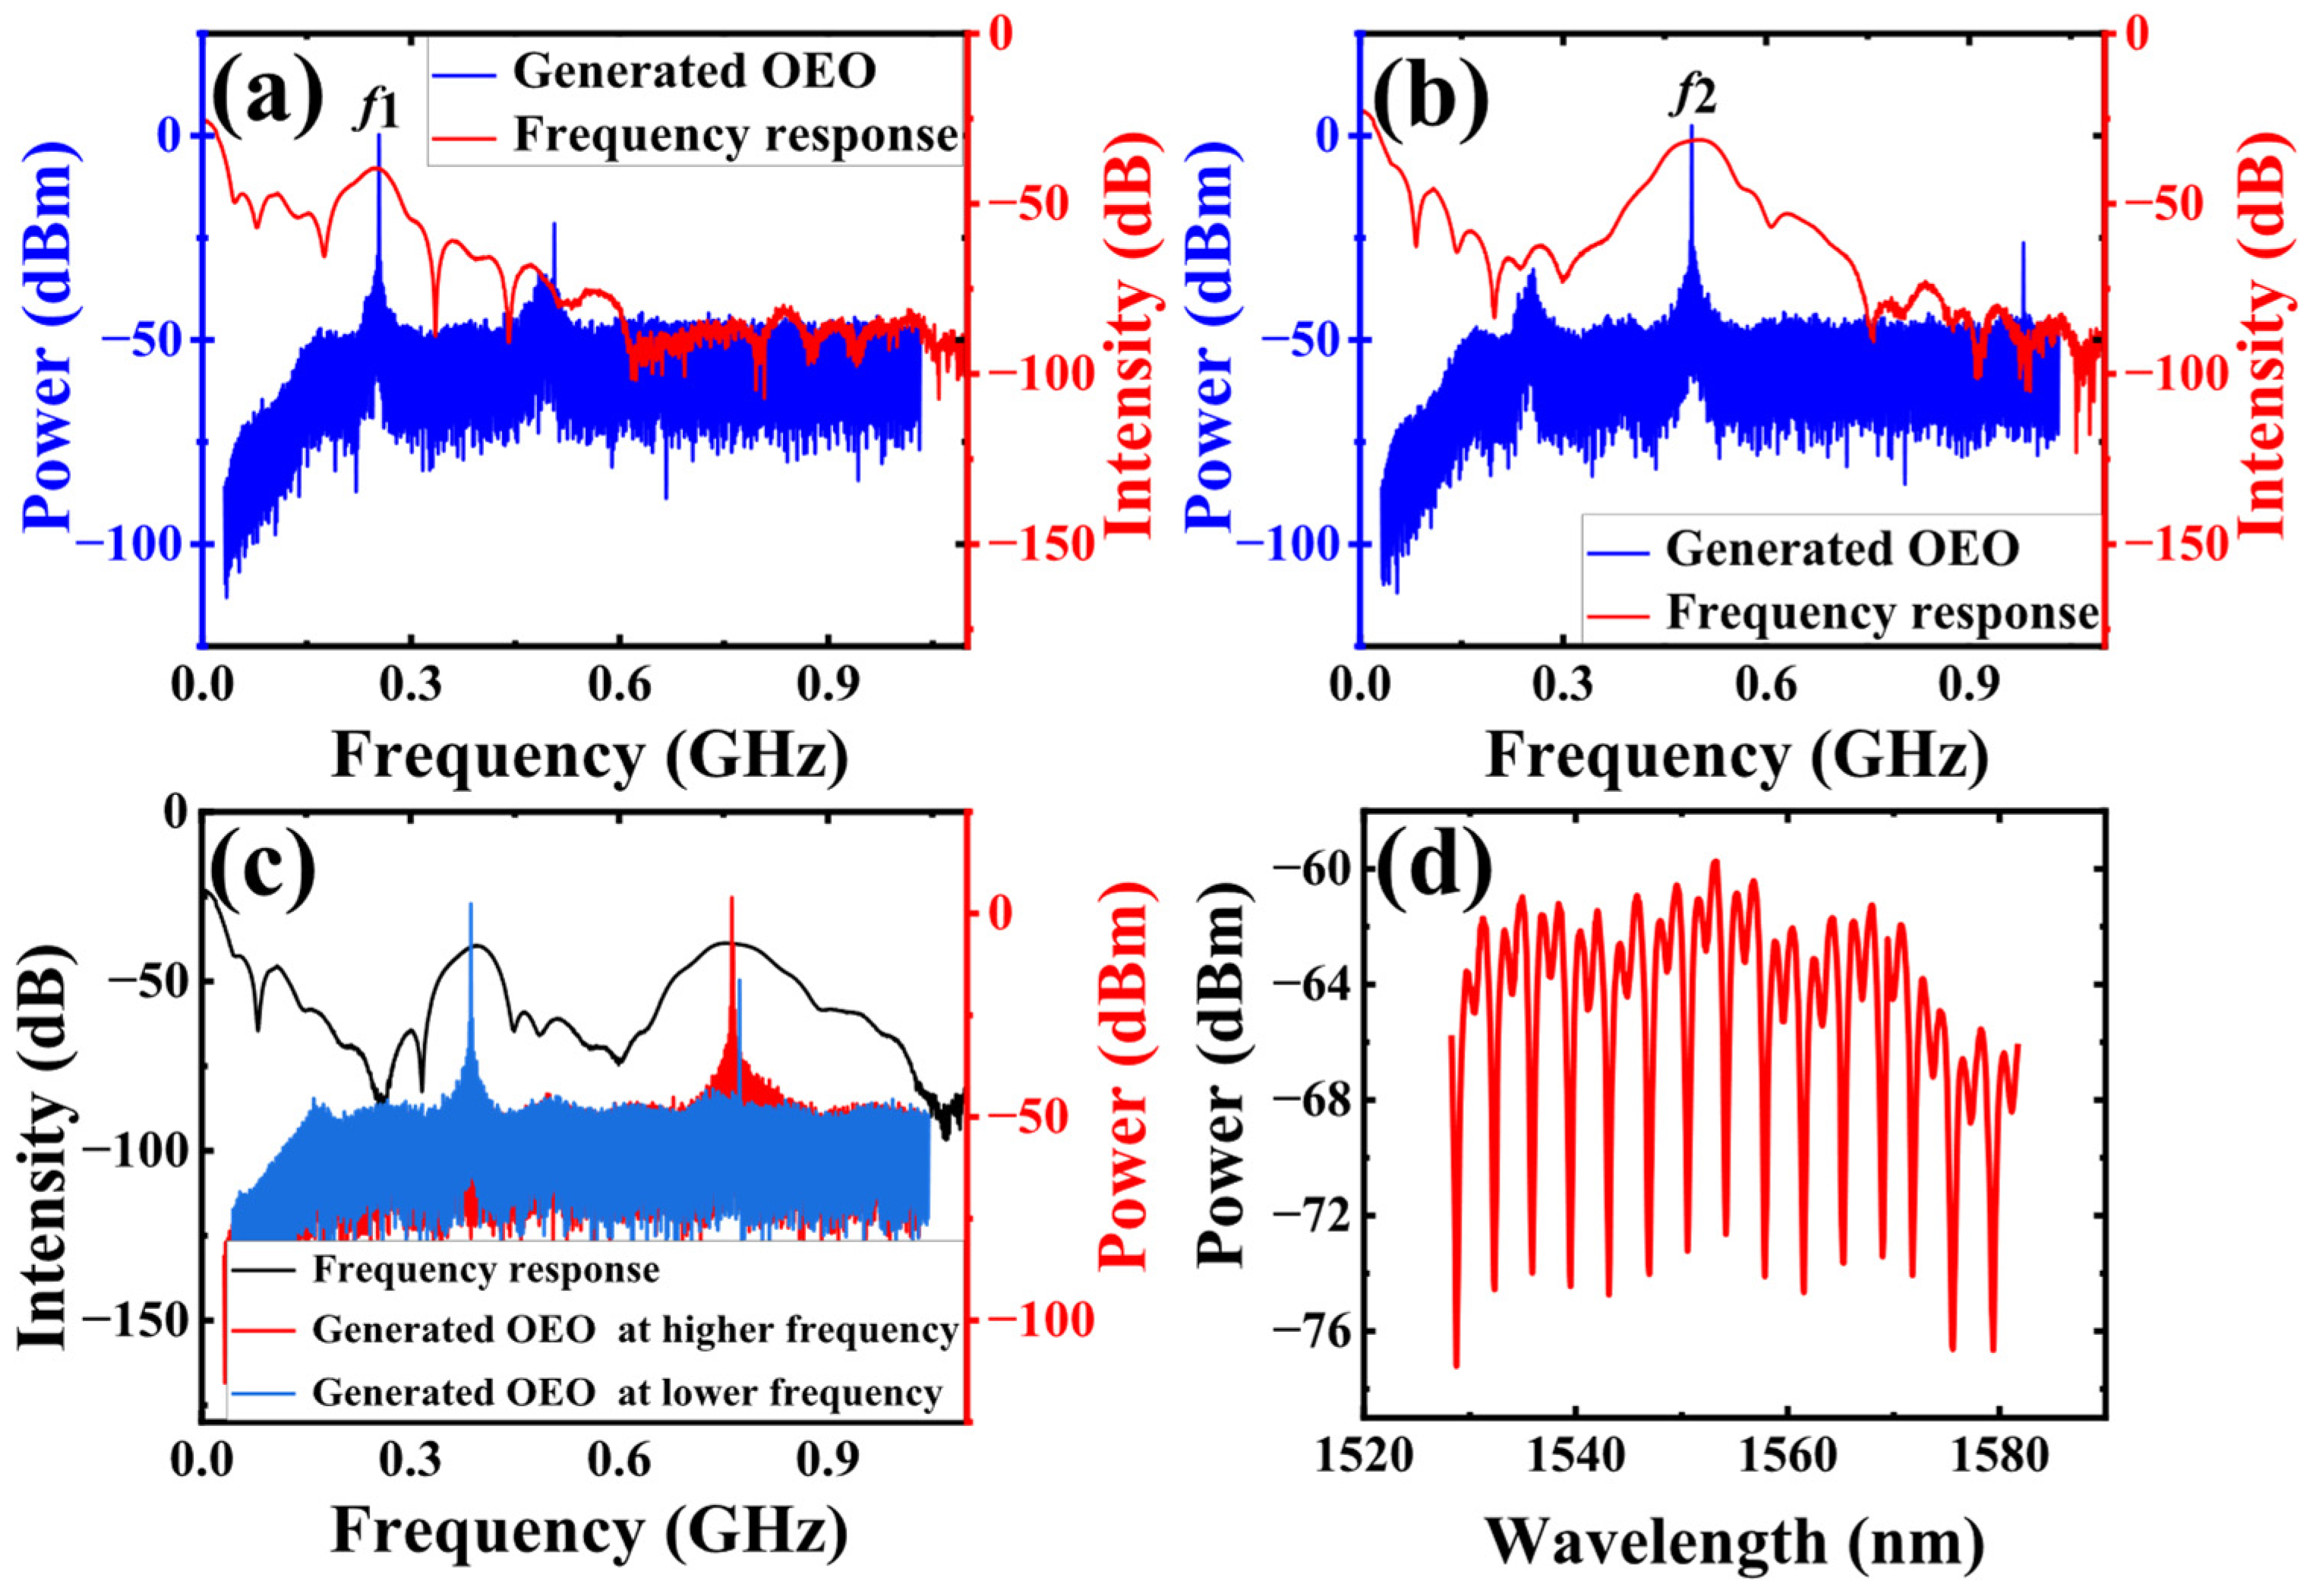
By adjusting the gain in the loop such that the loop meets the oscillation conditions, a frequency-switchable OEO operating at either f1 or f2 can be obtained. It should be noted that the proposed OEO operates in a single-frequency oscillation regime, and the two frequencies are obtained by switching the passband of the MPF, rather than simultaneous dual-frequency oscillation. Figure 5a shows the resulting signals of switchable frequency OEO and the frequency response of MPF operating at f1. The red line in Figure 5a represents the frequency response of the MPF with a central frequency of 250 MHz and a 3 dB bandwidth of 42.6 MHz; the blue line in Figure 5a represents the resulting OEO signal at a frequency of 250 MHz. It can be seen that the frequency generated by OEO corresponds one-to-one to the central frequency of the MPF. Figure 5b shows the resulting signals of switchable frequency OEO and the frequency response of MPF operating at f2, and the red line in Figure 5b represents the frequency response of the MPF with a center frequency of 490 MHz and a 3 dB bandwidth of 74.4 MHz; the blue line in Figure 5b represents the resulting OEO signal at a frequency of 490 MHz. Figure 5c shows the measured dual-passband MPF and the corresponding microwave signal of a single-frequency OEO with switchable operating frequencies. The black line in Figure 5c is the measured frequency response of the dual passband of the MPF, and the red and blue lines are the frequencies generated by OEO corresponding to the central frequency of the two passbands. Figure 5d shows the optical spectrum of the dual-passband MPF in Figure 5c. It can be observed that the measured MPF responses exhibit slight deviations from the simulated results in both the absolute center frequencies and the detailed response profiles. These differences are mainly attributed to practical factors such as the actual FMZI path-length difference, polarization-dependent effects, and non-ideal device responses, which are not fully considered in the simulation.
Figure 5.
The resulting single passband MPF and the oscillation signals of the switchable frequency OEO at (a) f1 and (b) f2. (c) The resulting dual-passband MPF and the corresponding single-frequency OEO with switchable operating frequencies. (d) The optical spectrum of the dual passband MPF in (c).
3.2. Temperature Sensing Performance Based on the Frequency-Switchable OEO
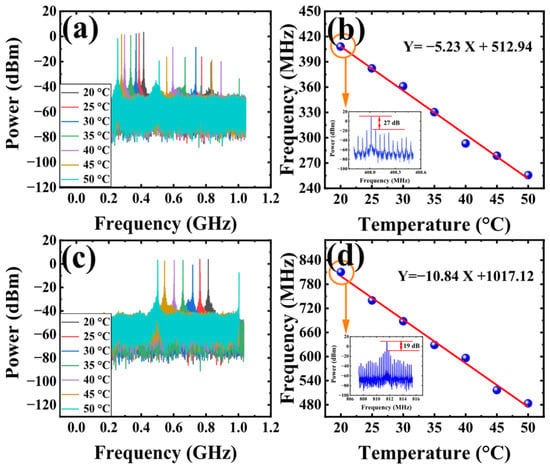
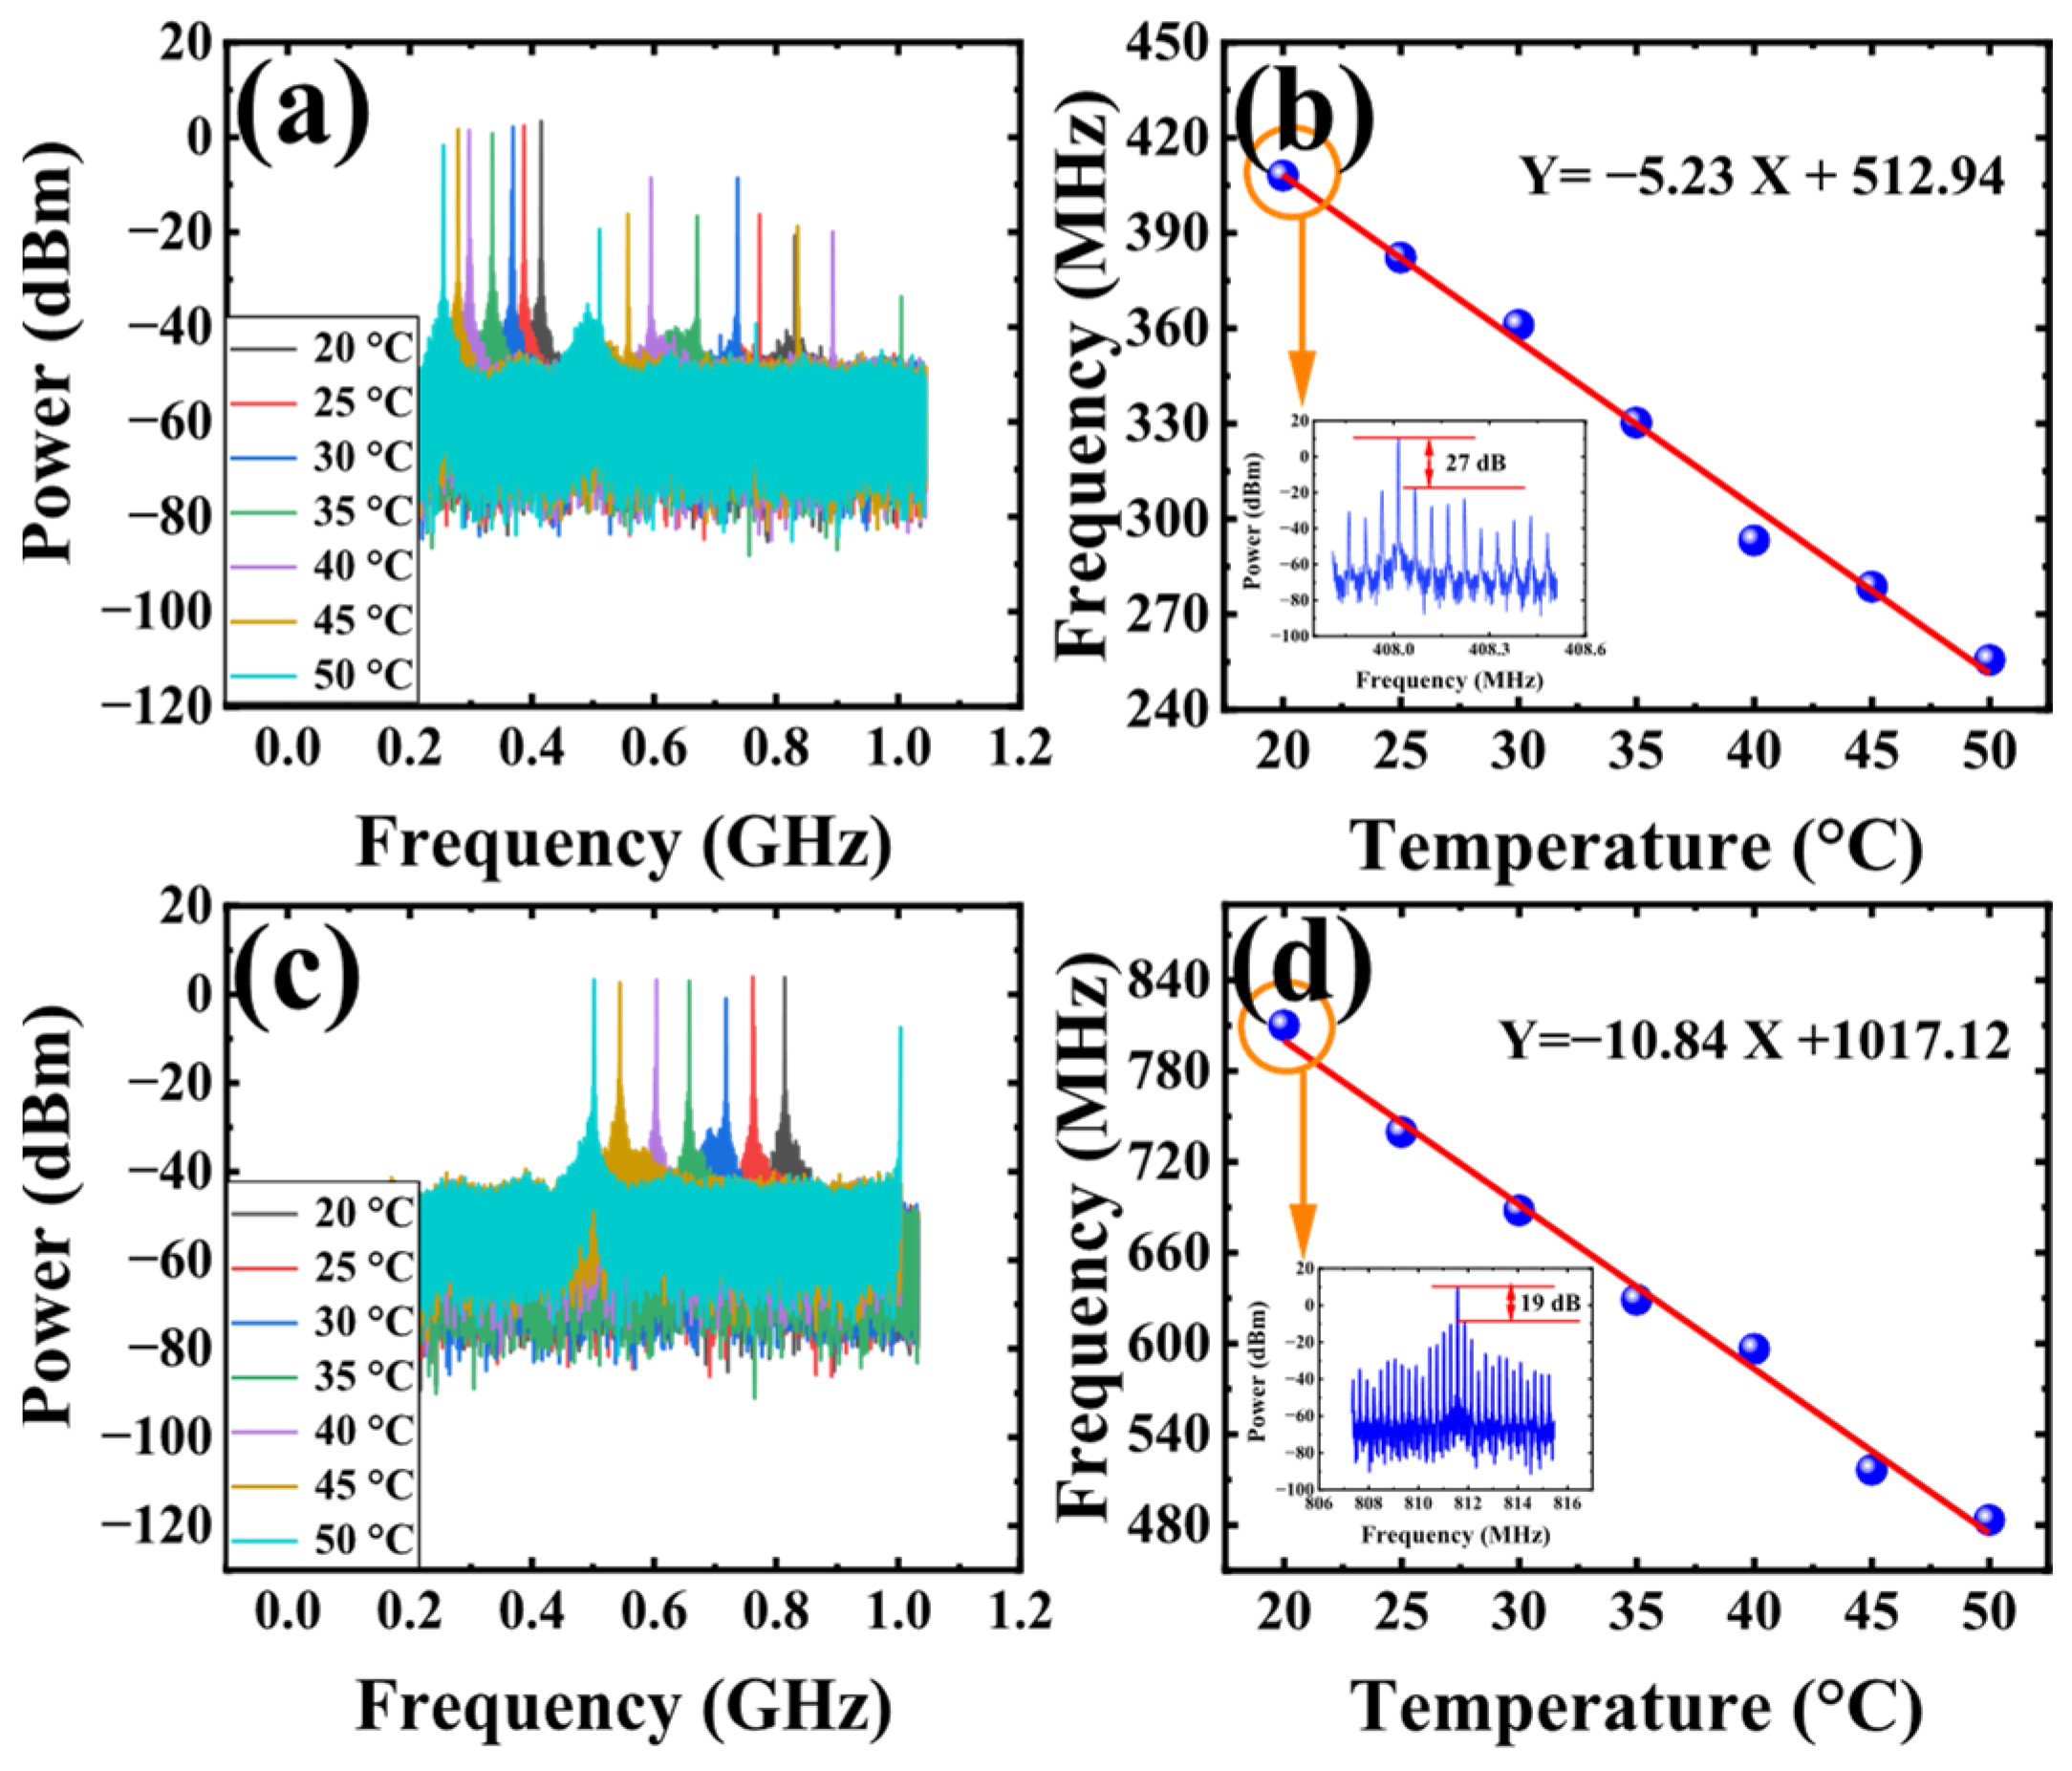
Since the frequencies f1 and f2 are 408 MHz and 812 MHz, respectively, according to Equation (3), the length difference between the two arms of the FMZI is 0.44 mm. When increasing the temperature of the SMF in the incubator from 20 °C to 50 °C by a 5 °C interval, the shifts in the frequency spectrum of f1 are present in Figure 6a. We can see from Figure 6a that as the temperature increases, the frequency of the resulting OEO shifts toward lower frequencies. Figure 6b shows the relationship between the frequency shift of f1 and temperature. The fitting curve indicates a sensitivity of 5.23 MHz/°C. The inset in Figure 6b is an enlarged view of f1 at 408 MHz with a signal-to-noise ratio (SNR) of 27 dB. Then, we adjust the polarization state and switch to f2. The shifts in the frequency spectrum of f2 are shown in Figure 6c. Figure 6d shows the relationship between the frequency shift of f2 and temperature. The fitting curve shows that the sensitivity corresponding to the f2 is 10.84 MHz/°C. The blue dots in Figure 6b,d represent the measured data, and the red lines represent the fitted curves. The inset in Figure 6d is an enlarged view of f2 at 812 MHz with a SNR of 19 dB. The results show that the sensitivity is in good agreement with the theoretical value, and the sensitivity of f2 is twice that of f1.
Figure 6.
The frequency spectrum of temperature sensing with switchable frequency OEO: only f1 in operation (a) and only f2 in operation (c). The corresponding fitting curve of f1 (b). The corresponding fitting curve of f2 (d).
3.3. Temperature Sensing Performance Based on the Dual-Passband MPF
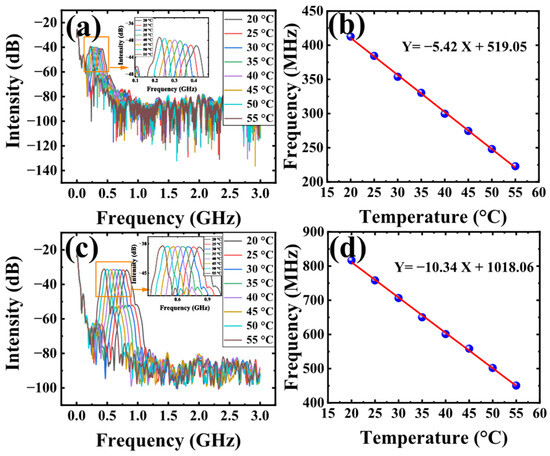
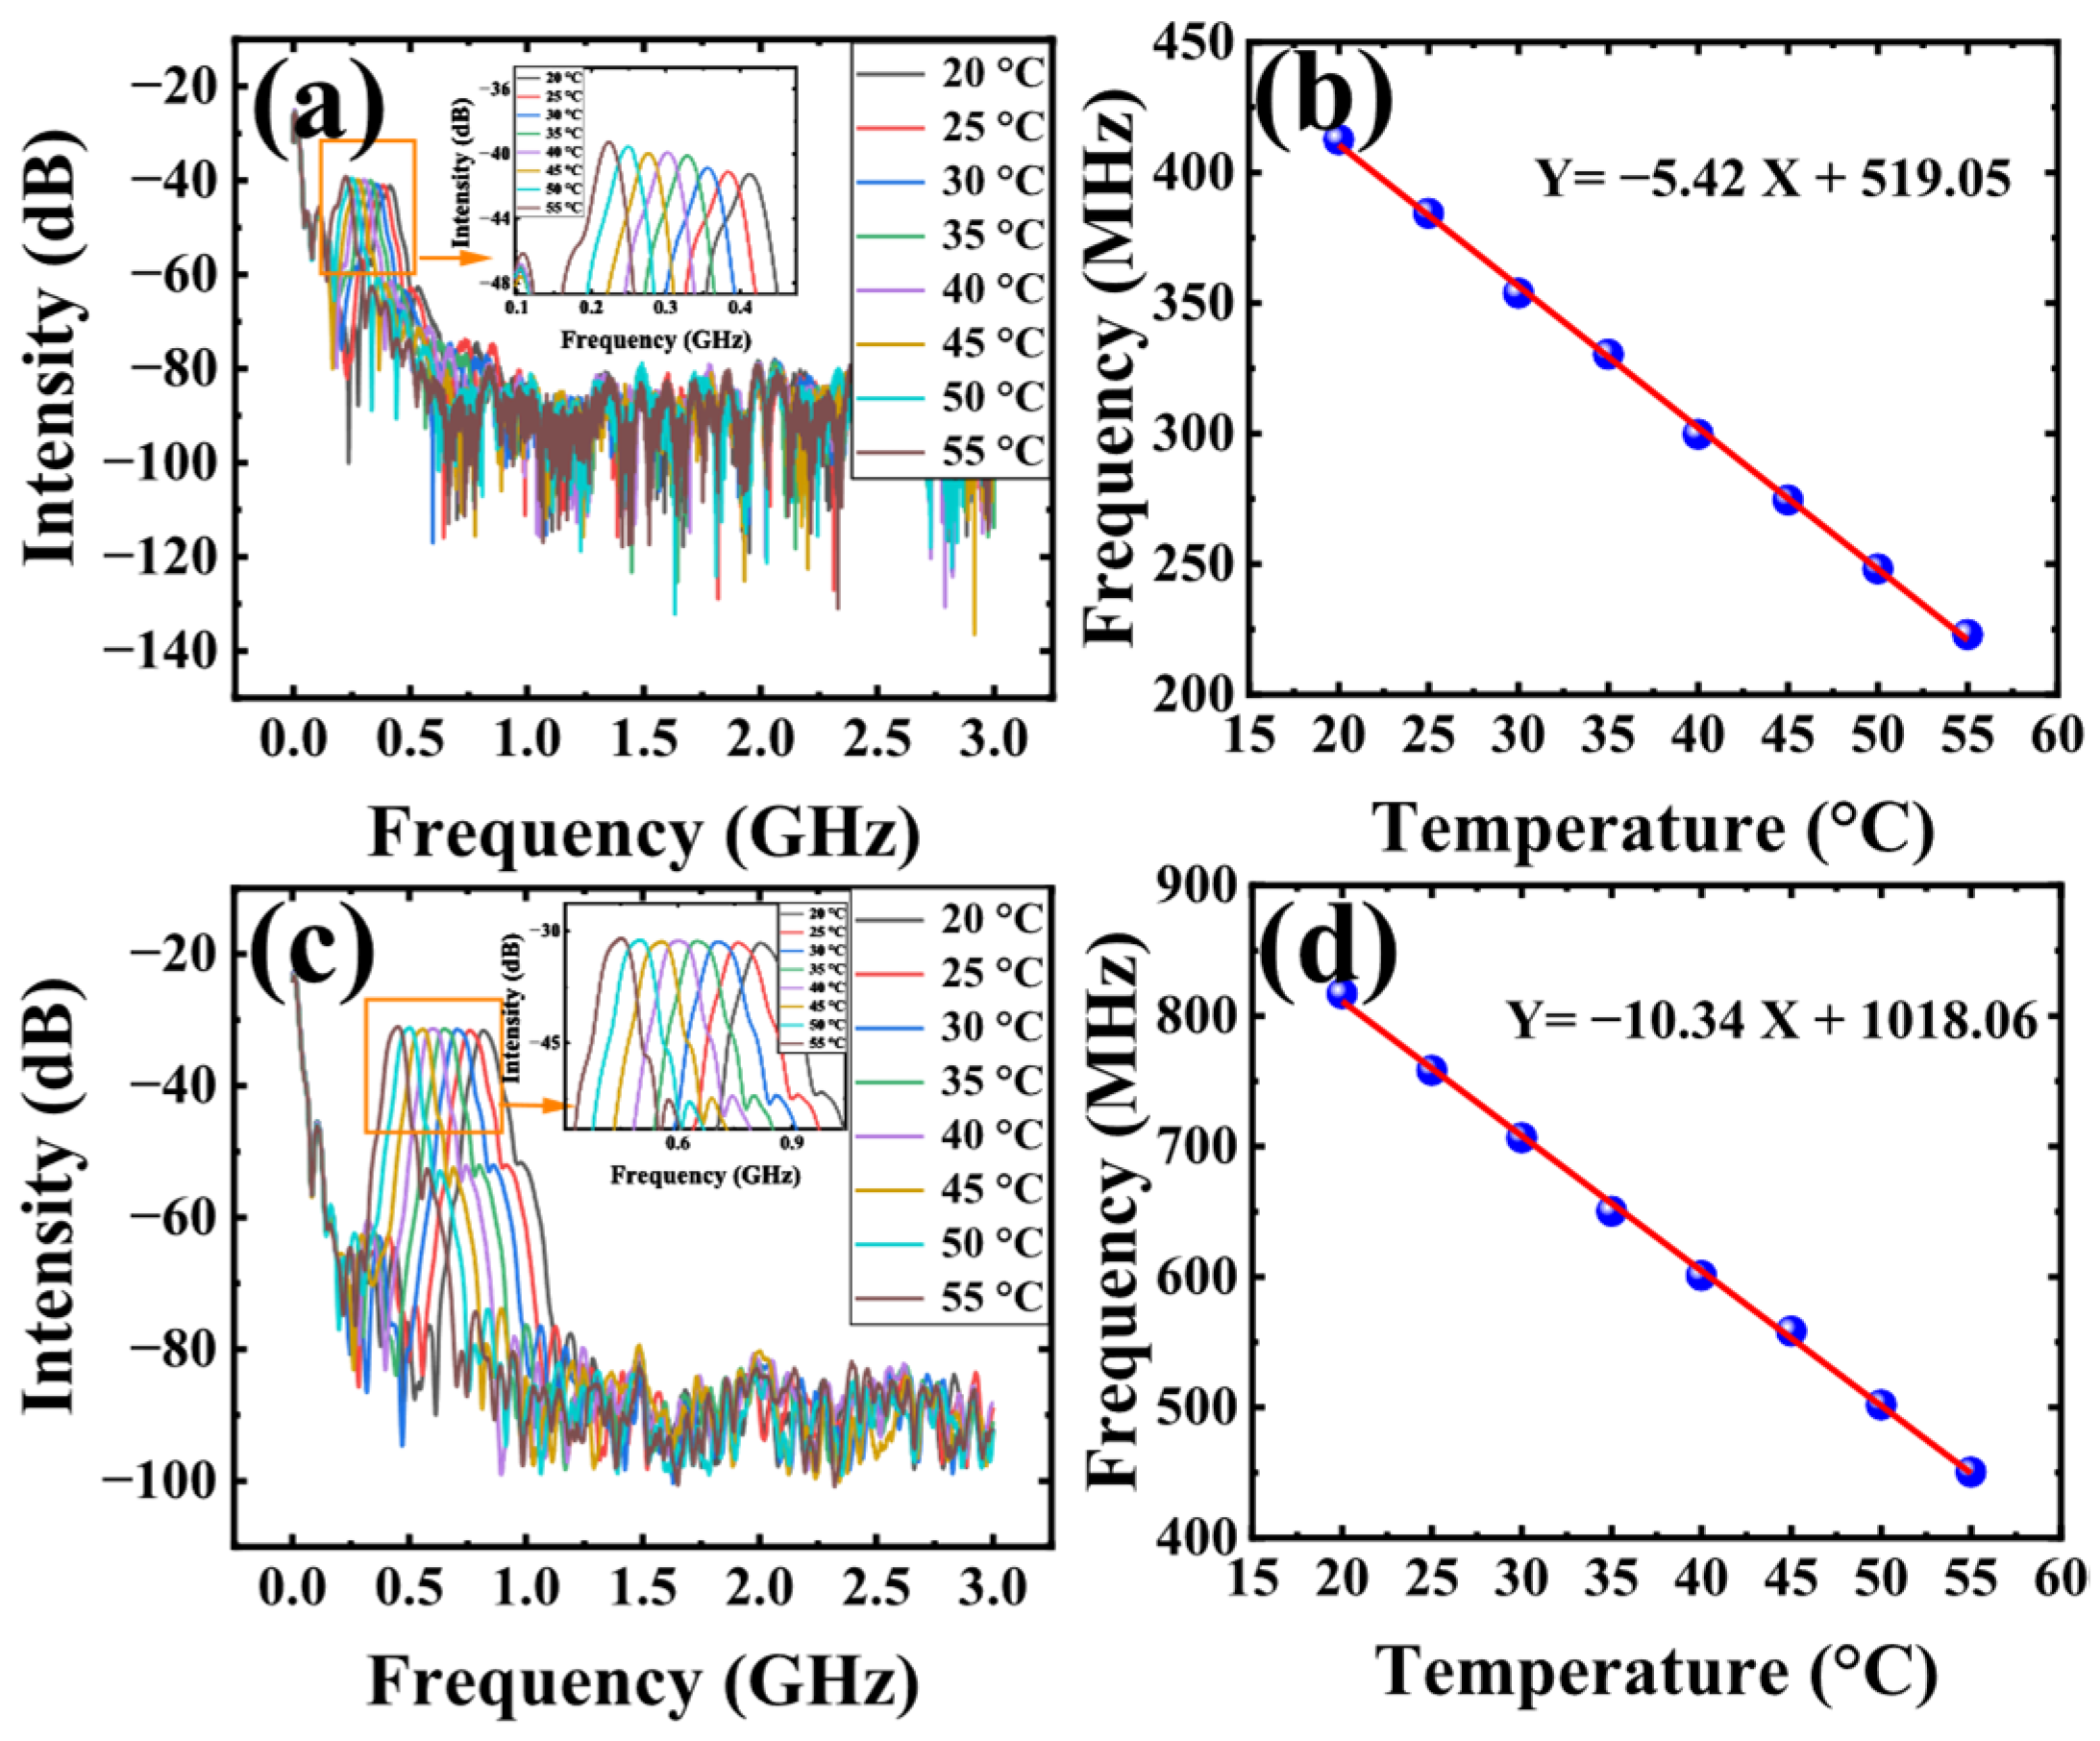
We also measured the frequency response of the switchable dual passband MPF. The obtained frequency response of lower passband with central frequency f1 at different temperature are depict in Figure 7a, the relationship of the central frequency of lower passband and the temperature variation is shown in Figure 7b, and the fitting curve shows that the sensitivity corresponding to the lower passband is 5.42 MHz/°C, Figure 7c show the obtained frequency response of higher passband with central frequency f2 at different temperature, Figure 7d depicts the relationship of the central frequency of higher passband and the temperature variation. As we can see, the sensitivity corresponding to the higher passband is 10.34 MHz/°C, which is consistent with the measurement result for the dual-frequency switchable OEO.
Figure 7.
Temperature sensing with dual passband MPF (a) only lower passband in operation, (b) corresponding fitting curve of lower passband, (c) and only higher passband in operation, (d) corresponding fitting curve of higher passband.
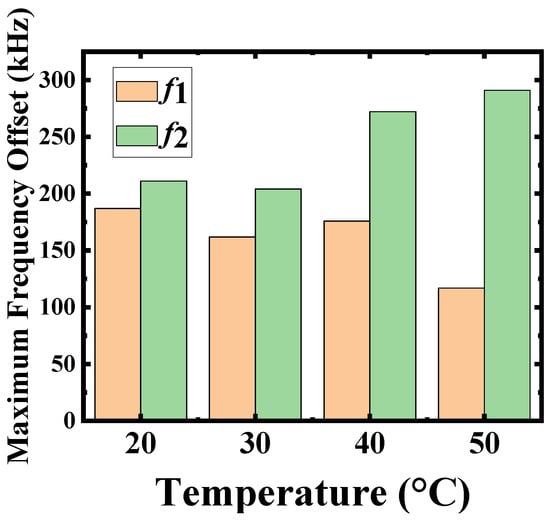
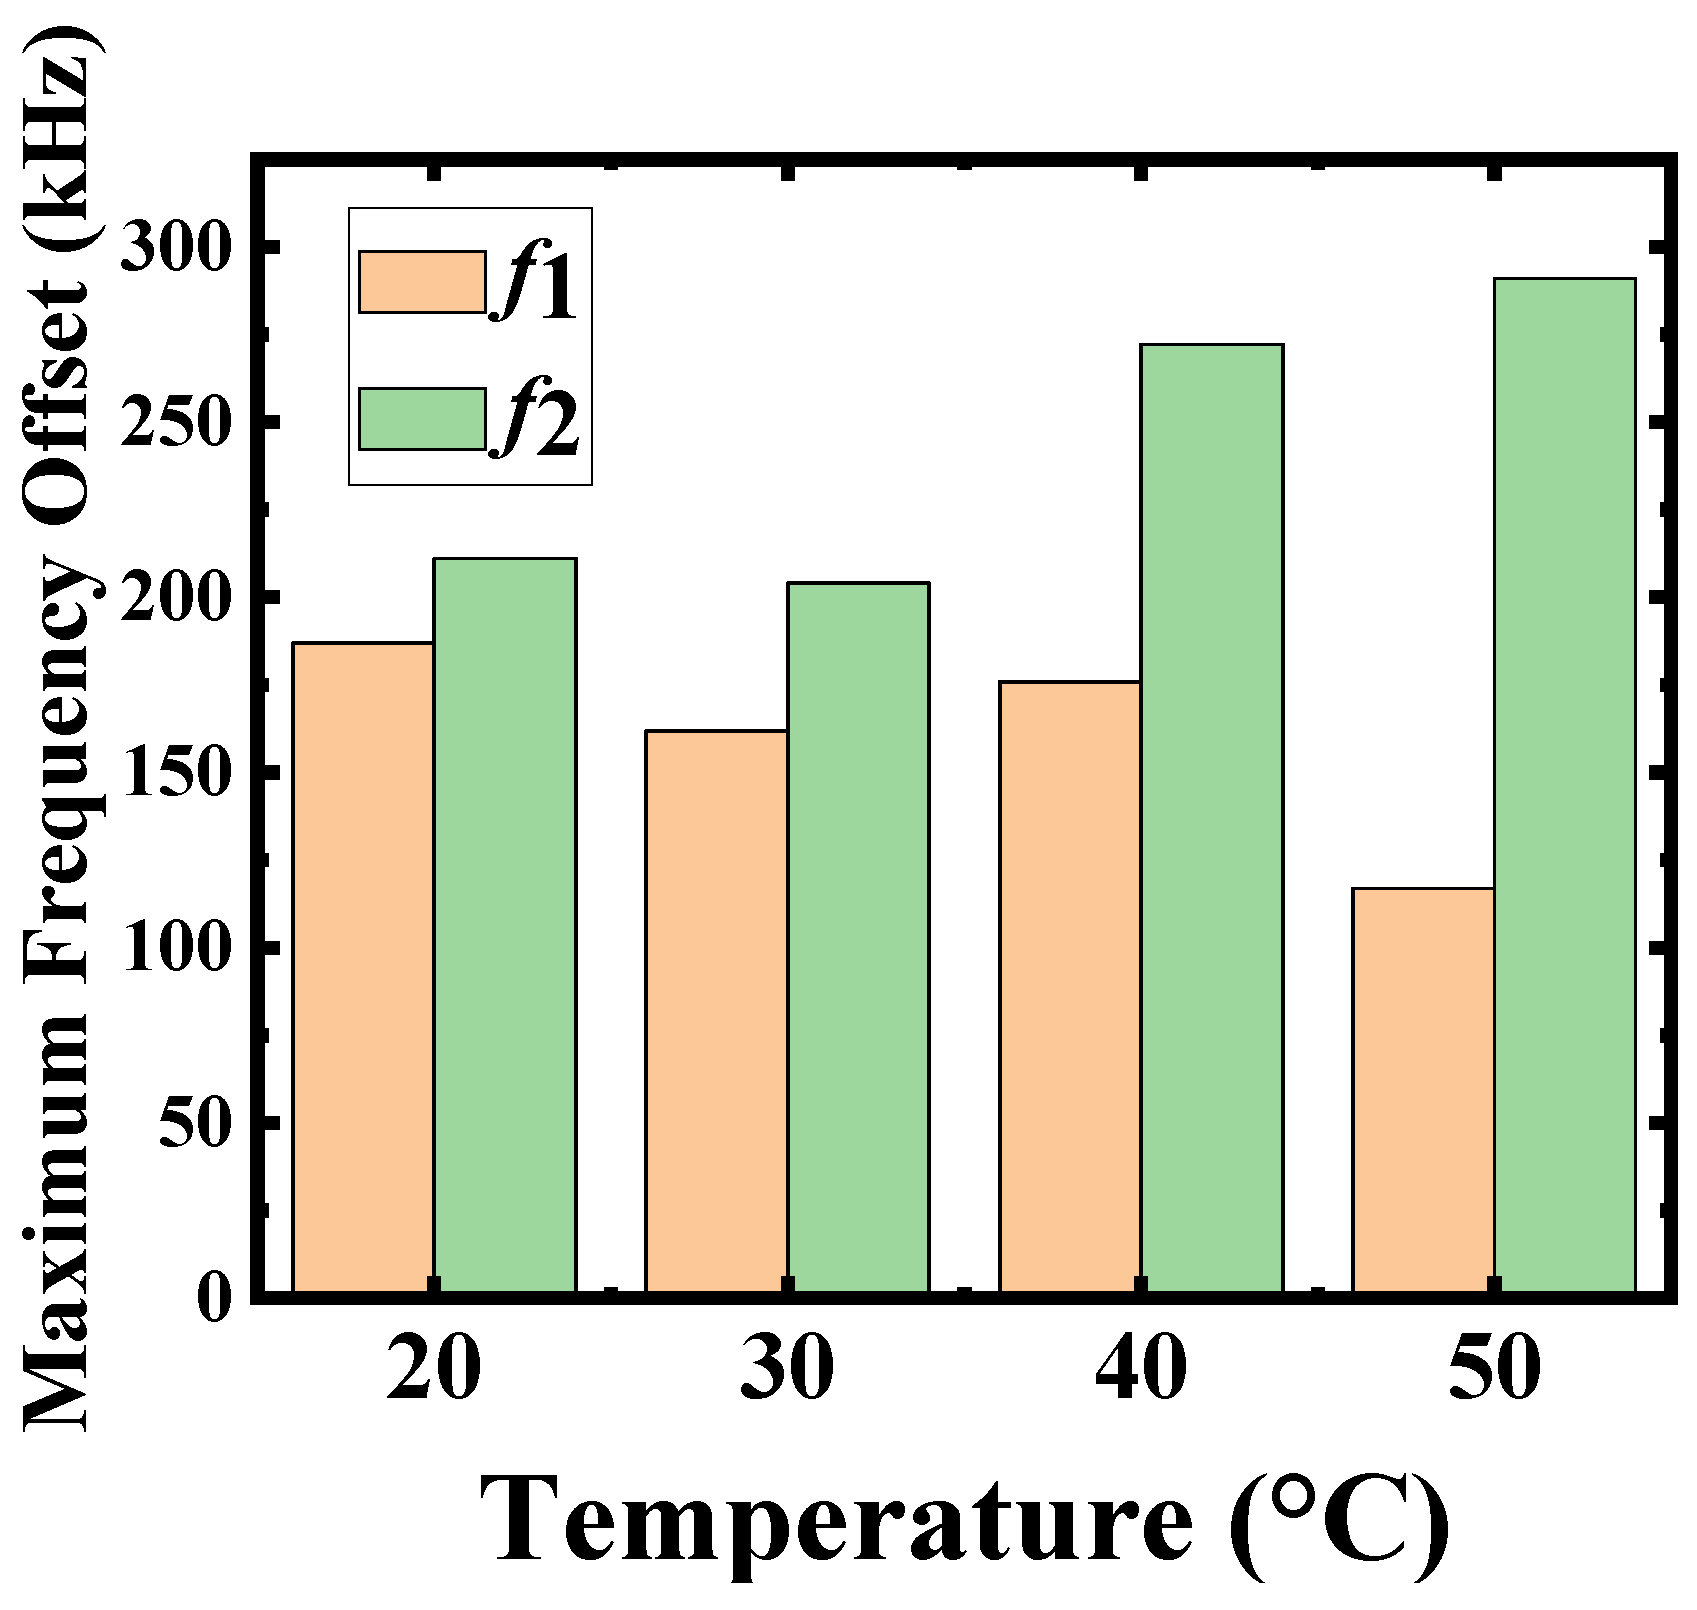
Figure 8 shows the stability of the proposed sensing system, we measured stability at different temperature of 20 °C, 30 °C, 40 °C, and 50 °C for the frequency of f1 and f2 in 10 min, we can see that the maximum frequency drift of the system is 187 kHz, 162 kHz, 176 kHz, and 117 kHz at f1 respectively, which corresponding to the measurement error of the system is 0.035 °C, 0.030 °C, 0.033 °C and 0.022 °C. The maximum frequency drift of the system is 211 kHz, 204 kHz, 272 kHz, and 291 kHz at f2, respectively, corresponding to measurement errors of 0.019 °C, 0.018 °C, 0.025 °C, and 0.026 °C. The greater fluctuation in the frequency at f2 generated by OEO than at f1 is due to the higher 3 dB bandwidth of the MPF at the high frequency f2, which makes mode selection more difficult. However, the error is reduced due to increased sensitivity. These results demonstrate the effectiveness and robustness of the proposed frequency-domain interrogation scheme for temperature sensing.
Figure 8.
Stability test of the proposed temperature sensing system.
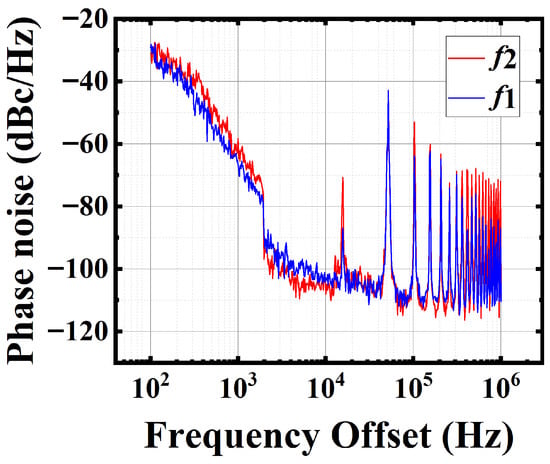
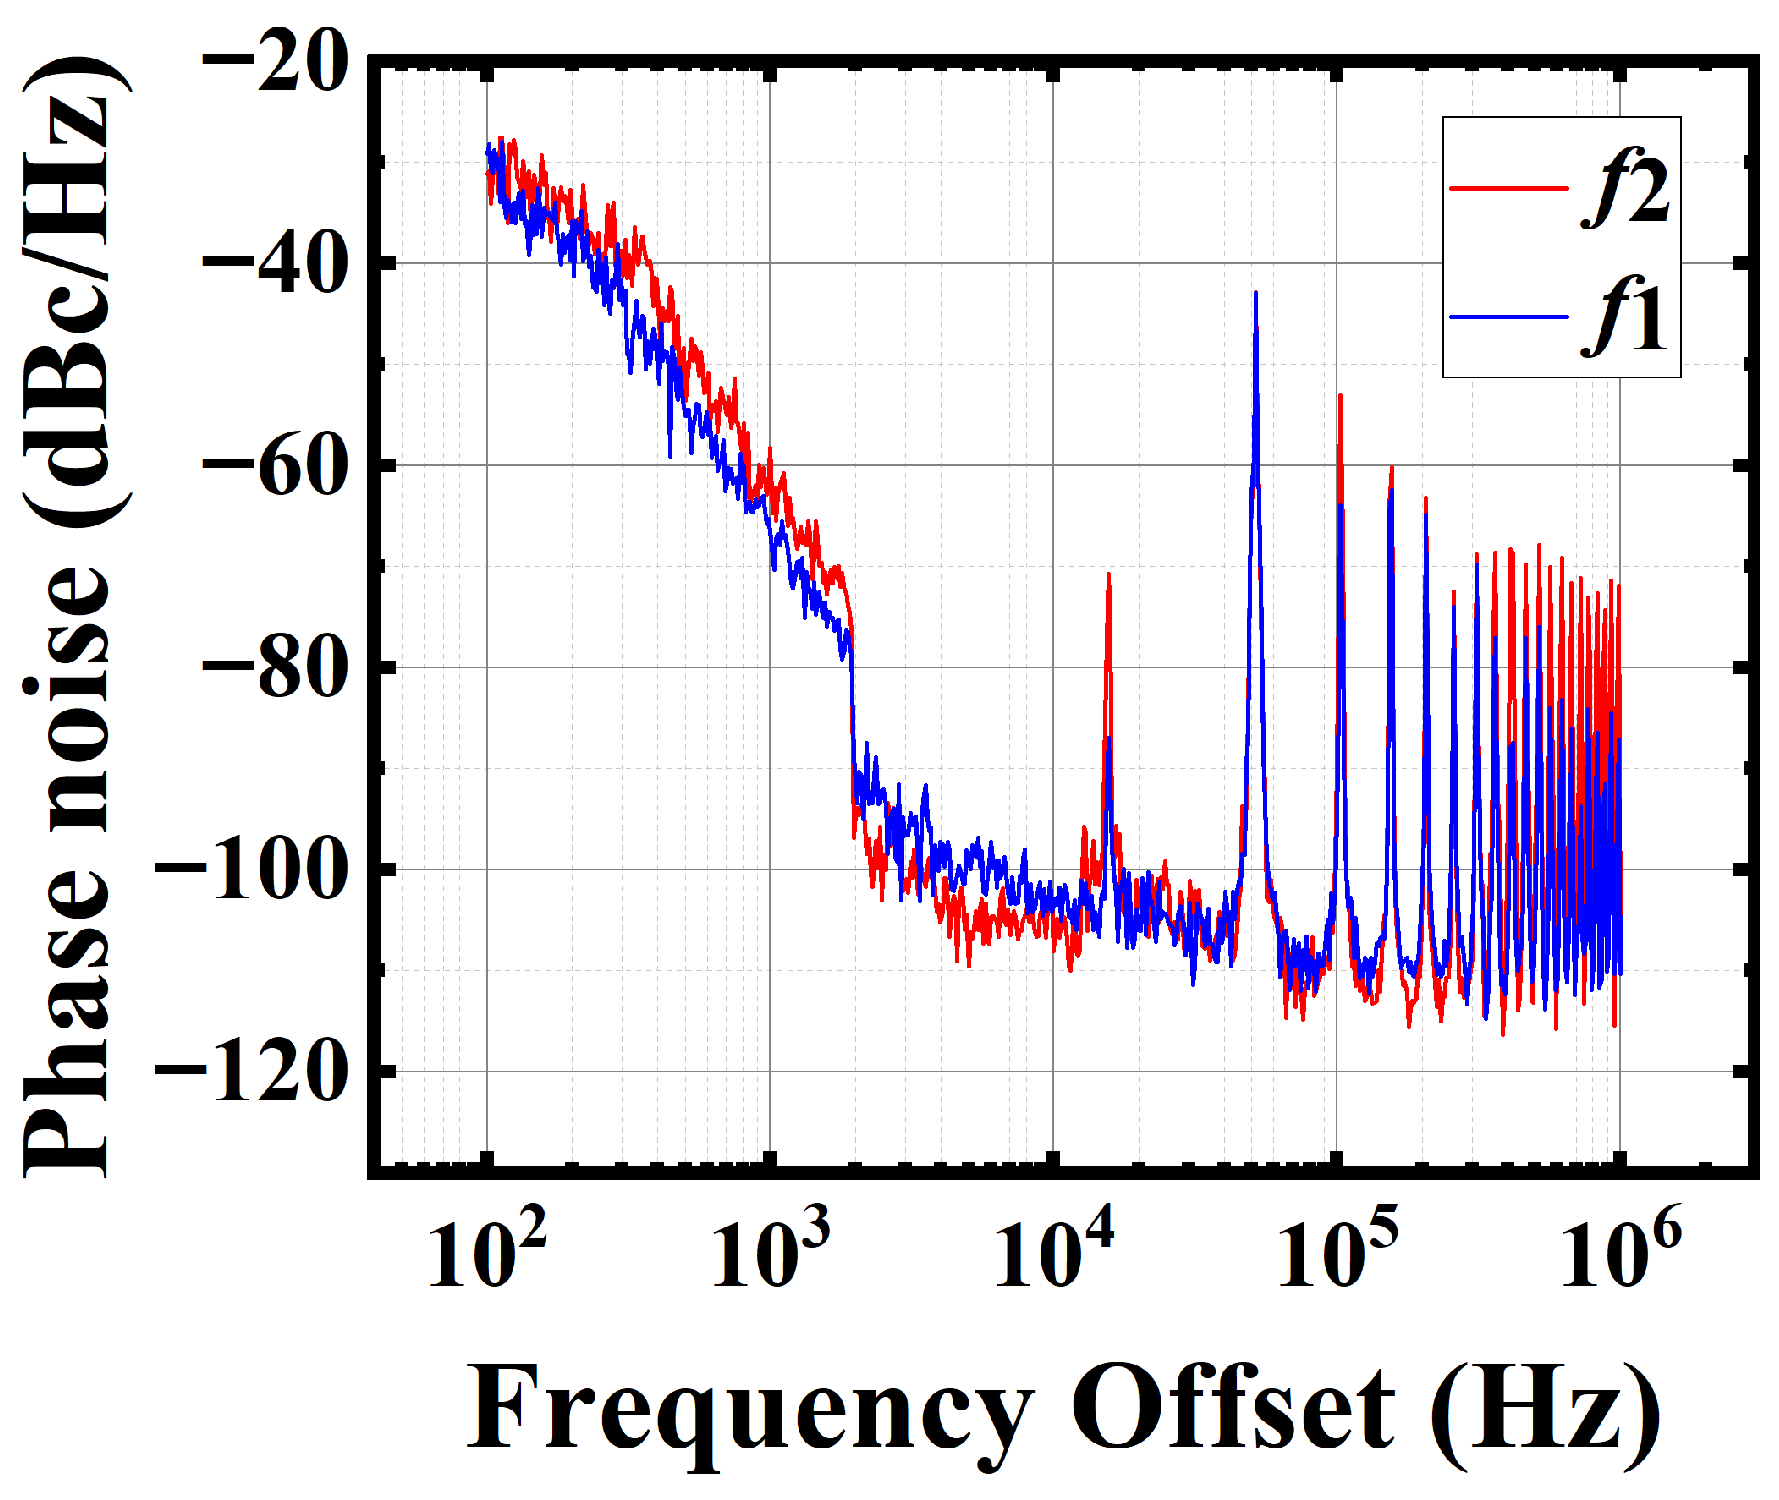
To further evaluate the stability, the single-sideband (SSB) phase noise is also characterized. Figure 9 shows the measured phase noise spectra at f1 and f2 (300 MHz and 600 MHz). The corresponding SSB phase noise values are −103.58 dBc/Hz and −108.07 dBc/Hz at a 10 kHz offset, respectively. These results demonstrate that the proposed OEO exhibits good spectral purity and stability.
Figure 9.
The tested SSB Phase noise of the microwave signal at the two frequencies.
4. Discussion
Finally, since the entire OEO loop is approximately 4 km long, the corresponding FSR is 51 kHz. The sensing system resolution obtained through tracking f2 is 0.004 °C, which is half that of f1. Compared with the MPF structure based on ordinary FMZI proposed in Ref. [11], our scheme is based on modified FMZI and yields a sensitivity twice that of ordinary FMZI. In addition, since the length difference between the two arms of FMZI is small, the effect of disturbance on both arms is the same. Hence, the disturbance has almost no effect on our structure.
The measurable range is also an important parameter for sensing systems. In our experiment, constrained by the bandwidth of the network vector analyzer (VNA), the maximum observable frequency is 3 GHz, corresponding to a temperature sensing range of 276.7 °C. However, our scheme has a wider measurement range in theory. Another problem that cannot be ignored in this interrogation scheme is that the MPF’s central frequency shifts toward higher frequencies, and its 3 dB bandwidth gradually increases. When the 3 dB bandwidth increases to a certain value, it cannot oscillate with a single frequency, which is difficult to demodulate with high precision. However, cascading a dual-loop structure or introducing a fiber ring structure can effectively improve mode selection and enable stable single-frequency oscillation.
In addition to the measured frequency drift, further improvement of long-term stability can be achieved through several practical approaches. For instance, the stability of the OEO can be enhanced by optimizing the loop structure, such as employing a dual-loop configuration to improve mode selectivity. Moreover, since the proposed MPF relies on polarization control, the use of polarization-maintaining fibers and better environmental isolation can effectively suppress polarization-induced fluctuations. In addition, the use of low-noise electronic components and temperature-stabilized devices can further reduce system drift. These approaches are expected to further improve the long-term stability of the proposed sensing system.
5. Conclusions
In this paper, we exploit the feature of the modified FMZI to propose a sensitivity-improvement sensing demodulation scheme using OEO. A temperature sensor was used to verify the feasibility of the experiment. By switching and tracking the frequency of the generated high-frequency OEO signal, a sensitivity of 10.84 MHz/°C can be obtained. Experiment results show that the sensitivity of our scheme is twice that of the method using ordinary FMZI, and the resolution is also increased by a factor of 2. The proposed sensing scheme has a low cost, a simple structure, and easy fabrication, and is also suitable for application in other sensing schemes.
Author Contributions
Conceptualization, H.W. and H.F.; methodology, H.W., T.X., and G.H.; investigation, H.W., T.X., G.H., Q.L., S.Y., and D.Z.; data curation, H.W. and T.X.; formal analysis, H.W., T.X., and Z.L.; validation, Q.L., S.Y., and D.Z.; writing—original draft preparation, H.W. and T.X.; writing—review and editing, H.F. and Z.L.; visualization, T.X. and G.H.; supervision, H.F.; project administration, H.F.; funding acquisition, H.F. All authors have read and agreed to the published version of the manuscript.
Funding
This work was supported in part by the Science and Technology Project of State Grid Jiangxi Electric Power Co., Ltd. under Grant 521835250009.
Institutional Review Board Statement
Not applicable.
Informed Consent Statement
Not applicable.
Data Availability Statement
Data underlying the results presented in this paper are not publicly available at the time of publication but may be obtained from the authors upon reasonable request.
Conflicts of Interest
Authors Hua Wang, Gang Huang, Qiang Liu, Shuai Yuan and Dian Zuo were employed by the company State Grid Jiangxi Information and Telecommunication Company. The remaining authors declare that the research was conducted in the absence of any commercial or financial relationships that could be construed as a potential conflict of interest.
Abbreviations
The following abbreviations are used in this manuscript:
| OEO | Optoelectronic Oscillator |
| MPF | Microwave Photonic Filter |
| FMZI | Modified Fiber Mach–Zehnder Interferometer |
| EOM | Electro-Optical Modulator |
| DCF | Dispersion Compensating Fiber |
| PD | Photodetector |
| PC | Polarization Controller |
| OSA | Optical Spectrum Analyzer |
| FSR | Free Spectral Range |
| ESA | Electrical Spectrum Analyzer |
References
- Giallorenzi, T.G.; Bucaro, J.A.; Dandridge, A.; Sigel, G.H.; Cole, J.H.; Rashleigh, S.C.; Priest, R.G. Optical fiber sensor technology. IEEE J. Quantum Electron. 1982, 18, 626–665. [Google Scholar] [CrossRef] [Scilit]
- Hirayama, N.; Sano, Y. Fiber Bragg grating temperature sensor for practical use. ISA Trans. 2000, 39, 169–173. [Google Scholar] [CrossRef] [Scilit] [PubMed]
- Rao, Y.J.; Webb, D.J.; Jackson, D.A.; Zhang, L.; Bennion, I. In-fiber Bragg-grating temperature sensor system for medical applications. J. Light. Technol. 1997, 15, 779–785. [Google Scholar] [CrossRef] [Scilit]
- Zhang, D.; Wang, J.; Wang, Y.; Dai, X. A fast response temperature sensor based on fiber Bragg grating. Meas. Sci. Technol. 2014, 25, 075105. [Google Scholar] [CrossRef] [Scilit]
- Zaynetdinov, M.; See, E.M.; Geist, B.; Ciovati, G.; Robinson, H.D.; Kochergin, V. A fiber Bragg grating temperature sensor for 2–400 K. IEEE Sens. J. 2015, 15, 1908–1912. [Google Scholar] [CrossRef] [Scilit]
- Starodumov, A.N.; Zenteno, L.A.; Monzon, D.; De La Rosa, E. Fiber Sagnac interferometer temperature sensor. Appl. Phys. Lett. 1997, 70, 19–21. [Google Scholar] [CrossRef] [Scilit]
- Zhu, J.; Zhang, A.; Xia, T.; He, S.; Xue, W. Fiber-optic high-temperature sensor based on thin-core fiber modal interferometer. IEEE Sens. J. 2010, 10, 1415–1418. [Google Scholar] [CrossRef] [Scilit]
- Rong, Q.; Sun, H.; Qiao, X.; Zhang, J.; Hu, M.; Feng, Z. A miniature fiber-optic temperature sensor based on a Fabry–Perot interferometer. J. Opt. 2012, 14, 045002. [Google Scholar] [CrossRef] [Scilit]
- Sun, M.; Xu, B.; Dong, X.; Li, Y. Optical fiber strain and temperature sensor based on an in-line Mach-Zehnder interferometer using thin-core fiber. Opt. Commun. 2012, 285, 3721–3725. [Google Scholar] [CrossRef] [Scilit]
- Jiang, L.; Yang, J.; Wang, S.; Li, B.; Wang, M. Fiber Mach-Zehnder interferometer based on microcavities for high-temperature sensing with high sensitivity. Opt. Lett. 2011, 36, 3753–3755. [Google Scholar] [CrossRef] [Scilit] [PubMed]
- Wang, Y.; Zhang, J.; Yao, J. An optoelectronic oscillator for high-sensitivity temperature sensing. IEEE Photonics Technol. Lett. 2016, 28, 1458–1461. [Google Scholar] [CrossRef] [Scilit]
- Zhang, S.; Chen, H.; Fu, H. Fiber-optic temperature sensor using an optoelectronic oscillator. In Proceedings of the 14th International Conference on Optical Communications and Networks (ICOCN), Nanjing, China, 3–5 July 2015; pp. 1–3. [Google Scholar] [CrossRef] [Scilit]
- Xu, Z.; Shu, X.; Fu, H. Fiber Bragg grating sensor interrogation system based on an optoelectronic oscillator loop. Opt. Express 2019, 27, 23274–23281. [Google Scholar] [CrossRef] [Scilit] [PubMed]
- Shi, Q.; Wang, Y.; Cui, Y.; Xia, W.; Guo, D.; Wang, M. Resolution-enhanced fiber grating refractive index sensor based on an optoelectronic oscillator. IEEE Sens. J. 2018, 18, 9562–9567. [Google Scholar] [CrossRef] [Scilit]
- Xie, T.; Liu, W.; Wu, M.; Li, Z.; Lin, L.; Chen, H.; Fu, H. Wearable FBG Sensing System Based on Optoelectronic Oscillator for High-Resolution Vital-Sign Detection. IEEE Trans. Instrum. 2025, 74, 7013209. [Google Scholar] [CrossRef] [Scilit]
- Zhu, M.; Gao, P.; Cai, S.; Zhang, N.; Wu, B.; Liu, Y.; Yin, B.; Wang, M. High-Sensitivity Magnetic Field Sensor Based on an Optoelectronic Oscillator with a Mach–Zehnder Interferometer. Sensors 2025, 25, 1621. [Google Scholar] [CrossRef] [Scilit]
- Zhang, T.; Zhu, J.; Guo, T.; Wang, J.; Ye, S. Improving accuracy of distance measurements based on an optoelectronic oscillator by measuring variation of fiber delay. Appl. Opt. 2013, 52, 3495–3499. [Google Scholar] [CrossRef] [Scilit]
- Yang, B.; Yu, J.; Chi, H.; Yang, S.; Ou, J.; Zhai, Y. Improving the accuracy of distance measurements based on beat frequency detection of a dual-frequency optoelectronic oscillator. Appl. Opt. 2021, 60, 10109–10113. [Google Scholar] [CrossRef] [Scilit] [PubMed]
- Tang, Y.; Wang, M.; Wu, B.; Dong, Y.; Xiao, H.; Zhang, J.; Mu, H.; Fan, G. High-sensitivity displacement sensing based on an optoelectronic oscillator incorporating an unbalanced Mach-Zehnder interferometer. Opt. Laser Technol. 2020, 121, 105816. [Google Scholar] [CrossRef] [Scilit]
- Liu, L.; Gao, H.; Ning, T.; Pei, L.; Zheng, J.; Li, J.; Xu, J. High accuracy temperature sensing system exploiting a Sagnac interferometer and an optoelectronic oscillator. Opt. Laser Technol. 2020, 123, 105951. [Google Scholar] [CrossRef] [Scilit]
- Xie, T.; Xu, Z.; Cai, X.; Zhang, D.; Fu, H. Highly sensitive fiber Bragg grating sensing system based on a dual-loop optoelectronic oscillator with the enhanced Vernier effect. J. Light. Technol. 2022, 40, 4871–4877. [Google Scholar] [CrossRef] [Scilit]
- Cheng, Y.; Wang, Y.; Song, Z.; Lei, J. High-sensitivity optical fiber temperature sensor based on a dual-loop optoelectronic oscillator with the Vernier effect. Opt. Express 2020, 28, 35264–35271. [Google Scholar] [CrossRef] [Scilit] [PubMed]
- Gui, W.; Yang, Z.; Liu, Z.; Dong, W. High-Resolution Fiber Bragg Grating Voltage Sensing System Based on an Optoelectronic Oscillator With the Vernier Effect. IEEE Sens. J. 2025, 25, 34663–34670. [Google Scholar] [CrossRef] [Scilit]
- Mora, J.; Ortega, B.; Díez, A.; Cruz, J.L.; Andrés, M.V.; Capmany, J.; Pastor, D. Photonic microwave tunable single-bandpass filter based on a Mach-Zehnder interferometer. J. Light. Technol. 2006, 24, 2500–2509. [Google Scholar] [CrossRef] [Scilit]
- Chen, H.; Xu, Z.; Fu, H.; Zhang, S.; Wu, C.; Wu, H.; Xu, H.; Cai, Z. Switchable and tunable microwave frequency multiplication based on a dual-passband microwave photonic filter. Opt. Express 2015, 23, 9835–9843. [Google Scholar] [CrossRef] [Scilit] [PubMed]
Disclaimer/Publisher’s Note: The statements, opinions and data contained in all publications are solely those of the individual author(s) and contributor(s) and not of MDPI and/or the editor(s). MDPI and/or the editor(s) disclaim responsibility for any injury to people or property resulting from any ideas, methods, instructions or products referred to in the content. |
© 2026 by the authors. Licensee MDPI, Basel, Switzerland. This article is an open access article distributed under the terms and conditions of the Creative Commons Attribution (CC BY) license.