


Abstract
High-power-density LEDs can achieve many functions that are difficult for traditional light sources and conventional LEDs to realize, pushing the semiconductor lighting technology chain to a new level. Increasing the number of chips is an effective approach to improving the light output capability of LED devices. In this study, five high-power-density LED devices with different chip numbers (4, 9, 16, 25, and 64 chips) were fabricated using the same blue LED chips, and the effects of chip number on the light output capability, spatial light distribution characteristics, and spatially correlated color temperature distribution characteristics of high-power-density LED devices were systematically investigated. The temperature distribution characteristics of the internal chips were further analyzed in combination with infrared thermal imaging results. The results show that increasing the chip number significantly enhances the total light output capability of the device; however, due to the influence of thermal coupling among chips, the saturation current and saturated luminous intensity of devices with different chip numbers are not proportional to the chip number. Increasing the number of chips in the device does not alter the intrinsic spatial emission pattern. Under optical saturation conditions, the luminous intensity distribution curves of all five devices exhibit Lambertian spatial light distribution characteristics. In terms of correlated color temperature, the CCT of all devices increases with increasing current per chip, and devices with more chips exhibit higher CCT values and a faster increasing trend. The spatial CCT distribution results show that the correlated color temperature of the device reaches its maximum in the normal direction, decreases with increasing testing angle, and exhibits good spatial symmetry. The thermal imaging results show that devices with more chips exhibit higher average chip temperatures and a relatively more uniform temperature distribution, which improves the spatial CCT uniformity of the device to some extent.
1. Introduction
Light-emitting diodes (LEDs) possess advantages such as high luminous efficiency, fast response, compact size, long lifetime, and easy integration and have become important light sources in the field of semiconductor lighting in recent years [1,2,3,4]. In addition, research on LEDs and related photonic devices has gradually extended to areas such as microcavity structures, polaritonic devices, and angle-resolved spectroscopic characterization [5,6]. At present, with the continuous development of device structures and packaging technologies, LEDs are no longer limited to traditional energy-saving lighting but are demonstrating increasing importance in high-brightness output and high-power-density applications [2,3]. High-power-density LED devices have become one of the major hotspots in the industry. In practical applications, high-power-density LEDs are not primarily designed for energy saving; instead, their key technical metric is the power density that the device can withstand [7,8,9,10,11,12]. A higher power density enables longer-range illumination and stronger penetration capability. In the LED industry, LED chips capable of sustaining a power density above 10 W/mm2 are generally referred to as high-power-density chips, and devices packaged based on such high-power-density chips and capable of continuously sustaining a power density above 3 W/mm2 are defined as high-power-density LED devices. This enables many functions that are difficult for traditional light sources and conventional LEDs to achieve, driving LEDs from the era of “replacement lighting” toward that of “beyond-lighting” applications [7,8,9,10,11,12].
With the improvement of chip epitaxial quality and packaging technologies, integrating multiple chips within a single LED device to enhance its total power and overall light output capability has become an important approach for realizing high-power-density LEDs. However, increasing the number of chips not only changes the total light output capability of the device but also significantly affects the internal temperature distribution characteristics of the device. Previous studies have shown that as the spacing between chips in LED devices decreases, the thermal coupling effect becomes significantly stronger, leading to more severe thermal congestion, i.e., localized heat accumulation and a rapid rise in device temperature caused by insufficient heat dissipation among densely integrated chips, which further manifests as a reduction in luminous flux, an increase in correlated color temperature, and a decrease in the red component ratio. This indicates that changes in thermal distribution under multi-chip integration conditions can directly affect the luminous performance and optical color characteristics of the device [10]. Meanwhile, studies on ceramic eutectic-packaged LEDs have shown that the number and positions of eutectic chips can significantly influence the light output capability of the device and the variation trend of correlated color temperature, mainly because changes in chip number alter the total heat generation and heat dissipation conditions within the device [11]. In addition, studies on the top-surface micro-area luminous uniformity of ceramic-packaged high-power flip-chip LEDs have indicated that under high-current conditions, the light intensity distribution in different micro-regions of the device can change significantly due to nonuniform current spreading and variations in local heat dissipation conditions [12]. These studies indicate that there is a close relationship among the internal thermal distribution, current distribution, and spatial emission behavior in multi-chip LED devices.
For high-power-density LED devices, the spatial light distribution characteristics are also a key indicator for evaluating their performance. In practical applications, devices are usually used in conjunction with optical systems such as lenses and reflectors, and their spatial emission patterns directly influence the resulting light distribution performance. For white LED devices, the spatial light distribution characteristics are reflected not only in the angular distribution of light intensity but also in the spatial distribution of correlated color temperature. Relevant studies have shown that the spatial CCT uniformity of white LED devices can be influenced by the device packaging structure, the morphology of the phosphor layer, and secondary optical components [13]. Therefore, variations in chip number may not only alter the total light output capability of high-power-density LED devices but may also significantly affect their spatial light distribution characteristics.
However, the above studies have mainly focused on chip spacing, chip position, local luminous uniformity, and thermal behavior, whereas systematic investigations on how different chip numbers affect the spatial light distribution, spatially correlated color temperature distribution, and their coupled thermal behavior in high-power-density LED devices remain relatively limited. Based on this, five high-power-density LED devices with different chip numbers (4, 9, 16, 25, and 64 chips) were fabricated using the same blue LED chips, and, combined with infrared thermal imaging, the effects of chip number on the total light output capability, spatial light distribution characteristics, and spatially correlated color temperature distribution characteristics of the devices were systematically investigated.
2. Experiment
2.1. Sample Preparation
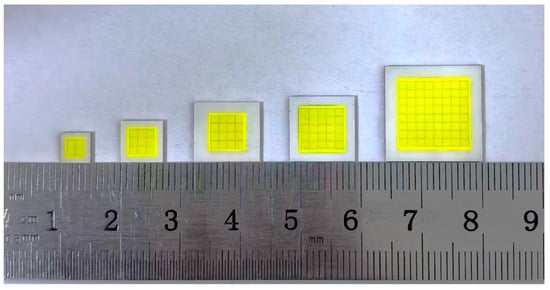
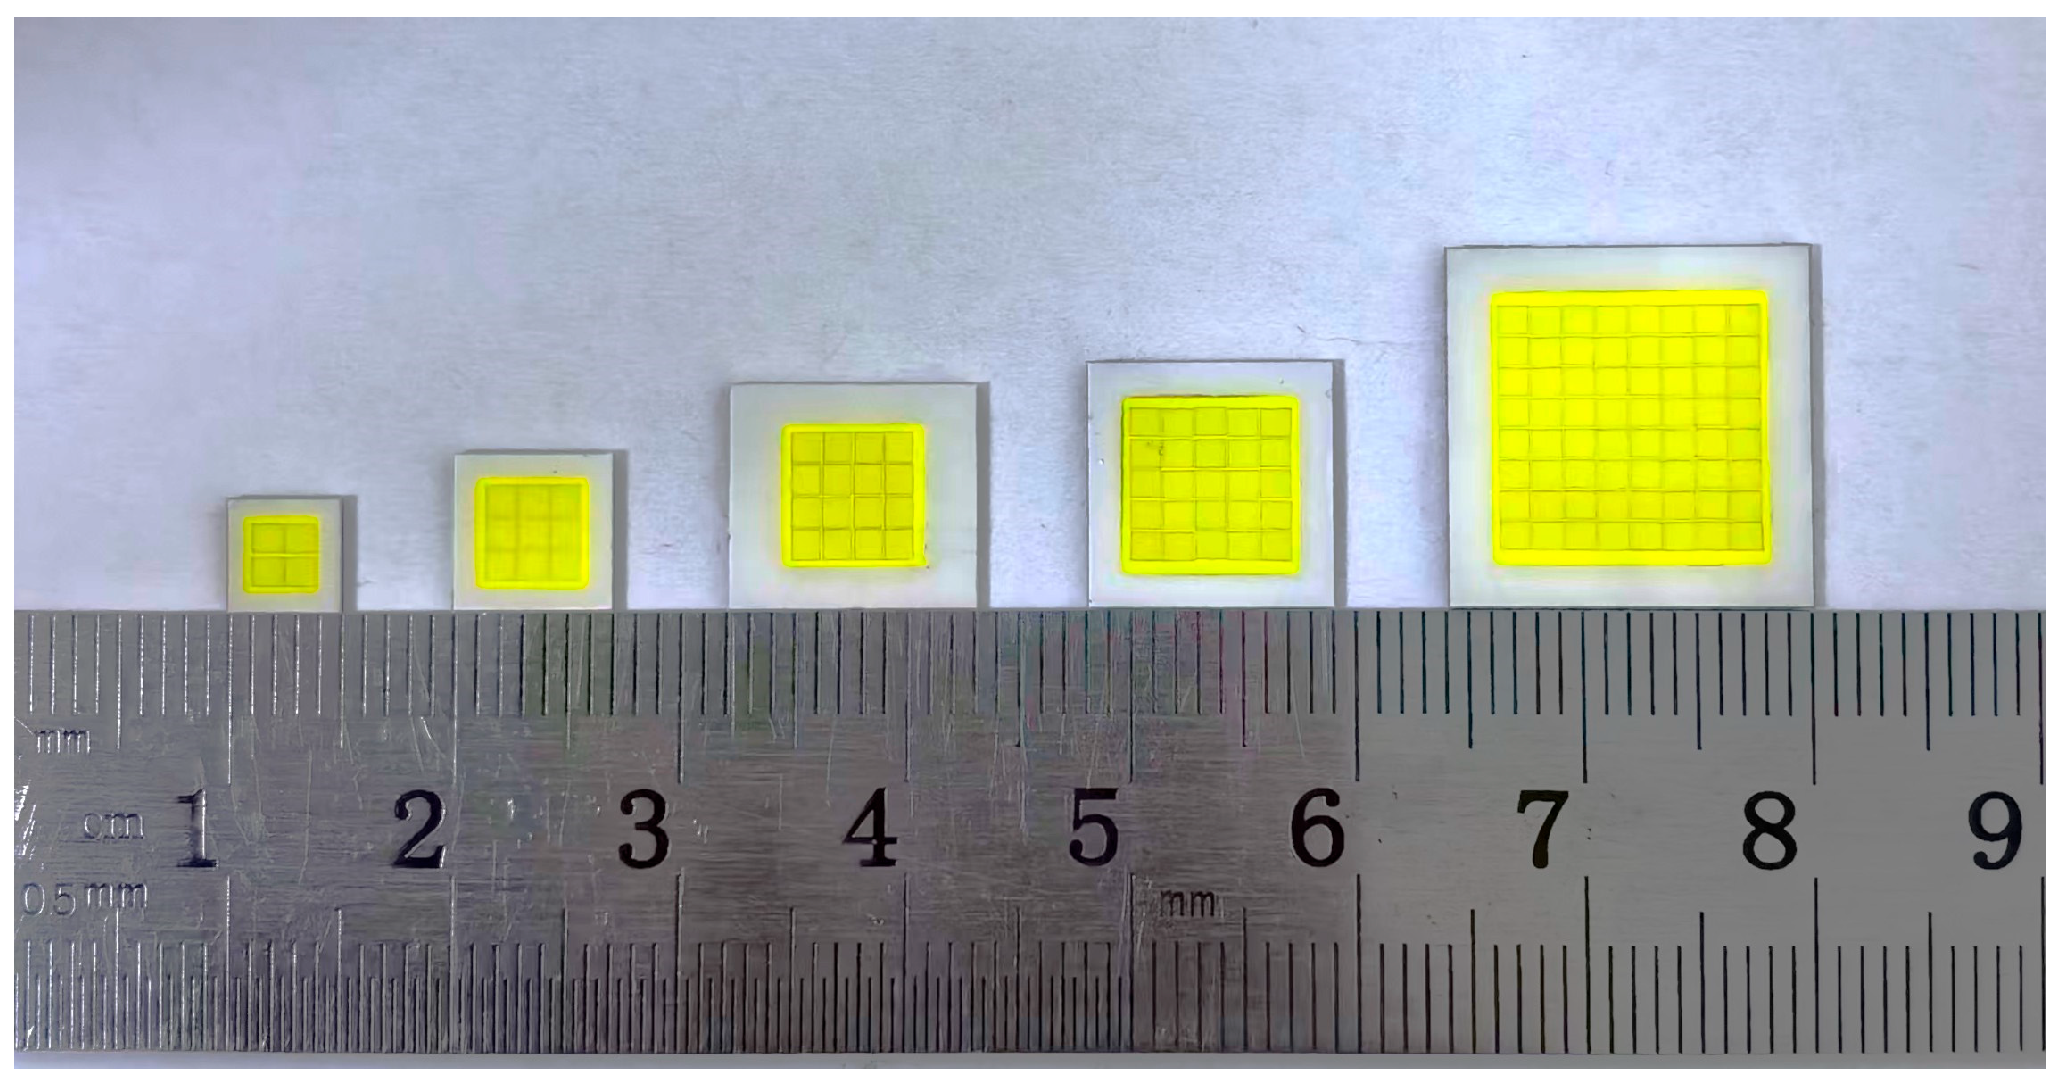
The chips used for fabricating the high-power-density LED devices were 1397 μm × 1397 μm (55 mil × 55 mil) flip-chip blue LEDs. All devices adopted a fully parallel chip configuration, and the chips were eutectically bonded to an aluminum nitride ceramic substrate using an ASM-AD211 thermal compression eutectic bonding system, with a chip spacing of 40 μm. On this basis, a high-reflectivity white wall was applied around the sidewalls of the chips to obtain ceramic-packaged blue LED devices. The high-reflectivity white wall material consisted of a mixture of silicone and anatase titanium dioxide (TiO2) powder, with a TiO2 content of 0.5%. Subsequently, the surface of the flip-chip LEDs was cleaned by plasma glow treatment, and a phosphor–silicone mixture diluted with thinner was sprayed onto the chip surface to form the phosphor–silicone layer. The thickness of the phosphor–silicone layer was 200 μm. It was composed of silicone mixed with yttrium aluminum garnet (YAG) phosphor, with a phosphor content of 30 wt% and an average phosphor particle size of 8 μm. Ceramic-packaged white LED devices were fabricated with a total thickness of 800 μm. A total of five types of devices with different chip numbers were fabricated in this study, including 4-chip, 9-chip, 16-chip, 25-chip, and 64-chip configurations. Among them, the 4-chip device has a geometric size of 5.0 × 5.0 mm and is known as XHP50 in the LED industry, while the 9-chip device (7.0 × 7.0 mm), 16-chip device (11.0 × 10.0 mm), 25-chip device (11.0 × 11.0 mm), and 64-chip device (16.0 × 16.0 mm) correspond to the XHP70, SBT90, XHP110, and XHP160 devices, respectively. The five high-power-density LED samples with different chip numbers used in this study are listed in Table 1.
Table 1.
Samples of five high-power-density LEDs.
Figure 1 Photographs of high-power-density LED devices with five different chip numbers (4, 9, 16, 25, and 64 chips).
Figure 1.
Photographs of high-power-density LED Samples with different chip numbers.
The five devices compared in this study all adopted the same chips, the same packaging process, and a fully parallel configuration. Therefore, the conclusions of this work mainly reflect the overall variation patterns in optical and thermal performance exhibited by devices with different chip numbers within the current sample system.
2.2. Sample Test
A rotating light-source measurement method was used in the experiment. First, the samples shown in Figure 1 were soldered onto a copper substrate and connected with electrical wires. Thermal grease was uniformly applied to the backside of the copper substrate, and the substrate was mounted onto a temperature-controlled, water-cooled copper test head using bolts. The wires from the copper substrate were connected to the positive and negative electrodes of the copper test head. Subsequently, the entire assembly was fixed on a rotary stage. When the fiber probe was aligned with the normal direction of the emitting surface of the device, the angle was defined as 0°. During the measurement, the position of the fiber probe remained fixed, while the sample was rotated by the rotary stage. Clockwise rotation was defined as “+”, whereas counterclockwise rotation was defined as “−”. The angular sampling interval was 10°, and the measurement accuracy of the rotary stage was 1°. The spectral acquisition system used in this experiment was the HASS-2000 spectrometer from Hangzhou Everfine. During the measurements, the integration time was operated in the automatic mode to ensure that each acquired data point was automatically matched with an appropriate integration time, and the averaging number for each data point was set to 10. The LED devices were driven by a 0–200 A adjustable constant-current DC power supply. The circulating water flow rate was maintained at 6 L/min, and the temperature-control water tank had a volume of 100 L. During the experiment, the temperature of the heat sink was maintained at room temperature. All devices were tested under the same mounting method, thermal interface conditions, and circulating water-cooling conditions to ensure the comparability of the optical and thermal results among different samples.
The LED devices used in this study have already been mass-produced, and the relevant experimental data have been repeatedly verified through tests on batch samples, demonstrating good repeatability and reliability. Moreover, in this study, the uncertainties in luminous intensity and correlated color temperature mainly arise from fluctuations in repeated spectral acquisitions, probe positioning errors, and angular setting errors; the uncertainty in beam angle mainly arises from the angular accuracy of the rotary stage and the angular sampling interval; and the uncertainty in infrared thermal imaging temperature mainly arises from the measurement accuracy of the thermal imager, emissivity setting, and the selection of the temperature-measurement area.
3. Results and Discussion
3.1. I–L Characteristics
In practical applications, LED devices are often combined with secondary optical designs, such as lenses or reflectors, so that the light emitted in the normal direction of the device serves as the primary useful beam, while the light deviating from the normal direction is more strongly influenced by the device packaging structure and the secondary modulation of the optical system [13,14]. Therefore, compared with the total luminous flux over all angles, the light output in the normal direction more directly reflects the effective luminous performance of the device under practical application conditions. Investigating the I–L characteristics of the device in the normal direction helps to accurately evaluate its light output capability under high-current driving conditions and the nonlinear variation in light output with increasing current.
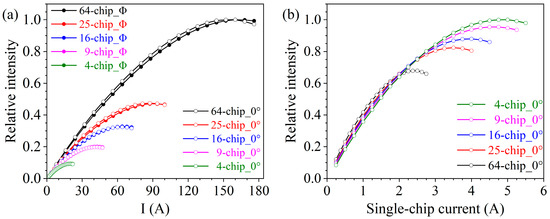
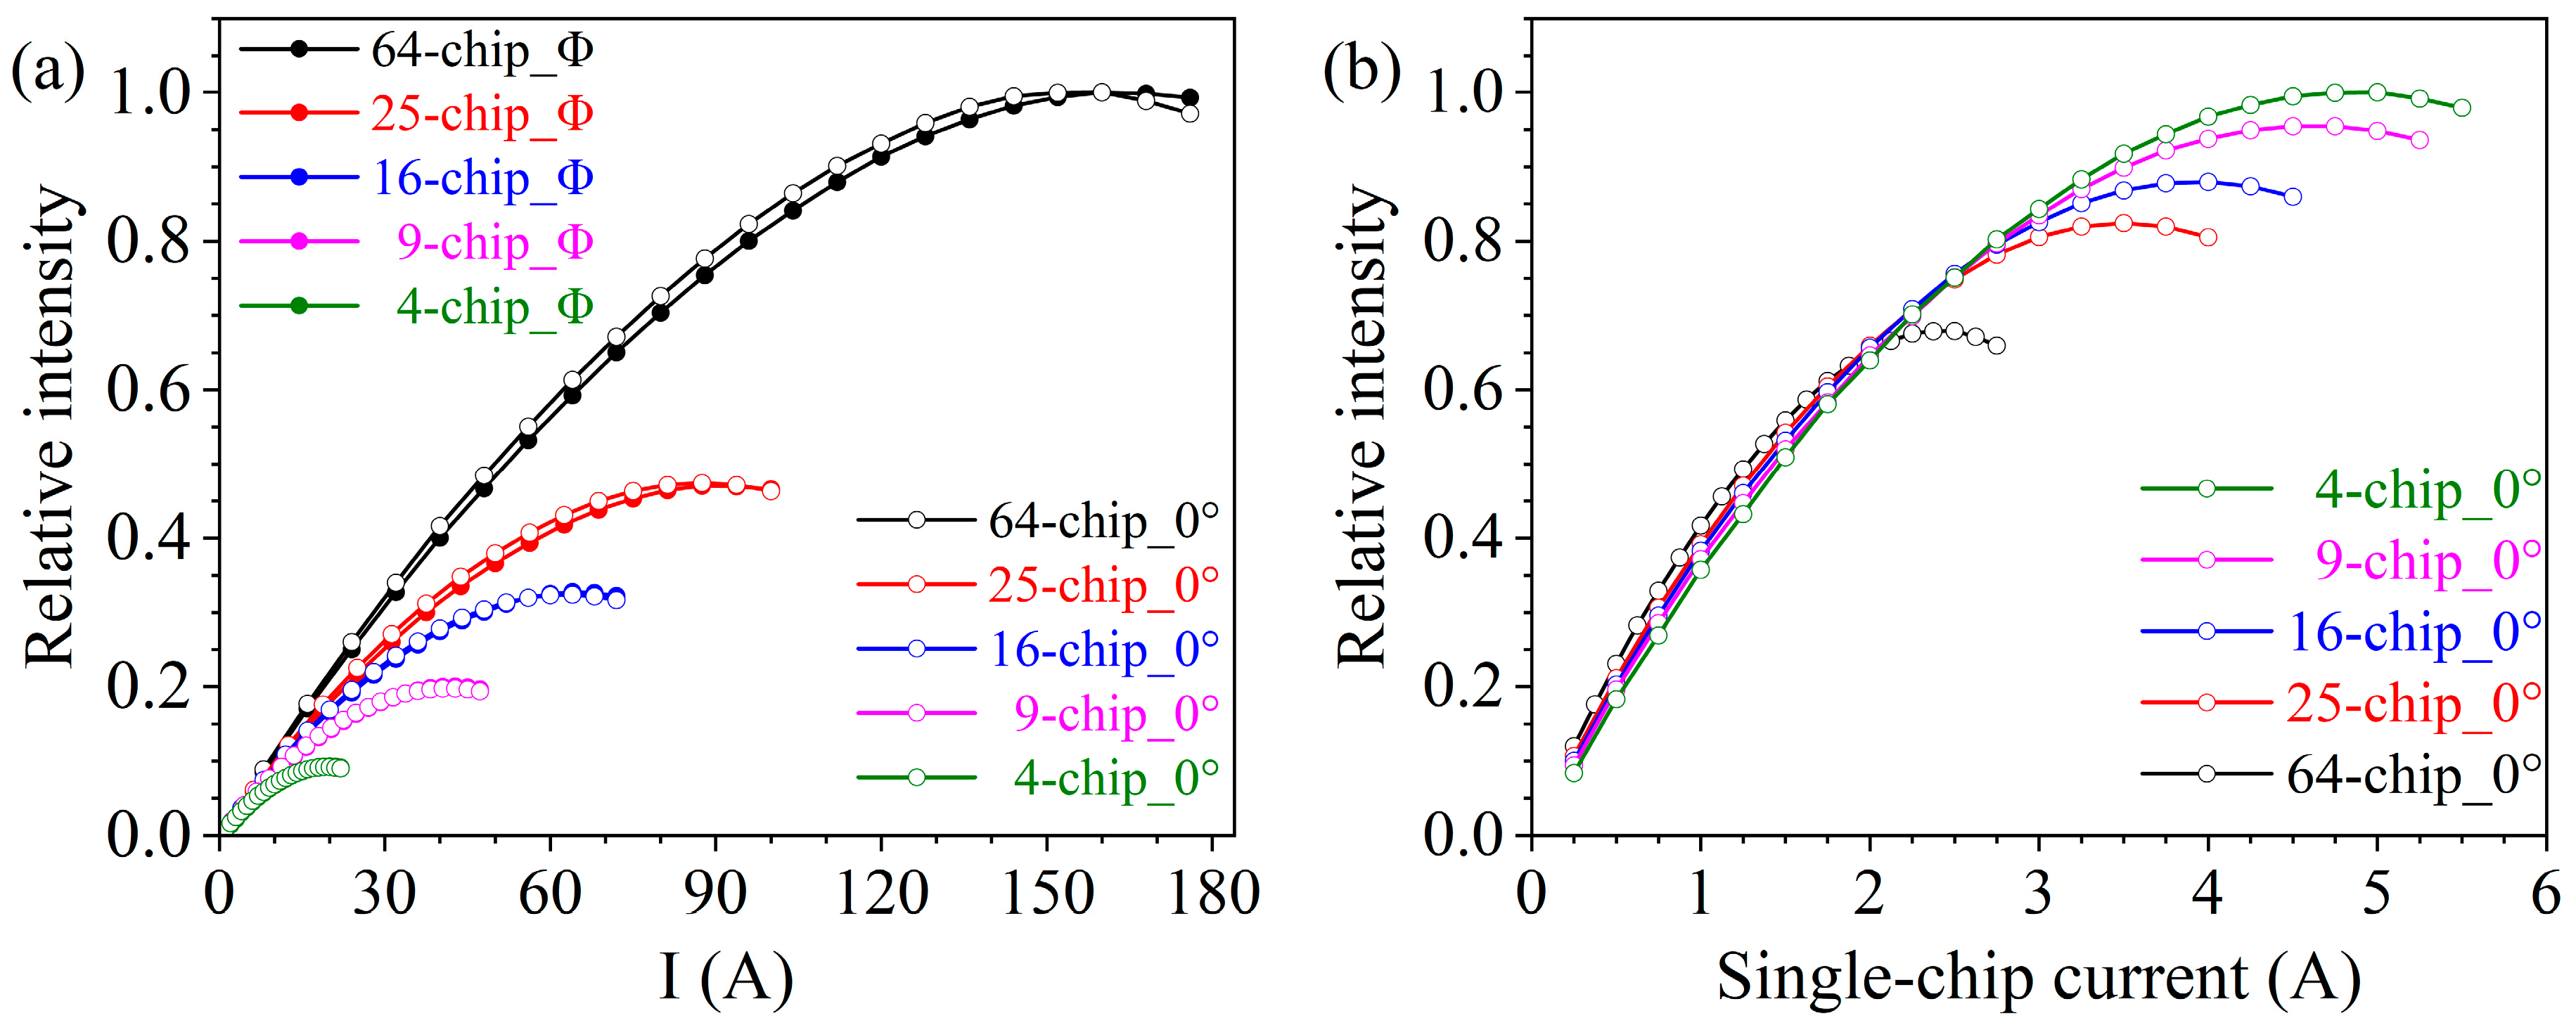
Figure 2a shows a comparison of the I–L characteristic curves of five high-power-density LED devices with different chip numbers measured in the integrating sphere (Φ) and in the normal direction (0°). For plotting, the maximum luminous intensity in each case was normalized to 1, and the curves were normalized accordingly (with differences only in the vertical axis scale). Figure 2a indicates the following: (1) The I–L characteristics of the five multi-chip devices measured in the integrating sphere (Φ) and in the normal direction (0°) exhibit similar trends, indicating that the variation in light output with current remains consistent under different measurement conditions. (2) All devices exhibit the typical operating characteristics of LEDs. In the low-current region, the luminous intensity of the device increases approximately linearly with the driving current. In this current range, the junction temperature of the device remains relatively low, the internal quantum efficiency stays at a high level, and the electro-optical conversion efficiency is relatively high. With the continuous increase in the driving current, for example, when the driving current of the 64-chip device exceeds 80 A, the junction temperature of the device rises significantly. This leads to a reduction in internal quantum efficiency and an enhancement of nonradiative recombination, thereby resulting in a noticeable decrease in the growth rate of light output. Meanwhile, current crowding under high-current conditions further intensifies local heat accumulation, resulting in different degrees of nonlinear saturation in the light output of the devices. (3) The chip number shows a significant positive correlation with both the saturated luminous intensity and the saturation current of the device. Specifically, as the number of chips increases, the device can withstand a significantly higher driving current, and both the saturated luminous intensity and the saturation current increase accordingly. In this study, the operating state at which the light output of the device no longer noticeably increases and reaches its maximum value is defined as the optical saturation state, and the corresponding operating current under this state is defined as the saturation current. (4) Taking the I–L characteristics in the normal direction as an example, the driving currents at which the 4-, 9-, 16-, 25-, and 64-chip devices reach optical saturation are 20 A, 42.75 A, 64 A, 87.5 A, and 160 A (4: 8.55: 12.8: 17.5: 32), respectively, indicating that these values are not proportional to the number of chips. Similarly, the ratios of saturated luminous intensity are 4: 8.61: 14.09: 20.61: 43.48, which are also not proportional to the number of chips.
Figure 2.
Comparison of the I–L characteristics of LED devices with five different chip numbers. (a) I–L curves measured in the integrating sphere (Φ) and in the normal direction (0°); (b) average luminous intensity per chip as a function of single-chip current in the normal direction (0°).
To reveal the differences in the light-emitting capability of individual chips in devices with different chip numbers under high-current operation, a comparative analysis of the light output characteristics of these devices was carried out under the same single-chip current condition. For this purpose, the I–L curves in the normal direction shown in Figure 2a were processed as follows: the total driving current and total luminous intensity of each device were divided by the corresponding chip number to obtain the variation curves of the average luminous intensity per chip with the single-chip current. The results are shown in Figure 2b. Similarly, the maximum average luminous intensity per chip among the five curves was taken as 1, and the curves were normalized accordingly. Figure 2b further reveals that the variation in the average luminous intensity per chip with the single-chip current differs significantly among devices with different chip numbers: (1) When the devices reach optical saturation, devices with fewer chips exhibit a higher average luminous intensity per chip. Among them, the average luminous intensity per chip of the 4-chip device is higher than that of the 9-, 16-, 25-, and 64-chip devices by 4.56%, 12.04%, 17.58%, and 32.09%, respectively. (2) Devices with a larger number of chips tend to reach saturation of the average luminous intensity per chip more easily. Specifically, the single-chip currents at which the 64-, 25-, 16-, 9-, and 4-chip devices reach optical saturation are 2.5 A, 3.5 A, 4 A, 4.75 A, and 5 A, respectively. These results indicate that the average single-chip current at optical saturation differs significantly among devices with different chip numbers. (3) When the devices have not yet reached optical saturation and the single-chip current is relatively low, the differences in average luminous intensity per chip among devices with different chip numbers are not significant, and the overall variation trends are relatively similar.
In practical applications, increasing the number of chips is an effective approach to improving the light output and power-handling capability of LED devices. By integrating more chips, LED devices can withstand higher driving currents within a safe voltage range, thereby significantly enhancing their light output capability to meet the requirements for extremely high brightness in applications such as industrial lighting and special light sources. However, increasing the number of chips inevitably leads to a corresponding increase in the total heat generation of the device. More importantly, under high current-density driving conditions, strong thermal coupling occurs among densely arranged chips. The generated heat cannot be rapidly dissipated, resulting in a thermal congestion effect that causes a sharp rise in the overall junction temperature of the device, which in turn leads to performance degradation, such as optical saturation and efficiency reduction. Devices with different chip numbers experience significantly different temperature rise conditions. The thermal coupling effect inside the device becomes progressively stronger, and the thermal congestion phenomenon becomes more pronounced, resulting in a further increase in the overall average temperature of the chips. Since an increase in junction temperature suppresses the luminous efficiency of the device and accelerates light output saturation [2,15], under the same heat dissipation conditions, devices with more chips tend to exhibit a lower maximum driving current that each individual chip can sustain (i.e., the saturation current), as well as a lower corresponding light output capability. This explains the observed phenomenon: although the total saturation current and total saturated luminous intensity increase with the number of chips, their values are not strictly proportional to the chip number. Devices with fewer chips exhibit larger average saturation current per chip and can achieve higher average saturated luminous intensity per chip.
Therefore, although increasing the number of chips can improve the total power and overall light output capability of the device, it comes at the cost of reduced luminous efficiency of the average individual chip within the device. Future technological breakthroughs will rely on improving packaging materials, optimizing heat dissipation structures, and enhancing the uniformity of current distribution among chips, in order to alleviate the “thermal congestion” caused by high-density integration and ensure the luminous performance of individual chips while increasing the integration level.
3.2. θ–L Characteristics of the Saturated Luminous Intensity
In practical applications, high-power-density LEDs are not primarily designed for energy saving but rather are often operated under optical saturation conditions (i.e., the light output no longer increases with increasing current) in order to achieve a high optical power density output. Compared with the linear response characteristics in the low-current region, the device behavior under optical saturation conditions can better reflect its actual output capability and thermal stability. Therefore, the extreme luminous performance of high-power-density LED devices has become an important research topic. On the other hand, under high-current operating conditions, the luminous intensity of the device is not only affected by the driving current but may also vary in its spatial distribution. Investigating the variation in saturated luminous intensity with the testing angle (θ–L) helps evaluate the spatial light output stability and luminous distribution consistency of the device under extreme operating conditions. By comparing the θ–L characteristics of high-power-density LED devices with different chip numbers under optical saturation conditions, the influence of chip number variation on the spatial light output capability of the device can be more comprehensively understood.
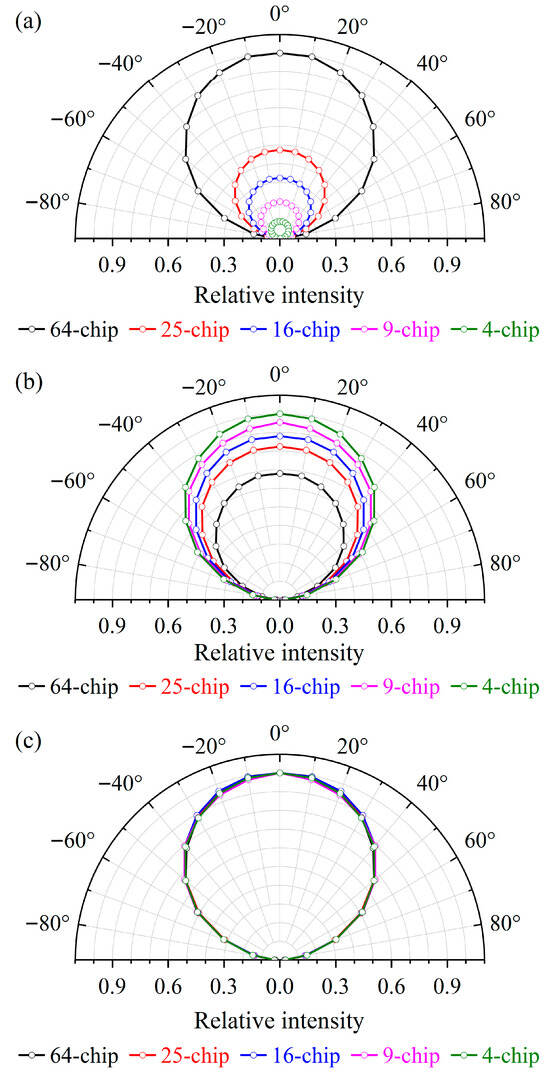
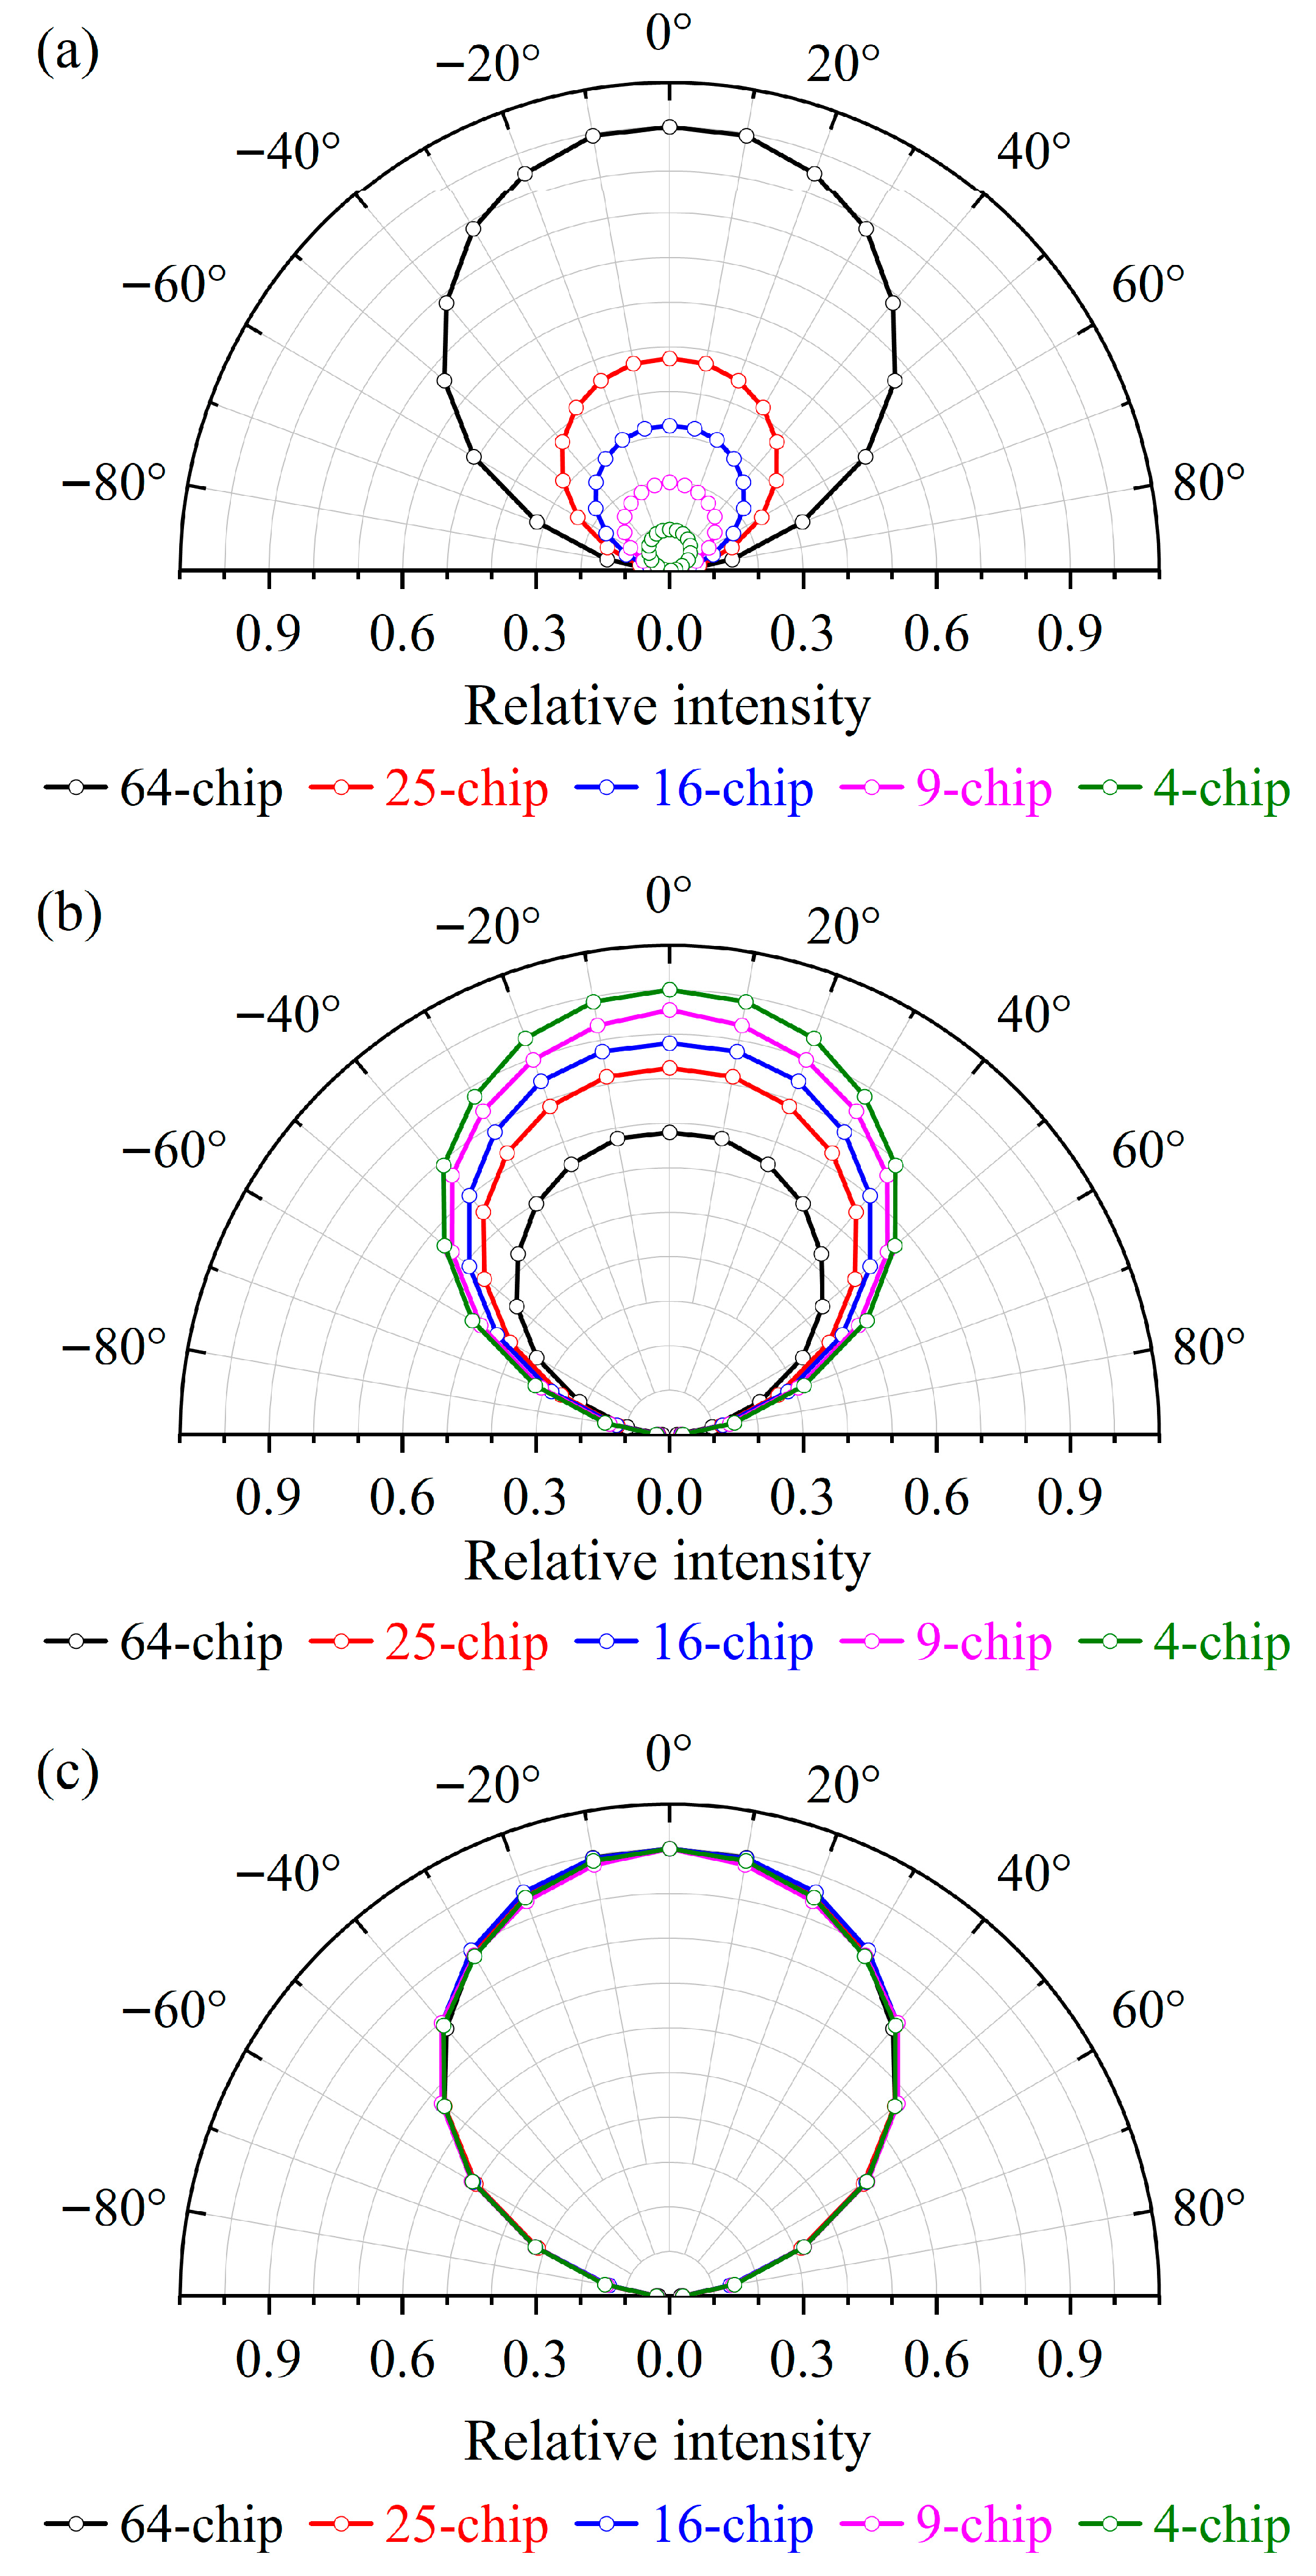
Figure 3a,b present the variations in luminous intensity and average luminous intensity per chip with the testing angle when the five devices with different chip numbers reach the optical saturation state. For convenient comparison among different devices, the maximum luminous intensity in each curve was normalized to 1. Figure 3a,b reveal the following: (1) As the number of chips increases, the ultimate light output capability of the device at various spatial angles is significantly enhanced. However, the average light output capability per chip at each spatial angle decreases with increasing chip number. This is consistent with the previously observed I–L characteristics, indicating that increasing the number of chips enhances the overall light output capability of the device, but under high-power operating conditions, it is also more susceptible to thermal effects, thereby limiting the light output capability of the average individual chip. (2) The luminous intensity of the five multi-chip devices decreases with increasing testing angle. When the testing angle is 0°, the measured luminous intensity reaches its maximum. As the rotating stage turns clockwise or counterclockwise, the measured luminous intensity gradually decreases. At the same positive and negative angles, the measured luminous intensity is nearly identical, indicating that the spatial light distribution of the device is symmetric.
Figure 3.
Angular optical characteristics of LED devices with five different chip numbers: (a) saturated luminous intensity versus testing angle; (b) average luminous intensity per chip versus testing angle; (c) luminous intensity distribution curves.
The decrease in luminous intensity with increasing testing angle is mainly determined by the angular light-emission characteristics of the device. When the testing angle is 0°, the optical fiber probe is aligned with the normal direction of the device emitting surface, where the emitted light received is the strongest. As the rotating stage rotates clockwise or counterclockwise, the optical fiber probe gradually deviates from the normal direction, and the effective light output component of the device in that direction continuously decreases; therefore, the measured luminous intensity gradually decreases with increasing testing angle. The symmetry exhibited in the spatial distribution of luminous intensity fundamentally originates from the geometric symmetry of the device packaging structure and the effective light-emitting region. The five high-power-density LED devices with different chip numbers investigated in this study all adopt a planar rectangular ceramic-packaged structure. Their package geometry and chip arrangement exhibit good spatial symmetry, resulting in equivalent optical boundary conditions on both sides of the device normal. Based on this structural configuration, the photon emission paths of the device in different directions are geometrically consistent, which determines that the luminous intensity exhibits a symmetric distribution in the positive and negative directions as the testing angle varies.
These features indicate that the variation in luminous intensity with testing angle in devices with different chip numbers overall exhibits a typical cosine-like decay behavior, showing spatial light-emission characteristics close to those of an ideal Lambertian emitter. To eliminate the influence of differences in chip number and driving current on the luminous-intensity magnitude, and to more intuitively compare the spatial light-emission patterns of different devices, the curves in Figure 3a were normalized using the luminous intensity at 0° as the reference. In this way, the light-distribution curves of the five multi-chip devices under optical saturation conditions were obtained, as shown in Figure 3c. It can be seen that the light-distribution curves of the devices almost overlap and exhibit highly consistent overall shapes, indicating that increasing the chip number does not significantly affect the spatial distribution of luminous intensity.
For an ideal Lambertian emitter, the angular distribution of luminous intensity satisfies:
where is the luminous intensity in the normal direction, and is the testing angle. To further quantitatively evaluate the degree of agreement between the spatial light distribution of each device and that of an ideal Lambertian emitter, the following empirical model was adopted in this study:
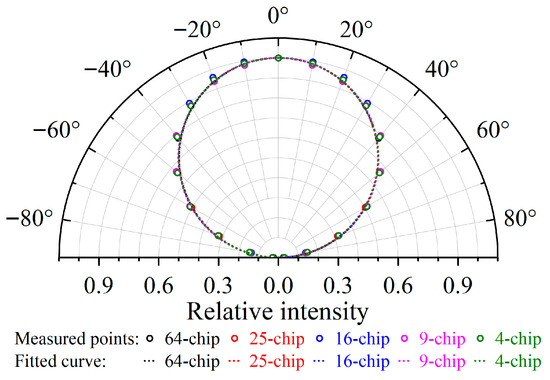
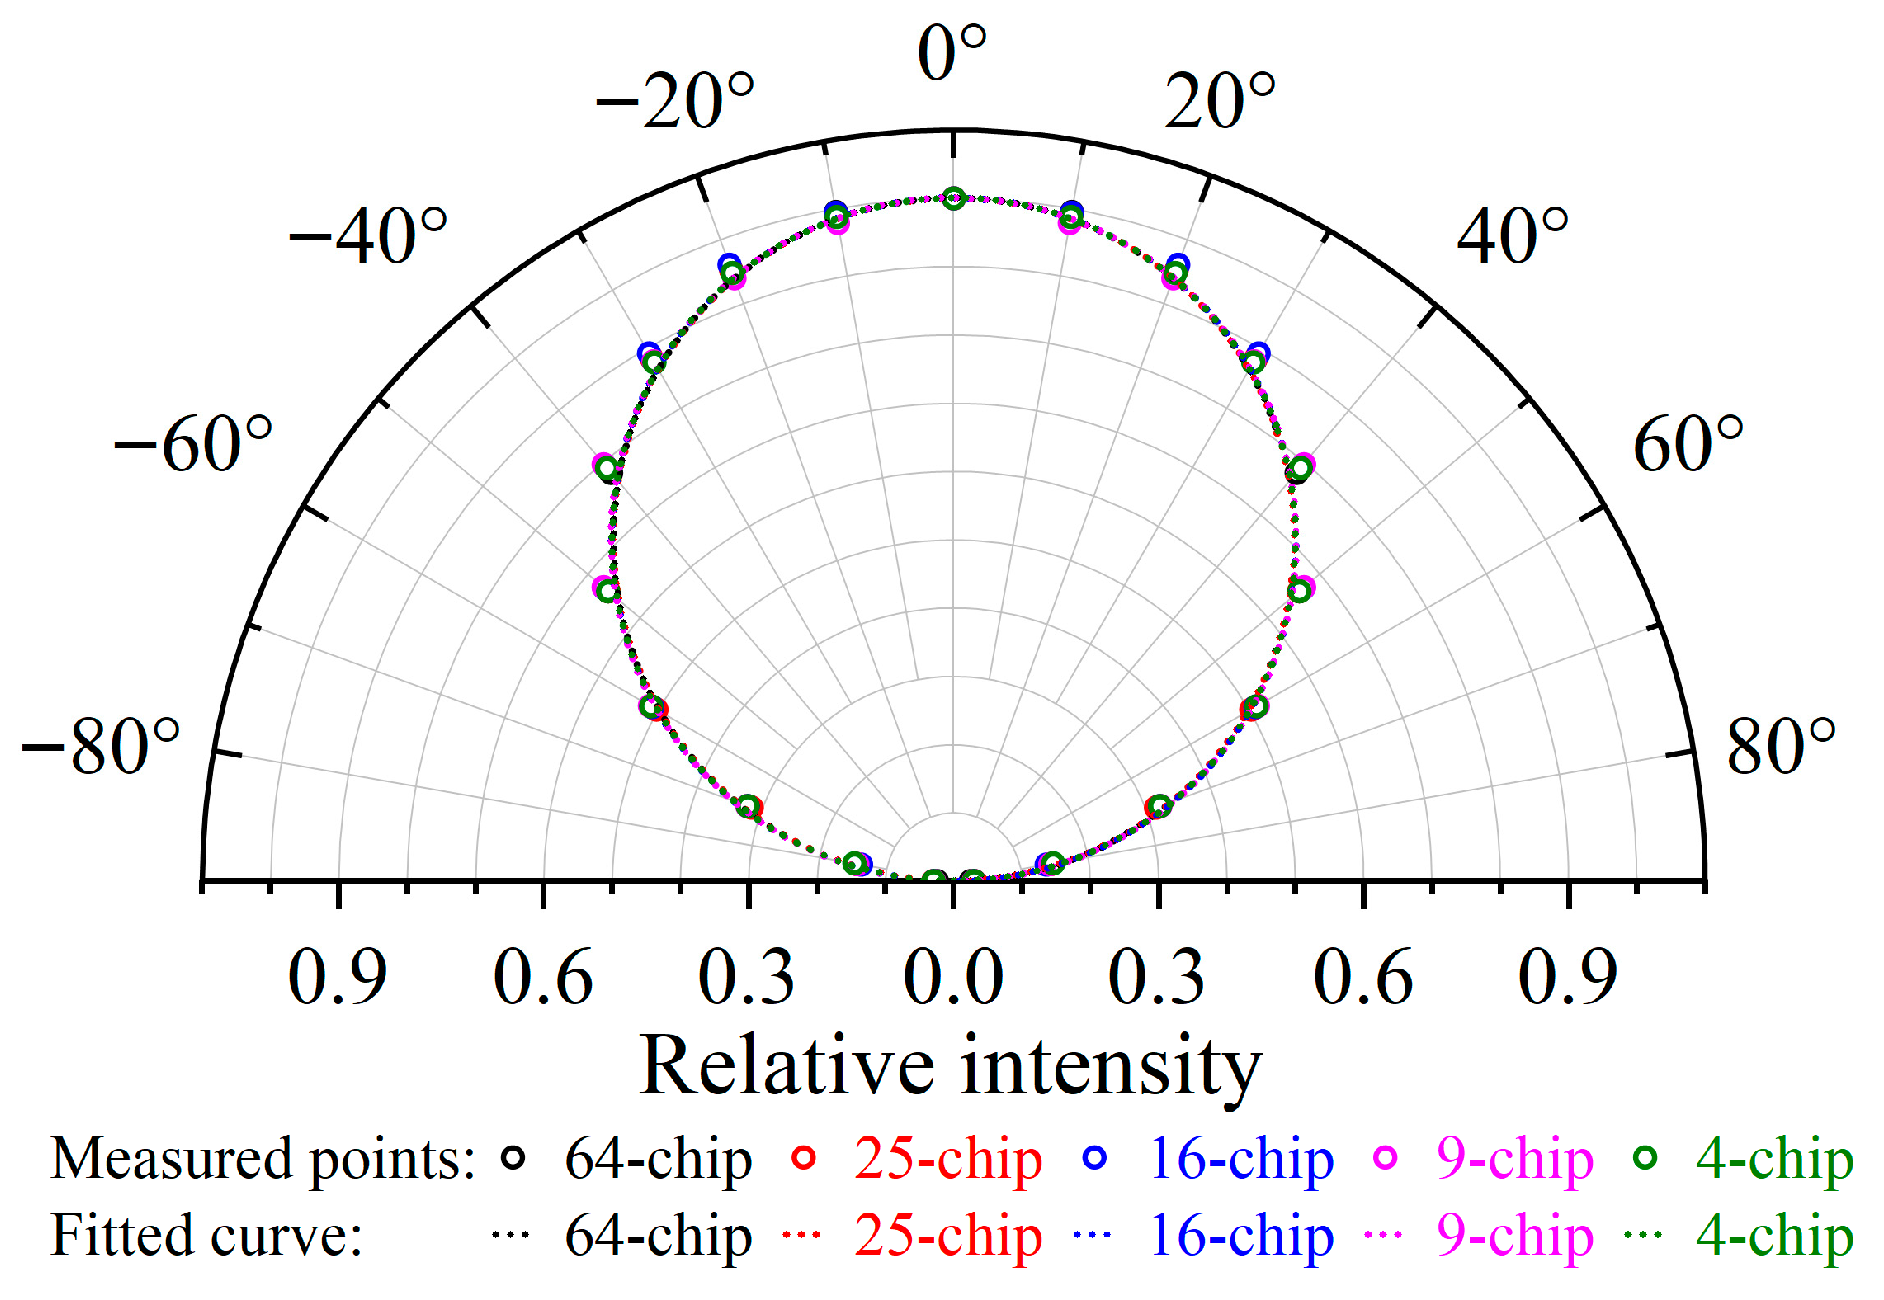
A nonlinear fitting was performed on the spatial light distributions of the five devices under optical saturation conditions, and the fitting results are shown in Figure 4, where m is the fitting parameter that characterizes the degree to which the spatial light distribution of the device deviates from that of an ideal Lambertian emitter. When m = 1, the distribution corresponds to that of an ideal Lambertian emitter.
Figure 4.
Lambertian fitting results of the spatial light distribution of devices with different chip numbers under optical saturation conditions.
The relevant fitting parameters and measured beam angles are listed in Table 2. Figure 4 and Table 2 together demonstrate that the measured data points of the five devices agree well with the fitting curves, the fitting quality is high for all cases, and the fitted m values are all close to 1, indicating that devices with different chip numbers all exhibit near-Lambertian spatial light distributions under optical saturation conditions. For an ideal Lambertian emitter, the beam angle is 120°. In this study, the measured beam angles of all devices are close to 120°, with only small differences among them, which further indicates that increasing the chip number does not significantly alter the intrinsic spatial light-distribution pattern of the devices.
Table 2.
Comparison of the Lambertian fitting parameter, m, and measured beam angle of the five devices under optical saturation conditions. (R2 ≥ 0.99).
The results presented in Figure 2, Figure 3 and Figure 4 indicate that the chip number mainly determines the absolute output intensity level of the device but does not fundamentally change its inherent spatial light-emission characteristics. This has important practical significance for understanding the optical characteristics of high-power-density LED devices. In the absence of secondary optical design in LED devices, the spatial light emission pattern of high-power-density LED devices is mainly determined by the chips themselves and their primary packaging structure, exhibiting good stability and consistency. This characteristic provides an important basis for luminous distribution design in practical optical applications of high-power-density LED devices.
3.3. θ–CCT Characteristics
Correlated color temperature (CCT) is an important parameter for characterizing the spectral properties of white LEDs, and its variation directly reflects the relative proportion between the emitted blue light from the chip and the phosphor-converted light [2,16,17]. For high-power-density LED devices, the internal spectral composition may change under different driving current and thermal load conditions, thereby leading to variations in correlated color temperature. Meanwhile, influenced by factors such as the packaging structure, optical path differences, and internal temperature distribution, the spectral mixing state of LED devices may also vary at different emission angles. Therefore, investigating the variation in correlated color temperature with spatial angle in high-power-density LED devices helps to achieve a more comprehensive understanding of the variation patterns of spatial spectral distribution and the color temperature stability under different driving current conditions.
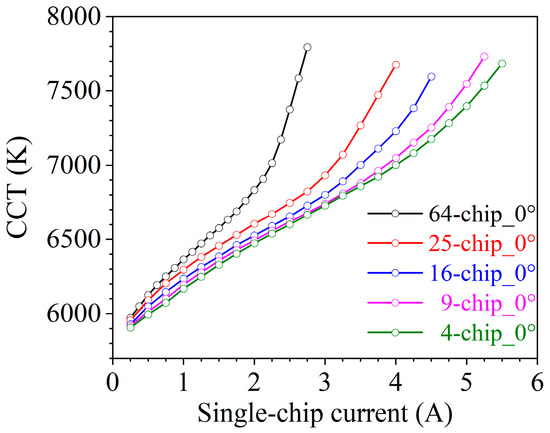
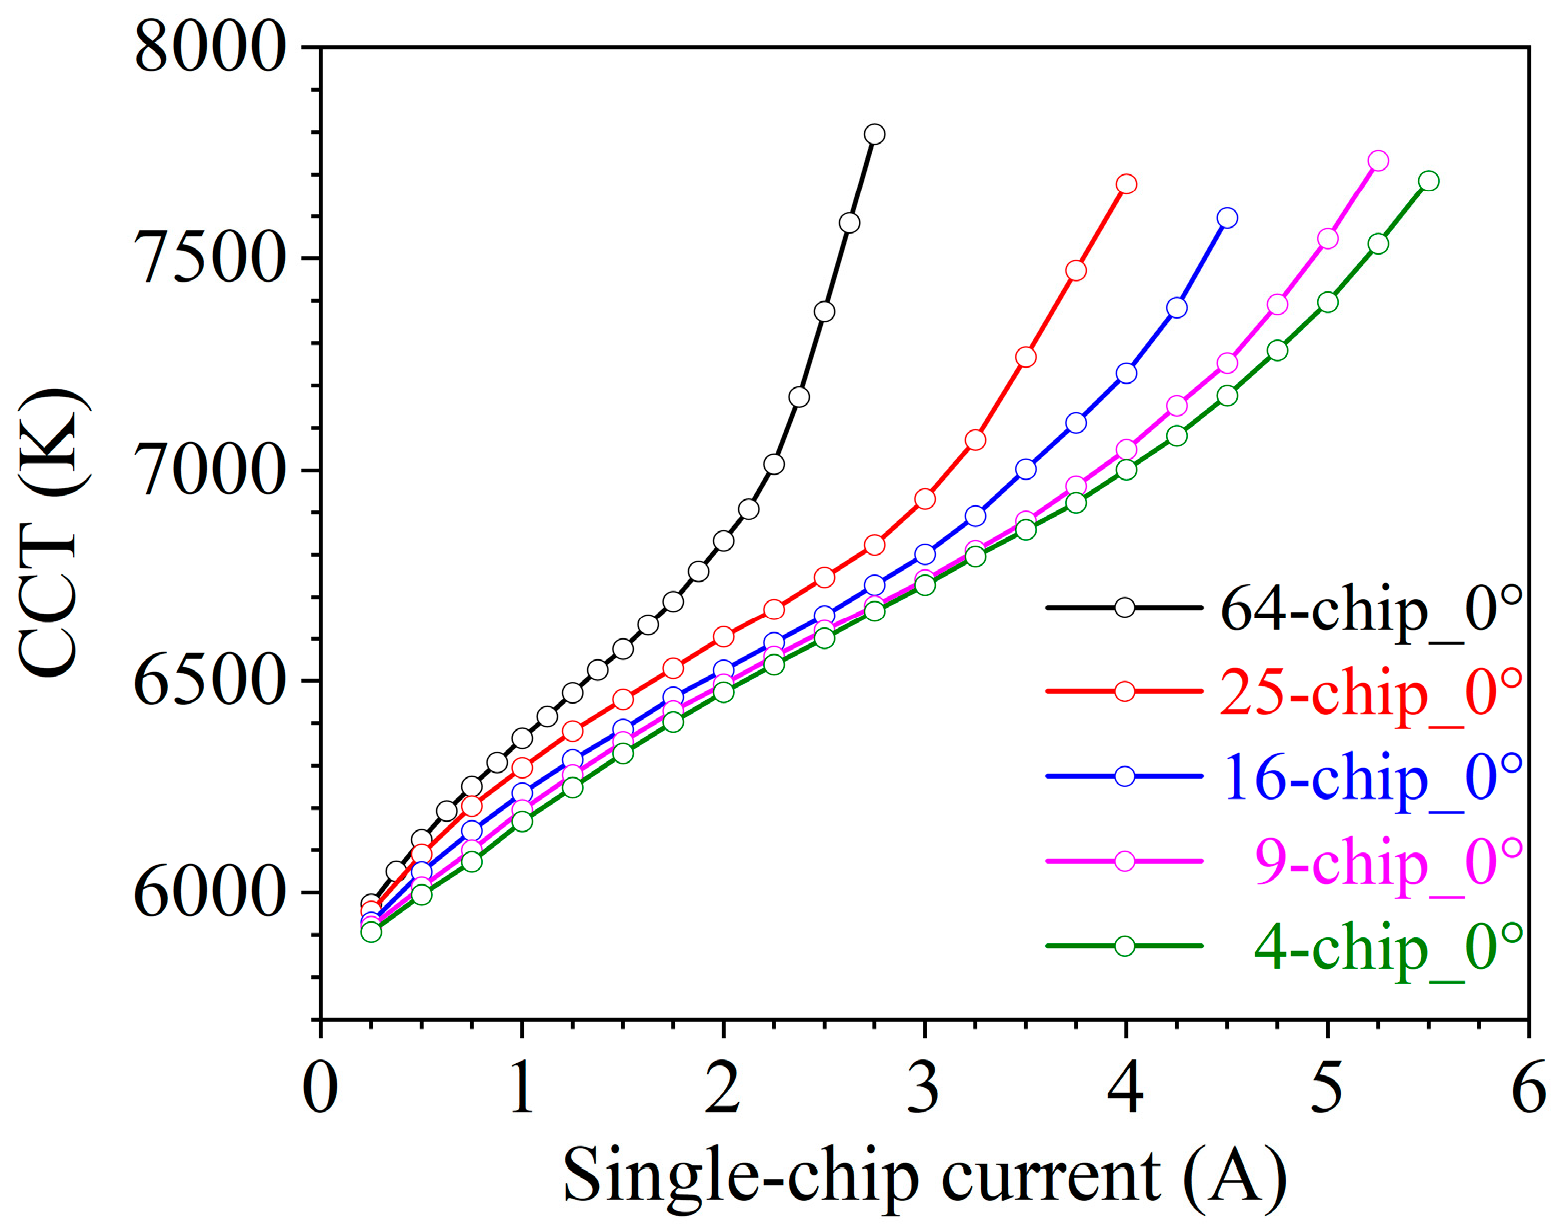
Figure 5 shows the I–CCT characteristic curves of the five devices with different chip numbers measured along the normal direction, where the horizontal axis represents the current flowing through each individual chip. Figure 5 shows the following: (1) The correlated color temperature of devices with different chip numbers increases with the increase of the current flowing through each chip. (2) A further comparison of the I–CCT characteristics of devices with different chip numbers shows that, under the same current per chip, devices with more chips exhibit higher correlated color temperatures. This difference becomes more pronounced in the medium- and high-current regions. The CCT of the 64-chip device increases much faster than that of the 25-, 16-, 9-, and 4-chip devices and reaches a higher CCT level at a relatively lower current per chip. In contrast, devices with fewer chips exhibit a more gradual increase in CCT.
Figure 5.
Comparison of the I–CCT characteristic curves of LED devices with five different chip numbers in the normal direction.
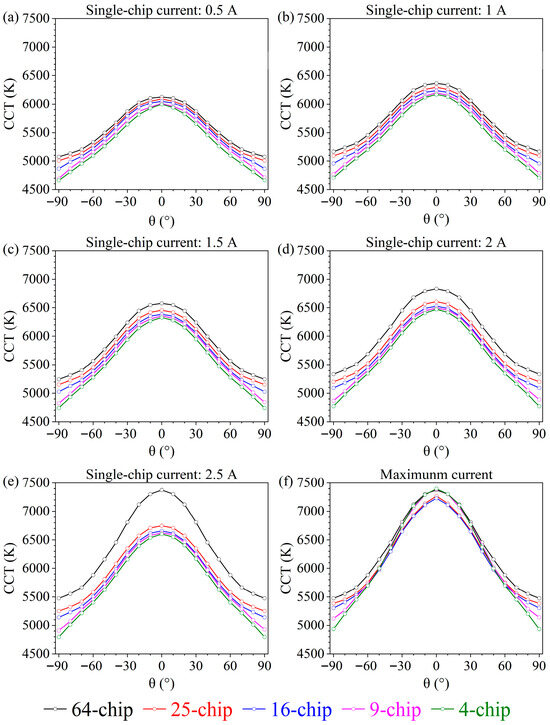
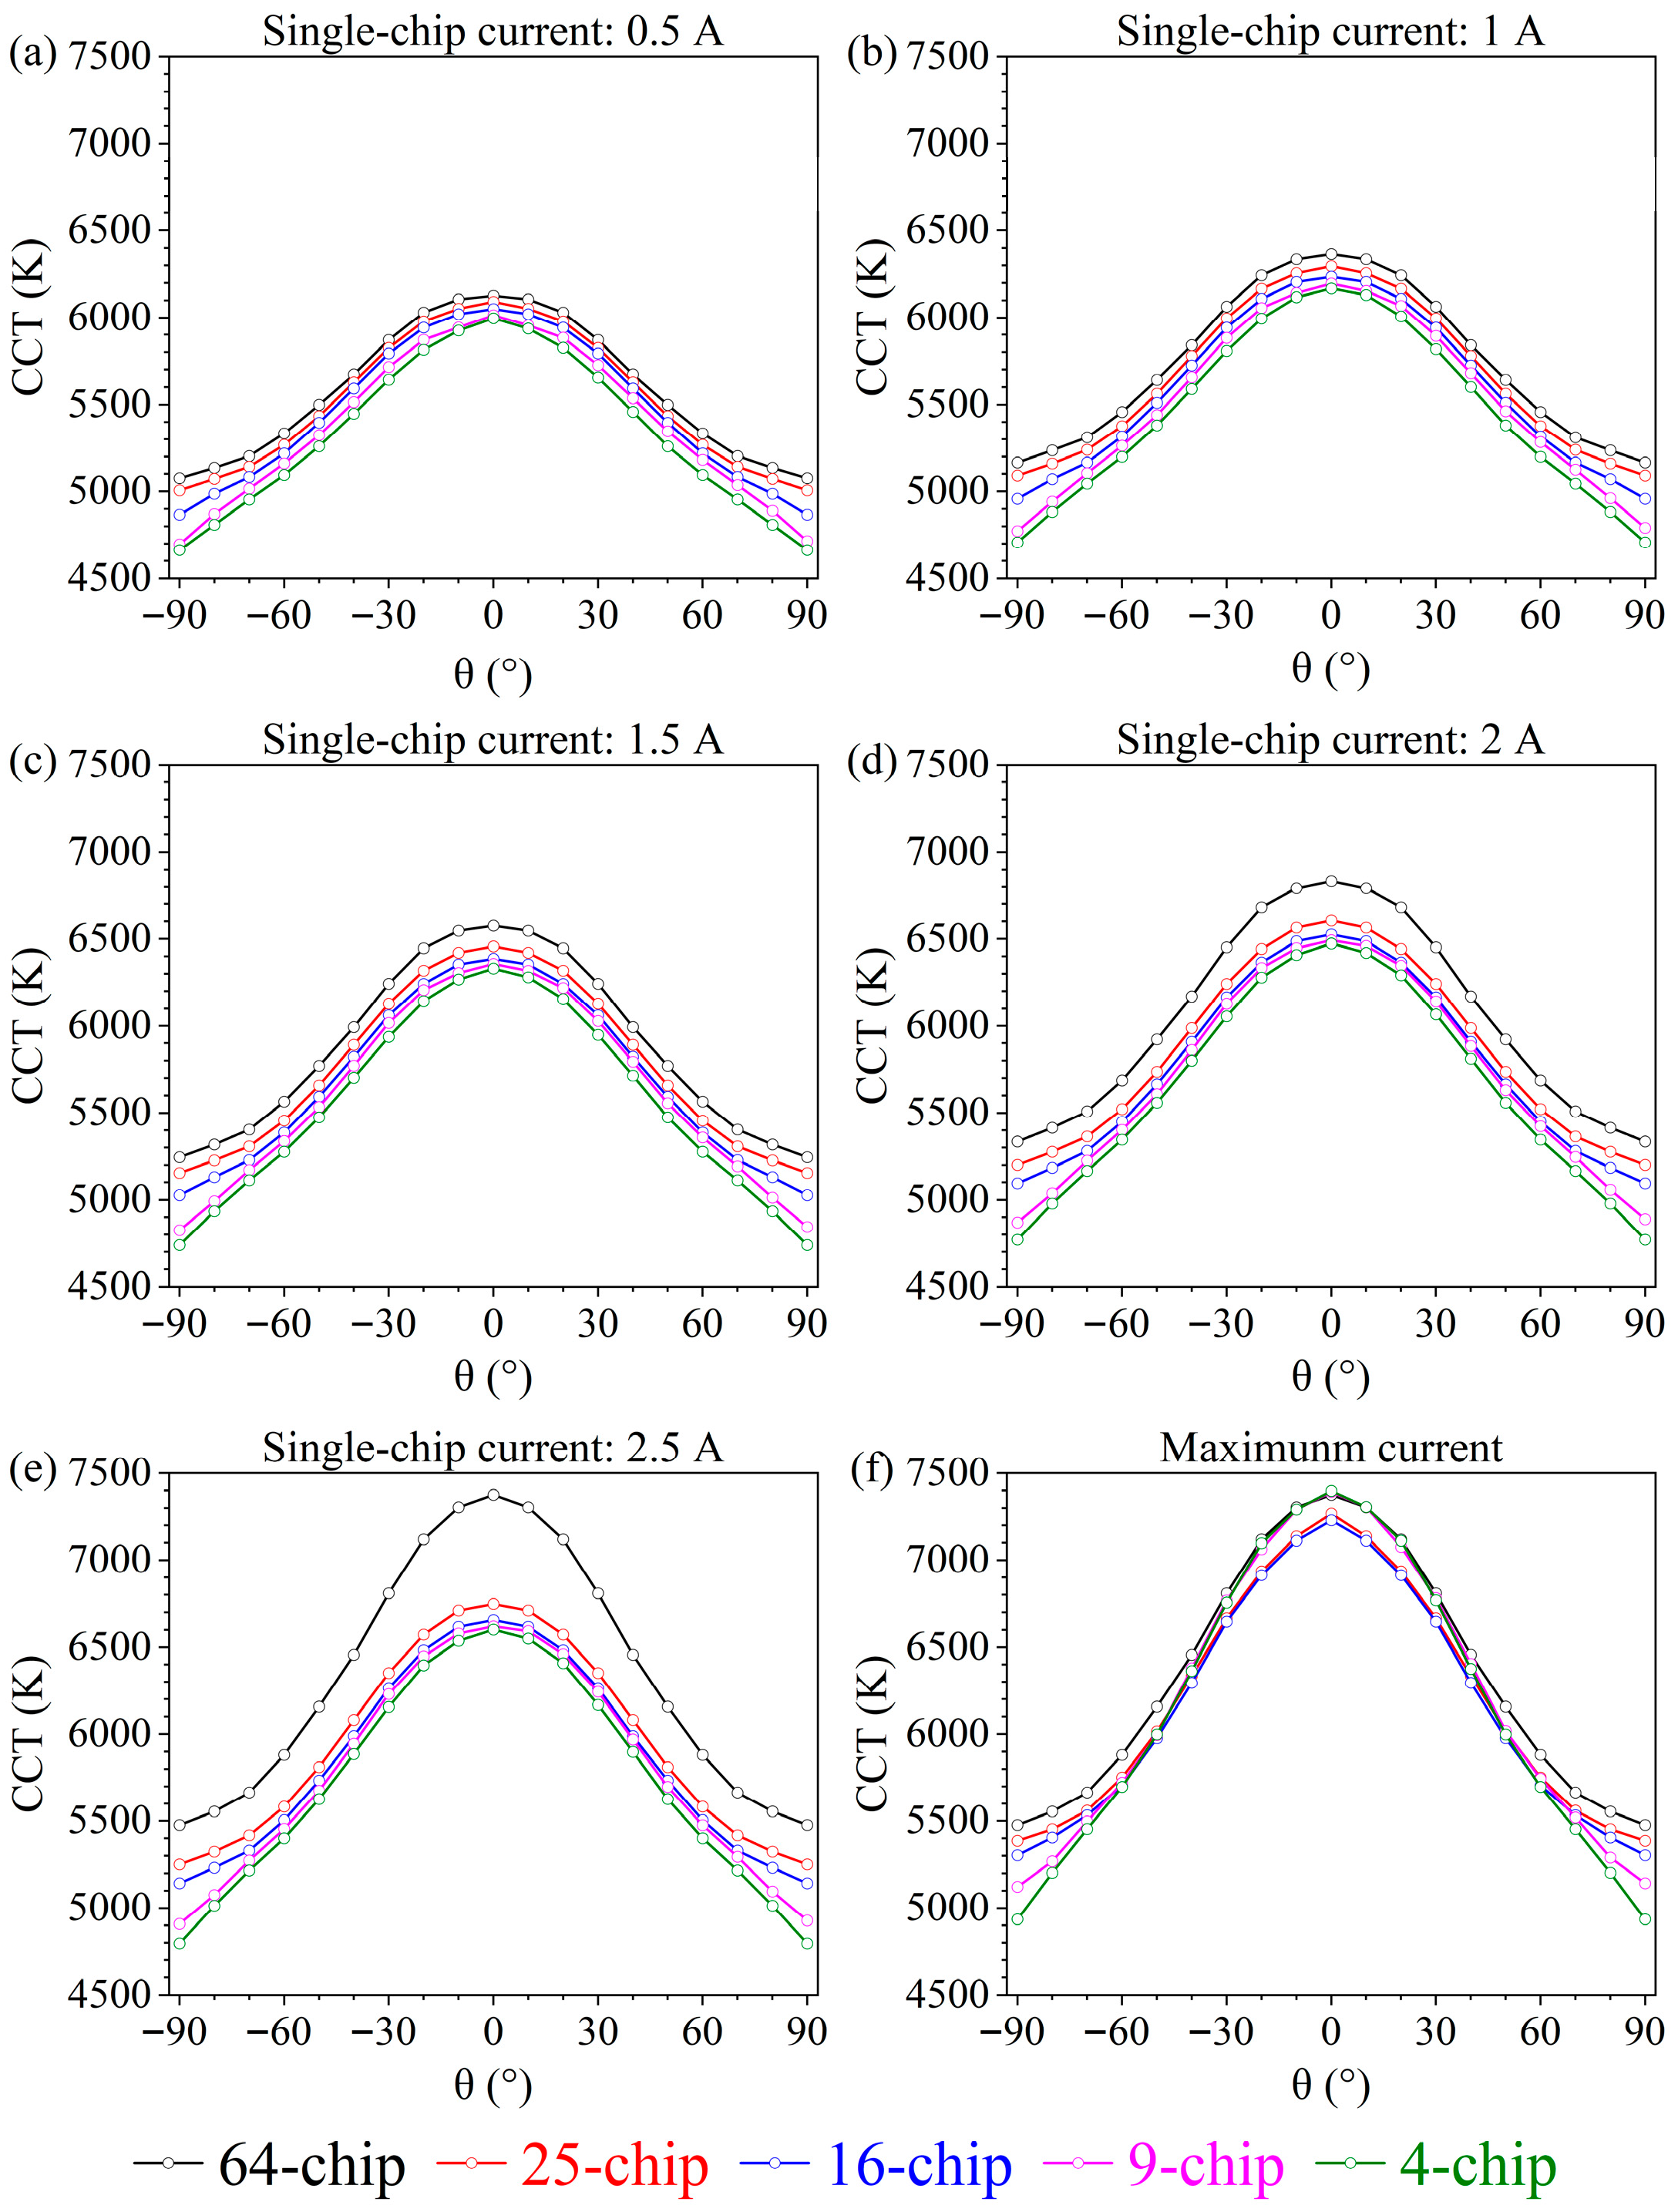
To investigate the variation in correlated color temperature with spatial angle in high-power-density LED devices and to examine the influence of chip number on the spatial CCT distribution, a comparative analysis of the spatial CCT characteristics of five LED devices with different chip numbers under different operating current conditions was carried out in this work, as shown in Figure 6. Figure 6a–e present the spatial CCT distributions of the five devices at single-chip currents of 0.5 A, 1 A, 1.5 A, 2 A, and 2.5 A, respectively, while Figure 6f shows the spatial CCT distribution characteristics of each device under optical saturation conditions.
Figure 6.
Variation in correlated color temperature (CCT) with spatial angle for LED devices with five different chip numbers at single-chip currents of (a) 0.5 A, (b) 1 A, (c) 1.5 A, (d) 2 A, and (e) 2.5 A and (f) under their respective optical saturation conditions.
As shown in Figure 6, (1) under different single-chip current conditions (0.5 A, 1 A, 1.5 A, 2 A, and 2.5 A and the saturation current of each device), the CCT of the five multi-chip devices exhibits the same variation trend with testing angle. For all devices, the CCT reaches its maximum in the normal direction (θ = 0°) and gradually decreases as the testing angle increases. The CCT measured at the same positive and negative angles is nearly identical, indicating that the devices exhibit good spatial symmetry of CCT distribution under different operating current conditions. (2) Although the CCT of all devices decreases with increasing testing angle, the overall decreasing magnitude differs among devices with different chip numbers. Devices with a larger number of chips exhibit a more gradual variation at large testing angles (70–90°). Overall, devices with a larger number of chips exhibit relatively smoother CCT variations, showing better uniformity in spatial CCT distribution. (3) As the current per chip gradually increases, the decreasing trend of CCT with testing angle becomes more pronounced for all devices, indicating that an increase in driving current aggravates the spatial nonuniformity of CCT.
Since the spatial CCT distribution of the devices exhibits good symmetry, the variation in CCT within the range of 0–90° is taken as an example to compare the CCT decrease (ΔCCT) of devices with different chip numbers, and the results are listed in Table 3.
Table 3.
Variation in correlated color temperature (ΔCCT) over the angular range of 0–90° for devices with five different chip counts.
It can be seen from Table 3 that, under the same current per chip, devices with fewer chips generally exhibit larger ΔCCT values. Among them, the four-chip device exhibits a relatively large CCT variation under most current conditions. In contrast, devices with a larger number of chips exhibit relatively smaller ΔCCT values overall, indicating that increasing the chip number can improve the spatial CCT uniformity of LED devices to some extent. Meanwhile, as the current per chip increases, the ΔCCT values of all devices show an overall increasing trend, indicating that higher driving current aggravates the nonuniformity of spatial CCT distribution.
Increased correlated color temperature with increasing input current is a common phenomenon in white LED devices. The light emission of white LED devices essentially results from the superposition and mixing of light emitted by two luminophores [18,19,20,21]. One is the blue light generated by the blue chip through electroluminescence, and the other is the yellow light emitted by the phosphor under blue light excitation [18,19,20,21]. When the relative proportion of blue light and yellow light remains stable, the correlated color temperature of the emitted white light remains unchanged. If the proportion of blue light emitted by the chip increases while the proportion of yellow light generated by the phosphor under blue-light excitation decreases, the correlated color temperature increases; conversely, the correlated color temperature decreases.
Under low driving current conditions, the emission intensities of both the blue chip and the phosphor increase with increasing current, and their variation proportions remain relatively small, resulting in a relatively stable CCT. However, as the driving current further increases, the blue-light excitation density experienced by the phosphor rises significantly, and its luminous efficiency gradually becomes limited. On the one hand, the increase in blue-light excitation density can lead to saturation or even a decrease in the photoluminescence efficiency of the phosphor. On the other hand, both the blue chip and the phosphor generate heat during the emission process, but their heat dissipation conditions differ significantly. The blue chip is directly connected to the aluminum nitride ceramic substrate, allowing its heat to be effectively conducted to the substrate and further dissipated. In contrast, the heat generated in the phosphor layer must first pass through the sapphire substrate with relatively low thermal conductivity before being conducted to the ceramic substrate, resulting in a significantly higher equivalent thermal resistance than that of the blue chip. The combined effects of these two factors lead to a more pronounced decrease in the luminous efficiency of the phosphor under high-current conditions.
Therefore, as the driving current of the device increases, although the absolute emission intensities of both blue and yellow light increase, the luminous efficiency of the phosphor gradually becomes limited, while the proportion of light emitted by the blue chip continues to increase. As a result, the proportion of blue light in the emitted light increases, leading to an increase in the correlated color temperature of the white LED device with increasing current.
When the devices operate under the same current per chip, devices with more chips have larger total operating current and higher total input power, resulting in a higher overall temperature of the chips and the phosphor layer above them. Since the heat dissipation condition of the phosphor layer is inferior to that of the blue chip, its luminous efficiency decreases more easily under high-temperature conditions. As a result, devices with more chips exhibit a higher proportion of blue light, leading to a higher correlated color temperature. As the driving current continues to increase, the overall temperature rise of the device and the blue-light excitation density further accumulate, causing the CCT of devices with more chips to increase more rapidly. In addition, from the perspective of spectral composition, devices with more chips contain a larger number of blue-emitting units. When the phosphor conversion efficiency becomes limited, the proportion of blue light in the emitted light increases, which further contributes to the higher CCT of these devices.
The symmetry of the spatial CCT distribution of each device mainly originates from the geometric symmetry of the device packaging structure. In the high-power-density LED devices studied in this work, the internal chip array is arranged in an N × N configuration (for example, the chip array of the 64-chip device is arranged in an 8 × 8 configuration), and the phosphor–silicone layer is uniformly coated above the chips. The device as a whole exhibits equivalent geometric and optical boundary conditions on both sides of the normal direction. Based on this structural configuration, the emitted light in any pair of identical positive and negative directions experiences highly consistent propagation paths, phosphor interactions, and reflection conditions. Therefore, the CCT measured at the same positive and negative angles is nearly identical, exhibiting symmetry in the spatial CCT distribution.
The decrease in spatial CCT with increasing testing angle observed in devices with different chip numbers is mainly determined by the combined effects of optical path differences in the phosphor–silicone layer and the internal temperature distribution within the device. From an optical perspective, in the normal direction, the blue light emitted by the chip passes through the phosphor layer nearly perpendicularly, resulting in the shortest effective propagation path within the phosphor. As a result, part of the blue light is not fully absorbed and converted, leading to a relatively high proportion of blue light in the emitted light; therefore, the CCT in the normal direction is the highest. As the testing angle increases, the propagation path of light in the phosphor–silicone layer increases significantly. The blue light undergoes more absorption and scattering processes within the phosphor, resulting in a higher proportion of conversion into longer-wavelength light. Consequently, the CCT of the device decreases with increasing emission angle.
In addition, the center-to-edge temperature gradient inside the device is also an important factor affecting the spatially correlated color temperature distribution. Due to the dense chip arrangement and pronounced thermal coupling in multi-chip devices, the operating temperature of chips in the central region is usually higher than that in the edge region, and this phenomenon becomes more pronounced as the driving current increases. The higher temperature in the central region further reduces the conversion efficiency of the phosphor above it, resulting in a relatively high proportion of blue light in the emitted light along the normal direction. In contrast, the chips in the edge region operate at relatively low temperatures, and the phosphor above them has a relatively high conversion efficiency; therefore, the emitted light at larger angles contains a higher proportion of yellow light.
In spatial angular measurements, the light collected in the normal direction mainly originates from the chips near the central region of the device and the corresponding phosphor region above them, whereas the emitted light at larger angles contains a greater contribution from the chips located near the edge of the device. Since the chips located in the edge regions operate at relatively lower temperatures, the phosphor above them exhibits higher conversion efficiency, resulting in a higher proportion of yellow light in the emitted light. Consequently, the CCT measured at larger angles is relatively lower. As the driving current increases, the temperature difference between the central and edge regions gradually enlarges, making the decrease in CCT with increasing angle more pronounced.
Therefore, this study suggests that the decrease in spatially correlated color temperature with increasing testing angle may result from the combined effect of phosphor optical-path differences and the nonuniform temperature distribution within the chip array, and that this phenomenon becomes more pronounced under high-current operating conditions.
The differences in the uniformity of spatial CCT distribution among devices with different chip numbers are mainly related to their temperature level and thermal distribution under different operating current conditions.
Under low driving current conditions, the overall thermal load of each device is relatively small, the temperature gradient within the chip array is slight, the junction temperature difference among chips in devices with different chip numbers is small, and the overall temperature uniformity remains relatively high. At this stage, the spatial CCT distribution of the devices is mainly influenced by the optical packaging structure and the differences in optical path within the phosphor layer, and the difference in the uniformity of spatial CCT distribution among different devices is not significant.
As the driving current gradually increases, owing to thermal coupling and differences in heat dissipation paths, the chips near the central region of the device are more prone to temperature rise, whereas the chips in the edge region remain relatively cooler, leading to a gradual increase in the internal temperature gradient of the device. This center-to-edge temperature gradient gradually becomes more pronounced as the current increases, and consequently affects the spatial CCT distribution.
When the driving current is further increased to high-current or optical saturation conditions, the temperature distribution characteristics of devices with different chip numbers become significantly different. For devices with fewer chips, the emitting area is limited, and heat tends to accumulate in the central region, which further enlarges the temperature gradient among chips. As a result, the spectral components collected from different spatial directions differ more markedly, leading to a noticeable decline in the uniformity of spatial CCT distribution. In contrast, although devices with more chips operate at a higher overall temperature level, their emitting area is larger, and the heat sources are distributed more diffusely in space. This allows thermal coupling and heat diffusion among chips to proceed more sufficiently, so that under high-current conditions, the temperature differences among chips are instead alleviated to some extent.
This characteristic, namely, a higher overall temperature but a relatively more uniform temperature distribution, causes devices with more chips to exhibit a more gradual variation in CCT with angle under high-current conditions. This explains why devices with different chip numbers exhibit significant differences in their spatial CCT distribution characteristics, and also indicates that an increase in operating current aggravates the nonuniformity of thermal distribution within the device, which in turn intensifies the nonuniformity of spatial CCT distribution.
3.4. Temperature Distribution Characteristics of LED Devices with Different Chip Numbers
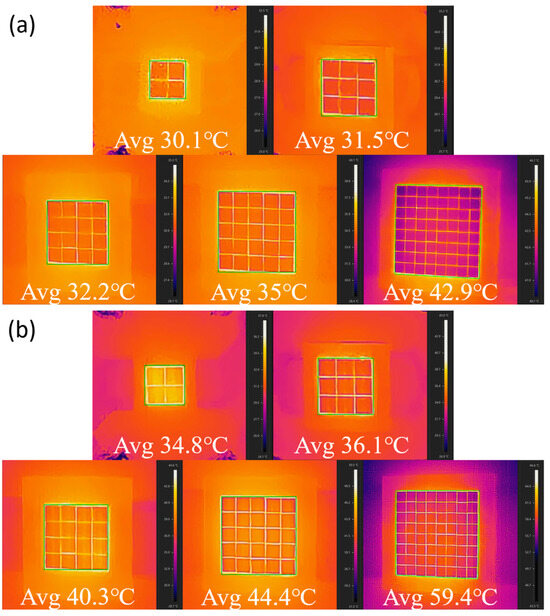
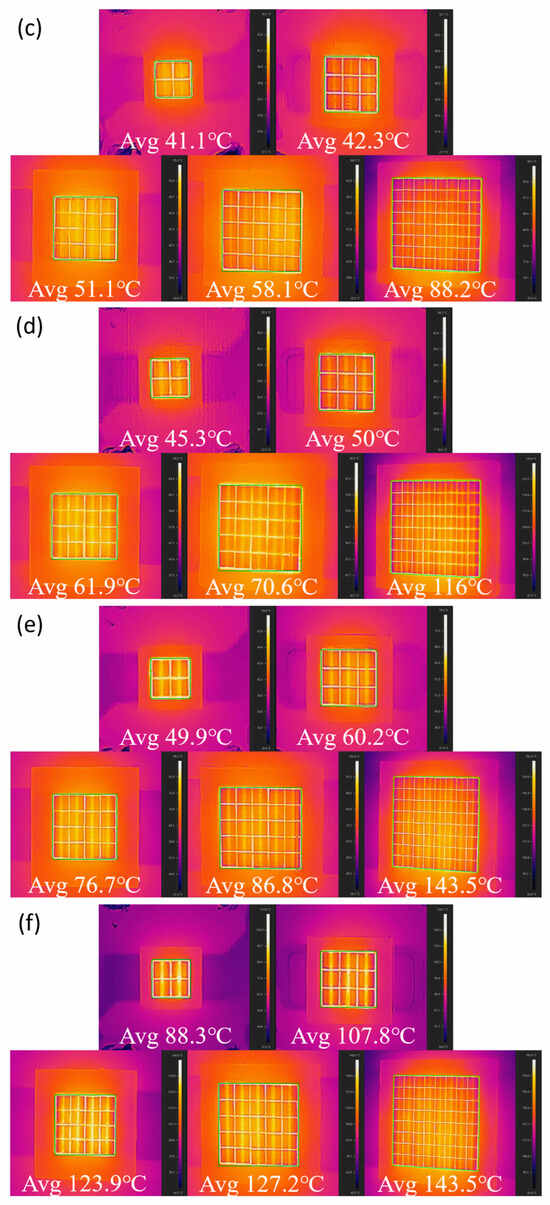
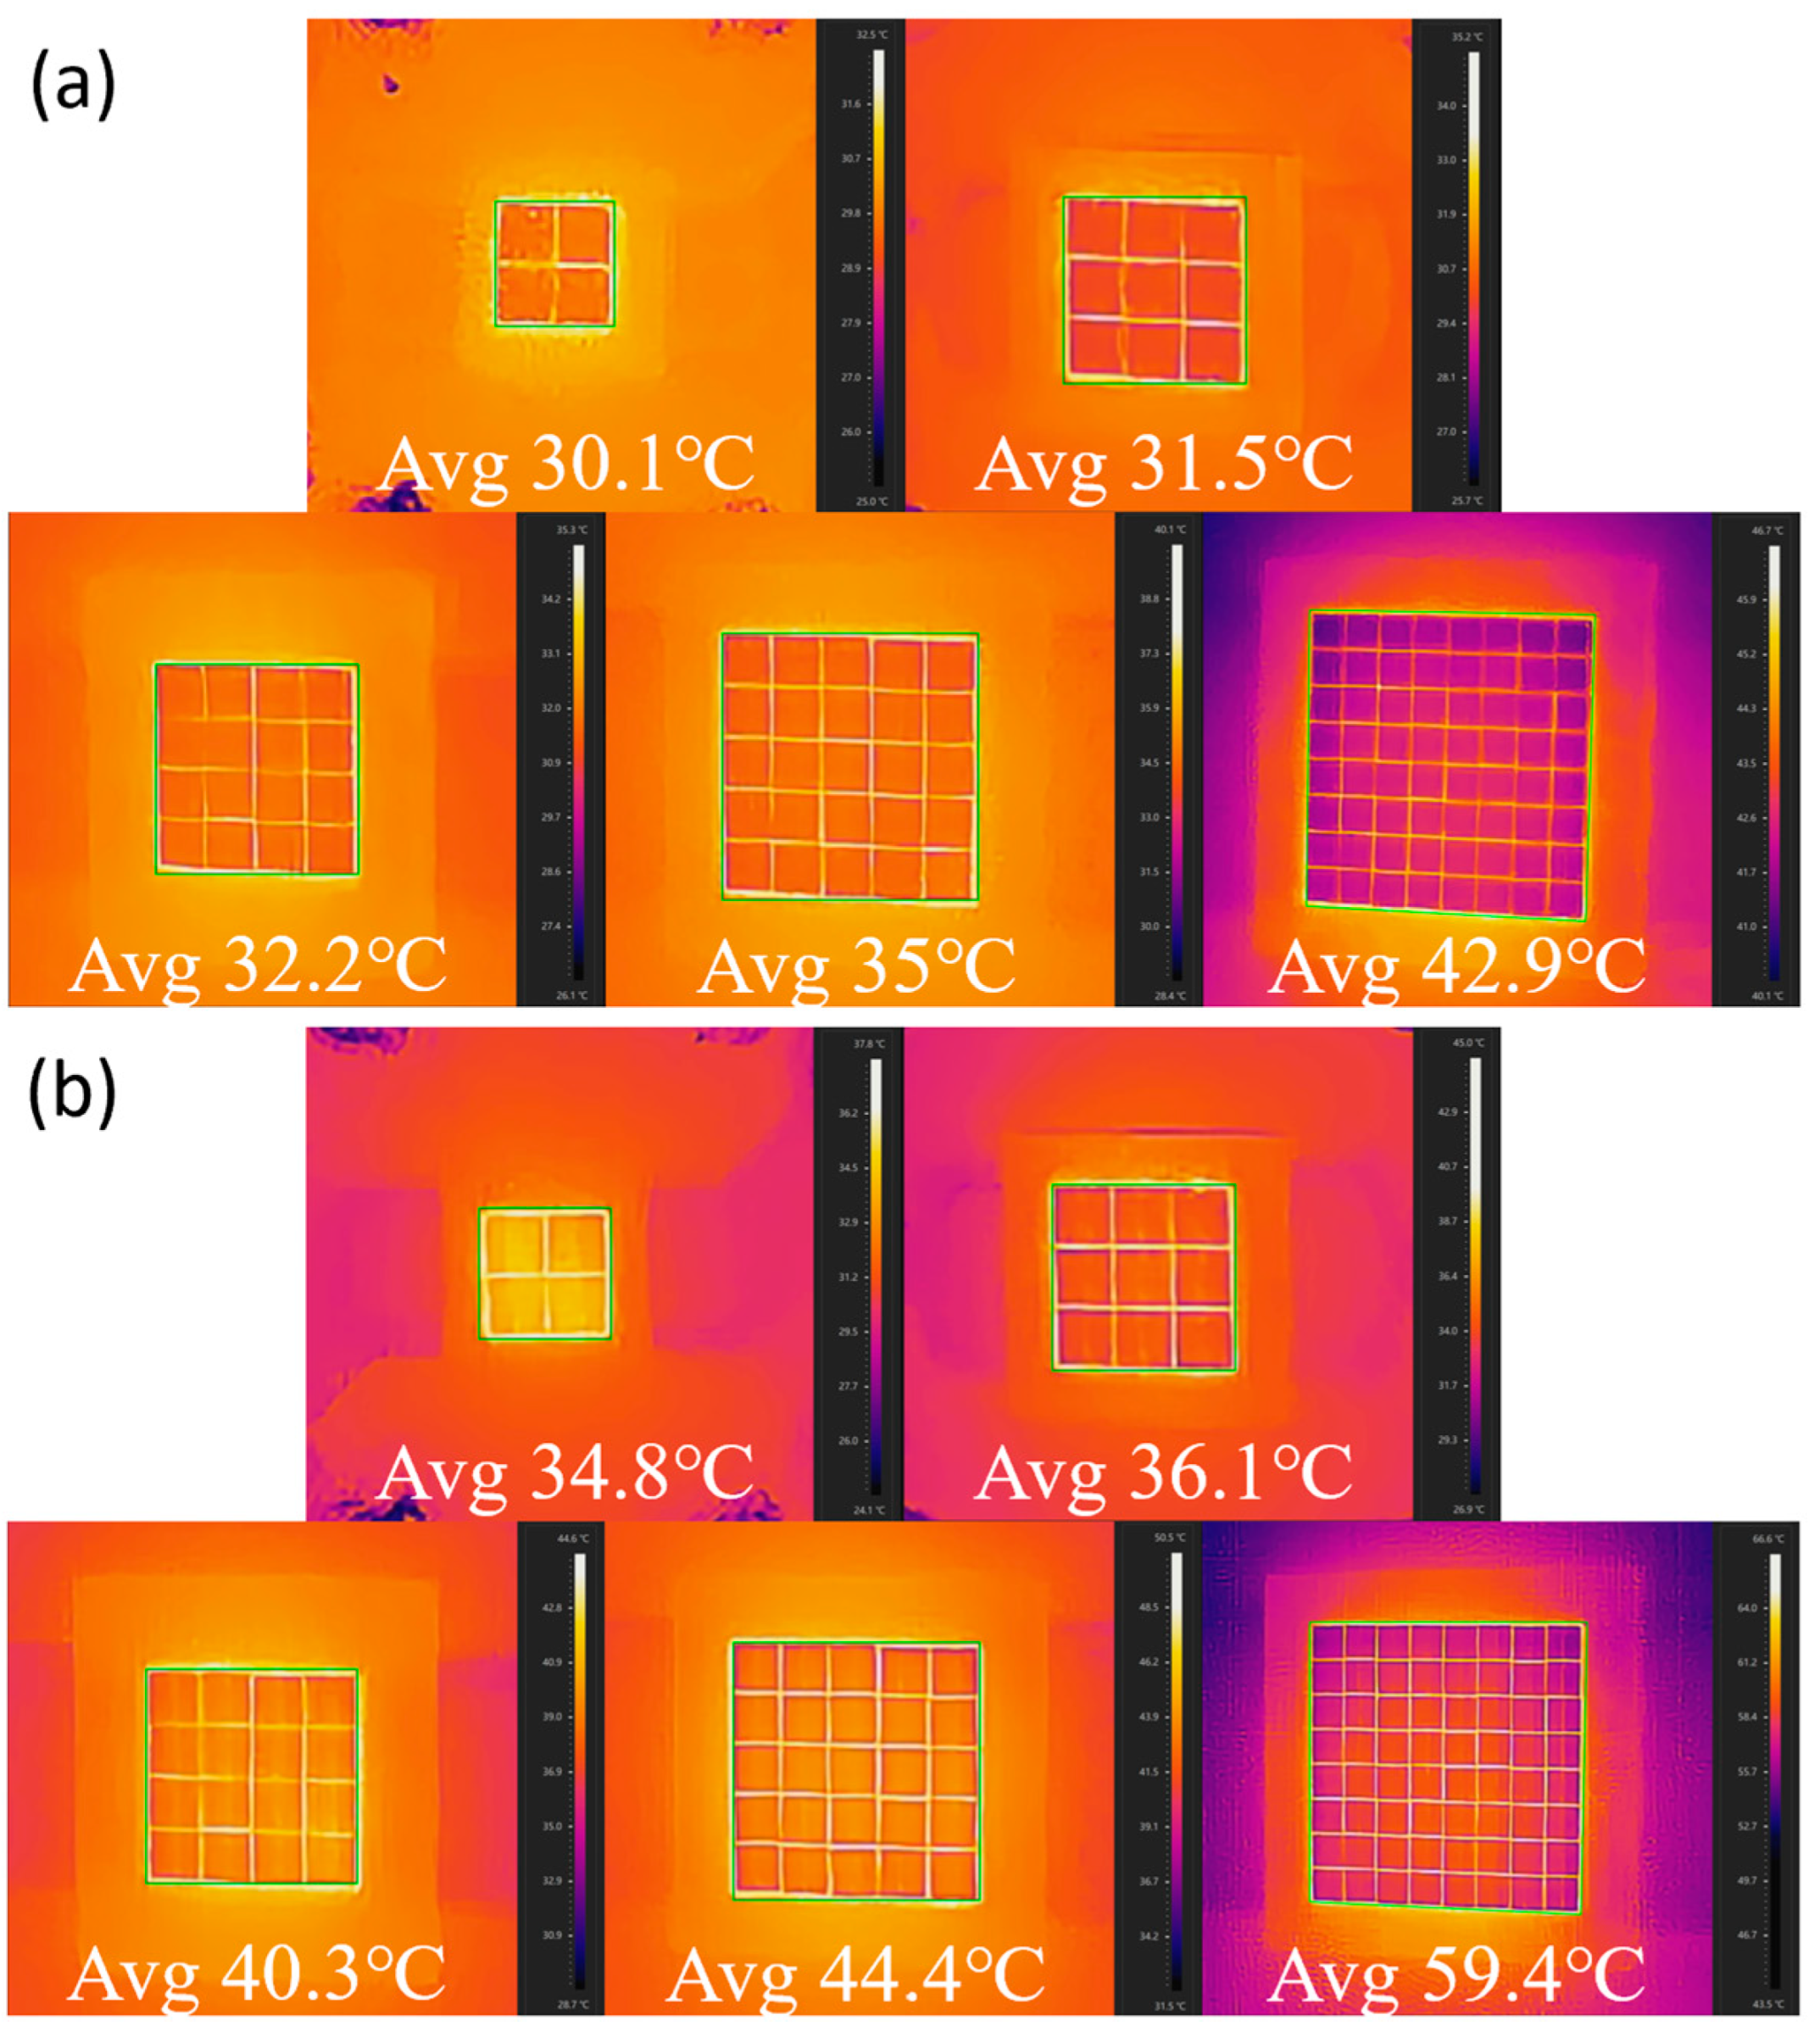
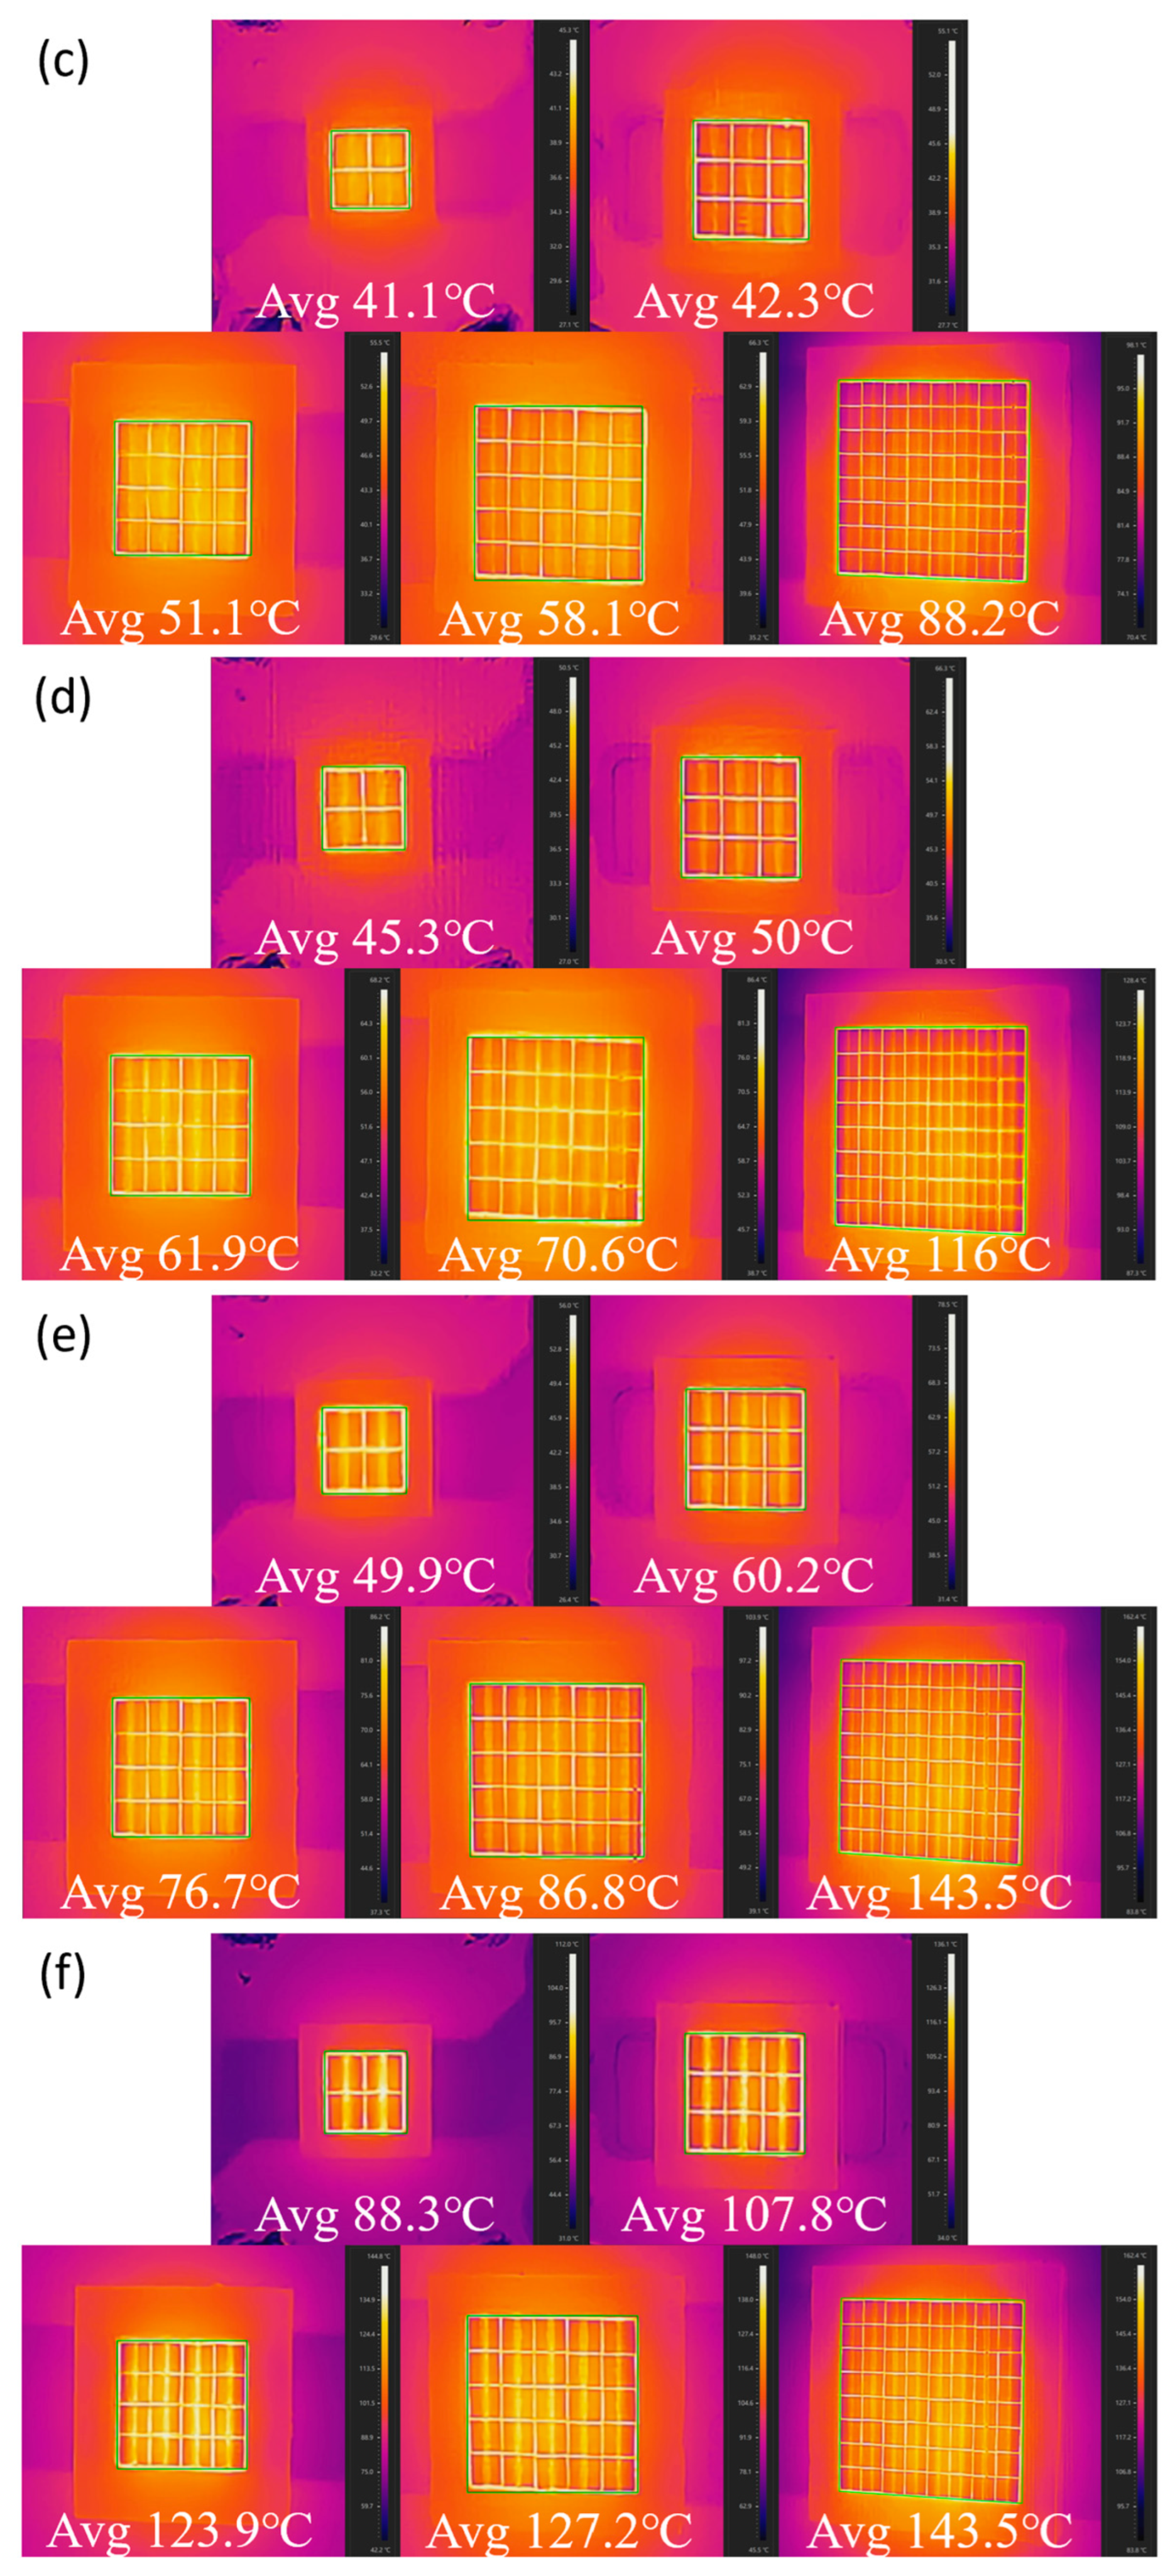
To further reveal the physical origin of the differences in optical characteristics among devices with different chip numbers, infrared thermal imaging was carried out on the blue-light devices after removal of the phosphor layer. The testing instrument used in the experiment was a HIKMICRO P20 Max infrared thermal imager, with an infrared resolution of 256 × 192 pixels, a thermal sensitivity of ≤50 mK, an operating spectral range of 8–14 µm, and a temperature measurement range of −20 °C to 550 °C. Figure 7 presents the thermal imaging results of blue-light devices with different chip numbers at single-chip currents of 0.5 A, 1 A, 1.5 A, 2 A, and 2.5 A, as well as the corresponding thermal images of the white-light devices under optical saturation conditions. The temperatures marked in the figure represent the average chip temperature.
Figure 7.
Infrared thermal images of blue LED devices with different chip numbers at single-chip currents of (a) 0.5 A, (b) 1 A, (c) 1.5 A, (d) 2 A, and (e) 2.5 A and (f) the corresponding white LED devices under optical saturation conditions.
Figure 7 shows that the average chip temperature of all devices increases significantly with increasing operating current. This result also confirms the phenomena observed in Figure 2 and Figure 5, namely that with increasing operating current, the light output of the devices gradually approaches saturation, while the correlated color temperature continues to rise. As the driving current increases, the thermal congestion effect within the device becomes progressively more severe, and the chip junction temperature continues to rise. This temperature rise directly affects the luminous efficiency and spectral composition, which is the reason why the device’s light output gradually approaches saturation while the correlated color temperature continues to increase.
A further comparison among devices with different chip numbers shows that, whether under the same current per chip or under the saturation current of each device, devices with more chips exhibit higher average chip temperatures. Moreover, as the operating current gradually increases, the differences in average chip temperature among devices with different chip numbers also progressively enlarge. Table 4 lists the average chip temperature differences (Avg. ΔT) of the 9-, 16-, 25-, and 64-chip blue-light devices relative to the 4-chip device under different operating current conditions. This result further confirms the phenomena observed in Figure 2 and Figure 5 above: (1) The relatively large differences in average chip temperature among different devices cause the saturation current and the corresponding saturated luminous intensity to deviate from a proportional relationship with chip number; moreover, the larger the chip number, the smaller the average current and luminous intensity per chip. (2) Under the same current per chip, devices with more chips exhibit higher correlated color temperatures, and their correlated color temperature increases more rapidly with increasing single-chip current.
Table 4.
Average chip temperature difference (Avg. ΔT) relative to the 4-chip device.
Meanwhile, the thermal imaging results show that the temperature distribution inside the LED device is not uniform but instead exhibits a pronounced center-to-edge temperature gradient, with the chips located in the central region having significantly higher temperatures than those near the edge. Moreover, this phenomenon becomes more pronounced as the driving current increases. This temperature distribution characteristic is consistent with the spatial CCT variation shown in Figure 6, namely that the correlated color temperature is higher in the normal direction and gradually decreases as the testing angle increases. This study suggests that this phenomenon is related to the fact that the higher temperature in the central region reduces the con-version efficiency of the phosphor above it, thereby resulting in a relatively higher proportion of blue light in the emitted light along the normal direction; in contrast, the edge region operates at a lower temperature, and the phosphor above it has a relatively high conversion efficiency, so the emitted light at larger angles contains a higher proportion of yellow light. This indicates that the increase in the center-to-edge temperature gradient within the device is likely one of the important thermal factors leading to the enhanced nonuniformity of the spatially correlated color temperature distribution.
In addition, a comparison of the thermal distribution characteristics of devices with different chip numbers shows that devices with more chips exhibit higher average chip temperatures, while the thermal field within the emitting region is more uniformly distributed, and the temperature transition from the center to the edge is relatively smoother. Especially under high-current and optical saturation conditions, devices with fewer chips, such as the four-chip and nine-chip devices, are more likely to exhibit higher temperatures in the central region. In contrast, devices with more chips, such as the 25-chip and 64-chip devices, exhibit a more uniform temperature distribution. This result is consistent with the trend reflected in Figure 6, namely that devices with more chips exhibit a more gradual variation in correlated color temperature at large testing angles (70–90°), and that increasing the chip number can, to some extent, improve the nonuniformity of the spatially correlated color temperature distribution.
4. Conclusions
In this study, five high-power-density LED devices with different chip numbers (4, 9, 16, 25, and 64 chips) were fabricated. The effects of chip number on the light output capability, spatial light distribution characteristics, and spatially correlated color temperature distribution characteristics of high-power-density LED devices were systematically investigated, and the temperature distribution characteristics of the internal chips were further analyzed in combination with infrared thermal imaging results. The main results are as follows: (1) As the chip number increases, both the total saturation current and the total saturated luminous intensity of the device increase significantly, but neither of them is strictly proportional to the chip number. Under the same current per chip, devices with fewer chips exhibit higher average light output capability per chip. (2) Under optical saturation conditions, all five devices exhibit near-Lambertian spatial light distribution characteristics, and the measured light-distribution curves agree well with the fitting results. The results indicate that the chip number mainly affects the absolute intensity level of light output, but does not significantly alter the inherent spatial light-emission pattern of the device. (3) The correlated color temperature of all devices increases with increasing current per chip. Under the same current per chip, devices with more chips exhibit higher correlated color temperatures and a faster increasing trend, indicating that the stronger thermal effects under multi-chip integration further influence the optical color characteristics of the device. (4) For all devices, the spatially correlated color temperature reaches its maximum in the normal direction and gradually decreases with increasing testing angle, while exhibiting good spatial symmetry. This study suggests that this phenomenon is related to the combined effect of phosphor optical-path differences and the center-to-edge temperature gradient within the chip array. (5) Although devices with more chips exhibit a higher overall average temperature, their temperature distribution is relatively more uniform due to the enlarged emitting area and the more dispersed distribution of heat sources, which improves the spatially correlated color temperature uniformity to some extent.
Overall, increasing the number of chips is an effective way to enhance the total light output capability of high-power-density LED devices, but it should not be simply regarded as the only means of optimizing device performance. In practical design, the number of integrated chips should be considered in coordination with the packaging structure, heat dissipation capability, spatial light-distribution stability, and spatially correlated color temperature uniformity. For application scenarios where high-brightness output is the primary objective, increasing the number of chips helps improve the total light output of the device; however, for applications that simultaneously require high spatially correlated color temperature uniformity and stability, a comprehensive trade-off between chip integration density and thermal management design is necessary. The results of this study can provide a useful reference for the structural design and opto-thermal optimization of high-power-density LED devices in fields such as industrial lighting, special light sources, and high-brightness integrated light sources.
Author Contributions
X.Y. conceived the initial idea, collected the data, and authored the manuscript; C.X. contributed to designing the research and edited the manuscript; X.L., Y.T., and H.Y. assisted with manuscript writing and analysis of specific experimental findings; Y.M., B.L., and J.D. refined the experimental concept and oversaw the project. All authors have read and agreed to the published version of the manuscript.
Funding
This research was financially supported by the Key Technologies Innovation and Industrialization Projects of Fujian Province (Grant No. 2023QX007), the Industry-University-Research Cooperation Project of Fujian Science and Technology Department (Grant No. 2023H6018), and the Natural Science Foundation of Fujian Province (Grant No. 2022J01917).
Institutional Review Board Statement
Not applicable.
Informed Consent Statement
Not applicable.
Data Availability Statement
The data are contained within the article.
Conflicts of Interest
The authors declare no conflicts of interest.
Abbreviations
The following abbreviations are used in this manuscript:
| LED | Light-Emitting Diode |
| CCT | Correlated Color Temperature |
| YAG | Yttrium Aluminum Garnet |
| AlN | Aluminum Nitride |
References
- Cho, J.; Park, J.H.; Kim, J.K.; Schubert, E.F. White light-emitting diodes: History, progress, and future. Laser Photonics Rev. 2017, 11, 1600147. [Google Scholar] [CrossRef] [Scilit]
- Luo, X.; Hu, R.; Liu, S.; Wang, K. Heat and fluid flow in high-power LED packaging and applications. Prog. Energy Combust. Sci. 2016, 56, 1–32. [Google Scholar] [CrossRef] [Scilit]
- Li, Z.; Tan, J.; Li, J.; Ding, X.; Tang, Y. A review on thermal management of light-emitting diodes: From package-level to system-level. Appl. Therm. Eng. 2024, 257, 124145. [Google Scholar] [CrossRef] [Scilit]
- Alim, M.A.; Abdullah, M.Z.; Abdul Aziz, M.S.; Kamarudin, R. Die attachment, wire bonding, and encapsulation process in LED packaging: A review. Sens. Actuators A Phys. 2021, 329, 112817. [Google Scholar] [CrossRef] [Scilit]
- Jayaprakash, R.; Georgiou, K.; Coulthard, H.; Askitopoulos, A.; Rajendran, S.K.; Coles, D.M.; Musser, A.J.; Clark, J.; Samuel, I.D.W.; Turnbull, G.A.; et al. A hybrid organic–inorganic polariton LED. Light Sci. Appl. 2019, 8, 81. [Google Scholar] [CrossRef] [Scilit]
- Rozenman, G.G.; Peisakhov, A.; Zadok, N. Dispersion of organic exciton polaritons—A novel undergraduate experiment. Eur. J. Phys. 2022, 43, 035301. [Google Scholar] [CrossRef] [Scilit]
- Ma, Y.; Xiong, C.; Li, X.; Tang, Y.; Yuan, H.; Yang, X.; Luo, B.; Di, J. Study on the luminous performance of the same LED chip packaged into different specifications of high-power-density devices. Opt. Express 2026, 34, 12211–12224. [Google Scholar] [CrossRef] [Scilit]
- Ma, Y.; Xiong, C.; Li, X.; Tang, Y.; Yuan, H.; Yang, X.; Luo, B.; Di, J. Research on the optoelectronic and thermal characteristics of high-power-density LEDs. Photonics 2026, 13, 58. [Google Scholar] [CrossRef] [Scilit]
- Huang, L.F.; Xiong, C.B.; Tang, Y.W.; Yuan, H.; Ma, Y.H.; Yang, X.Y. Influence of copper substrate area, solder and copper foil thickness on maximum output light intensity and voltage of high power density LEDs. Chin. J. Lumin. 2024, 45, 1196–1210. [Google Scholar] [CrossRef] [Scilit]
- Liu, Q.; Xiong, C.B.; Tang, Y.W.; Li, X.Z.; Wang, S.L. Influence of multi-core CSP-LED chip spacing on thermal congestion. Chin. J. Lumin. 2020, 41, 308–315. [Google Scholar] [CrossRef] [Scilit]
- Wang, S.L.; Xiong, C.B.; Tang, Y.W.; Li, X.Z.; Liu, Q. Effect of number and location of eutectic chips on luminescent properties of ceramic eutectic packaged LEDs. Chin. J. Lumin. 2020, 41, 1421–1430. [Google Scholar] [CrossRef] [Scilit]
- Li, X.Z.; Xiong, C.B.; Tang, Y.W.; Hao, D.H. Uniformity of light emission in micro-area on mesa of high-power flip-chip LED devices with ceramic packaging. Chin. J. Lumin. 2021, 42, 1436–1445. [Google Scholar] [CrossRef] [Scilit]
- Wang, K.; Wu, D.; Chen, F.; Liu, Z.; Luo, X.; Liu, S. Angular color uniformity enhancement of white light-emitting diodes integrated with freeform lenses. Opt. Lett. 2010, 35, 1860–1862. [Google Scholar] [CrossRef] [Scilit]
- Moreno, I.; Sun, C.C. Modeling the radiation pattern of LEDs. Opt. Express 2008, 16, 1808–1819. [Google Scholar] [CrossRef] [Scilit]
- Wang, W.; Zou, J.; Zheng, Q.; Li, Y.; Yang, B.; Shi, M.; Li, Y.; Li, X.; Zhang, C.; Li, C.; et al. The effect of different filament arrangements on thermal and optical performances of LED bulbs. Appl. Sci. 2020, 10, 1373. [Google Scholar] [CrossRef] [Scilit]
- Zhang, D.; Chen, J.; Cai, A.; Yu, C. Effect of the correlated color temperature of a phosphor-converted LED on indoor visible light communication. Opt. Express 2024, 32, 21459–21472. [Google Scholar] [CrossRef] [Scilit]
- Hariyani, S.; Brgoch, J. Spectral Design of Phosphor-Converted LED Lighting Guided by Color Theory. Inorg. Chem. 2022, 61, 4205–4218. [Google Scholar] [CrossRef] [Scilit]
- Fang, M.H.; Bao, Z.; Huang, W.T.; Liu, R.S. Evolutionary generation of phosphor materials and their progress in future applications for light-emitting diodes. Chem. Rev. 2022, 122, 11474–11513. [Google Scholar] [CrossRef] [Scilit]
- Li, C.; Tang, F.; Xiao, Y.; Zhou, Y.; Zhao, B.; Lv, S. High brightness and vibronic luminescent behavior of YAG: Mn4+/Ca2+ red phosphor for preparing phosphor-in-glass in white LED. J. Mater. Chem. C 2023, 11, 14413–14420. [Google Scholar] [CrossRef] [Scilit]
- Bispo-Jr, A.G.; Saraiva, L.F.; Lima, S.A.M.; Pires, A.M.; Davolos, M.R. Recent prospects on phosphor-converted LEDs for lighting, displays, phototherapy, and indoor farming. J. Lumin. 2021, 237, 118167. [Google Scholar] [CrossRef] [Scilit]
- Panigrahi, K.; Nag, A. Challenges and Strategies to Design Phosphors for Future White Light Emitting Diodes. J. Phys. Chem. C 2022, 126, 6235–6250. [Google Scholar] [CrossRef] [Scilit]

Disclaimer/Publisher’s Note: The statements, opinions and data contained in all publications are solely those of the individual author(s) and contributor(s) and not of MDPI and/or the editor(s). MDPI and/or the editor(s) disclaim responsibility for any injury to people or property resulting from any ideas, methods, instructions or products referred to in the content. |
© 2026 by the authors. Licensee MDPI, Basel, Switzerland. This article is an open access article distributed under the terms and conditions of the Creative Commons Attribution (CC BY) license.