


Abstract
Thin-film lithium niobate electro-optic modulators exhibit outstanding advantages such as large bandwidth, low insertion loss, and low half-wave voltage, demonstrating broad application prospects. However, due to internal defects in lithium niobate crystals, modulators exhibit electro-optic relaxation phenomena, with the relaxation time of thin-film structures being reduced by more than two orders of magnitude compared to bulk materials. In this study, we fitted and simulated the electro-optic relaxation behavior of thin-film lithium niobate modulators based on RC circuit model, effectively explaining their time-domain response characteristics under low-frequency conditions. By comparing thin-film modulators with and without silica cladding structures, the fitting results indicate that the relaxation time of modulators with cladding is approximately 11.9 ms, showing positive DC drift, whereas the relaxation time of modulators without cladding is significantly shortened to about 88.6 μs and exhibits negative DC drift. Additionally, the enhancement of optical intensity alters the photoconductivity of the material, thereby affecting its low-frequency electro-optic response behavior. This research provides important ideas for the design and optimization of next-generation integrated lithium niobate photonic modulators with high stability and controllability.
1. Introduction
Lithium niobate crystal is a multifunctional material with excellent performance, which integrates electro-optic, pyroelectric, thermo-optic, piezoelectric and nonlinear optical effects. It is widely used in the fields of optical communication, information processing and quantum technology [1,2]. In recent years, thin-film electro-optic modulators based on the lithium niobate-on-insulator platform have advanced rapidly, demonstrating significant potential to surpass bulk modulators in key metrics like low insertion loss, low half-wave voltage, and high bandwidth [3]. Research has achieved breakthroughs, including electro-optic bandwidth exceeding 110 GHz [4], half-wave voltage below 1 V [5], and insertion loss under 0.2 dB [6]. These milestones, particularly the low-voltage driving compatibility with CMOS processes [1] and ultra-high bandwidth-voltage product enabled by micro-structured electrodes design [7], provide critical components for next-generation data center optical interconnects, high-speed coherent communication, and photonic computing systems [8,9].
However, the practical application of lithium niobate thin-film modulators remains constrained by the electro-optic relaxation effect induced by intrinsic crystal defects, which manifests directly as a dynamic drift of the operating bias point. This phenomenon is physically consistent with the long-standing DC drift issue observed in bulk materials [10,11,12,13,14,15]. In traditional bulk lithium niobate modulators, the relaxation time constant can range from minutes to years. Due to the long relaxation time, bulk lithium niobate modulators exhibit normal responses when driven by low-frequency signals (1 Hz–1 MHz) and can control the bias point through the electro-optic effect. In contrast, the relaxation process in thin-film lithium niobate is significantly accelerated, leading to rapid bias drift and abnormal frequency responses in the DC or sub-MHz frequency range [16]. Although the control scheme based on thermo-optic effect can achieve bias point stability [17,18], it often introduces thermal crosstalk, increases static power consumption, and limits modulation bandwidth. Various methods to mitigate electro-optic relaxation in thin-film lithium niobate have been reported, including argon ion bombardment pretreatment [19], operation at liquid nitrogen temperatures [20], control of LN-metal interfaces, and annealing [21]. However, most studies focus on experimental observations without adequately explaining the electro-optic relaxation phenomenon. Although frequency-domain analysis of thin-film lithium niobate’s electro-optic relaxation has been conducted using finite element methods and simple material models [21], it struggles to accurately extract the relaxation time constant and lacks the ability to intuitively present the dynamic response process of electro-optic relaxation. Most importantly, it fails to explain the output waveform distortion of thin-film lithium niobate modulators under low-frequency driving signals. In comparison, electro-optic relaxation in bulk lithium niobate modulators has been extensively studied, and the RC circuit model effectively explains the electro-optic relaxation phenomenon in bulk lithium niobate [10,11,12,13,14,15]. Additionally, the photorefractive effect of lithium niobate also stems from the photoexcitation and redistribution of charge carriers by defects, leading to an increase in mobile charges [22]. Therefore, the change in light intensity will also affect the low-frequency response of lithium niobate thin films [23].
This paper employs an RC circuit model to conduct time-domain fitting and simulation of the electro-optic relaxation phenomenon in lithium niobate thin-film modulators, systematically explaining their dynamic responses within the low-frequency range of 10 Hz–100 kHz. By comparing measurement data of modulators with and without silica cladding, the study reveals that modulators with cladding exhibit a relaxation time of approximately 11.9 ms, showing positive DC drift and large drift. In contrast, modulators without cladding demonstrate a reduced relaxation time of about 88.6 μs with negative DC drift and small drift. Furthermore, the paper explores how light intensity influences low-frequency responses through photoconductivity modulation, uncovering the impact of light-electric synergy on device stability. This research provides novel insights into the fundamental mechanisms of electro-optic relaxation in lithium niobate thin films and offers guidance for designing highly stable integrated electro-optic modulators.
2. Materials and Methods
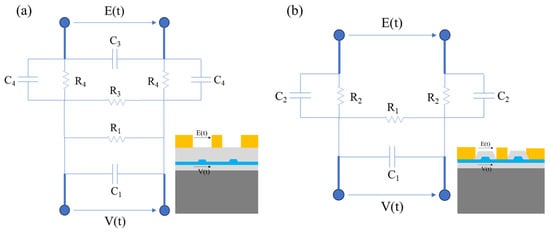
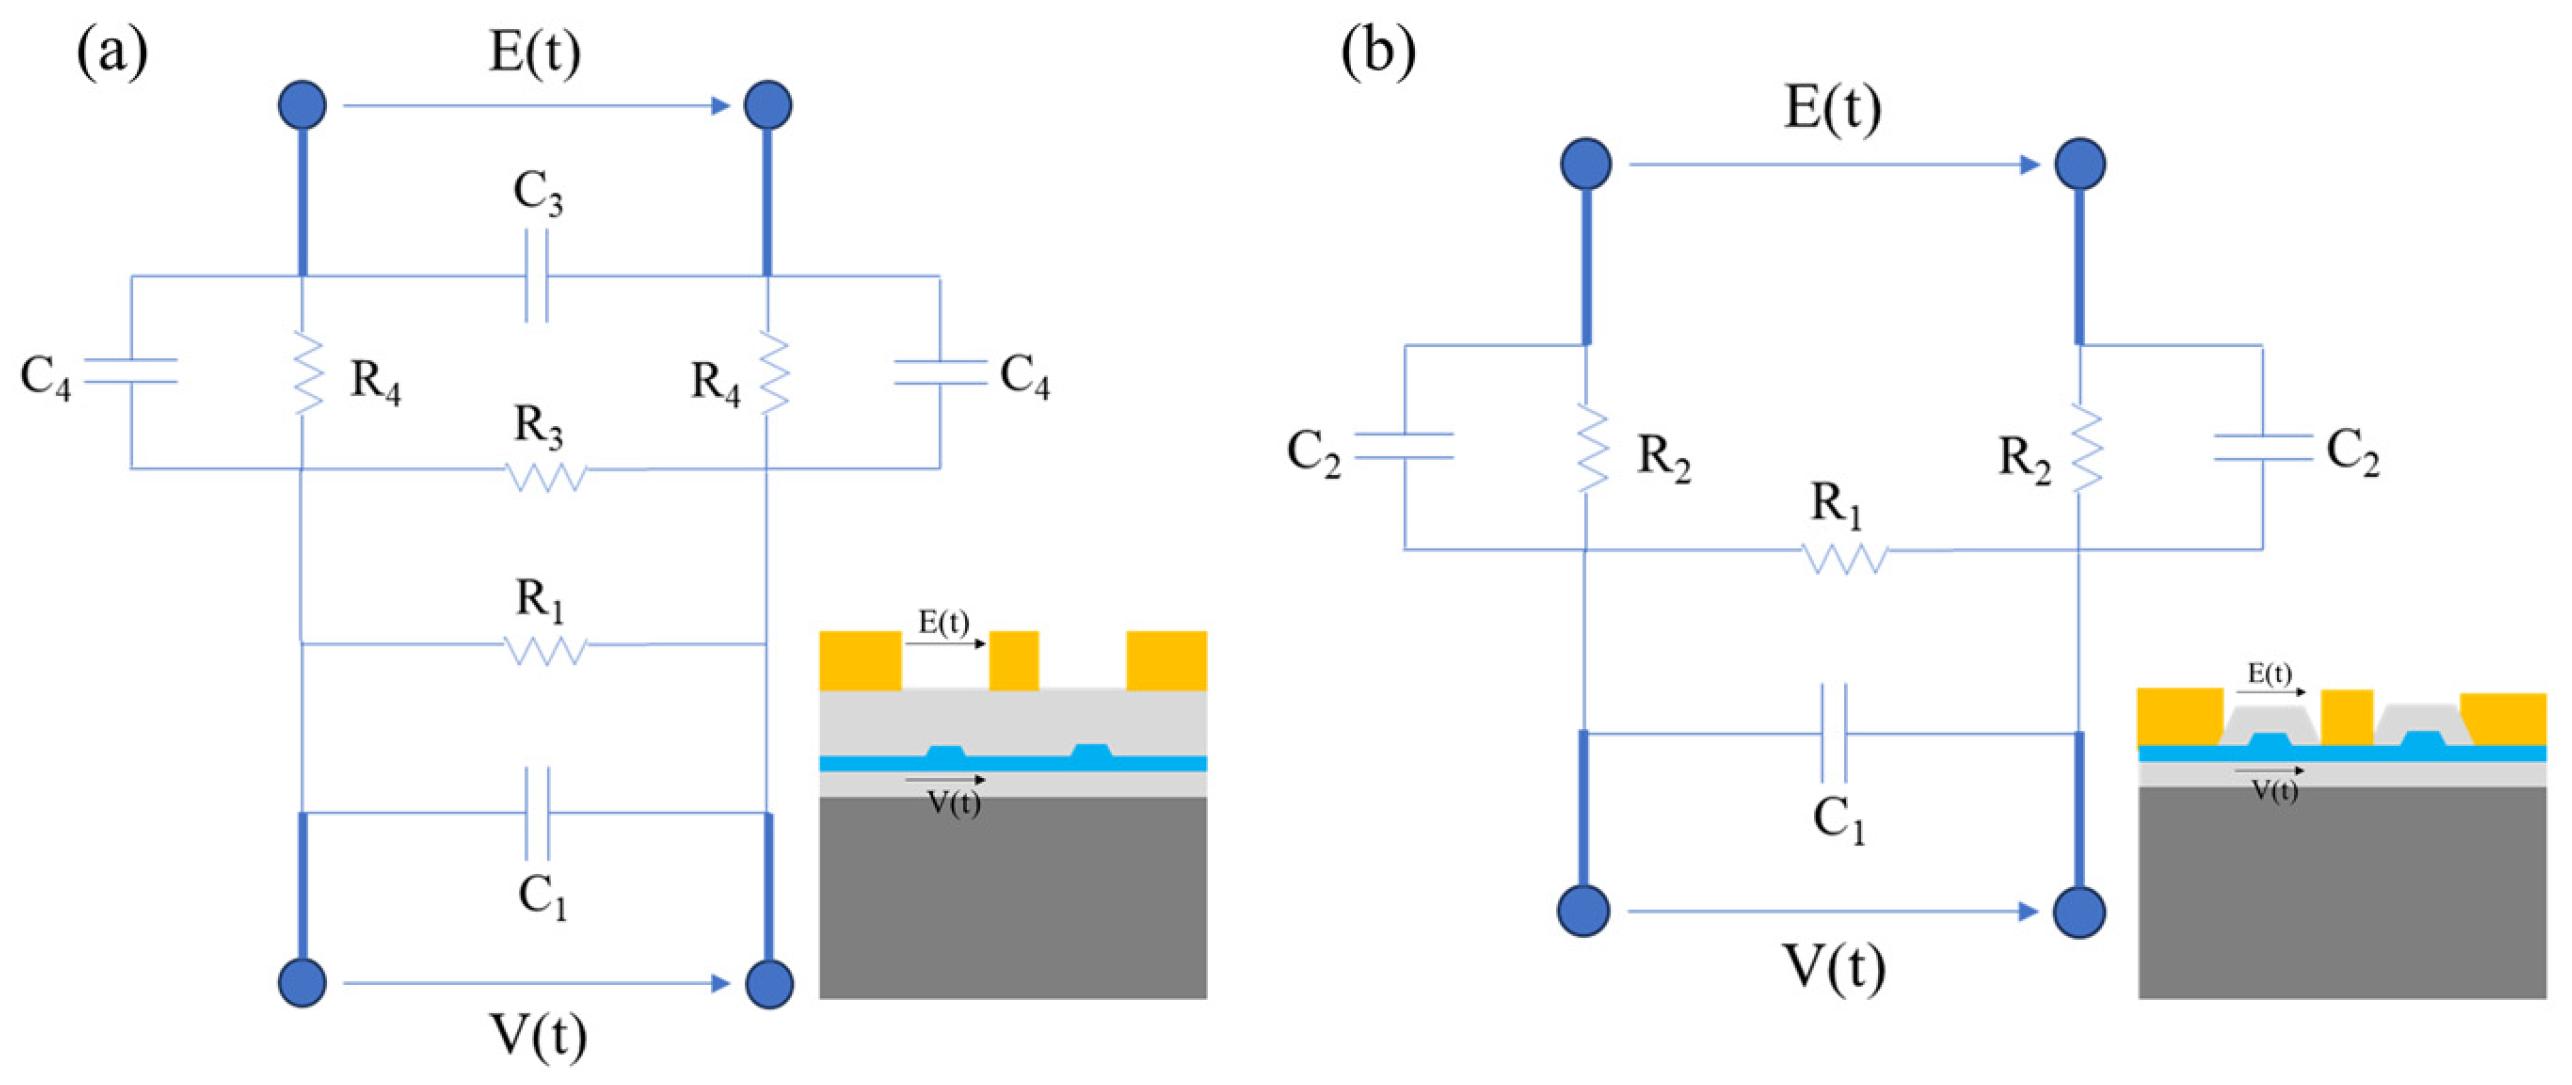
The electro-optic relaxation phenomenon and photorefractive effect of lithium niobate are essentially due to the charge transport and redistribution process caused by defects inside the crystal [24]. When studying the short-term DC drift phenomenon of modulators, Syoji Yamada and Makoto Minakata first proposed a classic RC equivalent circuit model in 1981 [10], which mainly targets bulk lithium niobate modulator structures with silicon dioxide buffer layers. Subsequently, Becker proposed a similar model in 1985 to describe modulators without silicon dioxide buffer layers [11]. The RC circuit model is shown in Figure 1, where E(t) represents the external voltage applied to the metal electrode, and V(t) represents the actual effective voltage acting on both ends of the optical waveguide region. In the model, R3 (C3) and R4 (C4) respectively represent the transverse and longitudinal resistance (capacitance) of the buffer layer, while R1 (C1) and R2 (C2) represent the transverse and longitudinal resistance (capacitance) of the optical waveguide region. Each RC parallel unit essentially corresponds to the physical ability of different functional regions in the modulator to store charges, conduct currents, and inject/extract charges.
Figure 1.
(a) RC circuit model with silicon dioxide buffer layer (b) RC circuit model without silicon dioxide buffer layer.
When the modulator incorporates a silicon dioxide buffer layer and the input is a step signal (i.e., E(t) = E0), according to the RC circuit model, the actual voltage applied to the optical waveguide can be expressed as:
When the input signal is a square wave with a period of T, the expression for the steady-state solution of the voltage applied to the optical waveguide in the positive half-cycle of the signal can be written as:
where
For the model without a silicon dioxide buffer layer, when the input is a step signal (i.e., E(t) = E0), the expression for the voltage applied to the optical waveguide is given as follows:
Similarly, when the input signal is a square wave with a period of T, the expression for the steady-state solution of the voltage applied to the optical waveguide in the positive half-cycle of the signal can be written as:
where
The two models (Equations (2) and (8)) are mathematically consistent in form, and their differences are mainly reflected in the values of parameters A and B. The transfer functions corresponding to the two models can both be expressed as:
The expression for the voltage applied to the waveguide is obtained by applying a square-wave signal to the modulator, normalizing the measured response waveform, mapping it to voltage, and subsequently fitting the mapped voltage.
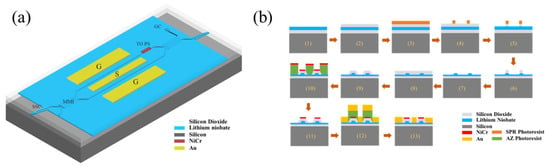
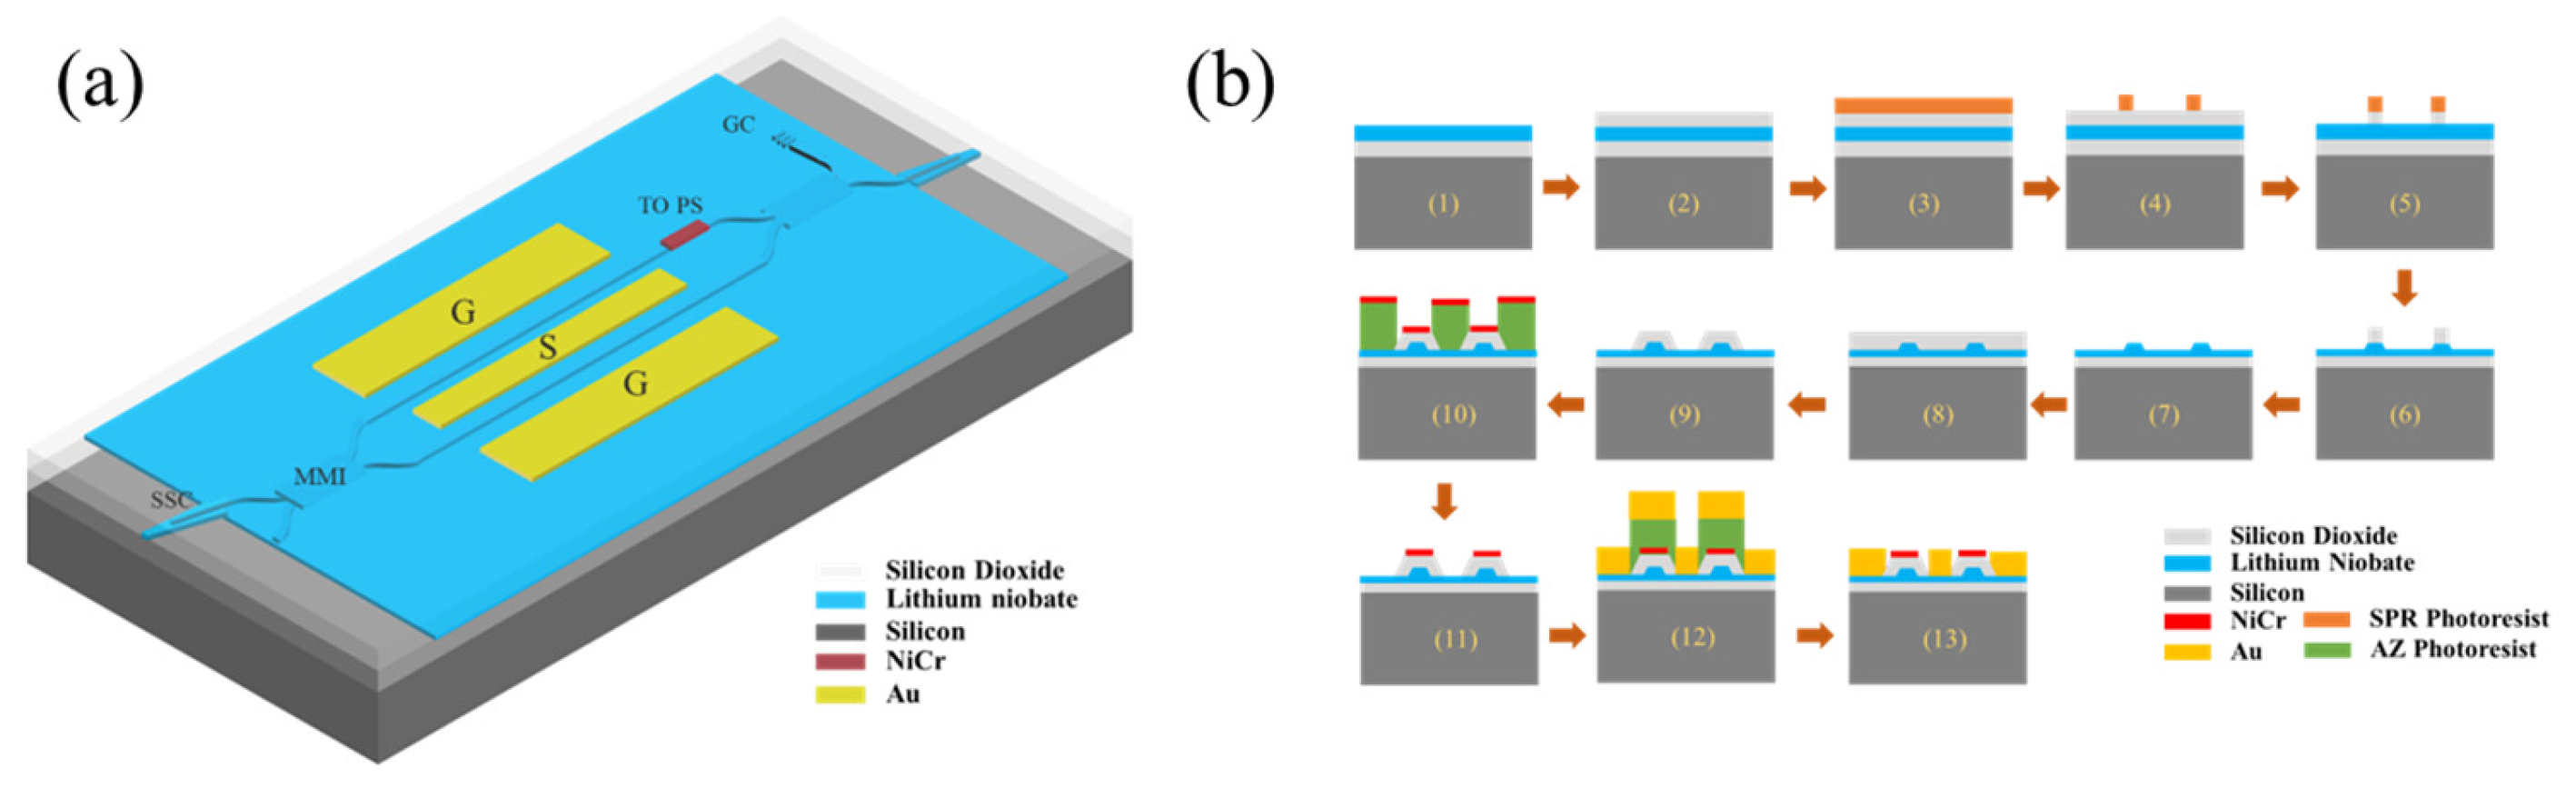
Figure 2a shows the schematic structural diagram of the lithium niobate on insulator (LNOI) modulator designed in this paper. The optical path section of the device consists of input/output spot-size converters, 2 × 2 multimode interference (MMI) coupler for beam splitting and combining, and two single-mode ridge optical waveguides serving as modulation arms. The LN layer is etched to a depth of 300 nm, leaving a 300 nm-thick slab, and the waveguide width is 1.5 μm. The electrodes we designed are traveling-wave T-shaped electrodes with a push–pull configuration. The matching resistor serves to eliminate signal reflections, ensuring that the signal energy is transmitted efficiently and completely from the driver to the modulator electrodes, thereby supporting the square-wave and sawtooth signal excitations applied in the experiments. Meanwhile, the thermal electrode operates based on the thermo-optic effect and does not involve the electro-optic relaxation phenomenon, allowing stable control of the bias point and facilitating accurate testing.
Figure 2.
(a) Schematic structural diagram of the LNOI electro-optic modulator. (b) Fabrication process flow chart (modulator without Silicon Dioxide Buffer Layer).
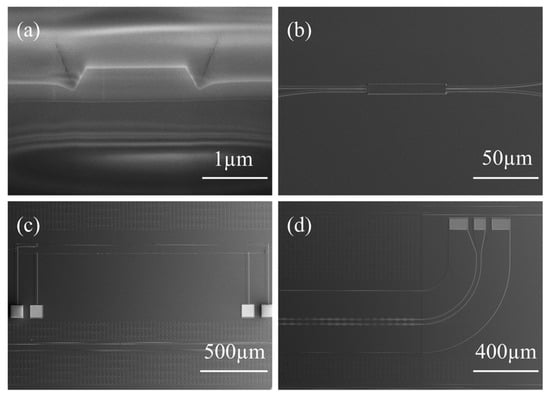
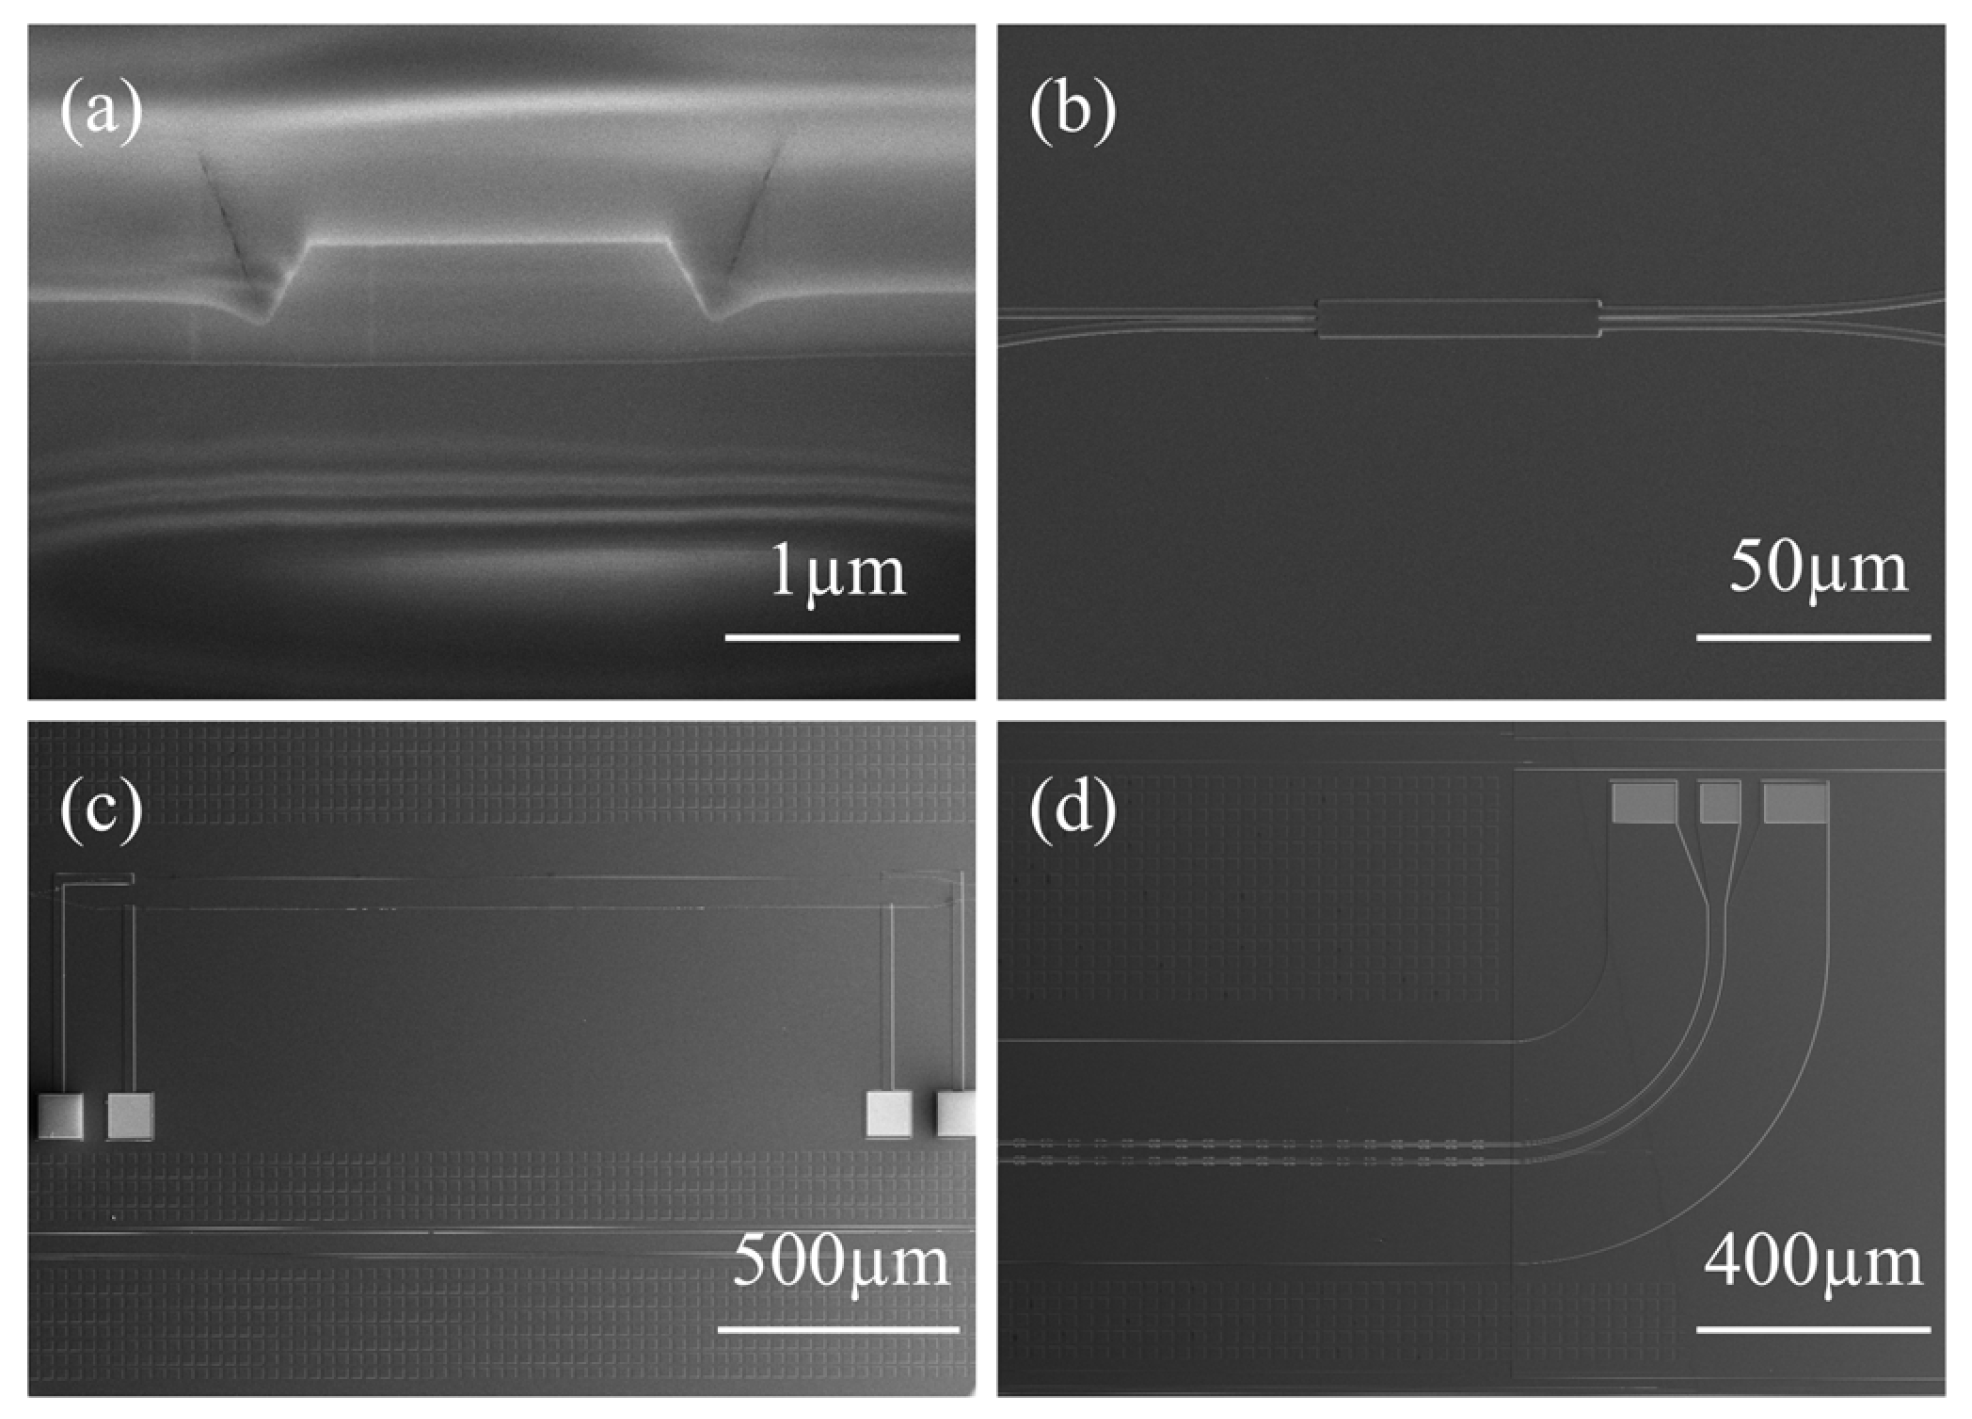
The fabrication process flow of the LNOI electro-optic modulator chip is illustrated in Figure 2b. The electro-optic modulators were fabricated on commercial X-cut LNOI wafers (NANOLN). The wafer structure comprises a 600 nm-thick lithium niobate film, a 4.7 μm-thick SiO2 buried layer, and a 500 μm-thick silicon substrate as shown in step (1). The two wafers were fabricated via the same core process flow that adopts a hybrid lithography process combining i-line stepper lithography and contact lithography. The specific steps are as follows: First, a silicon dioxide layer was deposited on the surface of 4-inch LNOI wafers by plasma-enhanced chemical vapor deposition (PECVD) to serve as a hard mask layer as shown in step (2). Subsequently, exposure was performed using an i-line stepper with a single exposure window size of 1.6 cm × 1.6 cm to complete the patterning of the entire wafer as shown in step (3). Next, the patterns were transferred to the photoresist as shown in step (4). SiO2 hard mask as shown in step (5) and lithium niobate device layer as shown in step (6) to step (7) were sequenced by inductively coupled plasma-reactive ion etching (ICP-RIE) to form ridge waveguides with an etching depth of 300 nm. After that, an 800 nm-thick SiO2 layer was deposited again by PECVD as the upper cladding layer as shown in step (8) (for samples without a silicon dioxide buffer layer, the SiO2 in the traveling-wave electrode region needs to be removed by lithography and wet etching as shown in step (9)). Then, thermal electrodes, matching resistors and metal traveling-wave electrodes were fabricated through lithography, electron beam evaporation and lift-off processes as shown in step (10) to step (13). Finally, a 1 μm-thick SiO2 layer was deposited as a passivation protection layer, and electrode bonding pads were formed by etching. Figure 3 presents the key structures of the fabricated modulators, including the cross-section of the single-mode waveguide, MMI coupler, traveling wave electrodes and thermal electrodes.
Figure 3.
SEM images of the fabricated device: (a) the cross-section of the single-mode waveguide, (b) MMI coupler, (c) thermal electrodes, and (d) traveling wave electrodes.
Finally, the LNOI electro-optic modulators were packaged with metal packages, and a thermoelectric cooler (TEC) was integrated into the package structure to realize the temperature control of the modulators. Temperature can also cause drift, so we used TEC to maintain the chip at 23 °C.
3. Results
3.1. With Silicon Dioxide Buffer Layer
The physical essence of the electro-optic relaxation phenomenon lies in the fact that the voltage applied to the waveguide drives the migration of defects within the lithium niobate crystal, thereby forming a built-in electric field that causes the effective voltage on the waveguide to vary over time. At the macroscopic device level, this phenomenon manifests as a slow drift in the output optical power of the modulator over time when a fixed DC bias voltage is applied. However, in thin-film lithium niobate devices, due to the relatively short relaxation time (which is two orders of magnitude shorter than that of bulk material), directly applying a DC voltage and recording the optical power with a commercial optical power meter (which typically has a sampling rate on the order of seconds) cannot accurately capture the rapid relaxation process. To address this measurement challenge, we employed a periodic square wave as the excitation signal. Using a square wave, we converted the slow time-domain drift into a repeatedly observable waveform distortion, enabling accurate extraction of the relaxation time constant. By fitting the output response of the modulator under square-wave excitation, we obtained the equivalent RC parameters. Substituting these parameters into Equation (1) essentially reconstructs the evolution of the effective voltage on the waveguide over time under a fixed DC voltage.
To observe the electro-optic relaxation phenomenon, the period of the input signal used in the experiment must be of the same order of magnitude as the relaxation time of the device. In this experiment, the modulator was set and maintained at the quadrature bias point via the thermal electrode. Symmetric square-wave signals at 10 Hz with different peak-to-peak voltages (Vpp) were applied to the modulator, with the input optical power set to 10 dBm. Subsequently, the collected output optical waveforms were normalized, and the response in the positive half-cycle was mapped to effective voltage values for analysis. The wavelength of the input light was 1550 nm and the loss of the modulator was 7 dB.
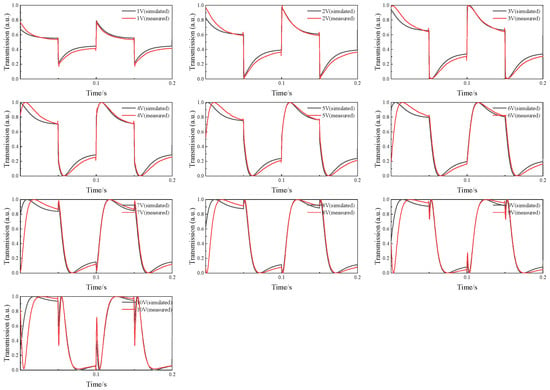
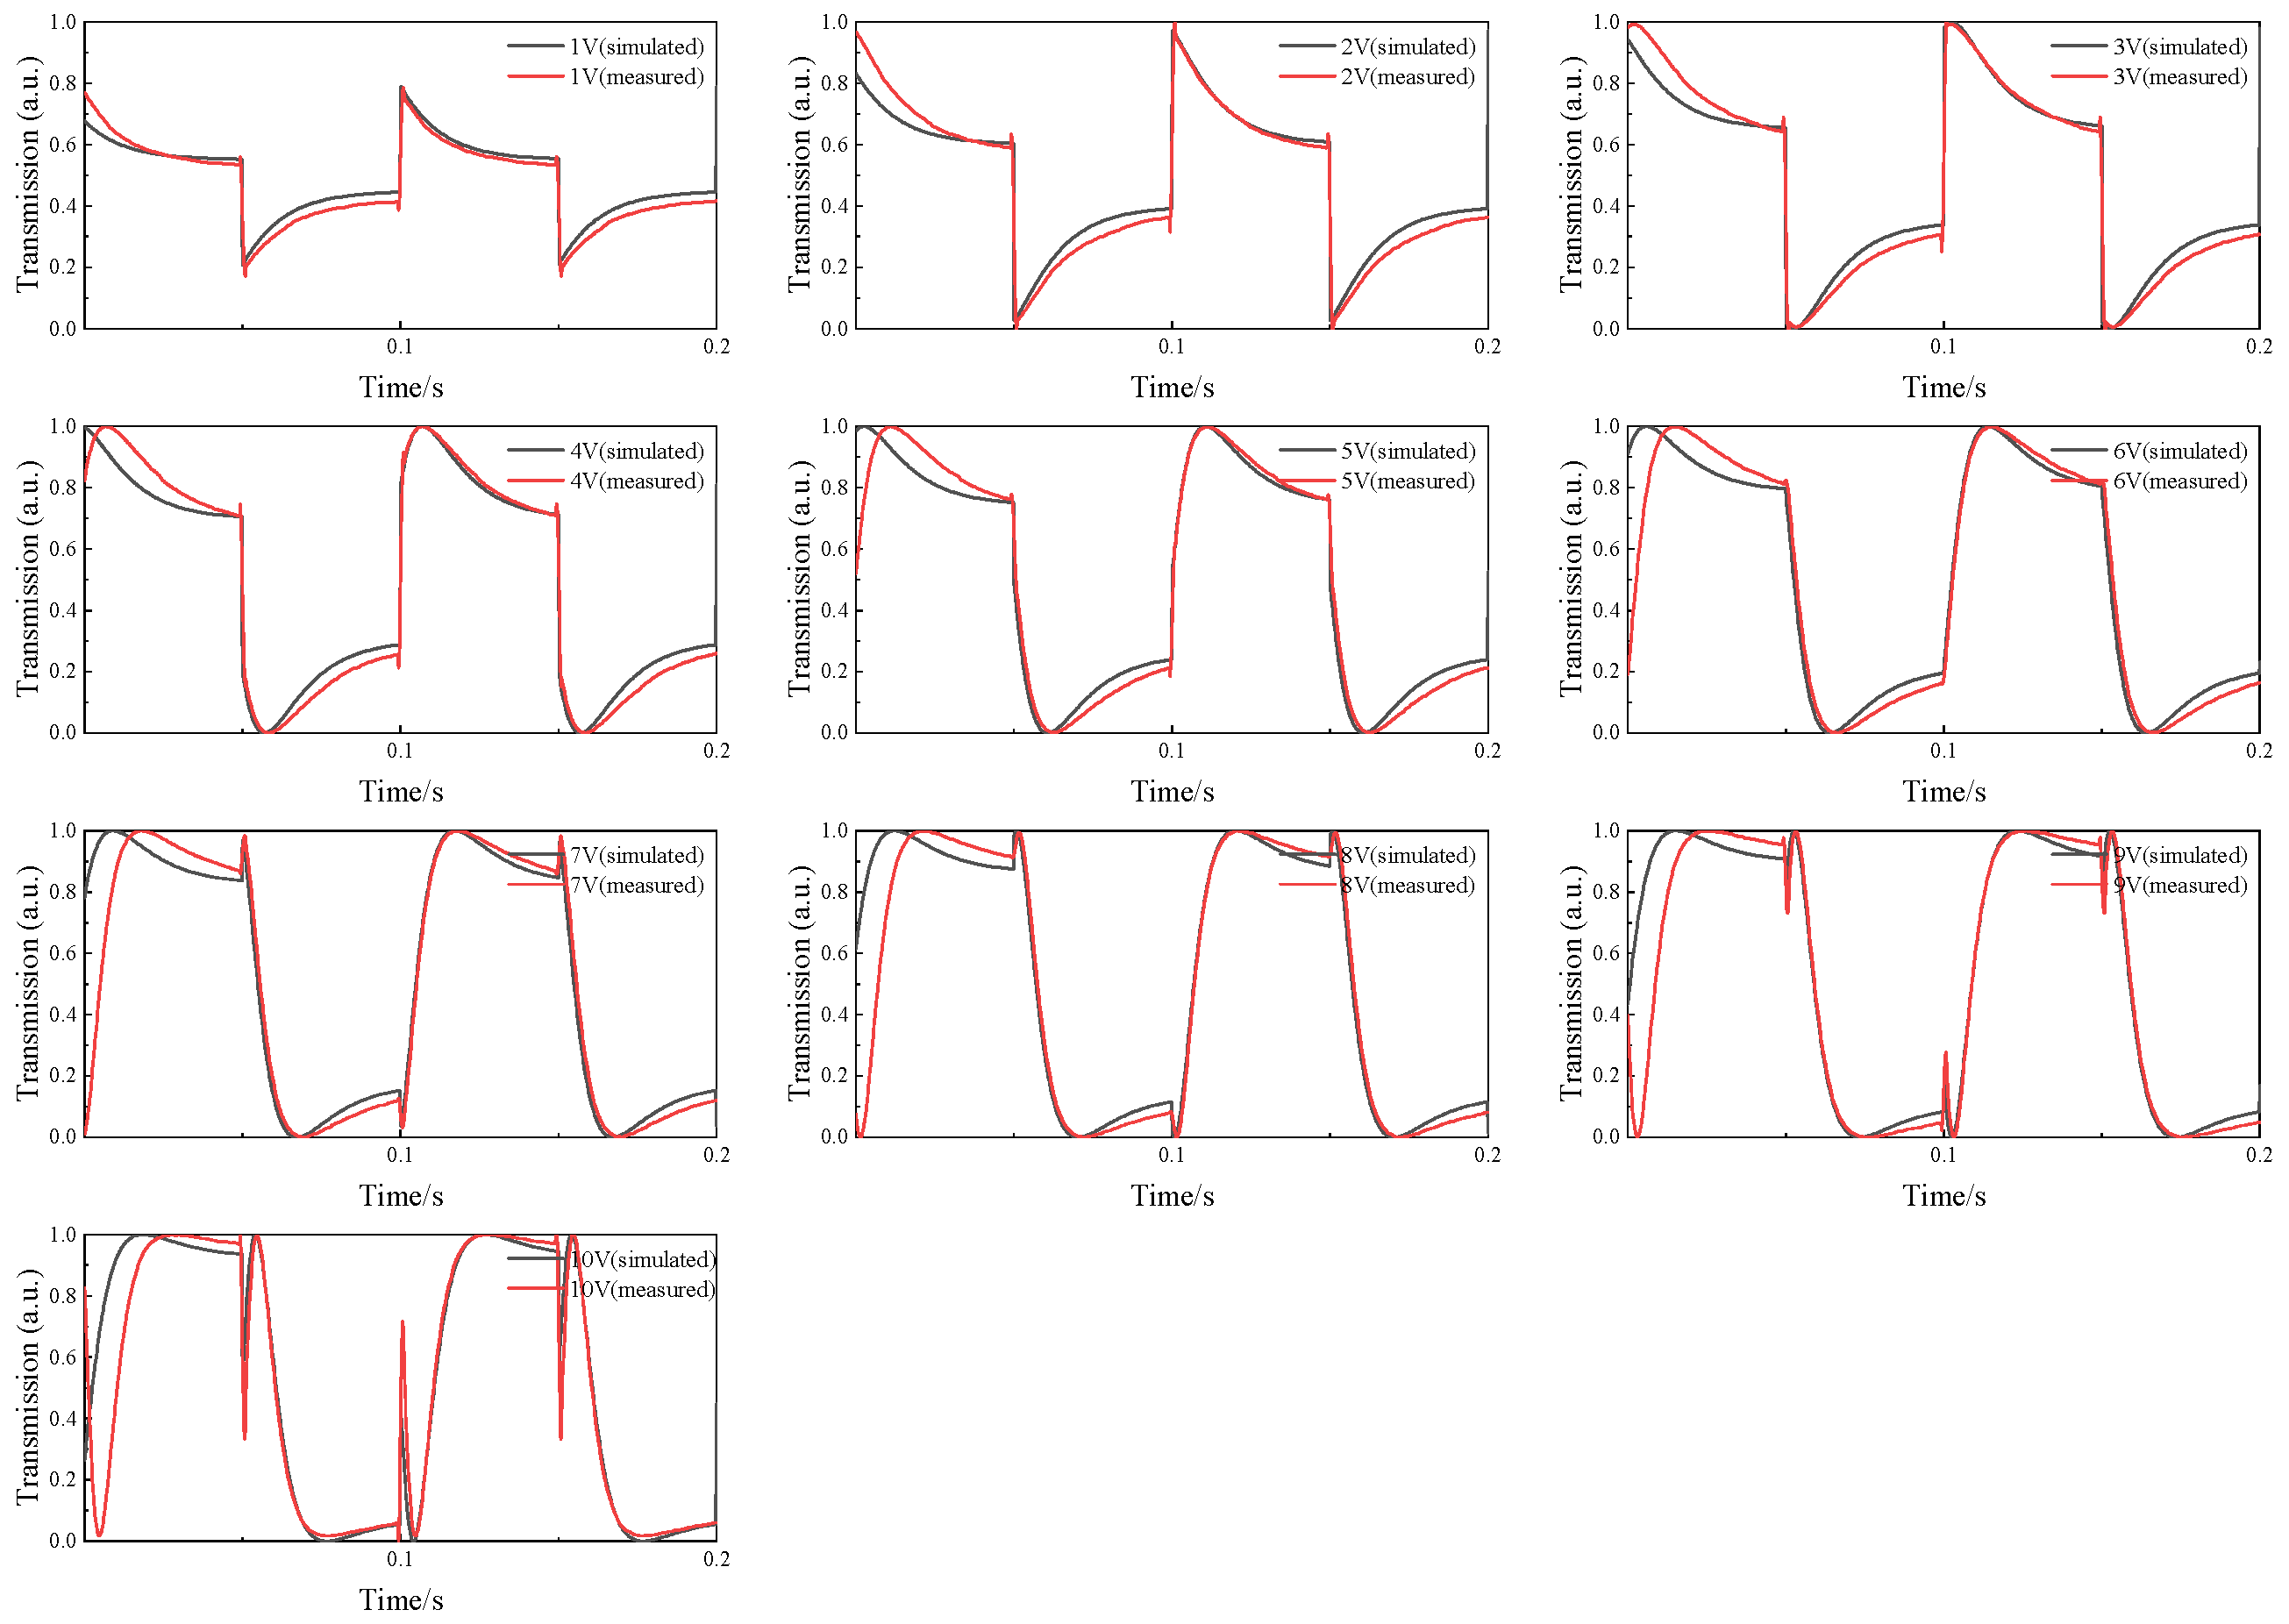
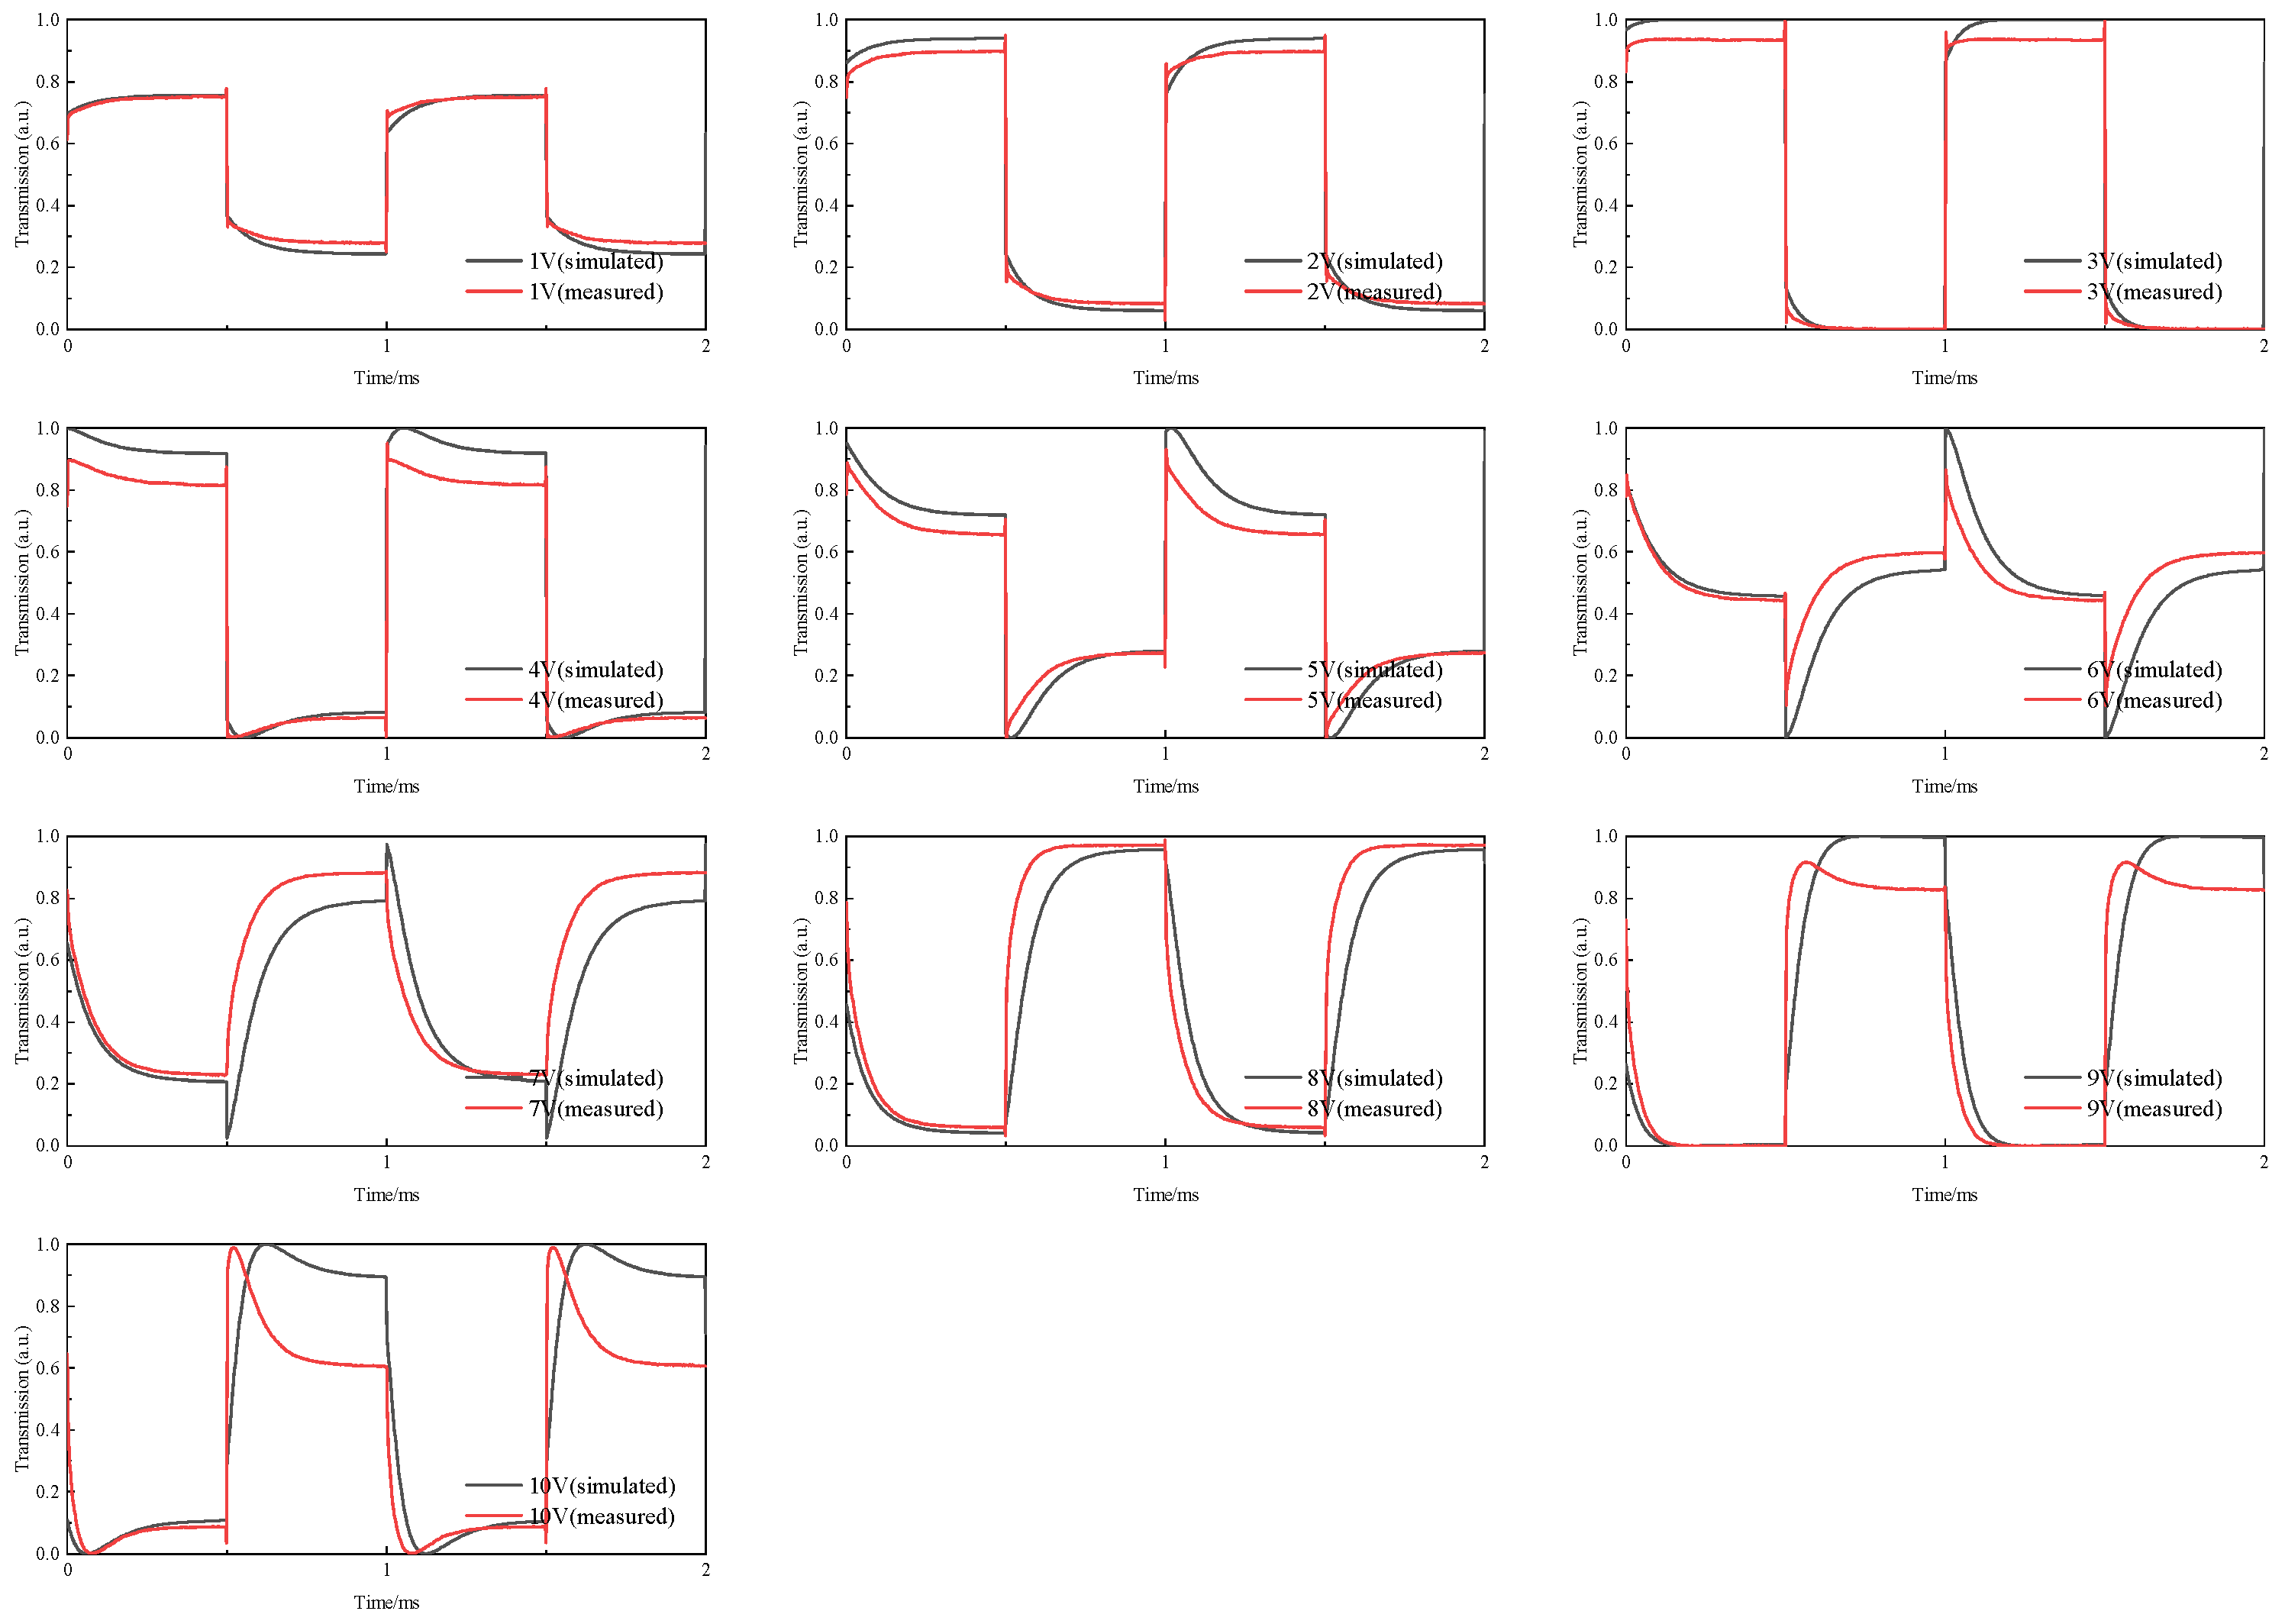
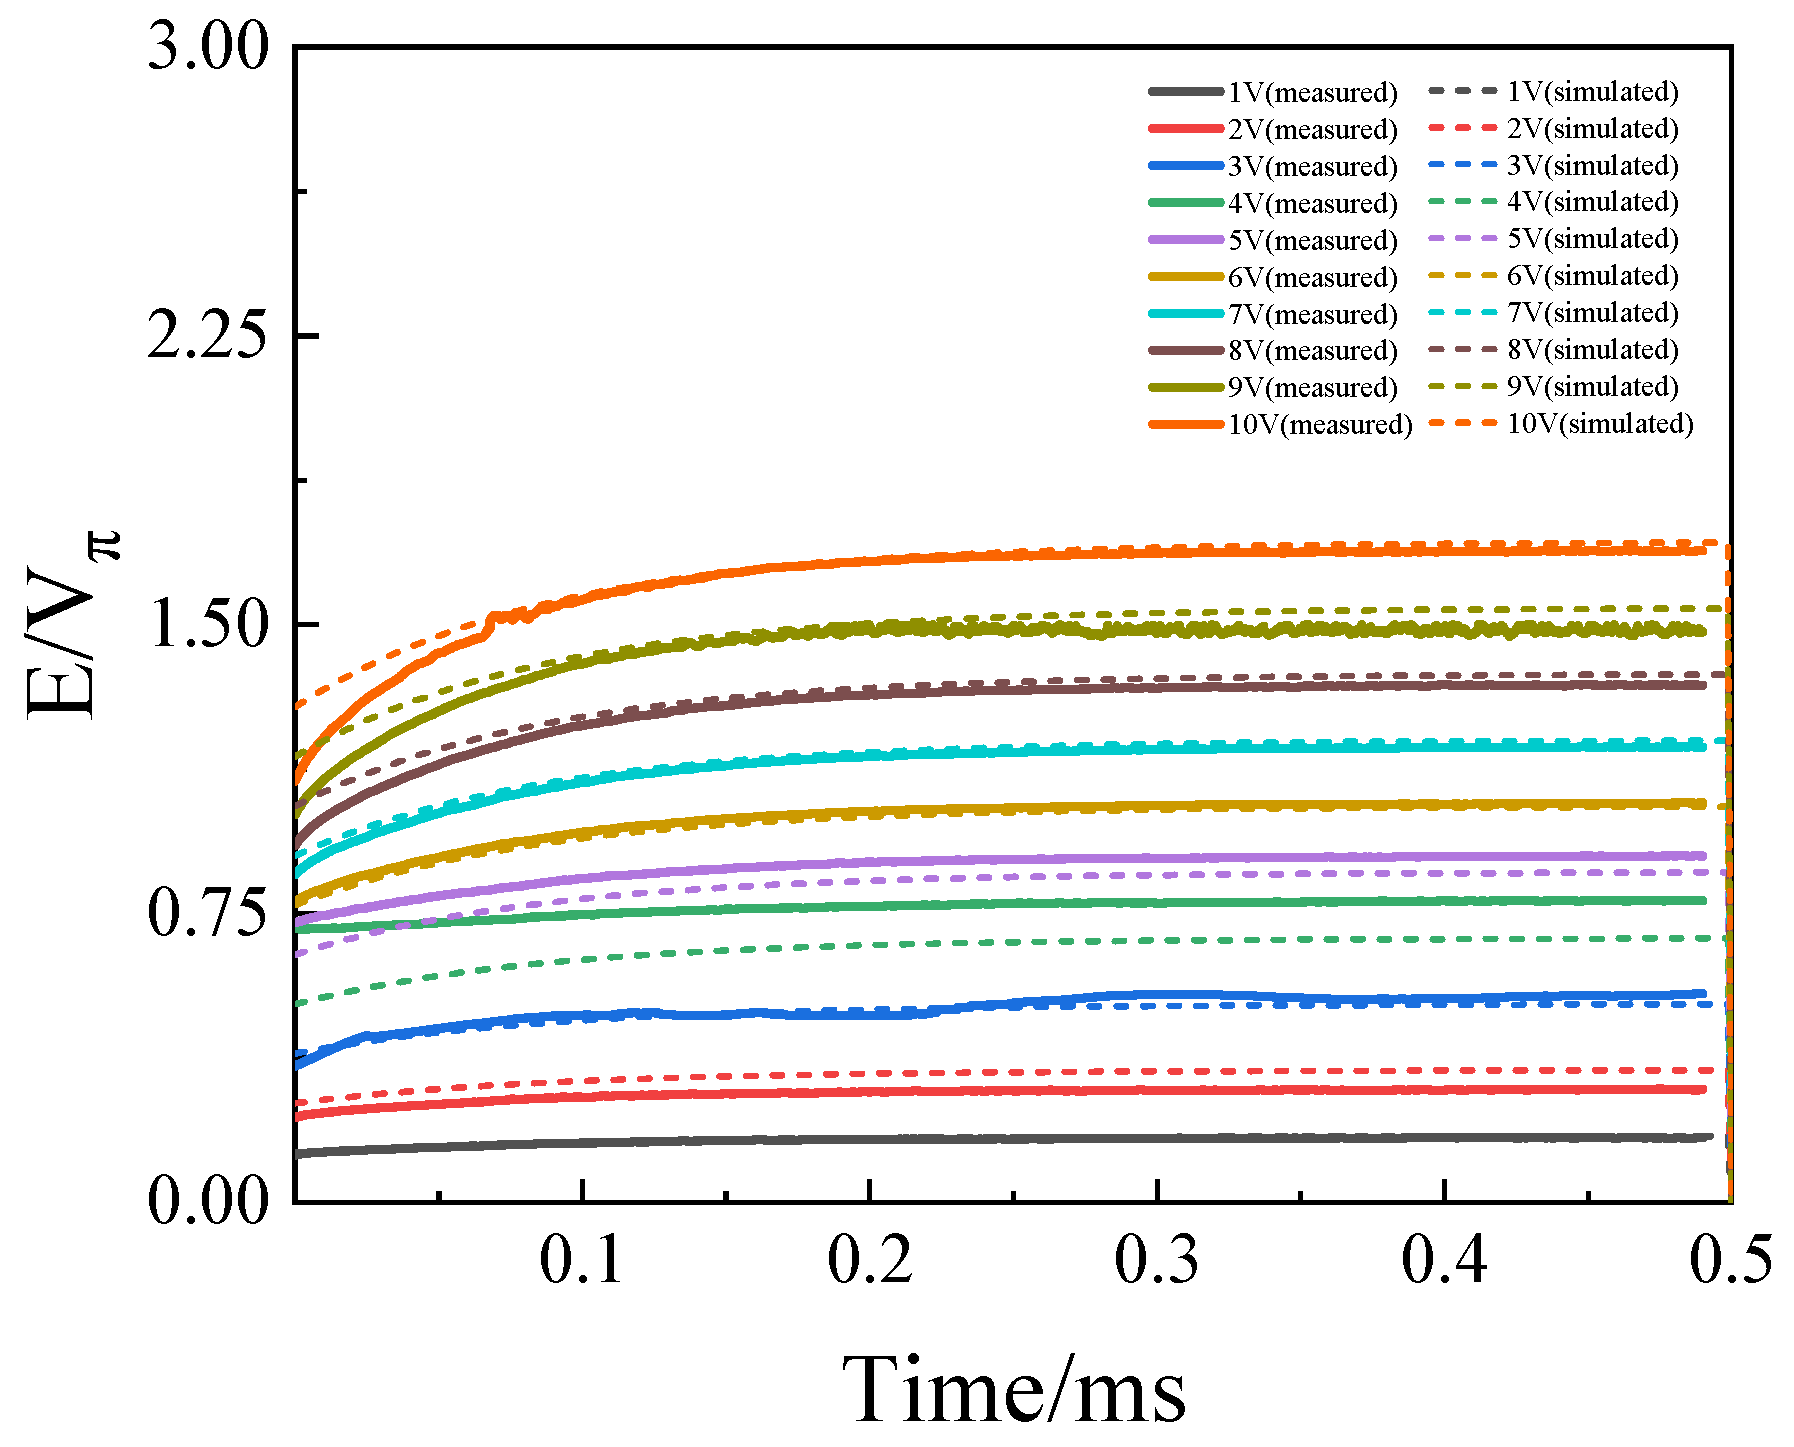
Based on the mathematical model of the square wave input signal, the measurement data under different voltages were fitted, and the statistical average of the obtained parameters was calculated, with the results presented in Table 1. The parameters in the table were then substituted into the system transfer function, and the theoretical output values of the square wave signal under this transfer function were calculated. Figure 4 shows the comparison results of measured and simulated normalized output optical power under different voltages with a 10 Hz square wave input. Figure 5 shows time-dependent voltage mapped from half a cycle of the output waveform. To verify the universality of the model, we further compared the measurement output waveforms of the modulator with the simulated results under different driving frequencies and voltages. The measurement data and simulated data are in good agreement, which shows that the model can accurately describe and simulate the time-domain response characteristics of the modulator in the low-frequency range.
Table 1.
Fitted parameters of the formulation.
Figure 4.
Comparison of measured and simulated normalized output optical power under different voltages with a 10 Hz square wave input.
Figure 5.
Time-dependent voltage mapped from half a cycle of the output waveform.
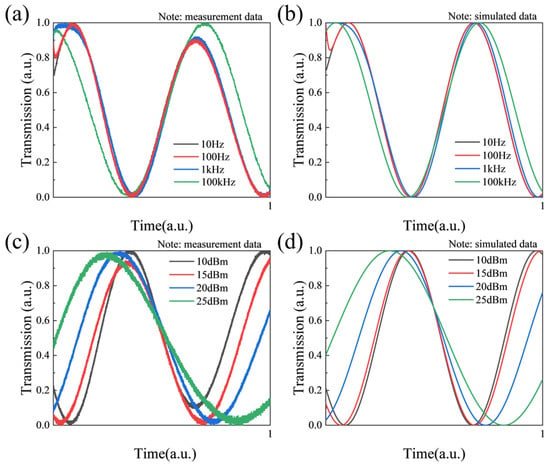
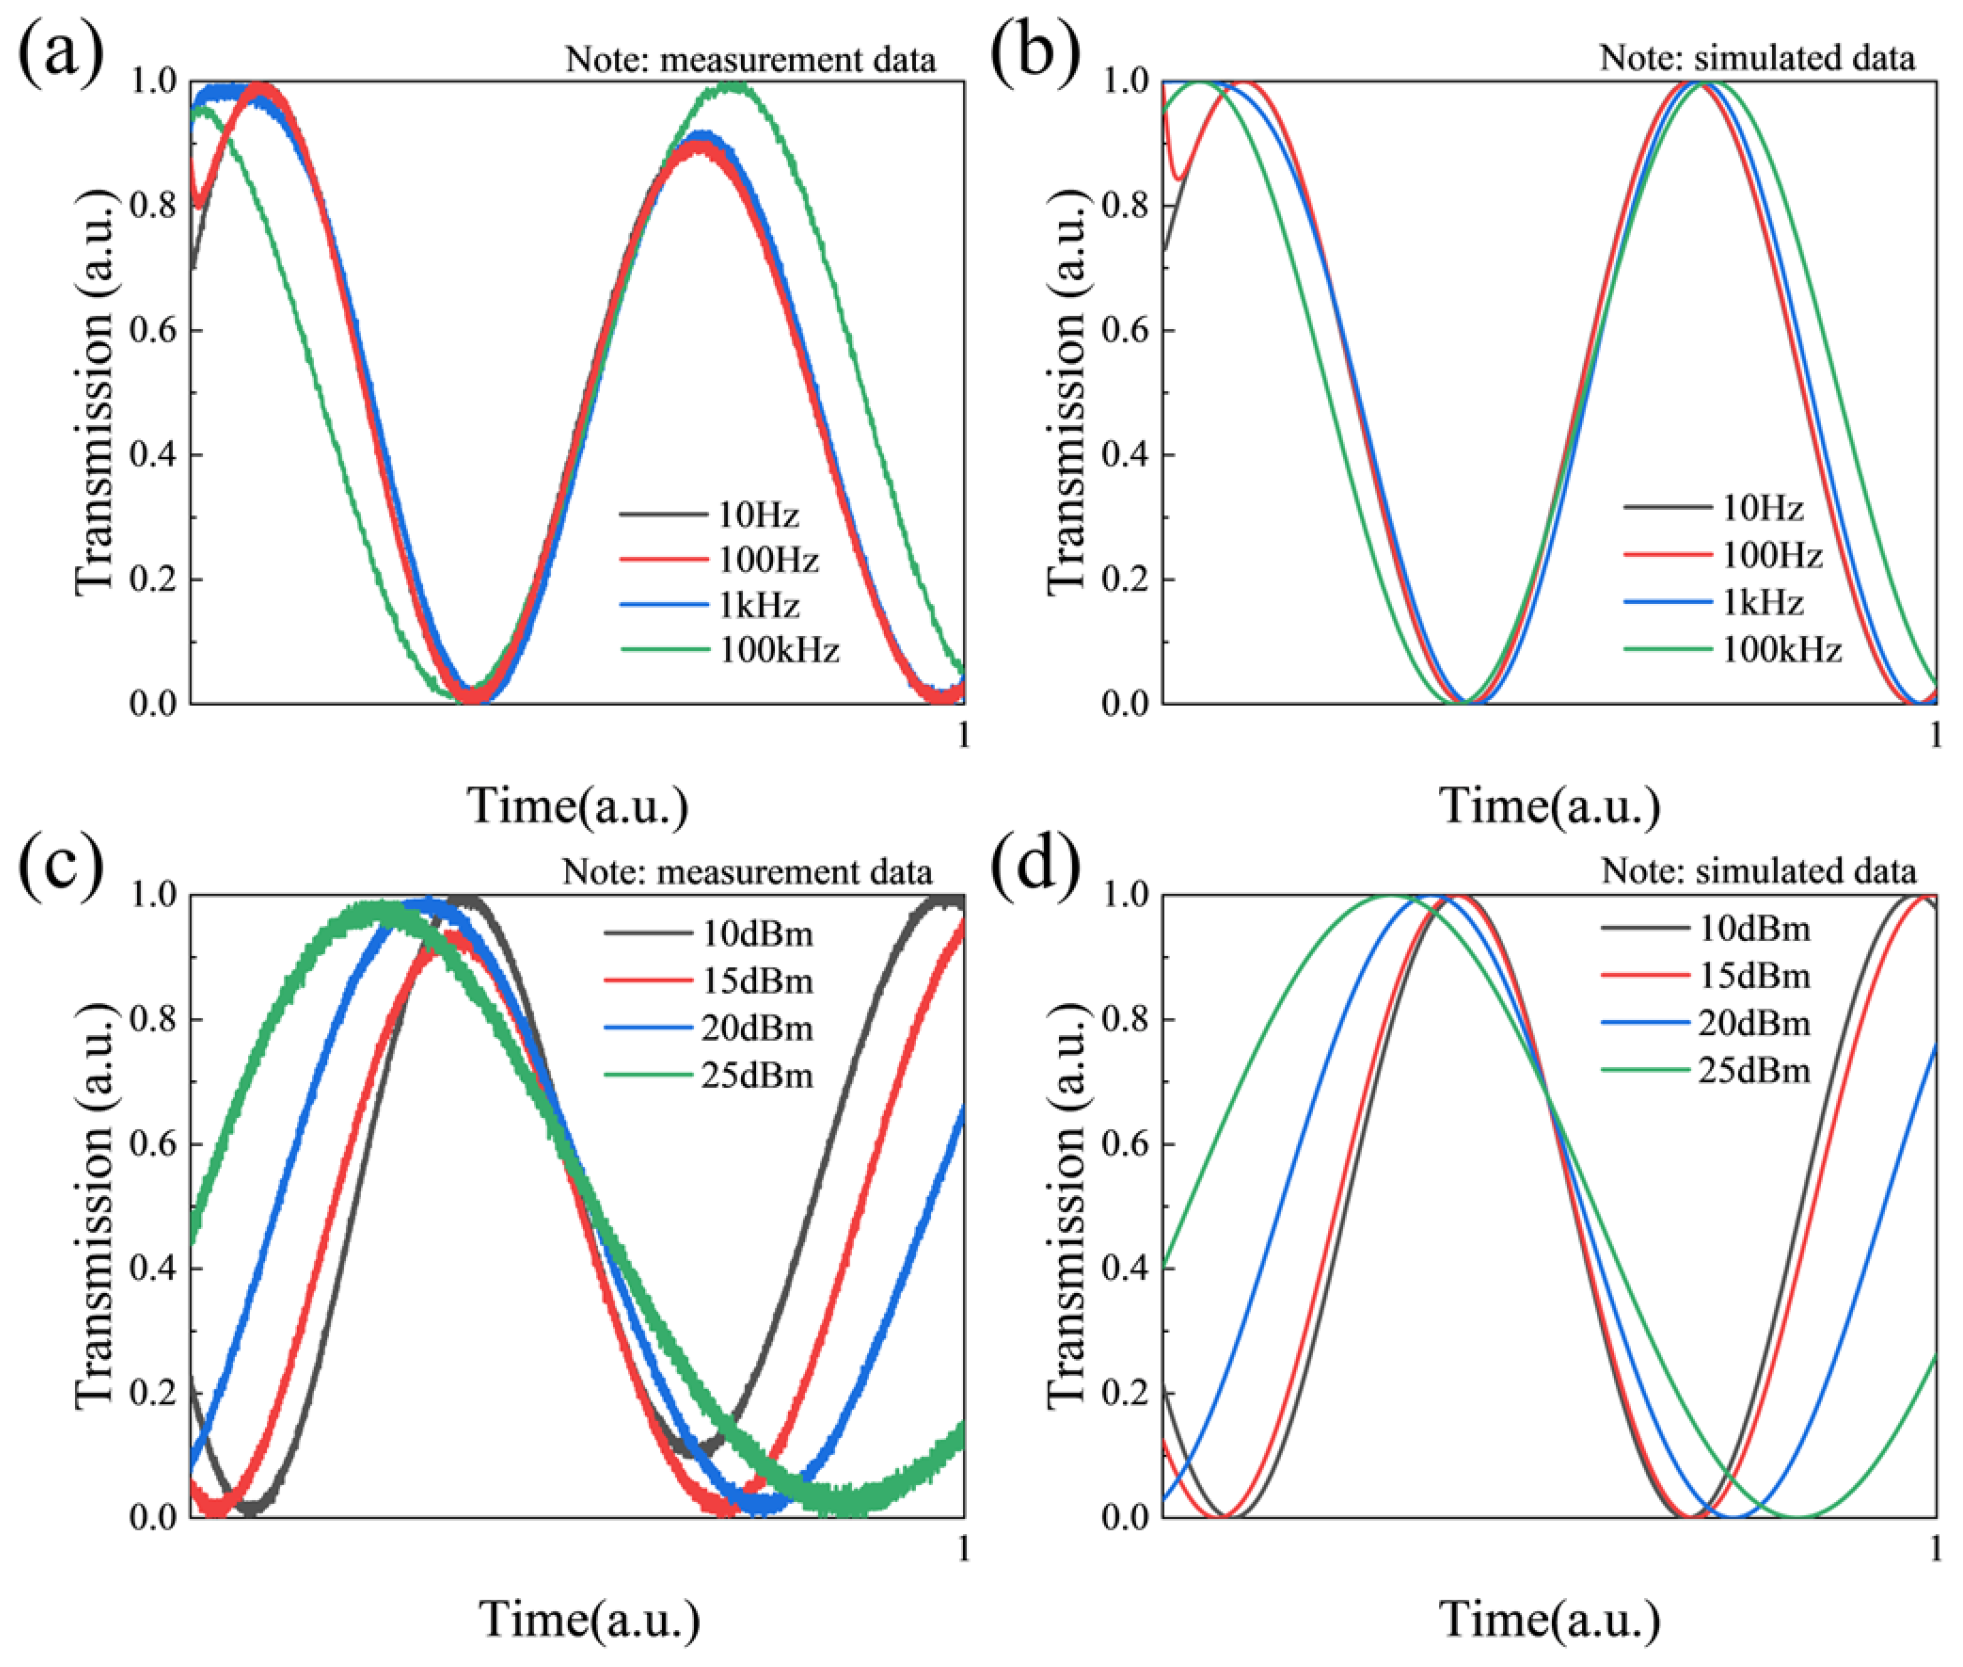
To further investigate the low-frequency response characteristics of the LNOI modulator, in addition to square wave signals, this study also focused on its time-domain output behavior under the excitation of sawtooth wave signals. Since electro-optic modulators usually calibrate their half-wave voltage based on low-frequency signals, distortion of the output waveform will directly affect the accuracy of the calibration results. Therefore, we compared the output responses of the modulator under the excitation of sawtooth wave signals with peak-to-peak value of 10 V and frequencies of 10 Hz, 100 Hz, 1 kHz and 100 kHz, respectively. The measurement results show that there are differences in the output waveforms at different frequencies. Under the 10 Hz input, the waveform exhibits the characteristic of a rapid change followed by a gradual flattening. In addition, by analyzing the measurement data under different optical intensities, fitting results show that the value of model parameter A decreases with the increase in optical intensity. Furthermore, the output responses under different optical intensity conditions were compared under the excitation of a 50 Hz sawtooth wave with a peak-to-peak value of 10 V, and the simulation results reproduce the main characteristics of the experimental curves well, verifying the validity of the model. Figure 6 shows the comparison results of measurement and simulation under sawtooth wave input. According to Table 2, the electro-optic relaxation time is shortened accordingly with the increase in optical intensity, which provides basis for the dynamic response of modulators when the optical power changes.
Figure 6.
Normalized output of the modulator under sawtooth waves with different frequencies with input power of 15 dBm: (a) measurement data, (b) simulated data. Normalized output of the modulator under different input powers at sawtooth frequency of 50 Hz: (c) measurement data, (d) simulated data.
Table 2.
Fitted parameters of the formulation under different optical inputs.
3.2. Without Silicon Dioxide Buffer Layer
When testing the modulator without a silicon dioxide buffer layer, we found that its electro-optic relaxation time is significantly shorter than that of the structure with a buffer layer. When tested at 10 Hz, the electro-optic relaxation phenomenon is not observable. In order to clearly observe the electro-optic relaxation phenomenon, symmetric square wave signals with a frequency of 1 kHz and different Vpp were applied to the device, with the input optical power set to 10 dBm. Subsequently, the collected output waveforms were normalized, and the response in the positive half-cycle was mapped to effective voltage values for analysis. The wavelength of the input light was 1550 nm and the loss of the modulator was 9 dB.
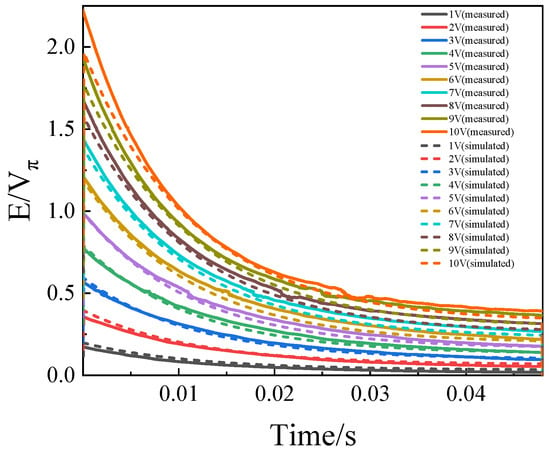
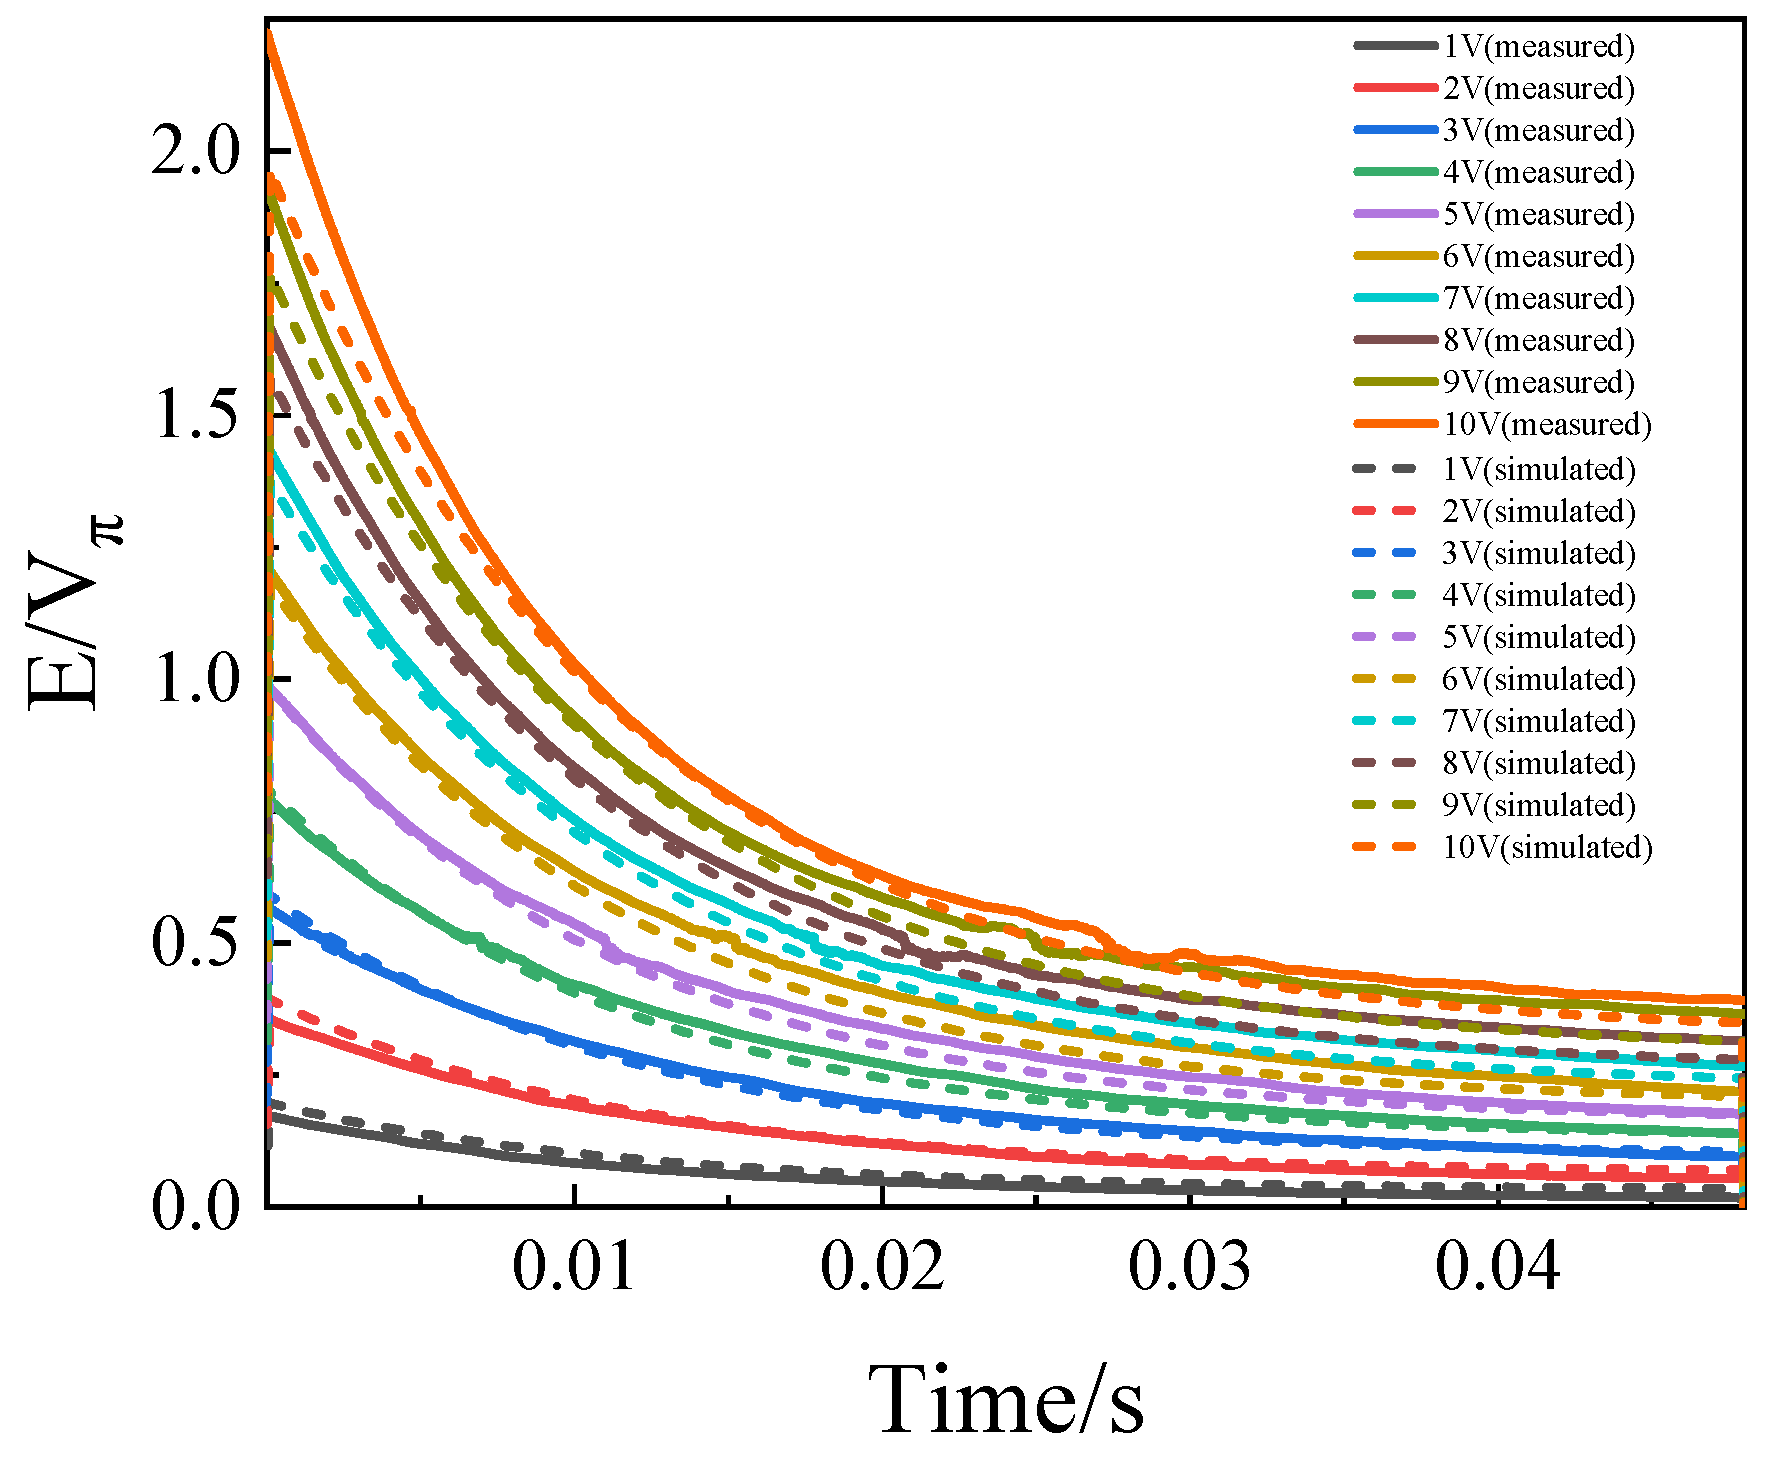
Based on the mathematical model of the square wave input signal as well, the measurement data under different voltages were fitted, and the statistical average of the obtained parameters was calculated, with the results presented in Table 3. The parameters in the table were then substituted into the system transfer function, and the theoretical output values of the square wave signal under this transfer function were calculated. Figure 7 shows the comparison results of measured and simulated normalized output optical power under different voltages with a 1 kHz square wave input. Figure 8 shows time-dependent voltage mapped from half a cycle of the output waveform. We also compared the experimentally measured results of the modulator output waveforms with the model simulation data under square wave input with other frequencies and different driving voltages. The measurement data and simulated data are in good agreement, which indicates that the model can still accurately describe and simulate the time-domain response characteristics of the modulator without a silicon dioxide buffer layer in the low-frequency range.
Table 3.
Fitted parameters of the formulation.
Figure 7.
Comparison of measured and simulated normalized output of optical power under different voltages with a 1 kHz square wave input.
Figure 8.
Time-dependent voltage mapped from half a cycle of the output waveform.
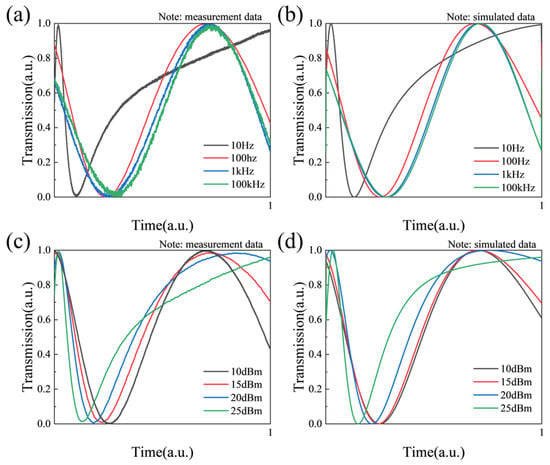
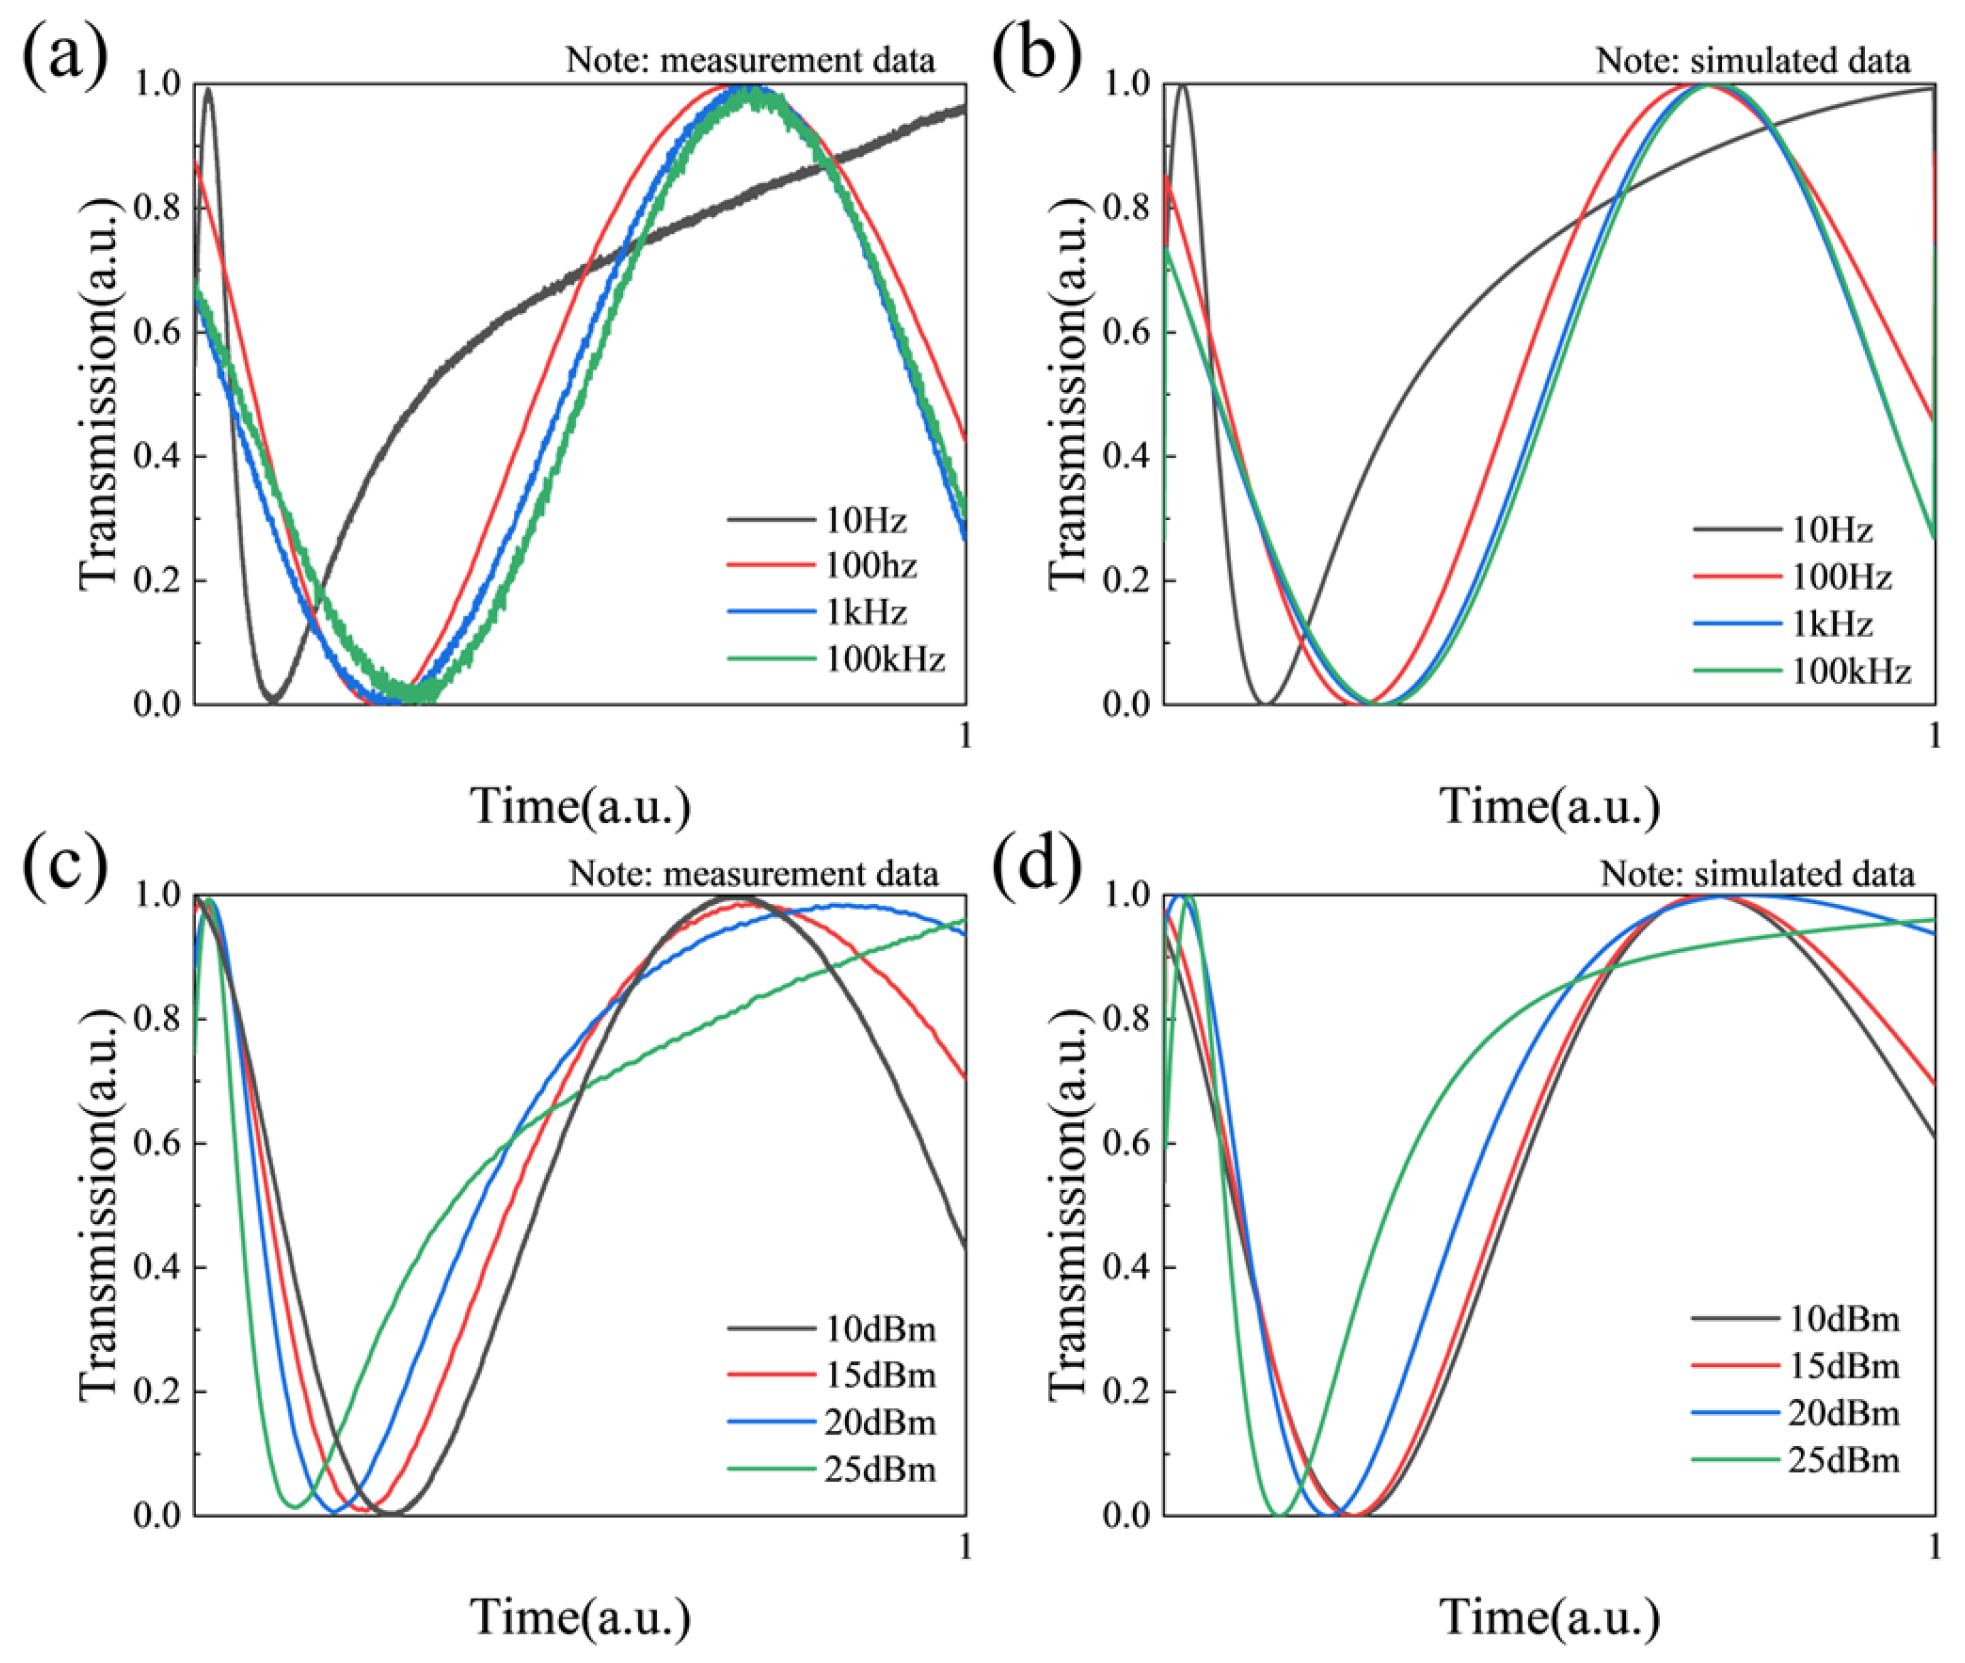
Under the excitation of sawtooth wave signals with Vpp of 10 V, we further investigated the effects of different frequencies and different optical intensities on the output response of the modulator. The measurement data of the square wave test were fitted to extract the variation relationship of parameter A with optical intensity. Figure 9 shows the comparison results of measurement and simulation under sawtooth wave input. The results show that the simulation results effectively reproduce the main characteristics of the measurement data, verifying the accuracy of the model. The electro-optic relaxation time also decreases with the increase in optical power according to Table 4.
Figure 9.
Normalized output of the modulator under sawtooth waves with different frequencies with input power of 10 dBm: (a) measurement data, (b) simulated data. Normalized output of the modulator under different input powers at sawtooth frequency of 10 Hz: (c) measurement data, (d) simulated data.
Table 4.
Fitted parameters of the formulation under different optical inputs.
4. Discussion
A comparative analysis of LNOI electro-optic modulators with and without a silicon dioxide buffer layer reveals that the primary cause of the difference in their low-frequency responses lies in the fact that the introduction of the buffer layer alters the parameters in the equivalent RC circuit, thereby influencing their low-frequency electro-optic response behavior. Samples from different regions on the same wafer exhibit the same behavior, with only slight variations in the relaxation time.
For the sample with the silicon dioxide buffer layer, the fitted parameters under the excitation of a 10 Hz square wave at the input optical power of 10 dBm are A = 0.065⋅Vπ and B = 0.232⋅Vπ. Since B–A > 0, the device exhibits a positive DC drift and large drift—namely, the actual voltage of the waveguide attenuates rapidly after the application of voltage, leading to a significant weakening of the electro-optic response. This is consistent with the positive DC drift phenomenon observed in Ref. [10]. To accurately determine the value of Vπ, the actual resistance and capacitance values of the lithium niobate waveguide and the silicon dioxide layer must be obtained. According to the parallel plate structure model, the RC time constant is independent of geometric dimensions and determined solely by material properties: RC = ε0εrρ, where ε0, εr, and ρ are vacuum dielectric constant, relative dielectric constant and resistivity respectively. From R4C4 = 0.0425 s, the resistivity of silicon dioxide is deduced to be approximately 1.23 × 10⁹ Ω⋅m, which is consistent with the fitting results in Ref. [21] and the reported measured resistivity values of low-temperature PECVD silicon dioxide [25]. Although the exact half-wave voltage cannot be obtained directly, Vπ ≈ 3.85 V can be estimated via simulation. Substituting the values of A and B yields R4 ≈ 1.5·R5 and C4 ≈ 16.7·C1, further giving R5C1 = 0.00169 s. Given the high resistivity of silicon dioxide, R1 ≈ R5 can be approximated. Therefore, the transverse resistivity of the LNOI film is calculated to be approximately 6.38 × 10⁶ Ω⋅m. This value is consistent with the analysis in Ref. [21]. Such a low resistivity would cause considerable optical absorption [26], yet the on-chip loss of the sample is less than 1 dB, indicating that the surface conduction effect may play a dominant role in charge transport. Thus, there is a thin amorphous lithium niobate layer several nanometers thick on the surface [27], and the formation of amorphous lithium niobate may be related to the etching process.
For the sample without a silicon dioxide buffer layer, the fitted parameters under the excitation of a 1 kHz square wave are A = 0.349⋅Vπ and B = 0.306⋅Vπ. Since B–A < 0, the device exhibits a negative DC drift and small drift; the voltage response shows a rapid rising trend, and the electro-optic response is enhanced accordingly. From R2C2 = 77.7 us, the longitudinal resistivity of the LNOI film is deduced to be approximately 1.04 × 10⁵ Ω·m. Based on simulation, Vπ ≈ 2.82 V is estimated; substituting A and B gives R2 ≈ 0.008·R1 and C2 ≈ 12.6·C1, and the transverse resistivity of the LNOI film is calculated to be approximately 2.89 × 10⁶ Ω·m. This value is of the same order of magnitude as the transverse resistivity deduced for the aforementioned sample with a buffer layer. The difference between the transverse and longitudinal resistivity may be related to the anisotropy of the lithium niobate crystal, which is consistent with the observation in Ref. [11] that the transverse resistance of X-cut lithium niobate is higher than the longitudinal resistance, as well as the consistent negative DC drift phenomenon. The transverse resistivity of LiNbO3 material is calculated as 9.08 × 10¹⁰ Ω·m [11], which is much higher than the resistivity of thin film LiNbO3 calculated by us. The primary reason for the faster relaxation exhibited by LNOI films is the surface conduction effect.
In addition, an increase in optical intensity enhances the photoconductivity of the LNOI film and reduces the transverse resistance of its waveguide region, thereby decreasing the value of A and shortening the relaxation time, which alters the low-frequency response characteristics. In the sample without a silicon dioxide buffer layer, when the input optical power is increased to 25 dBm, the value of A drops to 0.195·Vπ; at this point, A < B, and the drift direction of the device switches from negative to positive.
Therefore, the stability of LNOI modulators can be improved either by increasing the relaxation time to the minute scale or longer, or by reducing the magnitude of bias drift. The parameters in the RC model can be altered by flexibly regulating the capacitance and resistance values of the buffer layer and the LNOI film, thereby mitigating the effects caused by the electro-optic relaxation phenomenon. It should be noted that due to the voltage division effect of resistors and capacitors, the half-wave voltage of the modulator will be affected, so a comprehensive consideration is required.
5. Conclusions
Based on the equivalent RC circuit model, this study systematically reveals the deterministic effect of the silicon dioxide buffer layer on the low-frequency response characteristics of LNOI electro-optic modulators. Research indicates that modulators with cladding exhibit a relaxation time of approximately 11.9 ms, showing positive DC drift and large drift, while those without cladding demonstrate a reduced relaxation time of about 88.6 μs with negative DC drift and small drift. In addition, optical intensity can alter the equivalent resistance by modulating the material photoconductivity, thereby affecting the low-frequency response—this provides critical evidence for the opto-electronic coupling effect. Material parameter analysis further indicates that the transverse resistivity of LNOI films is mainly dominated by the surface conduction mechanism. This study points out that the stability of LNOI modulators can be improved either by increasing the relaxation time to the minute scale or longer, or by reducing the magnitude of bias drift. The parameters in the RC model can be adjusted by flexibly regulating the capacitance and resistance values of the buffer layer and the LNOI film, thereby mitigating the impacts of the electro-optic relaxation phenomenon. Meanwhile, the influence of capacitance voltage division on modulation efficiency must be considered holistically in the design. This study provides important ideas for the design and optimization of next-generation integrated lithium niobate photonic modulators with high stability and tunability.
Author Contributions
Conceptualization, R.L. and J.L. (Jinye Li); methodology, Q.J.; software, Z.X.; validation, R.L. and J.H.; writing—review and editing, R.L. and Z.L.; supervision, J.X.; project administration, J.L. (Jianguo Liu); All authors have read and agreed to the published version of the manuscript.
Funding
This research received no external funding.
Institutional Review Board Statement
The study did not require ethical approval.
Informed Consent Statement
The study did not involve humans.
Data Availability Statement
The data presented in this study are available on request from the corresponding author.
Conflicts of Interest
The authors declare no conflicts of interest.
References
- Boes, A.; Chang, L.; Langrock, C.; Yu, M.; Zhang, M.; Lin, Q.; Lončar, M.; Fejer, M.; Bowers, J.; Mitchell, A. Lithium niobate photonics: Unlocking the electromagnetic spectrum. Science 2023, 379, eabj4396. [Google Scholar] [CrossRef] [Scilit]
- Zhu, D.; Shao, L.; Yu, M.; Cheng, R.; Desiatov, B.; Xin, C.J.; Hu, Y.; Holzgrafe, J.; Ghosh, S.; Shams-Ansari, A.; et al. Integrated photonics on thin-film lithium niobate. Adv. Opt. Photonics 2021, 13, 242–352. [Google Scholar] [CrossRef] [Scilit]
- Wang, C.; Zhang, M.; Chen, X.; Bertrand, M.; Shams-Ansari, A.; Chandrasekhar, S.; Winzer, P.; Lončar, M. Integrated lithium niobate electro-optic modulators operating at CMOS-compatible voltages. Nature 2018, 562, 101–104. [Google Scholar] [CrossRef] [Scilit]
- Yang, F.; Fang, X.; Chen, X.; Zhu, L.; Zhang, F.; Chen, Z.; Li, Y. Monolithic thin film lithium niobate electro-optic modulator with over 110 GHz bandwidth. Chin. Opt. Lett. 2022, 20, 022502. [Google Scholar] [CrossRef] [Scilit]
- Xu, M.; Zhu, Y.; Pittalà, F.; Tang, J.; He, M.; Ng, W.C.; Wang, J.; Ruan, Z.; Tang, X.; Kuschnerov, M.; et al. Dual-polarization thin-film lithium niobate in-phase quadrature modulators for terabit-per-second transmission. Optica 2022, 9, 2. [Google Scholar] [CrossRef] [Scilit]
- Chen, G.; Chen, K.; Gan, R.; Ruan, Z.; Wang, Z.; Huang, P.; Lu, C.; Lau, A.P.T.; Dai, D.; Guo, C.; et al. High performance thin-film lithium niobate modulator on a silicon substrate using periodic capacitively loaded traveling-wave electrode. APL Photonics 2022, 7, 026103. [Google Scholar] [CrossRef] [Scilit]
- Kharel, P.; Reimer, C.; Luke, K.; He, L.; Zhang, M. Breaking voltage–bandwidth limits in integrated lithium niobate modulators using micro-structured electrodes. Optica 2021, 8, 357–363. [Google Scholar] [CrossRef] [Scilit]
- Marpaung, D.; Yao, J.; Capmany, J. Integrated microwave photonics. Nat. Photonics 2019, 13, 80–90. [Google Scholar] [CrossRef] [Scilit]
- Zhang, M.; Wang, C.; Kharel, P.; Zhu, D.; Lončar, M. Integrated lithium niobate electro-optic modulators: When performance meets scalability. Optica 2021, 8, 652–667. [Google Scholar] [CrossRef] [Scilit]
- Yamada, S.; Minakata, M. DC drift phenomena in LiNbO3 optical waveguide modulators. Jpn. J. Appl. Phys. 1981, 20, 733. [Google Scholar] [CrossRef] [Scilit]
- Becker, R.A. Circuit effect in LiNbO3 channel-waveguide modulators. Opt. Lett. 1985, 10, 417–419. [Google Scholar] [CrossRef] [Scilit] [PubMed]
- Gee, C.; Thurmond, G.; Blauvelt, H.; Yen, H.W. Minimizing dc drift in LiNbO3 waveguide devices. Appl. Phys. Lett. 1985, 47, 211–213. [Google Scholar] [CrossRef] [Scilit]
- Nagata, H.; Ichikawa, J. Progress and problems in reliability of Ti:LiNbO3 optical intensity modulators. Opt. Eng. 1995, 34, 3284–3293. [Google Scholar] [CrossRef] [Scilit]
- Nagata, H.; Ichikawa, J.; Mitsugi, N.; Sakamoto, T.; Shinriki, T.; Honda, H.; Kobayashi, M. Improved long-term DC drift in OH-reduced lithium niobate optical intensity modulators. Appl. Opt. 1996, 35, 6828–6830. [Google Scholar] [CrossRef] [Scilit]
- Salvestrini, J.P.; Guilbert, L.; Fontana, M.; Abarkan, M.; Gille, S. Analysis and Control of the DC Drift in LiNbO3 Based Mach–Zehnder Modulators. J. Light. Technol. 2011, 29, 1522–1534. [Google Scholar] [CrossRef] [Scilit]
- Xu, M.; He, M.; Zhang, H.; Jian, J.; Pan, Y.; Liu, X.; Chen, L.; Meng, X.; Chen, H.; Li, Z.; et al. High-performance coherent optical modulators based on thin-film lithium niobate platform. Nat. Commun. 2020, 11, 3911. [Google Scholar] [CrossRef] [Scilit]
- Maeder, A.; Kaufmann, F.; Pohl, D.; Kellner, J.; Grange, R. High-bandwidth thermo-optic phase shifters for lithium niobate-on-insulator photonic integrated circuits. Opt. Lett. 2022, 47, 4375–4378. [Google Scholar] [CrossRef] [Scilit]
- Sun, S.; He, M.; Xu, M.; Gao, S.; Chen, Z.; Zhang, X.; Ruan, Z.; Wu, X.; Zhou, L.; Liu, L.; et al. Bias-drift-free Mach–Zehnder modulators based on a heterogeneous silicon and lithium niobate platform. Photonics Res. 2020, 8, 6. [Google Scholar] [CrossRef] [Scilit]
- Shi, J.; Ye, Z.; Liu, Z.; Yan, Z.; Jia, K.; Zhang, L.; Ge, D.; Zhu, S. Alleviation of DC drift in a thin-film lithium niobate modulator utilizing Ar+ ion milling. Opt. Lett. 2025, 50, 1703–1706. [Google Scholar] [CrossRef] [Scilit]
- Warner, H.K.; Zhao, Y.; Zhang, Y.; Zhang, M.; Lončar, M. DC-stable thin-film lithium niobate modulator at liquid nitrogen temperatures. Opt. Lett. 2025, 50, 5398–5401. [Google Scholar] [CrossRef] [Scilit]
- Holzgrafe, J.; Puma, E.; Cheng, R.; Warner, H.; Shams-Ansari, A.; Shankar, R.; Lončar, M. Relaxation of the electro-optic response in thin-film lithium niobate modulators. Opt. Express 2024, 32, 3619–3631. [Google Scholar] [CrossRef] [Scilit]
- Kirsch, M.; Kießler, C.; Lengeling, S.; Stefszky, M.; Eigner, C.; Herrmann, H.; Silberhorn, C. Photorefraction and in-situ optical cleaning in various types of LiNbO3 waveguides. Opt. Laser Technol. 2026, 193, 114260. [Google Scholar] [CrossRef] [Scilit]
- Celik, O.T.; Ammar, N.Y.; Stokowski, H.S.; Park, T.; Safavi-Naeini, A. Bias-stable Sub-Volt Visible Electro-optic Modulator in Thin-Film Lithium Niobate. In Proceedings of the 2023 IEEE Photonics Conference (IPC); IEEE: Piscataway, NJ, USA, 2023; pp. 1–2. [Google Scholar]
- He, X.K.; Xue, D.F.; Kitamura, K. Defects in lithium niobate crystals and their control. J. Synth. Cryst. 2005, 34, 1–8. [Google Scholar]
- Idris, I.; Sugiura, O. Film Characteristics of Low-Temperature Plasma-Enhanced Chemical Vapor Deposition Silicon Dioxide Using Tetraisocyanatesilane and Oxygen. Jpn. J. Appl. Phys. 1998, 37, 6562–6568. [Google Scholar] [CrossRef] [Scilit]
- Sugak, D.; Zhydachevskii, Y.; Sugak, Y.; Buryy, O.; Ubizskii, S.; Solskii, I.; Schrader, M.; Becker, K.-D. In Situ investigation of optical absorption changes in LiNbO3 during reducing/oxidizing high-temperature treatments. J. Phys. Condens. Matter 2007, 19, 086211. [Google Scholar] [CrossRef] [Scilit]
- Glass, A.M.; Nassau, K.; Negran, T.J. Ionic conductivity of quenched alkali niobate and tantalate glasses. J. Appl. Phys. 1978, 49, 4808–4811. [Google Scholar] [CrossRef] [Scilit]

Disclaimer/Publisher’s Note: The statements, opinions and data contained in all publications are solely those of the individual author(s) and contributor(s) and not of MDPI and/or the editor(s). MDPI and/or the editor(s) disclaim responsibility for any injury to people or property resulting from any ideas, methods, instructions or products referred to in the content. |
© 2026 by the authors. Licensee MDPI, Basel, Switzerland. This article is an open access article distributed under the terms and conditions of the Creative Commons Attribution (CC BY) license.