


Abstract
Phase measuring deflectometry (PMD) is widely employed in automotive intelligent manufacturing for high-precision, large-area inspection of specular and free-form surfaces. However, the conventional three-frequency four-step phase-shifting method requires multiple projected patterns, which reduces measurement efficiency and exhibits poor robustness on highly curved surfaces. To overcome these limitations, this study proposed a novel encoding and decoding strategy that utilized only four phase-shifted fringes and one additional unequal phase-shifted fringe for phase retrieval and unwrapping. Moreover, an amplitude symmetry-based segmentation algorithm was introduced for background segmentation, and a phase self-correction approach was developed to mitigate jump errors in the fringe order map caused by surface imperfections. Experimental results demonstrated that the proposed method significantly improved the measurement efficiency compared with the conventional approach while improving measurement accuracy.
1. Introduction
In the automotive manufacturing industry, the surface quality of painted car bodies directly influences both the aesthetic appearance and long-term durability of vehicles, making it a critical aspect of pre-delivery quality control. Traditional inspection methods, however, rely heavily on manual visual inspection and assisted defect localization, which not only consumes substantial human resources but also poses safety risks when inspecting elevated areas, such as roofs and hoods, often requiring scaffolding or other auxiliary equipment. These subjective and inefficient approaches are increasingly inadequate to meet the growing demand for high-precision and automated surface inspection in modern automotive production. Consequently, the development of non-contact, high-precision optical measurement techniques, particularly phase measuring deflectometry (PMD), has emerged as a crucial pathway to enhance both the efficiency and reliability of vehicle paint surface inspection. PMD has multiple advantages in measuring mirror-like or specular reflective surfaces, including non-destructive testing, a wide dynamic range, simple system configuration, and full-field high-precision measurement capability [1,2,3,4], and therefore has been widely applied to three-dimensional measurement of automotive paint surfaces. However, two main challenges exist in current automotive paint surface inspection: low measurement efficiency, since full-field PMD typically requires phase information from two orthogonal directions to obtain the surface gradient and additional phase-shifted fringe patterns are often needed to perform multi-frequency heterodyne phase unwrapping to handle phase retrieval problems caused by surface discontinuities [5,6,7,8,9], which severely limits the measurement speed; and phase unwrapping errors caused by the properties of automotive paint materials, as the physical characteristics of paint surfaces reduce fringe modulation and the signal-to-noise ratio of the captured images, making phase unwrapping prone to errors. Therefore, improving measurement speed while maintaining measurement accuracy has become one of the key research focuses in automotive paint surface measurement.
To overcome the above challenges, extensive research has been conducted on phase unwrapping algorithms to develop advanced phase unwrapping techniques [10,11,12,13,14,15,16]. According to the computational strategies employed, phase unwrapping methods can generally be divided into three major categories: spatial phase unwrapping [17,18], temporal phase unwrapping, and deep-learning-based phase unwrapping. Spatial phase unwrapping provides a natural and intuitive way to recover continuous phase maps by exploiting spatial continuity, in which the unwrapped phase at each pixel is inferred from its local neighborhood, using methods such as the Goldstein method [5], the quality-guided method [19], the Flynn method [20], and the minimum Lp-norm method [21]. Although these methods require only a single wrapped phase map, they often fail in the presence of surface discontinuities, isolated regions, and complex illumination disturbances [22,23,24].
In contrast, temporal phase unwrapping is known for its high accuracy and robustness and can effectively handle discontinuous surfaces [7,23]. Two representative methods are multi-frequency heterodyne and Gray-code-assisted schemes. However, the need to project a large number of fringe patterns limits the measurement efficiency. In the TPU algorithm, each spatial pixel is processed independently, thereby preventing noise from propagating between pixels. Nevertheless, auxiliary decoding still requires additional projected patterns. Therefore, minimizing the number of projected patterns has become a major research objective. Wang et al. [25] embedded fringe sequence information into N-step phase-shifting patterns to avoid extra projections, but the designed frequency and phase accuracy are constrained by N. Similarly, hybrid patterns that combine sinusoidal and speckle components can reduce the total number of patterns, although speckle signals are highly sensitive to ambient light [26]. An et al. [27] embedded periodic information into phase shifts to reduce the number of required fringe patterns. Although effective for ideal diffuse surfaces, this method is highly prone to fringe-induced errors when measuring semi-transparent or specular materials, making it difficult to meet the requirements of automotive paint surface measurement.
In recent years, deep learning has developed rapidly and has been widely applied in many fields [28,29]. It has also been extensively used to address various problems in structured-light 3D reconstruction [30,31,32]. Recently, an improved method was proposed that combines an encoder–decoder network with a pixel-wise classification layer to directly classify the wrapped order of all pixels. However, since the classification accuracy cannot always be guaranteed, post-processing (e.g., clustering-based smoothing) is usually required to optimize the results, which are then added to the wrapped phase to reconstruct the true phase [33]. More critically, any misclassification leads to an integer-multiple error of (at least ), which is unacceptable in practical applications. Dardikman and Shaked proposed using a neural network to directly map the relationship between the wrapped phase and the unwrapped phase, but only preliminary results were demonstrated [34]. Overall, deep-learning-based phase unwrapping still suffers from the limitation of insufficient generalization performance.
2. Materials and Methods
2.1. Phase Shift Encoding with Embedded Fringe Order
The encoding pattern set comprises five images in total: four conventional phase-shifting patterns and an encoding pattern designed in the paper. The traditional four-step phase-shifting formula can be expressed by the following equation:
where , and phase shift . Here, is the background intensity, is the modulation, and is the encoded phase. They can be derived from the following equations:
Unlike traditional temporal phase unwrapping schemes, this paper embeds the fringe order information into the phase-shift values. By encoding these phase-shift values, the unwrapping of the wrapped phase can be achieved with only a single additional pattern. The mapping of the encoded phase shift values onto the grayscale distribution of the projected pattern can be represented by the following equation:
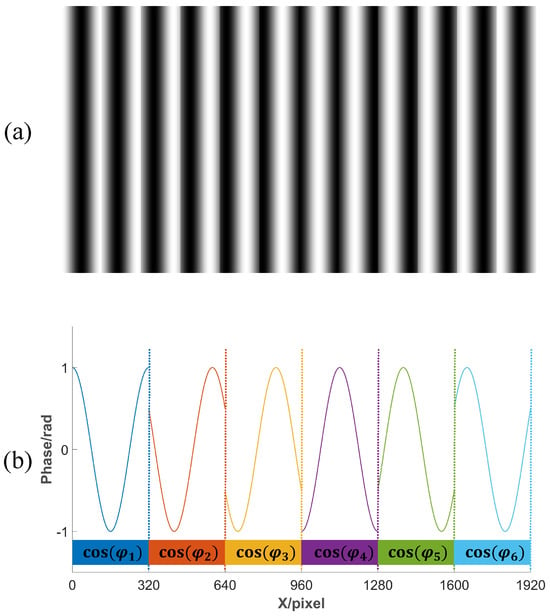
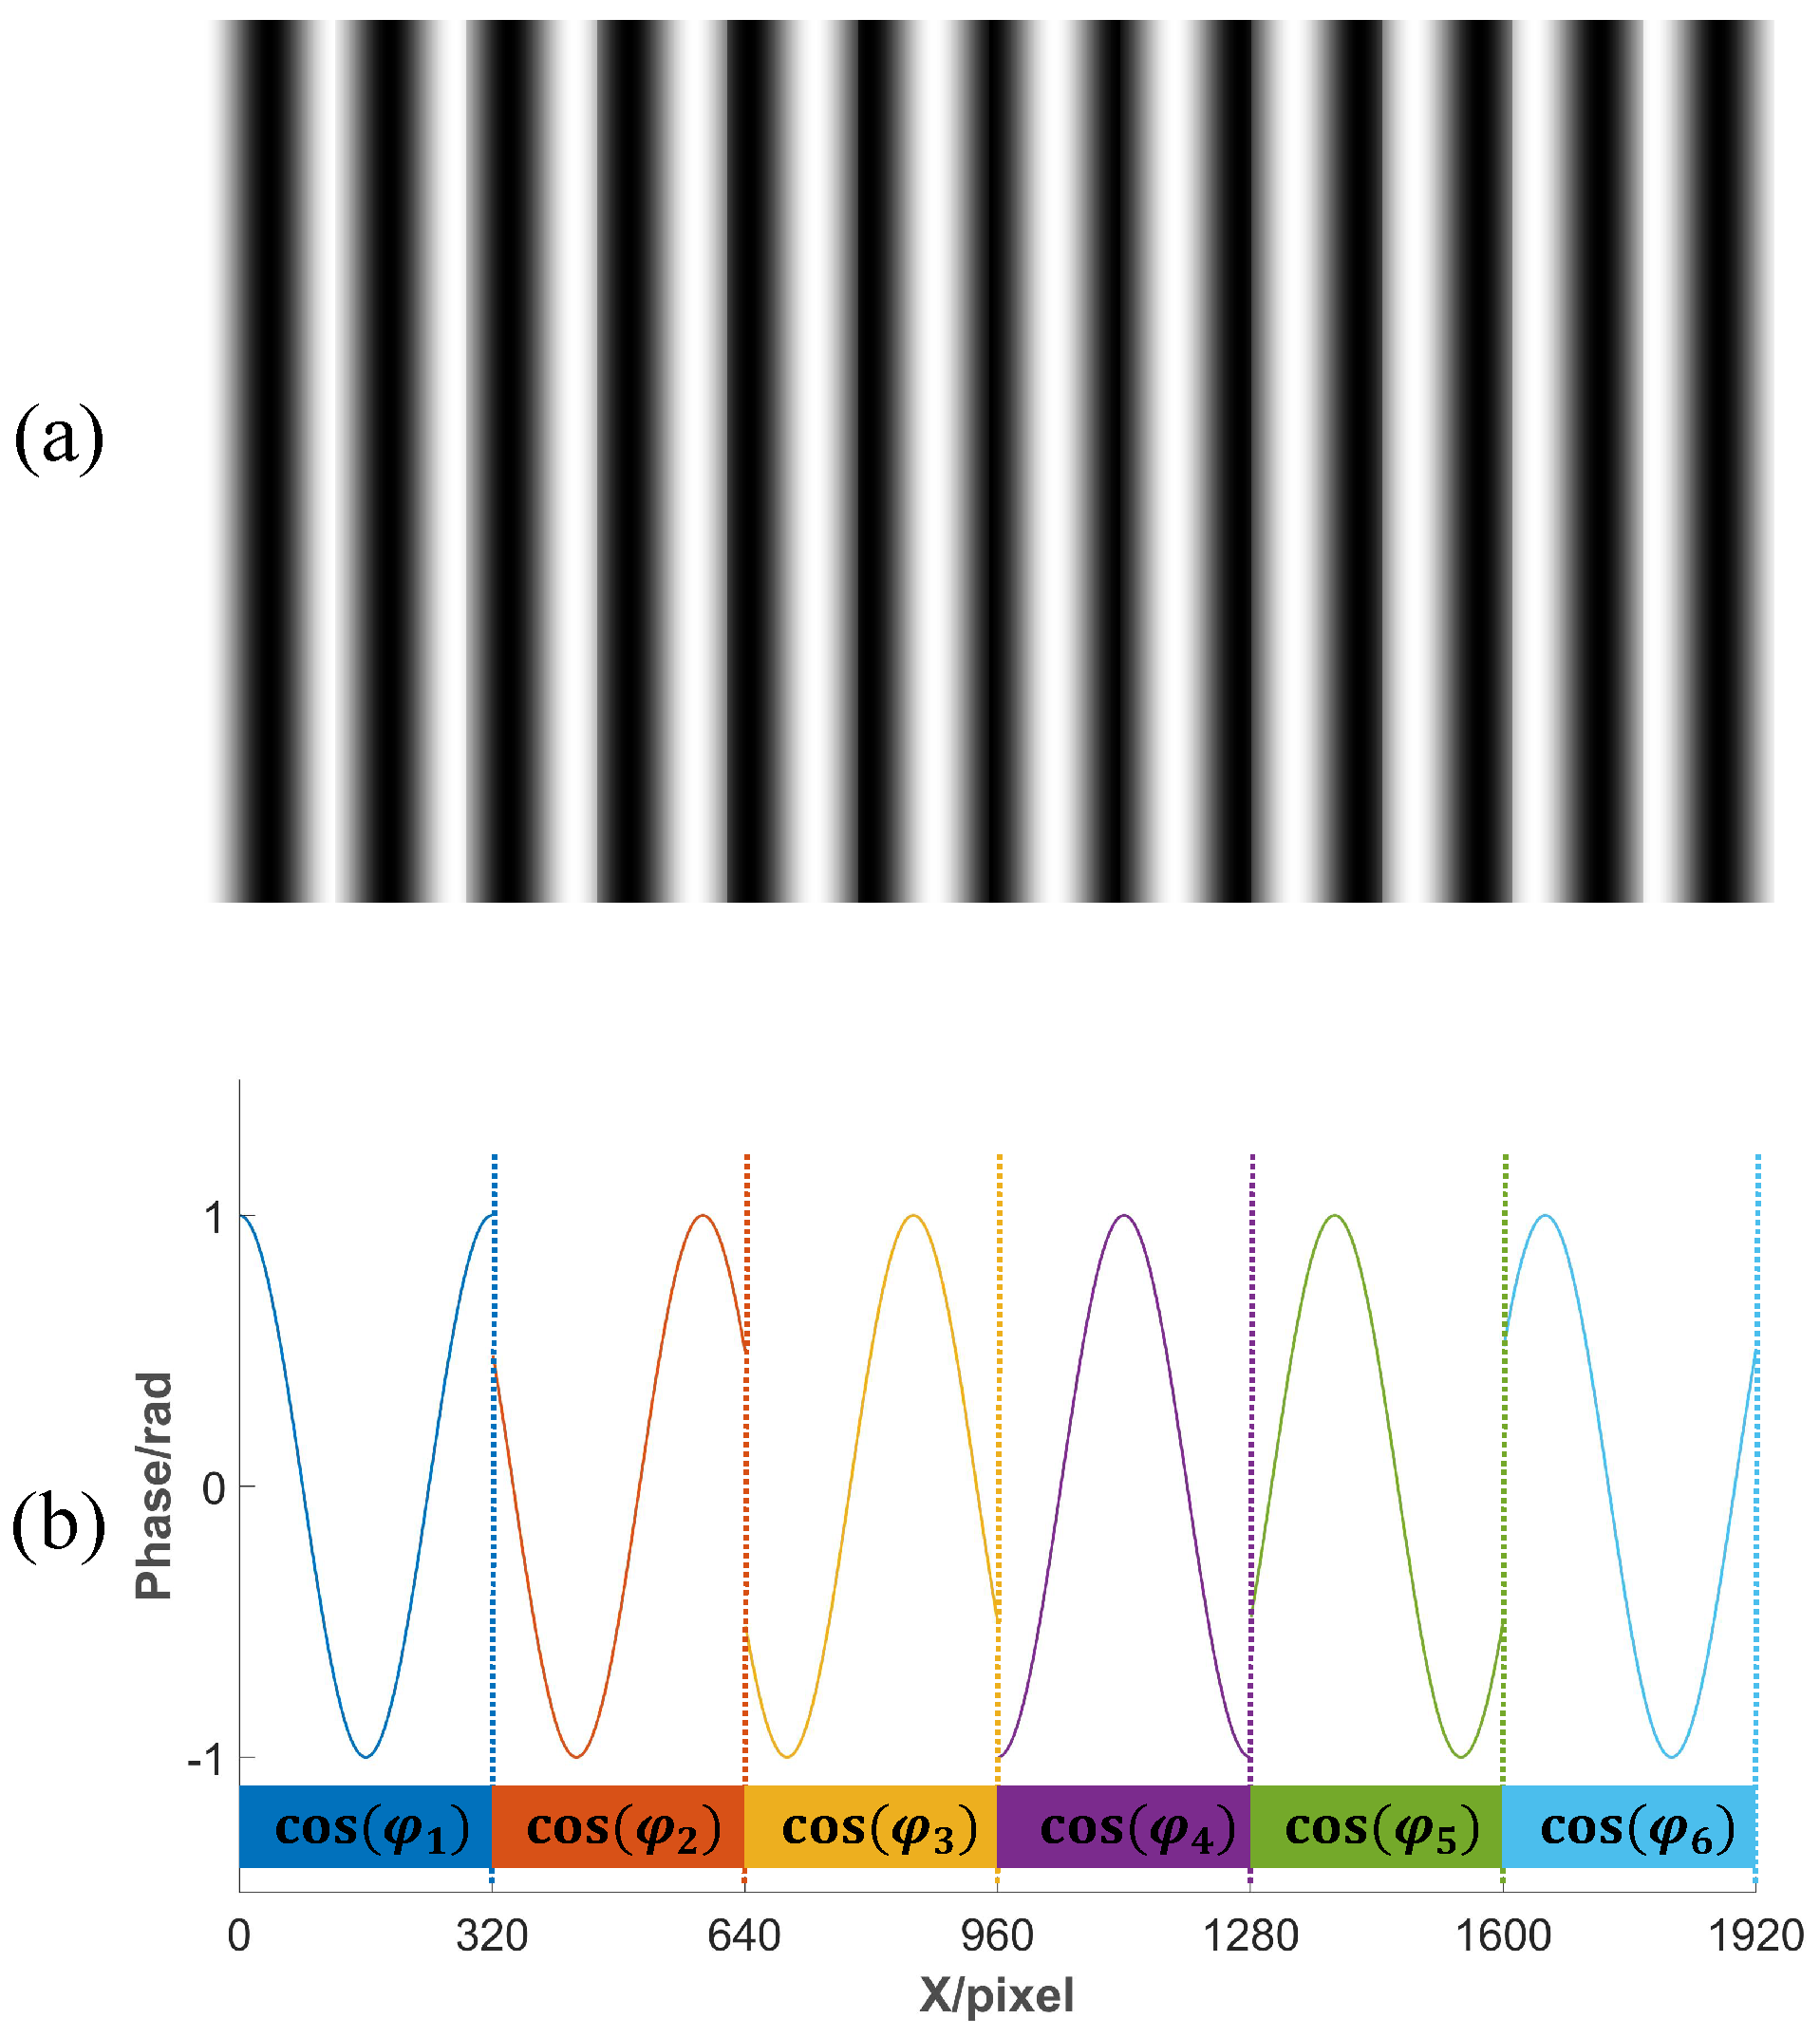
where , where , K is the total number of periods, and . According to Equation (3), the fringe pattern obtained after embedding the periodic information into the phase shift is shown in Figure 1a,b, which present the amplitude map of the cosine values resulting from encoding six periods, corresponding to .
Figure 1.
Coding Pattern. (a) Fringe pattern encoded by phase shift; (b) encoding of phase shifts for six periods.
2.2. Effective Segmentation of Encoding Regions
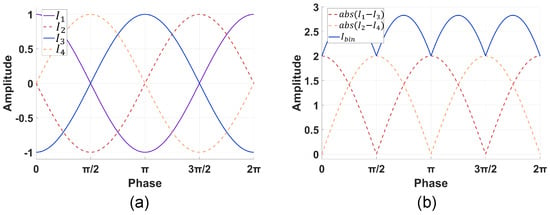
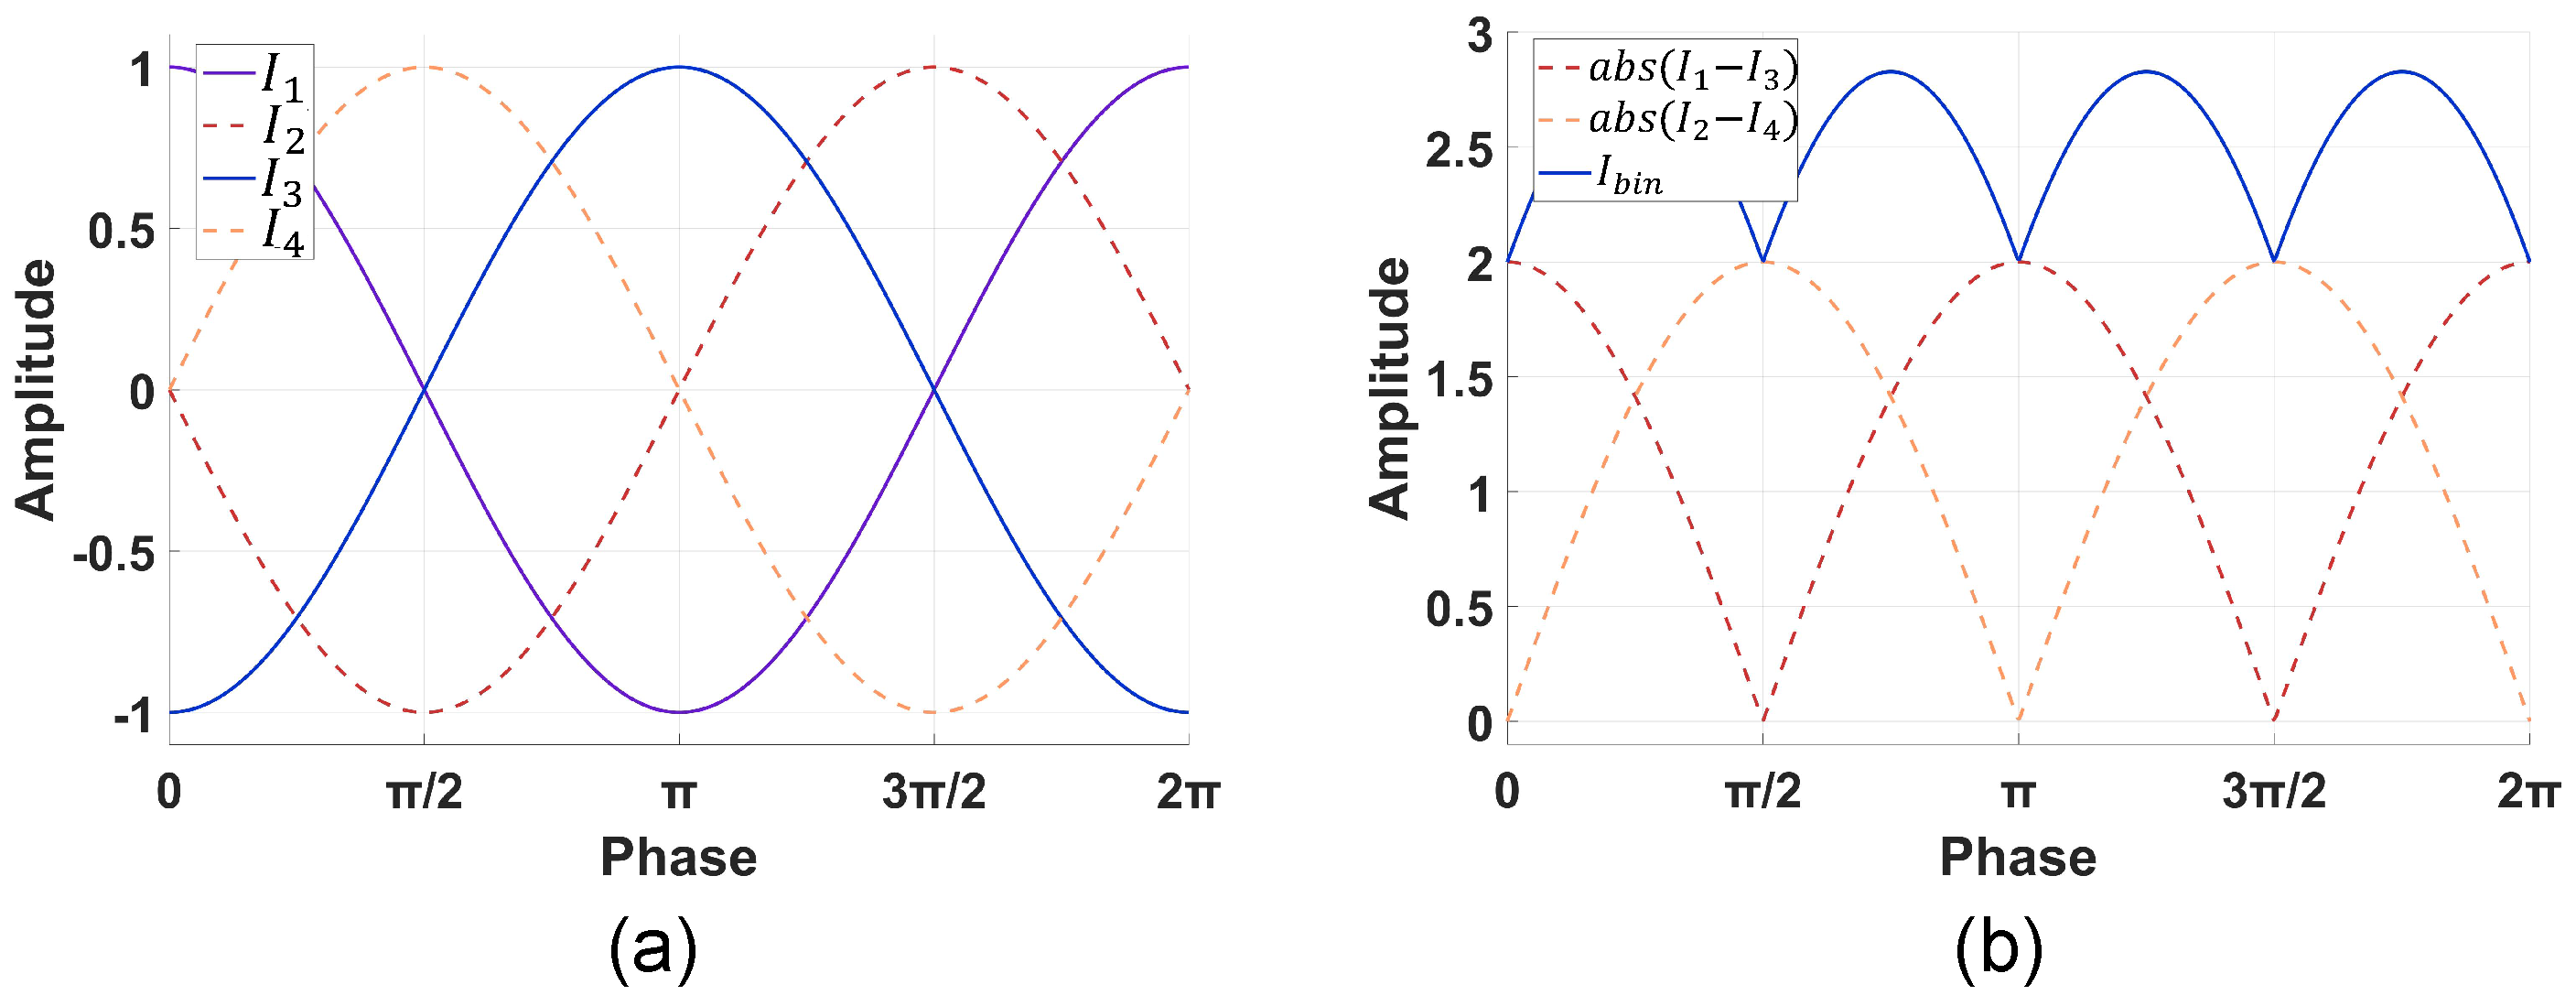
After projecting the five encoded patterns onto the object surface, they are sequentially captured by a camera for decoding. The first step in the decoding process is to separate the encoded regions from the non-encoded regions. Our approach aims to maximize the contrast between these two areas to facilitate binary segmentation. According to Equation (4), by calculating the differences between phase shift diagram, taking the absolute values, and then summing these values, the overall amplitude can be amplified, as shown in Figure 2a,b. Since the grayscale values of the background region remain approximately consistent across different images, performing image subtraction can reduce the grayscale values of the background. This process enhances the contrast between the encoded region and the background:
Figure 2.
Schematic of the regional contrast enhancemenfiguret principle. (a) Amplitude variation in single-cycle four-step phase shifting; (b) principle of amplitude stretching in the encoded region.
Subsequently, a threshold is applied to to perform binarization, achieving the segmentation of the encoded regions.
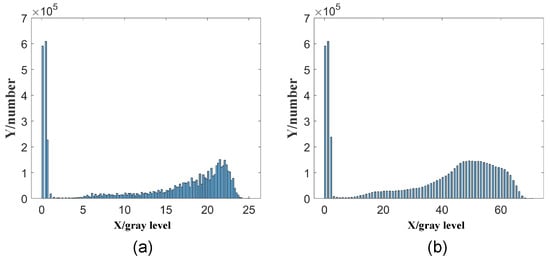
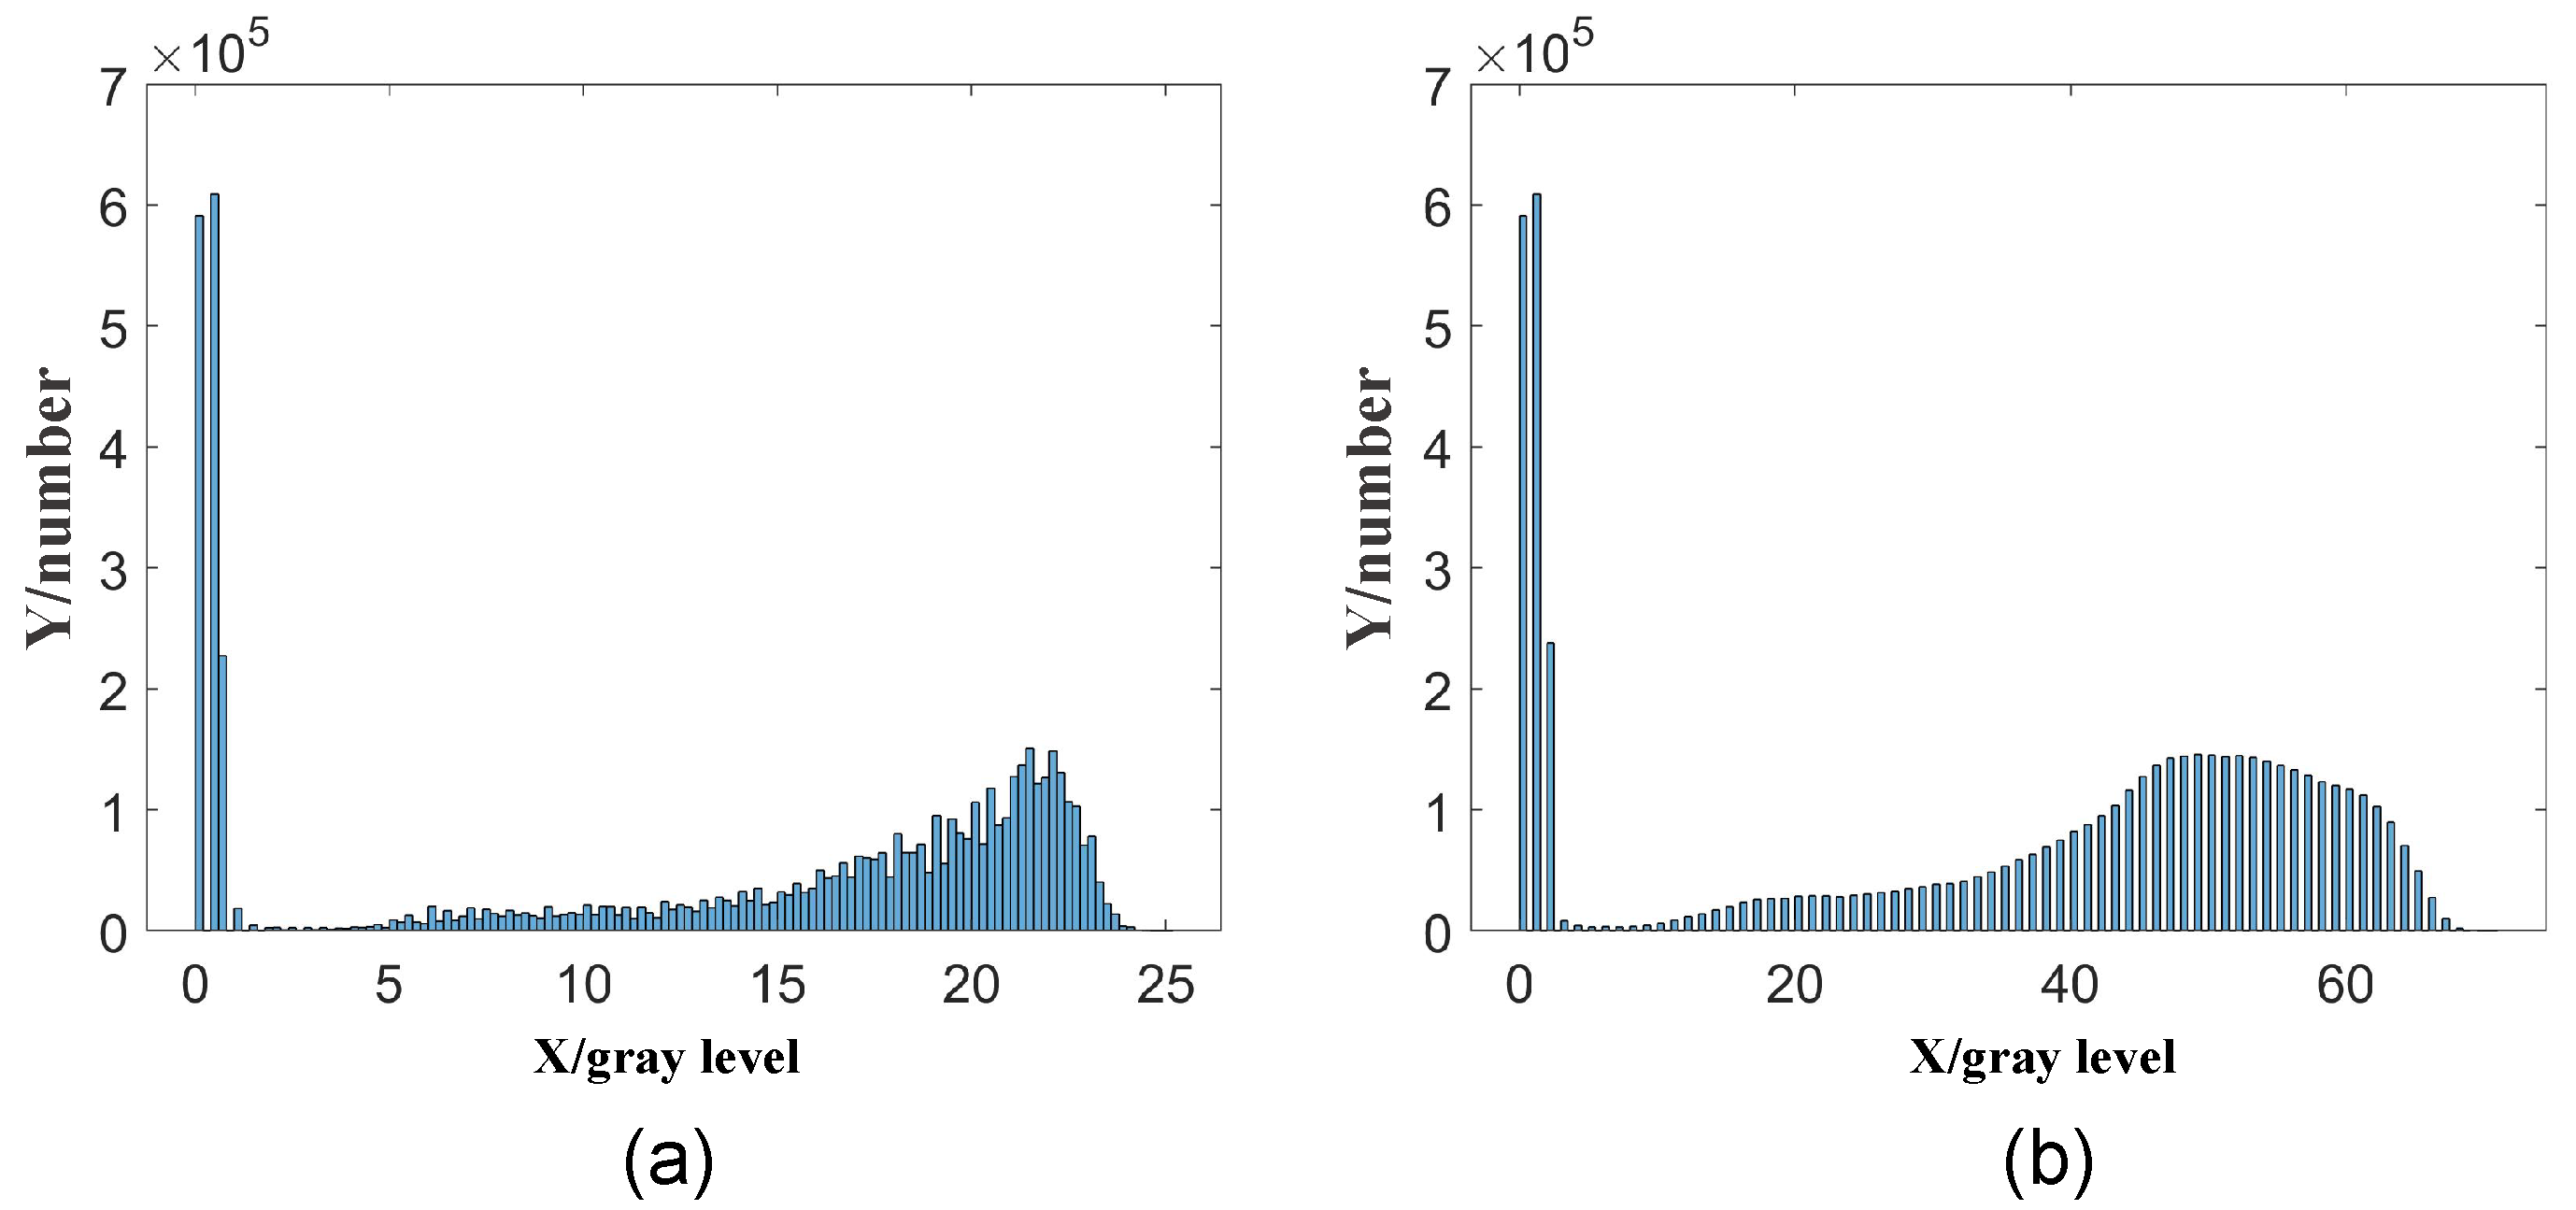
Compared to the segmentation using modulation b, this segmentation method has two advantages. First, the computation time is reduced. The calculation of modulation involves squaring, summing, square rooting, and division, and outputs floating-point data, whereas the method proposed in this paper only requires subtraction, absolute value operation, addition, and outputs integer data, resulting in lower time consumption. Second, the histogram of obtained by this method is smoother, as shown in Figure 3, which is more conducive to finding the minimum value as an automatic threshold for segmentation.
Figure 3.
Histogram of the Image. (a) Histogram of modulation b; (b) histogram of .
2.3. Determination of the Fringe Order Map
The determination of the fringe order is based on the difference between and , namely . The parameters a, b, and can be retrieved from the four-step phase-shifting fringe patterns. Subsequently, the parameter can be determined based on them:
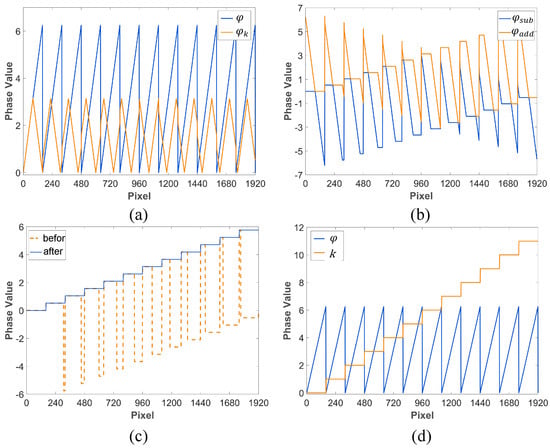
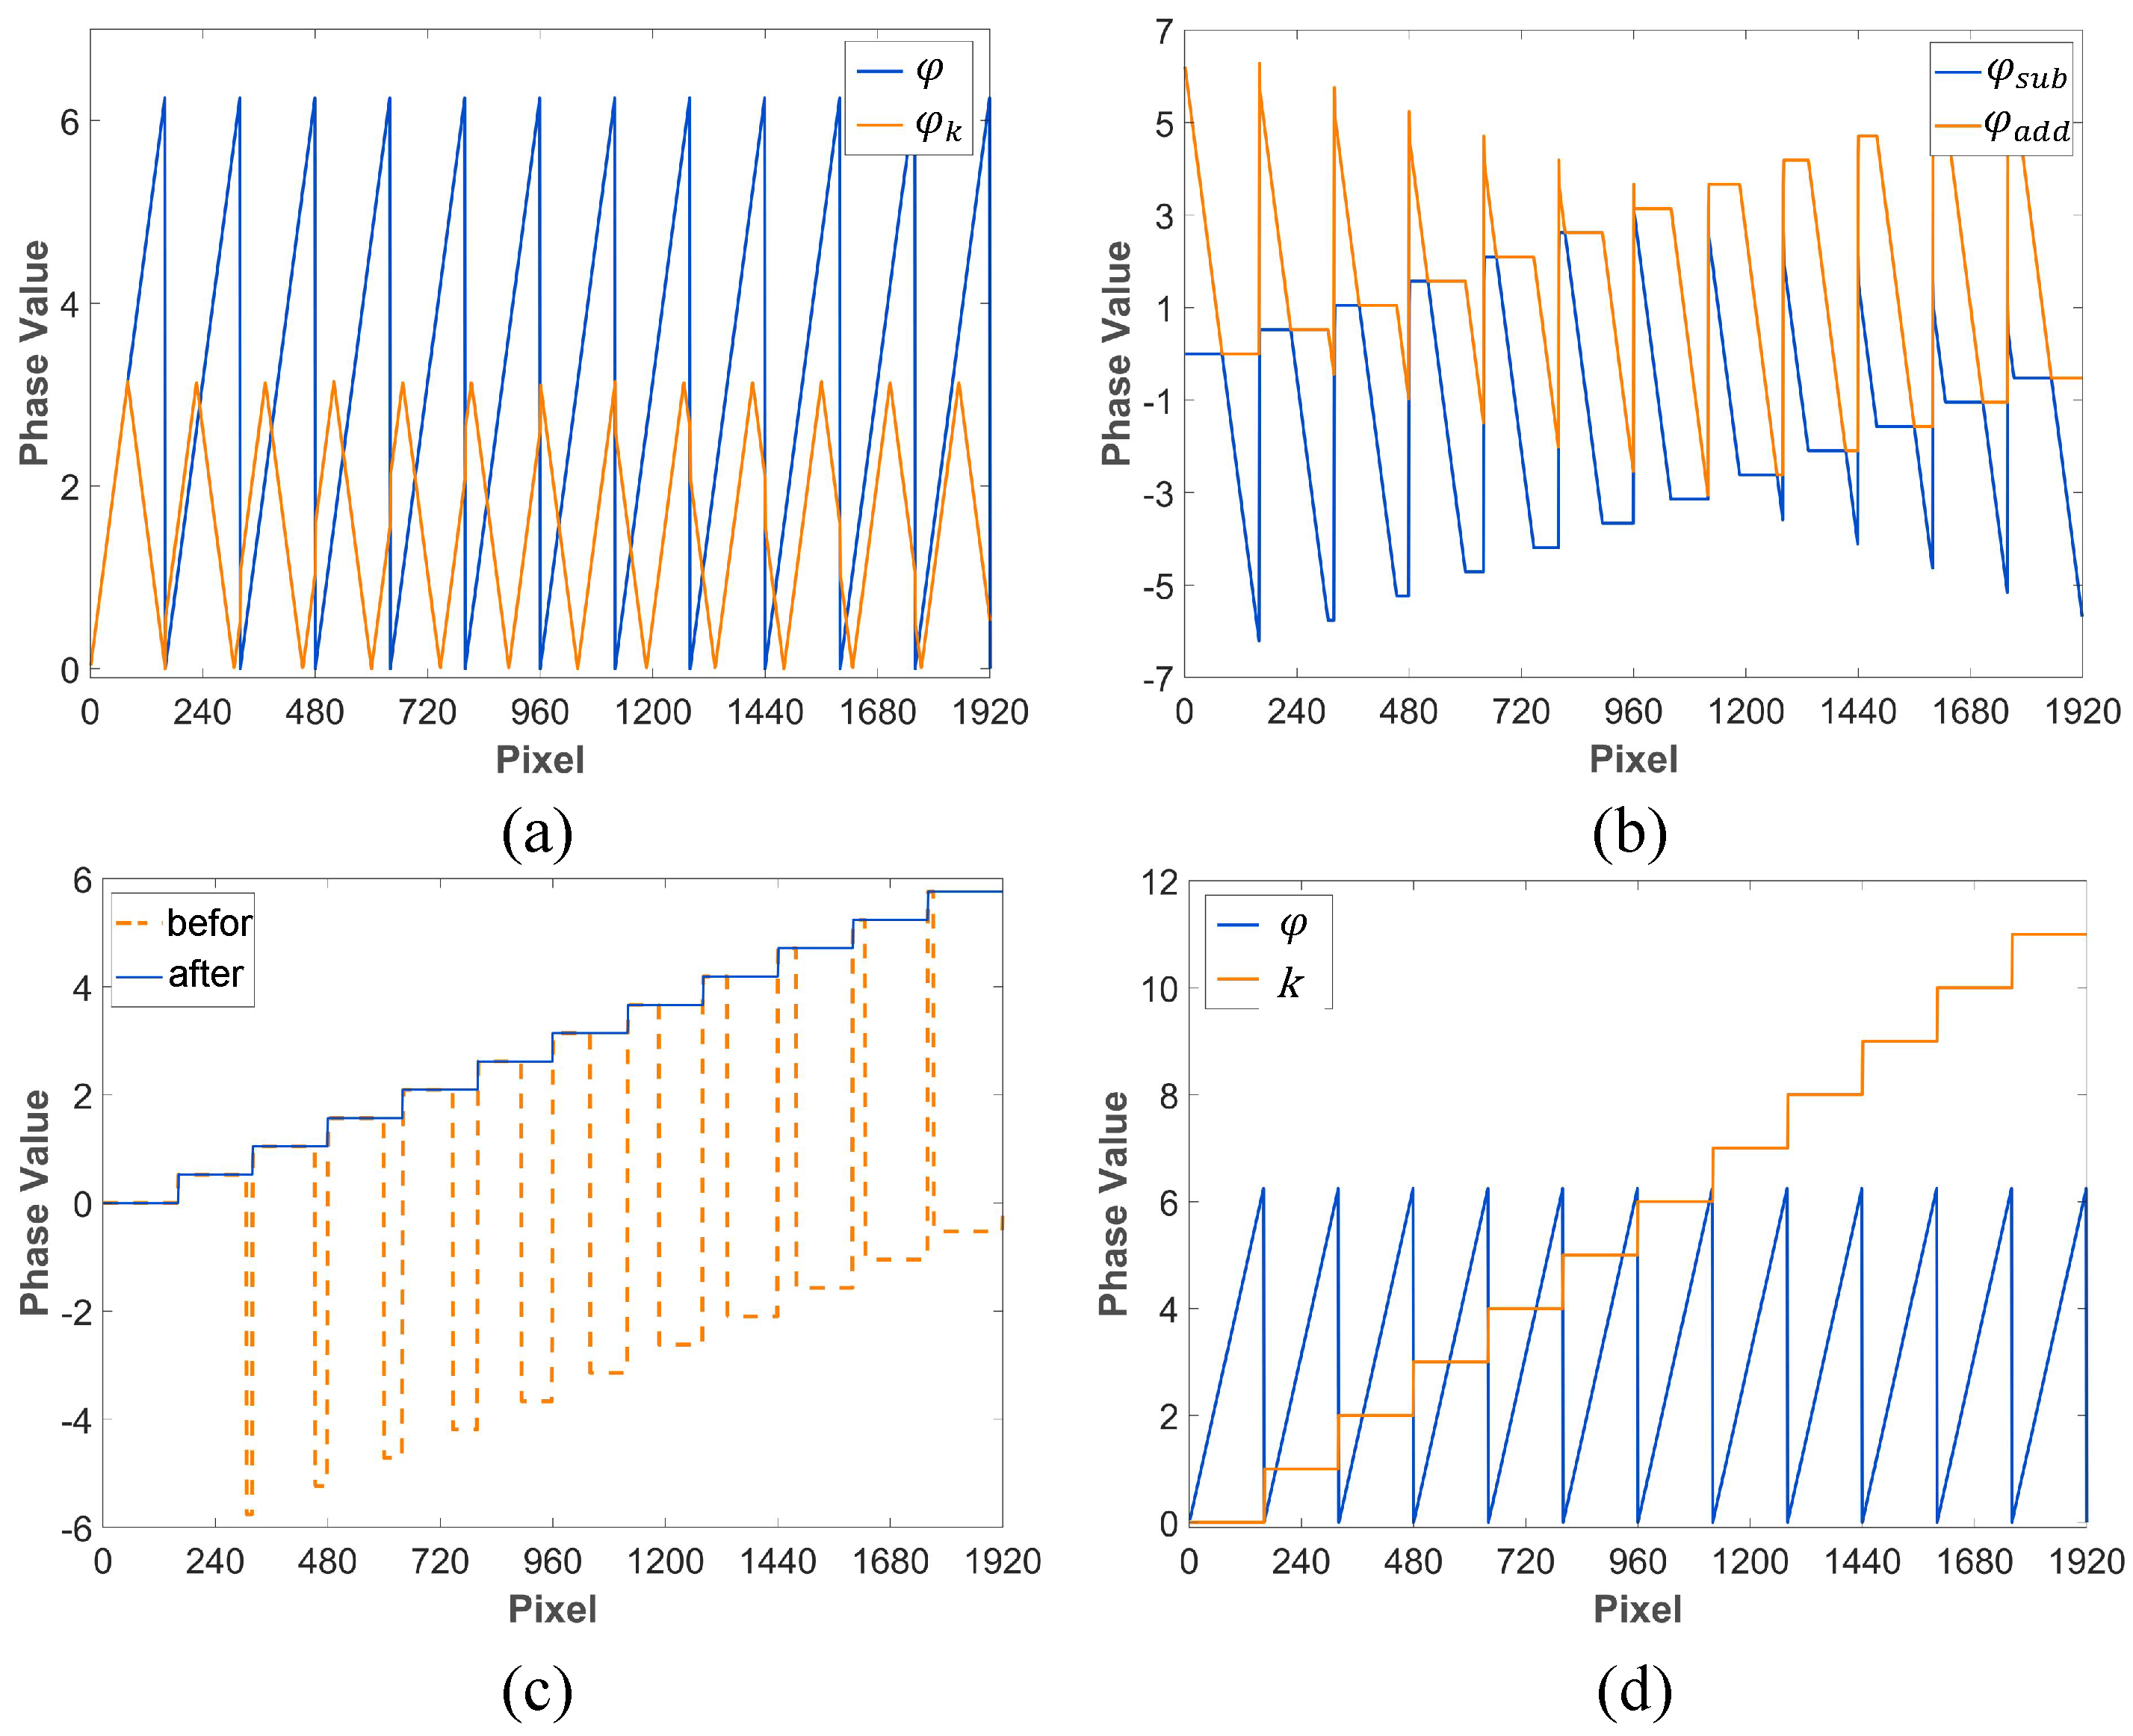
As illustrated in Figure 4a, the reverse cosine operation confines to a triangular pattern , whereas exhibits a sawtooth pattern . These two waveforms are characterized by a periodic parallel or symmetric relationship, with both the parallel segment and the symmetry axis defined by for the k-th period. Leveraging these properties, we can subsequently derive the subtracting phase and the adding phase :
Figure 4.
Decoding process. (a) Wrapped phase and coded phase; (b) phase addition and phase subtraction; (c) before and after orientation alignment; (d) wrapped phase and fringe order.
As shown in Figure 4b, the phase shift encoding quantity , which is alternately embedded within patterns and , can be extracted by utilizing the horizontal gradients of and :
To achieve phase unwrapping, we add a compensation to all negative values in the retrieved phase , as shown in Figure 4c:
The fringe order k for each pixel can be determined by the following equation:
2.4. Self-Correction of Absolute Phase
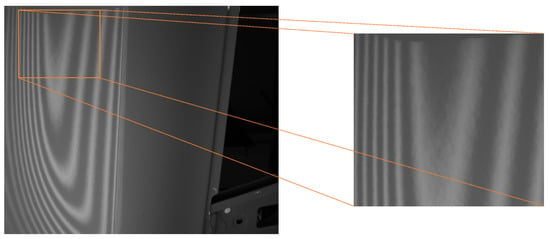
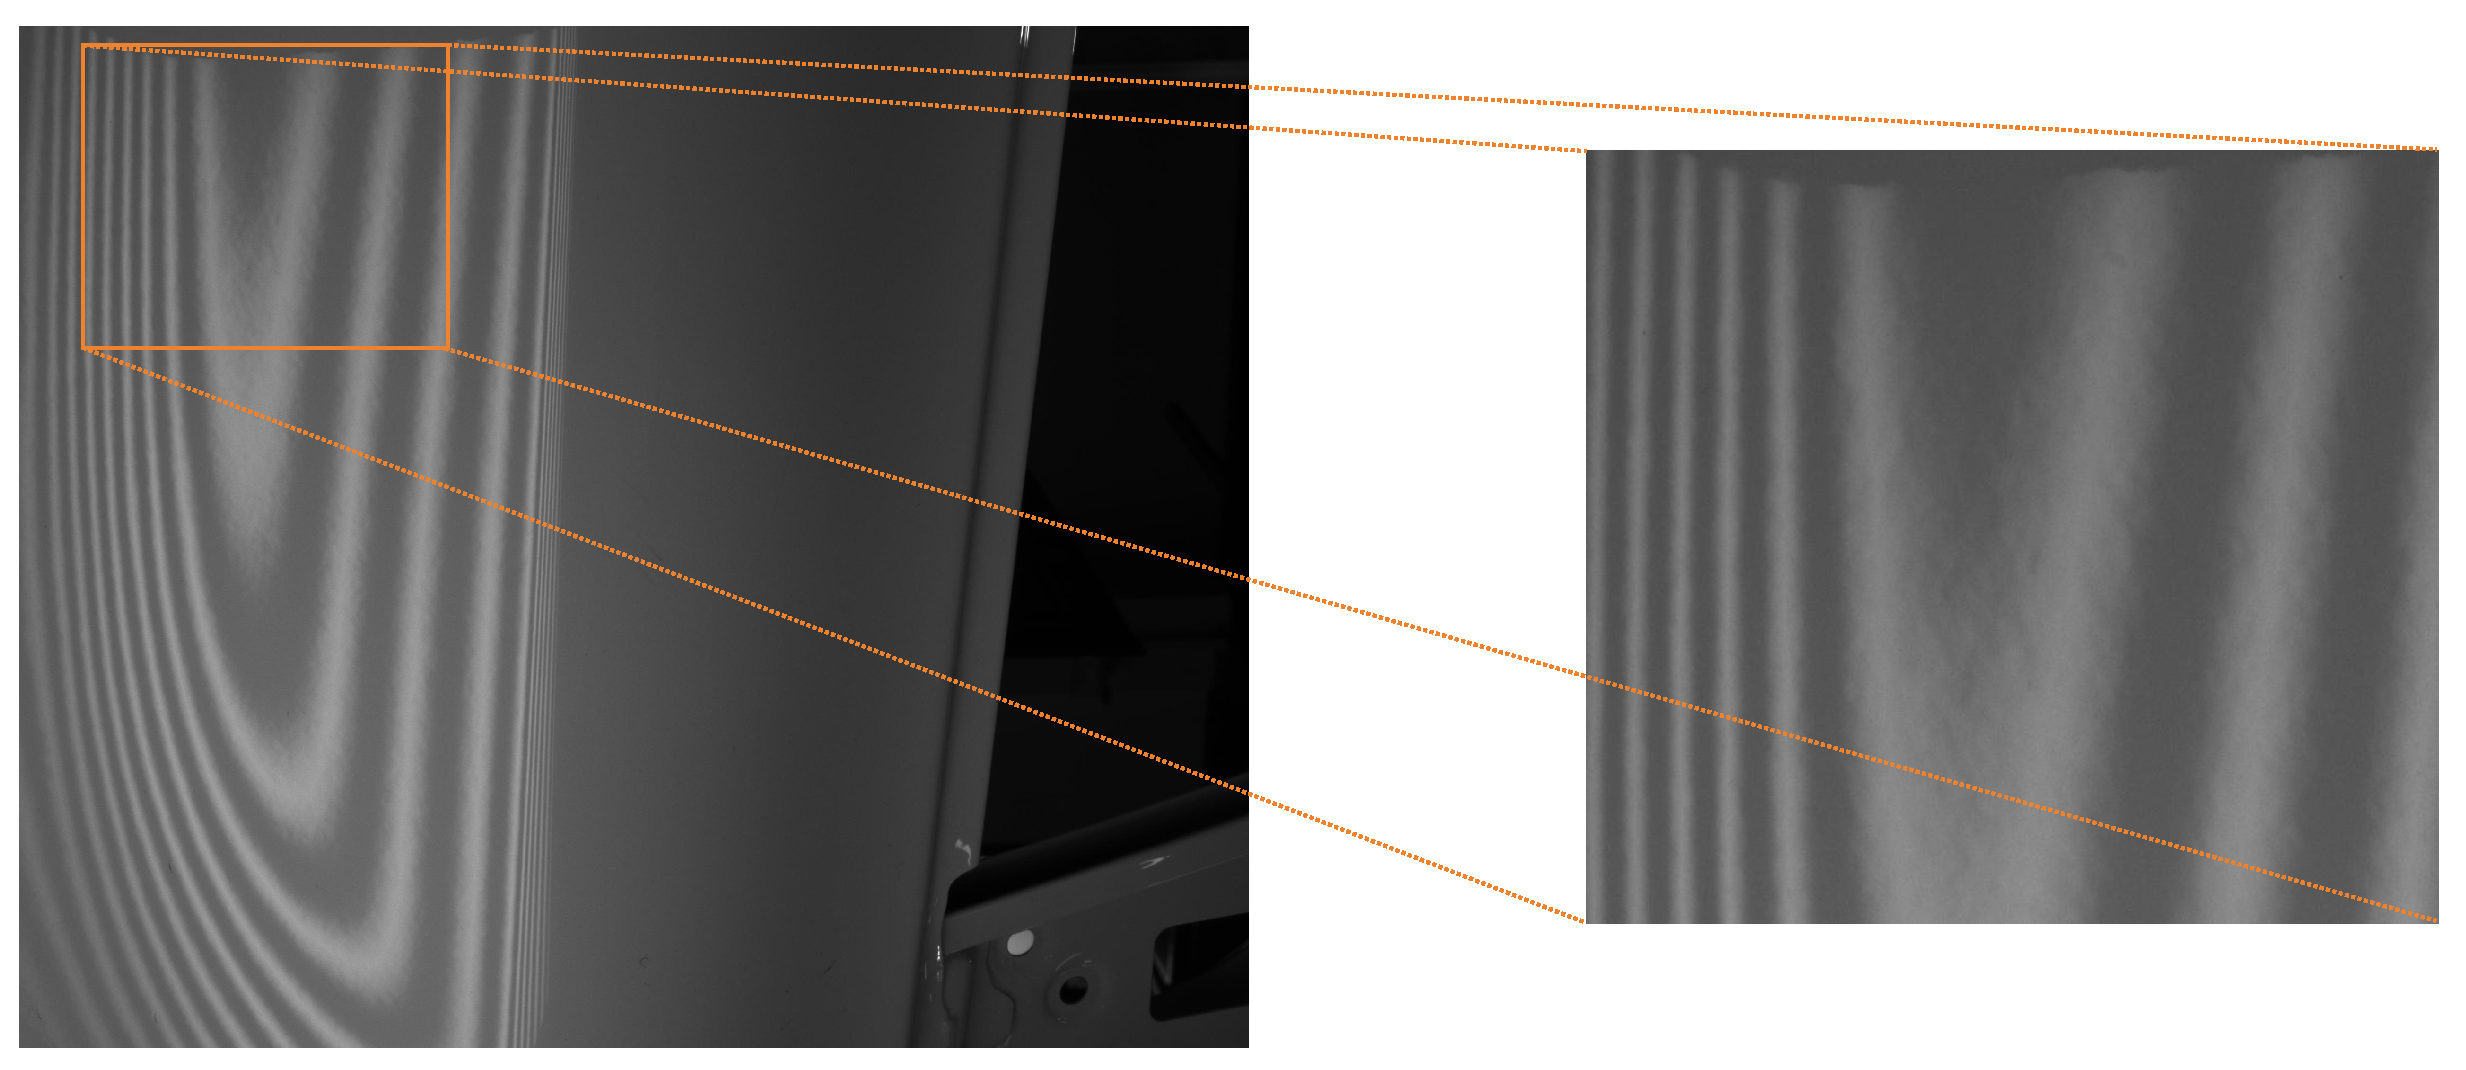
Although the series encoding and decoding process is theoretically sound, it poses significant challenges in the practical measurement of vehicle paint surfaces, manifesting as considerable measurement errors. The root cause of this issue is the “orange peel” effect on the paint surface, combined with interference from ambient light and inter-reflections. As shown in Figure 5, the quality of the acquired fringe pattern is very poor. Using such low-quality images as input will undoubtedly increase the difficulty of decoding.
Figure 5.
The influence of orange peel effect on fringes.
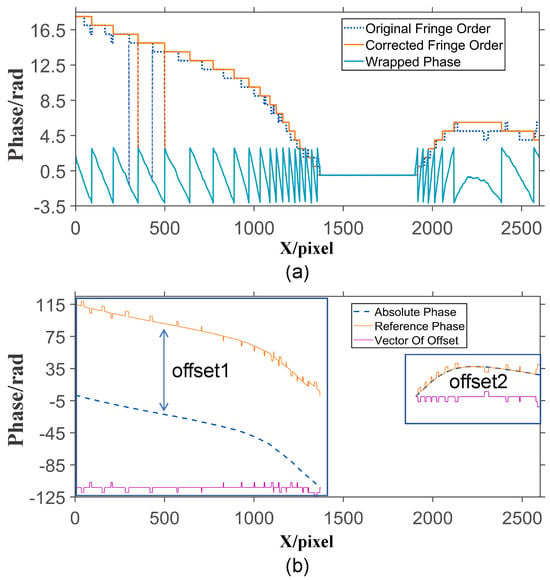
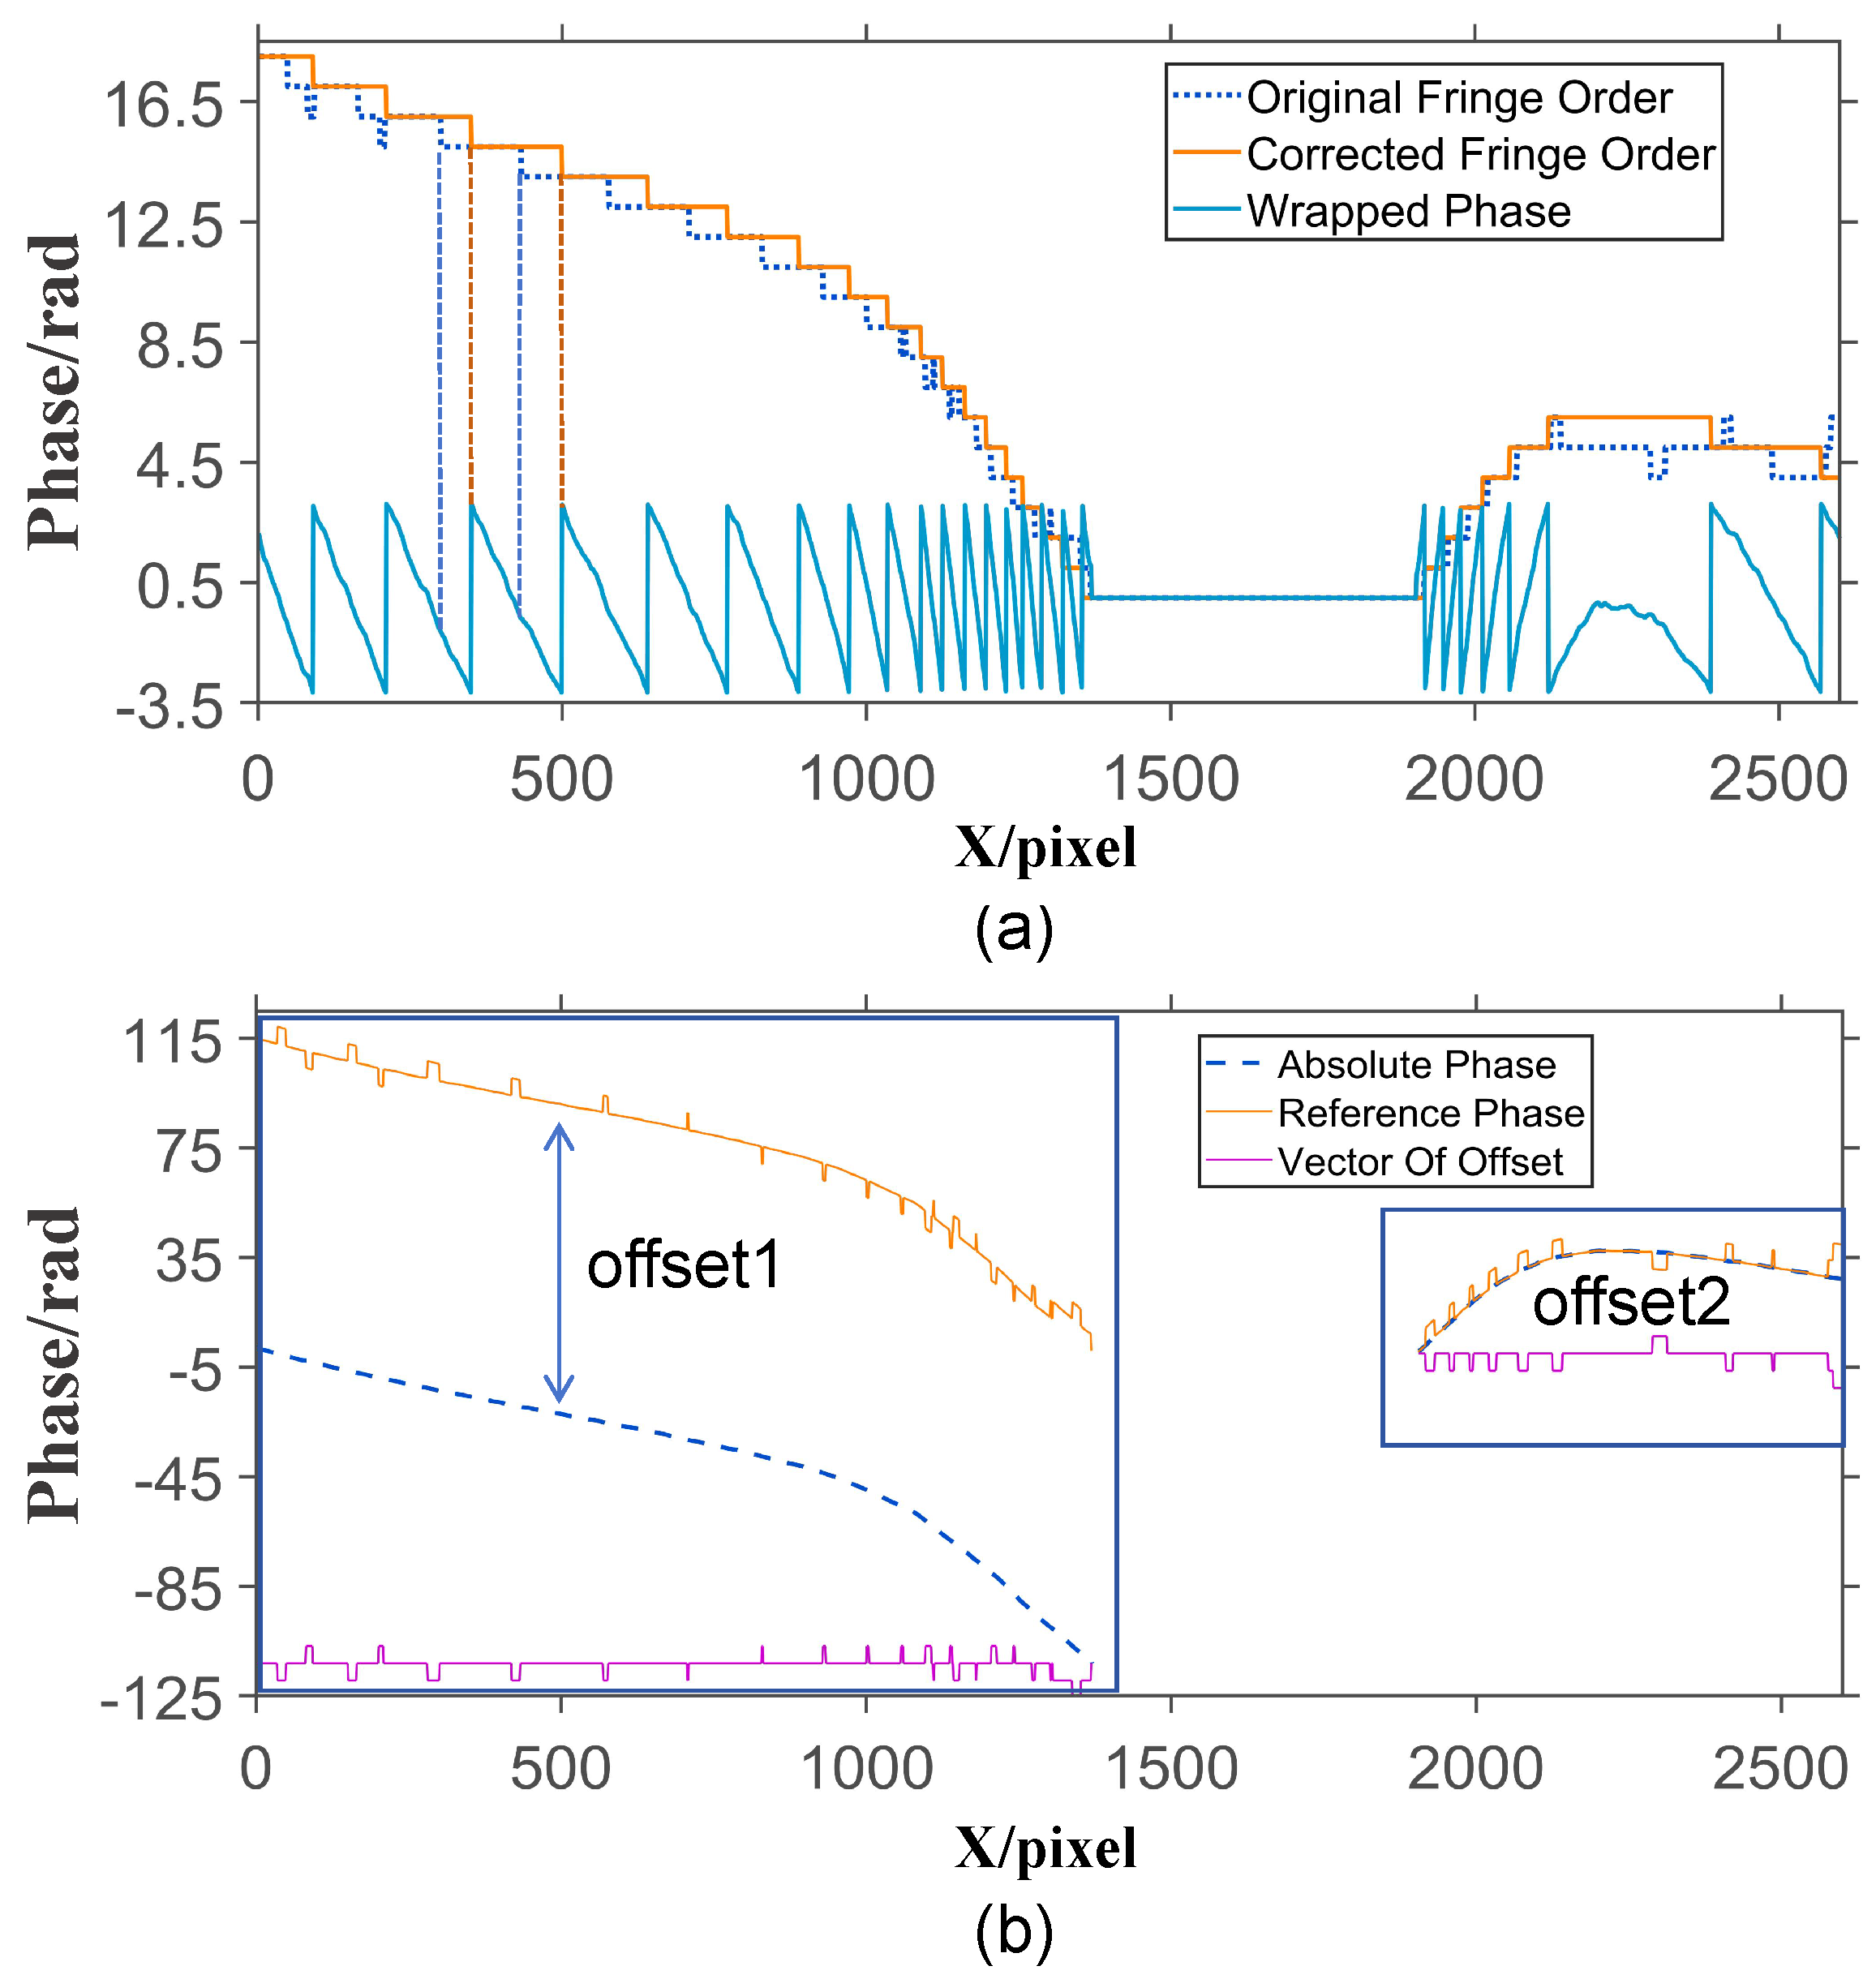
The accumulation of various errors during temporal phase unwrapping results in misalignment between the decoded fringe order map and the actual fringe periods, as shown in Figure 6a. Our method is specifically designed for scenarios involving relatively smooth surfaces, such as vehicle paint finishes. In such contexts, the phase in continuous regions is expected to remain consistent without abrupt changes, except at isolated local points. The encoding and decoding approach described in the paper often introduces repeated phase-jump artifacts in practical measurements, even though the resolved phase in most regions is accurate (with a signal-to-noise ratio of at least 0.5).
Figure 6.
Principle diagram of absolute phase self correction. (a) Fringe order map before and after correction; (b) absolute phase before correction and reference phase.
Therefore, by integrating spatial information (to ensure smoothness of the absolute phase within continuous regions) and temporal information (to verify the correctness of the phase across most of the measured area), our algorithm achieves self-correction of the absolute phase.
First, the correction of the Absolute Phase is applied individually to each isolated region. As shown in Figure 6b, this particular row contains two isolated regions that must be corrected separately. The first step of the correction algorithm involves spatially unwrapping the Wrapped Phase along the encoding direction, producing the result indicated by the Absolute Phase in Figure 6b. The Reference Phase in Figure 6b illustrates the initial absolute phase unwrapped by the encoding and decoding method proposed in this paper. Subtracting the vector of Absolute Phase from the vector of Reference Phase yields the deviation vector Offset, as illustrated in Figure 6b. The deviation offset1, offset2 to be added to the absolute phase corresponds to the mode of the offset vector, as shown in the phase plot in Figure 6b. Adding offset1 to the Absolute Phase yields the corrected absolute phase. As shown in Figure 6b, the fringe order map of the corrected phase demonstrates perfect alignment with the fringe periods. The same method is applied to the isolated region on the right side of Figure 6a, where offset2 is calculated to achieve phase self-correction.
The correction algorithm is applied to all rows, resulting in the absolute phase shown in Figure 7a. However, since the initial correction only incorporates horizontal reference information, the calculation of global deviation becomes prone to errors when the isolated regions in the horizontal direction are small. To address this limitation, a second correction is performed by incorporating vertical reference information. This step follows a procedure similar to the first correction, but uses the output of the initial correction as the input for spatial unwrapping. The result after the second correction is shown in Figure 7b.
Figure 7.
Absolute phase self-correction results. (a) First self correction result; (b) second self correction result.
3. Experiments
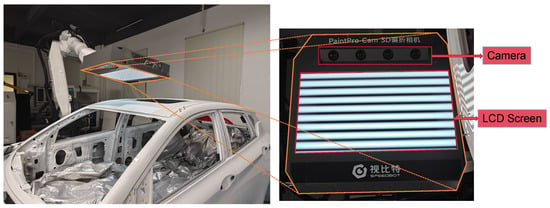
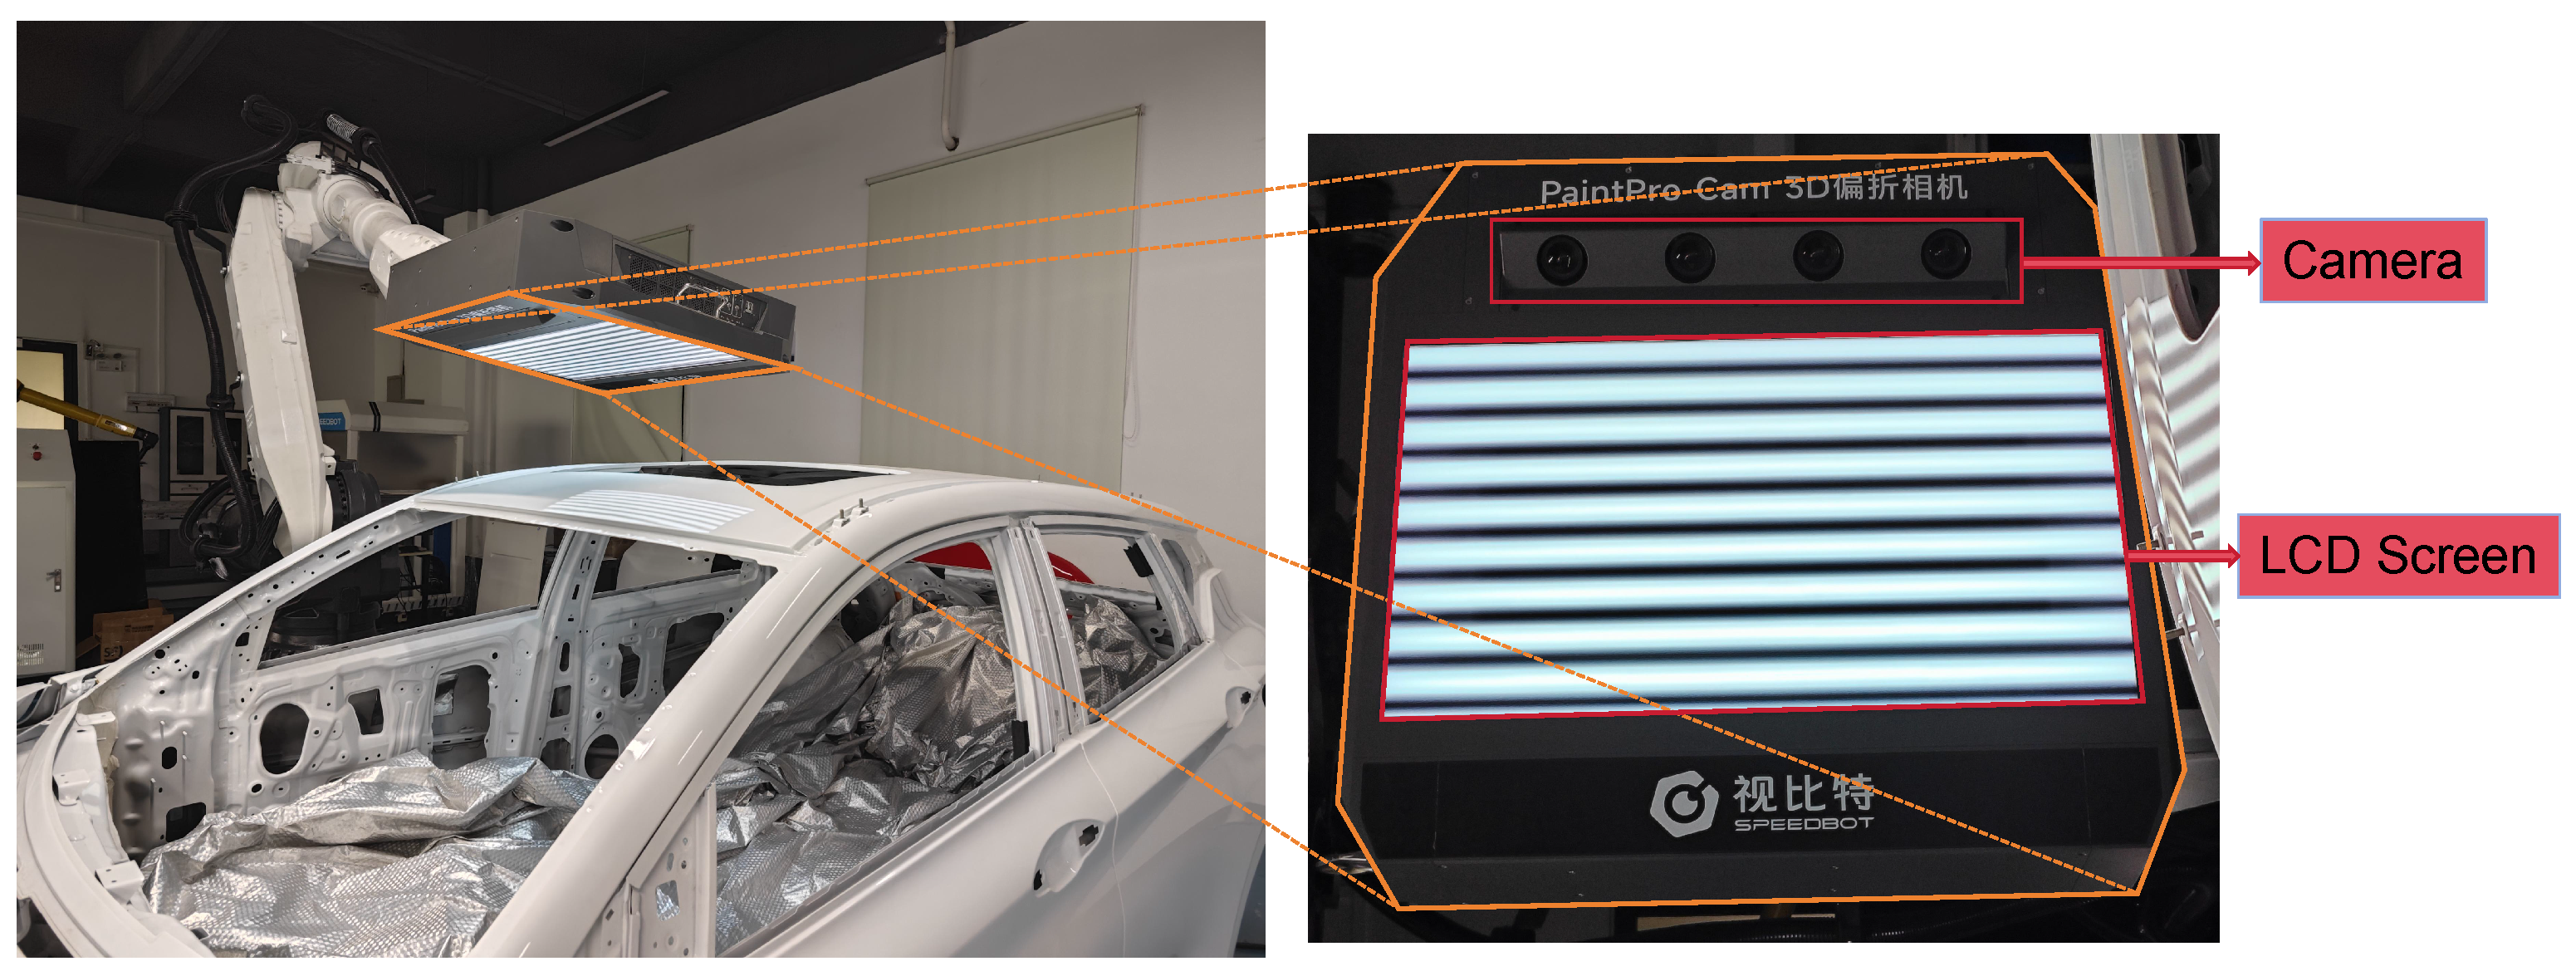
We conducted various experiments and tests on PaintPro at Hunan SpeedBot Robotics Ltd., Changsha, China. Figure 8 shows our system composition of PaintPro, which is built around a 23.8-inch LCD screen with a resolution of 1920 × 1080 (pixel pitch ≈ 0.2745 mm) and a refresh rate of 20 fps, paired with a Daheng ME2S-560-70U3M camera (resolution 2600 × 2160, pixel size 2.5 µm). When the display fills the camera’s field of view—as in our calibration setup—this configuration yields a spatial resolution on the display plane of approximately 0.20 mm horizontally and 0.14 mm vertically. In practical terms, this means the system operates in an oversampled regime where light from each display pixel is captured by about 2.7 camera pixels on average. This oversampling is instrumental for our phase measuring deflectometry approach, as it reduces discretization artifacts from the screen and provides the sub-pixel phase precision that underpins the robustness of the proposed unwrapping algorithm.
Figure 8.
Photograph of the PMD system.
3.1. Determination of the Fringe Order
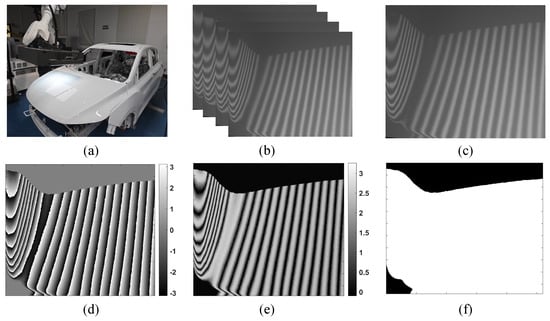
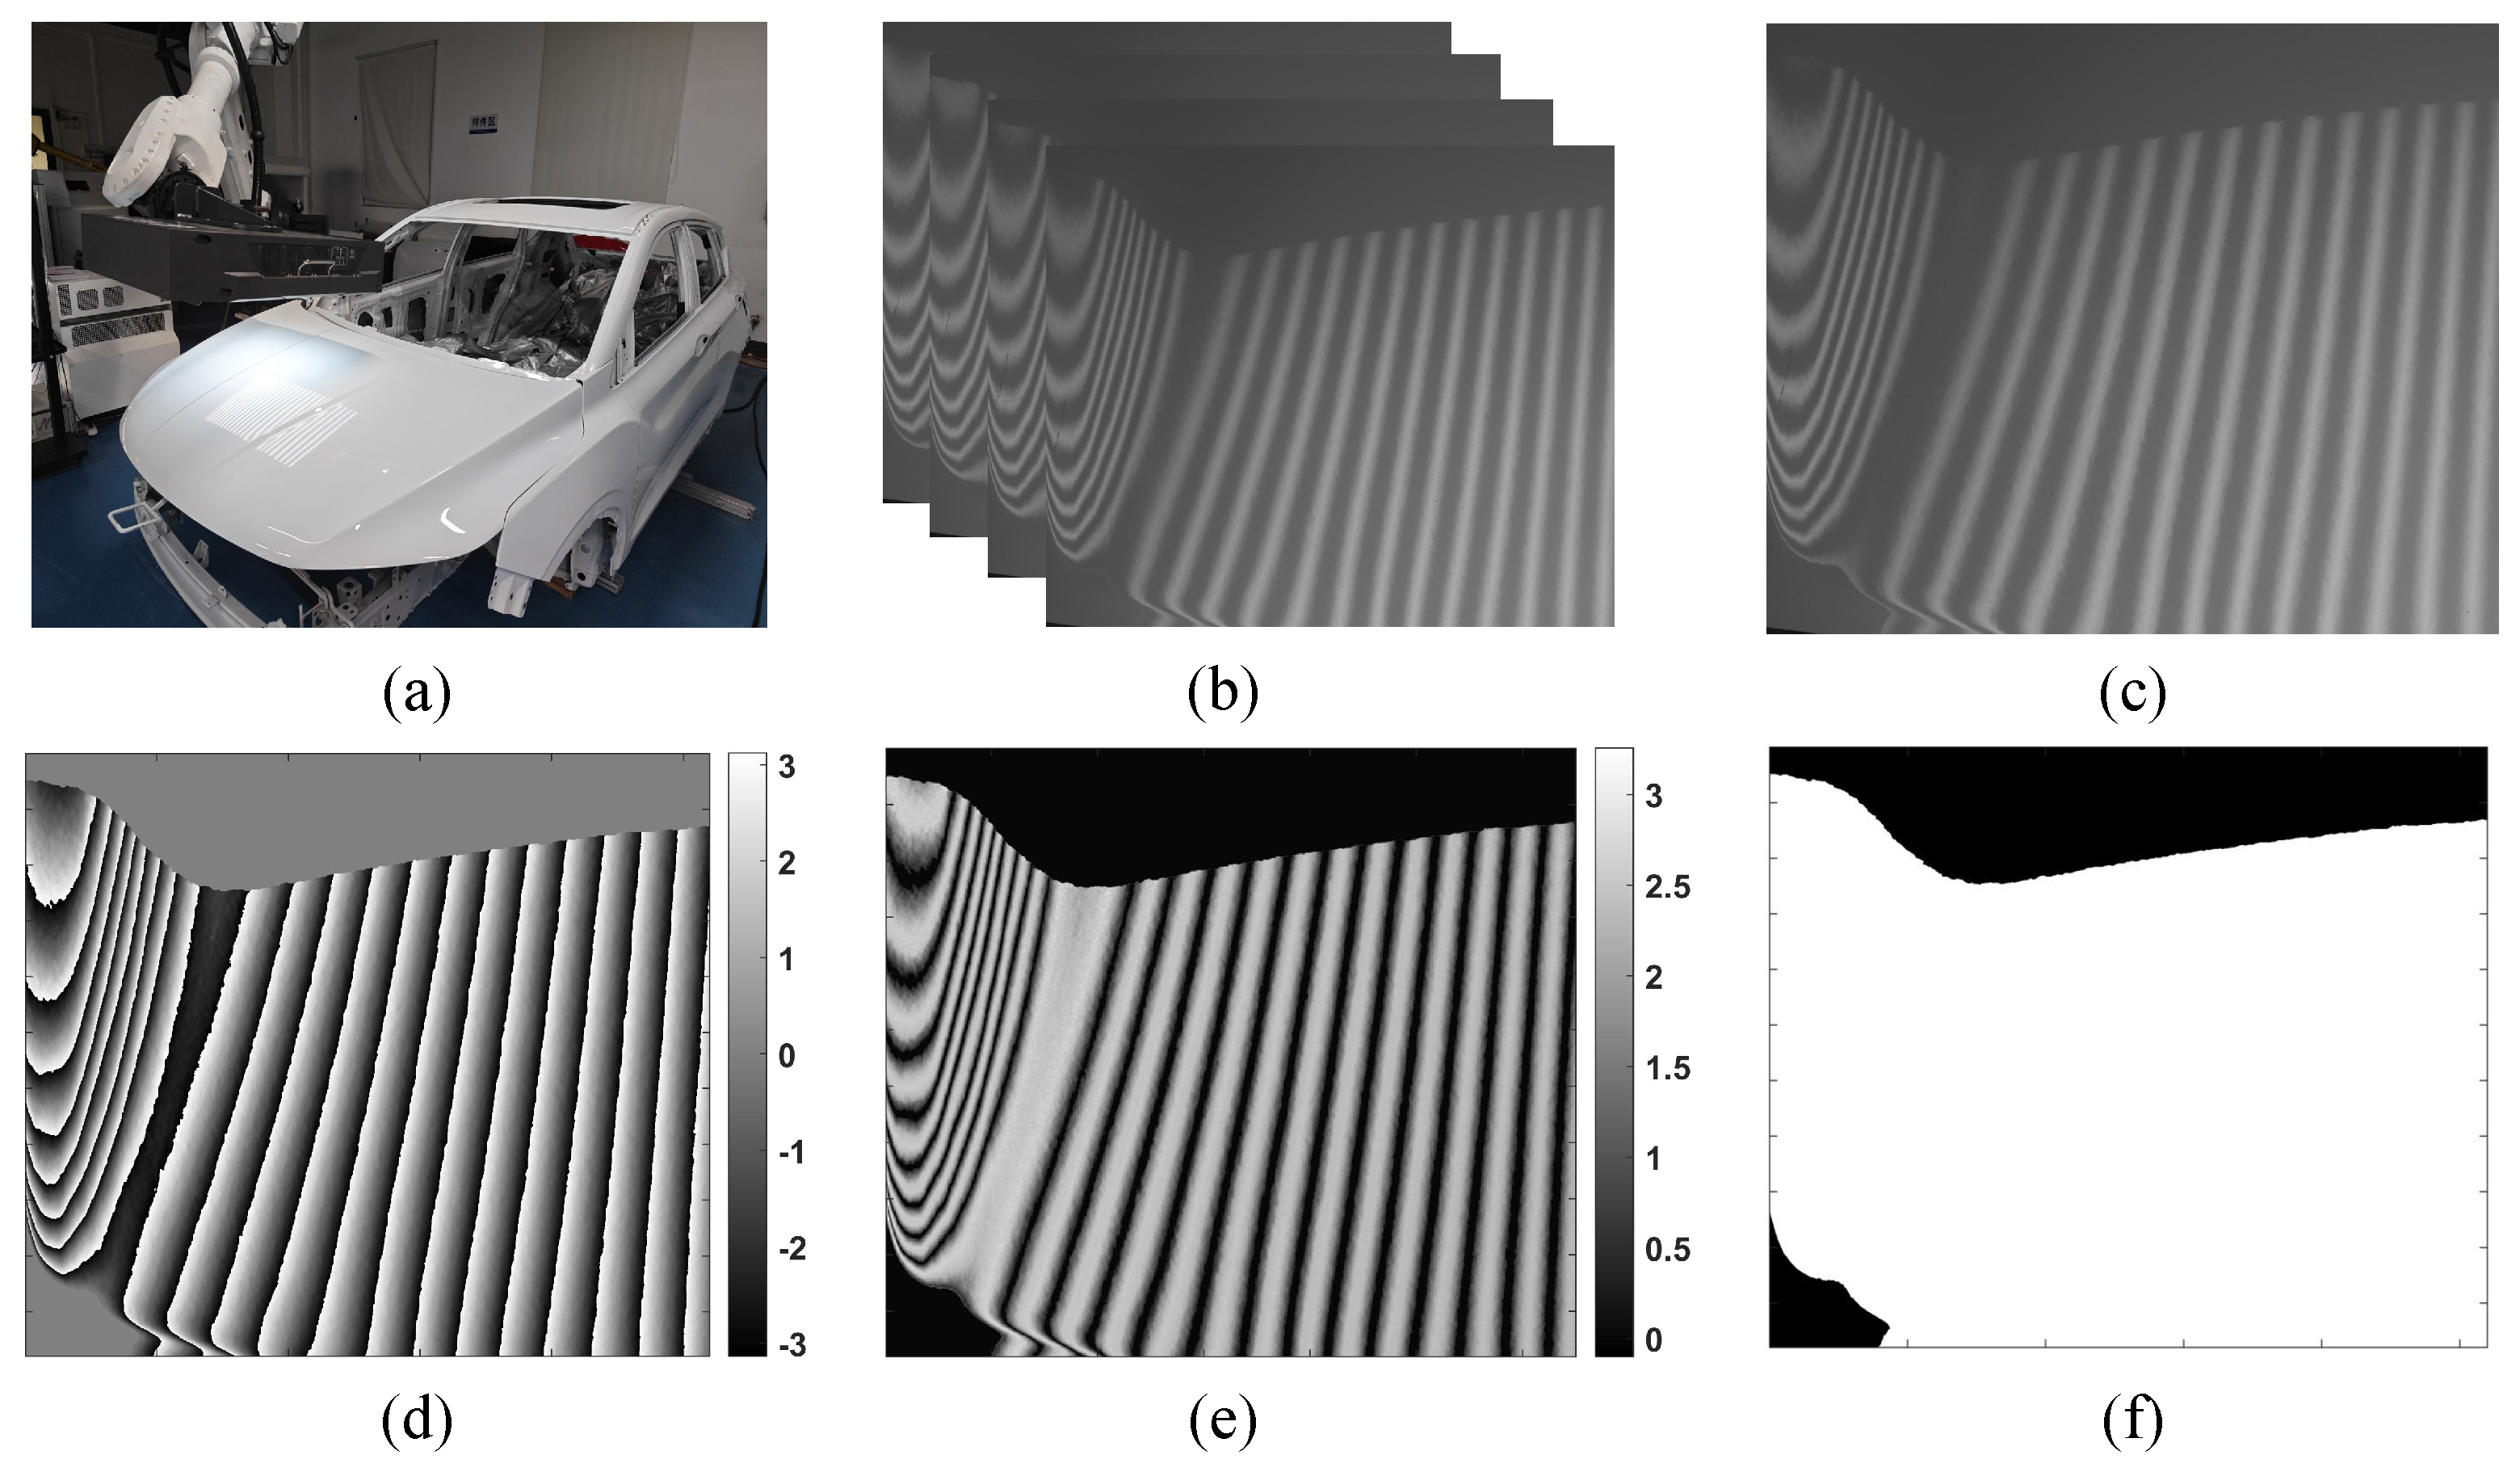
To validate the feasibility of the algorithm, tests were conducted under challenging imaging conditions on white car paint, as shown in Figure 9. The images respectively display the four-step phase-shifting patterns, the unequal phase-shifting patterns, and the binary mask segmented by the proposed method.
Figure 9.
Captured fringe patterns and the computed initial values. (a) Measurement scenario; (b) captured four-step phase-shifting fringe patterns; (c) captured coded phase-shifting fringe pattern; (d) wrapped phase; (e) coded phase; (f) binary mask extracted by the proposed method.
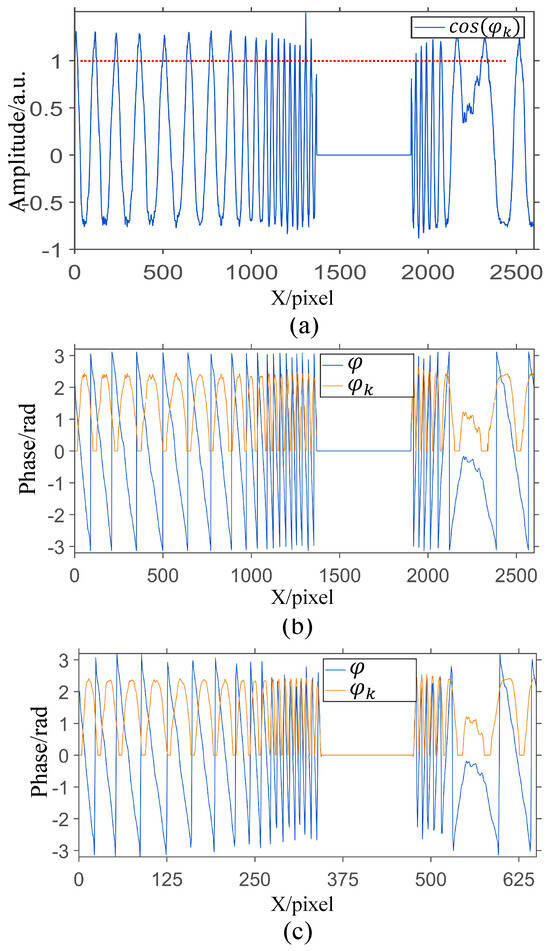
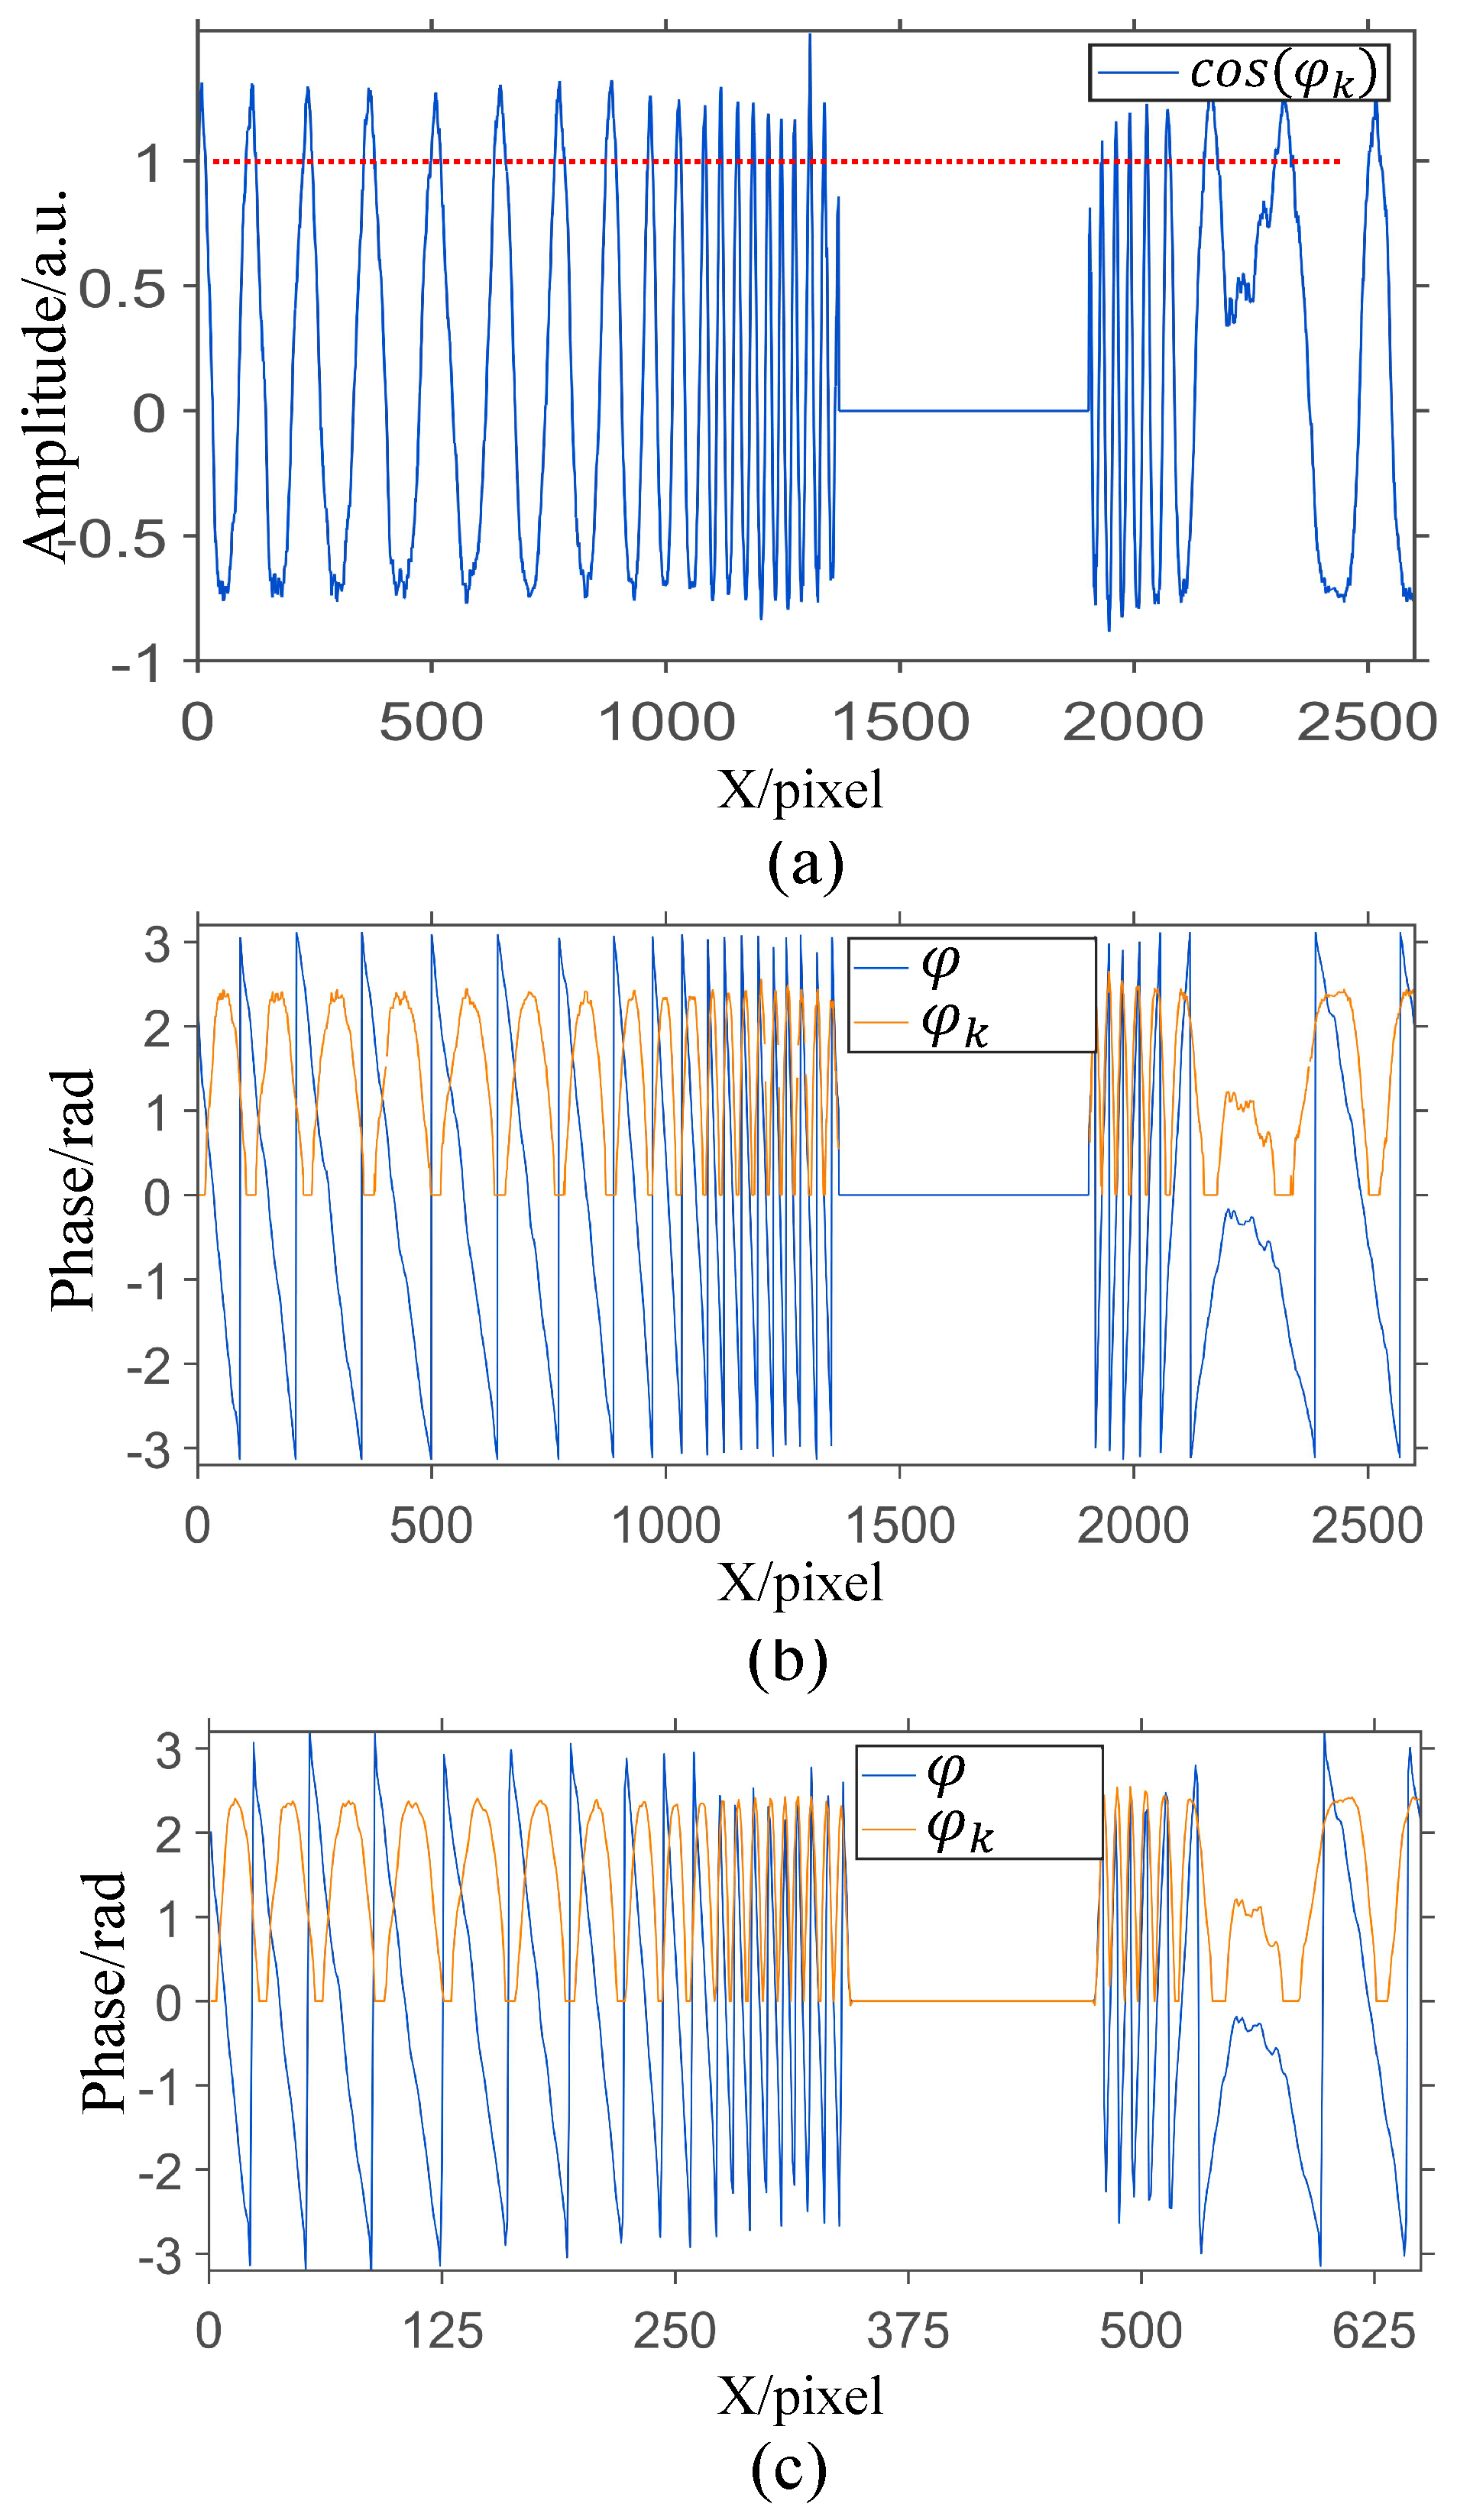
As shown in Figure 10a, which displays the 1000th line of the encoded phase cosine value, the value range deviates from the ideal distribution between −1 and 1 due to system noise, and significant errors are present during the oscillation process. To address this, we preprocess the wrapped phase and encoded phase by resampling the image. However, it is crucial to note that we backed up the original wrapped phase. In other words, we only utilized the wrapped phase to perform phase unwrapping for obtaining the fringe order map. The wrapped phase ultimately used for the final unwrapping is the pristine, unaltered wrapped phase, which has not undergone any downsampling or image processing. This approach reduces noise while improving the efficiency of subsequent processing. Since the input to the arccosine function must be within the range of −1 to 1, manual truncation is required, manual truncation is required to ensure that the input values do not exceed the bounds represented by the red dashed line in Figure 10a. Figure 10b,c show the smoothness of the initial phase values and the resampled phase, respectively.
Figure 10.
Preprocessing of the 1000th line. (a) Truncated cosine value range; (b) wrapped phase and coded phase; (c) smoothed signal after downsampling.
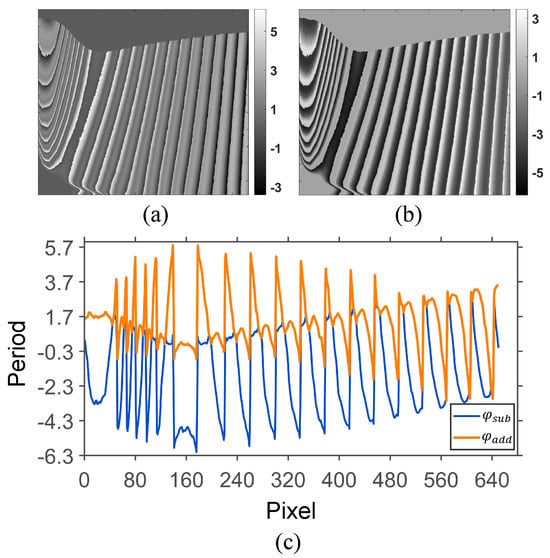
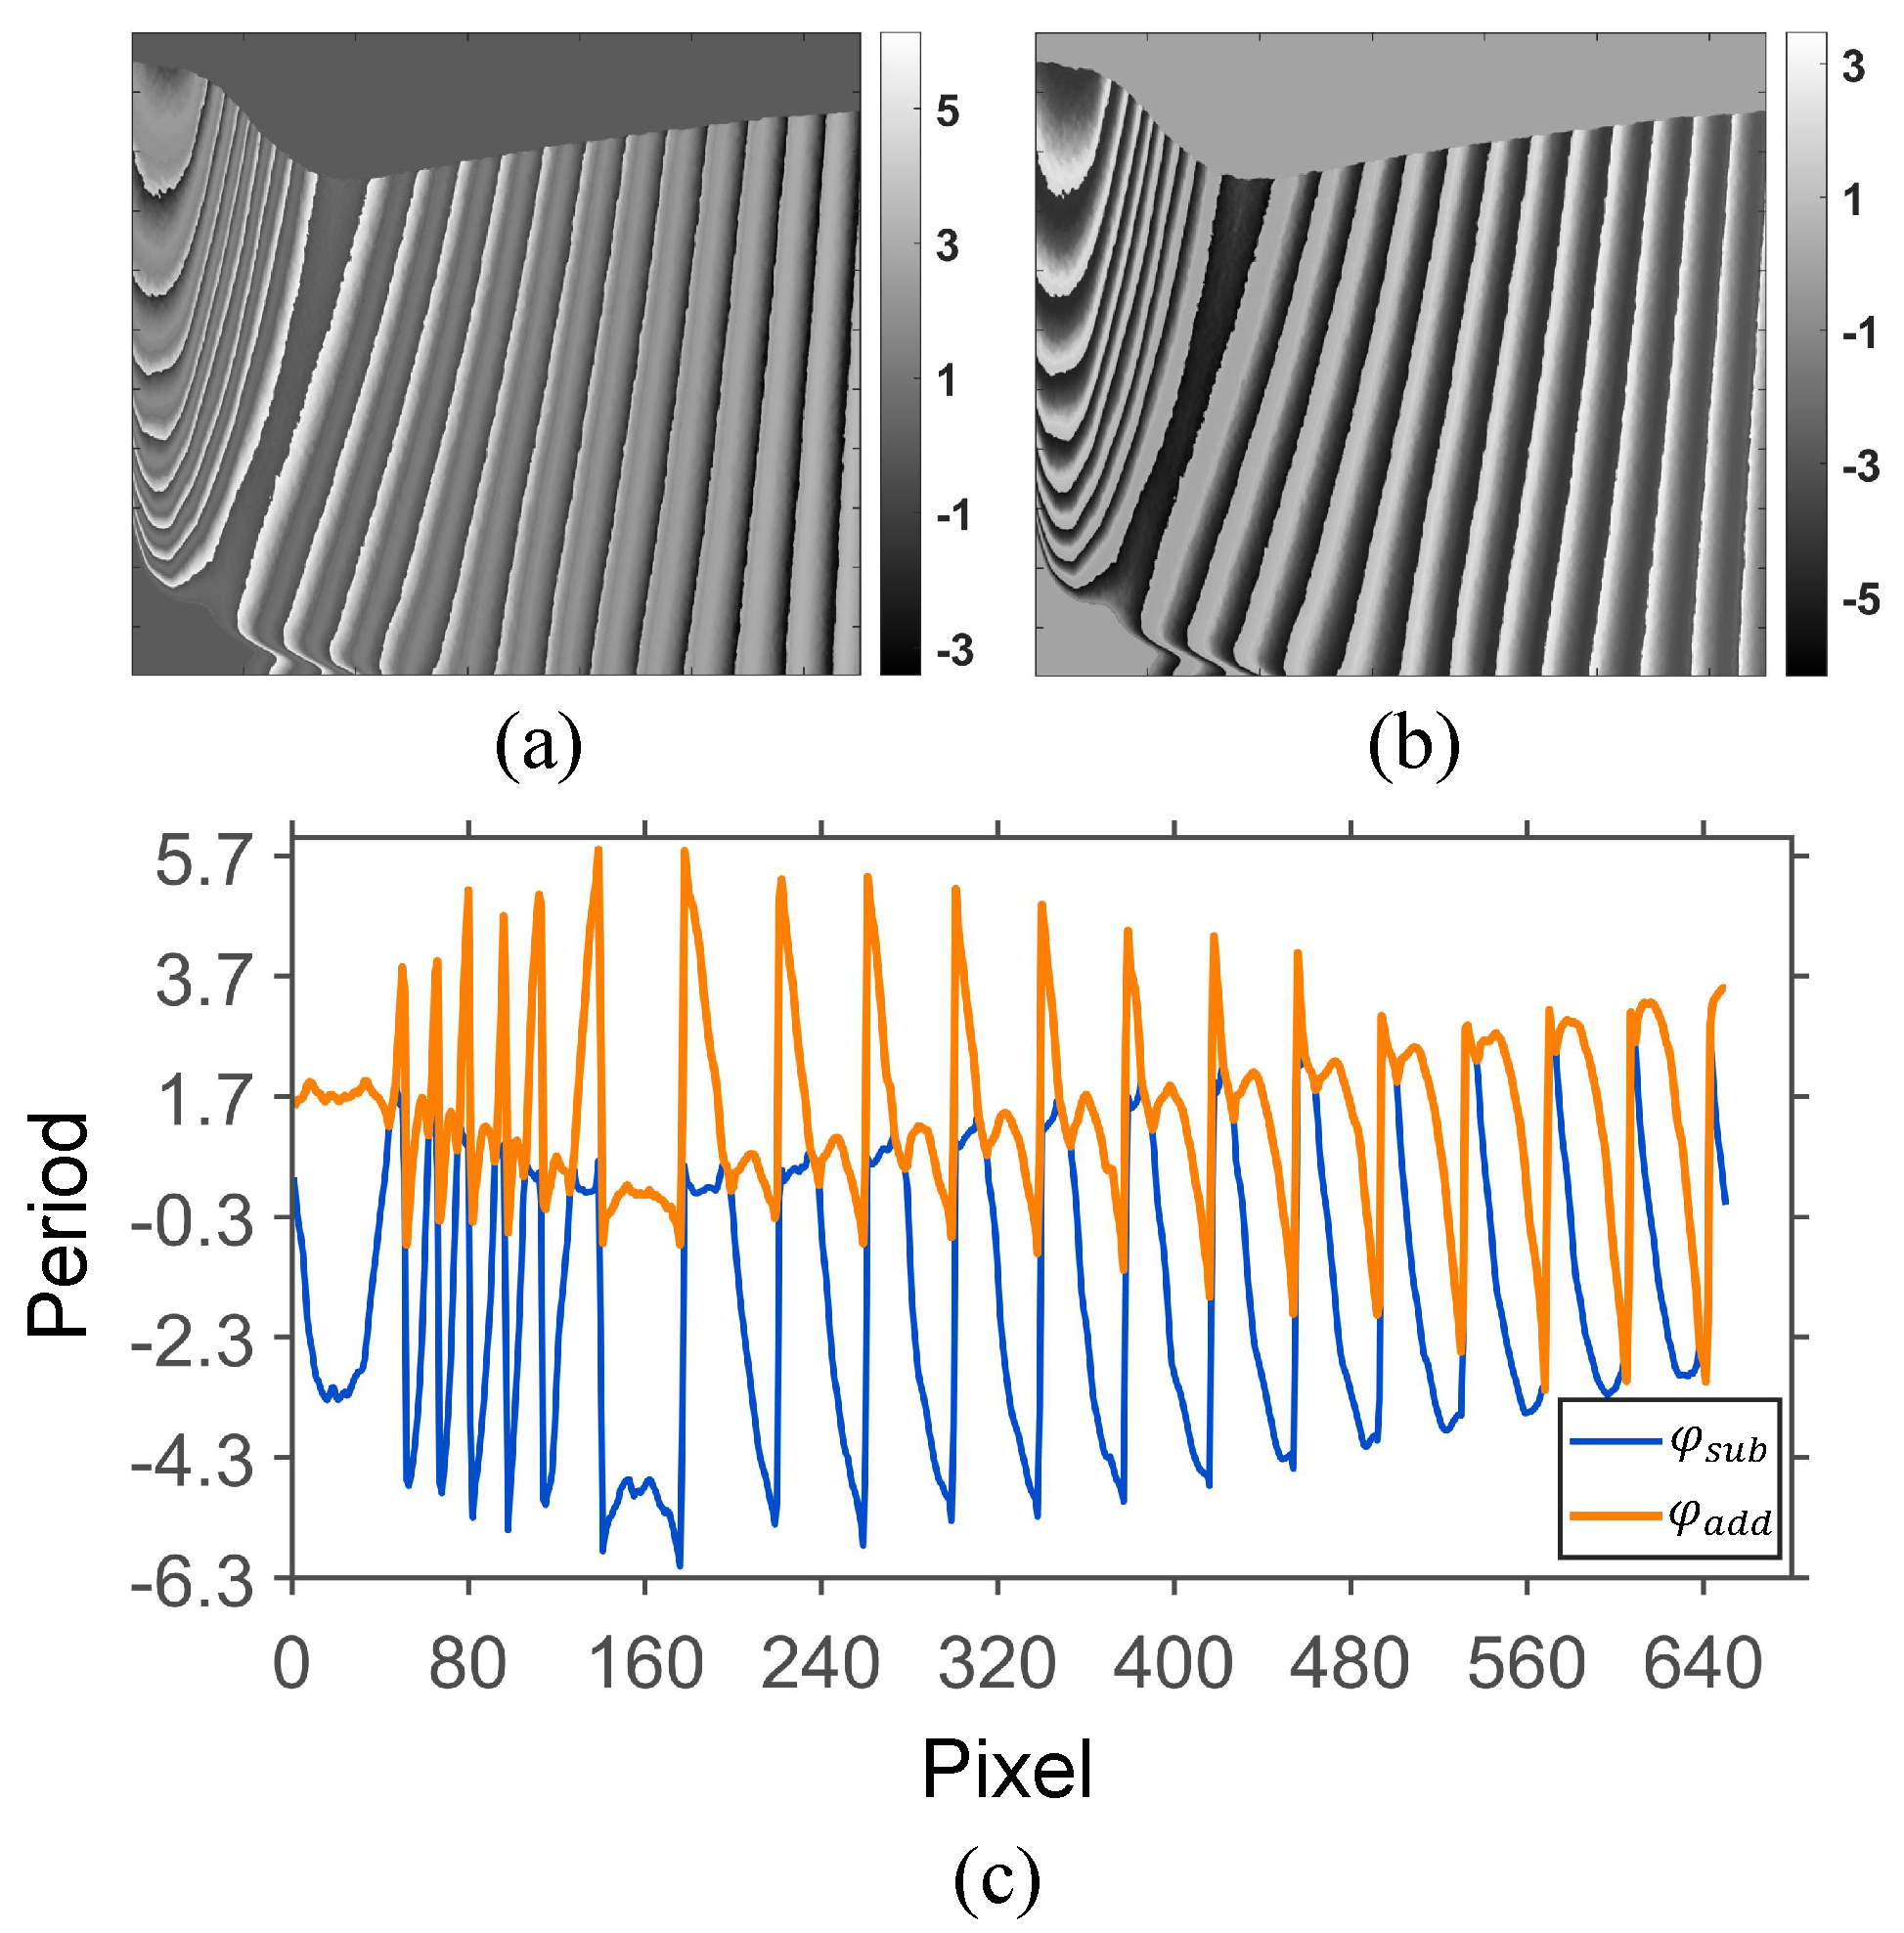
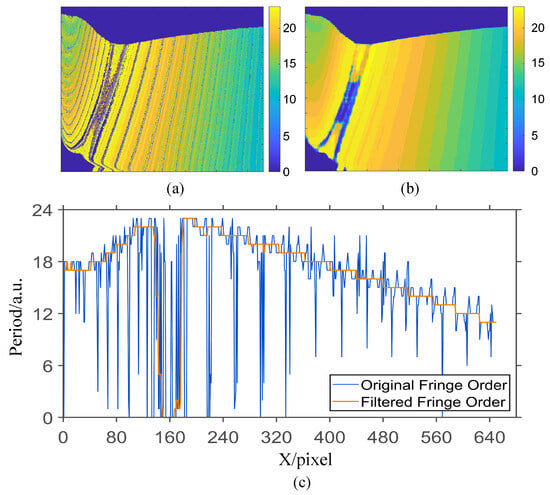
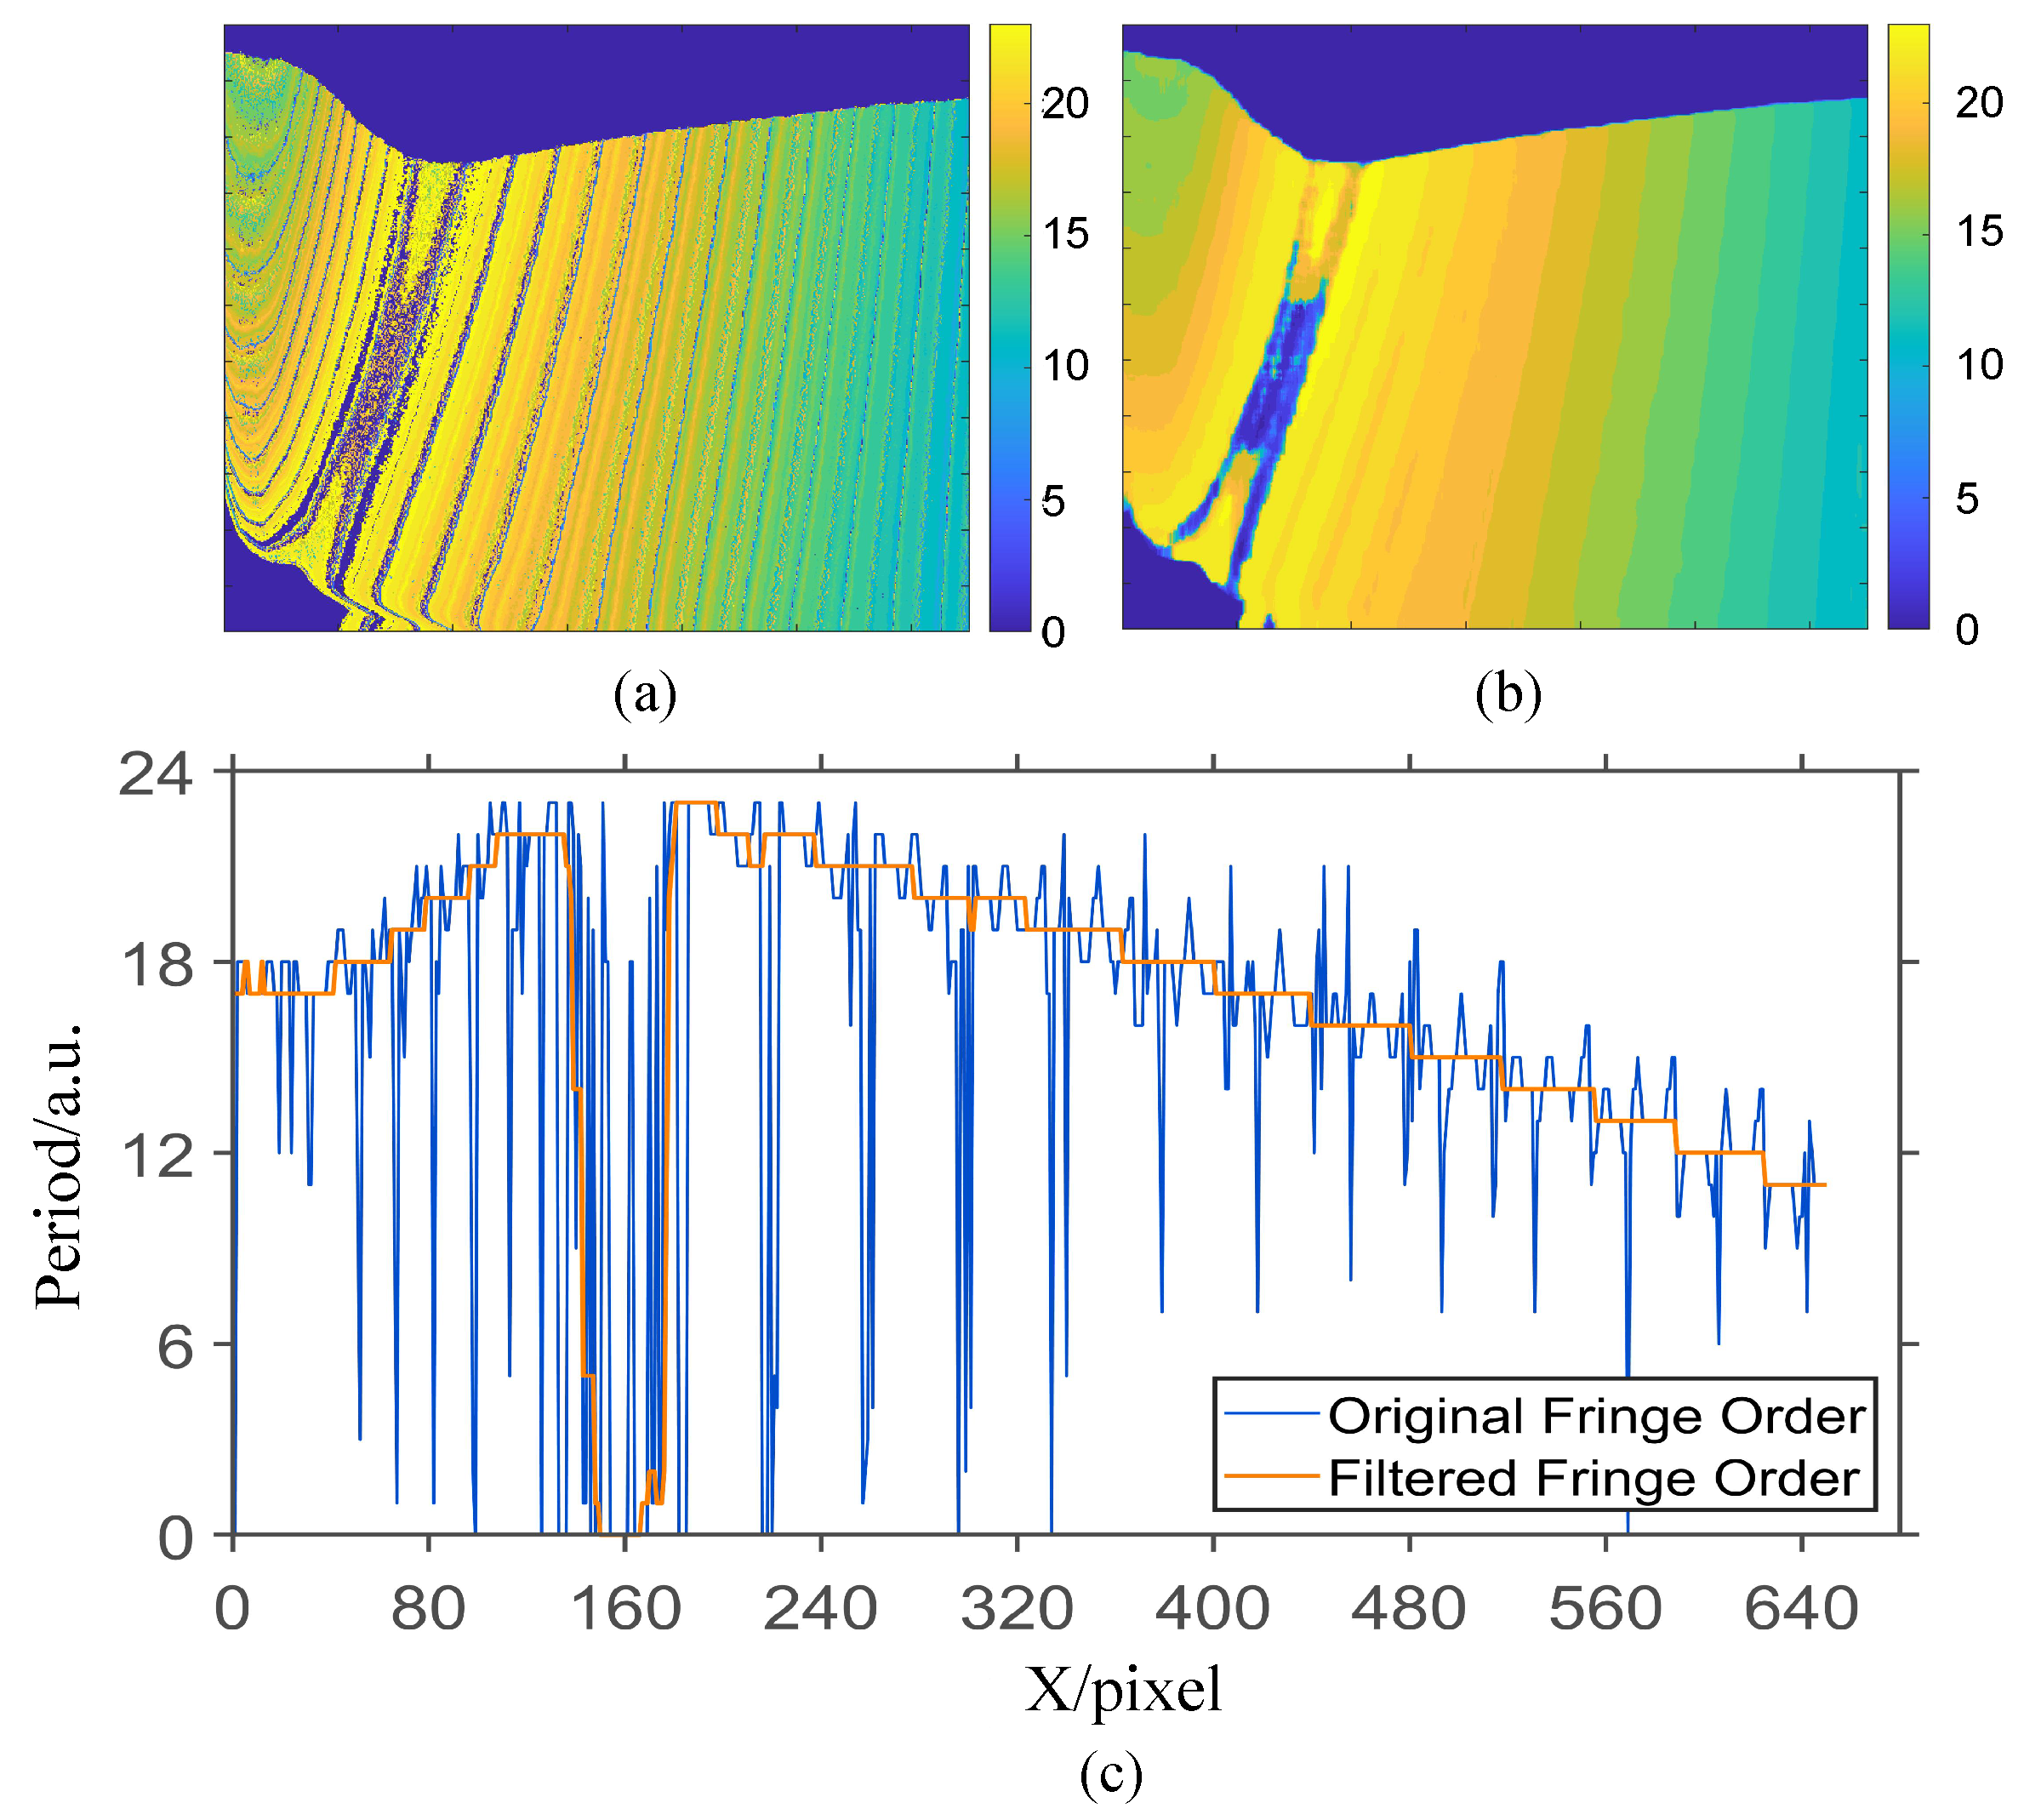
After obtaining the down-sampled wrapped phase and coded phase, the phase summation value extracted using Equation (8) is shown in Figure 11b, and the phase difference value extracted using Equation (7) is shown in Figure 11a,c, which show the phase addition and subtraction results for a randomly selected row. The resulting fringe order map, computed using Equations (9)–(11), is shown in Figure 12a. To obtain an initial fringe order map with a relatively high signal-to-noise ratio (SNR), median filtering was applied to the calculated fringe order map shown in Figure 12a, ensuring the subsequent self-correction of the absolute phase could proceed smoothly. The filtered result is presented in Figure 12b. Figure 12c shows the fringe order of a selected row before and after median filtering.
Figure 11.
Addition and subtraction of wrapped phase and coded phase. (a) Phase addition; (b) phase subtraction; (c) line chart of phase difference and sum for a selected row.
Figure 12.
Fringe Order Maps Before and After Filtering. (a) Fringe order map; (b) fringe order map after filtering; (c) fringe order of a selected row before and after median filtering.
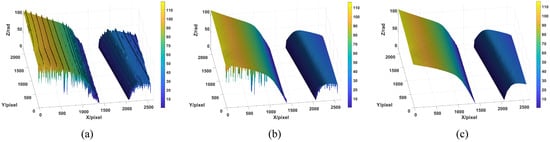
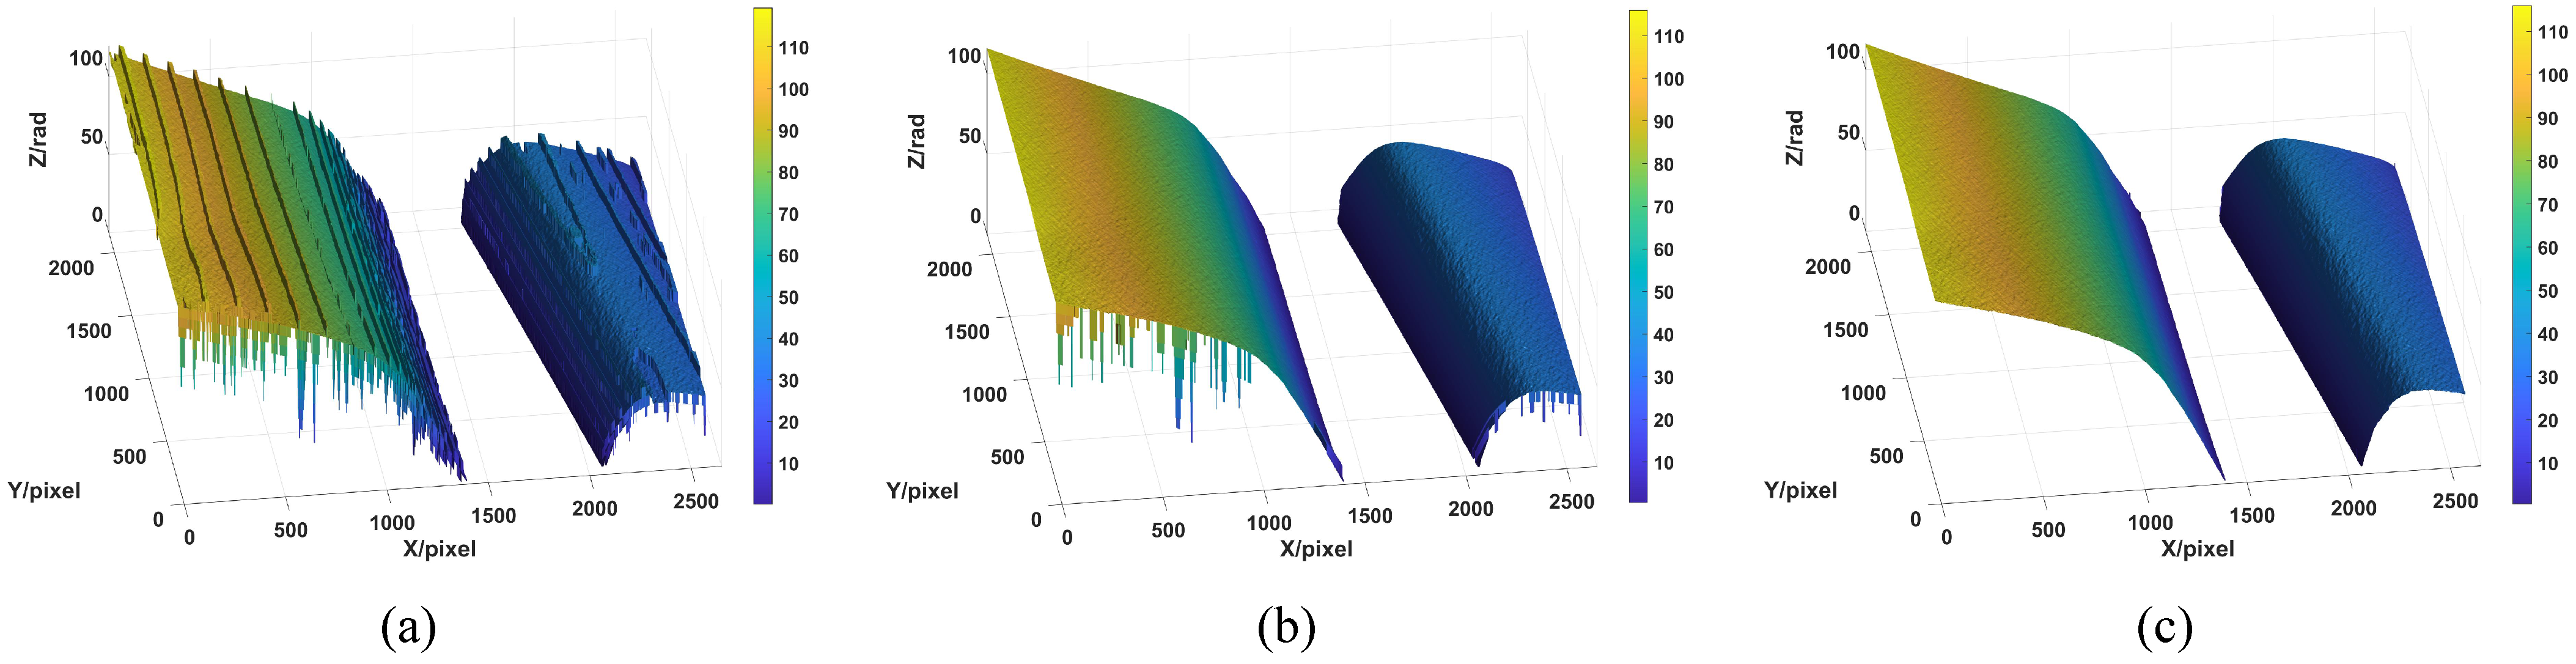
An enhanced signal-to-noise ratio was achieved through median filtering, ensuring the successful execution of the subsequent phase correction procedure. Figure 13 depicts the results of our correction methodology, Figure 13a presents the initial absolute phase, Figure 13b presents the absolute phase following the initial correction applied along the coding direction, and Figure 13c presents the absolute phase after the secondary correction applied along the alternative direction. This demonstrates that the proposed method, by encoding and decoding the phase shift and incorporating spatial domain information for correction, successfully yields the desired absolute phase.
Figure 13.
Absolute phase correction results. (a) Absolute phase before correction; (b) absolute phase after the first correction; (c) absolute phase after the second correction.
3.2. Comparative Analysis
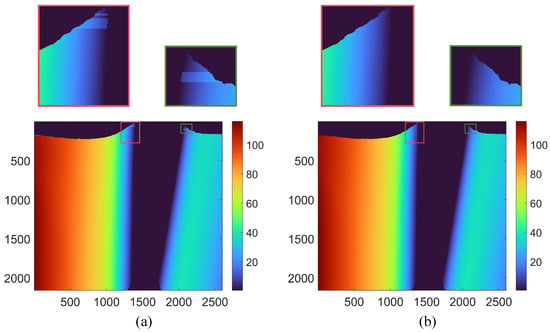
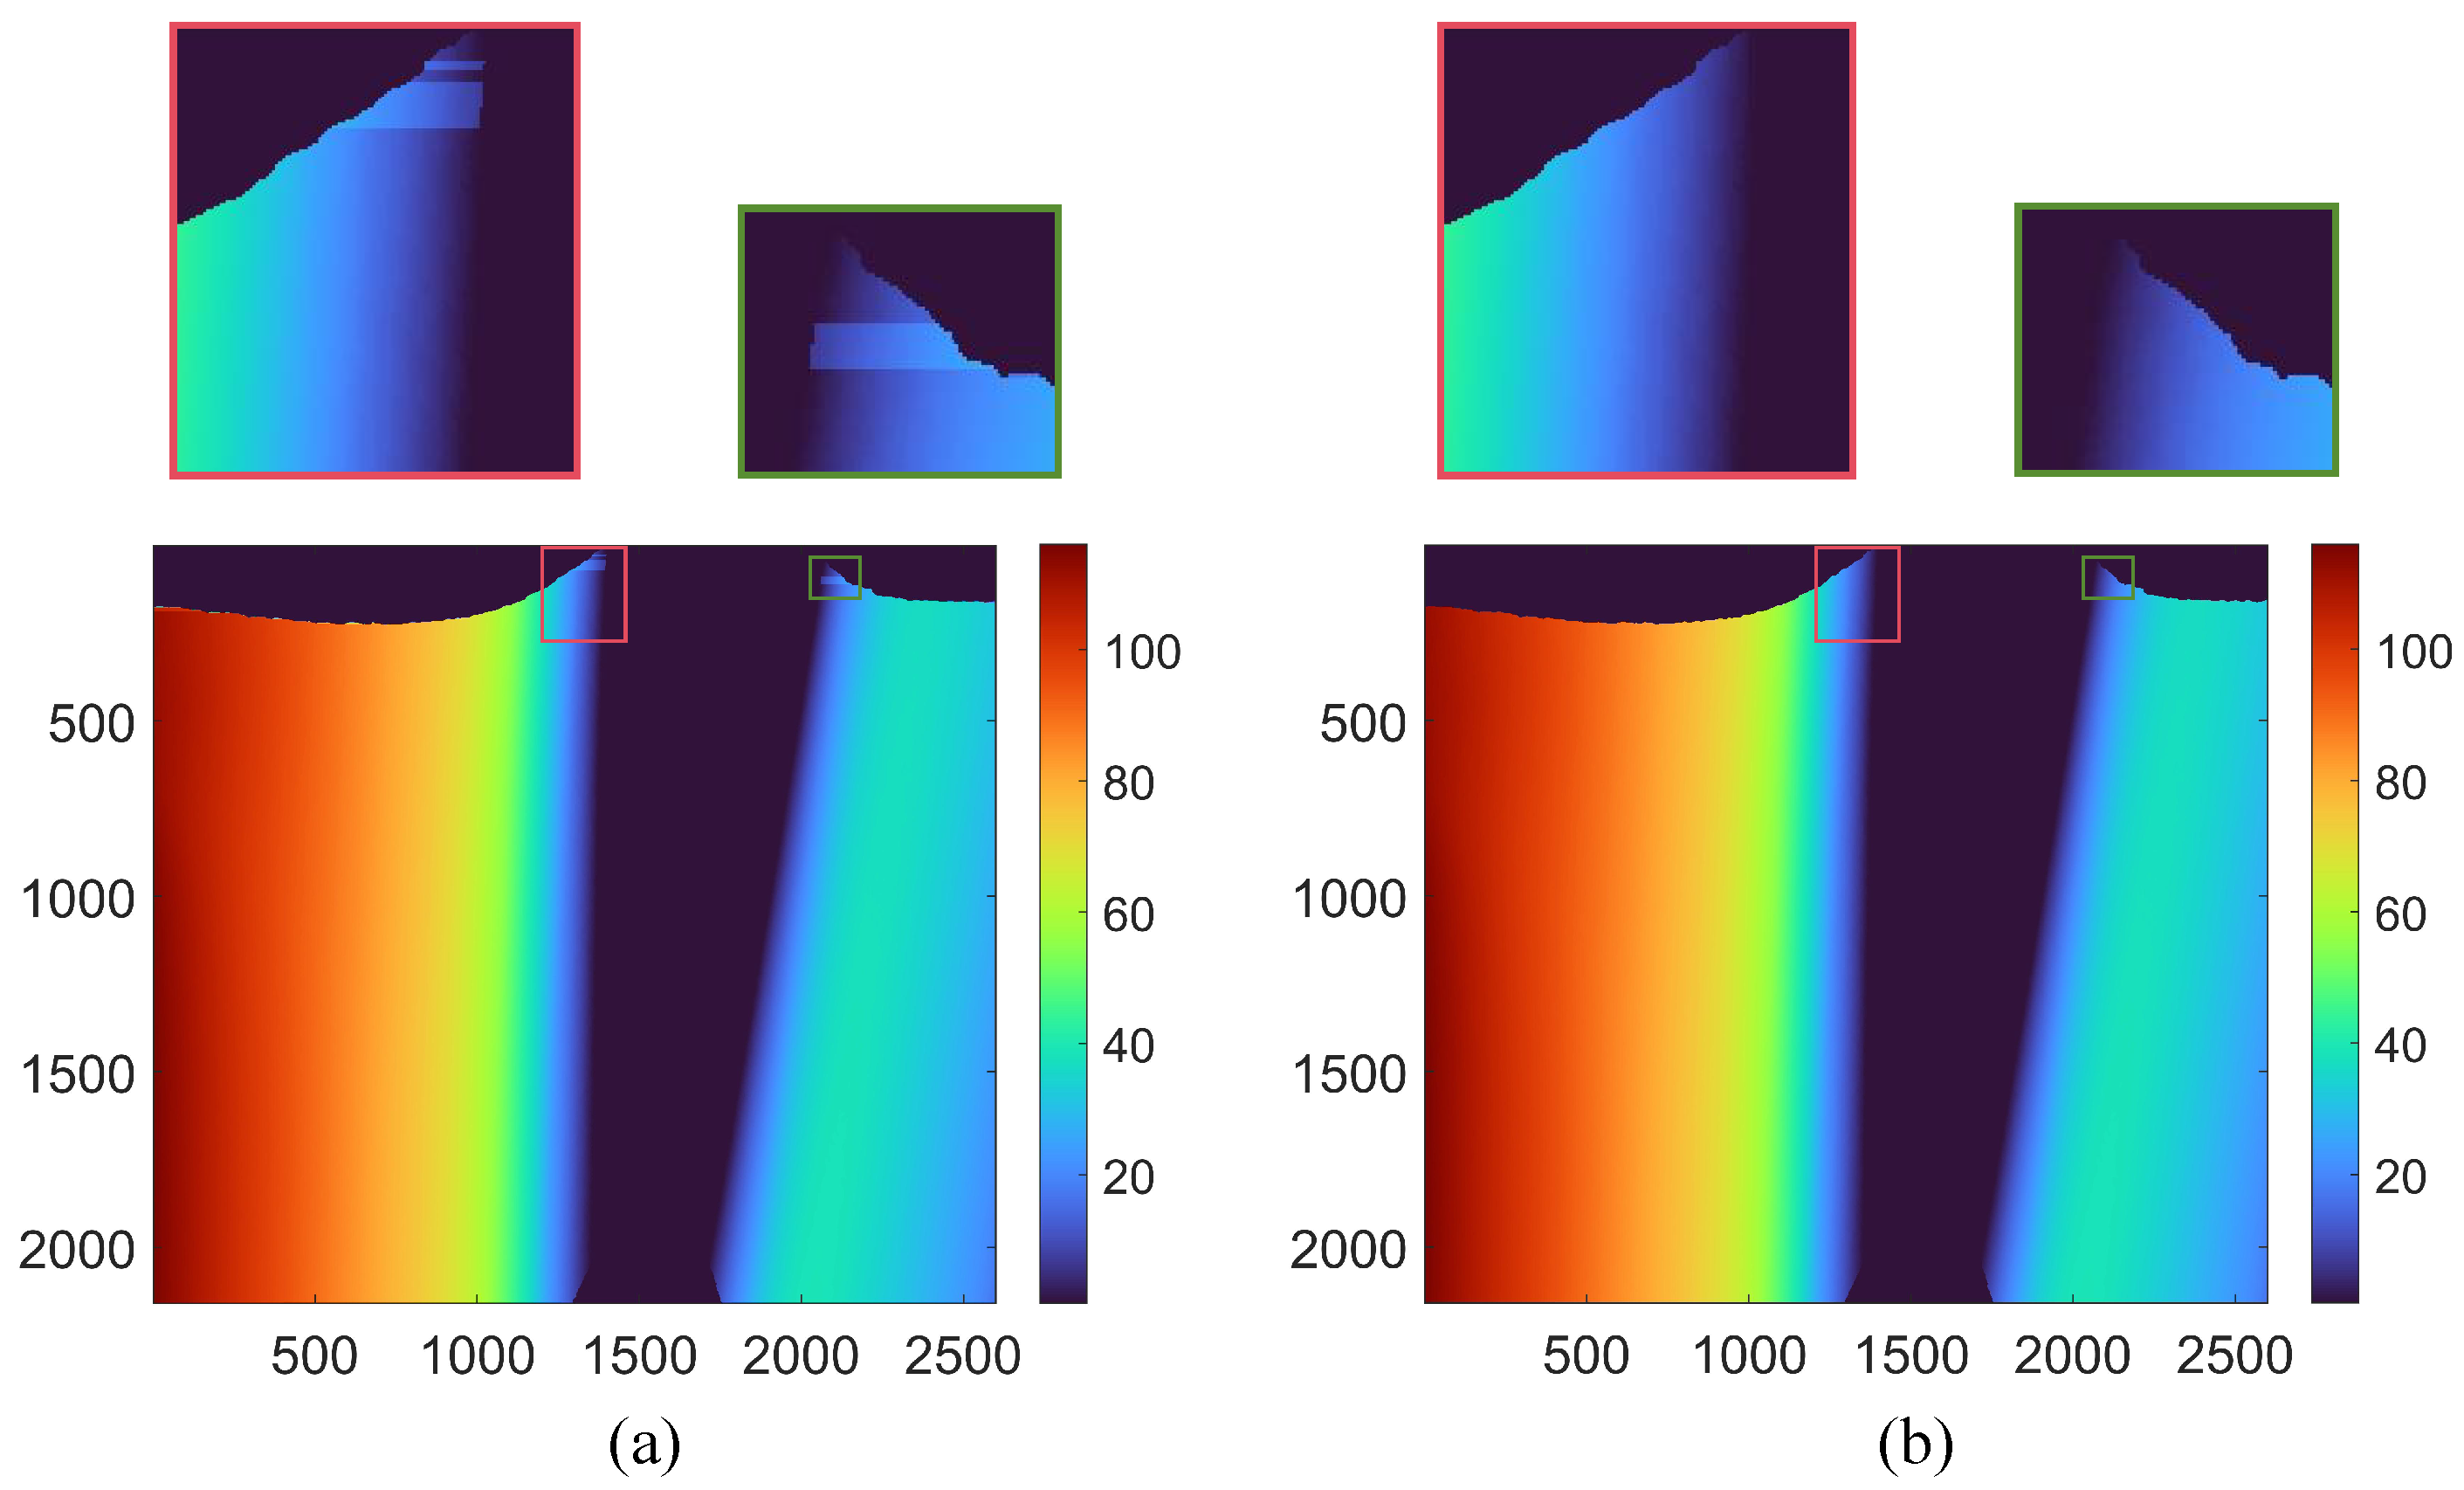
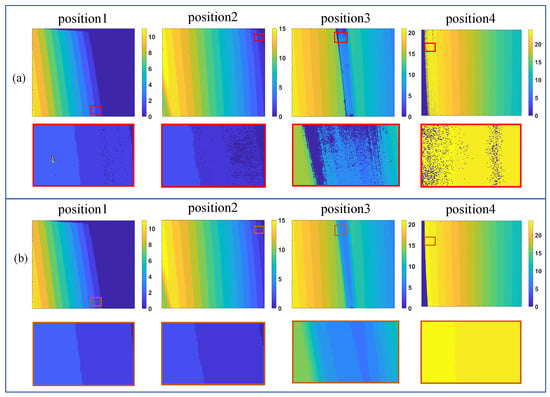
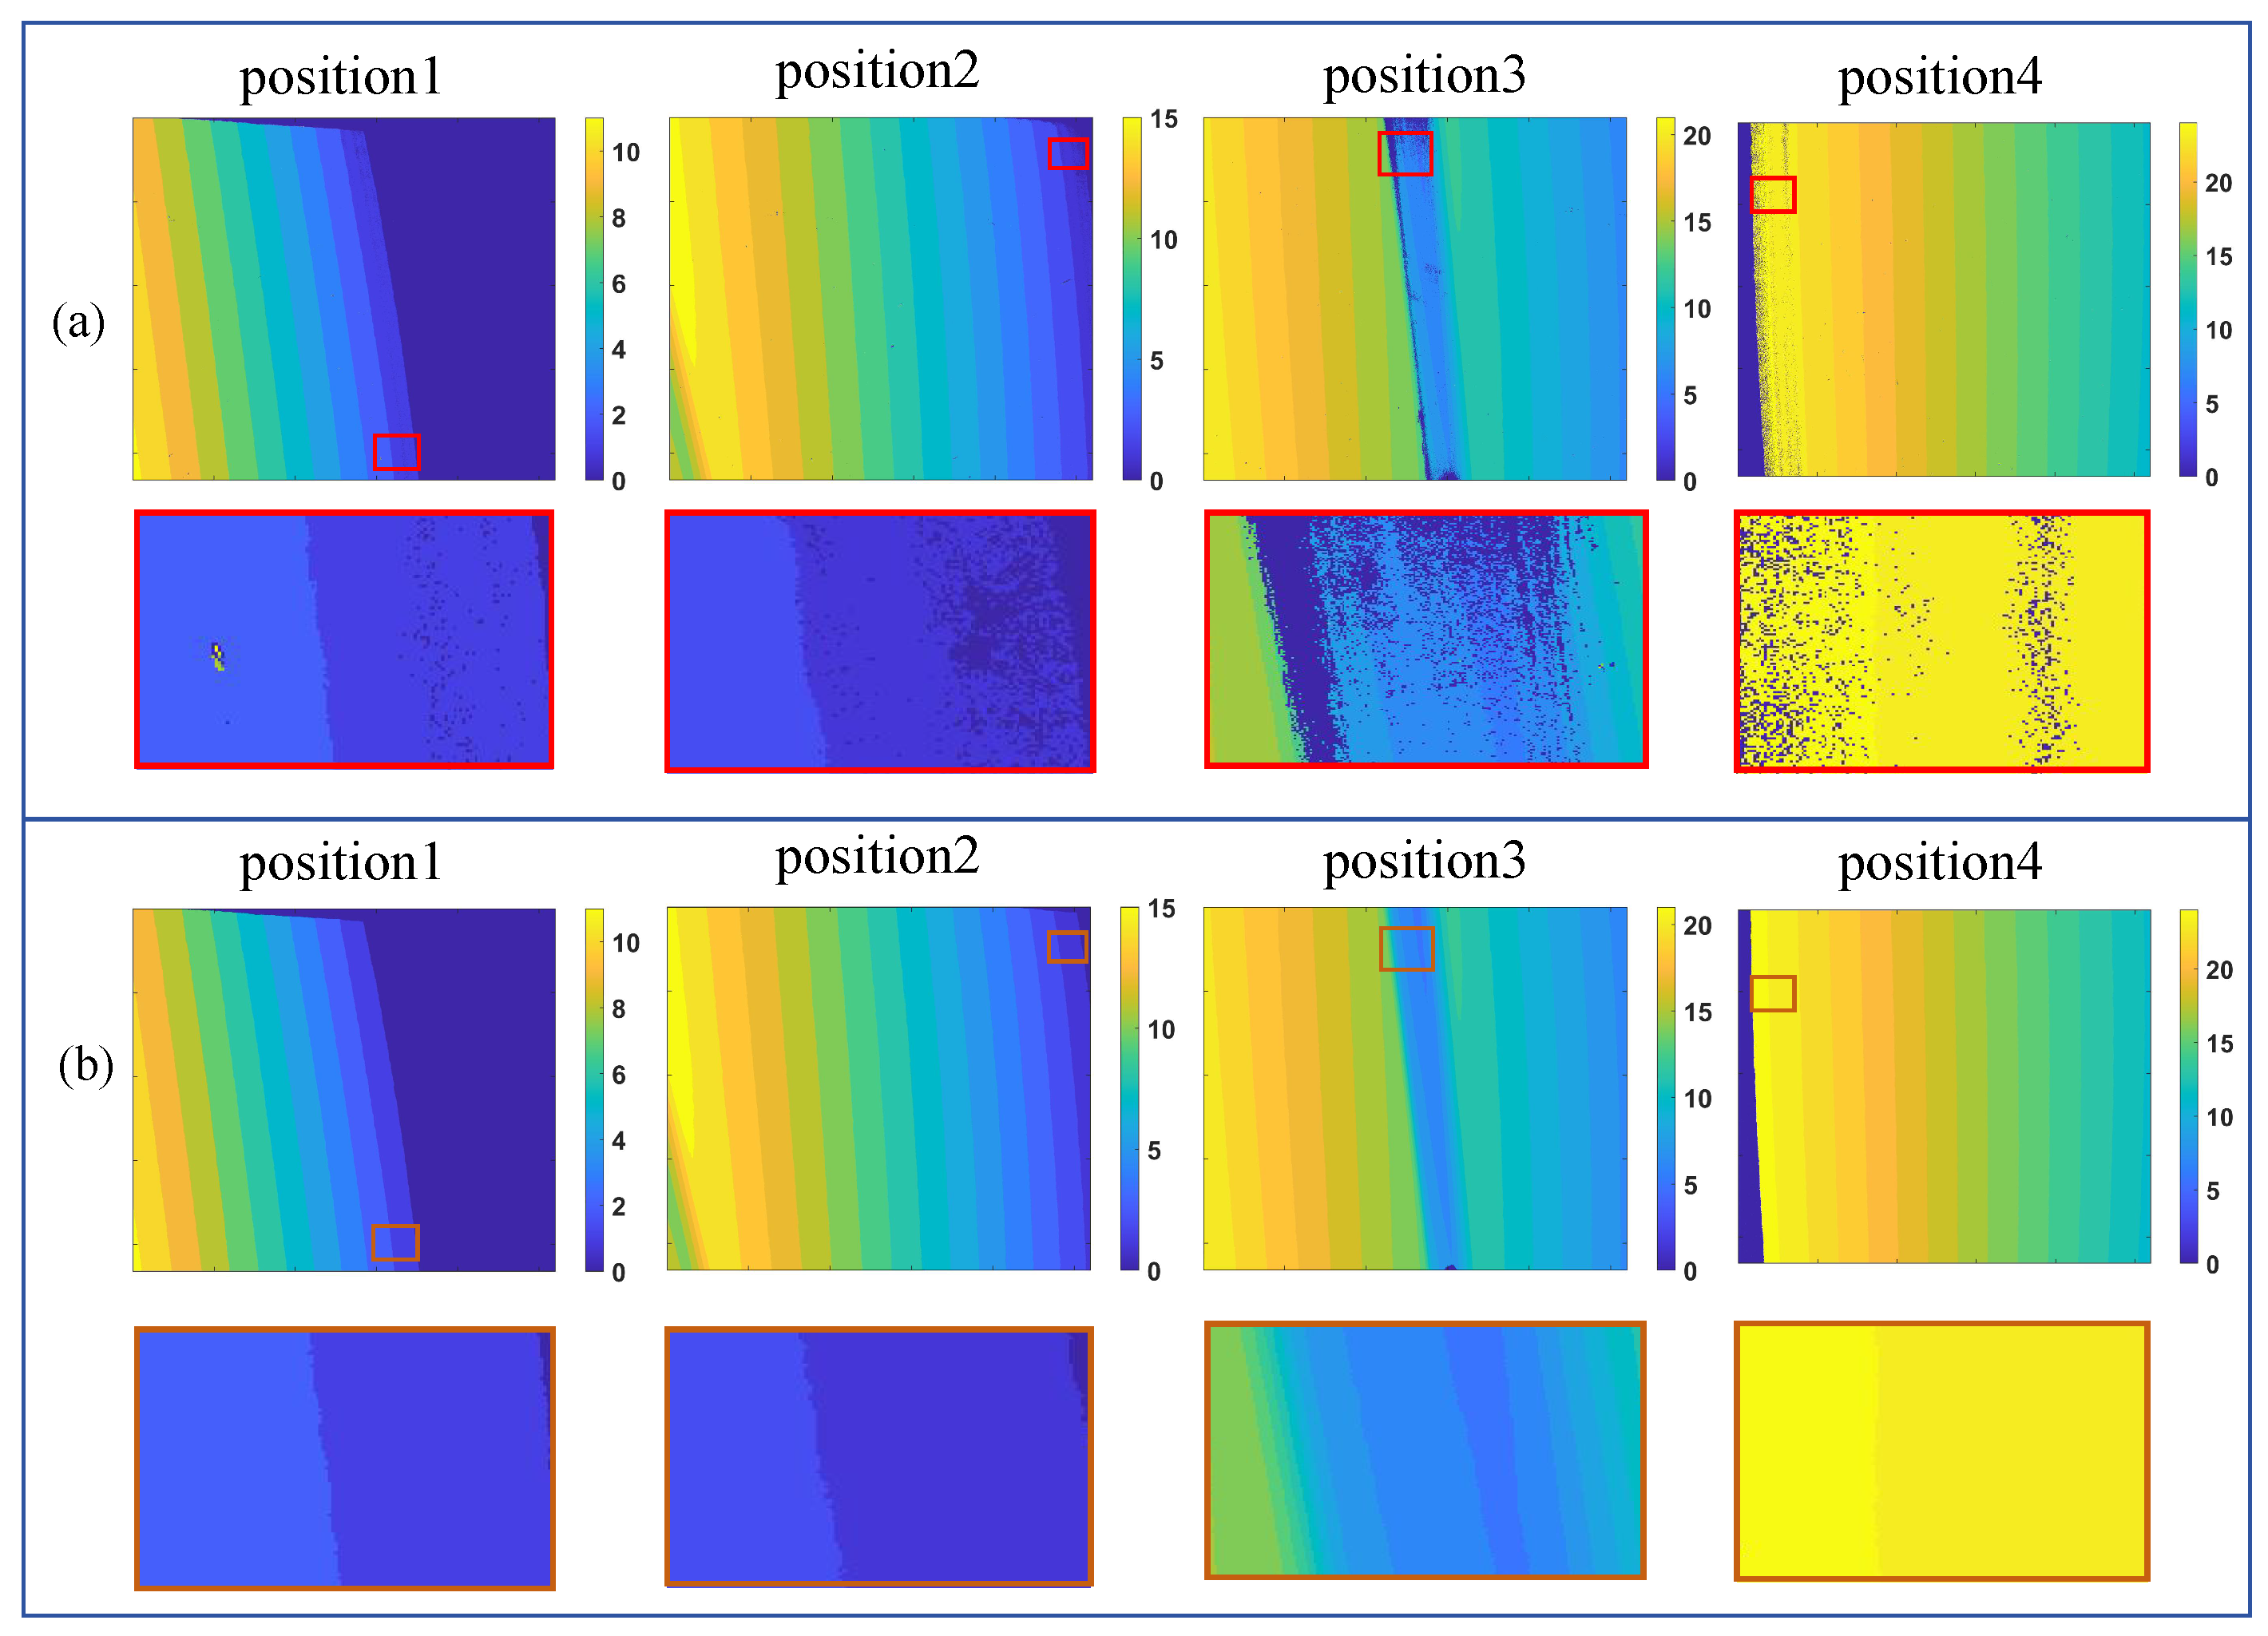
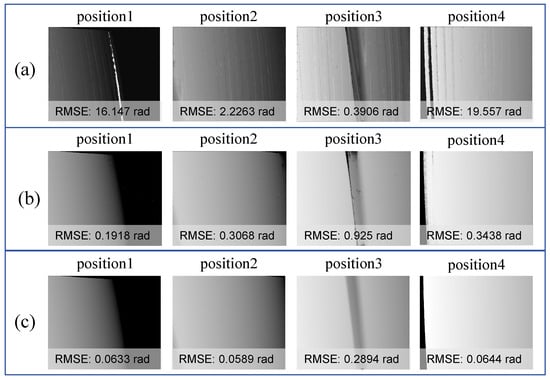
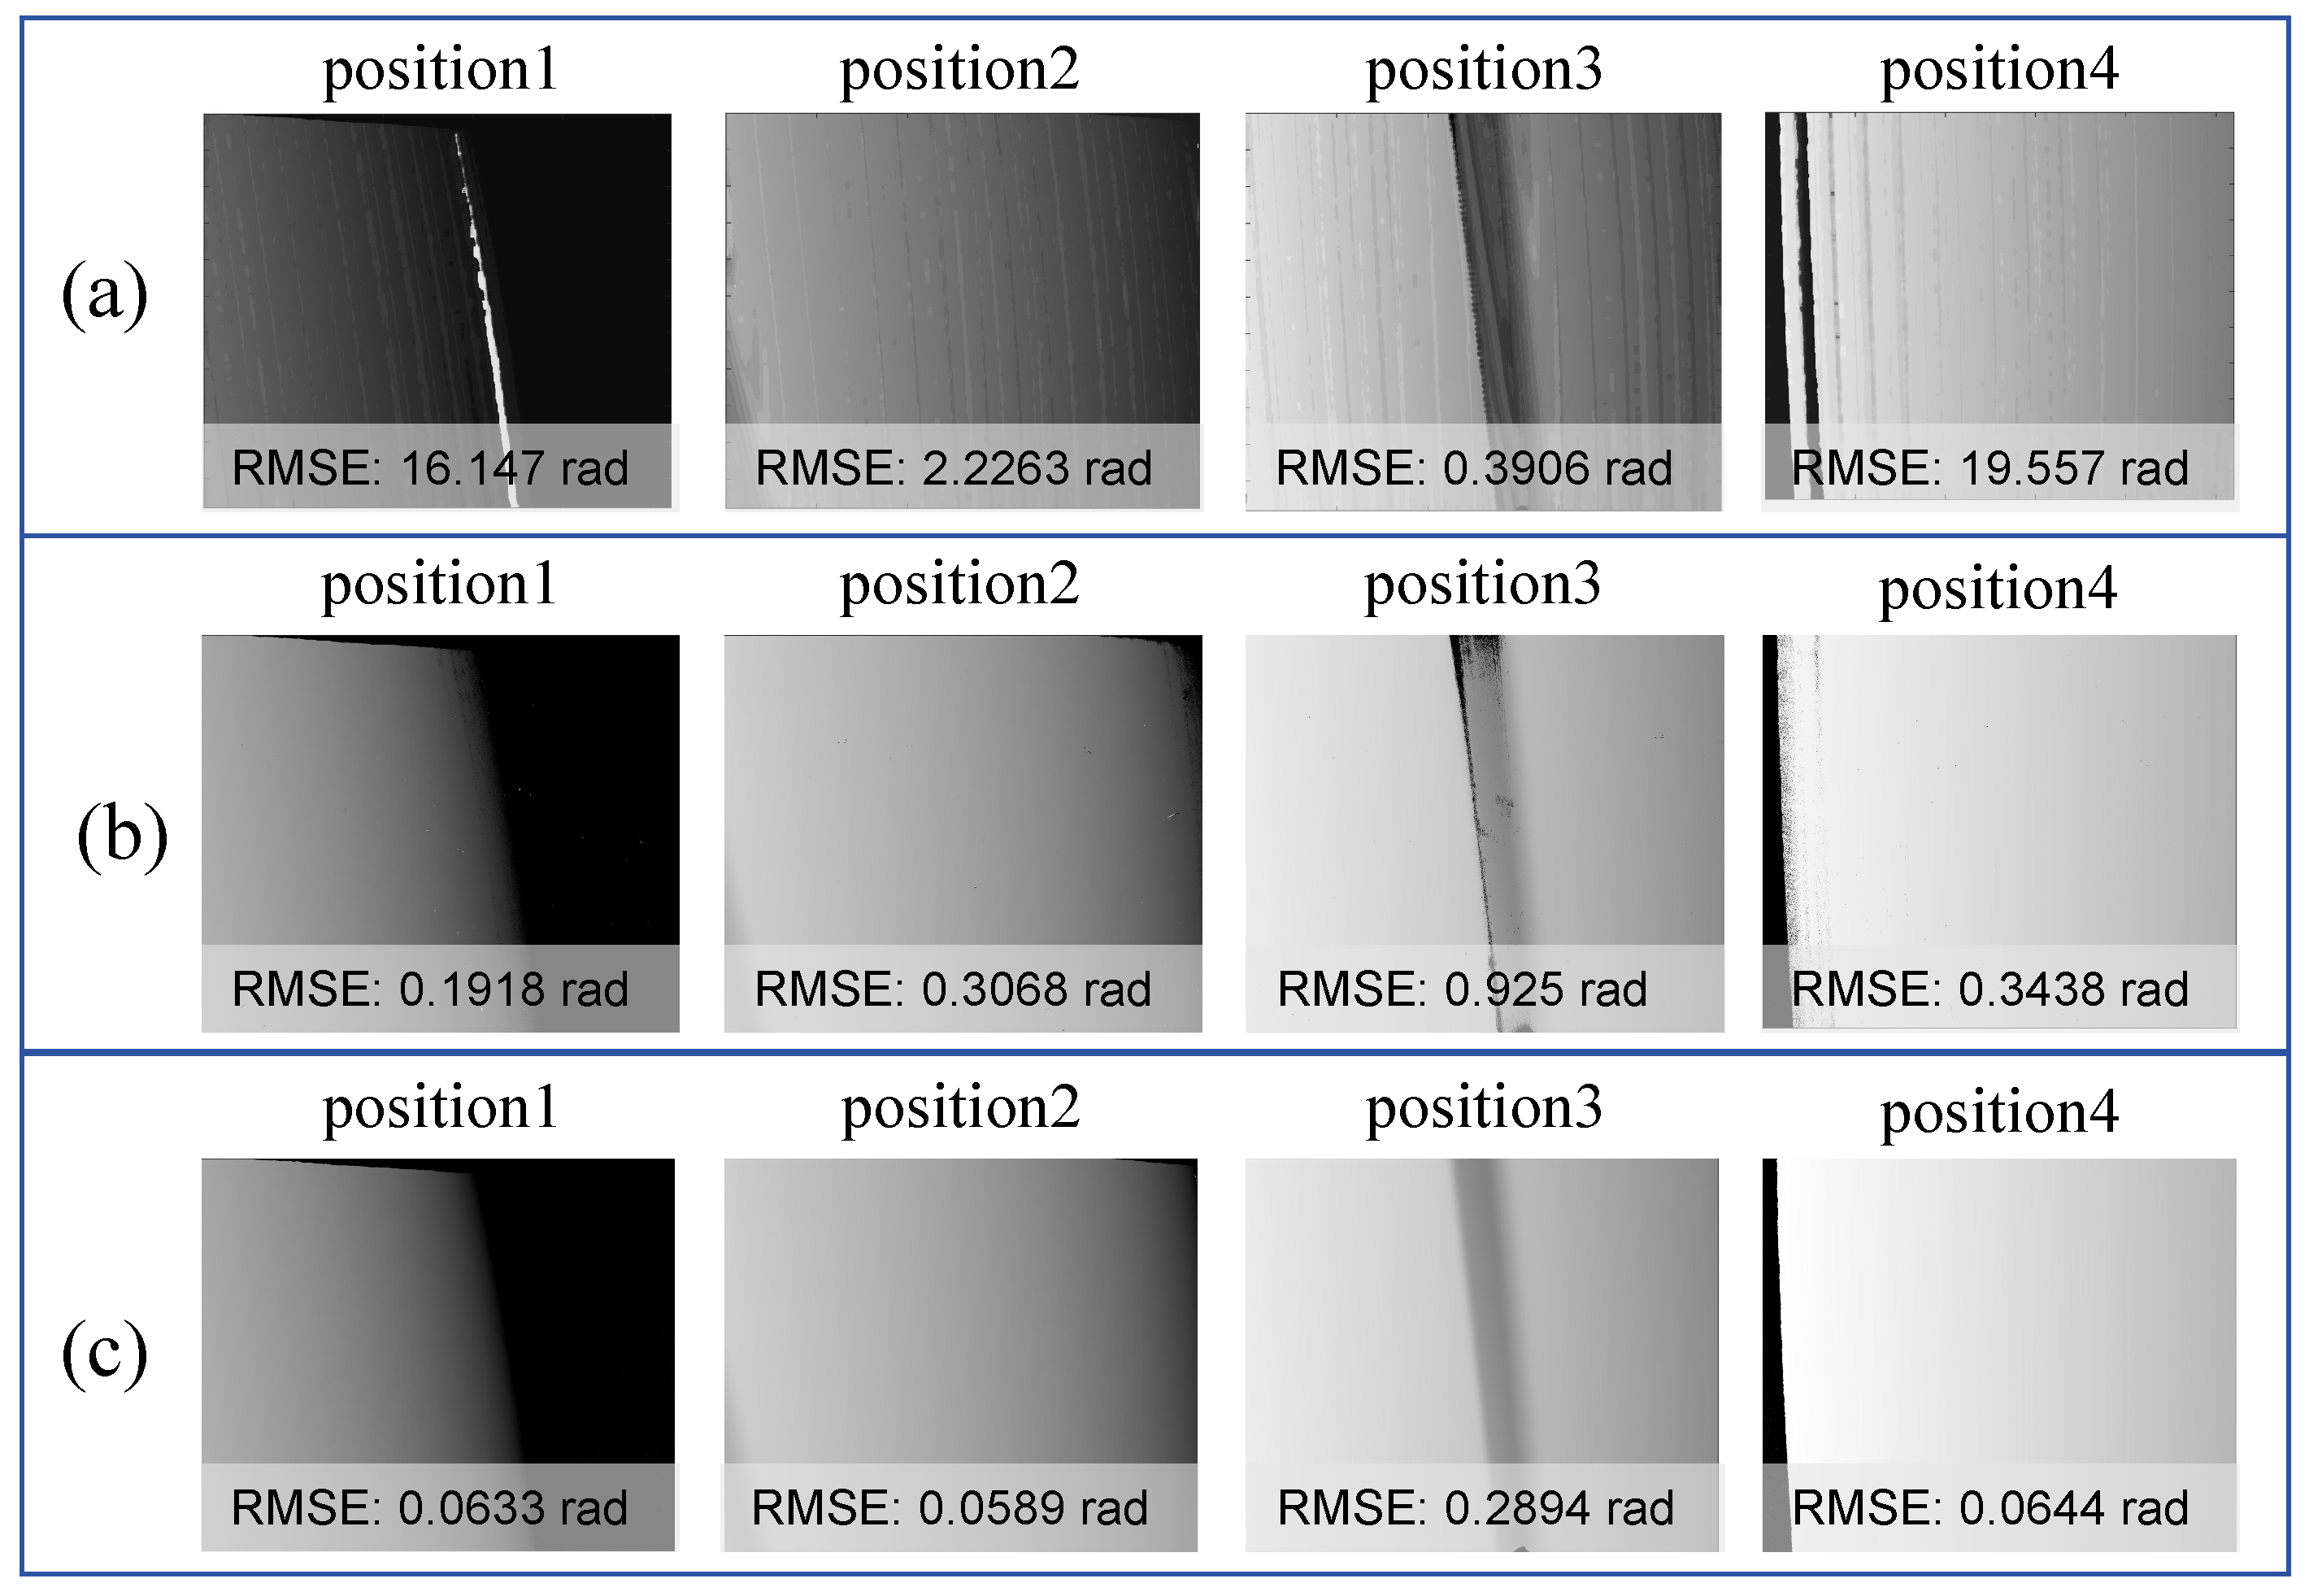
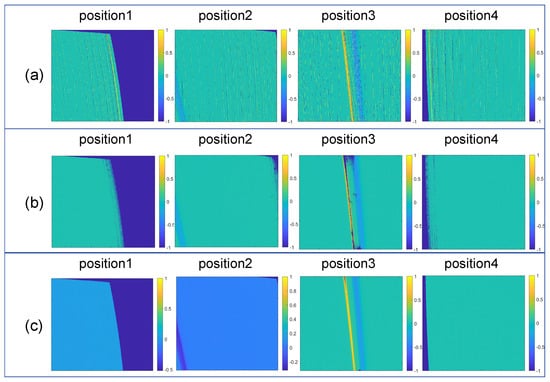
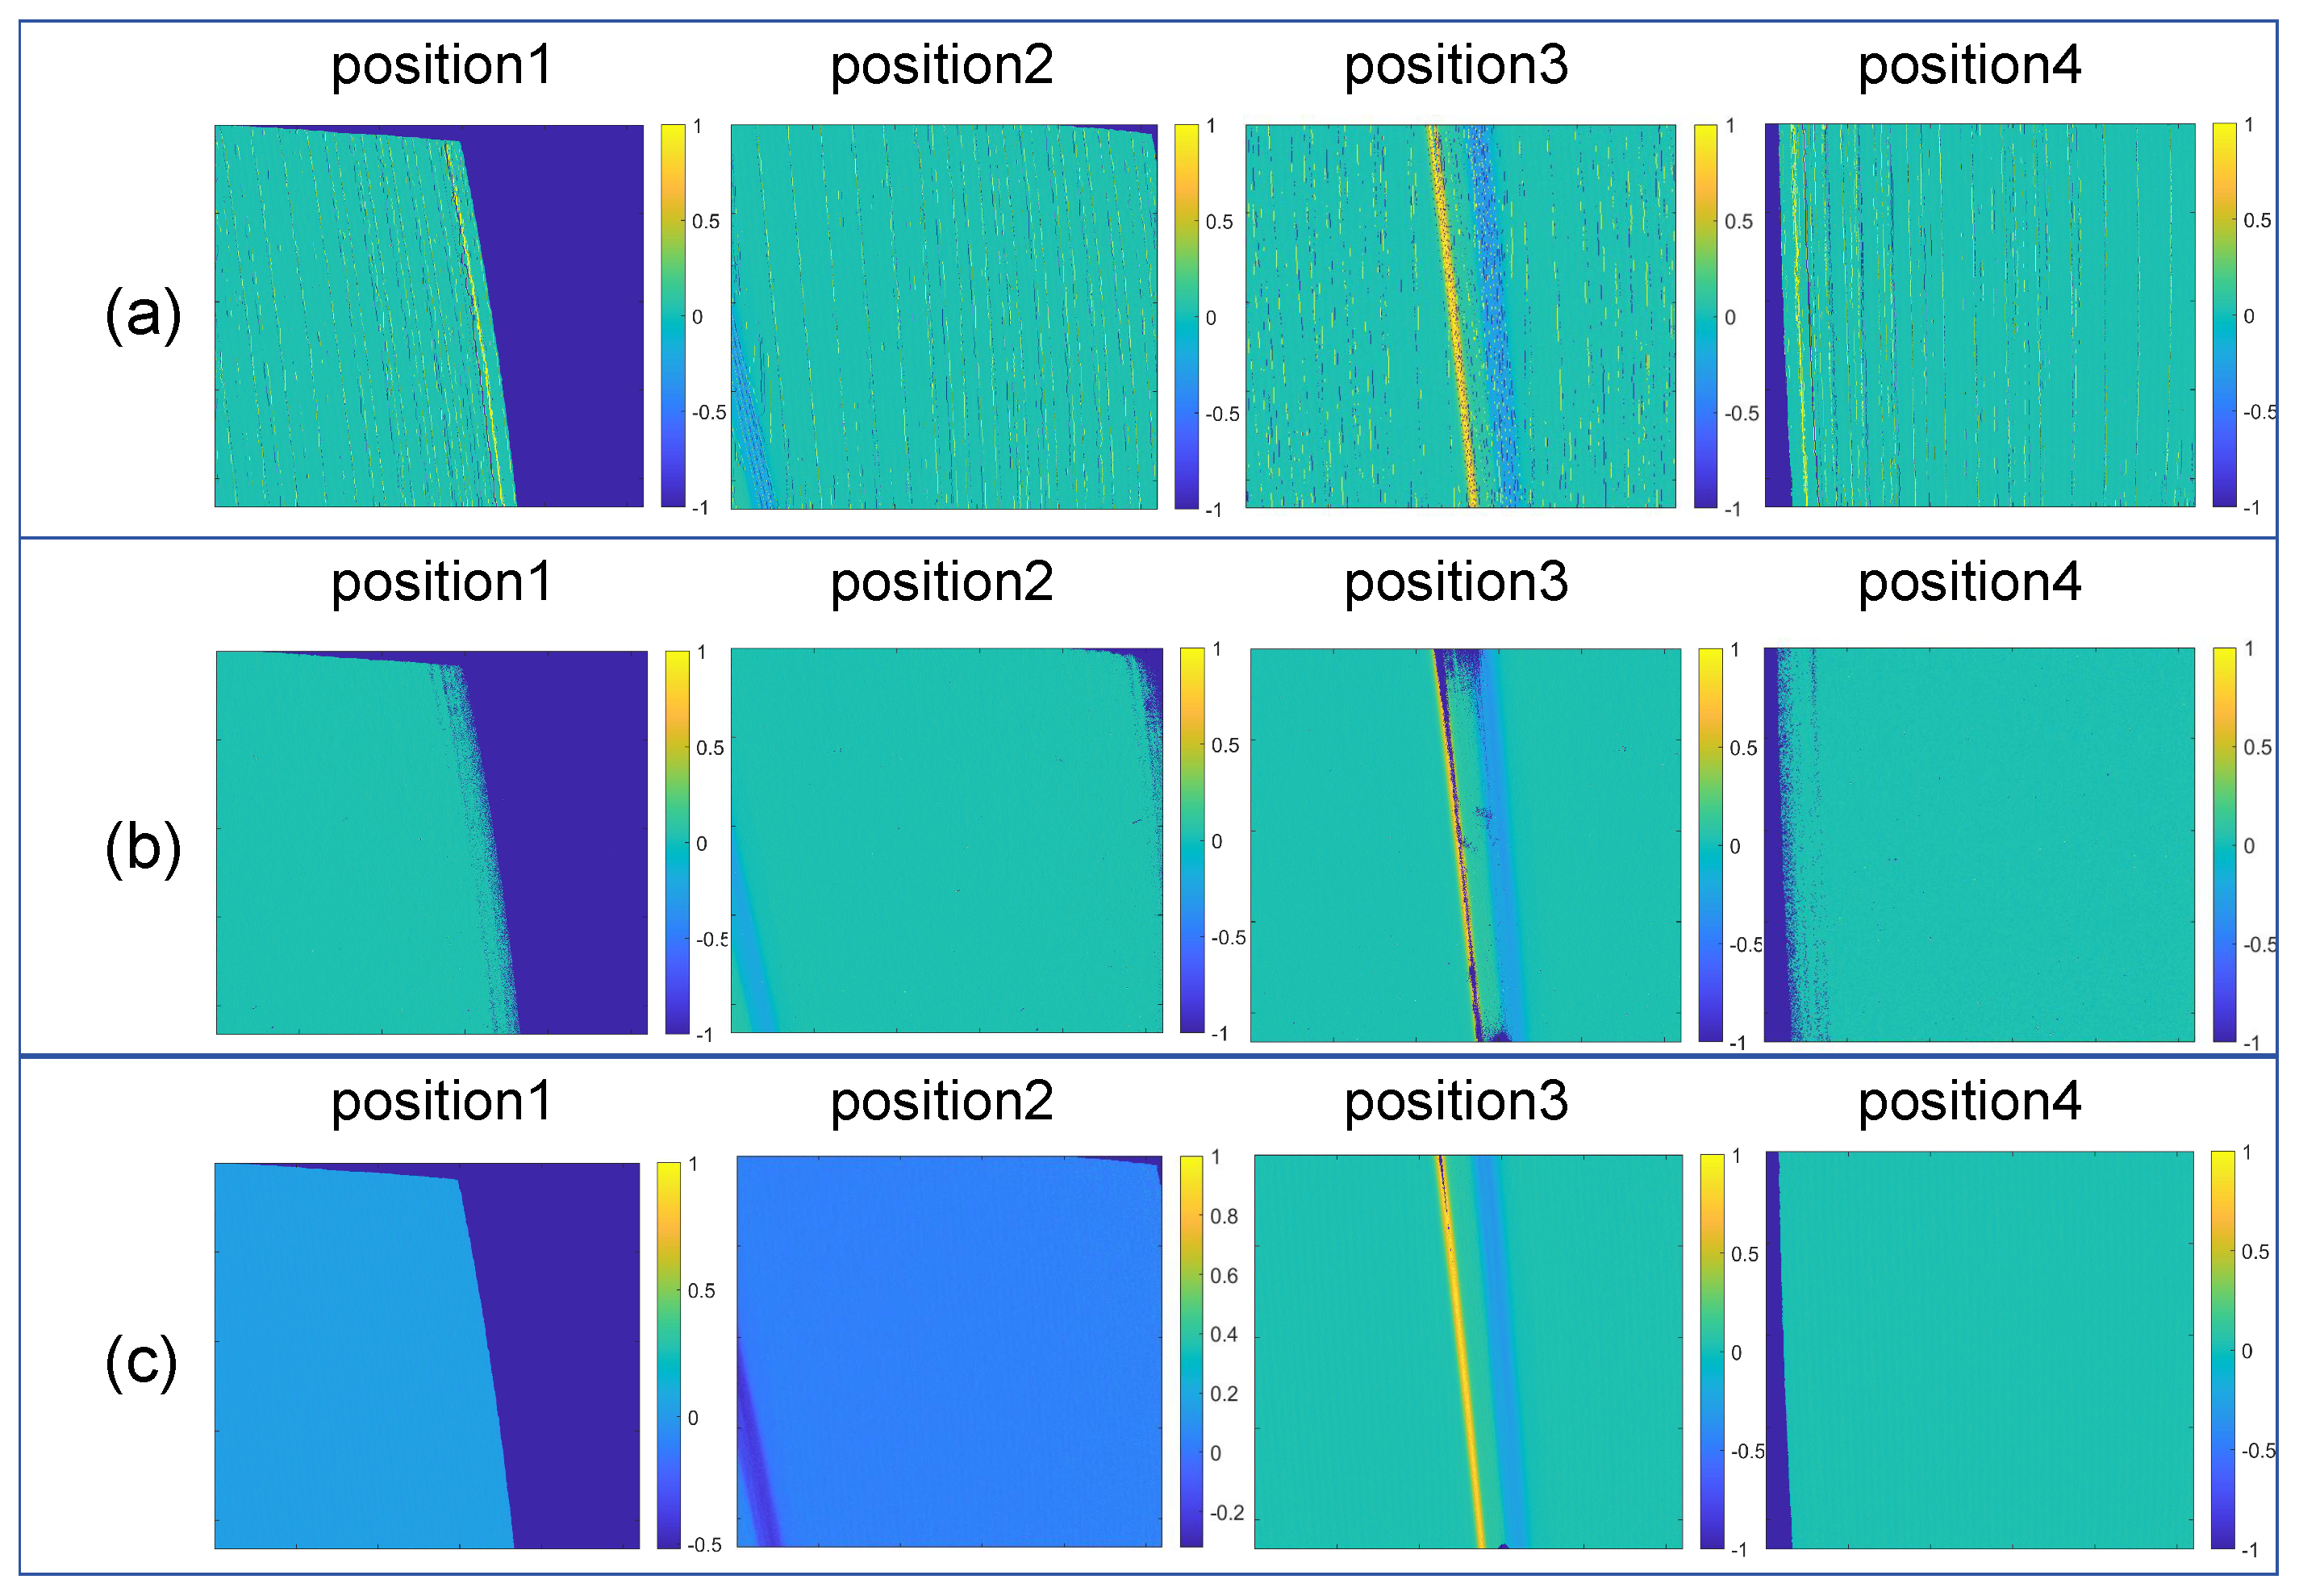
The absolute phase calculated by the three-frequency four-step method has been extensively validated on our system and is considered highly reliable. To verify the effectiveness of the proposed method, the fringe order map calculated by our approach is compared with that of the three-frequency four-step method in Figure 14, while the absolute phase is compared with the three-frequency four-step method and An’s method [27] in Figure 15. We also compared the phase gradient maps of these methods, as shown in Figure 16. We performed surface fitting for each absolute phase in Figure 15 and calculated the corresponding root mean square error (RMSE). This error can reflect the extent to which phase noise and fringe order affect the phase retrieval results. It can be observed that the RMSE of the proposed method is the smallest among the three methods. The experimental results show that the proposed method not only significantly reduces the number of encoded patterns but also improves accuracy.
Figure 14.
Comparison of fringe order results. (a) Fringe order map obtained by the multi-frequency heterodyne method; (b) fringe order map obtained by the proposed method.
Figure 15.
Absolute phase comparison. (a) Absolute phase unwrapped by An’s method; (b) absolute phase unwrapped by the multi−frequency heterodyne method; (c) absolute phase unwrapped by the proposed method.
Figure 16.
Phase gradient map. (a) Gradient map calculated by An’s method; (b) gradient map calculated by the multi-frequency heterodyne; (c) gradient map calculated by our method.
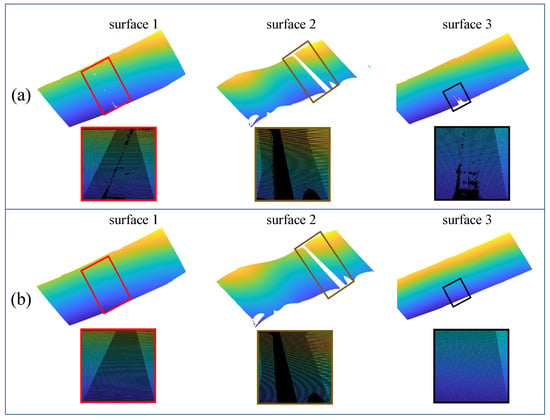
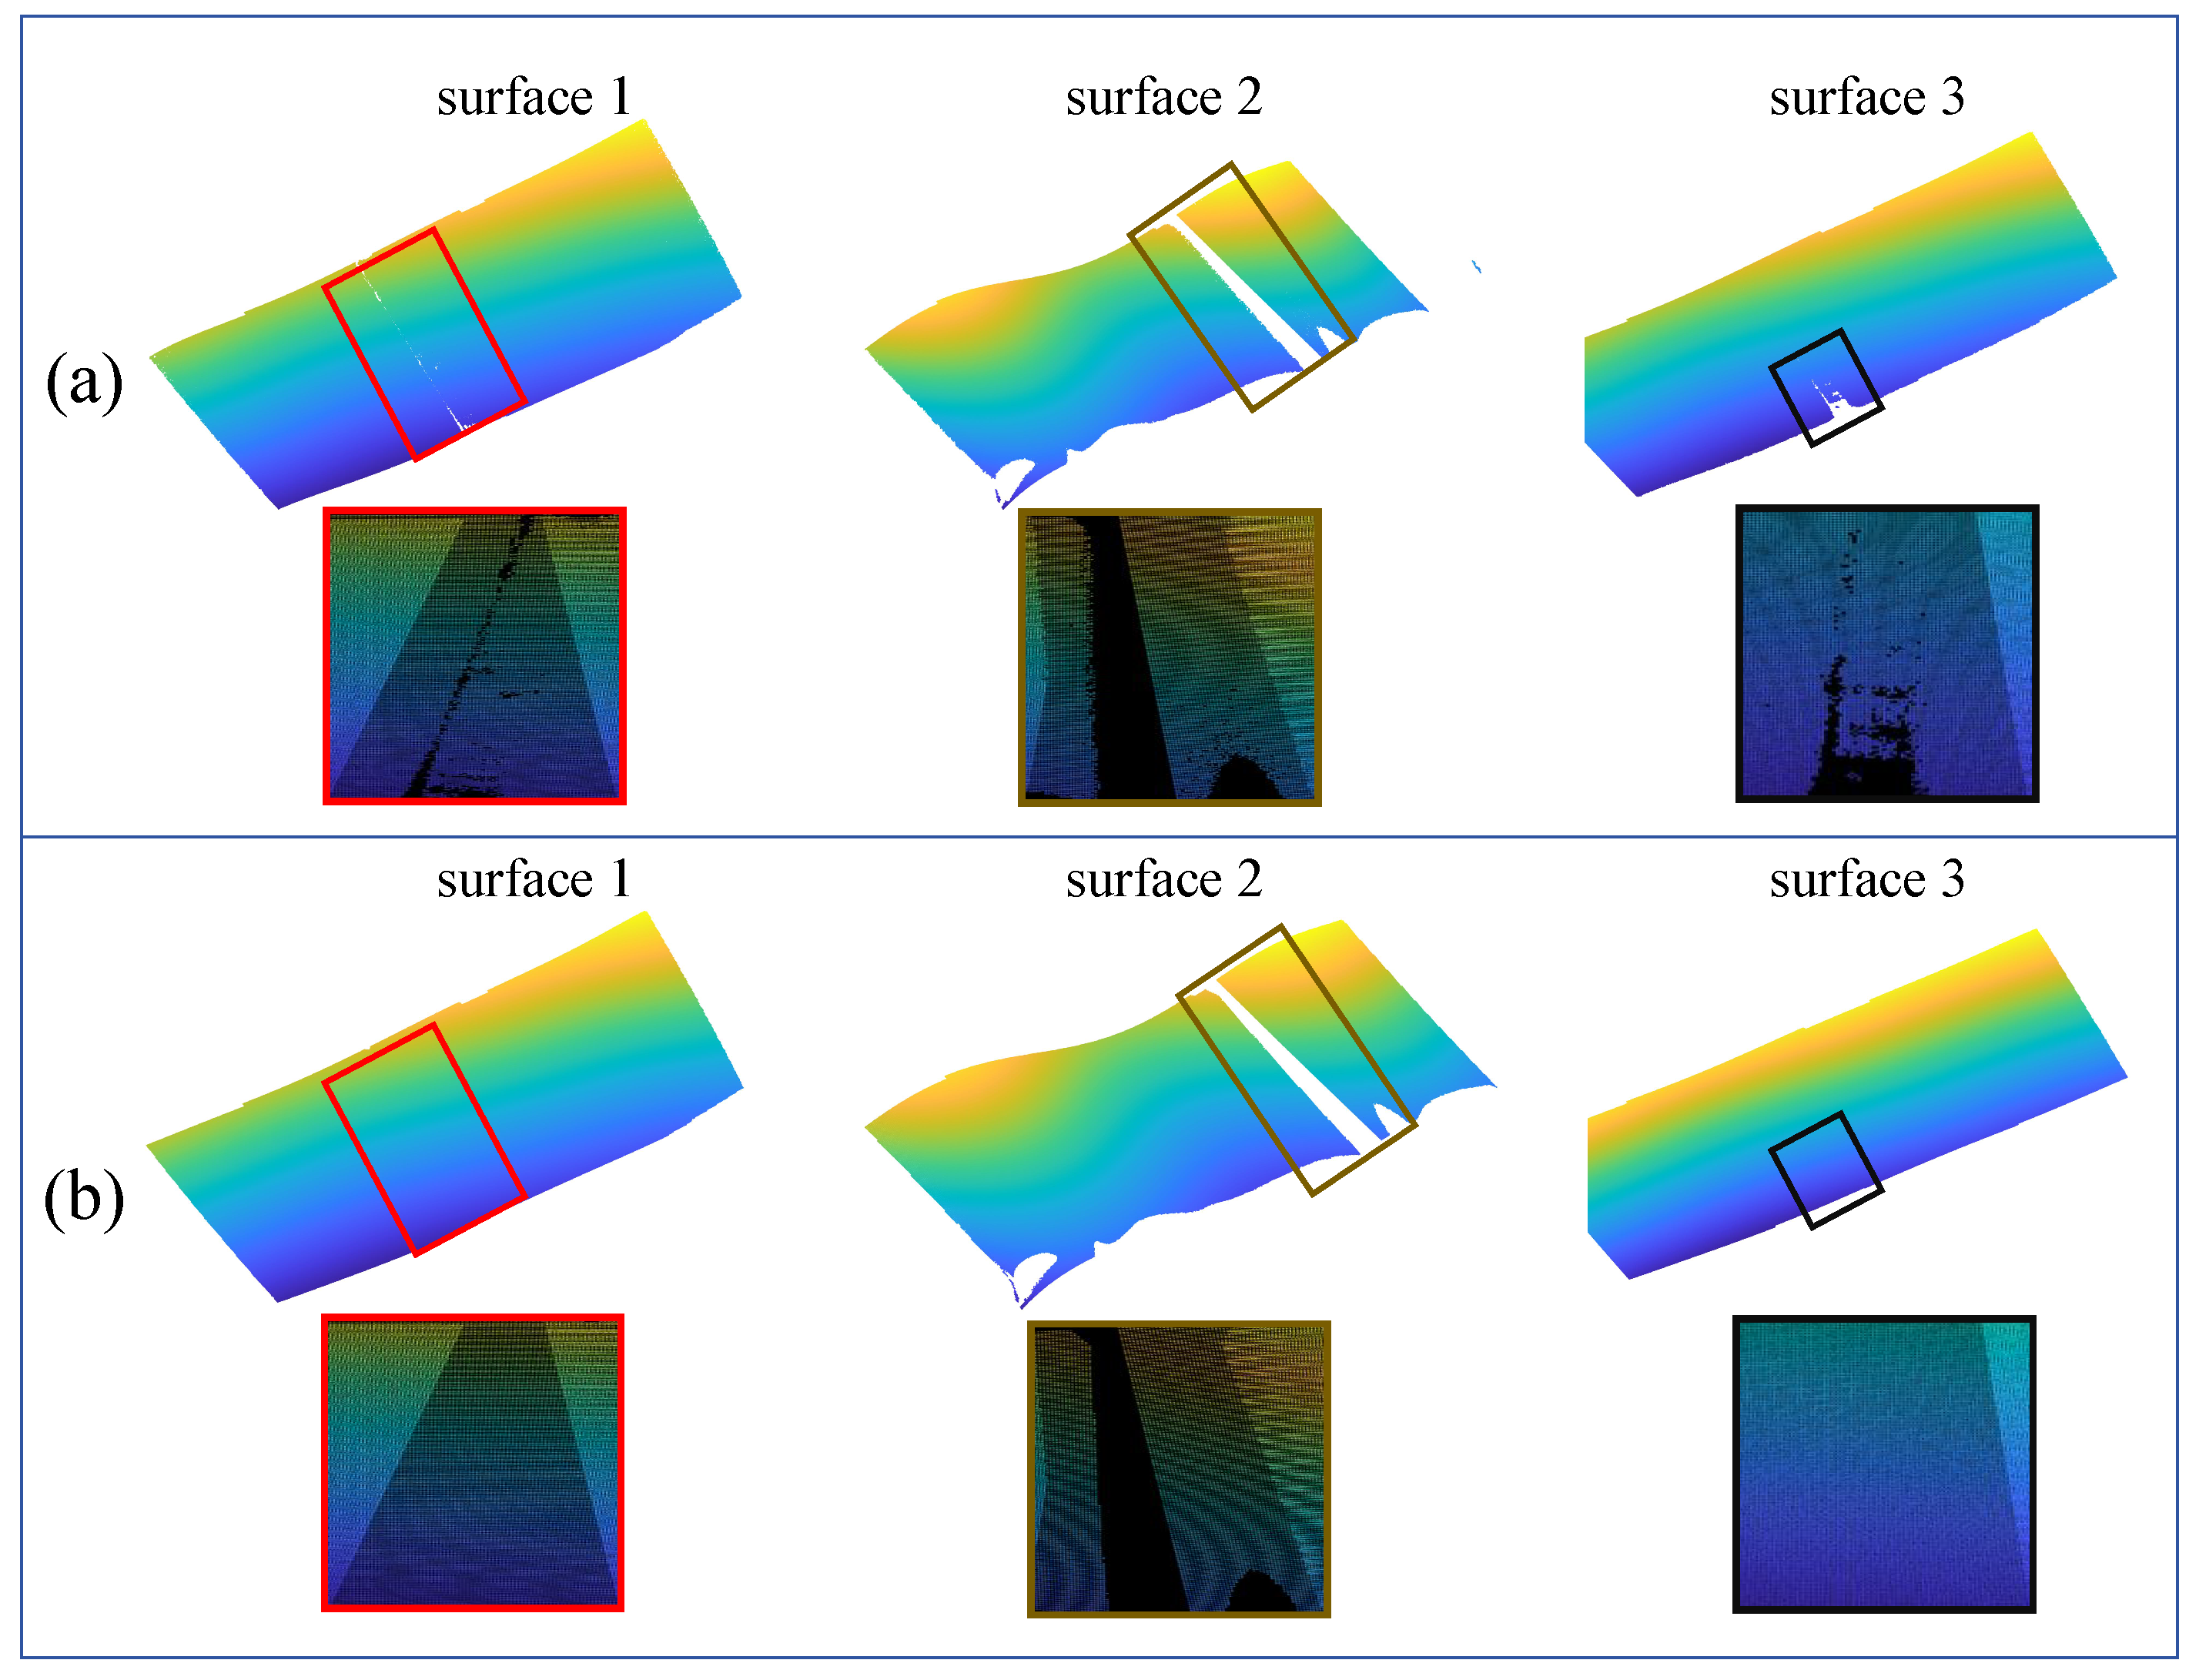
To ensure the correctness of our decoded fringe orders, surface gradients at each point on the object are indirectly derived from the absolute phase based on the principle of phase-measuring deflectometry. These gradient data are then processed through a Poisson integration algorithm to reconstruct the 3D height field, which effectively minimizes the cumulative error during the numerical integration process. The reconstruction results are shown in Figure 17. A multi-camera system with four synchronized units is employed in this setup. Through calibrated stereo vision parameters, direct feature point correspondence is established between each camera pair, enabling high-precision, single-frame 3D reconstruction of specular surfaces without requiring additional temporal sequences.
Figure 17.
Point cloud comparison. (a) Result reconstructed by the three-frequency four-step phase-shifting method; (b) result reconstructed by the proposed method.
4. Discussion
In the field of 3D reconstruction and reverse engineering, measurement accuracy and speed are often the two most concerning indicators. When reconstructing specular objects, classical spatial phase unwrapping algorithms, such as the three-frequency four-step phase-shifting method, require a large number of encoded patterns and perform poorly in measuring high-curvature areas. The Gray code strategy can reduce the number of patterns to some extent when the number of fringe periods is small. However, due to inter-reflections and non-uniform illumination on specular surfaces, the binarization step of Gray code becomes extremely challenging, and modulation-based segmentation methods often fail.
This paper proposes embedding period information into the phase-shifting sequence. Reusing the background intensity and modulation data obtained from four-step phase-shifting, we determine the fringe period. Since the actual measurement process is complex and involves various error sources during reverse reconstruction, resampling is introduced to enhance measurement accuracy. In addition, spatial information is incorporated to enable self-correction of the absolute phase, ultimately realizing a 4+1 pattern unwrapping algorithm for industrial applications. The encoding method proposed in the paper can be extended from four-step phase shifting to other phase-shifting schemes with different numbers of steps and remains equally applicable.
A high-precision Phase Measuring Deflectometry (PMD) measurement system relies not only on excellent algorithms but also crucially on rational hardware configuration. For instance, parameters such as the display screen’s brightness, contrast, and encoded fringe period must be determined according to the specific measurement scenario. On the other hand, camera settings including resolution, exposure time, gain, and aperture also require appropriate configuration. Furthermore, synchronization between the display’s refresh rate and the camera’s frame rate must be carefully ensured.
In addition to hardware safeguards, systematic error analysis is equally essential. Assuming an additive, white, Gaussian noise model with zero mean and standard deviation for the intensity [35] and under the condition of multi-period standard phase-shifting fringe patterns, the phase error standard deviation for the N-step PSP approach is defined as:
where represents the standard deviation of the phase error. Noise suppression in Phase-Shifting Profilometry (PSP) is governed by three key parameters: the phase-shift steps (N), the intensity modulation (B), and the fringe frequency (K). Increasing N improves accuracy at the cost of longer acquisition time. Optimizing B enhances the signal-to-noise ratio. Compared to standard 3-step sinusoidal patterns, raising K is the most effective way to reduce phase error.
Furthermore, the proposed method still has certain limitations. Since the measured object in this study is vehicle paint surfaces, which are relatively smooth and cover a large area, the phase self-correction algorithm achieves very good results. For smaller scenarios or surfaces with high complexity, additional correction procedures tailored to practical conditions may be necessary on the basis of the present work.
5. Conclusions
This paper proposes a novel temporal phase unwrapping algorithm to achieve robust three-dimensional measurement of specular objects. The period information of each pixel is embedded into the phase-shifting amount. During decoding, parameters are utilized to extract both the wrapped phase and the encoded phase. To address noise and nonlinear interference in practical measurement scenarios, a resampling strategy is employed to minimize the loss of periodic encoding information while simultaneously denoising the signal. After retrieving the fringe order map, a self-correction mechanism is applied based on the physical properties of the object and the spatial information of the phase map. Experimental results demonstrate that in the reverse engineering of 3D reconstruction for painted specular surfaces, the proposed encoding and decoding method using only 4+1 patterns can simultaneously improve both measurement speed and accuracy.
Author Contributions
Conceptualization, Z.W.; methodology, Z.W.; software, Z.W., X.L. and D.Y.; validation, Z.W., X.L. and D.Y.; investigation, Z.W. and X.H.; writing—original draft preparation, Z.W., X.H. and W.S.; writing—review and editing, Z.W.; supervision, J.T., Z.H. and Z.C.; funding acquisition, J.T. and Z.H. All authors have read and agreed to the published version of the manuscript.
Funding
This research was funded by National Natural Science Foundation of China, grant number 62203121, 62273105; Natural Science Foundation of Guangdong Province, grant number 2024A1515010557; Science and Technology Program of Guangzhou, grant number 2025A04J3373.
Institutional Review Board Statement
Not applicable.
Informed Consent Statement
Not applicable.
Data Availability Statement
The data presented in this study are available upon reasonable request from the corresponding author.
Conflicts of Interest
Author Xuewen Liu and Dong Yang was employed by the company SpeedBot Robotics Ltd. The remaining authors declare that the research was conducted in the absence of any commercial or financial relationships that could be construed as a potential conflict of interest.
References
- Knauer, M.C.; Kaminski, J.; Häusler, G. Phase measuring deflectometry: A new approach to measure specular free-form surfaces. In Optical Metrology in Production Engineering; SPIE: Bellingham, WA, USA, 2004; Volume 5457, pp. 366–376. [Google Scholar]
- Huang, L.; Idir, M.; Zuo, C.; Asundi, A. Review of phase measuring deflectometry. Opt. Lasers Eng. 2018, 107, 247–257. [Google Scholar] [CrossRef] [Scilit]
- Gorthi, S.S.; Rastogi, P. Fringe projection techniques: Whither we are? Opt. Lasers Eng. 2010, 48, 133–140. [Google Scholar] [CrossRef] [Scilit]
- Tang, Y.; Su, X.; Liu, Y.; Jing, H. 3D shape measurement of the aspheric mirror by advanced phase measuring deflectometry. Opt. Express 2008, 16, 15090–15096. [Google Scholar] [CrossRef] [Scilit]
- Goldstein, R.M.; Zebker, H.A.; Werner, C.L. Satellite radar interferometry: Two-dimensional phase unwrapping. Radio Sci. 1988, 23, 713–720. [Google Scholar] [CrossRef] [Scilit]
- Ghiglia, D.C. Two-Dimensional Phase Unwrapping: Theory, Algorithms, and Software; John Wiley and Sons, Inc.: Hoboken, NJ, USA, 1998. [Google Scholar]
- Huntley, J.M.; Saldner, H. Temporal phase-unwrapping algorithm for automated interferogram analysis. Appl. Opt. 1993, 32, 3047–3052. [Google Scholar] [CrossRef] [Scilit]
- Su, X. Phase unwrapping techniques for 3D shape measurement. In International Conference on Holography and Optical Information Processing (ICHOIP’96); SPIE: Bellingham, WA, USA, 1996; Volume 2866, pp. 460–465. [Google Scholar]
- Huang, P.S.; Zhang, C.; Chiang, F.-P. High-speed 3-D shape measurement based on digital fringe projection. Opt. Eng. 2003, 42, 163–168. [Google Scholar] [CrossRef] [Scilit]
- Zhang, Z.H. Review of single-shot 3D shape measurement by phase calculation-based fringe projection techniques. Opt. Lasers Eng. 2012, 50, 1097–1106. [Google Scholar] [CrossRef] [Scilit]
- Marrugo, A.G.; Gao, F.; Zhang, S. State-of-the-art active optical techniques for three-dimensional surface metrology: A review. J. Opt. Soc. Am. A 2020, 37, B60–B77. [Google Scholar] [CrossRef] [Scilit]
- Zhang, S. Absolute phase retrieval methods for digital fringe projection profilometry: A review. Opt. Lasers Eng. 2018, 107, 28–37. [Google Scholar] [CrossRef] [Scilit]
- Zuo, C.; Feng, S.; Huang, L.; Tao, T.; Yin, W.; Chen, Q. Phase shifting algorithms for fringe projection profilometry: A review. Opt. Lasers Eng. 2018, 109, 23–59. [Google Scholar] [CrossRef] [Scilit]
- Zuo, C.; Huang, L.; Zhang, M.; Chen, Q.; Asundi, A. Temporal phase unwrapping algorithms for fringe projection profilometry: A comparative review. Opt. Lasers Eng. 2016, 85, 84–103. [Google Scholar] [CrossRef] [Scilit]
- Zuo, C.; Qian, J.; Feng, S.; Yin, W.; Li, Y.; Fan, P.; Han, J.; Qian, K.; Chen, Q. Deep learning in optical metrology: A review. Light Sci. Appl. 2022, 11, 39. [Google Scholar] [CrossRef] [Scilit]
- Guo, W.B.; Zhang, Q.C.; Wu, Z.J. Real-time three-dimensional imaging technique based on phase-shift fringe analysis: A review. Laser Optoelectron. Prog. 2021, 58, 0800001. [Google Scholar]
- Zappa, E.; Busca, G. Comparison of eight unwrapping algorithms applied to Fourier-transform profilometry. Opt. Lasers Eng. 2008, 46, 106–116. [Google Scholar] [CrossRef] [Scilit]
- Zhao, M.; Huang, L.; Zhang, Q.; Su, X.; Asundi, A.; Kemao, Q. Quality-guided phase unwrapping technique: Comparison of quality maps and guiding strategies. Appl. Opt. 2011, 50, 6214–6224. [Google Scholar] [CrossRef] [Scilit]
- Lim, H.; Xu, W.; Huang, X. Two new practical methods for phase unwrapping. In Proceedings of the 1995 International Geoscience and Remote Sensing Symposium, IGARSS’95. Quantitative Remote Sensing for Science and Applications, Florence, Italy, 10–14 July 1995; Volume 1, pp. 196–198. [Google Scholar]
- Flynn, T.J. Two-dimensional phase unwrapping with minimum weighted discontinuity. J. Opt. Soc. Am. A 1997, 14, 2692–2701. [Google Scholar] [CrossRef] [Scilit]
- Ghiglia, D.C.; Romero, L.A. Minimum L p-norm two-dimensional phase unwrapping. J. Opt. Soc. Am. A 1996, 13, 1999–2013. [Google Scholar] [CrossRef] [Scilit]
- Creath, K. Step height measurement using two-wavelength phase-shifting interferometry. Appl. Opt. 1987, 26, 2810–2816. [Google Scholar] [CrossRef] [Scilit]
- Saldner, H.O.; Huntley, J.M. Temporal phase unwrapping: Application to surface profiling of discontinuous objects. Appl. Opt. 1997, 36, 2770–2775. [Google Scholar] [CrossRef] [Scilit]
- Tan, J.; Zou, T.; Chen, H.; Su, W.; He, Z. Spectral division multiplexing-based region projection for 3D measurement under mutual reflection. Opt. Lett. 2026, 51, 488–491. [Google Scholar] [CrossRef] [Scilit]
- Wang, Y.; Liu, K.; Hao, Q.; Lau, D.L.; Hassebrook, L.G. Period coded phase shifting strategy for real-time 3-D structured light illumination. IEEE Trans. Image Process. 2011, 20, 3001–3013. [Google Scholar] [CrossRef] [Scilit] [PubMed]
- Zhang, J.; Guo, W.; Wu, Z.; Zhang, Q. Three-dimensional shape measurement based on speckle-embedded fringe patterns and wrapped phase-to-height lookup table. Opt. Rev. 2021, 28, 227–238. [Google Scholar] [CrossRef] [Scilit]
- An, H.; Cao, Y.; Zhang, Y.; Li, H. Phase-shifting temporal phase unwrapping algorithm for high-speed fringe projection profilometry. IEEE Trans. Instrum. Meas. 2023, 72, 5009209. [Google Scholar] [CrossRef] [Scilit]
- Lin, H.; Huang, X.; Chen, Z.; He, G.; Xi, C.; Li, W. Matching pursuit network: An interpretable sparse time-frequency representation method toward mechanical fault diagnosis. IEEE Trans. Neural Netw. Learn. Syst. 2024, 36, 12377–12388. [Google Scholar] [CrossRef] [Scilit] [PubMed]
- Qi, J.; Chen, Z.; Kong, Y.; Qin, W.; Qin, Y. Attention-guided graph isomorphism learning: A multi-task framework for fault diagnosis and remaining useful life prediction. Reliab. Eng. Syst. Saf. 2025, 263, 111209. [Google Scholar] [CrossRef] [Scilit]
- Tan, J.; Liu, J.; Wang, X.; He, Z.; Su, W.; Huang, T.; Xie, S. Large depth range binary-focusing projection 3D shape reconstruction via unpaired data learning. Opt. Lasers Eng. 2024, 181, 108442. [Google Scholar] [CrossRef] [Scilit]
- Tan, J.; Niu, H.; Su, W.; He, Z. Structured light 3D shape measurement for translucent media based on deep Bayesian inference. Opt. Laser Technol. 2025, 181, 111758. [Google Scholar] [CrossRef] [Scilit]
- Feng, S.; Chen, Q.; Gu, G.; Tao, T.; Zhang, L.; Hu, Y.; Yin, W.; Zuo, C. Fringe pattern analysis using deep learning. Adv. Photonics 2019, 1, 025001. [Google Scholar] [CrossRef] [Scilit]
- Spoorthi, G.E.; Gorthi, S.; Gorthi, R.K.S.S. PhaseNet: A deep convolutional neural network for two-dimensional phase unwrapping. IEEE Signal Process. Lett. 2018, 26, 54–58. [Google Scholar] [CrossRef] [Scilit]
- Dardikman, G.; Shaked, N.T. Phase unwrapping using residual neural networks. In Computational Optical Sensing and Imaging; OSA Technical Digest; Optica Publishing Group: Washington, DC, USA, 2018; Paper CW3B.5. [Google Scholar]
- Li, J.; Hassebrook, L.G.; Guan, C. Optimized two-frequency phase-measuring-profilometry light-sensor temporal-noise sensitivity. J. Opt. Soc. Am. A 2003, 20, 106–115. [Google Scholar] [CrossRef] [Scilit]
Disclaimer/Publisher’s Note: The statements, opinions and data contained in all publications are solely those of the individual author(s) and contributor(s) and not of MDPI and/or the editor(s). MDPI and/or the editor(s) disclaim responsibility for any injury to people or property resulting from any ideas, methods, instructions or products referred to in the content. |
© 2026 by the authors. Licensee MDPI, Basel, Switzerland. This article is an open access article distributed under the terms and conditions of the Creative Commons Attribution (CC BY) license.