


Abstract
We present an investigation of the thermal damage threshold of passivated Bi2Se3 films upon laser illumination, with a focus on their employment in terahertz (THz) spectroscopic applications. Passivation was achieved by depositing a thin 3 nm Al capping layer which, exposed to the ambient, forms a natural oxide. In THz transient emission experiments, the samples were exposed to a train of 100 fs wide laser pulses with 800 nm wavelength at 78 MHz repetition rate and peak power density up to 295 mW/µm2. For the sake of comparison, the films were also exposed to continuous wave laser light with a wavelength of 532 nm in the average optical power density range from 5 × 10⁻² mW/µm2 to 50 mW/µm2. In both cases, changes in film appearance, detected by optical microscopy, or even film removal in a small area close to the center of the illuminated spot could be induced. Raman spectroscopy provided evidence that the crystalline phase of Bi2Se3 films is present in areas that have been exposed but not damaged. Conversely, in the film region illuminated with the highest peak power density no Raman signal was detected in the range under investigation which we ascribe to material removal. At the perimeter of this ablated area, we observed a dominant Raman mode at approximately 255 cm−1 that we can attribute to selenium and indicates partial Bi2Se3 decomposition. In contrast, we observed Raman spectra corresponding to as-deposited Bi2Se3 only a few micrometers away from the laser-damaged area. Hence, the observed THz radiation originates from this illuminated but undamaged region. This detailed knowledge is expected to serve as a guide for designing the emitter’s thermal management and choosing laser parameters for optimal operation.
1. Introduction
The reliability and long-term operation of electronic and photonic devices have attracted heightened attention in recent decades. In addition to the general efforts aimed at reducing power consumption and ensuring efficient operation without adversely affecting device functionality, it is imperative to ascertain optimal operating conditions. This phenomenon is also evident in spintronic THz emitters based on various nanolayers [1,2,3,4,5], as well as studies performed on Bi2Se3 [6,7,8,9,10]. Terahertz emission from three-dimensional topological insulators (TIs) arises from several nonlinear processes. These exploit either the unique Dirac surface states or bulk carrier dynamics. One principal contribution arises from transient surface photocurrents [8,11,12] and photogalvanic effects [9,12] among others. Also, Zhu et al. [6] reported on polarization-resolved studies of the emitted terahertz (THz) spectrum from the surface of Bi2Se3. Two emission mechanisms were identified: emission generated from the transient photocurrent under the influence of the surface depletion field, and emission resulting from nonlinear optical rectification performed at the Bi2Se3 surface.
In general, the duration of a device’s lifespan is constrained by a number of critical factors, one of which is the generation of heat during operation. The physical effects can, in certain instances, result in the degradation of the device’s materials. In order to circumvent undesirable heat accumulation and/or enhance heat dissipation, strategies have been followed inspired by laser processing, and welding parameter optimization, as well as studies on thermal wave scattering for sub-surface defect detection [13,14,15]. In addition, a plethora of unconventional heat management solutions have been devised and implemented, including, e.g., the growth of III-nitrides [16,17,18] and III-arsenides [19] for femtosecond photodetectors on metallic substrates and/or layers. Despite the implementation of these efforts and the integration of advanced device design and innovative architectures, the assessment of safe operational conditions remains paramount for ensuring the prolonged functionality of devices, particularly in scenarios involving high-power pulsed optical exposure, as exemplified by the operation of thin film-based THz emitters. In previous reports, the determination of thermal damage threshold in THz photomixer structures and phase change evolution in chalcogenide nano-membranes was conducted with the aid of Raman spectroscopy [20,21]. This non-destructive optical method has been demonstrated to be well-suited for delivering significant insights into the nature of various mechanisms, including phase change, aging, degradation, and/or corrosive processes. Its efficacy is attributed to its high sensitivity to chemical composition and bonding and, notably, its ability to detect impurities.
In the following, we focus on determining the optimal operational conditions of Bi2Se3-based THz emitters. The primary aim of our present study is estimating the thermal damage threshold for THz emitters based on passivated Bi2Se3 chalcogenide material, not only for THz generation applications, but potentially also for the thermal “healing” of structural defects/damages (to be reported in future) caused by, for example, extraterrestrial/space/solar or nuclear radiation. Therefore, this work represents a first building block towards emerging applications where different wavelengths for pulsed and continuous wave (cw) are required and applied to, e.g., efficient data storage and erasure of information manifested as different phase states in chalcogenide-type materials. Recently, Zheng et al. [22] demonstrated the use of different laser wavelengths for pulsed (800 nm) and cw (532 nm) exposures for rewritable optical storage, incorporating recording/writing and subsequent readout and/or erasing of surface patterns/information. We are aware that Bi2Se3, with its bandgap of ~0.3 eV, exhibits different absorption coefficients at 532 nm and 800 nm [23,24,25] and that fs excitation at 800 nm can involve nonlinear absorption pathways [26]. Optical constants from available literature suggest that Bi2Se3 is highly absorbing at both wavelengths and the penetration depth is on the order of ~10–18 nm at 532 nm vs. ~30–60 nm at 800 nm, respectively. Therefore, the laser energy deposition profiles may differ in our 70 nm film. The optical constants reported [23,24,25,26] range from ~0.39 to 0.53 and ~0.41 to 0.47 for 532 nm and 800 nm, respectively. However, we can nevertheless evaluate the resulting film modifications using Raman spectroscopy for both pulsed and cw laser film illumination. Determining the safe range for laser intensities is essential for device performance improvement as well as increasing device lifetime and reliability.
2. Materials and Methods
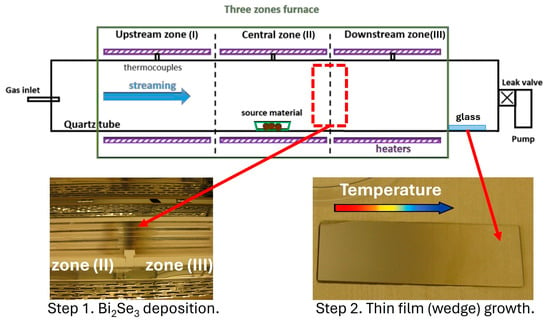
The Bi2Se3 films investigated by Raman spectroscopy in this study were synthesized by the physical vapor deposition (PVD) technique using a three-zone quartz tube furnace (OTF-1200X-III-HVC, MTI Corporation, Richmond, CA, USA), following a procedure similar to that described in [27]. In this study, the optimization of the deposition process was carried out empirically. However, we envisage further process optimization in the future by applying recently reported emerging computational methodologies [28,29,30]. The fabrication process consisted of two consecutive steps. In the first step, Bi2Se3 granular powder (99.999%, Sigma Aldrich, St. Louis, MO, USA, 35 mg) was placed in a quartz boat located in the middle of the central zone (II), as shown in Figure 1. The tube was flushed with Ar several times and then sealed at a pressure of 1 × 10⁻¹ mbar. The furnace temperature was ramped over 45 min from room temperature to 625, 600, and 375 °C in zones I, II, and III, respectively, and maintained at these values for 15 min. This procedure ensured complete evaporation of the Bi2Se3 source material. The heaters were then switched off, allowing the furnace to cool naturally. During cooling, the evaporated species condensed on the inner surface of the tube at the boundary between the central zone (II) and the downstream zone (III), where the temperature falls below the sublimation point of Bi2Se3. In the second step, once the furnace had cooled to room temperature, a quartz boat containing Se powder (99.99%, Sigma Aldrich, St. Louis, MO, USA, 10 mg) was placed at the border between zones II and III, where the Bi2Se3 species from the first step had condensed. A glass substrate (25 × 75 × 2 mm3) intended for thin-film deposition was loaded at the far downstream end of zone III, outside the heated region (see Figure 1). The tube was again flushed with Ar and sealed at a pressure of 1 × 10⁻² mbar. The temperature in all three zones was then raised to 625 C within 20 min and held for 30 min to re-evaporate the condensed Bi2Se3 species and Se. The furnace was then switched off and cooled down naturally. These re-evaporated species flowed toward the pumping system and condensed preferentially on the cooler walls of the tube, where the glass substrate was positioned. Because of the temperature gradient across the glass substrate, a thickness wedge formed: the layer was thicker at the “hot” edge and thinner at the “cold” edge. Immediately after synthesis, the sample was transferred to an electron-beam evaporator (Lesker PVD 225, Kurt J. Lesker Company, Pittsburgh, PA, USA) for deposition of a thin (3 nm) Al capping layer. Exposure to the ambient atmosphere induces the natural oxidation process [31,32]. The oxide layer formed serves as a passivation layer protecting the Bi2Se3 film from oxidation.
Figure 1.
Schematic of the three-zone quartz tube furnace, showing the positions of the source material and the substrate during the two growth steps.
The thickness and surface morphology of the deposited layer were examined using an atomic force microscope (AFM, Bruker Dimension ICON, Bruker Corporation, Billerica, MA, USA) and a scanning electron microscope (SEM, Zeiss Supra 60 VP, Carl Zeiss AG, Oberkochen, Germany) equipped with an energy-dispersive X-ray (EDX) analyzer (XFLASH 5010, Bruker Corporation, Billerica, MA, USA). X-ray diffraction (XRD) and X-ray reflectivity (XRR) measurements were carried out on a Panalytical XPert diffractometer (Malvern Panalytical, Almelo, The Netherlands) using CuKα radiation (λ = 1.5406 Å). We expect the native oxidation process to have ended before we started material characterization. This creates a natural protective layer on the surface of aluminum when it is exposed to air. This dense, adherent oxide layer provides a significant barrier against further oxidation [31,32].
In order to generate THz radiation, the passivated Bi2Se3 films were illuminated from the film’s front side by a train of 100 fs wide laser pulses generated by a Ti:sapphire solid state laser oscillator (Mai Tai Spectra Physics, Milpitas, CA, USA). The laser beam was first split into two optical paths with a 90:10 intensity ratio. The pump beam with 90% of the intensity was focused and generated THz radiation from the passivated Bi2Se3 film. The intensity of the pump beam was additionally tuned by variable neutral density filters. The full width at half maximum (FWHM) of the beam was approximately 300 μm at the film’s surface, which corresponds to a 1/e2 diameter of 510 µm. The 10% intensity probe beam was used to trigger a low-temperature-grown GaAs photoconductive antenna (PCA) for stroboscopic detection of the THz transients [33]. A computer-controlled delay stage was used to control the time delay between the pump and probe pulses. The THz radiation generated by the pump pulse was focused on the PCA and the resulting photocurrent was measured by a lock-in amplifier. The reference frequency for the lock-in was extracted from a mechanical chopper placed in the optical path of the pump beam. The THz emission experiments were obtained without the application of an external magnetic field.
The Raman studies were carried out in a confocal Raman microscope (Renishaw inVia FSM REFLEX, New Mills, Gloucestershire, UK) in backscattering geometry, which was equipped with a frequency-doubled Nd-YAG laser (532 nm, 50 mW) and a CCD detector. The backscattered signal was collected through a 100× objective lens and dispersed by a grating with 2400 grooves per mm. The laser spot 1/e2-diameter was ~1 µm and the laser power was kept below 0.05 mW to avoid sample damage and any heating effects. This value was experimentally evaluated by power density measurements under cw laser illumination. The power density of ~0.05 mW/μm2 used for our Raman spectroscopy investigations was reproducibly identified as a power density that does not initiate any surface morphology or structural changes in pristine regions of the passivated Bi2Se3 specimen. Zhang et al. [34] reported that the laser power at the sample surface was less than 70 μW and confirmed that such low-power excitation effectively excludes any laser heating effects in Raman measurements. The power density of our excitation laser is lower than that used by other groups [34,35,36,37]. The respective results are presented later in Section 3. Results: The spectrometer was referenced to the transverse optical phonon of Si at 521 cm−1. Spectra were recorded in the range between 100 cm−1 and 500 cm−1. Throughout these measurements, a Rayleigh edge filter of ~100 cm−1 was used. Additionally, it should also be noted here that the ambient humidity in the laboratory was controlled and monitored throughout the experiments, reaching a value close to 29%.
The laser parameters used in the experiments for pulsed and cw laser illumination are compiled in Table 1.
Table 1.
Parameters of the laser beams used. The average power is the time-averaged total power incident on the entire sample area. The beam area is calculated from the 1/e2-diameter of the Gaussian beam profile (~1 µm for the cw beam and 510 µm for the pulsed beam). The average power density is the average power divided by the beam area. For comparison, the fluence is also listed. The peak power density is the maximum laser amplitude required to achieve the given average power. It depends on the spatial extent of the beam and, for pulsed beams, also on the temporal pulse width (100 fs FWHM) and the pulse repetition rate (78 MHz). Therefore, the peak power density for both continuous wave and pulsed beams is the highest power density that hits the sample, namely at the spatial center of the beams and, in the case of pulses, at their temporal maximum. The films were irradiated from the film’s front side.
3. Results
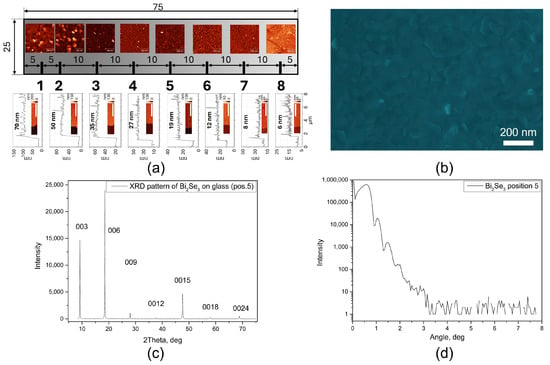
Figure 2a presents a schematic of the Bi2Se3 film with a thickness wedge formed along the long side of a glass substrate together with AFM images of the surface morphology at selected positions (indicated below). Artificial scratches were introduced to accurately determine the thickness. Representative AFM images and corresponding height profiles are shown at the bottom of Figure 2a. The layer thickness varied from ~70 nm at the “hot” side to ~6 nm at the “cold” side of the substrate. Figure 2b shows an SEM image of the Bi2Se3 layer at position 5 (~20 nm thick). The layer appears crack-free, continuous, and uniform over the entire area. EDX analysis confirmed a homogeneous distribution of Bi and Se, with an average composition of 40 ± 2 at% of Bi and 60 ± 5 at% of Se, consistent with the stoichiometry of Bi2Se3. XRD analysis (Figure 2c) revealed diffraction peaks corresponding only to the (003n) family, confirming that the Bi2Se3 layers grow with the c-axis oriented perpendicular to the substrate surface, which is the most energetically favorable growth direction. Pronounced XRR oscillations further indicate smooth interfaces and surfaces (Figure 2d). Thickness values obtained from XRR fitting were in good agreement with those measured by AFM. Taken together, these results confirm the high structural quality of the synthesized Bi2Se3 layer. For the experiments presented in this study, capped/passivated Bi2Se3 films with a thickness of ~70 nm were exposed to pulsed and cw laser illumination.
Figure 2.
(a) Schematic of the sample (glass substrate with Bi2Se3 wedge) together with AFM images of the morphology at different positions, with thickness determined from artificial scratches. (b) SEM image of the layer at position 5. (c) XRD pattern from position 5, showing only peaks corresponding to the (003n) family. (d) XRR measurements with well-pronounced oscillations, confirming the high quality of the layer.
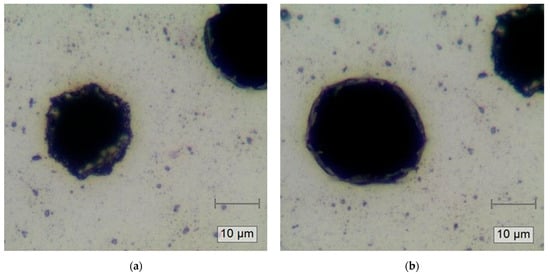
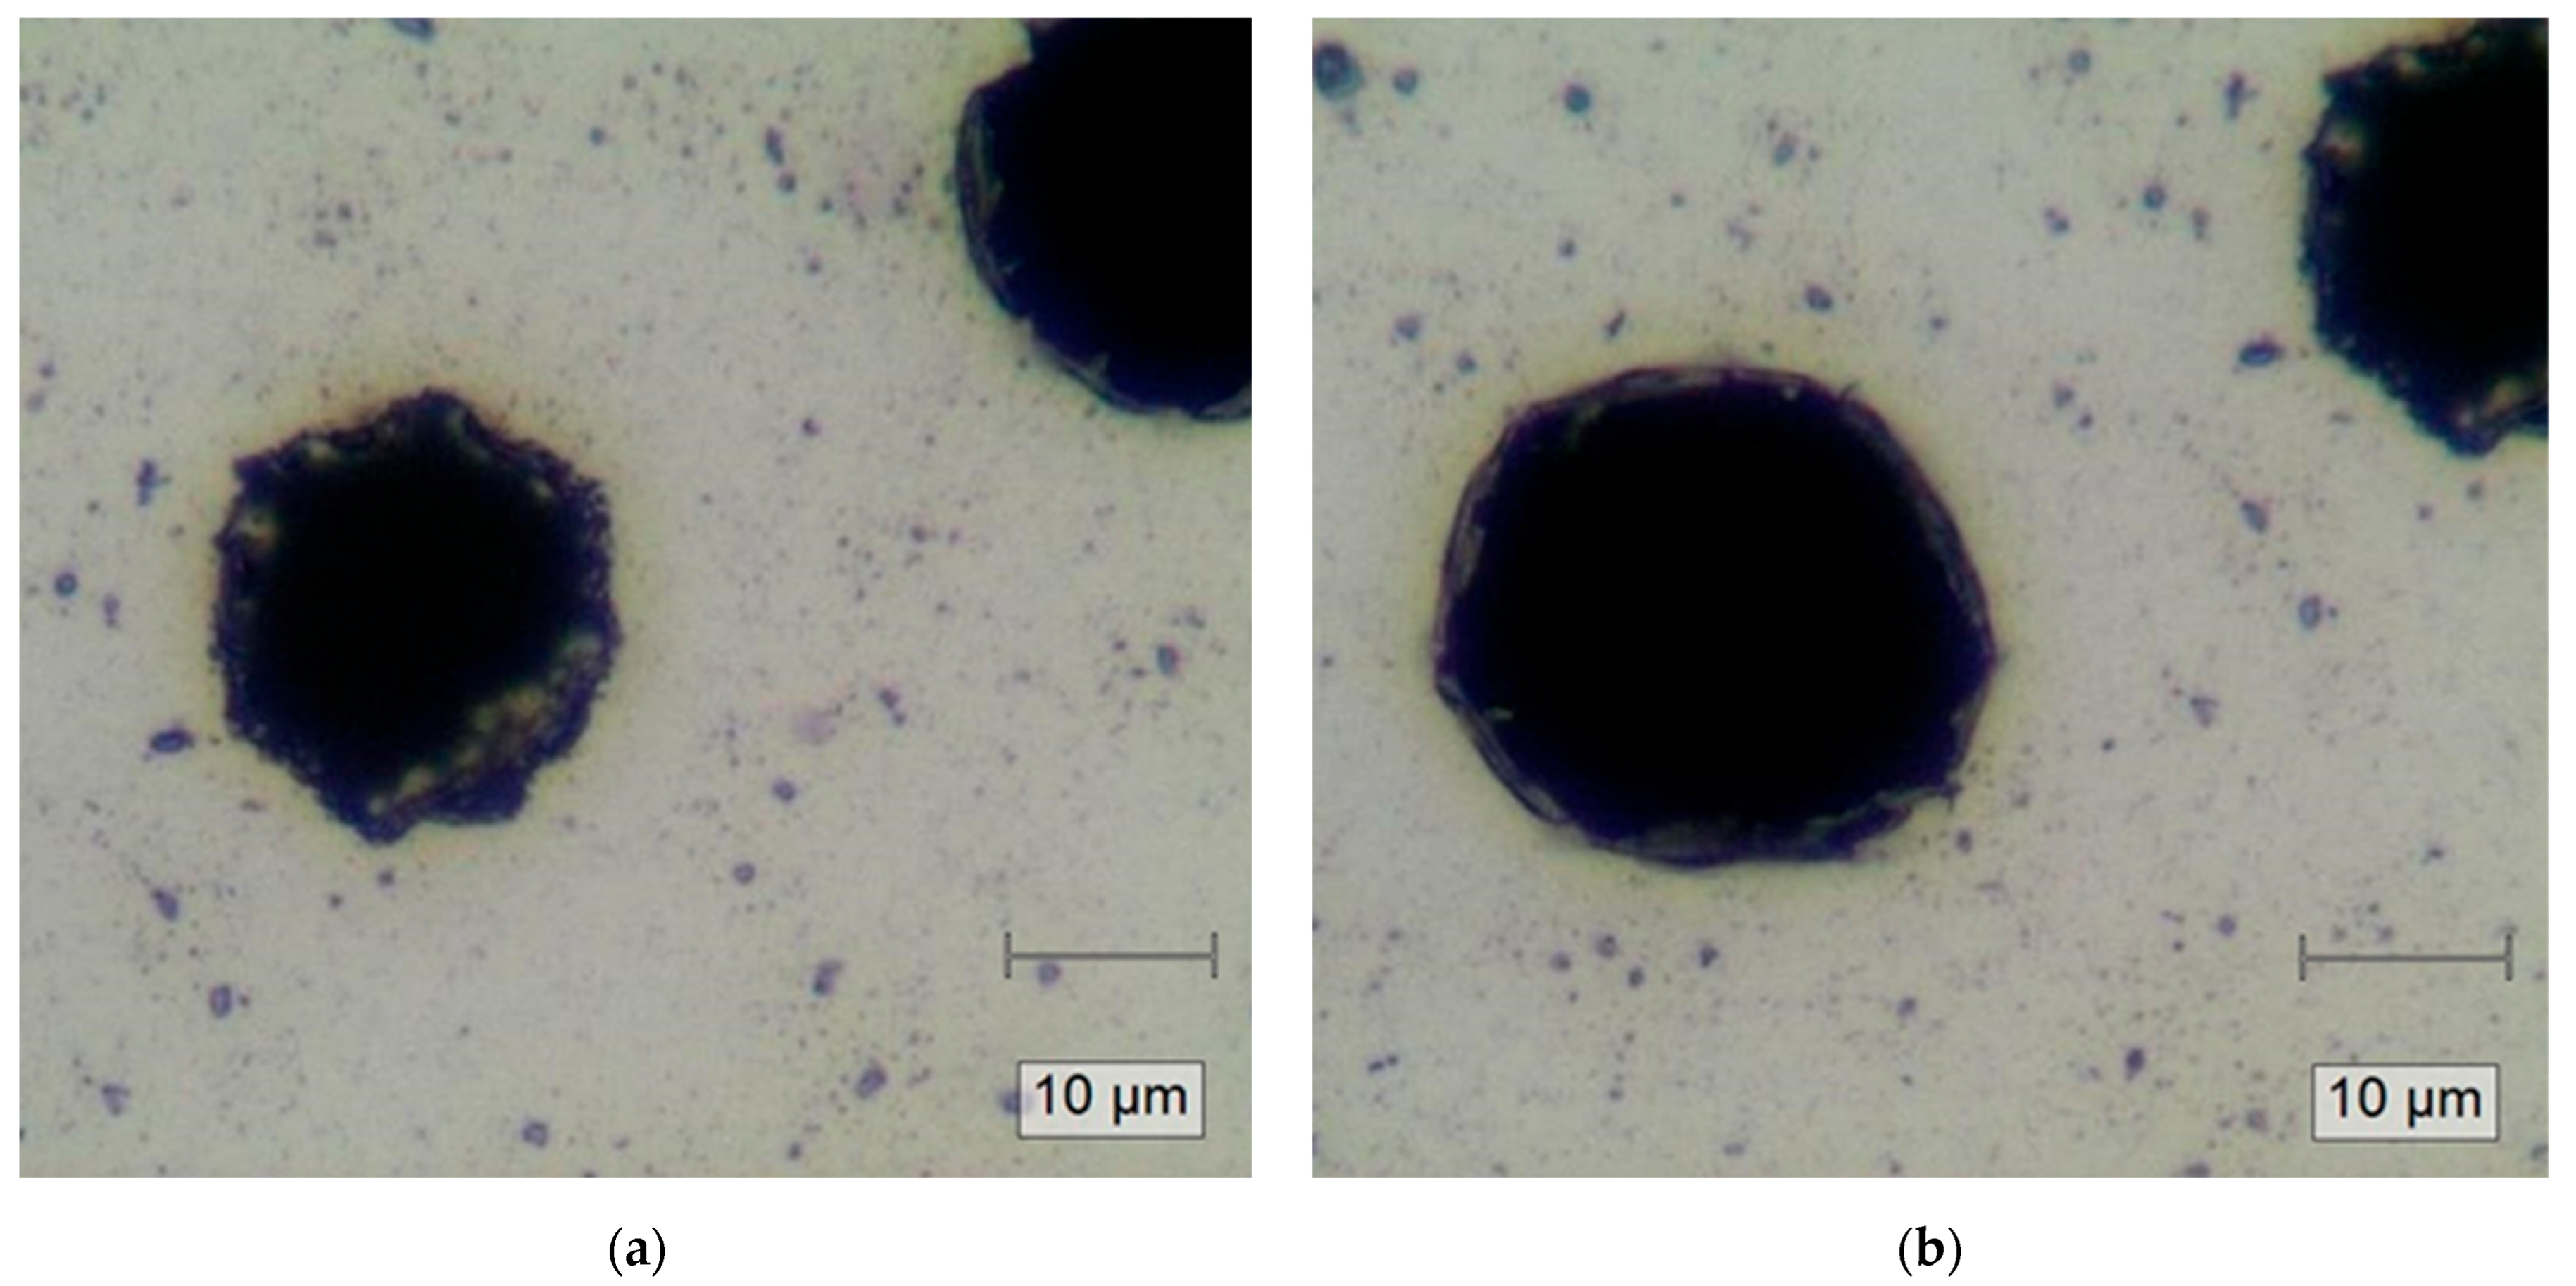
Figure 3 presents optical micrographs of the Al-capped Bi2Se3 films after pulsed laser exposure (800 nm, 100 fs wide, 78 MHz repetition rate, exposure time = 120 s) for two distinct incident laser peak power densities of 59 mW/µm2 (Figure 3a) and 295 mW/µm2 (Figure 3b). In both cases, there are visible locally melted circular black regions with diameters of approximately 20 and 25 µm, which are clearly smaller than the 1/e2-diameter of the pulsed beam. These regions include recrystallized rim areas up to 2 µm thick.
Figure 3.
Representative optical micrographs of passivated Bi2Se3 films after pulsed laser exposure (800 nm, 100 fs wide, exposure time = 120 s) of (a) peak power density 59 mW/µm2 and (b) peak power density 295 mW/µm2. Disparities in surface morphology and possibly holes due to laser ablation (circle-like “black” regions) are observed. Melted/recrystallized area/structures are visible on the rim of the black regions in both figures.
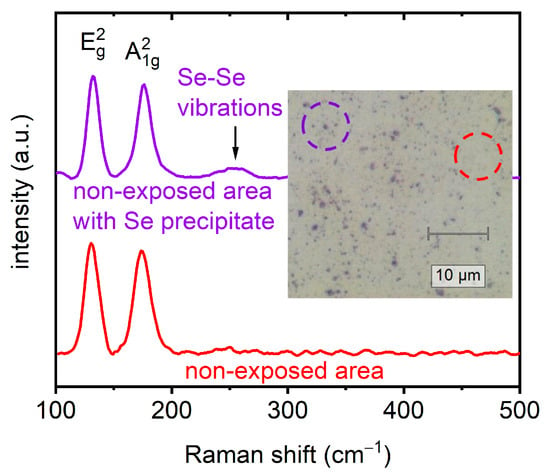
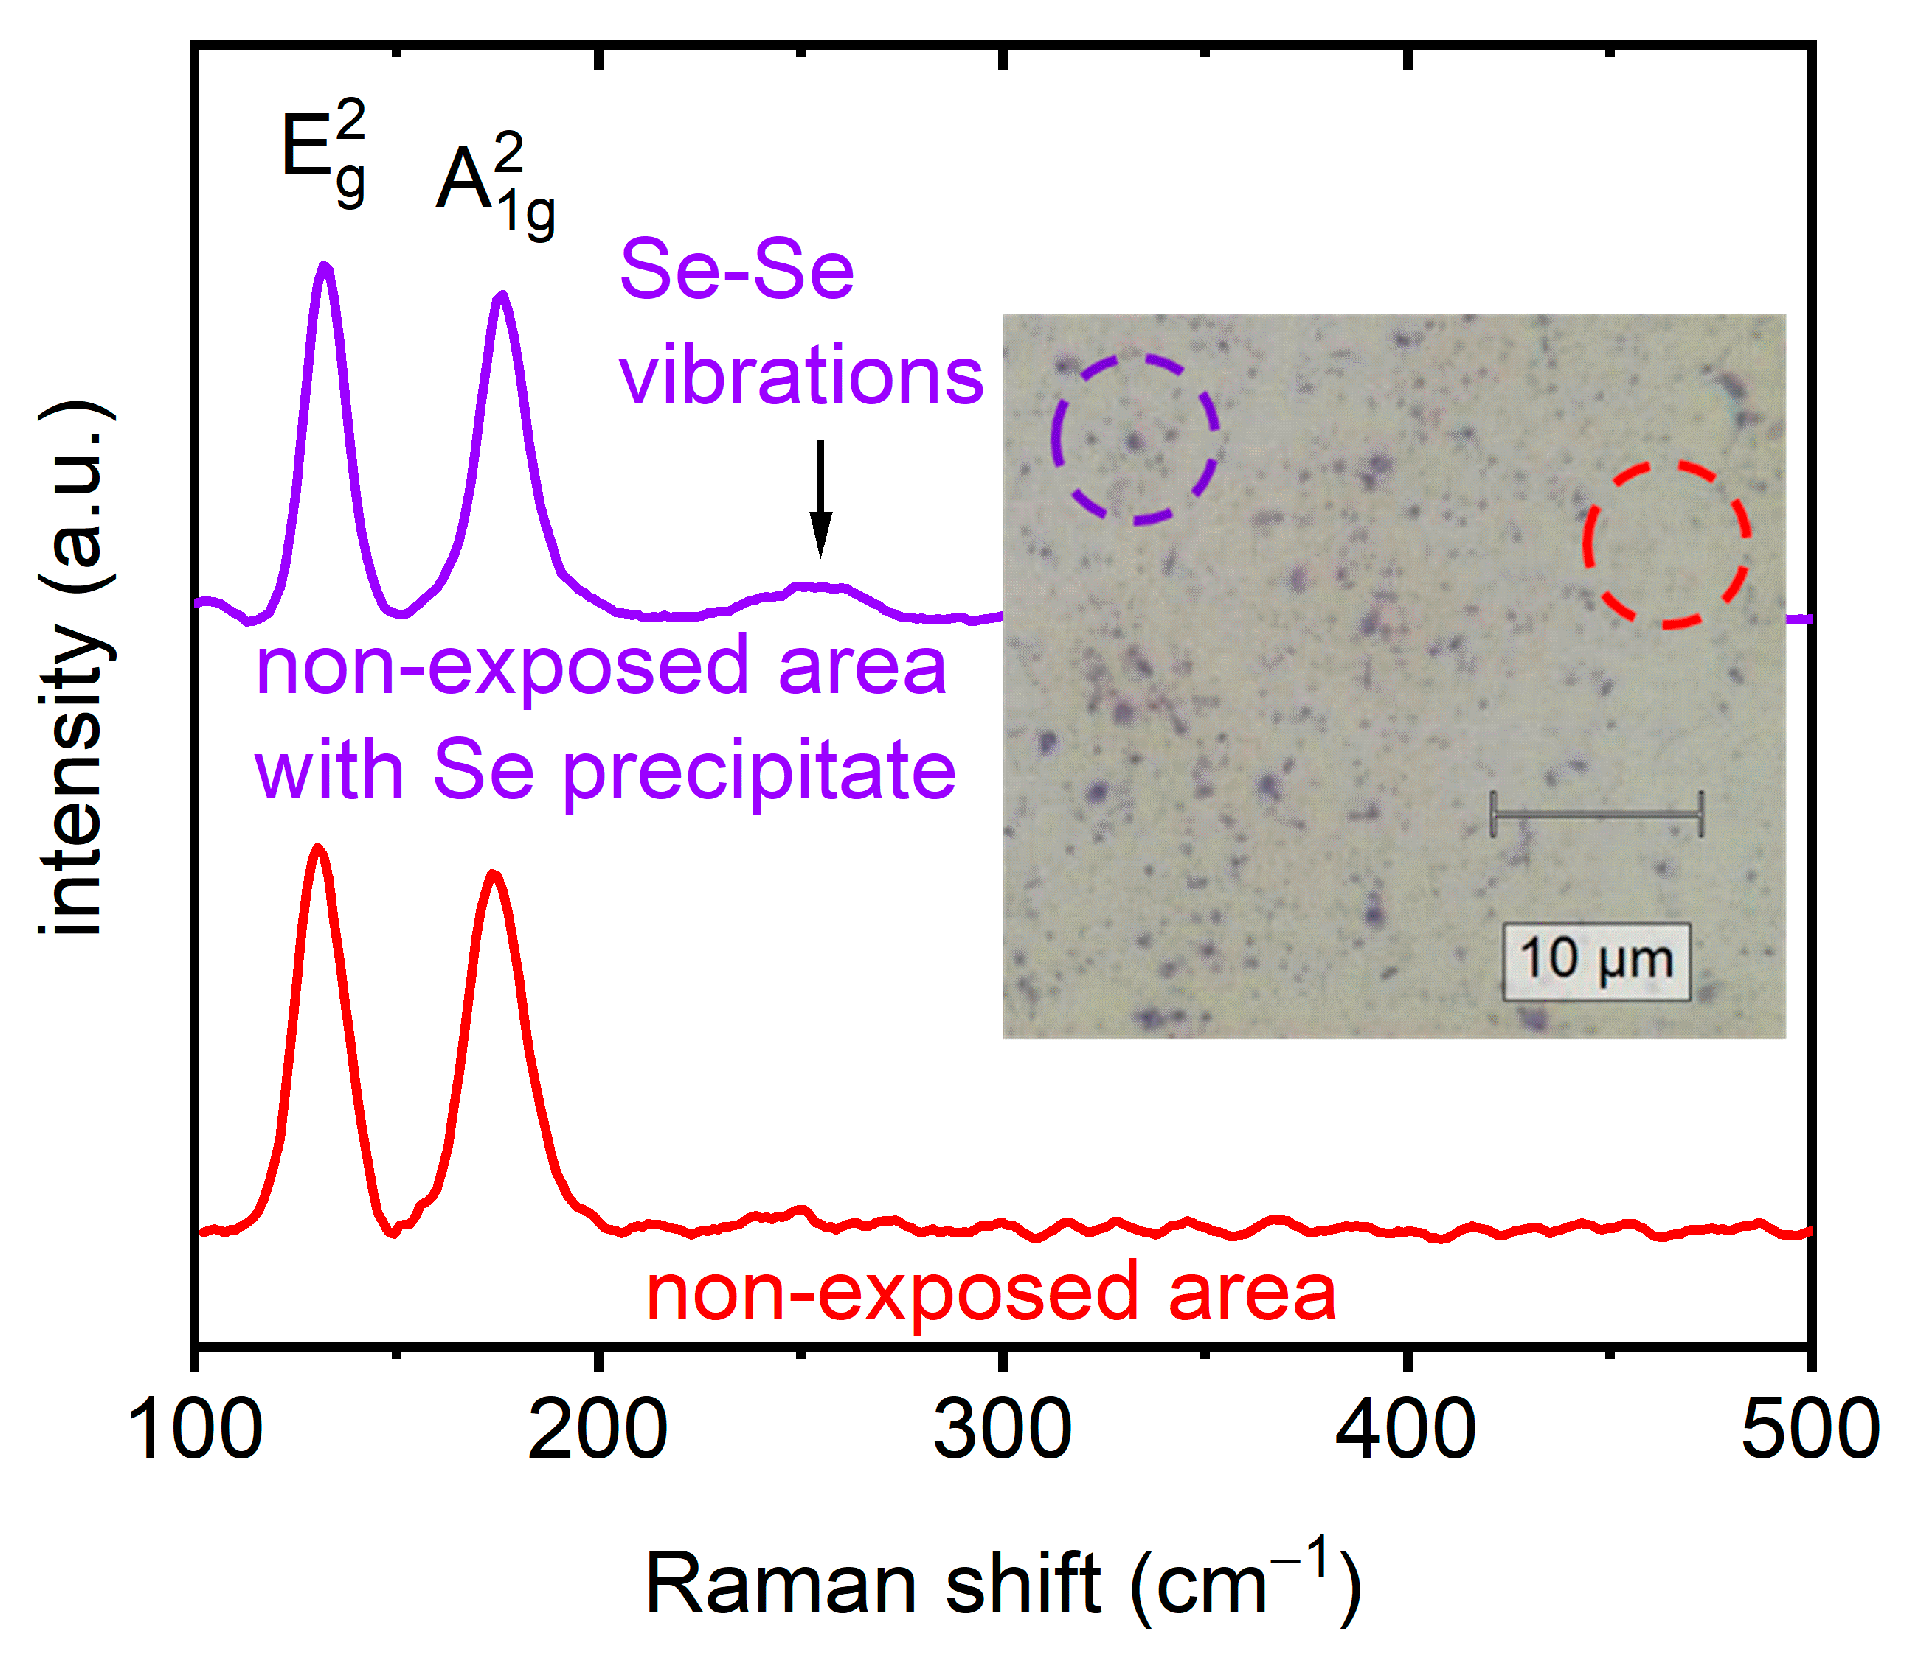
Initially, the non-exposed film areas were examined through micro-Raman measurements. The representative Raman spectra obtained from such a non-exposed area presented in Figure 4 exhibit two characteristic peaks at ~130 cm−1 and ~175 cm−1, corresponding to the in-plane (E2g) and out-of-plane (A21g) vibrational modes of the rhombohedral crystal structure of Bi2Se3 [38]. Additionally, Se-Se vibrations are visible at precipitates [39]. In general, the Raman vibration frequencies in films can be governed by various thickness-dependent factors. Except for dominant strain-related effects and charge carrier concentration, spin–orbit coupling also plays an important role, particularly in the case of topological insulators [40,41] as was already reported by Zhang et al. [42]. In this experimental study, the focus is on the effects caused predominantly by heating and melting, initiated by pulsed laser exposure.
Figure 4.
Representative Raman spectra collected in the non-exposed passivated Bi2Se3 film region. The Raman mode at ~255 cm−1 corresponds to the Se-Se stretching in Se precipitate.
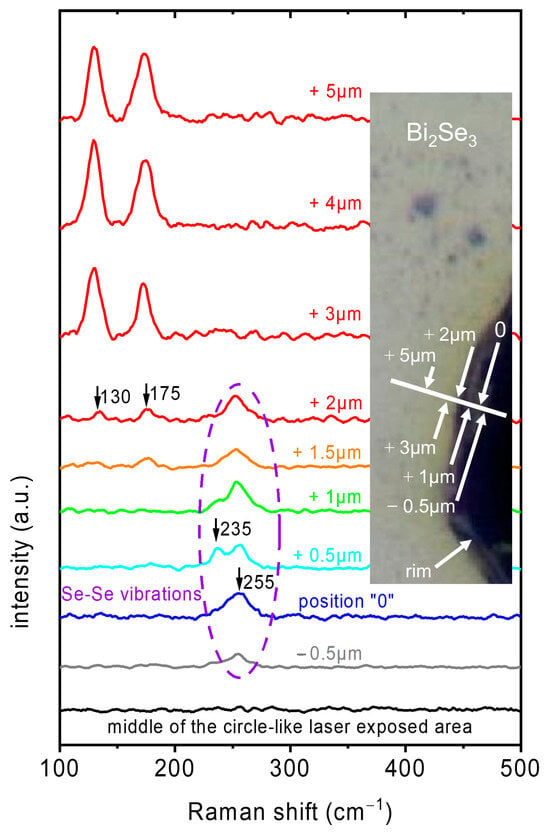
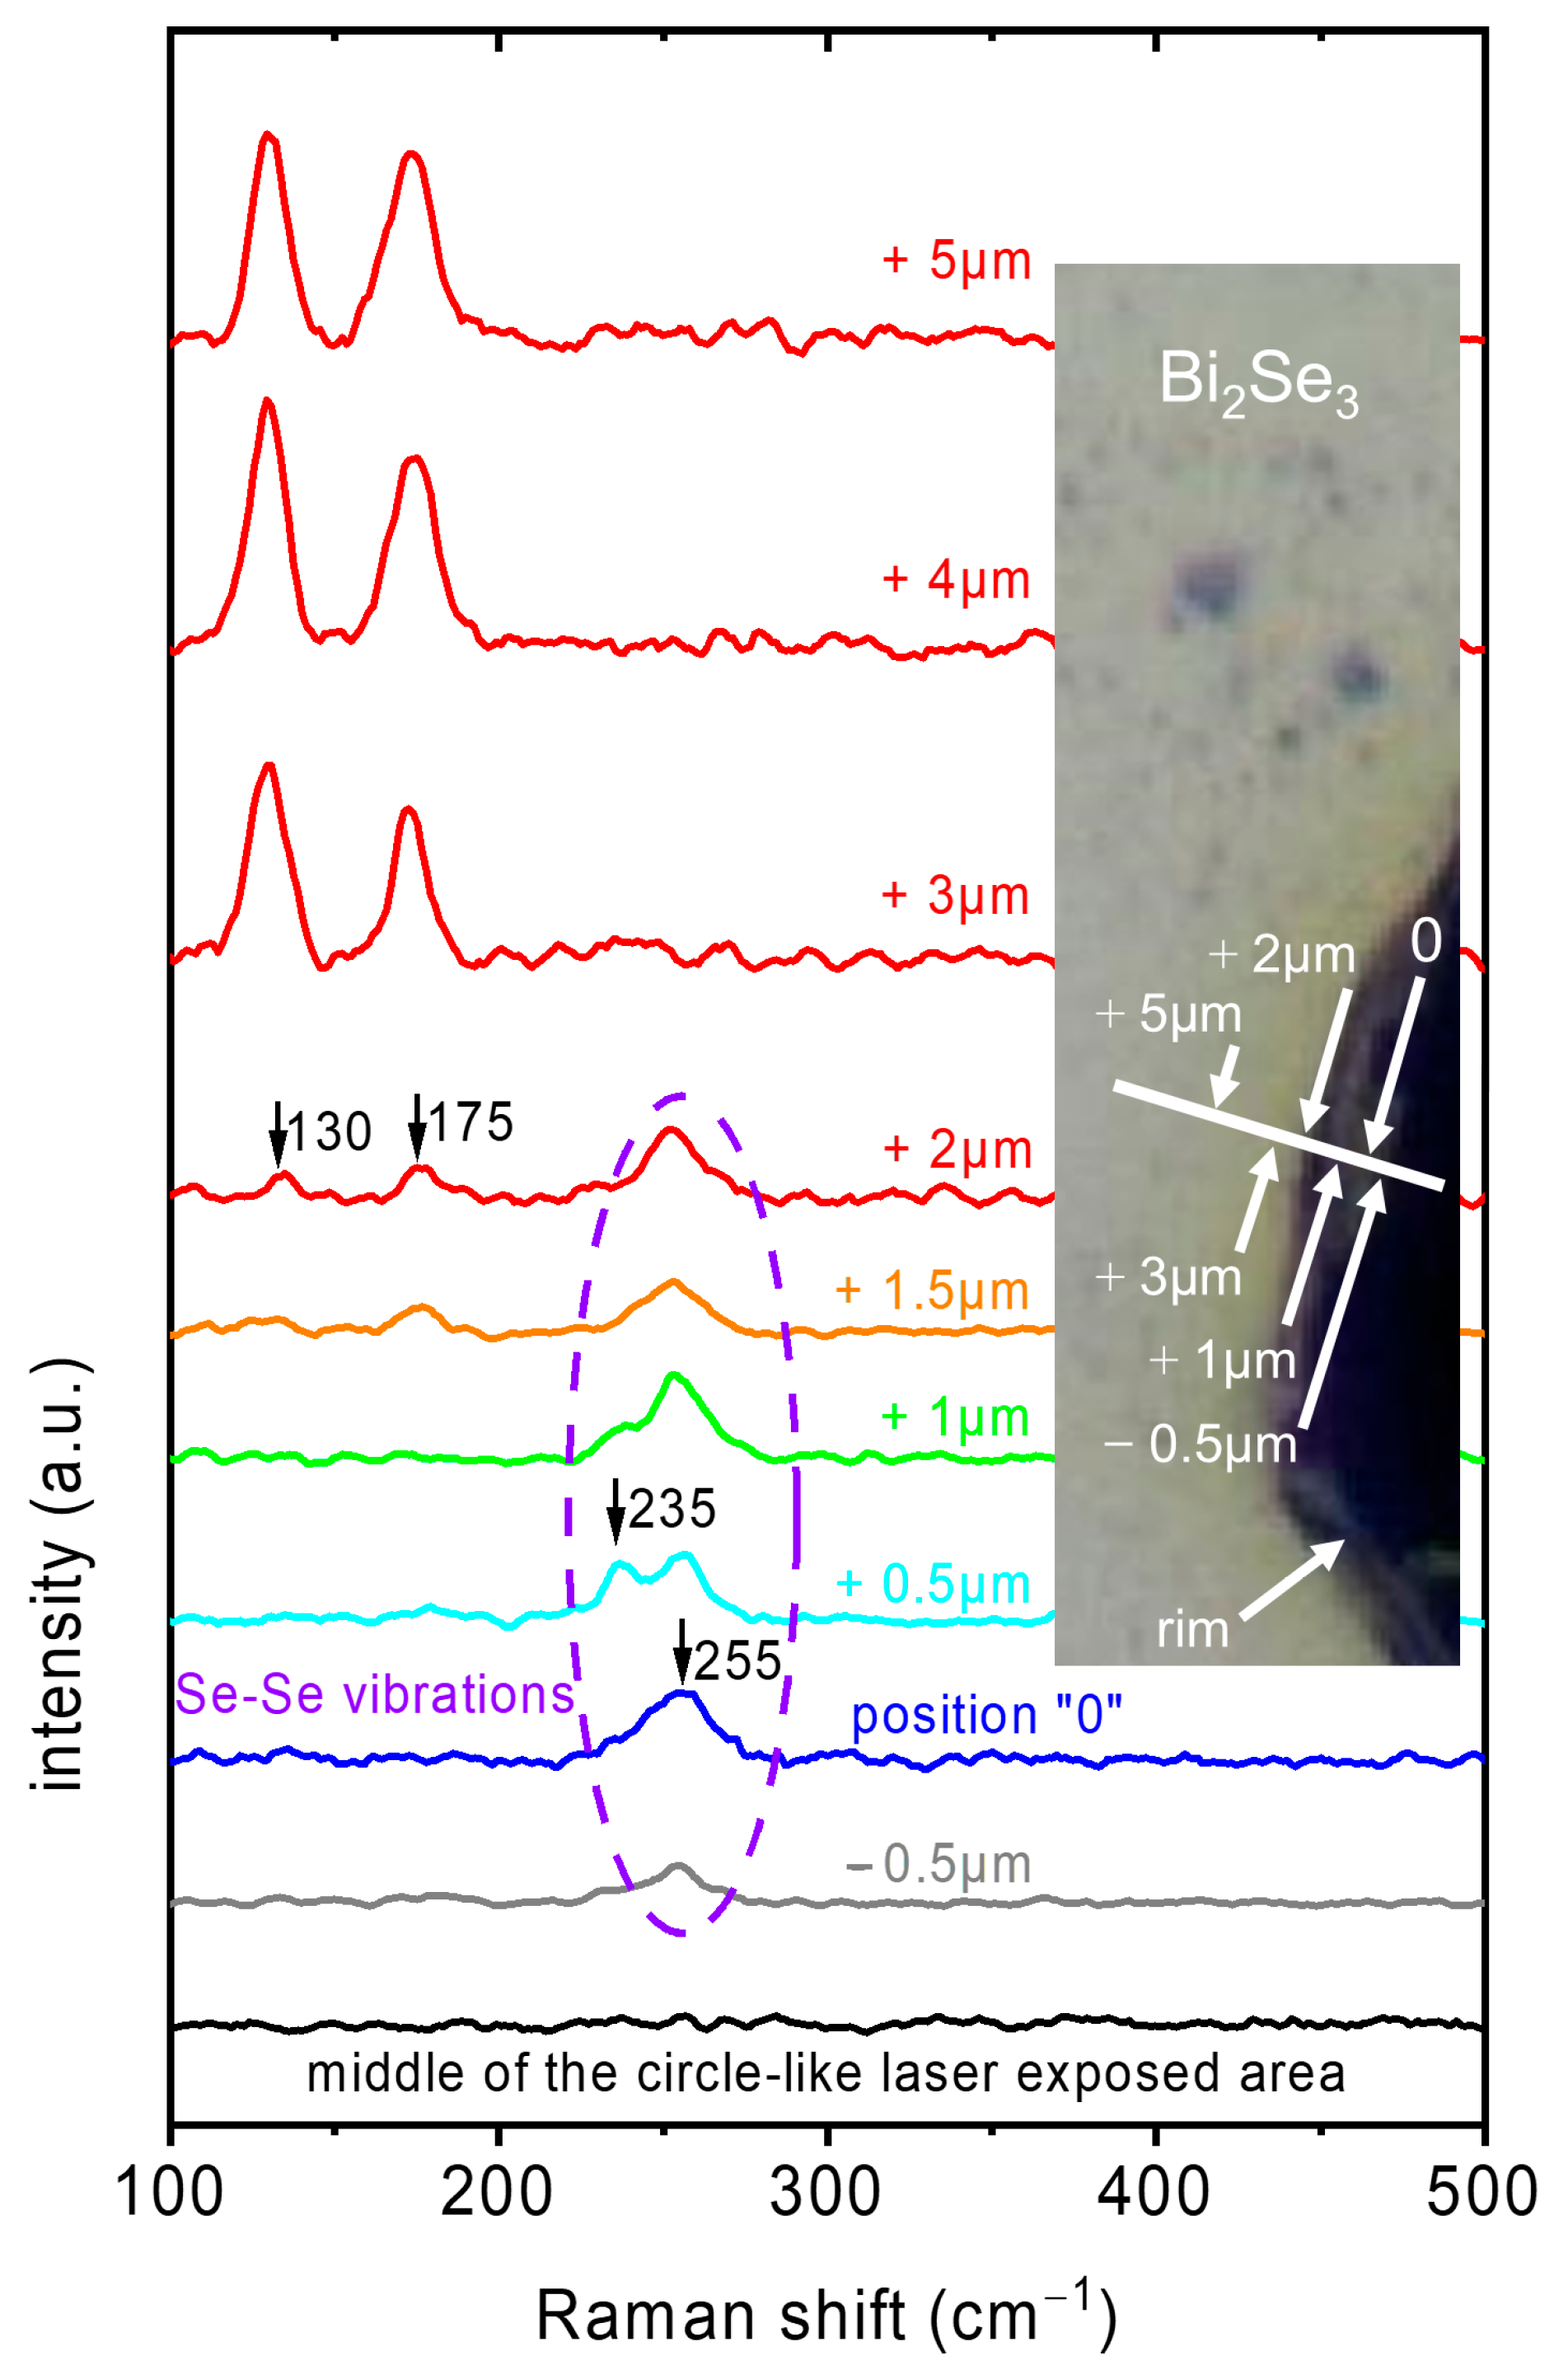
As evidenced by both images (Figure 3a,b), the central region of laser exposure manifests substantial disparities in surface morphology and possibly holes due to laser ablation (circle-like “black” regions) in comparison to those regions beyond. Micro-Raman measurements in the “black” regions show no Raman modes within the wavenumber range of 100 to 500 cm−1 (as illustrated by the black curve in Figure 5), i.e., Raman active materials are not present. Conversely, a thorough examination of numerous laser-exposed structures revealed the presence of melted or recrystallized areas and structures, manifesting as the “rim”-like regions. The formation of these “rim” regions was confirmed for all inspected structures after exposure with laser peak power densities of 59 mW/µm2 and 295 mW/µm2. The corresponding average power densities (calculated using the average power and the beam area within the 1/e2-radius of the Gaussian beam profile with a FWHM of 300 µm) are 2.5 × 10⁻⁴ mW/µm2 and 1.2 × 10⁻³ mW/µm2, respectively (Table 1). These “rim-like” regions exhibit Raman spectra which are dominated by modes related to elemental Se. The spectra are illustrated exemplarily in Figure 5 (blue, turquoise, green, orange). The emergence of a pronounced increase in the Raman mode at ~255 cm−1 in the “rim” regions discernible in optical images (see Figure 3a,b), was a noteworthy observation. During laser exposure, regions in the Gaussian laser intensity profile that reach different local temperatures can cause surface morphology changes in the exposed films—ranging from the melting of Bi2Se3, its material decomposition to selenium and “recrystallization” of the melted products. The dominant Raman mode at ~255 cm−1 can be attributed to the Se-Se stretching mode in molecule-like Se8 rings found in monoclinic Se as well as in amorphous Se [39,43,44,45]. Furthermore, the Raman mode at ~235 cm−1 can be identified and is indicative of the formation of trigonal selenium allotropes with chain-like structures [39,43,44,45]. These findings are a strong indication of a partial decomposition of the Bi2Se3 film. For positions still further away from the beam center, modes for Bi2Se3 (the E2g and A21g modes at ~130 cm−1 and ~175 cm−1, respectively) emerge and become dominant (orange and red spectra in Figure 5). This transition from Raman-inactive material to unperturbed Bi2Se3 occurs over a radial distance of a few µm, meaning that a major fraction of the illuminated area (1/e2-area) is unperturbed.
Figure 5.
Representative Raman spectra collected in the middle of the circle-like “black” regions of the laser/thermally exposed passivated Bi2Se3 film area and at different positions on the rim (corresponding to the melted/recrystallized region in Figure 3b) and slightly beyond. Raman modes clearly visible at ~235 and at ~255 cm−1 correspond to the trigonal allotrope and to Se-Se stretching in Se8 rings in monoclinic and amorphous Se allotropes, respectively [39]. The closer the position is towards the visually undamaged area, the more the modes for Bi2Se3—the E2g and A21g modes at ~130 cm−1 and ~175 cm−1, respectively—become visible (orange and red spectra). Just a few µm further away, only modes related to the E2g and A21g modes of Bi2Se3 are visible.
At this point, it is important to notice that any observed alterations in structural and/or surface morphology of the films investigated were induced by the laser exposure prior to the Raman spectroscopy studies. It is widely accepted that Raman spectroscopic analysis of thin chalcogenide films necessitates the performance of experiments at power levels that are below the threshold capable of inducing phase transitions and/or melting or thermal decomposition due to the heating effects during the investigation. This necessity arises from the fact that the “family” of these materials exhibits remarkably low thermal conductivity. Therefore, it is imperative that measurement conditions are selected with meticulous care to eliminate any external thermal effects that could exert a deleterious influence on the determination of the thermal damage threshold due to laser excitation in operation.
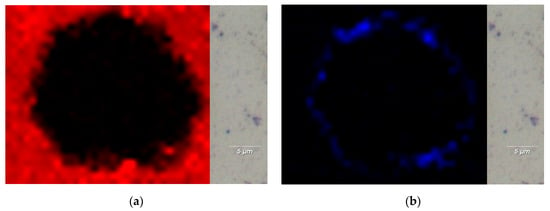
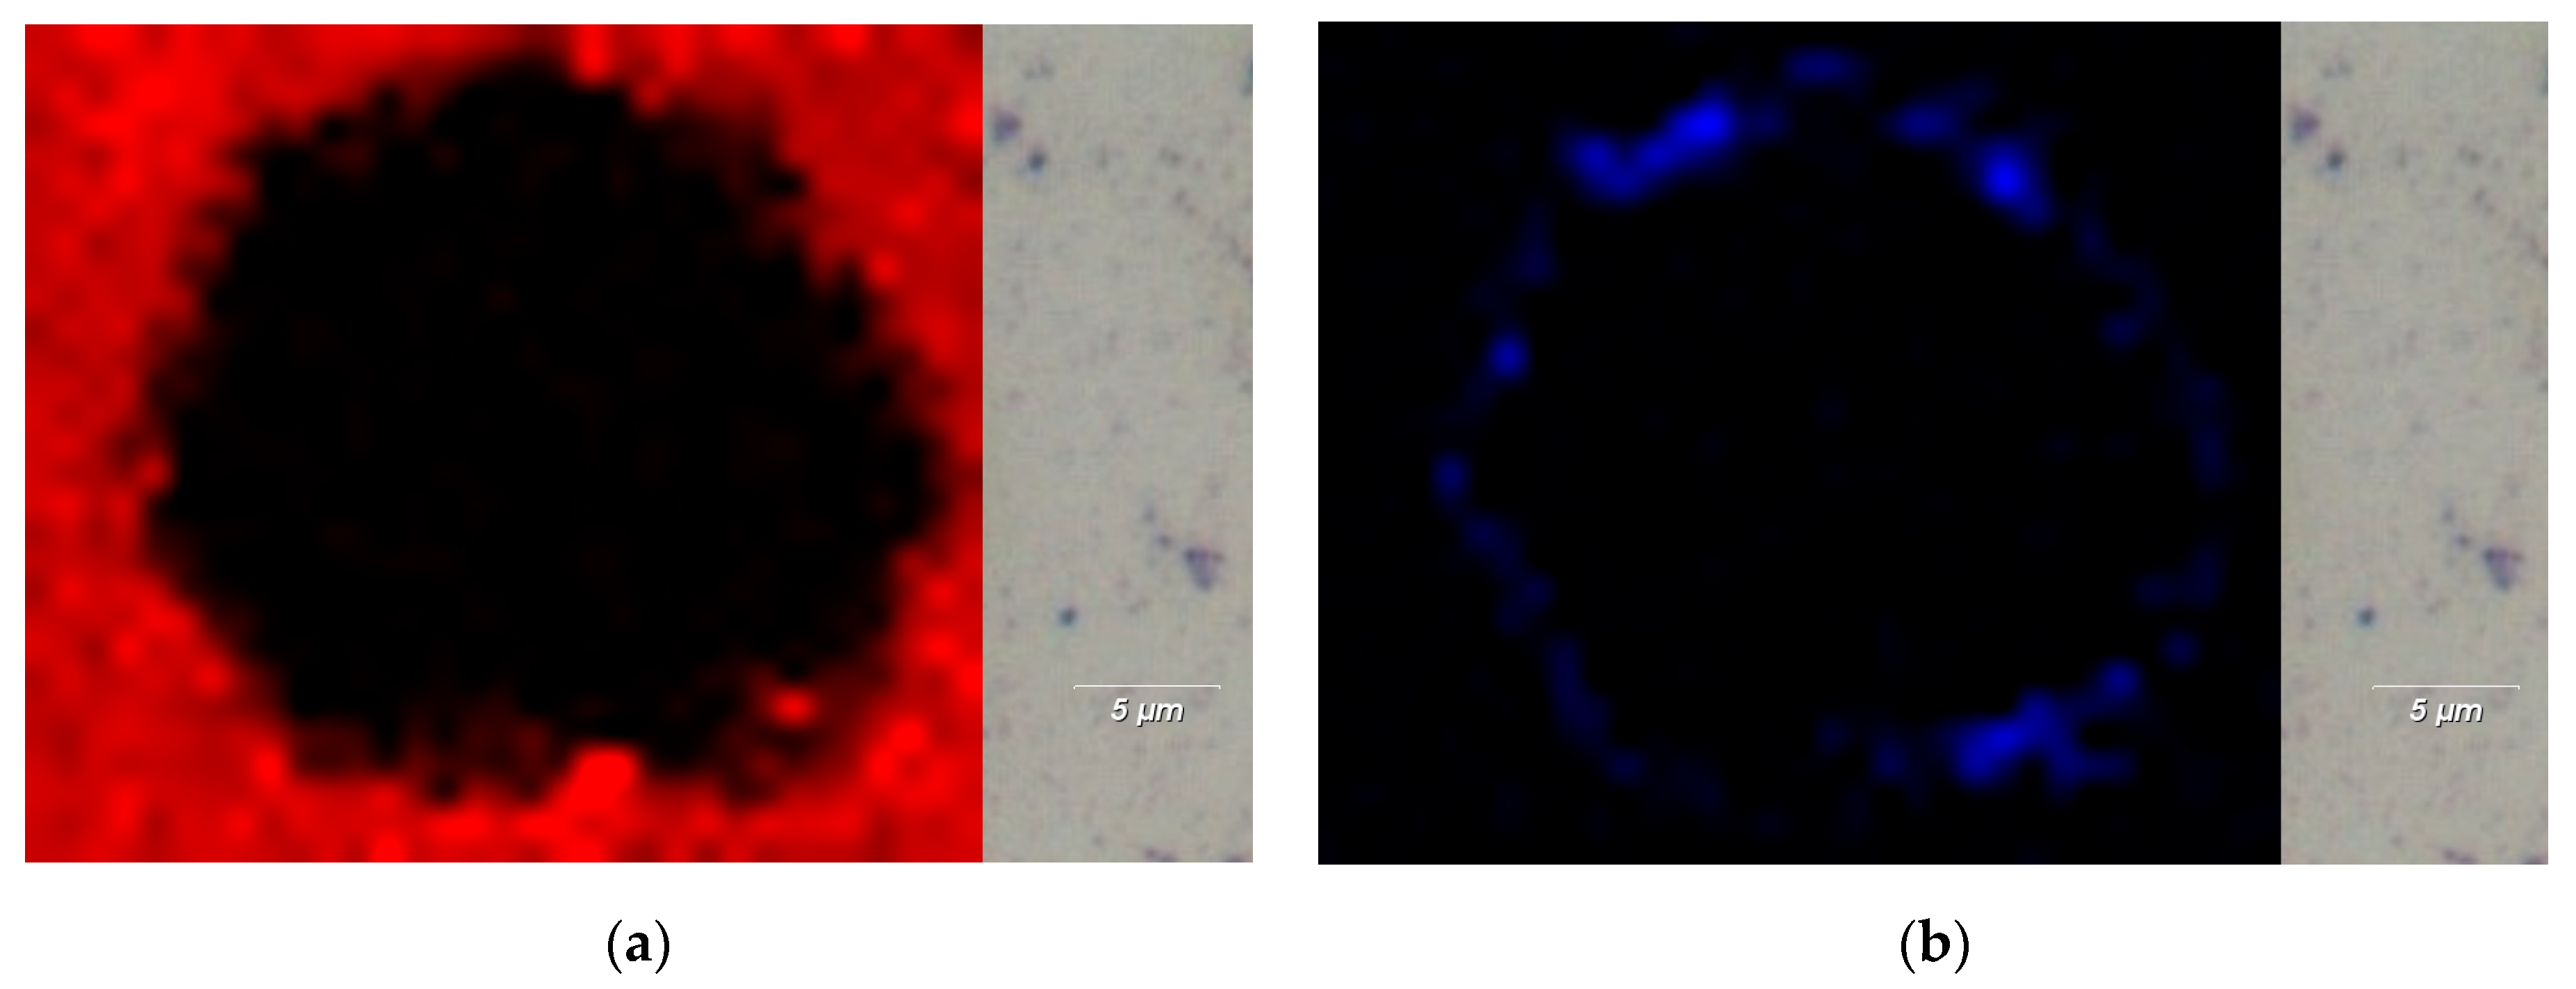
After having studied the middle of the circular-like object and its rim with Raman spectroscopy and obtained an overview of the important modes of the compounds present on the illuminated passivated Bi2Se3 film sample, we focused our attention on the distribution of the Bi2Se3 and selenium compounds. Figure 6 presents micro-Raman intensity mappings exemplarily for two distinct peaks: one at ~130 cm−1, corresponding to the in-plane (E2g) mode of Bi2Se3, and the other at ~255 cm−1, assigned to Se-Se stretching in Se8 rings of monoclinic and amorphous Se [39,43,44,45]. It should be noted here that the data collected for both micro-Raman mappings are derived from the structure presented in Figure 3b. As previously stated, the results obtained demonstrate that the central region does not display any Raman modes within the measured wavenumber range of 100 to 500 cm−1. Therefore, there are also none that could be attributed to characteristic modes for Bi2Se3. Furthermore, the presence of a narrow (up to 2.5 µm) rim-like structure has been observed. Outside of the hole/circular-like structure, the intensity of the in-plane (E2g) mode of Bi2Se3 at ~130 cm−1 abruptly increases and is uniform as the intensity map displays. The mode at ~255 cm−1, assigned to Se-Se stretching (Figure 6b) is only found at the rim and its intensity decreases abruptly beyond the rim.
Figure 6.
Micro-Raman intensity mappings performed at two characteristic peaks (a) at ~130 cm−1 corresponding to the in-plane (E2g) mode of Bi2Se3 and (b) ~255 cm−1 assigned to Se-Se stretching in Se8 rings of monoclinic or amorphous Se. Data collected for both micro-Raman mappings originate from the structure presented in Figure 3b.
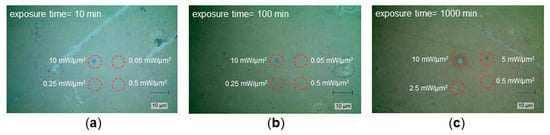
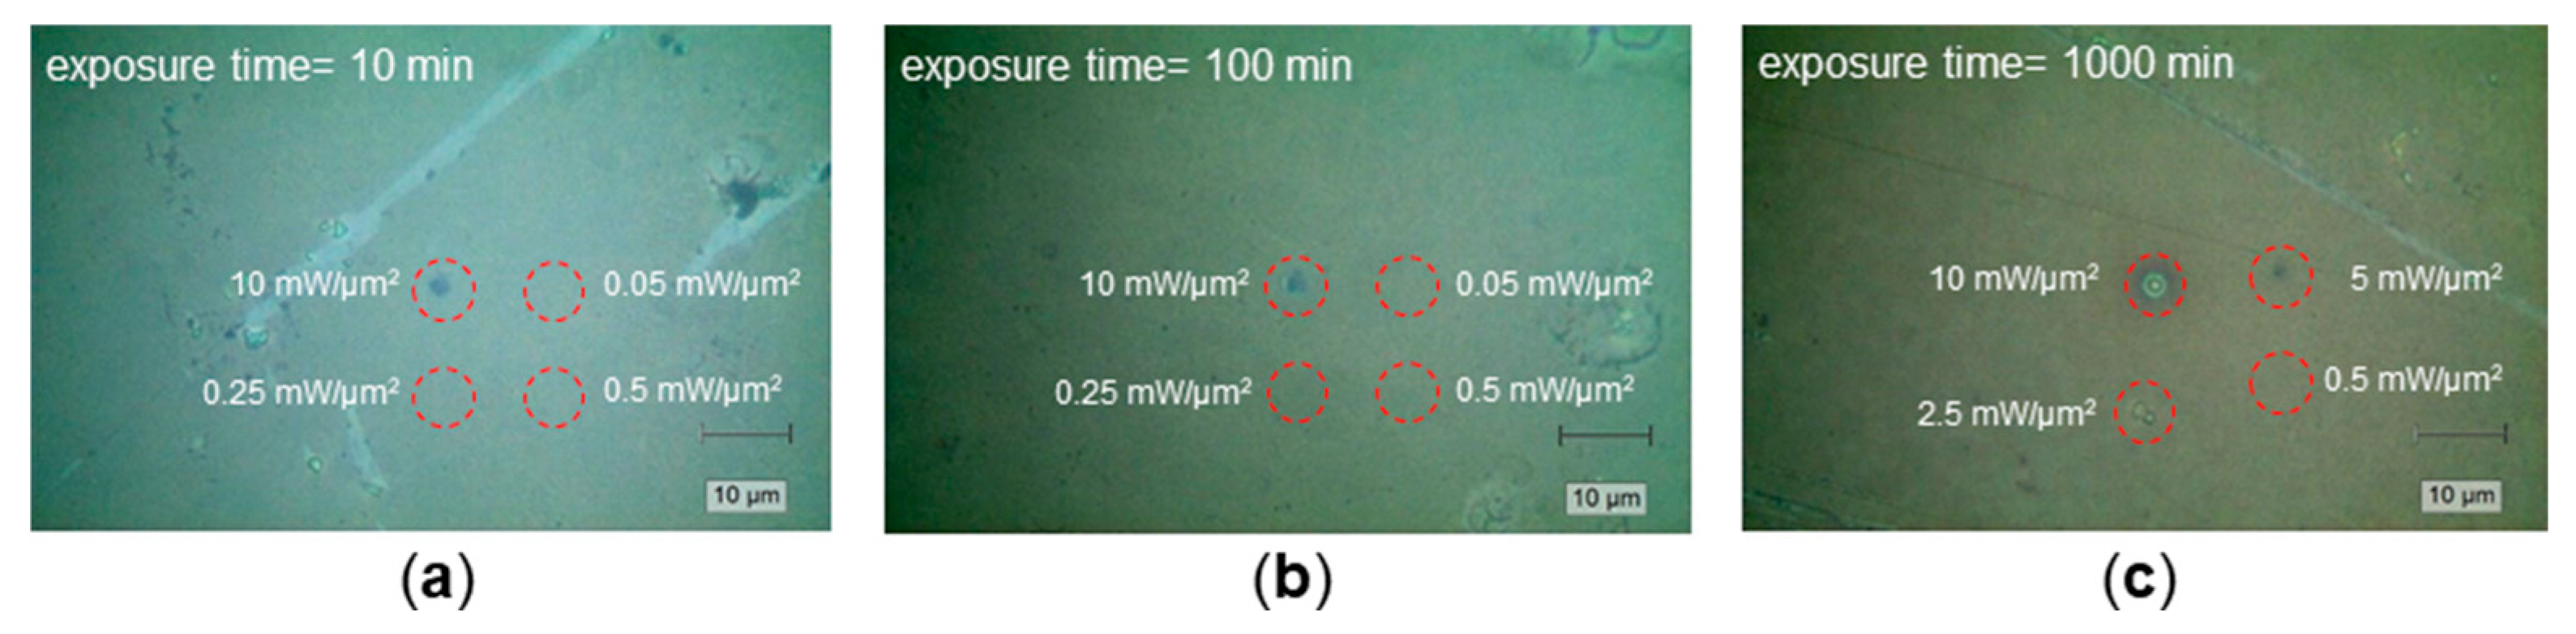
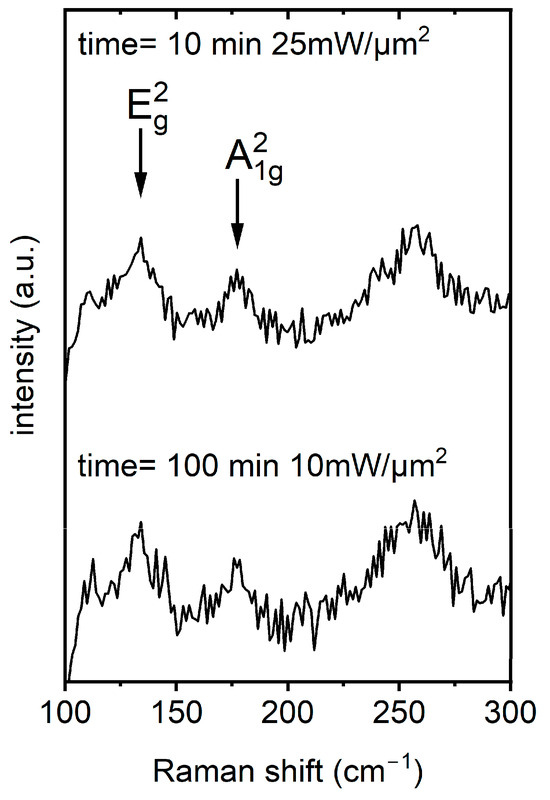
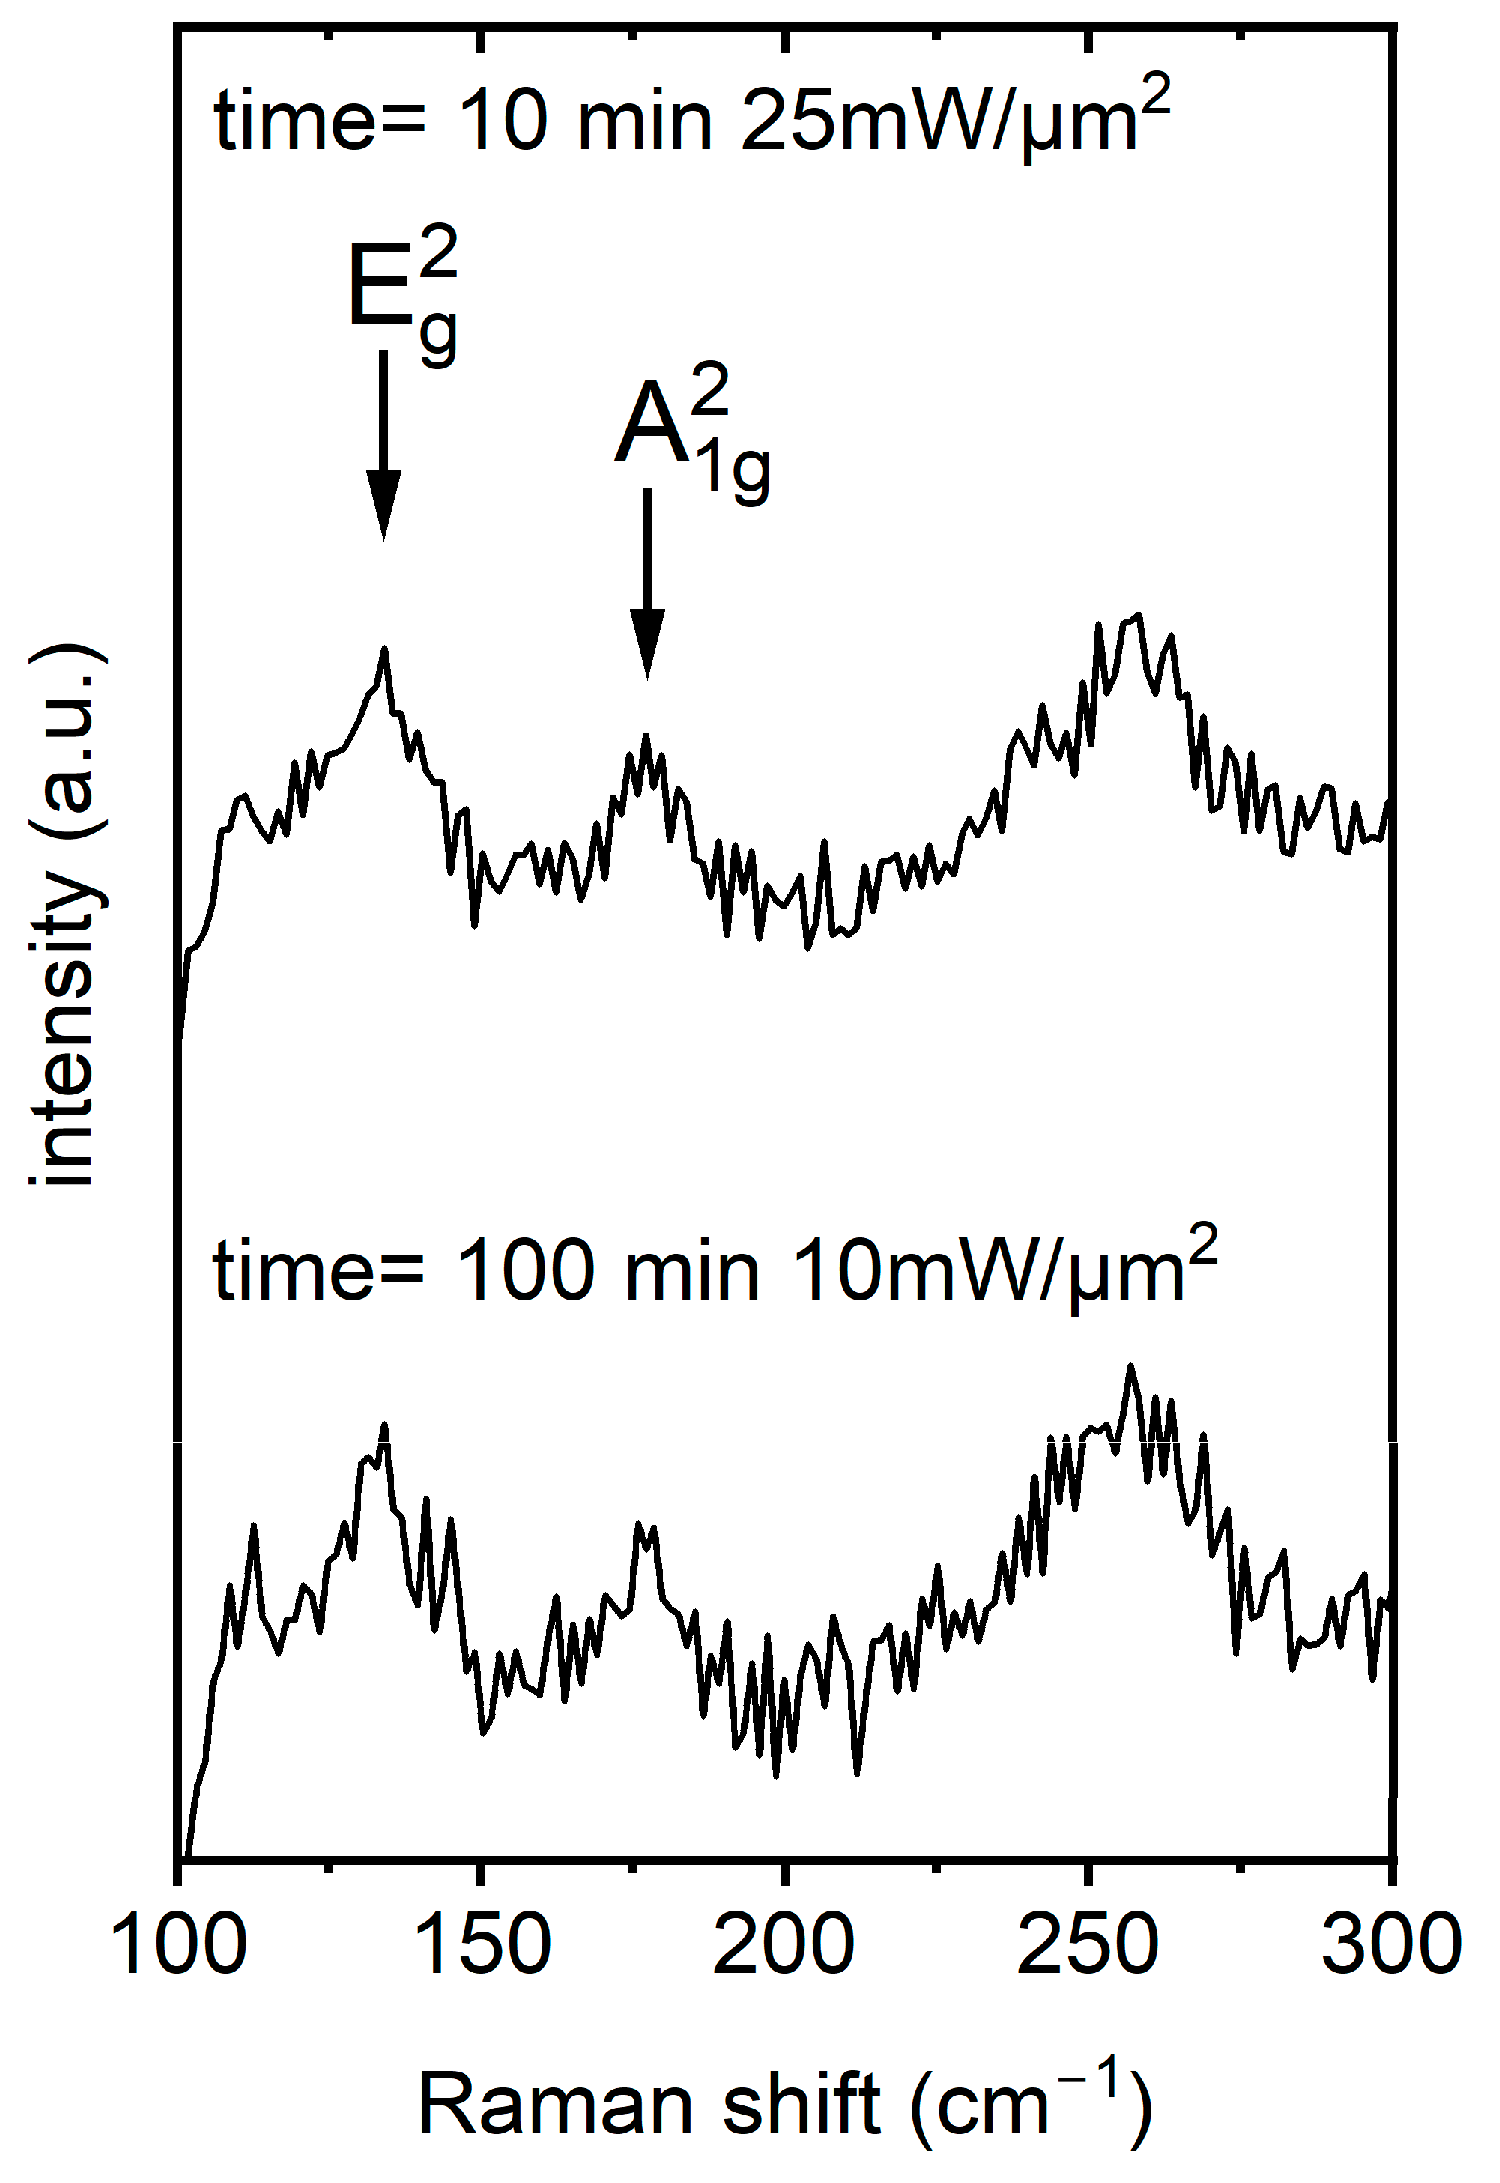
In contrast to pulsed laser illumination, in the following, we illuminated the passivated Bi2Se3 films with a cw laser (532 nm wavelength) with the aim of experimentally estimating the laser power level at which the material does not undergo structural changes. These changes would be detectable by Raman spectroscopy. It is important to avoid sample damage and any heating effects to the pulsed laser illuminated (passivated Bi2Se3) films which would additionally affect the material characteristics of the sample regions unintentionally. The passivated Bi2Se3 films were exposed within the average optical power density range from 5 × 10⁻² mW/µm2 to 50 mW/µm2 (Table 1). The thermally initiated changes in surface morphology and material characteristics were then systematically investigated to determine the thermal damage threshold. This limit is surpassed when the commencement of Bi2Se3 decomposition becomes visible, i.e., modes ascribed to Se-Se stretching evolve. Representative optical micro-graphs of passivated Bi2Se3 films following laser exposure for 10, 100 and 1000 min are presented in Figure 7a–c, respectively. As demonstrated by the optical images, substantial alterations in the surface morphology of the material under investigation are evident following laser exposure at an average power density of approximately 10 mW/µm2. As illustrated in Figure 7b and the related Figure 8 (bottom spectrum), the film reveals the formation of amorphous selenium indicative of partial thermal decomposition. Upon even longer exposure times (Figure 7c) a ring of amorphous selenium around the central area is observed. This phenomenon bears a resemblance to the outcomes demonstrated in Figure 3, Figure 5 and Figure 6b. Note that the diameter of the modified area is of the same order of magnitude as the 1/e2-diameter of the cw beam spot, in contrast to the case of pulsed illumination.
Figure 7.
Representative optical micrographs of passivated Bi2Se3 films (a–c) after cw laser exposure at 532 nm for 10 min, 100 min, and 1000 min, respectively. It should be noted that the dashed red circles are intended merely as a visual reference.
Figure 8.
Representative Raman spectra collected in the middle of the cw laser-exposed passivated Bi2Se3 film surfaces for average optical power densities ~10 and ~25 mW/µm2 for 100 and 10 min, respectively. The broad mode around ~255 cm−1 indicates the partial decomposition of Bi2Se3 to selenium. Optical images in Figure 7 confirm melting processes with irreversible changes in surface morphology.
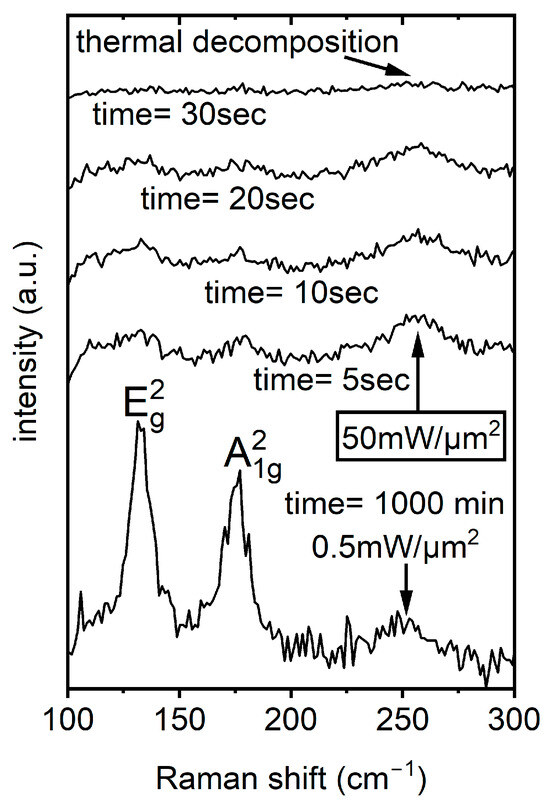
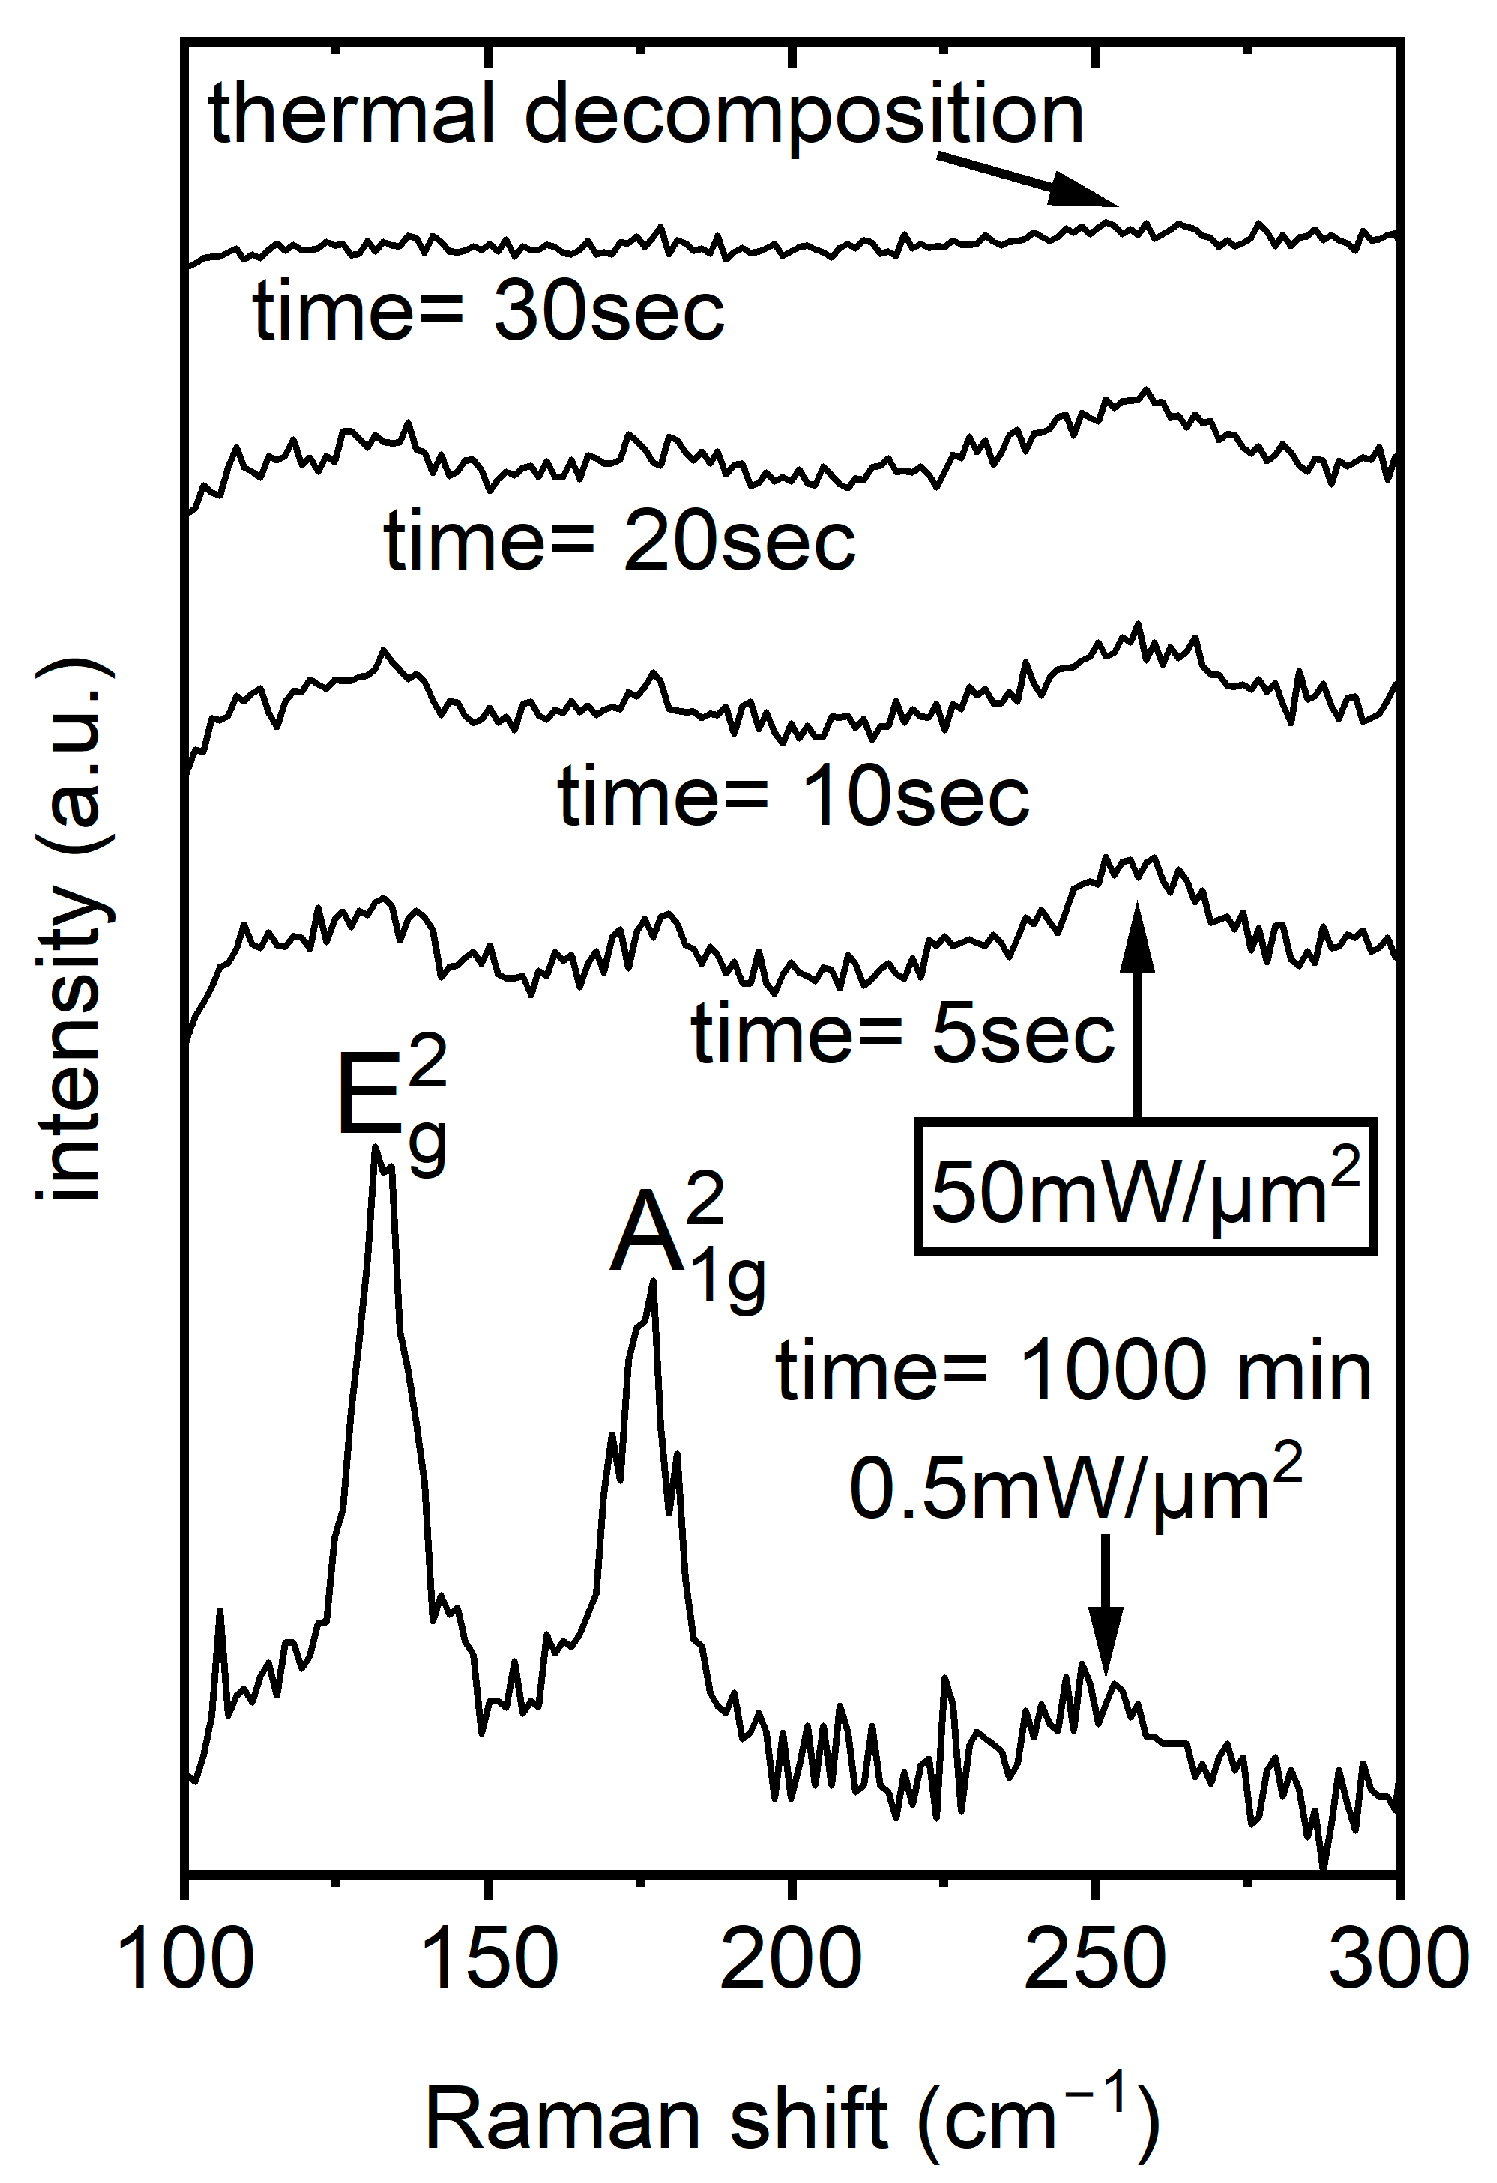
Subsequent micro-Raman spectroscopy investigations confirmed degradation effects and structural changes (i.e., melting effects) in the investigated target areas at average optical power density levels (cw laser exposure, 532 nm wavelength) at ~10 mW/µm2 for all exposure times (i.e., 10, 100, and 1000 min). Typical Raman spectra collected for average optical power densities of approximately 10 and 25 mW/µm2 for 100 and 10 min are presented in Figure 8. The broad mode around ~255 cm−1 indicates the Se-Se stretching vibrations of the Se8 in more disordered monoclinic and amorphous selenium allotropes. Conversely, the films exposed for approximately 1000 min at average optical power densities of up to 0.5 mW/µm2 did not demonstrate any alterations in surface morphology (see Figure 7c). As demonstrated in Figure 9, a representative Raman spectrum collected from the middle of the cw laser-exposed area (after ~1000 min with an average optical power density of 0.5 mW/µm2) clearly indicates that no changes in the phase state were detected. Conversely, laser exposure with average optical power densities approximating 50 mW/µm2 and an exposure duration of approximately 30 s leads to the thermal decomposition of the passivated Bi2Se3 films. As illustrated in Figure 9, the collection of a Raman signal was not possible in the designated area. This result is similar to the measurements presented in Figure 5 (black trace).
Figure 9.
Representative Raman spectra collected in the middle of the cw laser-exposed area after ~1000 min with an average optical power density 0.5 mW/µm2 (lower spectrum). Optical inspection before and after exposure did not reveal alterations in surface morphology. The upper four Raman spectra were collected after the four separate exposures of the passivated Bi2Se3 film using an average optical power density ~50 mW/µm2 for durations of 5, 10, 20 and 30 s.
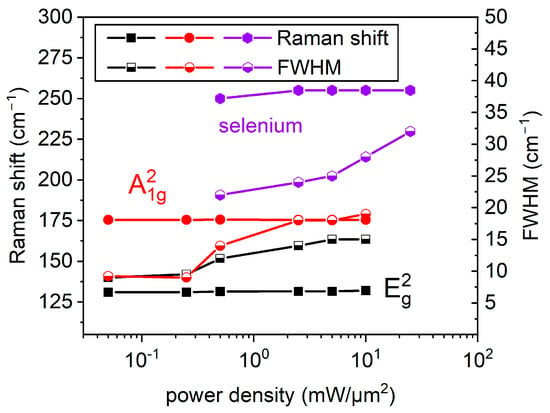
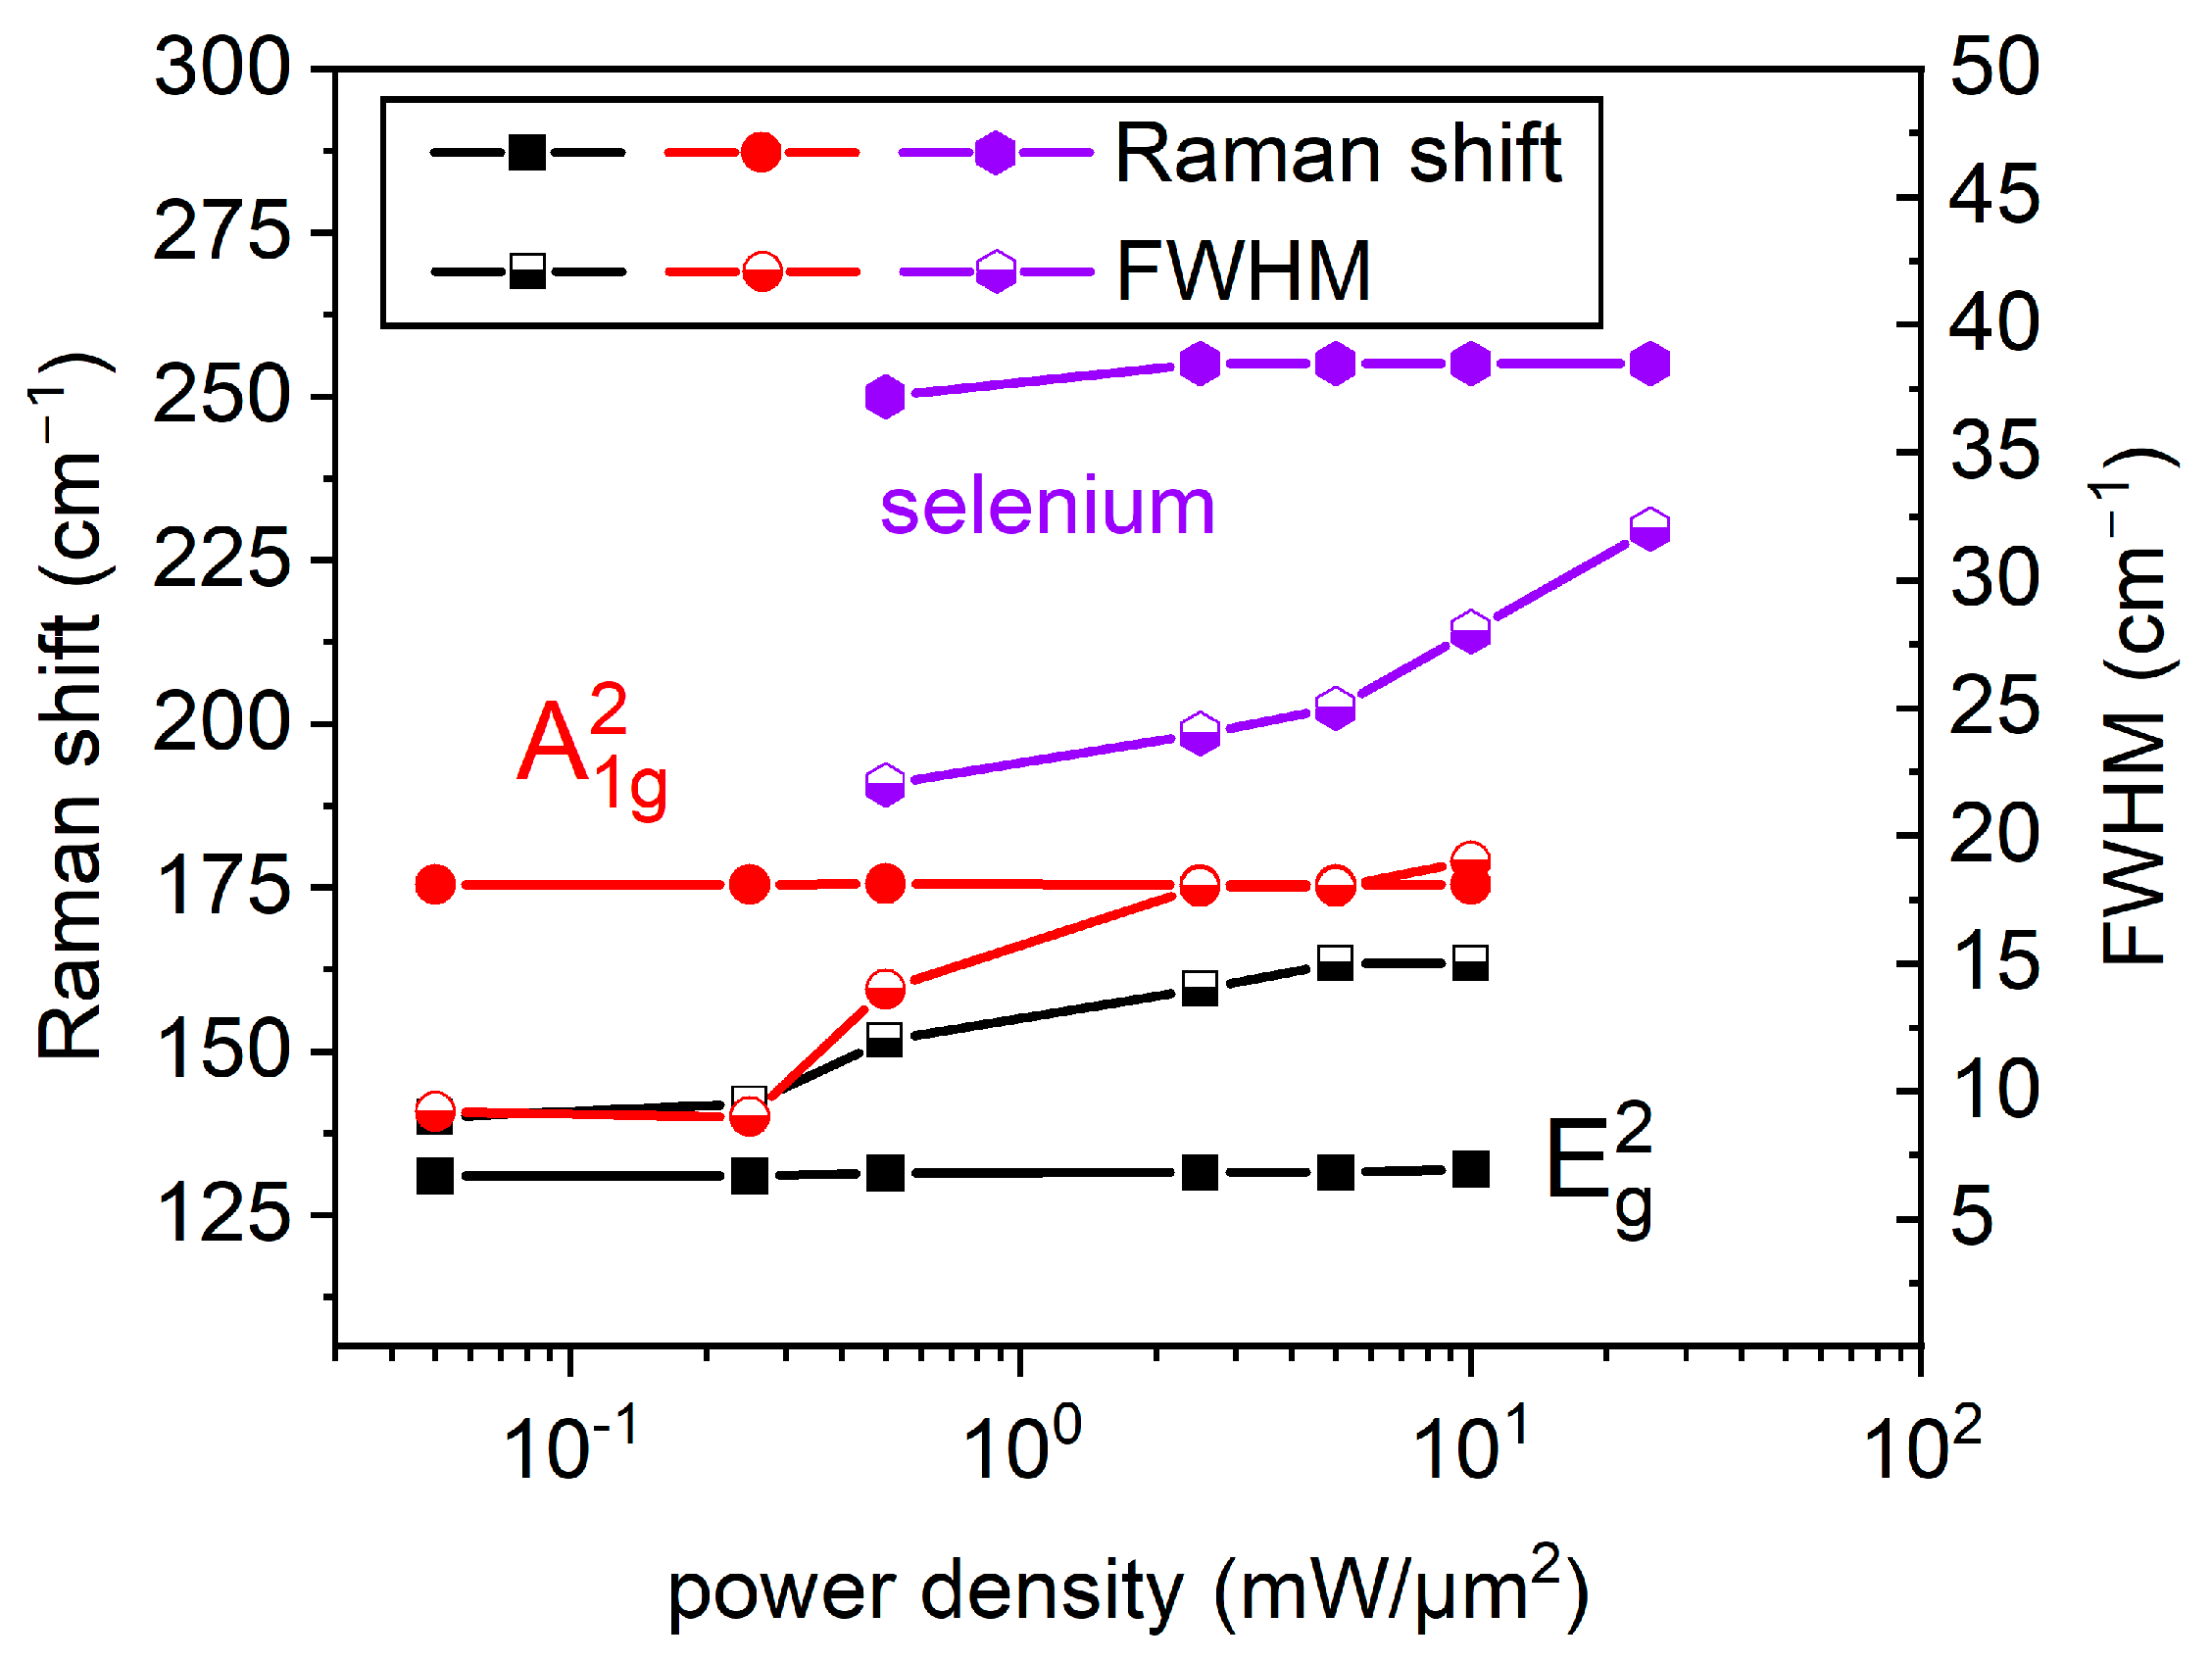
As illustrated in Figure 10, the position of the Raman A21g and E2g modes for a Bi2Se3 exposure time of 1000 min hardly depends on the incident average optical power density (wavelength 532 nm). In contrast to both characteristic modes at ~130 cm−1 and ~175 cm−1 (E2g) and (A21g) of Bi2Se3, the Raman modes at ~110 cm−1 (visible in Figure 8 and Figure 9 but not discussed in detail in this study) and at ~255 cm−1 can be detected after cw laser exposure above ~0.5 mW/µm2 for 1000 min. These modes are related to amorphous and/or monoclinic selenium [43,44,45]. A substantial increase in their intensity can serve as an indicator of degradation effects.
Figure 10.
Position of the Raman A21g and E2g modes for passivated Bi2Se3 and the Se-Se stretching mode as a function of incident average optical power density (wavelength 532 nm). Each data point was acquired by recording a Raman spectrum after exposing the material for 1000 min time at the respective average optical power density. It should be noted here that all the data points included in this figure correspond to the average of six measurements and are within the range of ±1 cm−1. Filled symbols indicate the peak positions (left scale) and half-filled symbols the corresponding FWHM (right scale). The lines through the measurement data are only a guide to the eye.
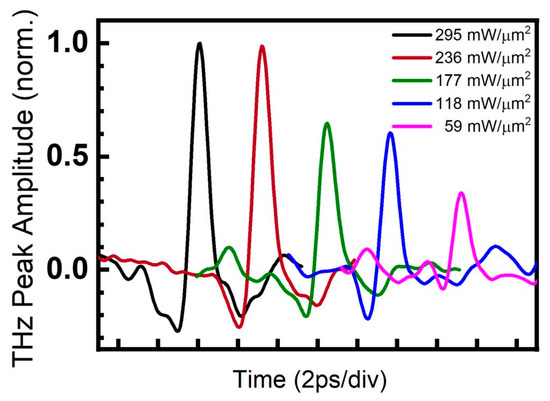
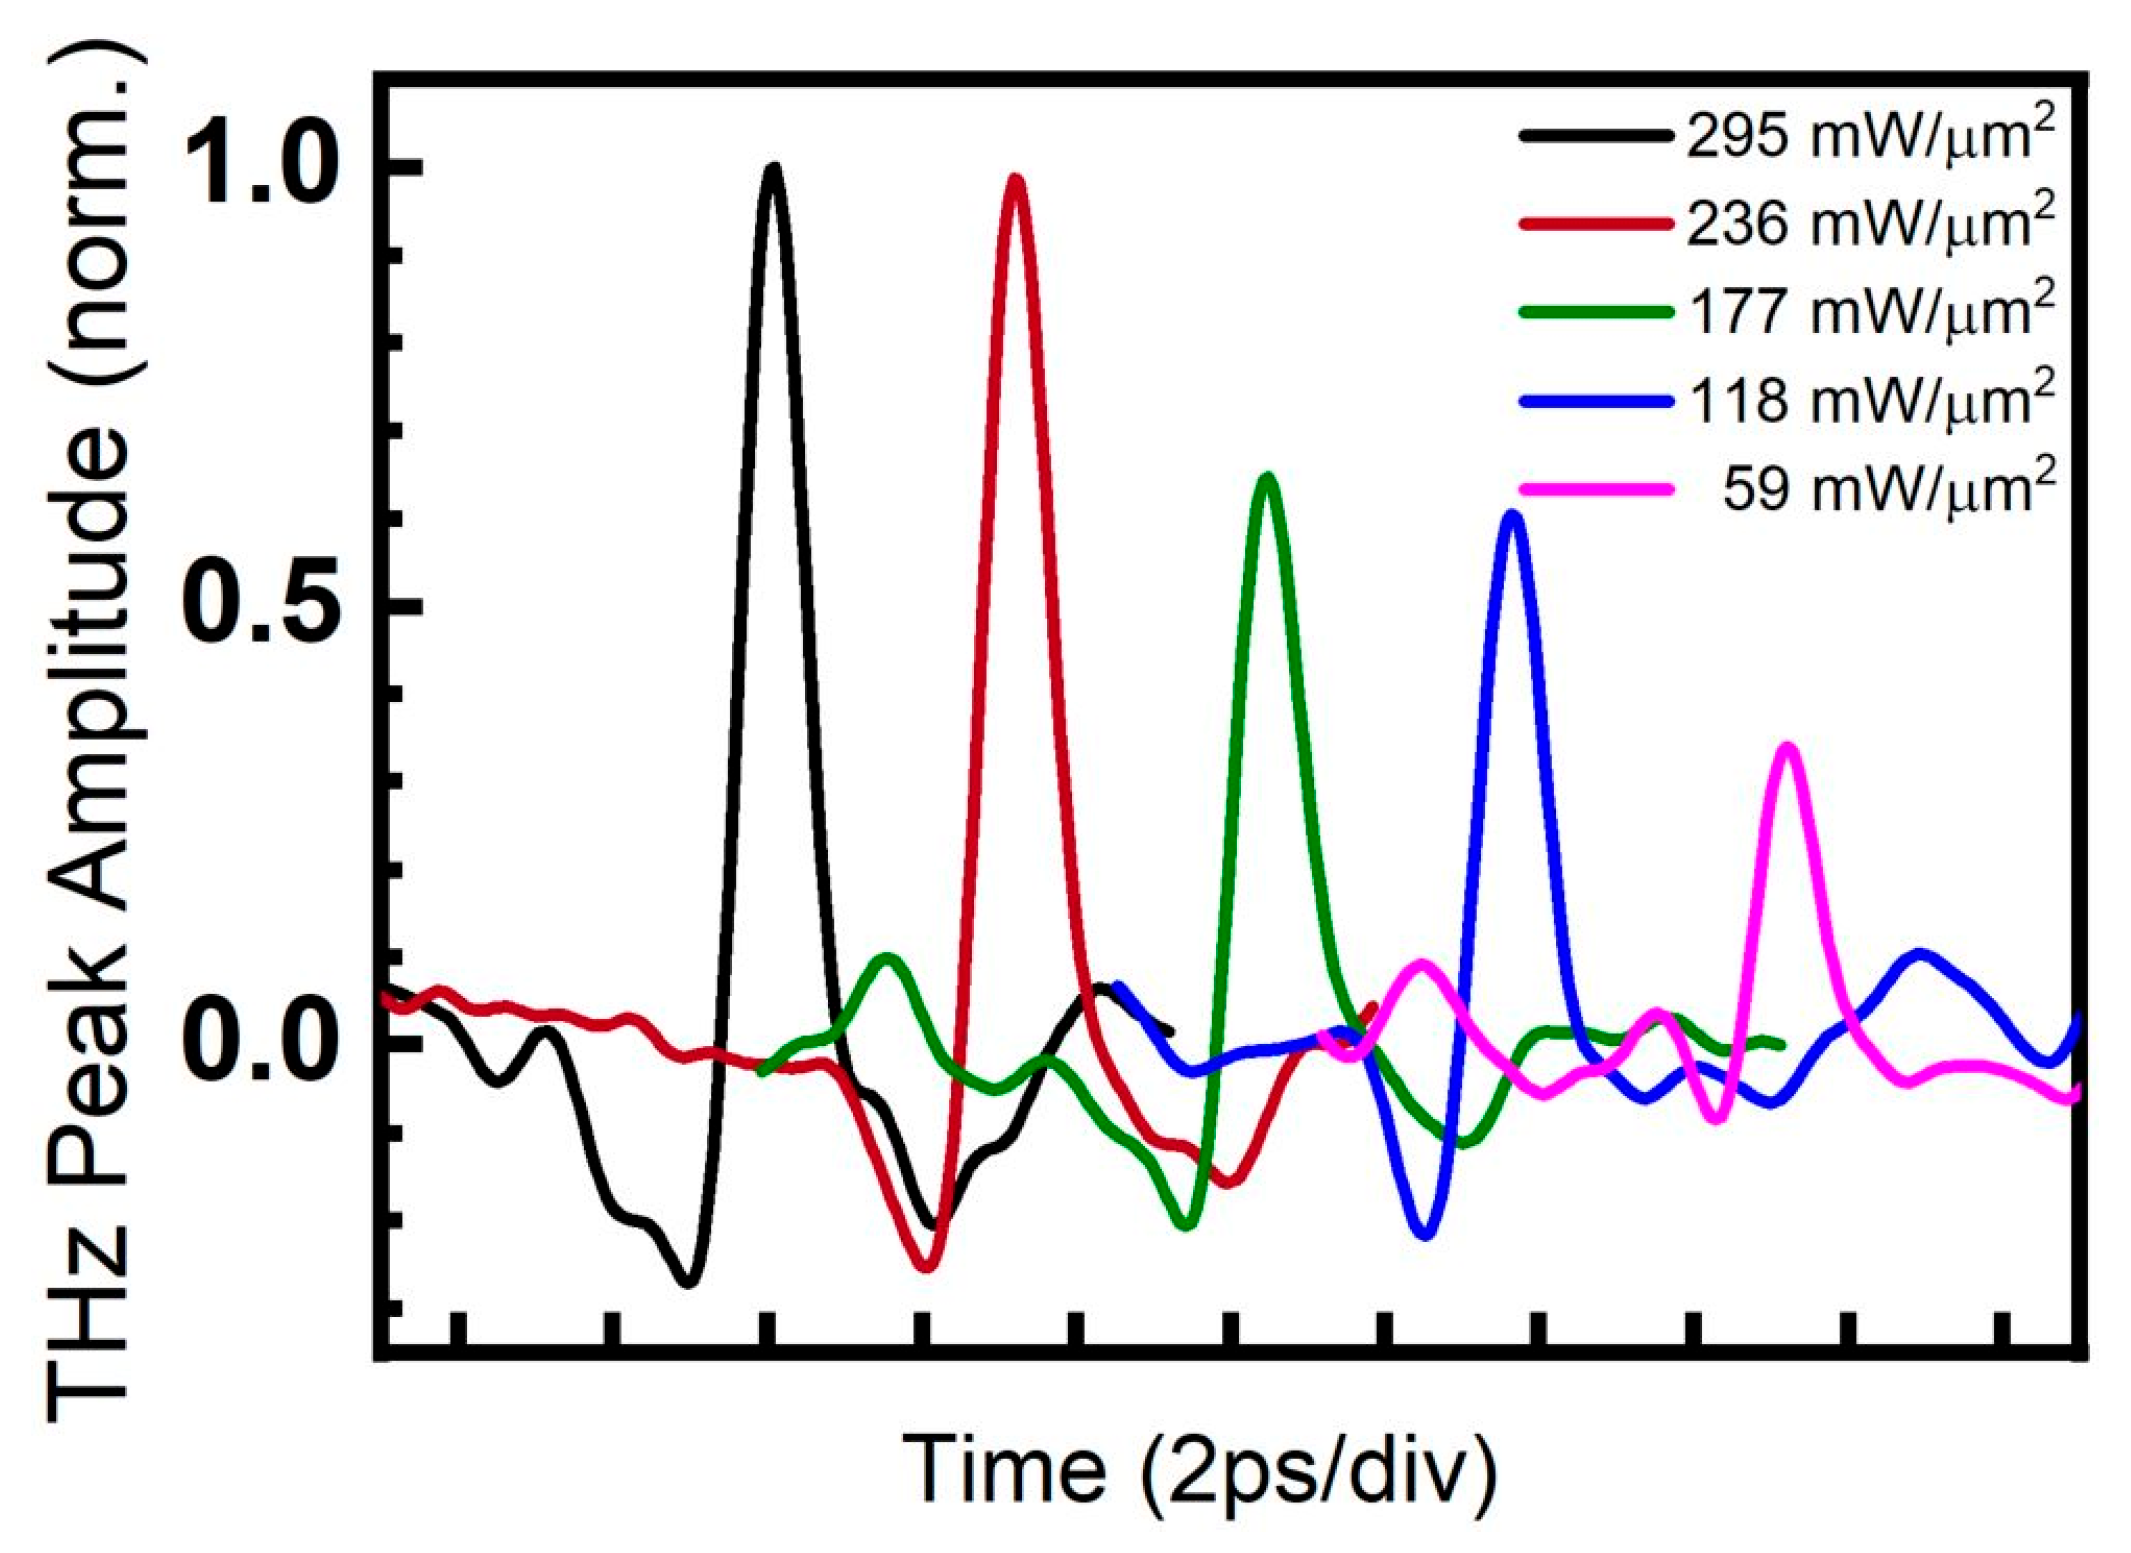
The THz transients generated by pulsed laser illumination of the Al-capped Bi2Se3 film at peak power densities from 59 mW/µm2 to 295 mW/µm2 are presented in Figure 11 showing an about three-fold difference between the THz peak amplitude triggered by the lowest and highest employed power. Furthermore, it is evident that for the highest peak power densities 295 mW/µm2 and 236 mW/µm2, corresponding to the black and red–brown traces, respectively, the measured THz peak amplitudes reach a maximum. We note that the measurement of a single THz transient takes about 120 s and that all transients were recorded at the same position. Clear THz transients could be recorded despite the substantial material modifications described above. We ascribe this to the fact that the visible material degradation and modification at the center of the illuminated laser spot affects only a tiny part of the illuminated area.
Figure 11.
THz transients generated by irradiating passivated Bi2Se3 films with a train of 100 fs laser pulses with a peak power range from 59 mW/µm2 to 295 mW/µm2. It should be noted here that each THz transient was measured in a different position. The THz transient recorded at 295 mW/µm2 (black trace) exhibits an approximately 3-fold increased THz peak amplitude in contrast to the transients recorded at 59 mW/µm2. Furthermore, the THz transients recorded at 295 mW/µm2 and 236 mW/µm2, (corresponding to the black and red–brown traces) exhibit approximately similar THz peak amplitudes, i.e., saturate in contrast to the transients recorded at lower optical peak power densities (green, blue and pink traces). For clarity, the transients are shifted on the time axis.
4. Discussion
Due to their different response times to pulsed optical illumination, the electron and phonon subsystems in solid thin films are often treated separately, and their transient behavior is described by a two-temperature model [46,47,48]. Here, illuminating a thin film with a femtosecond laser pulse leads to nearly instantaneous heating of the free electron subsystem. After a delay depending on electron-phonon coupling [49,50,51] heat transfers from the electron subsystem to the phonon subsystem, resulting in local lattice heating. Depending on the material, this process can lead to thermal expansion, local stress, the generation of acoustic waves, non-thermal melting, phase transition, or material ablation. Surprisingly, this is associated with only limited heating of the surrounding area [52,53]. In contrast, during cw laser illumination, the electron and phonon subsystems remain in equilibrium. This results in slow, diffusive heating, which typically results in a quasi-steady temperature distribution. The heat-affected zone is dominated by thermally induced melting, oxidation, or evaporation. Our studies examine extreme cases of pulsed and cw illumination, in which instantaneous and equilibrium processes both play a role in material modification.
For cw laser illumination, the correlation between the average power density (or peak power density, see Table 1) levels and the results presented in Figure 7 indicate the existence of a power density threshold for material damage. This observation has been substantiated through optical inspection and Raman measurements conducted in the targeted regions. As previously mentioned, within the safe average optical power density range, the (E2g) and (A21g) Raman modes of Bi2Se3 prevail in the recorded Raman spectra up to ~0.5 mW/µm2. Conversely, at elevated average optical power density levels (surpassing ~10 mW/µm2), the emergence or intensification of the Raman mode at ~255 cm−1, ascribed to Se-Se stretching vibrations [39,43,44,45], can serve as a hallmark of irreversible structural transformations, as previously delineated.
For pulsed laser illumination, Raman spectra presented in Figure 5 demonstrate that peak power densities ranging from 59 mW/µm2 to 295 mW/µm2 (corresponding to average power densities from 2.5 × 10⁻⁴ mW/µm2 to 1.2 × 10⁻³ mW/µm2, respectively) are adequate to induce local damage. Note that the peak and average power density differ for cw illumination by at most a factor of two, whereas they differ by about five orders of magnitude for the pulsed laser beam. This is due to the strong compression of the laser power in the ultrashort pulses. Therefore, we consider the peak power density for the comparison of the cw and pulsed illumination. Damage occurs for peak power densities exceeding similar values of about 20 mW/µm2 for cw and 50 mW/µm2 for pulsed illumination.
Although the energy deposition mechanisms differ substantially between cw and pulsed excitation, the final lattice state probed by Raman spectroscopy is governed primarily by the maximum lattice temperature and subsequent cooling rather than by the initial energy transfer. In both regimes, once the local lattice temperature exceeds the threshold for melting or structural decomposition, the material undergoes irreversible modification. The subsequent cooling, determined mainly by heat diffusion into the substrate, leads to recrystallization into a similar structurally modified phase at the rim of the damaged area.
In this picture, the rim region corresponds to locations where the maximum lattice temperature approaches the film morphology transformation threshold. As a result, despite the distinct excitation pathways (steady-state thermal diffusion in the cw case versus ultrafast electron–lattice thermalization in the pulsed case), the material may reach comparable states, leading to similar Raman signatures.
In our pulsed experiments, the diameter of the regions with thermally destroyed material is much smaller than the laser spot 1/e2-diameter, as presented in Figure 3 and Figure 6. Both optical and Raman measurements show that the damaged and undamaged regions are separated by a few µm wide rim regions. The large undamaged fraction in the flank and tail of the Gaussian laser profile is where unperturbed THz generation occurs (Figure 11). Micro-Raman mapping in Figure 6 reveals in addition the partial decomposition of Bi2Se3 and the development of selenium allotropes in the so-called rim region. In the flank and tail of the Gaussian distribution, we did not detect any structural or compositional changes.
It is widely accepted that the position of the (E2g) and (A21g) Raman modes is temperature-dependent [54] and accompanied by linewidth broadening with temperature increase. In contrast, the Raman spectra presented in this study were collected under an average optical power density of less than 0.05 mW/µm2. Therefore, it can be assumed that the temperature effects reported in earlier studies did not contribute significantly to the broadening of the characteristic Raman modes presented in this work. As presented by the findings in Figure 10, this assertion is confirmed. The extracted values for the peak positions of the (E2g) and (A21g) Raman modes, as determined from the measured Raman spectra, deviate only minimally from ~130 cm−1 and ~175 cm−1, respectively. It is important to note that different sample positions on the passivated Bi2Se3 films were exposed to the respective average optical power densities ranging from 5 × 10⁻² mW/µm2 to 25 mW/µm2 for 1000 min. Explicitly, in Figure 10, each data point was derived from a different sample position. After the exposure procedure, Raman spectra were collected on the sample at the differently exposed positions.
Conversely, a moderate increase in the line width (FWHM) of the measured Raman modes was observed for average cw optical power densities exceeding ~0.5 mW/µm2 (see Figure 10). In contrast, the FWHM of the ~255 cm−1 Raman mode related to Se-Se stretching in Se8 rings [39,43,44,45] in monoclinic and/or amorphous Se increases is about twice as large at ~0.5 mW/µm2 and increases rapidly in the range above from ~0.5 mW/µm2 to ~25 mW/µm2. This behavior unmistakably signifies dramatic structural and/or compositional, irreversible, alterations in the target sample regions.
Furthermore, the passivated Bi2Se3 films were subjected to the maximal average optical power density of ~50 mW/µm2, however we could not collect any Raman spectrum after 1000 min of exposure. The underlying cause of this phenomenon was thermal decomposition, which was initiated after a mere 30 s of exposure (Figure 9). As illustrated in Figure 7, representative optical micrographs of passivated Bi2Se3 films, before and after laser exposure confirmed irreversible surface morphology changes at all sample positions for exposure with an average optical power density of 10 mW/µm2 after 10, 100 and 1000 min. Furthermore, the “border case” of maximum laser power levels which induced thermal decomposition (visible as circle-like “black” regions in Figure 3 and Figure 7) of the Bi2Se3 film for both (cw and pulsed) lasers is fully comparable and presented. In both cases, this results in irreversible changes to the illuminated area, manifested as a “disappearance” of Raman modes—see Figure 5 (middle position, pulsed illumination, exposure time = 120 s) and Figure 9 (cw illumination, exposure time = 30 s). Although our micro-Raman measurements and investigations confirmed that optical power densities of 10 mW/µm2 (and higher) and 30 s (and longer) exposure operation conditions exceeded the thermal damage threshold, there are still many open questions, e.g., whether the onset of the Se–Se Raman peak correlates with the saturation or degradation of the THz emission. Additionally, we need to identify regions characterized by predominant and/or partial decomposition of Bi2Se3 to selenium and regions where possibly the amorphous phase of Bi2Se3 occurs. This will be the subject of our future studies based on TEM investigations. Nonetheless, the structural changes indicated by Raman spectra and the absence of visible changes in surface morphology suggest alterations in the material properties. Consequently, damage-free cw illumination of Bi2Se3 films can be achieved only at average optical power densities below 0.5 mW/µm2. Besides serving as a guide for designing the emitter’s thermal management and choosing laser parameters for long-term operation, future developments in design and operation of sophisticated micrometer-sized THz emitters arranged in arrays [55] would benefit from this knowledge. Nevertheless, further investigations of the impact of material degradation on, e.g., frequency bandwidth, signal-to-noise ratio, spectral uniformity, and conversion efficiency of the THz emitters should be provided. Finally, it must be noted that using different excitation wavelengths with the Bi2Se3 material, which has different absorption coefficients [23,24,25,26], results in different penetration depths. Therefore, power density comparisons under these conditions must be considered, which will be the focus of our future study. This will ultimately enable us to determine ‘safe’ operating conditions, thereby significantly increasing the lifetime and reliability of Bi2Se3-based THz emitters.
5. Conclusions
Our investigation has centered on degradation effects caused by both cw and femtosecond pulsed laser exposure in THz emitter structures based on passivated Bi2Se3 films. Raman spectroscopy was utilized to conduct this investigation. The experimental findings have demonstrated that thermal damage induced by both 100 fs wide optical pulses, as well as by cw laser exposure, was reproducible. For cw laser illumination, this phenomenon was manifested at average optical power density levels exceeding approximately 10 and 25 mW/µm2 for 100 and 10 min of exposure, respectively. In the case of femtosecond pulse illumination, even the smallest used average laser power density leads to irreversible film modification or even to film ablation in the core region of the exposed area due to the high peak power density at the center of the beam. Nevertheless, the affected area constitutes a small fraction of the entire illuminated spot, thus allowing THz generation.
The optical inspection and micro-Raman measurements performed on the targeted regions confirmed the irreversible structural changes in the materials. For the cw mode, long-term illumination up to 1000 min reveals that the passivated Bi2Se3 films can withstand an average cw optical power density up to ~0.5 mW/µm2 without any indications of degradation.
In both cw and pulsed illumination modes the resulting Raman spectra at the rim of the damaged area show very similar features. This observation is surprising given the different underlying physical mechanisms. For cw illumination, near-equilibrium diffusive heating leads to a steady-state temperature distribution, whereas for pulsed illumination, far-from-equilibrium sequential heating of electron and phonon subsystems results in extremely steep spatial and temporal thermal gradients. The associated extreme heating and cooling rates are likely to account for the small size and sharp boundaries of the ablated (black) areas.
Long-term operation of THz emitters requires a deep understanding of thermal management and damage mechanisms in the involved materials, resulting from both equilibrium and transient laser-driven processes. Here, we showed that the combination of Raman spectroscopy and THz generation can significantly extend knowledge about this interplay. We conclude that these insights could be beneficial for future/emerging, advanced, highly efficient, micrometer-sized, and in particular durable THz emitters—also designed in arrays—for spectroscopic applications in hard-to-access environments, including, e.g., material inspection in fusion and nuclear facilities, as well as Arctic and extraterrestrial applications, where long-term reliability of devices and materials is required.
Author Contributions
Conceptualization, M.M. and H.H.H.; methodology, M.M., H.H.H., R.A., D.E.B., S.F.H., I.K., K.A.N., R.S., C.M.S. and J.M.; THz transient emission experiments, R.A.; laser beam profile characterization, D.E.B. and R.A.; Micro-Raman measurements, M.M. and H.H.H.; PVD/AFM/XRD/XRR, K.A.N., A.K., validation, R.A., M.M., D.E.B., I.K., K.A.N., S.F.H., R.S. and H.H.H.; formal analysis, R.A., H.H.H., M.M., D.E.B., K.A.N., S.F.H. and A.K., investigation, H.H.H., M.M., R.A., S.F.H., K.A.N., A.K., I.K. and D.E.B.; resources, C.M.S., J.M. and R.S., data curation, R.A., M.M. and H.H.H.; writing—original draft, M.M., H.H.H., R.A., D.E.B., K.A.N. and R.S.; writing—review and editing, H.H.H., M.M., R.A., D.E.B., I.K., K.A.N., J.M., C.M.S. and R.S.; supervision, H.H.H., R.A., J.M., D.E.B., C.M.S. and R.S.; project administration, R.A., C.M.S., J.M. and R.S.; funding acquisition, C.M.S. and R.S. and J.M. All authors have read and agreed to the published version of the manuscript.
Funding
The research at the University of Rochester was supported in part by the University Research Awards (URA) Program. The research in Jülich was funded in part by “the Joint Lab for Integrated Model and Data Driven Material Characterization (JL MDMC), a cross-centre platform of the Helmholtz Association” and contains results obtained from experiments performed at the Ernst Ruska-Centre (ER-C) for Microscopy and Spectroscopy with Electrons at the Forschungszentrum Julich (FZJ) in Germany.
Data Availability Statement
Data supporting reported results are available from the corresponding authors upon reasonable request.
Conflicts of Interest
The authors declare no conflicts of interest.
References
- Bull, C.; Hewett, S.M.; Ji, R.; Lin, C.-H.; Thomson, T.; Graham, D.M.; Nutter, P.W. Spintronic Terahertz Emitters: Status and Prospects from a Materials Perspective. APL Mater. 2021, 9, 090701. [Google Scholar] [CrossRef] [Scilit]
- Papaioannou, E.T.; Beigang, R. THz Spintronic Emitters: A Review on Achievements and Future Challenges. Nanophotonics 2021, 10, 1243–1257. [Google Scholar] [CrossRef] [Scilit]
- Kumar, S.; Kumar, S. Ultrafast Terahertz Spin and Orbital Transport in Magnetic/Nonmagnetic Multilayer Heterostructures and a Perspective. J. Appl. Phys. 2023, 134, 170901. [Google Scholar] [CrossRef] [Scilit]
- Cheng, J.; Komissarov, I.; Chen, G.; Chakraborty, D.; Adam, R.; Bürgler, D.E.; Heidtfeld, S.; Cao, D.; Büscher, M.; Hardtdegen, H.; et al. Terahertz Inverse Spin Hall Effect in Spintronic Nanostructures with Various Ferromagnetic Materials. J. Magn. Magn. Mater. 2024, 593, 171641. [Google Scholar] [CrossRef] [Scilit]
- Adam, R.; Cao, D.; Bürgler, D.E.; Heidtfeld, S.; Wang, F.; Greb, C.; Cheng, J.; Chakraborty, D.; Komissarov, I.; Büscher, M.; et al. THz Generation by Exchange-Coupled Spintronic Emitters. npj Spintron. 2024, 2, 58. [Google Scholar] [CrossRef] [Scilit]
- Zhu, L.-G.; Kubera, B.; Fai Mak, K.; Shan, J. Effect of Surface States on Terahertz Emission from the Bi2Se3 Surface. Sci. Rep. 2015, 5, 10308. [Google Scholar] [CrossRef] [Scilit]
- Hamh, S.Y.; Park, S.-H.; Han, J.; Jeon, J.H.; Kahng, S.-J.; Kim, S.; Choi, S.-H.; Bansal, N.; Oh, S.; Park, J.; et al. Anisotropic Terahertz Emission from Bi2Se3 Thin Films with Inclined Crystal Planes. Nanoscale Res. Lett. 2015, 10, 489. [Google Scholar] [CrossRef] [Scilit]
- Braun, L.; Mussler, G.; Hruban, A.; Konczykowski, M.; Schumann, T.; Wolf, M.; Münzenberg, M.; Perfetti, L.; Kampfrath, T. Ultrafast Photocurrents at the Surface of the Three-Dimensional Topological Insulator Bi2Se3. Nat. Commun. 2016, 7, 13259. [Google Scholar] [CrossRef] [Scilit]
- Nivedan, A.; Kumar, S. Excitation Wavelength-Dependent Ultrafast THz Emission from Surface and Bulk of Three-Dimensional Topological Insulators. J. Phys. D Appl. Phys. 2023, 56, 255101. [Google Scholar] [CrossRef] [Scilit]
- Zhang, Q.; Ou, Y.; Hilse, M.; Liu, D.S.H.; Law, S. Prospects for THz Optoelectronic Devices Using Chalcogenide Topological Materials and Recent Progress on Their Synthesis by Molecular Beam Epitaxy [Invited]. Opt. Mater. Express 2025, 15, 1135. [Google Scholar] [CrossRef] [Scilit]
- Guo, Y.; Chen, Z.; Jin, Z.; Wang, X.; Zhang, C.; Balakin, A.V.; Shkurinov, A.P.; Peng, Y.; Zhu, Y.; Zhuang, S. Dynamically Controllable Terahertz Electromagnetic Interference Shielding by Small Polaron Responses in Dirac Semimetal PdTe2 Thin Films. Adv. Funct. Mater. 2024, 34, 2407749. [Google Scholar] [CrossRef] [Scilit]
- Chen, Z.; Qiu, H.; Cheng, X.; Cui, J.; Jin, Z.; Tian, D.; Zhang, X.; Xu, K.; Liu, R.; Niu, W.; et al. Defect-Induced Helicity Dependent Terahertz Emission in Dirac Semimetal PtTe2 Thin Films. Nat. Commun. 2024, 15, 2605. [Google Scholar] [CrossRef] [Scilit] [PubMed]
- Ma, Y.; Guan, Y. Recent Progress on Laser-Assisted Machining for Silicon Carbide Materials. J. Manuf. Process. 2025, 151, 623–654. [Google Scholar] [CrossRef] [Scilit]
- Peng, J.; Xie, S.; Chen, T.; Wang, X.; Yu, X.; Yang, L.; Ni, Z.; Ling, Z.; Yuan, Z.; Shi, J.; et al. Numerical Simulation and Process Optimization of Laser Welding in 6056 Aluminum Alloy T-Joints. Crystals 2024, 15, 35. [Google Scholar] [CrossRef] [Scilit]
- Yang, X.; Gai, J.; Zheng, X.; Xie, Y.; Yu, X.; Gong, R.; Meng, Z.; Zhai, S.; Zhao, X. Analysis of Thermal Wave Scattering and Temperature Distribution in Sub-Surface, Defects of Gradient Construction Materials. Sci. Rep. 2025, 15, 22381. [Google Scholar] [CrossRef] [Scilit]
- Mikulics, M.; Kočan, M.; Rizzi, A.; Javorka, P.; Sofer, Z.; Stejskal, J.; Marso, M.; Kordoš, P.; Lüth, H. Growth and Properties of GaN and AlN Layers on Silver Substrates. Appl. Phys. Lett. 2005, 87, 212109. [Google Scholar] [CrossRef] [Scilit]
- Inoue, S.; Okamoto, K.; Nakano, T.; Ohta, J.; Fujioka, H. Growth of Single Crystalline GaN on Silver Mirrors. Appl. Phys. Lett. 2007, 91, 201920. [Google Scholar] [CrossRef] [Scilit]
- Mikulics, M.; Kordoš, P.; Fox, A.; Kočan, M.; Lüth, H.; Sofer, Z.; Hardtdegen, H. Efficient Heat Dissipation in AlGaN/GaN Heterostructure Grown on Silver Substrate. Appl. Mater. Today 2017, 7, 134–137. [Google Scholar] [CrossRef] [Scilit]
- Mikulics, M.; Adam, R.; Sofer, Z.; Hardtdegen, H.; Stanček, S.; Knobbe, J.; Kočan, M.; Stejskal, J.; Sedmidubský, D.; Pavlovič, M.; et al. Femtosecond and Highly Sensitive GaAs Metal–Semiconductor–Metal Photodetectors Grown on Aluminum Mirrors/Pseudo-Substrates. Semicond. Sci. Technol. 2010, 25, 075001. [Google Scholar] [CrossRef] [Scilit]
- Mikulics, M.; Adam, R.; Chen, G.; Chakraborty, D.; Cheng, J.; Pericolo, A.; Komissarov, I.; Bürgler, D.E.; Heidtfeld, S.F.; Serafini, J.; et al. Determination of Thermal Damage Threshold in THz Photomixers Using Raman Spectroscopy. Crystals 2023, 13, 1267. [Google Scholar] [CrossRef] [Scilit]
- Mikulics, M.; Adam, R.; Sobolewski, R.; Heidtfeld, S.; Cao, D.; Bürgler, D.E.; Schneider, C.M.; Mayer, J.; Hardtdegen, H.H. Nano-LED Driven Phase Change Evolution of Layered Chalcogenides for Raman Spectroscopy Investigations. FlatChem 2022, 36, 100447. [Google Scholar] [CrossRef] [Scilit]
- Zheng, B.; Deng, L.; Ma, H.; Wang, J.; Yao, Y.; Qi, D.; Shen, Y.; Sun, Z.; Zhang, S. Rewritable Multilevel Optical Storage Based on Valence State Conversion Induced by Phase-Shaped Femtosecond Laser in Rare Earth-Doped Nanocrystals. Appl. Phys. Lett. 2025, 127, 171101. [Google Scholar] [CrossRef] [Scilit]
- Ermolaev, G.A.; Vyslanko, I.S.; Tselin, A.P.; El-Sayed, M.A.; Tatmyshevskiy, M.K.; Slavich, A.S.; Yakubovsky, D.I.; Mironov, M.S.; Mazitov, A.B.; Eghbali, A.; et al. Broadband Optical Properties of Bi2Se3. Nanomaterials 2023, 13, 1460. [Google Scholar] [CrossRef] [Scilit]
- Patel, N.F.; Bhakhar, S.A.; Jagani, H.S.; Solanki, G.K.; Pataniya, P.M. Synthesis, Characterization and Optoelectronic Application of Bi2Se3 Thin Film Prepared by Thermal Evaporation Technique. Opt. Mater. 2023, 136, 113403. [Google Scholar] [CrossRef] [Scilit]
- Gautam, S.; Aggarwal, V.; Singh, B.; Kumar, R.; Tawale, J.S.; Yadav, B.S.; Ganesan, R.; Singh, V.N.; Singh, S.P.; Senthil Kumar, M.; et al. Structural and Optical Properties of Sputtered Bi2Se3 Thin Films on Sapphire (0001), Quartz and GaN/Sapphire (0001). J. Mater. Res. 2023, 38, 1780–1791. [Google Scholar] [CrossRef] [Scilit]
- Wang, Y.; Liu, S.; Yuan, J.; Wang, P.; Chen, J.; Li, J.; Xiao, S.; Bao, Q.; Gao, Y.; He, J. Ultra-Broadband Nonlinear Saturable Absorption for Two-Dimensional Bi2TexSe3−x Nanosheets. Sci. Rep. 2016, 6, 33070. [Google Scholar] [CrossRef] [Scilit] [PubMed]
- Salvato, M.; Scagliotti, M.; De Crescenzi, M.; Castrucci, P.; De Matteis, F.; Crivellari, M.; Pelli Cresi, S.; Catone, D.; Bauch, T.; Lombardi, F. Stoichiometric Bi2Se3 Topological Insulator Ultra-Thin Films Obtained through a New Fabrication Process for Optoelectronic Applications. Nanoscale 2020, 12, 12405–12415. [Google Scholar] [CrossRef] [Scilit]
- Wang, C.; Zhang, Z.; Jing, X.; Yang, Z.; Xu, W. Optimization of Multistage Femtosecond Laser Drilling Process Using Machine Learning Coupled with Molecular Dynamics. Opt. Laser Technol. 2022, 156, 108442. [Google Scholar] [CrossRef] [Scilit]
- Zhang, Z.; Yang, Z.; Wang, C.; Xu, W. Accelerating Ultrashort Pulse Laser Micromachining Process Comprehensive Optimization Using a Machine Learning Cycle Design Strategy Integrated with a Physical Model. J. Intell. Manuf. 2024, 35, 449–465. [Google Scholar] [CrossRef] [Scilit]
- Zhang, Z.; Liu, S.; Zhang, Y.; Wang, C.; Zhang, S.; Yang, Z.; Xu, W. Optimization of Low-Power Femtosecond Laser Trepan Drilling by Machine Learning and a High-Throughput Multi-Objective Genetic Algorithm. Opt. Laser Technol. 2022, 148, 107688. [Google Scholar] [CrossRef] [Scilit]
- Baran, J.D.; Grönbeck, H.; Hellman, A. Mechanism for Limiting Thickness of Thin Oxide Films on Aluminum. Phys. Rev. Lett. 2014, 112, 146103. [Google Scholar] [CrossRef] [Scilit]
- Evertsson, J.; Bertram, F.; Zhang, F.; Rullik, L.; Merte, L.R.; Shipilin, M.; Soldemo, M.; Ahmadi, S.; Vinogradov, N.; Carlà, F.; et al. The Thickness of Native Oxides on Aluminum Alloys and Single Crystals. Appl. Surf. Sci. 2015, 349, 826–832. [Google Scholar] [CrossRef] [Scilit]
- Burford, N.M.; El-Shenawee, M.O. Review of Terahertz Photoconductive Antenna Technology. Opt. Eng. 2017, 56, 010901. [Google Scholar] [CrossRef] [Scilit]
- Zhang, J.; Peng, Z.; Soni, A.; Zhao, Y.; Xiong, Y.; Peng, B.; Wang, J.; Dresselhaus, M.S.; Xiong, Q. Raman Spectroscopy of Few-Quintuple Layer Topological Insulator Bi2Se3 Nanoplatelets. Nano Lett. 2011, 11, 2407–2414. [Google Scholar] [CrossRef] [Scilit]
- Wang, M.; Xing, H.; Li, R.; Li, Q.; Qiu, W. Micro-Raman Spectroscopy Investigation of Deformation Transfer at the Interface between Bi2Se3 Nanoflakes and a Flexible Substrate. Opt. Lasers Eng. 2025, 185, 108705. [Google Scholar] [CrossRef] [Scilit]
- Yuan, J.; Zhao, M.; Yu, W.; Lu, Y.; Chen, C.; Xu, M.; Li, S.; Loh, K.; Qiaoliang, B. Raman Spectroscopy of Two-Dimensional Bi2TexSe3−x Platelets Produced by Solvothermal Method. Materials 2015, 8, 5007–5017. [Google Scholar] [CrossRef] [Scilit] [PubMed]
- Shahil, K.M.F.; Hossain, M.Z.; Goyal, V.; Balandin, A.A. Micro-Raman Spectroscopy of Mechanically Exfoliated Few-Quintuple Layers of Bi2Te3, Bi2Se3, and Sb2Te3 Materials. J. Appl. Phys. 2012, 111, 054305. [Google Scholar] [CrossRef] [Scilit]
- Richter, W.; Becker, C.R. A Raman and Far-Infrared Investigation of Phonons in the Rhombohedral V2–VI3 Compounds Bi2Te3, Bi2Se3, Sb2Te3 and Bi2(Te1−xSex)3 (0 < x < 1), (Bi1−ySby)2Te3 (0 < y < 1). Phys. Status Solidi (b) 1977, 84, 619–628. [Google Scholar] [CrossRef] [Scilit]
- Jadhav, A.A.; Khanna, P.K. Impact of Microwave Irradiation on Cyclo-Octeno-1,2,3-Selenadiazole: Formation of Selenium Nanoparticles and Their Polymorphs. RSC Adv. 2015, 5, 44756–44763. [Google Scholar] [CrossRef] [Scilit]
- Zhao, Y.; Luo, X.; Zhang, J.; Wu, J.; Bai, X.; Wang, M.; Jia, J.; Peng, H.; Liu, Z.; Quek, S.Y.; et al. Interlayer Vibrational Modes in Few-Quintuple-Layer Bi2Te3 and Bi2Se3 Two-Dimensional Crystals: Raman Spectroscopy and first-principles studies. Phys. Rev. B 2014, 90, 245428. [Google Scholar] [CrossRef] [Scilit]
- Niherysh, K.A.; Andzane, J.; Mikhalik, M.M.; Zavadsky, S.M.; Dobrokhotov, P.L.; Lombardi, F.; Prischepa, S.L.; Komissarov, I.V.; Erts, D. Correlation Analysis of Vibration Modes in Physical Vapour Deposited Bi2Se3 Thin Films Probed by the Raman Mapping Technique. Nanoscale Adv. 2021, 3, 6395–6402. [Google Scholar] [CrossRef] [Scilit]
- Zhang, H.; Liu, C.-X.; Qi, X.-L.; Dai, X.; Fang, Z.; Zhang, S.-C. Topological Insulators in Bi2Se3, Bi2Te3 and Sb2Te3 with a Single Dirac Cone on the Surface. Nat. Phys. 2009, 5, 438–442. [Google Scholar] [CrossRef] [Scilit]
- Lucovsky, G.; Mooradian, A.; Taylor, W.; Wright, G.B.; Keezer, R.C. Identification of the Fundamental Vibrational Modes of Trigonal, α-Monoclinic and Amorphous Selenium. Solid State Commun. 1967, 5, 113–117. [Google Scholar] [CrossRef] [Scilit]
- Baganich, A.A.; Mikla, V.I.; Semak, D.G.; Sokolov, A.P.; Shebanin, A.P. Raman Scattering in Amorphous Selenium Molecular Structure and Photoinduced Crystallization. Phys. Status Solidi (b) 1991, 166, 297–302. [Google Scholar] [CrossRef] [Scilit]
- Goldan, A.H.; Li, C.; Pennycook, S.J.; Schneider, J.; Blom, A.; Zhao, W. Molecular Structure of Vapor-Deposited Amorphous Selenium. J. Appl. Phys. 2016, 120, 14072–14081. [Google Scholar] [CrossRef] [Scilit]
- Aeaby, C.D.; Ray, A. Two-Temperature Model for Ultrafast Melting of Au-Based Bimetallic Films Interacting with Single-Pulse Femtosecond Laser: Theoretical Study of Damage Threshold. Phys. Rev. B 2023, 107, 195402. [Google Scholar] [CrossRef] [Scilit]
- Gurevich, E.L.; Levy, Y.; Gurevich, S.V.; Bulgakova, N.M. Role of the Temperature Dynamics in Formation of Nanopatterns upon Single Femtosecond Laser Pulses on Gold. Phys. Rev. B 2017, 95, 054305. [Google Scholar] [CrossRef] [Scilit]
- van Kampen, M. Ultrafast Spin Dynamics in Ferromagnetic Metals. Ph.D. Thesis, Technical University of Eindhoven, Eindhoven, The Netherlands, 2003. [Google Scholar] [CrossRef]
- Naldo, S.B.; Bernotas, A.V.; Donovan, B.F. Understanding the Sensitivity of the Two-Temperature Model for Electron–Phonon Coupling Measurements. J. Appl. Phys. 2020, 128, 085102. [Google Scholar] [CrossRef] [Scilit]
- Akhmetov, F.; Milov, I.; Semin, S.; Formisano, F.; Medvedev, N.; Sturm, J.M.; Zhakhovsky, V.V.; Makhotkin, I.A.; Kimel, A.; Ackermann, M. Laser-Induced Electron Dynamics and Surface Modification in Ruthenium Thin Films. Vacuum 2023, 212, 112045. [Google Scholar] [CrossRef] [Scilit]
- Akhmetov, F.; Medvedev, N.; Makhotkin, I.; Ackermann, M.; Milov, I. Effect of Atomic-Temperature Dependence of the Electron–Phonon Coupling in Two-Temperature Model. Materials 2022, 15, 5193. [Google Scholar] [CrossRef] [Scilit]
- Lee, J.B.; Kang, K.; Lee, S.H. Comparison of Theoretical Models of Electron-Phonon Coupling in Thin Gold Films Irradiated by Femtosecond Pulse Lasers. Mater. Trans. 2011, 52, 547–553. [Google Scholar] [CrossRef] [Scilit]
- Shin, S.; Hur, J.-G.; Park, J.K.; Kim, D.-H. Thermal Damage Free Material Processing Using Femtosecond Laser Pulses for Fabricating Fine Metal Masks: Influences of Laser Fluence and Pulse Repetition Rate on Processing Quality. Opt. Laser Technol. 2021, 134, 106618. [Google Scholar] [CrossRef] [Scilit]
- Irfan, B.; Sahoo, S.; Gaur, A.P.S.; Ahmadi, M.; Guinel, M.J.-F.; Katiyar, R.S.; Chatterjee, R. Temperature Dependent Raman Scattering Studies of Three Dimensional Topological Insulators Bi2Se3. J. Appl. Phys. 2014, 115, 173506. [Google Scholar] [CrossRef] [Scilit]
- Das-Mohapatra, B.; Kanistras, N.; Busse, A.; Papaioannou, E.T.; Schmidt, G. On Chip Digital-to-Analog Converters for Ultrafast Signals Using Spintronic Terahertz Emitters. Appl. Phys. Lett. 2025, 127, 204103. [Google Scholar] [CrossRef] [Scilit]

Disclaimer/Publisher’s Note: The statements, opinions and data contained in all publications are solely those of the individual author(s) and contributor(s) and not of MDPI and/or the editor(s). MDPI and/or the editor(s) disclaim responsibility for any injury to people or property resulting from any ideas, methods, instructions or products referred to in the content. |
© 2026 by the authors. Licensee MDPI, Basel, Switzerland. This article is an open access article distributed under the terms and conditions of the Creative Commons Attribution (CC BY) license.