


Abstract
Skin diseases are one of the most common diseases, affecting approximately 1.9 billion people worldwide, and early detection of skin diseases can help avoid deterioration and improve treatment outcomes. Existing clinical detection methods have drawbacks such as high subjectivity and complexity, as existing diagnostic algorithms pay less attention to interpretability, and research mainly focuses on Caucasian skin. Therefore, we designed a multi-spectral skin disease detection system based on multi-model multi-layer networks to accurately differentiate similar skin diseases. The results show that the system has great potential in assisting the detection of skin diseases and can effectively improve the diagnostic accuracy and medical efficiency of skin diseases.
1. Introduction
Skin and subcutaneous conditions are among the most prevalent diseases globally, affecting approximately 1.9 billion people across all regions and age groups [1]. These diseases involve all parts of the skin, including, but not limited to, the scalp, face, limbs and other parts of the body, and exert a significant impact on the quality of life and health of patients [2,3]. Early detection of skin diseases can help to avoid deterioration and improve treatment outcomes [4], and available clinical tests include dermatological examination using dermoscopy, skin biopsy (also known as whole slide imaging), genetic mutation testing, and MRI (Magnetic Resonance Imaging), CT (Computed Tomography) scanning, and PET (Positron Emission Tomography) imaging tests, among others. However, these clinical tests have significant drawbacks: manual diagnosis is highly subjective and has low diagnostic accuracy; the procedure is relatively complex and requires a high level of professional knowledge and experience on the part of medical personnel [5,6].
The computer-aided diagnosis technology, by combining medical image processing, biochemical and physiological analysis, and computer calculations, can assist doctors to quickly discover the lesion area and improve diagnostic accuracy and efficiency [7,8]. Especially in the diagnosis of complex diseases, this technology can improve the reliability and consistency of diagnosis and alleviate the problem of strained medical resources [9]. Meanwhile, multi-spectral imaging, as a non-invasive technique, can capture richer information about diseased tissues than RGB imaging [10], and its application in the medical field, such as in early disease diagnosis, is gradually increasing [11]. Multi-spectral imaging fuses image and spectral properties for fast and accurate data interpretation [12,13,14]. Combining computer-aided diagnosis (e.g., artificial intelligence techniques such as deep learning) with multi-spectral medical imaging is expected to further improve the accuracy and efficiency of disease detection, provide more comprehensive auxiliary diagnostic support for physicians, and promote the development of precision medicine.
In recent years, scholars in various countries have been actively exploring the development of more rapid, accurate, and convenient methods for the detection of skin diseases. In 2018, Rey-Barroso et al. [15] proposed a visible and extended near-infrared multi-spectral imaging technique for skin cancer diagnosis. In 2019, Uemori et al. [16] proposed a skin recognition system based on multi-spectral image data and convolutional neural networks. Setiadi et al. [17] proposed an LED-based multi-spectral imaging system for estimating blood and melanin content. Kim S et al. [18] proposed a smartphone-based multi-spectral imaging and machine learning analysis system for differentiating seborrheic dermatitis and psoriasis. In 2020, Bondarenko et al. [19] proposed a machine learning-based non-invasive skin melanoma diagnosis using a novel multi-input. In 2022, Shen et al. [20] proposed an open-source mobile multi-spectral imaging system. Ma et al. [21] propose an efficient portable LED multi-spectral imaging system for human tongue health detection. Hwang et al. [22] propose a canine skin disease classification system based on deep learning and multi-spectral imaging. In 2024, Rey-Barroso et al. [23] proposed a deep learning algorithm to improve the classification of skin diseases using a multi-spectral dermatology dataset to train deep learning algorithms to improve the accuracy of skin disease diagnosis. In 2024, Jiang et al. [24] proposed a deep learning-assisted multi-spectral imaging system for the early screening of multiple skin diseases, utilizing a commercial mosaic spectrometer and a 1D-CNN-LSTM model to classify lesions. These studies have demonstrated the powerful potential of combining multi-spectral imaging with artificial intelligence techniques.
Although multi-spectral imaging technology has made significant progress in the field of artificial intelligence-assisted dermatological diagnosis, current research still faces three key limitations: (1) Most studies focus on broad skin cancer screening or multi-disease classification rather than fine discrimination of conditions with similar clinical manifestations and high misdiagnosis rates, such as acne and eczema; (2) algorithms prioritize accuracy over interpretability, which hinders clinical application—in scenarios where the transparency of diagnostic basis is crucial; and (3) existing benchmark tests are mainly characterized by the skin phototypes of Caucasians, lacking validation for populations with different spectral features, such as East Asians.
To address these gaps, this study develops a comprehensive multi-spectral skin disease detection system with a novel multi-model, multi-layer network fusion framework. This architecture achieves high accuracy in distinguishing similar conditions while enhancing decision transparency. Rigorous validation was conducted on a dataset of common skin diseases in an East Asian cohort.
2. Methods
2.1. Analysis of the Light Absorption Properties of Typical Skin Diseases
Skin light absorption refers to the ability of skin tissue to absorb light of different wavelengths. When photons are transmitted in the skin tissue, they are affected by different absorbing and scattering substances in the tissue, resulting in diffuse reflection phenomena. These absorbing substances are collectively known as chromophores, and different chromophores have different absorption spectra.
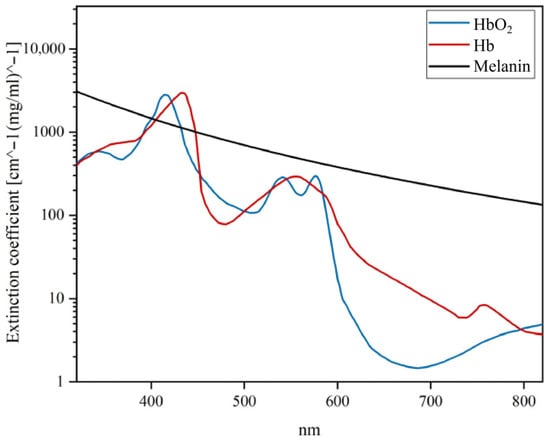
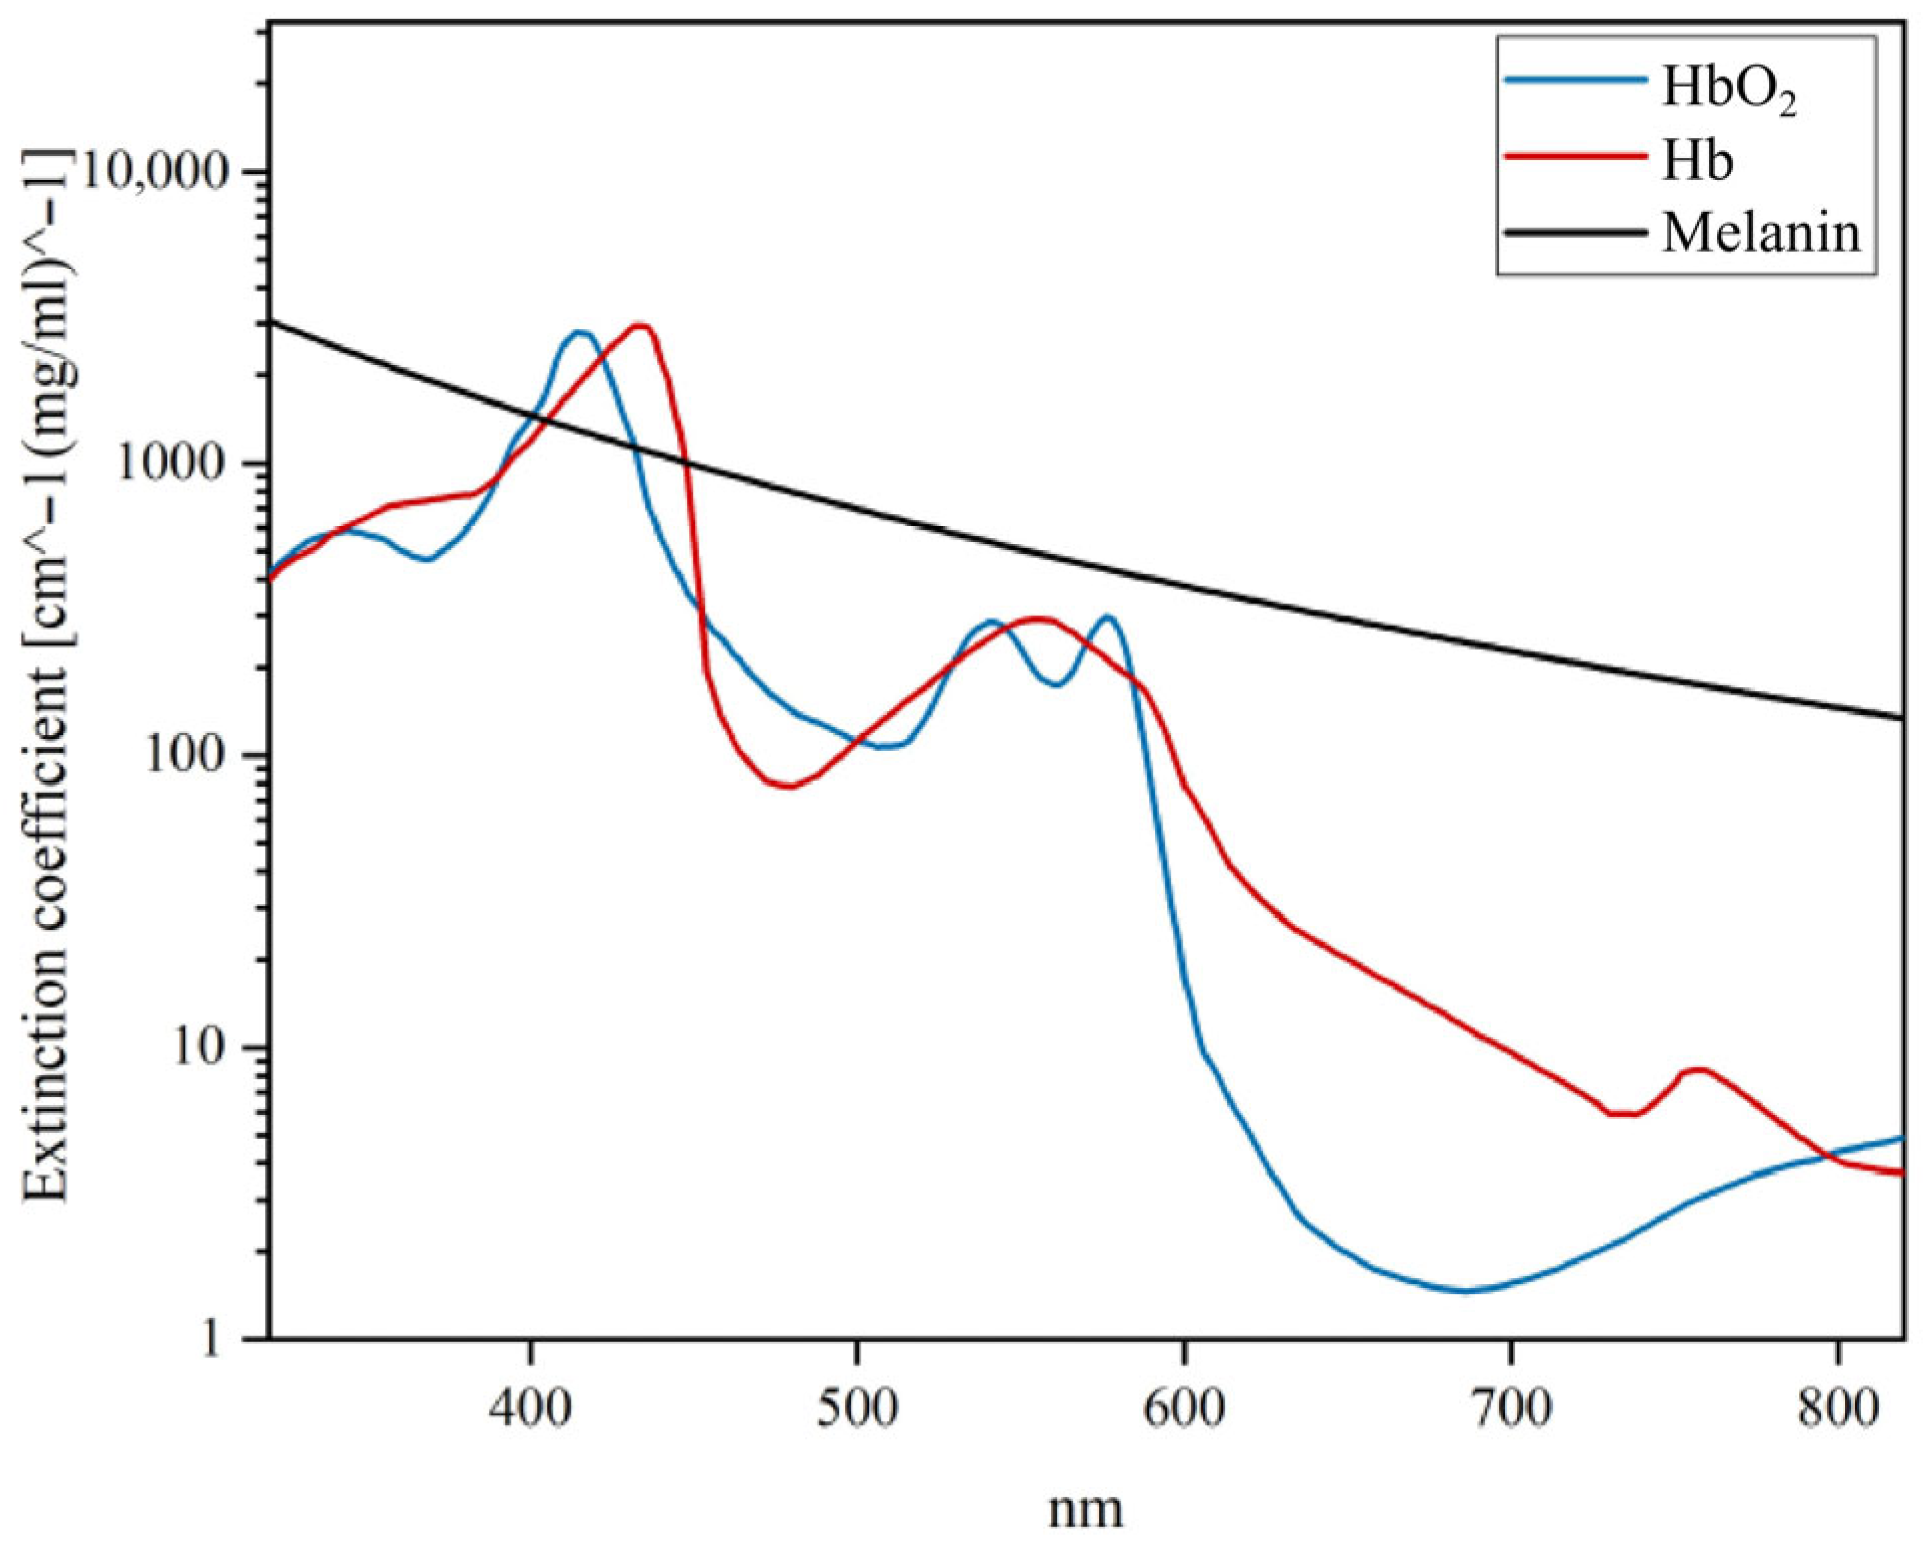
The major chromophores in human skin tissues are melanin, oxyhemoglobin (HbO2), and deoxyhemoglobin (Hb), and their absorbance in the range of 320–820 nm is shown in Figure 1 [25,26]. From Figure 1, it can be seen that oxygenated/deoxygenated hemoglobin absorbs mainly blue (400–430 nm) and green (525–575 nm) wavelengths, which is the reason for its red colour. The absorption peaks of oxyhemoglobin are at 405–415 nm, and deoxyhemoglobin is at 425–435 nm. Melanin demonstrates higher absorbance in the blue wavelength range, with absorbance decreasing as wavelength increases [27,28,29,30,31].
Figure 1.
Spectral absorption curves of major chromophores in the skin.
Acne is a chronic inflammatory skin disease of the follicular sebaceous gland units. Propionibacterium acnes in acne lesions synthesize large amounts of porphyrin derivatives under conditions of occlusion of the follicular opening, and porphyrins are the substances that are most strongly absorbed by blue light at 420–490 nm. The inflammation caused by acne also leads to high hemoglobin levels in the area of the lesions. Eczema is an inflammation of the superficial dermis and epidermis caused by a variety of internal and external factors. The lesions begin as erythematous papules and merge to form plaques, which may appear as crusts or scales. While the colour change in the plaque is a feature that can be measured multi-spectrally, the dilation of the capillaries of the plaque leads to a higher concentration of blood on the plaque, which correspondingly represents a higher concentration of hemoglobin blood.
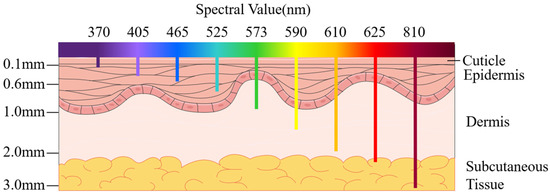
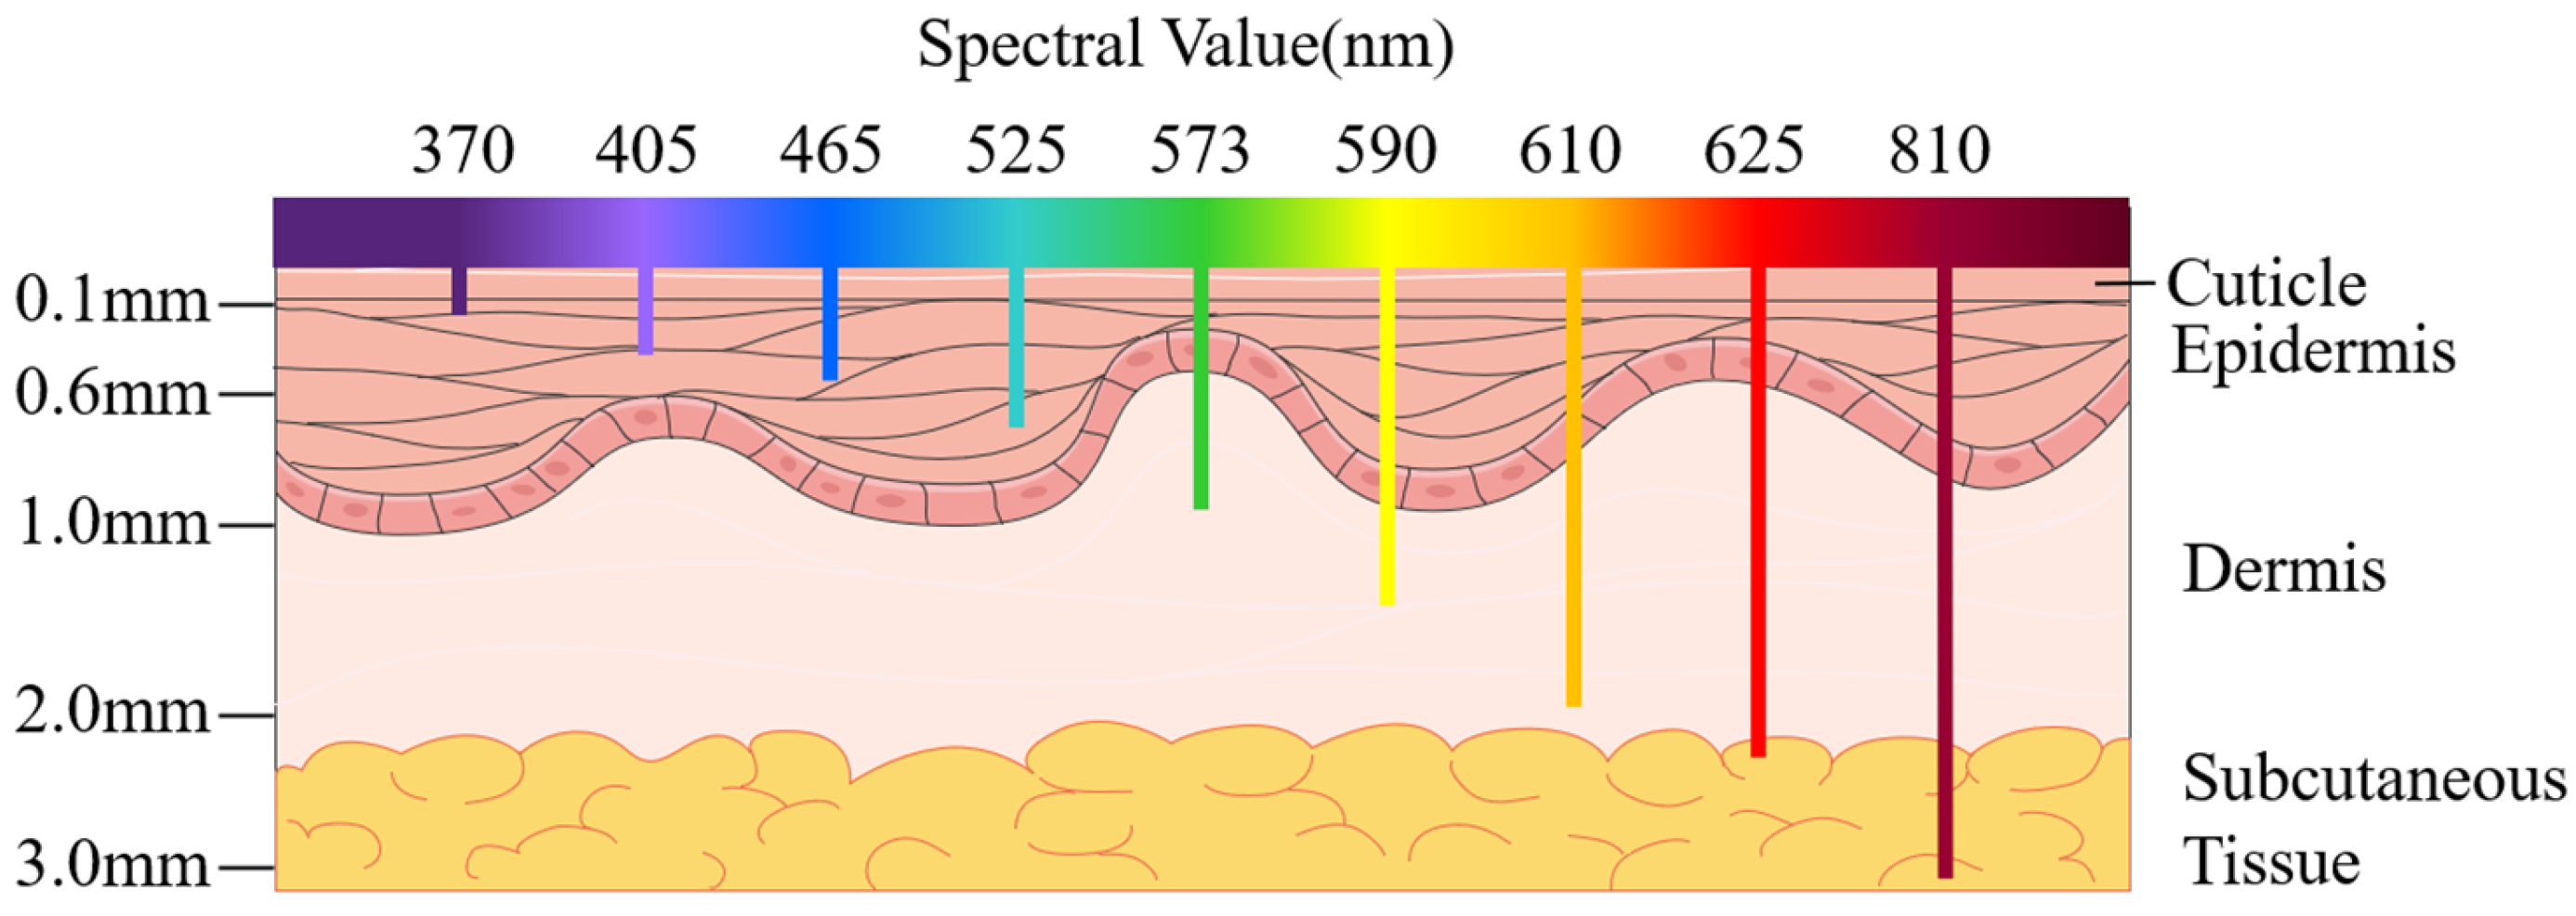
Combining the absorption spectra of each chromophore with the analysis of the spectral properties of typical skin diseases mentioned above, different wavelengths of light can be used to distinguish the characteristics of different skin diseases. Firstly, in the 350–410 nm wavelength band, due to the low light penetration ability, some changes in the skin surface can be revealed, such as pigmentation, epidermal keratinisation, and dermal vasodilatation. The 465–590 nm wavelength band can be used to differentiate between deoxygenated hemoglobin and oxyhemoglobin, in which hemoglobin shows two peaks of absorption, especially in the 400–470 nm band, and the absorbance of hemoglobin is higher than that of melanin. In this band, hemoglobin shows two absorption peaks, especially in the 400–470 nm band, where the absorbance of hemoglobin is higher than that of melanin, while the opposite is true in other bands. In the 610–625 nm band, there is already a big difference in the absorbance between hemoglobin and melanin, and hemoglobin absorbs much less than melanin, so it can be used to differentiate between some diseases that have an abnormal content of melanin. The penetration of light above 760 nm is further enhanced to reach the deeper layers of the skin, so that small changes in the subcutaneous tissue can be observed, which helps to detect skin diseases at an early stage. Figure 2 shows a comparison of the penetration of different wavelengths of light into skin tissue.
Figure 2.
Comparison of the penetration of different wavelengths of light into skin tissue.
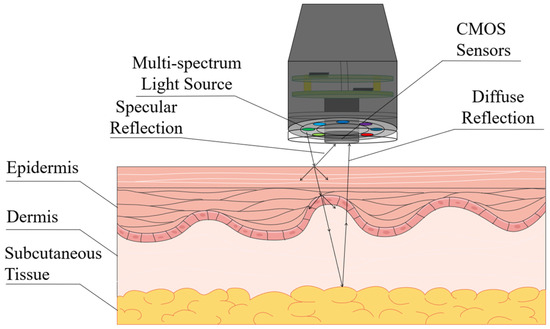
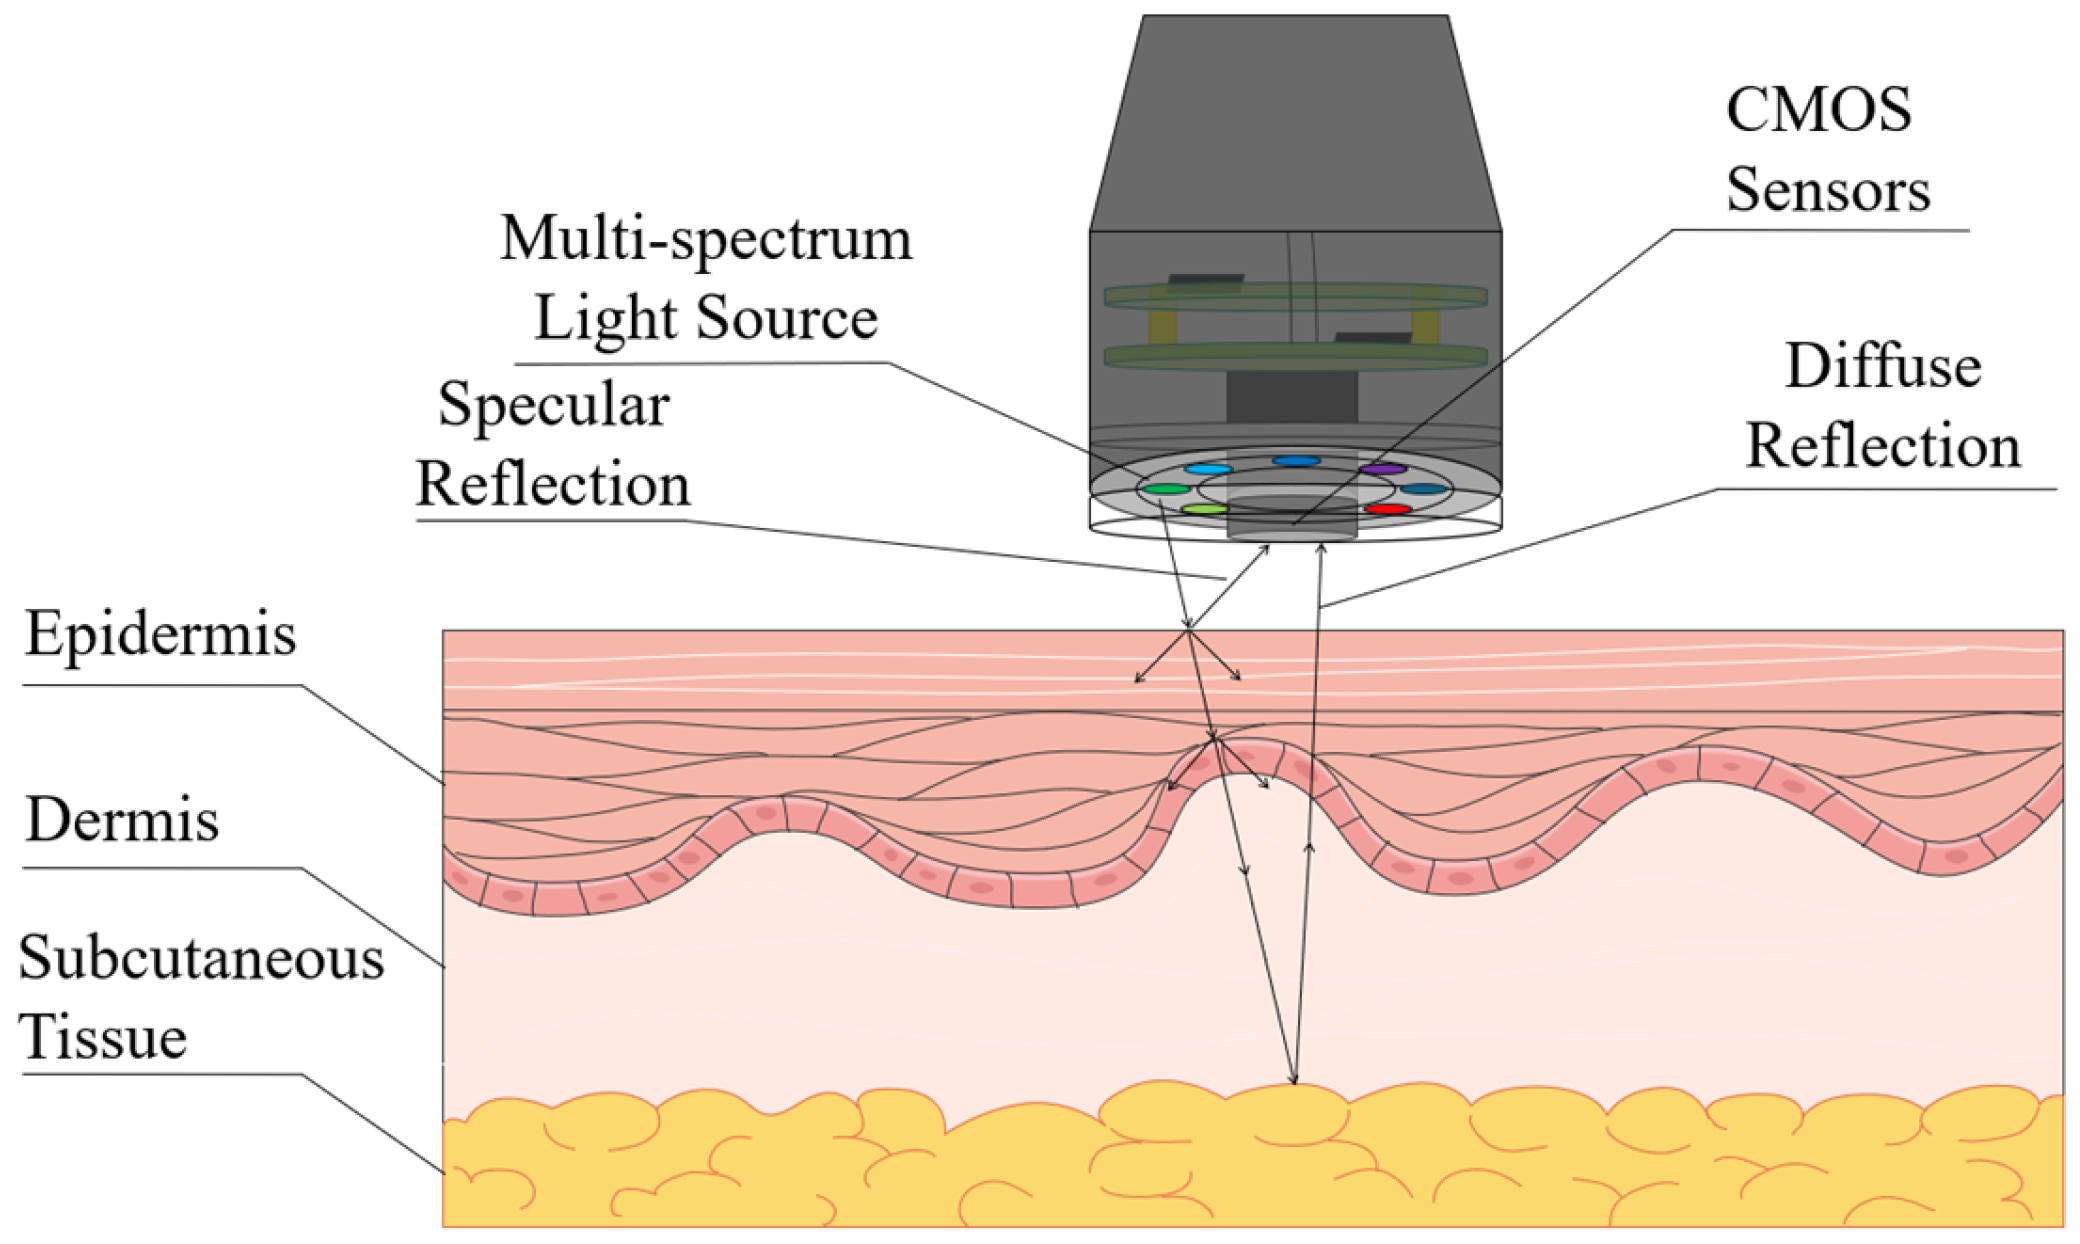
Although absorbance can be used to infer the presence and concentration of chromophores in tissues by determining the intensity of light absorption at different wavelengths, it is relatively limited in its information and does not directly reflect the internal structure and complex biological properties of tissues. In contrast, multi-spectral imaging technology, as illustrated in Figure 3, works by irradiating the skin with a multi-spectral light source consisting of a series of specific wavelengths of light, which allows the extraction of the diffuse reflectance spectra of the tissue structures and components that need to be detected. The conversion of the diffuse reflectance spectrum into absorbance can be correlated with the composition of the substance, and spectral properties such as the absorbance of the skin are importantly related to the physiological structure of the skin. The absorbance can be expressed in the image as image colour, contrast, texture, and brightness, so that different skin diseases can be distinguished according to the different image characteristics of the skin under multi-spectral imaging.
Figure 3.
Physical process of light transmission through the skin.
2.2. Hardware and Software Design of the Detection System
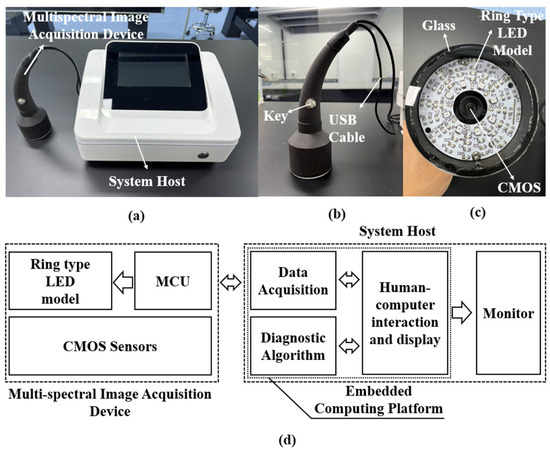
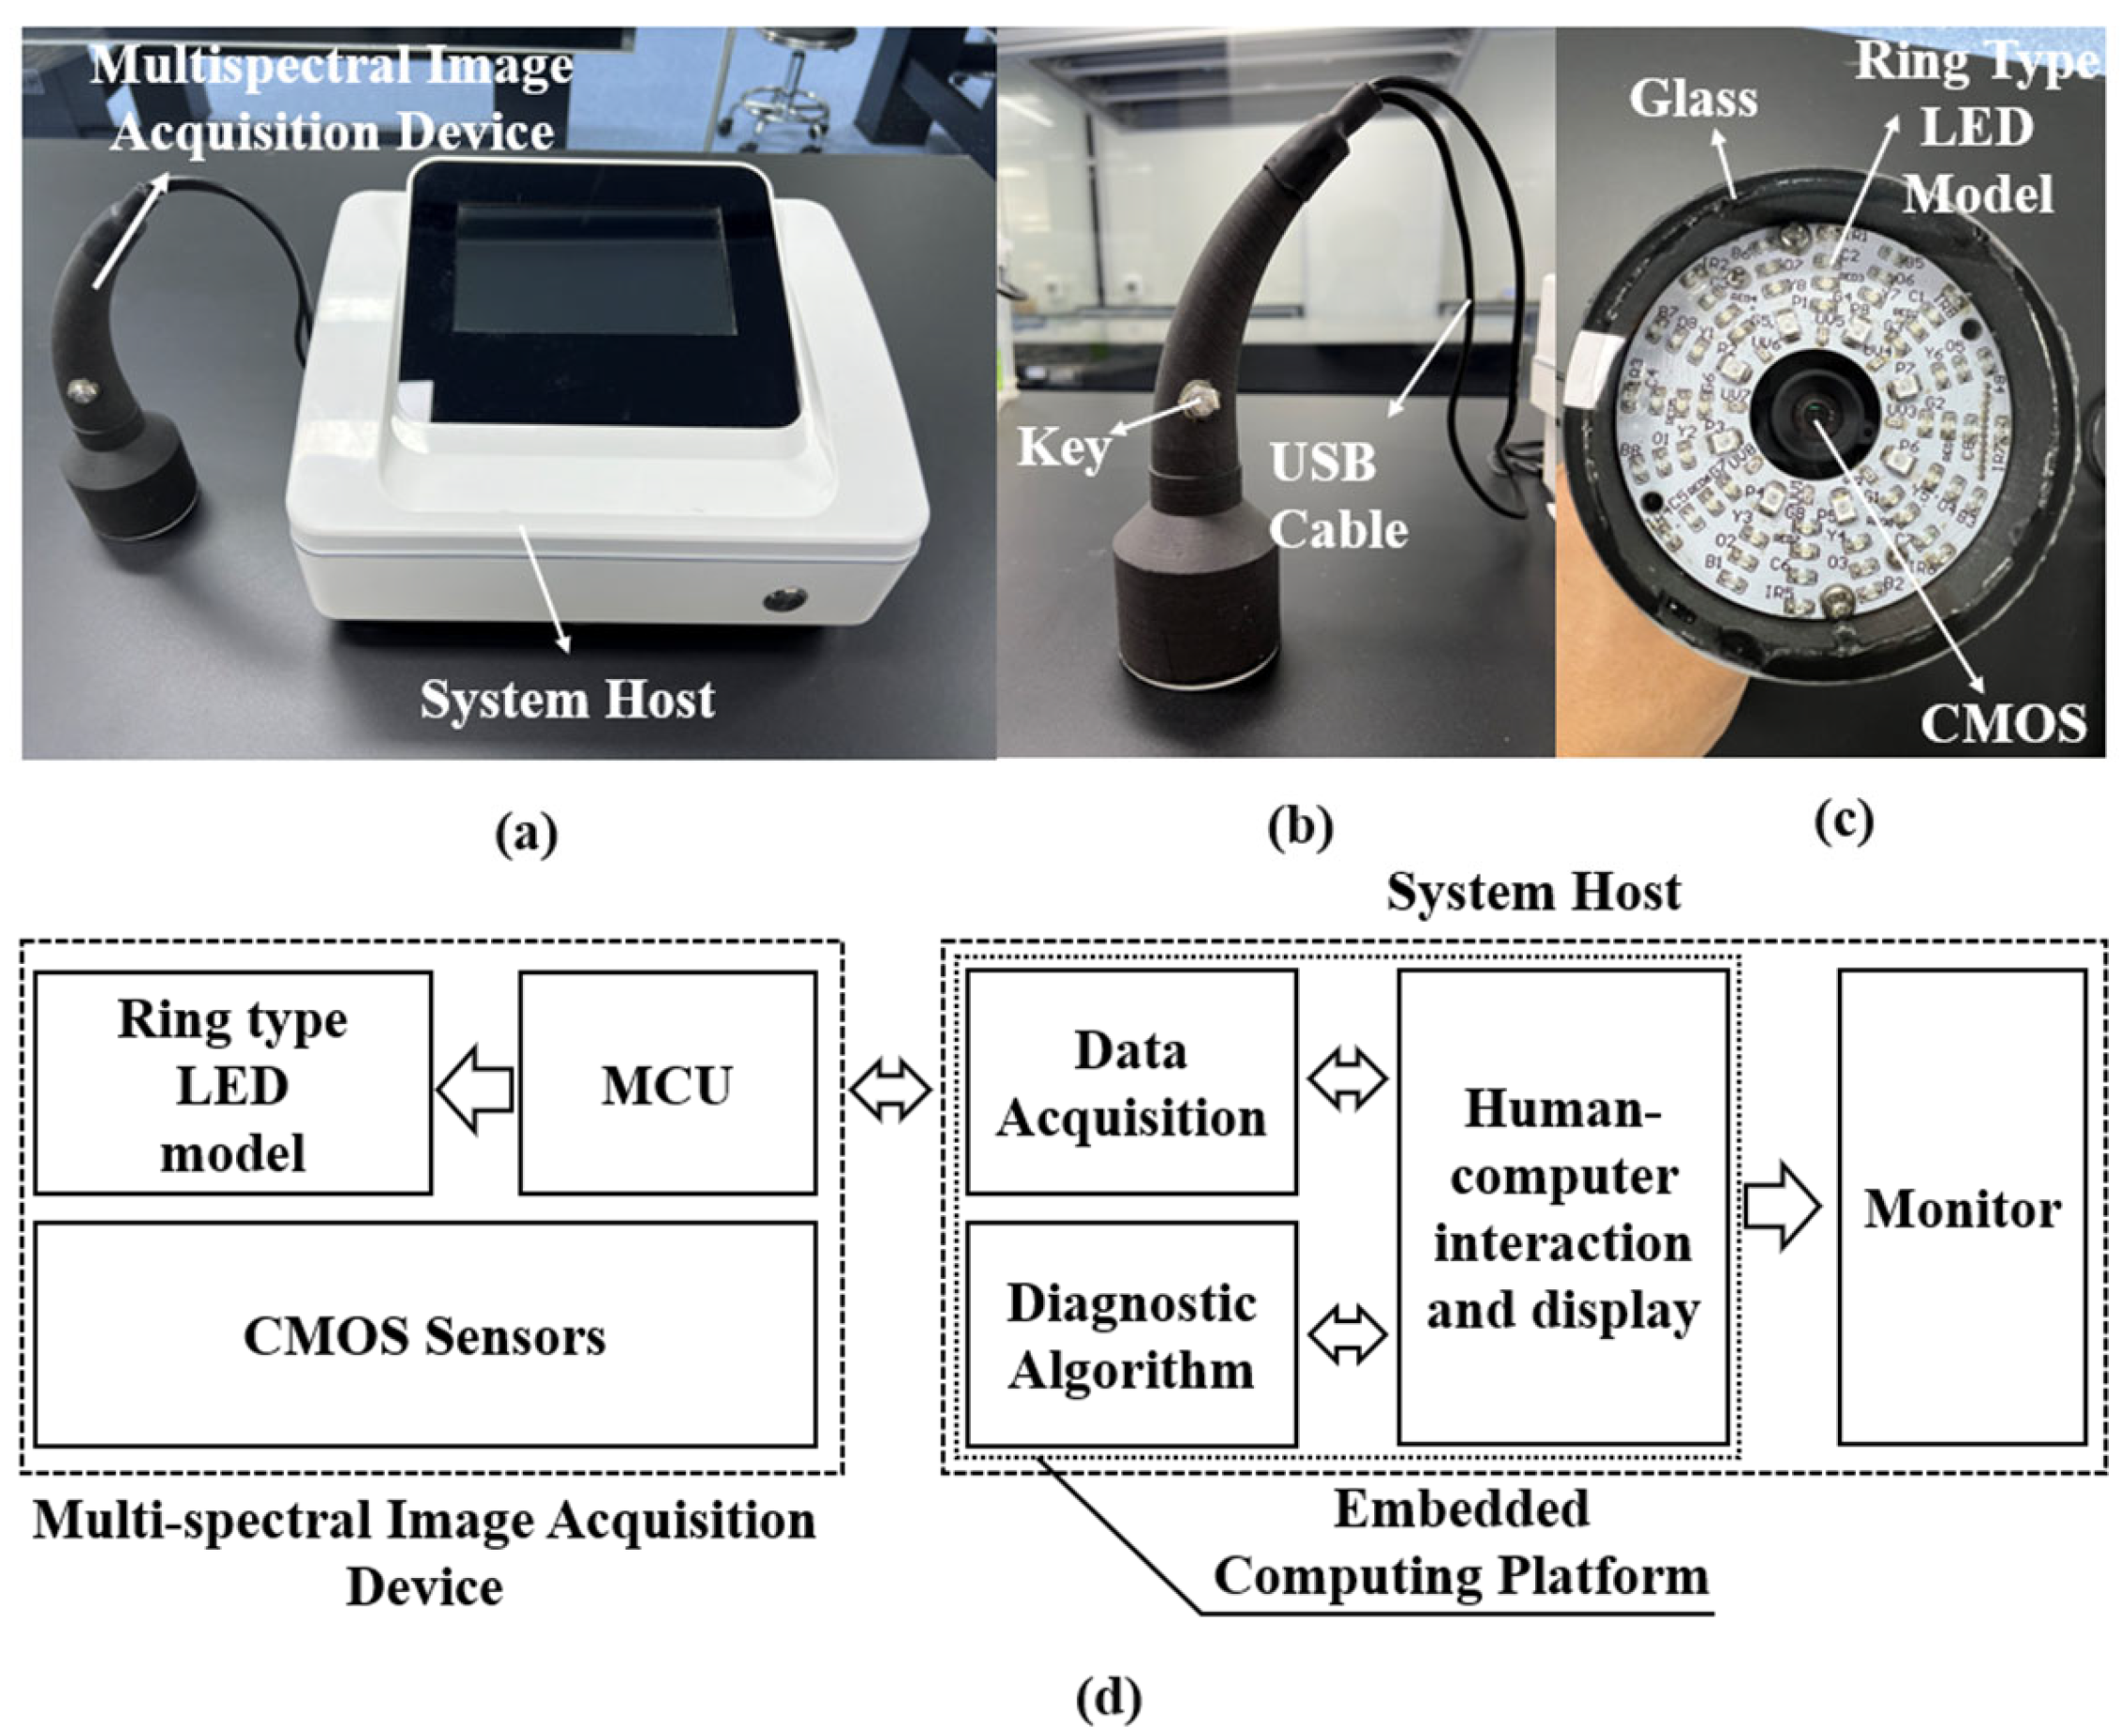
The proposed multi-spectral skin disease detection system, based on a multi-model multi-layer network framework, primarily consists of a multi-spectral image acquisition device and a system host. The image acquisition device comprises a circular multi-spectral light source module, a microprocessor module, and a CMOS image sensor module. The system host includes an embedded computing platform and a display unit. Host software running on the embedded platform integrates data acquisition, diagnostic algorithm execution, database, and display functionalities, presenting relevant information through the display interface.
The system workflow operates as follows: The host software controls the multi-spectral image acquisition device through the data acquisition module to capture multi-spectral images of skin lesions. The diagnostic algorithm is then invoked to predict disease probabilities, with results displayed on the software interface. This enables medical professionals to quickly and accurately interpret the findings and make informed diagnostic and treatment decisions. Figure 4 shows the block diagram and structure of the detection system.
Figure 4.
Multi-spectral skin diseases detection system based on multi-model multi-layer networks: (a) Overall block diagram of the system. (b) Overall physical drawing of the system. (c) Multi-spectral image acquisition device. (d) Light source surface of the multi-spectral image acquisition device.
Inside the multi-spectral image acquisition device, the microprocessor module, the CMOS image sensor module, and the multi-spectral light source are screwed together and integrated into a black, lightweight, handle-like enclosure made from 3D printing. A quartz glass with high light transmission is placed at the front of the handle to ensure a good fit between the handle and the lesion during image data acquisition. The microprocessor and CMOS sensor in the image acquisition device are connected to the host computer via USB ports for data transfer, functionality, and power supply. Figure 4b,c shows the structure of the multi-spectral image acquisition device.
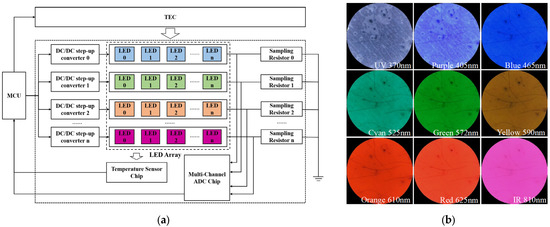
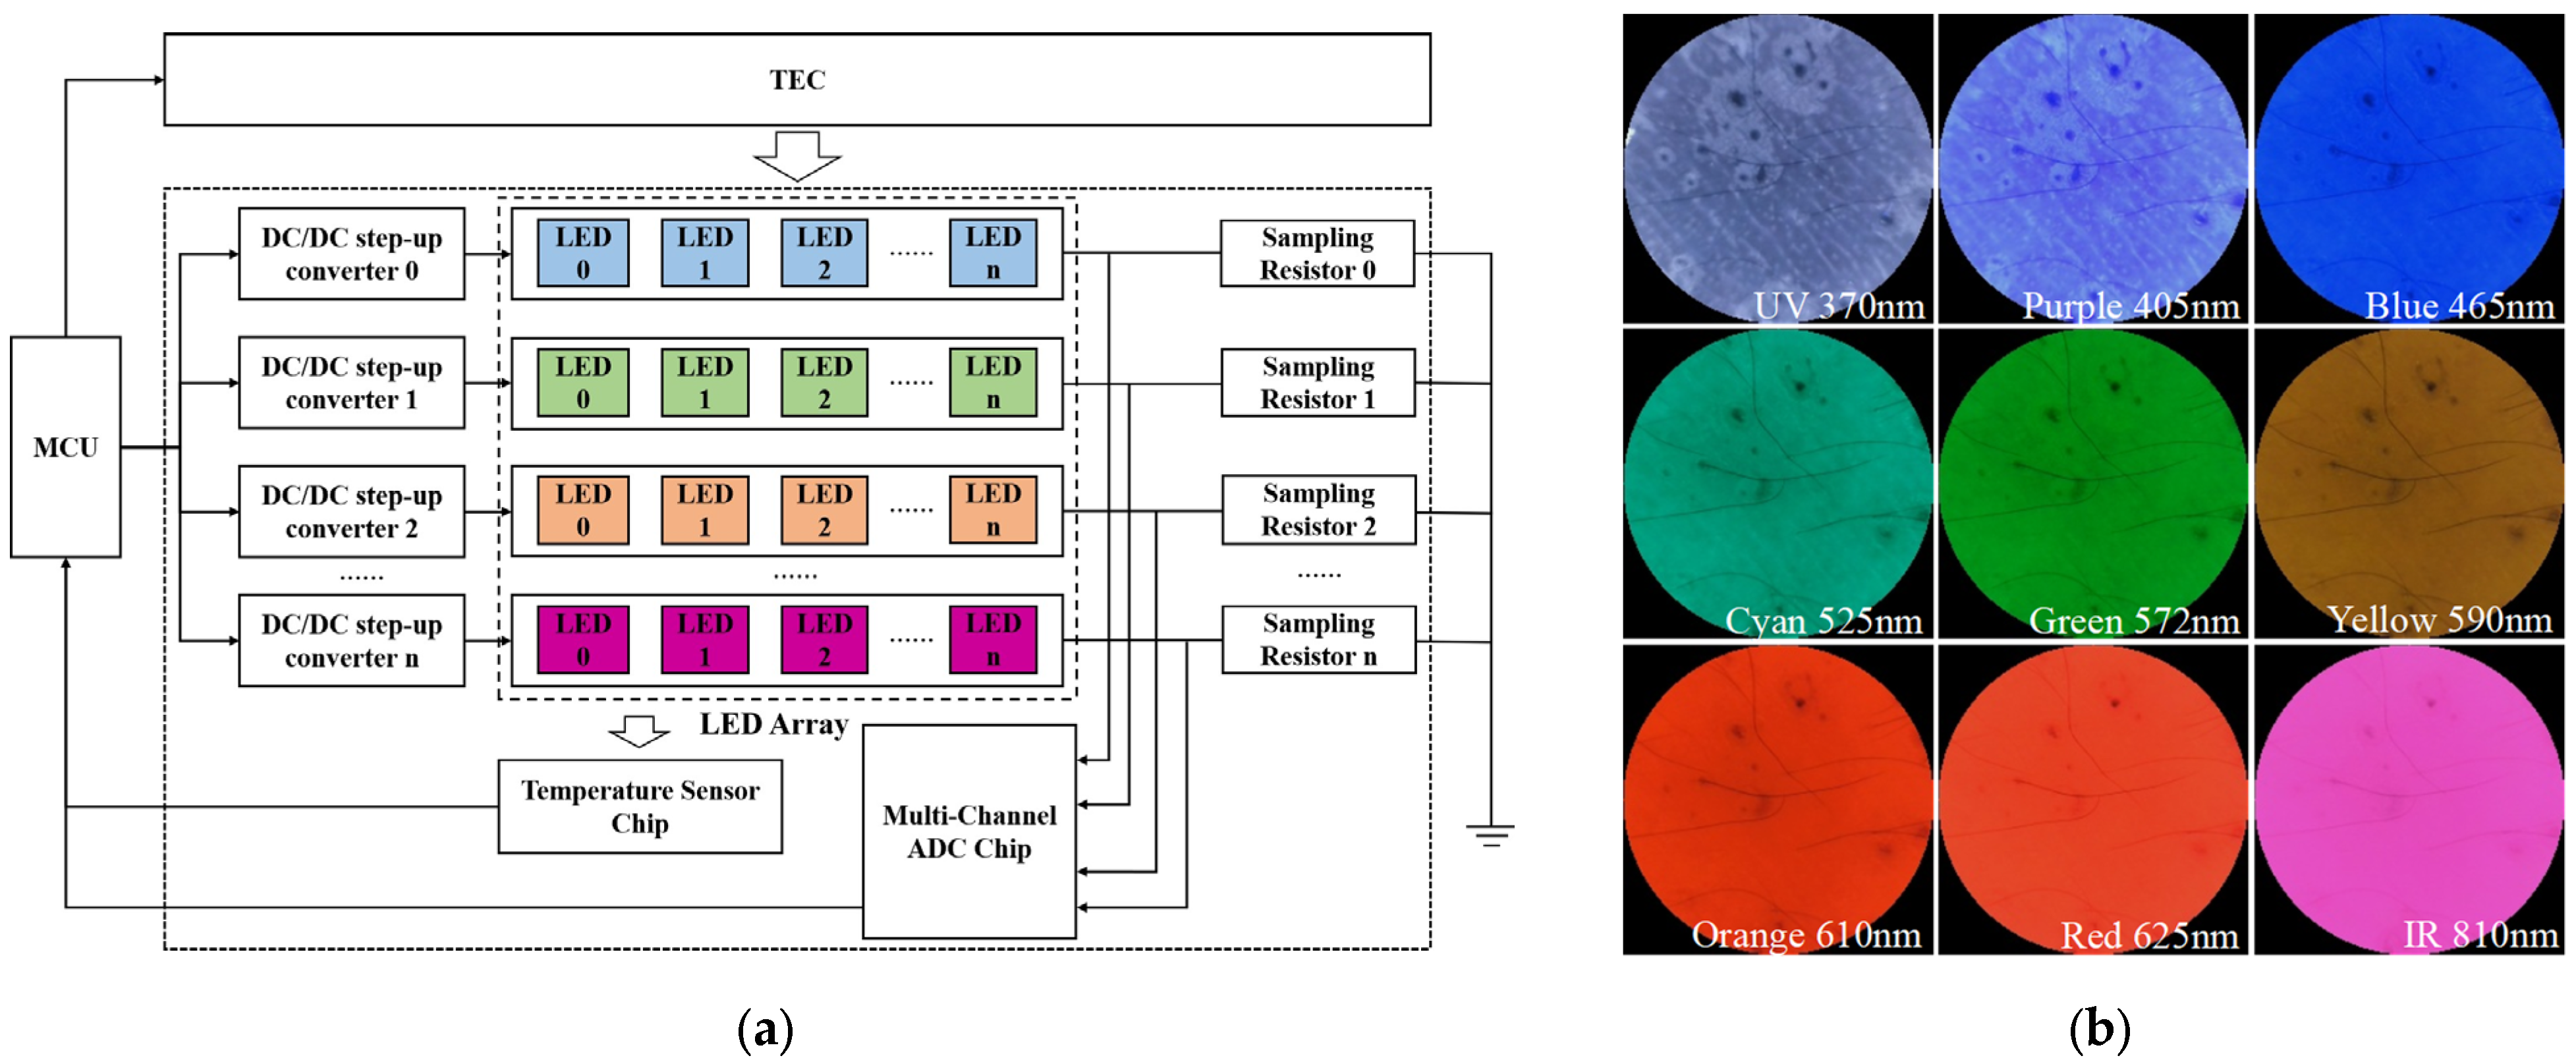
In multi-spectral imaging, the choice of wavelength is crucial. In this way, we choose LEDs with peak wavelengths of 370 nm, 405 nm, 465 nm, 525 nm, 573 nm, 590 nm, 610 nm, 625 nm, and 810 nm as the light source based on the above analysis of the absorption spectra of each chromophore and the spectral properties of typical skin diseases. Figure 4d demonstrates the design of the multi-spectral light source. The LED light sources of various wavelengths in the system are distributed in a ring shape, which enables the light sources of different spectra to irradiate the skin uniformly at a reasonable angle. Each light source contains 8 LEDs, which are individually controlled by a constant-current driver chip to achieve independent control of DC (Direct Current) dimming for each light source. The LEDs of different wavelengths within the multi-spectral light source are concentrically arranged from the inner to the outer ring. Due to the inherent differences in the electro-optical conversion efficiency of each LED, there are inherent differences in their luminous intensity at different wavelengths. To address this issue, each LED group in the system light source module is independently controlled by a precise constant current drive circuit. During system initialization, the image of a standard diffuse reflection white target is first captured. Based on this reference image, the microprocessor adjusts the drive current of each group of LEDs at different wavelengths (via PWM duty cycle) through a feedback loop. This calibration ensures that the grey-scale response of each wavelength on the CMOS sensor reaches a preset uniform level, thereby achieving the standardization of spectral irradiance. Additionally, a precision sampling resistor in each drive circuit continuously monitors the LED current, and the corresponding voltage is amplified and read by the microprocessor to form a closed-loop control system. Figure 5a shows the circuit schematic of the multi-spectral light source drive module. This mechanism actively maintains a stable drive current, thereby ensuring consistent illumination output under all working conditions. Figure 5b presents typical multi-spectral images captured at nine wavelengths.
Figure 5.
(a) Circuit schematic of the multi-spectral light source driver module; (b) Exemplary multi-spectral images captured at nine wavelengths.
The system uses a Sony IMX415 CMOS sensor (Sony Group Corporation, Tokyo, Japan) with 8.5 million pixels for image acquisition. Its spectral response range covers 400 to 1000 nanometers. According to the spectral response curve provided in the manual, the relative response at a wavelength of 370 nanometers is approximately 0.3. At the specified imaging distance, the system’s spatial resolution can reach about 5.56 µm per pixel, mapping a 12 mm diameter field of view onto a 2160-pixel diameter imaging area. The system operates in a time-sequential imaging mode, with nine groups of LEDs being illuminated in a preset sequence, and the CMOS sensor is triggered synchronously for image capture. The exposure and storage time for a single-wavelength image is 120 milliseconds, and the total time required to complete the acquisition of all nine spectral bands is approximately 1 s, fully meeting the timeliness requirements for static clinical examinations. The host computer uses the NVIDIA Jetson Nano platform (NVIDIA Corporation, Santa Clara, CA, USA), which is a low-cost mobile deep intelligence computing platform with parallel computing acceleration capability.
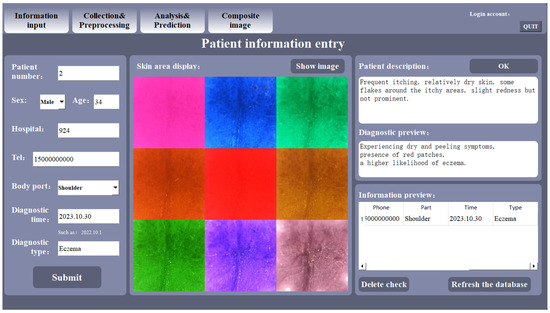
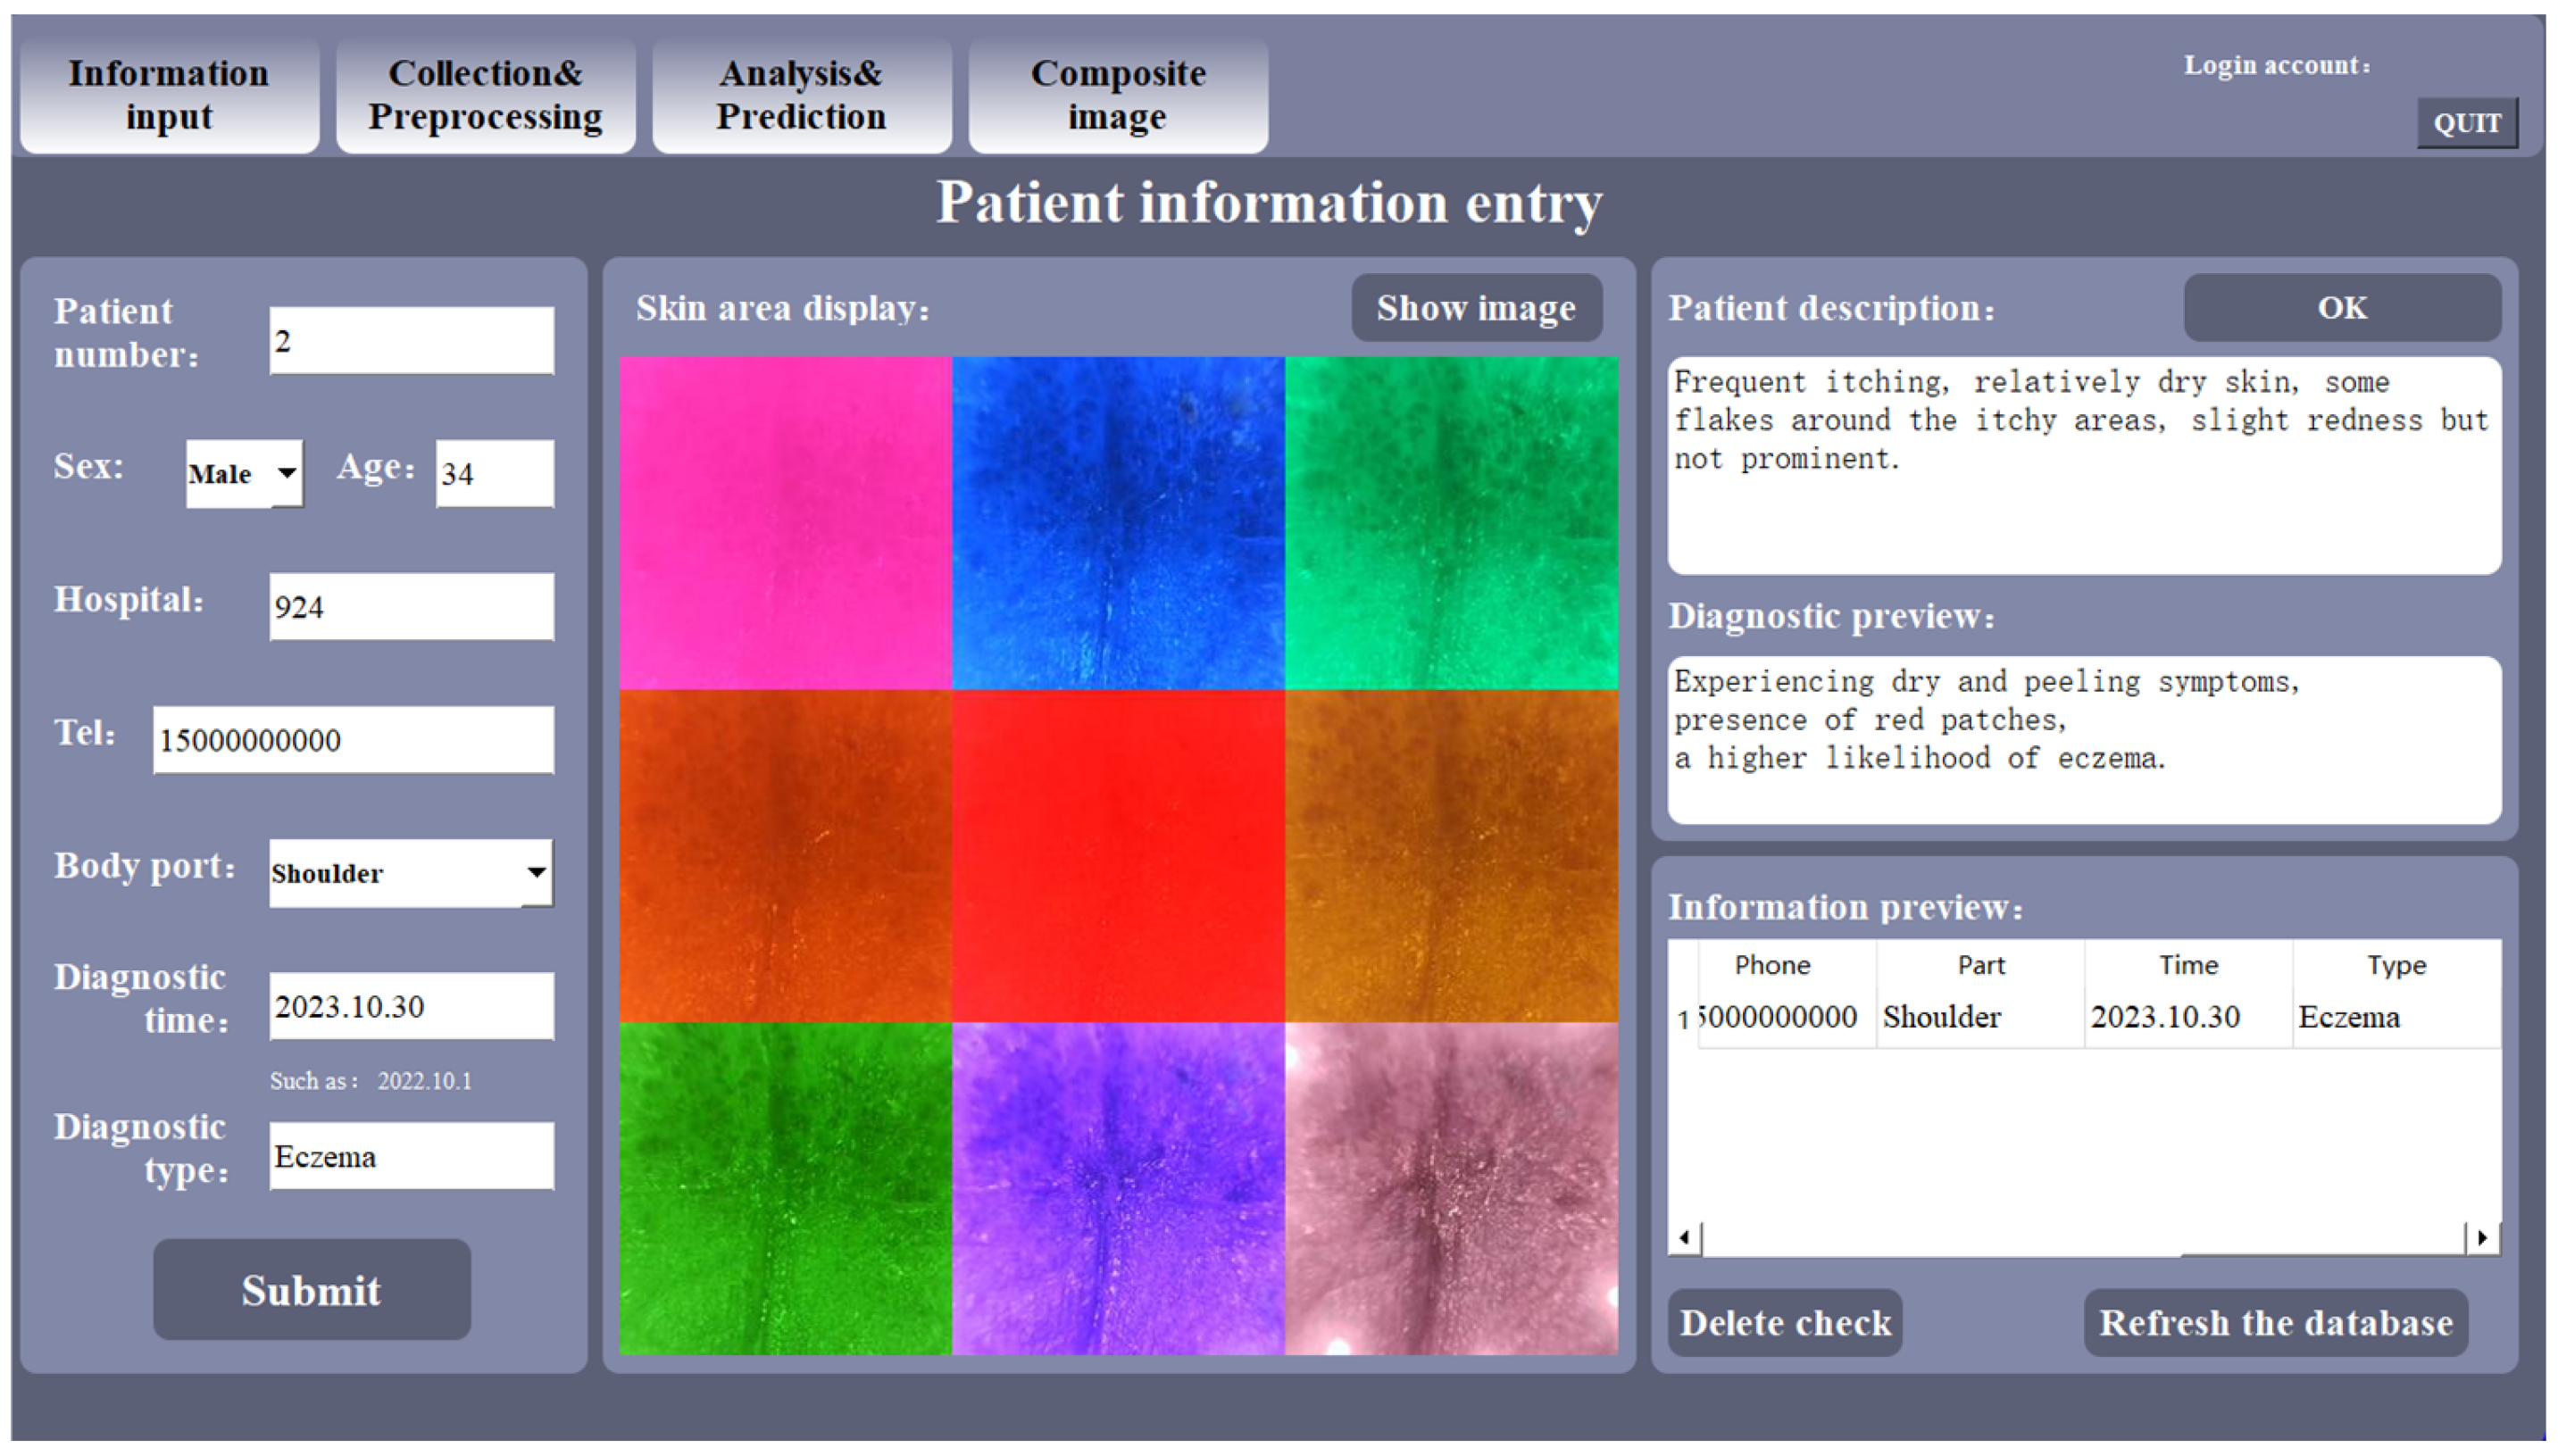
To enhance the operational efficiency of the detector in clinical settings and to enable effective management and analysis of the skin disease database, our research group developed the host software. This application was built using Python 3.9 with a Qt 5.15.2-based graphical interface and runs on the host computer. Its core functionalities encompass patient information entry, multi-spectral image acquisition, and disease diagnosis. Furthermore, the software leverages the embedded NVIDIA Jetson platform’s acceleration APIs to expedite image preprocessing tasks. The main interface of the host software is presented in Figure 6.
Figure 6.
Graphical user interface (GUI) of the host software.
Image Acquisition and Calibration
Data acquisition was conducted in a darkroom to minimize ambient light interference. During imaging, the optical glass window of the acquisition device was placed in close contact with the skin to form a sealed light path, and a disposable film was applied to the window and discarded after each use. Before each acquisition, a dark-field image was captured with all light sources off for subsequent correction. Additionally, a standard white reference tile with known reflectance was imaged before each experiment to obtain a reference image for calibration. This computation serves as a normalization procedure, which removes the effects of dark current and ambient light, and projects the image data into a relative reflectance space, ensuring comparability across measurements taken at different times.
2.3. Detection of Skin Diseases Based on Multi-Model Multi-Layer Network Fusion Classification Algorithm
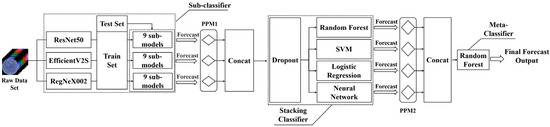
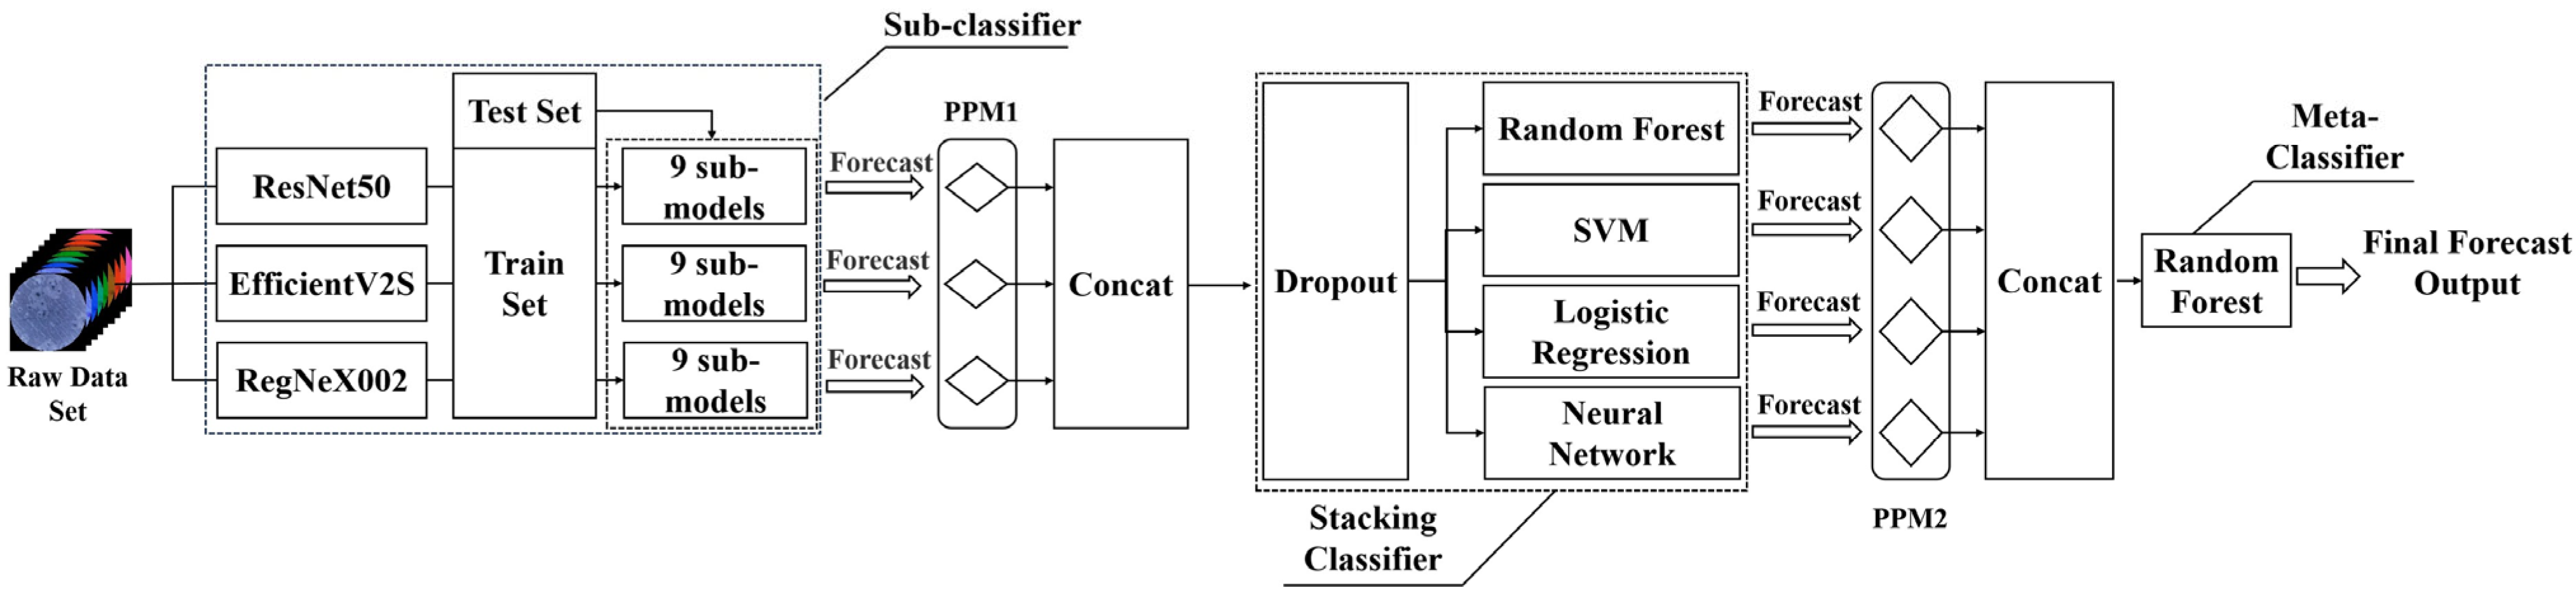
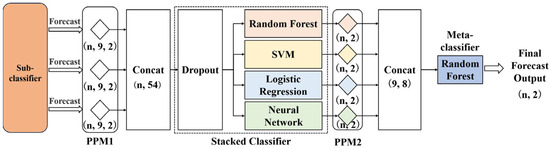
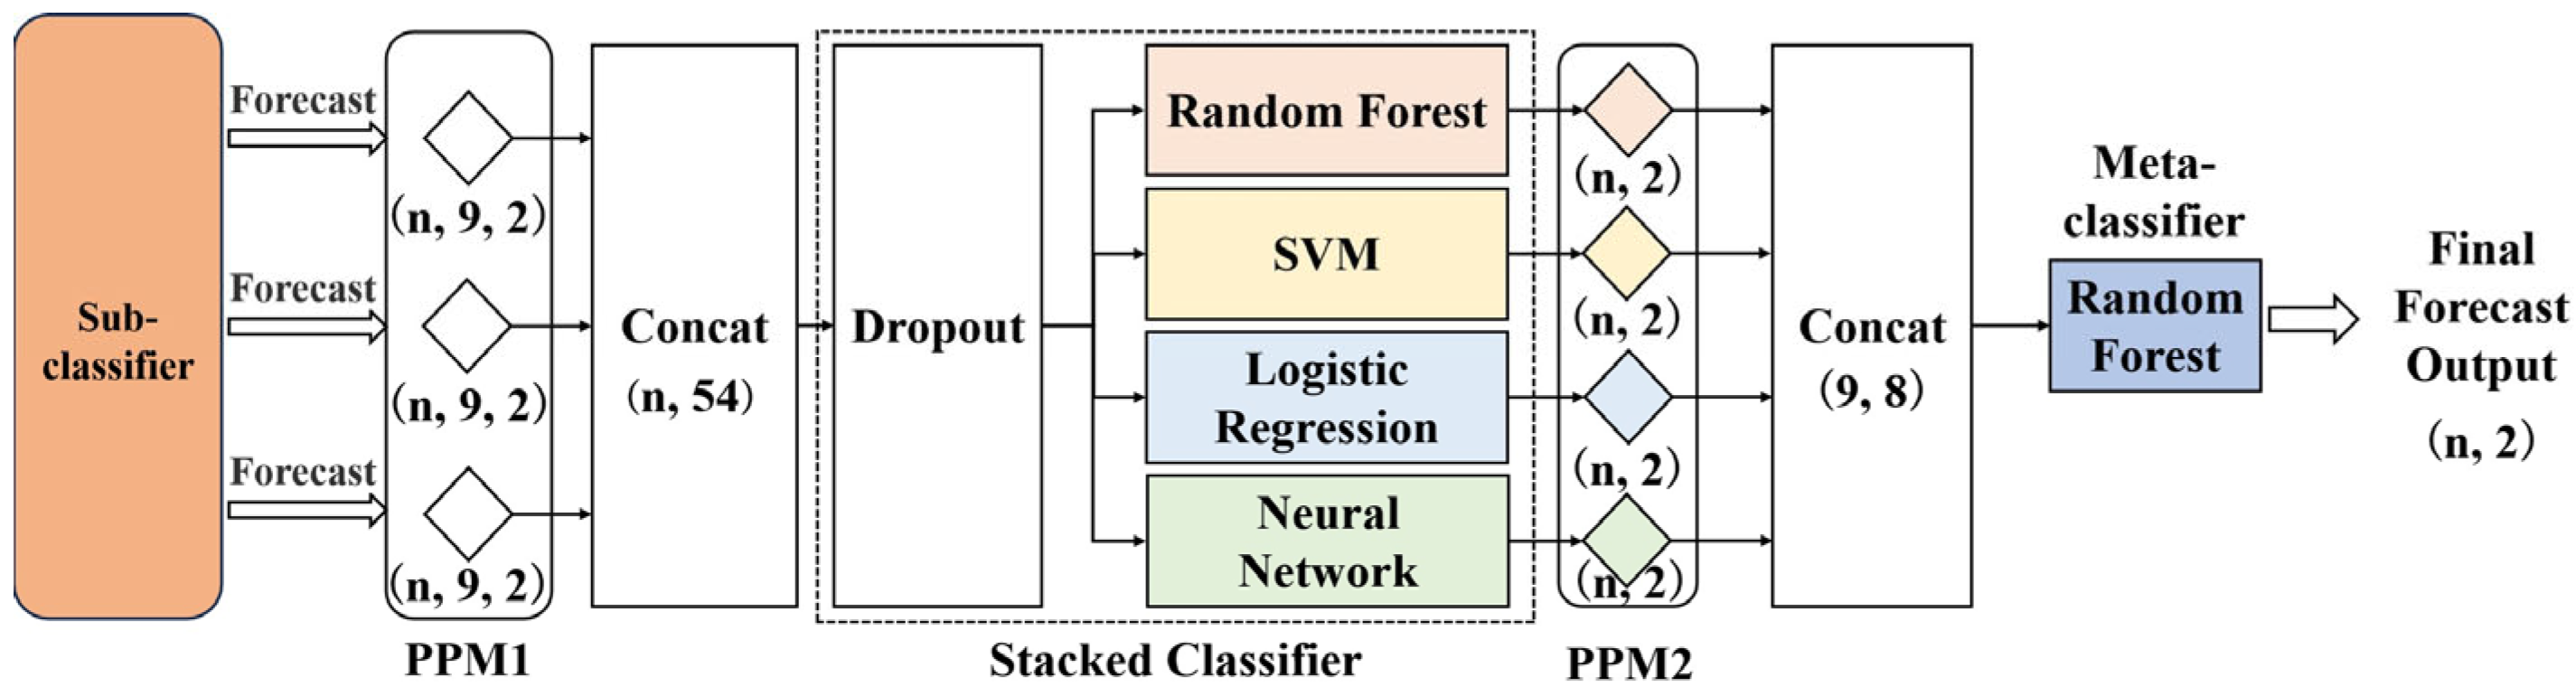
Assisted diagnostic algorithms for skin diseases are a central part of the detection system, and most of the existing research focuses on improving the final diagnostic accuracy. For disease diagnosis algorithms, the interpretability of the model is equally crucial. Therefore, we propose a skin disease classification algorithm based on multi-model multi-layer network fusion. The algorithm is centred on interpretability and achieves classification and diagnosis of skin diseases through three levels of classification: sub-classifier, stacked classifier, and meta-classifier. In the sub-classifier, multiple pre-trained deep CNN architectures are first used for migration learning, and each wavelength in the original multi-spectral data is trained independently in order to train multiple first-level sub-models. After inferring the initial prediction probabilities under each wavelength sub-model, the prediction probability matrices of each sub-model under each CNN architecture are concatenated and fed into the stacked classifier for training to obtain the second prediction result. This prediction result is then sent to the final meta-classifier to obtain the final classification result. The block diagram of the algorithm is shown in Figure 7.
Figure 7.
Architecture of the multi-model multi-layer network fusion algorithm.
2.3.1. Sub-Classifier
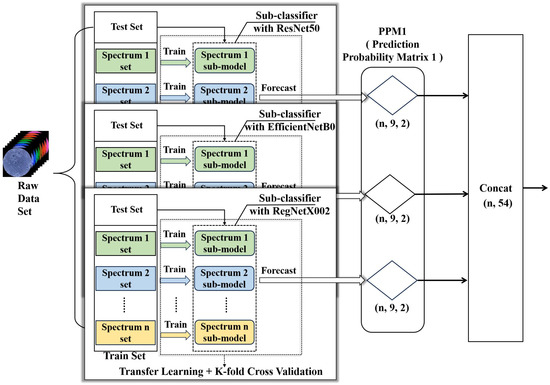
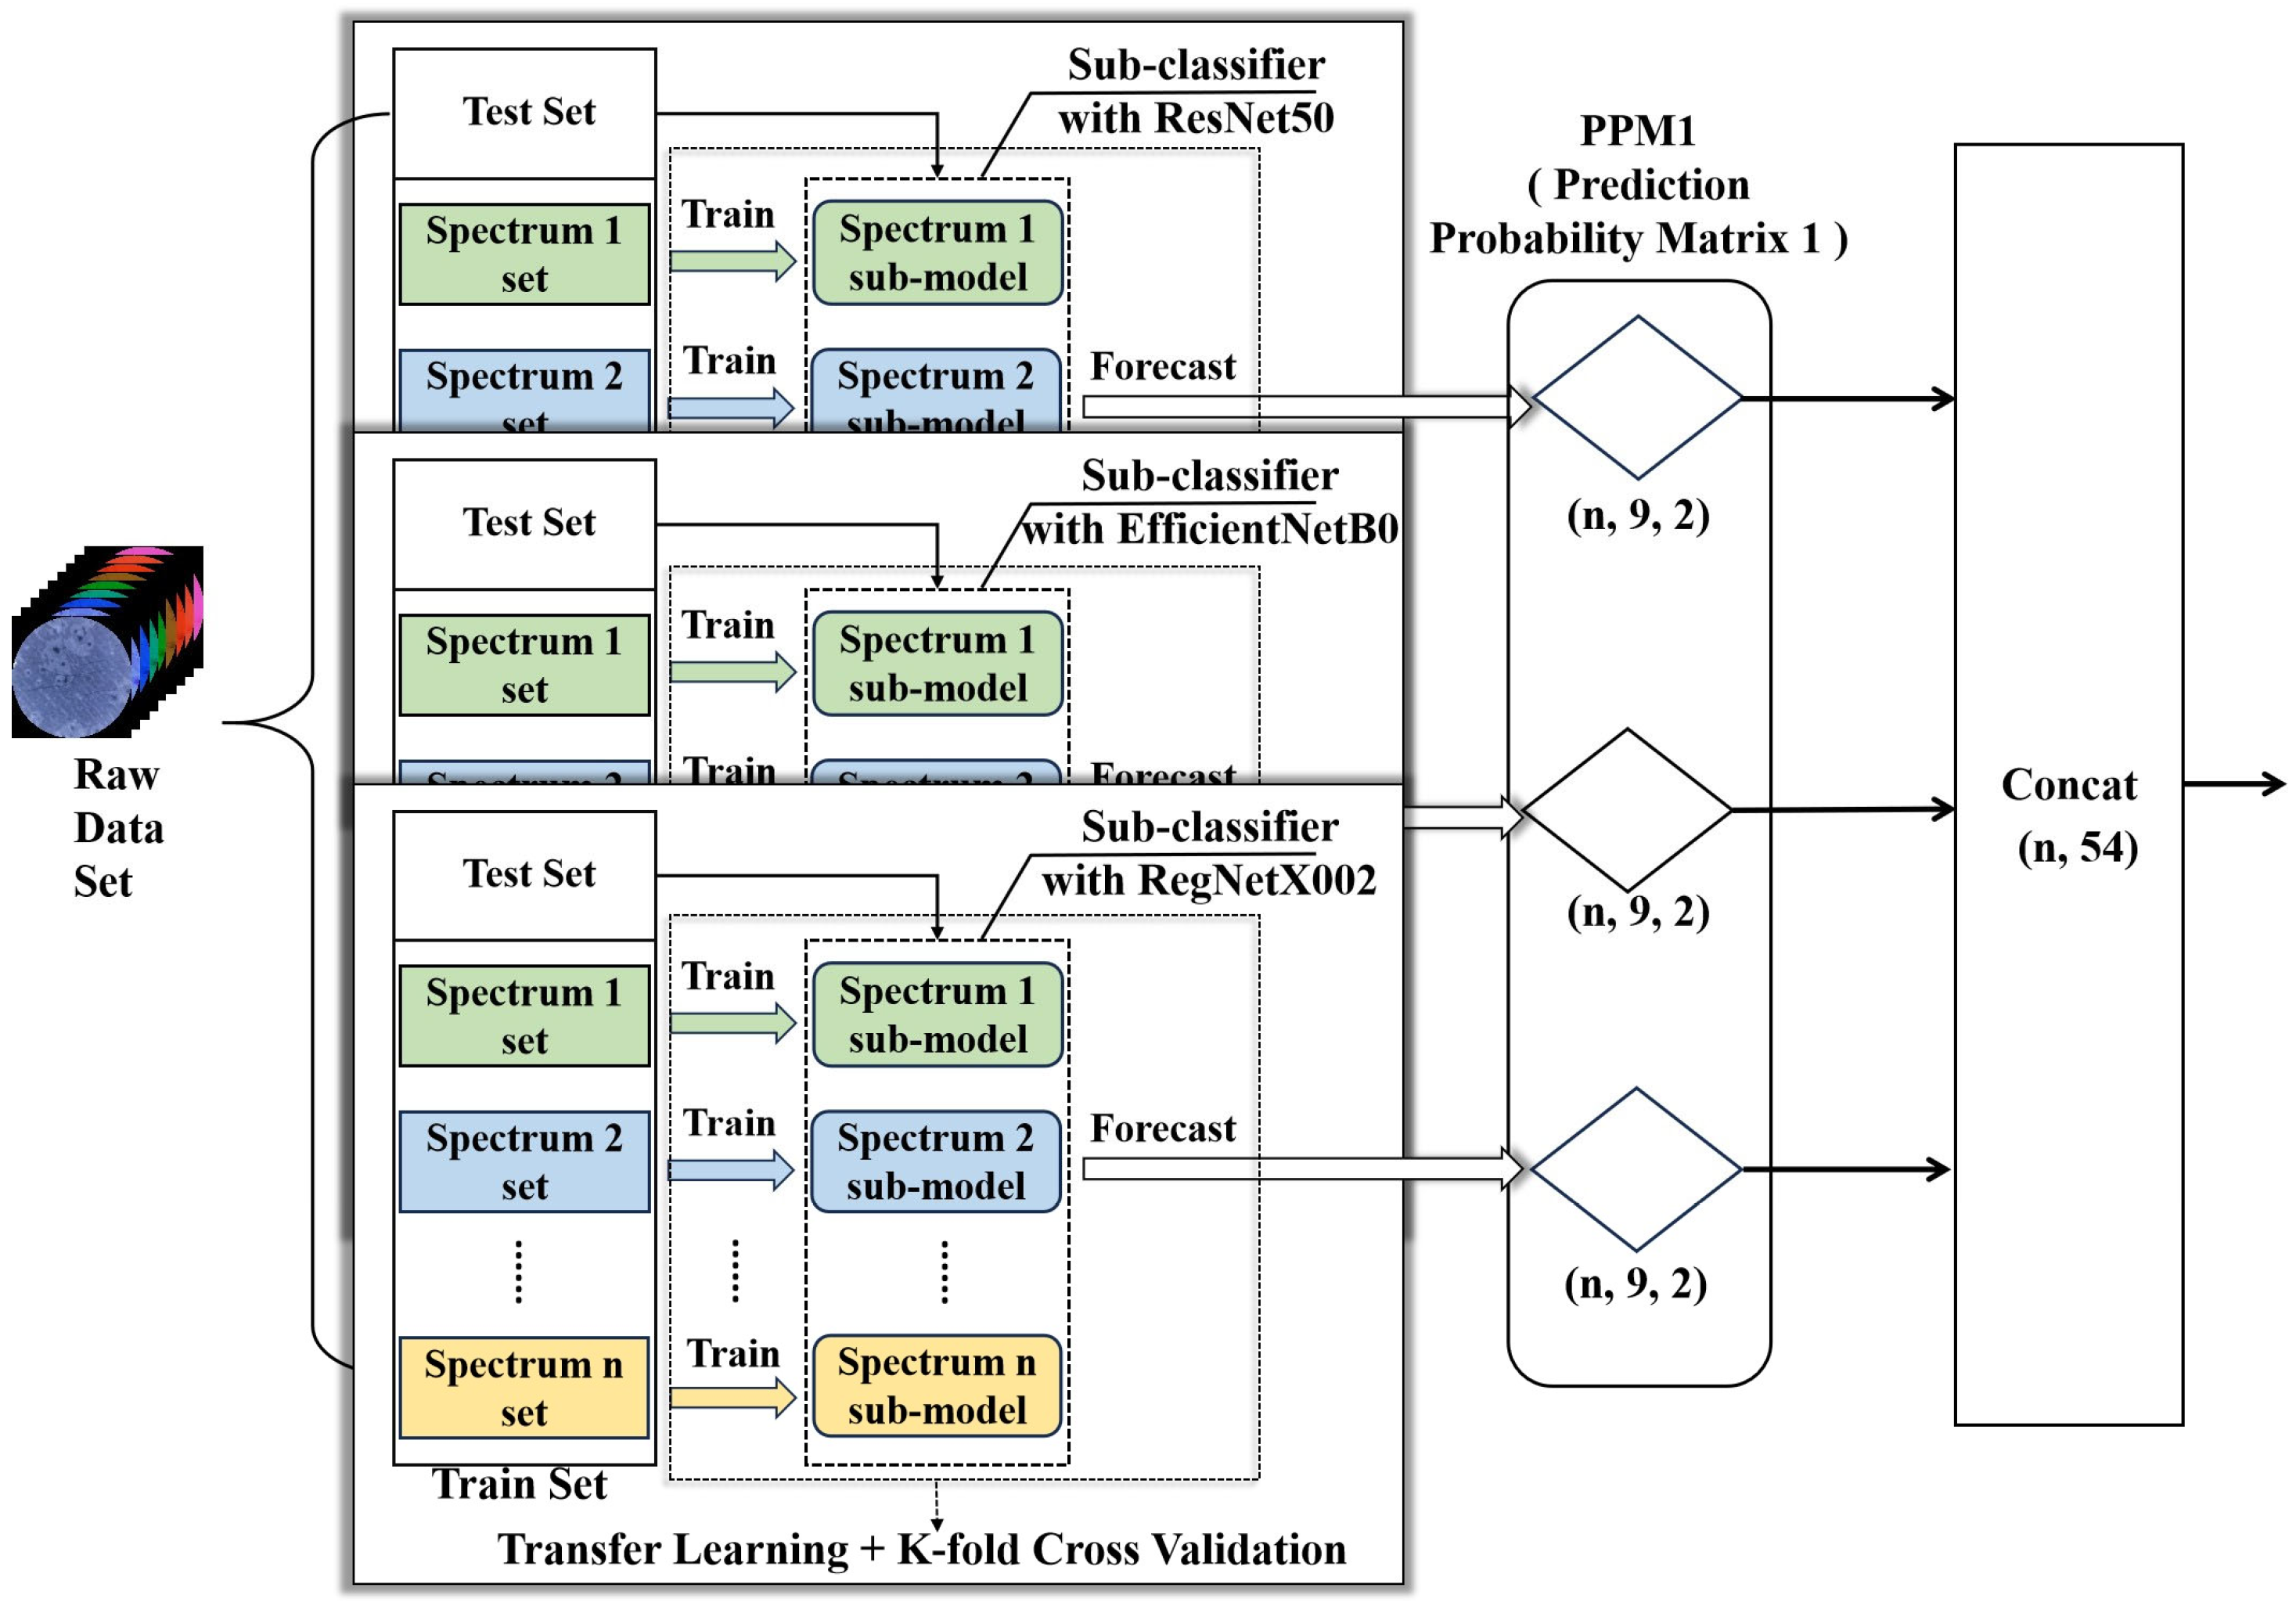
In order to make effective use of the unique diffuse reflection information at each wavelength, the advantages of multi-spectral images are fully utilized. In the sub-classifier construction process, an independent dataset is created by taking the data obtained from each wavelength of light and training independent sub-models for each wavelength to better capture the features of skin diseases at specific wavelengths. Pre-trained models are also used for fine-tuning. First, the output layer of the original pre-trained model is redefined to match the current classification task, and then transfer learning is conducted. Usually, during the fine-tuning process, some parameters of the source model are frozen, and its last layer or several layers are replaced with new ones to introduce an output layer that meets the requirements of the target task. Through the fine-tuning method, the problem of insufficient or different data distribution of the target task can be overcome, thereby achieving better performance on small samples or unconventional data. The fine-tuning method can also reduce training time and resource costs, and improve the efficiency and practicality of the model. K-fold cross-validation is used in the learning process to solve the data imbalance and overfitting problem. In order to improve the model diagnostic prediction capability and to obtain the best performance on low-computing-power embedded devices, three different lightweight CNN architectures (ResNet50 [32], EfficientNetB0 [33,34], and RegNetX002 [35]) are used for the simultaneous construction of sub-classifiers. The principle of the sub-classifiers is shown in Figure 8.
Figure 8.
Schematic of the wavelength-specific sub-classifiers within the three CNN architectures.
In skin disease image analysis, different deep learning model architectures have different tendencies for feature extraction. ResNet50 demonstrates excellent feature extraction and generalization ability and is well-suited for capturing fine-grained features including texture, colour, and shape in dermatological images. These features are critical for distinguishing clinically similar conditions such as acne and eczema. RegNetX002 features high scalability and robustness, enabling efficient extraction of multi-scale local and global features from dermatological images. Based on its Compound Scaling mechanism, EfficientNetB0 achieves an optimal balance between performance and efficiency through balanced optimization of network depth, width, and input resolution. This architecture can extract hierarchical features ranging from low-level edges and contours to high-level semantic information in dermatological images with relatively few parameters and low computational cost.
The integration of these three architectures ensures that the fused model maintains a strong feature extraction capability while balancing overall efficiency and sensitivity to multi-scale pathological features. This integration enhances the comprehensive discriminative power and deployment feasibility of the model from both computational efficiency and feature richness perspectives. Feature outputs derived from multiple architectures can clarify the decision-making basis of the model, thus improving its interpretability.
In the sub-classifier section, as shown in Figure 8, the K-fold cross-validation training is first conducted for each wavelength sub-model under the three architectures of ResNet50, EfficientNetB0, and RegNetX002, respectively, to obtain the prediction result matrix 1 (PPM1).
Among them, PPM1 (n, 9, 2), where n represents the number of samples, 9 represents the output of sub-classifiers at 9 wavelengths, and 2 represents the two categories of eczema and acne. The purpose of the sub-classifiers is to obtain richer and unique feature representations from the multi-spectral data at various wavelengths. The purpose of the stacking and meta-classifiers is to comprehensively analyze the features output by the sub-classifiers and extract information that is more helpful for decision-making. Therefore, before the data enters the stacking classifier and meta-classifier, the matrices are concatenated first. The concatenation operation connects the category prediction probabilities at different wavelengths together.
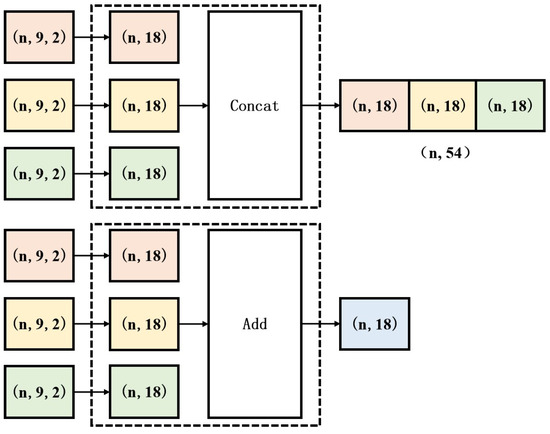
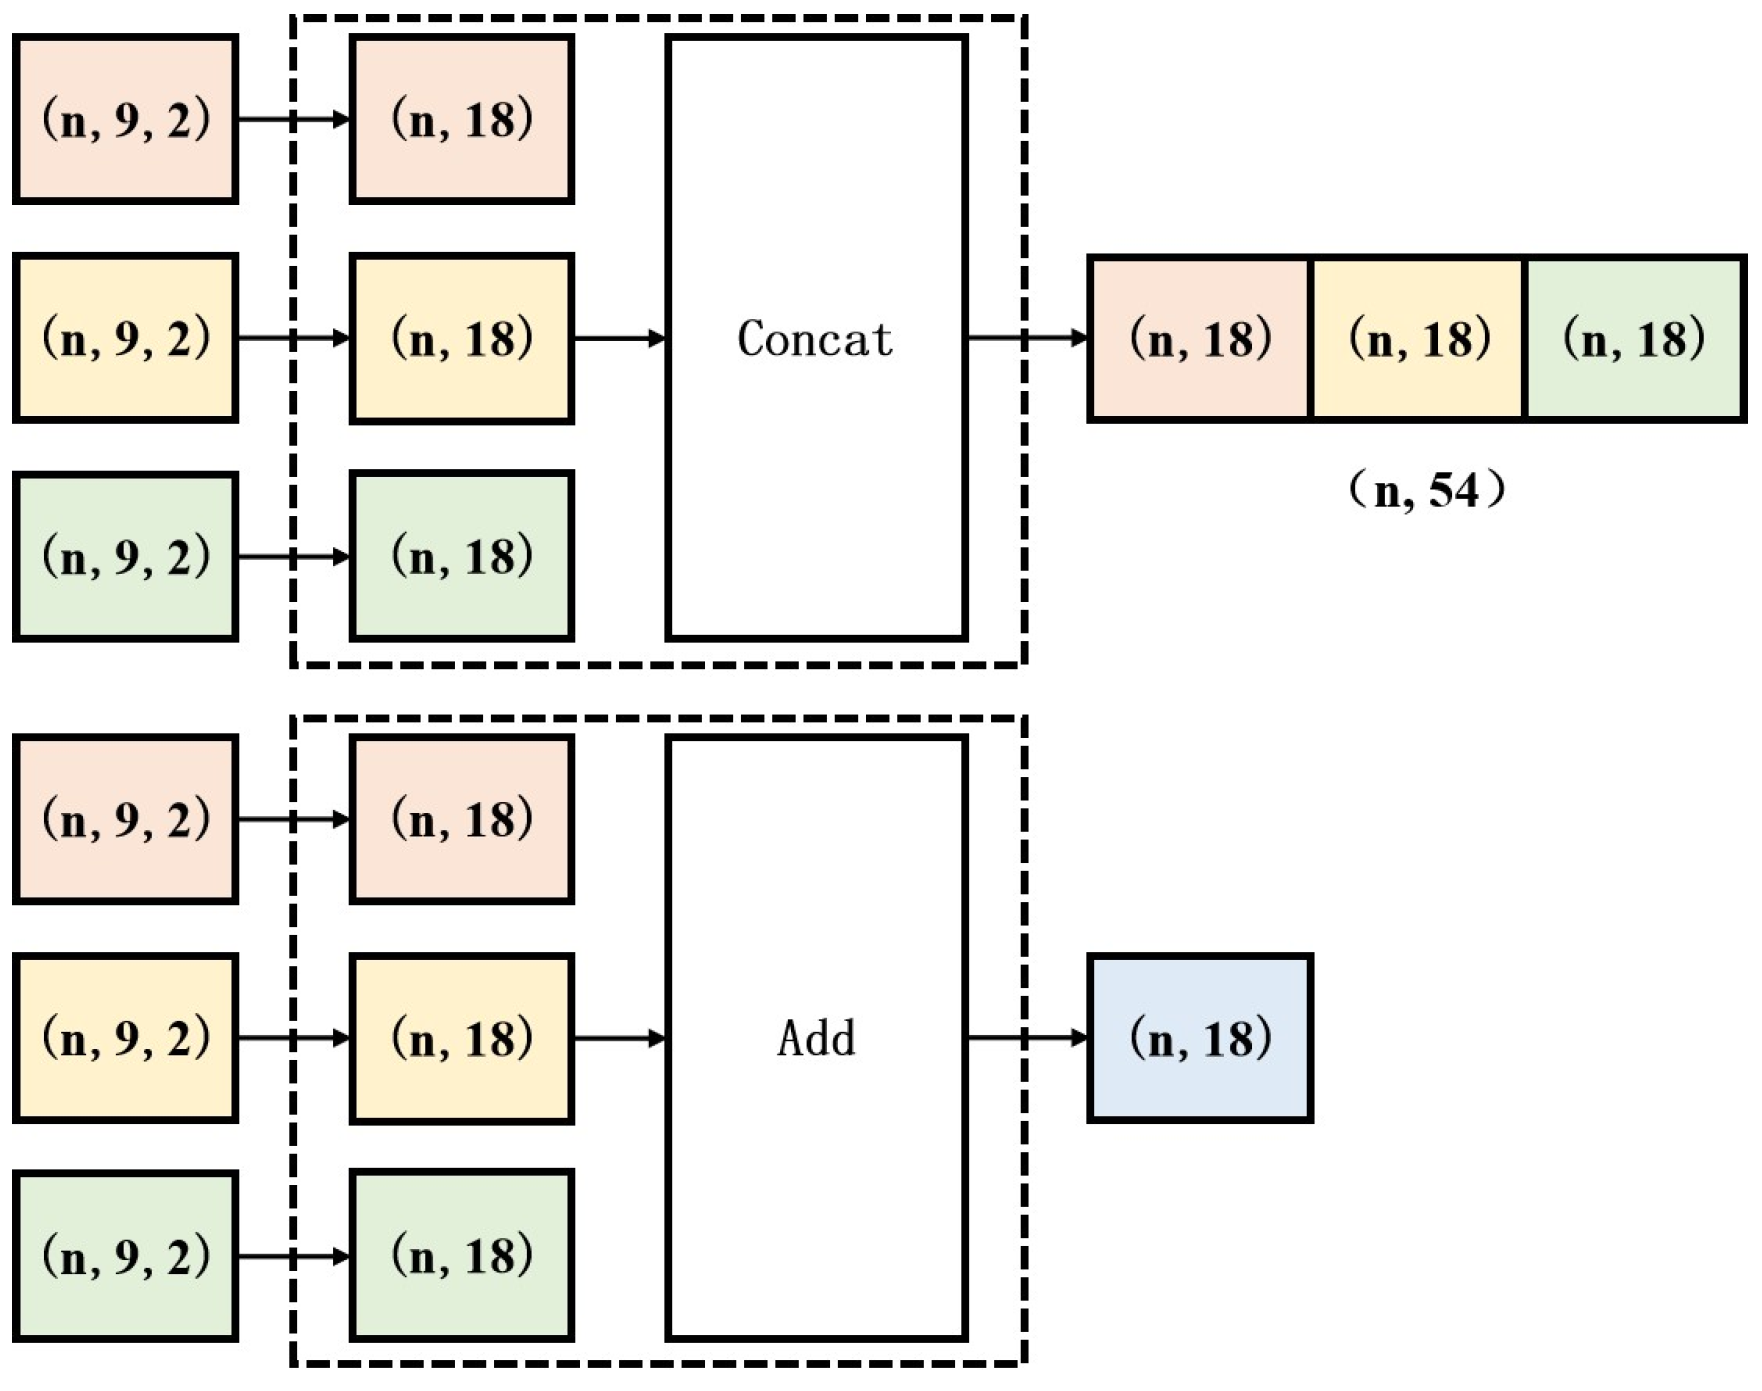
Compared with matrix addition, the concatenation module can preserve the independent information of each sub-classifier when connecting matrices, ensuring that all key features are fully considered. This feature is particularly important for exploring the significance of different dimensions or features, as the output of each sub-classifier may reflect the correlation between different wavelengths in the data. Secondly, matrix concatenation can enhance the transparency of the model, allowing us to more clearly understand the contribution of each sub-classifier to the final output, thereby enhancing the model’s interpretability. Additionally, matrix concatenation can effectively reduce the impact of the output deviation of a single sub-classifier on the overall model, improving the model’s robustness. Figure 9 shows a schematic diagram of the principles of matrix concatenation and matrix addition.
Figure 9.
Schematic diagram illustrating the principles of matrix concatenation and addition.
2.3.2. Stacked Classifier and Meta-Classifier
Then, as shown in Figure 10, PPM1 is concatenated to build a new training dataset. Subsequently, the new dataset is processed through a Dropout layer with a hyperparameter of 0.2. Dropout is a regularization technique, and a hyperparameter of 0.2 indicates that during the training process, it will randomly drop 20% of the neurons in the network, thereby reducing the interdependence among neurons to prevent overfitting and encouraging the subsequent network to learn more robust features. The dataset processed by the Dropout layer is first used to train the stacked classifier. The training of the stacked classifier also employs the K-fold cross-validation method. The prediction results of all sub-models on each validation fold are used to train the meta-classifier in the last layer to obtain the final classification result.
Figure 10.
Schematic diagram of stacked classifiers and meta-classifiers.
The design concept of stacked classifiers and meta-classifiers is similar to that of sub-classifiers. They extract various features and patterns of metadata through sub-models and use them to train the meta-classifier model. Among them, random forest, Support Vector Machine (SVM), Logistic Regression, and neural network are used as sub-models of the stacked classifier, and random forest is used as the model of the meta-classifier. Among the four classifiers, Logistic Regression and Support Vector Machine are linear classifiers, while random forests and neural networks are non-linear classifiers. Linear classifiers are simple and easy to implement, and have high computational efficiency, but they have high requirements for data distribution. Non-linear classifiers, on the other hand, can capture complex relationships in the data, but they are prone to overfitting and have complex models. By stacking linear and non-linear classifiers, their respective advantages can be fully utilized to improve classification accuracy and enhance the robustness of the model. It can also reduce the model’s dependence on training data, learn the data in the output probability matrix from different perspectives, achieve complementary integration, and thereby improve the overall performance of the model. Prediction Probability Matrix 2 (PPM2) is the prediction probability matrix output by the four classifiers, and PPM2 (9, 2) represents the probabilities of nine spectra corresponding to two types of skin diseases, respectively.
Multi-spectral data has high-dimensional features, and it is difficult to fully utilize this information using traditional single classifiers. Random forest, by integrating multiple decision trees, can automatically select important features and learn the non-linear relationships between features, thereby better utilizing the rich information contained in multi-spectral data. Therefore, random forest is used as the meta-classifier to further improve the performance and generalization ability of the entire stacked classifier.
3. Experimentation and Analysis
3.1. Dataset
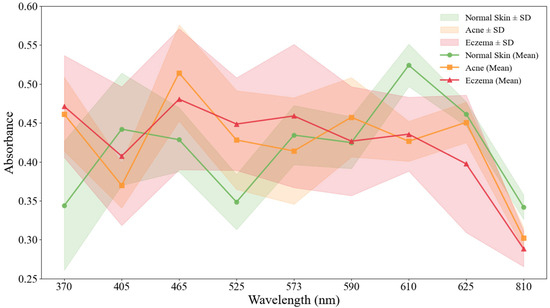
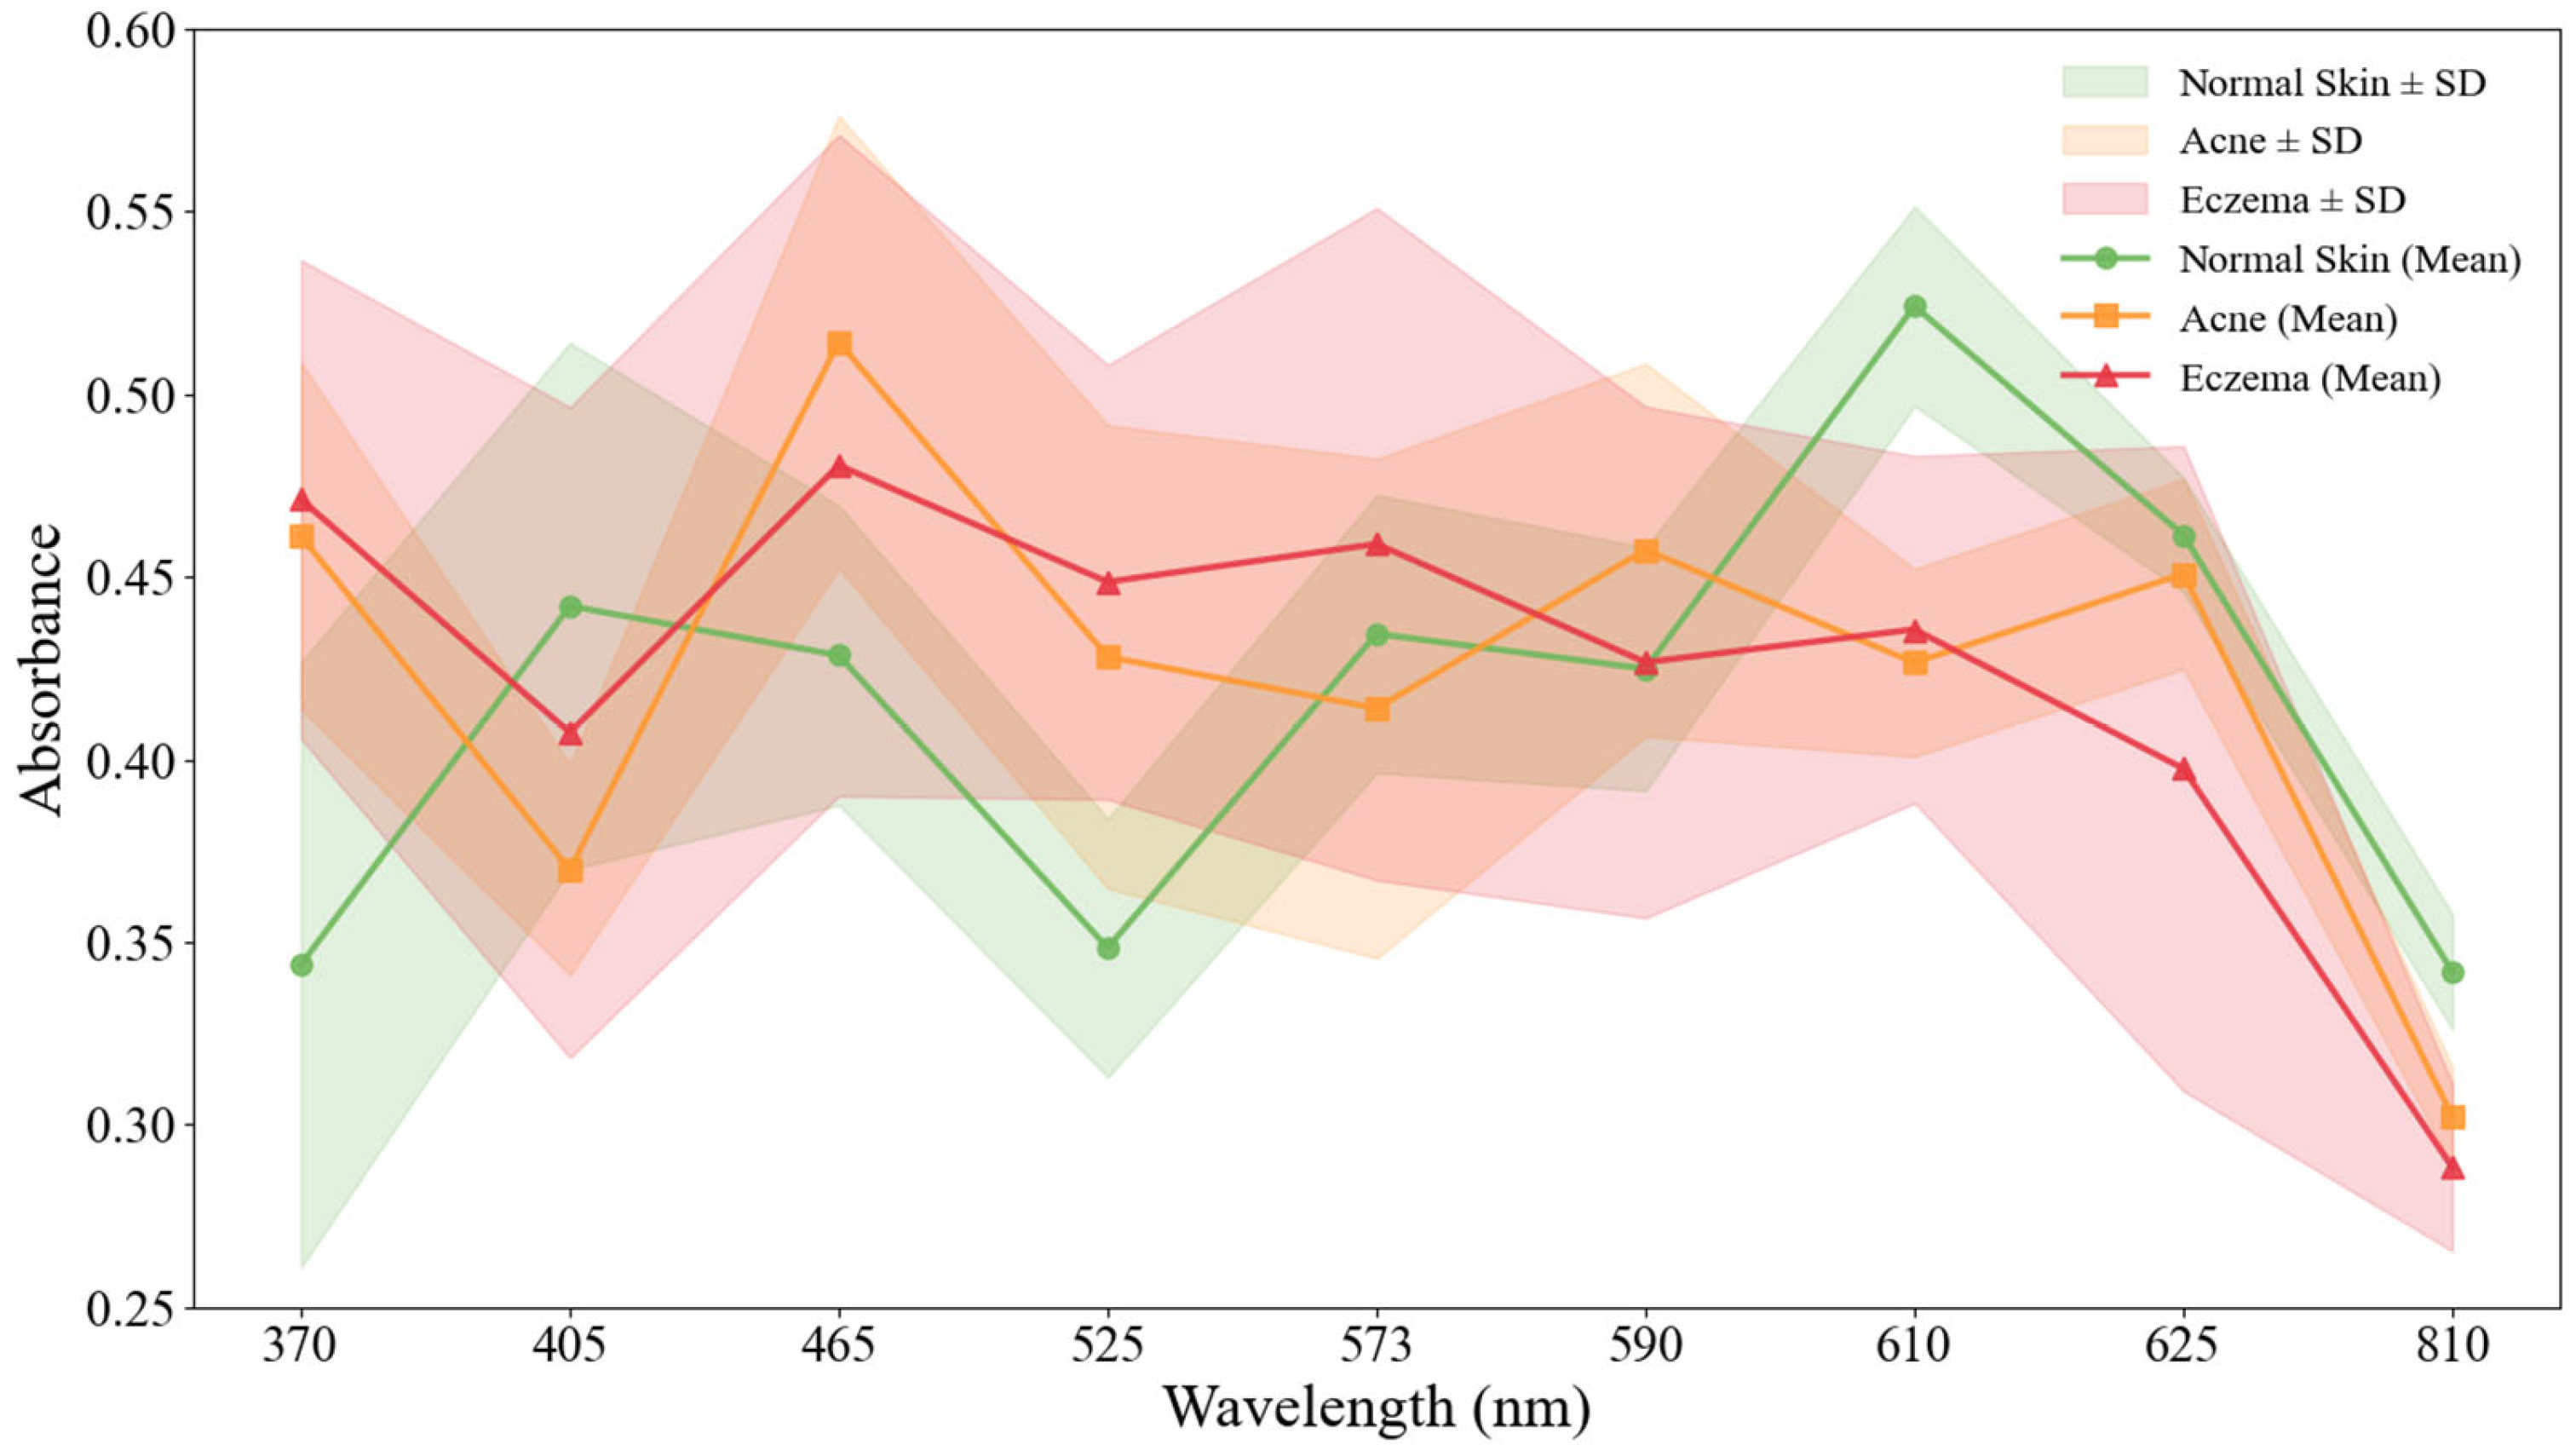
Acne and eczema are two diseases that are difficult for physicians to accurately distinguish with the naked eye in clinical diagnosis, especially in the early stages or when symptoms are atypical. However, there is a difference in the content of major chromophores (such as porphyrin in acne and hemoglobin in eczema) between the two, and the difference in chromophore absorbance can be represented by the textural features of the lesion tissue images. Therefore, this study used acne and eczema diagnostic accuracy to validate the algorithm’s performance. Twenty samples each of acne and eczema were selected from the dataset and compared with another 20 samples of normal skin by calculating the average absorbance using the logarithmic method. Figure 11 shows the average absorbance of acne, eczema, and normal skin.
Figure 11.
Mean absorbance (±SD) of acne and eczema compared to normal skin.
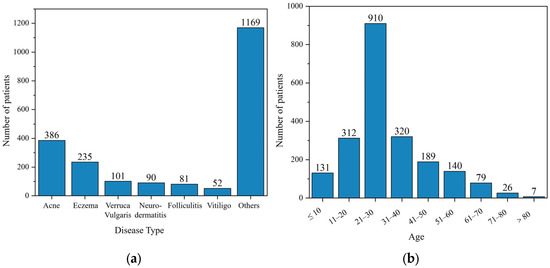
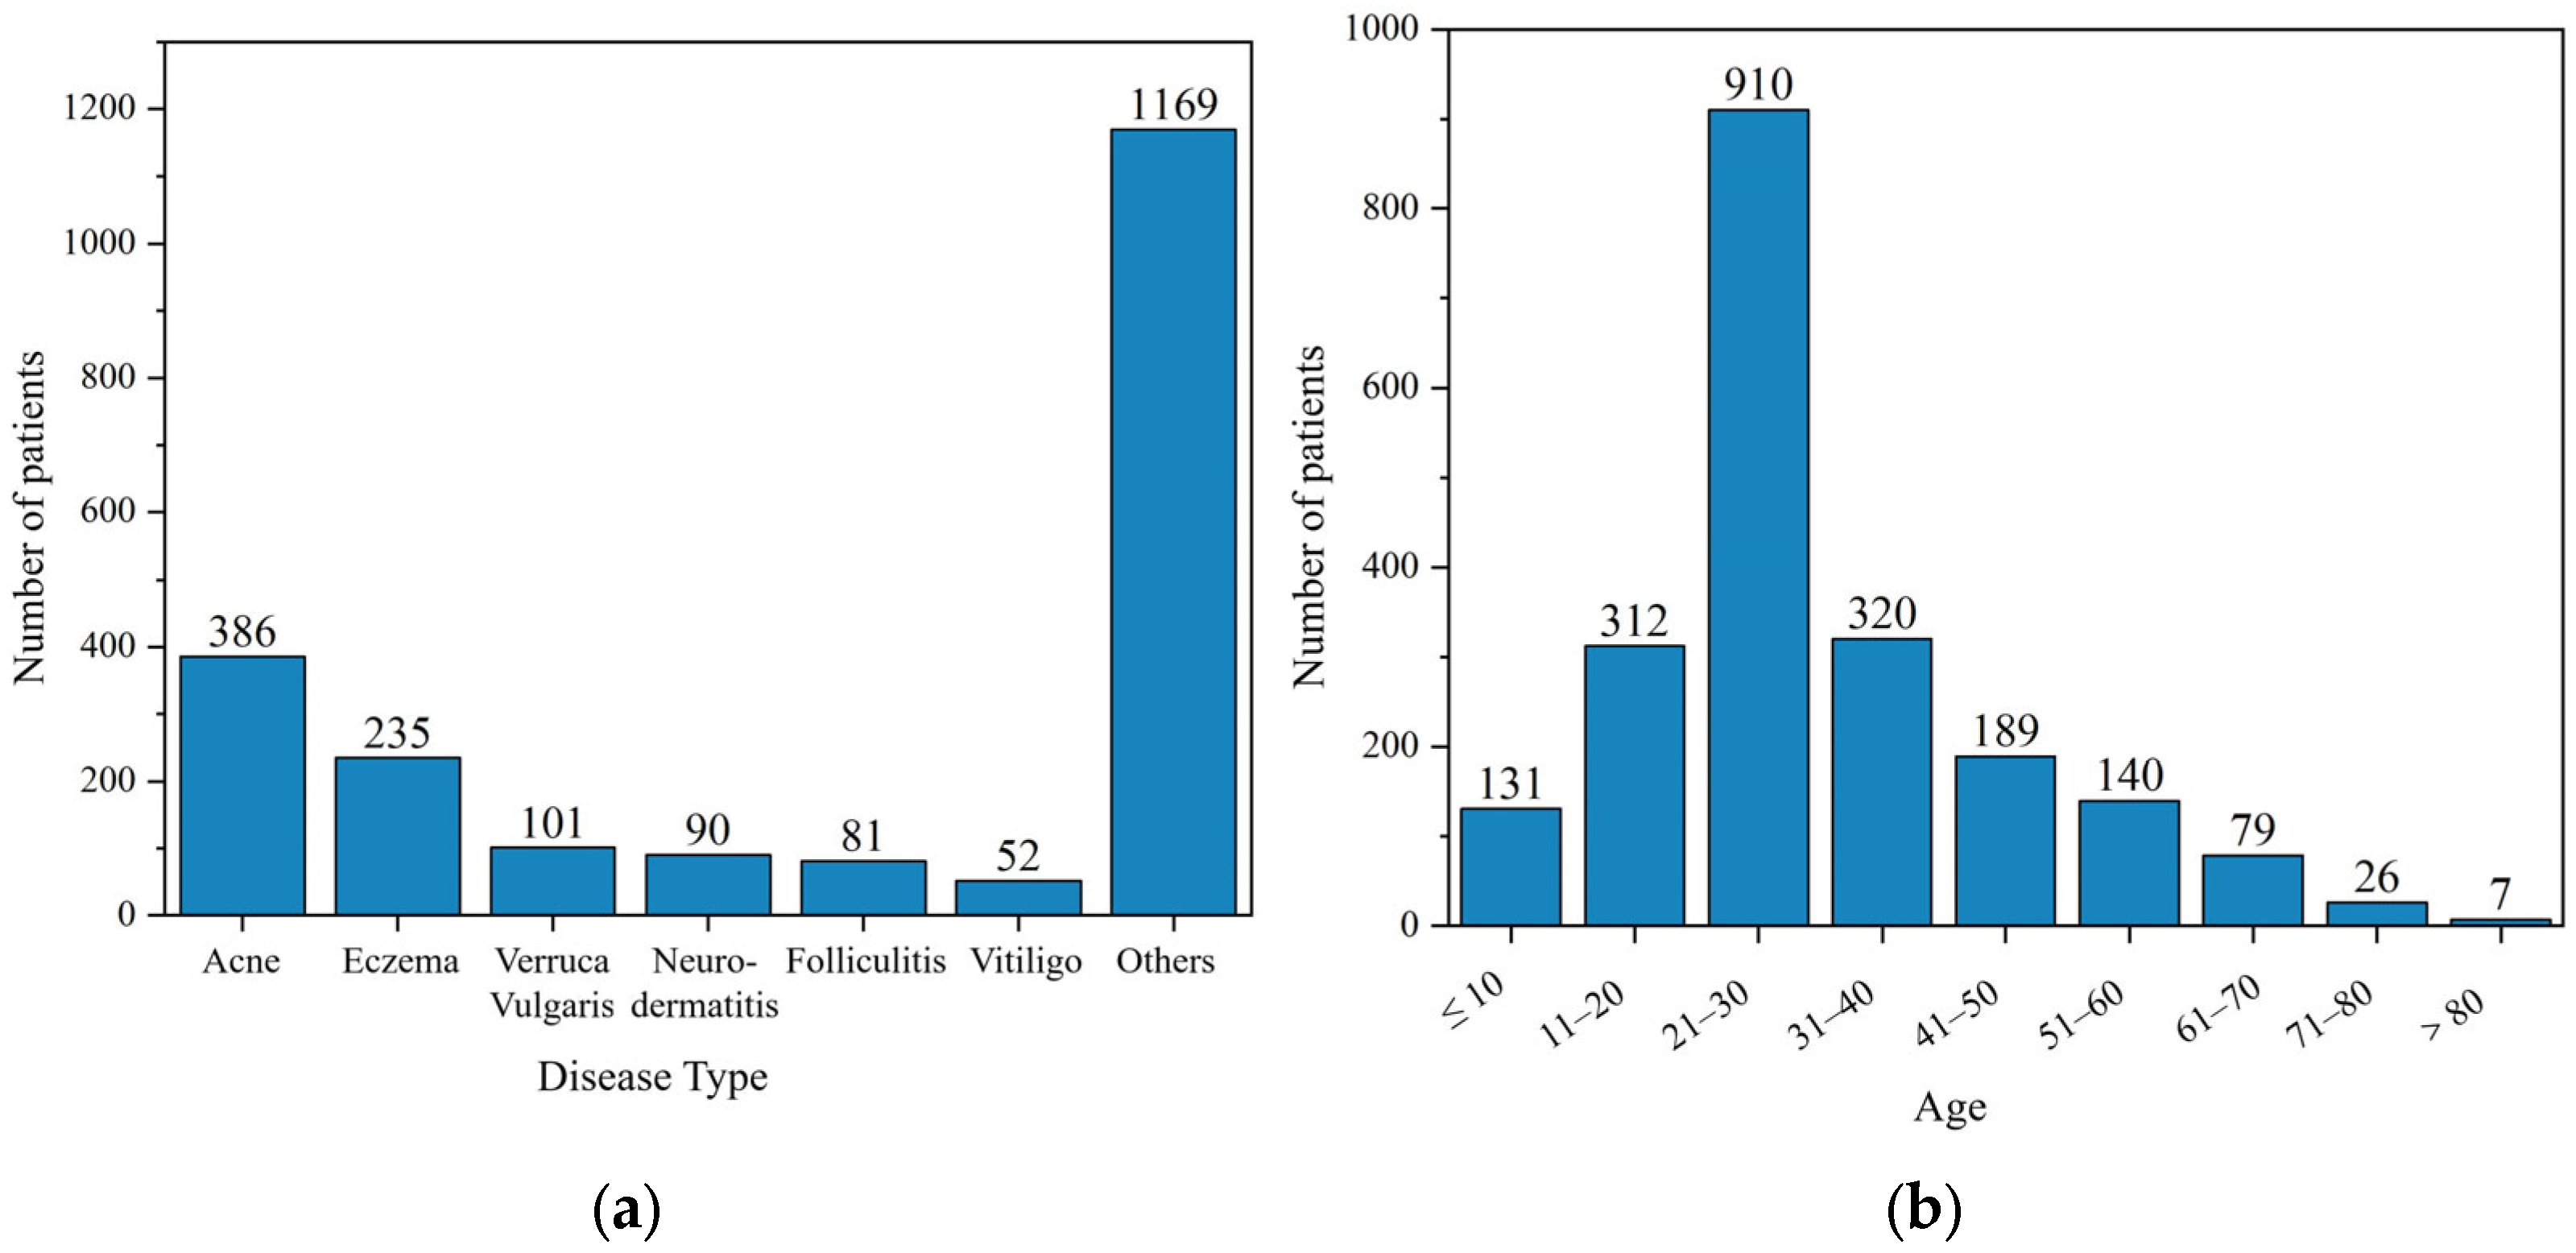
In response to internationally available datasets focusing on Caucasian skin diseases, this study collected 2114 validated multi-spectral skin disease data samples on-site in a hospital clinical setting using the collection equipment described above, with the prior informed consent of all participating patients and with the relevant permissions obtained. The patients involved in the collection covered an age range from 1 to 93 years old, including 386 cases of acne and 235 cases of eczema. Figure 12 shows the distribution of the number of skin diseases and the age of patients within the dataset.
Figure 12.
Clinical and demographic profile of the study cohort. (a) Number of patients by skin condition type; (b) age distribution of participants.
The self-developed multi-spectral acquisition device described in Section 2.2 was used. Prior to image capture, the operator calibrated the device using a standard white board and a dark field. During acquisition, the device probe was placed in close, vertical contact with the skin lesion area through a disposable sterile transparent film to ensure a consistent imaging distance and lighting angle. For each patient, the clinician identified the most representative lesion area for imaging. Each image was labelled as acne, eczema, or normal based on either pathological findings or the clinical diagnosis of a senior dermatologist.
To ensure the fairness of model training and avoid the bias caused by class imbalance, we took the eczema class with a smaller sample size (a total of 235 cases) as the benchmark and randomly under-sampled the acne class with a larger sample size to make its number also 235 cases. All samples were randomly divided into a training set and a test set (7:3). In addition, we selected 200 multi-spectral images of normal skin from the dataset as a control.
Each original multi-spectral image of each wavelength is a grey-scale image. To adapt to the pre-trained CNN model (which usually requires 3-channel RGB input), we replicate each single-channel grey-scale image (224 × 224 × 1) three times along the channel dimension to form a 224 × 224 × 3 tensor as the model input. Meanwhile, in order to effectively isolate the interference of the background noise from other parts of the image in the lesion region to the model, a layer of circular mask was added to the original image after adjusting the resolution to better preserve the spatial structure information of the lesion and its surrounding region, such as edges, textures, etc., which helps the model to capture richer visual cues.
3.2. Training Parameters and Evaluation Indicators
In this experiment, the initial learning rate of each sub-model under the sub-classifier is set to 0.0001 during the migration learning process with exponential decay. The number of samples learned by each input model is 16, the number of iterations is 20, the loss function is Sparse Categorical Crossentropy Loss (SCCL), and the K-value is selected as 5. Accuracy, Recall, Precision, F1-Score (F1-Score), AUC-ROC (Area Under the Receiver Operating Characteristic Curve), and other metrics were used for the experimental evaluation of the model.
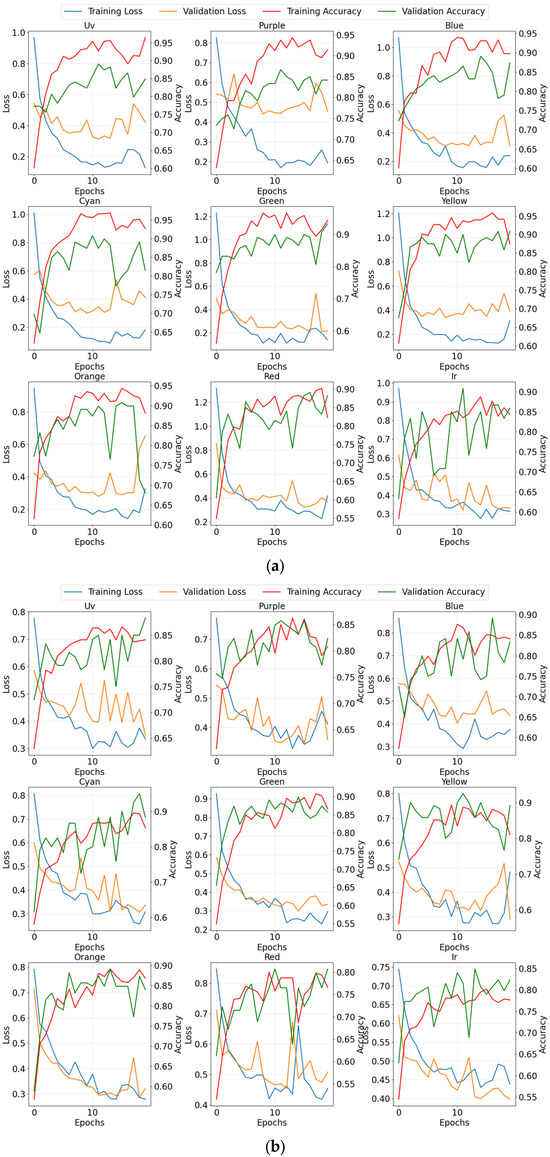
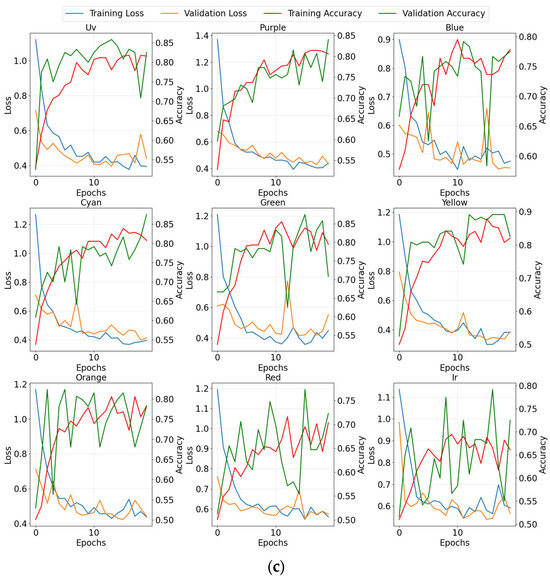
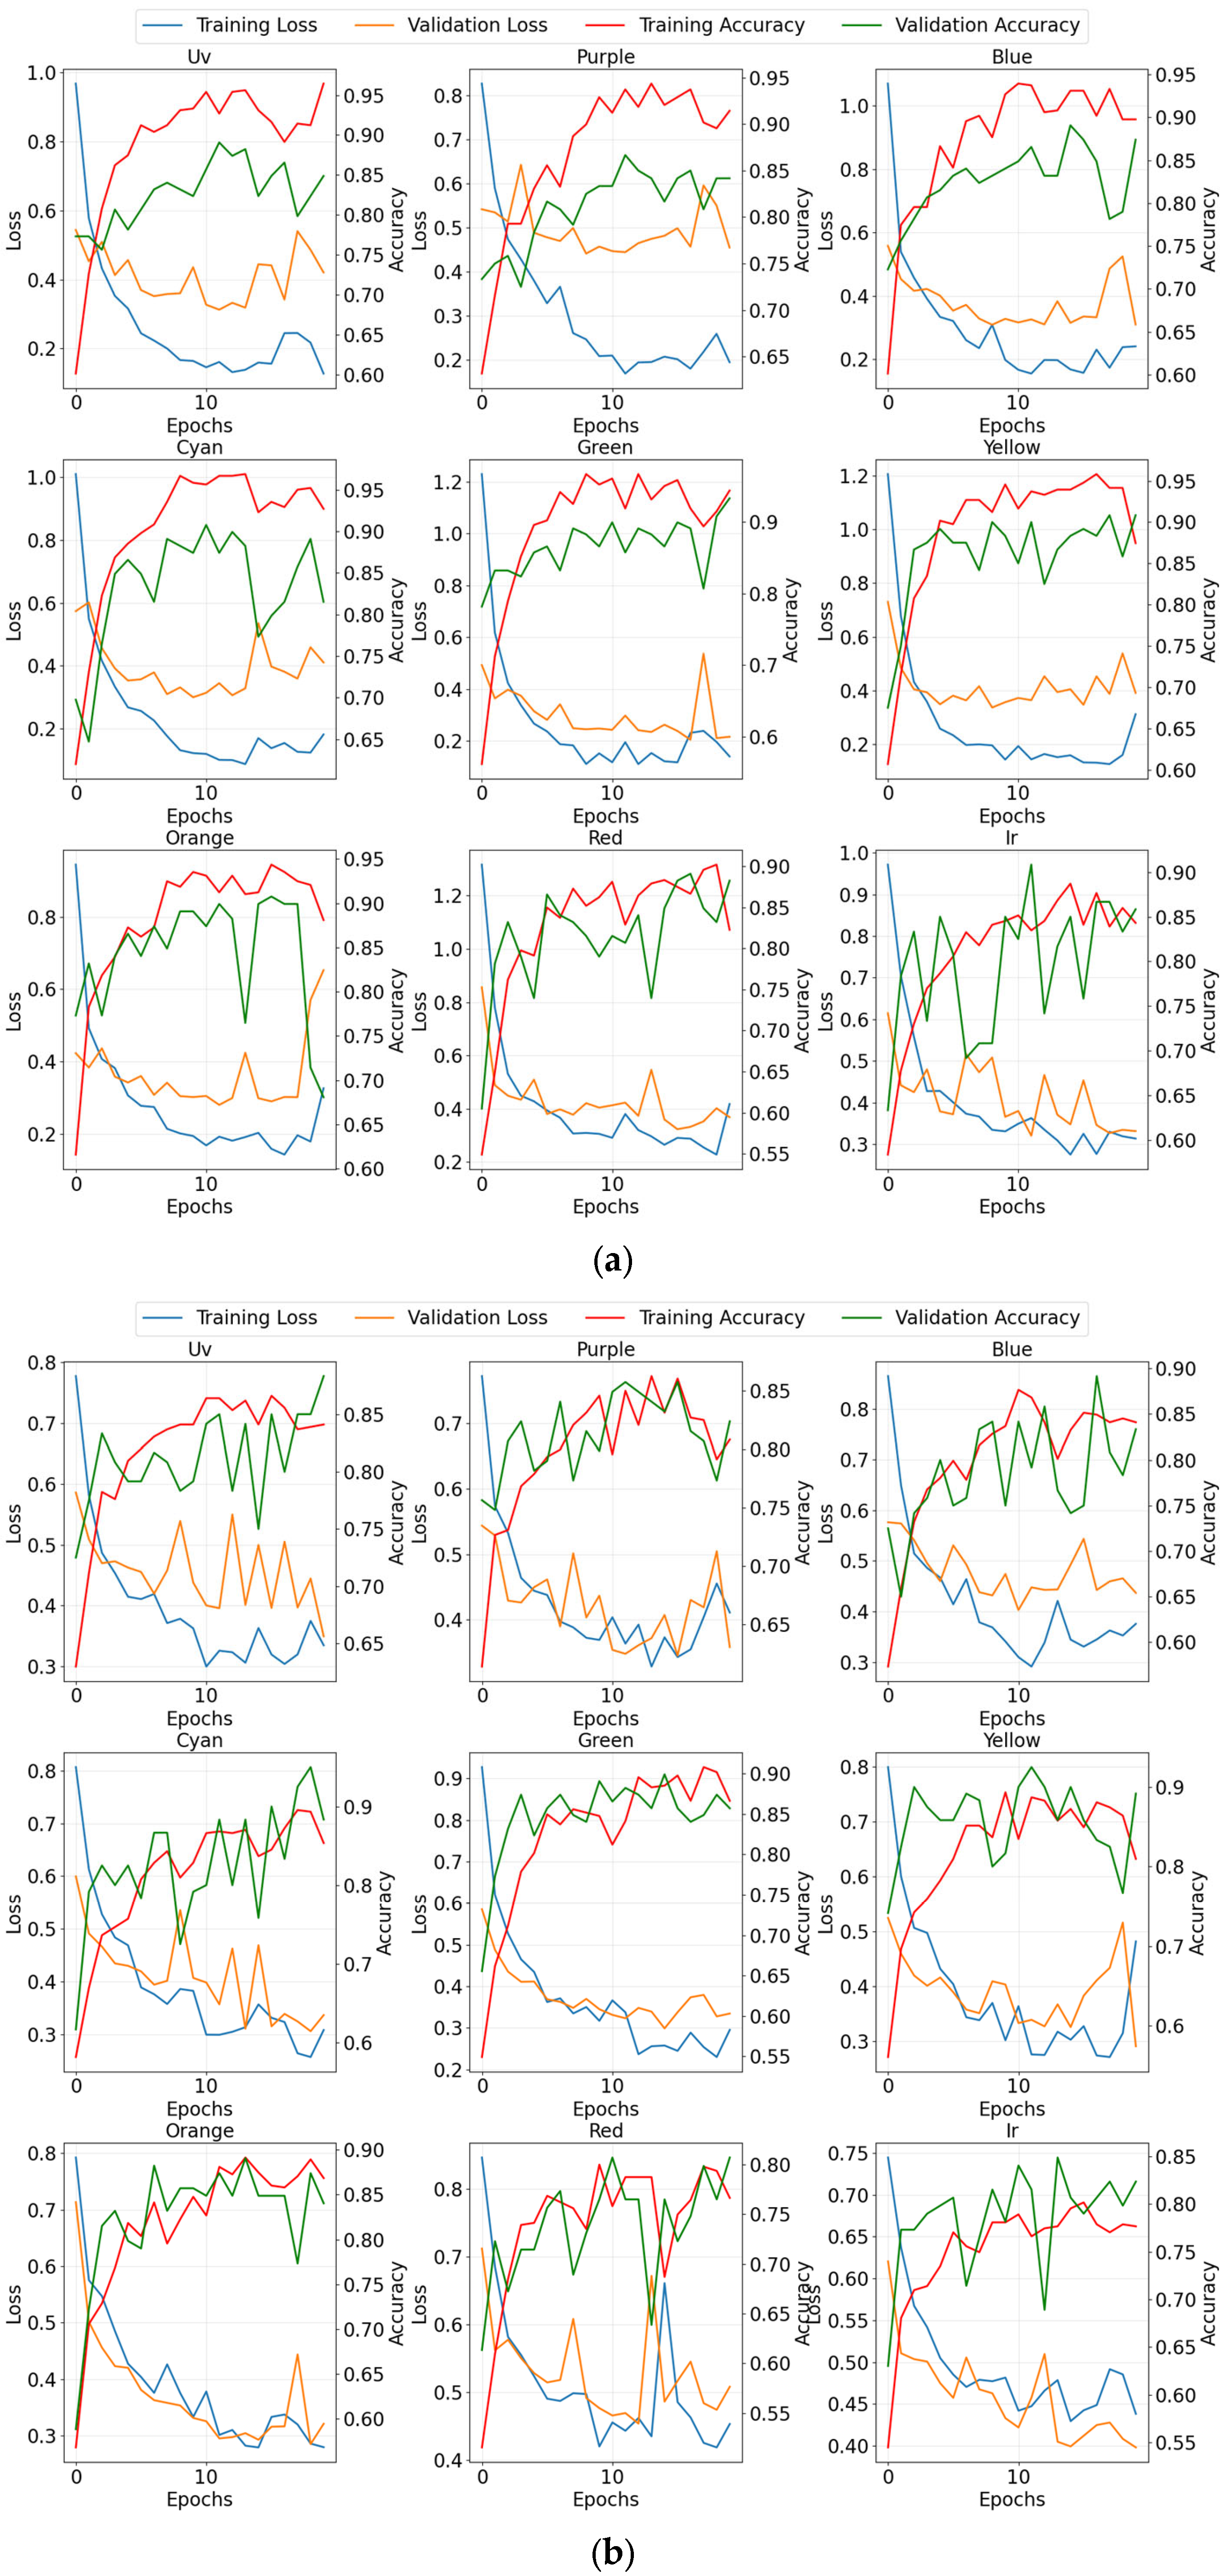
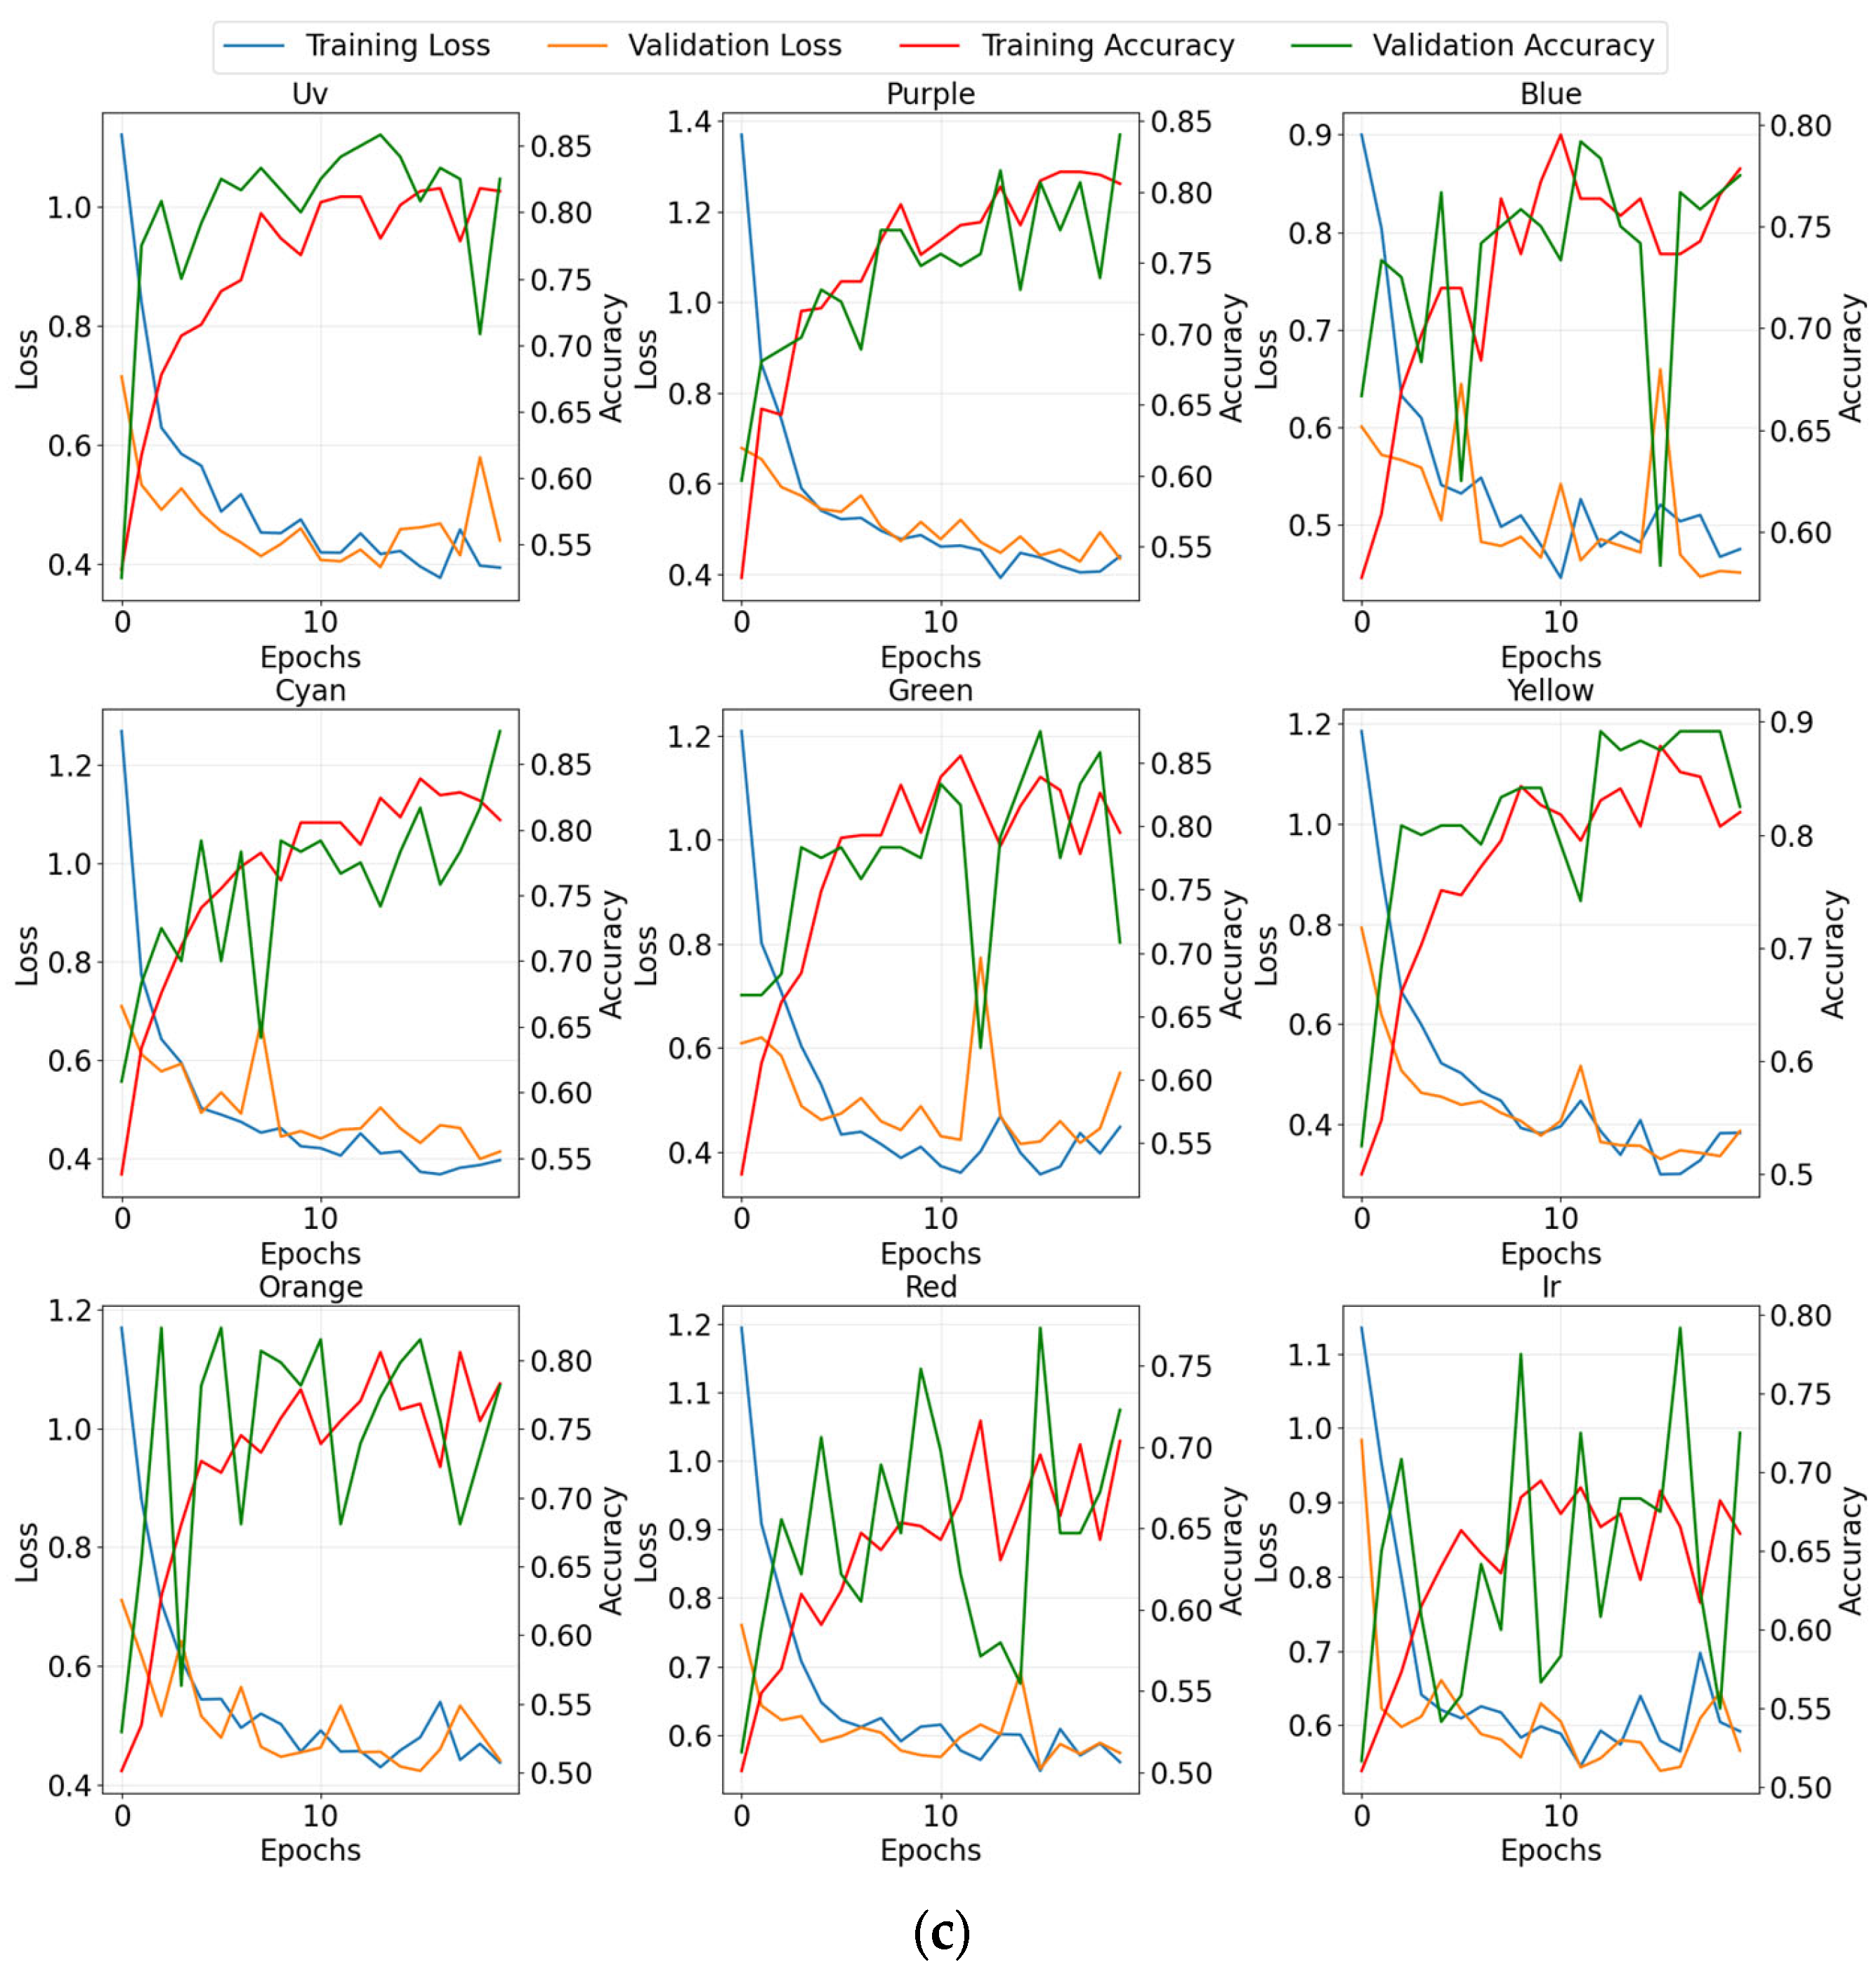
To prevent model overfitting, we have taken some effective measures. K-fold cross-validation (K = 5) was adopted in the training and validation phases, which is a robust evaluation strategy in itself. As shown in Figure 13, we monitored the loss curves of the training and validation sets and did not observe any obvious signs of overfitting. Additionally, to prevent overfitting, Dropout layers were introduced in the stacked classifiers. Furthermore, the error bars in Figure 14, Figure 15 and Figure 16 already reflect the variance of the results from the robust k-fold cross-validation strategy itself.
Figure 13.
Training and validation loss curves of the wavelength-specific sub-models for the three lightweight CNN classifiers: (a) ResNet50, (b) EfficientNet-B0, and (c) RegNetX-002.
Figure 14.
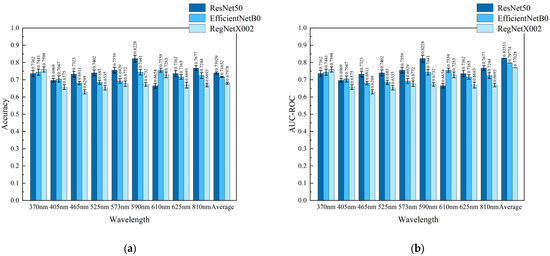
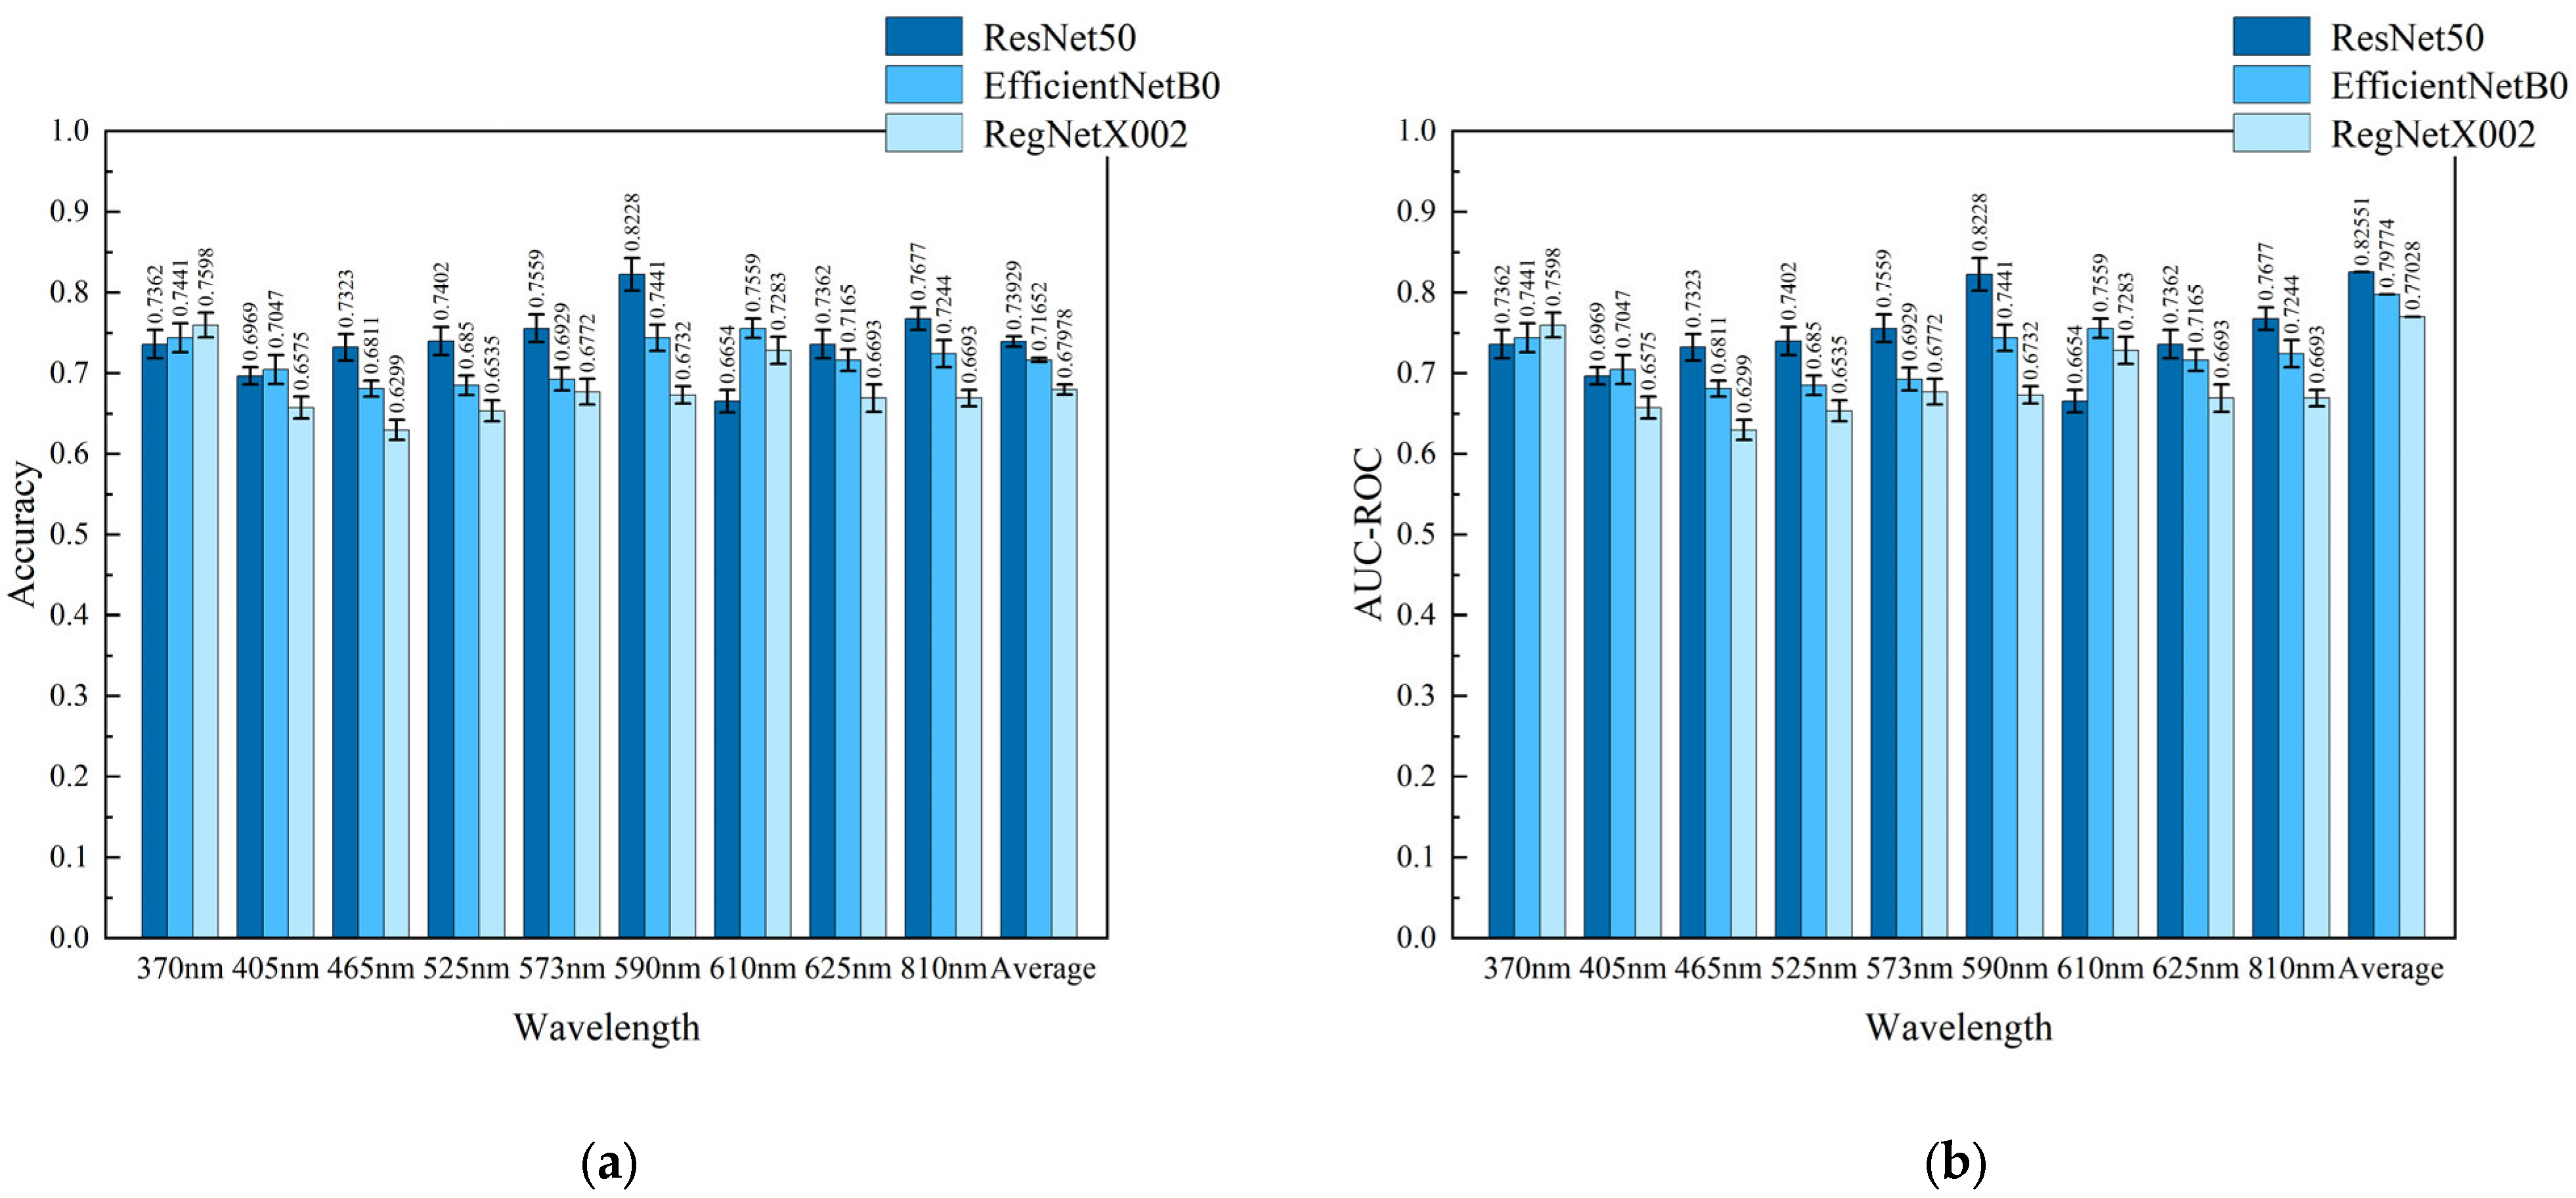
Performance evaluation of sub-classifiers under ResNet50, EfficientNetB0, and RegNetX002 architectures: (a) Accuracy comparison, and (b) AUC-ROC value comparison. Error bars denote 5-fold cross-validation standard deviations.
Figure 15.
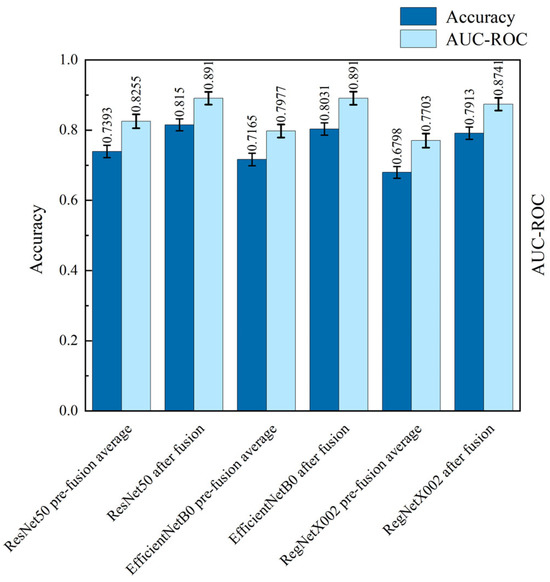
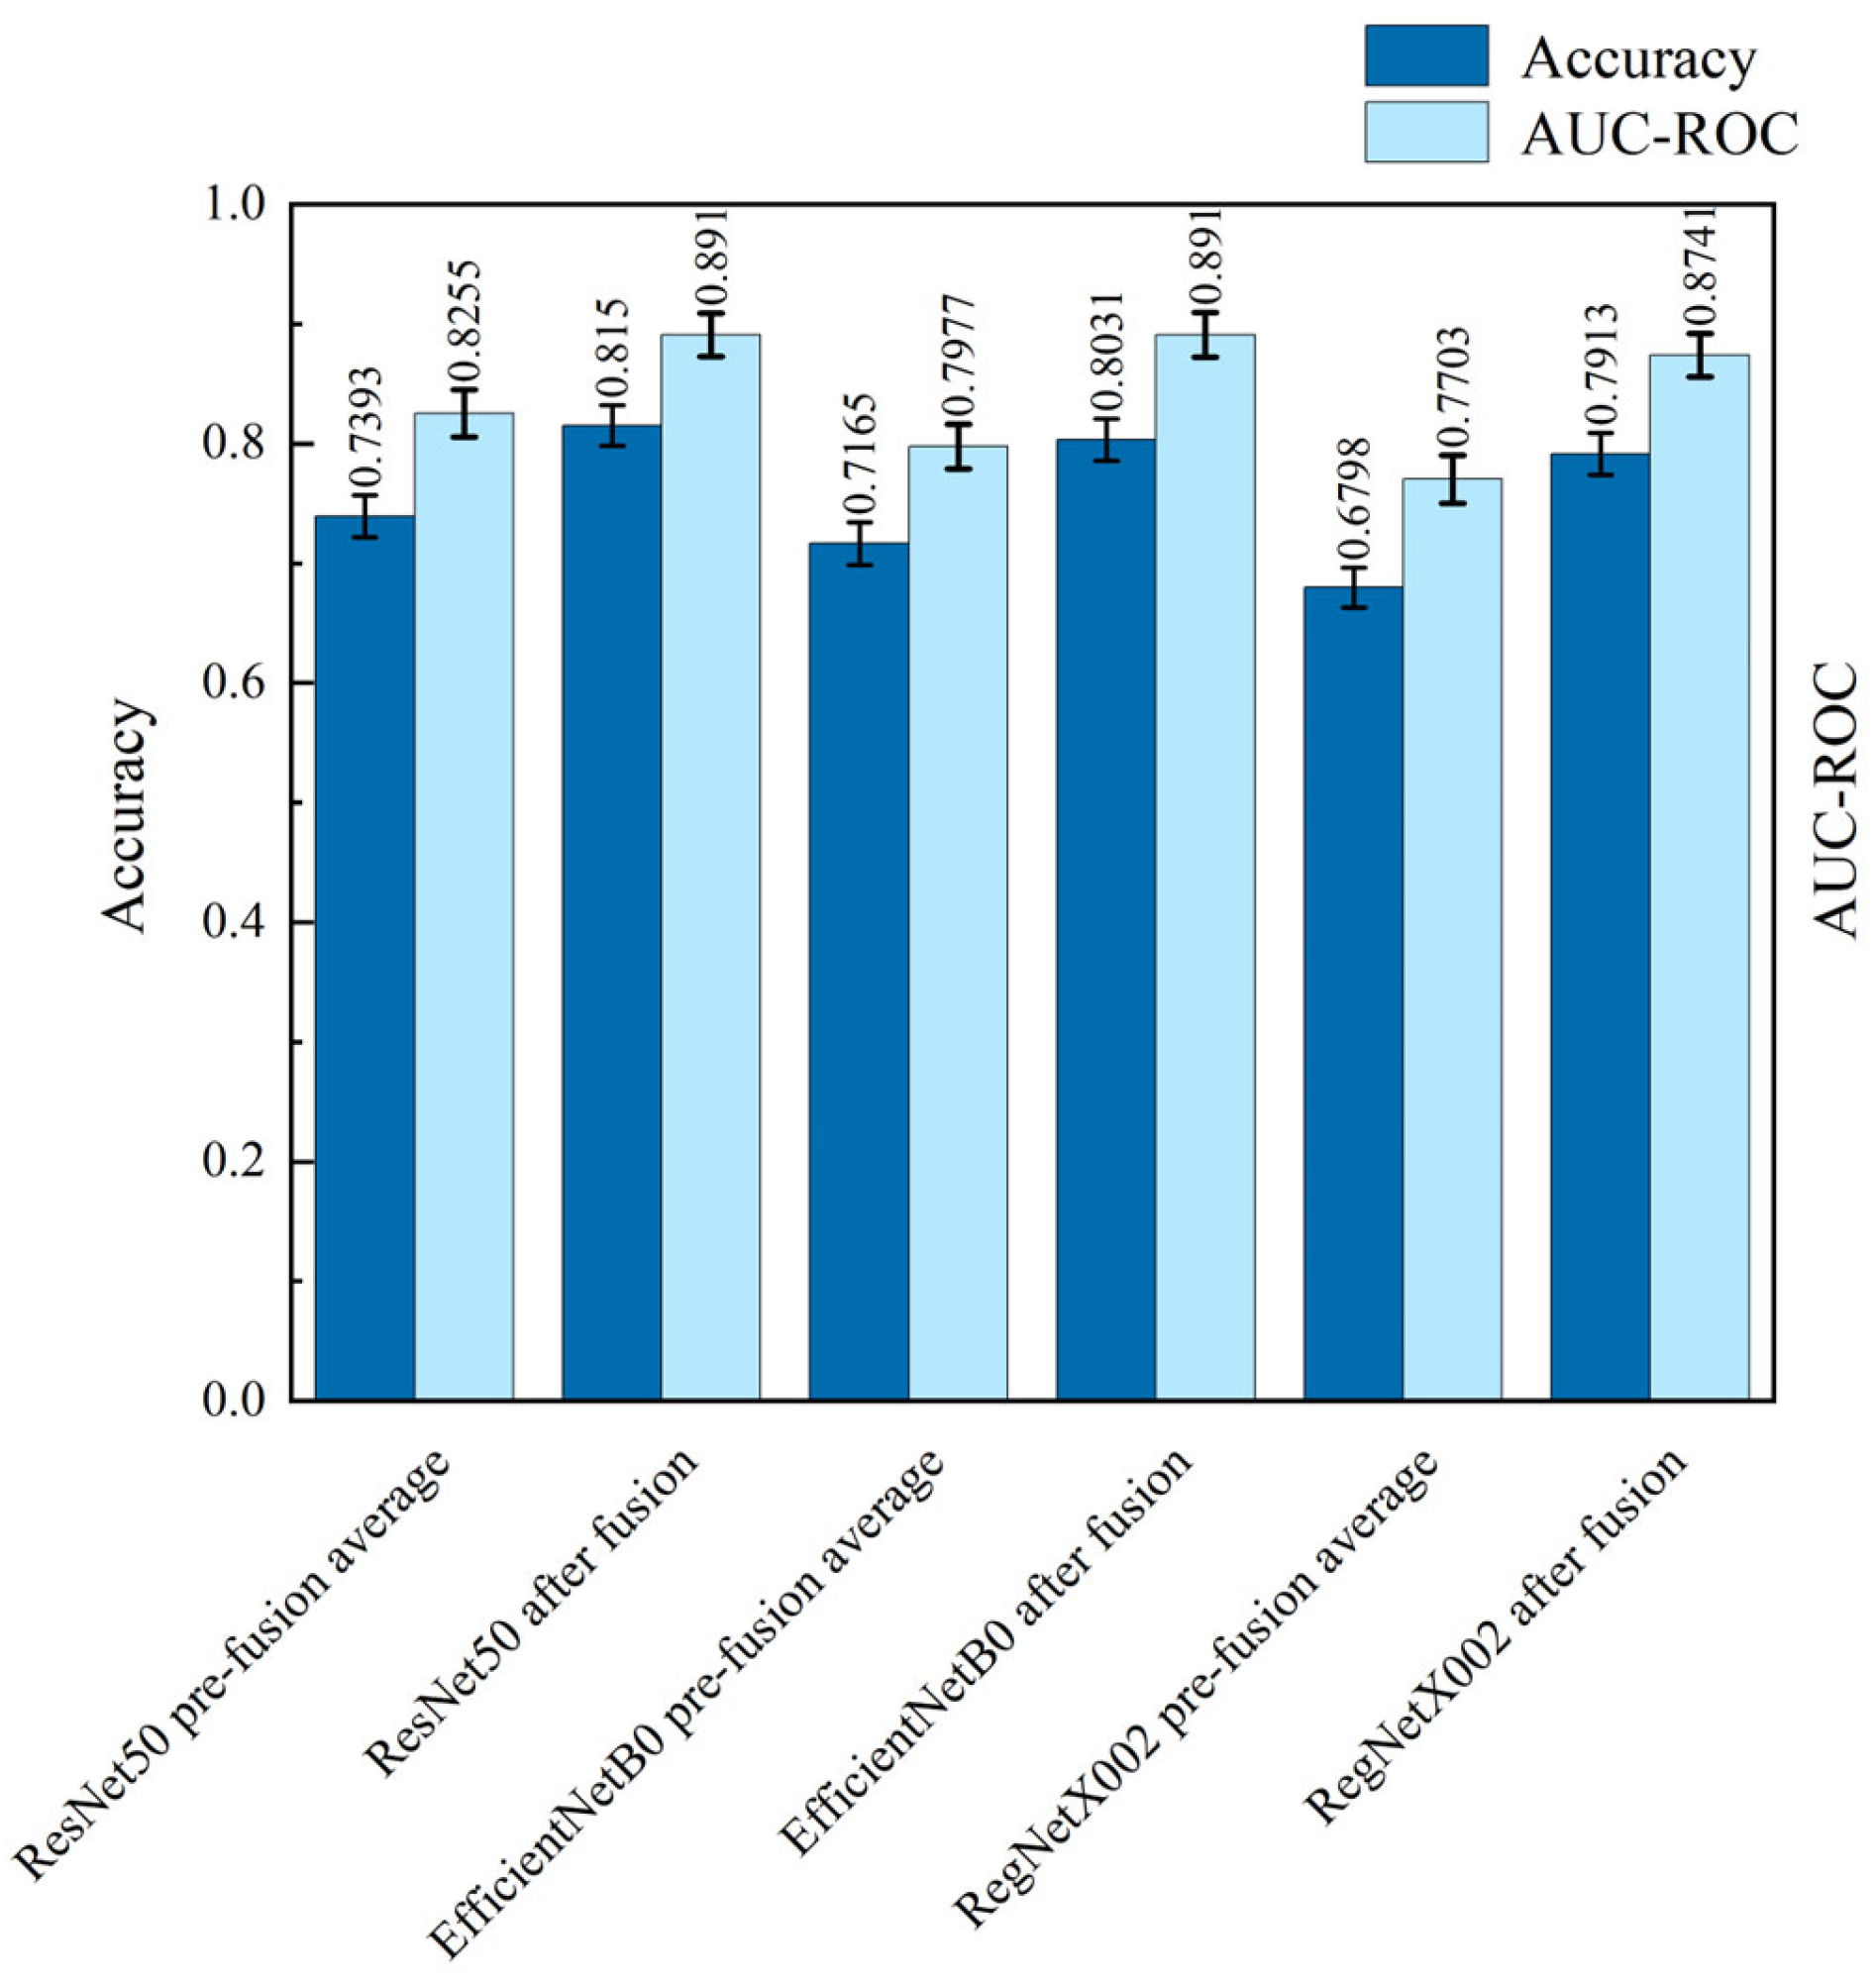
Performance comparison before and after convergence in a single architecture.
Figure 16.
Performance comparison of single-architecture fusion vs. cross-architecture fusion.
3.3. Analysis of Each Wavelength Sub-Model in a Single CNN Architecture
By comparing and analyzing the performance of the sub-models under the three CNN architectures, ResNet50, EfficientNetB0, and RegNetX002, it is possible to gain insights into the capabilities of the model architectures themselves, which can provide an important reference for the subsequent optimization of the models. Therefore, firstly, the performance of the sub-models of nine wavelengths under each architecture after the migration learning was compared and experimented, and their accuracy on the test set with the comparison of AUC-ROC values are shown in Figure 14.
From Figure 14, we can see that none of the architectures performs best at all wavelengths, and each architecture performs differently at different wavelengths. In the comparison of accuracy, ResNet50 has the highest average accuracy of 0.7393, followed by EfficientNetB0 with 0.7165, and lastly RegNetX002 with 0.6798. This indicates that the ResNet50 network architecture has the best overall performance in classification at all wavelengths. Specifically, at 465 nm, 525 nm, 573 nm, 590 nm, 625 nm, and 810 nm wavelengths, the accuracy of ResNet50 is higher than that of EfficientNetB0 and RegNetX002, with the advantages of ResNet50 being especially obvious at 465 nm, 525 nm, 573 nm, and 590 nm wavelengths. Compared with EfficientNetB0 and RegNetX002, the accuracy of EfficientNetB0 is higher than that of RegNetX002 at all wavelengths except 370 nm.
In the comparison of the average AUC-ROC values, the ResNet50 architecture is still the best performer, with an average AUC-ROC value of 0.8255, followed by the EfficientNetB0 architecture, with an average AUC-ROC value of 0.7977, and the RegNetX002 architecture performs relatively poorly, with an average AUC-ROC value of 0.7703. Specifically, the same ResNet50 architecture outperforms EfficientNetB0 and RegNetX002 on most wavelength sub-models, and EfficientNetB0 outperforms RegNetX002 overall.
The difference may stem from several factors. ResNet50 has a higher number of model parameters and computational complexity, and thus is able to effectively capture the deeper features of skin disease images, such as texture, colour, and shape, and thus exhibits an advantage in overall performance. EfficientNetB0 employs a composite scaling and channel attention mechanism, which focuses on extracting both shallow and deep features, including edges, contours, and semantic information, and thus does not perform as well as ResNet50 in terms of overall performance. RegNetX002 employs a random channel pruning technique, which, although it can efficiently extract multi-scale features of skin disease images, it reduces the performance of the model while decreasing the number of model parameters, resulting in a slight lag behind in terms of performance among the three architectures.
3.4. Single CNN Architecture Fusion vs. Multiple CNN Cross-Architecture Fusion
In order to verify that using multiple CNN architectures works better than a single CNN architecture, for the three CNN architectures, ResNet50, EfficientNetB0, and RegNetX002, the outputs of different spectral sub-models under each architecture are first fused using random forests to obtain the fused classification outputs under that architecture, respectively. Then, after fusing the probability matrices of the above three architectures in tandem, the fused classification output across architectures is obtained using random forests. After the classifiers were adequately trained, a comprehensive comparison of the classification results of fusion within a single architecture and fusion across architectures was evaluated on a reserved test set. The performance comparison results before and after fusion in a single architecture are shown in Figure 15.
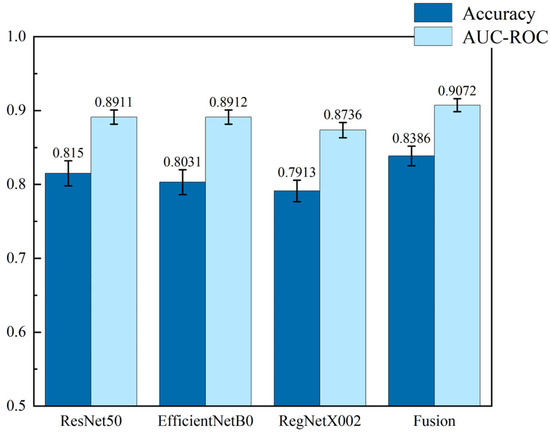
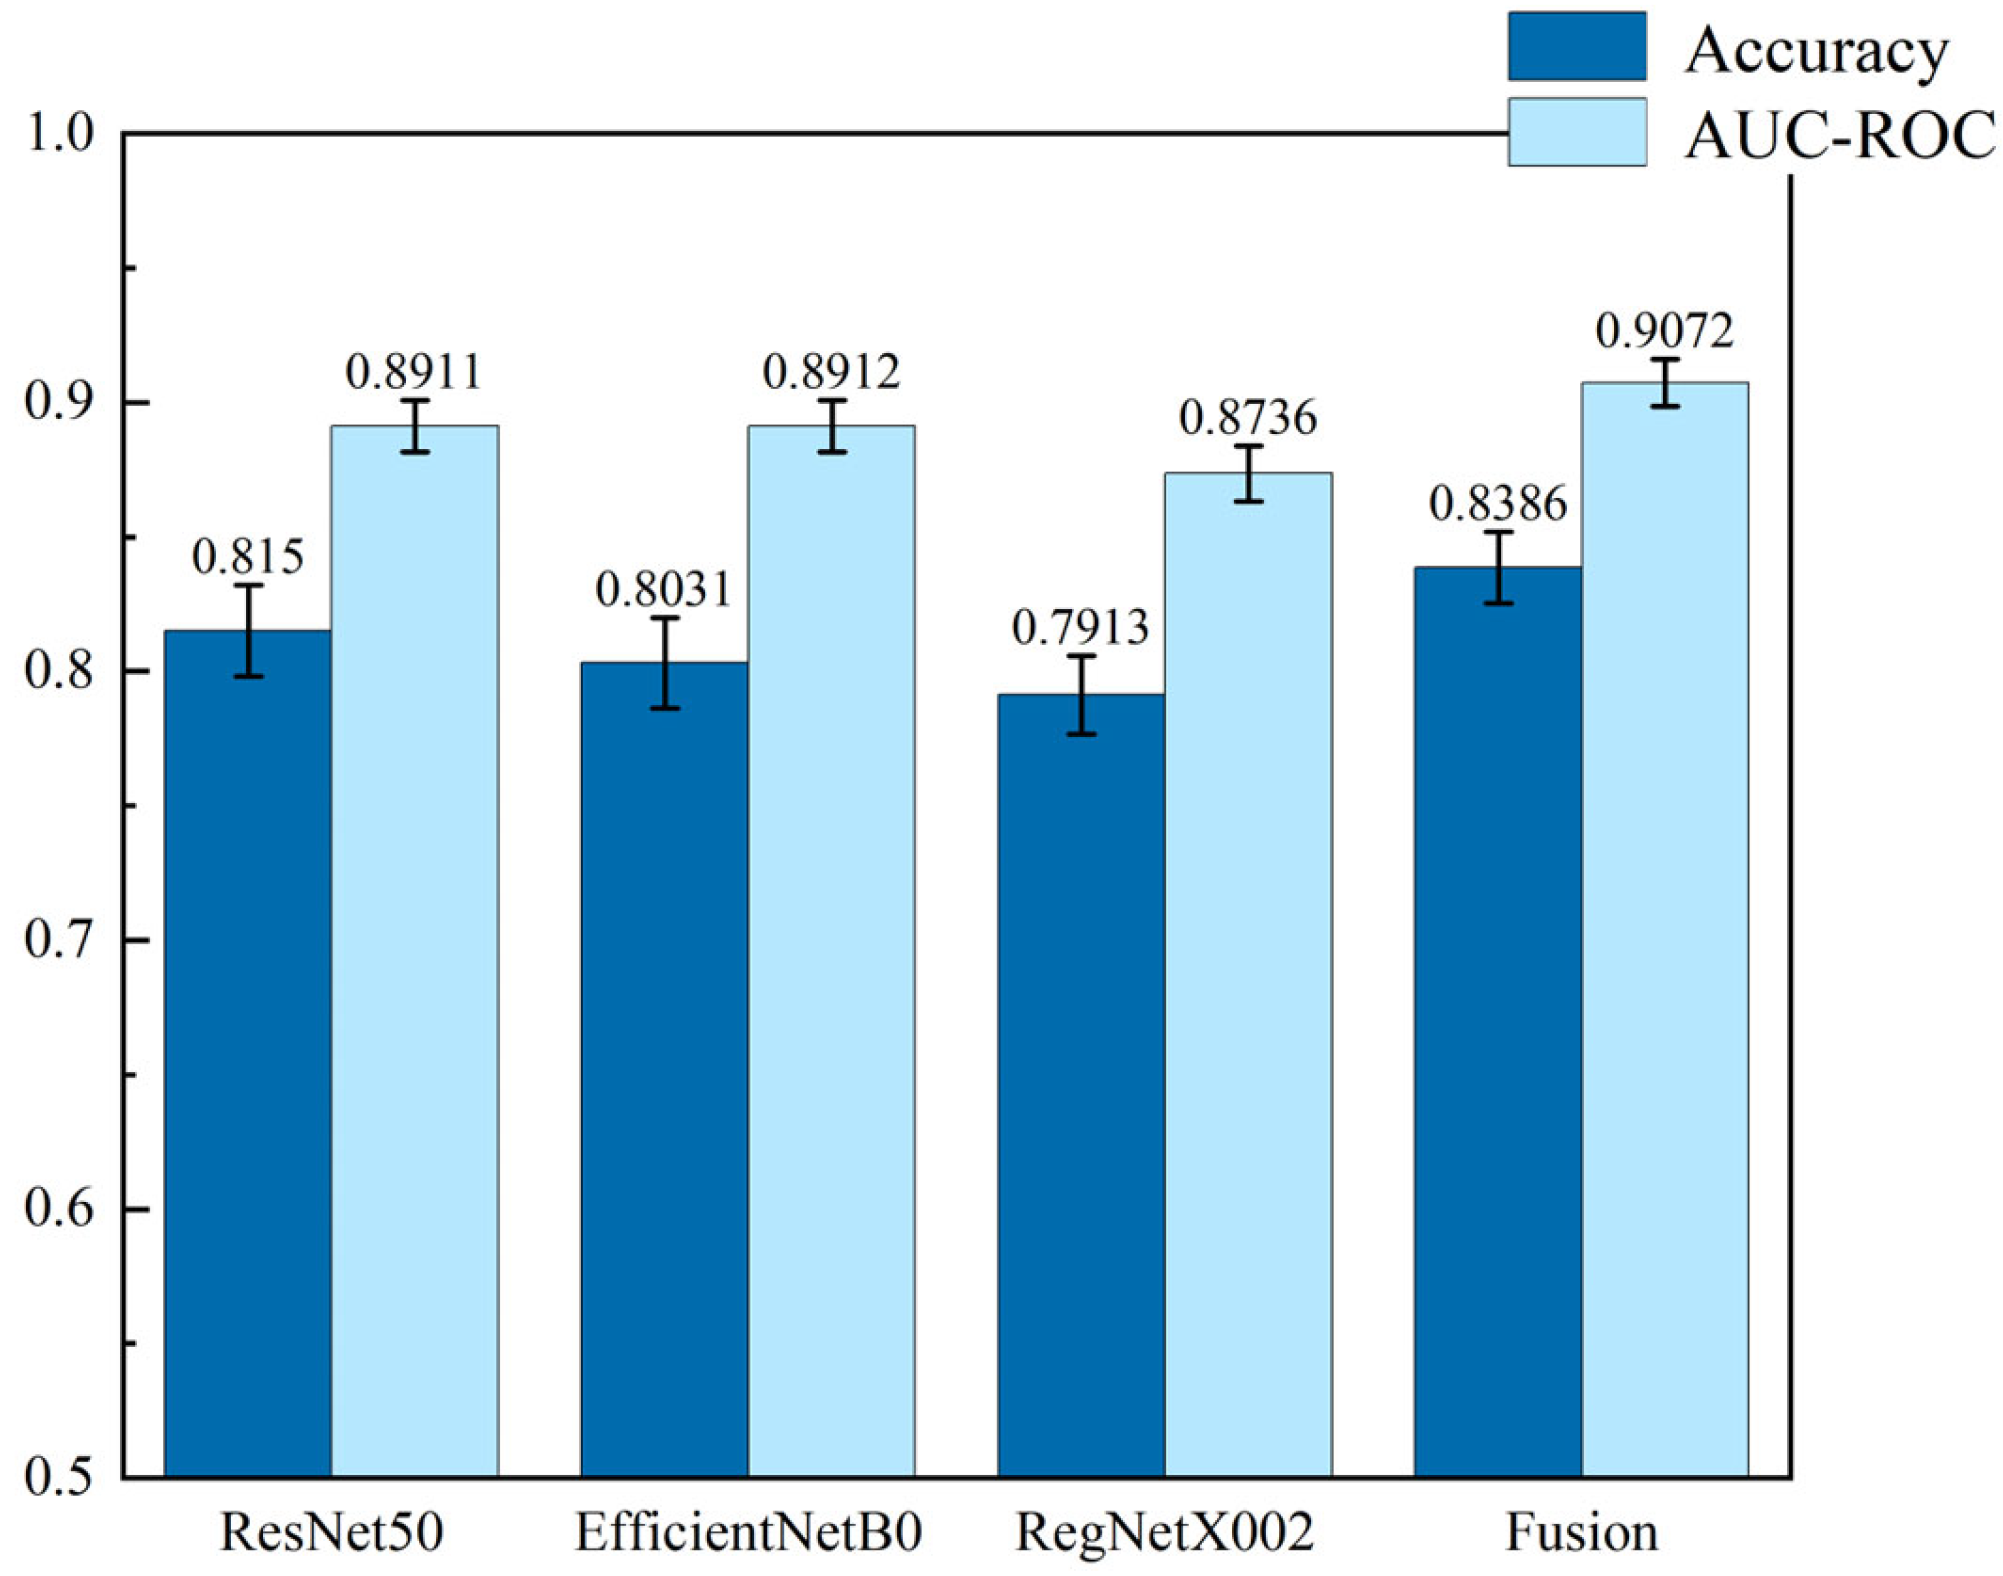
As can be seen from Figure 15, for ResNet50, EfficientNetB0, or RegNetX002, after fusion using random forest, the accuracy and AUC-ROC values are higher than the average of the outputs of the nine wavelength sub-models before fusion, and the improvement is significant. In particular, the accuracy and AUC-ROC values were improved by 10.24% and 7.93% for ResNet50, 12.09% and 11.7% for EfficientNetB0, and 16.4% and 13.48% for RegNetX002. This verifies that fusing multiple wavelength sub-models within the same architecture can effectively utilize the feature information at different wavelengths, which, in turn, significantly improves the classification performance of a single architecture. The comprehensive performance ranking of the three architectures after fusion is consistent with that before fusion, which, on the other hand, verifies the effectiveness and interpretability of the fusion method and lays a foundation for subsequent cross-architecture fusion.
Figure 16 shows the performance comparison between cross-architecture fusion and single-architecture fusion. From the Figure, it can be concluded that the accuracy and AUC-ROC values of the cross-architecture fusion model are better than those of the single-architecture model. For ResNet50, EfficientNetB0, and RegNetX002, the accuracy of the cross-architecture model is improved by 2.9%, 4.42%, and 5.98%, and the AUC-ROC values are improved by 1.8%, 1.8%, and 3.85%, respectively. The cross-architecture fusion model preserves the information unique to each sub-classifier while ensuring that all important features are considered by concatenating the outputs under a single architecture. This crosstalk approach is particularly critical for the comprehensive analysis of multi-spectral data, as the output of each wavelength sub-model represents the correlation between different wavelengths in the data. Thus, the cross-architecture fusion model not only combines the strengths of multiple architectures but also significantly improves the performance of analyzing multi-spectral data, a result that validates its importance for performance improvement.
3.5. Analysis of Experimental Results for Stacked Classifiers and Meta-Classifiers
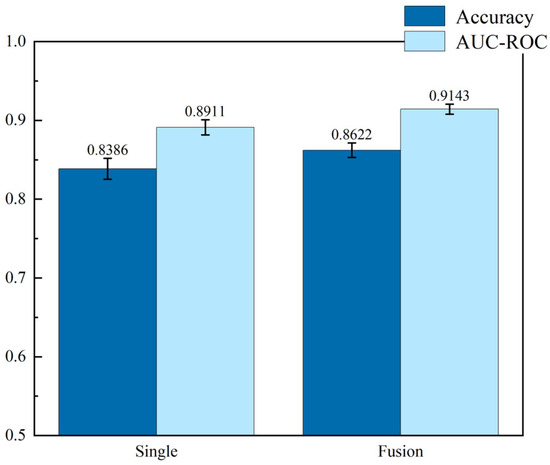
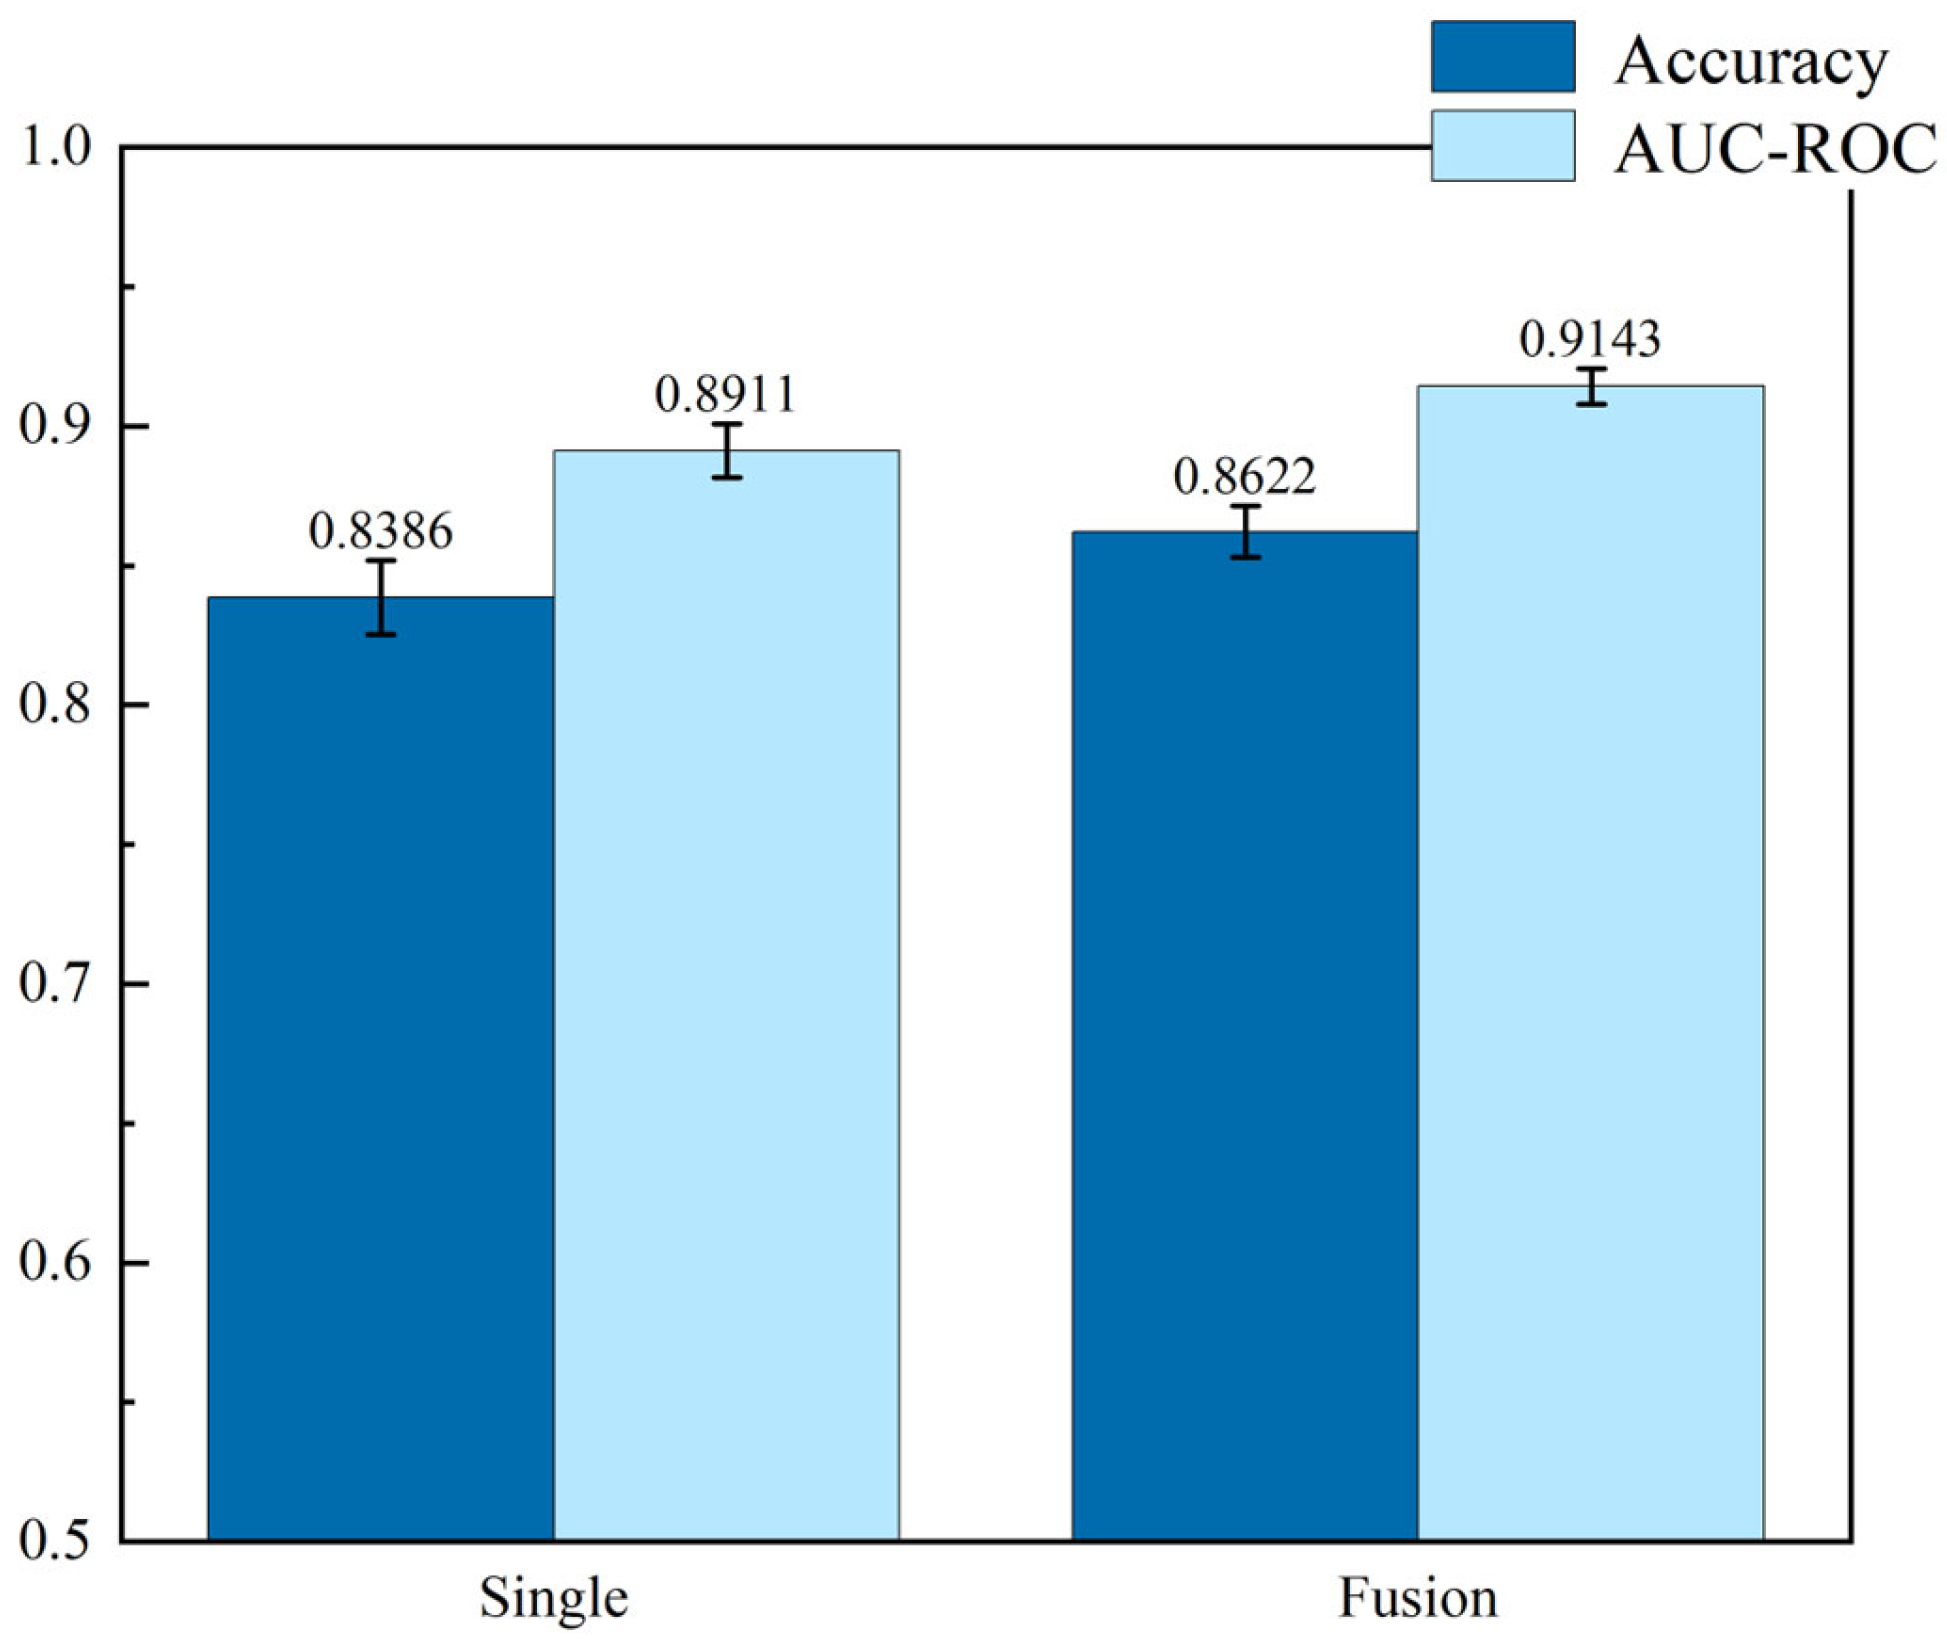
In order to compare using multiple meta-classifiers for stacking with better results than using a single meta-classifier, the outputs of using random forests, Support Vector Machines, Logistic Regression, and neural networks with the outputs of four classifiers stacked in series followed by neural networks for classification, as well as using a single random forest with the probability matrices of the outputs of the three architectures stacked in series for classification, have been compared. A comparison of the recognition performance of a single meta-classifier versus multiple meta-classifiers derived on the retained test set after the classifiers have been adequately trained is shown in Figure 14.
From Figure 17, it can be concluded that the method of using multiple classifiers stacking followed by fusion classification using random forest can improve the accuracy and AUC-ROC value compared to simply directly concatenating the probability matrices output from the three CNN architectures and then using random forest for classification. The output accuracy of the final meta-classifier reaches 0.8622 with an AUC-ROC value of 0.9143. This further validates the effectiveness of integrated learning when dealing with classification tasks. By fusing the outputs of multiple classifiers during the stacking process, it is possible to take full advantage of their respective strengths and feature representation capabilities, thus improving the overall classification accuracy and robustness.
Figure 17.
Comparison of recognition performance of single meta-classifier and fusion of multiple meta-classifiers.
3.6. Discussion on System Superiority and Experimental Results
The multi-spectral skin disease detection system developed in this study adopts a multi-model multi-layer network architecture, which outperforms existing technologies in terms of diagnostic accuracy, model interpretability, and clinical applicability. Unlike the skin cancer diagnosis framework proposed by Rey-Barroso et al. [15], this system is specifically designed for visually indistinguishable skin diseases such as acne and eczema, rather than skin cancer screening. Compared with the smartphone diagnosis platform developed by Kim et al. [18], this system enhances spectral resolution and optimizes hardware design, focusing on acne and eczema—conditions that are far more challenging to diagnose clinically than seborrheic dermatitis and psoriasis. Unlike the open-source mobile system by Shen et al. [20], the light source structure and circuit design of this study are optimized for skin disease imaging, ensuring image acquisition consistency superior to general biological sample detection systems. Different from the animal skin disease classification algorithm proposed by Hwang et al. [22], this method prioritizes model interpretability and is only applicable to human skin diseases. Unlike the subsequent research by Rey-Barroso [23], this study focuses on common skin diseases with high visual similarity, thus having broader clinical application value.
The proposed multi-model multi-layer network fusion algorithm adopts a three-layer architecture composed of sub-classifiers, stacked classifiers, and meta-classifiers, achieving a diagnostic accuracy of 0.8622 and an AUC-ROC value of 0.9143. This architecture enhances decision transparency through multi-model fusion and wavelength contribution analysis.
4. Conclusions and Future Works
This study has developed a complete multi-spectral skin disease detection system based on deep learning. This system not only accurately acquires multi-spectral skin images but also provides reliable auxiliary diagnostic suggestions for clinicians. On this basis, we have designed a multi-model, multi-layer network fusion classification algorithm with interpretability at its core. This algorithm effectively integrates the outputs of multiple CNN sub-models and traditional machine learning classifiers through a three-level hierarchical architecture of sub-classifiers, stacked classifiers, and meta-classifiers, thereby more fully capturing the compositional differences between different lesion tissues, enhancing the comprehensive analysis ability of multi-spectral data, and significantly improving the accuracy and robustness of classification. Future research will further expand the scale and diversity of the dataset, including collaborating with more clinical institutions in various regions to systematically collect data from different races, skin colours, and geographical areas, and increase the coverage of disease categories. It will also attempt to actively explore multimodal fusion technology to continuously enhance the clinical application value of the system. Only through such efforts can a truly robust, fair, and globally clinically valuable auxiliary diagnostic tool be gradually established.
Author Contributions
Conceptualization, Y.Z. and X.T.; methodology, G.Y.; software, Q.Z.; validation, Y.Z., X.T. and S.D.; formal analysis, Q.Z.; investigation, S.D.; resources, S.D.; data curation, G.Y.; writing—original draft preparation, Y.Z.; writing—review and editing, X.T.; visualization, Q.Z.; supervision, S.D.; project administration, X.T.; funding acquisition, S.D. All authors have read and agreed to the published version of the manuscript.
Funding
This work was supported in part by Guangxi Science and Technology Program Project AD25069073, NSFC under Grants 62364006, U23A20282, 62005057, and 61964005, and in part by under Grants AB21076005 and 2019GXNSFBA245057, and in part by Guangxi Talent Project.
Institutional Review Board Statement
The study was conducted in accordance with the Declaration of Helsinki and approved by the Scientific Research Ethics Review Committee of the 924th Hospital of the Joint Logistics Support Force of the Chinese People’s Liberation Army (Approval No.: 2024-108]) for studies involving humans.
Informed Consent Statement
Informed consent was obtained from all subjects involved in the study.
Data Availability Statement
The multispectral image dataset collected and analyzed in this study is currently not available to the public due to ethical restrictions and patient privacy protection. Requests for controlled access to de-identified data for legitimate research purposes can be submitted to the corresponding author, but they must undergo review and obtain the necessary ethical approval.
Conflicts of Interest
The authors declare no conflicts of interest. The funders had no role in the design of the study; in the collection, analyses, or interpretation of data; in the writing of the manuscript; or in the decision to publish the results.
References
- Yakupu, A.; Aimaier, R.; Yuan, B.; Chen, B.; Cheng, J.; Zhao, Y.; Peng, Y.; Dong, J.; Lu, S. The burden of skin and subcutaneous diseases: Findings from the global burden of disease study 2019. Front. Public Health 2023, 11, 1145513. [Google Scholar] [CrossRef] [Scilit] [PubMed]
- Bhate, K.; Williams, H. Epidemiology of acne vulgaris. Br. J. Dermatol. 2013, 168, 474–485. [Google Scholar] [CrossRef] [Scilit] [PubMed]
- Nutten, S. Atopic dermatitis: Global epidemiology and risk factors. Ann. Nutr. Metab. 2015, 66, 8–16. [Google Scholar] [CrossRef] [Scilit] [PubMed]
- Bickers, D.R.; Lim, H.W.; Margolis, D.; Weinstock, M.A.; Goodman, C.; Faulkner, E.; Dall, T. The burden of skin diseases: 2004: A joint project of the American Academy of Dermatology Association and the Society for Investigative Dermatology. J. Am. Acad. Dermatol. 2006, 55, 490–500. [Google Scholar] [CrossRef] [Scilit]
- Harrington, E.; Clyne, B.; Wesseling, N.; Sandhu, H.; Armstrong, L.; Bennett, H.; Fahey, T. Diagnosing malignant melanoma in ambulatory care: A systematic review of clinical prediction rules. BMJ Open 2017, 7, e014096. [Google Scholar] [CrossRef] [Scilit]
- Koelink, C.J.; Kollen, B.J.; Groenhof, F.; van der Meer, K.; van der Heide, W.K. Skin lesions suspected of malignancy: An increasing burden on general practice. BMC Fam. Pract. 2014, 15, 29. [Google Scholar] [CrossRef] [Scilit]
- Eita, M.A.; Rizk, H. A trustworthy and explainable deep learning framework for skin lesion detection in smart dermatology. Eng. Appl. Artif. Intell. 2025, 159, 111594. [Google Scholar] [CrossRef] [Scilit]
- Okuboyejo, D.A.; Olugbara, O.O.; Odunaike, S.A. Automating skin disease diagnosis using image classification. In Proceedings of the World Congress on Engineering and Computer Science, San Francisco, CA, USA, 23–25 October 2013. [Google Scholar]
- Li, H.; Pan, Y.; Zhao, J.; Zhang, L. Skin disease diagnosis with deep learning: A review. Neurocomputing 2021, 464, 364–393. [Google Scholar] [CrossRef] [Scilit]
- Goceri, E. Diagnosis of skin diseases in the era of deep learning and mobile technology. Comput. Biol. Med. 2021, 134, 104458. [Google Scholar] [CrossRef] [Scilit]
- Liu, Y.; Jain, A.; Eng, C.; Way, D.H.; Lee, K.; Bui, P.; Coz, D. A deep learning system for differential diagnosis of skin diseases. Nat. Med. 2020, 26, 900–908. [Google Scholar] [CrossRef] [Scilit]
- Wu, Z.; Zhao, S.; Peng, Y.; He, X.; Zhao, X.; Huang, K. Studies on different CNN algorithms for face skin disease classification based on clinical images. IEEE Access 2019, 7, 66505–66511. [Google Scholar] [CrossRef] [Scilit]
- Monsalve, M.A.T.; Osorio, G.; Montes, N.L.; Lopez, S.; Cubero, S.; Blasco, J. Characterization of a multispectral imaging system based on narrow bandwidth power LEDs. IEEE Trans. Instrum. Meas. 2020, 70, 2000111. [Google Scholar] [CrossRef] [Scilit]
- Theckedath, D.; Sedamkar, R. Detecting affect states using VGG16, ResNet50 and SE-ResNet50 networks. SN Comput. Sci. 2020, 1, 79. [Google Scholar] [CrossRef] [Scilit]
- Rey-Barroso, L.; Burgos-Fernández, F.J.; Delpueyo, X.; Ares, M.; Royo, S.; Malvehy, J.; Vilaseca, M. Visible and extended near-infrared multispectral imaging for skin cancer diagnosis. Sensors 2018, 18, 1441. [Google Scholar] [CrossRef] [Scilit]
- Uemori, T.; Ito, A.; Moriuchi, Y.; Gatto, A.; Murayama, J. Skin-based identification from multispectral image data using CNNs. In Proceedings of the IEEE/CVF Conference on Computer Vision and Pattern Recognition, Long Beach, CA, USA, 16–20 June 2019. [Google Scholar]
- Setiadi, I.C.; Nasution, A.M.; Chandra, T.G. A new LED-based multispectral imaging system for blood and melanin content estimation: The validation. In Proceedings of the AIP Conference Proceedings, St. Petersburg, Russia, 18–20 September 2019; AIP Publishing: New York, NY, USA, 2019. [Google Scholar] [CrossRef] [Scilit]
- Kim, S.; Kim, J.; Hwang, M.; Kim, M.; Jin Jo, S.; Je, M.; Hwang, J.Y. Smartphone-based multispectral imaging and machine-learning based analysis for discrimination between seborrheic dermatitis and psoriasis on the scalp. Biomed. Opt. Express 2019, 10, 879–891. [Google Scholar] [CrossRef] [Scilit]
- Bondarenko, A.; Chizhov, Y.; Uteshev, D.; Bliznuks, D.; Lihachev, A.; Lihacova, I. Use of machine learning approaches to improve non-invasive skin melanoma diagnostic method in spectral range 450–950 nm. In Proceedings of the Optics, Photonics and Digital Technologies for Imaging Applications, Virtual, 6–10 April 2020; SPIE: Cergy, France, 2020. [Google Scholar] [CrossRef] [Scilit]
- Shen, F.; Deng, H.; Yu, L.; Cai, F. Open-source mobile multispectral imaging system and its applications in biological sample sensing. Spectrochim. Acta Part A Mol. Biomol. Spectrosc. 2022, 280, 121504. [Google Scholar] [CrossRef] [Scilit]
- Ma, C.; Yu, M.; Chen, F.; Lin, H. An Efficient and Portable LED Multispectral Imaging System and Its Application to Human Tongue Detection. Appl. Sci. 2022, 12, 3552. [Google Scholar] [CrossRef] [Scilit]
- Hwang, S.; Shin, H.K.; Park, J.M.; Kwon, B.; Kang, M.G. Classification of dog skin diseases using deep learning with images captured from multispectral imaging device. Mol. Cell. Toxicol. 2022, 18, 299–309. [Google Scholar] [CrossRef] [Scilit]
- Rey Barroso, L.; Vilaseca Ricart, M.; Royo Royo, S.; Puig Sardá, S.; Malvehy Guilera, J.; Pellacani, G.; Burgos Fernández, F.J. Training deep learning algorithms with multispectral dataset of skin lesions for the improvement of skin cancer diagnosis. In Proceedings of the Translational Biophotonics: Diagnostics and Therapeutics III, Munich, Germany, 25–29 June 2024; SPIE: Cergy, France, 2024. [Google Scholar] [CrossRef] [Scilit]
- Jiang, Z.; Gu, X.; Chen, D.; Zhang, M.; Xu, C. Deep learning-assisted multispectral imaging for early screening of skin diseases. Photodiagnosis Photodyn. Ther. 2024, 48, 104292. [Google Scholar] [CrossRef] [Scilit]
- Hsu, C.K.; Tzeng, S.Y.; Yang, C.C.; Lee, J.Y.Y.; Huang, L.L.H.; Chen, W.R.; Tseng, S.H. Non-invasive evaluation of therapeutic response in keloid scar using diffuse reflectance spectroscopy. Biomed. Opt. Express 2015, 6, 390–404. [Google Scholar] [CrossRef] [Scilit]
- Yao, J.; Wang, L.V. Photoacoustic microscopy. Laser Photonics Rev. 2013, 7, 758–778. [Google Scholar] [CrossRef] [Scilit]
- Farina, B.; Bartoli, C.; Bono, A.; Colombo, A.; Lualdi, M.; Tragni, G.; Tragni, G. Multispectral imaging approach in the diagnosis of cutaneous melanoma: Potentiality and limits. Phys. Med. Biol. 2000, 45, 1243. [Google Scholar] [CrossRef] [Scilit]
- Tomatis, S.; Bono, A.; Bartoli, C.; Carrara, M.; Lualdi, M.; Tragni, G.; Marchesini, R. Automated melanoma detection: Multispectral imaging and neural network approach for classification. Med. Phys. 2003, 30, 212–221. [Google Scholar] [CrossRef] [Scilit]
- Monheit, G.; Cognetta, A.B.; Ferris, L.; Rabinovitz, H.; Gross, K.; Martini, M.; Gutkowicz-Krusin, D. The performance of MelaFind: A prospective multicenter study. Arch. Dermatol. 2011, 147, 188–194. [Google Scholar] [CrossRef] [Scilit]
- Kapsokalyvas, D.; Bruscino, N.; Alfieri, D.; de Giorgi, V.; Cannarozzo, G.; Cicchi, R.; Pavone, F.S. Spectral morphological analysis of skin lesions with a polarization multispectral dermoscope. Opt. Express 2013, 21, 4826–4840. [Google Scholar] [CrossRef] [Scilit] [PubMed]
- Jolivot, R.; Benezeth, Y.; Marzani, F. Skin parameter map retrieval from a dedicated multispectral imaging system applied to dermatology/cosmetology. J. Biomed. Imaging 2013, 2013, 978289. [Google Scholar] [CrossRef] [Scilit] [PubMed]
- He, K.; Zhang, X.; Ren, S.; Sun, J. Deep residual learning for image recognition. In Proceedings of the IEEE Conference on Computer Vision and Pattern Recognition, Las Vegas, NV, USA, 27–30 June 2016. [Google Scholar] [CrossRef] [Scilit]
- Jaworek-Korjakowska, J.; Brodzicki, A.; Cassidy, B.; Kendrick, C.; Yap, M.H. Interpretability of a Deep Learning Based Approach for the Classification of Skin Lesions into Main Anatomic Body Sites. Cancers 2021, 13, 6048. [Google Scholar] [CrossRef] [Scilit] [PubMed]
- Gawali, C.J.; Subbulakshmi, S. Enhancing Diagnosis of Infectious Skin Disease: A Professional Approach using Deep Learning for Leprosy Detection. In Proceedings of the 2024 15th International Conference on Computing Communication and Networking Technologies (ICCCNT), Kamand, India, 24–28 June 2024; pp. 1–6. [Google Scholar] [CrossRef] [Scilit]
- Dos Santos, L.F.D.; dos Santos Canuto, J.L.; De Souza, R.C.T.; Aylon, L.B.R. Thermographic image-based diagnosis of failures in electrical motors using deep transfer learning. Eng. Appl. Artif. Intell. 2023, 126, 107106. [Google Scholar] [CrossRef] [Scilit]
Disclaimer/Publisher’s Note: The statements, opinions and data contained in all publications are solely those of the individual author(s) and contributor(s) and not of MDPI and/or the editor(s). MDPI and/or the editor(s) disclaim responsibility for any injury to people or property resulting from any ideas, methods, instructions or products referred to in the content. |
© 2026 by the authors. Licensee MDPI, Basel, Switzerland. This article is an open access article distributed under the terms and conditions of the Creative Commons Attribution (CC BY) license.