


Abstract
We present a flexible holographic system based on spatial frequency division multiplexing for single-shot, multi-depth, full-field tomographic imaging. In this system, a specially designed sequence light generator containing a group of optical path delayers and diffraction gratings is utilized to generate multiple specific off-axis reference beams. These beams feature various optical path lengths and tilted wavefronts carrying different spatial frequencies. Because of the coherence-gating property of low-coherence illumination, interference occurs only between reference and object beams with equal optical path lengths. The sample depth can be simply and flexibly controlled by adjusting the optical path delayers. In addition, the characteristic of a tilted wavefront enables this system to successfully overcome the walk-off effect caused by low-coherence illumination used in conventional off-axis holography. This facilitates full field-of-view imaging without mechanical motion in a single camera exposure. We demonstrate the capability of the proposed system for complex amplitude imaging of optically thick samples.
1. Introduction
The capability of optical sectioning imaging for three-dimensional (3D) samples has garnered increasing research interest in recent years, with applications ranging from structural analysis of cells, neural tissues, and pathological specimens in biomedicine [1] to the characterization and non-destructive testing of micro-nano materials [2]. Among the various developed 3D imaging methods, confocal laser scanning microscopy (CLSM) is one of the most widely used approaches [3]. Nevertheless, its point-scanning mechanism can induce inevitable photo-bleaching and photo-toxicity during volumetric imaging of thick biological samples [4]. To circumvent these limitations, light-sheet fluorescence microscopy (LSFM) confines laser excitation to a thin optical slice, thereby substantially reducing such photo-damage [5]. However, both LSFM and CLSM require axial scanning for 3D reconstruction, which leads to time-consuming acquisition and may introduce imaging artifacts due to mechanical motion.
As another established 3D imaging technique, optical coherence tomography (OCT) allows sample characterization under non-invasive or minimally invasive conditions [6,7]. In contrast to conventional OCT, full-field OCT is a technique that produces a single tomographic image in the en-face orientation without point-scanning by using full-field illumination and a two-dimensional image sensor [8,9]. Nevertheless, to acquire complete 3D tomographic data containing sample information at various depths, it is essential to carry out axial scanning. Unfortunately, measurement errors caused by mechanical scanning are introduced again.
Beyond OCT-based methods, optical diffraction tomography (ODT) has also attracted growing research interest [10,11]. It enables the reconstruction of the 3D refractive-index distribution of a specimen by using optical sectioning data obtained at different depths, which are reconstructed from diffraction fields captured under various illumination angles. Despite the ability of existing techniques to realize single-exposure ODT imaging without mechanical movement [12,13], the complex reconstruction pipeline requires high-performance hardware and results in a long computation time.
In addition to the aforementioned tomographic approaches, digital holography offers an alternative tool for 3D sample imaging [14]. In conventional digital holography, the complex wavefront of a 3D sample is obtained by recording the interference pattern formed between the object-scattered beam and a coherent reference beam. Although in-focus object fields can be readily reconstructed, signals arising from out-of-focus depths remain superimposed on every reconstructed z-plane. This out-of-focus information can only be isolated and recovered with dedicated numerical post-processing algorithms [15]. To suppress these artifacts, low-coherence holography combined with confocal filtering can produce thin optical sections [16]. Even so, this setup still requires mechanical volumetric scanning of the specimen, leading to long acquisition times and low imaging throughput.
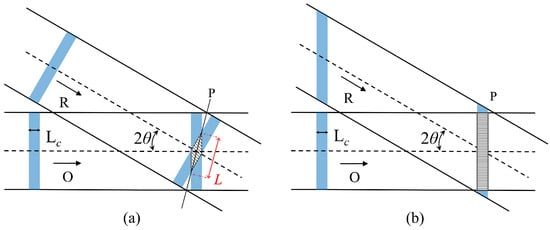
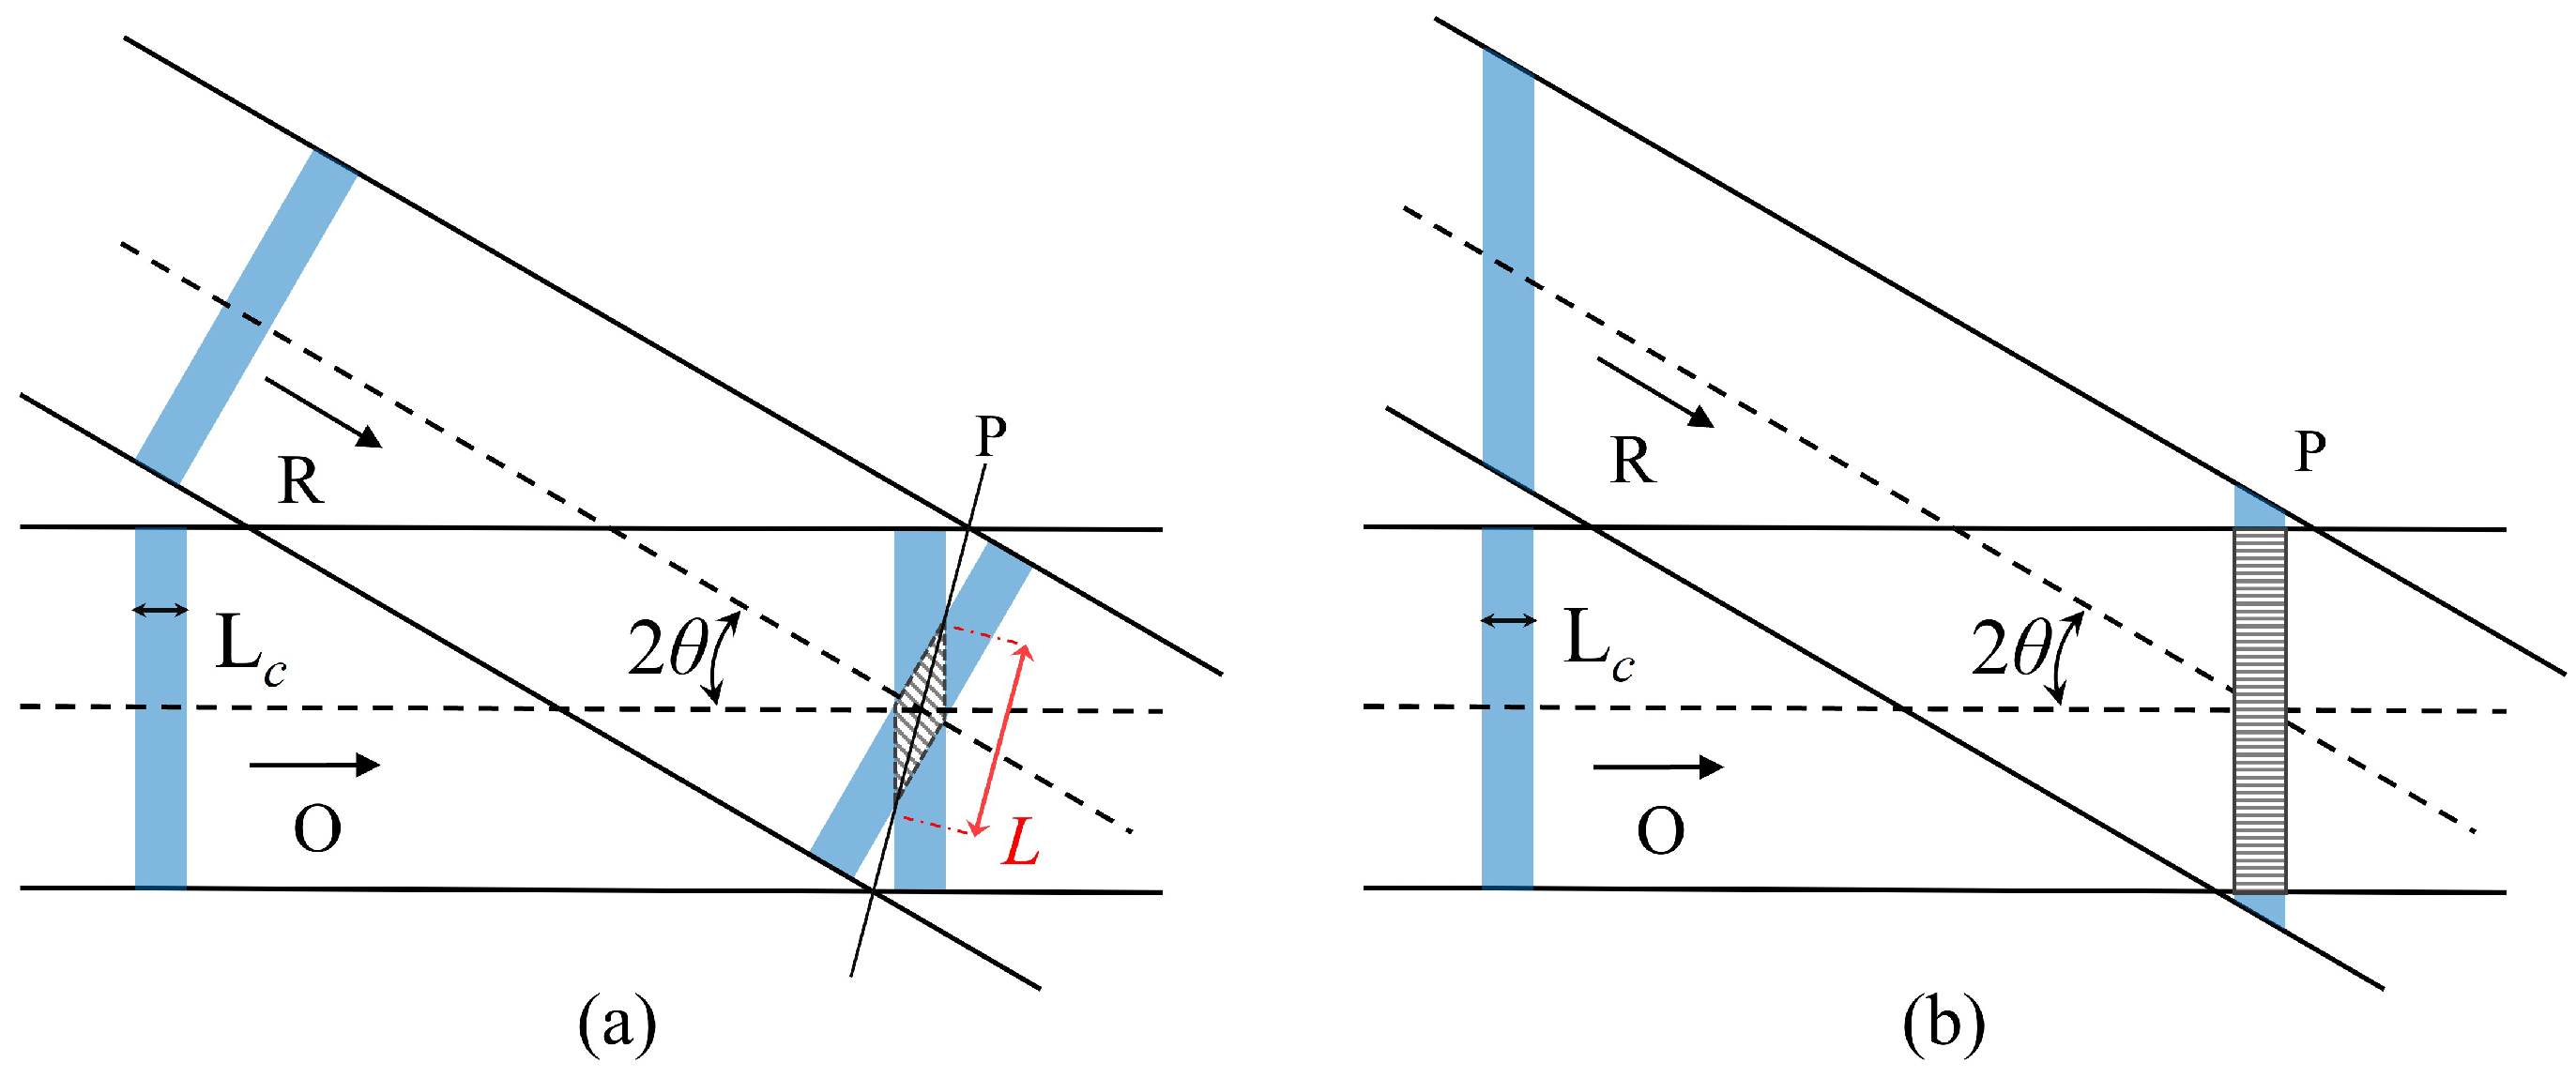
By contrast, spatial frequency division multiplexing (SFDM) holography can simultaneously capture and reconstruct multiple complex wavefronts of the tested sample within a single camera exposure [17]. When a low-coherence light source is adopted, SFDM can be combined with the full-field OCT to realize single-shot, multi-depth tomographic imaging. While this imaging modality has been demonstrated, it presents notable practical drawbacks. For instance, tuning the reference optical path causes deviations in the beam incidence angle [18], and the spacing between adjacent tomographic layers cannot be adjusted flexibly [19,20]. When imaging dynamic samples, pico- or femtosecond light sources with short pulse widths are commonly employed [21]. However, conventional SFDM holography then suffers from the walk-off effect [22]. The high-contrast fringes appear only at locations where the optical path lengths of the object and reference beams are perfectly matched. Fringe contrast decreases sharply as the optical path difference increases, limiting interference to a small rhomboidal region of beam overlap, as shown in Figure 1a. The maximum lateral extent of the interference region within the recording plane (P) can be expressed as: [23], where presents the the coherence length of the light source and the denotes the half of the off-axis angle between the reference beam (R) and the object beam (O), which significantly degrades the field of view.
Figure 1.
(a) Walk-off effect of low-coherence source in conventional off-axis recording geometry. (b) Local enlarged drawing of the SFDM hologram in our system.
In this paper, we propose a flexibly tunable system with a large field of view for realizing single-shot, multi-depth, full-field tomographic imaging (SMFTI). The key component of the system is a specially designed sequence light generator (SLG) unit, in which each optical path delay and diffraction grating can be individually adjusted to generate reference beams with optimal optical path lengths and tilted wavefronts. The former enables matching with object sub-beams from different depths without directional deviation, streamlining alignment. The latter overcomes the walk-off effect in conventional low-coherence off-axis holography to realize full-field complex amplitude imaging, as shown in Figure 1b. Coupled with the subsequently designed multiplexing holographic imaging (MHI) unit, we have constructed the SMFTI system and demonstrated its feasibility in achieving complex amplitude imaging of multi-depth optically thick samples.
2. Methods
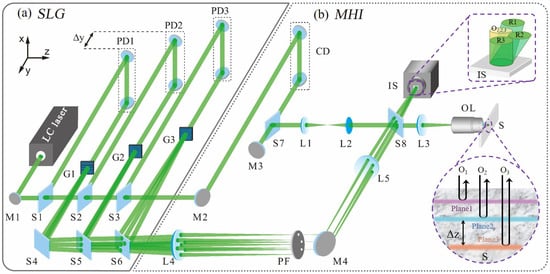
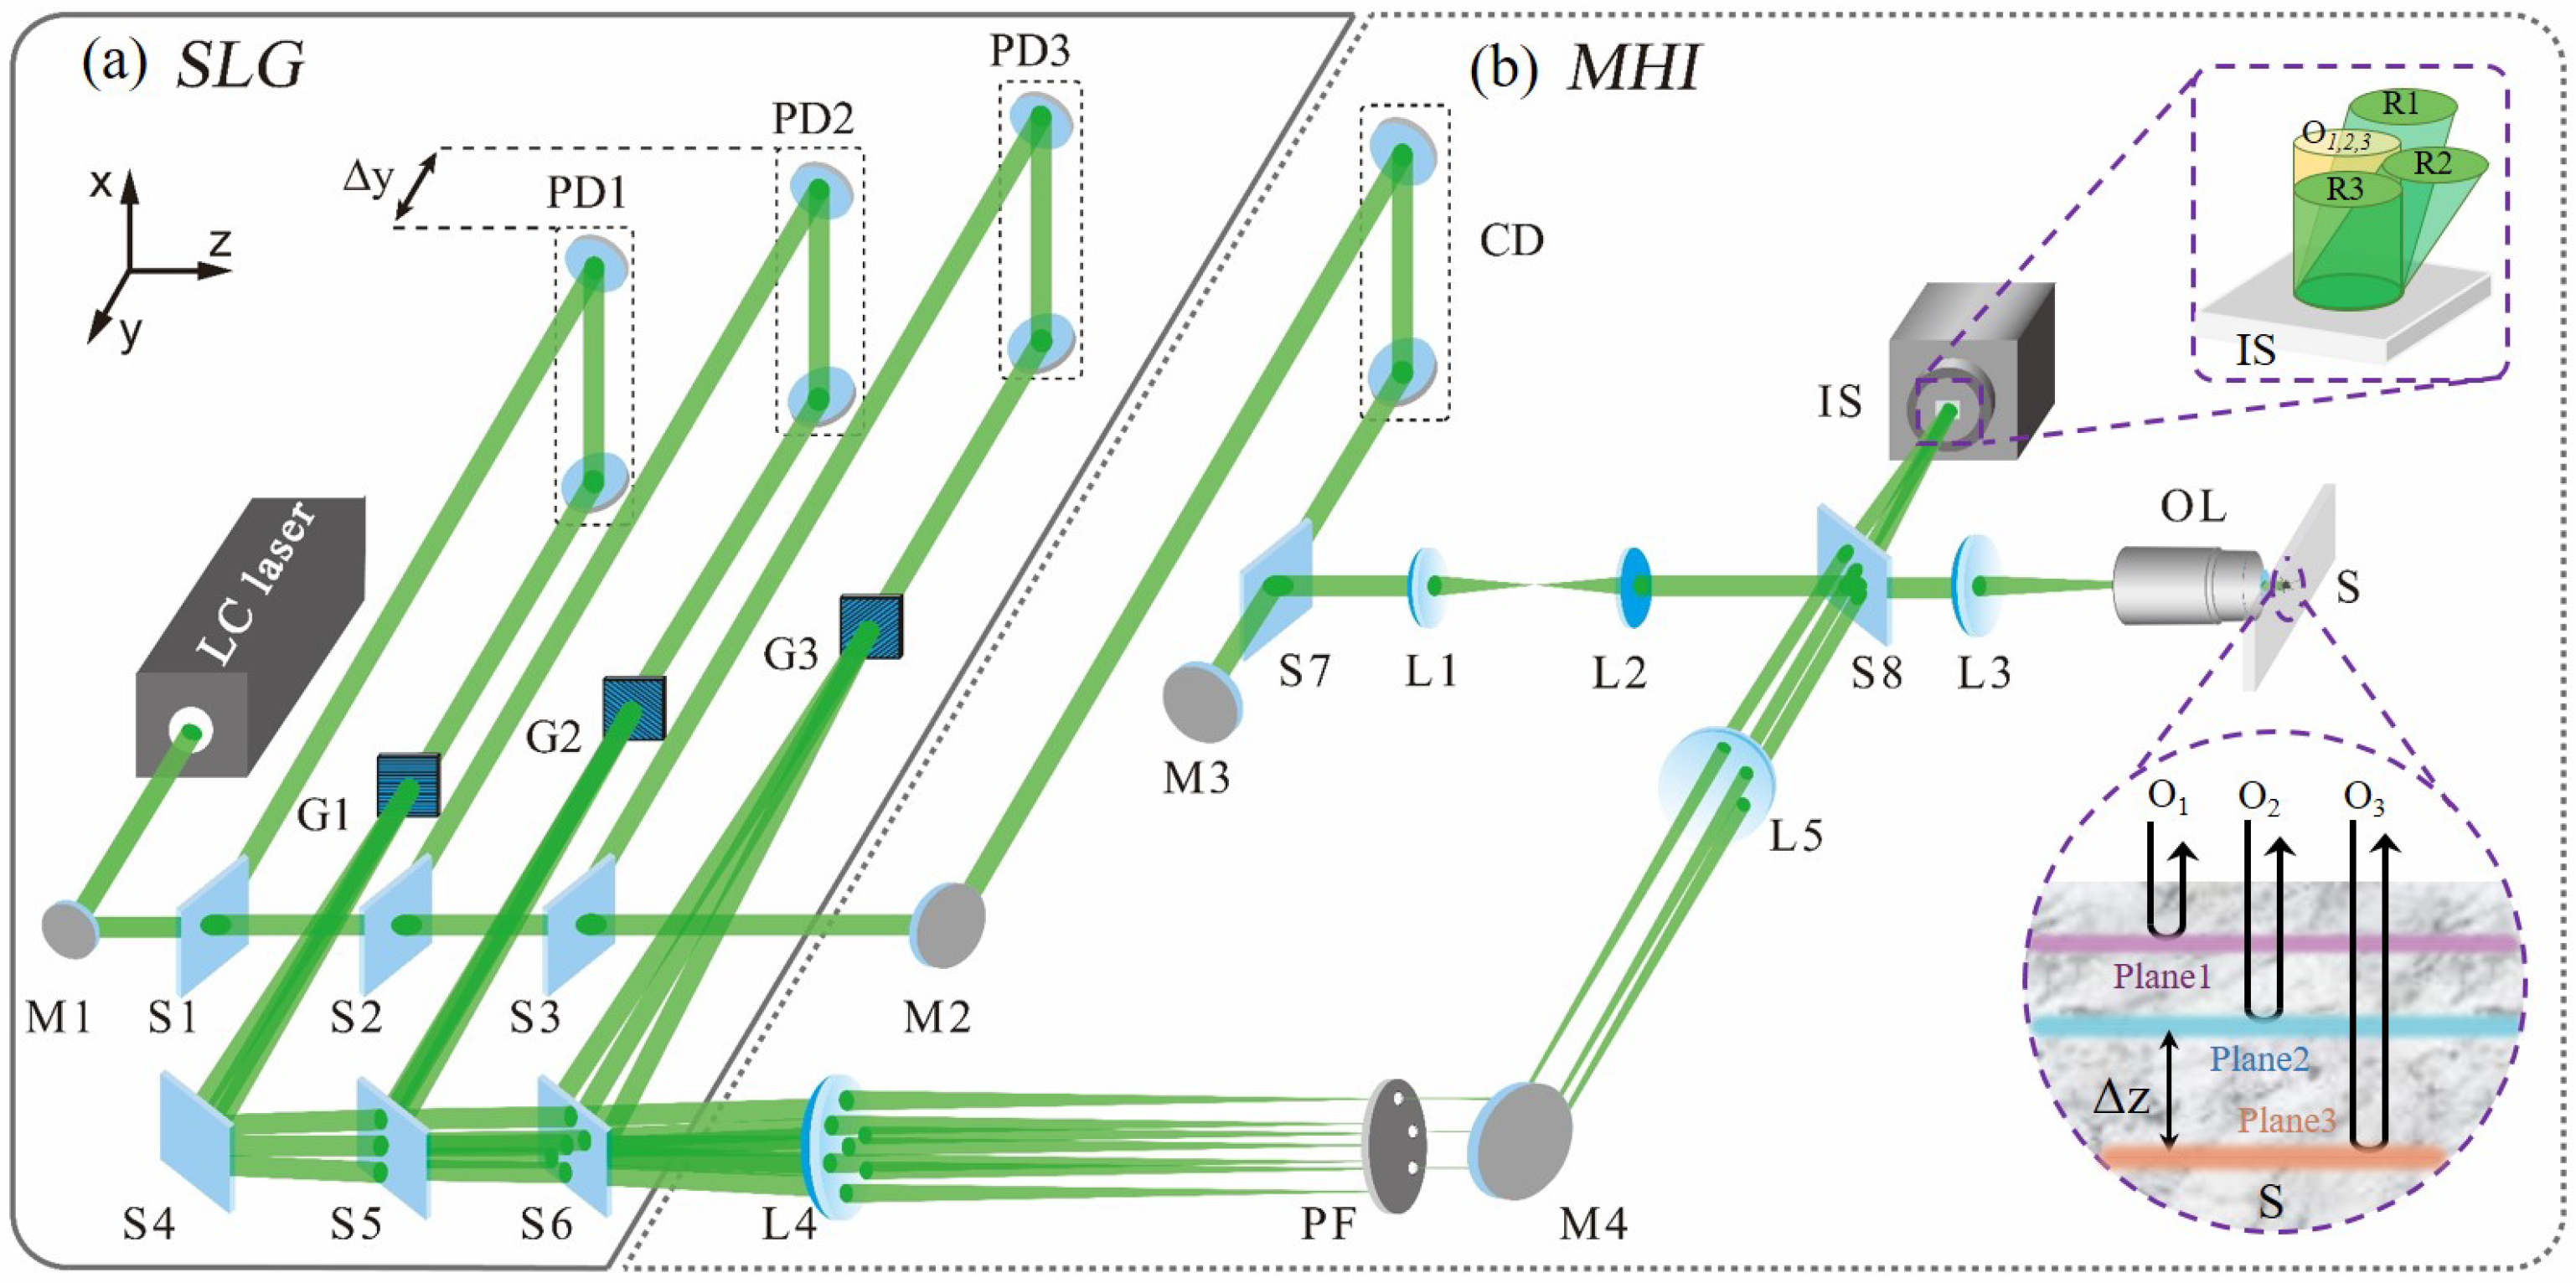
Figure 2 illustrates a schematic diagram of our proposed SMFTI system. Firstly, the input beam from a low-coherence laser source with a coherence length of passes through a specially designed SLG unit, as shown in Figure 2a. The unit consists of 2N beam splitters (S1–S2N), N path delayers (PD1–PDN) and N diffraction gratings (G1–GN). Using this unit, a train of N sub-beams can be successively split out by the beam splitters S1–SN. The optical path difference among the sub-beams can be greatly adjusted by the optical-path delayers PD1–PDN, respectively. Because of the diffraction effect of the gratings G1–GN inserted later, on the one hand, these sub-beams can generate a train of high-order beams that will be further evolved into a group of off-axis reference beams required for recording an SFDM hologram in the following MHI unit.
Figure 2.
The schematic diagram of the SMFTI system.
Based on the Linnik-type Michelson interferometric microscope, we designed an MHI unit shown in Figure 2b to realize SMFTI. The output beams are split by the beam splitters Sn and S2n in the preceding SLG unit, and then guided into the object arm and the reference arm of the MHI unit, respectively. In the object arm, a microscope objective lens (OL) is placed at the front of the sample (S), which can achieve full-field illumination and high lateral-resolution imaging. The transmitted beam passes through the OL and then illuminates the sample vertically. The back-reflected beams from the target sample at multiple depth planes, as shown in the bottom right of Figure 2b, will become sequential coaxial object beams with different optical path lengths. Then, these sequential object beams will be delivered to the recording plane of the imaging sensor (IS) by the OL and lens L3. In the reference arm, a pair of Fourier lenses (L4 and L5) is embedded between the gratings inserted in the SLG unit and the IS, which are configured as follows: each grating is placed at the front focal plane of L4, and the record plane of IS is located at the back focal plane of L5. Here, a 4f imaging system composed of L4 and L5 can be constructed. And then, a multi-pinhole filter (PF) is placed at the back focal plane of L4, which will filter partial high-order beams generated from gratings (e.g., all the first diffraction orders). This process cleans the wavefront, enhancing fringe visibility and improving imaging quality. These selected beams will serve as the ideal sequential off-axis reference beams for the SFDM holographic recording. After passing through L5, these filtered off-axis reference beams converge on the recording plane of IS and overlap with the coaxial object beams from the object arm, as shown in the upper-right corner of Figure 2b. It is worth noting that these off-axis reference beams generated from the diffraction gratings are encoded as a tilted wavefront. This configuration aligns the coherent planes of the object and reference sub-beams to be parallel at the IS recording plane, enabling high-contrast interference fringes to be acquired over the full field of view, as shown in Figure 1b.
The PDs mentioned previously will collaborate with an optical coherence delayer (CD) installed in the object arm: the former allow the optical path length of the corresponding reference beams to be independently and greatly adjusted; the CD can ensure that the optical path difference between the reference beams and object beams meets the interference. If the carrier frequencies of the gratings take different values, an ideal single-shot off-axis SFDM hologram containing N sub-holograms can be recorded by the IS. It can be expressed as:
where the first and second terms are the autocorrelation terms; the asterisk ∗ indicates the complex conjugate operator; is the complex amplitude distribution of the reference sub-beam originating from grating Gn; denotes the total optical path length of this reference beam from the corresponding grating plane to the recording plane; and represents the wavevector on the recording plane of this reference sub-beam. stands for the complex amplitude distribution of the object beam with a total optical path length of , which corresponds to a sample depth of . Since each reference (or object) sub-beam possesses a distinct optical path length , the temporal coherence condition dictates that the n-th object sub-beam and the n-th reference sub-beam have the following relationships:
That is, only the object beam with the optical path length and the reference beam with the same optical path length will interact on the IS. Thus, utilizing the relations given in Equation (2), a sub-hologram is generated that encodes the sample information with a spatial frequency and a sample depth .
Suppose the optical path difference between the adjacent reference beams is set as , where is the displacement of the PDs, as shown in the upper left corner of Figure 2a. The space interval between recorded sample layers also can be calculated as
where denotes the refractive index of the measured sample. Therefore, adjustment of the PDs within the SLG unit generates variable optical path lengths for separate reference sub-beams, enabling flexible acquisition of sample data at different depths. When , the axial depth-gating range can also be calculated from Equation (3).
Furthermore, to improve light utilization efficiency, shorten the camera exposure time, and suppress motion artifacts, the optical parameters of optical components within the system need to be optimized, especially the beam splitters integrated in the SLG unit. As shown in Figure 2a, the input beam will be split into N independently encodable sub-beams. Each sub-beam undergoes identical optical modulation processes: two mirror reflections within the path delay (PD), diffraction at the transmission grating (G), and two reflections plus N-1 transmissions caused by the beam splitter (S). Suppose the intensity of the input beam is , all identical optical elements share the same optical parameters, and no light loss occurs as the beam passes through the beam splitters. The intensity of each generated sub-beam can be expressed as:
where denotes the reflectivity of mirrors inside the three-dimensional delay line, represents the diffraction efficiency of the m-th diffraction order of the transmission grating, and r stands for the reflectivity of beam splitters.
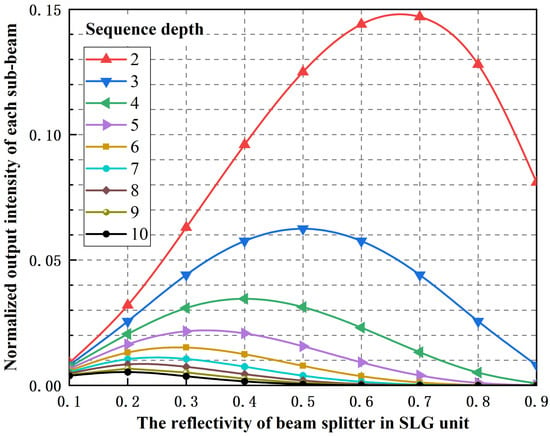
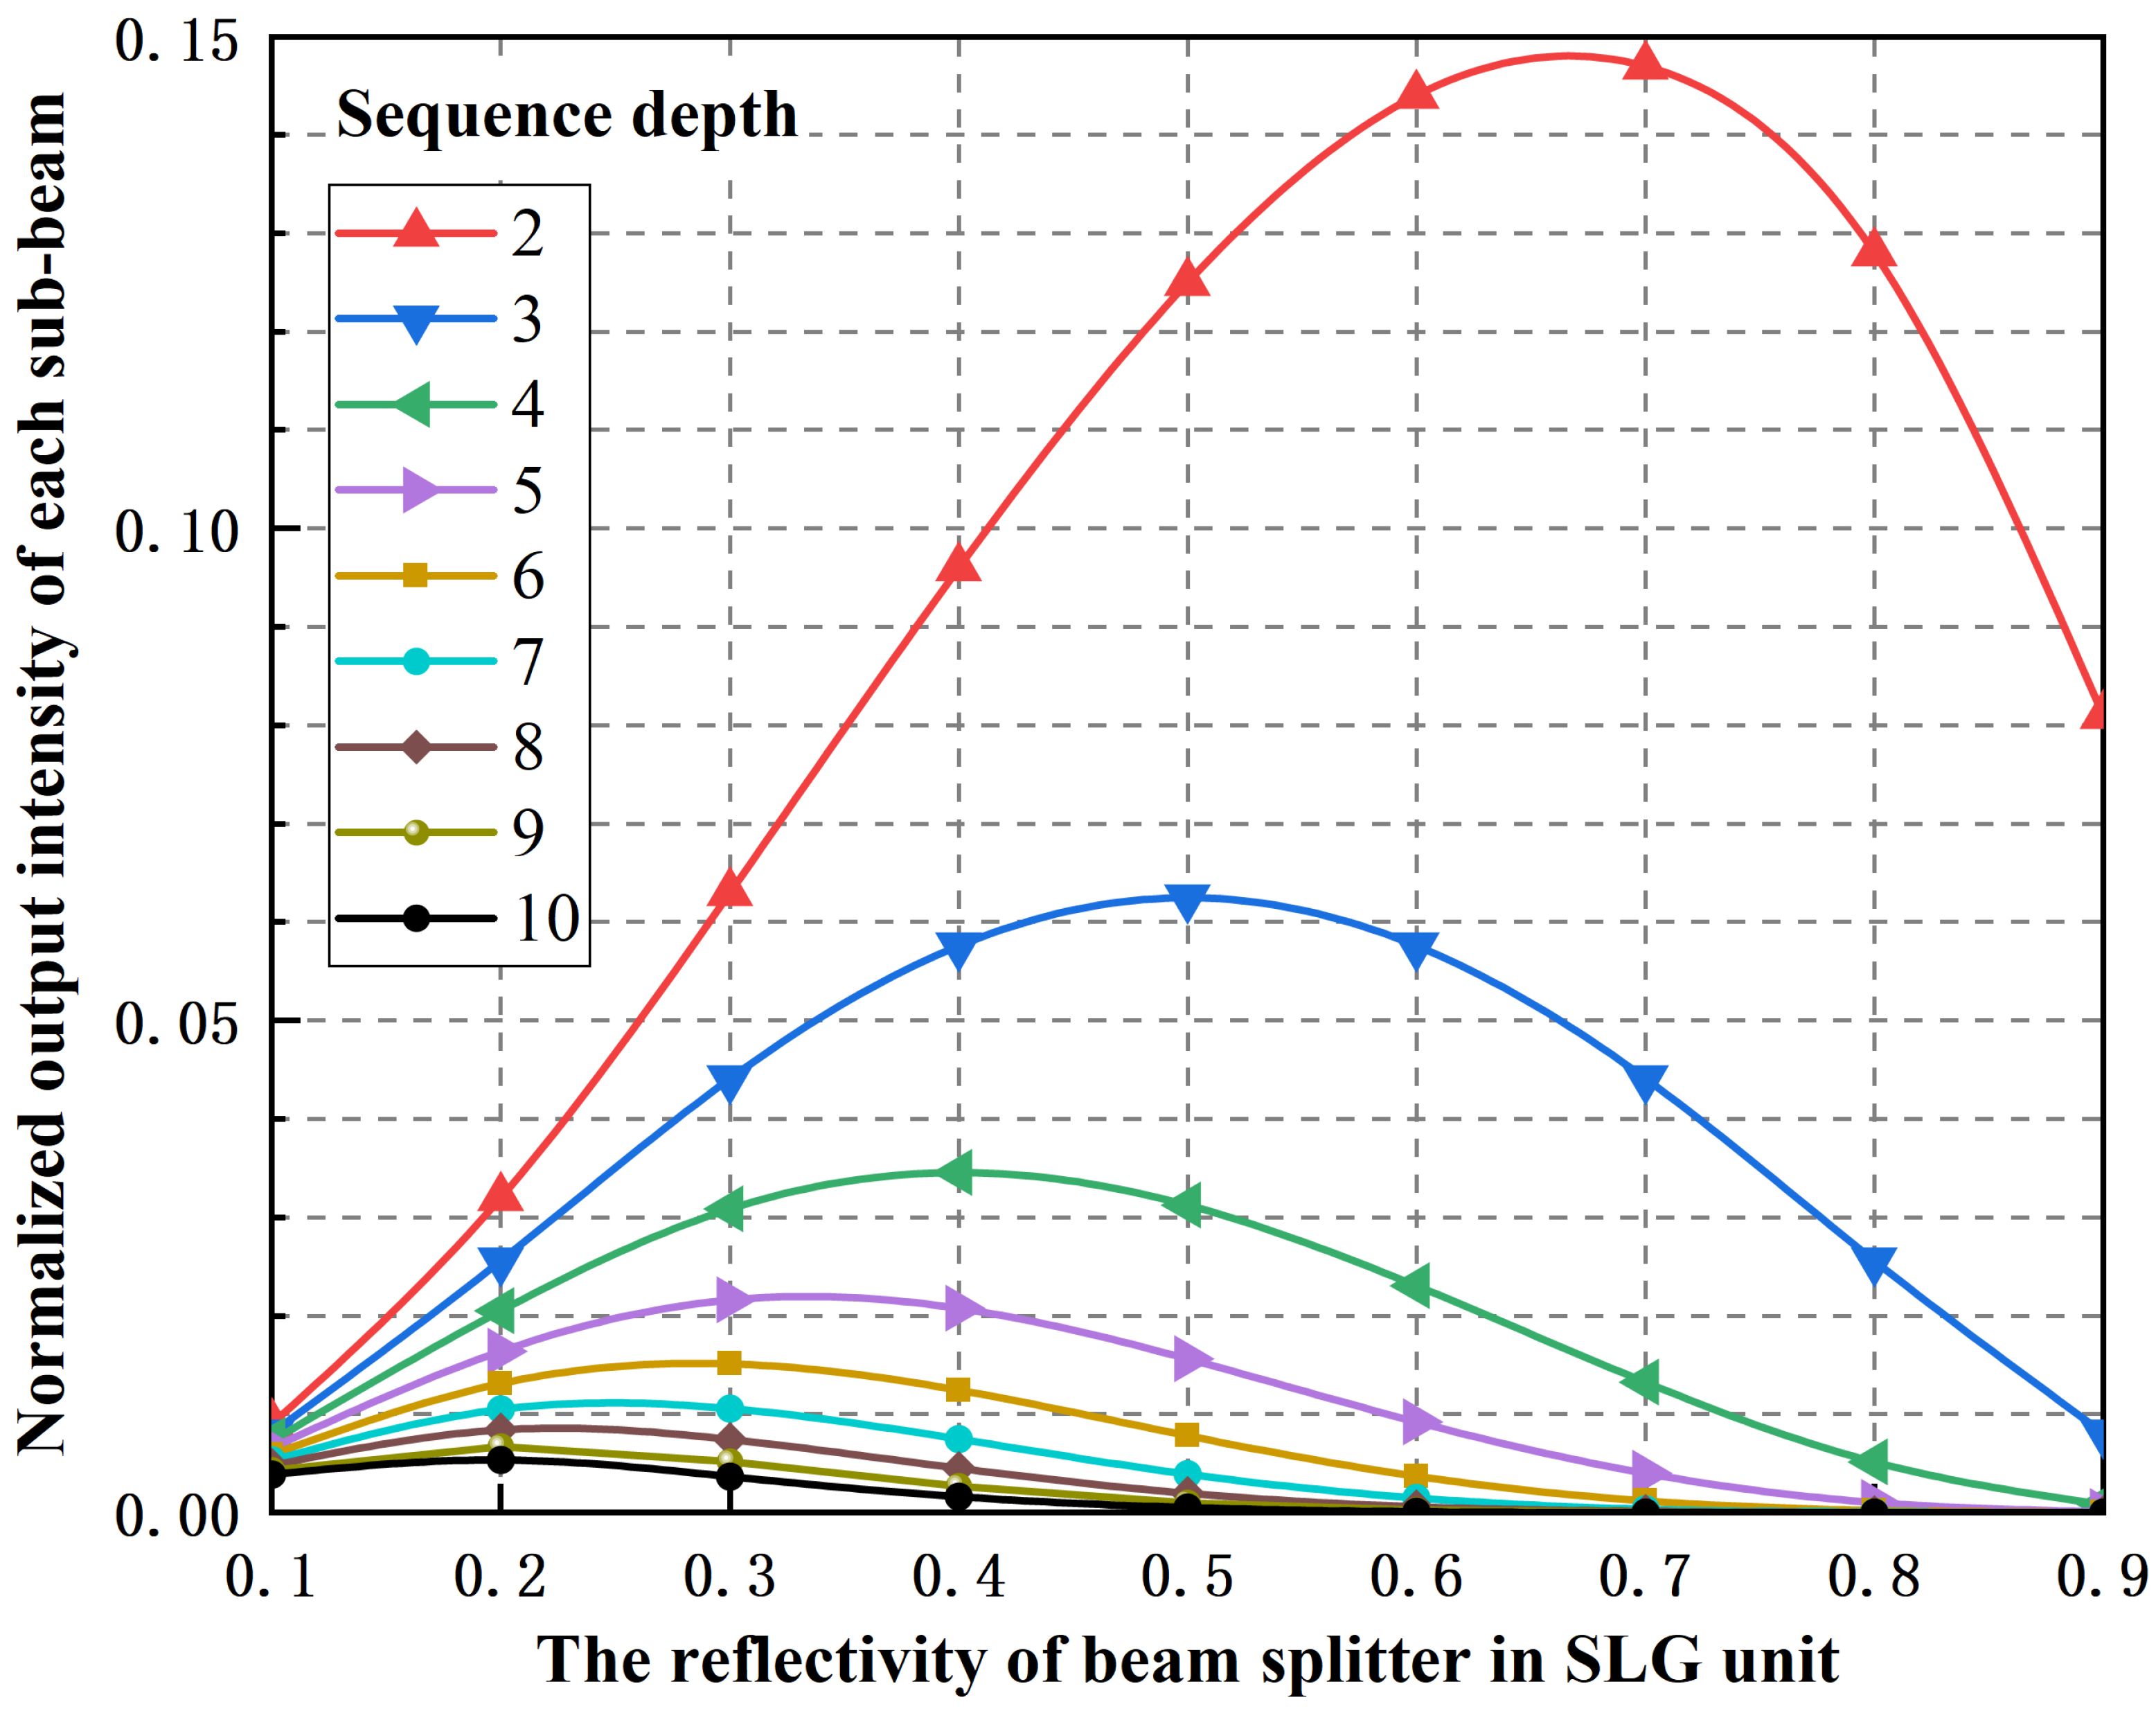
A simple analysis of the optical parameters in the above equation indicates that the beam splitter reflectivity is the key parameter to be optimized. Based on Equation (4), Figure 3 illustrates the normalized light intensity of each sub-beam corresponding to various reflectivities of beam splitters and different sequence depths. As clearly illustrated, when different sequence depths are applied to the SLG unit, the normalized light intensity of each sub-beam reaches its maximum only at a specific reflectivity of the beam splitter. To further quantify the relationship between the optimal reflectivity of beam splitters and the sequence depths, we need to differentiate Equation (3) with respect to the reflectivity r:
Figure 3.
The normalized output intensity of each sub-beam with various sub-beams quantities and different reflectivity ratios of beam splitters.
By equating Equation (5) to zero, we can further obtain:
As calculated using Equation (6), Table 1 further presents the details of the optimal beam-splitter reflectivity and the corresponding maximum light intensity at different sequential depths. As an example, for a sequential depth of , the optimal beam-splitter reflectivity is , which aligns well with the normalized intensity distribution shown in Figure 3.
Table 1.
Optimal beam splitter reflectivity and corresponding light intensity extrema at different sequential depths.
3. Experiment and Results
3.1. Experiment Configuration
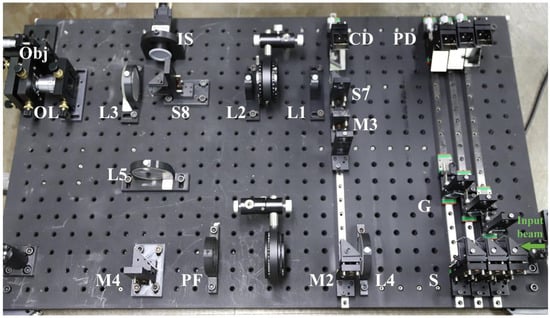
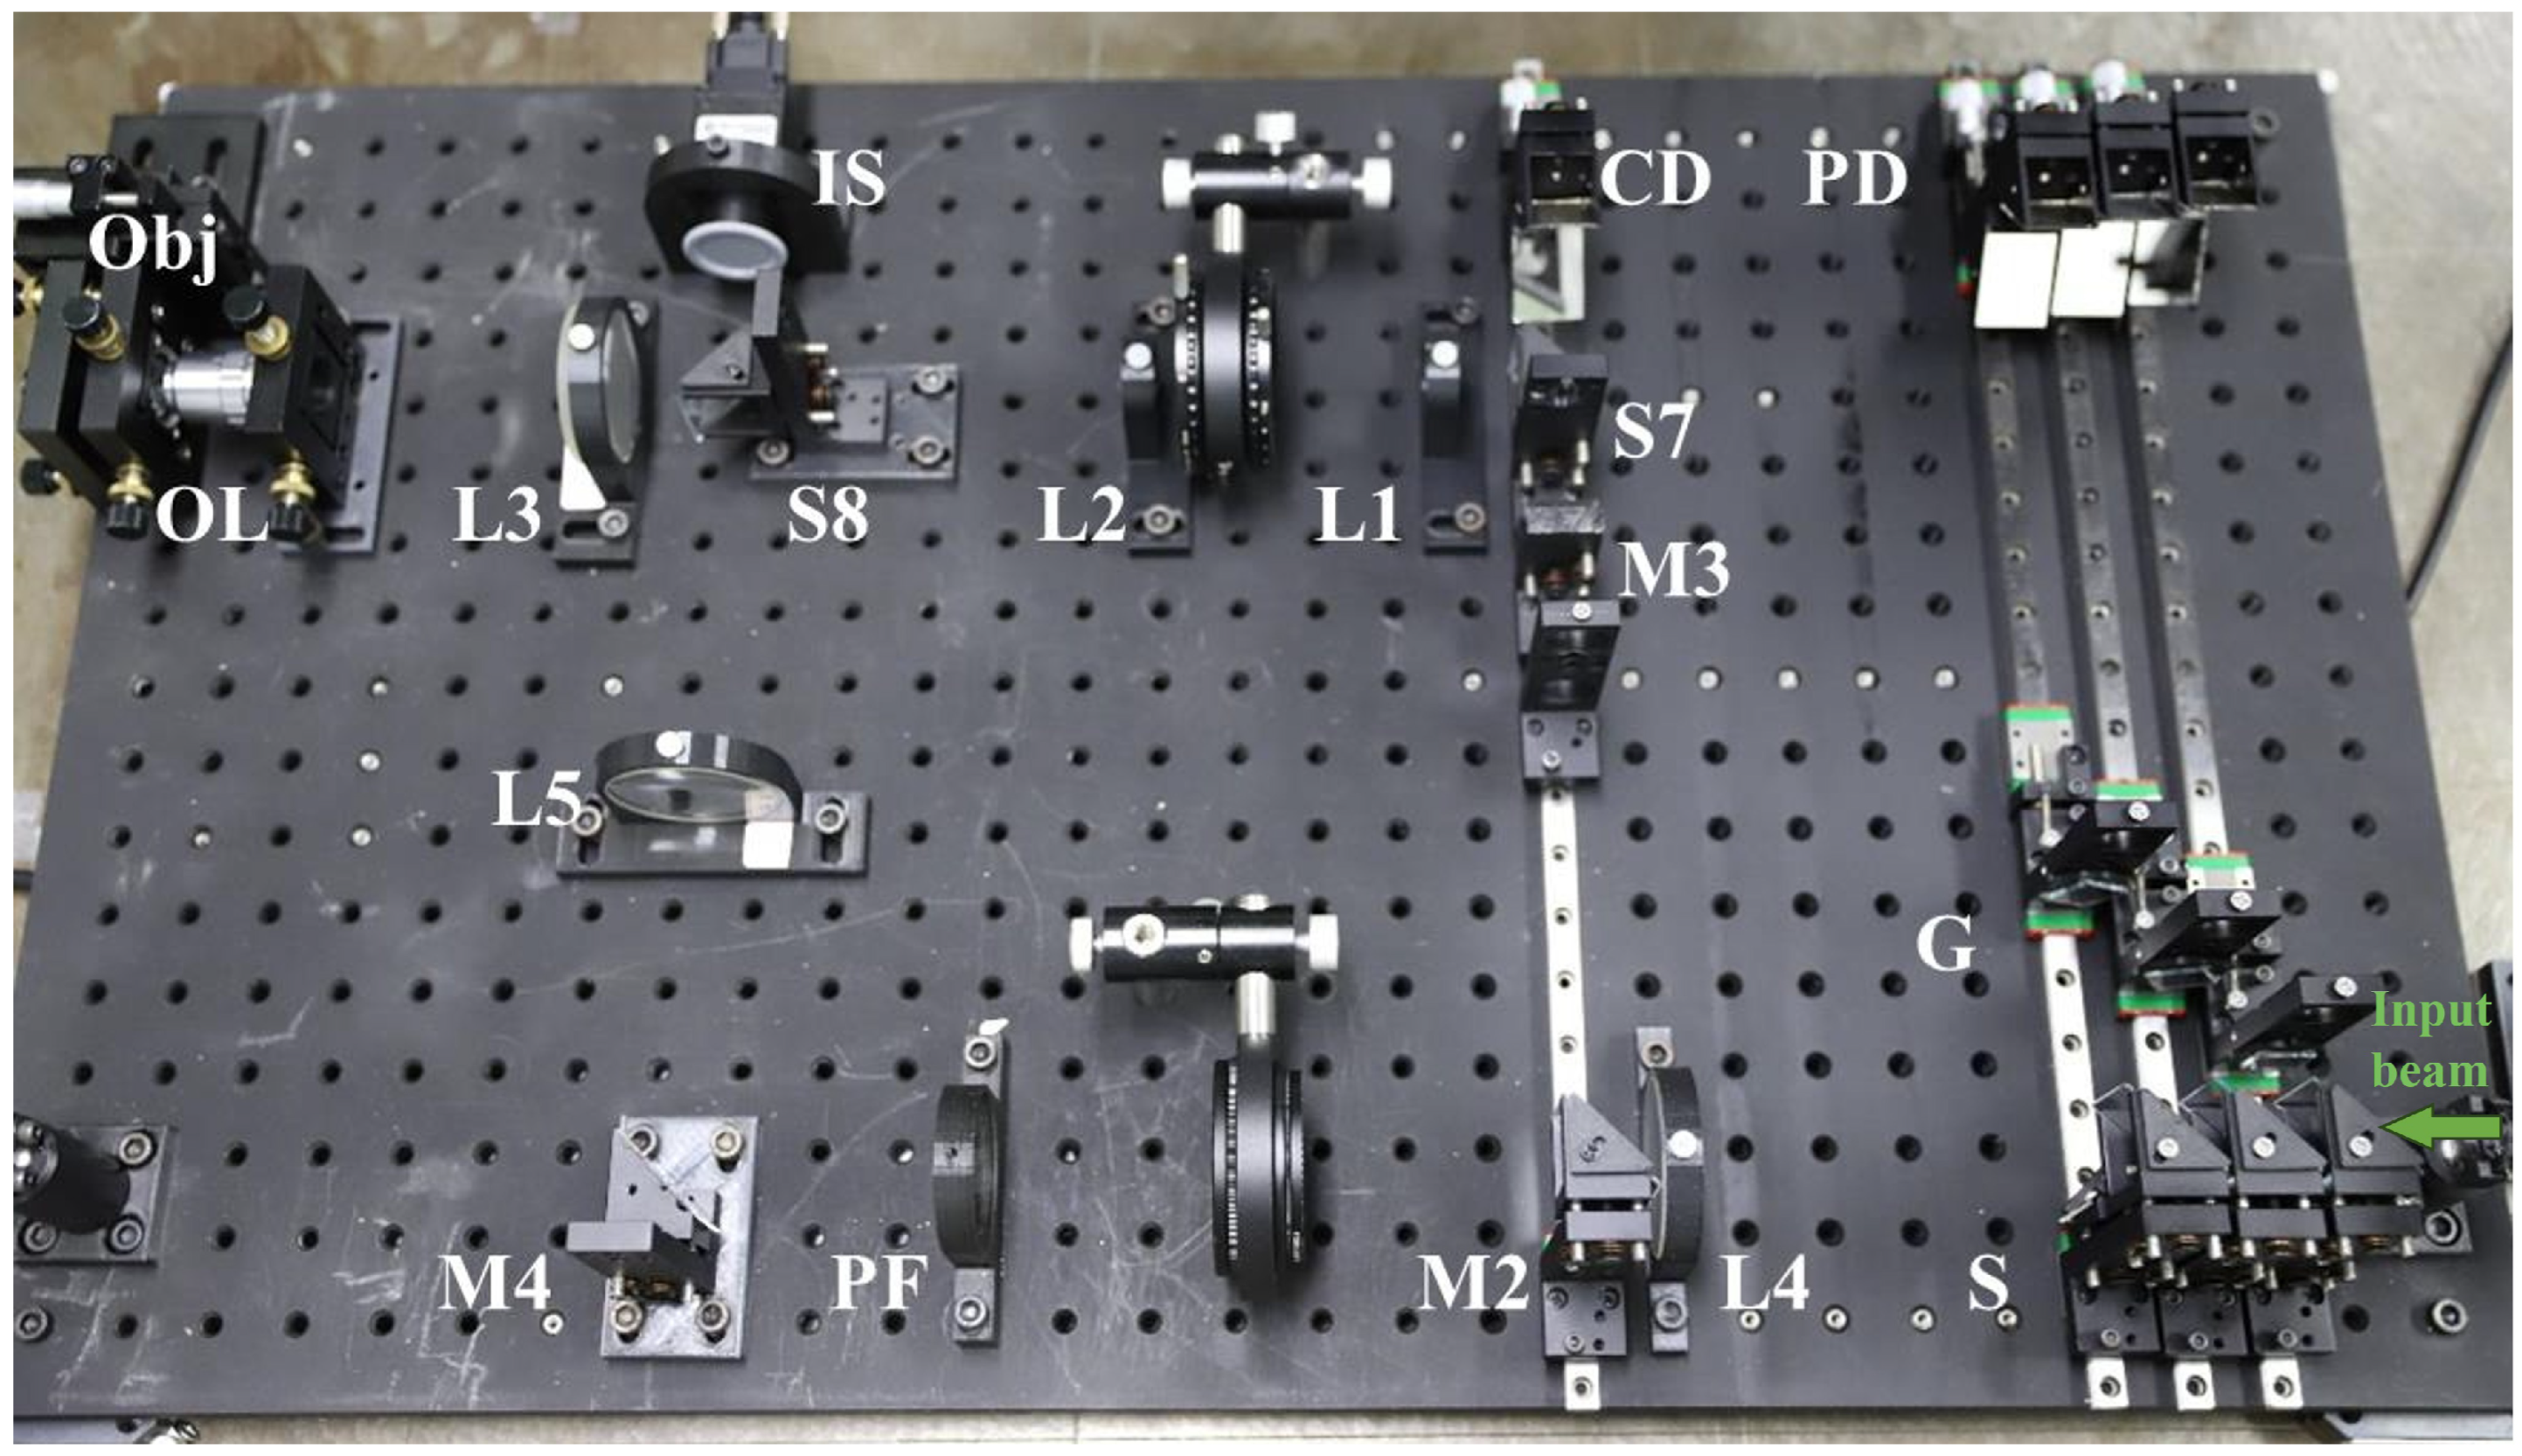
Figure 4 shows a photo of the experimental setup constructed according to the principal schematic shown in Figure 2. The laser source used in the system is a supercontinuum laser (SC-5, YSL Photonics, Wuhan, China) coupled with a line filter (FL532-1, Thorlabs, Shanghai, China), which can provide the desirable low-coherence input beam with a wavelength of 532 nm and a coherence length of 283 μm. As shown in Figure 4, the incident beam is then coupled into the SLG unit. To verify the multi-channel holographic imaging performance of the proposed system, we constructed a three-channel imaging prototype inside the SLG unit as a demonstration setup.
Figure 4.
The picture of the constructed experimental setup for realizing the SMFTI system.
In this configuration, a 50:50 beam splitter was chosen based on the results presented in Table 1. The gratings used in the experiment are one-dimensional amplitude transmission gratings fabricated by photolithographic etching on chromium-coated quartz substrates, each with a uniform grating period of 24 μm. To assign different spatial frequencies to each sub-hologram, gratings G1, G2, and G3 are oriented at 0°, 60°, and 120° relative to the vertical axis, respectively. The aperture size and position of the pinhole filter (PF) are adjusted to transmit only the +1st diffraction orders diffracted by the gratings. The CD and PDs are each equipped with micrometer heads, featuring a displacement range of 6 mm and a smallest division of 10 μm. The sample used in the MHI unit is a stacked three-layer resolution target. Each layer features unique resolution patterns. The focal length ratio of the objective lens (OL) to lens L3 is 1:6.25, providing an imaging magnification of 6.25× for the sample within the field of view. The SFDMH containing three sub-holograms is recorded by a CCD camera (MV-GE501GM, MindVision, Jiangsu, China) with a global shutter. The camera has a pixel number of 2448 × 2048 and a pixel pitch of 3.45 μm × 3.45 μm.
3.2. Results
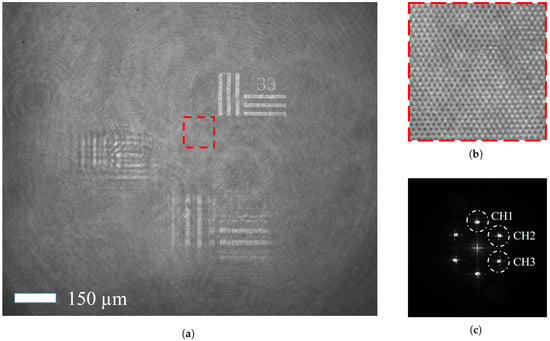
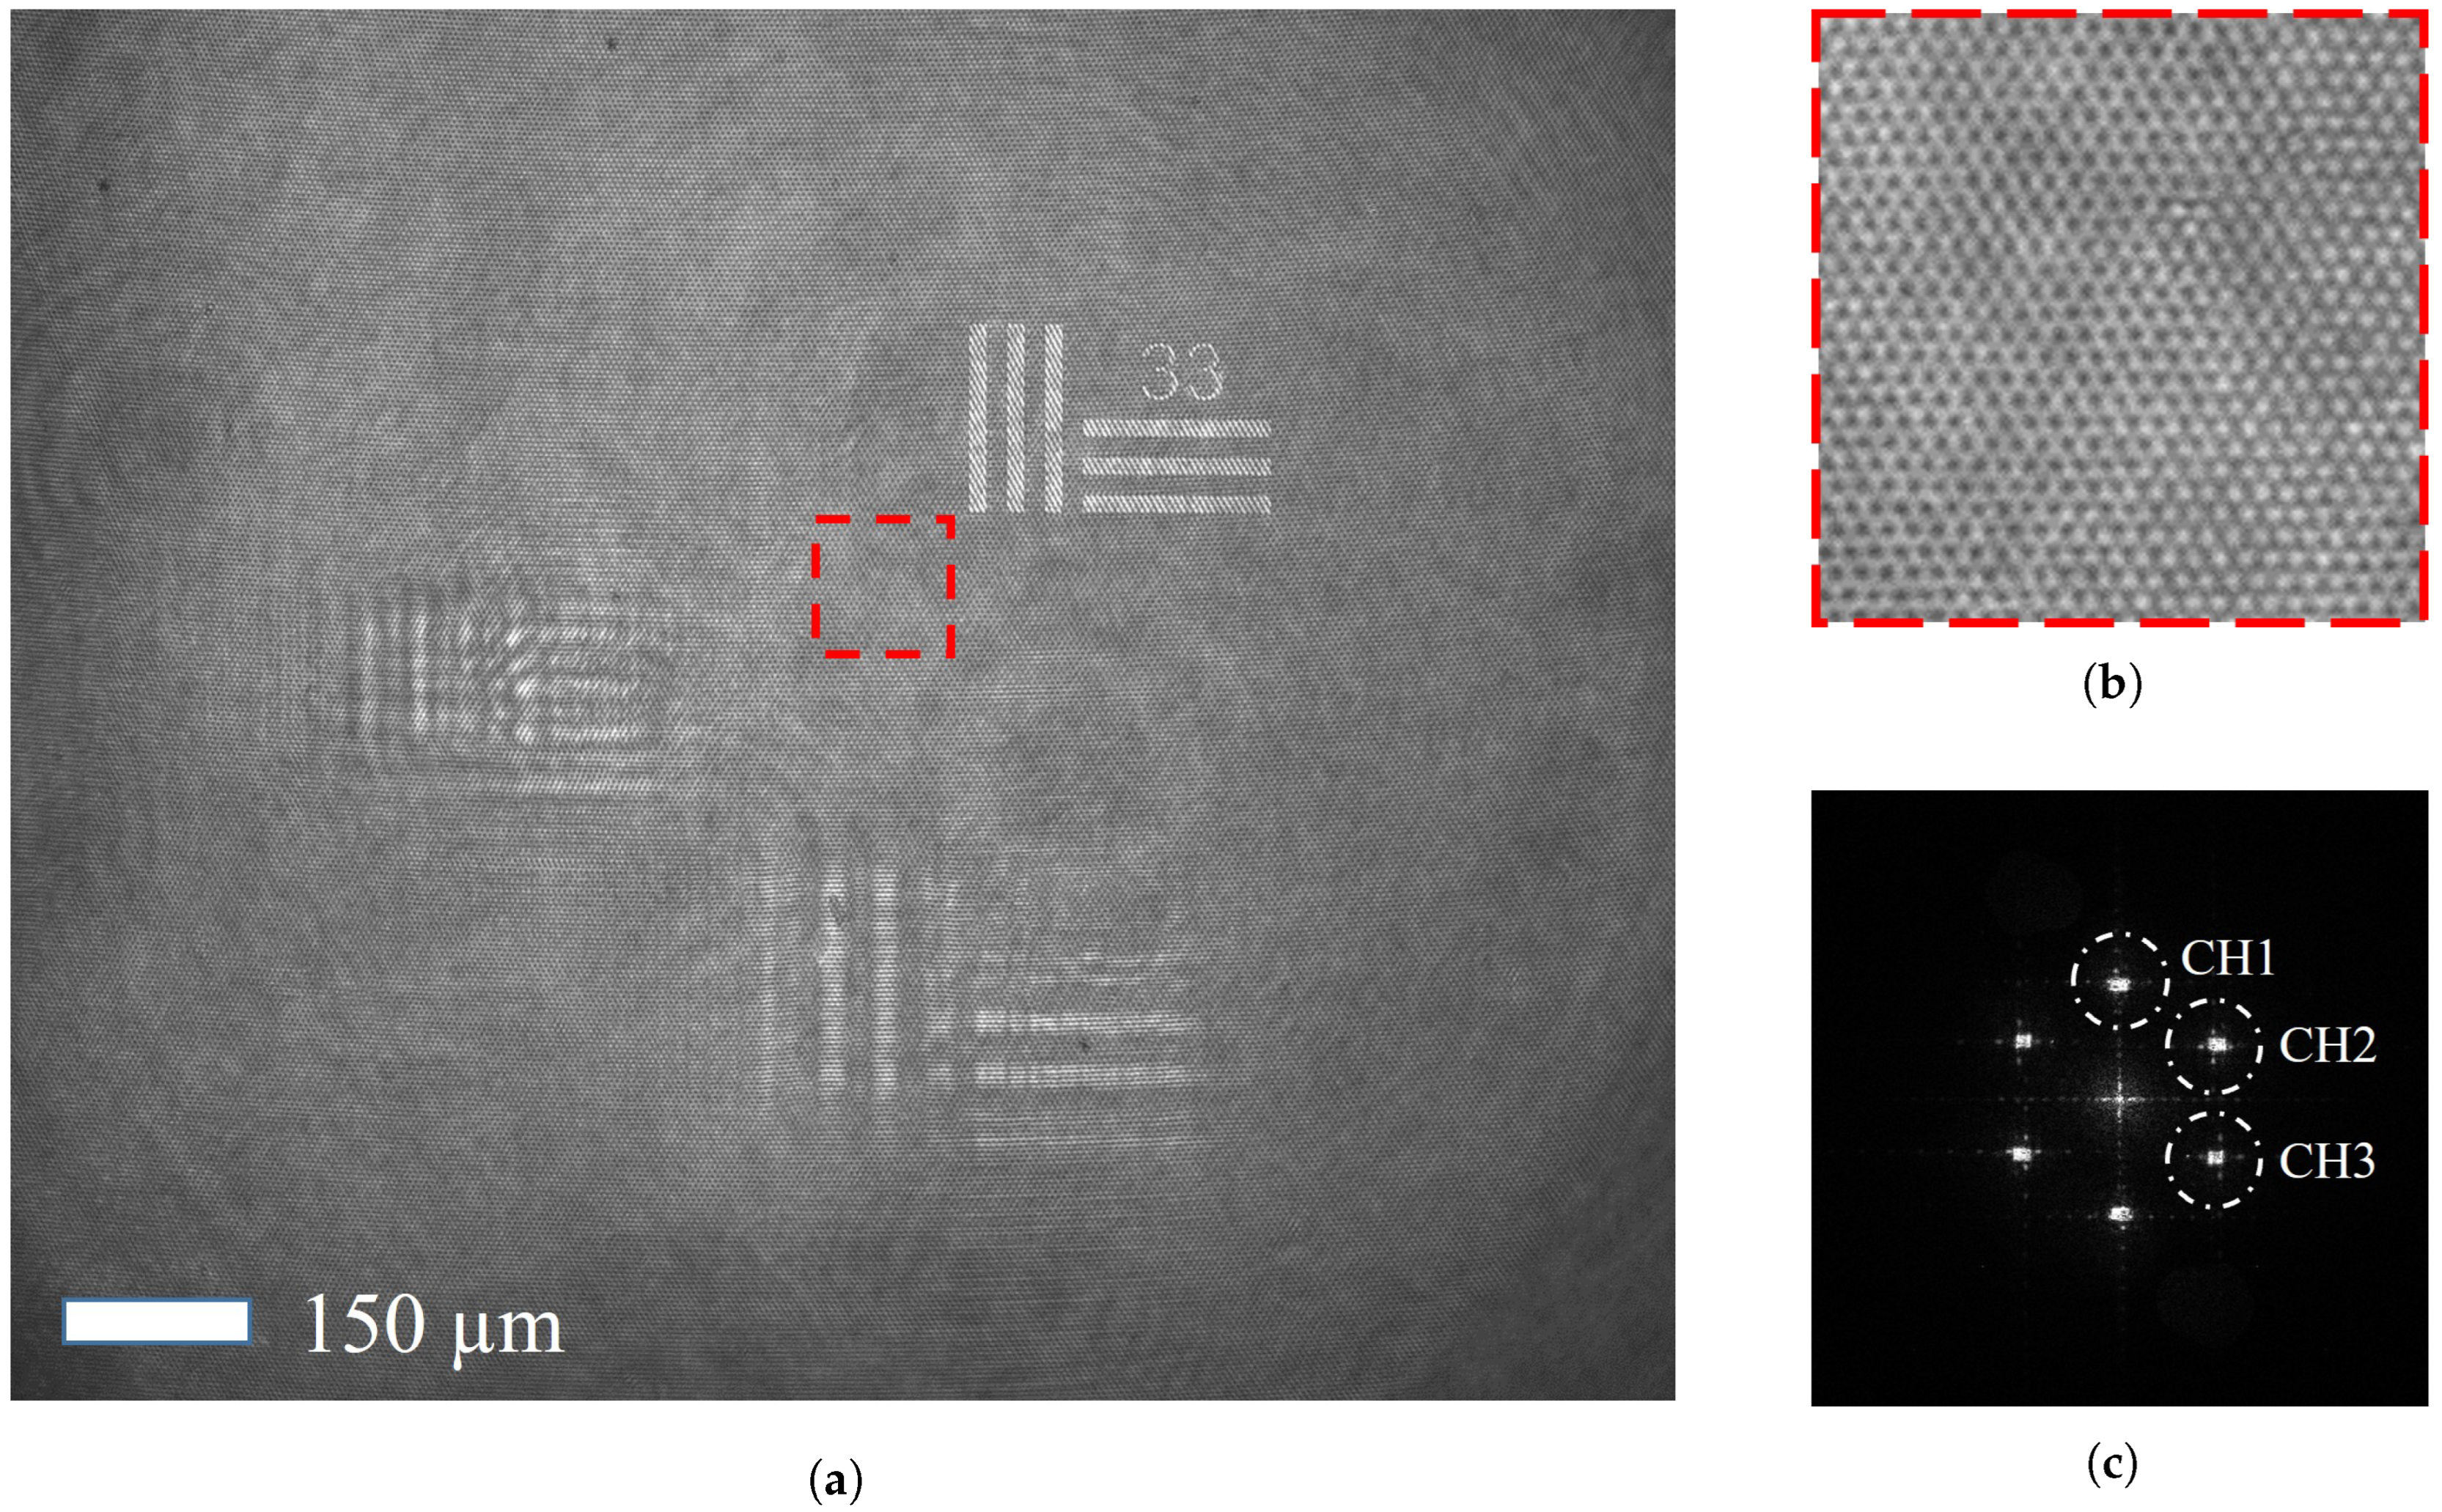
In this case, Figure 5a presents a recorded SFDM hologram of the tested three-layer resolution target with an exposure time of 10 ms, in which the effective coherent overlap zone of all the reference and probe beams covers the entire recording plane of IS. Figure 5b further shows the details of the interference fringes in the recorded hologram. Figure 5c gives the Fourier spectrum of the SFDM hologram computed by a 2D fast Fourier transform. The three dashed circles denote CH1–CH3, i.e., the Fourier spectra associated with the complex fields of the three probe beams. These components can be separately extracted with a spatial-filtering algorithm. In the experiment, we use a 10× microscopic objective (OL) for image pre-magnification to meet the spatial filtering requirements and minimize distortion of the retrieved information caused by spatial filtering.
Figure 5.
(a) Experimentally recorded SFDM hologram of the tested three-layer resolution target. (b) Local enlarged drawing of the SFDM hologram. (c) Fourier spectrum of the SFDM hologram. Scale bar: 150 μm.
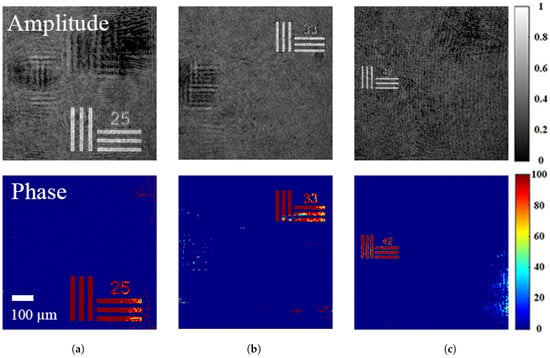
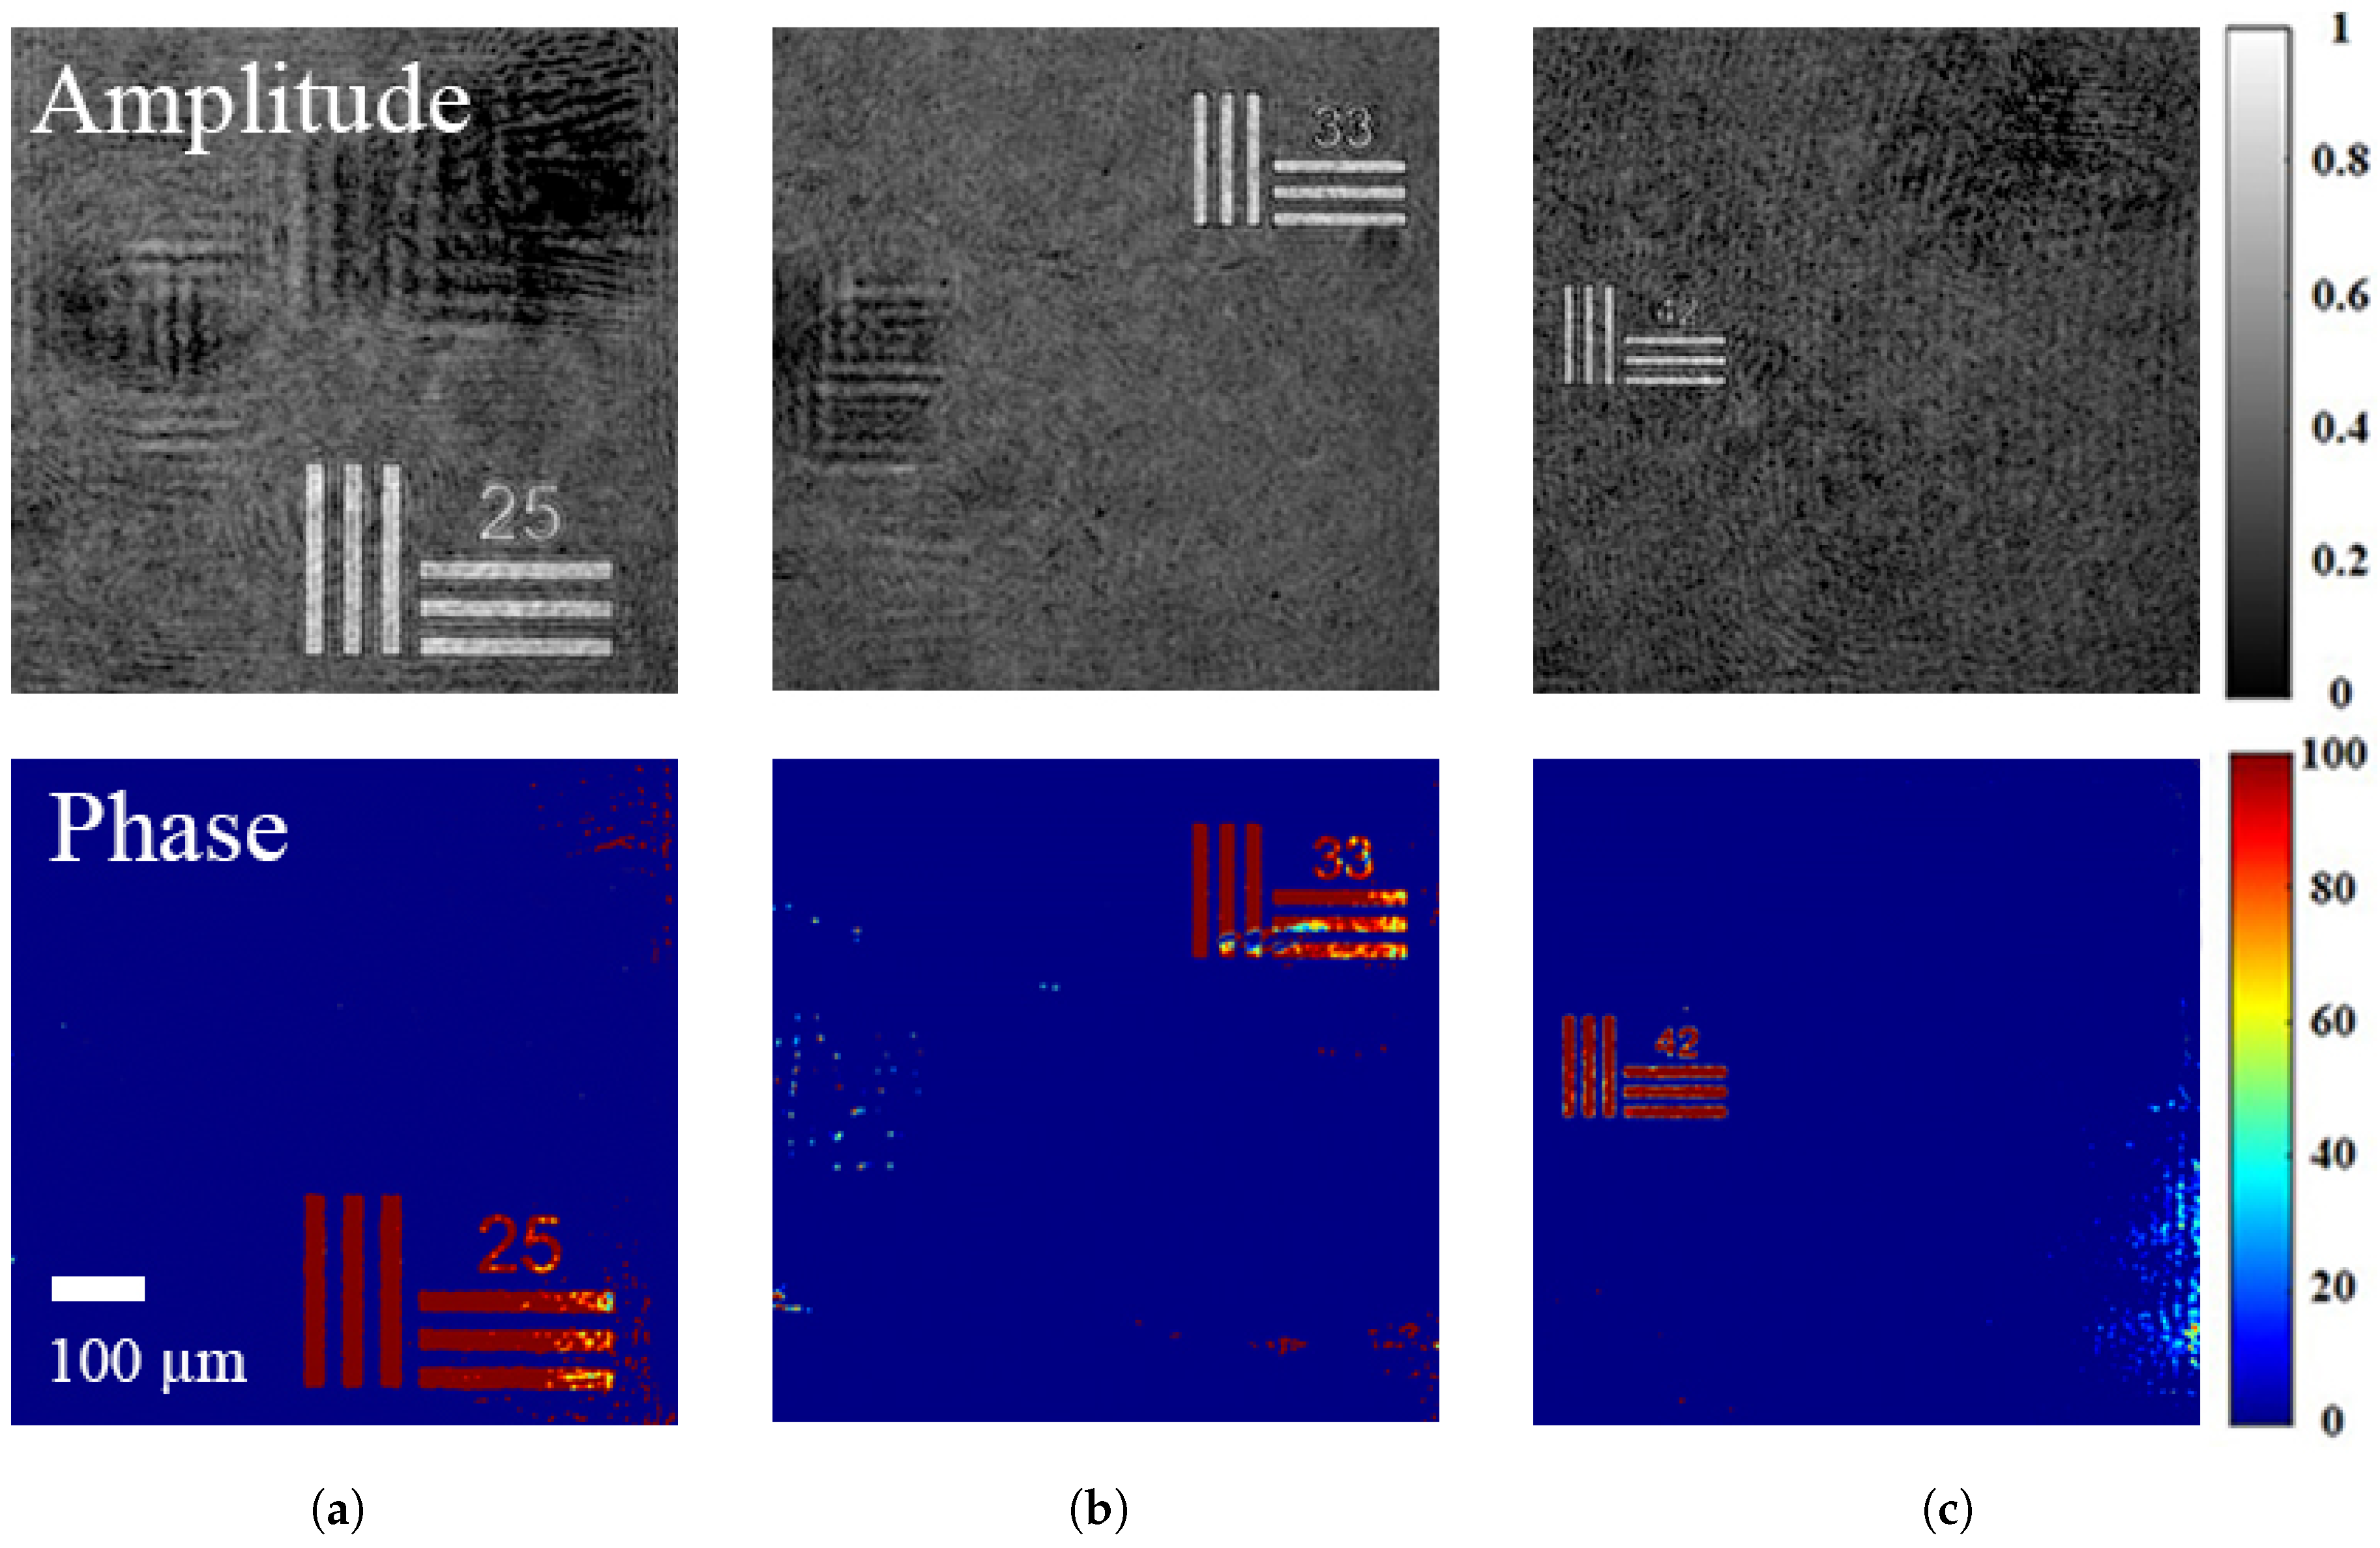
Figure 6 presents the reconstructed complex amplitude information of the resolution target for each layer. The sample features from individual layers are clearly distinguishable, in which the numbers marked on the target denote the number of line pairs per millimeter. If layer 2 is set as the zero axial distance reference and the relative distances of the PDs are known, the distances between layers can be calculated accordingly according to Equation (3). In the experiments, the positional separations of path delay PD2 relative to PD1, and PD3 were measured as mm and mm, respectively. A positive sign denotes a longer optical path, while a negative sign indicates a shorter one. Because the optical path difference between adjacent reference sub-beams significantly exceeds the coherence length of the light source, the cross-interference between adjacent reference sub-beams is naturally suppressed. Finally, the “25”, “33”, and “44” resolution targets shown in Figure 6a, Figure 6b, and Figure 6c can be conveniently calculated to be located at mm, mm, and mm, respectively. The experimentally calculated distances are broadly consistent with the parameter settings adopted during sample fabrication.
Figure 6.
The amplitudes and phases of tested resolution targets at various layers reconstructed from Figure 5c, enabling simultaneous reconstruction of all three-layer complex wavefronts from a single camera exposure. Subfigures (a–c) correspond to three distinct axial layers. Scale bar: 100 μm.
4. Discussion
Although the interval between adjacent imaging layers is approximately 2.4 mm, this distance should not be considered the axial resolution of our system. The theoretical value can be calculated by using Equation (3). However, it may be degraded by factors such as the dispersion effect of optical components used in the experiment. In addition, to quantitatively assess the layer-to-layer crosstalk in the reconstructed images, we calculated the signal-to-noise ratio (SNR) for each reconstructed amplitude image within Figure 6. The calculated values for the amplitude images are 18.3 dB, 17.4 dB, and 14.3 dB, respectively. It can be seen that the SNR value of the image reconstructed from Ch3 is significantly lower than that of the other two channels. This may be attributed to the finer line features of the target, which produce a weaker signal and make this channel more susceptible to noise. Table 2 offers the comparison between the existing SMHI methods and our proposed system. Our case enables optical-path adjustment of the reference sub-beams solely by tuning CD and PD, without causing directional deviations of the reference sub-beams. This significantly reduces the complexity of experimental operation. In addition, our system successfully overcomes the walk-off effect in low-coherence off-axis holographic recording and, hence, effectively avoids the influence of the short-coherence light on the field of view (or spatial resolution) of SMHI.
Table 2.
Comparison of the characteristics of single-shot, multi-depth holographic imaging methods.
5. Conclusions
In summary, we have demonstrated the feasibility of our proposed SMFTI system based on an SLG unit. The SLG unit with a group of diffraction gratings inserted was used to generate multiple reference sub-beams with adjustable optical path lengths and a tilted wavefront. The former allows flexible tuning of axial layer spacing without disturbing the reference incidence angle, while the latter achieves a full field of view imaging by circumventing the walk-off effect in low-coherence off-axis digital holography. Although only three frames in a single SFDM hologram are taken in our experimental demonstration, the system still shows strong potential for increasing sequence depths due to its easily expandable SLG structure and the SFDM recording geometry. Furthermore, since the recording plane and all grating positions in our system satisfy the imaging condition, the interference fringes generated by each spectral component of the sub-beams remain matched across the entire spectrum. This enables the acquisition of holograms with optimal contrast. Thus, we believe that it will provide a powerful tool for single-shot, multi-depth tomographic imaging.
Author Contributions
Conceptualization, H.-Y.H. and C.-S.G.; methodology, X.-T.Z.; software, S.W. and F.-J.Y.; validation, H.-Y.H., C.-S.G. and X.-T.Z.; formal analysis, L.L.; investigation, L.X. and H.-H.Z.; resources, C.-S.G.; data curation, H.-Y.H. and F.-J.Y.; writing—original draft preparation, H.-Y.H.; writing—review and editing, H.-Y.H.; visualization, L.L.; supervision, X.-T.Z.; project administration, X.-T.Z.; funding acquisition, C.-S.G. and H.-Y.H. All authors have read and agreed to the published version of the manuscript.
Funding
This research was funded by the National Natural Science Foundation of China (No. 91750105), and Shandong Agriculture and Engineering University Start-Up Fund for Talented Scholars (2025GCCZR-12).
Institutional Review Board Statement
Not applicable.
Data Availability Statement
Data underlying the results presented in this paper are not publicly available at this time but may be obtained from the authors upon reasonable request.
Conflicts of Interest
The authors declare no conflicts of interest.
References
- Xu, X.; Su, J.; Zhu, R.; Li, K.; Zhao, X.; Fan, J.; Mao, F. From morphology to single-cell molecules: High-resolution 3D histology in biomedicine. Mol. Cancer 2025, 24, 63. [Google Scholar] [CrossRef] [Scilit] [PubMed]
- Quan, H.; Shi, W.; Kong, L. Non-destructive optical measurement of transparent objects: A review. Light. Adv. Manuf. 2025, 6, 333–357. [Google Scholar] [CrossRef] [Scilit]
- Patil-Takbhate, B.; Tripathy, S.P.; Harshavardhan, S. A Narrative Review on Confocal Laser Scanning Microscopy: Principle, Applications, Advancements and Challenges. J. Clin. Diagn. Res. 2024, 18, 7. [Google Scholar] [CrossRef] [Scilit]
- Jerome, W.G.; Price, R.L. Basic Confocal Microscopy; Springer: Berlin/Heidelberg, Germany, 2018; Volume 2. [Google Scholar] [CrossRef] [Scilit]
- Stelzer, E.H.; Strobl, F.; Chang, B.J.; Preusser, F.; Preibisch, S.; McDole, K.; Fiolka, R. Light sheet fluorescence microscopy. Nat. Rev. Methods Prim. 2021, 1, 73. [Google Scholar] [CrossRef] [Scilit]
- Chua, J.; Tan, B.; Wong, D.; Garhöfer, G.; Liew, X.W.; Popa-Cherecheanu, A.; Loong Chin, C.W.; Milea, D.; Li-Hsian Chen, C.; Schmetterer, L. Optical coherence tomography angiography of the retina and choroid in systemic diseases. Prog. Retin. Eye Res. 2024, 103, 101292. [Google Scholar] [CrossRef] [Scilit] [PubMed]
- Stremplewski, P.; Auksorius, E.; Wnuk, P.; Kozoń, Ł.; Garstecki, P.; Wojtkowski, M. In vivo volumetric imaging by crosstalk-free full-field OCT. Optica 2019, 6, 608–617. [Google Scholar] [CrossRef] [Scilit]
- Subhash, H.M. Full-Field and Single-Shot Full-Field Optical Coherence Tomography: A Novel Technique for Biomedical Imaging Applications. Adv. Opt. Technol. 2012, 2012, 435408. [Google Scholar] [CrossRef] [Scilit]
- Wang, L.; Fu, R.; Xu, C.; Xu, M. Methods and applications of full-field optical coherence tomography: A review. J. Biomed. Opt. 2022, 27, 050901. [Google Scholar] [CrossRef] [Scilit] [PubMed]
- Kim, K.; Yoon, J.; Park, Y. Simultaneous 3D visualization and position tracking of optically trapped particles using optical diffraction tomography. Optica 2015, 2, 343–346. [Google Scholar] [CrossRef] [Scilit]
- Kim, T.K.; Lee, B.W.; Fujii, F.; Lee, K.H.; Lee, S.; Park, Y.; Kim, J.K.; Lee, S.W.; Pack, C.G. Mitotic Chromosomes in Live Cells Characterized Using High-Speed and Label-Free Optical Diffraction Tomography. Cells 2019, 8, 1368. [Google Scholar] [CrossRef] [Scilit] [PubMed]
- Sung, Y. Hyperspectral Three-Dimensional Refractive-Index Imaging Using Snapshot Optical Tomography. Phys. Rev. Appl. 2023, 19, 014064. [Google Scholar] [CrossRef] [Scilit]
- Huang, H.Y.; Yue, Q.Y.; Yang, Y.; Wang, R.X.; Guo, C.S. Single-exposure multi-wavelength optical diffraction tomography based on space-angle dual multiplexing holography. Opt. Lett. 2024, 49, 3066–3069. [Google Scholar] [CrossRef] [Scilit] [PubMed]
- Tahara, T.; Quan, X.; Otani, R.; Takaki, Y.; Matoba, O. Digital holography and its multidimensional imaging applications: A review. Microscopy 2018, 67, 55–67. [Google Scholar] [CrossRef] [Scilit] [PubMed]
- Brady, D.J.; Choi, K.; Marks, D.L.; Horisaki, R.; Lim, S. Compressive Holography. Opt. Express 2009, 17, 13040–13049. [Google Scholar] [CrossRef] [Scilit] [PubMed]
- Finkeldey, M.; Göring, L.; Brenner, C.; Hofmann, M.; Gerhardt, N.C. Depth-filtering in common-path digital holographic microscopy. Opt. Express 2017, 25, 19398–19407. [Google Scholar] [CrossRef] [Scilit] [PubMed]
- Shaked, N.T.; Micó, V.; Trusiak, M.; Kuś, A.; Mirsky, S.K. Off-axis digital holographic multiplexing for rapid wavefront acquisition and processing. Adv. Opt. Photon. 2020, 12, 556–611. [Google Scholar] [CrossRef] [Scilit]
- Wolbromsky, L.; Turko, N.A.; Shaked, N.T. Single-exposure full-field multi-depth imaging using low-coherence holographic multiplexing. Opt. Lett. 2018, 43, 2046–2049. [Google Scholar] [CrossRef] [Scilit] [PubMed]
- Moon, J.; Lim, Y.S.; Yoon, S.; Choi, W. Single-shot multi-depth full-field optical coherence tomography using spatial frequency division multiplexing. Opt. Express 2021, 29, 7060–7069. [Google Scholar] [CrossRef] [Scilit] [PubMed]
- Kang, M.; Woo, S.; Choi, W.; Kang, P.; Hoang, T.D.; Koo, J.; Choi, Y.; Choi, W. Single-shot multiple-depth macroscopic imaging by spatial frequency multiplexing. Opt. Express 2021, 29, 34360–34369. [Google Scholar] [CrossRef] [Scilit] [PubMed]
- Shang, X.; Xu, N.; Zong, M.; Yu, W.; Guo, L.; Gao, G.; Zhang, Z.; Zhang, H.; Su, L. ZrGeTe4 Nanoparticles as a Saturable Absorber for Mode-Locked Operations at 1 and 1.55 µm. Photonics 2026, 13, 305. [Google Scholar] [CrossRef] [Scilit]
- Pretzler, G.; Kasper, A.; Witte, K. Angular chirp and tilted light pulses in CPA lasers. Appl. Phys. B 2000, 70, 1–9. [Google Scholar] [CrossRef] [Scilit]
- Monemhaghdoust, Z.; Montfort, F.; Emery, Y.; Depeursinge, C.; Moser, C. Dual wavelength full field imaging in low coherence digital holographic microscopy. Opt. Express 2011, 19, 24005–24022. [Google Scholar] [CrossRef] [Scilit] [PubMed]

Disclaimer/Publisher’s Note: The statements, opinions and data contained in all publications are solely those of the individual author(s) and contributor(s) and not of MDPI and/or the editor(s). MDPI and/or the editor(s) disclaim responsibility for any injury to people or property resulting from any ideas, methods, instructions or products referred to in the content. |
© 2026 by the authors. Licensee MDPI, Basel, Switzerland. This article is an open access article distributed under the terms and conditions of the Creative Commons Attribution (CC BY) license.