


Abstract
To address the complex parameter–response relationships of metal–insulator–metal (MIM) metasurface absorbers and the low design efficiency of conventional electromagnetic simulations, this study proposes a neural network-assisted design method based on a two-stage progressive spectral-shape constraint. An MIM absorber featuring composite square- and circular-ring resonators is constructed, a dataset containing 6480 samples is generated, and a forward neural-network model is developed for spectral prediction. A two-stage training strategy is adopted, in which the model first learns the spectral amplitudes and then progressively incorporates the spectral-shape constraint, thereby enhancing its ability to represent resonance peaks and valleys as well as local spectral features. The results show that the proposed model achieves a mean squared error of 2.50 × 10⁻⁶ and a mean absolute error of 1.16 × 10⁻³ on the test set, while reducing the spectral-shape loss by 18.98% compared with the baseline model. The model exhibits good generalization across the continuous parameter ranges, and its predictions agree closely with the results obtained from automated finite-difference time-domain simulations, while achieving an approximately 140-fold speedup over FDTD. Based on the trained model, four broadband absorber structures are designed and validated. The highest mean absorptance reaches 97.64%, and the maximum continuous high-absorption bandwidth reaches 1375 nm. The proposed data-driven method balances spectral-shape fidelity with computational efficiency and provides an effective framework for the rapid prediction and design of composite-resonant MIM metasurface absorbers.
1. Introduction
By introducing artificial micro- and nanostructures at the subwavelength scale, metasurface absorbers can efficiently regulate and absorb electromagnetic-wave energy, demonstrating considerable application potential in infrared stealth, thermal-radiation control, infrared detection, and other fields [1,2,3]. Beyond absorption applications, engineered metasurfaces also enable flexible control of optical polarization states, providing opportunities for optical field manipulation and precision sensing [4]. Compared with conventional bulk-material absorbers, metasurface absorbers can achieve near-perfect absorption with an ultrathin subwavelength thickness, providing a new technical approach for the design of lightweight and integrated optical devices [5,6].
Among various structural configurations, metal–insulator–metal (MIM) metasurface absorbers have attracted extensive attention because of their distinctive physical mechanisms. By introducing a dielectric spacer layer between the top metallic resonator and the bottom metallic reflector, this configuration can excite surface plasmon resonances and Fabry–Pérot cavity-mode resonances, thereby significantly enhancing the light–matter interaction [7,8,9]. By regulating the geometric shape, characteristic dimensions, and material parameters of the top resonator, the resonance conditions of localized surface plasmons can be effectively altered, enabling precise modulation of the positions and intensities of the absorption peaks and the spectral line shapes [10,11,12,13]. However, a single resonant unit has a limited ability to regulate localized resonances, and its absorption bandwidth and spectral design flexibility remain considerably restricted, making it difficult to satisfy the practical requirements for efficient multiband or broadband absorption. Consequently, researchers have gradually extended the design focus from single-resonator structures to multiresonant and composite-resonant metasurface configurations. By incorporating resonant structures with different dimensions or morphologies into the same unit cell, multiple absorption peaks can be cooperatively superimposed, thereby effectively broadening the absorption bandwidth [14]. For example, Bai et al. developed a miniaturized broadband metasurface absorber based on a fractal resonator structure, demonstrating the effectiveness of geometric design and impedance matching in achieving broadband absorption [15]. However, multiresonant composite structures generally involve strong coupling among multiple geometric parameters, and their spectral responses exhibit pronounced high-dimensional and nonlinear characteristics, resulting in greater difficulties in structural design and parameter optimization [16].
At present, the design of metasurface absorbers still relies primarily on full-wave electromagnetic simulation methods, such as the finite-difference time-domain (FDTD) method and the finite element method (FEM) [17,18,19]. Although these methods can provide highly accurate calculations of optical responses, a single simulation often requires considerable computational time for multiresonant metasurfaces with high-dimensional parameters and complex structures. Large-scale parameter sweeps generally require numerous simulations of different structures, resulting in high computational costs and long design cycles. Although recently developed topology-optimization and inverse-design methods have improved design flexibility to some extent, they still inherently rely on extensive iterative searches and numerical calculations, which impose certain limitations on their engineering applications [20,21]. Therefore, efficient design methods are urgently needed to enable rapid performance prediction and high-performance structure screening for composite-resonant MIM absorbers.
In recent years, the rapid development of artificial intelligence, particularly deep-learning methods, has provided new approaches for the efficient design of photonic devices [22,23,24]. Artificial neural networks (ANNs) can learn the underlying nonlinear mapping relationships from a large number of structure–spectrum pairs and rapidly predict the corresponding optical responses from structural parameters, thereby improving the efficiency of metasurface design [25]. Neural networks have achieved good performance in the spectral-response modeling of multilayer thin-film structures, the performance prediction of nanophotonic structures, and the inverse design of metamaterial structures [26,27,28]. However, composite-resonant MIM metasurface absorbers with continuous geometric parameters, complex resonance modes, and significant parameter coupling exhibit more diverse and complex absorption spectra. Existing studies still lack efficient neural-network-based design methods suitable for complex composite-resonant MIM metasurfaces, and the rapid and accurate prediction of their spectral responses remains a key issue that urgently needs to be addressed [29,30].
To address these issues, this study investigates an efficient mapping method between the structural parameters and spectral responses of near-infrared composite-resonant metasurface absorbers. A composite-resonant MIM absorber combining square and circular rings is designed, and an ANN-based forward prediction method incorporating a two-stage progressive spectral shape constraint is proposed. First, a large-scale database of structural parameters and reflection spectra is constructed using FDTD electromagnetic simulations. Second, a multilayer perceptron (MLP) is employed to learn the nonlinear mapping relationship between the structural parameters and reflection spectra. On this basis, considering that absorber performance is more strongly determined by local spectral features such as resonance peaks and valleys, a two-stage progressive training strategy is further proposed. After the model has learned the overall spectral-amplitude characteristics, the spectral-shape constraint is progressively introduced to improve local spectral-shape reconstruction while maintaining amplitude accuracy. Finally, Latin hypercube sampling is used to generate independent samples not covered by the database, and comparisons with FDTD simulations are performed to examine the generalization capability of the model over the continuous parameter ranges. The trained model is subsequently used for the rapid performance evaluation of candidate structures. While ensuring spectral prediction accuracy, the proposed framework significantly shortens the design cycle for large numbers of structures. Its prediction speed is approximately 140 times that of the electromagnetic simulations, and its spectral shape loss is 18.98% lower than that of the baseline model. Based on model screening and subsequent FDTD validation, four representative broadband absorber structures with different absorption-performance advantages are ultimately obtained. The highest average absorptance reaches 97.64%, and the maximum continuous high-absorption bandwidth reaches 1375 nm. These results demonstrate the potential and advantages of the composite square- and circular-ring resonator design for regulating broadband absorption performance and provide an effective data-driven approach for the efficient design of composite-resonant MIM metasurface absorbers.
2. Structural Design and Operating Principle
2.1. Absorber Design and Operating Principles
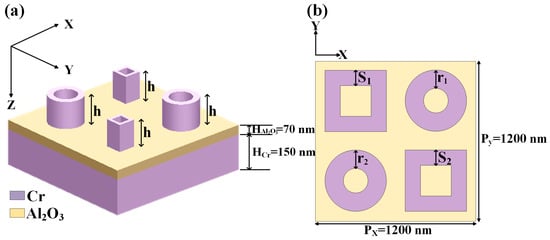
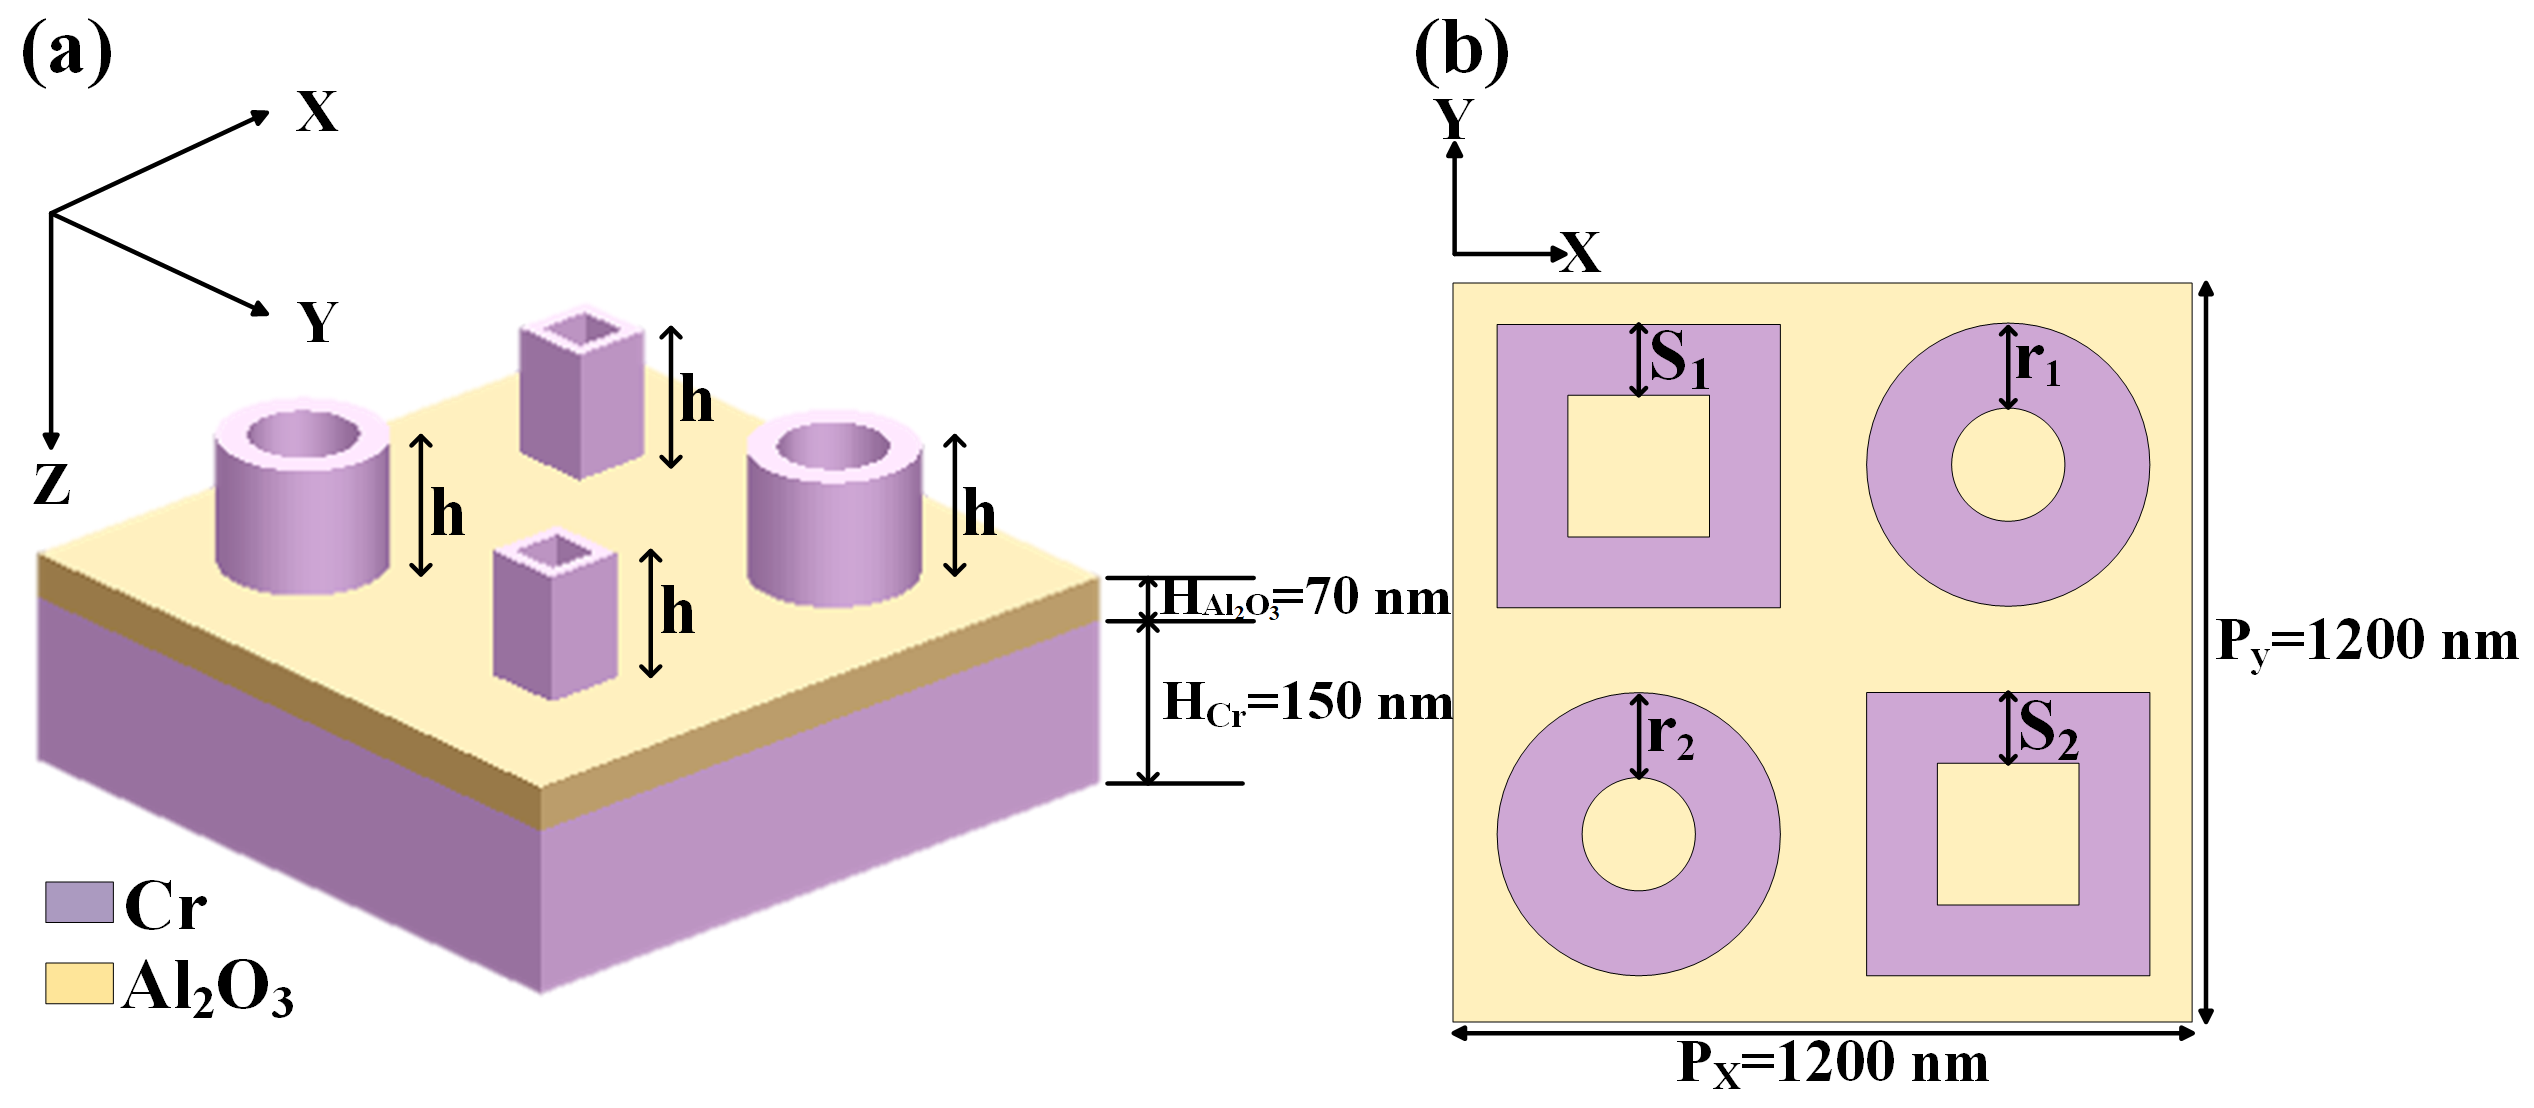
In this study, the finite-difference time-domain (FDTD) method was used to design a composite-resonant metasurface absorber based on an MIM structure. As shown in Figure 1a, the metasurface unit cell consists of a top composite metallic resonator layer, an intermediate dielectric spacer layer, and a bottom continuous metallic reflector layer. Cr and Al2O3 were used for the metallic and dielectric layers, respectively. The bottom continuous metallic reflector layer can effectively suppress the transmission of electromagnetic waves; therefore, the absorptance of the device can be directly calculated from its reflectance. The entire structure is periodically arranged along the X and Y directions to form a two-dimensional metasurface array. Here, r1 and r2 denote the radial widths of the circular resonant rings, namely, the differences between the outer and inner radii. The parameters S1 and S2 denote the structural widths of the square resonant rings, respectively, each of which is defined as half the difference between the outer and inner side lengths. The parameter h denotes the thickness of the top metallic resonator unit, while PX and PY denote the unit-cell periods. The unit-cell periods along the x and y directions were both fixed at 1200 nm. The thicknesses of the bottom Cr reflector and the intermediate Al2O3 dielectric spacer were set to 150 nm and 70 nm, respectively. The top resonator layer consisted of two circular rings and two square rings, with their centers located at (300, 300), (−300, −300), (−300, 300), and (300, −300) nm. The inner radius of each circular ring was fixed at 80 nm, while the inner side length of each square ring was fixed at 160 nm.
Figure 1.
Schematic diagram of the square–circular composite resonant metasurface absorber structure. (a) three-dimensional unit-cell structure; (b) top view.
The electromagnetic response of the structure was simulated using the three-dimensional finite-difference time-domain (FDTD) method. Periodic boundary conditions were applied along the x- and y-directions, while perfectly matched layer (PML) boundary conditions were applied along the z-direction. The wavelength-dependent complex refractive indices of Cr and Al2O3 were obtained from the Palik optical constants database. The structure was illuminated by a normally incident, x-polarized plane wave over the wavelength range of 800–2200 nm. An automatic nonuniform mesh was employed with a mesh accuracy setting of 2. The reflected power was recorded using a frequency-domain power monitor, with 400 uniformly spaced wavelength samples. The monitor integration covered the entire reflection monitoring plane within the unit cell, thereby accounting for all propagating reflected diffraction orders rather than only the zeroth-order specular reflection. To assess the numerical reliability of the adopted mesh setting, a mesh-convergence analysis was conducted using mesh accuracy settings of 2, 3, and 4 by comparing the complete absorption spectra and band-averaged absorptance. The mean absolute spectral differences between mesh accuracy settings of 2 and 3, 3 and 4, and 2 and 4 were approximately 0.6, 0.3, and 0.8 percentage points, respectively, all below the adopted convergence criterion of 1 percentage point. The reduced spectral difference between settings of 3 and 4 indicates that the results tend to stabilize with further mesh refinement. In addition, the difference in band-averaged absorptance between settings of 2 and 4 was only 0.0216 percentage points. These results support the adequacy of a mesh accuracy setting of 2 for evaluating the overall broadband absorption performance, and this setting was therefore adopted to balance numerical accuracy and computational efficiency.
The top metallic resonator consists of two square resonant rings and two circular resonant rings. Compared with a resonator with a single geometric structure, the composite structure can support multiple localized resonance modes within the same unit cell and broaden the absorption bandwidth or produce a multi-peak absorption response through the coupling between different resonance modes. This increases the design flexibility of broadband and multiband absorbing devices and enables the cooperative excitation of multiple localized resonance modes [31,32]. Under electromagnetic-wave illumination, the top composite metallic resonator can excite localized surface plasmon resonances, while the electromagnetic wave forms a Fabry–Pérot-like cavity-mode resonance between the dielectric layer and the bottom metallic reflector layer [33,34]. The two types of resonances are mutually coupled and jointly enhance the local confinement of the incident electromagnetic wave, thereby effectively strengthening the light–matter interaction. The square resonant ring mainly produces strong localized electric-field enhancement near its edges, whereas the circular resonant ring exhibits a more symmetric radial electric-field distribution. The complementary responses of different resonant modes can enrich the spectral characteristics of composite metasurfaces and contribute to broadband absorption enhancement, as also discussed in previous studies of multimode resonances and plasmonic hybridization [35,36]. It is worth noting that the bottom metallic reflector layer strongly suppresses electromagnetic-wave transmission, resulting in negligible transmittance, T(λ) ≈ 0. Therefore, the absorptance of the metasurface absorber with the composite square- and circular-ring resonator investigated in this study can be expressed as
where A(λ), R(λ), and T(λ) denote the absorptance, reflectance, and transmittance, respectively. The transmittance was further examined and found to range approximately from 10−6 to 10−4 over the evaluated structures and wavelengths, confirming the validity of the negligible-transmission approximation. Therefore, the corresponding absorption spectrum can be obtained directly from the calculated total reflectance spectrum. This simplifies the calculation of the absorption spectrum and provides a basis for the subsequent dataset construction and neural-network training.
A(λ) = 1 − R(λ) − T(λ) ≈ 1 − R(λ),
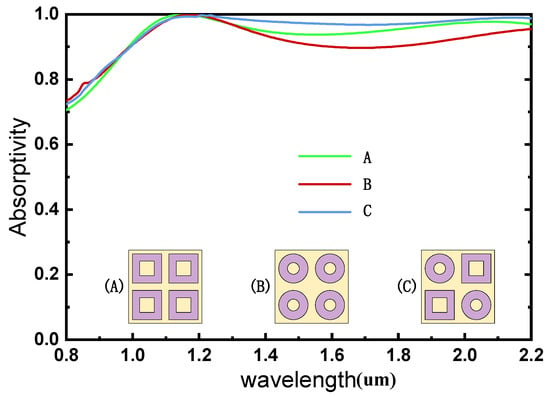
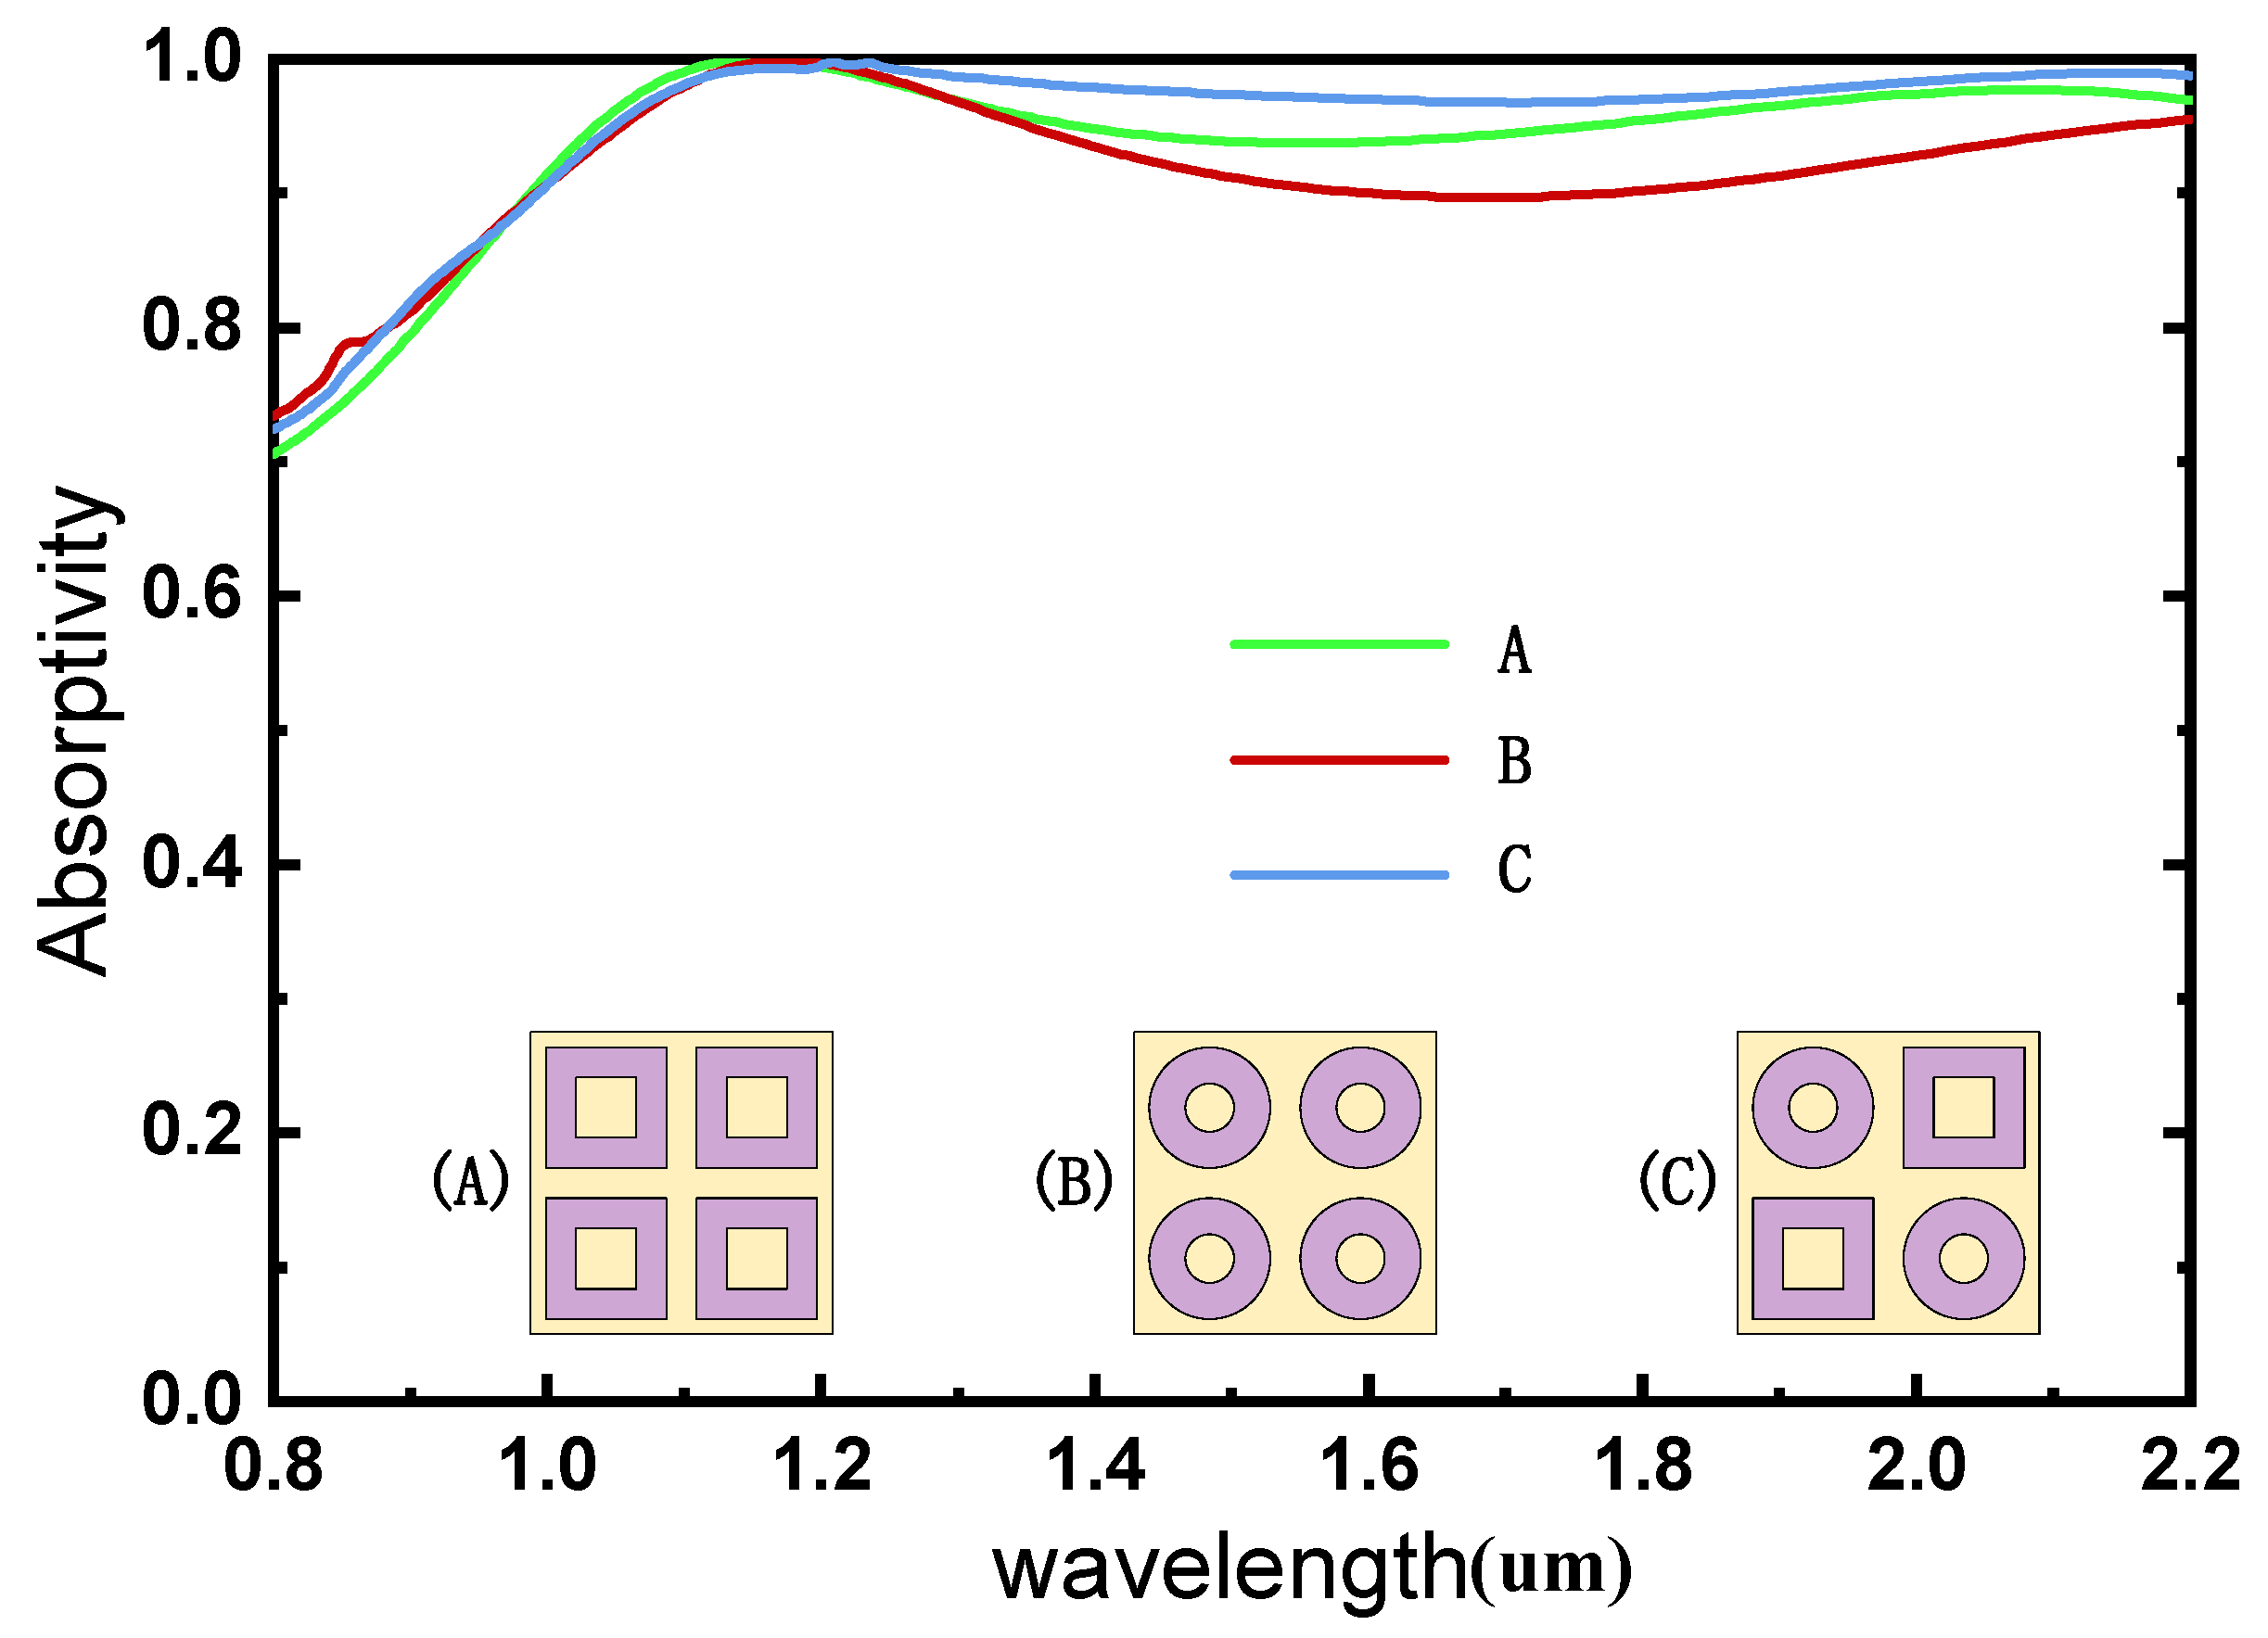
To clarify the respective roles of the square and circular resonators in broadband absorption, the absorption spectra of the square-ring-only, circular-ring-only, and combined structures were compared under identical simulation conditions, as shown in Figure 2. All three structures exhibit high absorptance in the short-wavelength region. As the wavelength increases, the circular-ring-only structure exhibits a more pronounced reduction in absorptance, whereas the square-ring-only structure maintains a comparatively broad high-absorption response. The combined structure provides a higher and flatter absorption response over the middle- and long-wavelength regions. These results indicate that the two resonator types provide complementary spectral responses, and their combination contributes to broadening and flattening the absorption band. Similar broadband absorption strategies based on structural geometry and multiple resonant responses have also been investigated in previous metasurface absorber designs [37].
Figure 2.
Absorption spectra of three metasurface configurations under identical simulation conditions. (A) square-ring-only structure; (B) circular-ring-only structure; (C) combined square–circular-ring structure.
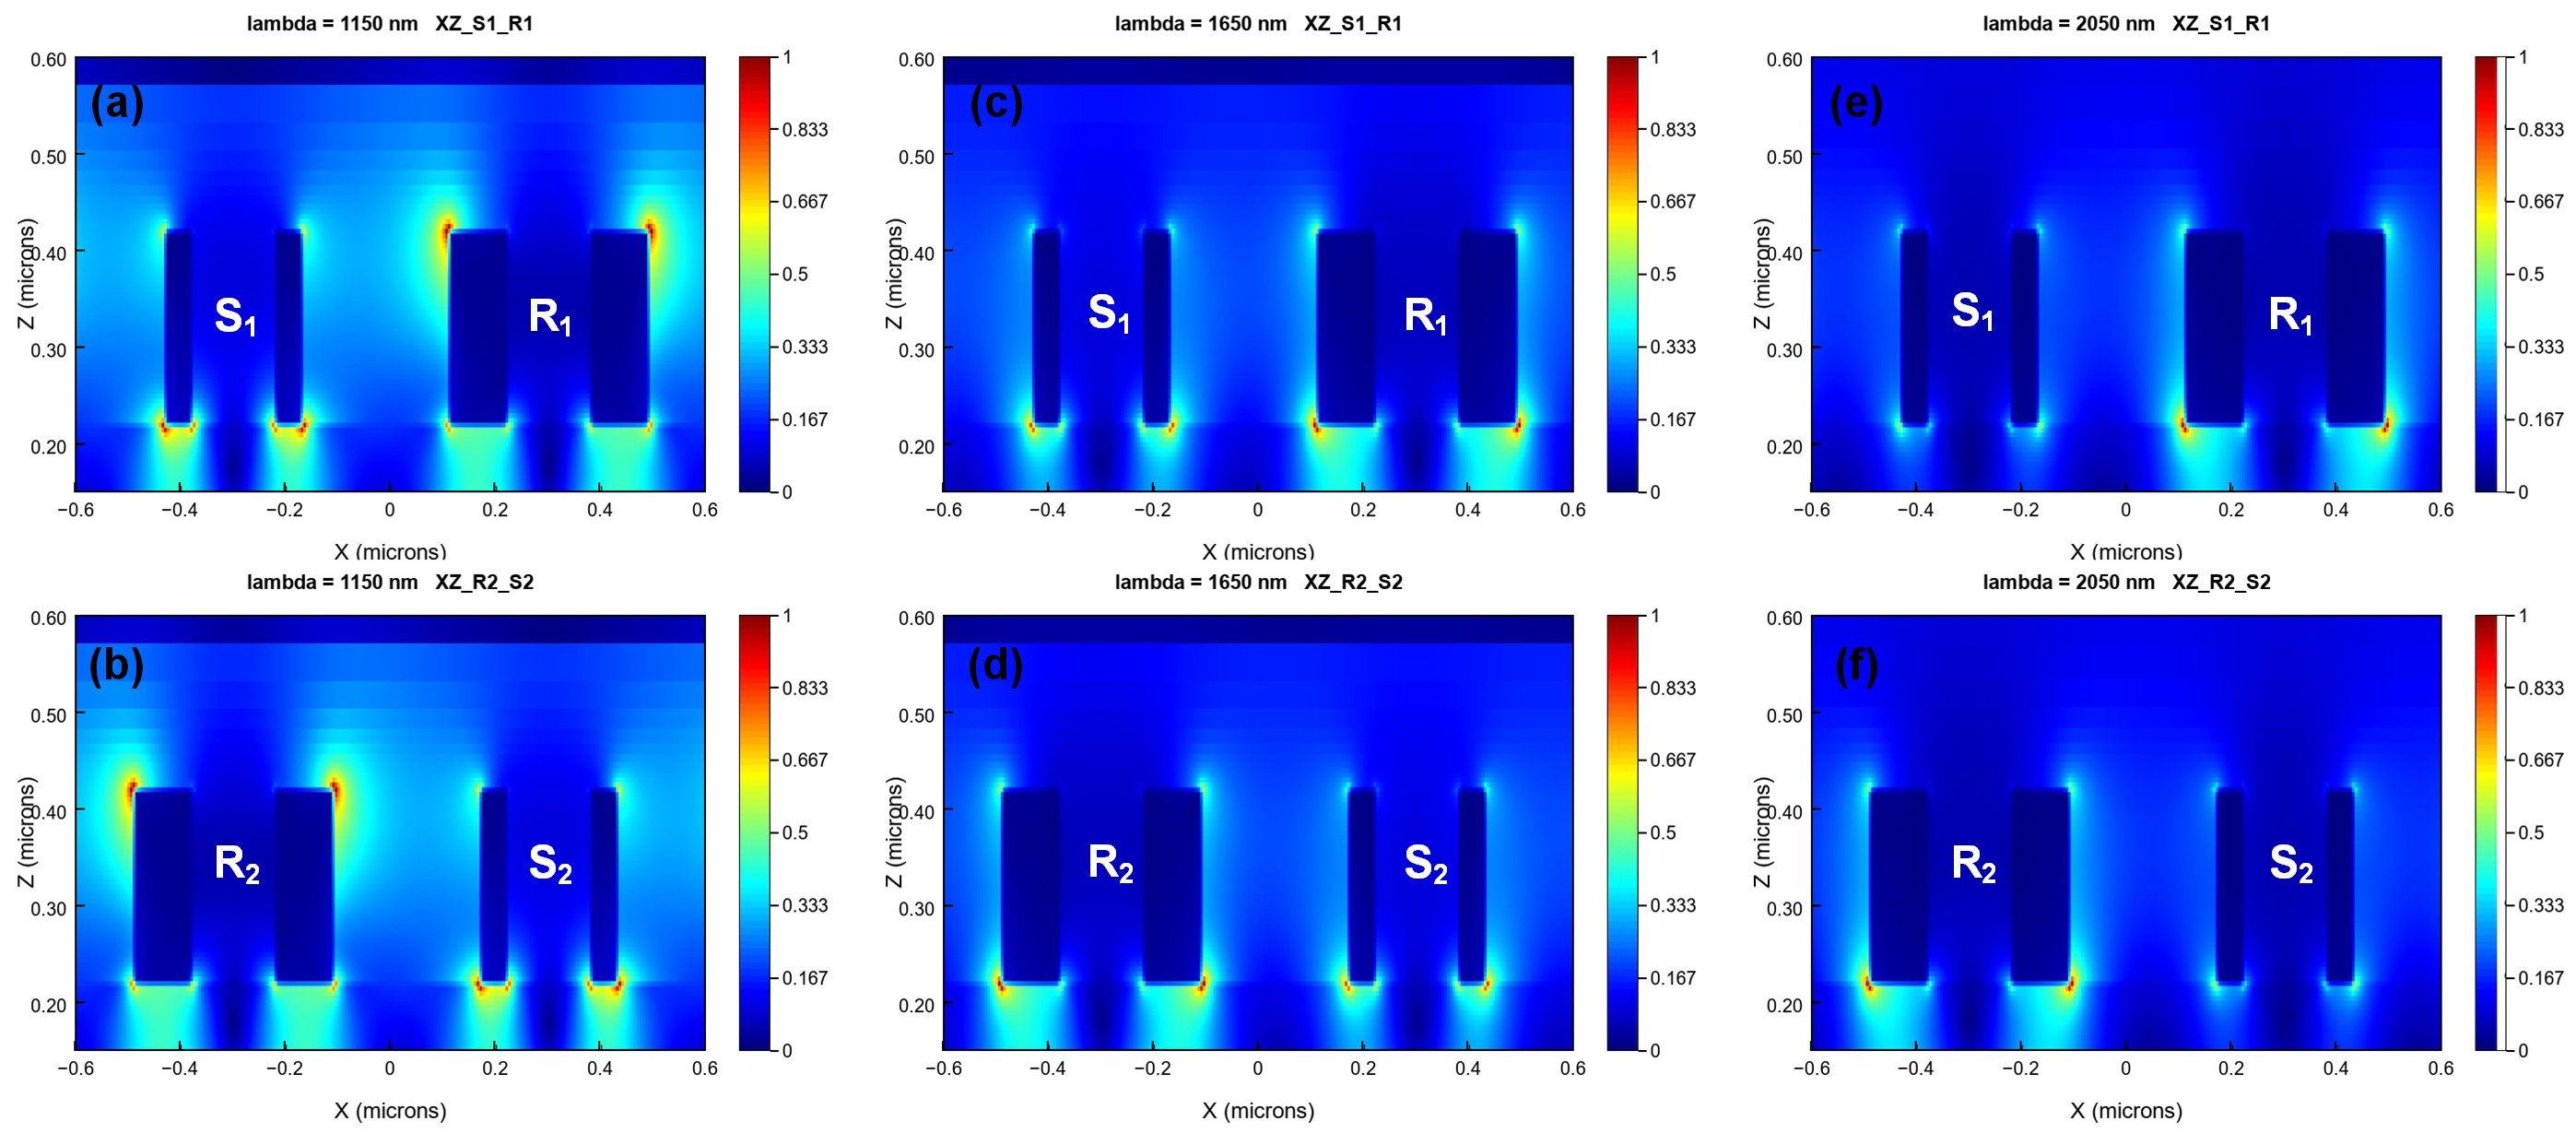
The electric-field distributions at representative wavelengths are shown in Figure 3. At 1150 nm, localized field enhancement is observed near the edges of both square and circular rings, particularly around the metallic boundaries and adjacent interfaces. At 1650 nm, the field becomes more concentrated near the lower resonator edges and the adjacent dielectric region. At 2050 nm, localized fields remain visible near the lower edges of the resonators and the metal–dielectric interfaces, including regions around the circular rings. The wavelength-dependent redistribution of the electric field indicates that both resonator types participate in the electromagnetic response over different spectral regions, consistent with the complementary absorption characteristics observed in Figure 2.
Figure 3.
Electric-field intensity distributions of the combined square–circular-ring absorber at (a,b) 1150 nm, (c,d) 1650 nm, and (e,f) 2050 nm. The first and second rows correspond to the cross-sectional planes passing through S1–R1 and R2–S2, respectively.
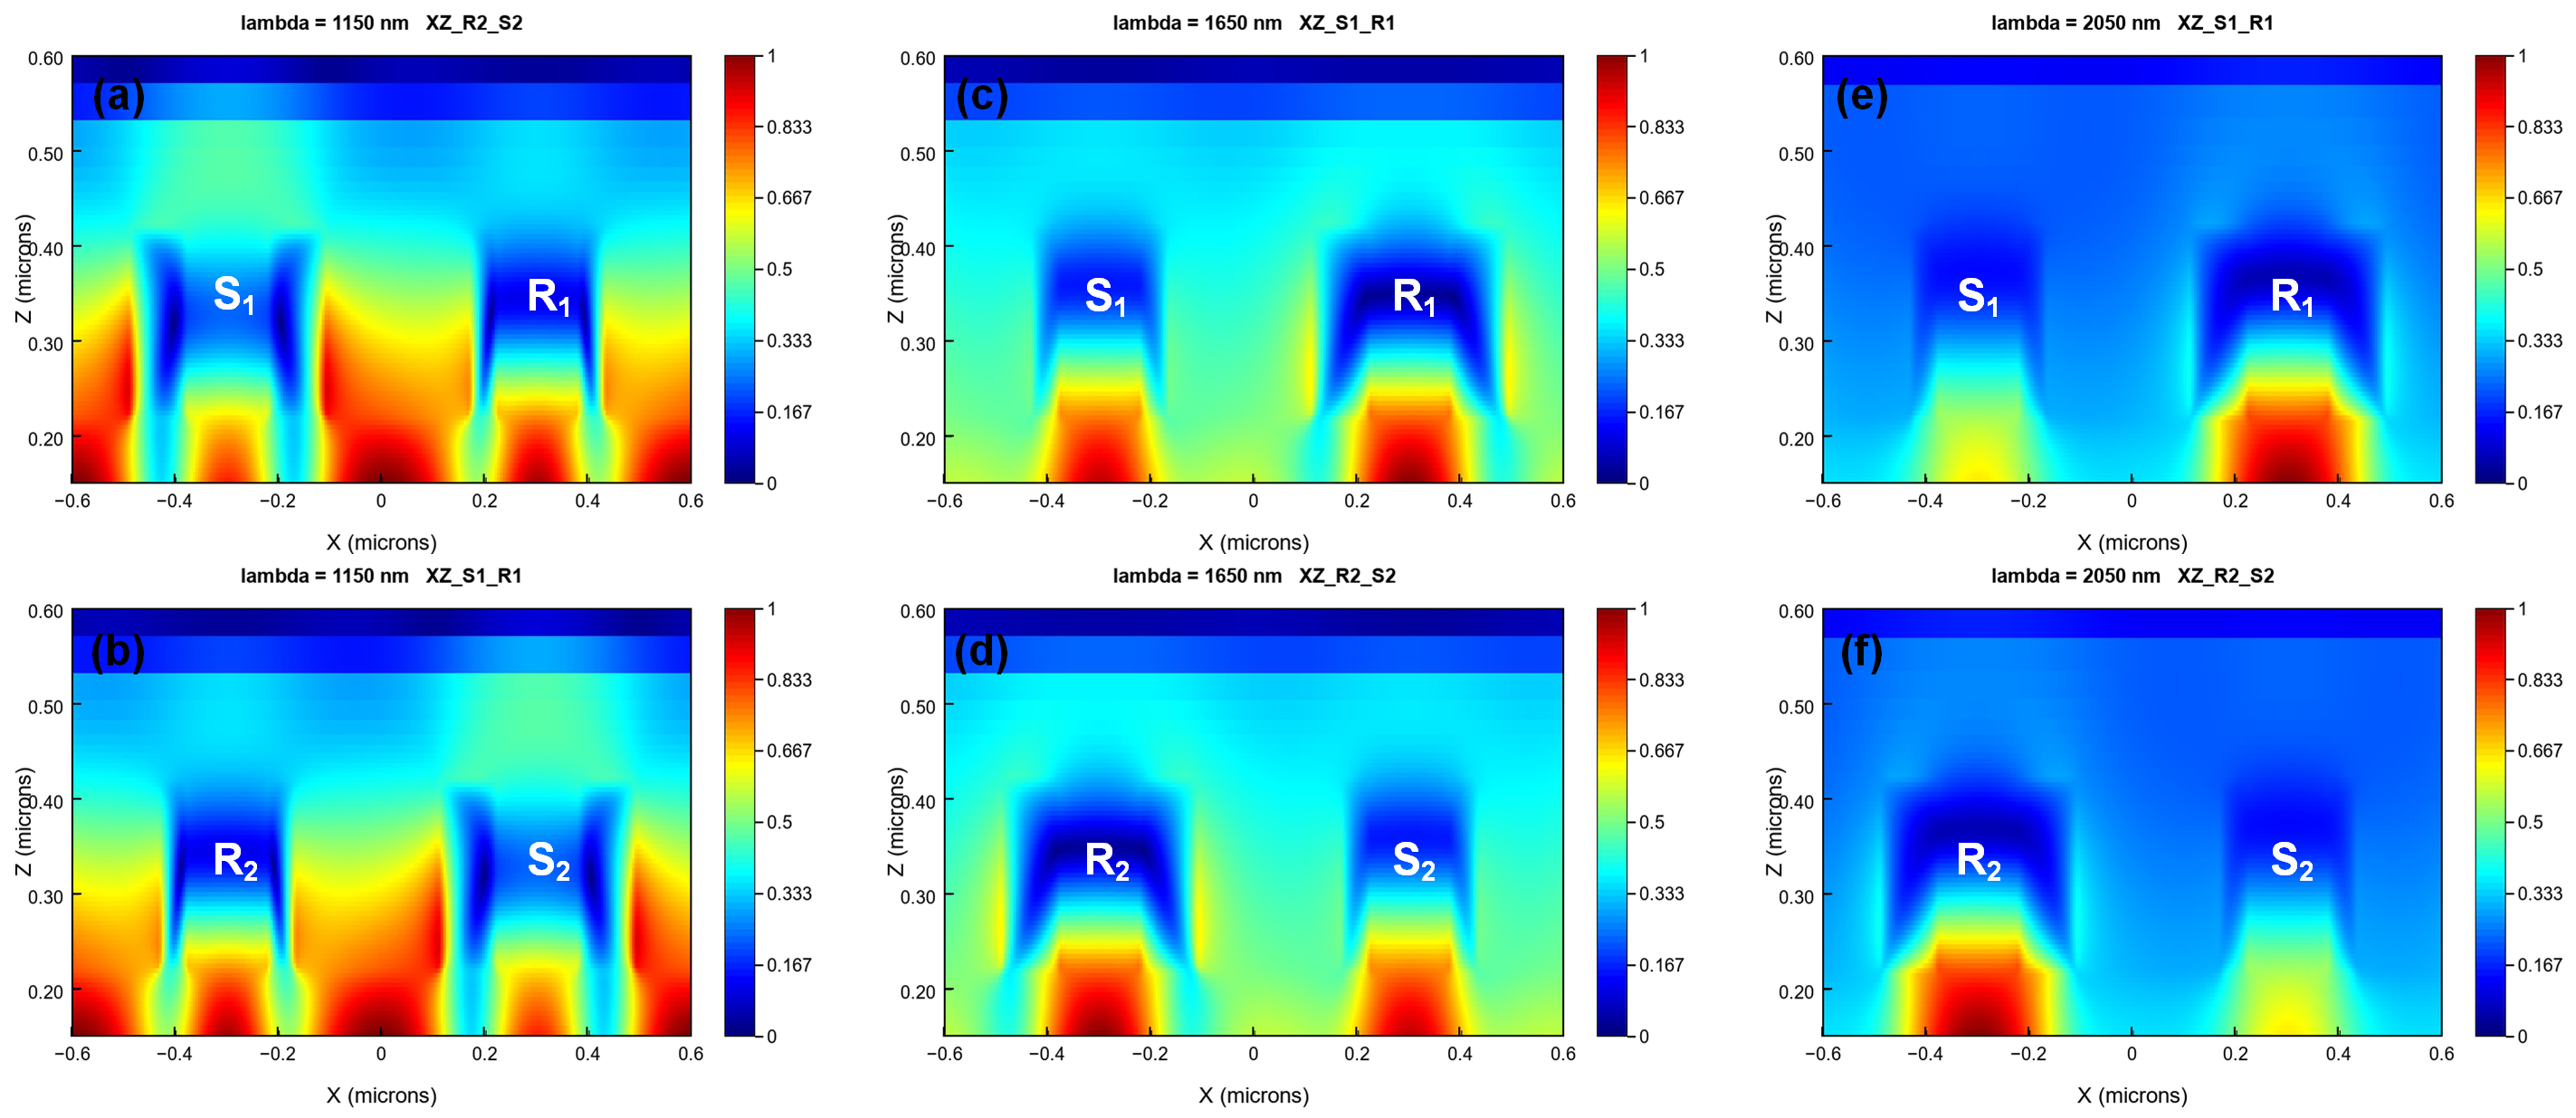
The corresponding magnetic-field distributions are presented in Figure 4. At 1150 nm, magnetic-field enhancement is observed beneath both resonator types and within the adjacent dielectric region. At 1650 nm, the magnetic field is more strongly confined within the dielectric spacer between the top resonators and the bottom metallic reflector, suggesting a cavity-like electromagnetic response in the metal–dielectric–metal configuration. At 2050 nm, the field remains localized mainly within the dielectric region beneath the resonators, with noticeable enhancement beneath the circular rings. Together with the electric-field distributions, these results support the participation of localized resonant responses and dielectric-gap field confinement in the broadband absorption process.
Figure 4.
Magnetic-field intensity distributions of the combined square–circular-ring absorber at (a,b) 1150 nm, (c,d) 1650 nm, and (e,f) 2050 nm. The first and second rows correspond to the cross-sectional planes passing through S1–R1 and R2–S2, respectively.
Taken together, the absorption spectra and electromagnetic-field distributions indicate that the broadband response arises from the combined effects of intrinsic Cr dissipation and complementary resonant responses supported by the square and circular rings. Previous studies have demonstrated the contribution of the optical properties of Cr to broadband absorption in metallic absorber structures [38]. The spectral overlap of these responses, together with field localization near the resonator boundaries and within the dielectric spacer, contributes to maintaining high absorptance over a broad wavelength range. The combined structure therefore benefits from the complementary spectral contributions of the two resonator types, resulting in a broader and flatter absorption response than that provided by either individual configuration over the relevant spectral regions.
2.2. Evaluation Metrics for the Absorber Structure
To quantitatively evaluate the broadband absorption performance of the metasurface structure, this study adopts the average absorptance and the maximum continuous high-absorption bandwidth as the main evaluation metrics, with reference to the evaluation methods commonly used in previous studies of broadband absorbers [39,40]. These two metrics characterize the overall absorption level of the device and the width of its continuous high-absorption band, respectively.
- (1)
- Average absorptance
The average absorptance is used to evaluate the overall absorption performance of the structure over the operating wavelength range of 800–2200 nm. It is expressed as
where λmax and λmin are the maximum and minimum wavelengths of the operating band, respectively, and A(λ) denotes the absorptance of the structure at wavelength λ.
- (2)
- High-absorption coverage ratio and maximum continuous high-absorption bandwidth
The high-absorption coverage ratio and the maximum continuous bandwidth with an absorptance of no less than 90% are commonly used metrics for evaluating the high-absorption performance of broadband absorbers [41]. The high-absorption coverage ratio is expressed as
where ηHA is the high-absorption coverage ratio, N is the number of continuous high-absorption intervals satisfying A(λ) ≥ 0.9 within the operating band, and Δλi is the width of the i-th continuous high-absorption interval. This metric reflects the extent to which high absorption is achieved over the entire operating band. The maximum continuous high-absorption bandwidth is used to evaluate the ability of the structure to maintain continuous high absorption when the absorptance is no less than 90%. It is expressed as
where BHA is the maximum continuous high-absorption bandwidth, and λi,R and λi,L are the left and right boundary wavelengths of the i-th continuous high-absorption interval, respectively.
3. Construction and Training of the Neural Network Prediction Model
3.1. ANN-Assisted Design of the Metasurface Absorber
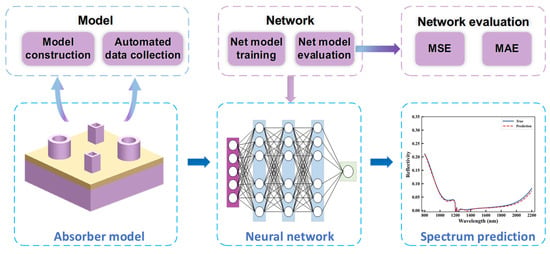
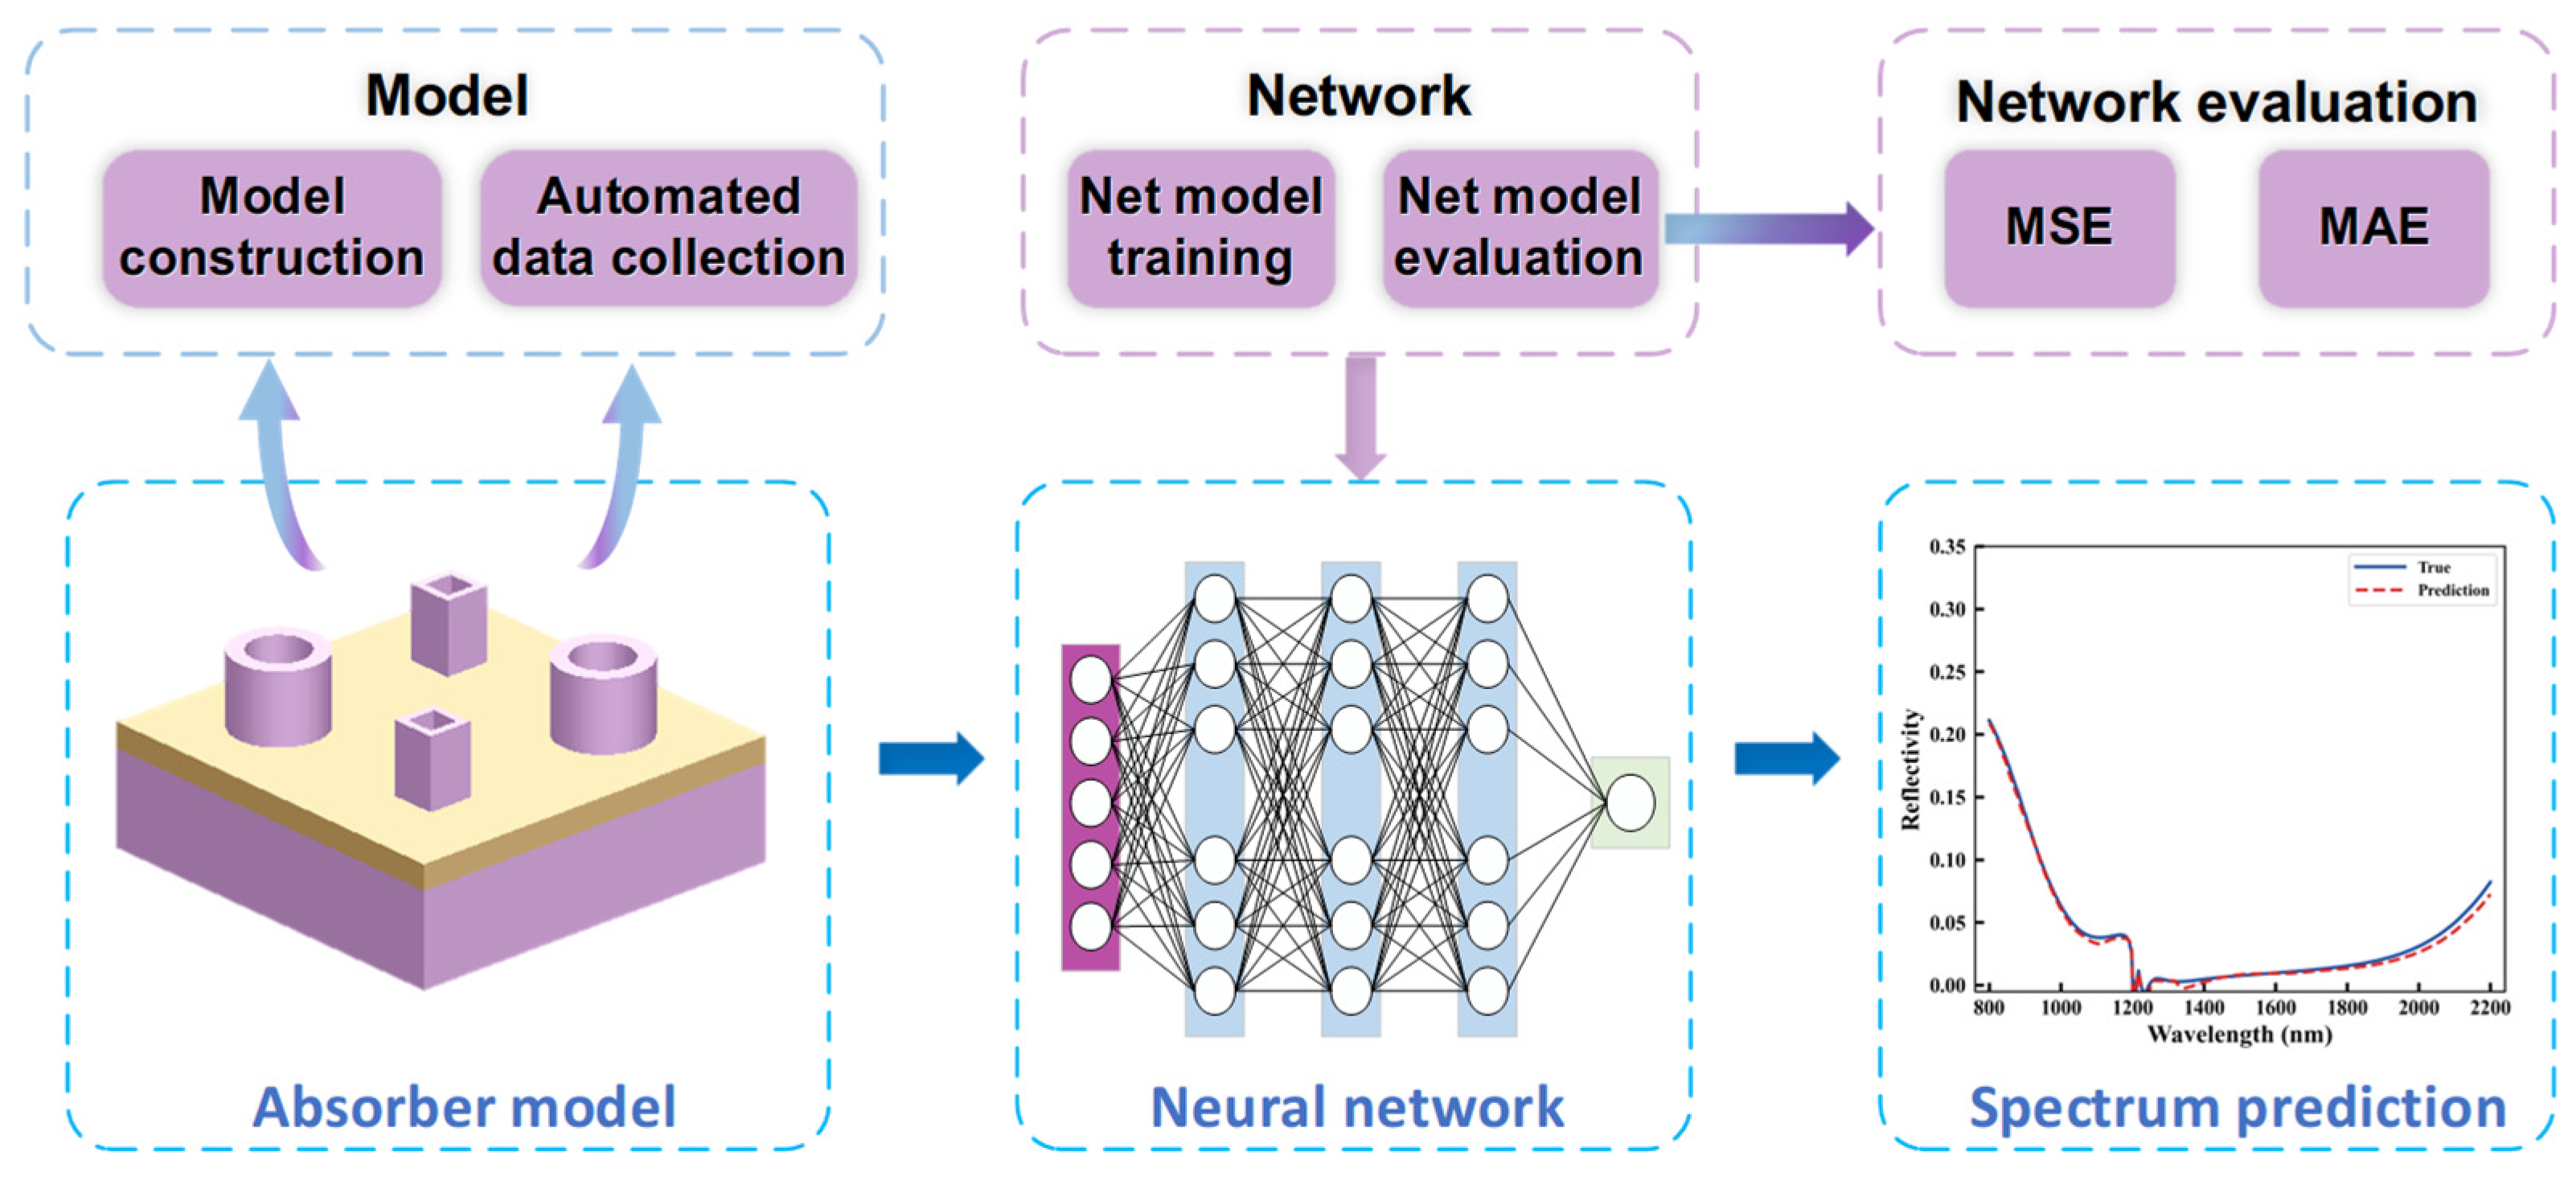
Variations in the geometric parameters of the absorber structure affect the absorption performance of the composite-resonant MIM metasurface absorber. In particular, parameters such as the dimensions, spacing, and thickness of the top square and circular resonant rings jointly determine the conditions for localized surface plasmon resonance and the strength of mode coupling, resulting in strongly nonlinear variations in the peak positions, bandwidth, and shape of the absorption spectrum. To enable rapid prediction of reflection spectra and efficient design of high-absorption structures, an artificial neural network (ANN) is developed to learn the nonlinear relationship between the structural parameters and spectral responses of the composite-resonant MIM metasurface absorber. The overall research framework is illustrated in Figure 5.
Figure 5.
Workflow of the ANN-assisted design of the metasurface absorber.
First, automated scripts are used to construct a three-dimensional numerical model of the metasurface absorber and invoke the FDTD solver. After the simulation environment, including the material parameters, boundary conditions, and excitation source, is configured, model updating, electromagnetic simulation, spectral extraction, and data storage are sequentially performed to construct a dataset containing the structural parameters and their corresponding spectral responses. Subsequently, with the structural parameters as the input and the corresponding spectral data as the output, the training set is used to optimize the neural-network parameters. Different model configurations and training strategies are then compared based on the MSE and MAE obtained on the validation set, and the model with the best predictive performance is ultimately selected. After the model architecture and training parameters are determined, a test set that is not involved in either model training or model selection is used to evaluate the final predictive performance. Following training, the trained neural network is applied to the spectral prediction of the metasurface absorber, rapidly producing the corresponding spectral response from the input structural parameters. Finally, the accuracy and reliability of the model predictions are verified through comparison with the FDTD simulation results.
3.2. Dataset Construction and Spectral Sampling Method
The spectral response of the composite-resonant MIM metasurface absorber is regulated by adjusting the geometric parameters of the top square and circular resonant rings while maintaining the overall structural configuration. A full-factorial scanning method is employed to generate structural samples within the predefined discrete parameter ranges, as detailed in Table 1.
Table 1.
Structural parameter settings of the composite resonant MIM metasurface absorber.
Finally, 6480 different parameter combinations are obtained. Electromagnetic simulations are performed for all parameter combinations using the FDTD method, and the corresponding reflection spectra are extracted and stored. Each reflection spectrum covers the wavelength range of 800–2200 nm and contains 400 wavelength sampling points, which serve as the 400-dimensional output labels of the neural network model.
In addition, to independently evaluate the predictive capability of the model for off-grid parameter combinations, Latin hypercube sampling is employed to generate 200 sets of structural parameters within the predefined parameter ranges, while ensuring that these parameter combinations do not duplicate those in the original discrete dataset. The corresponding 400-point reflection spectrum of each structure is then calculated using the FDTD method. These data are independent of the original discrete dataset containing 6480 structures and are used for the subsequent out-of-dataset prediction validation.
3.3. Artificial Neural Network Architecture and Training Method
To establish the nonlinear mapping relationship between the structural parameters of the composite-resonant MIM metasurface and its reflection spectrum, the spectral prediction problem is formulated as a supervised-learning regression task. The network input is a feature vector X = [r1,r2,S1,S2,h] consisting of five structural parameters, while the network output, sampled over the wavelength range of 800–2200 nm, is represented by a 400-dimensional reflection-spectrum vector Y = [R(λ1),R(λ2) … R(λ400)]. Therefore, the problem can be formally expressed as finding a nonlinear function mapping:
f:R5 → R400.
The network continuously optimizes the mapping function to minimize the error between the predicted spectrum and the true spectrum Y.
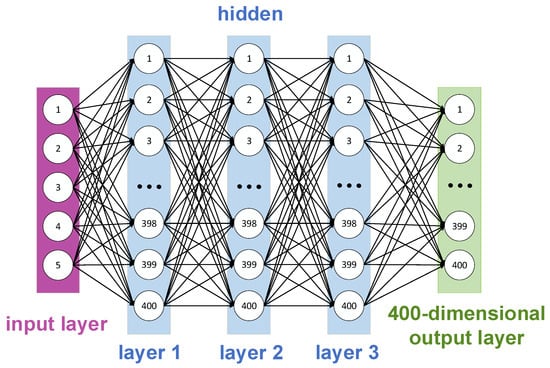
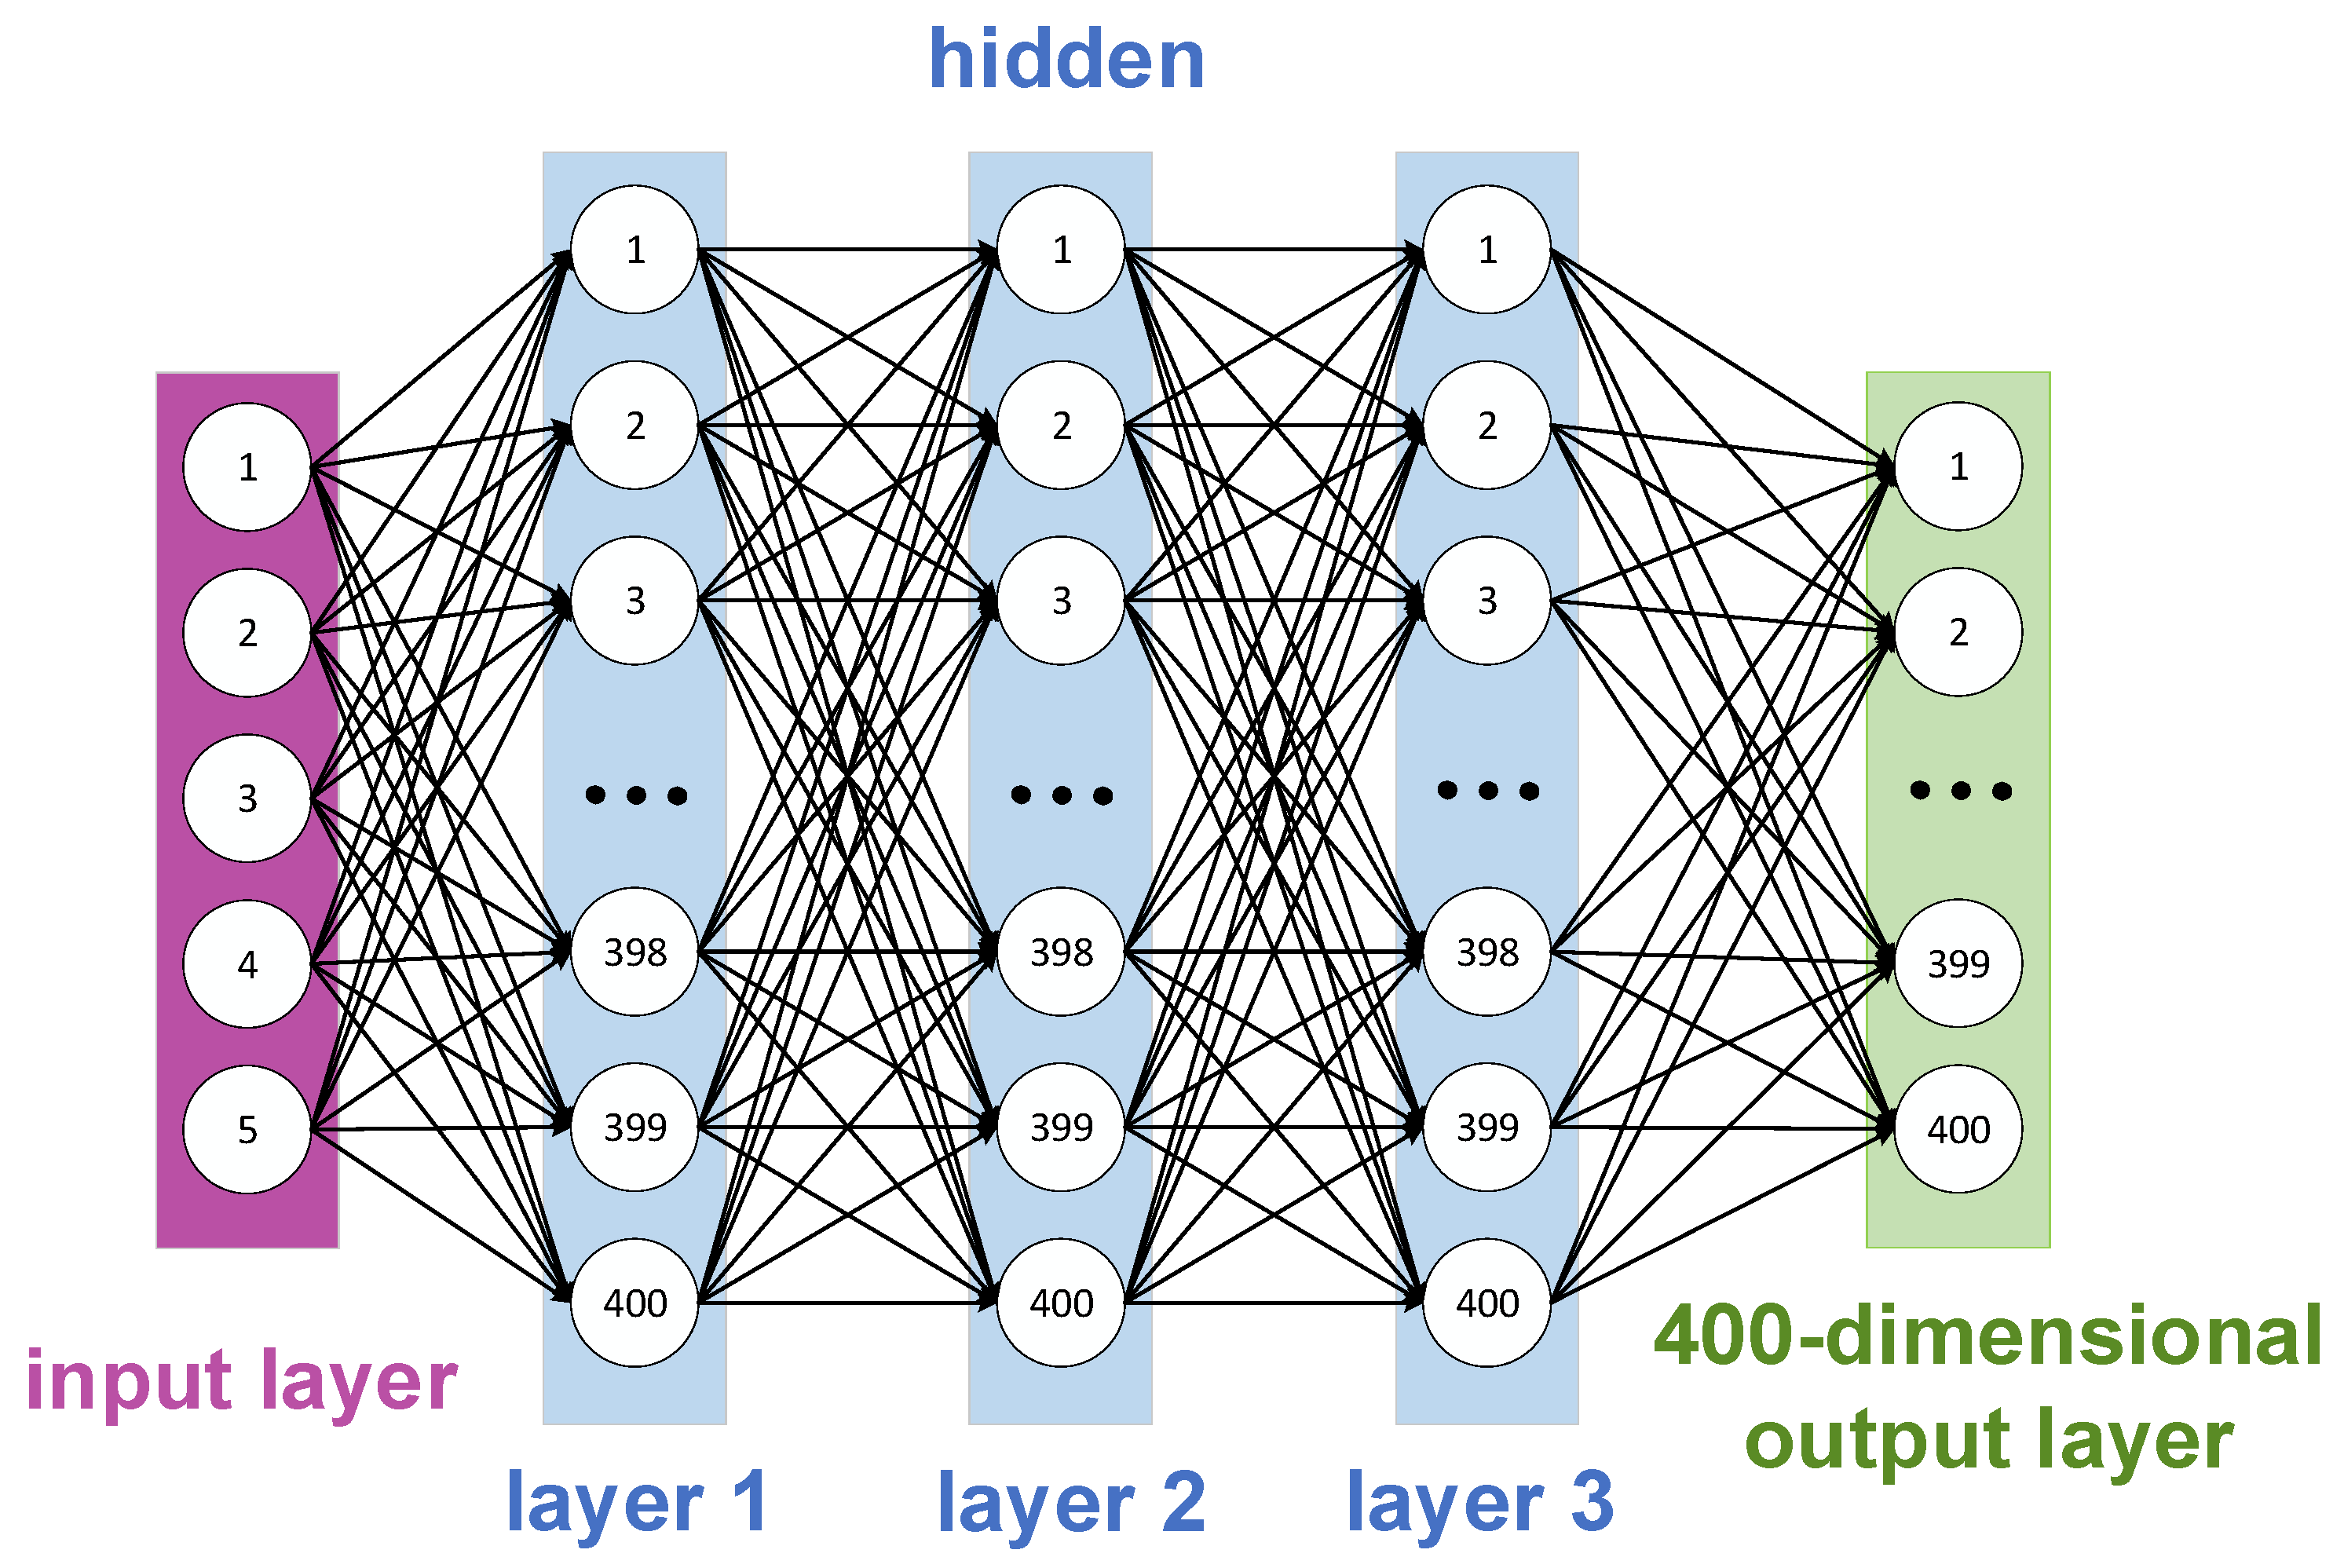
Considering that the input parameter dimension is relatively low and that the output is a one-dimensional continuous spectral vector, an artificial neural network (ANN) based on a multilayer perceptron (MLP) is selected as the prediction model. Its overall architecture is illustrated in Figure 6. The network consists of a five-dimensional input layer, three hidden layers containing 400 neurons each, and a 400-dimensional output layer. The rectified linear unit (ReLU) is employed as the activation function for the hidden layers [42], while the sigmoid activation function is used in the output layer to constrain the predicted reflectance to the physical range of 0–1, thereby satisfying the prediction requirements of the continuous-spectrum regression task. The network parameters are updated using the Adam optimization algorithm [43], which adaptively adjusts the learning rate based on estimates of the first and second moments of the gradients and provides good convergence speed and training stability for high-dimensional nonlinear regression problems.
Figure 6.
Schematic illustration of the ANN architecture developed in this work.
The network was trained using the Adam optimizer with a batch size of 64. In the first stage, spectral-amplitude pretraining was performed with an initial learning rate of 1 × 10⁻³ and a maximum of 3000 epochs. The learning rate was adjusted using a ReduceLROnPlateau scheduler with a reduction factor of 0.5, a patience of 40 epochs, and a minimum learning rate of 1 × 10⁻⁶. Early stopping was applied with a patience of 150 epochs. In the second stage, the pretrained network weights were used to initialize progressive spectral-shape fine-tuning, with the initial learning rate reduced to 1 × 10⁻⁴ and the maximum number of epochs set to 500. The learning-rate scheduler retained the same reduction factor and minimum learning rate, while early stopping was applied with a patience of 100 epochs.
The 6480 samples are divided into training, validation, and test sets containing 3855, 681, and 1944 samples, respectively, accounting for 59.5%, 10.5%, and 30% of the entire dataset. To address the limitation that the conventional pointwise MSE loss mainly focuses on spectral-amplitude errors and cannot sufficiently constrain resonance peaks, valleys, and local spectral-shape variations, a two-stage progressive training method with joint spectral amplitude–shape constraints is developed in this study. The method first performs basic learning of the spectral amplitudes and then progressively introduces a spectral-shape constraint, thereby strengthening the model’s ability to represent local variation trends while maintaining its overall spectral prediction accuracy.
In the first training stage, only the pointwise mean squared error at each wavelength is used as the loss function to train the baseline model, enabling the network to learn the mapping relationship between the structural parameters and the reflection-spectrum amplitudes. The MSE is adopted as the loss function and is defined as
where LMSE denotes the spectral-amplitude loss, N denotes the number of spectral sampling points, and Yi and denote the true and predicted reflectances at the i-th wavelength sampling point, respectively. By continuously minimizing this loss function, the network gradually learns a stable mapping relationship between the structural parameters and the reflection spectrum.
In the second stage, the optimal weights of the baseline model are used as the initial weights. A spectral-shape loss constructed from the reflectance changes between adjacent wavelength sampling points is then introduced, together with a progressive weight-adjustment strategy. The spectral-shape loss is expressed as
where and Yi+1 − Yi denote the reflectance changes between adjacent wavelength sampling points in the spectrum predicted by the ANN and the true spectrum obtained by FDTD, respectively. The term Lshape denotes the spectral-shape loss, which is used to measure the difference in local variation trends between the predicted and true spectra. The overall composite loss function is expressed as
where L denotes the total loss function used for model training, and α(e) denotes the weight of the spectral-shape loss, which varies dynamically with the training epoch. Unlike methods that directly employ a composite loss with a fixed weight, the proposed method dynamically adjusts the weight of the spectral-shape loss according to the training epoch, thereby achieving joint optimization of the spectral amplitude and local spectral shape.
L = LMSE + α(e)Lshape,
The weighting schedule was empirically specified to balance spectral-amplitude reconstruction and local spectral-shape optimization during training. A warm-up period was first introduced to allow the network to establish a stable spectral-amplitude representation, followed by a linear increase in the spectral-shape loss weight and a subsequent constant-weight stage. The weighting coefficient α(e) was therefore designed to increase gradually during fine-tuning, allowing the network to transition from amplitude-focused optimization to joint amplitude–shape optimization. The corresponding schedule is defined as follows:
Here, e denotes the fine-tuning epoch, while Ew, Er and αmax represent the warm-up duration, ramp duration, and maximum spectral-shape loss weight, respectively. These parameters were set to 20 epochs, 100 epochs, and 1.8, respectively.
Finite difference-based shape constraints characterize local variations between neighboring spectral values, while multi-objective learning methods combine different optimization objectives through weighted loss functions. Progressive training strategies further organize the optimization process by gradually introducing learning objectives or constraints. Building on these concepts, the proposed T-Spssc framework coordinates spectral-amplitude and spectral-shape optimization through a two-stage training strategy. Specifically, the network is first pretrained using an amplitude-based loss to learn the overall spectral response. A spectral-shape constraint is then introduced during fine-tuning, with its weight progressively increased to strengthen local spectral-shape reconstruction while preserving the learned spectral-amplitude representation.
4. Analysis and Discussion
4.1. Training and Convergence Analysis of Models with Different Architectures
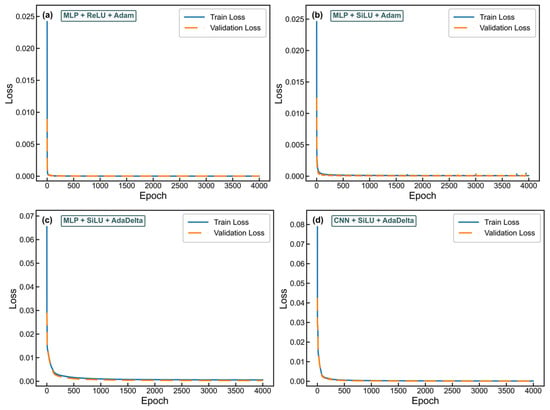
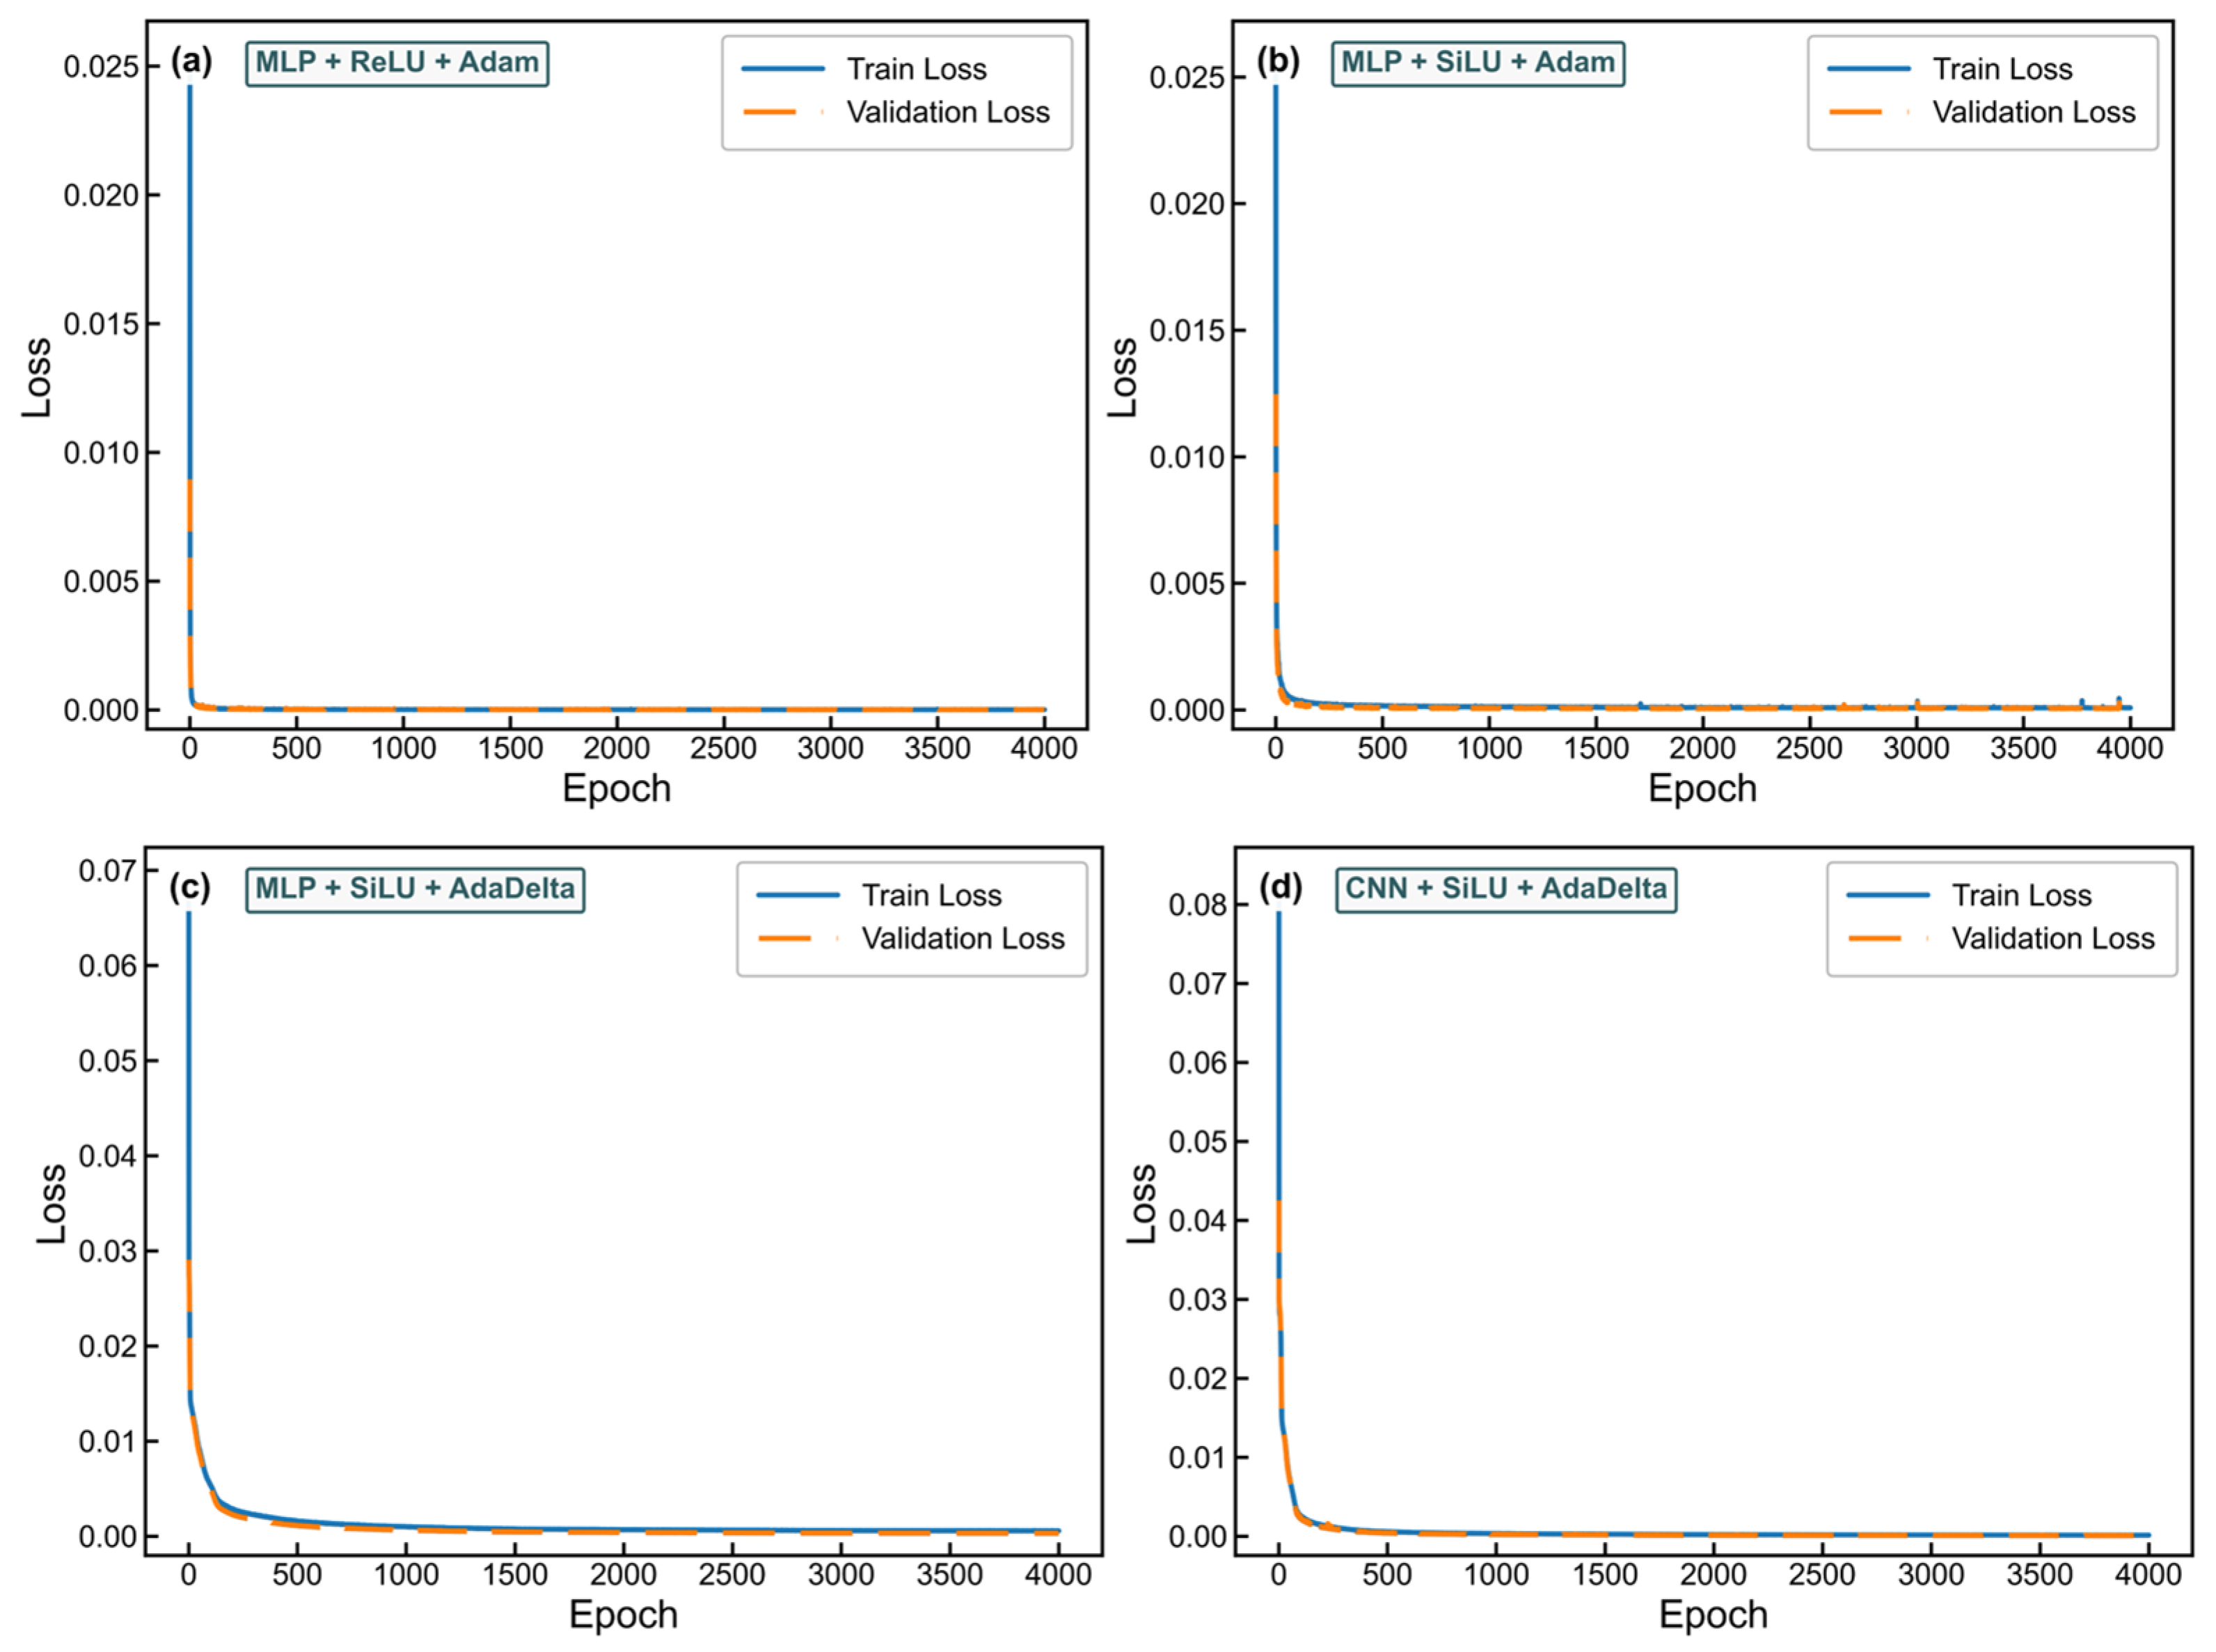
To identify a suitable baseline network architecture for the rapid prediction of metasurface reflection spectra, different combinations of network architectures, activation functions, and optimizers are compared. As shown in Figure 7, the training losses of all four models gradually decrease with an increasing number of iterations and eventually stabilize, indicating that all four models can effectively learn the nonlinear mapping relationship between the geometric parameters and the reflection spectra. However, clear differences are observed among the models in terms of convergence speed, loss level, and training stability.
Figure 7.
Training and validation loss curves of different neural-network models. (a) MLP + ReLU + Adam; (b) MLP + SiLU + Adam; (c) MLP + SiLU + AdaDelta; (d) CNN + SiLU + AdaDelta.
Among the four models, the MLP model using the ReLU activation function and the Adam optimizer (Figure 7a) exhibits the best overall performance. The model converges rapidly during the early stage of training, and its loss stabilizes after approximately 300 epochs. It also achieves the lowest final training and validation losses. The training and validation losses exhibit generally consistent trends, and the validation loss remains at a low level throughout the training process without obvious divergence. Although the MLP model using the SiLU activation function (Figure 7b) also achieves a relatively low loss, its validation loss shows some fluctuations during the later stage of training, indicating slightly lower stability than that of the ReLU model. The model using the AdaDelta optimizer (Figure 7c) exhibits a markedly slower convergence rate and requires more epochs to stabilize, indicating insufficient parameter-update efficiency for this task. For the CNN model (Figure 7d), the input data contain only a limited number of metasurface geometric parameters rather than two-dimensional structural features with spatial topological relationships. Therefore, the advantage of convolutional operations in extracting local spatial features cannot be fully utilized, and its predictive performance does not reach that of model (a).
Considering the convergence speed, loss level, and stability of the models, the MLP + ReLU + Adam model shown in Figure 7a is selected as the baseline network architecture for the subsequent spectral prediction.
4.2. Ablation Analysis of the Two-Stage Progressive Spectral Shape Constraint
After determining the baseline network architecture, three groups of ablation experiments are conducted to verify the effectiveness of the spectral shape loss and its progressive introduction strategy: the baseline model using only the mean squared error loss, the model using a fixed-weight spectral shape constraint (Fixed-Weight Spectral Shape Constraint, F-Wssc), and the proposed model using a two-stage progressive spectral shape constraint (Two-Stage Progressive Spectral Shape Constraint, T-Spssc). All three models employ the same data partition, network architecture, optimizer, and training configuration, with the total number of training epochs used as a unified training budget. Their main differences lie in the composition of the loss function and the corresponding training strategy. Model selection for each model is performed using the validation set containing 681 samples, and the final performance is evaluated using 1944 grid-based test samples.
As shown in Table 2, the F-Wssc model reduces the spectral-shape MSE by 50.51% compared with the baseline, demonstrating the effectiveness of the shape constraint in capturing local spectral variations. However, the spectral MSE and MAE increase by 16.34% and 8.47%, respectively, accompanied by a 23.36% increase in resonance-position deviation. These results suggest that applying a fixed spectral-shape constraint throughout training places greater emphasis on local spectral variations, thereby influencing the balance between global spectral accuracy and local shape reconstruction.
Table 2.
Ablation study results under different strategies.
In contrast, the T-Spssc model progressively incorporates the spectral-shape constraint after establishing the overall spectral response, achieving a more balanced prediction performance. Compared with the baseline, the spectral MSE, MAE, and spectral-shape MSE decrease by 2.72%, 1.69%, and 18.98%, respectively, while the absolute error in average absorptance decreases by 0.91%. Among the 1944 test samples, lower spectral MSE, MAE, and spectral-shape MSE values are obtained for 67.13%, 65.48%, and 93.11% of the samples, respectively, indicating that these improvements extend across a substantial proportion of the test set.
Furthermore, the resonance-position deviations of the baseline and T-Spssc models remain comparable at 29.84 and 30.01 nm, respectively, with a difference of only 0.17 nm, well below the average wavelength sampling interval of approximately 3.51 nm. Notably, although F-Wssc achieves the lowest spectral-shape MSE, T-Spssc provides higher overall spectral prediction accuracy and a smaller resonance-position deviation than F-Wssc. These findings highlight the effectiveness of the two-stage progressive optimization strategy in coordinating global spectral reconstruction and local spectral-shape preservation while maintaining comparable resonance-position prediction performance. Accordingly, T-Spssc is selected for subsequent spectral prediction and structural screening.
To further assess the effectiveness and consistency of the proposed training strategy, four approaches were compared: the baseline model, the fixed-weight spectral-shape constraint (F-Wssc), the one-stage progressive spectral-shape constraint (O-Spssc), and the proposed two-stage progressive spectral-shape constraint (T-Spssc). All models were trained from scratch using the same network architecture, dataset partition, optimization settings, and training budget. Five random seeds were employed to evaluate the consistency of the prediction results, and both prediction accuracy and computational cost were examined. The corresponding results are summarized in Table 3.
Table 3.
Comparison of prediction accuracy and computational cost across four training strategies using five random seeds.
As shown in Table 3, the four training strategies exhibit different optimization characteristics. The F-Wssc model achieves the lowest spectral-shape MSE of 6.519 × 10⁻⁸, demonstrating its effectiveness in reconstructing local spectral variations. However, its spectral MSE increases to 1.837 × 10⁻⁶ compared with the baseline model. The O-Spssc model exhibits spectral MSE and spectral-shape MSE values of 1.932 × 10⁻⁶ and 6.840 × 10⁻⁸, respectively, which are slightly higher than those of the F-Wssc model. This indicates that progressively introducing the spectral-shape constraint within a single training stage does not necessarily improve both global spectral accuracy and local spectral-shape reconstruction. In comparison, the proposed T-Spssc model achieves the lowest spectral MSE of 1.795 × 10⁻⁶ among the four approaches, corresponding to a reduction of approximately 0.17%, 2.29%, and 7.09% compared with the baseline, F-Wssc, and O-Spssc models, respectively. Its spectral-shape MSE is also reduced by approximately 11.00% relative to the baseline. Although its spectral-shape MSE remains higher than those of F-Wssc and O-Spssc, T-Spssc provides the best overall spectral prediction accuracy, demonstrating the advantage of separating initial spectral-amplitude learning from subsequent progressive spectral-shape optimization.
Furthermore, T-Spssc exhibits a spectral MSE standard deviation of 0.065 × 10⁻⁶ across the five random seeds, indicating relatively consistent prediction performance. In terms of computational cost, the mean training times of the baseline, F-Wssc, O-Spssc, and T-Spssc models are 557, 579, 490, and 443 s, respectively, while their inference times remain comparable at 0.253–0.256 μs per sample. These results suggest that the proposed two-stage strategy provides a favorable balance between global spectral prediction accuracy and local spectral-shape reconstruction without increasing inference complexity.
To investigate the sensitivity of spectral prediction performance to the progressive spectral-shape weighting schedule, five configurations were evaluated by varying the ramp duration and weighting function. The warm-up duration and maximum spectral-shape loss weight were fixed at 20 epochs and 1.8, respectively. Specifically, linear schedules with ramp durations of 50, 100, and 200 epochs were compared with cosine and quadratic schedules using a 100-epoch ramp. All experiments employed the same dataset partition, network architecture, and training settings, and were evaluated on the same 1944 test samples. The results are summarized in Table 4.
Table 4.
Sensitivity analysis of different progressive spectral-shape weighting schedules.
As shown in Table 4, the spectral MSE varies by less than 0.71% across the five weighting schedules, indicating relatively stable overall spectral prediction accuracy under the investigated configurations. In contrast, the spectral-shape MSE exhibits greater sensitivity to the ramp duration. Compared with the adopted 100-epoch linear schedule, reducing the ramp duration to 50 epochs increases the spectral-shape MSE by 3.02%, while extending it to 200 epochs results in an increase of 6.40%. This suggests that the ramp duration plays a more pronounced role in local spectral-shape reconstruction than in overall spectral-amplitude prediction. When the ramp duration is fixed at 100 epochs, the linear, cosine, and quadratic schedules yield closely comparable prediction errors, indicating a relatively limited influence of the weighting function. Among the five configurations, the adopted 100-epoch linear schedule achieves the lowest spectral MSE and spectral-shape MSE, supporting its selection for the proposed T-Spssc model. These findings demonstrate that the progressive weighting strategy maintains stable global spectral prediction accuracy across the examined schedules, while the ramp duration has a greater influence on local spectral-shape reconstruction.
4.3. Analysis of Prediction Results for the Test Samples
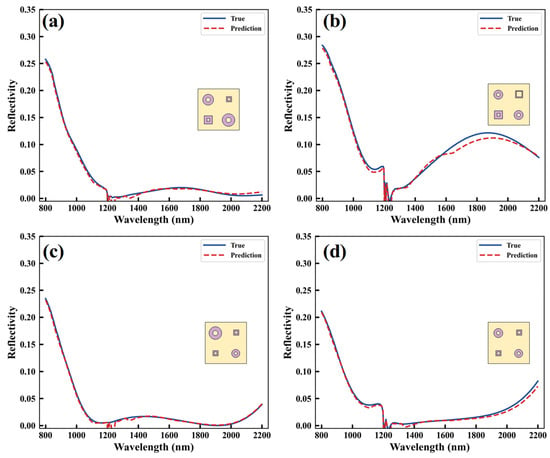
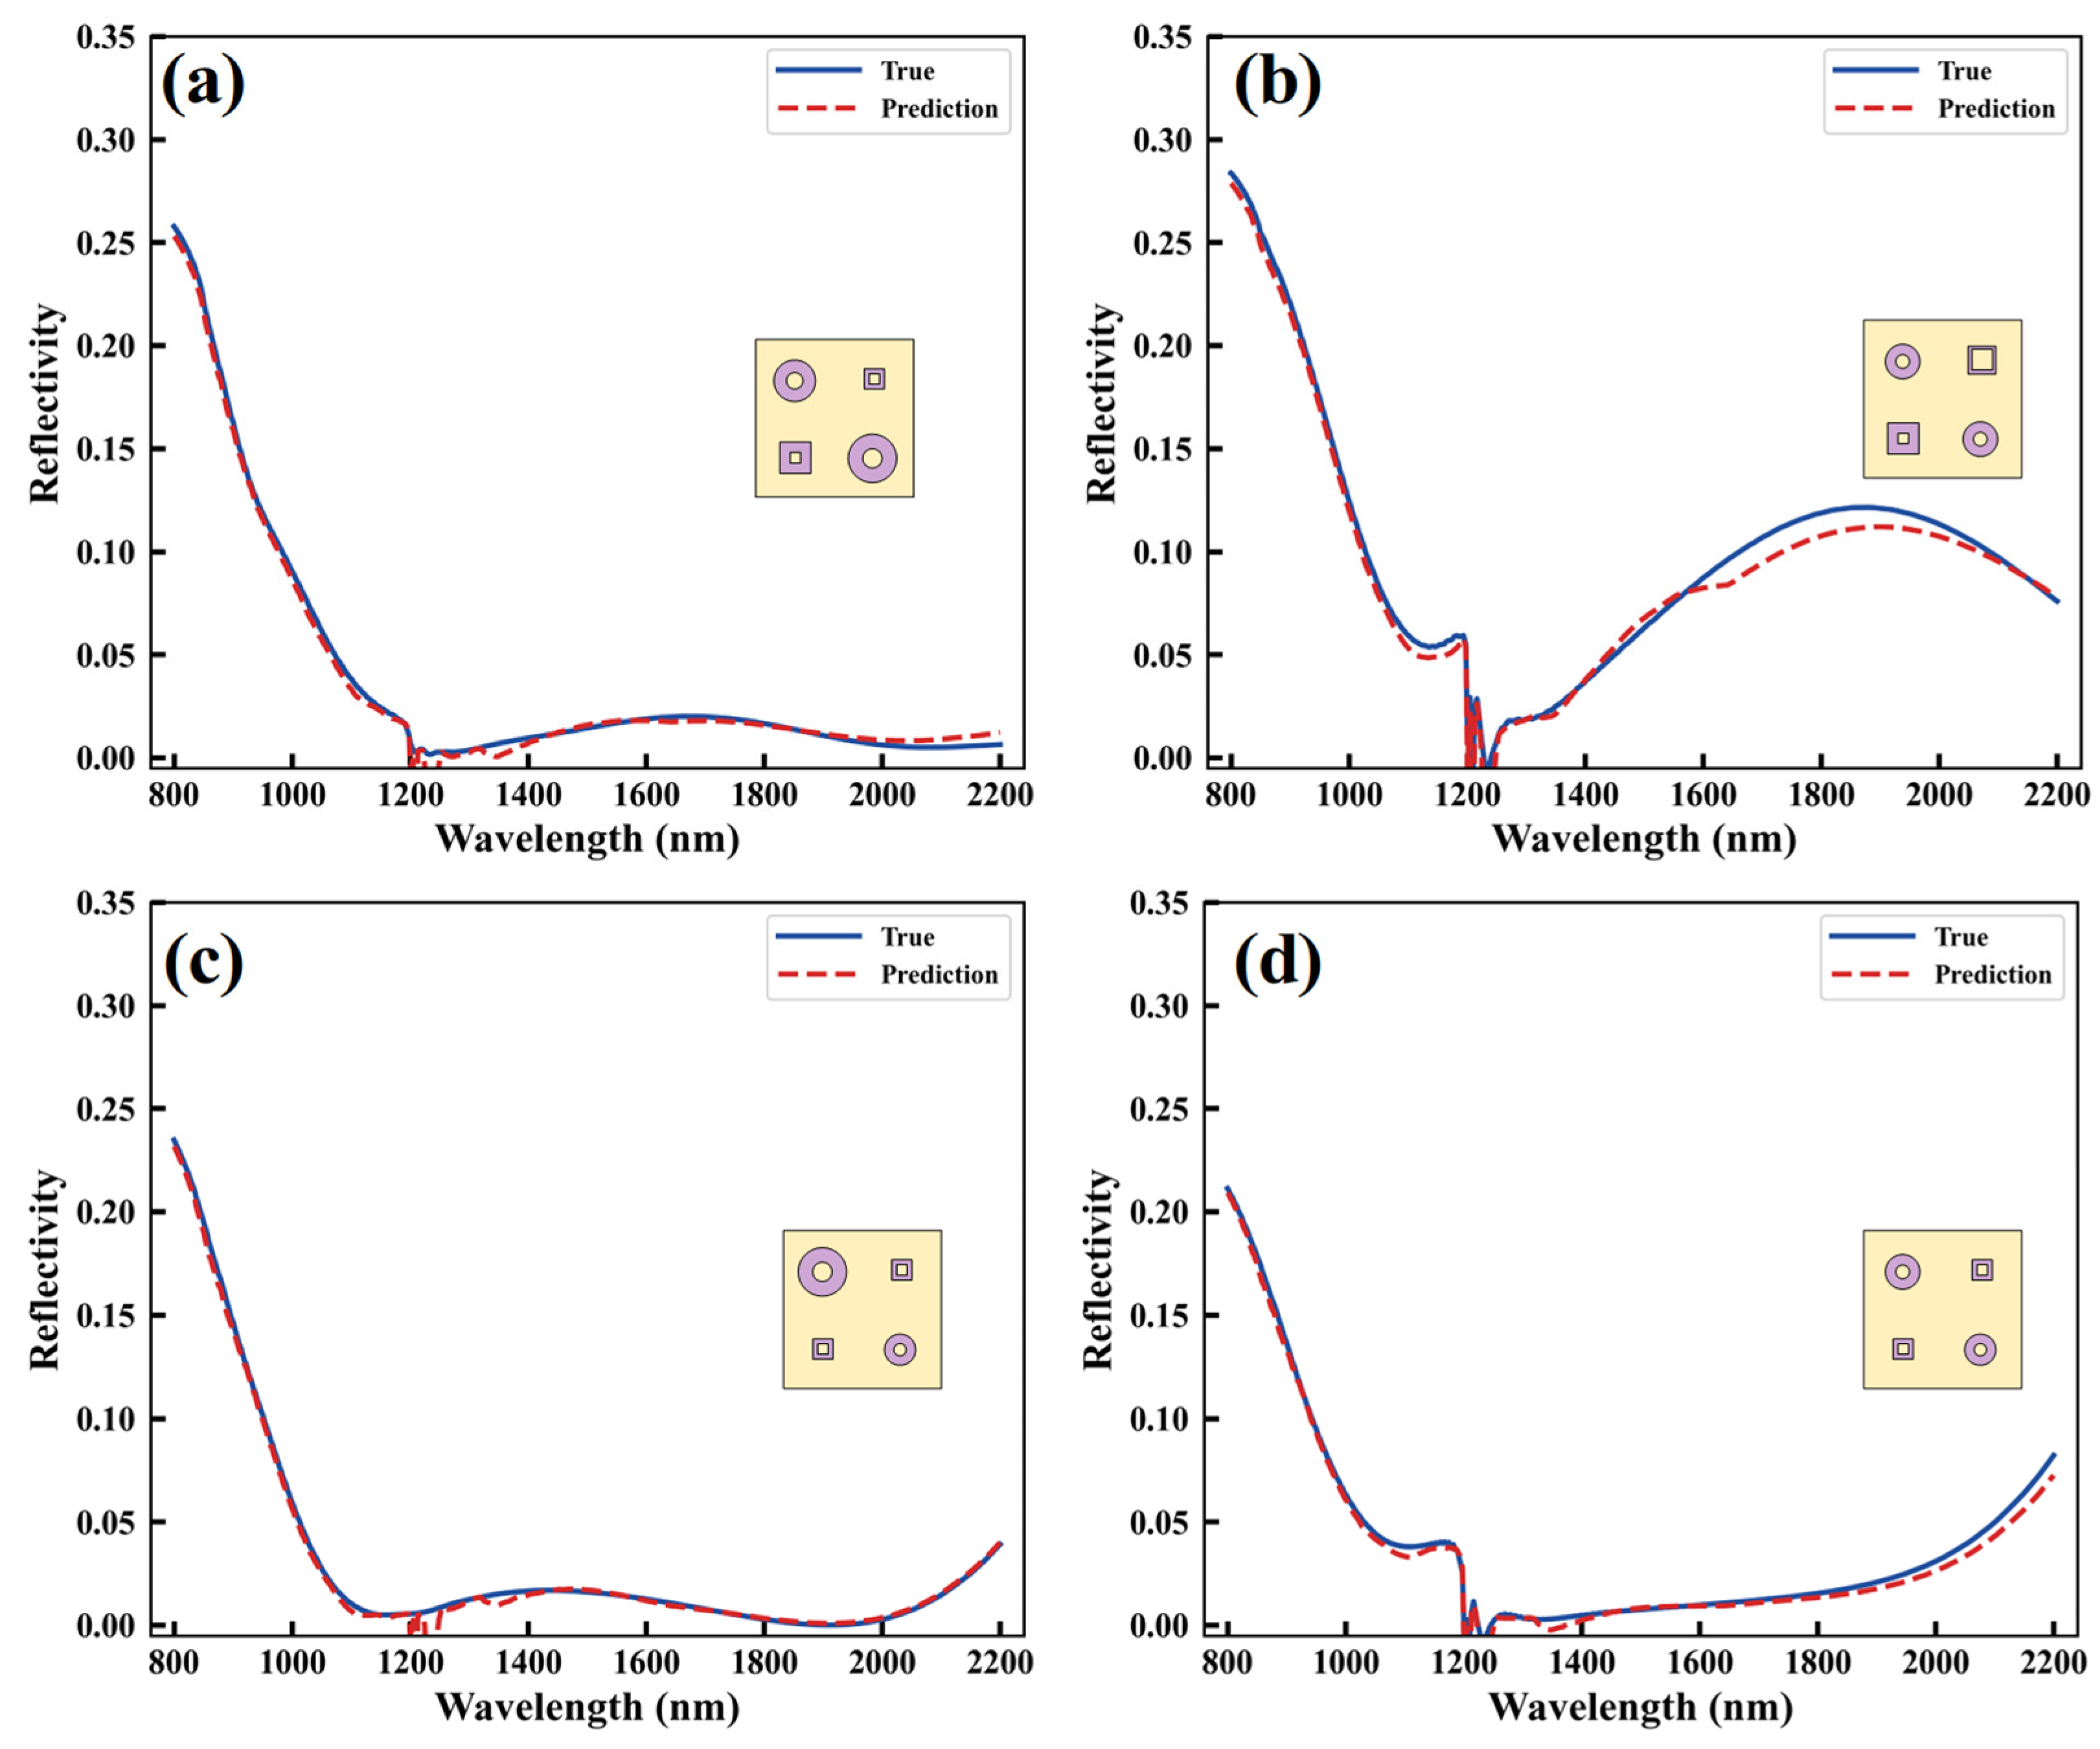
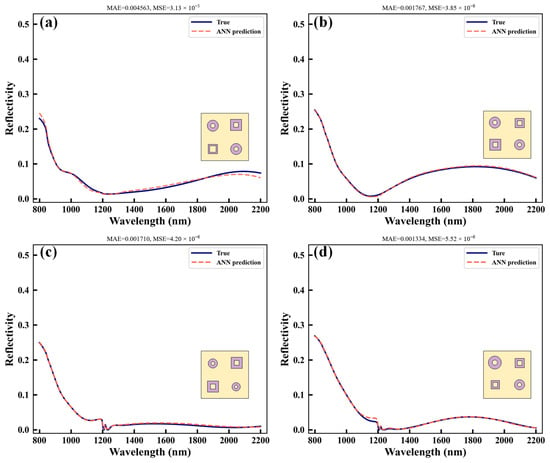
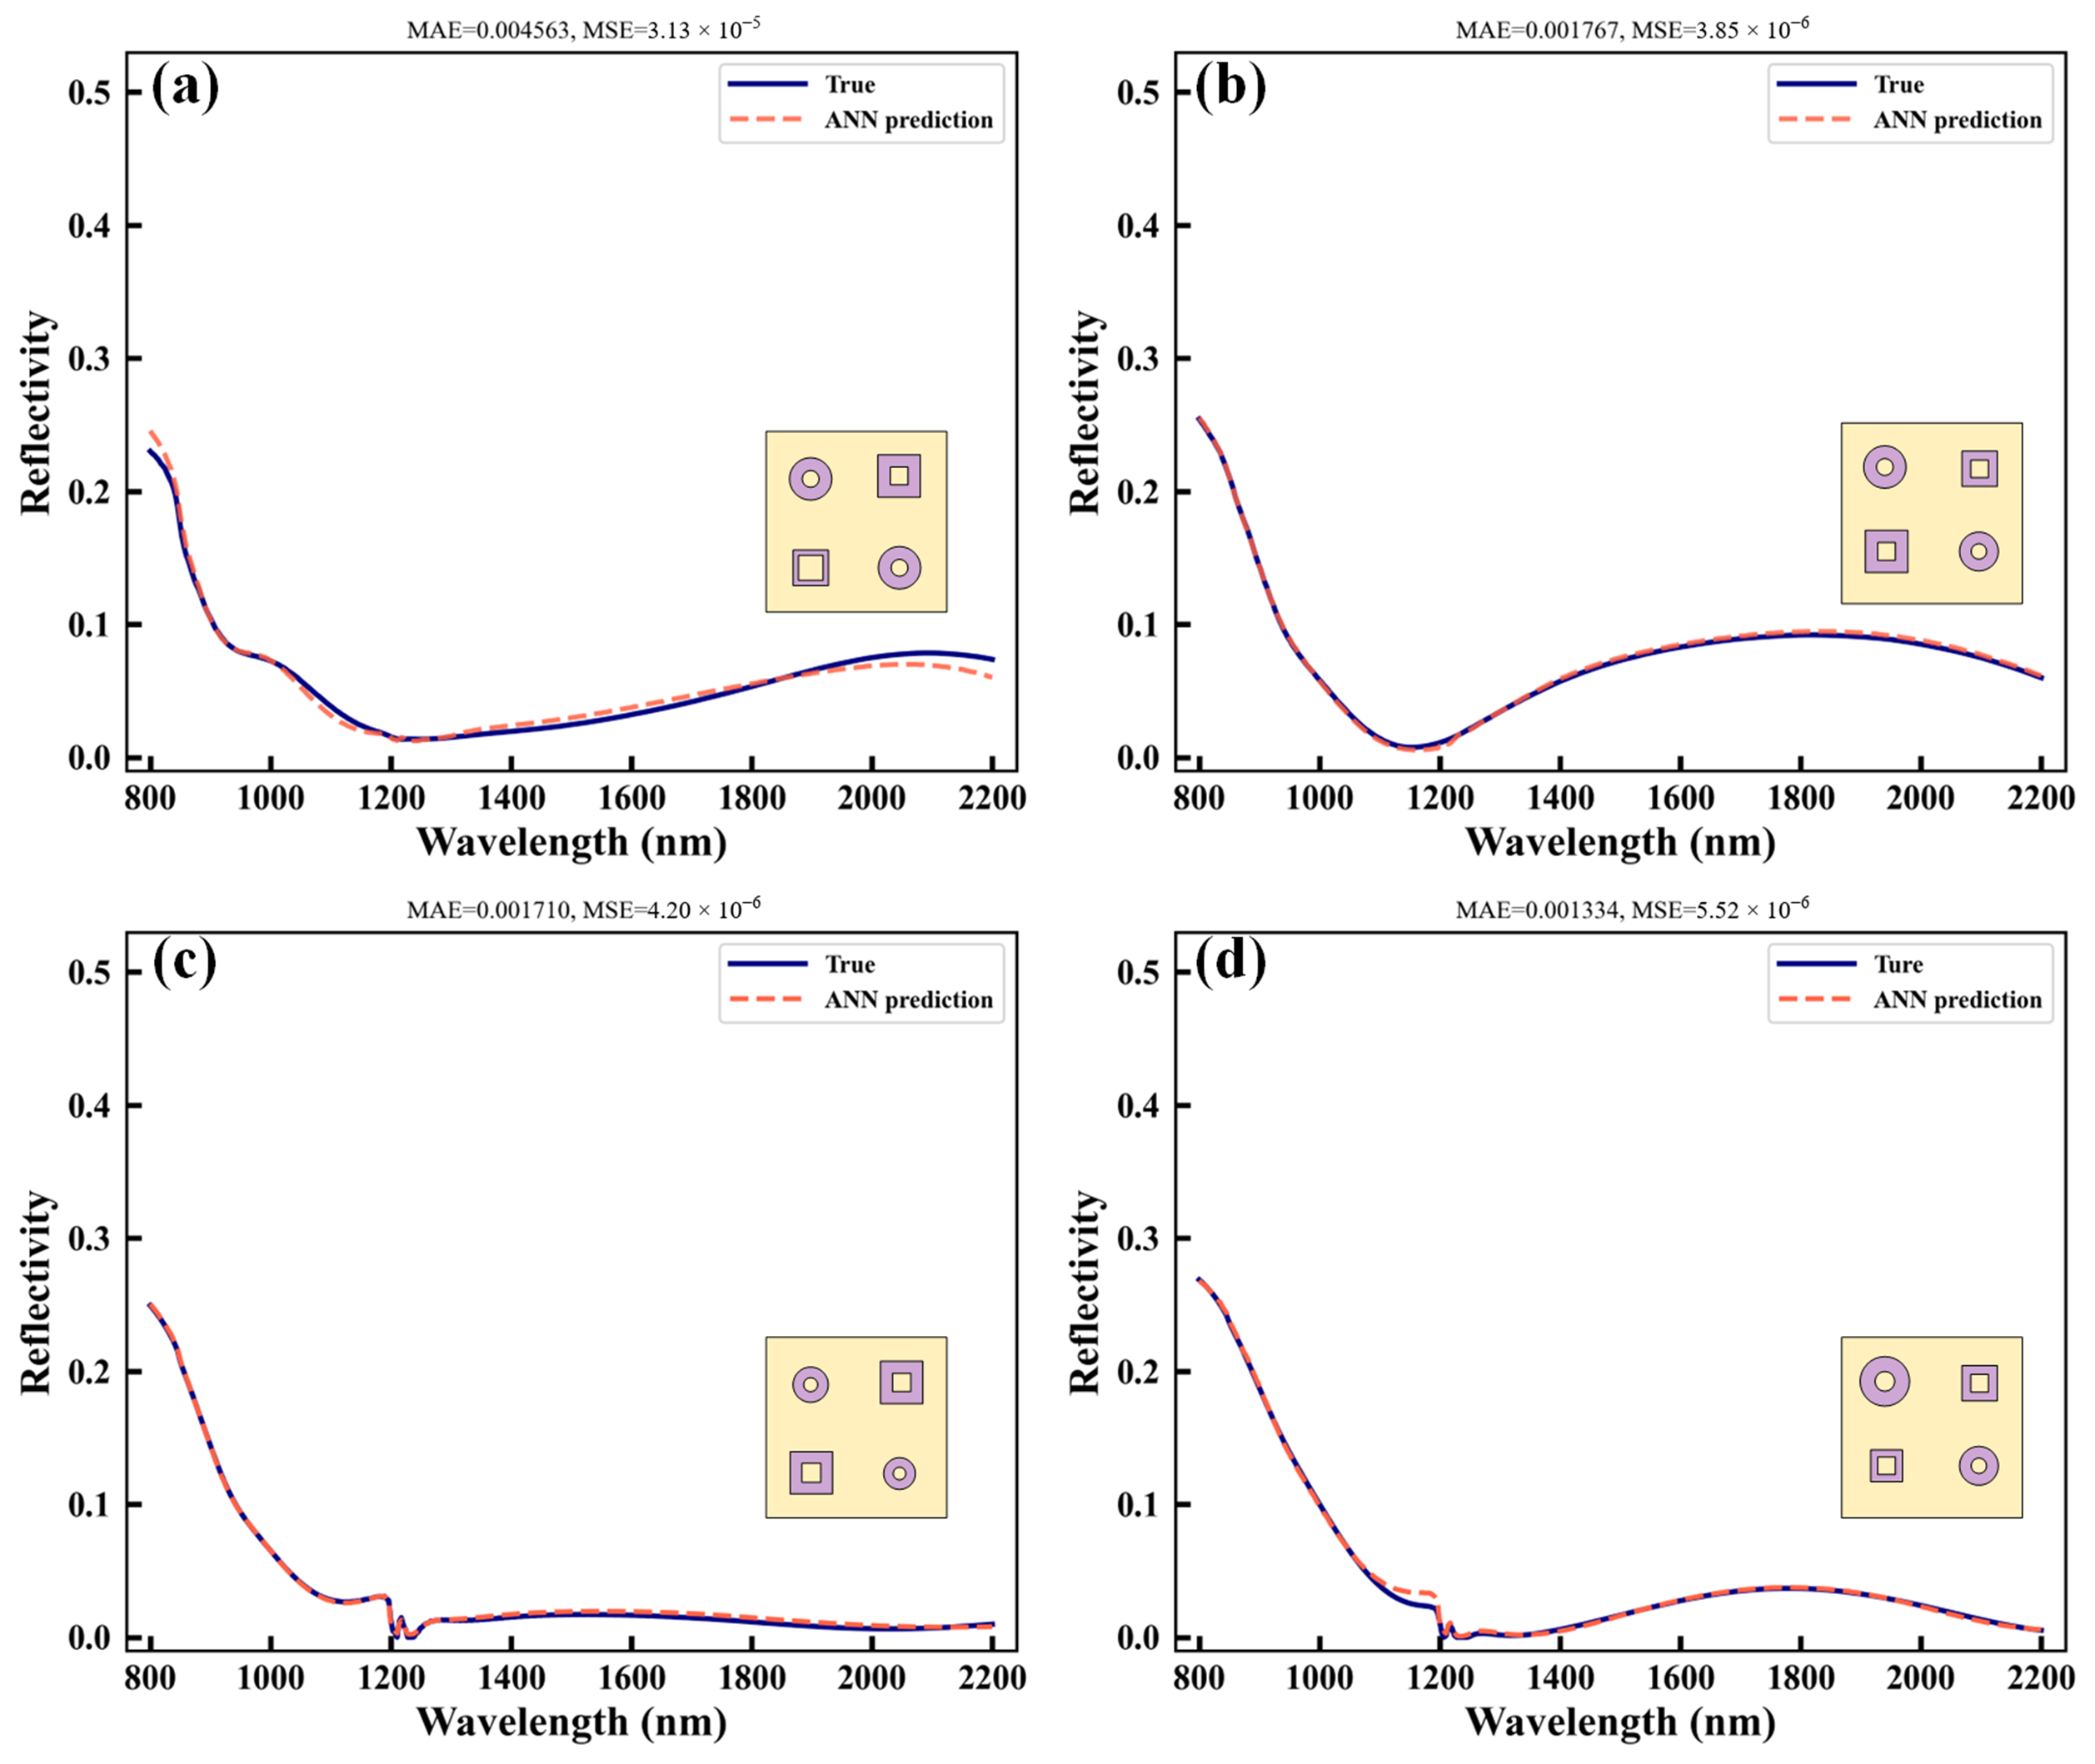
To verify the generalization capability of the developed ANN model for samples not involved in training, a test set completely independent of the training and validation sets is used to evaluate the predictive performance of the model. Figure 8 presents four representative test samples with different spectral characteristics and compares the reflection spectra predicted by the two-stage progressive spectral shape constraint model with the FDTD-simulated spectra.
Figure 8.
Comparison of reflection spectra predicted by the ANN model and those simulated by FDTD for representative structures in the test set. The corresponding structural parameters are (a) r1 = 50 nm, r2 = 90 nm, S1 = 50 nm, S2 = 130 nm, h = 225 nm; (b) r1 = 130 nm, r2 = 130 nm, S1 = 30 nm, S2 = 130 nm, h = 200 nm; (c) r1 = 90 nm, r2 = 110 nm, S1 = 50 nm, S2 = 50 nm, h = 200 nm; (d) r1 = 30 nm, r2 = 110 nm, S1 = 50 nm, S2 = 50 nm, h = 200 nm.
As shown in Figure 8, over the wavelength range of 800–2200 nm, the ANN-predicted curves for all test samples closely overlap with the FDTD-simulated spectra. The number and positions of the reflection dips, as well as the overall spectral line shapes, are accurately reproduced, indicating good agreement between the predicted and true spectra over the entire target wavelength range. These results demonstrate that the model can not only reproduce the overall spectral profiles but also describe in relatively fine detail the local spectral variations caused by resonance behavior.
It should be noted that sharp resonance features impose greater demands on the predictive capability of the model. Such resonances have narrow linewidths and steep spectral profiles, and small variations in the geometric parameters can cause significant changes in the spectral shape. Therefore, the ability to accurately reproduce these features is an important criterion for evaluating the nonlinear fitting capability of the model. As shown in Figure 8b,d, the model maintains high fidelity when reproducing these sharp resonance features. No obvious systematic deviation is observed between the predicted spectra and the FDTD-simulated spectra; that is, the errors do not exhibit a regular shift in a consistent direction. This further demonstrates the good performance of the model in learning the highly nonlinear mapping relationship between the geometric parameters and optical responses and also indicates its good stability and robustness in complex spectral scenarios.
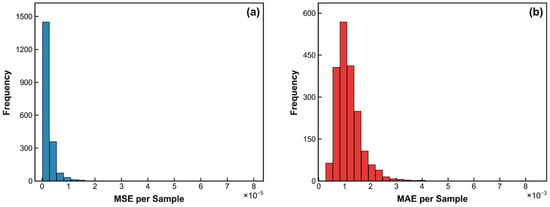
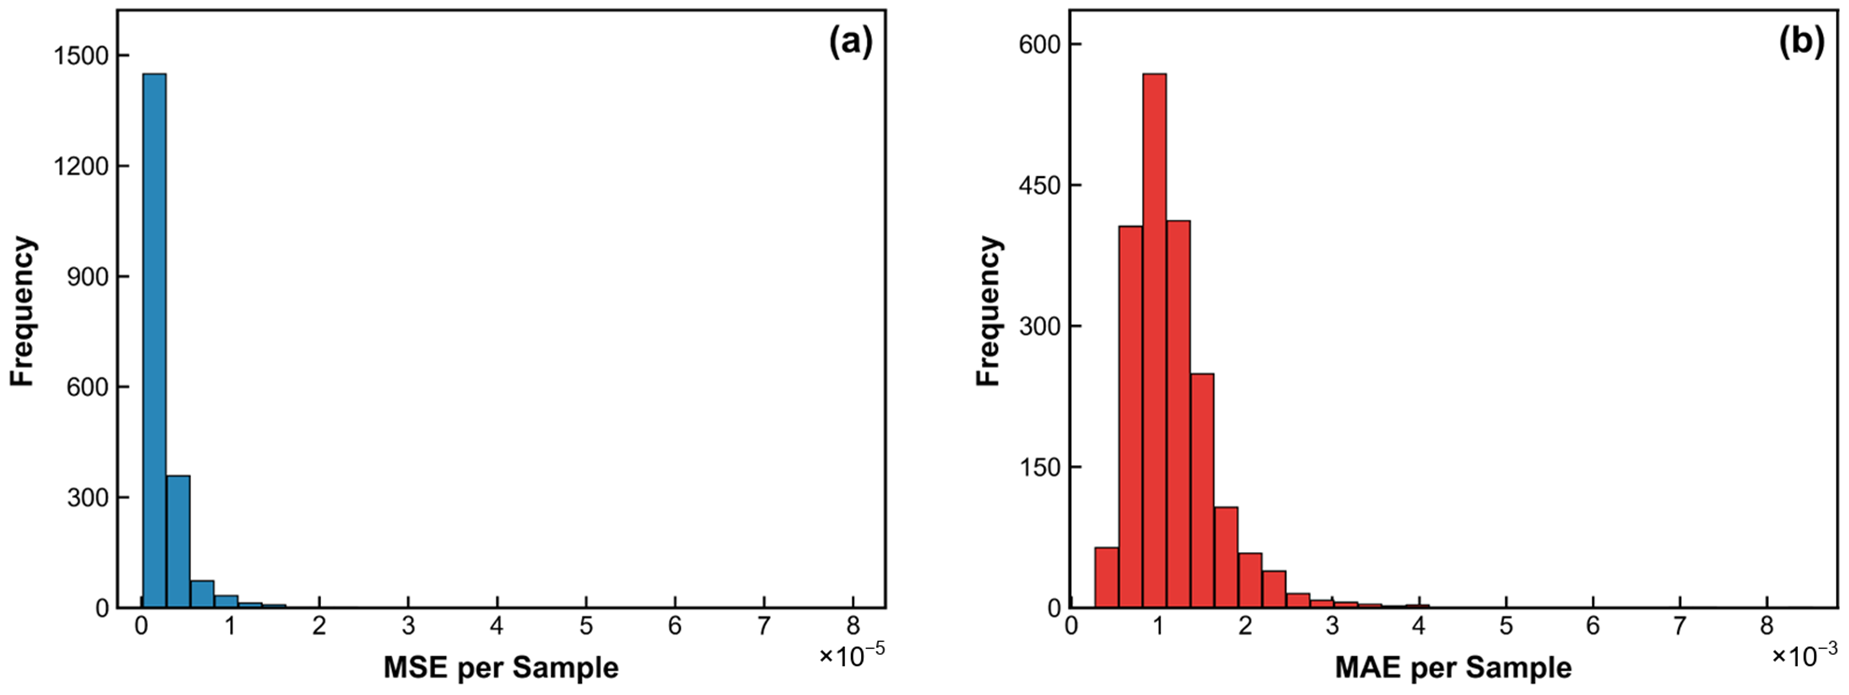
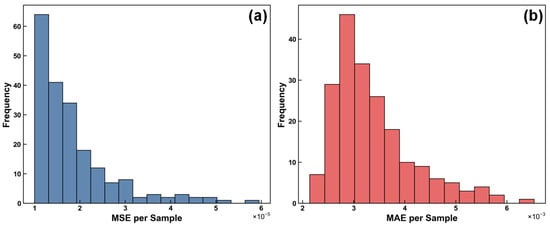
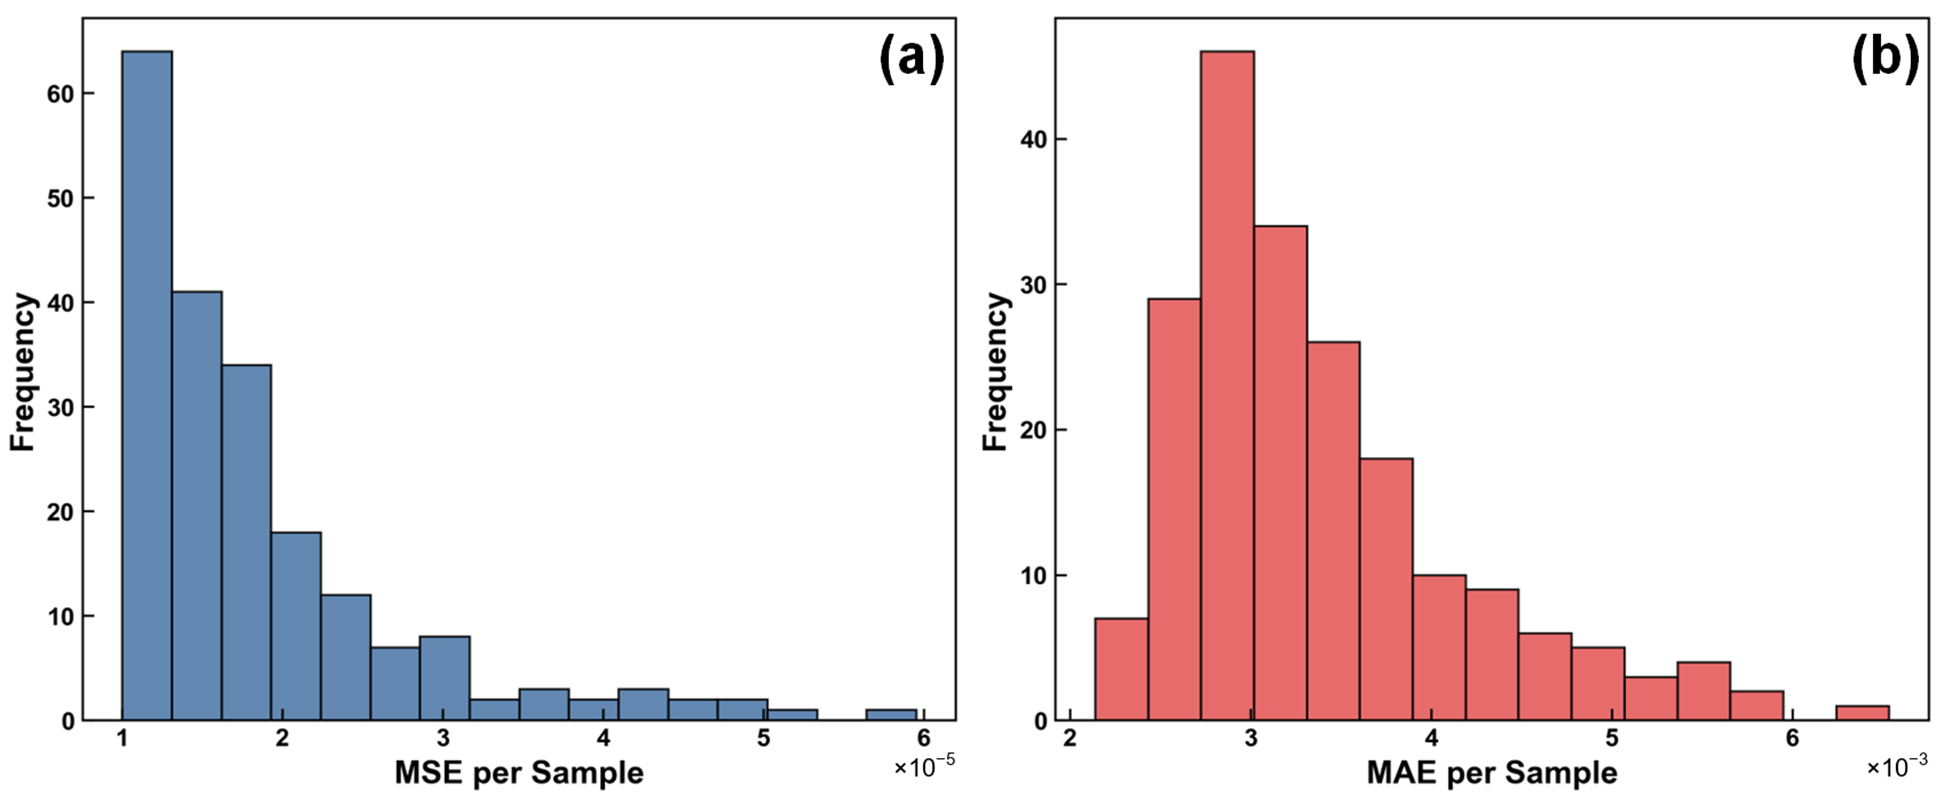
To quantitatively evaluate the prediction accuracy and stability of the model, the distributions of the MSE and MAE values for all test samples are further analyzed. Figure 9 presents histograms of the sample-wise errors of the final model for the 1944 test samples. The horizontal axes represent the MSE and MAE of each individual sample over the 400 wavelength points, while the vertical axes represent the number of samples with errors falling within the corresponding intervals. As shown in Figure 9a, the MSE values of the vast majority of the test samples are concentrated in the low-error range close to zero, indicating that the model achieves high spectral prediction accuracy for most of the grid-based test structures. Similarly, the MAE values in Figure 9b are mainly distributed within a relatively low numerical range and exhibit a comparatively concentrated distribution. The calculated mean squared error and mean absolute error of the model on the test set are 2.50 × 10⁻⁶ and 1.16 × 10⁻³, respectively, indicating that the average prediction deviations of the model across different test samples are relatively small. The combined MSE and MAE distributions demonstrate that the model achieves high prediction accuracy and good sample-to-sample stability within the original discrete parameter space.
Figure 9.
Per-sample prediction-error distributions of the final model on the grid-based test set. (a) MSE per sample; (b) MAE per sample.
4.4. Generalization Performance of the Model for Structures Outside the Dataset
To further evaluate the predictive capability of the developed ANN model for unseen structures, Latin hypercube sampling is employed to generate off-grid structures within the predefined parameter ranges that are not included in the original dataset. The resulting independent off-grid test set is not used for model training or validation, normalization-parameter fitting, or loss-weight adjustment. As shown in Figure 10, the reflection spectra predicted by the ANN for the samples outside the dataset are compared with the corresponding FDTD-simulated reflection spectra. Over the wavelength range of 800–2200 nm, the ANN predictions are highly consistent with the FDTD simulation results. The model accurately predicts the positions of the main reflection dips, the minimum reflectance values, and the overall variation trends of the reflection spectra, indicating that it can effectively preserve the overall variation patterns of the reflection spectra. These results also demonstrate that the model can apply the structure–spectrum mapping learned from the discrete dataset to unsampled off-grid parameter combinations within the predefined parameter ranges.
Figure 10.
Comparison between ANN-predicted and FDTD-simulated reflection spectra for four off-grid structures. The corresponding structural parameters are (a) r1 = 112 nm, r2 = 91 nm, S1 = 111 nm, S2 = 91 nm, h = 200 nm; (b) r1 = 110 nm, r2 = 70 nm, S1 = 110 nm, S2 = 90 nm, h = 177 nm; (c) r1 = 98.6 nm, r2 = 56.3 nm, S1 = 72.1 nm, S2 = 110.6 nm, h = 197.9 nm; (d) r1 = 127.4 nm, r2 = 41.7 nm, S1 = 86.9 nm, S2 = 83.5 nm, h = 219.8 nm.
To further quantitatively evaluate the prediction accuracy for off-grid structures, the MSE and MAE were calculated for all 200 independent samples by comparing the ANN-predicted reflectance spectra with the corresponding FDTD results. As shown in Figure 11, both error distributions are mainly concentrated in the lower-error regions, with relatively few samples exhibiting larger deviations. The average MSE and MAE across the 200 samples were 1.84 × 10⁻⁵ and 3.37 × 10⁻³, respectively. These results provide a quantitative assessment of the model’s predictive performance for previously unsampled structural parameter combinations.
Figure 11.
Distributions of the prediction errors for 200 independent off-grid samples. (a) mean squared error (MSE); (b) mean absolute error (MAE).
In summary, the developed model also exhibits good generalization capability for off-grid structures within the predefined parameter ranges that are not involved in training, and it can be used to rapidly predict their overall reflection spectra and absorptance variation trends. Combined with the aforementioned relationship between absorptance and reflectance, the model enables rapid prediction of the absorption performance of the metasurface, providing effective technical support for the rapid design and optimization of high-performance broadband metasurface absorbers.
4.5. ANN-Assisted Screening and Performance Analysis of High-Performance Absorber Structures
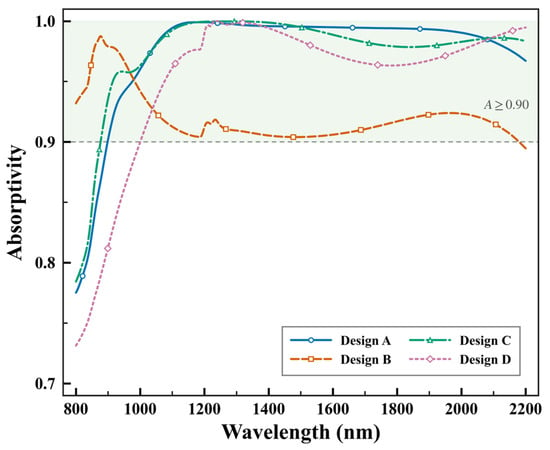
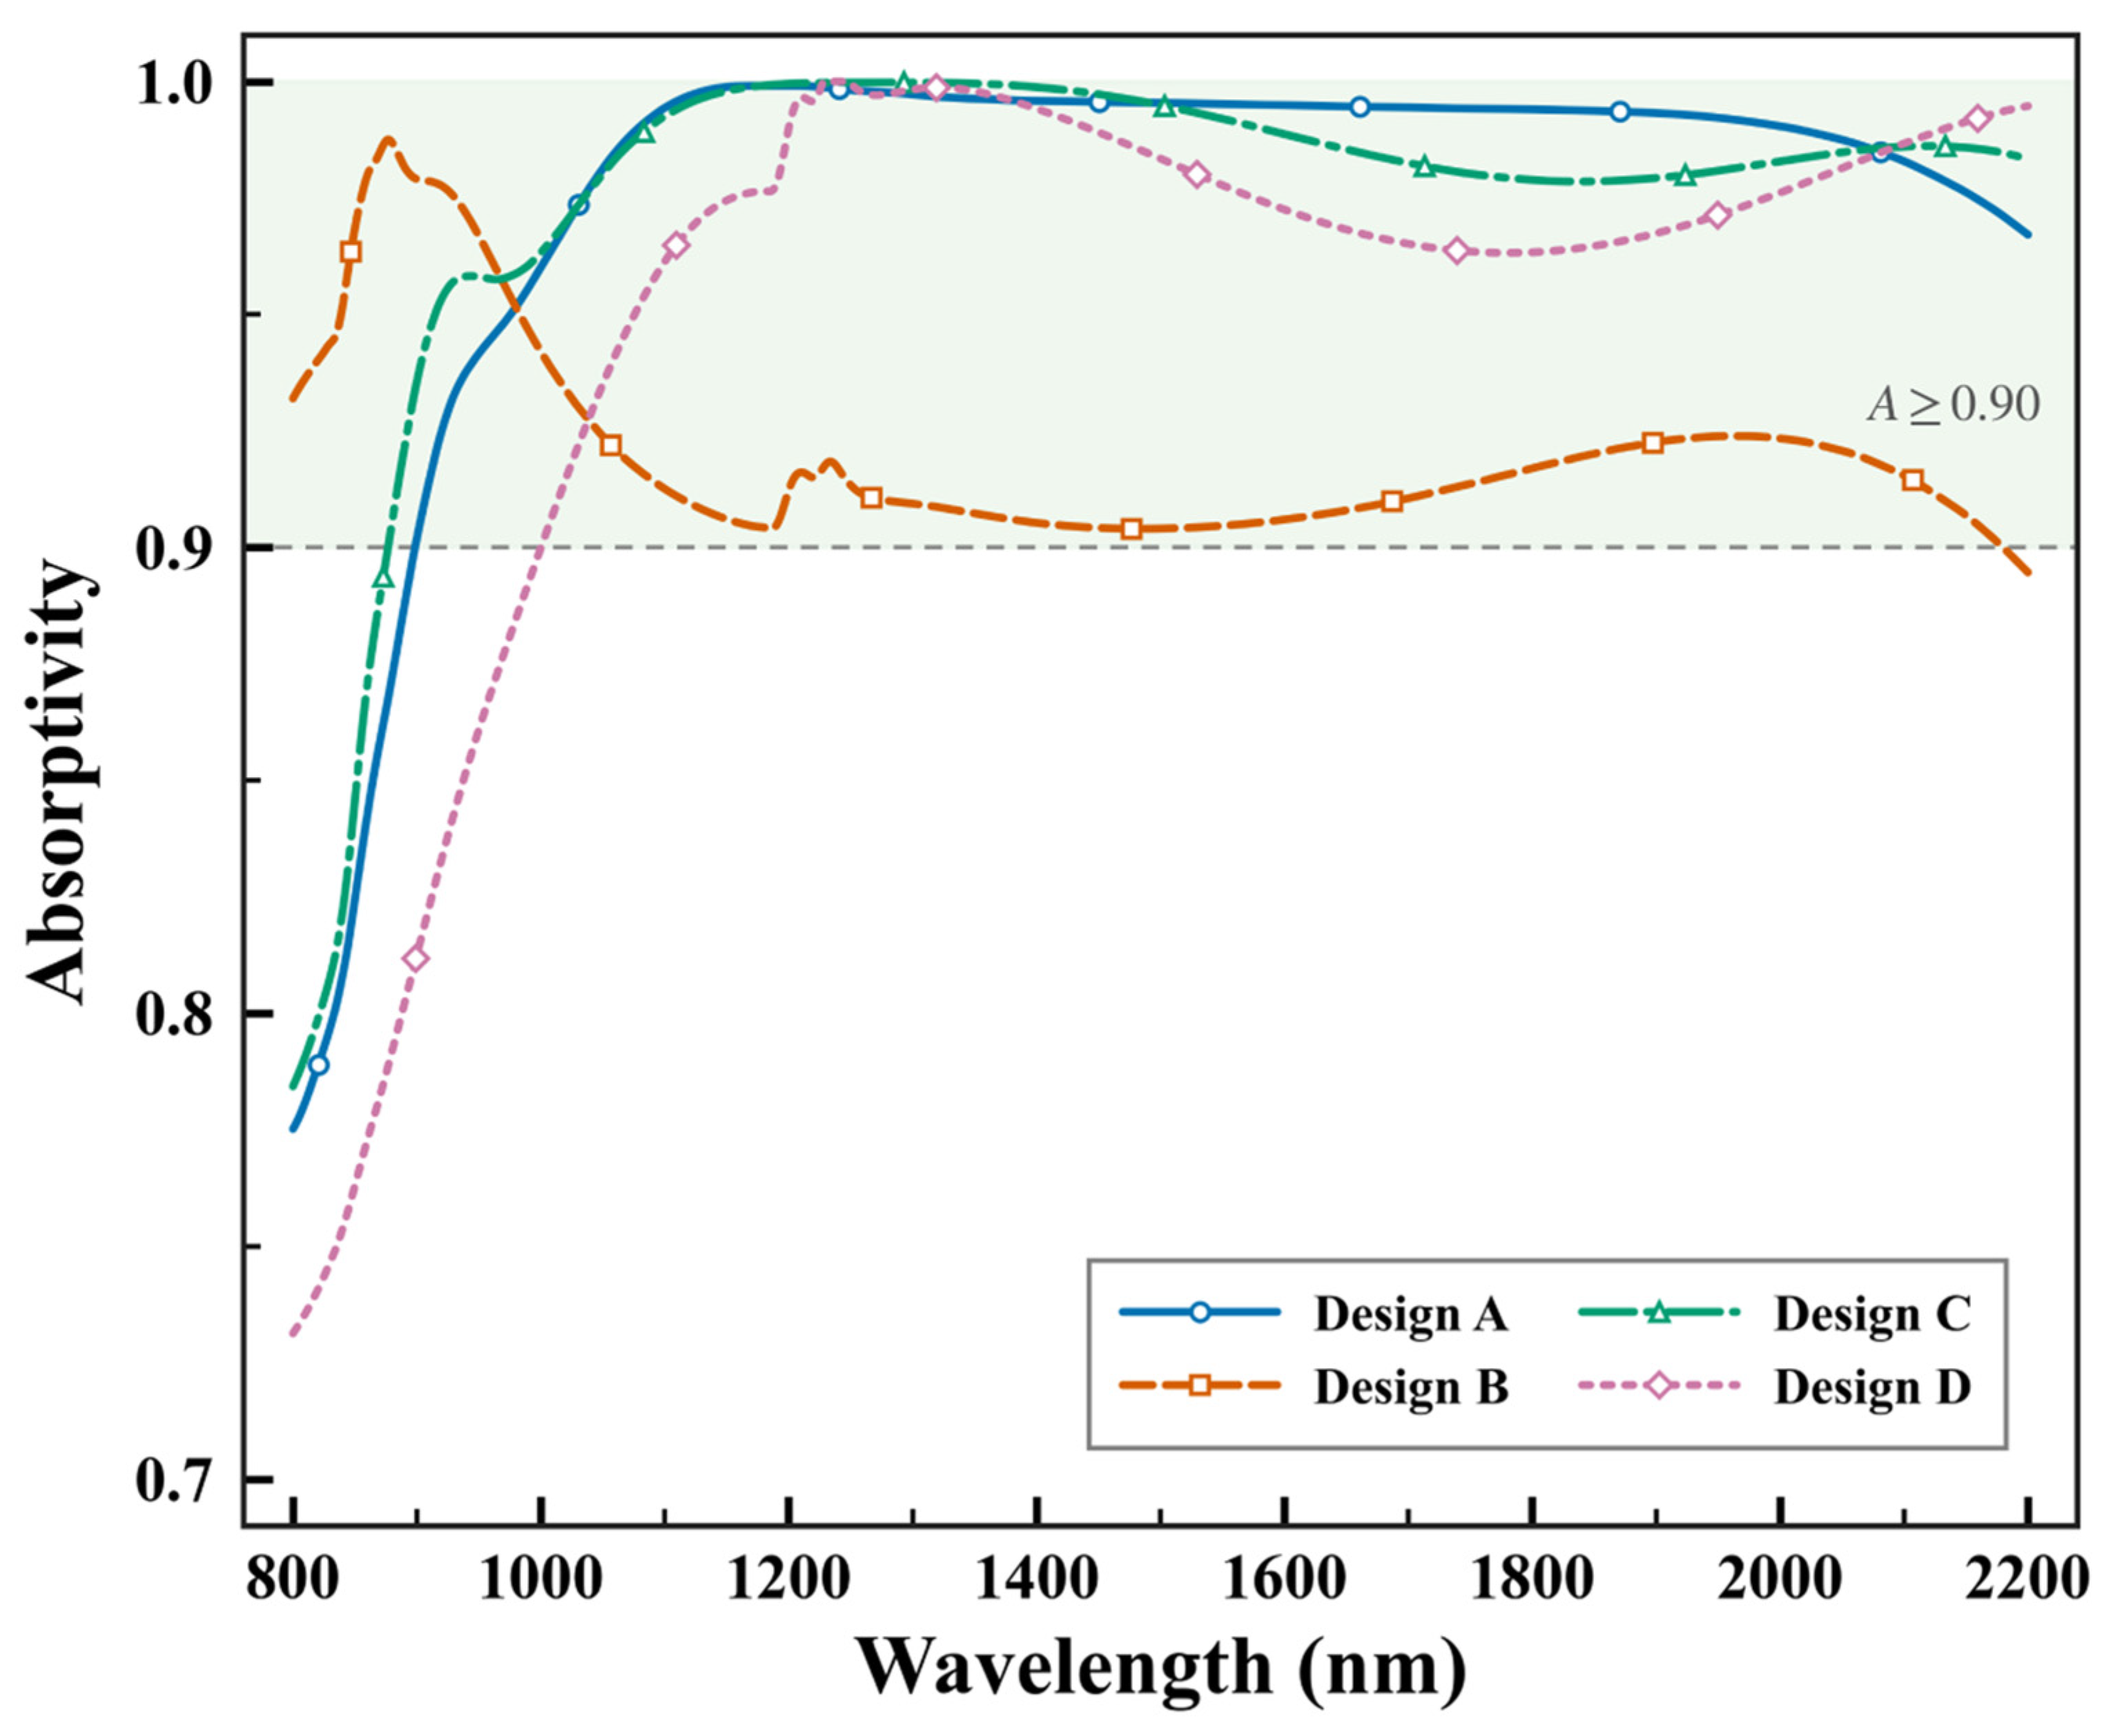
To further evaluate the predictive capability of the proposed ANN model in broadband absorber screening, four representative structures were selected based on their absorption performance. The trained ANN was used to predict the absorption spectra of candidate structures over the wavelength range of 800–2200 nm. The candidates were evaluated in terms of mean absorptance, high-absorption coverage ratio, and maximum continuous high-absorption bandwidth. Specifically, Design A was selected for its high mean absorptance, while Design B was selected for its high absorption coverage and wide continuous high-absorption band. Design C represents a favorable balance between mean absorptance and continuous high-absorption bandwidth, whereas Design D provides a representative off-grid structure exhibiting broadband absorption. The absorption characteristics of the four selected designs were subsequently verified using FDTD simulations, and the corresponding spectra are presented in Figure 12.
Figure 12.
FDTD-simulated absorption spectra of four representative high-performance absorber structures. The corresponding structural parameters are: Design A: r1 = 50 nm, r2 = 70 nm, S1 = 70 nm, S2 = 90 nm, h = 200 nm; Design B: r1 = 110 nm, r2 = 130 nm, S1 = 50 nm, S2 = 30 nm, h = 125 nm; Design C: r1 = 50 nm, r2 = 50 nm, S1 = 90 nm, S2 = 90 nm, h = 200 nm; Design D: r1 = 127.4 nm, r2 = 41.7 nm, S1 = 86.9 nm, S2 = 83.5 nm, h = 219.8 nm.
As shown in Figure 12, all four structures exhibit good broadband absorption characteristics, although they emphasize different aspects of performance. The average absorptances of Design A and Design C over the wavelength range of 800–2200 nm reach 97.64% and 97.63%, respectively, demonstrating high overall absorption levels. The high-absorption coverage ratios of Design B and Design C reach 98.21% and 94.36%, respectively, and their corresponding maximum continuous high-absorption bandwidths are 1375 nm and 1321 nm, respectively, demonstrating good continuous broadband absorption performance. Design D has an average absorptance of 95.25%, and its absorptance remains no lower than 90% over the approximate wavelength range of 1000–2200 nm, corresponding to a maximum continuous high-absorption bandwidth of approximately 1200 nm. The average absorptance and continuous high-absorption bandwidth predicted by the ANN are calculated by the program to be 95.18% and 1202 nm, respectively, showing good agreement with the FDTD validation results. This further demonstrates that the model can assist in identifying candidate structures with good broadband absorption performance.
The above results demonstrate that the composite unit consisting of square and circular resonant rings can maintain high absorptance over a broad wavelength range through the cooperative interaction between different localized resonance modes, exhibiting good broadband absorption performance and structural-parameter tunability. By adjusting the geometric parameters of the two types of resonant units, absorber structures with different advantages in terms of overall absorption level and continuous high-absorption bandwidth can be obtained. The developed ANN model enables rapid spectral prediction and performance evaluation of candidate structures, providing an effective data-driven strategy for the efficient optimization and design of other composite-resonant metasurface absorbers.
To quantitatively evaluate the proposed absorber, the performance metrics of Design C are compared with those of representative broadband optical absorbers reported in the literature. The comparison focuses on the evaluation wavelength range, mean absorptance, continuous wavelength interval with absorptance above 90%, and the corresponding continuous bandwidth, as summarized in Table 5. Because the evaluation ranges adopted in different studies are not identical, the reported mean absorptance values should be interpreted within their respective wavelength intervals.
Table 5.
Comparison of Design C with representative broadband optical absorbers.
As shown in Table 5, Design C achieves a mean absorptance of 97.63% over 800–2200 nm and maintains A ≥ 90% from 879 to 2200 nm, corresponding to a continuous bandwidth of 1321 nm. Its mean absorptance exceeds the reported values of the selected reference absorbers, while its continuous bandwidth is greater than those reported by Ding et al. and Ran et al. Although Liu et al. reported a broader continuous absorption band, Design C exhibits a higher mean absorptance within its respective evaluation range. Because the studies adopted different evaluation wavelength ranges, this comparison is meant to show overall performance rather than establish a definitive ranking among the absorbers.
Table 6 compares the spectral computation times of the ANN and FDTD. For the same 200 structures, the time required by the ANN to obtain the 400-point reflection spectra is considerably shorter than that required by the FDTD electromagnetic simulations, resulting in an approximately 140-fold improvement in computational efficiency. This result demonstrates that the trained ANN can rapidly predict the spectral responses corresponding to the structural parameters and has good practical value for the evaluation of large numbers of candidate structures and the screening of high-performance absorbers.
Table 6.
Comparison of computational efficiency between ANN and FDTD.
It should be noted that the approximately 140-fold speedup refers specifically to the spectral prediction stage using the trained ANN model. The initial computational cost also includes FDTD dataset generation, neural-network training, and additional electromagnetic simulations for structural validation. Based on the average FDTD simulation time of 21.64 s per structure, generating the original dataset of 6480 structures requires approximately 38.95 h of simulation time, while the neural-network training process takes approximately 1 h. The additional cost of FDTD-based validation should also be considered when evaluating the complete computational workflow. Nevertheless, once the ANN model has been trained, it enables repeated spectral predictions without requiring full electromagnetic simulations for every candidate structure. Thus, the reported acceleration characterizes the inference efficiency of the trained model rather than the overall computational cost of model development.
4.6. Robustness Analysis of the Representative Absorber
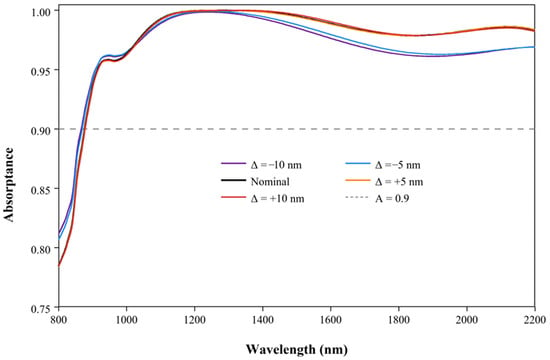
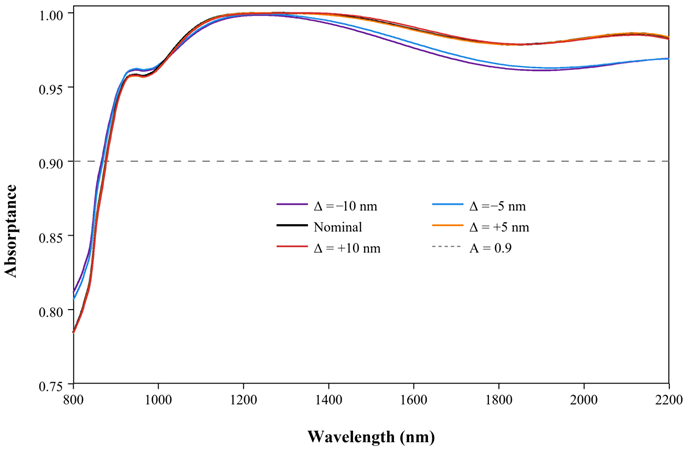
To evaluate the robustness of the broadband absorption performance against fabrication-induced dimensional variations, Design C was selected as a representative structure because of its favorable combination of high mean absorptance and broad continuous high-absorption bandwidth. The four lateral geometric parameters, r1, r2, S1, and S2, were simultaneously varied by −10, −5, 0, +5, and +10 nm, while the resonator thickness h was kept unchanged. The corresponding absorption spectra were calculated using FDTD simulations to examine the effects of systematic dimensional deviations.
As shown in Figure 13, Design C maintains a broadband high-absorption response under the investigated dimensional deviations. The mean absorptance ranges from approximately 96.85% to 97.63%, while the maximum continuous bandwidth with absorptance above 90% remains approximately 1.32–1.33 μm. Only minor shifts in the short-wavelength boundary of the high-absorption band are observed. These results demonstrate that the broadband absorption characteristics are well maintained under systematic lateral dimensional variations of up to ±10 nm.
Figure 13.
FDTD-simulated absorption spectra of Design C under different lateral dimensional deviations. The parameters r1, r2, S1, and S2 were simultaneously varied by −10, −5, 0, +5, and +10 nm, while h remained unchanged.
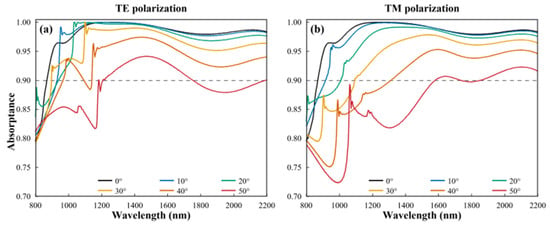
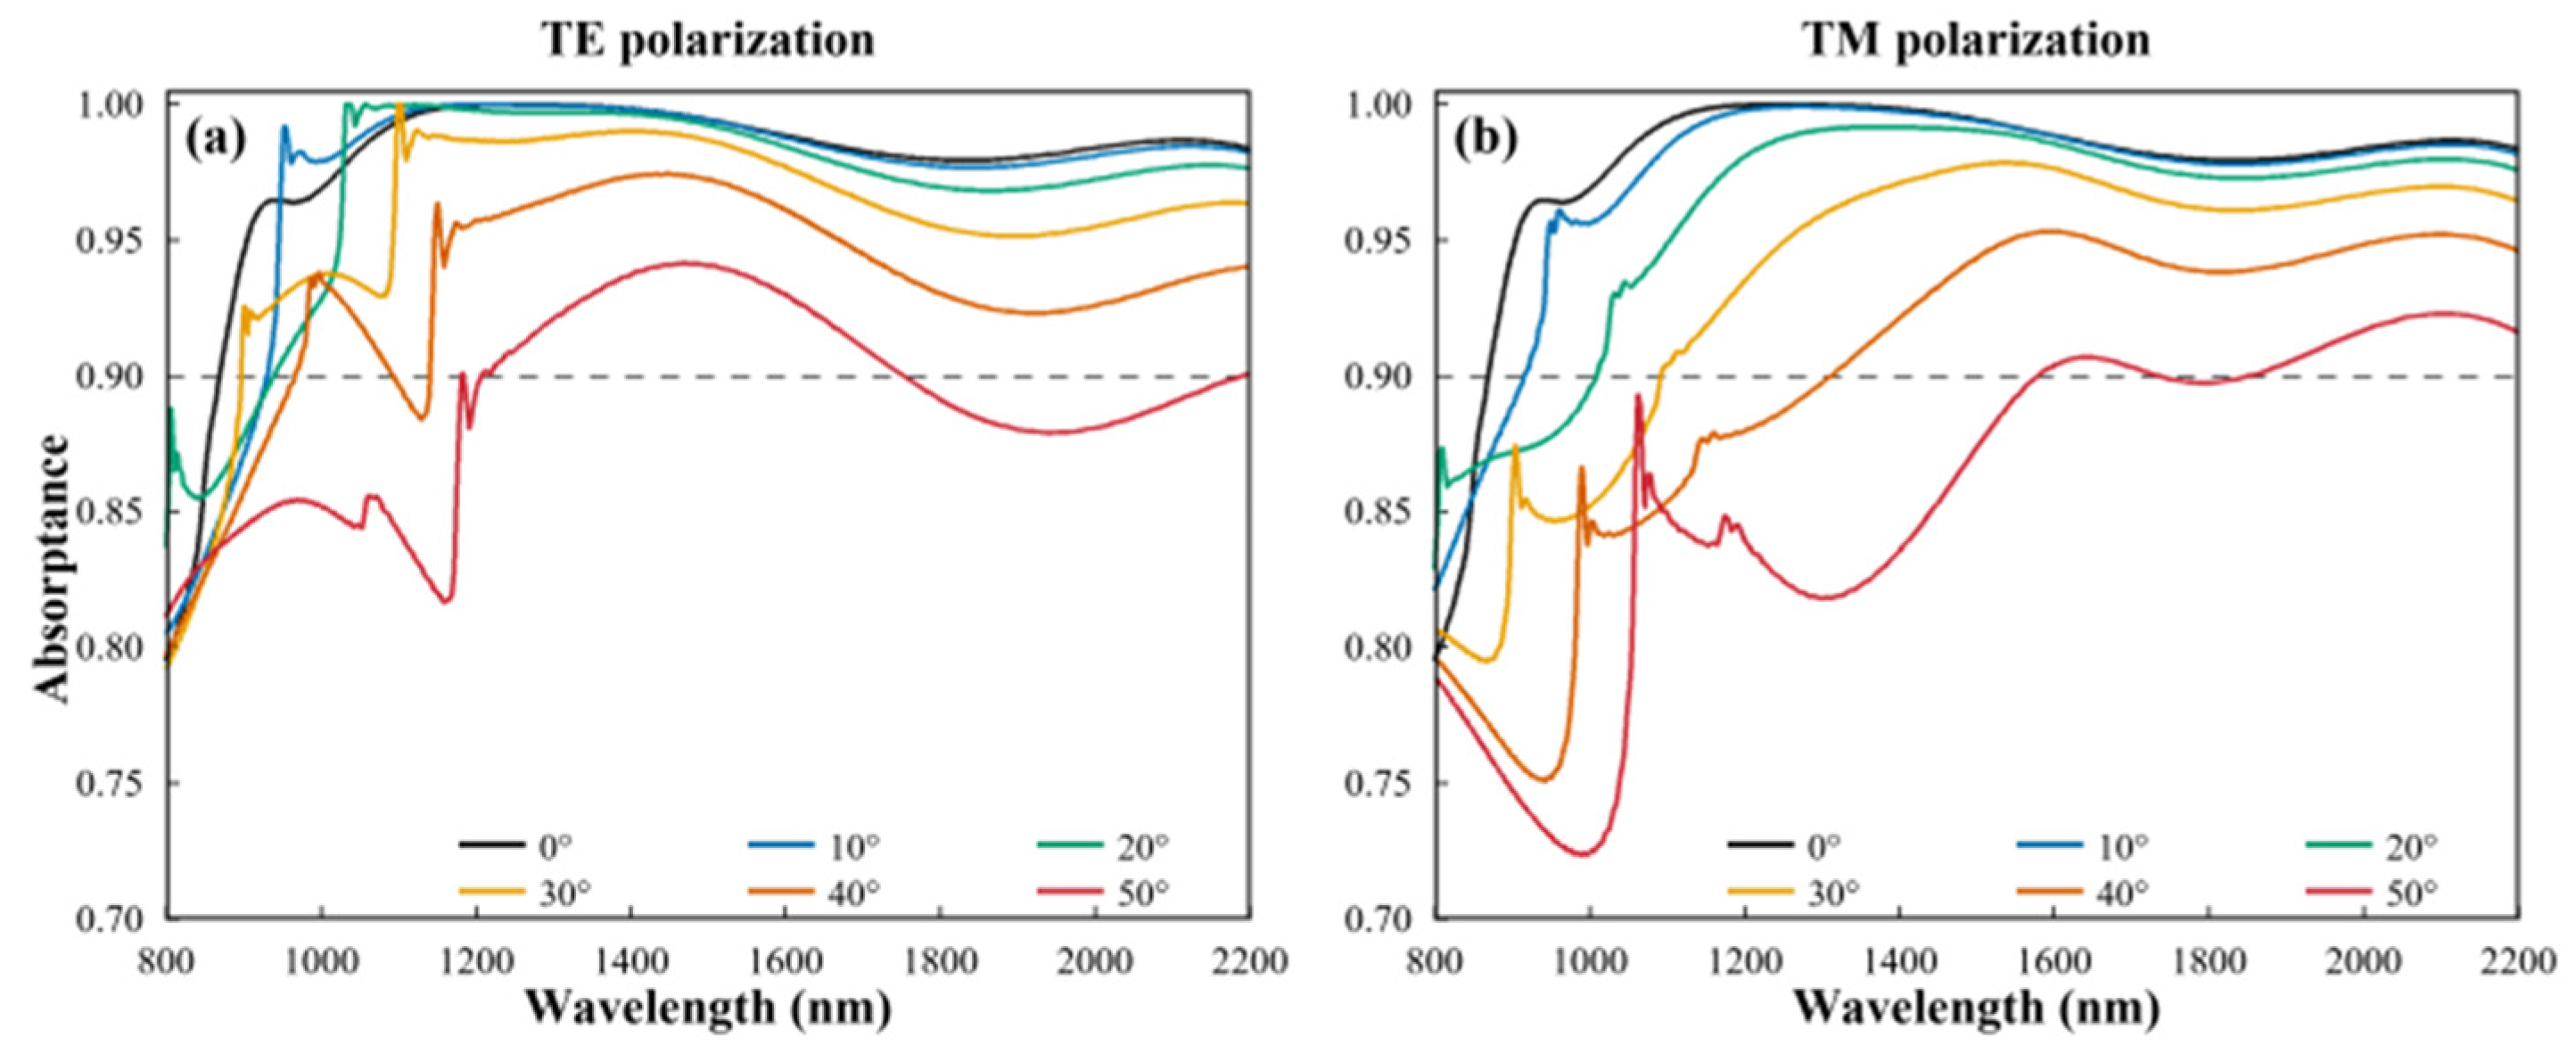
The polarization and angular responses of Design C were further investigated under transverse-electric (TE) and transverse-magnetic (TM) polarized illumination at incidence angles ranging from 0° to 50°. The corresponding absorption spectra are presented in Figure 14.
Figure 14.
FDTD-simulated absorption spectra of Design C at different incidence angles under (a) TE and (b) TM polarization. The dashed line indicates an absorptance of 90%.
As shown in Figure 14, the TE- and TM-polarized absorption spectra nearly coincide at normal incidence, indicating a weak polarization dependence under normal illumination. As the incidence angle increases, the broadband absorption characteristics are largely maintained up to approximately 30°. For TE polarization, the mean absorptance decreases from 97.82% at 0° to 95.65% at 30°, while the corresponding values for TM polarization are 97.82% and 93.64%, respectively. At 40°, the mean absorptance remains at 93.16% for TE polarization and 90.18% for TM polarization. These results demonstrate that Design C maintains high broadband absorption performance under both polarization states over a relatively wide range of incidence angles, particularly within 0–30°.
5. Conclusions
To address the complex parameter–response relationship and low design efficiency of near-infrared MIM metasurface absorbers, this study proposes an ANN-assisted design method incorporating a two-stage progressive spectral shape constraint. The main conclusions are as follows. Through the cooperative interaction between different localized resonance modes, the designed composite resonant unit consisting of square and circular rings achieves good broadband absorption performance over the wavelength range of 800–2200 nm and exhibits good parameter tunability. An MLP (ReLU + Adam) forward prediction model is constructed using 6480 sets of FDTD structure–spectrum data. Through two-stage progressive training that learns the spectral amplitude first and then the spectral shape, the model achieves an MSE of 2.50 × 10⁻⁶ and an MAE of 1.16 × 10⁻³ on 1944 grid-based test samples while reducing the spectral shape MSE by 18.98% compared with the baseline model. These results indicate that the proposed strategy effectively improves the fitting capability for local spectral shapes, including peaks, valleys, and variation trends, while maintaining the accuracy of the overall spectral amplitude. The model is subsequently used for rapid spectral prediction and performance evaluation of candidate structures, followed by FDTD validation. Four representative broadband absorber structures are obtained, with the highest average absorptance reaching 97.64% and the maximum continuous high-absorption bandwidth reaching 1375 nm, thereby verifying the potential of the composite resonant structure for broadband absorption regulation. The ANN requires approximately 0.154 s to predict a single structure and is approximately 140 times as computationally efficient as FDTD, significantly reducing the spectral computation time required for large numbers of candidate structures.
In summary, the developed ANN-assisted design method jointly considers spectral prediction accuracy and spectral shape fidelity, effectively improving the efficiency of spectral prediction and structural screening for near-infrared broadband metasurface absorbers. It provides an efficient data-driven design approach for composite-resonant MIM metasurface absorbers.
Author Contributions
Conceptualization, Y.X. and G.L.; methodology, Y.X. and Z.H.; software, Z.H.; validation, Q.H. and D.N.; formal analysis, Y.X.; investigation, Y.X., Q.H. and D.N.; resources, X.L. and G.L.; data curation, Z.H. and Q.H.; visualization, Y.X. and D.N.; writing—original draft preparation, Y.X.; writing—review and editing, Z.H., X.L. and G.L.; supervision, X.L. and G.L.; project administration, G.L.; funding acquisition, G.L. All authors have read and agreed to the published version of the manuscript.
Funding
This research was funded by the National Natural Science Foundation of China, grant number 62465015; the Guangxi Natural Science Foundation, grant number 2026GXNSFAA00641095; the Natural Science Foundation of Hunan Province, grant number 2023JJ30165; the Guangxi Graduate Education Innovation Project, grant number 60202165302; and the “Eight Osmanthus” Young Top-notch Talent Program (Science and Technology Innovation Category).
Informed Consent Statement
Not applicable.
Data Availability Statement
Data underlying the results presented in this paper are not publicly available at this time but may be obtained from the authors upon reasonable request.
Conflicts of Interest
The authors declare no conflicts of interest.
References
- Maman, R.; Mazurski, N.; Goykhman, I.; Levy, U. Metasurface platform for simultaneous and uncorrelated emissivity control over MWIR and LWIR spectral bands. Light Sci. Appl. 2026, 15, 329. [Google Scholar] [CrossRef] [Scilit] [PubMed]
- Lu, Y.; Liu, L.; Gao, R.; Xiong, Y.; Sun, P.; Wu, Z.; Wu, K.; Yu, T.; Zhang, K.; Zhang, C.; et al. Ultrafast near-infrared pyroelectric detector based on inhomogeneous plasmonic metasurface. Light Sci. Appl. 2024, 13, 241. [Google Scholar] [CrossRef] [Scilit] [PubMed]
- Li, H.; Zhang, C.; Liu, X.C.; Yu, P.; Chen, W.D.; Xie, Z.W.; Tang, M.J.; Zheng, J.; Li, L. Wafer-scale ultra-broadband perfect absorber based on ultrathin Al-SiO(2) stack metasurfaces. Opt. Express 2022, 30, 30911–30917. [Google Scholar] [CrossRef] [Scilit] [PubMed]
- Sun, S.; Zhang, J.; Zhu, R.; Zhou, H.; Cheng, T.; Chen, L.; Li, J. Polarization-Improved Bidirectional-Pump Atomic Magnetometer Based on Spin-Decoupled Metasurface. Adv. Sci. 2025, 12, e09028. [Google Scholar] [CrossRef] [Scilit] [PubMed]
- Watts, C.M.; Liu, X.; Padilla, W.J. Metamaterial electromagnetic wave absorbers. Adv. Mater. 2012, 24, OP98–OP120. [Google Scholar] [CrossRef] [Scilit] [PubMed]
- Hao, J.; Wang, J.; Liu, X.; Padilla, W.J.; Zhou, L.; Qiu, M. High performance optical absorber based on a plasmonic metamaterial. Appl. Phys. Lett. 2010, 96, 251104. [Google Scholar] [CrossRef] [Scilit]
- Aydin, K.; Ferry, V.E.; Briggs, R.M.; Atwater, H.A. Broadband polarization-independent resonant light absorption using ultrathin plasmonic super absorbers. Nat. Commun. 2011, 2, 517. [Google Scholar] [CrossRef] [Scilit] [PubMed]
- Shu, S.; Li, Y.Y. Triple-layer Fabry-Perot/SPP aluminum absorber in the visible and near-infrared region. Opt. Lett. 2015, 40, 934–937. [Google Scholar] [CrossRef] [Scilit] [PubMed]
- Zhai, Y.; Chen, G.; Xu, J.; Qi, Z.; Li, X.; Wang, Q. Multiple-band perfect absorbers based on the combination of Fabry-Perot resonance and the gap plasmon resonance. Opt. Commun. 2017, 399, 28–33. [Google Scholar] [CrossRef] [Scilit]
- Kats, M.A.; Sharma, D.; Lin, J.; Genevet, P.; Blanchard, R.; Yang, Z.; Qazilbash, M.M.; Basov, D.; Ramanathan, S.; Capasso, F. Ultra-thin perfect absorber employing a tunable phase change material. Appl. Phys. Lett. 2012, 101, 221101. [Google Scholar] [CrossRef] [Scilit]
- Wei, X.; Wang, Y.; Yao, J.; Li, J.; Yuan, C.; Zhou, Z. Broadband metasurface absorber based on involute structure and surface plasmon resonance. Opt. Express 2025, 33, 26857–26868. [Google Scholar] [CrossRef] [Scilit] [PubMed]
- Kwon, M.-S.; Seo, J.; Kim, Y. Dynamically Switchable Mid-Infrared Perfect Absorber Based on Grating-Assisted Graphene Plasmon Excitation. ACS Photonics 2025, 12, 330–337. [Google Scholar] [CrossRef] [Scilit]
- Cui, Y.; Fung, K.H.; Xu, J.; Ma, H.; Jin, Y.; He, S.; Fang, N.X. Ultrabroadband light absorption by a sawtooth anisotropic metamaterial slab. Nano Lett. 2012, 12, 1443–1447. [Google Scholar] [CrossRef] [Scilit] [PubMed]
- Shen, X.; Cui, T.J.; Zhao, J.; Ma, H.F.; Jiang, W.X.; Li, H. Polarization-independent wide-angle triple-band metamaterial absorber. Opt. Express 2011, 19, 9401–9407. [Google Scholar] [CrossRef] [Scilit] [PubMed]
- Bai, P.; Deng, H.; Liu, Z.; Cai, Y.; Xia, T.; Wan, X. Miniaturized broadband absorber based on fractal structure metasurface. J. Appl. Phys. 2025, 137, 223106. [Google Scholar] [CrossRef] [Scilit]
- Lin, Q.; Li, C.; Chen, J.; Han, Y. Inverse Design of Manufacturable Infrared Metasurfaces Based on Multimodal Deep Learning Methods. ACS Appl. Mater. Interfaces 2025, 17, 40951–40963. [Google Scholar] [CrossRef] [Scilit] [PubMed]
- Choi, M.; Park, J.; Shin, J.; Keawmuang, H.; Kim, H.; Yun, J.; Seong, J.; Rho, J. Realization of high-performance optical metasurfaces over a large area: A review from a design perspective. npj Nanophotonics 2024, 1, 31. [Google Scholar] [CrossRef] [Scilit]
- Zhang, H.; Wu, K.; Wang, G.P. Near-perfect absorption of a honeycomb metasurface through QBICs. Opt. Lett. 2024, 49, 1692–1695. [Google Scholar] [CrossRef] [Scilit] [PubMed]
- Wang, J.; Liu, L.; Jing, Y.; Xiong, Z.; Kowal, D.; Chen, Y. Efficient Finite Element Modeling of Light Scattering in Symmetric Structures: A Nondegenerate Case. ACS Photonics 2025, 12, 2053–2061. [Google Scholar] [CrossRef] [Scilit]
- Piggott, A.Y.; Lu, J.; Lagoudakis, K.G.; Petykiewicz, J.; Babinec, T.M.; Vučković, J. Inverse design and demonstration of a compact and broadband on-chip wavelength demultiplexer. Nat. Photonics 2015, 9, 374–377. [Google Scholar] [CrossRef] [Scilit]
- Molesky, S.; Lin, Z.; Piggott, A.Y.; Jin, W.; Vucković, J.; Rodriguez, A.W. Inverse design in nanophotonics. Nat. Photonics 2018, 12, 659–670. [Google Scholar] [CrossRef] [Scilit]
- Peurifoy, J.; Shen, Y.; Jing, L.; Yang, Y.; Cano-Renteria, F.; DeLacy, B.G.; Joannopoulos, J.D.; Tegmark, M.; Soljačić, M. Nanophotonic particle simulation and inverse design using artificial neural networks. Sci. Adv. 2018, 4, eaar4206. [Google Scholar] [CrossRef] [Scilit] [PubMed]
- Liu, D.; Tan, Y.; Khoram, E.; Yu, Z. Training deep neural networks for the inverse design of nanophotonic structures. Acs Photonics 2018, 5, 1365–1369. [Google Scholar] [CrossRef] [Scilit]
- Malkiel, I.; Mrejen, M.; Nagler, A.; Arieli, U.; Wolf, L.; Suchowski, H. Plasmonic nanostructure design and characterization via deep learning. Light Sci. Appl. 2018, 7, 60. [Google Scholar] [CrossRef] [Scilit] [PubMed]
- Yang, G.; Xiao, Q.; Zhang, Z.; Yu, Z.; Wang, X.; Lu, Q. Exploring AI in metasurface structures with forward and inverse design. iScience 2025, 28, 111995. [Google Scholar] [CrossRef] [Scilit] [PubMed]
- Kiarashinejad, Y.; Zandehshahvar, M.; Abdollahramezani, S.; Hemmatyar, O.; Pourabolghasem, R.; Adibi, A. Knowledge discovery in nanophotonics using geometric deep learning. Adv. Intell. Syst. 2020, 2, 1900132. [Google Scholar] [CrossRef] [Scilit]
- Ma, W.; Cheng, F.; Liu, Y. Deep-learning-enabled on-demand design of chiral metamaterials. ACS Nano 2018, 12, 6326–6334. [Google Scholar] [CrossRef] [Scilit] [PubMed]
- Pan, Q.; Zhou, S.; Chen, S.; Yu, C.; Guo, Y.; Shuai, Y. Deep learning-based inverse design optimization of efficient multilayer thermal emitters in the near-infrared broad spectrum. Opt. Express 2023, 31, 23944–23951. [Google Scholar] [CrossRef] [Scilit] [PubMed]
- Ma, W.; Liu, Z.; Kudyshev, Z.A.; Boltasseva, A.; Cai, W.; Liu, Y. Deep learning for the design of photonic structures. Nat. Photonics 2021, 15, 77–90. [Google Scholar] [CrossRef] [Scilit]
- Huang, Y.; Liu, X.; Liu, M.; Chen, J.; Du, W.; Liu, Z. Deep learning-based inverse design of multi-functional metasurface absorbers. Opt. Lett. 2024, 49, 2733–2736. [Google Scholar] [CrossRef] [Scilit] [PubMed]
- Zhai, Y.; He, W.; Chen, Q. Multi-Peak Narrowband Perfect Absorber Based on the Strong Coupling Between Fabry–Perot Mode and SPP Waveguide Mode. Photonics 2025, 12, 1131. [Google Scholar] [CrossRef] [Scilit]
- Liao, X.; Zeng, J.; Zhang, Y.; He, X.; Yang, J. A Dual-Band Guided Laser Absorber Based on Plasmonic Resonance and Fabry-Perot Resonance. Nanomaterials 2022, 12, 2751. [Google Scholar] [CrossRef] [Scilit] [PubMed]
- Pech-May, N.W.; Tobias, L.; Retsch, M. Design of Multimodal Absorption in the Mid-IR: A Metal Dielectric Metal Approach. ACS Appl. Mater. Interfaces 2021, 13, 1921–1929. [Google Scholar] [CrossRef] [Scilit] [PubMed]
- Jiang, J.; Cao, Y.; Zhou, X.; Xu, H.; Ning, K.; Xiao, X.; Lu, Y.; Ding, C.; Chen, Y.; Dong, J. Colloidal self-assembly based ultrathin metasurface for perfect absorption across the entire visible spectrum. Nanophotonics 2023, 12, 1581–1590. [Google Scholar] [CrossRef] [Scilit] [PubMed]
- Zhu, J.; Deng, J.; Xiong, H.; Wang, B.-X.; Zhang, H.-Q. Triband Metamaterial Absorber Based on a Three-Ring Coupled Structure. ACS Appl. Electron. Mater. 2024, 6, 9184–9193. [Google Scholar] [CrossRef] [Scilit]
- Chou Chau, Y.-F. Enhancing broadband terahertz absorption via a graphene-based metasurface absorber featuring a rectangular ring and triple crossbars. Phys. Scr. 2024, 99, 055905. [Google Scholar] [CrossRef] [Scilit]
- Li, Y.; Liu, Z.; Zhang, H.; Tang, P.; Wu, B.; Liu, G. Ultra-broadband perfect absorber utilizing refractory materials in metal-insulator composite multilayer stacks. Opt. Express 2019, 27, 11809–11818. [Google Scholar] [CrossRef] [Scilit] [PubMed]
- Deng, H.; Li, Z.; Stan, L.; Rosenmann, D.; Czaplewski, D.A.; Gao, J.; Yang, X. Broadband perfect absorber based on one ultrathin layer of refractory metal. Opt. Lett. 2015, 40, 2592–2595. [Google Scholar] [CrossRef] [Scilit] [PubMed]
- Tuo, C.; Zhu, J.; Yi, Z.; Li, B.; Cheng, S. Mid-infrared broadband triple-resonance metamaterial absorber based on triple-layer silicon nitride structure. Opt. Commun. 2026, 599, 132650. [Google Scholar] [CrossRef] [Scilit]
- Liu, L.; Wang, B.; Zhang, S. Metamaterial ultra-broadband absorber in near-infrared region with decreasing thermal emission. Int. J. Therm. Sci. 2024, 204, 109237. [Google Scholar] [CrossRef] [Scilit]
- Luo, F.; Li, C.; He, X. Ultra-broadband metamaterial absorber for collecting electromagnetic waves from the ultraviolet to the mid-infrared. Int. J. Therm. Sci. 2024, 203, 109141. [Google Scholar] [CrossRef] [Scilit]
- Dubey, S.R.; Singh, S.K.; Chaudhuri, B.B. Activation functions in deep learning: A comprehensive survey and benchmark. Neurocomputing 2022, 503, 92–108. [Google Scholar] [CrossRef] [Scilit]
- Kingma, D.P.; Ba, J.L. Adam: A method for stochastic optimization. In Proceedings of the 3rd International Conference on Learning Representations (ICLR 2015), San Diego, CA, USA, 7–9 May 2015. [Google Scholar]
- Ding, F.; Dai, J.; Chen, Y.; Zhu, J.; Jin, Y.; Bozhevolnyi, S.I. Broadband near-infrared metamaterial absorbers utilizing highly lossy metals. Sci. Rep. 2016, 6, 39445. [Google Scholar] [CrossRef] [Scilit] [PubMed]
- Ran, Y.; Jiang, Z.; Wang, Z. All-nitride broadband metamaterial absorbers. Results Phys. 2022, 38, 105657. [Google Scholar] [CrossRef] [Scilit]

Disclaimer/Publisher’s Note: The statements, opinions and data contained in all publications are solely those of the individual author(s) and contributor(s) and not of MDPI and/or the editor(s). MDPI and/or the editor(s) disclaim responsibility for any injury to people or property resulting from any ideas, methods, instructions or products referred to in the content. |
© 2026 by the authors. Licensee MDPI, Basel, Switzerland. This article is an open access article distributed under the terms and conditions of the Creative Commons Attribution (CC BY) license.