


Abstract
Cryogenic liquid-level measurement requires a distinct and repeatable liquid–vapor interface signal. In this study, a commercial coherent optical frequency-domain reflectometry (C-OFDR) instrument is used to interrogate an electrically heated SMF-28 probe. The contributions are an analysis of the heat-transfer-based sensing principle, a bonded probe package, and experimental evaluation of interface stability and repeatability. A separate enameled Ni-Cr wire and the fiber are bonded with thermally conductive adhesive before insertion into a sleeve, providing controlled thermal contact. The interface is located from the maximum magnitude of the axial gradient in the Rayleigh-based temperature-equivalent profile. In liquid nitrogen, an approximately 0.4 m active probe was interrogated through an approximately 63 m passive lead. Ten quasi-static readings yielded a zero-intercept slope of 0.9732, R2 = 0.9998, an MAE of 0.251 mm, and a maximum absolute error of 0.630 mm relative to a ruler. The stored coordinate interval was 0.1 mm but is not an absolute-accuracy specification. Tests at 200 Hz and approximately 23.5 Hz, together with ten repeated room-temperature water profiles, showed that the heated interface remained distinguishable and repeatable under the tested conditions. Cryogenic vibration, dynamic response, long-term drift, and qualification for liquid oxygen or liquid hydrogen remain to be evaluated.
1. Introduction
Liquid-level measurement is important in chemical processing, fuel storage and transport, aerospace systems, reservoirs, and wastewater treatment [1,2]. Cryogenic liquids, including liquid helium, oxygen, nitrogen, and hydrogen, are used in superconducting systems, aerospace, medicine, and other advanced applications [3,4,5,6]. Their low boiling points, ready vaporization, and often poorly defined liquid–vapor interfaces complicate rapid and reliable level measurement [7]. Cryogenic examples include dynamic cryostat monitoring and capacitance-type slush-nitrogen meters [4,8]. Fiber-optic liquid-level transducers have also been developed for non-cryogenic monitoring [9], while non-contact ultrasonic systems, LOX tank mass gauging, and other radar, thermal, and optical approaches provide additional level-sensing strategies [10,11,12,13,14,15]. Fiber-optic sensors are attractive because the optical lead can be compact, remotely interrogated, and resistant to electromagnetic interference.
Reported fiber-optic liquid-level sensors include modal-interference devices [16,17], Fabry–Perot cavities [18], polymer optical-fiber sensors [19], fiber Bragg grating arrays [13,20], and other interferometric configurations [21,22,23]. These approaches can offer high sensitivity, but their active lengths, probe complexity, and suitability for cryogenic operation vary. Distributed heated-fiber methods instead identify the liquid–vapor boundary from the different heat-transfer conditions on the two sides of the interface [24,25]. Temperature and strain can also alter attenuation in composite fiber cables [26], while temperature-dependent mode coupling in low-numerical-aperture multimode fibers redistributes modal power [27]. SMF-28 was selected here to provide a single spatial mode compatible with the C-OFDR interrogator and to avoid additional intermodal ambiguity in the thermal profile.
In this study, C-OFDR serves as a commercial distributed interrogation platform, whereas the main contributions are the sensing-principle analysis, the probe-packaging design, and experimental evaluation of stability and repeatability. Electrical heating generates a controlled temperature contrast between the submerged and vapor-exposed sections, and the interface is identified using a derivative-based criterion. A qualitative model based on radial heat conduction and Newton’s cooling boundary condition supports the sensing mechanism. The probe combines a conventional SMF-28 fiber with a separate enameled Ni-Cr wire that is bonded with thermally conductive adhesive before insertion into a sleeve. Liquid-nitrogen measurements, 200 Hz vibration tests, approximately 23.5 Hz engine-vibration tests, and ten repeated water-level profiles were used to evaluate the configuration under the stated experimental conditions.
2. Principle of Cryogenic Liquid-Level Sensing
Ultra-low-temperature liquid-level sensing can be achieved by locating the axial temperature transition along a heated optical fiber. An unheated fiber may not produce a sufficiently sharp or stable interface signal because of environmental drift and thermal stratification. By contrast, electrical heating creates a controlled temperature contrast between the liquid-submerged and vapor-exposed sections: the substantially different heat-transfer conditions in the cryogenic liquid and vapor produce a pronounced axial temperature gradient, and the position of this transition indicates the liquid level. Both optical self-heating and electrically heated-fiber configurations have been reported [24,25,28,29]. Optical heating typically couples a high-power laser into a cobalt-doped attenuating fiber, where the absorbed optical power is converted into heat [24]. However, exponential power attenuation limits the sensing length to the centimeter scale, while fabrication-dependent absorption can produce non-uniform temperature distributions.
Electrical heating can be implemented using either a conductive metal coating or a separate resistance wire. Metal-coated fibers require specialized fabrication, reliable electrical connections, and additional insulation, thereby increasing manufacturing complexity and cost and potentially introducing electrical-leakage risks [25]. An external alloy wire can instead be combined with a conventional optical fiber, although thermal contact, electrical insulation, and mechanical positioning must be controlled. Our previous work enclosed an optical fiber and a Ni-Cr resistance wire within a thin tube [29]; however, the sensing-principle analysis, probe-packaging design, and experimental evaluation of stability and repeatability were not fully developed in that study.
In the present study, liquid nitrogen is used as the cryogenic medium. Heat is conducted from the alloy wire to the adjacent fiber and subsequently removed by the surrounding liquid or vapor through convection and boiling. Because the resulting multiphase heat-transfer process is highly complex, the following model is intended only as a qualitative feasibility model for establishing the axial temperature contrast, rather than predicting the complete temperature field. The model assumes a constant internal heat source, fixed wire geometry, constant effective thermal conductivity, simplified surface heat-transfer coefficients, and stable thermal contact between the wire and fiber. Symbols used in the equations are shown in Table 1.
Table 1.
Symbols used in Equations (1)–(11).
According to Newton’s cooling law, the differential equation governing the temperature field of the alloy wire is expressed as
When the outer diameter r = 0, the temperature change becomes zero, resulting in the first boundary condition:
When the outer diameter r = rout, the second boundary condition is obtained:
Since the internal heat source Q(r) is set as a constant, integration yields (where c1 and c2 represent constants):
After integrating again,
From the first boundary condition, c1 = 0 can be derived. From the second boundary condition, the following is obtained:
Through calculation,
Therefore, the temperature field is given by Equation (8).
The outermost layer of the alloy wire satisfies r = rout, and substituting this into Equation (8) yields the temperature of the outermost layer, which can be expressed as follows:
Heat is transferred from the wire surface to the adjacent optical fiber through the adhesive according to Fourier’s law. The combined transverse and axial conduction path is represented by an effective proportional coefficient kR. The predicted temperature difference between the liquid-side and vapor-side fiber sections is therefore written as:
Further refinement yields
Here, denotes the difference between the vapor- and liquid-side surface heat-transfer coefficients, while denotes the corresponding difference in ambient temperature. Equations (1)–(11) show qualitatively that the different boundary conditions on the two sides of the liquid–vapor interface generate a fiber-temperature contrast. Because the heat-transfer coefficients depend on temperature, flow, boiling, and phase change and were not measured independently, this formulation is a feasibility model rather than a calibrated multiphase prediction. Its role is to support detection of the axial temperature transition, not to predict the complete cryogenic temperature field.
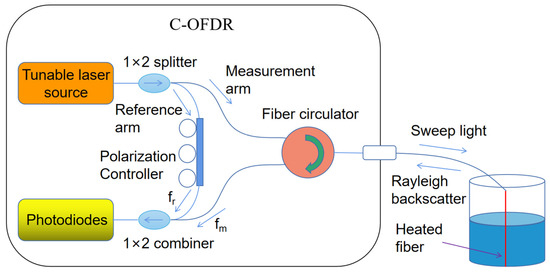
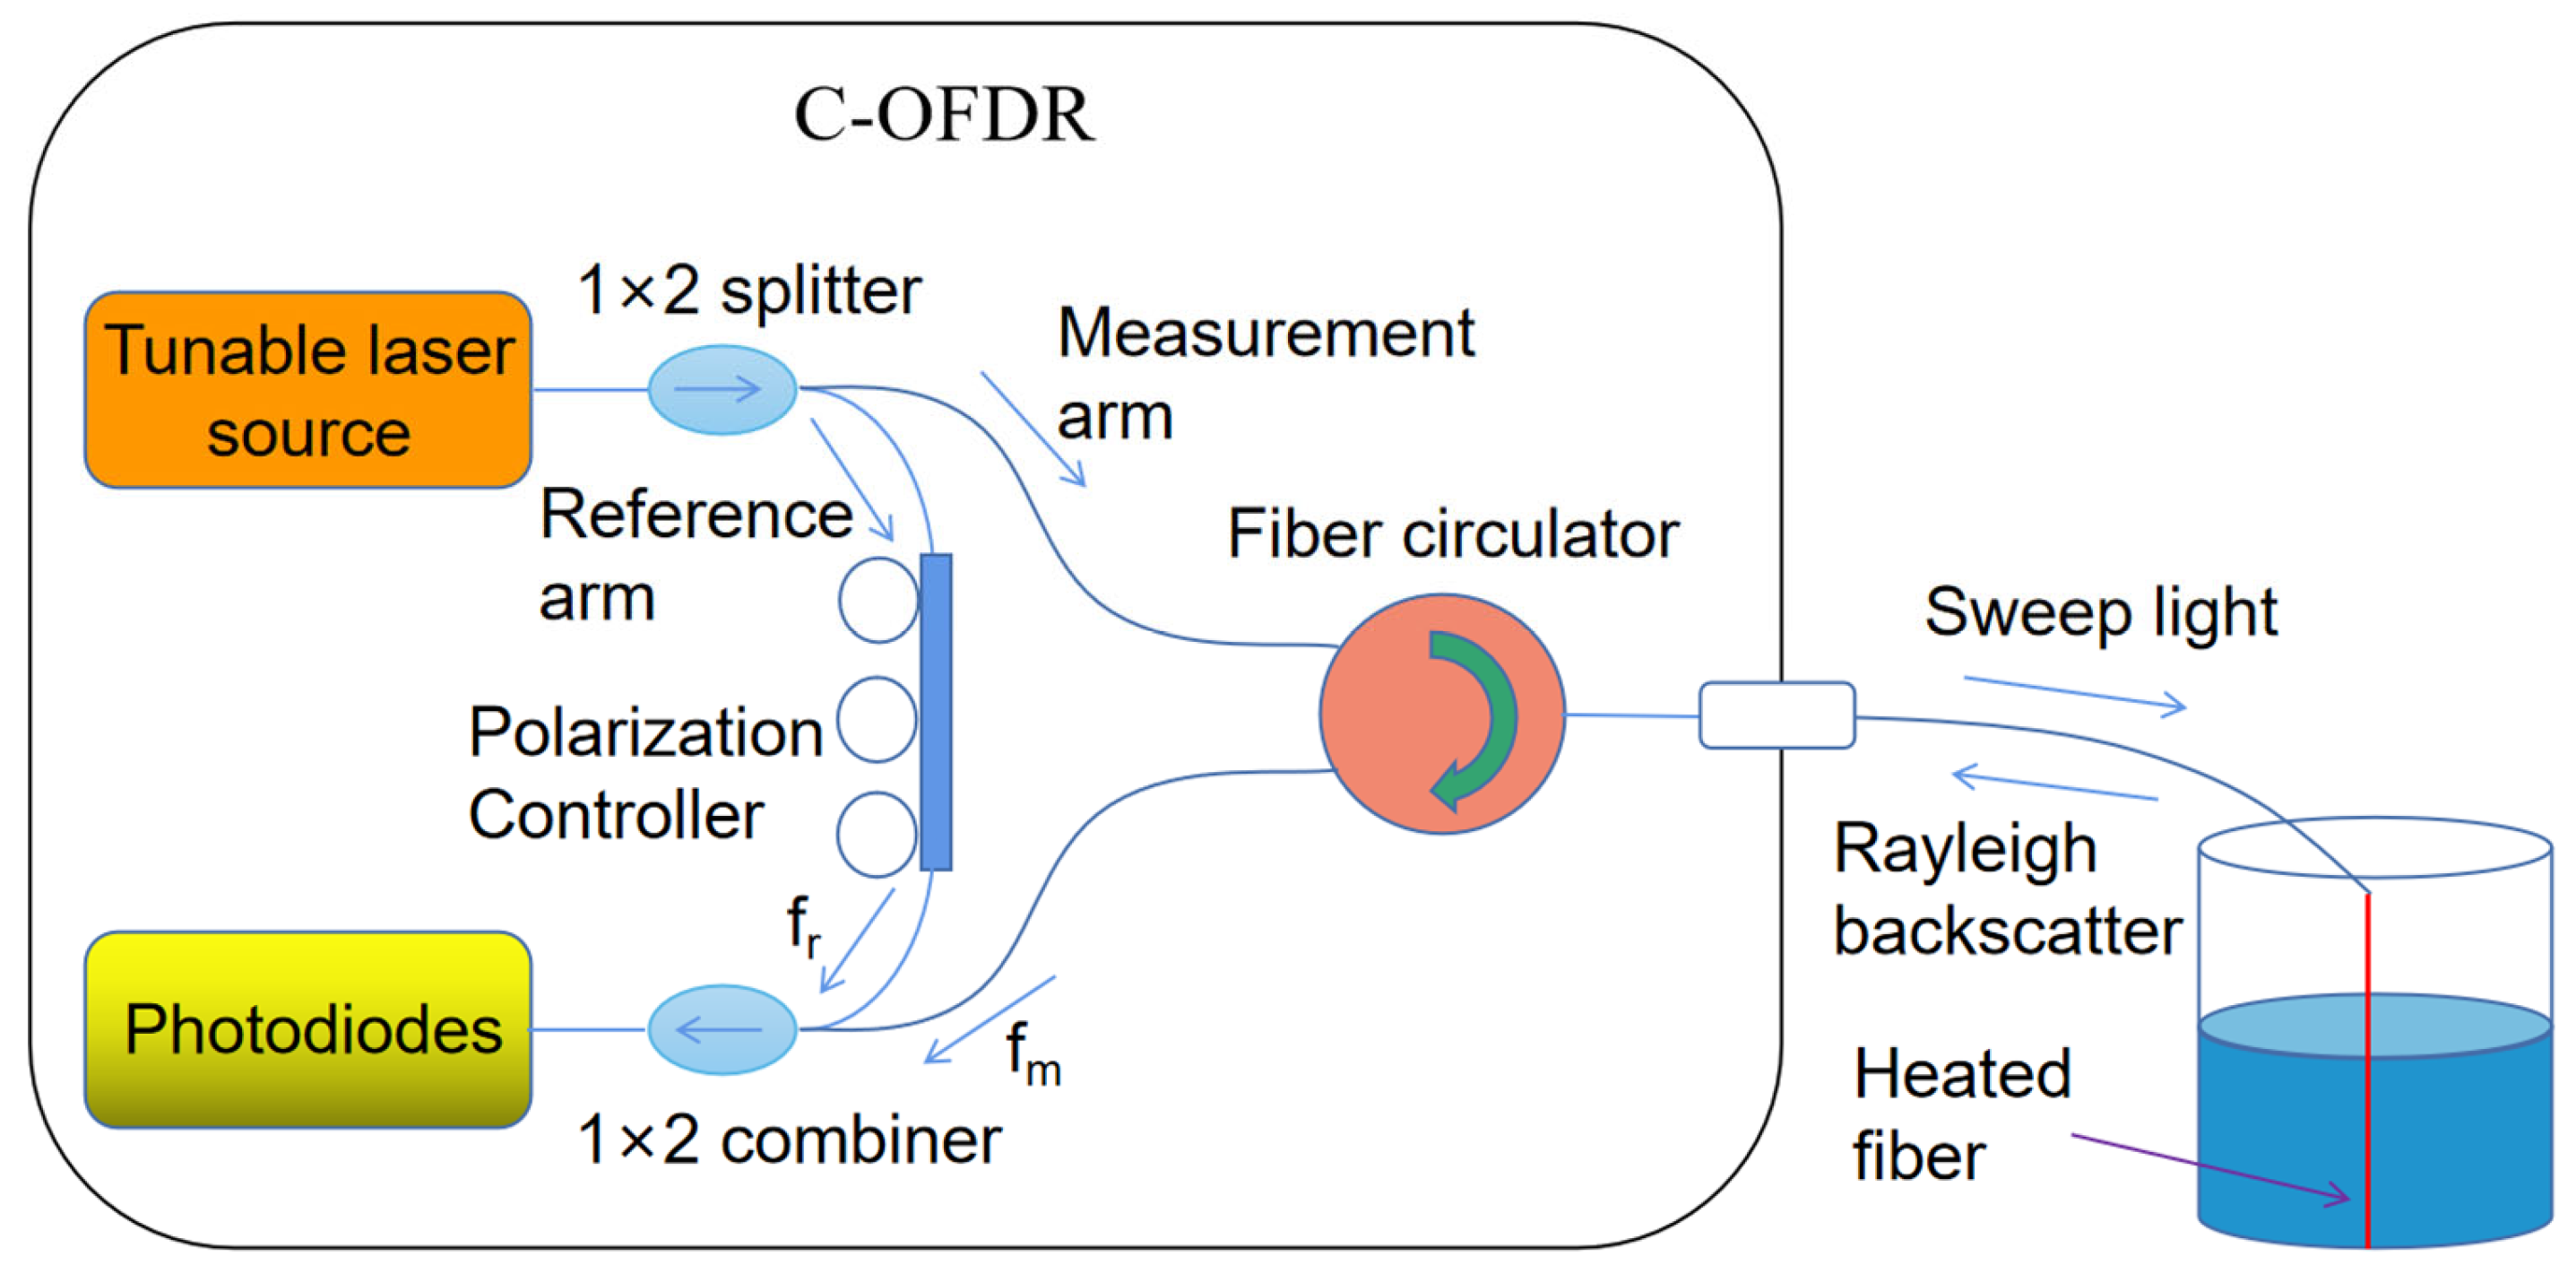
Figure 1 presents the system-level sensing arrangement. Current through the alloy wire heats the adjacent fiber. Stronger heat removal in liquid nitrogen limits the temperature rise in the submerged section, whereas the vapor-exposed section reaches a higher temperature. The C-OFDR instrument converts local Rayleigh spectral shifts into a distributed temperature-equivalent profile [30,31,32], and the liquid–vapor interface is identified from the axial transition in that profile. A reference Rayleigh trace and the instrument temperature coefficient are required, although absolute-temperature calibration is not needed for relative interface localization. The Rayleigh shift remains sensitive to both temperature and strain.
Figure 1.
Principle of the fiber-optic level-sensing system based on Rayleigh backscattering.
An OBR4400 (Luna Technologies, Blacksburg, VA, USA) was used as the commercial C-OFDR interrogator, and its standard software supplied the Rayleigh-based temperature-equivalent profiles. The contribution evaluated here is the heated probe and interface-location procedure, not the interrogator’s internal optical design. During a wavelength sweep, the instrument records the interference between reference and backscattered light; a Fourier transform maps the beat frequency to position along the fiber. The nominal C-OFDR spatial resolution is described by Equation (12).
Here, and represent the starting and ending wavelengths of the laser source’s scanning range, respectively, while denotes the effective refractive index of the fiber core. The OBR4400 can perform linear scanning across laser wavelengths from 1520 nm to 1610 nm. For a standard single-mode fiber with a refractive index of approximately 1.46, the theoretical spatial resolution of C-OFDR reaches 10 µm. When measuring temperature along a 70 m long single-mode fiber, the spatial resolution is 1 mm, with a temperature resolution of 0.1 °C [31,32]. For each measured temperature profile, we calculate its spatial derivative, and the liquid–vapor interface is located at the position where the absolute value of the temperature gradient reaches its maximum. The response speed of the reported level readings is constrained by the selected C-OFDR sweep parameter settings.
3. Sensor Fabrication and Experimental Results
Regarding external heating technology for alloy wires, an analysis of the sensing principles reveals that the selection of ultra-low-temperature liquids—such as liquid nitrogen, liquid helium, liquid oxygen, or liquid hydrogen—for level measurement experiments follows universal methodologies. Given the challenges in obtaining these extremely cold fluids and experimental safety considerations, liquid nitrogen (77 K, −196 °C) is the most representative choice for such measurements.
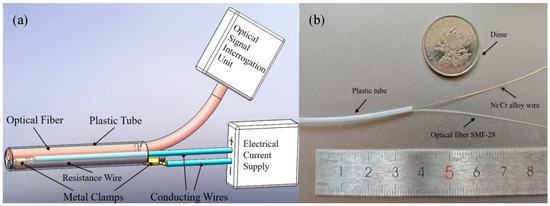
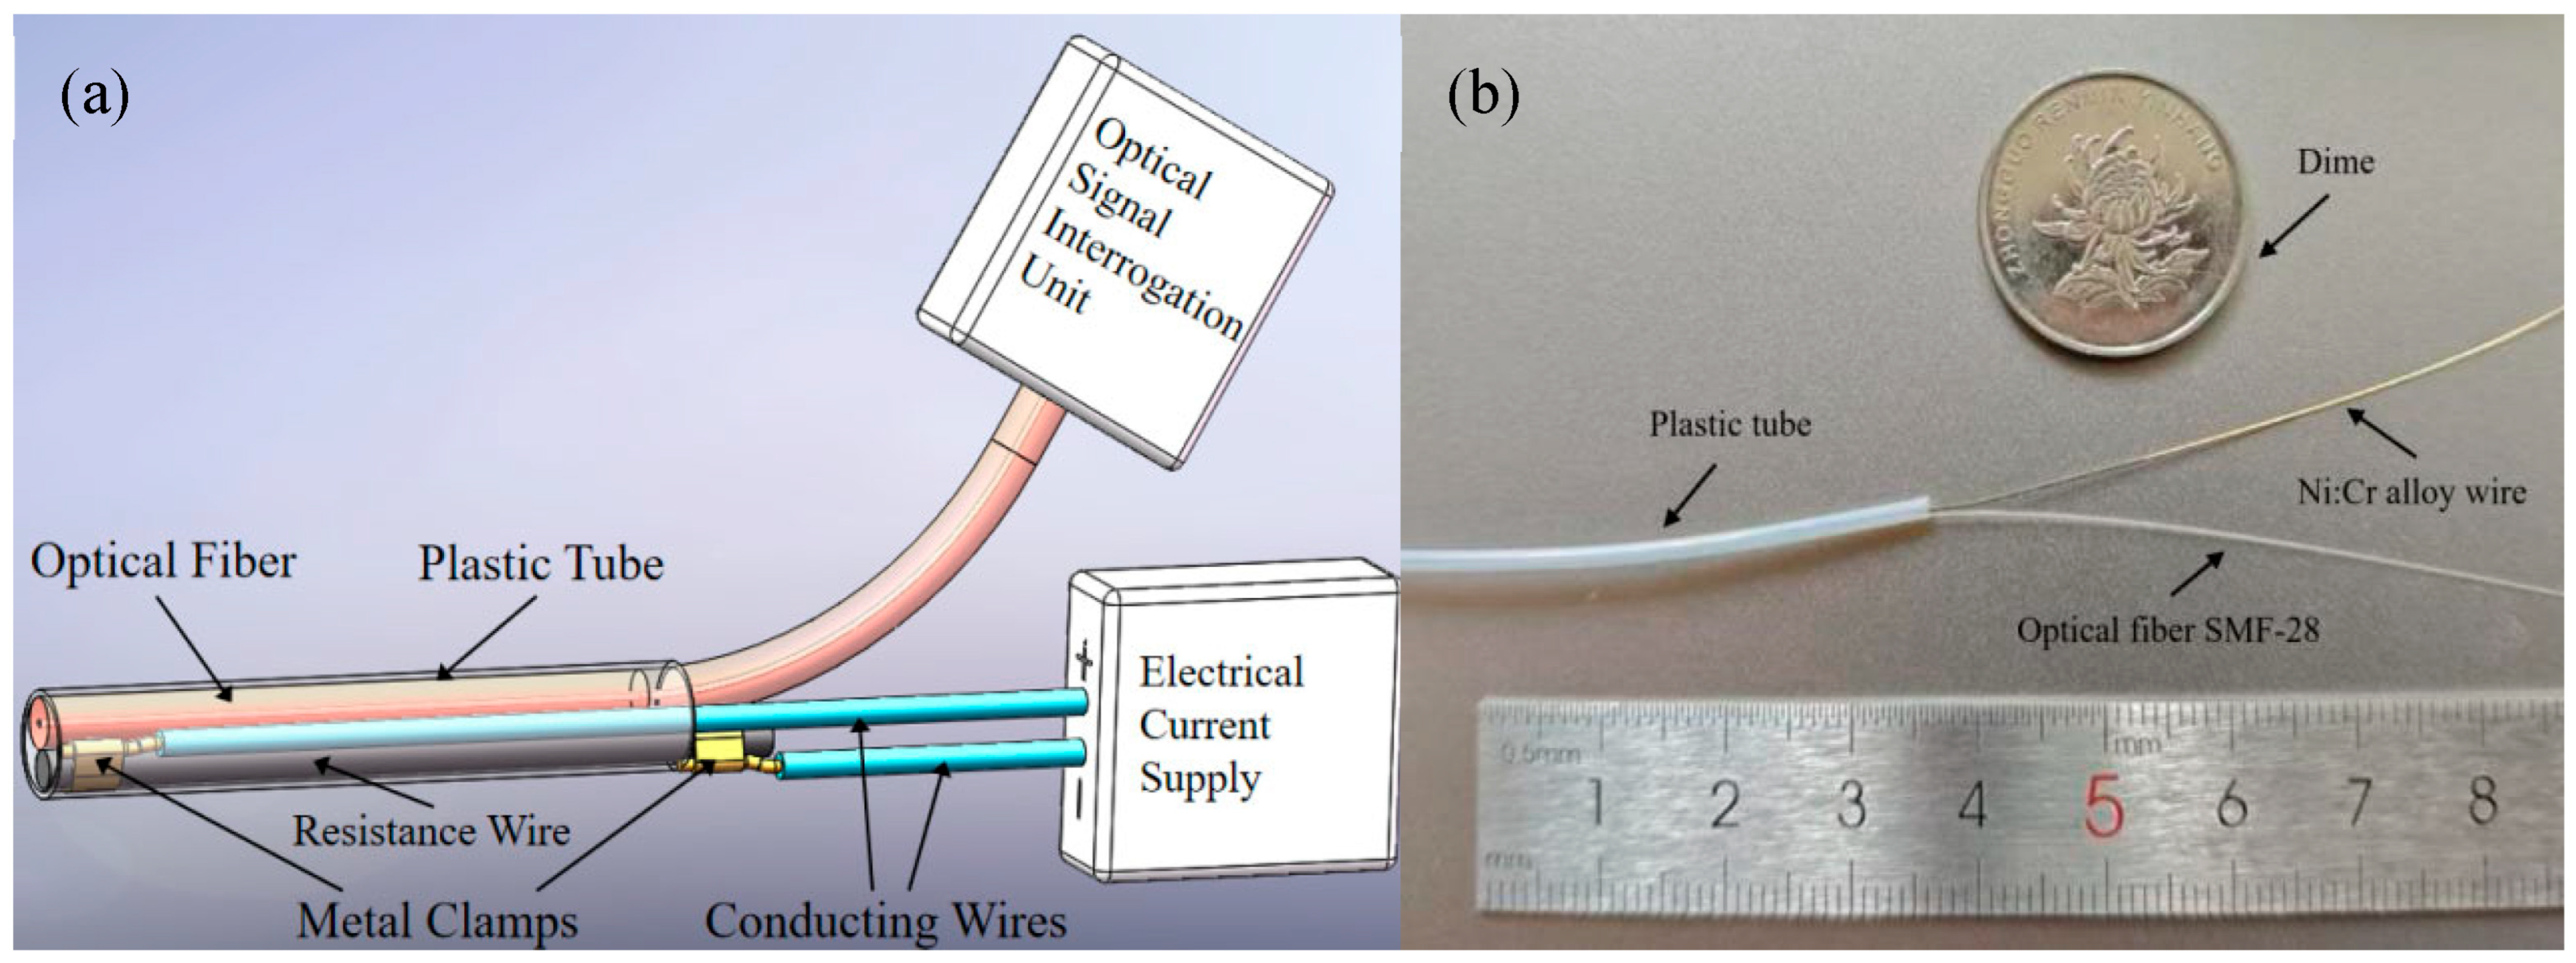
The probe contains a 125 µm diameter SMF-28 single-mode fiber and a 200 µm diameter enameled Ni-Cr wire (ARCOR Epoxy Inc., Pocasset, MA, USA) with a linear resistance of 22.15 Ω/m. The electrical heating powers per unit length, I2R, are 0.886 W/m at 200 mA, 1.99 W/m at 300 mA, and 3.54 W/m at 400 mA. These values are suitable for the short active lengths used in the laboratory experiments; the power implications of longer continuously heated probes are considered in the Discussion. Both components are flexible and can be packaged together, as shown in Figure 2.
Figure 2.
The sensor fiber probe: (a) Schematic diagram; (b) physical photo.
The flexible plastic sleeve has an inner diameter of 1 mm and an outer diameter of 1.4 mm. The optical fiber and the alloy wire are first aligned in parallel and bonded together with a thermally conductive adhesive. This adhesive fixes their relative position and maintains a constant separation along the sensing section. The bonded assembly is then inserted into the sleeve, which further constrains the assembly and prevents relative movement during installation and cryogenic operation. When no current is applied, the fiber mainly records the background temperature field and the interface cannot be reliably identified from a controlled temperature step. When current is applied to the alloy wire, the optical fiber is heated and the liquid-submerged and vapor-exposed sections show different temperature rises. The alloy wire can be selected according to the required active length, allowable voltage, heating power, insulation constraint, and operating liquid.
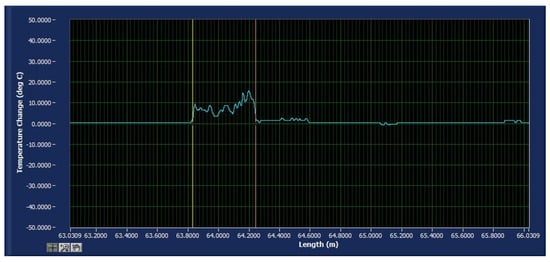
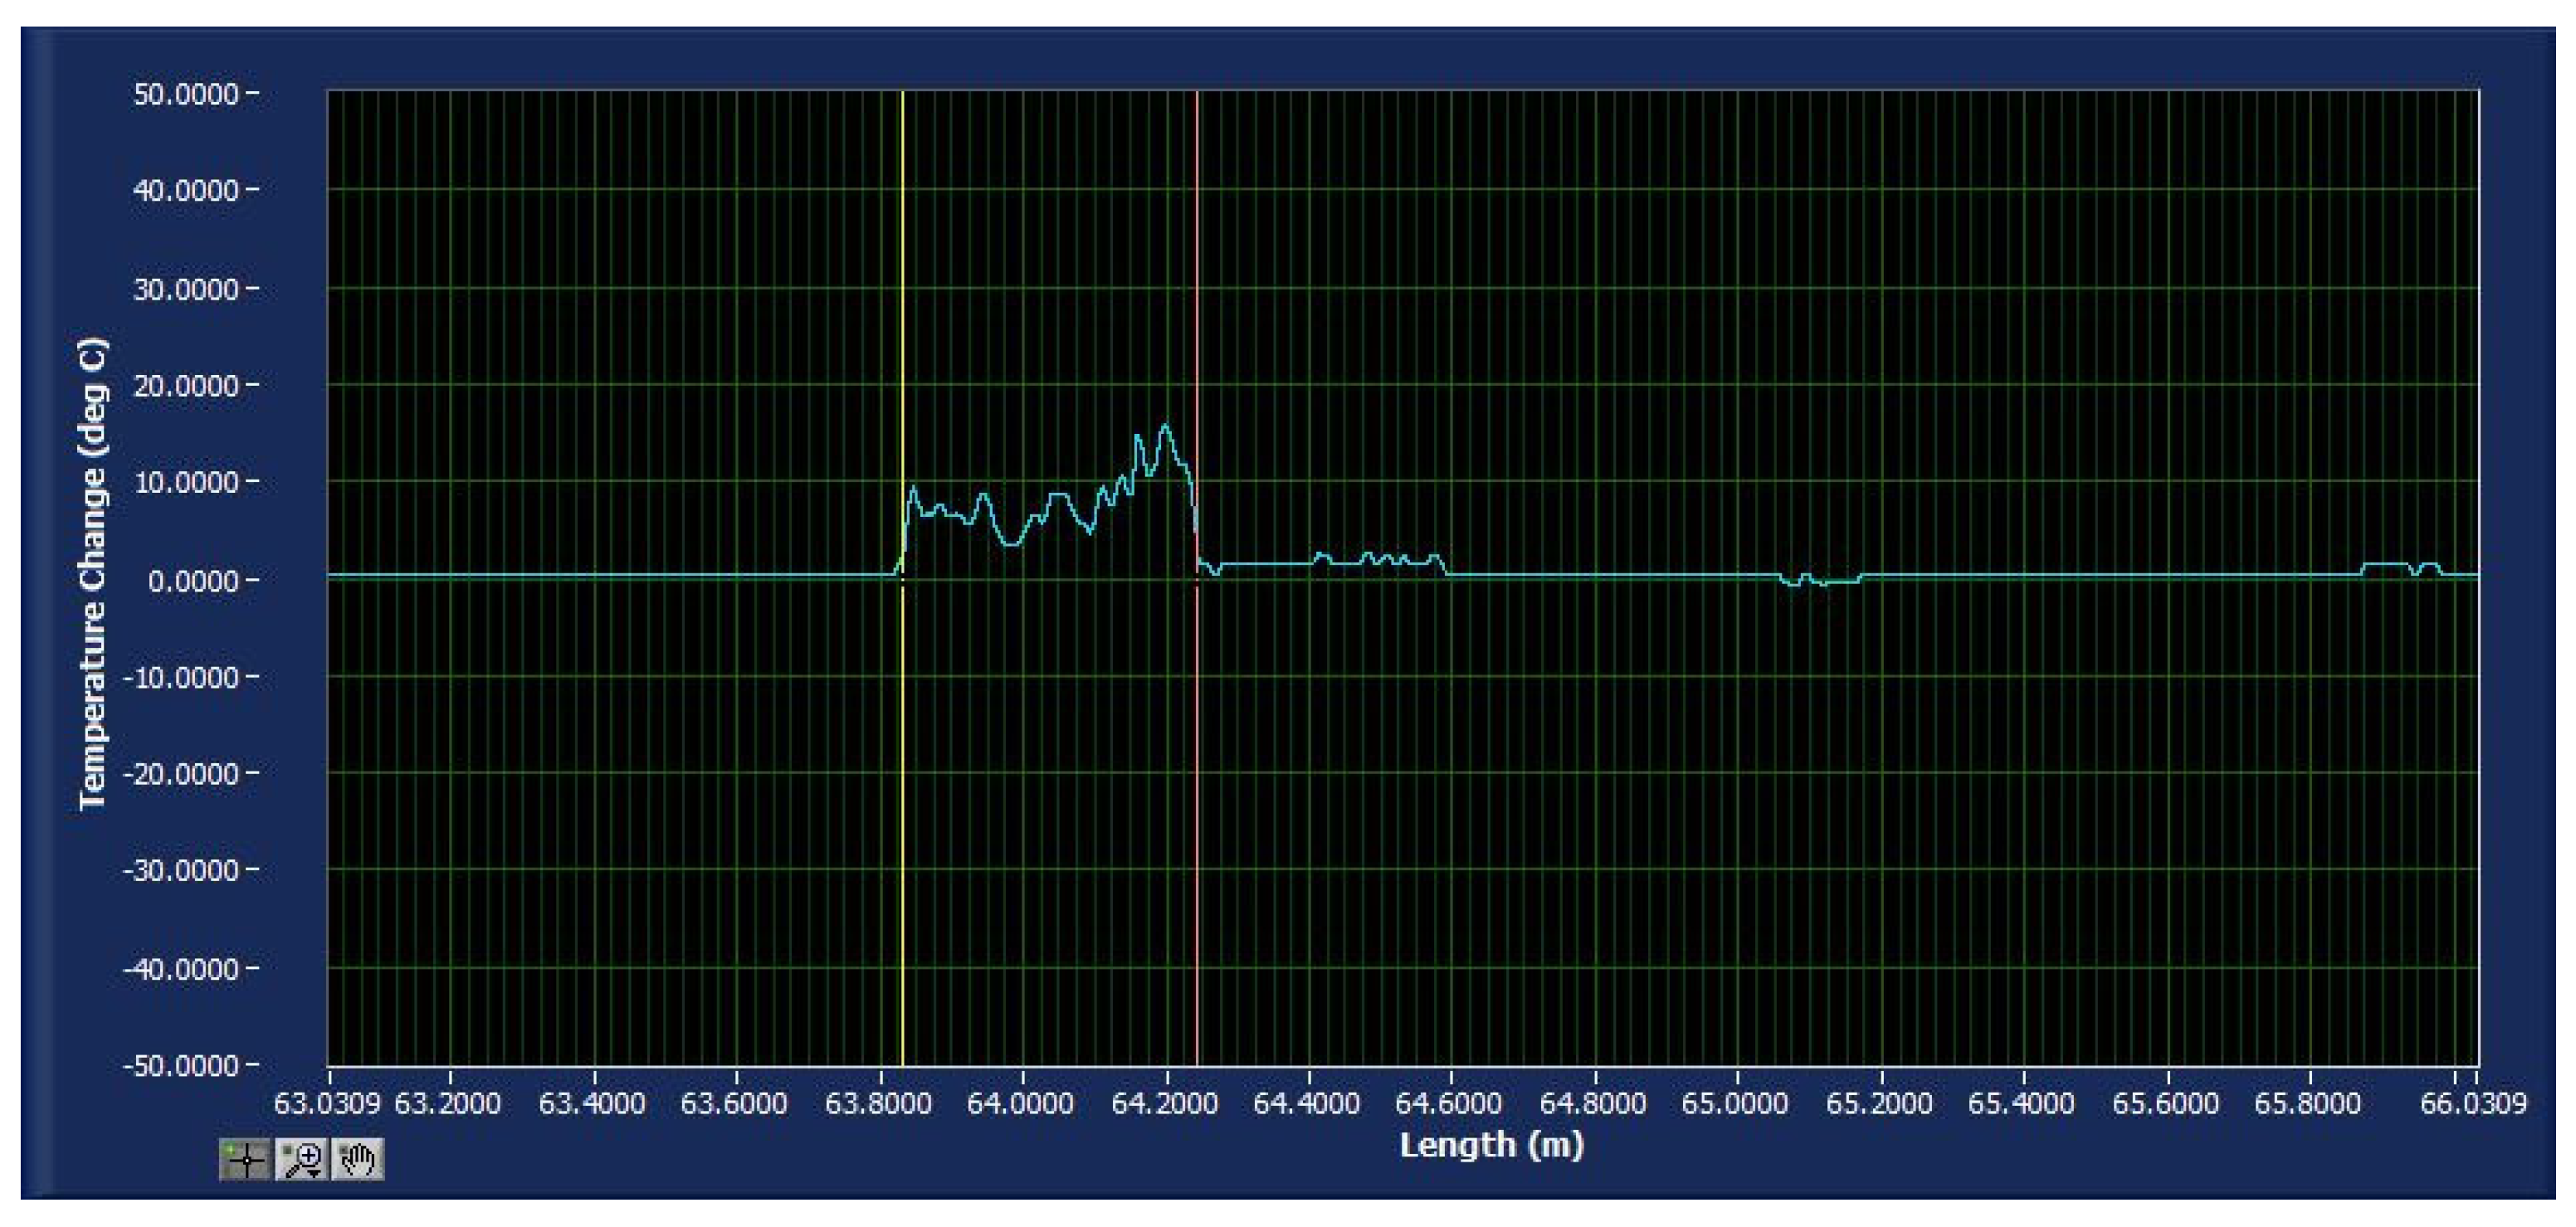
The signal processing unit OBR4400 connects a fiber-optic sensor with a 0.4 m extension using approximately 63 m of identical SMF-28 fiber to verify the sensor’s measurement range. The alloy wire is linked to an adjustable current source, and the fiber-optic level sensor is vertically mounted on a scale with 1 mm accuracy. This scale is then secured vertically within a liquid-nitrogen cooler measuring 40 cm in height and 30 cm in inner diameter. As the liquid nitrogen gradually evaporates, the level changes accordingly; during this process, both the sensing fiber and the scale measure the liquid-nitrogen level simultaneously, with the scale reading serving as a reference. A 200 mA current is applied to the alloy wire to heat the sensing fiber, enabling differentiation of the temperature difference between the liquid nitrogen and nitrogen vapor (as shown in Figure 3). The fiber-temperature jump exceeds 5 °C, far surpassing the OBR4400 signal processing unit’s temperature resolution of 0.1 °C. The yellow line in Figure 3 indicates the temperature change in the fiber at 63.830 m from the signal unit, while the red line marking the temperature jump corresponds to the liquid-nitrogen level at 64.245 m; the interval between them represents the sensing fiber.
Figure 3.
Temperature change on optical fiber.
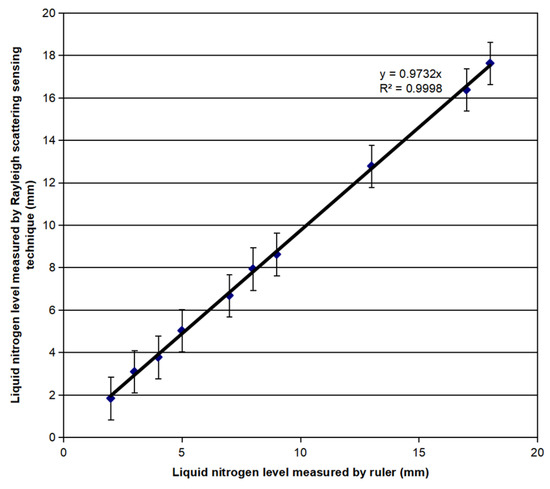
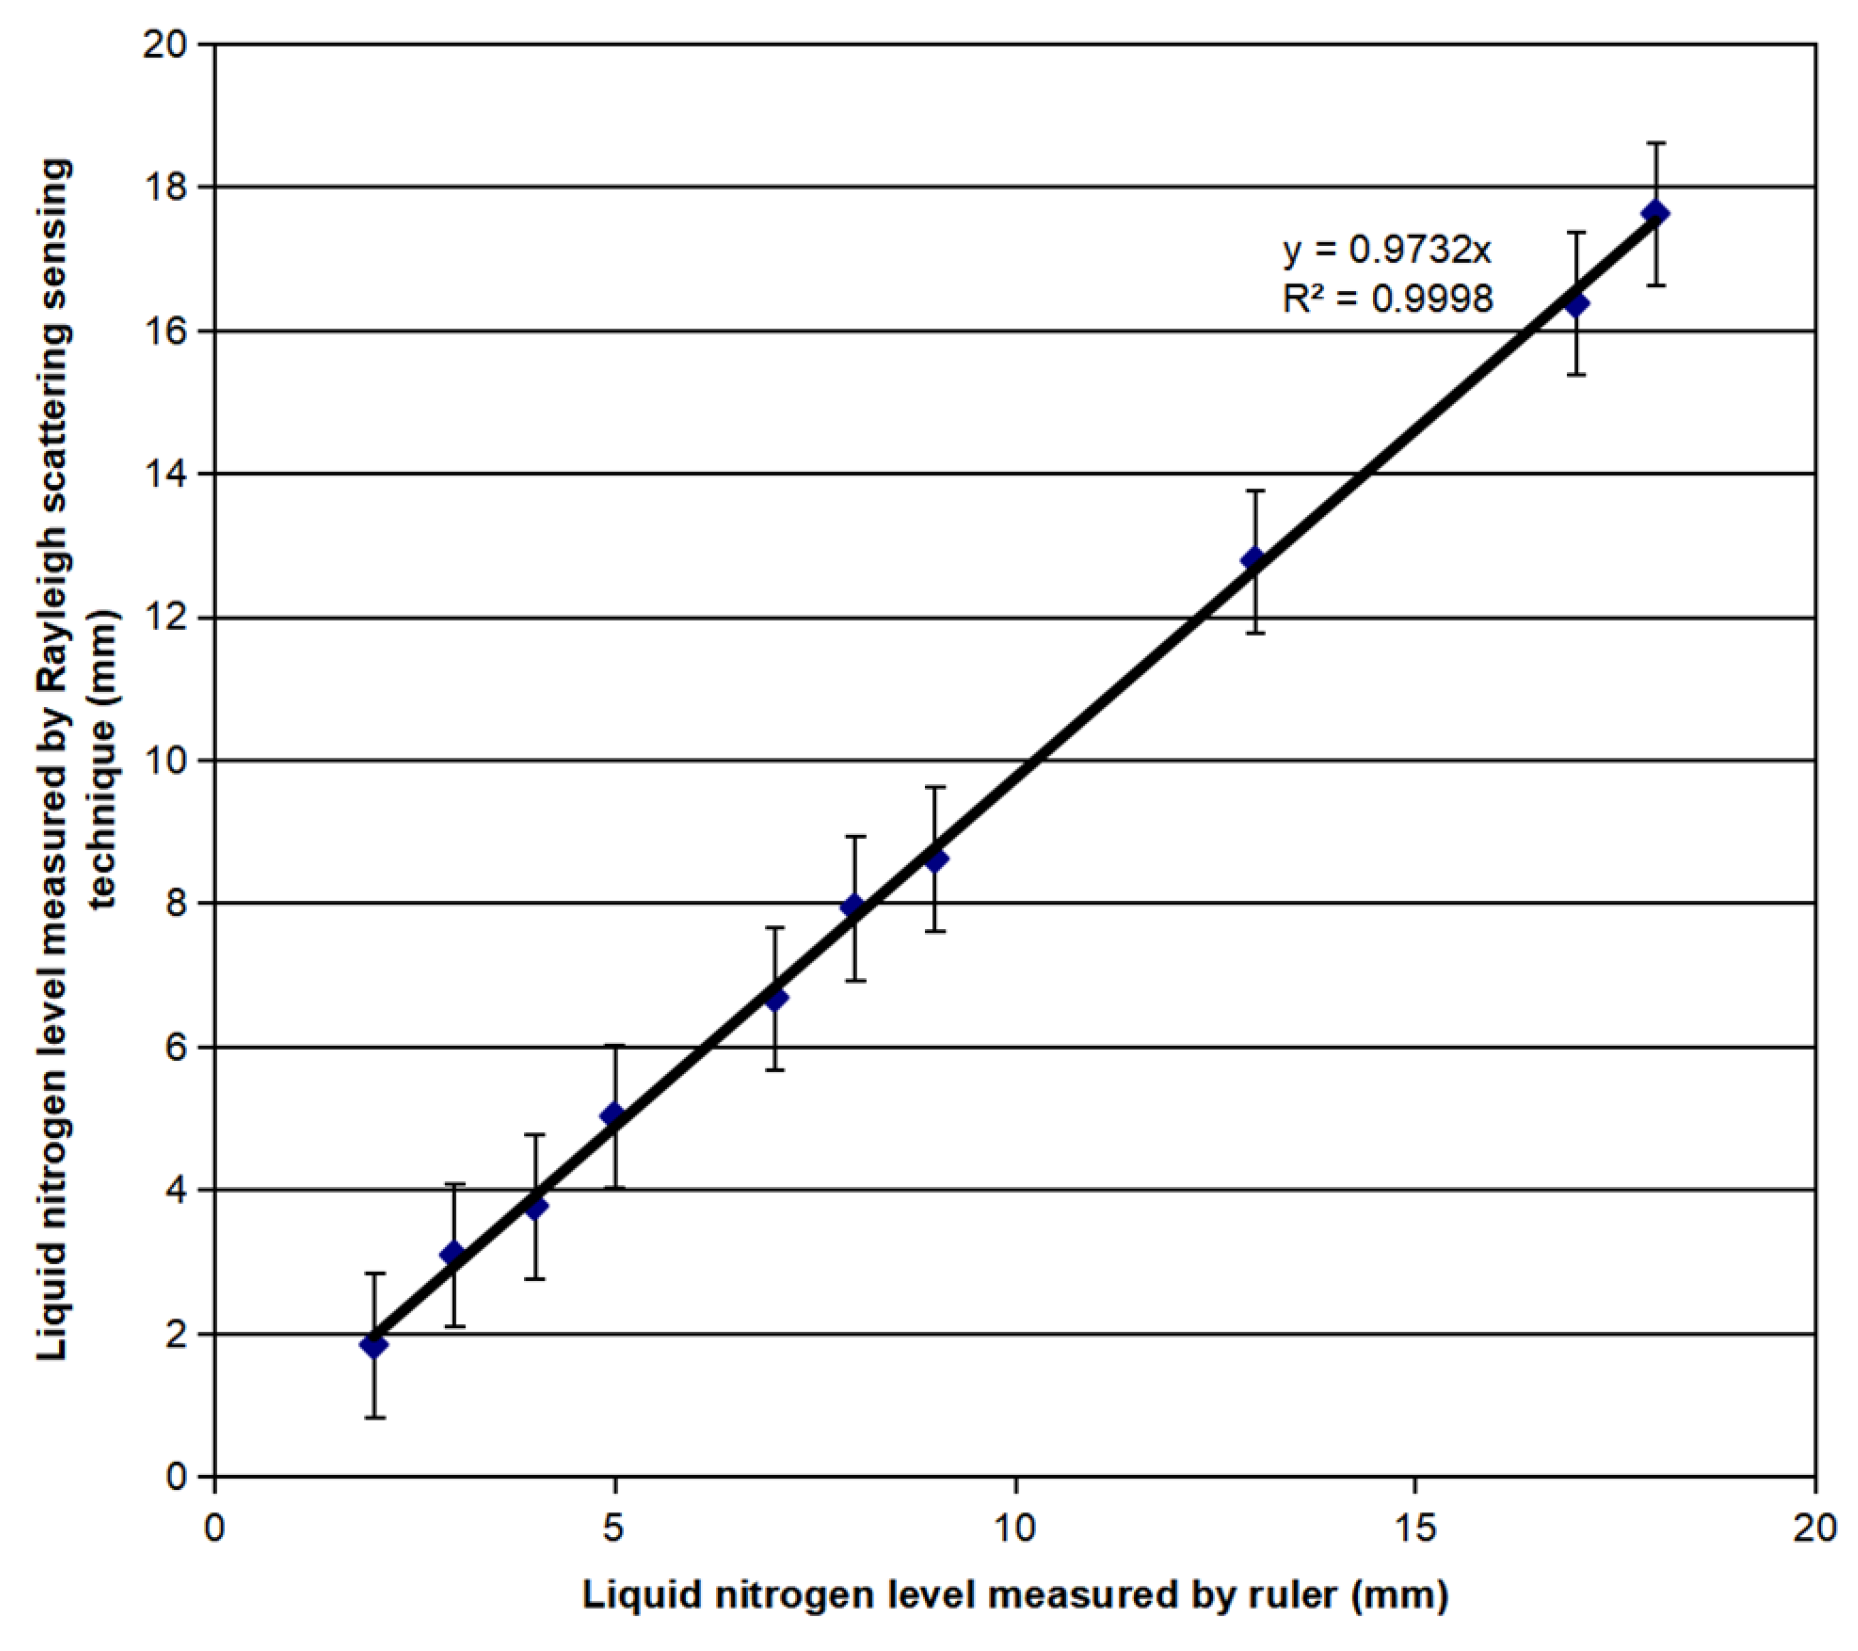
Ten quasi-static liquid-level readings were collected during the experiment. Figure 4 compares the fiber-sensor measurements with the corresponding ruler readings. A zero-intercept linear fit yielded a slope of k = 0.9732 and a coefficient of determination of R2 = 0.9998, indicating excellent agreement over the tested range.
Figure 4.
Comparison of the liquid-nitrogen level measured by the sensing optical fiber and the ruler.
The slope was 2.68% lower than unity, indicating a minor scale-factor bias. Possible contributors include ruler-reading uncertainty, vertical misalignment between the fiber and ruler, the finite width of the thermal transition region, and the selected interface-detection criterion. At the upper reading of 18 mm, the scale-factor deviation alone corresponds to approximately 0.48 mm relative to the one-to-one relationship. The signed error (C-OFDR reading minus ruler reading) had a mean bias of −0.231 mm, an MAE of 0.251 mm, an RMSE of 0.306 mm, and a maximum absolute error of 0.630 mm. The vertical error bars represent deviations from the corresponding ruler readings, with bounds of ±1 mm. Although the 0.1 mm spatial sampling interval improves the resolution of the recorded coordinates, it does not itself represent the absolute measurement accuracy; the reference ruler had 1 mm graduations.
Rayleigh C-OFDR is sensitive to both temperature and strain; mechanical vibration can therefore perturb the spectral shift and move the liquid surface. The following tests examined whether the electrically heated-interface signal remained distinguishable from vibration-induced disturbances. Water was used to avoid hazardous liquid-nitrogen splashing during mechanical excitation. Because water and liquid nitrogen differ in heat transfer, boiling, free-surface motion, and thermal shock, these experiments provide room-temperature mechanical validation only and do not establish cryogenic vibration performance.
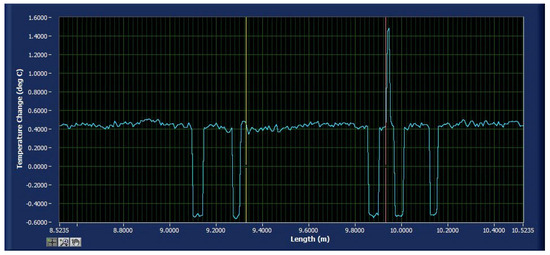
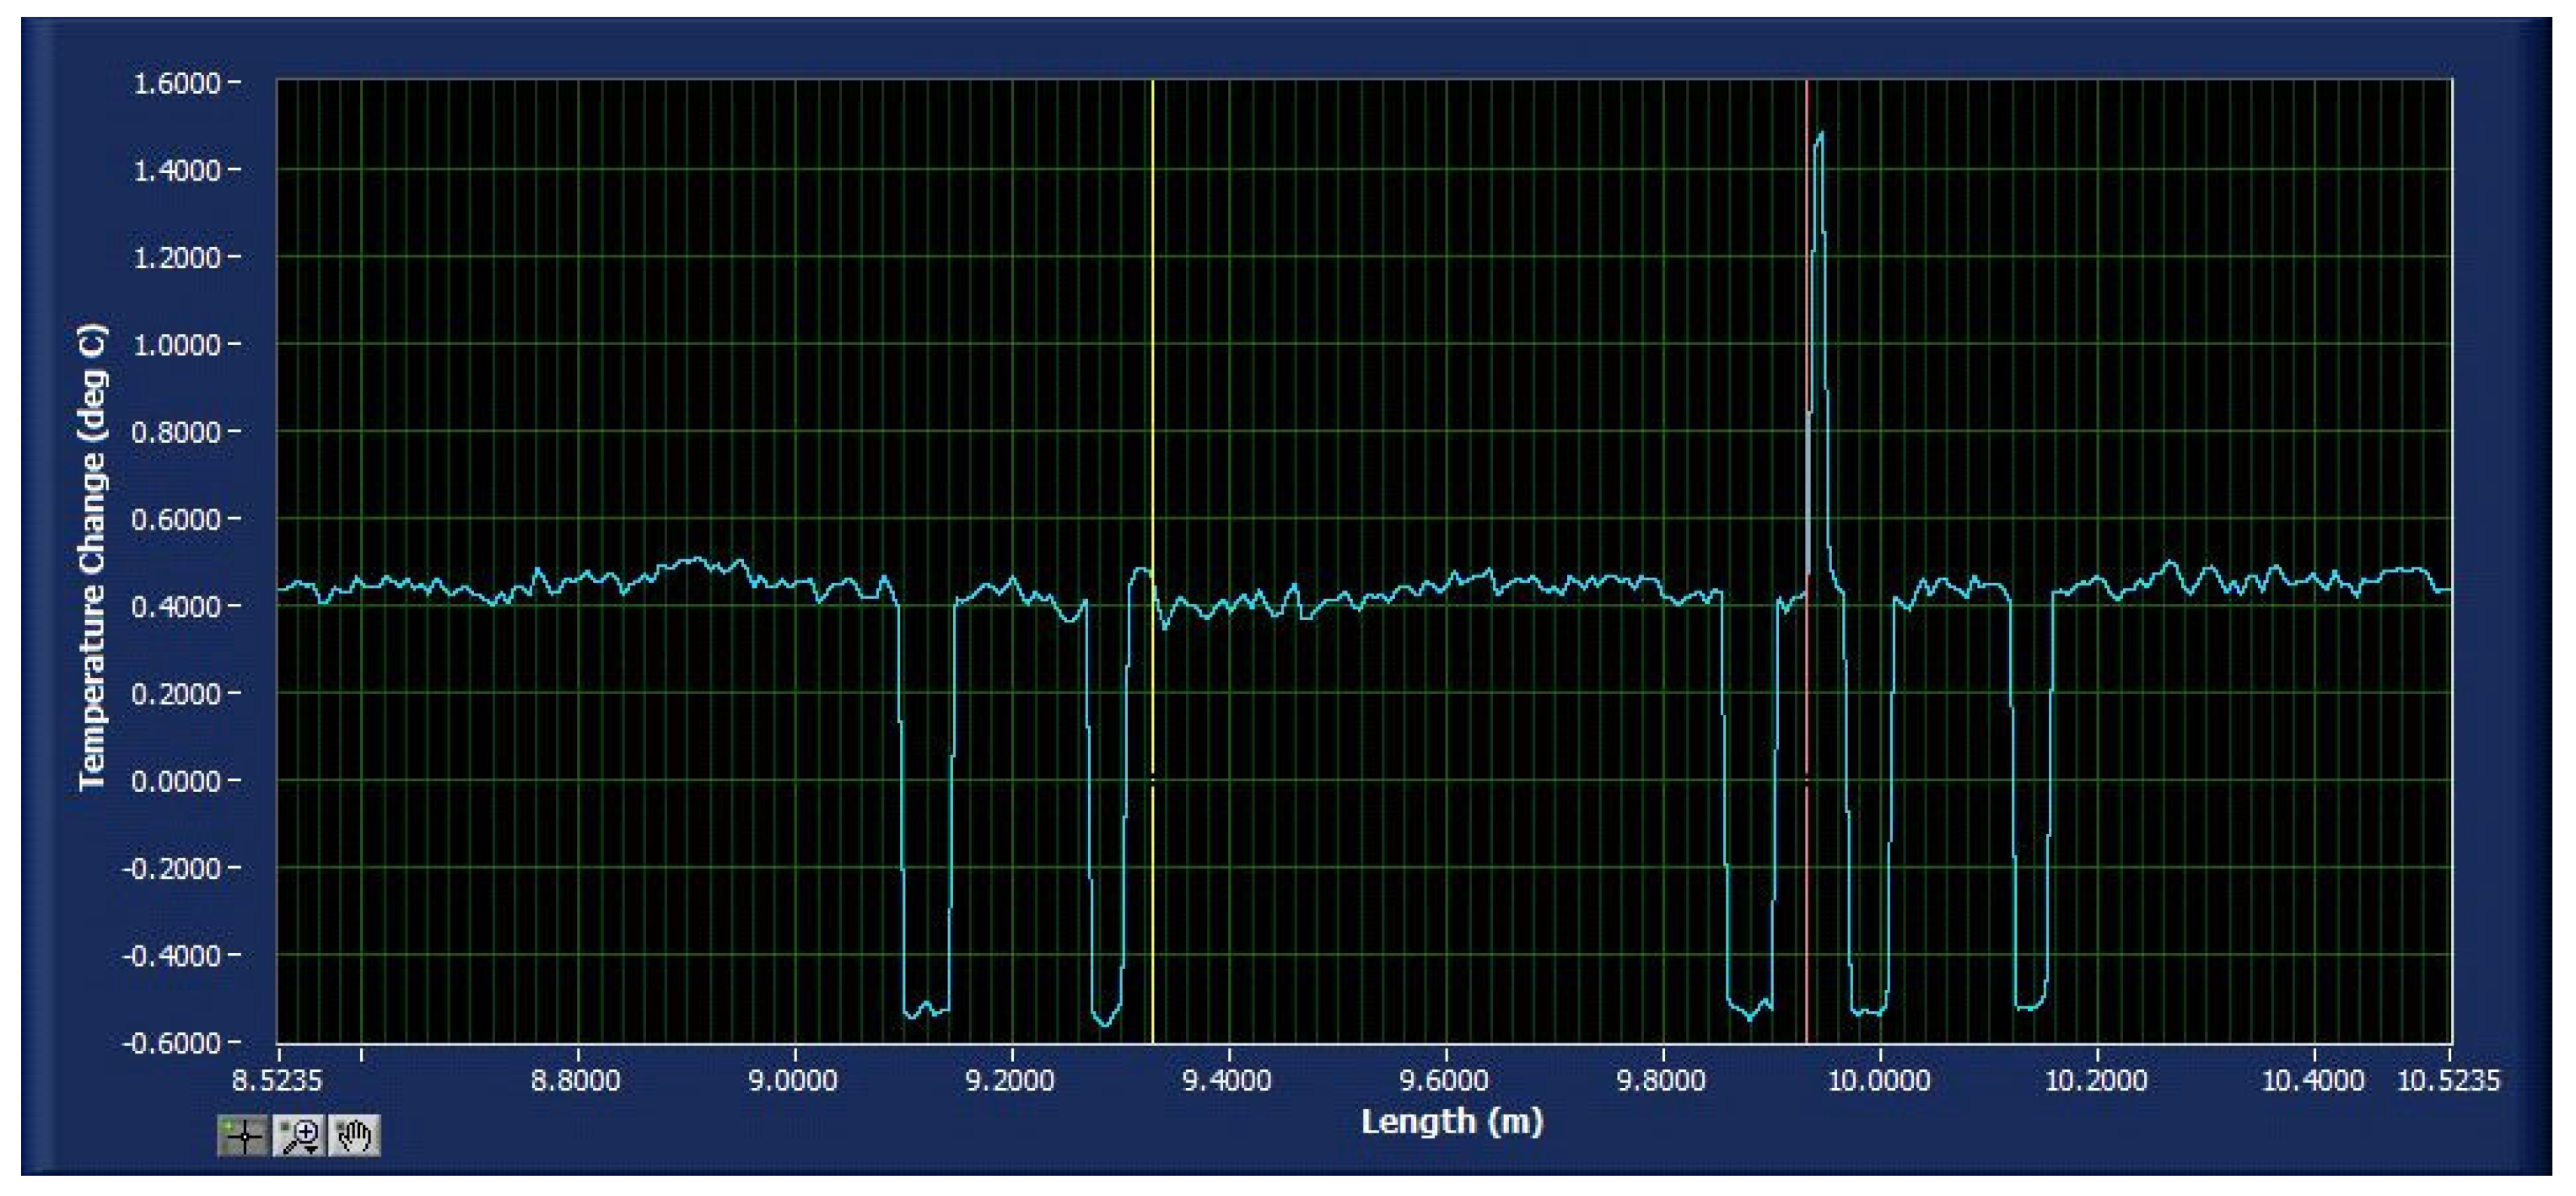
With the industrial vibrator off and no heating current applied, the maximum temperature-equivalent fluctuation along the sensing fiber was approximately ±1.0 °C, as shown in Figure 5.
Figure 5.
The maximum noise (i.e., the maximum temperature fluctuation) along the sensing fiber is about ± 1.0 °C when the industrial vibrator did not vibrate and no current was applied.
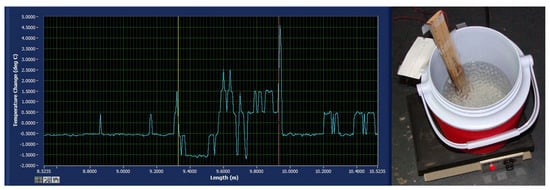
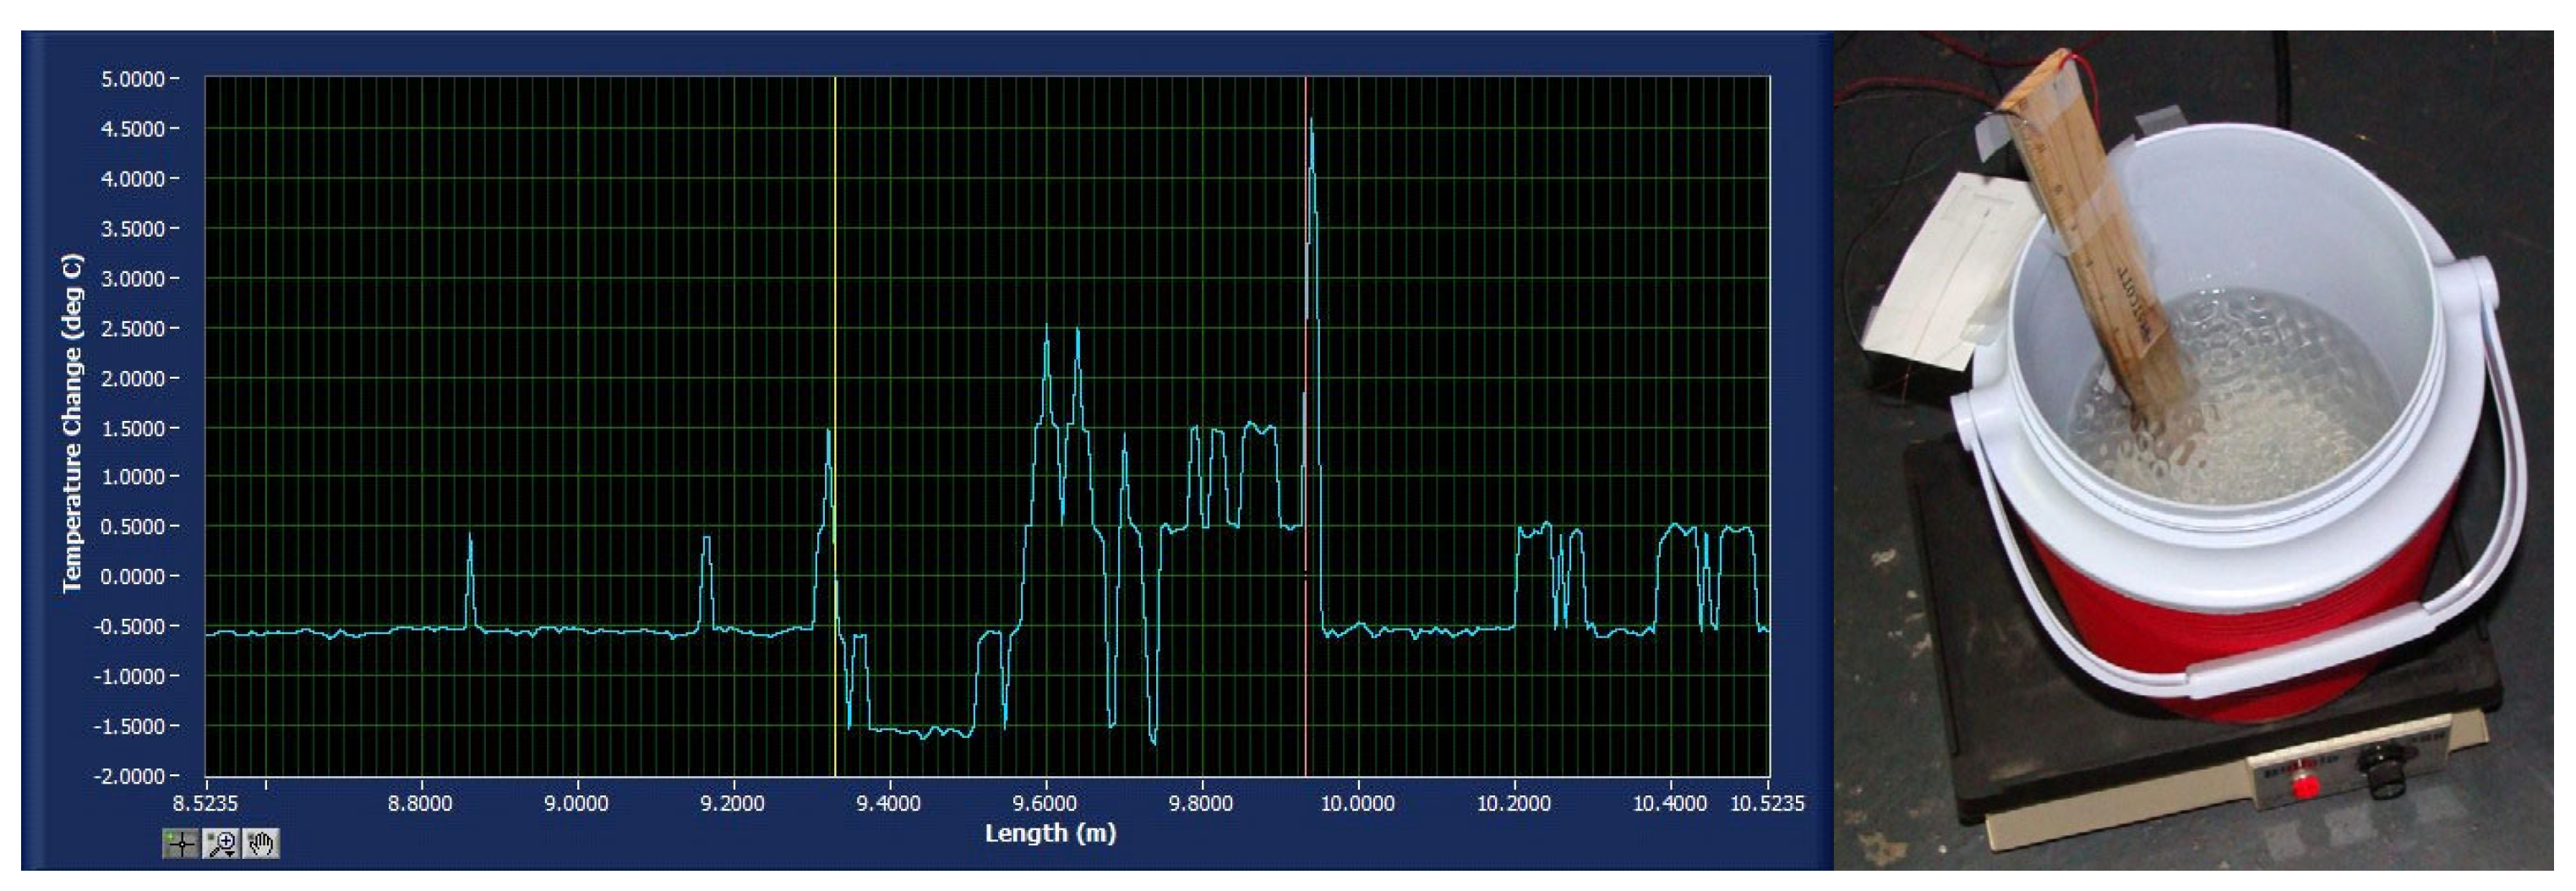
In the experiment investigating the effect of high-frequency vibration on the temperature performance of the optical fiber level sensor, the sensing fiber was 0.6 m long, and the high-frequency industrial vibrator was set to an operating frequency of 200 Hz. With no current applied, the temperature variation along the fiber is shown in Figure 6, where the maximum temperature fluctuation is less than 5 °C. This noise level served as the reference for selecting a heating current capable of producing a sufficiently strong liquid-level measurement signal.
Figure 6.
Temperature change along the sensing fiber when the vibrator was on: (a) Maximum noise; (b) experimental setup.
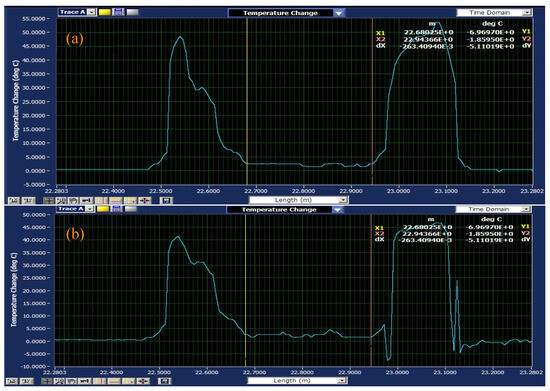
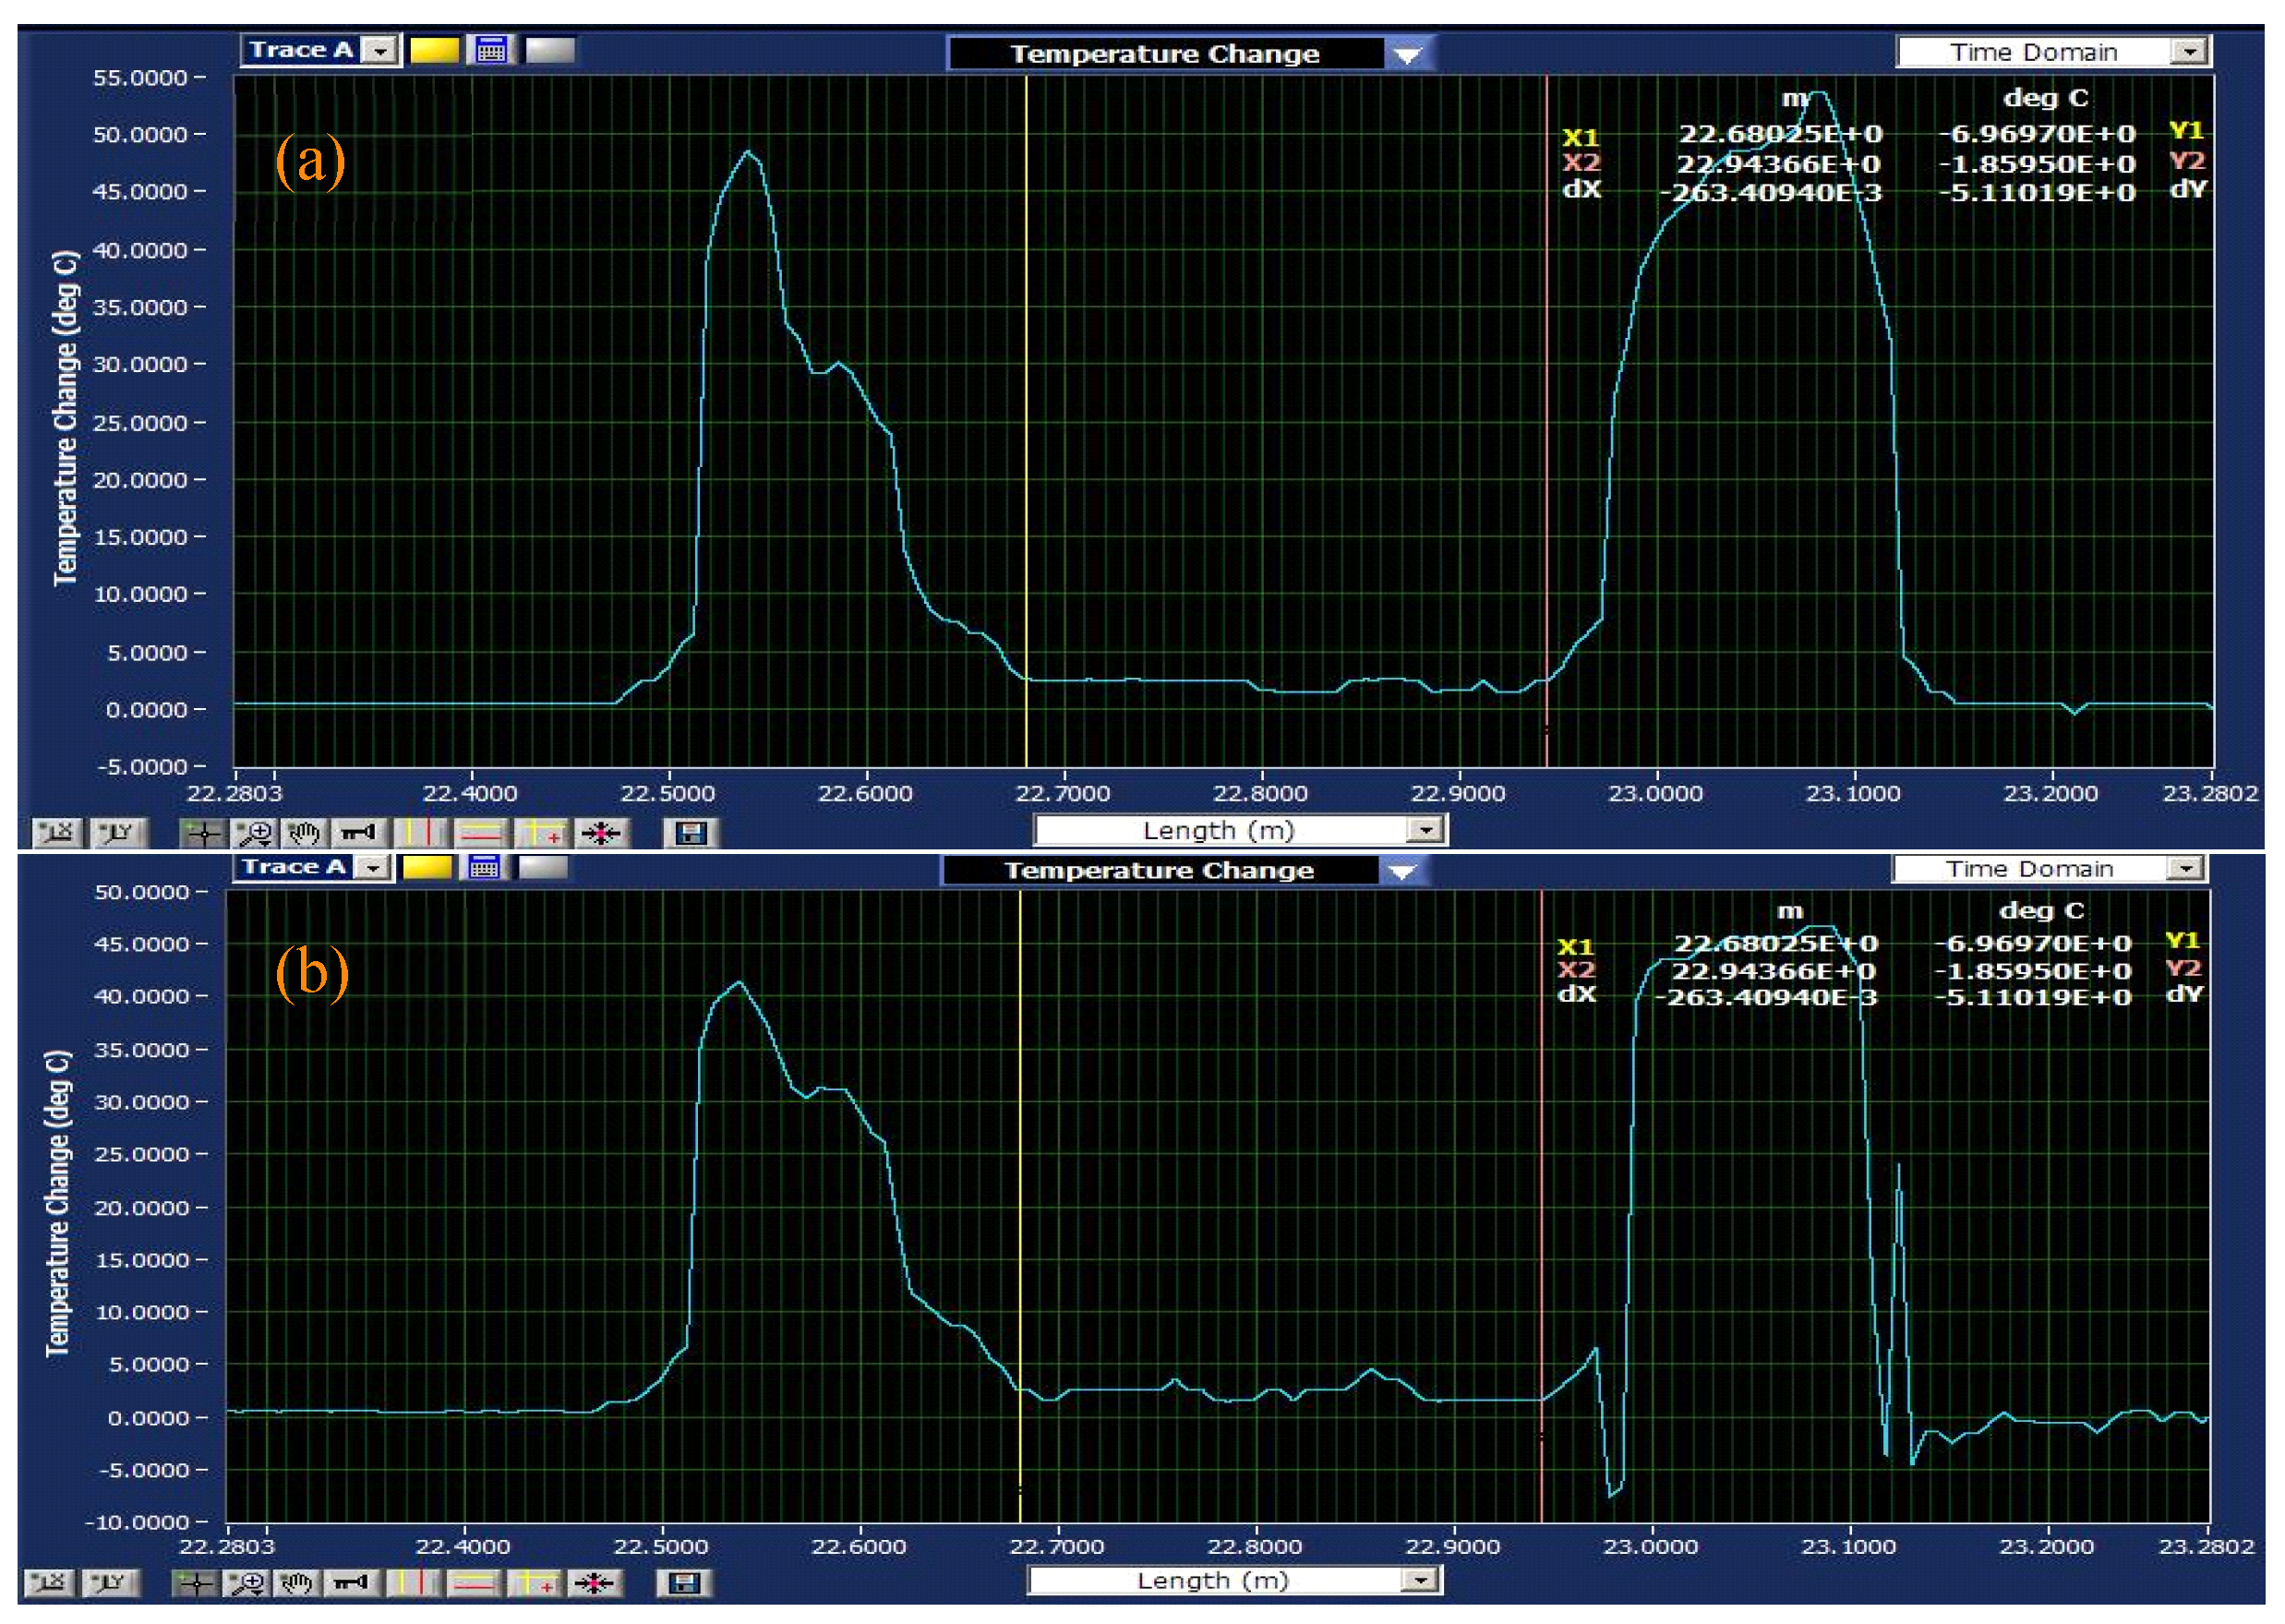
The sensing optical fiber is arranged in a U shape and fixed on the scale surface to measure two liquid levels. When a 400 mA current was applied, the heated fiber generated a temperature contrast greater than the vibration noise, so the water–air interface could be identified whether the vibrator was activated or not, as shown in Figure 7.
Figure 7.
Water level measured by sensing fiber: (a) Vibrator off; (b) vibrator on.
The experimental results indicate that, with OBR4400 as the origin and a liquid-level range of 22.68 m to 22.94 m, the temperature of the fiber below the water surface remains virtually unchanged when the fiber is heated. The noise peak generated by the vibrator at the 23.12 m position of the fiber reaches approximately 25.0 °C, whereas the temperature increase in the fiber segment above the liquid level reaches about 50.0 °C—significantly higher than the noise peak. Thus, under high-frequency vibration, the liquid-level sensing fiber continues to provide accurate water-level measurements.
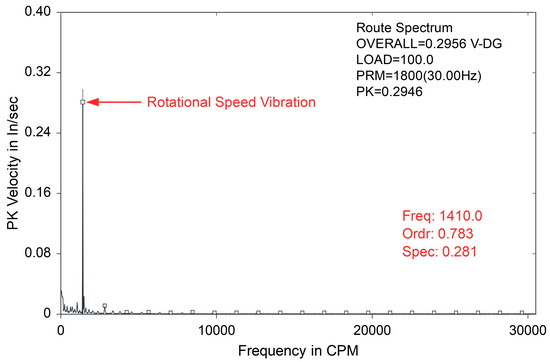
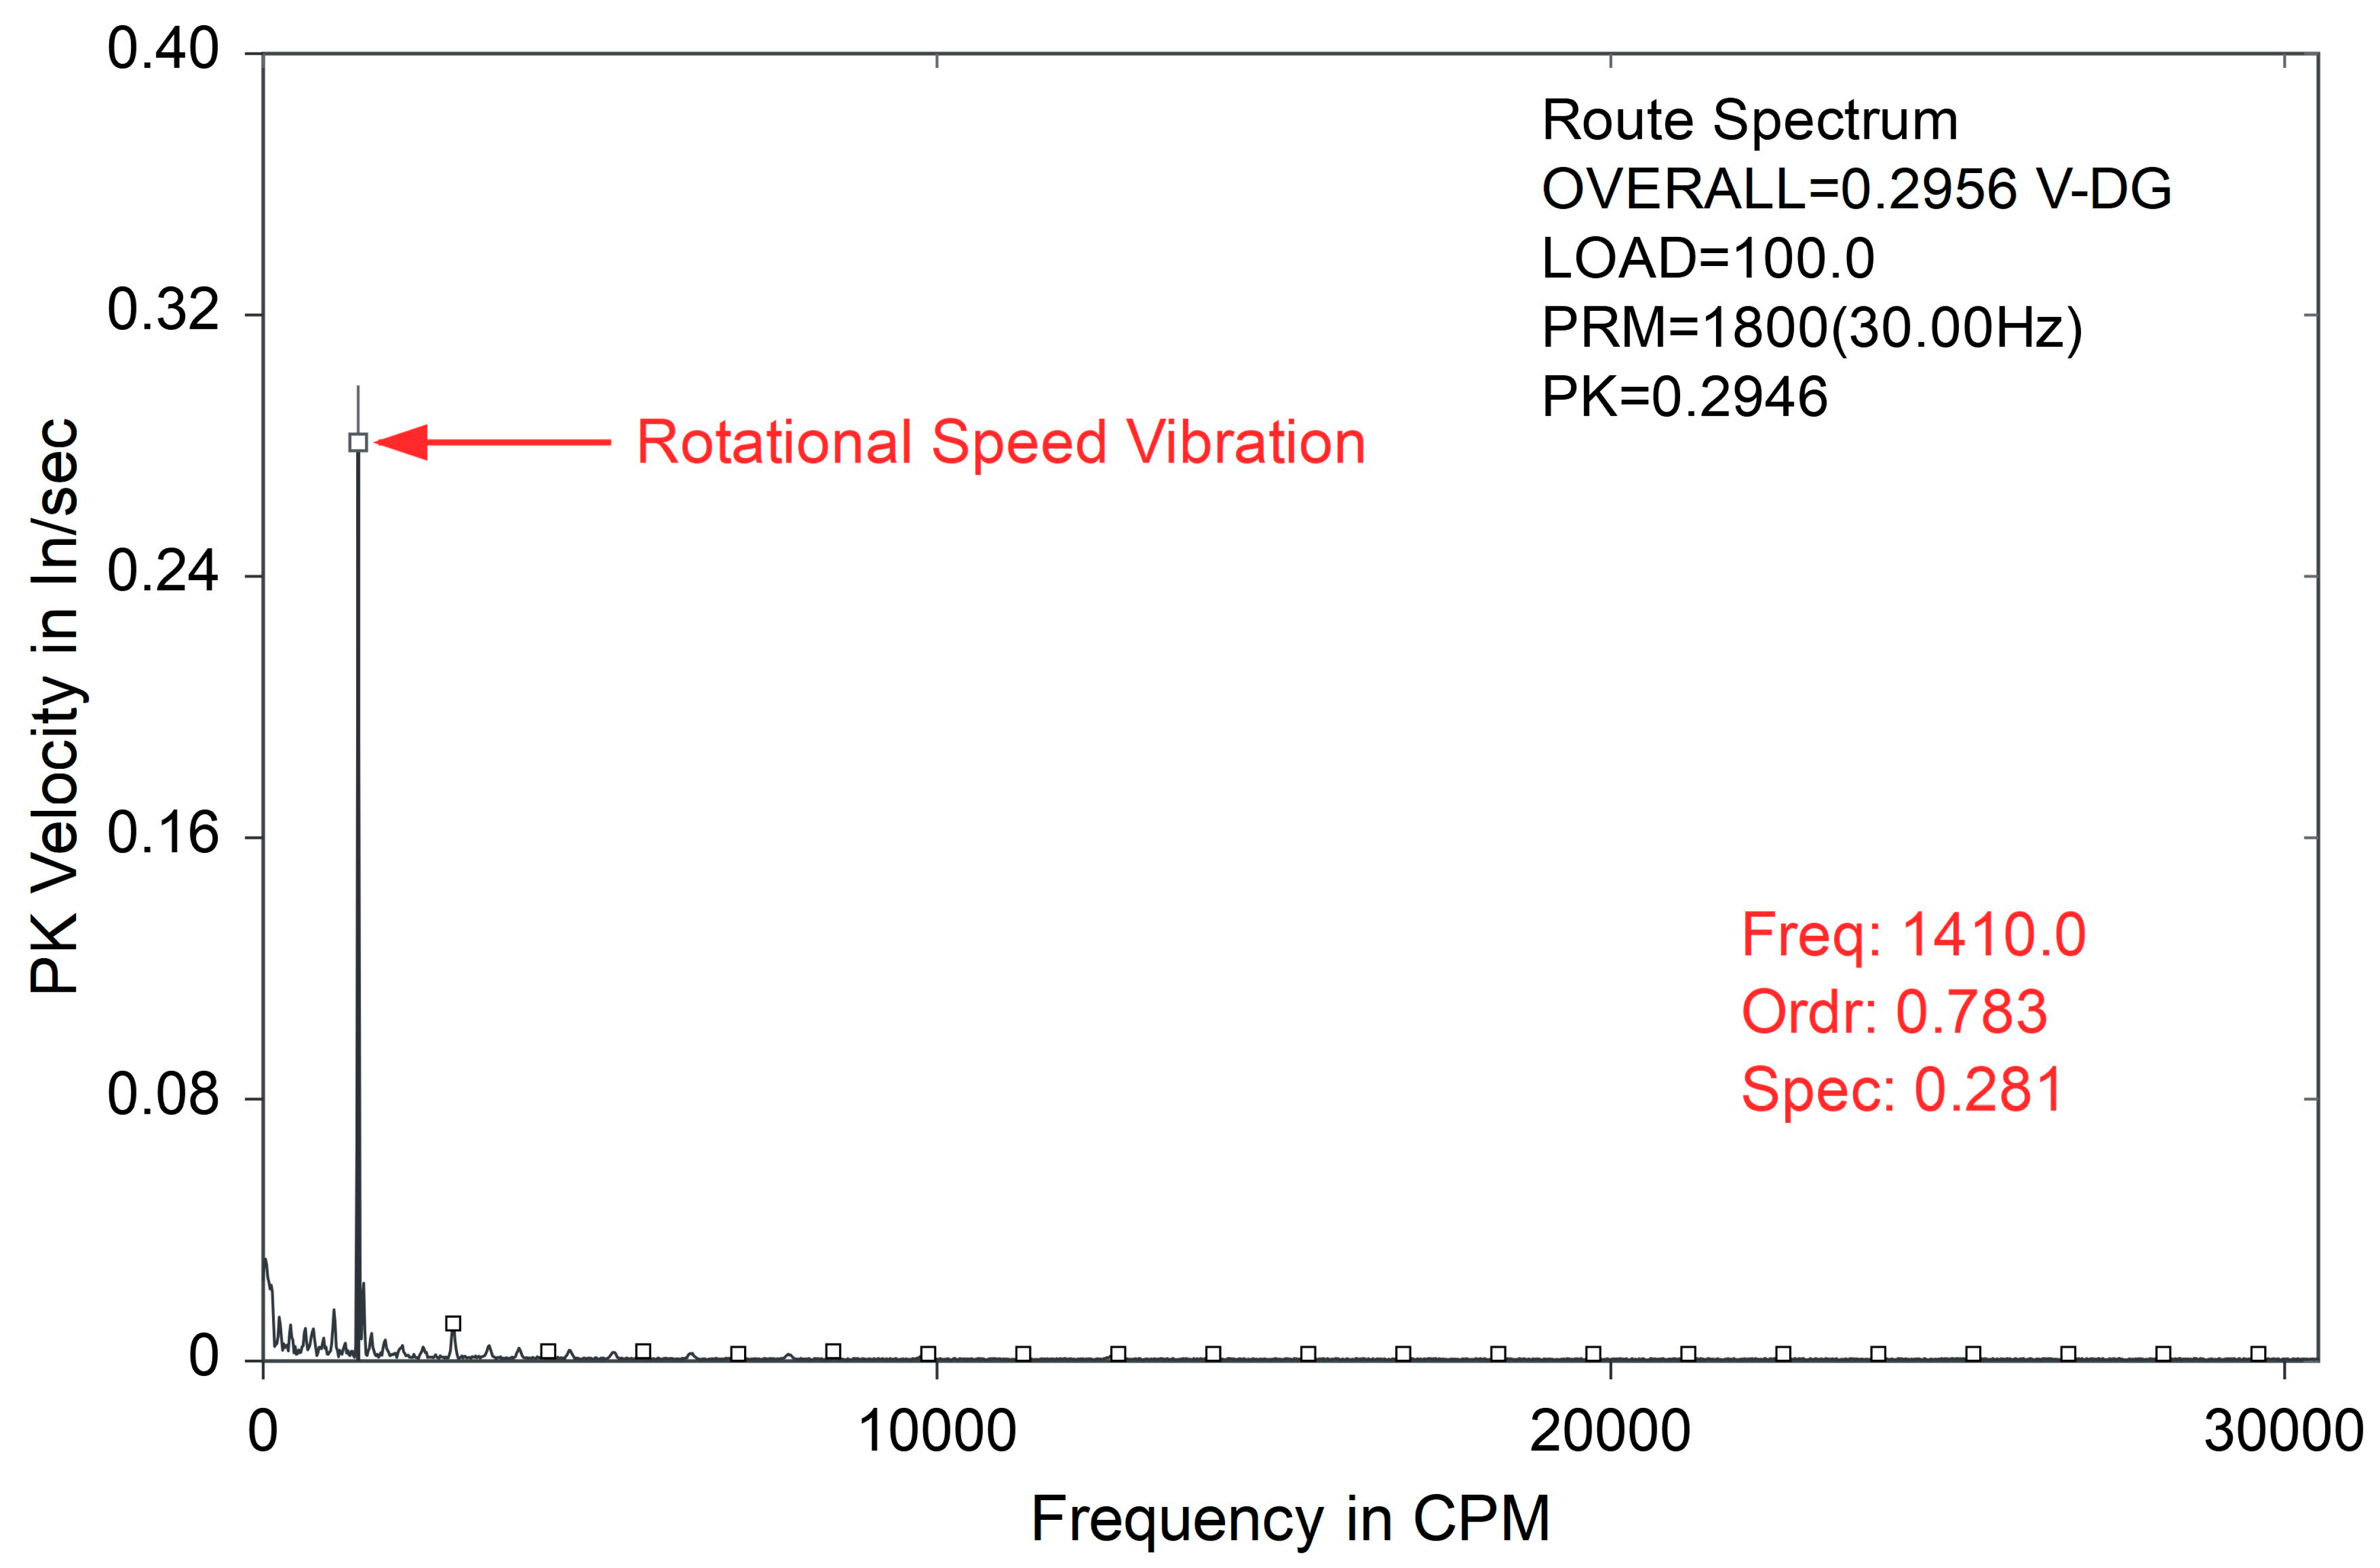
Further research was conducted on the effects of intermediate-frequency vibration on fiber-optic sensors. Water-level measurements were performed on an operating automotive engine, with a 0.6 m long fiber-optic cable installed on a ruler submerged in a bucket; the ruler served as a control reference for water-level measurement. To analyze the vibration spectrum of the operating engine, a vibration analyzer model CSI2120 from Emerson Process Control Co., Ltd. was used. Figure 8 shows the vibration spectrum at the contact point between the bucket and the engine surface, exhibiting a peak velocity of 0.281 in/s (7.1374 mm/s) and a frequency of 1410.0 CPM (cycles per minute), equivalent to 23.5 Hz.
Figure 8.
Vibration pattern of the contact position between the bucket and the engine surface.
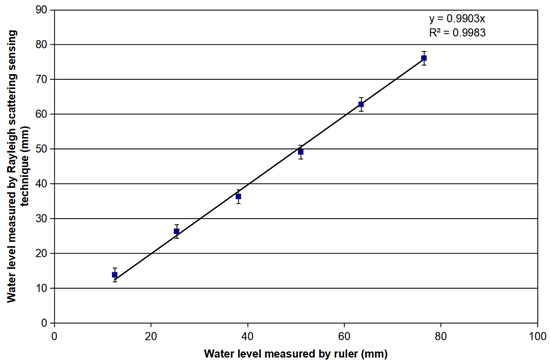
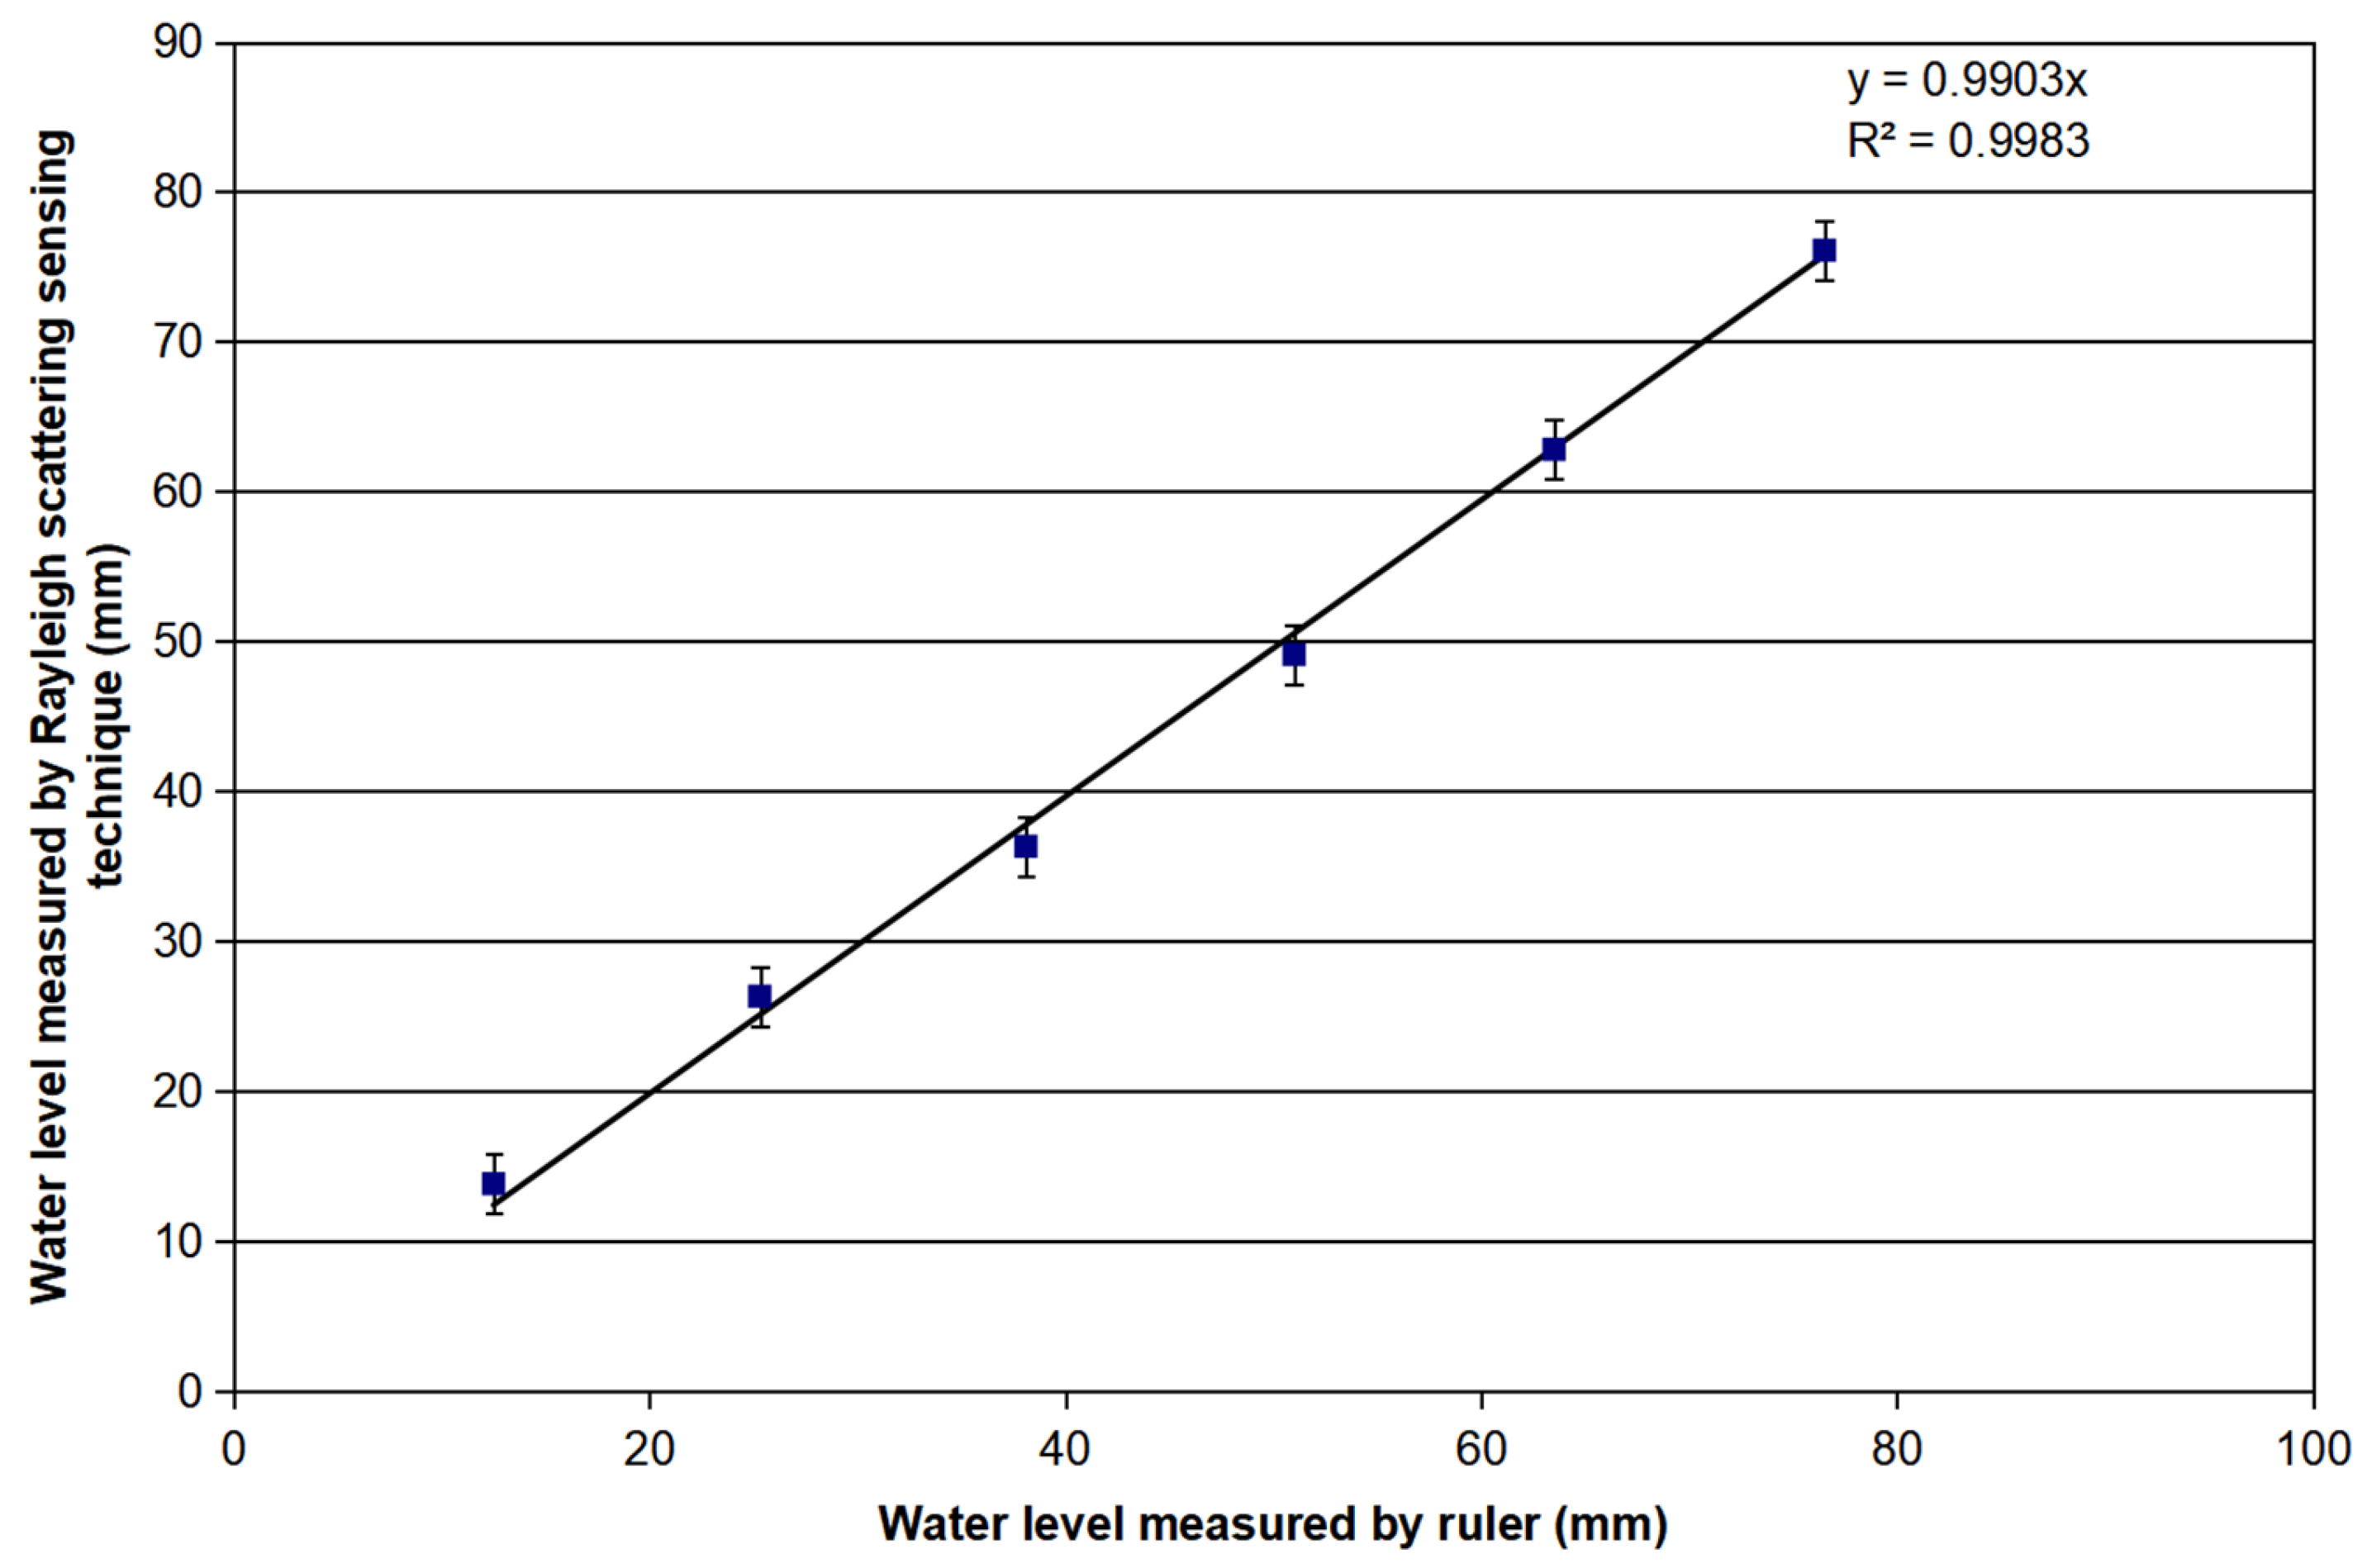
A current of 400 mA was applied to the alloy wire, and measurements were repeated across six distinct liquid levels. Figure 9 presents the numerical correlation between scale readings and measurement results from the fiber-optic sensor, with a linear fitting coefficient k = 0.9903 and a correlation coefficient R2 = 0.9983. Relative to the ruler measurements, the six C-OFDR measurements yielded an MAE of 1.183 mm, an RMSE of 1.303 mm, and a maximum absolute error of 1.900 mm.
Figure 9.
Linear fitting of water-level measurement simultaneously using the optical fiber sensor and ruler under the influence of engine vibration.
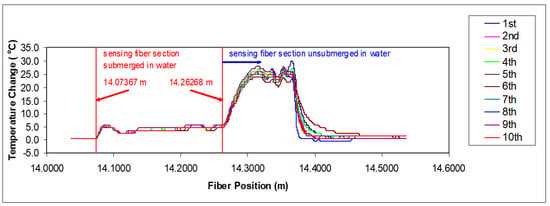
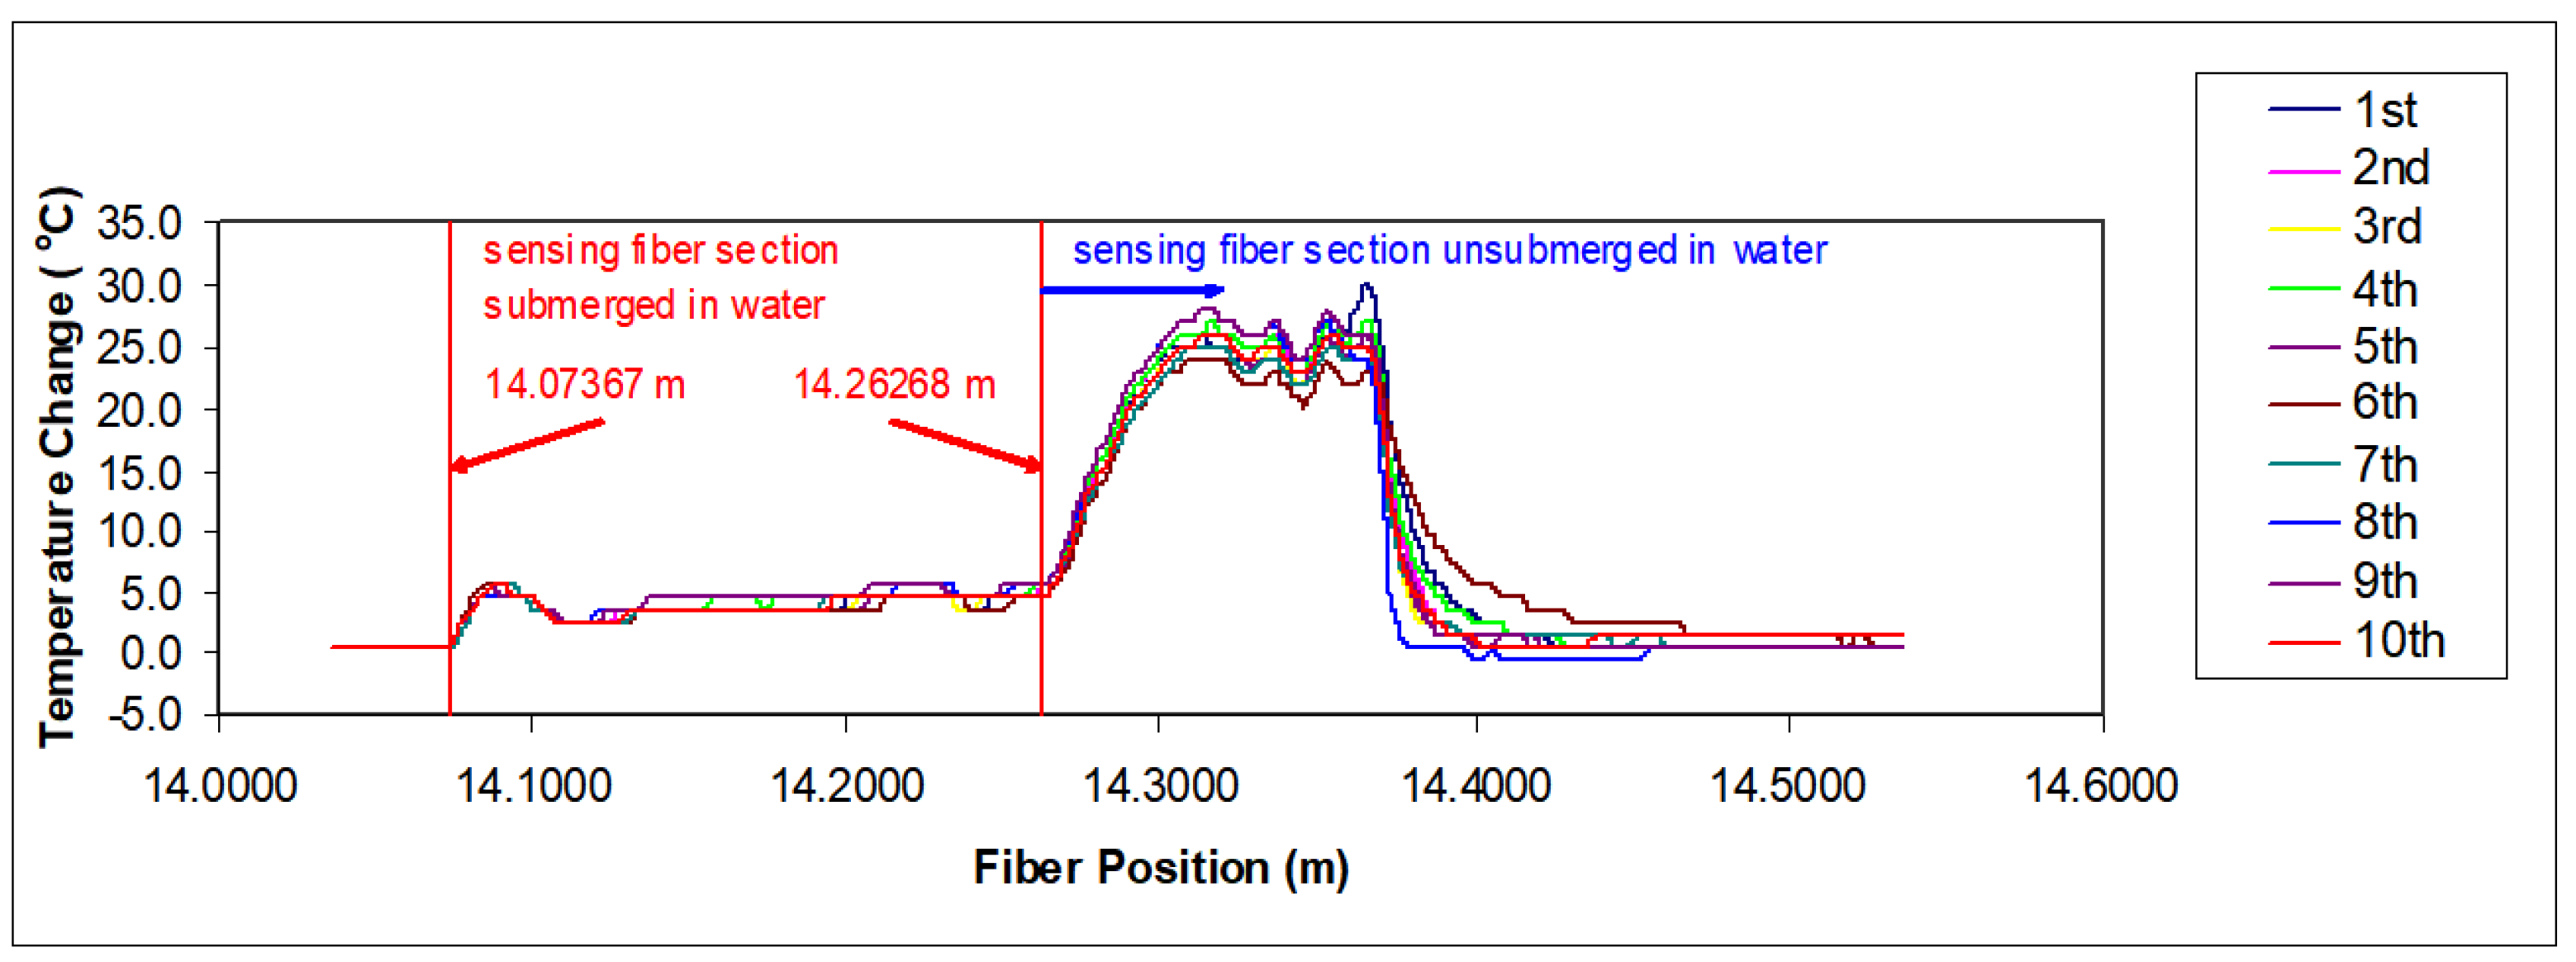
Fiber-optic level sensors can only be practically applied if they exhibit good repeatability; therefore, repeatability experiments must be conducted for verification. In the repeatability test, the fiber sensor length was approximately 0.35 m, connected via a ~14 m SMF-28 fiber to the OBR4400 signal processing unit. A 300 mA current was applied to the alloy wire to heat the fiber. The experimental procedure followed the same protocol as our previous water-level measurements, and we performed ten repeated measurements at 10 min intervals.
The repeatability results are presented in Figure 10, where the sensing fiber covered the range from 14.07 to 14.40 m. Despite slight temperature variations during the ten consecutive measurements, the detected water–air interfaces, indicated by the red vertical lines, remained tightly clustered. For the first interface, the mean detected position was 14.07367 m, with a standard deviation of 0.103 mm, a range of 0.334 mm, and a maximum absolute deviation from the mean of 0.178 mm. For the second interface, the corresponding values were 14.26268 m, 0.091 mm, 0.282 mm, and 0.158 mm, respectively. These results confirm strong repeatability for the tested water-level configuration, while performance under cryogenic boiling and thermal-shock conditions requires separate verification.
Figure 10.
Repeatability test results of alloy wire heating sensing fiber.
For comparison, the optically heated-fiber sensor reported in [24] achieved a 20 cm active measurement range with a spatial resolution of 1 cm. In the present experiments, the OBR4400 remotely interrogated an approximately 0.4 m active fiber-optic probe through approximately 63 m of passive SMF-28 lead fiber, demonstrating its remote interrogation capability. The system also achieved stable and repeatable interface detection, with the heated-interface signal remaining clearly distinguishable under the tested medium- and high-frequency vibration conditions.
Under the same temperature rise, a smaller current produces less heat and causes less disturbance to the liquid. Reducing the fiber radius can lower the required current, and more robust packaging can further improve electrical safety. That said, the sensor’s performance in harsher cryogenic environments still needs further verification. The cost advantage of the method mainly refers to the simple fiber probe and sensing cable; the total system cost is still strongly affected by the commercial C-OFDR interrogator.
4. Discussion
The principal experimental result is that a controlled thermal transition can be located using a bonded SMF-28/Ni-Cr probe after an approximately 63 m passive optical lead. The present work provides an incremental evaluation of a conventional SMF-28 fiber bonded to a separate enameled heater wire, alongside an explicit derivative-based interface identification rule and a quantitative assessment of the configuration’s performance limits.
Distributed DPP-BOTDA with a self-heated high-attenuation fiber [24] and FBG-array temperature profiling [13] represent viable alternative sensing architectures. However, differences in their sensing mechanisms, active sensing lengths, interrogation methods, and calibration procedures mean that their reported performance metrics cannot be directly applied to the C-OFDR probe described in this work.
The measured interface coordinate at approximately 64 m demonstrates the system’s remote interrogation capability, rather than indicating a 64 m active level measurement range. Only approximately 0.4 m of the liquid-nitrogen probe was actively heated, while the remaining ~63 m functioned as a passive lead fiber. At a drive current of 200 mA, the measured wire resistance corresponds to a linear heating power of 0.886 W/m, yielding a total power of approximately 0.35 W for the active-probe section. Power consumption thus scales linearly with continuously heated length; extending this design to a 70 m active length would require approximately 62 W, which could cause unacceptable boil-off rates in closed cryogenic tanks. Compared with the integrated Cu-coated fiber reported in [25], the external heater wire design allows the use of standard SMF-28 fiber and independent selection of heater specifications, but introduces additional variability from adhesive contact, as well as added requirements for thermal mass management, robust packaging, and electrical insulation. Long-range deployment of this design would therefore require segmented heating, intermittent excitation schemes, or a fundamentally different heater architecture. The room-temperature water tests provide only secondary evidence that the heated-interface signature remained distinguishable under the specified mechanical excitation conditions. Because these tests were conducted in water, they do not validate sensor performance under cryogenic boiling, thermal shock, liquid splashing, or sloshing conditions.
Several open questions remain for future work. No long-term drift testing was performed in this study, so sensor drift over extended operation remains unquantified. A controlled cryogenic step test is required to measure the combined thermal and C-OFDR response time; repeated measurement runs are needed to enable statistical analysis of repeatability and measurement uncertainty. Boil-off rates and power consumption should be characterized as functions of drive current and active heated length, followed by dedicated vibration and sloshing tests in cryogenic media. Finally, the current materials, insulation components, feedthroughs, and current source require dedicated compatibility, fault tolerance, ignition safety, and tank-standard qualification before any deployment with liquid oxygen or liquid hydrogen.
5. Conclusions
This study analyzed the sensing principle of an electrically heated Rayleigh C-OFDR liquid-level sensor, developed a bonded SMF-28/Ni-Cr wire probe, and evaluated interface stability and repeatability. Differential cooling of the submerged and vapor-exposed probe sections produced an axial temperature-equivalent transition, which was located using the maximum absolute gradient. In liquid nitrogen, an approximately 0.4 m active probe was interrogated through an approximately 63 m passive lead. Ten quasi-static readings yielded k = 0.9732, R2 = 0.9998, an MAE of 0.251 mm, and a maximum absolute error of 0.630 mm relative to a ruler. Tests at 200 Hz and approximately 23.5 Hz, together with ten repeated water profiles, showed stable and repeatable interface identification under the tested room-temperature conditions. Cryogenic vibration, dynamic response, long-term drift, extended active-probe power, strain–temperature separation, and qualification for liquid oxygen or liquid hydrogen remain subjects for future work.
Author Contributions
Conceptualization, X.C.; methodology, X.W.; validation, X.C., writing—review and editing, X.C. and X.W. All authors have read and agreed to the published version of the manuscript.
Funding
This work was supported by the Scientific and Technological Research Project of the Hubei Provincial Department of Education (grant no. B2023495), and the Research Projects of Wuhan Technical University (grant nos. 2024YK040, 2025YK036), and the National Natural Science Foundation of China (grant no. 41476153).
Data Availability Statement
The original contributions presented in this study are included in the article. Further inquiries can be directed to the corresponding author.
Conflicts of Interest
The authors declare no conflicts of interest.
References
- Chang, Z.; Sheng, Q.; Xu, Y.; Hou, L.; Yang, J.; Zhang, Y.; Liu, Z. Large sensitivity-range product of liquid level enabled by constrained multimode interference. Chin. Opt. Lett. 2026, 24, 031201. [Google Scholar] [CrossRef] [Scilit]
- Liu, Z.; Fan, Q.; Liu, J.; Zhou, L.; Zhang, Z. Robust intelligent monitoring and measurement system toward downhole dynamic liquid level. Sensors 2024, 24, 3607. [Google Scholar] [CrossRef] [Scilit] [PubMed]
- Yin, B.; Gevorgyan, H.; Onural, D.; Zhang, B.; Khilo, A.; Popovic, M.A.; Stojanovic, V.M. A fully packaged cryogenic optical transmitter directly interfaced with a superconducting chip. Nat. Electron. 2026, 9, 78–83. [Google Scholar] [CrossRef] [Scilit]
- Zhang, S.; Ren, Y.; Du, Y.; Zheng, J.; Deng, Z. Dynamic liquid nitrogen level detection of cryostats onboard the HTS maglev vehicle. IEEE Trans. Appl. Supercond. 2019, 29, 9000704. [Google Scholar] [CrossRef] [Scilit]
- Bondarenko, V.L.; Ilyinskaya, D.N.; Kazakova, A.A.; Kozlovtsev, P.S.; Lavrov, N.A.; Razenko, E.A. Application of liquid hydrogen in hydrogen engines and fuel cells. Chem. Pet. Eng. 2022, 57, 1033–1037. [Google Scholar] [CrossRef] [Scilit]
- Jimeno, M.M.; Vaughan, J.T.; Geethanath, S. Superconducting magnet designs and MRI accessibility: A review. NMR Biomed. 2023, 36, e4921. [Google Scholar] [CrossRef] [Scilit] [PubMed]
- Nawaz, W.; Olewski, T.; Vechot, L. Assessment and validation of evaporation models for cryogenic liquids. Process Saf. Environ. Prot. 2019, 121, 50–61. [Google Scholar] [CrossRef] [Scilit]
- Li, Y.; Wu, S.; Jin, T.; Lei, G. Experimental study on the performance of capacitance-type meters for slush nitrogen measurement. Exp. Therm. Fluid Sci. 2017, 88, 103–110. [Google Scholar] [CrossRef] [Scilit]
- Xu, D.-S.; Liu, H.-B.; Luo, W.-L. Development of a novel settlement monitoring system using fiber-optic liquid-level transducers with automatic temperature compensation. IEEE Trans. Instrum. Meas. 2018, 67, 2214–2222. [Google Scholar] [CrossRef] [Scilit]
- Patel, R.; Bisht, L.K.; Kesavaraja, C.; Sengottuvel, S. A feasibility study on non-contact liquid nitrogen level measurement in laboratory settings using machine learning-driven ultrasonic system. Int. J. Inf. Technol. 2025, 17, 3213–3220. [Google Scholar] [CrossRef] [Scilit]
- Schieb, D.J.; Haberbusch, M.S.; Yeckley, A.J. Cryo-Tracker mass gauging system testing in a large-scale expendable launch vehicle LOX tank simulator. Proc. SPIE 2006, 6222, 622206. [Google Scholar] [CrossRef] [Scilit]
- Zhao, B.; Xu, Y.; Zhang, Y.; Shen, S.; Tang, C.; Liu, X.; Fang, G. A split-type FMICW-based guided wave radar with multisegmental probe for liquid level measurement. IEEE Sens. J. 2022, 22, 9397–9407. [Google Scholar] [CrossRef] [Scilit]
- Barone, F.; Signorini, A.; Ntibarikure, L.; Fiore, T.; Di Pasquale, F.; Oton, C.J. Fiber-optic liquid level sensing by temperature profiling with an FBG array. Sensors 2018, 18, 2422. [Google Scholar] [CrossRef] [Scilit] [PubMed]
- Preloznik, B.; Gleich, D.; Donlagic, D. All-fiber, thermo-optic liquid level sensor. Opt. Express 2018, 26, 23518–23533. [Google Scholar] [CrossRef] [Scilit] [PubMed]
- Wang, Y.; Yan, G.; Lian, Z.; Wu, C.; He, S. Liquid-level sensing based on a hollow core Bragg fiber. Opt. Express 2018, 26, 21656–21663. [Google Scholar] [CrossRef] [Scilit] [PubMed]
- Wang, T.; Liu, B.; Zhao, L.; Mao, Y.; Ren, J.; Zheng, J. High-sensitivity liquid level sensor based on the balloon-shaped fiber optic MZI. IEEE Photonics J. 2022, 14, 6821007. [Google Scholar] [CrossRef] [Scilit]
- Halendy, M.; Sielska, A.; Ertman, S. Scalable sensors of refractive index and liquid level based on multimode interference in small-core hollow core fiber. Measurement 2025, 248, 116977. [Google Scholar] [CrossRef] [Scilit]
- Shi, J.; Xu, Z.; Li, X.; Bai, H.; Guo, C.; Niu, P.; Yao, J. A high-resolution liquid-level sensor based on Fabry-Perot interferometer with fiber laser intracavity sensing. IEEE Sens. J. 2023, 23, 16938–16943. [Google Scholar] [CrossRef] [Scilit]
- He, R.; Teng, C.; Kumar, S.; Marques, C.; Min, R. Polymer optical fiber liquid level sensor: A review. IEEE Sens. J. 2022, 22, 1081–1091. [Google Scholar] [CrossRef] [Scilit]
- Nascimento, K.P.; Frizera-Neto, A.; Marques, C.; Leal-Junior, A.G. Machine learning techniques for liquid level estimation using FBG temperature sensor array. Opt. Fiber Technol. 2021, 65, 102612. [Google Scholar] [CrossRef] [Scilit]
- Vanegas-Tenezaca, E.; Galarza, M.; Dauliat, R.; Jamier, R.; Roy, P.; Lopez-Amo, M. High resolution liquid level measurement using a multisection interferometer based on capillary fibers. J. Light. Technol. 2024, 42, 6540–6546. [Google Scholar] [CrossRef] [Scilit]
- Judez, A.; Leandro, D.; Perez-Herrera, R.A.; Galarza, M.; Lopez-Amo, M. High sensitivity fiber-optic liquid level sensor using biconical tapered fibers. In Proceedings of the 26th International Conference on Optical Fiber Sensors (OFS 2018), Lausanne, Switzerland, 24–28 September 2018; p. Paper TuE45. [Google Scholar] [CrossRef] [Scilit]
- Wang, S.; Yang, Y.; Zhang, L.; Mohanty, L.; Jin, R.-B.; Wu, S.; Lu, P. High-precision fiber optic liquid level sensor based on fast Fourier amplitude demodulation in a specific range of spectrum. Measurement 2022, 187, 110326. [Google Scholar] [CrossRef] [Scilit]
- Zhang, H.; Cheng, Y.; Wu, K.; Yuan, Z.; Dong, Y. Liquid-level sensing method based on differential pulse-width pair Brillouin optical time-domain analysis and a self-heated high attenuation fiber. Appl. Opt. 2020, 59, 795–799. [Google Scholar] [CrossRef] [Scilit] [PubMed]
- Chi, X.; Wang, X.; Ke, X. Optical fiber-based continuous liquid level sensor based on Rayleigh backscattering. Micromachines 2022, 13, 633. [Google Scholar] [CrossRef] [Scilit] [PubMed]
- Ashfaq, A.; Chen, Y.; Jia, F.; Yao, K.; Yu, J.; Cheng, Y. Attenuation investigation influenced by the temperature and strain in an optical fiber composite low voltage cable. Opt. Express 2021, 29, 12696–12711. [Google Scholar] [CrossRef] [Scilit] [PubMed]
- Savovic, S.; Kovacevic, M.S.; Bajic, J.S.; Stupar, D.Z.; Djordjevich, A.; Zivanov, M.; Drljaca, B.; Simovic, A.; Oh, K. Temperature dependence of mode coupling in low-NA plastic optical fibers. J. Light. Technol. 2015, 33, 89–94. [Google Scholar] [CrossRef] [Scilit]
- Chen, T.; Wang, Q.; Chen, R.; Zhang, B.; Lin, Y.; Chen, K.P. Distributed liquid level sensors using self-heated optical fibers for cryogenic liquid management. Appl. Opt. 2012, 51, 6282–6289. [Google Scholar] [CrossRef] [Scilit] [PubMed]
- Chi, X.; Ke, X.; Xu, W. Optical fibre liquid sensor for cryogenic propellant mass measurement. Electron. Lett. 2019, 55, 278–280. [Google Scholar] [CrossRef] [Scilit]
- Ding, Z.; Guo, H.; Liu, K.; Hua, P.; Zhang, T.; Li, S.; Liu, J.; Jiang, J.; Liu, T. Advances in distributed optical fiber sensors based on optical frequency-domain reflectometry: A review. IEEE Sens. J. 2023, 23, 26925–26941. [Google Scholar] [CrossRef] [Scilit]
- Kreger, S.T.; Rahim, N.A.A.; Garg, N.; Klute, S.M.; Metrey, D.R.; Beaty, N.; Jeans, J.W.; Gamber, R. Optical frequency domain reflectometry: Principles and applications in fiber optic sensing. Proc. SPIE 2016, 9852, 98520T. [Google Scholar] [CrossRef] [Scilit]
- Soller, B.J.; Gifford, D.K.; Wolfe, M.S.; Froggatt, M.E. High resolution optical frequency domain reflectometry for characterization of components and assemblies. Opt. Express 2005, 13, 666–674. [Google Scholar] [CrossRef] [Scilit] [PubMed]
Disclaimer/Publisher’s Note: The statements, opinions and data contained in all publications are solely those of the individual author(s) and contributor(s) and not of MDPI and/or the editor(s). MDPI and/or the editor(s) disclaim responsibility for any injury to people or property resulting from any ideas, methods, instructions or products referred to in the content. |
© 2026 by the authors. Licensee MDPI, Basel, Switzerland. This article is an open access article distributed under the terms and conditions of the Creative Commons Attribution (CC BY) license.