


Abstract
Finite-length raster scanning can cause endpoint over-ablation, whereas repeated scanning along a fixed direction can reinforce directional bottom textures. In this study, skywriting-based synchronized gating was combined with four-direction orthogonal cross-hatch scanning to fabricate square micro-holes on 316L stainless steel using a picosecond laser. Scanner acceleration and deceleration occurred outside the target region, and laser output was restricted to the constant-velocity segment. The local height variation at the line start decreased from approximately 8.0 to 1.3 μm. At a nominal processing area of 320 μm × 320 μm and a cumulative count of 140 full-area scans, four-direction scanning produced a bottom-surface Sa of 0.325 μm, 52.3% lower than that obtained by unidirectional raster scanning. It also yielded lower Sa and Sq values than continuous serpentine raster and continuous square-spiral scanning. Increasing the scan count from 84 to 532 increased the machining depth from 22.4 to 135.4 μm, with an approximately linear relationship over the tested range. However, bottom roughness and bottom-area shrinkage increased with depth. These results demonstrate that synchronized gating and directional alternation improve endpoint consistency and average bottom uniformity, while depth extension requires balancing removal depth against bottom quality.
1. Introduction
With the growing demand for miniaturized molds, microfluidic devices and functional surfaces, the fabrication of stainless steel micro-holes with characteristic dimensions ranging from tens to several hundreds of micrometers has become an important topic in precision micromanufacturing. For instance, stainless steel micro-holes serve as microstructure replication units in precision molds, fluid-transport or interconnection features in microfluidic devices, and localized texture elements for regulating surface wettability and interfacial behavior [1,2,3,4]. Since the opening shape, lateral dimensions, depth, and dimensional consistency of micro-holes directly affect replication fidelity, fluid-transport characteristics and functional-surface performance, precise control of micro-hole geometry is essential for ensuring manufacturing accuracy and functional reliability.
To meet these requirements, laser microdrilling has been widely employed for fabricating micro-holes of difficult-to-machine metals, because of its non-contact material removal, broad material applicability and flexible trajectory control [5]. The movement of a focused ultrashort-pulse beam within a specific region of the micro-hole removes material through localized ablation and evaporation, while repeated irradiation under layerwise scanning progressively increases the micro-hole depth [6,7]. Under high pulse overlap and repeated scanning, however, heat accumulation, redeposition, periodic protrusions and nonuniform bottom removal can deteriorate micro-hole geometry and surface quality [6,8]. Accordingly, the effects of pulse energy, repetition rate, scan speed, hatch spacing, cumulative scan count and scanning trajectory on material removal efficiency, geometric accuracy, and surface quality have been extensively investigated [8,9,10,11,12,13,14]. Although parameter and path optimization can improve individual quality indicators, conventional parameter adjustment does not directly address the temporal mismatch between spot motion and laser gating, while repeated raster scanning along a fixed direction may still accumulate directional overlap errors during full-area removal by laser ablation.
In the laser microdrilling of layerwise micro-hole fabrication, each full-area removal stage is constructed from finite-length scan lines. The coordination between laser switching on/off and spot motion at the start and end of each line therefore directly affects the machining quality. At these positions, a galvo scanner must accelerate or decelerate, and its instantaneous velocity differs from the prescribed steady velocity. If laser output remains active during these low-velocity intervals, the pulse number per unit length and spatial pulse overlap increase, leading to local energy concentration, point-like over-ablation, contour expansion, and abrupt depth variations at the scan endpoints. Timing offsets between the laser gate and scanner motion further increase the uncertainty in the effective exposure position. Gafner et al. [15] combined a diffractive beam-splitting element with fully synchronized galvo scanning to realize on-the-fly laser microdrilling with high-rate surface removal, demonstrating the importance of coordinating scanner motion with pulse timing. Garkusha et al. [16] used model-based trajectory predistortion to reduce dynamic tracking errors, achieving a 49.2% reduction in settling time for a 30 μm displacement. This result further demonstrates the influence of scanner dynamics on microscale positioning. Switching-delay compensation, pulse synchronization and skywriting have therefore been proposed to complete scanner transients outside the processing region and confine laser exposure to a stable motion interval [15,16,17]. Because scanner dynamics, controller execution, and laser triggering differ among systems, accurate micro-hole fabrication requires coordination of laser activation and deactivation with the actual spot motion along each target scan line.
At the full-area scanning level, the scanning trajectory determines how line-overlap errors and local energy fluctuations accumulate within each removal layer, thereby affecting the geometric accuracy and bottom uniformity of the micro-hole. Repeated parallel scanning in a fixed direction accumulates hatch-overlap errors and removal nonuniformity along the same orientation, resulting in directional grooves and height undulations. Daniel et al. [10] investigated angular hatching in layerwise picosecond-laser ablation and showed that varying the hatch angle between adjacent layers reduced the surface roughness by a factor of approximately 2.0–3.5, yielding an Sa of 0.82 μm. This finding demonstrated that interlayer trajectory overlap directly affects the machined bottom. Alternating hatch angles, rotating scan directions, spiral paths and other optimized algorithms can redistribute repeated textures and improve average bottom uniformity [10,11,12,13]. In contrast, continuous serpentine raster and square-spiral trajectories reduce the number of laser switching events, but require the spot to repeatedly traverse reversals or sharp corners. The associated local deceleration can again increase pulse density and lead to excessive removal [16]. Therefore, a direct comparison at a common nominal size and cumulative scan count is required to evaluate the effects of continuous-path scanning and raster scanning constructed from individually gated line segments on micro-hole morphology and bottom quality.
Despite these advances, uniform layerwise removal involves two distinct requirements: controlling local over-ablation at individual scan endpoints and preventing fixed-direction textures from accumulating during repeated full-area scanning. Suppressing endpoint over-ablation prevents local crater formation, but it cannot mitigate the directional groove accumulation caused by repetitive hatch overlap. Conversely, rotating scan trajectories without gating synchronization still leaves severe edge defects. For square micro-holes with lateral dimensions of several hundred micrometers on 316L stainless steel, the combined use of skywriting-based synchronized gating and scan-direction alternation therefore requires systematic evaluation in terms of endpoint morphology, overall morphology, and bottom quality under consistent processing and measurement conditions. It is also necessary to establish how machining depth, bottom roughness, and bottom-area shrinkage evolve as the cumulative scan count increases.
In this work, a picosecond laser direct-writing system was constructed and jointly controlled using a Power PMAC CK3M programmable multi-axis motion controller (OMRON, Kyoto, Japan). A skywriting-based synchronized gating strategy was implemented by accelerating and decelerating the scanner outside the target region and enabling effective laser output only within the constant-velocity segment. On this basis, a four-direction orthogonal cross-hatch strategy was adopted, in which the full-area scan direction was rotated clockwise by 90° between successive passes. Its performance was compared with unidirectional raster, continuous serpentine raster, and continuous square-spiral scanning. Confocal measurements were used to evaluate endpoint height variations, micro-hole bottom roughness, and overall morphology. The effects of cumulative scan count on machining depth, bottom-area shrinkage, and bottom quality were further investigated. The objective was to implement and systematically validate a processing strategy that combines synchronized endpoint energy control with four-direction scan alternation for stable direct writing of square micro-holes on 316L stainless steel.
2. Materials and Methods
2.1. Materials and Experimental System
Commercial mirror-polished 316L stainless-steel specimens with a thickness of 2 mm were used. Before and after laser processing, the specimens were ultrasonically cleaned in deionized water to remove surface contaminants and loosely attached ablation products. All experiments were conducted at room temperature under ambient atmosphere.
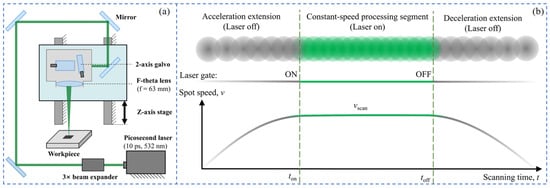
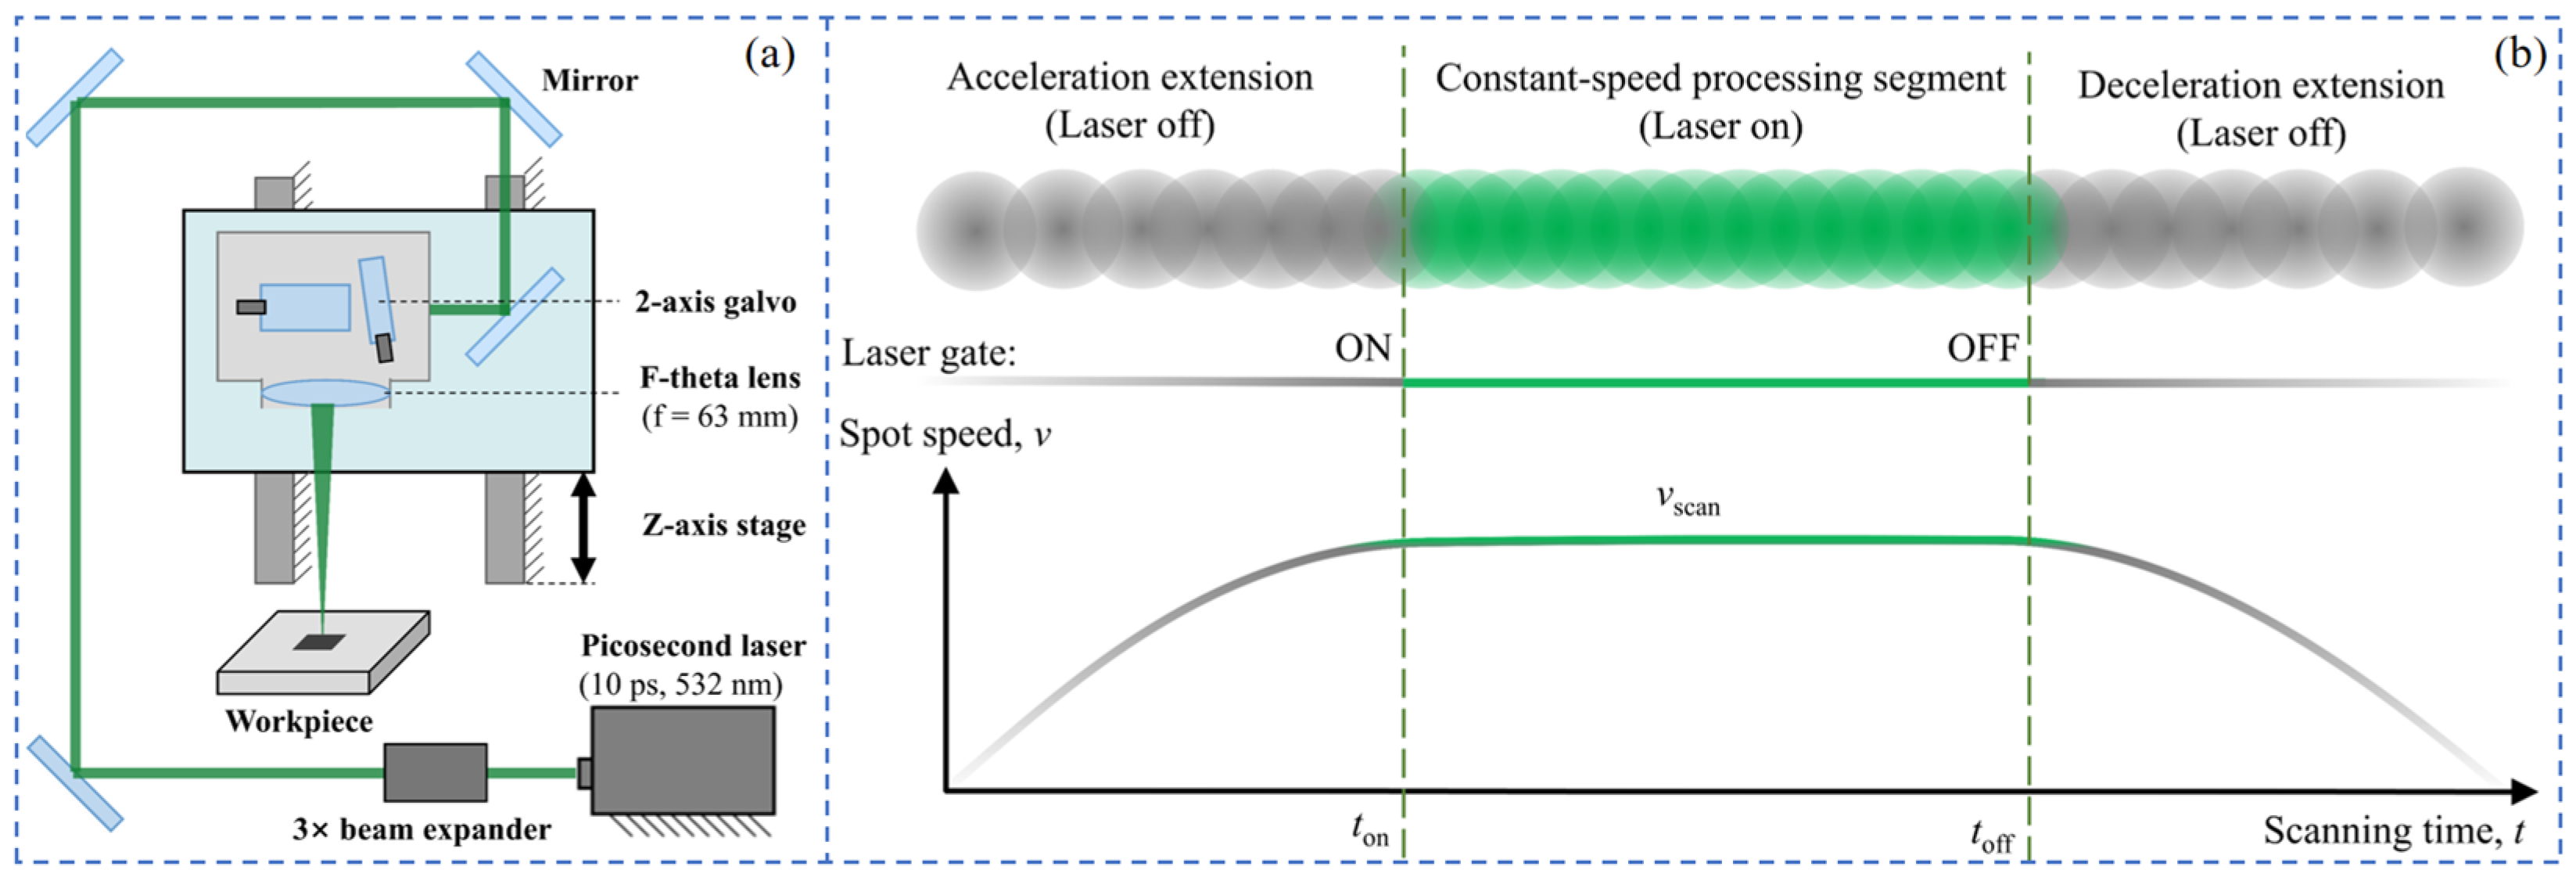
A custom-built picosecond laser direct-writing system was used, as schematically illustrated in Figure 1a. The laser source was a water-cooled Huaray picosecond pulsed laser (Huaray Laser, Wuhan, China) operating at a wavelength of 532 nm, with a pulse duration of 10 ps, a maximum average power of approximately 29.1 W, and a base repetition-rate range of 400 kHz–2 MHz. During the experiments, the base repetition rate was set to 400 kHz, the frequency-division factor was 1, and the external analog power-control voltage was fixed at 4 V. According to the factory calibration data, the average power and single-pulse energy at 400 kHz and full-scale output were 18.0 W and 45.0 μJ, respectively. The beam diameter measured 65 cm from the laser output was 1.76 mm, and the beam-quality factors were Mx2 = 1.034 and My2 = 1.040. The laser output was linearly polarized with a polarization ratio greater than 100:1. After threefold beam expansion, the beam diameter D was approximately 5.28 mm. The beam was then directed into a SCANLAB hurrySCAN two-dimensional galvo scanner (SCANLAB, Puchheim, Germany) and focused onto the specimen through an F-theta lens with a focal length fL of 63 mm. Using the mean beam-quality factor M2 = 1.04, the diffraction-limited focal-spot diameter d0 was calculated to be 8.41 μm, corresponding to a beam-waist radius w0 of 4.20 μm. The calculated Rayleigh length was 100.29 μm, giving a depth of focus of 200.58 μm.
Figure 1.
Picosecond laser direct-writing system and synchronized gating principle. (a) Schematic of the laser processing system. (b) Schematic of the laser gate and spot-speed relationship during a finite-length scan.
The specimen was mounted on a Z-axis translation stage, which, together with the two-dimensional galvo scanner, formed a three-axis platform for layerwise processing. Scanner motion, Z-axis feed, and laser gating were jointly executed by a CK3M motion controller. The controller synchronously recorded the commanded position, actual position, actual velocity, and gate state of the scanner, enabling identification of the effective processing interval and verification of the programmed scan sequence.
2.2. Synchronized Gating During Constant-Velocity Motion
During a finite-length linear scan, the laser spot accelerates at the beginning and decelerates at the end. At a constant repetition rate f, the pulse number per unit length approximately follows nl = f/v, where v is the actual scan velocity. If the laser remains active during acceleration or deceleration, the local pulse spacing decreases, and the overlap ratio increases, leading to excessive energy deposition near the scan endpoints. To confine material removal in the target region to the constant-velocity segment, a synchronized gating method was adopted, in which scanner acceleration and deceleration occurred outside the target processing region.
As shown in Figure 1b, the scanner first accelerated along a leading auxiliary segment while the laser remained off. Once the spot entered the constant-velocity segment, the controller activated the gate and the laser interacted with the material only along the target line. After the spot crossed the target endpoint, the laser was switched off, and the scanner decelerated along a trailing auxiliary segment. Gray spots denote laser-off motion, whereas green spots and the green gate bar indicate the effective exposure interval. In the single-line comparison, the target line length was 3 mm, the scan speed was 200 mm/s, and each line was repeated 20 times. For the synchronized gating group, a 300 μm auxiliary distance was assigned at each end of the target line. Both groups used the same normalized laser-power coefficient of 0.40.
Full-area scanning was constructed by superimposing parallel, individually gated scan lines. Independent leading and trailing auxiliary segments were assigned to every line. The effective line length and center position were calibrated for each scan axis and motion direction according to the measured system response, so that the processed regions generated from different scan directions shared a common geometric reference.
2.3. Layerwise Scanning and Characterization of Square Micro-Holes
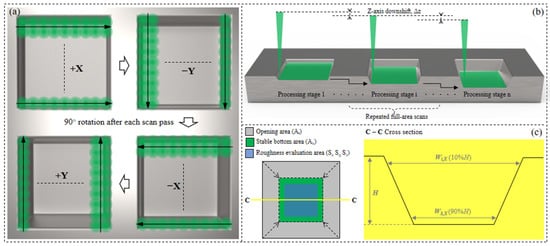
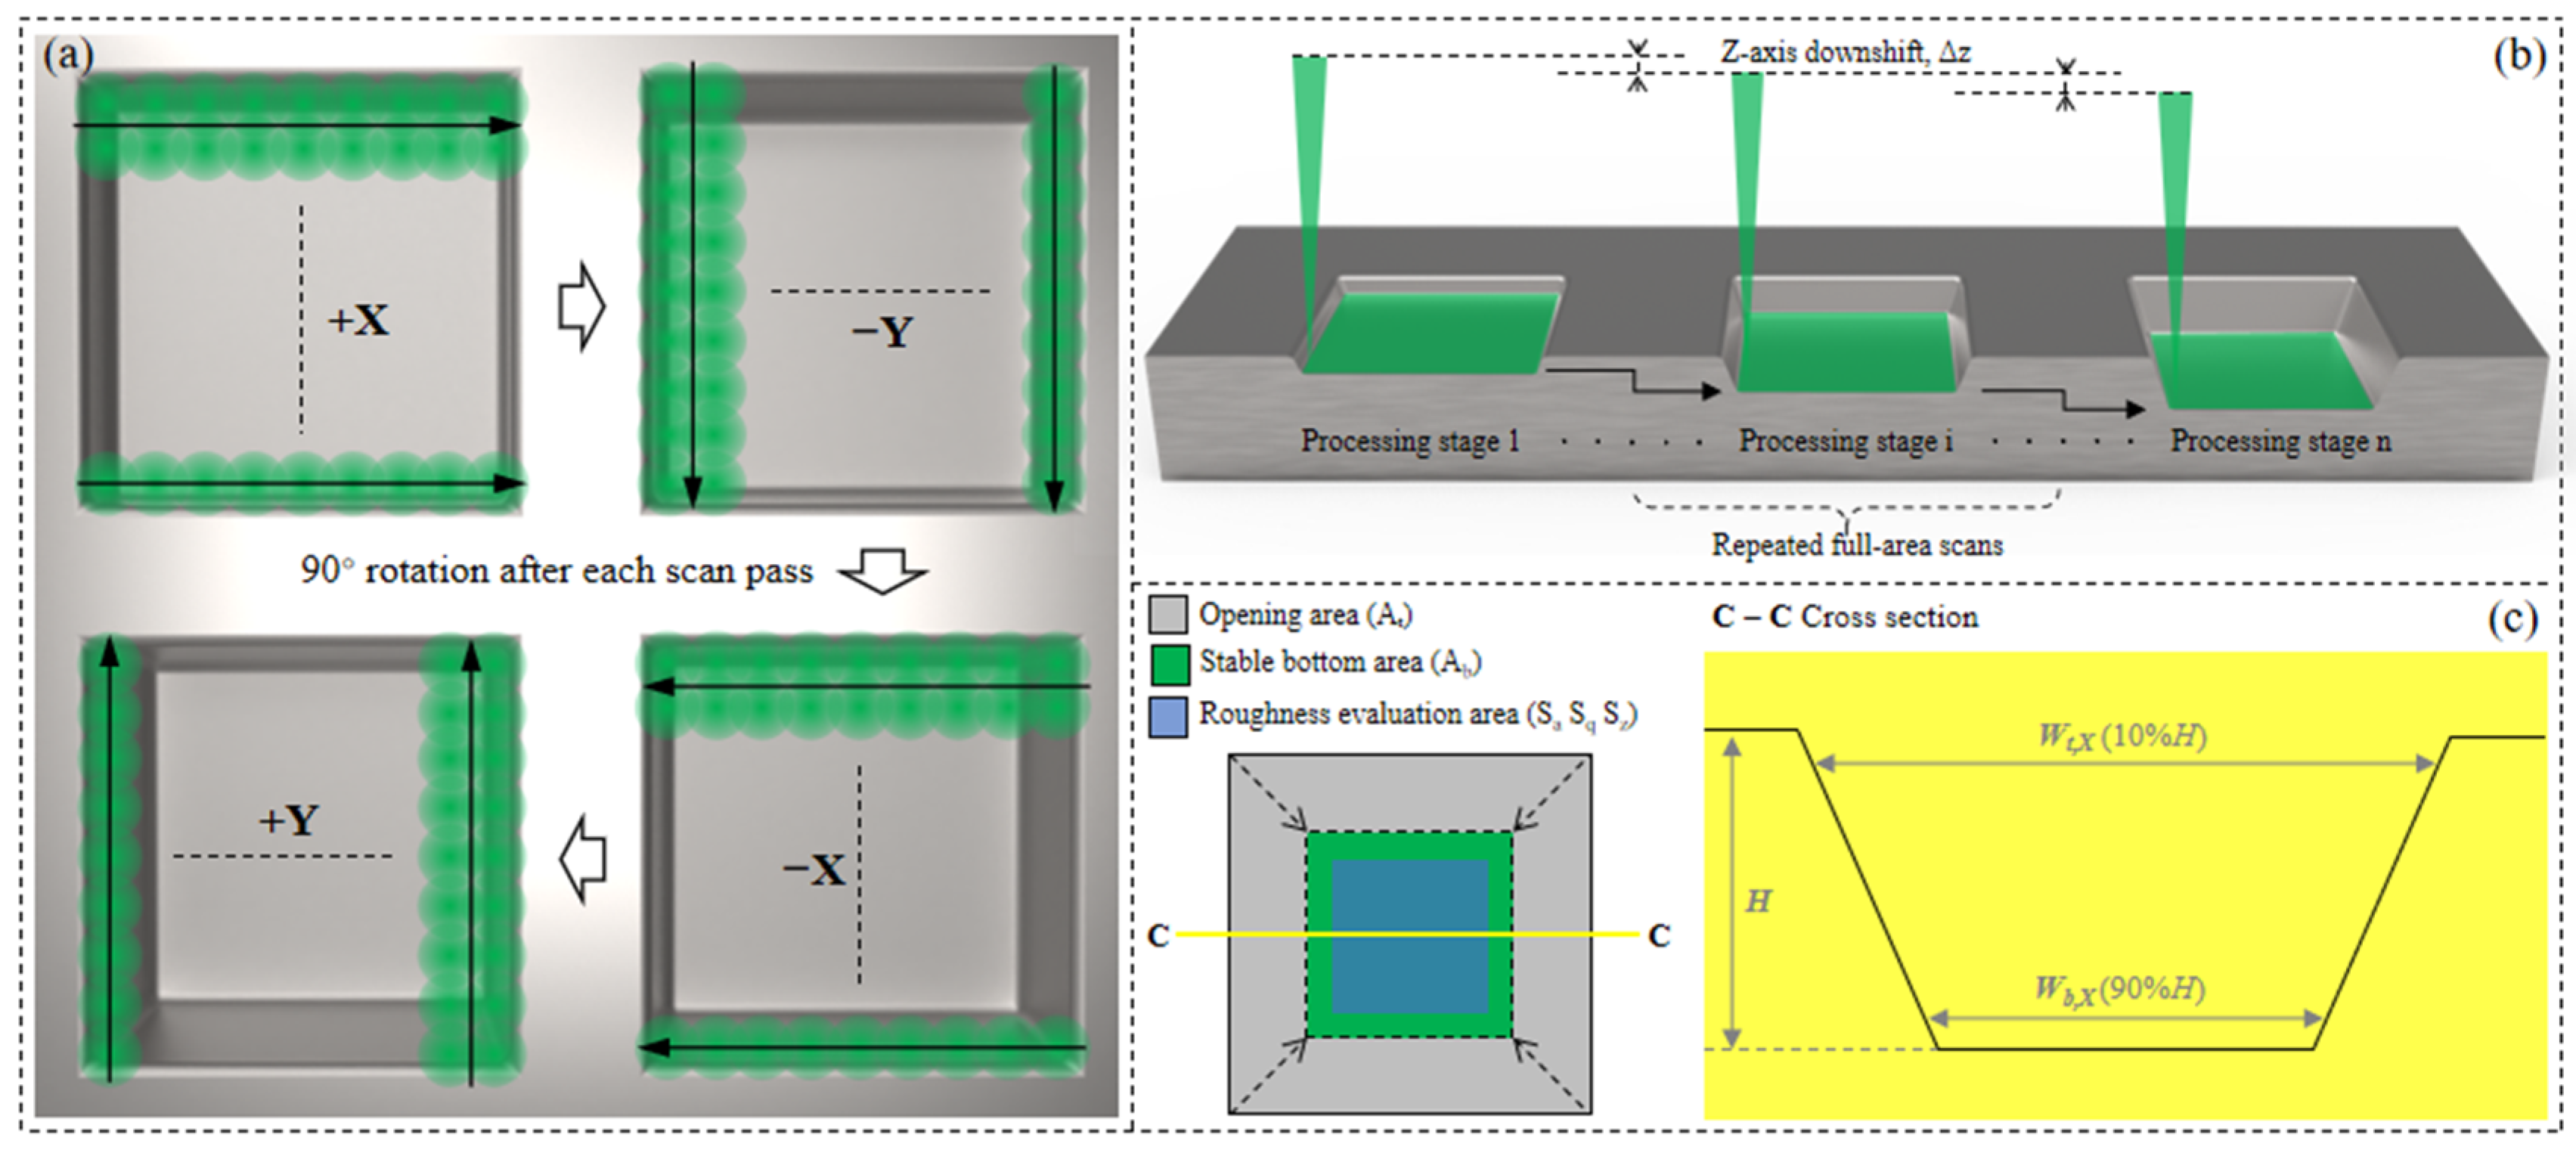
The layerwise scanning and characterization procedure is summarized in Figure 2. Within each processing stage, a four-direction orthogonal cross-hatch strategy was used, as illustrated in Figure 2a. Although synchronized gating suppresses excessive energy deposition at the endpoints of an individual line, repeated raster scanning in one direction still accumulates hatch-overlap errors and removal nonuniformity along the same orientation. After each full-area scan, the subsequent scan direction was rotated clockwise by 90°, and four successive full-area scans formed one complete rotation cycle. This directional alternation changed the dominant hatch orientation between adjacent scans, thereby redistributing fixed-direction textures and balancing energy deposition over the two-dimensional area.
Figure 2.
Layerwise scanning and characterization of square micro-holes. (a) Four-direction orthogonal cross-hatch scanning within one processing stage. (b) Repeated full-area scanning and Z-axis downshift between successive processing stages. (c) Definitions of the opening area, stable bottom area, roughness evaluation area, machining depth, and characteristic widths.
In this study, square micro-holes refer to blind square holes fabricated by layerwise laser ablation. The nominal opening size was 320 μm. Because the dynamic responses of the X and Y axes differed between their positive and negative directions, direction-specific effective scan lengths and center-position corrections were obtained experimentally. The full-area scan speed was 100 mm/s, the actual spacing between adjacent lines was approximately 5.45 μm, and a 300 μm auxiliary travel distance was assigned at both ends of every discrete scan line. For the trajectory comparison, the planned processing area was 320 μm × 320 μm for all groups.
The layer-to-layer transition is illustrated in Figure 2b. Deeper square micro-holes were fabricated by combining layerwise full-area scanning with focal-plane translation. After the prescribed number of full-area scans was completed at each Z position, the Z axis was displaced by 2 μm in the machining-depth direction, and the same scan sequence was repeated at the new focal plane. All trajectory-comparison experiments used 14 Z positions with a Z-step of 2 μm and a cumulative full-area scan count of 140. Ten full-area scans were performed at each Z position for the three non-cross-hatch strategies, whereas eight and twelve scans were alternated between successive Z positions for four-direction orthogonal cross-hatch scanning. The detailed processing routines are summarized in Table 1.
Table 1.
Processing routines used in the scanning-trajectory comparison.
One complete coverage of the target area using a given trajectory was defined as one full-area scan. In four-direction orthogonal cross-hatch scanning, each direction independently completed one full-area scan, and four directions separated by successive 90° rotations formed one complete rotation cycle, corresponding to four full-area scans. The cumulative full-area scan count N was 140 for every trajectory in the comparison experiment. For the raster strategies constructed from discrete scan lines, synchronized gating was applied to each line. During continuous serpentine raster scanning and continuous square-spiral scanning, the laser remained on throughout each full-area trajectory, including the reversal regions and 90° corners. In the depth-evolution experiment, N was increased from 84 to 532.
The characterization definitions are summarized in Figure 2c. The processed micro-hole morphologies were characterized using a laser scanning confocal microscope (VK-9710, KEYENCE, Osaka, Japan). The starting region of a single line was observed with a 100× objective to obtain local intensity images and centerline height profiles. Overall micro-hole morphology and opening dimensions were measured with a 20× objective, whereas local bottom morphology, machining depth, and areal surface roughness were characterized with a 50× objective. For all scanning strategies, roughness was evaluated over rectangular regions of identical area and relative position on the central micro-hole bottom. The sampling regions excluded the sidewalls, edge-transition zones, and obvious edge accumulations. Three independently fabricated micro-holes were evaluated for each processing condition using the same machining parameters and confocal-measurement procedure. The mean values and corresponding sample standard deviations are reported.
The machining depth H was defined as the height difference between the original specimen surface and the stable micro-hole bottom. In the X- and Y-direction profiles, the widths at 10% H and 90% H were denoted by Wt and Wb, respectively, representing the opening size and stable bottom size. To minimize the influence of surface-leveling errors, local edge accumulation, bottom roughness, and isolated height extrema on the measured width values, the two reference positions were shifted inward by 10% H while retaining widths representative of the near-opening and stable-bottom regions. The bottom-area shrinkage ratio ηA was calculated as:
where ηA is the bottom-area shrinkage ratio; Wt,X and Wt,Y are the opening widths measured at 10% H in the X and Y directions, respectively; and Wb,X and Wb,Y are the corresponding stable bottom widths measured at 90% H.
Micro-hole bottom quality was evaluated using the areal roughness parameters Sa, Sq, and Sz. Sa and Sq describe the overall height variation within the sampling area, whereas Sz represents the maximum peak-to-valley height.
3. Results and Discussion
3.1. Endpoint Over-Ablation and Its Suppression by Synchronized Gating
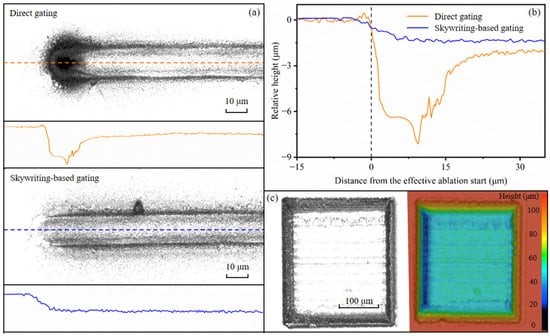
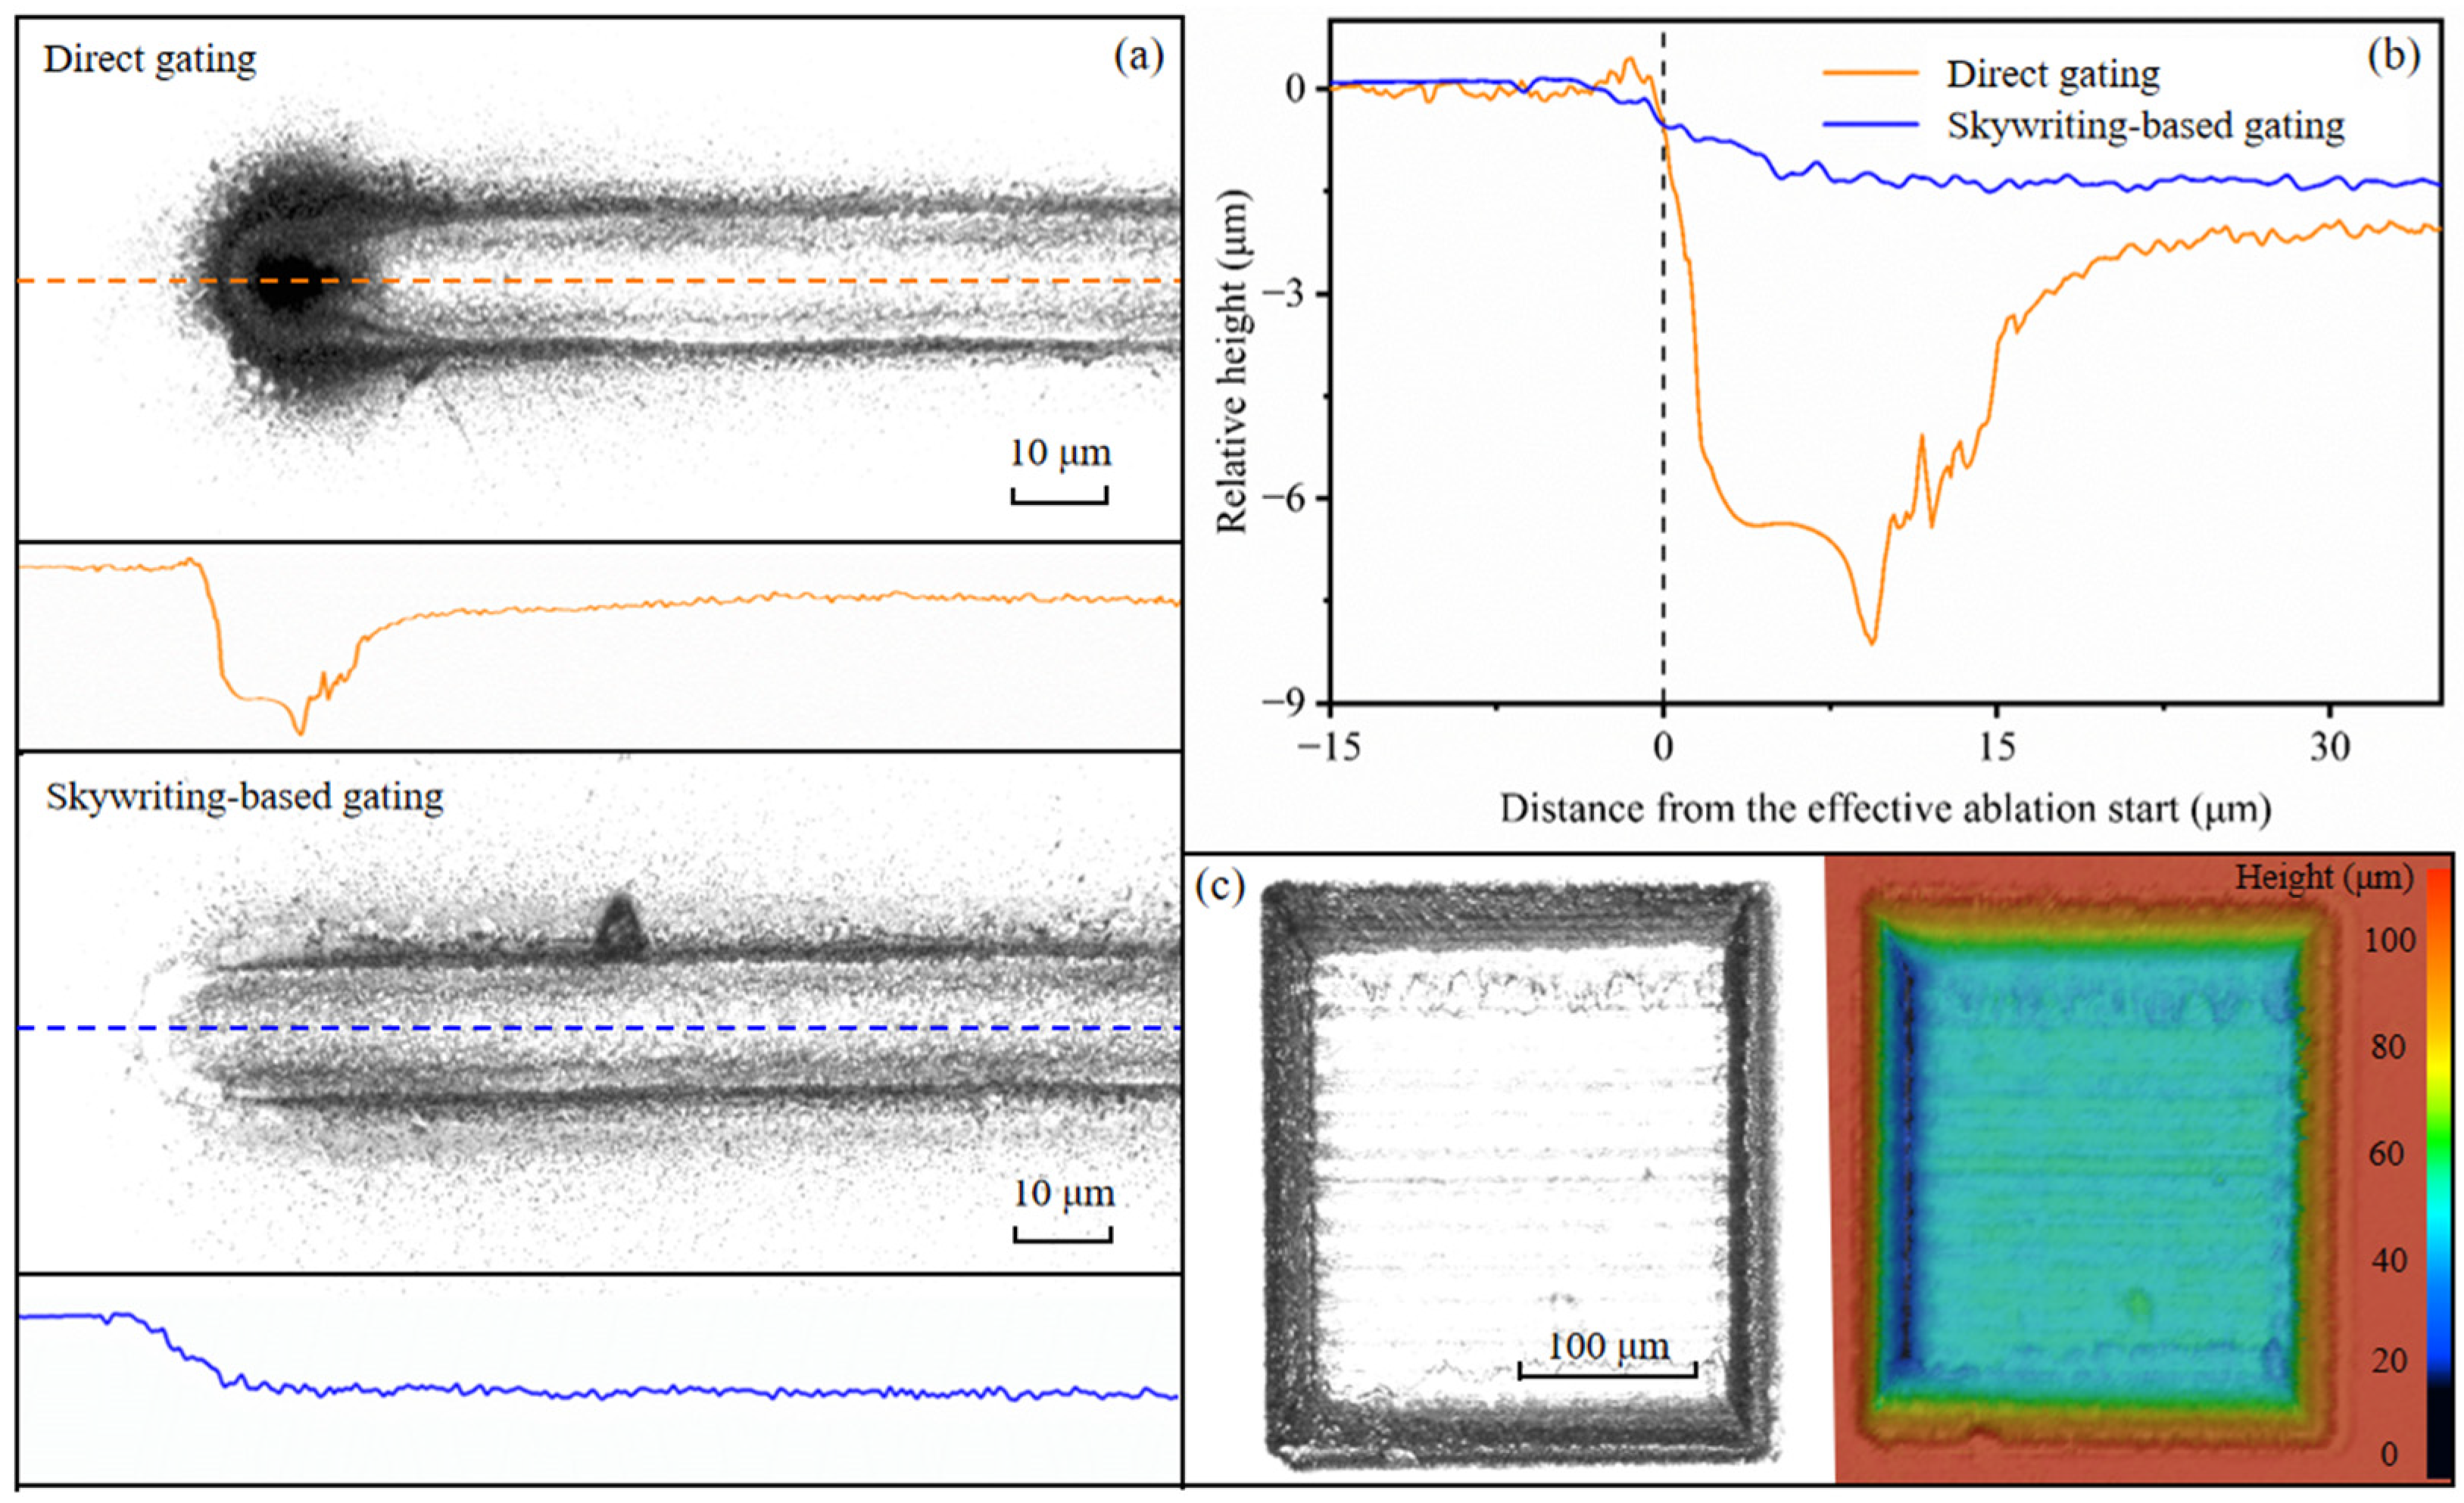
Figure 3a compares the line morphologies and height profiles near the line starts produced by direct gating and synchronized gating. Under direct gating, the effective laser output overlapped with scanner acceleration. At a fixed repetition rate f, the pulse spacing can be approximated by Δs = v/f and the pulse number per unit length by f/v. When the instantaneous velocity v is lower than its steady value, the pulse spacing decreases and the spatial overlap increases. The starting region therefore receives a higher cumulative dose and develops an isolated, deeply ablated zone that is discontinuous from the steady line segment. Similar endpoint over-ablation may occur at the terminal end if laser shutoff overlaps with deceleration. Studies on synchronized galvo scanning and skywriting likewise indicate that scanner transients and trigger timing jointly determine the effective pulse distribution at scan endpoints [15,16,17].
Figure 3.
Processing results obtained by direct gating and synchronized gating. (a) Intensity images and height profiles of lines produced using direct and synchronized gating, arranged from top to bottom. The orange and blue dashed lines indicate the profile-extraction paths for direct gating and synchronized gating, respectively. (b) Comparison of height profiles near the line start under the two gating modes. (c) Intensity and height maps of a square micro-hole produced by line-by-line scanning with direct gating.
Figure 3b shows that, under direct gating, the abnormal region at the line start extended approximately 34.1 μm laterally and exhibited a maximum local height drop of approximately 8.0 μm. With synchronized gating, scanner acceleration was completed outside the target region, and the laser was enabled only along the constant-velocity segment. No isolated deep pit of comparable scale appeared at the line start, and the corresponding height variation was approximately 1.3 μm. Spatially separating low-velocity motion from effective exposure therefore reduced excessive local removal near the scan endpoint.
When direct gating was extended to line-by-line full-area scanning, abnormal endpoint ablation was repeatedly introduced by adjacent hatch lines, forming a continuous over-processed region along the micro-hole edge and bottom, as shown in Figure 3c. The high local dose at the endpoints not only altered individual-line depth but also developed into contour expansion and abrupt bottom-height variations under high-overlap scanning. Endpoint energy control is therefore a prerequisite for uniform full-area removal, and synchronized gating was used for all subsequent full-area scans constructed from discrete line segments.
3.2. Effect of Scanning Trajectory on Micro-Hole Morphology and Bottom Quality
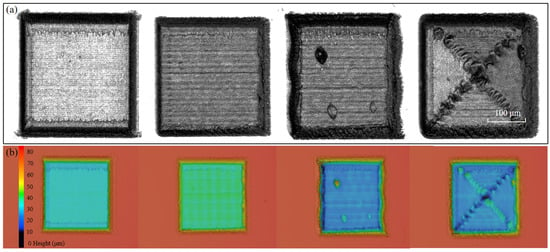
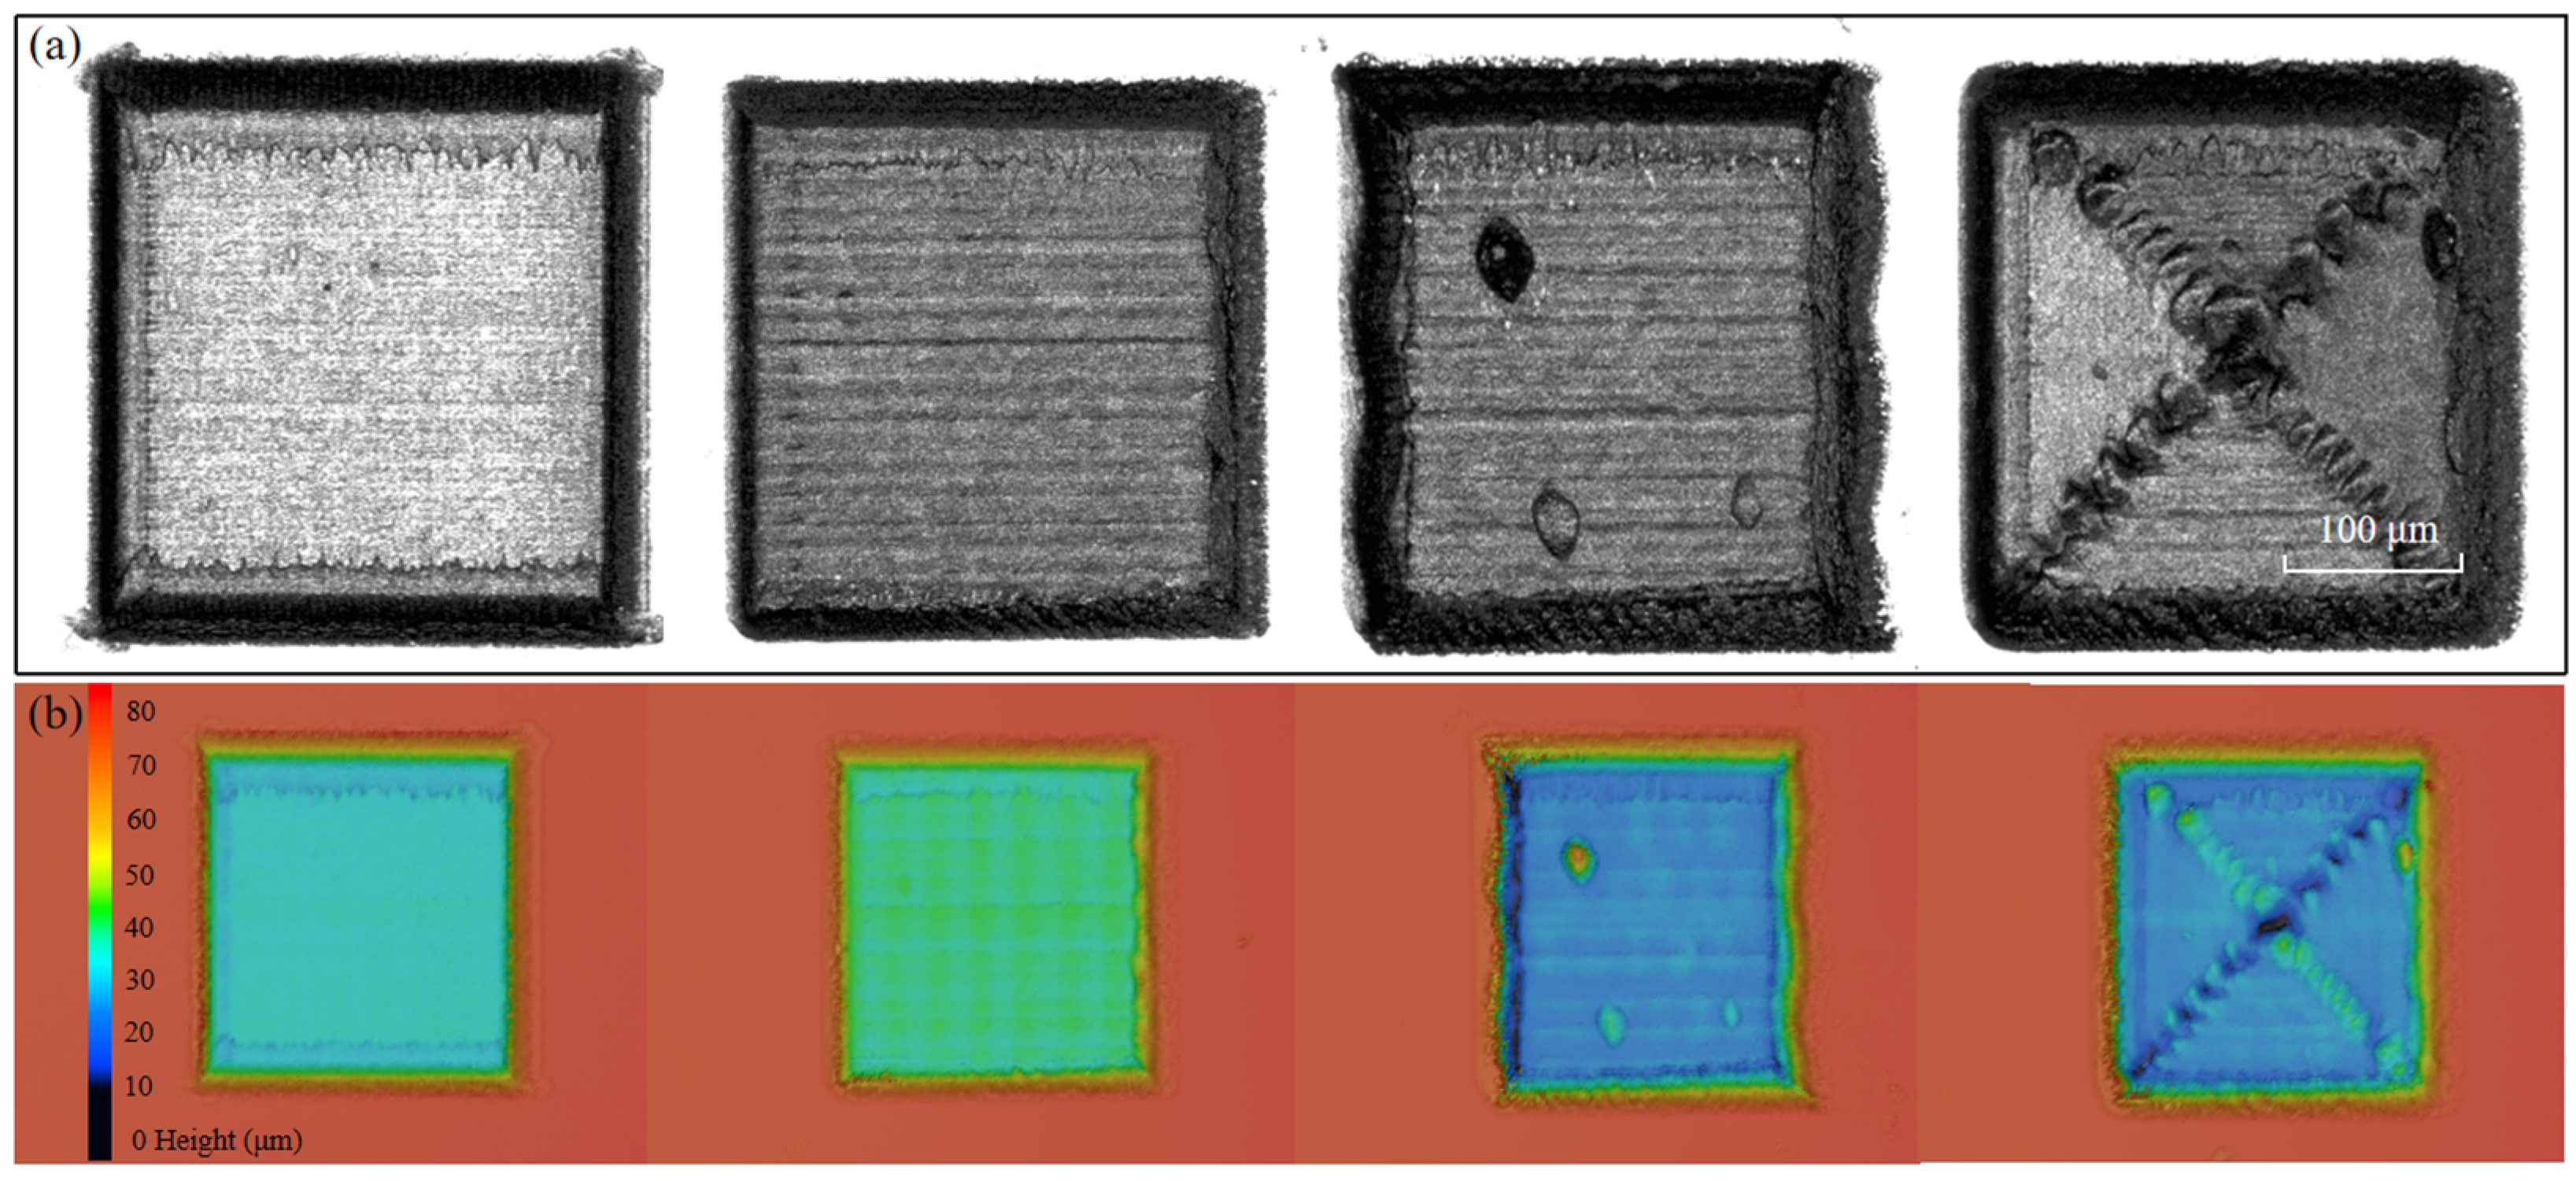
To evaluate whether the proposed combination of line-by-line synchronized gating and scan-direction alternation could reduce bottom defects associated with fixed-direction overlap and velocity variations during turning, four scanning strategies were compared: four-direction orthogonal cross-hatch scanning, unidirectional raster scanning, continuous serpentine raster scanning, and continuous square-spiral scanning. All trajectories were evaluated at the same nominal processing area of 320 μm × 320 μm and a cumulative count of 140 full-area scans, with the comparison focused on overall micro-hole morphology and bottom quality. Figure 4a shows the intensity images, whereas Figure 4b shows the corresponding two-dimensional height maps displayed using a common color scale.
Figure 4.
Overall morphologies of square micro-holes produced using different scanning trajectories. (a) Intensity images. (b) Two-dimensional height maps displayed using a common color scale. In each panel, the columns from left to right correspond to four-direction orthogonal cross-hatch scanning, unidirectional raster scanning, continuous serpentine raster scanning, and continuous square-spiral scanning.
The micro-hole bottom produced by unidirectional raster scanning retained band-like textures aligned with the hatch direction, indicating that line-overlap differences accumulated repeatedly at the same spatial locations. In four-direction orthogonal cross-hatch scanning, the scan direction was rotated by 90° between successive full-area scans. Grooves, ridges, and locally under-processed regions generated in one direction were consequently crossed by scan lines from subsequent directions, preventing persistent reinforcement of a fixed hatch error. Previous studies on angular hatching and scan-path algorithms have shown that interlayer scan angle changes the spatial distribution of path overlap and pulse accumulation, and that appropriate directional alternation weakens anisotropic roughness caused by periodic hatching [10,11,12]. The morphological improvement observed here is therefore attributed mainly to spatial averaging of unidirectional height errors by multidirectional coverage.
Continuous square-spiral scanning reduced line-by-line switching but introduced numerous 90° corners and inward-connecting segments. At an ideal sharp corner, the velocity vector changes abruptly. Because the scanner is constrained by acceleration, jerk, and servo-following capability, it must adjust its velocity before and after the corner, causing the actual velocity to depart from the prescribed steady value [16]. At a constant repetition rate, the increased local dwell time and pulse overlap, together with repeated superposition of connecting segments near the diagonals, generated pronounced diagonal traces and a central defect. In continuous serpentine raster scanning, each line ended with a periodic reversal, and the reversal region repeatedly underwent deceleration, direction inversion, and reacceleration. This produced periodic height fluctuations corresponding to the hatch spacing. In the two continuous trajectories, the laser remained on at the reversals and 90-degree corners; the resulting bottom defects therefore reflected the combined influence of continuous irradiation and the velocity variations caused by turning. The proposed strategy restricted laser exposure to constant-velocity line segments and alternated the scan direction, thereby reducing local energy accumulation and improving the bottom morphology of the square micro-holes.
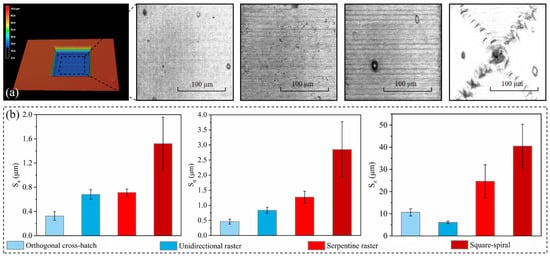
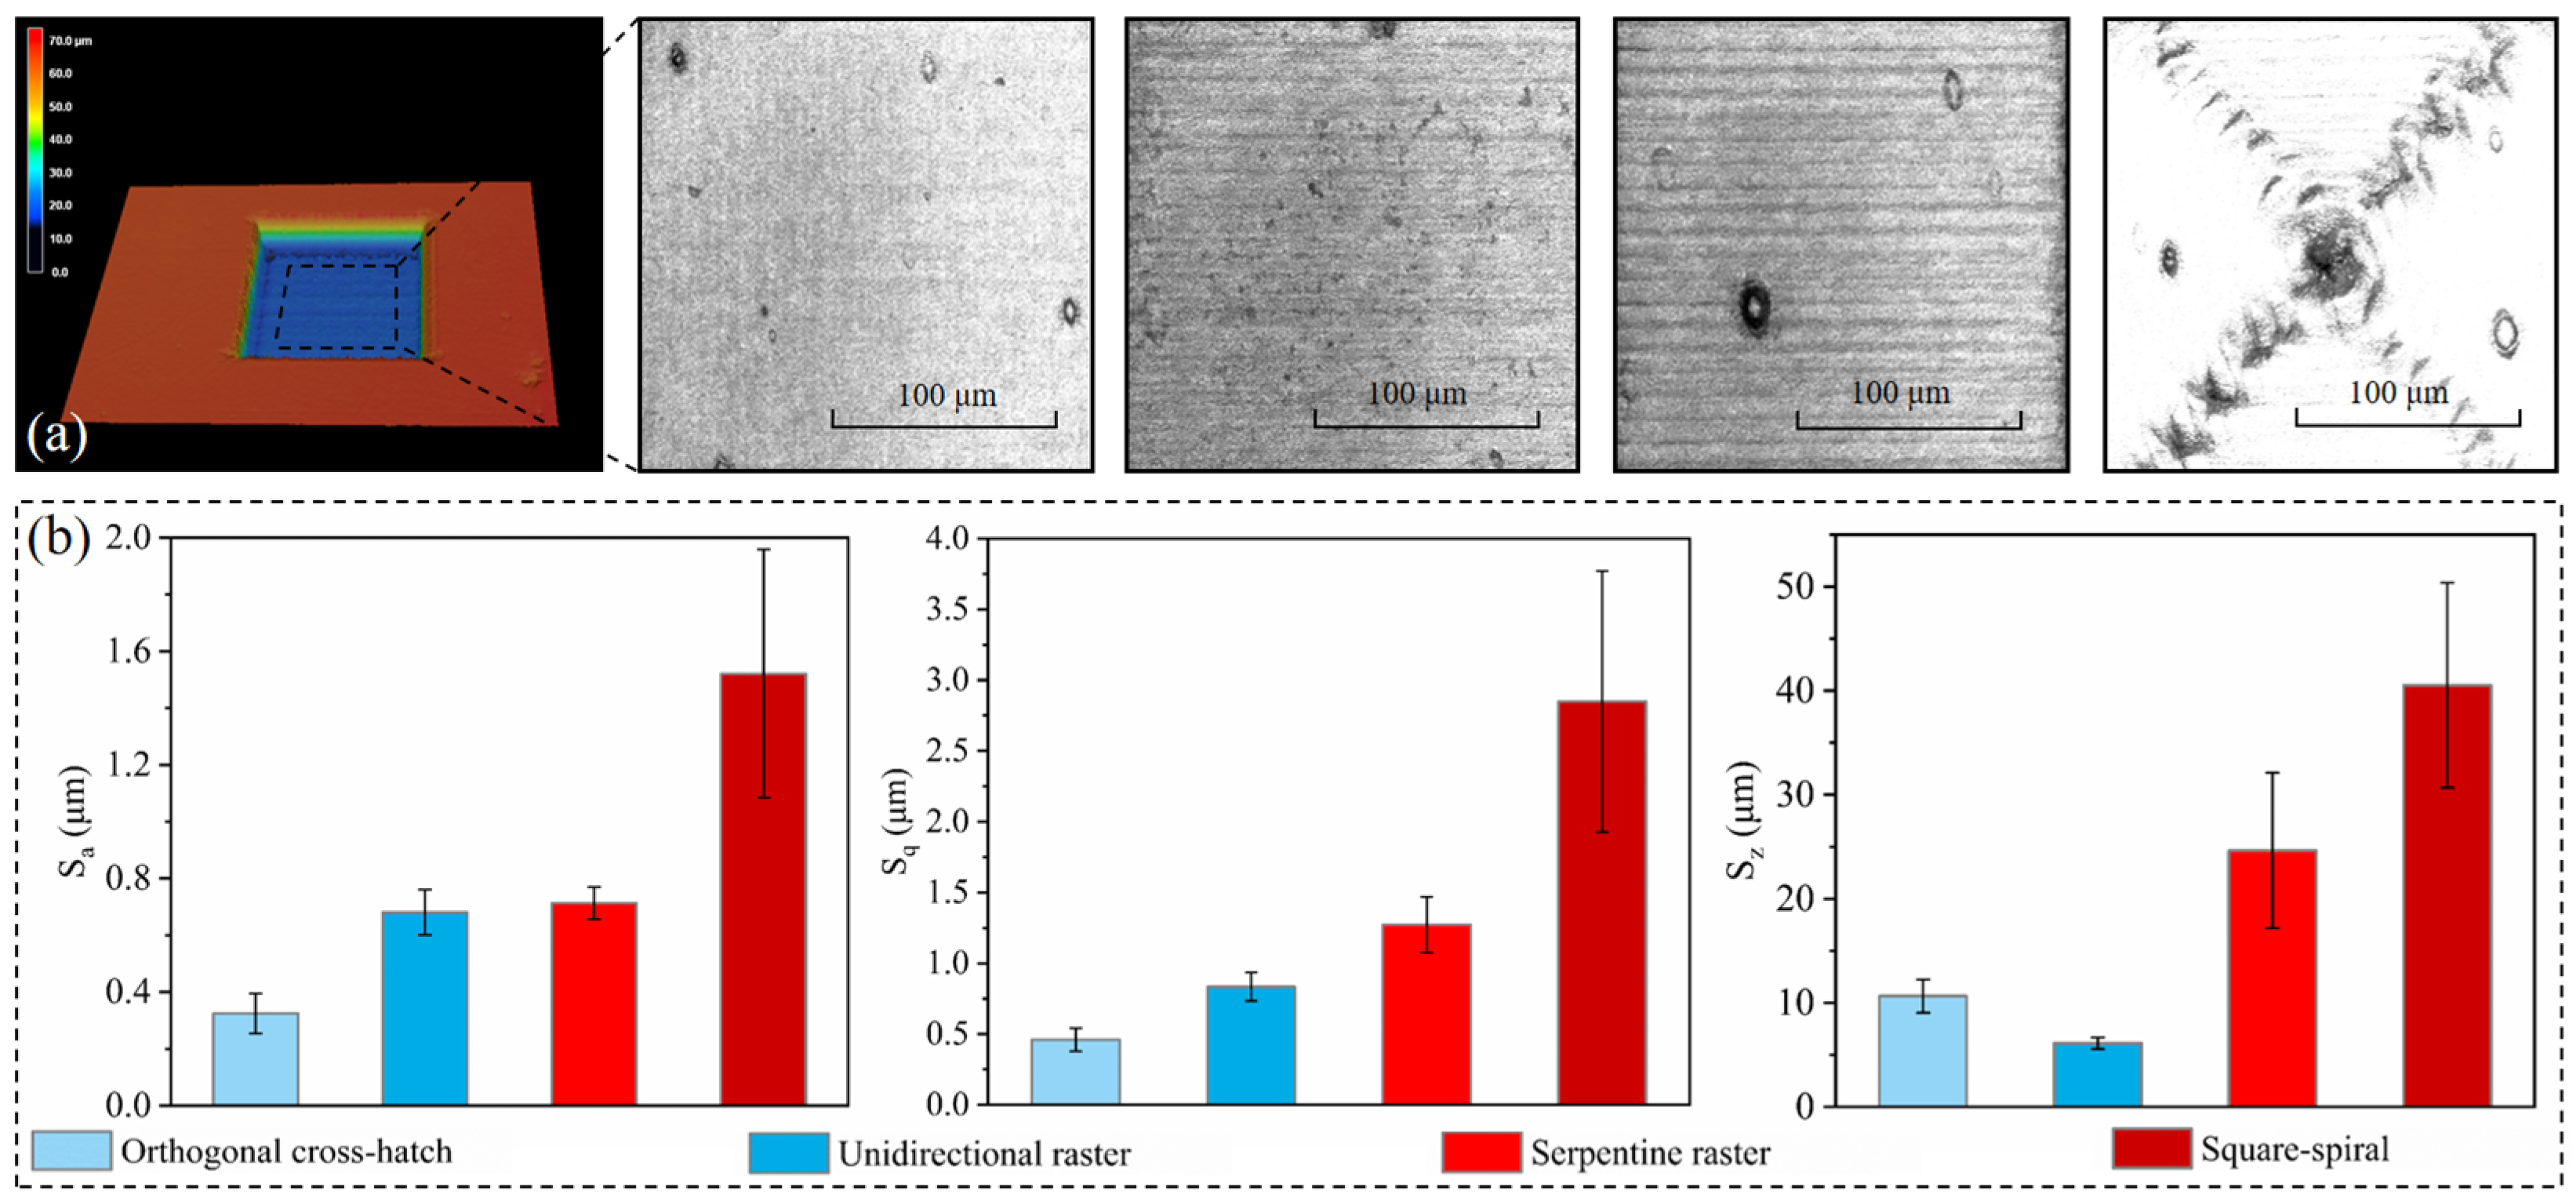
The overall morphologies in Figure 4 reveal the macroscopic consequences of the different scanning trajectories, whereas the bottom-surface images and areal roughness parameters provide a quantitative evaluation of the corresponding bottom quality. Roughness was evaluated over regions of identical area and relative position on the central bottom of each micro-hole. The sampling regions are shown in Figure 5a, and the corresponding roughness parameters are summarized in Figure 5b. Four-direction orthogonal cross-hatch scanning produced the weakest directional bottom texture. Distinct path-connection traces remained after continuous square-spiral scanning, whereas continuous serpentine raster scanning retained prominent parallel bands, consistent with the intensity and height maps shown in Figure 4a,b.
Figure 5.
Comparison of micro-hole bottom morphology and roughness for different scanning trajectories. (a) Representative three-dimensional micro-hole morphology and bottom-surface sampling regions for four-direction orthogonal cross-hatch, unidirectional raster, continuous serpentine raster, and continuous square-spiral scanning. (b) Corresponding areal roughness parameters Sa, Sq, and Sz.
As shown in Figure 5b, the micro-hole bottom produced by four-direction orthogonal cross-hatch scanning exhibited an Sa of 0.325 μm, approximately 52.3% lower than the 0.681 μm obtained by unidirectional raster scanning. Continuous serpentine raster and continuous square-spiral scanning produced Sa values of 0.713 and 1.521 μm, respectively. Sq followed the same ranking: 0.460 μm for four-direction orthogonal cross-hatch scanning, 0.834 μm for unidirectional raster scanning, 1.273 μm for continuous serpentine raster scanning, and 2.849 μm for continuous square-spiral scanning. The Sa and Sq results confirm that directional alternation reduced the overall height variation in the micro-hole bottom.
The Sz results in Figure 5b show that the value obtained by four-direction orthogonal cross-hatch scanning was 10.645 μm. This value was higher than the 6.117 μm measured for unidirectional raster scanning but substantially lower than the 24.637 and 40.524 μm measured for continuous serpentine raster and continuous square-spiral scanning, respectively. Sa and Sq characterize the overall height variation within the sampling area, whereas Sz is determined by the highest peak and deepest valley and is therefore more sensitive to isolated extrema. For four-direction orthogonal cross-hatch scanning, the average maximum peak height Sp was 8.451 μm, whereas the average maximum valley depth Sv was 2.194 μm, indicating that the elevated Sz mainly originated from a localized protrusion within the bottom sampling region. During multipulse ablation, material heterogeneity, local melting and resolidification, redeposition of ablation products, and path-overlap errors can all produce discrete peaks or valleys [6,8,12,13]. Directional alternation can thus reduce the average bottom undulation without necessarily eliminating every isolated extreme. Overall, the morphology and roughness results demonstrate the advantage of combining synchronized gating with four-direction orthogonal cross-hatch scanning to suppress directional bottom undulations and improve average bottom uniformity.
3.3. Effect of Cumulative Scan Count on Micro-Hole Depth and Bottom Quality
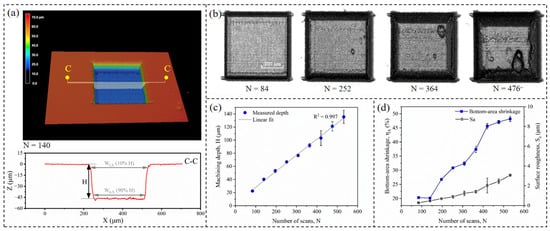
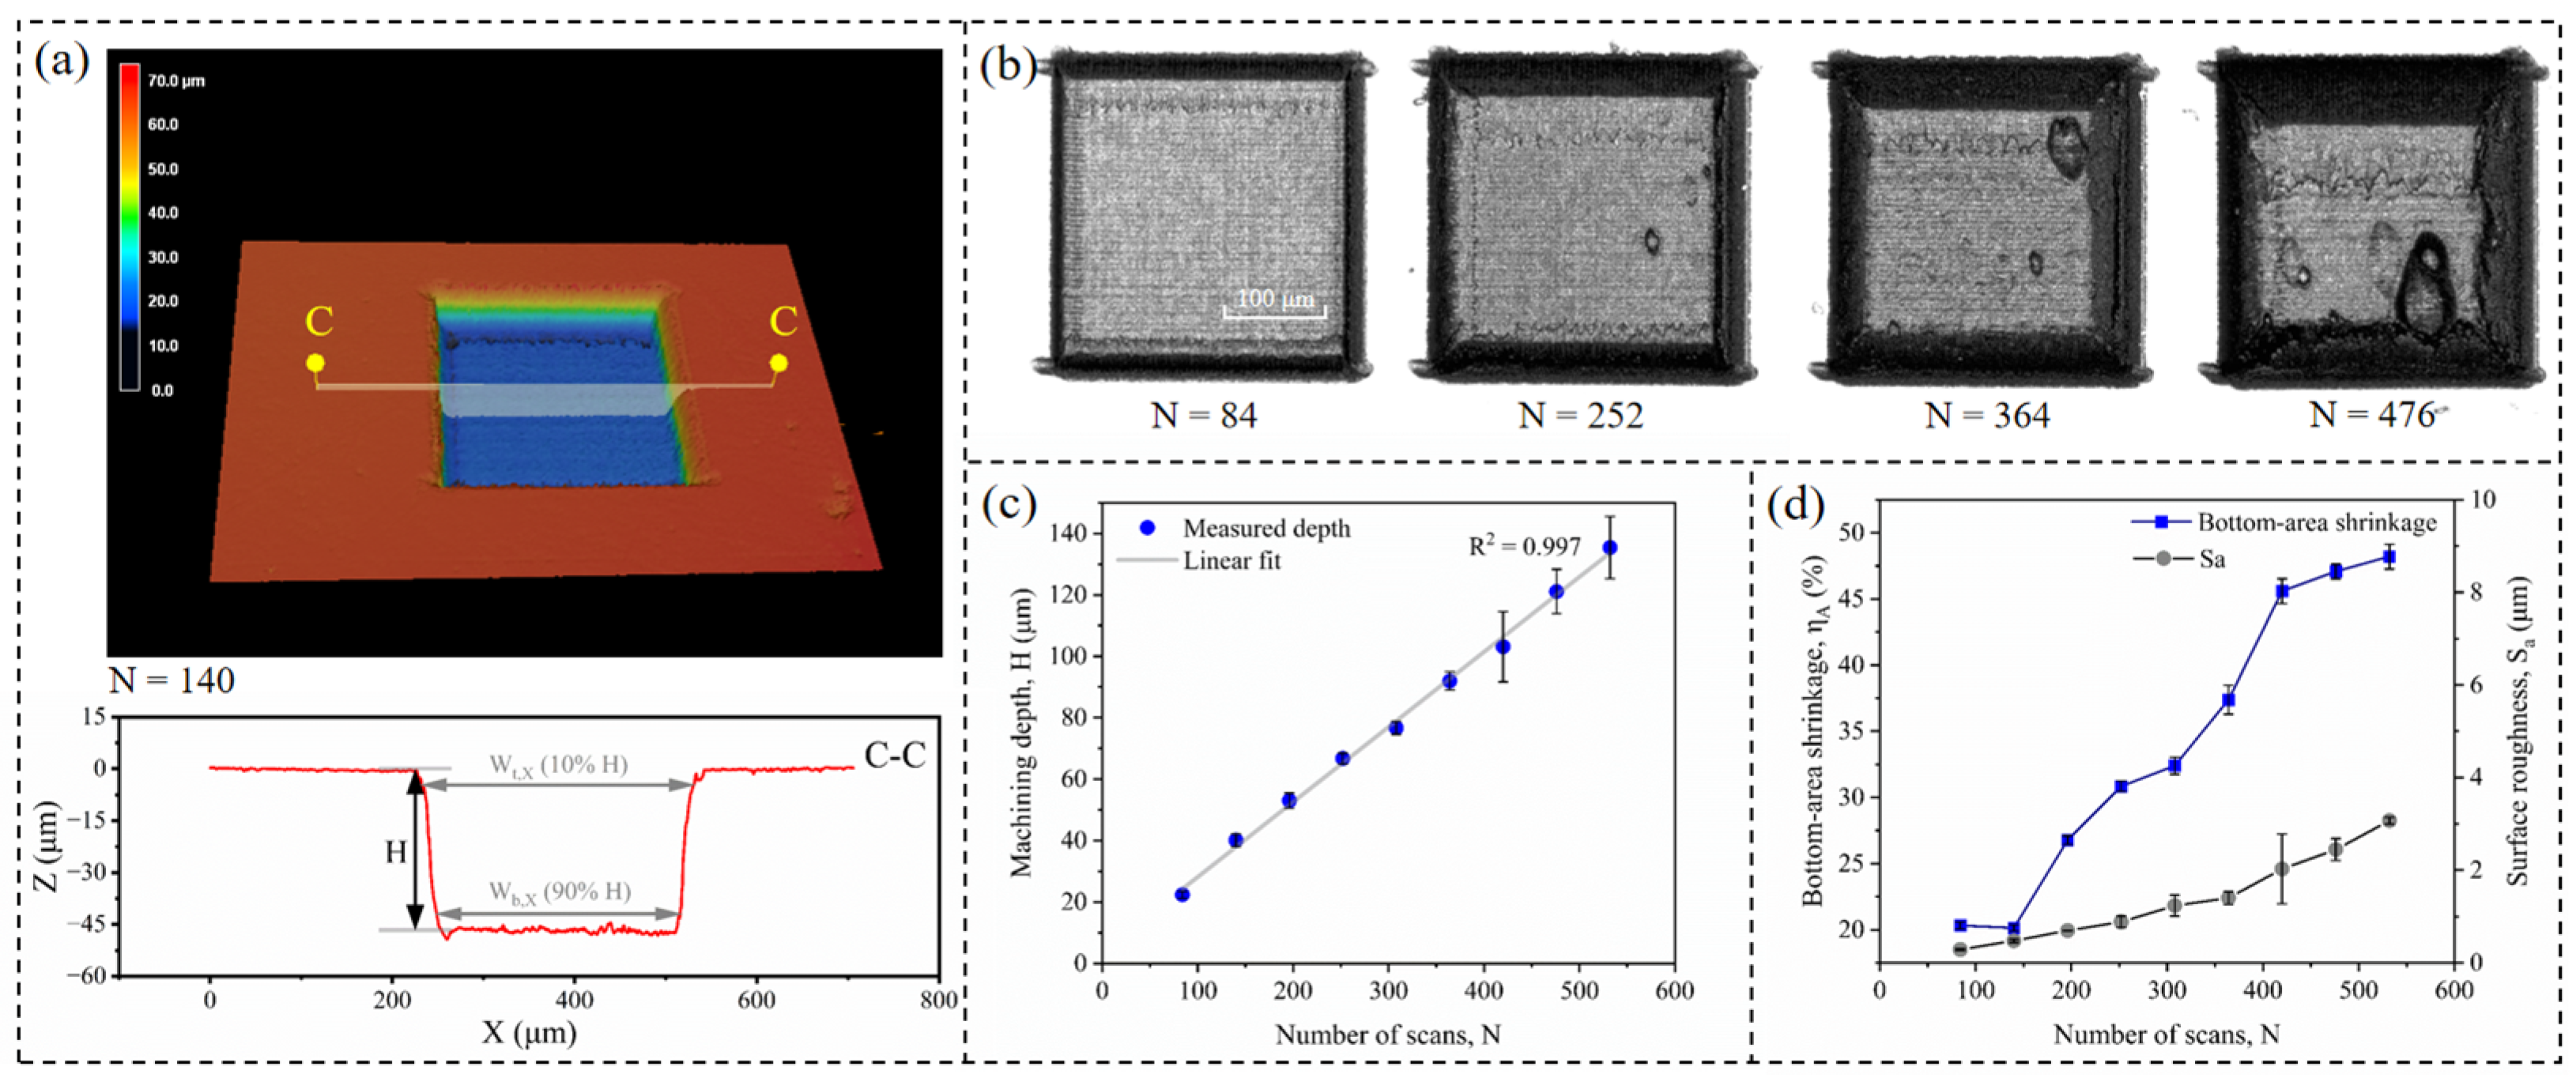
With synchronized gating, four-direction orthogonal cross-hatch scanning, and a fixed focal-plane downshift step of 2 μm, the number of processing Z positions was increased from 8 to 53, raising the cumulative full-area scan count N from 84 to 532 and the total focal-plane downshift from 14 to 104 μm. The evolution of micro-hole depth and morphology was evaluated under this layerwise processing scheme, in which the cumulative scan count and total focal-plane downshift increased together. Figure 6a presents a representative three-dimensional morphology and an X-direction profile, together with the measurement definitions of machining depth H, opening width Wt,X, and stable bottom width Wb,X. Representative corner morphologies at different scan counts are shown in Figure 6b. Figure 6c shows machining depth as a function of cumulative scan count, while Figure 6d presents the corresponding bottom-area shrinkage ratio and Sa.
Figure 6.
Effect of cumulative full-area scan count on the depth and morphological quality of square micro-holes. (a) Representative three-dimensional morphology and measurement definitions from an X-direction profile. (b) Overall morphologies at different scan counts. (c) Machining depth as a function of cumulative scan count. (d) Bottom-area shrinkage ratio and Sa as functions of cumulative scan count.
As shown in Figure 6c, the machining depth increased from 22.4 μm at N = 84 to 135.4 μm at N = 532. Within the investigated range, H was approximately linear with N, following H = 0.244N + 3.73 with a coefficient of determination R2 = 0.997. The high coefficient of determination confirms a strong linear relationship between the cumulative full-area scan count and machining depth under the fixed 2 μm layerwise focal-plane downshift scheme and within the investigated parameter range.
As shown in Figure 6d, increasing N was accompanied by deterioration in both bottom quality and effective bottom dimensions. Sa increased from 0.286 μm at N = 84 to 3.069 μm at N = 532, while the bottom-area shrinkage ratio increased overall from 20.3% to 48.2%. At the maximum scan count, the stable bottom occupied approximately 51.8% of the opening area. For N ≥ 308, corner serration, edge-transition zones, and local bottom defects became progressively more pronounced. Several depth-dependent factors may jointly influence these changes. One possible explanation is that, at 400 kHz, the microsecond pulse interval may restrict the clearance of laser-induced plasma and vaporized material from the deepening micro-hole, contributing to beam attenuation and particle redeposition. Related femtosecond-laser studies have shown that in situ deposited nanoparticles and particle aggregates can alter the resulting surface morphology and affect subsequent laser-material interaction through absorption and scattering [18]. The evolving cavity geometry may also redistribute incident energy through sidewall scattering and multiple reflections, while the layerwise focal-plane translation changes the local irradiation conditions. At the boundary, threshold-limited removal by the Gaussian beam yields an effective ablation width smaller than the overall energy-distribution width. With repeated layerwise processing, the lower effective energy near the edge and the evolving sidewall geometry may jointly cause the stable bottom to contract relative to the opening.
The results show that combining synchronized gating with four-direction orthogonal cross-hatch scanning provides endpoint energy control, improves average bottom uniformity, and enables depth extension beyond 100 μm within the present parameter range. Further increasing the scan count, however, raises bottom roughness and reduces stable bottom area. Depth extension is therefore constrained not only by the number of input scans but also by multipulse removal saturation, surface-evolution effects, and the transport of ablation products within the deep micro-hole. The cumulative scan count should therefore be selected by balancing the target depth against bottom quality and geometric fidelity.
3.4. Consistency of Square Micro-Hole Array Fabrication
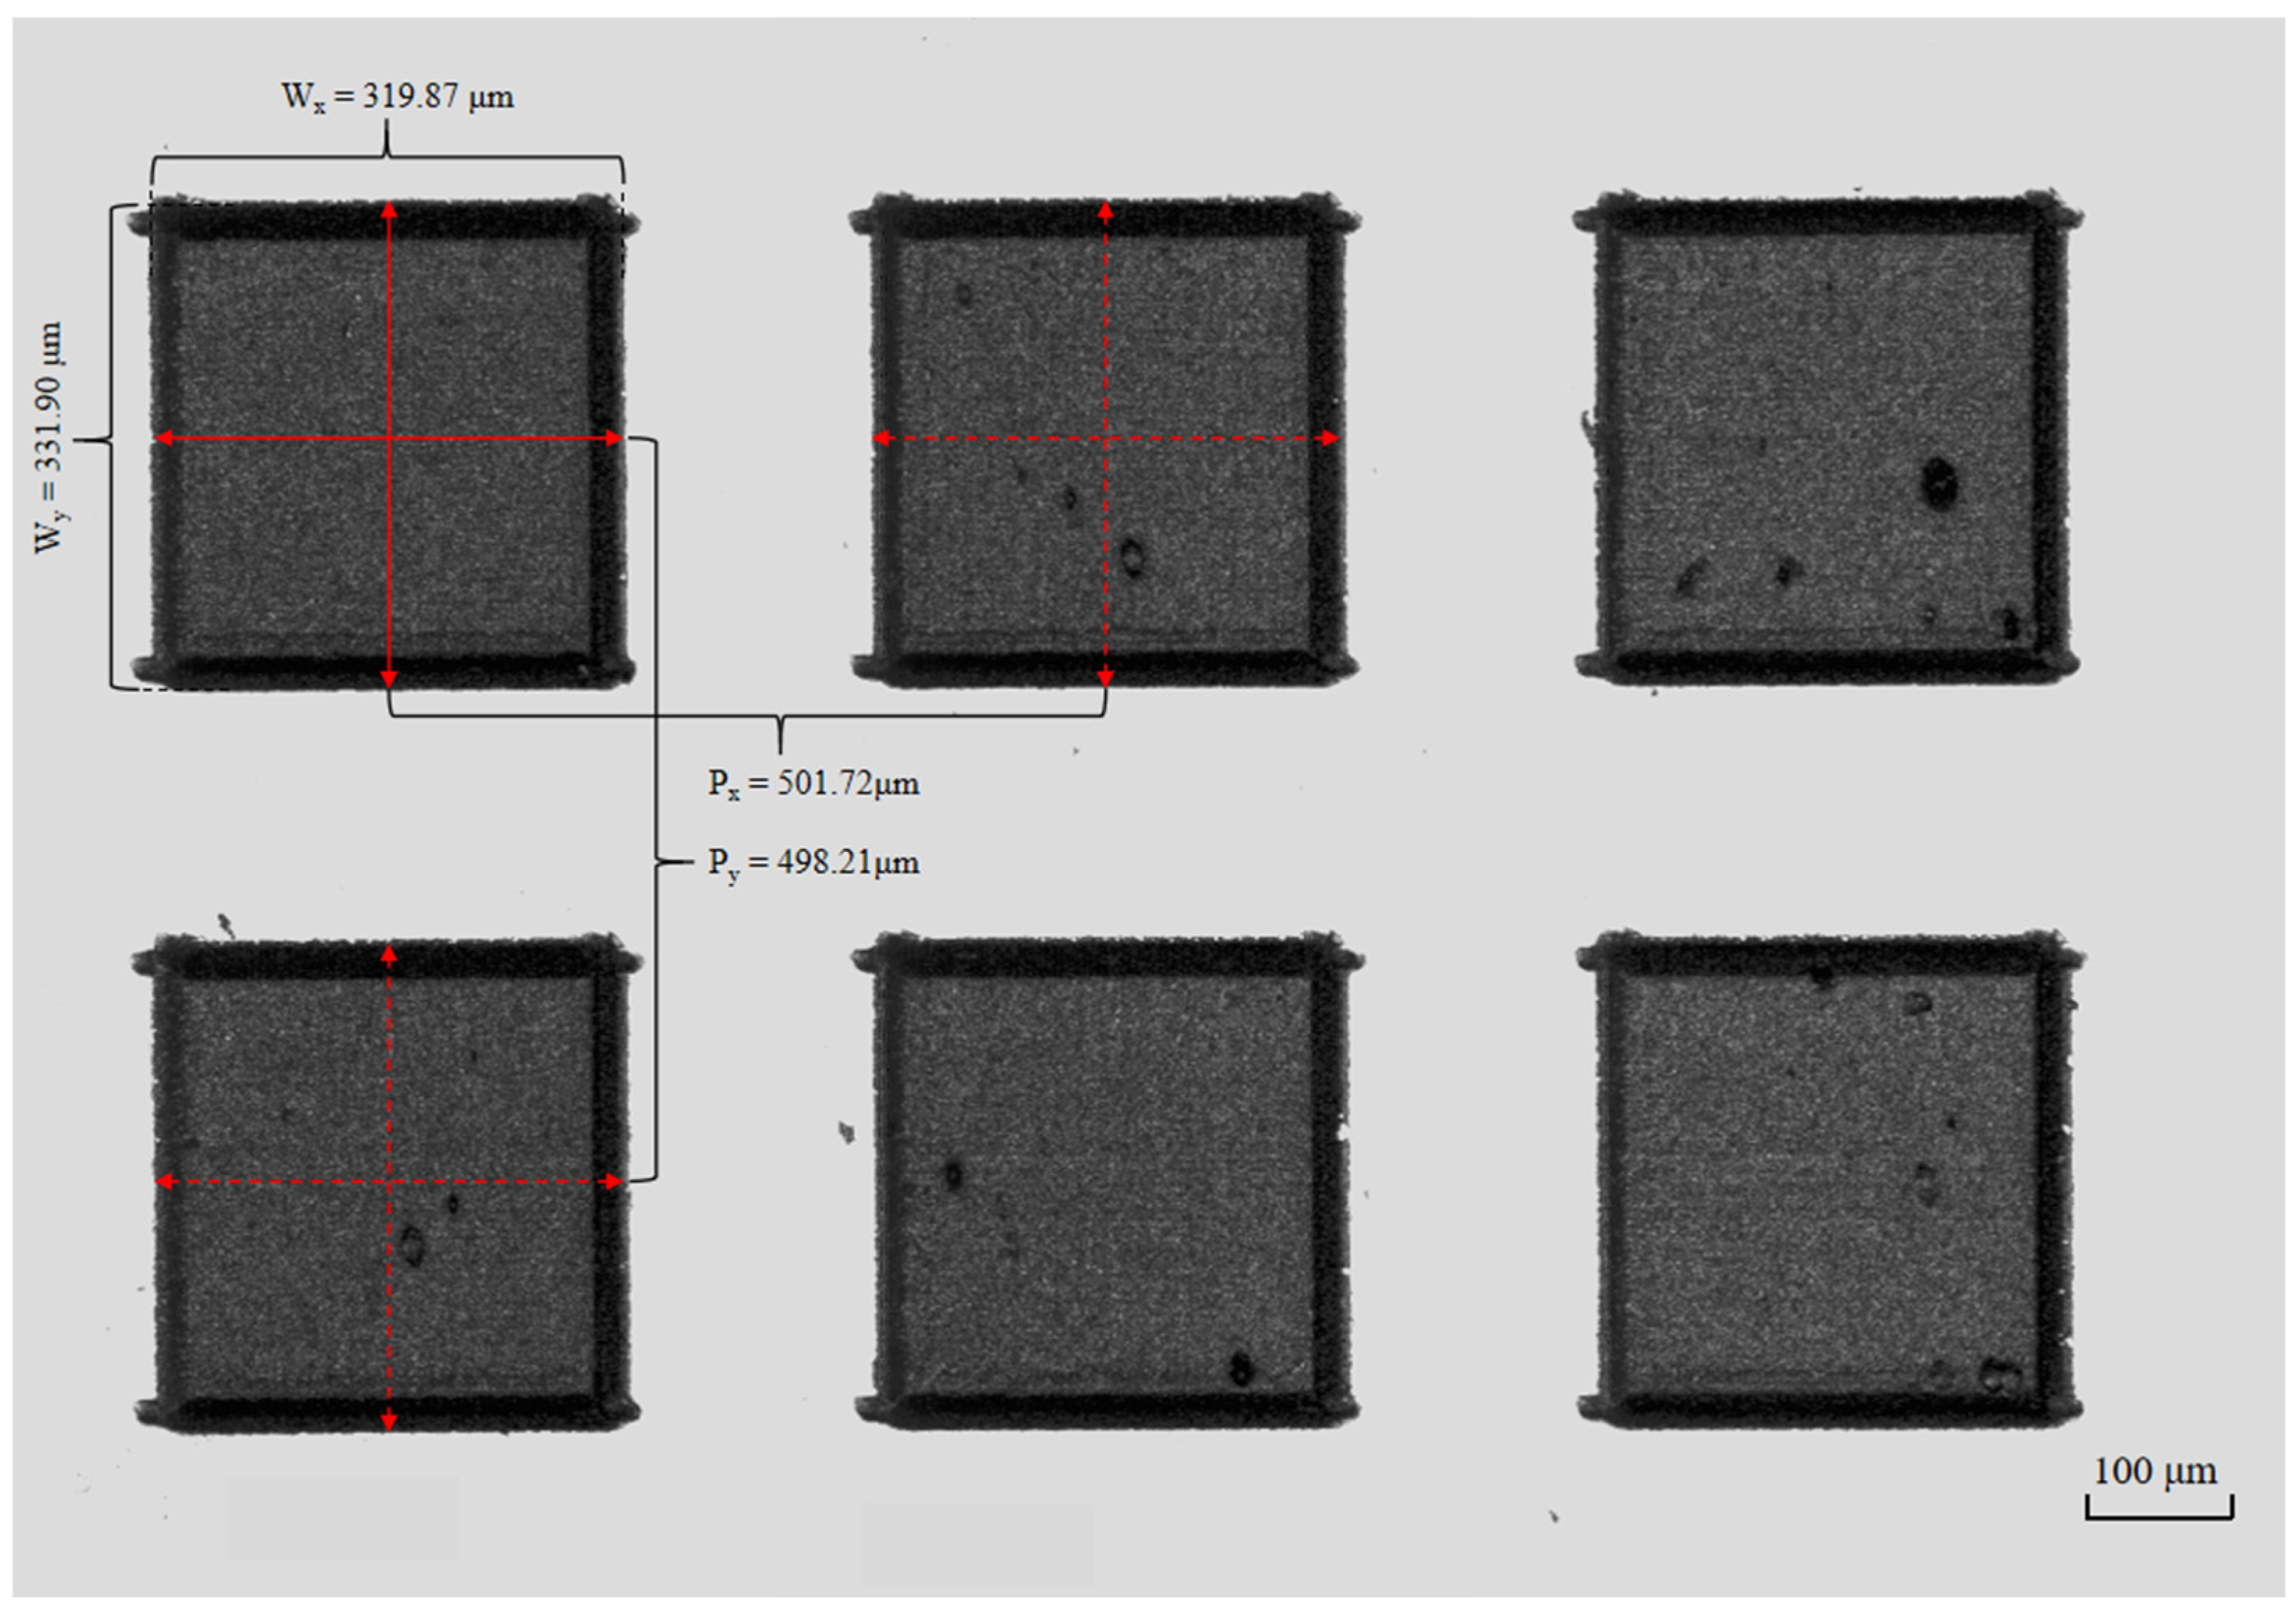
To further verify the processing consistency of the proposed strategy, a 2 × 3 square micro-hole array was fabricated using synchronized gating and four-direction orthogonal cross-hatch scanning. The nominal micro-hole size was 320 μm × 320 μm, the nominal center-to-center pitch was 500 μm, and each micro-hole was processed using 140 full-area scans. As shown in Figure 7, the six micro-holes exhibited similar plan-view morphology. The dimensional results are reported as mean ± standard deviation. The mean measured dimensions in the X and Y directions were 319.87 ± 1.90 μm and 331.90 ± 1.01 μm, with corresponding coefficients of variation of 0.60% and 0.30%, respectively. The measured center-to-center pitch was 500.55 ± 2.24 μm, with a coefficient of variation of 0.45%. The deviations of the mean X- and Y-direction dimensions from the nominal value were approximately −0.04% and +3.72%, respectively. This directional difference is associated with the axis-dependent dynamic response and effective scan-length calibration of the X- and Y-axis galvo mirrors. Because the array experiment was intended primarily to evaluate the repeatability and positioning consistency of the proposed processing strategy, a common compensation scheme was retained and no additional correction was applied specifically for the measured Y-direction deviation. The low coefficients of variation in the measured dimensions and center-to-center pitch indicate good within-array dimensional repeatability and positioning consistency.
Figure 7.
Confocal intensity image of a 2 × 3 square micro-hole array fabricated using synchronized gating and four-direction orthogonal cross-hatch scanning. The nominal micro-hole size and center-to-center pitch were 320 μm × 320 μm and 500 μm, respectively.
Square micro-hole arrays with controlled dimensional repeatability and pitch consistency may serve as microstructure-replication units in precision molds, microcavities or localized liquid-storage structures in microfluidic devices, and periodic texture units on functional surfaces.
4. Conclusions
This study addressed endpoint energy accumulation and fixed-direction bottom textures during picosecond laser direct writing of square micro-holes. The synchronized gating strategy was combined with four-direction orthogonal cross-hatch scanning, and the effects of scanning trajectory and cumulative scan count were evaluated. The main conclusions are as follows.
(1) Under direct gating, effective laser output can overlap with scanner acceleration or deceleration, increasing pulse deposition per unit length at scan endpoints. A point-like over-ablated region approximately 34.1 μm wide with a maximum local height drop of approximately 8.0 μm formed at the line start. Restricting laser output to the constant-velocity segment reduced the local height variation to approximately 1.3 μm. This demonstrates that synchronized gating improved the consistency of the effective scan segment.
(2) At the same nominal processing area and cumulative scan count of 140 full-area scans, four-direction orthogonal cross-hatch scanning redistributed height errors associated with a fixed hatch direction and produced a more uniform micro-hole bottom. Its Sa was 0.325 μm, 52.3% lower than the 0.681 μm obtained by unidirectional raster scanning and lower than the 0.713 and 1.521 μm obtained by continuous serpentine raster and continuous square-spiral scanning, respectively. A 2 × 3 array fabricated under the same processing conditions exhibited coefficients of variation of 0.60% and 0.30% for the measured X- and Y-direction dimensions, respectively, and 0.45% for the center-to-center pitch, further demonstrating the within-array repeatability of the proposed strategy.
(3) With synchronized gating and four-direction orthogonal cross-hatch scanning, machining depth increased from 22.4 to 135.4 μm as the cumulative full-area scan count increased from 84 to 532. The relationship was approximately linear over the tested range, H = 0.244N + 3.73, with R2 = 0.997. Over the same interval, Sa increased from 0.286 to 3.069 μm, and the bottom-area shrinkage ratio increased from 20.3% to 48.2%. The cumulative scan count should be selected by balancing material removal depth against micro-hole bottom quality and geometric fidelity.
Author Contributions
C.J.: Investigation, Methodology, Validation, Visualization, Writing—original draft. O.P.: Visualization, Investigation. C.Z.: Visualization, Investigation. J.Z.: Writing—review and editing, Supervision, Project administration, Funding acquisition. All authors have read and agreed to the published version of the manuscript.
Funding
The research is supported by the Harbin Manufacturing Science and Technology Innovation Talent Project (No. 2023CXRCGD035) and the Shandong Province Central Guidance Local Science and Technology Development Fund Projects (No. YDZX2025075).
Data Availability Statement
The data presented in this study are available on request from the corresponding authors.
Conflicts of Interest
The authors declare no conflicts of interest.
Abbreviations
The following abbreviations are used in this manuscript:
| PMAC | Programmable Multi-Axis Controller |
References
- Choi, H.W.; Bong, S.; Farson, D.F.; Lu, C.; Lee, L.J. Femtosecond laser micromachining and application of hot embossing molds for microfluid device fabrication. J. Laser Appl. 2009, 21, 196–204. [Google Scholar] [CrossRef] [Scilit]
- Saadat, M.; Taylor, M.; Hughes, A.; Hajiyavand, A.M. Rapid prototyping method for 3D PDMS microfluidic devices using a red femtosecond laser. Adv. Mech. Eng. 2020, 12, 1687814020982713. [Google Scholar] [CrossRef] [Scilit]
- Al-Mahdy, A.; Kotadia, H.R.; Sharp, M.C.; Opoz, T.T.; Mullett, J.; Ahuir-Torres, J.I. Effect of surface roughness on the surface texturing of 316L stainless steel by nanosecond pulsed laser. Lasers Manuf. Mater. Process. 2023, 10, 141–164. [Google Scholar] [CrossRef] [Scilit]
- Aizawa, T.; Inohara, T.; Wasa, K. Femtosecond laser micro-/nano-texturing of stainless steels for surface property control. Micromachines 2019, 10, 512. [Google Scholar] [CrossRef] [Scilit]
- Sugioka, K.; Cheng, Y. Ultrafast lasers—Reliable tools for advanced materials processing. Light Sci. Appl. 2014, 3, e149. [Google Scholar] [CrossRef] [Scilit]
- Villerius, V.; Kooiker, H.; Post, J.; Pei, Y.T. Ultrashort pulsed laser ablation of stainless steels. Int. J. Mach. Tools Manuf. 2019, 138, 27–35. [Google Scholar] [CrossRef] [Scilit]
- Zhou, T.; Hong, Y.; Fang, Z.; Perrie, W.; Fei, Y.; Hu, Y.; Edwardson, S.; Dearden, G. Experimental and numerical study of multi-pulse picosecond laser ablation on 316 L stainless steel. Opt. Express 2023, 31, 38715–38727. [Google Scholar] [CrossRef] [Scilit]
- Sedao, X.; Lenci, M.; Rudenko, A.; Faure, N.; Pascale-Hamri, A.; Colombier, J.P.; Mauclair, C. Influence of pulse repetition rate on morphology and material removal rate of ultrafast laser ablated metallic surfaces. Opt. Lasers Eng. 2019, 116, 68–74. [Google Scholar] [CrossRef] [Scilit]
- Holder, D.; Hagenlocher, C.; Weber, R.; Röcker, C.; Abdou Ahmed, M.; Graf, T. Model for designing process strategies in ultrafast laser micromachining at high average powers. Mater. Des. 2024, 242, 113007. [Google Scholar] [CrossRef] [Scilit]
- Daniel, C.; Manderla, J.; Hallmann, S.; Emmelmann, C. Influence of an angular hatching exposure strategy on the surface roughness during picosecond laser ablation of hard materials. Phys. Procedia 2016, 83, 135–146. [Google Scholar] [CrossRef] [Scilit]
- Kažukauskas, E.; Butkus, S.; Jukna, V.; Paipulas, D.; Sirutkaitis, V. Scanning algorithm optimization for achieving low-roughness surfaces using ultrashort laser pulses: A comparative study. Materials 2023, 16, 2788. [Google Scholar] [CrossRef] [Scilit]
- Romoli, L. Flattening of surface roughness in ultrashort pulsed laser micro-milling. Precis. Eng. 2018, 51, 331–337. [Google Scholar] [CrossRef] [Scilit]
- Jia, X.; Vrijburg, F.; Zhang, W.; Groenendijk, M.; Pei, Y. Ultrasmooth micromilling of stainless steel by ultrashort pulsed laser ablation using MHz bursts. ACS Appl. Mater. Interfaces 2025, 17, 7989–8002. [Google Scholar] [CrossRef] [Scilit]
- Žemaitis, A.; Gaidys, M.; Brikas, M.; Gečys, P.; Račiukaitis, G.; Gedvilas, M. Advanced laser scanning for highly-efficient ablation and ultrafast surface structuring: Experiment and model. Sci. Rep. 2018, 8, 17376. [Google Scholar] [CrossRef] [Scilit]
- Gafner, M.; Remund, S.M.; Chaja, M.W.; Neuenschwander, B. High-rate laser processing with ultrashort laser pulses by combination of diffractive elements with synchronized galvo scanning. Adv. Opt. Technol. 2021, 10, 333–352. [Google Scholar] [CrossRef] [Scilit]
- Garkusha, P.; Harst, F.; Zaeh, M.F. Optimizing the dynamic performance of galvanometric scanners through advanced trajectory planning for laser material processing. J. Laser Appl. 2026, 38, 012006. [Google Scholar] [CrossRef] [Scilit]
- Ding, Q.; Wang, M.; Wang, X.; Huang, P.; Wang, Z.; Ji, Y. Experimental performance analysis of large-format 304 stainless steel surface laser matting process. Materials 2025, 18, 4412. [Google Scholar] [CrossRef] [Scilit]
- Liu, R.J.; Zhang, D.S.; Li, Z.G. Femtosecond laser subtractive/additive-integrated biomimetic manufacturing for visible/infrared encryption and stimuli-responsive infrared decryption. Int. J. Extrem. Manuf. 2025, 7, 045009. [Google Scholar] [CrossRef] [Scilit]

Disclaimer/Publisher’s Note: The statements, opinions and data contained in all publications are solely those of the individual author(s) and contributor(s) and not of MDPI and/or the editor(s). MDPI and/or the editor(s) disclaim responsibility for any injury to people or property resulting from any ideas, methods, instructions or products referred to in the content. |
© 2026 by the authors. Licensee MDPI, Basel, Switzerland. This article is an open access article distributed under the terms and conditions of the Creative Commons Attribution (CC BY) license.