


Abstract
A numerical method is proposed to assess the visual coverage and imaging quality of a pre-designed unmanned aerial vehicle (UAV) inspection route prior to field deployment. The modeled inspection domain includes 336 m2 of deck-underside, exterior-girder, and pier surfaces, 5424 area-weighted cells, fixed physical simulated-defect coordinates, explicit camera targets, and non-imaging transfer legs. For each of the three candidate flight strategies, 30 seeded Monte Carlo trials are conducted at each of four wind-disturbance levels. The retained observation should meet the field-of-view, range, incidence-angle, ground-sampling-distance (GSD), and repeated-capture requirements. Under no wind, valid coverage is 21.43%, 49.33%, and 93.97% for Basic, Improved, and Quality-aware, respectively; under the strongest wind level tested, the corresponding values are 16.64%, 47.38%, and 90.01%. Valid coverage is 0.275, 0.309 and 0.414 percentage points per meter for Basic, Improved and Quality-aware under no wind, respectively, and 0.214, 0.297 and 0.396 percentage points per meter under the highest wind level tested. The mean quality-adjusted resolution proxy for the Quality-aware route is raised from 0.983 to 1.409 mm/pixel over the range of tested winds. The results indicate that component-specific underside and pier observations offer significantly more coverage than exterior-only inspection, but at the cost of longer missions and greater distance travel. The framework is a numerical proof-of-concept for pre-flight route assessment rather than a field-validated engineering inspection tool; calibration against measured image, pose, wind, and defect-observation data is required before operational inspection performance can be inferred.
1. Practical Applications
The current numerical system shows how candidate UAV routes can be compared prior to field deployment based on coverage and image-quality related criteria. The program divides the modeled bridge into physical surface cells and determines whether each cell is viewed from the correct side, inside the camera field of view, at a suitable distance and incidence angle, with acceptable image scale, and in enough retained frames. The analysis shows how even a visually realistic flight around a bridge may not cover big deck undersides or piers. In the specific case of the bridge, the Quality-aware route maintained about 90% overall valid coverage at the highest wind level tested, while the Basic exterior-only route maintained about 17% overall valid coverage. Component-level coverage varies across the deck, girders, and piers and should therefore be examined separately from the overall coverage value. All these strategies can help to select paths, find potentially missed areas, and set margins of image quality. The method does not substitute the inspector, tactile inspection, collision planning, or regulations. Before operational deployment, the predictions need to be calibrated with aerial pictures, telemetry, wind measurements, and defects identified by experts.
2. Introduction
Bridges play a vital role in civil infrastructure, as they enable transportation, public mobility, economic activity and emergency access. Their serviceability is long-term, but they require regular inspection, condition assessment and maintenance planning. Bridge structures are subjected to aging, loading by traffic, environmental degradation, fatigue, corrosion, cracking, spalling and other surface and material degradation. Bridge inspection is therefore still a key part of infrastructure safety management and is usually carried out periodically to aid in maintenance decisions [1,2,3]. Traditional bridge inspection, however, still heavily depends on manual visual inspection, under-bridge inspection vehicles, aerial work platforms, ladders, ropes and other access equipment. These methods can be costly, time-consuming, disruptive to traffic and hazardous for inspectors working near heights, water, live traffic, or difficult terrain [4,5,6]. The current National Bridge Inspection Standards require that bridge inspections are carried out by qualified inspection personnel and that the inspection procedures are suitable for the type of inspection being undertaken, and that where appropriate, the inspection is supplemented by physical or tactile examination [1]. Advanced technologies can help this process, but they do not eliminate the need for the inspection procedures that are required for the specific bridge component and condition. Graybeal et al. [2] also showed that traditional visual bridge inspection can be quite subjective and inconsistent between inspectors and inspection conditions. This variability provides a practical motivation for recording objective image-acquisition quantities, such as surface coverage, spatial resolution, viewing geometry, and repeated observations, when UAV imagery is used to support an inspection.
Unmanned Aerial Vehicles (UAVs) are a promising tool for bridge inspection due to their ability to access difficult-to-reach parts of the structure and to minimize direct human exposure to hazardous inspection conditions. UAVs can obtain visual data from deck undersides, girder faces, pier areas, bridge edges and other regions that are hard to access with conventional methods. The use of UAVs for field bridge inspection, drone-enabled inspection methodology, crack recognition, optical-image-based inspection, machine-learning-assisted visibility improvement, SLAM-based inspection, and digital-twin quality evaluation have been demonstrated in previous studies [7,8,9,10,11,12,13,14]. The results of these studies indicate that UAV-based inspection can be used to assist in non-destructive monitoring of bridges, decrease inspection time, and provide permanent visual records for engineering assessment. In the current inspection practice, UAVs are thus used as an additional visual access and data acquisition tool, not as a replacement for the bridge inspector. FHWA guidance states that UAVs can be used to supplement parts of a bridge inspection if the capabilities of the UAV match the inspection task, but image-based UAV inspection cannot be used to replace required physical inspections like sounding or hammering [15].
While UAVs enhance access to bridge surfaces, bridge inspection is not just a flight-navigation challenge. The images collected should also meet the civil engineering inspection requirements. A bridge surface should not be deemed to be adequately inspected if it is only briefly visible in the camera’s field of view. The data captured should have sufficient coverage, viewing angle, distance from the surface, spatial resolution, and image stability to allow engineering interpretation. The studies of image-based bridge inspection and 3D reconstruction have revealed that the reliability of the inspection outputs can be compromised by incomplete coverage, poor point distribution, missing regions, outlier noise, shadowing, large tilt angles, and geometric uncertainty [16,17,18]. Thus, the planning of UAV inspection should not only consider whether the UAV can fly around the structure, but also whether the planned flight path can obtain useful inspection data.
One of the key requirements of UAV-assisted bridge inspection is image quality. The ability to visually interpret cracks, corrosion stains, spalling patches and other surface defects is directly affected by ground sampling distance (GSD), image overlap, camera angle, camera distance, blur, exposure, and spatial resolution. In recent years, several studies have been conducted on image quality assessment and enhancement techniques for UAV bridge inspection, such as image quality checking, image quality classification, and enhanced visibility analysis [19,20,21]. The influence of flight configuration, image overlap and camera geometry on the quality of UAV-based photogrammetric reconstruction has been investigated in other studies [22,23,24]. The results of these works show that the quality of the visual inspection is highly dependent on the interaction between the camera parameters, UAV path design and bridge geometry.
A key route-design challenge in UAV inspection is to obtain full and meaningful surface coverage. Yu et al. [25] integrated local navigation routines with a planner for autonomous inspection of box-girder, which involved path selection to minimize inspection time. To find inspection viewpoints that cover the entire surface and have a low-cost connecting path, Bircher et al. [26] employed iterative viewpoint resampling and tour optimization over a triangular surface representation. Almadhoun et al. [27] proposed a search-space coverage approach that considers coverage, accuracy, traveled distance, and turning angle. Phung et al. [28] formulated the vision-based surface inspection problem as an extended traveling-salesman problem with coverage and obstacle-avoidance constraints and solved it by using enhanced discrete particle swarm optimization. Shang et al. [29] integrated visual inspection quality into co-optimal coverage-path planning for complex 3-D structures. Wang et al. [24] created inspection viewpoints from a BIM representation and linked them together to form a feasible trajectory that would facilitate high-quality 3D reconstruction for bridge photogrammetry. Similar BIM-assisted scan planning and model-based reality-capture analyses have also demonstrated that surface coverage and viewpoint quality should be considered alongside route efficiency when planning the acquisition of a scan [30,31,32]. More recent studies have extended this direction through multi-UAV three-dimensional coverage planning, two-stage structural-inspection path optimization, viewpoint-importance-based bridge routing, bridge-specific coverage-path optimization, and practical route-generation toolkits [33,34,35,36,37]. The methods mainly focus on the generation or optimization of viewpoints and flight trajectories, while the present study focuses on the inspection performance of candidate routes provided to the framework.
UAV-based bridge inspection is also connected to wider developments in automated visual inspection and structural health monitoring. There are several studies that have suggested the use of automated or semi-automated systems for aerial data capture, 3D mapping, defect detection, analysis, reporting and bridge condition assessment [38,39,40]. UAVs equipped with deep learning, machine learning, digital image processing, edge detection and thermal imaging have been applied to crack detection, delamination assessment and structural health monitoring in other works [41,42,43,44,45]. These methods are useful for post-flight damage assessment but require high quality and complete images taken during the flight. Later image processing cannot completely recover the missing inspection information if a surface region is not captured or is captured from an inappropriate angle.
The general advances in aerial documentation and reconstruction also support UAV bridge inspection. Research on aerial photography, UAV-based inspection platforms, high-resolution multisensor infrastructure inspection and UAV bridge inspection systems has demonstrated that the performance of the inspection depends on the type of camera used, the flight height, the overlap of the images, the distance from the surface and the mission planning [46,47,48,49,50]. In the same way, research on image-based 3D reconstruction, multi-image reconstruction evaluation and low-cost photogrammetric modeling has demonstrated that the geometry of the cameras and the quality of the images have a significant impact on the completeness and accuracy of the reconstruction [51,52,53]. More generally, three-dimensional geometry-processing methods, including skeleton-based representations, can provide compact structural descriptions of reconstructed shapes for subsequent geometric analysis [54]. The results confirm the importance of evaluating the inspection coverage and spatial resolution prior to the actual deployment of the UAV.
Several non-UAV and hybrid sensing studies also highlight the importance of data completeness and geometric visibility in infrastructure inspection. The geometric and visual records that can be obtained from terrestrial laser scanning and camera-based bridge inspection techniques can be useful, but are subject to occlusions, line-of-sight constraints, self-shadowing and data gaps [55,56,57,58]. Flight and capture optimization studies also indicate that the paths used to acquire the data affect the completeness of the documentation of infrastructure surfaces [59]. While the sensing platforms are different, the principle is the same: Inspection data are only useful if the target surface is sensed with adequate visibility, resolution, and geometric quality.
Another challenge in UAV bridge inspection is the influence of environmental conditions. Spatially varying wind fields may exist at bridge sites due to the deck, piers, pylons, surrounding terrain, and wake effects. To solve this problem, Wang et al. [60] directly analyzed the wind field of the bridge and optimized the UAV inspection trajectory in the safe region under the condition of wind. Wind-aware route optimization, disturbance rejection, bridge wind response, near-deck wind environments, and wind-induced UAV hazard zones have been studied [61,62,63,64,65]. The present framework deals with wind at another level. It does not model bridge-wake aerodynamics or optimize a wind-dependent trajectory, but rather wind is applied as a repeatable stress test on the position, viewing direction, quality-adjusted resolution proxy, frame retention, and repeated-capture requirement of predefined candidate routes.
While there are well established route-generation and optimization techniques, there is a complementary need for a simple pre-flight assessment framework that can be used to assess the effectiveness of a proposed inspection route in terms of how well it will be able to observe the bridge surfaces prior to field deployment. The gap that is discussed here is not the generation of another optimized trajectory. Rather, the goal is to compare candidate routes based on a common set of criteria that are used for inspection, such as physical surface coverage, camera field of view, range, incidence angle, quality-adjusted resolution proxy, repeated valid observations, fixed simulated-defect visibility, and wind-induced degradation.
This study proposes a pre-flight assessment framework for UAV-assisted bridge inspection that is implemented in MATLAB. A simplified bridge is divided into physical surface cells on the underside of the deck, on the exterior faces of the girders and on the faces of the piers. Three candidate strategies are predefined and evaluated: Basic side-pass route, Improved route with extra underside and pier facing passes, and Quality-aware route with extra component-specific observations. Wind disturbance is captured as a perturbation in position and pointing, loss of frame, degradation of effective-GSD, and more stringent repeated-capture requirements. The contribution is a repeatable route assessment technique that determines the regions of the bridge that are not inspected, estimates the margins of inspection quality, compares candidate routes under common conditions, and assesses the geometric observability of fixed simulated-defect locations prior to field deployment. The framework is therefore complementary to path-generation algorithms and can be applied to routes defined manually or generated by an external planner.
3. Numerical Framework
3.1. Bridge Geometry and Surface Discretization
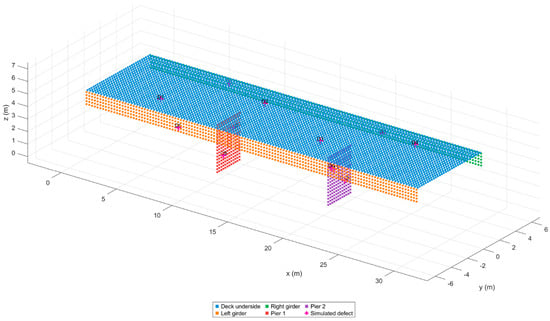
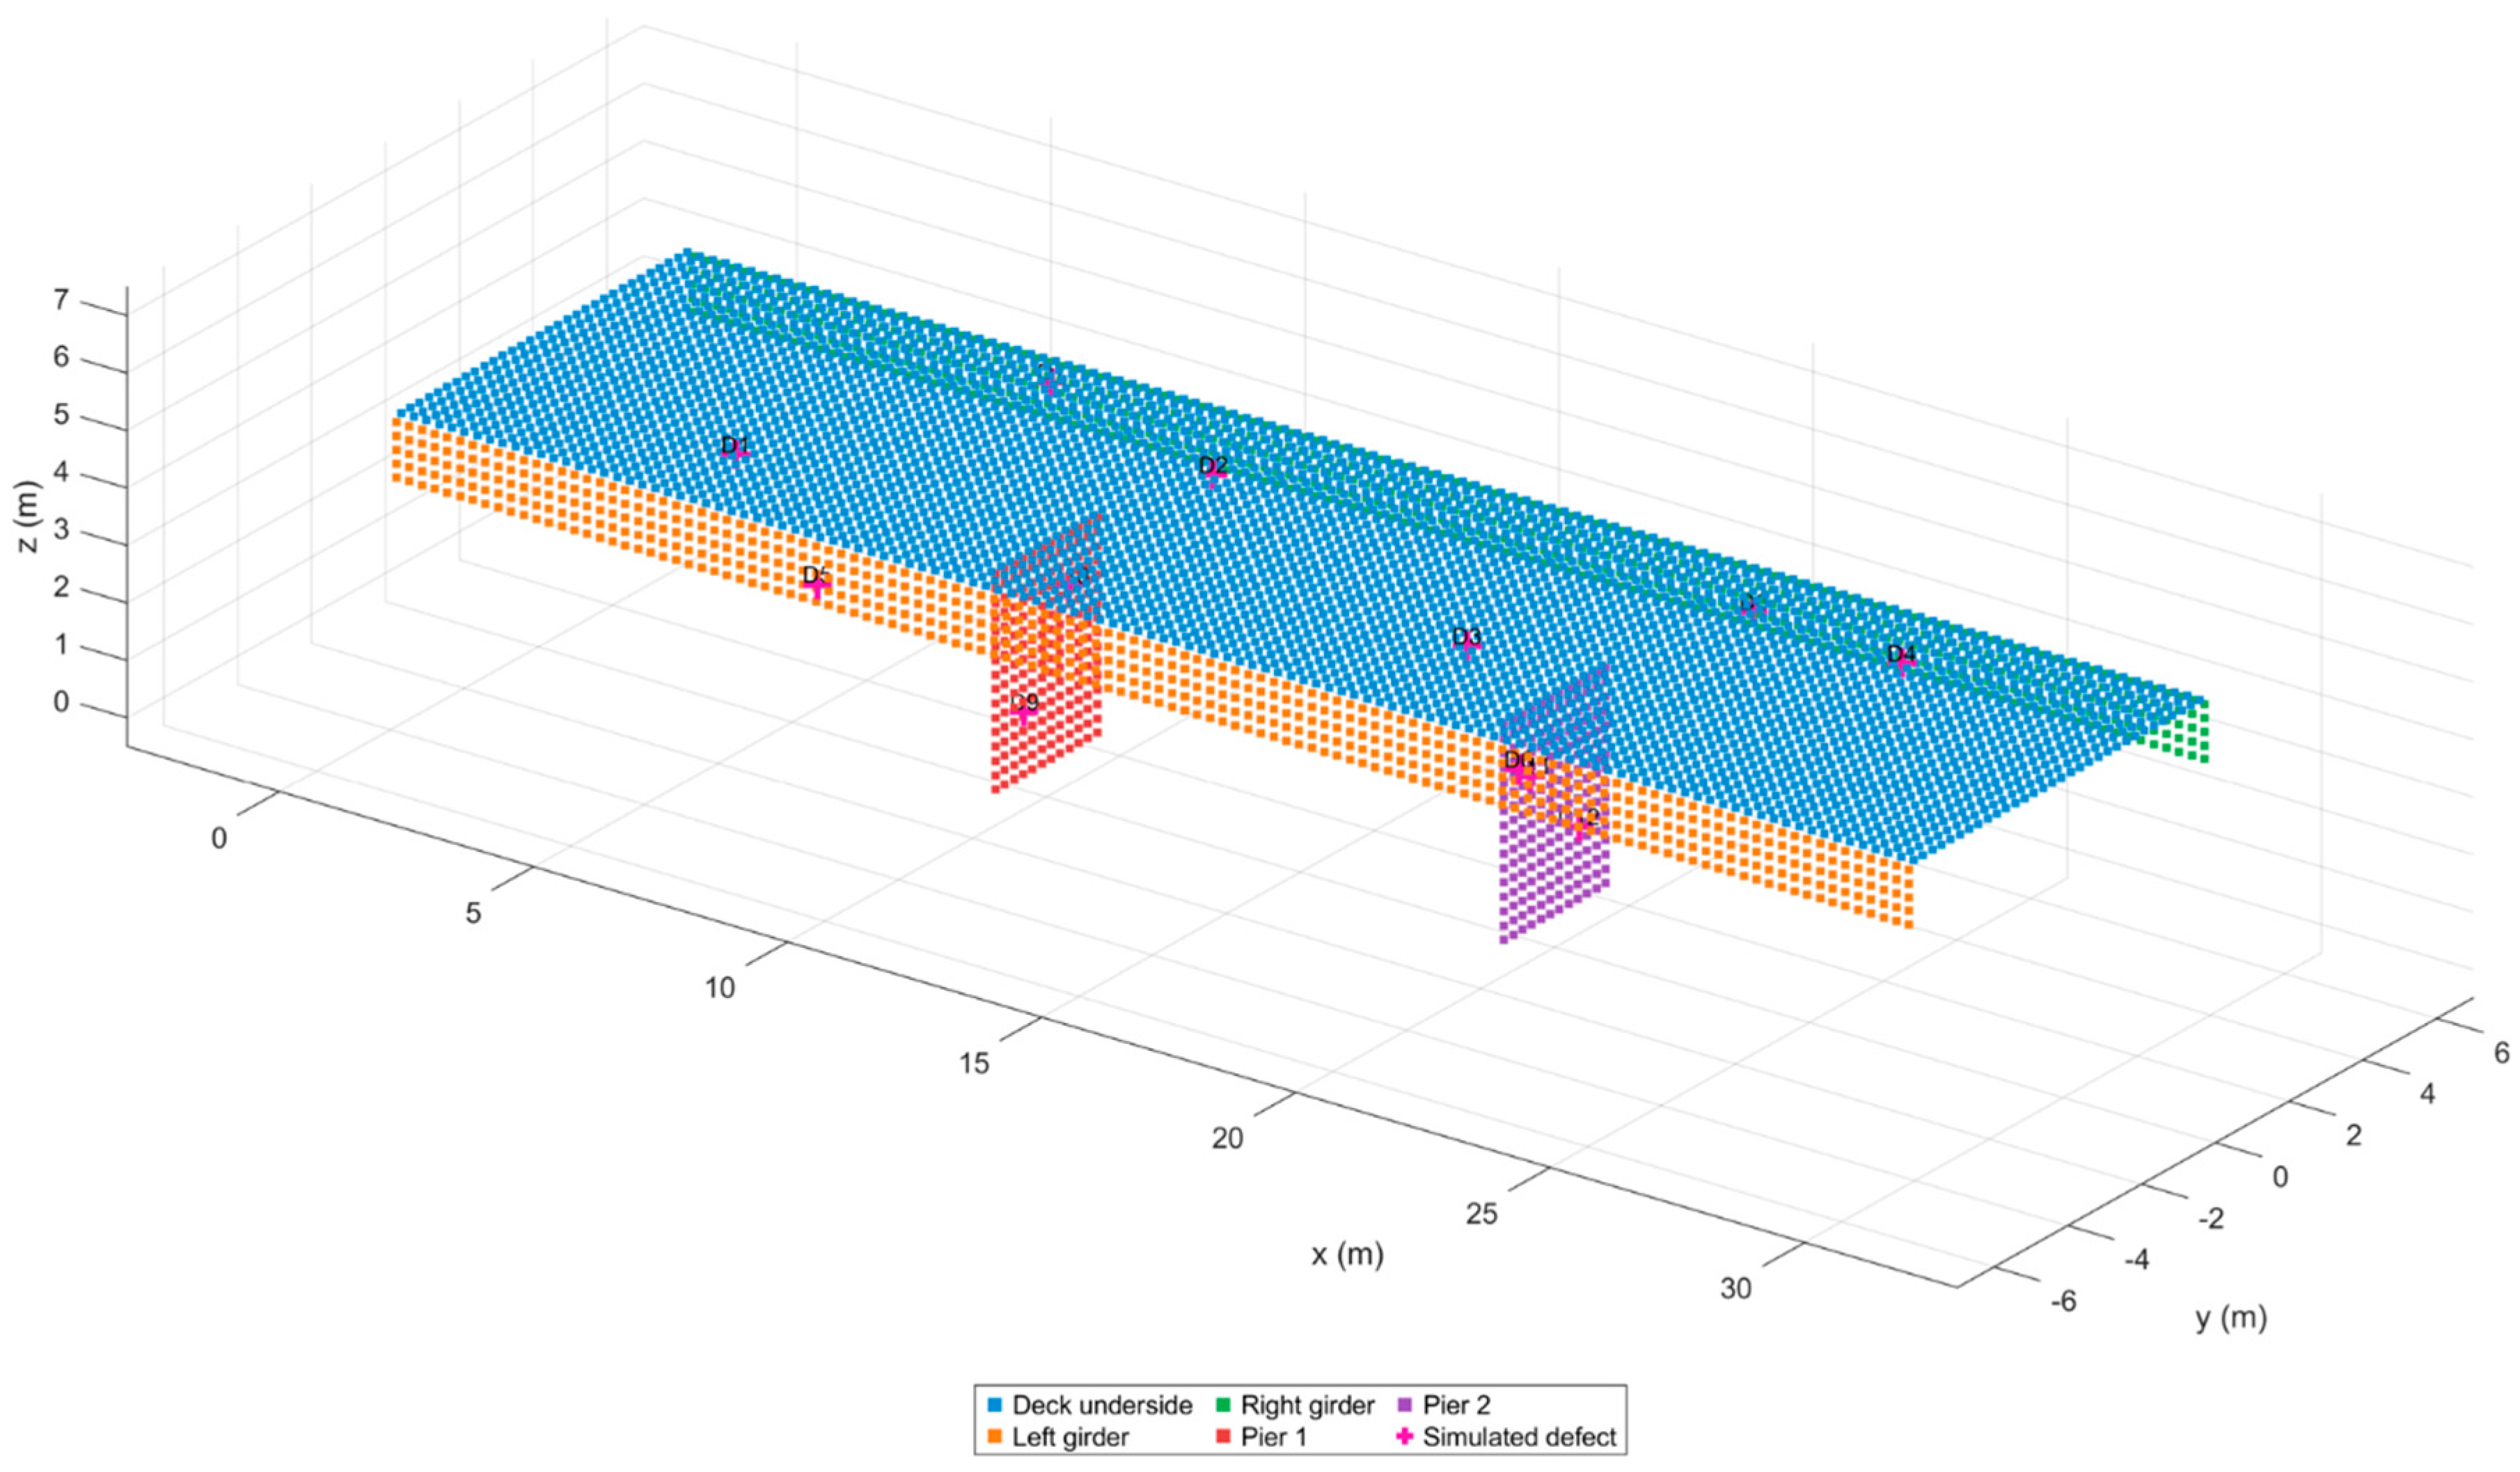
The inspected domain consists of a 30 m by 8 m deck underside (240 m2), two 30 m by 1.2 m exterior girder faces (72 m2 total), and two 3 m by 4 m upstream pier faces (24 m2 total). The two modeled pier surfaces are the two planar faces of the two piers that are facing upstream. These faces are only included to maintain a controlled and consistent numerical benchmark domain across the three candidate routes; the other pier faces are not in the modeled inspection domain and are not assumed to be unimportant in a field inspection. Their exact area is 336 m2. Each rectangular surface is subdivided so no cell edge exceeds 0.25 m, producing 5424 cells. Boundary subdivisions carry their exact areas, so a partial boundary cell is not assigned the weight of a full cell. The geometry and fixed simulated-defect points are shown in Figure 1.
Figure 1.
Bridge−surface discretization and fixed physical simulated−defect locations.
3.2. Camera Geometry, Incidence, and GSD
Following basic photogrammetric geometry [50], the modeled camera has a 13.2 mm by 8.8 mm sensor, 8.8 mm focal length, and a 4000 by 2667-pixel array. These parameters are used to specify a generic reference camera model that represents a 1-inch-type UAV imaging sensor, and are not designed to replicate the native configuration of a specific commercial camera. The numerical image configuration of 4000 × 2667 is used throughout the present assessment. The pixel array matches the 3:2 sensor aspect ratio to rounding tolerance. For sensor dimensions and and focal length f, the field-of-view angles are
which gives 73.7398 degrees horizontally and 53.1301 degrees vertically. The camera frame is constructed from the look-at direction and a reference up vector. A bridge point is inside the image only when it has positive camera depth and its horizontal and vertical bearing angles do not exceed the corresponding half-FOV angles.
For surface point x, camera position c, and outward unit normal n, incidence is defined using the surface-to-camera ray
so = 0 is a front-on view. Geometric capture additionally requires a 1.2–6.0 m range and . The influence of camera-to-surface distance and viewing angle on image-based three-dimensional reconstruction has also been investigated experimentally [66]. Nominal horizontal GSD and the effective oblique/wind-adjusted GSD are
Because retained observations already satisfy , the numerical floor is inactive within the accepted-observation domain and is therefore omitted from the displayed formulation, where d is range, is image width in pixels, and W is the nondimensional wind index. A retained observation is quality valid when is no greater than 3.5 mm/pixel.
3.3. Practical Basis and Interpretation of the Inspection Criteria
The thresholds in the present framework are not pass/fail thresholds but are planning thresholds that can be configured. There is no universal GSD, camera-to-surface range, incidence angle, or UAV flight speed for image-based bridge inspection specified in the current National Bridge Inspection Standards [1]. The parameters should finally be determined based on the inspection goal, defect to be inspected, imaging system, bridge geometry, and working environment.
The adopted effective-GSD limit of 3.5 mm/pixel is used here as a general image-scale criterion for surface-coverage assessment and should not be interpreted as a fine-crack detection threshold. The number of image pixels across the feature is approximately
where is the physical width of the feature and is the approximate number of image pixels spanning that feature.
Therefore, a 7 mm feature will take up about two pixels and a 10.5 mm feature will take up about three pixels at the limiting value of 3.5 mm/pixel. The threshold for sub-millimeter cracking is thus significantly lower than the GSD used in this numerical study. Peng et al. [10] studied the recognition of bridge cracks larger than 0.2 mm by UAV, and recent bridge image-quality and high-resolution camera-planning studies have focused on a target spatial resolution of about 1 mm/pixel [19,67]. The GSD criterion should therefore be chosen from the minimum defect scale of interest and the number of pixels needed for the visual interpretation or detection method of interest, and not directly from the present numerical case. Threshold values of 1 mm/pixel can be used as an example of a reasonable practical reference threshold for high-resolution structural inspection. In the current study, such a threshold value is applied to define the resolution properties of the observed structures and not as a detection limit that has been experimentally tested for a specific bridge defect. Thus, fulfilling the 1 mm/pixel threshold value should not be regarded as a guarantee of crack, corrosion, spalling, or other defect detection.
The range of 1.2–6.0 m is also considered a numerical close-range imaging envelope. Peng et al. [10] reported stable operating distances of about 2.5–6 m under general bridge conditions and 1.5–3 m when approaching bridge undersides. The 6 m upper bound is consistent with published close-range bridge imaging experience, while the 1.2 m lower bound is a model-specific limit and should be replaced by platform-, obstacle-, and site-specific clearance requirements in an operational mission. The maximum incidence angle of 60° is slightly more conservative than the 65° maximum used in recent high-resolution UAV bridge-imaging studies [67]. The speed of 1.5 m/s is a representative close-range simulation speed and not a regulatory limit; published structural-inspection planning studies have different speeds depending on platform and inspection objective. Therefore, the numerical coverage and IQS values presented here are subject to these criteria and should not be viewed as a general pass rate for bridge inspections.
The wind-perturbation scheme serves as an idealized test for numerical analysis but does not serve as a calibrated model of any particular UAV control system. While the sinusoidal term constitutes a reproducible time-varying perturbation, the zero-mean Gaussian term provides variability across trials for the simulated camera pose. Consequently, the sinusoidal phase is deterministic within the context of the mission time and is not randomly sampled for each Monte Carlo trial. Trial-to-trial variability, therefore, results from the Gaussian term in the perturbation. It is important to note that the disturbance parameters used in the model remain identical across all route designs and all wind strengths to ensure internal consistency between the routes.
The three configurations of inspections have been made through the use of predetermined route geometries in the simulation. In the case of the Basic configuration, exterior girder passes are used; in the case of the Improved configuration, the exterior inspection is coupled with an underside strip as well as separate pier inspection. The Quality-aware configuration makes use of three underside inspection strips. For both cases of disturbances, the same route definitions have been used in order to study the effect of disturbances on the inspections without changing the route geometry plan.
3.4. Fixed Physical Simulated Defects
Twelve simulated defects are stratified across the deck underside, both girders, and two pier faces. Each location is defined by continuous component-local coordinates and evaluated directly with the camera model. A nearest-cell index is retained only for mapping; it does not determine visibility. This prevents mesh refinement from moving a defect. The output, therefore, is called the geometric visibility of the simulated-defect locations, and it is just a statement that the prescribed locations meet the modeled observation criteria and is not a measure of the sensitivity of the crack detection, the inspector’s recognition, or the field inspection performance. The 12 simulated-defect locations are fixed before the Monte Carlo evaluation and are not resampled between routes, wind levels, or trials; the same continuous physical coordinates are therefore evaluated in every case.
3.5. Flight Strategies and Mission Accounting
The three strategies are predefined candidate routes to evaluate the framework and are not generated or optimized by the framework itself. They were chosen as a gradual sequence of exterior-only to more detailed coverage of components.
The Basic strategy shows the two faces of the exterior girders and is the lowest complexity baseline. It does not intentionally image the deck underside or the modeled pier faces.
The Improved strategy keeps the exterior-girder observations and introduces one longitudinal deck-underside strip and specific observations of the modeled pier faces. This route assesses the amount of coverage that is gained by adding passes to the exterior baseline that are specific to the component.
The Quality-aware route is an extension of the Improved route, with the addition of three strips of sampling under the deck instead of one. The Quality-aware route is an extension of the Improved route, with three longitudinal strips on the underside of the deck. The extra strips decrease the dependence on the edge of the camera field of view and increase the chances for surface cells to meet the incidence-angle, GSD, and repeated-capture criteria. Quality-aware is the design rationale of this predefined candidate route and not route optimization. Quality-aware is thus not a term for route optimization, but rather a design rationale of this predefined candidate route.
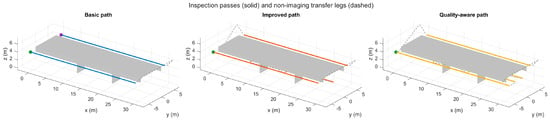
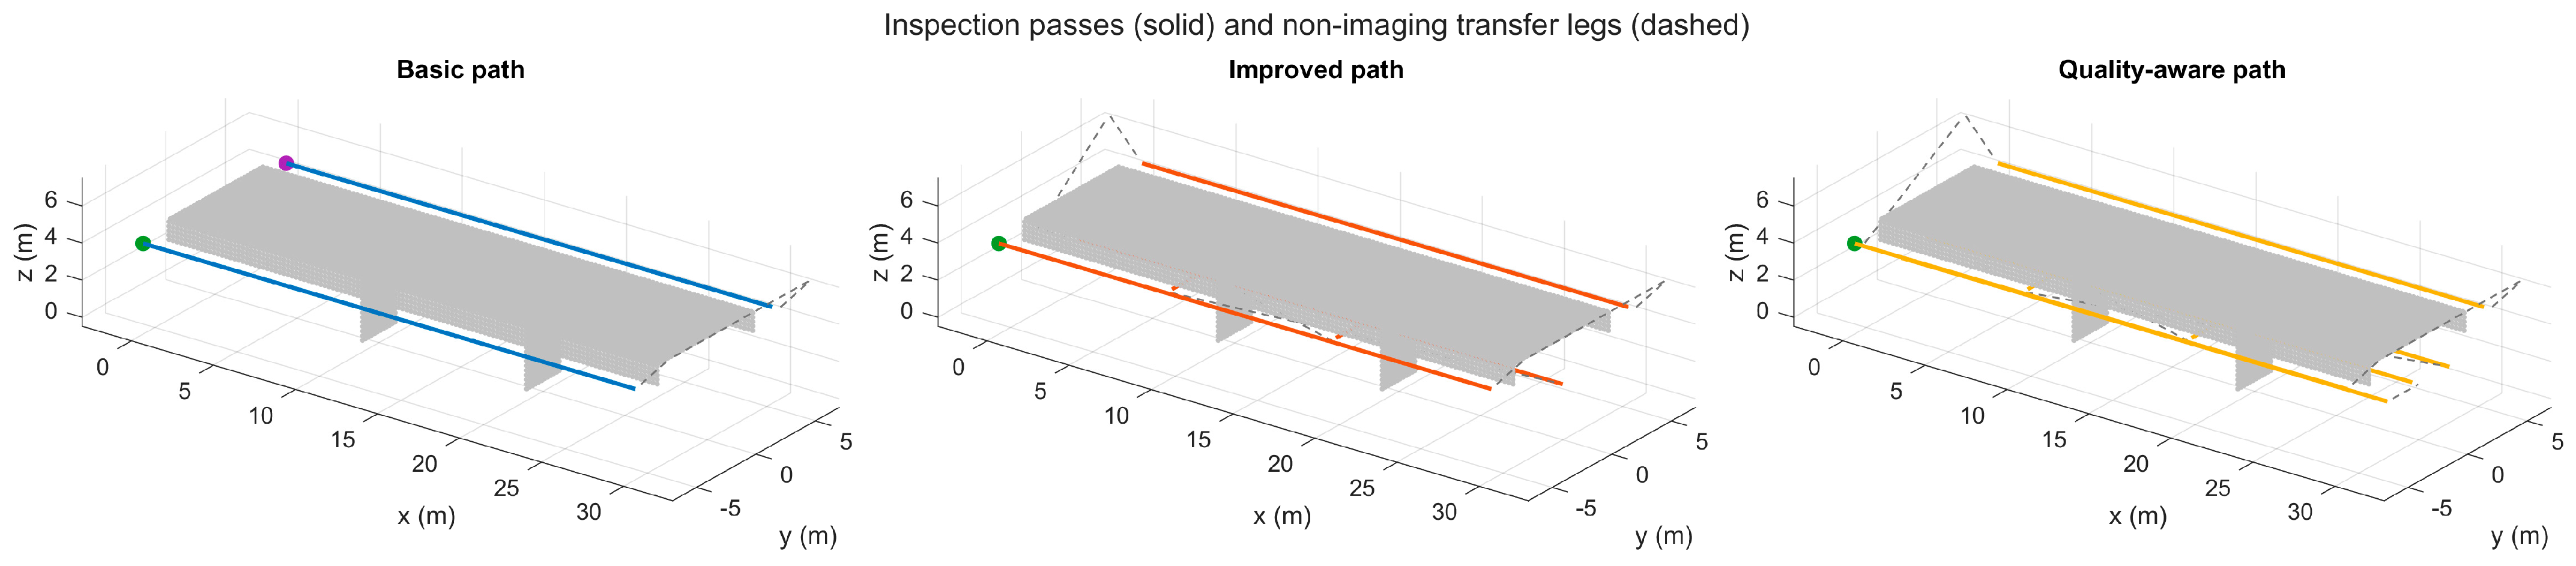
In imaging segments, the camera look-at target is linked to the inspected surface, so that the nominal optical axis is always pointing towards the inspected surface. Consecutive imaging passes are connected by capture-disabled transfer segments. Transfer segments do not add inspection observations but do add to total mission distance and duration. The speed of inspection is 1.5 m/s, the speed of transfer is 2.0 m/s, and the time step of the simulation is 0.25 s. For reproducibility, the nominal imaging-pass geometry is summarized in Table 1. The bridge fixed coordinate system is defined as along the length of the bridge 30 m, across the width of the bridge 8 m and vertically. Camera targets are moved with the imaging pass to keep the nominal optical axis pointing at the surface to be inspected. Figure 2 presents the different candidate inspection routes.
Table 1.
Nominal imaging-pass geometry for the three predefined UAV inspection routes.
Figure 2.
Basic, Improved, and Quality−aware candidate inspection routes. Solid segments represent imaging passes and dashed segments represent capture-disabled transfers. Basic contains exterior−girder observations only; Improved adds deck-underside and pier-facing observations; Quality−aware increases deck−underside sampling to three longitudinal strips.
3.6. Stochastic Wind Stress Test
Four representative wind levels are considered: 0, 3, 6, and 9 m/s. They are normalized using , giving , 0.25, 0.50, and 0.75. The upper limit of is intentionally limited as the formulation is designed as a pre-flight inspection stress test and not as a UAV flight-envelope model for certification level flight at the normalization speed of 12 m/s, which would require platform- and controller-specific validation.
Seeded sinusoidal and Gaussian terms are added to the camera position and look-at direction. The sinusoidal amplitude, frequency and phase are deterministic functions of mission time for a given wind level, while the Gaussian perturbation terms are different for each Monte Carlo trial and are based on a seeded random sequence. Thus, the sinusoidal part is not a random phase disturbance, but rather a repeatable time-dependent offset overlaid on trial-varying zero-mean Gaussian perturbations. The retained-frame loss probability is , and the minimum number of valid retained observations is , which results in one, two, three, and four required observations at the four wind levels. The image-quality formulation also decreases the quality margin available as the wind severity increases. These are numerical stress-test parameters, not aerodynamic or controller parameters.
The model does not address rigid-body UAV dynamics, control-system response, turbulence spectra, bridge-wake aerodynamics, GNSS degradation, or platform-specific wind limits. Therefore, the wind results should be used as a comparison between the three candidate routes and not as a prediction of the flight behavior of a specific UAV.
3.7. Area-Weighted Outcomes and Inspection Quality Score
Let denote the physical area of surface cell , and let when that cell satisfies all valid-observation requirements and otherwise. Area-weighted valid coverage is
simulated-defect visibility is the percentage of the fixed simulated-defect locations that meet the geometric and image-quality requirements. This quantity is considered a supplementary sparse location metric and is not used as a replacement for area coverage, as it is based on a limited number of prescribed locations.
is the minimum image-scale value accepted for a geometrically captured cell from all of observations retained in that cell. The local resolution margin is
and is the area-weighted mean of over cells captured geometrically. The absence of cells that are never captured is already represented by , so they do not contribute to the resolution-margin average.
B is a bounded mission-level motion/stability proxy and does not represent physical exposure blur. It is calculated at mission level from the representative simulated motion and wind severity.
The mission-level mean translational speed is computed over the entire nominal mission, including all the imaging passes as well as all the non-imaging segments for the transfer. It is calculated as the total flown distance divided by the total mission duration,
Mission-level mean absolute yaw rate is computed at the nominal camera look-at direction for the entire mission including transfer segments. For sample , yaw angle is derived from the horizontal components of the camera look-at vector, which is normalized,
and
Here, s. The nominal route geometry gives mean absolute yaw rates of approximately 3.67°/s for Basic, 2.82°/s for Improved, and 1.93°/s for Quality-aware. The wind index enters separately through the term in the motion/stability formulation, so the nominal mission yaw-rate quantity is not redefined for each wind level.
According to the current formulation, the Inspection Quality Score (IQS) consists of the valid-coverage term, the resolution-related term, and the motion stability term. and denote the average speeds of the UAV during the mission and the average yaw rate, respectively. They are defined for all route types and for all disturbances in the same manner. The R term indicates the normalized resolution quality term while the term indicates the normalized motion stability term. It is therefore appropriate to view the IQS as a relative index for evaluating the quality of inspection routes within the present numerical scheme.
These weights are not empirically derived utilities, but rather transparent planning decisions. IQS is therefore used as a comparative summary index and not as a probability of successful inspection. In this context, the adopted weighting coefficients used in the formulation of IQS are model design parameters and not calibration parameter values that are derived through experimental means. As such, one should not construe the value of IQS as an objective evaluation of the quality of bridge inspections. The aim of the adopted weighting approach is to derive a consistent scale parameter to compare the three routes based on the same assumptions. Since the current research deals with showing the effectiveness of the route evaluation approach that has been proposed, calibration of the weights based on field inspections is outside the scope of this study.
3.8. Experimental Design and Statistical Analysis
The experiment crosses three paths and four wind levels with 30 trials per case (360 simulations). The seed schedule is deterministic and unique for every path-wind-trial combination. Means and sample standard deviations are reported. Two-sided 95% confidence intervals use Student’s t with 29 degrees of freedom. Path comparisons utilize Welch standard errors and Welch–Satterthwaite degrees of freedom; the analysis considers the 0.975 Student’s t-critical value using a Cornish–Fisher expansion, circumventing reliance on a statistics toolbox. All simulations and post-processing were performed in MATLAB R2024a (MathWorks, Natick, MA, USA).
Table 2 summarizes the principal model inputs, derived quantities, and reproducibility settings used in the present framework. Specifically, it lists the precise 336 m2 inspection area, the 5424-element generation mesh, the 3:2 image-to-sensor aspect ratio, the 3.5 mm/pixel image quality criteria, and the 30-experiment seed-based design. The provenance column allows separation of assumptions into their sources versus derived results, thus not mixing categories.
Table 2.
Model parameters.
4. Verification and Numerical Adequacy
4.1. Analytical and Invariance Tests
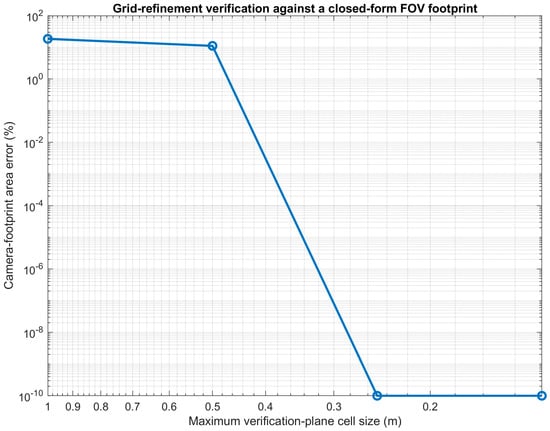
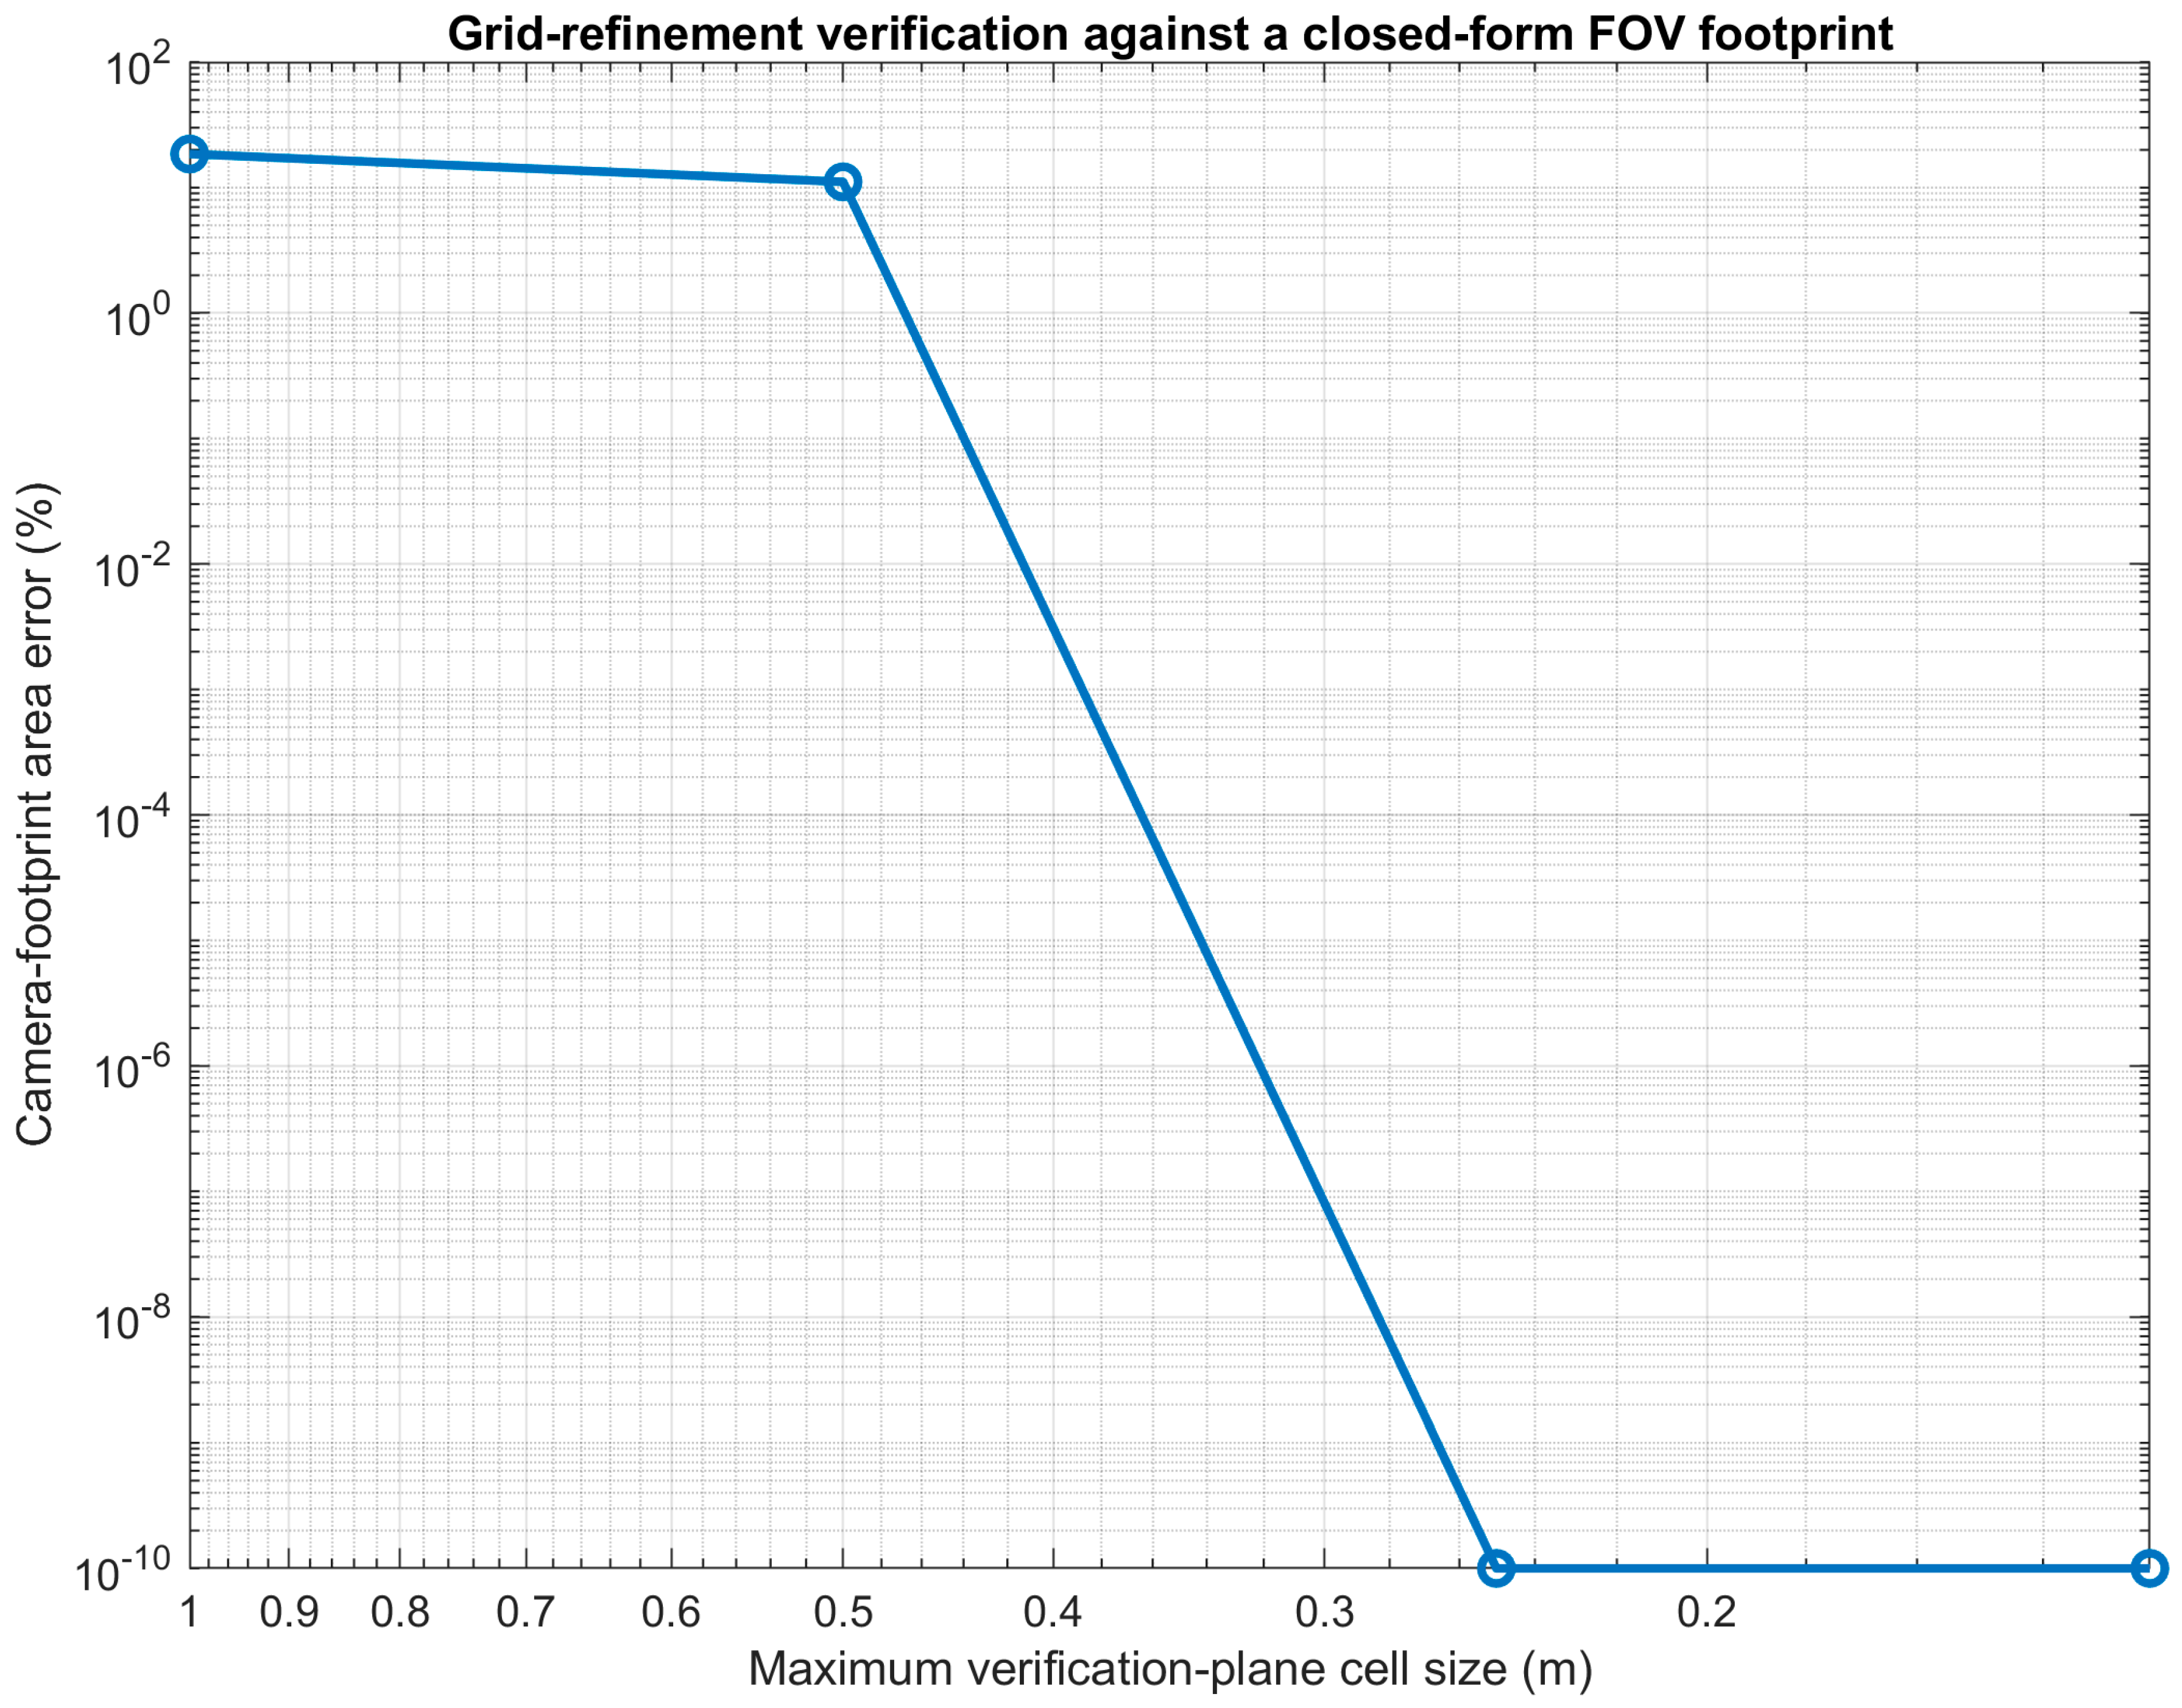
A total of 18 tests confirmed closed-form FOV and GSD calculation, sensor pixel aspect ratio, correct area, production cell number, unit normal, defect uniqueness, orientation front and back, points just inside and outside horizontal FOV boundary, seeded metric and cell map repeatability, area convergence, deterministic ordering of path, and closed-form rectangular camera footprint. All tests were successful. The footprint-area verification is a comparison between the area derived from the numerical classification based on the grid and the area of the camera footprint derived from a closed-form rectangular camera footprint. The relative error decreases from 18.52% at a 1.0 m grid to 11.11% at 0.5 m and reaches zero for the 0.25 and 0.125 m grids. The zero error at these two resolutions is due to the rectangular footprint boundaries matching the verification grids. These cases are thus consistent in implementation and should not be taken as a general discretization-error estimate. Figure 3 presents the grid refinement plot.
Figure 3.
Grid-refinement verification against the closed−form camera−footprint area.
In Table 3, the results are displayed both on an individual test-by-test basis and the acceptance tolerance limit. The results for area closure, unit normals, reproducibility and footprint assessment having zero or machine precision-level error indicate that the implementation is passing its analytical and invariance test with sufficient margin from specified tolerances.
Table 3.
Numerical verification tests.
The candidate-route ordering check is provided as an implementation sanity check. It validates that the deterministic route definitions generate the desired Basic < Improved < Quality-aware coverage ordering but does not consider it as an independent analytical validation test. The acceptance limits in Table 3 are based on the numerical value of each check. Analytical identities and invariance checks are performed with tight tolerances, close to floating-point precision, while the sensor/pixel aspect-ratio check is performed with a wider tolerance, since the image height must be an integer number of pixels and the selected 2667-pixel height is only an approximation of the exact 3:2 sensor aspect ratio. The resulting aspect-consistency error of remains below the adopted tolerance. The aspect-ratio tolerance is also consistent with rounding the image height to the nearest integer pixel, which introduces a maximum rounding uncertainty of about ±0.5 pixel. This aspect-consistency error is , which is within this tolerance.
4.2. Bridge-Mesh Sensitivity
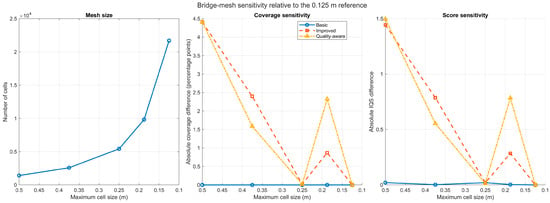
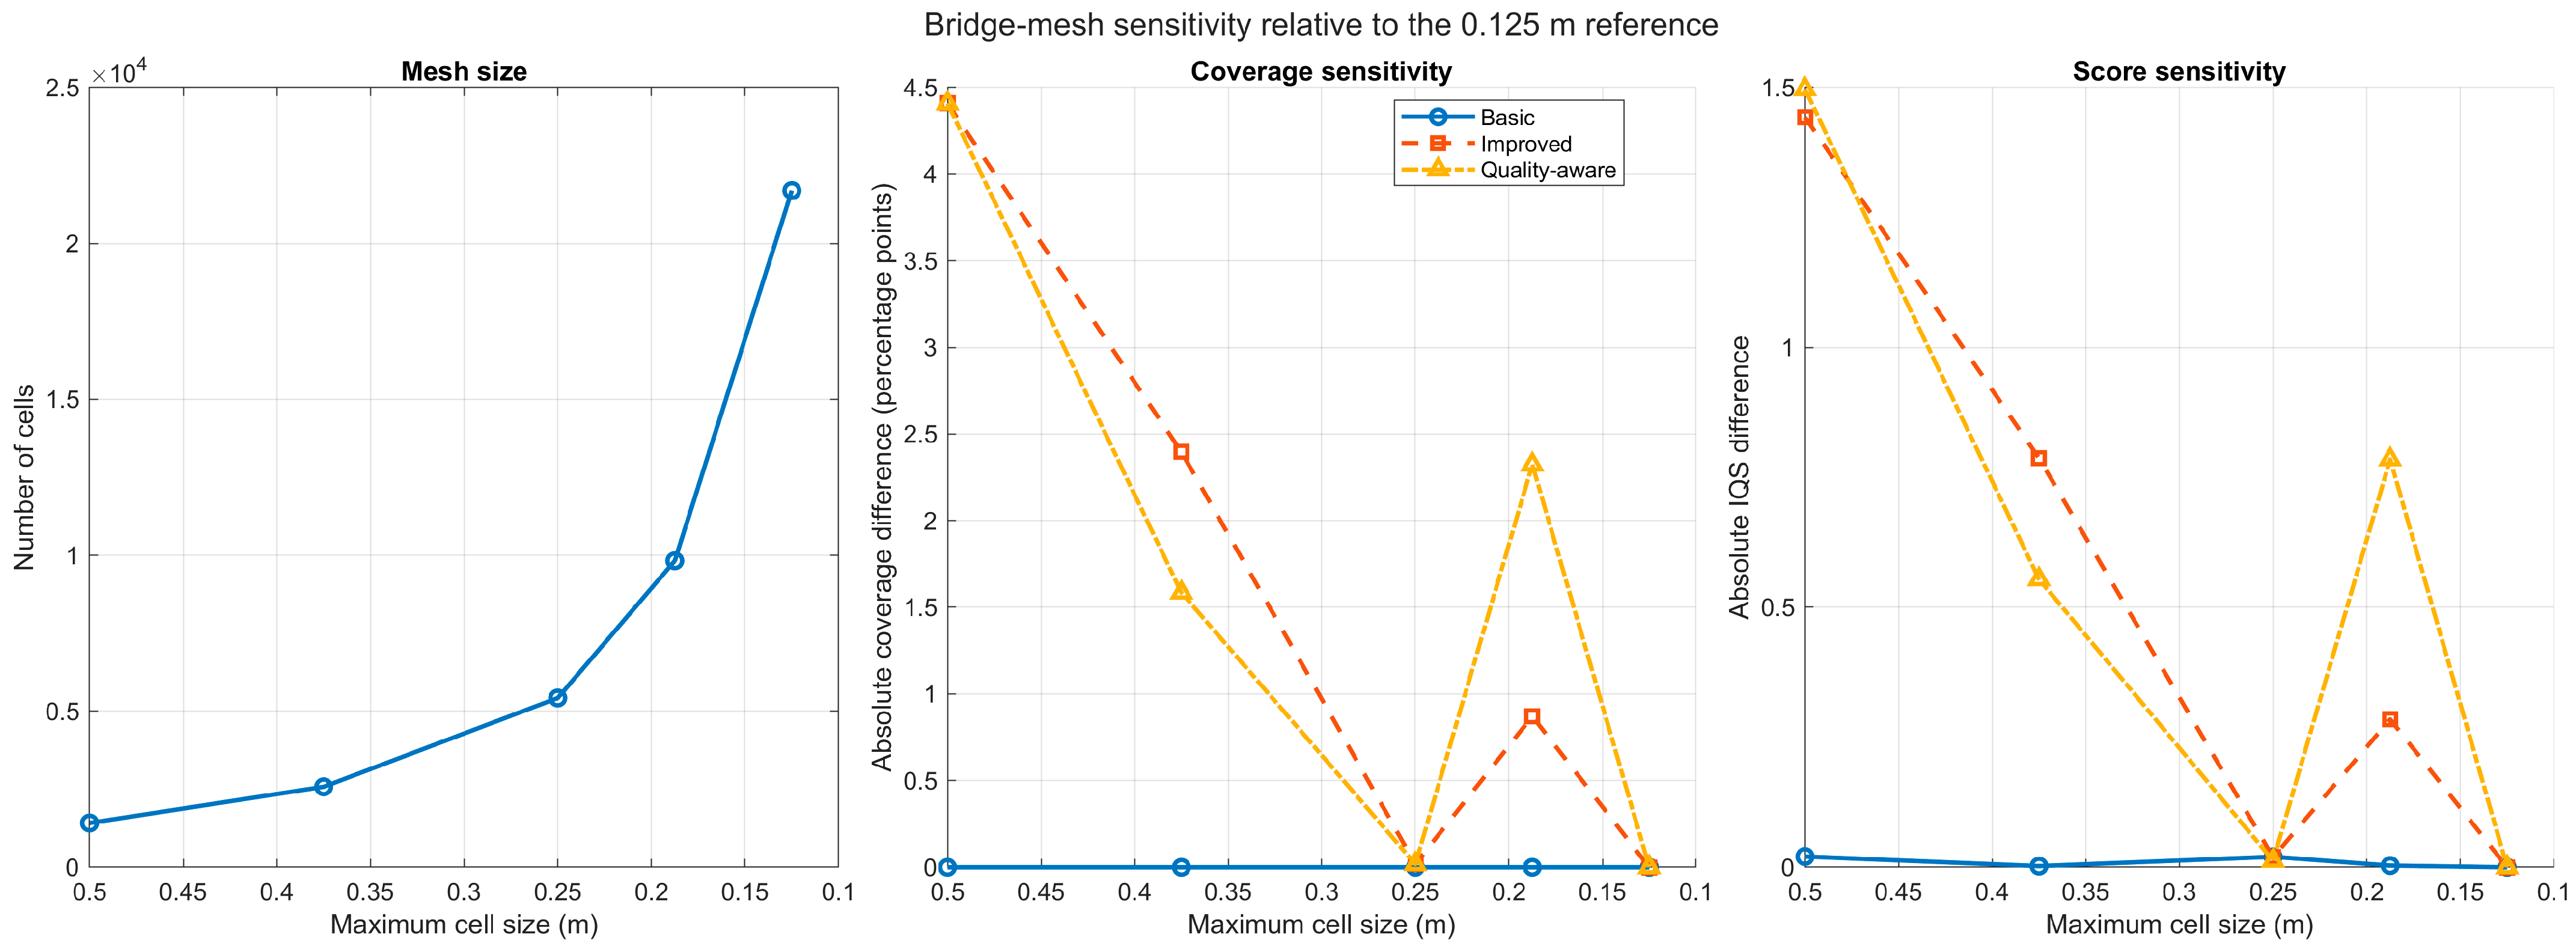
A deterministic mesh-sensitivity study was performed with maximum cell sizes of 0.5, 0.375, 0.25, 0.1875, and 0.125 m (Figure 4). Results are non-monotonic due to sensitivity of centroid-classification method to relative alignment of cell centroids and camera-footprint boundaries. The mesh response is non-monotonic because centroid-based classification is dependent on the relative alignment of the cell centers and the camera-footprint boundaries. The difference between the 0.25 m and 0.125 m cases is only 0.019 percentage points for the present geometry, but larger differences are found for intermediate meshes. This close agreement of this one pair of meshes is therefore not interpreted as proof of monotonic convergence; the full sequence of meshes in Table 4 is used to characterize the discretization sensitivity.
Figure 4.
Bridge-mesh sensitivity relative to the 0.125 m reference.
Table 4.
Deterministic bridge-mesh sensitivity relative to the 0.125 m reference.
The zero difference at the 0.125 m point in Figure 4 is to be expected since this mesh size is the numerical reference with which the other mesh sizes are compared. It thus does not imply a physical or model-form error of zero. Likewise, the zero-footprint error in Figure 3 is only for analytical verification cases that are aligned to the grid. Both results should not be taken as confirmation of the physical reality.
The bridge-mesh response is non-monotonic as shown in Table 4. The departures are about 4.41 percentage points, relative to the 0.125 m reference, across the tested meshes, and the 0.25 m case is in good agreement with the reference. For this reason, the complete mesh sequence, not just the m pair, is used to characterize discretization sensitivity.
As can be seen from the results obtained for the mesh-sensitivity analysis, the key features in terms of coverage are not greatly influenced by the chosen surface discretization values. On the other hand, although the low-wind variations are fairly minor when compared with the numerical variations obtained during the mesh-sensitivity analysis, they are still treated with caution as results of the numerical model and not physical effects, since a mesh convergence analysis under disturbed conditions is necessary to fully exclude mesh effects for each wind condition.
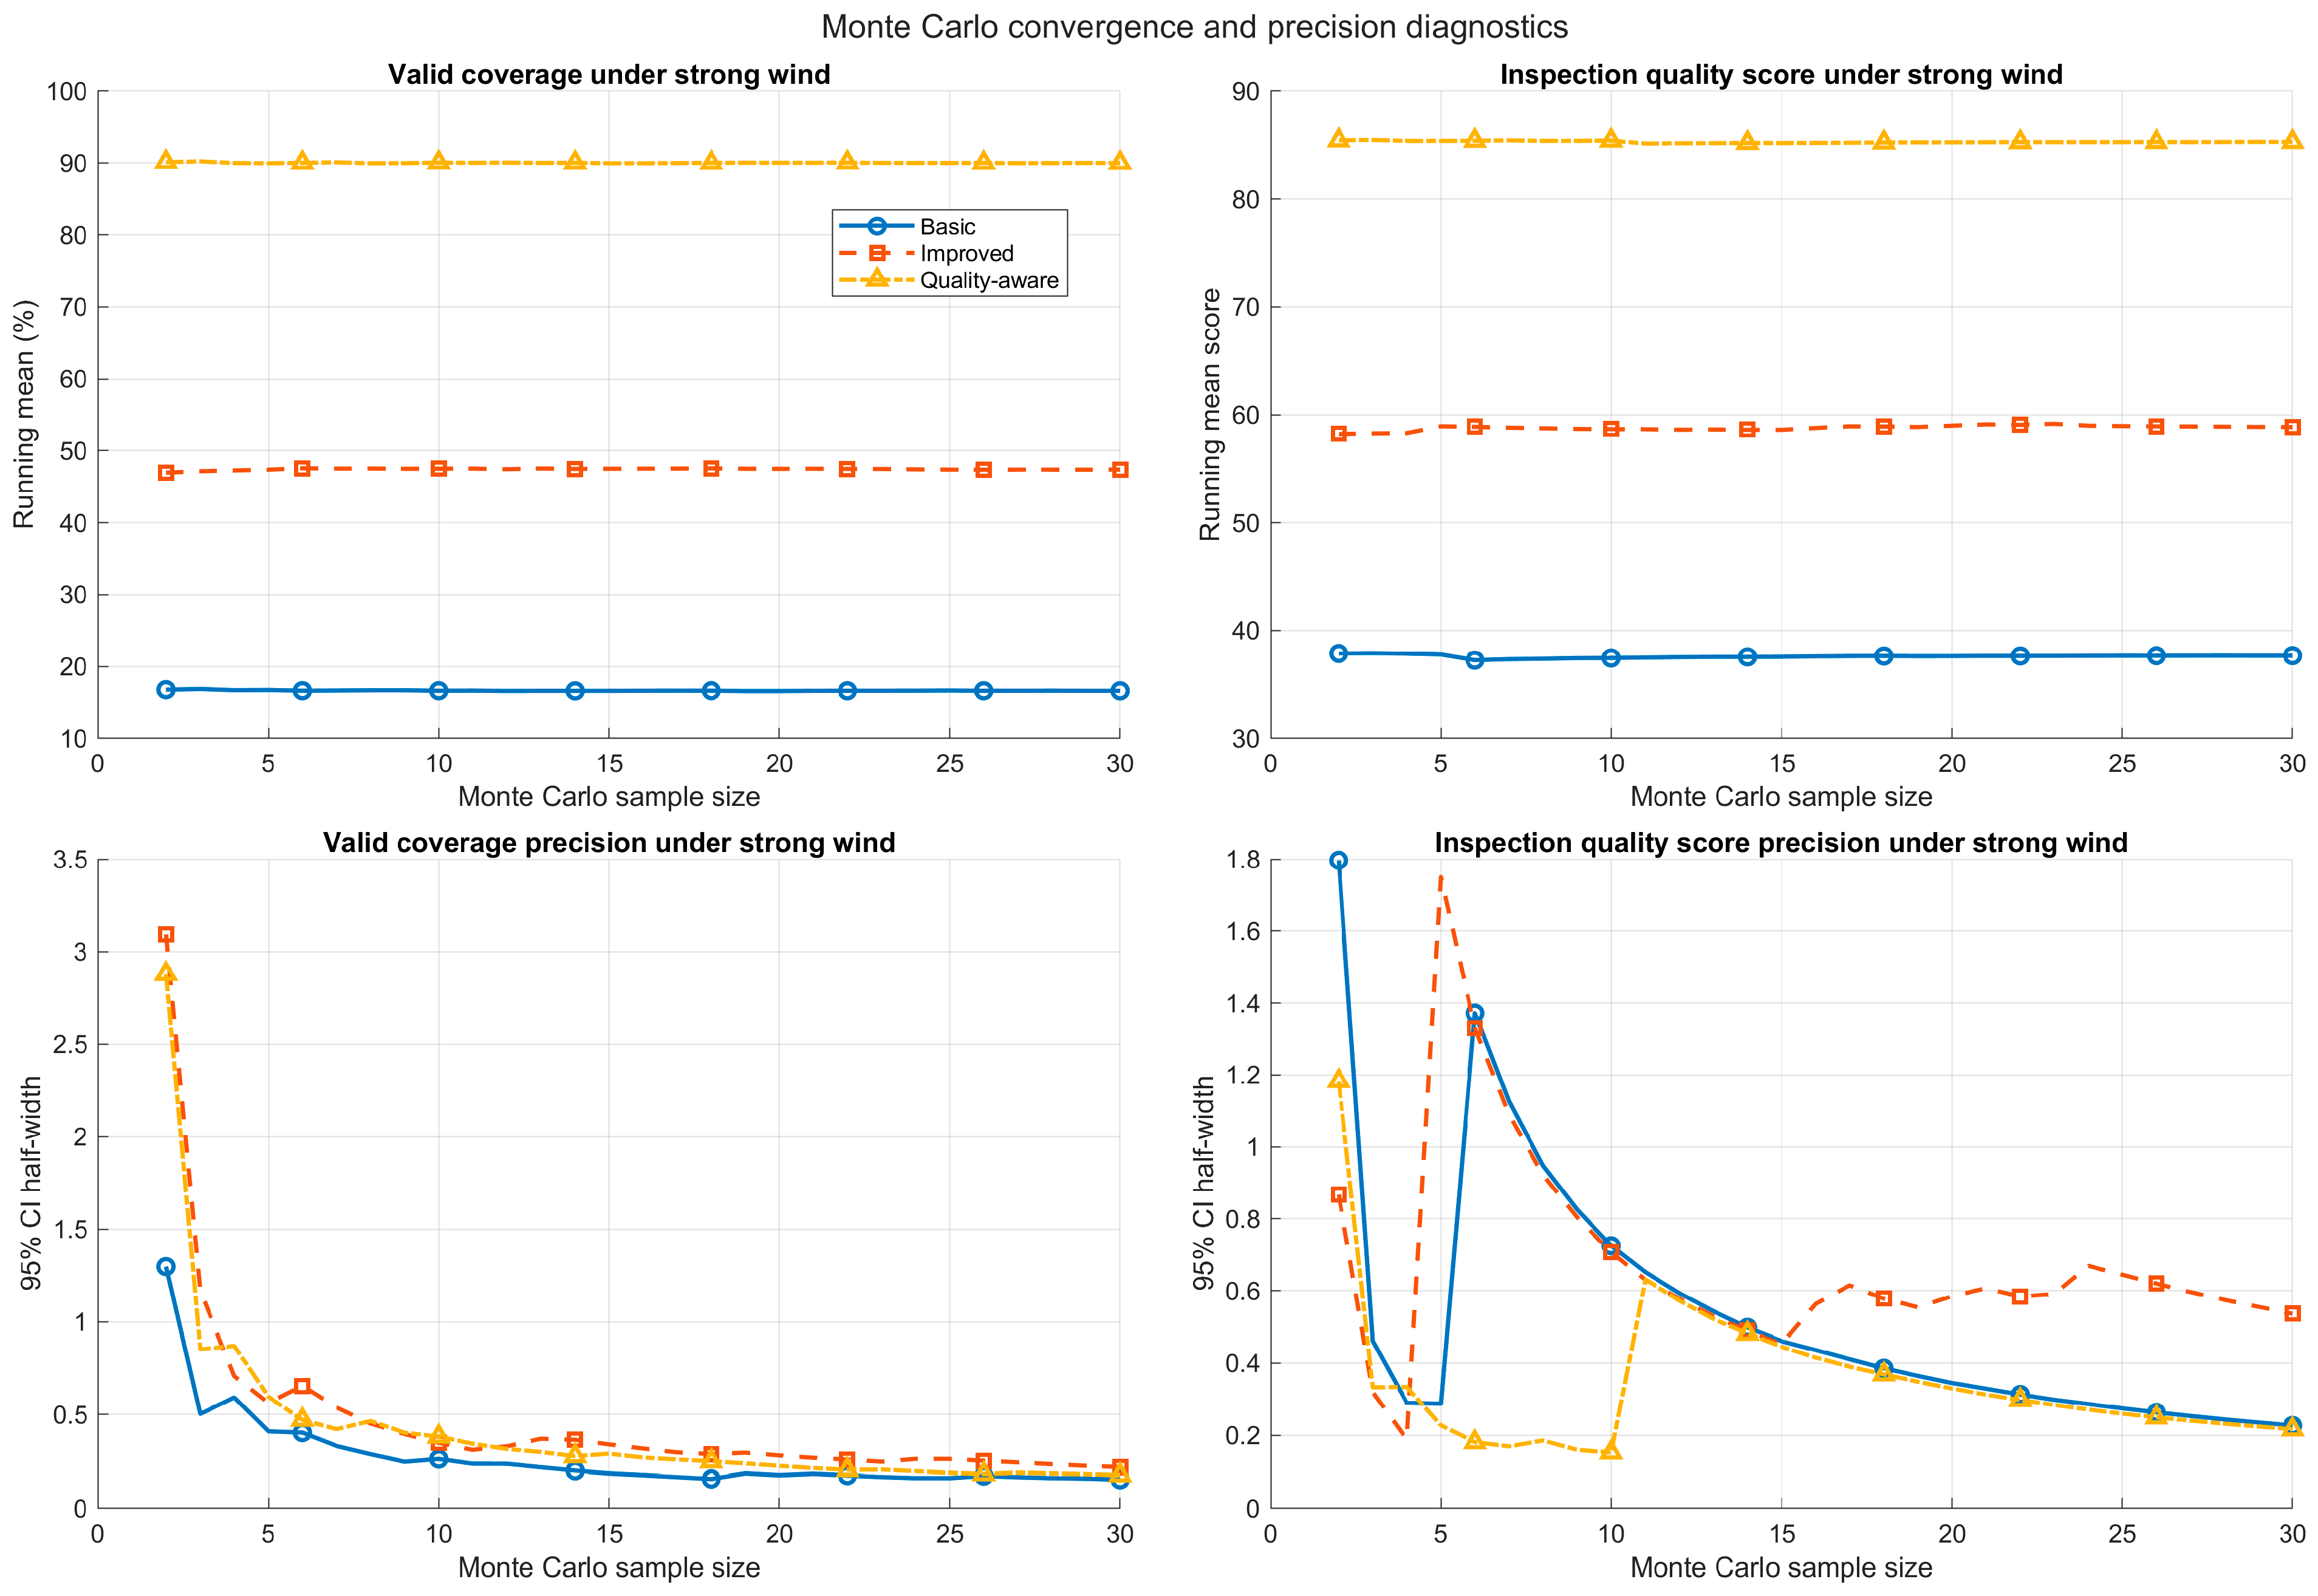
4.3. Monte Carlo Convergence
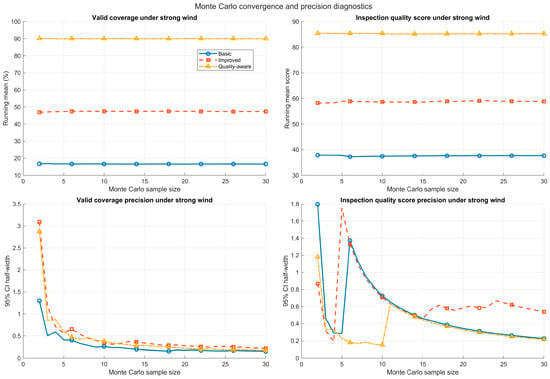
Running means stabilize well before 30 trials in the strong-wind cases (Figure 5). At n = 30, coverage 95% confidence-interval half-widths are 0.153, 0.220, and 0.177 percentage points for Basic, Improved, and Quality-aware. These correspond to 0.92%, 0.46%, and 0.20% of their means, indicating adequate precision for the reported path differences. The reported confidence intervals are only valid for the precision of the Monte Carlo sampling of the specified stochastic model. They do not account for uncertainty due to thresholds, wind coefficients, bridge idealization, IQS weights, or model form.
Figure 5.
Monte Carlo running means and confidence-interval precision under strong wind.
5. Results
5.1. Area Coverage
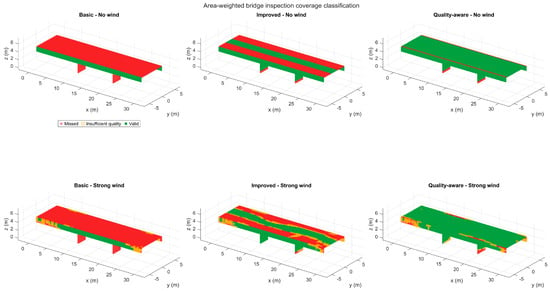
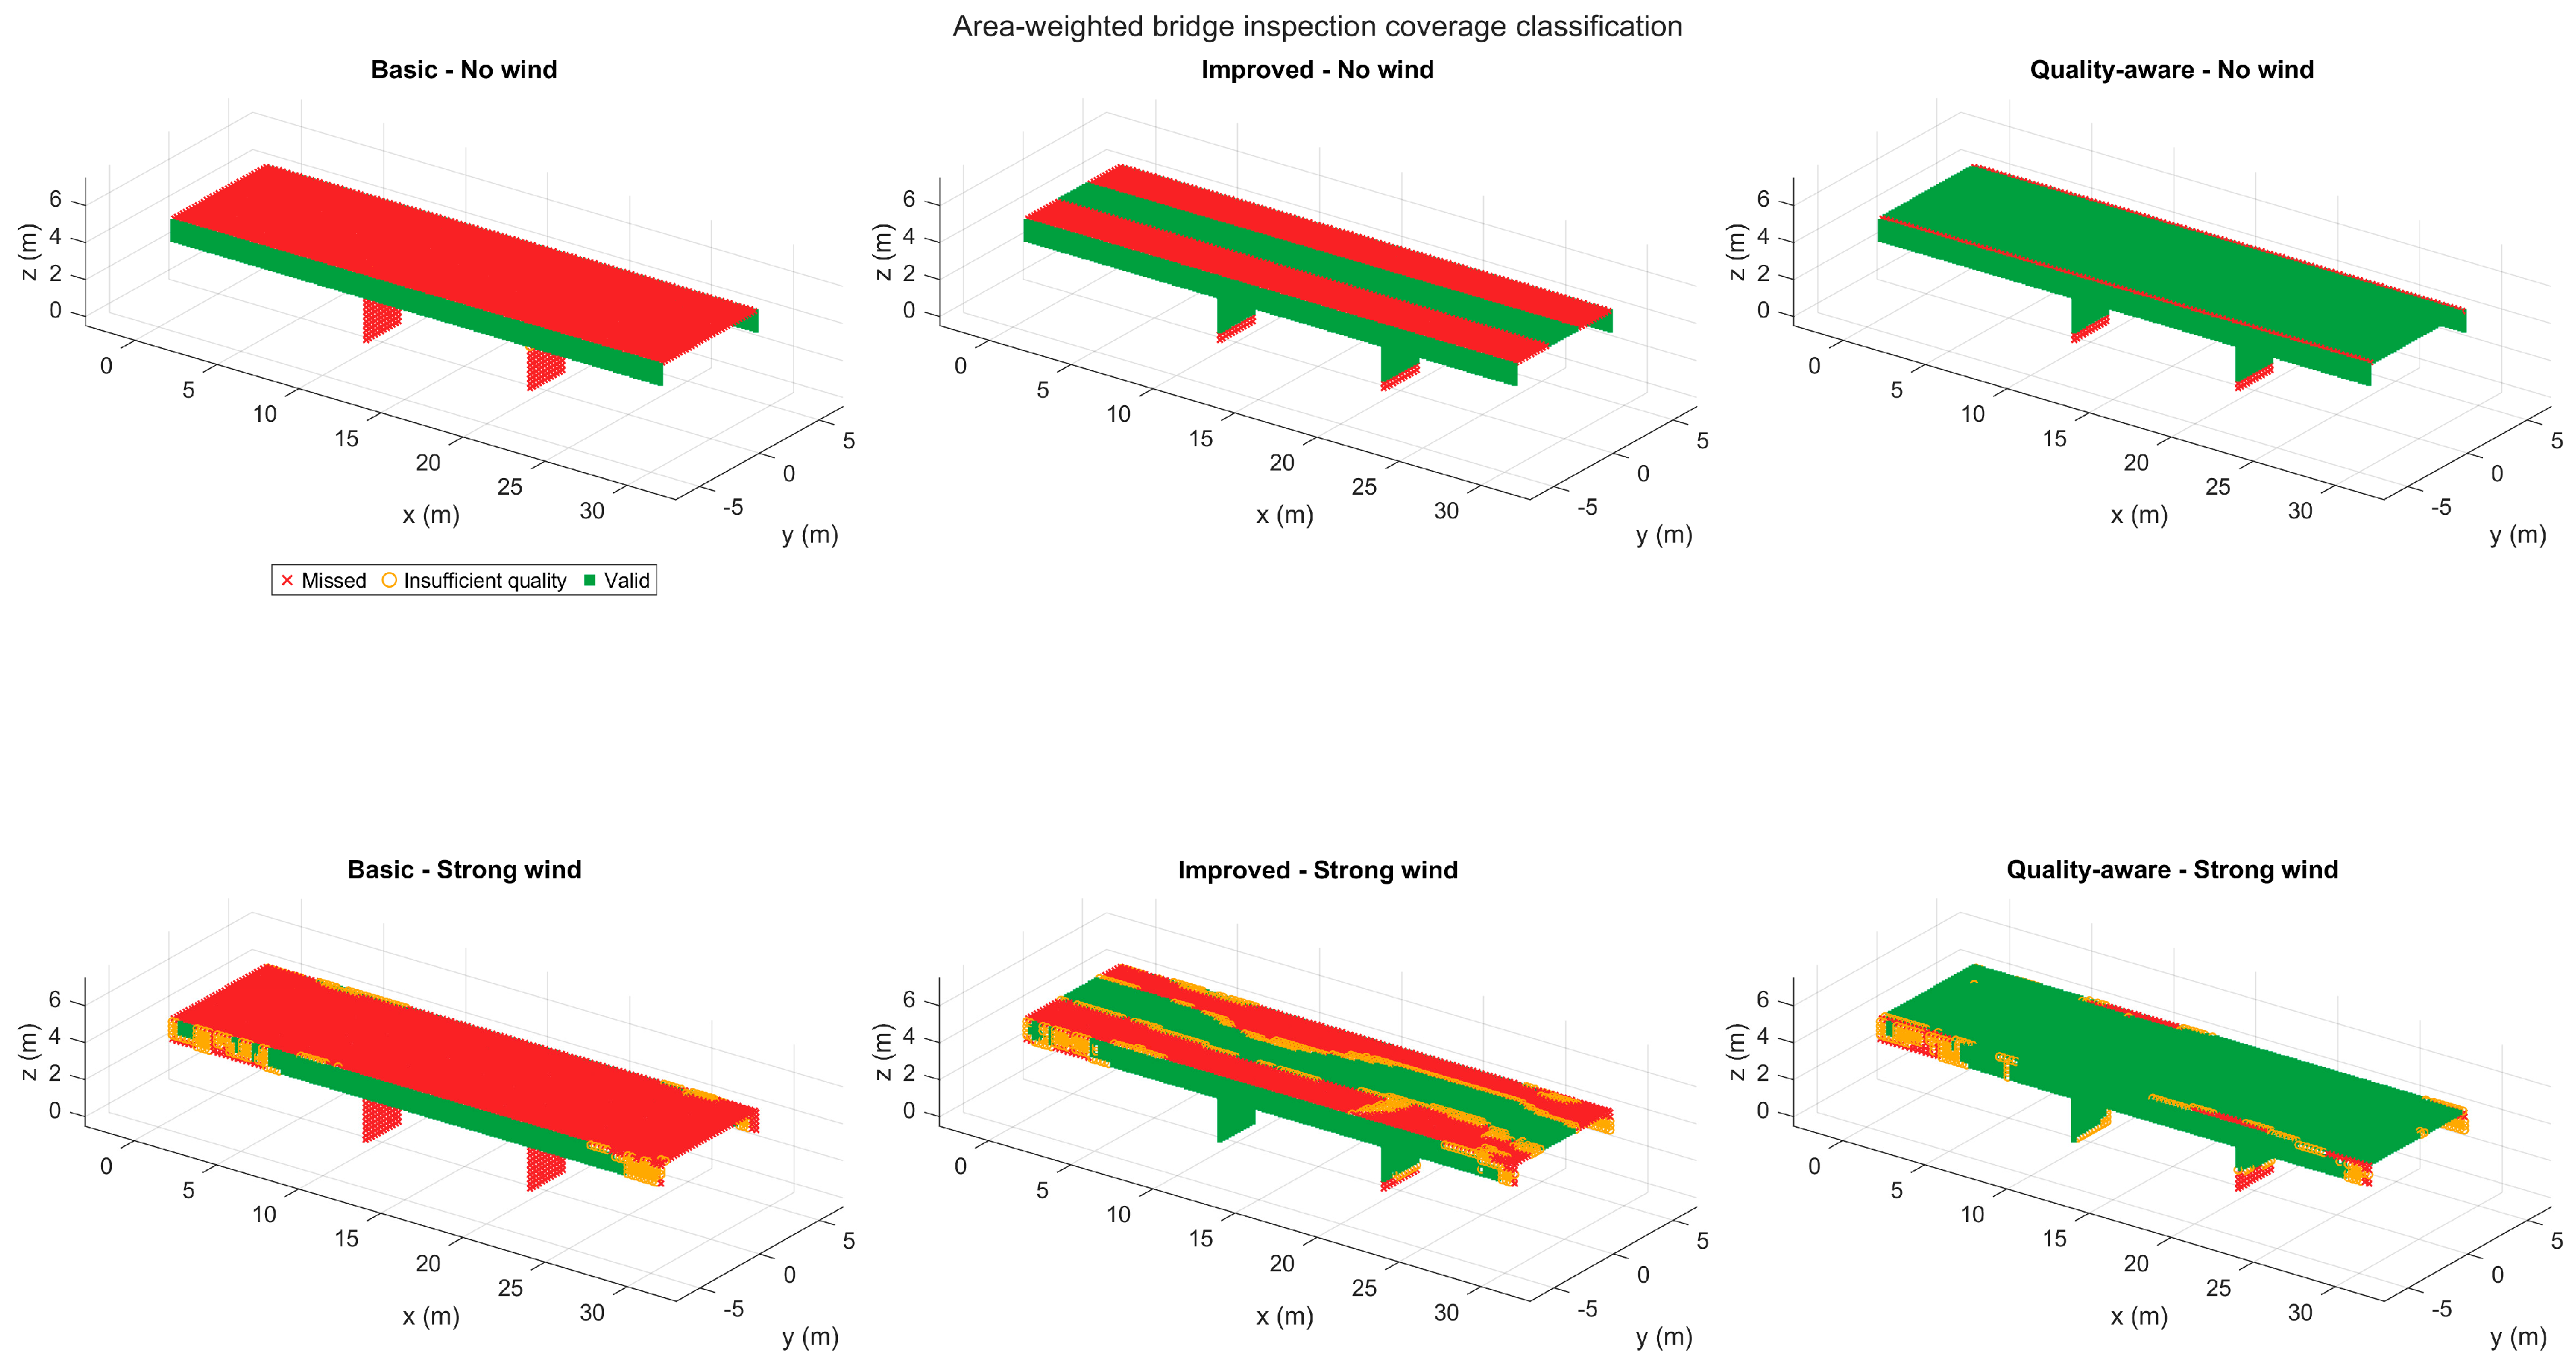
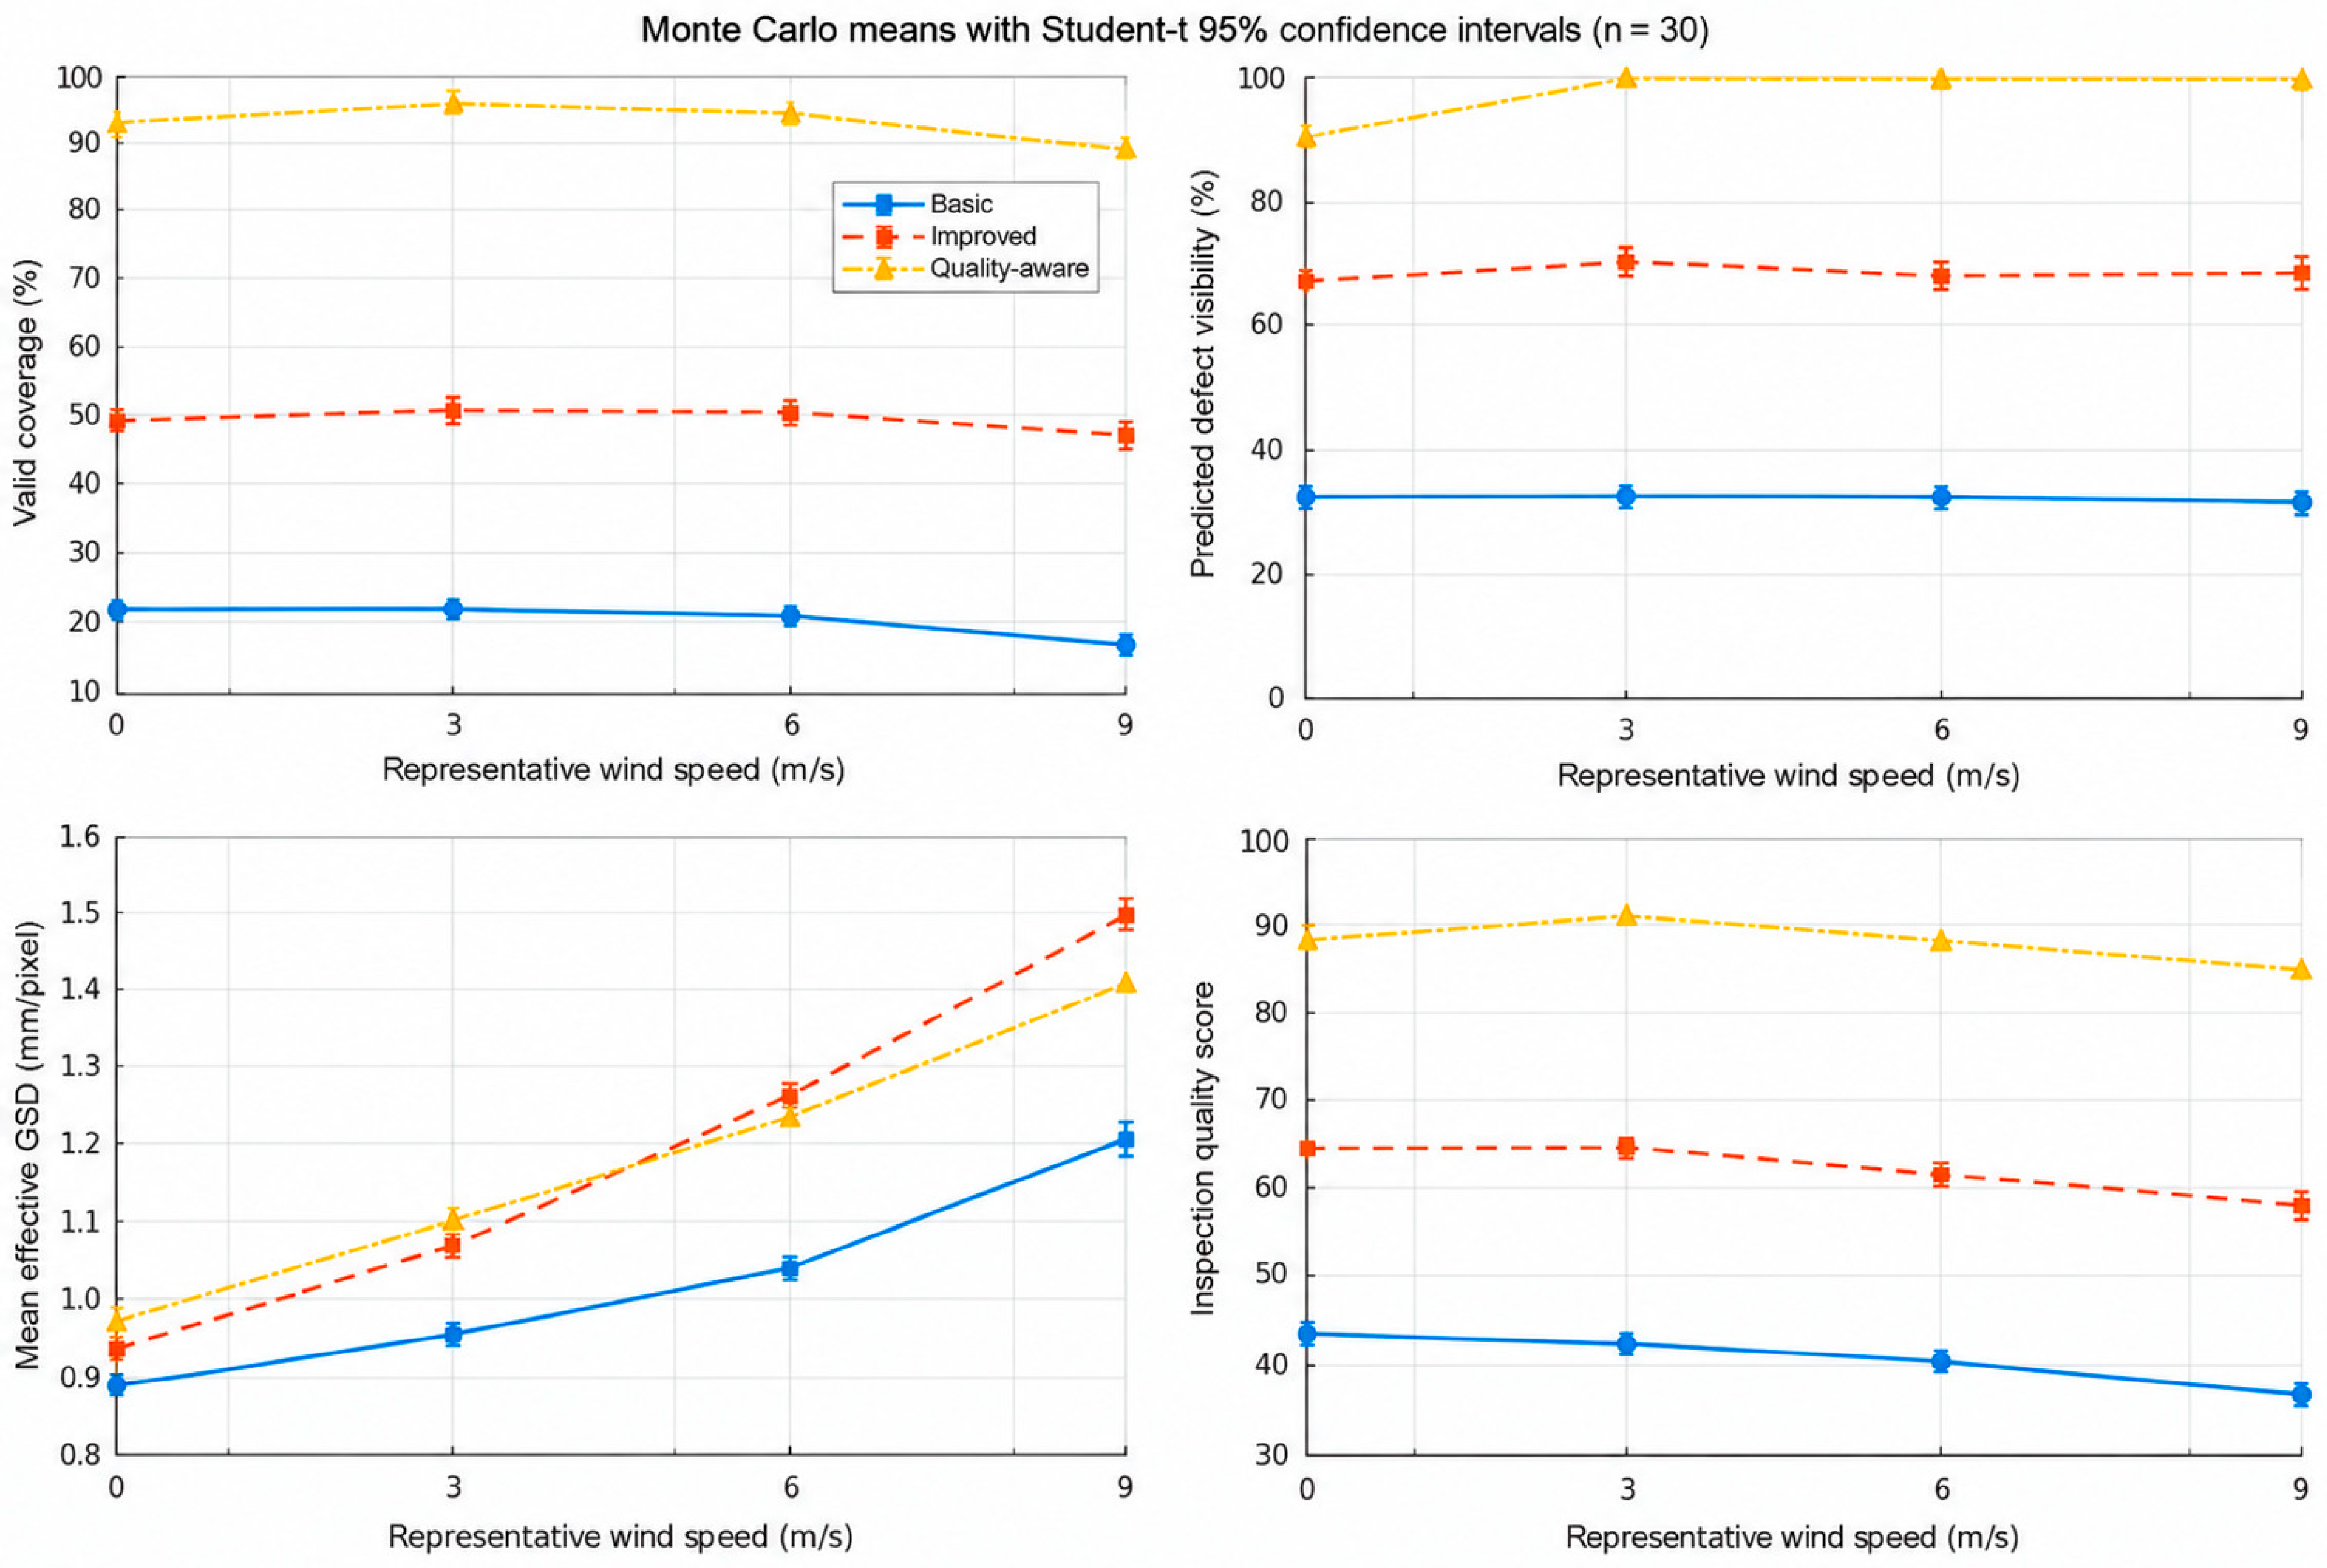
Basic coverage is 21.43 ± 0.00% under no wind and 16.64 ± 0.41% under strong wind. Improved reaches 49.33 ± 0.02% and 47.38 ± 0.59%, whereas Quality-aware reaches 93.97 ± 0.02% and 90.01 ± 0.47%. Coverage maps in Figure 6 show that Basic omits the deck underside and pier faces, Improved covers component-specific bands, and Quality-aware covers most modeled area while retaining narrow edge and boundary losses.
Figure 6.
Representative area-weighted coverage classifications for no−wind and strong−wind cases.
Under strong wind, Improved exceeds Basic by 30.74 percentage points (95% CI 30.48–31.00). Quality-aware exceeds Basic by 73.38 percentage points and Improved by 42.63 percentage points; neither interval approaches zero.
5.2. Simulated-Defect Geometric Visibility
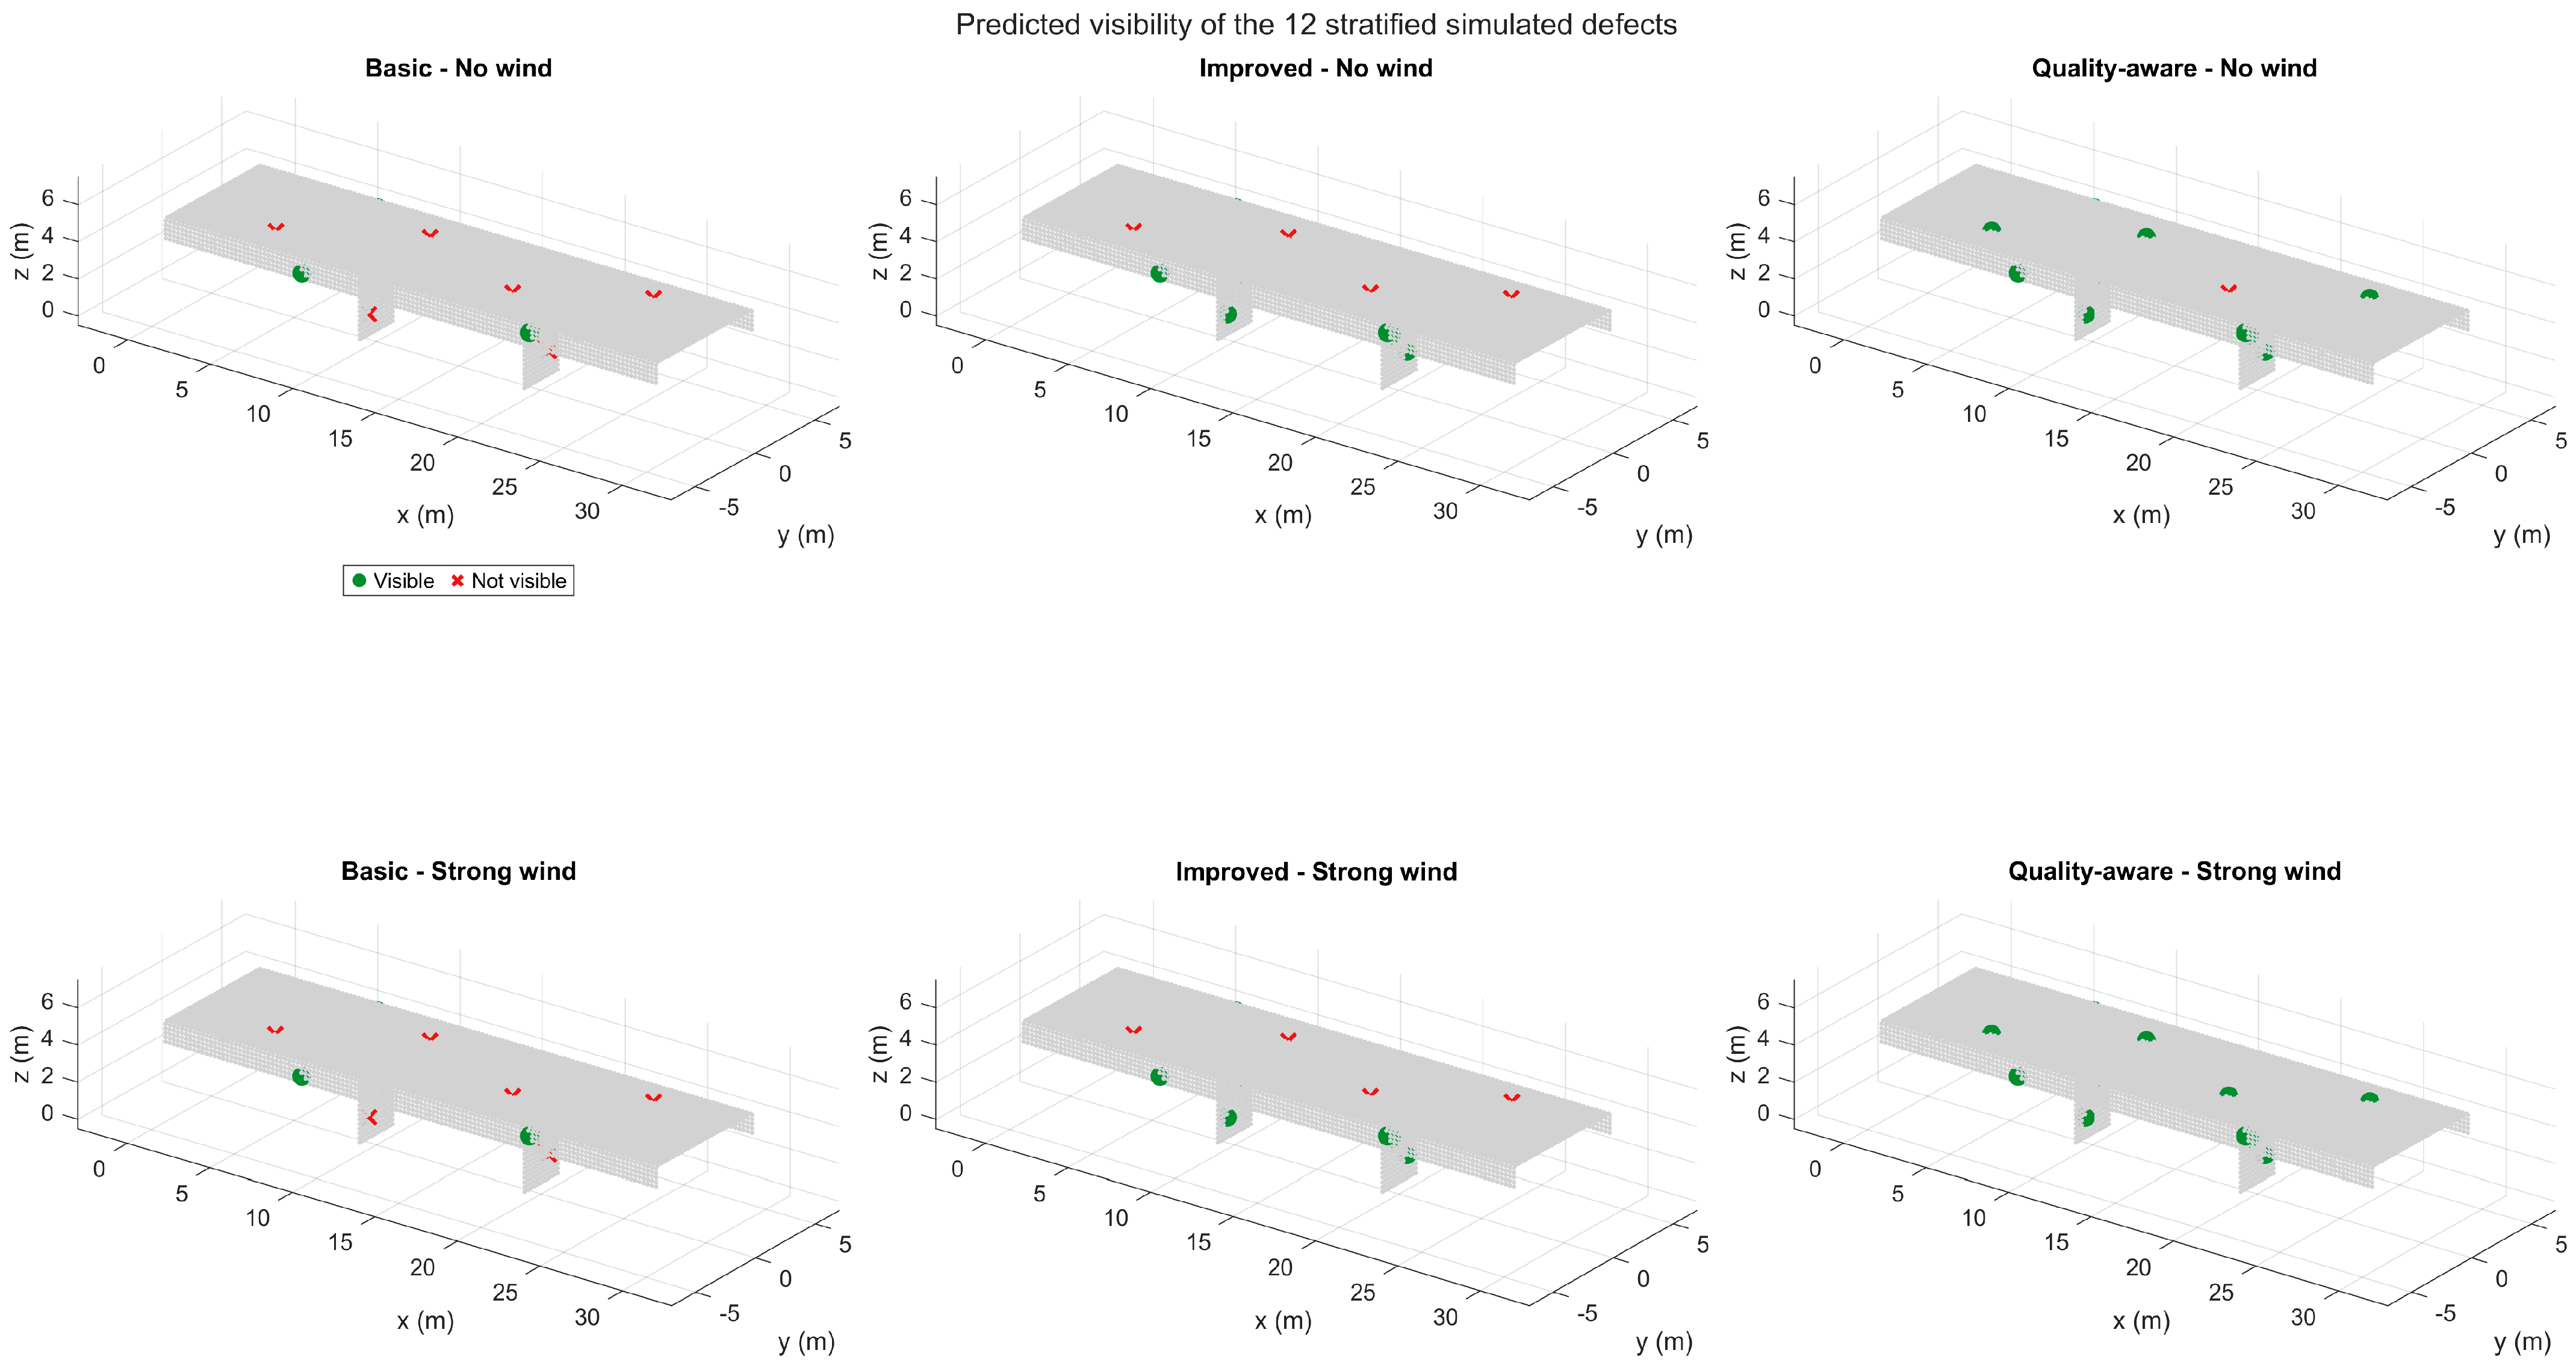
Simulated-defect geometric visibility in the no-wind case is 33.33% for Basic, 66.67% for Improved, and 91.67% for Quality-aware. Strong wind means are 33.06%, 68.06%, and 99.72%, respectively (Figure 7). The Quality-aware visibility increase with wind is not evidence that wind improves image quality: In Improved, stochastic pointing variation affects the visibility of some simulated-defect locations on the margins. In the case of Quality-aware, all 12 simulated defects are visible in each of the low and moderate wind trials, so the 100% is not due to the occasional recovery of a single marginal defect, but rather to redundant route geometry.
Figure 7.
Geometric visibility of the 12 fixed simulated−defect locations.
5.3. Quality-Adjusted Resolution Proxy and Inspection Quality
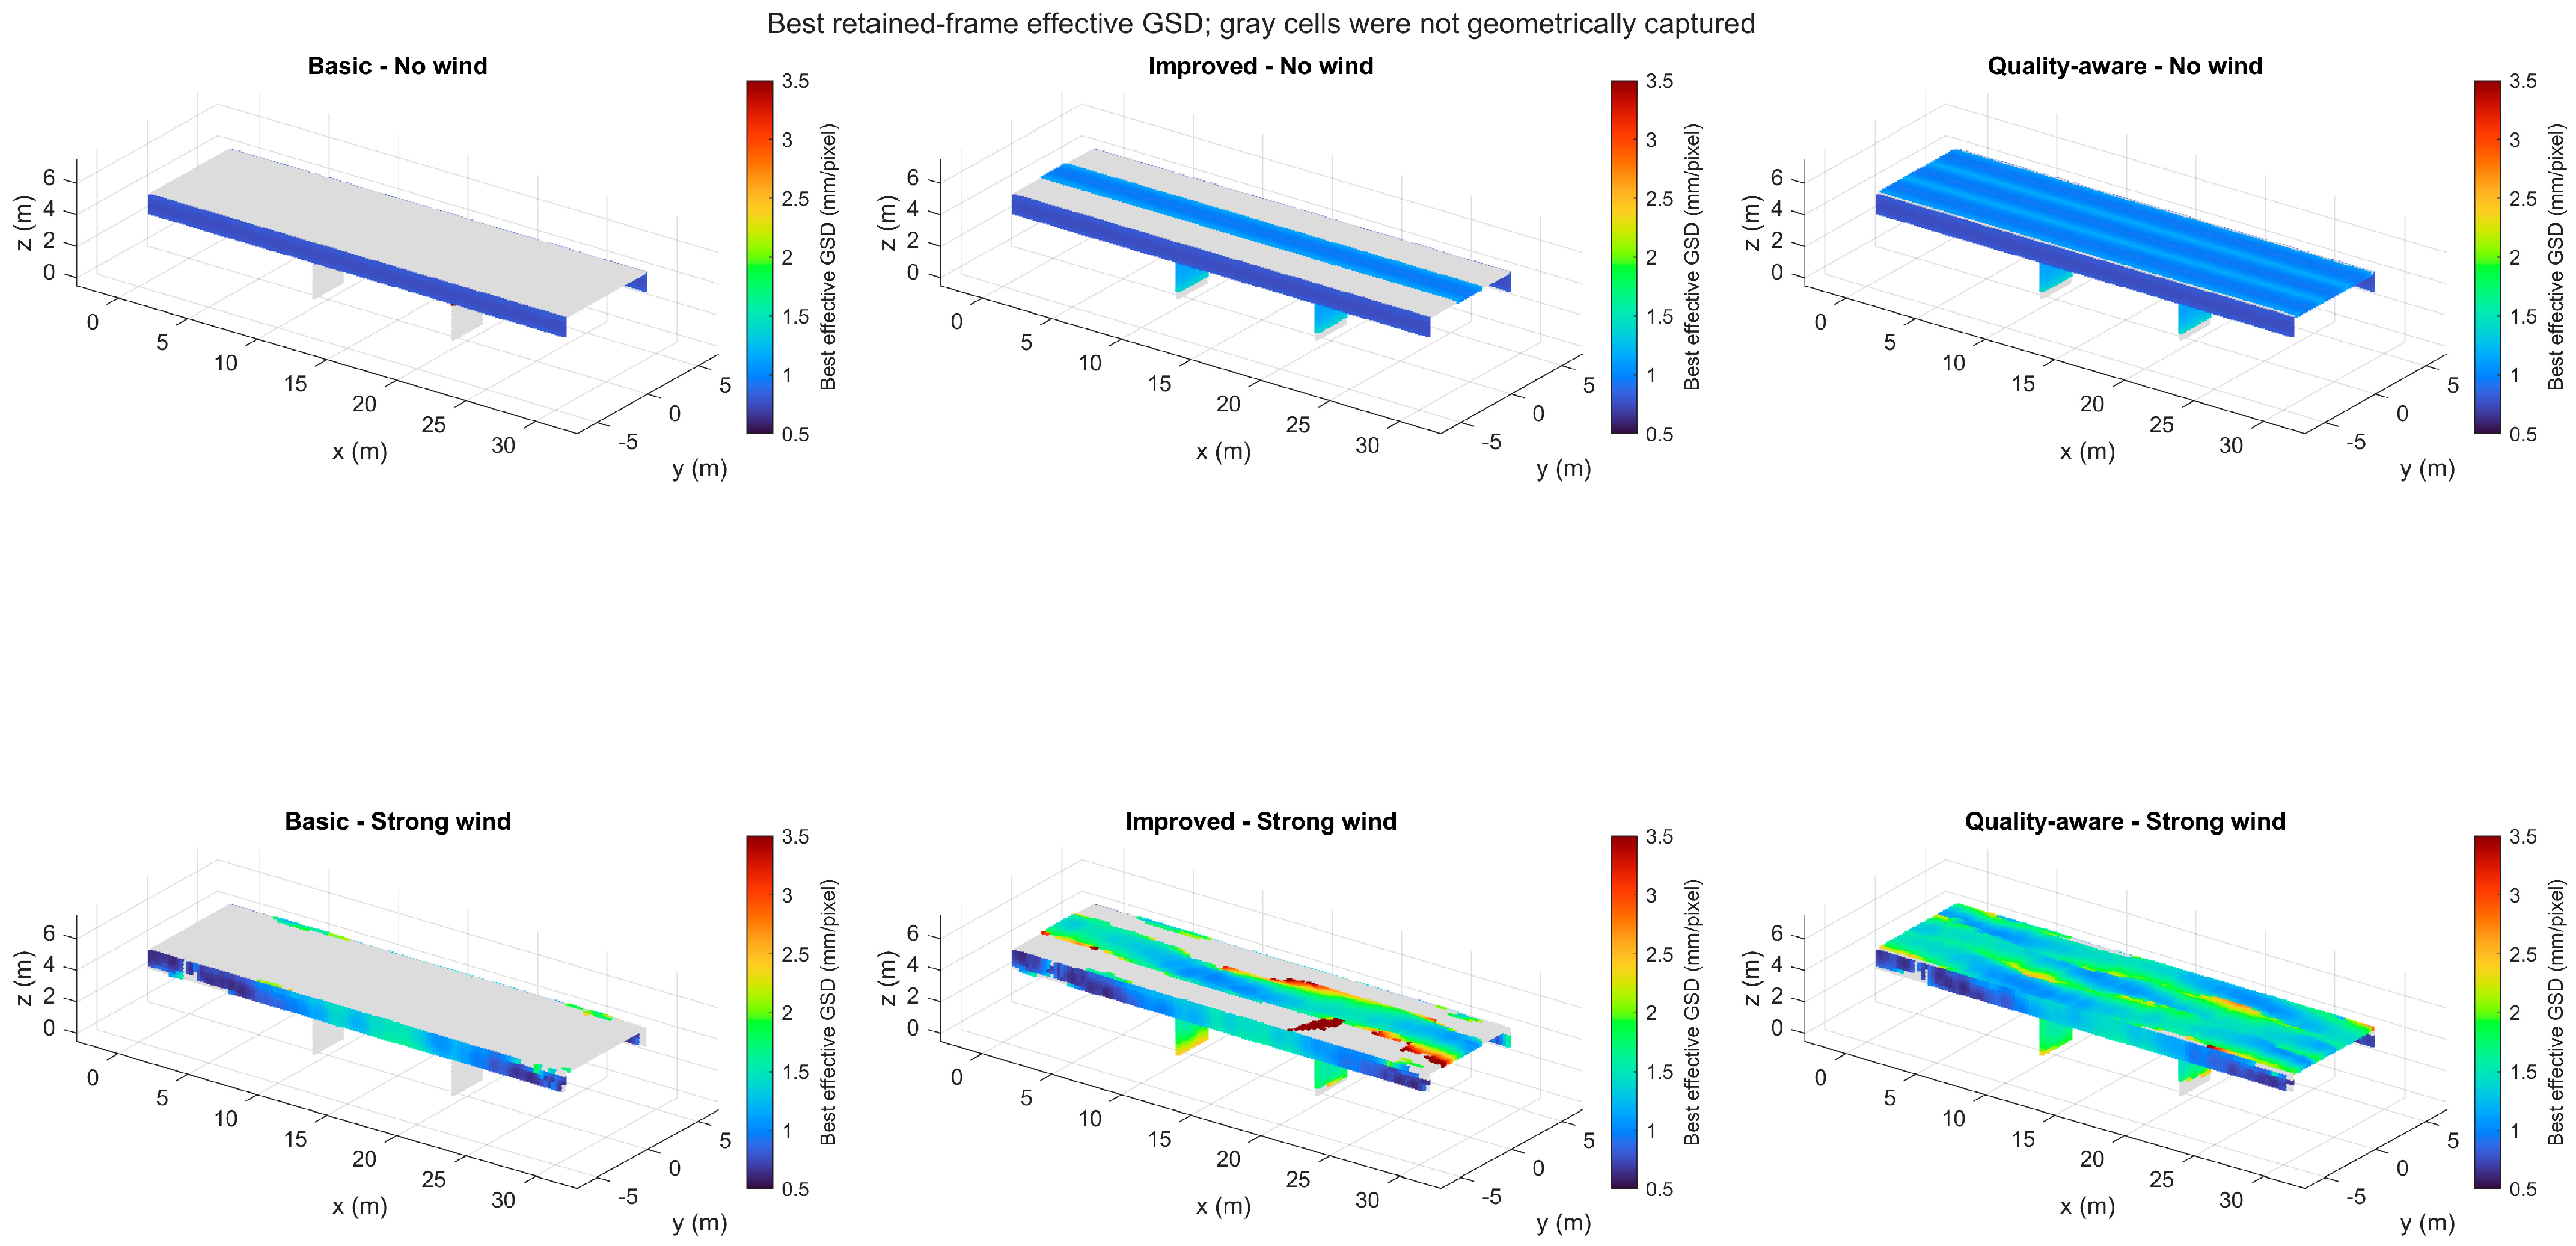
Mean quality-adjusted resolution proxy increases from 0.891 to 1.201 mm/pixel for Basic, 0.952 to 1.506 mm/pixel for Improved, and 0.983 to 1.409 mm/pixel for Quality-aware (Figure 8). These values are conditional on the geometrically captured area; a low Basic-path GSD does not compensate for its large missed area.
Figure 8.
Best retained-frame quality−adjusted resolution proxy.
IQS decreases from 43.34 ± 0.03 to 37.67 ± 0.61 for Basic, from 64.33 ± 0.01 to 58.86 ± 1.44 for Improved, and from 88.52 ± 0.01 to 85.28 ± 0.58 for Quality-aware (Figure 9). Quality-aware exceeds Improved by 26.42 IQS points under strong wind (95% CI 25.85–26.99).
Figure 9.
Monte Carlo means with Student’s t 95% confidence intervals (n = 30).
Table 5 provides the full 3 × 4 path-wind result matrix. The wind level response is not necessarily monotonic. Basic coverage decreases with disturbance, while Improved and Quality-aware exhibit small coverage gains at low and moderate disturbance, but decrease at the highest wind level. IQS also exhibits a slight low wind rise for Improved followed by a decline at higher disturbance. These small increases are due to the interplay between deterministic path geometry and stochastic viewpoint perturbations. For cells close to a field-of-view or incidence boundary, a small position or pointing perturbation can move the cell into an acceptable observation region in some trials. This local geometric gain can be greater than the simultaneous loss of some other marginal observations at low disturbance for routes with repeated and overlapping observations. As the wind severity increases, the frame loss, repeated-capture requirements, image-quality margin, and pose perturbations increase, and the aggregate metrics decrease. The result should therefore not be interpreted as evidence that wind improves inspection quality. The table also exposes the nonmonotonic fixed-defect visibility already noted in Figure 7, preventing that sparse metric from being mistaken for aggregate inspection quality. Sample standard deviations over the 30 Monte Carlo trials are shown in parentheses.
Table 5.
Monte Carlo outcomes reported as mean (sample standard deviation), n = 30.
The low-wind IQS response is also non-monotonic. The change is negligible for Improved, from 64.33 to 64.40, whereas Quality-aware increases more clearly from 88.52 to 90.87 presented in Table 5. These increases are interpreted as consequences of disturbance-induced boundary crossings within the prescribed numerical model and not as evidence that wind improves inspection performance. Table 6 presents Resolution-margin and mission-level motion/stability components used in IQS.
Table 6.
Resolution-margin and mission-level motion/stability components used in IQS.
The decrease in with increasing disturbance is due to the degradation of the quality-adjusted resolution margin, while the increase in is mainly due to the explicit wind-severity contribution in the motion/stability formulation.
To determine if the route ranking is sensitive to the illustrative IQS weights, the current component values were simply re-combined using three other sets of normalized weights, without the need for additional Monte Carlo simulations. In addition to the baseline weights a coverage-emphasized set , a visibility-emphasized set , and a resolution/stability-emphasized set were evaluated. The order of the ranking was always Quality-aware > Improved > Basic in all tested cases and at all four wind levels. Table 7 presents the sensitivity analysis of route ranking.
Table 7.
Sensitivity of route ranking to alternative IQS weights.
The positive pairwise margins for all tested weighting schemes indicate that the relative route ranking is not sensitive to the tested changes in IQS weights, but the absolute IQS values are.
Table 8 isolates the strong-wind comparisons and attaches 95% confidence intervals to each path difference. All reported intervals exclude zero. The Quality-aware minus Basic coverage advantage is 73.38 percentage points [73.15, 73.60], demonstrating that the practical ranking is much larger than the Monte Carlo sampling uncertainty.
Table 8.
Strong-wind path contrasts: difference [95% confidence interval].
5.4. Component Coverage and Mission Burden
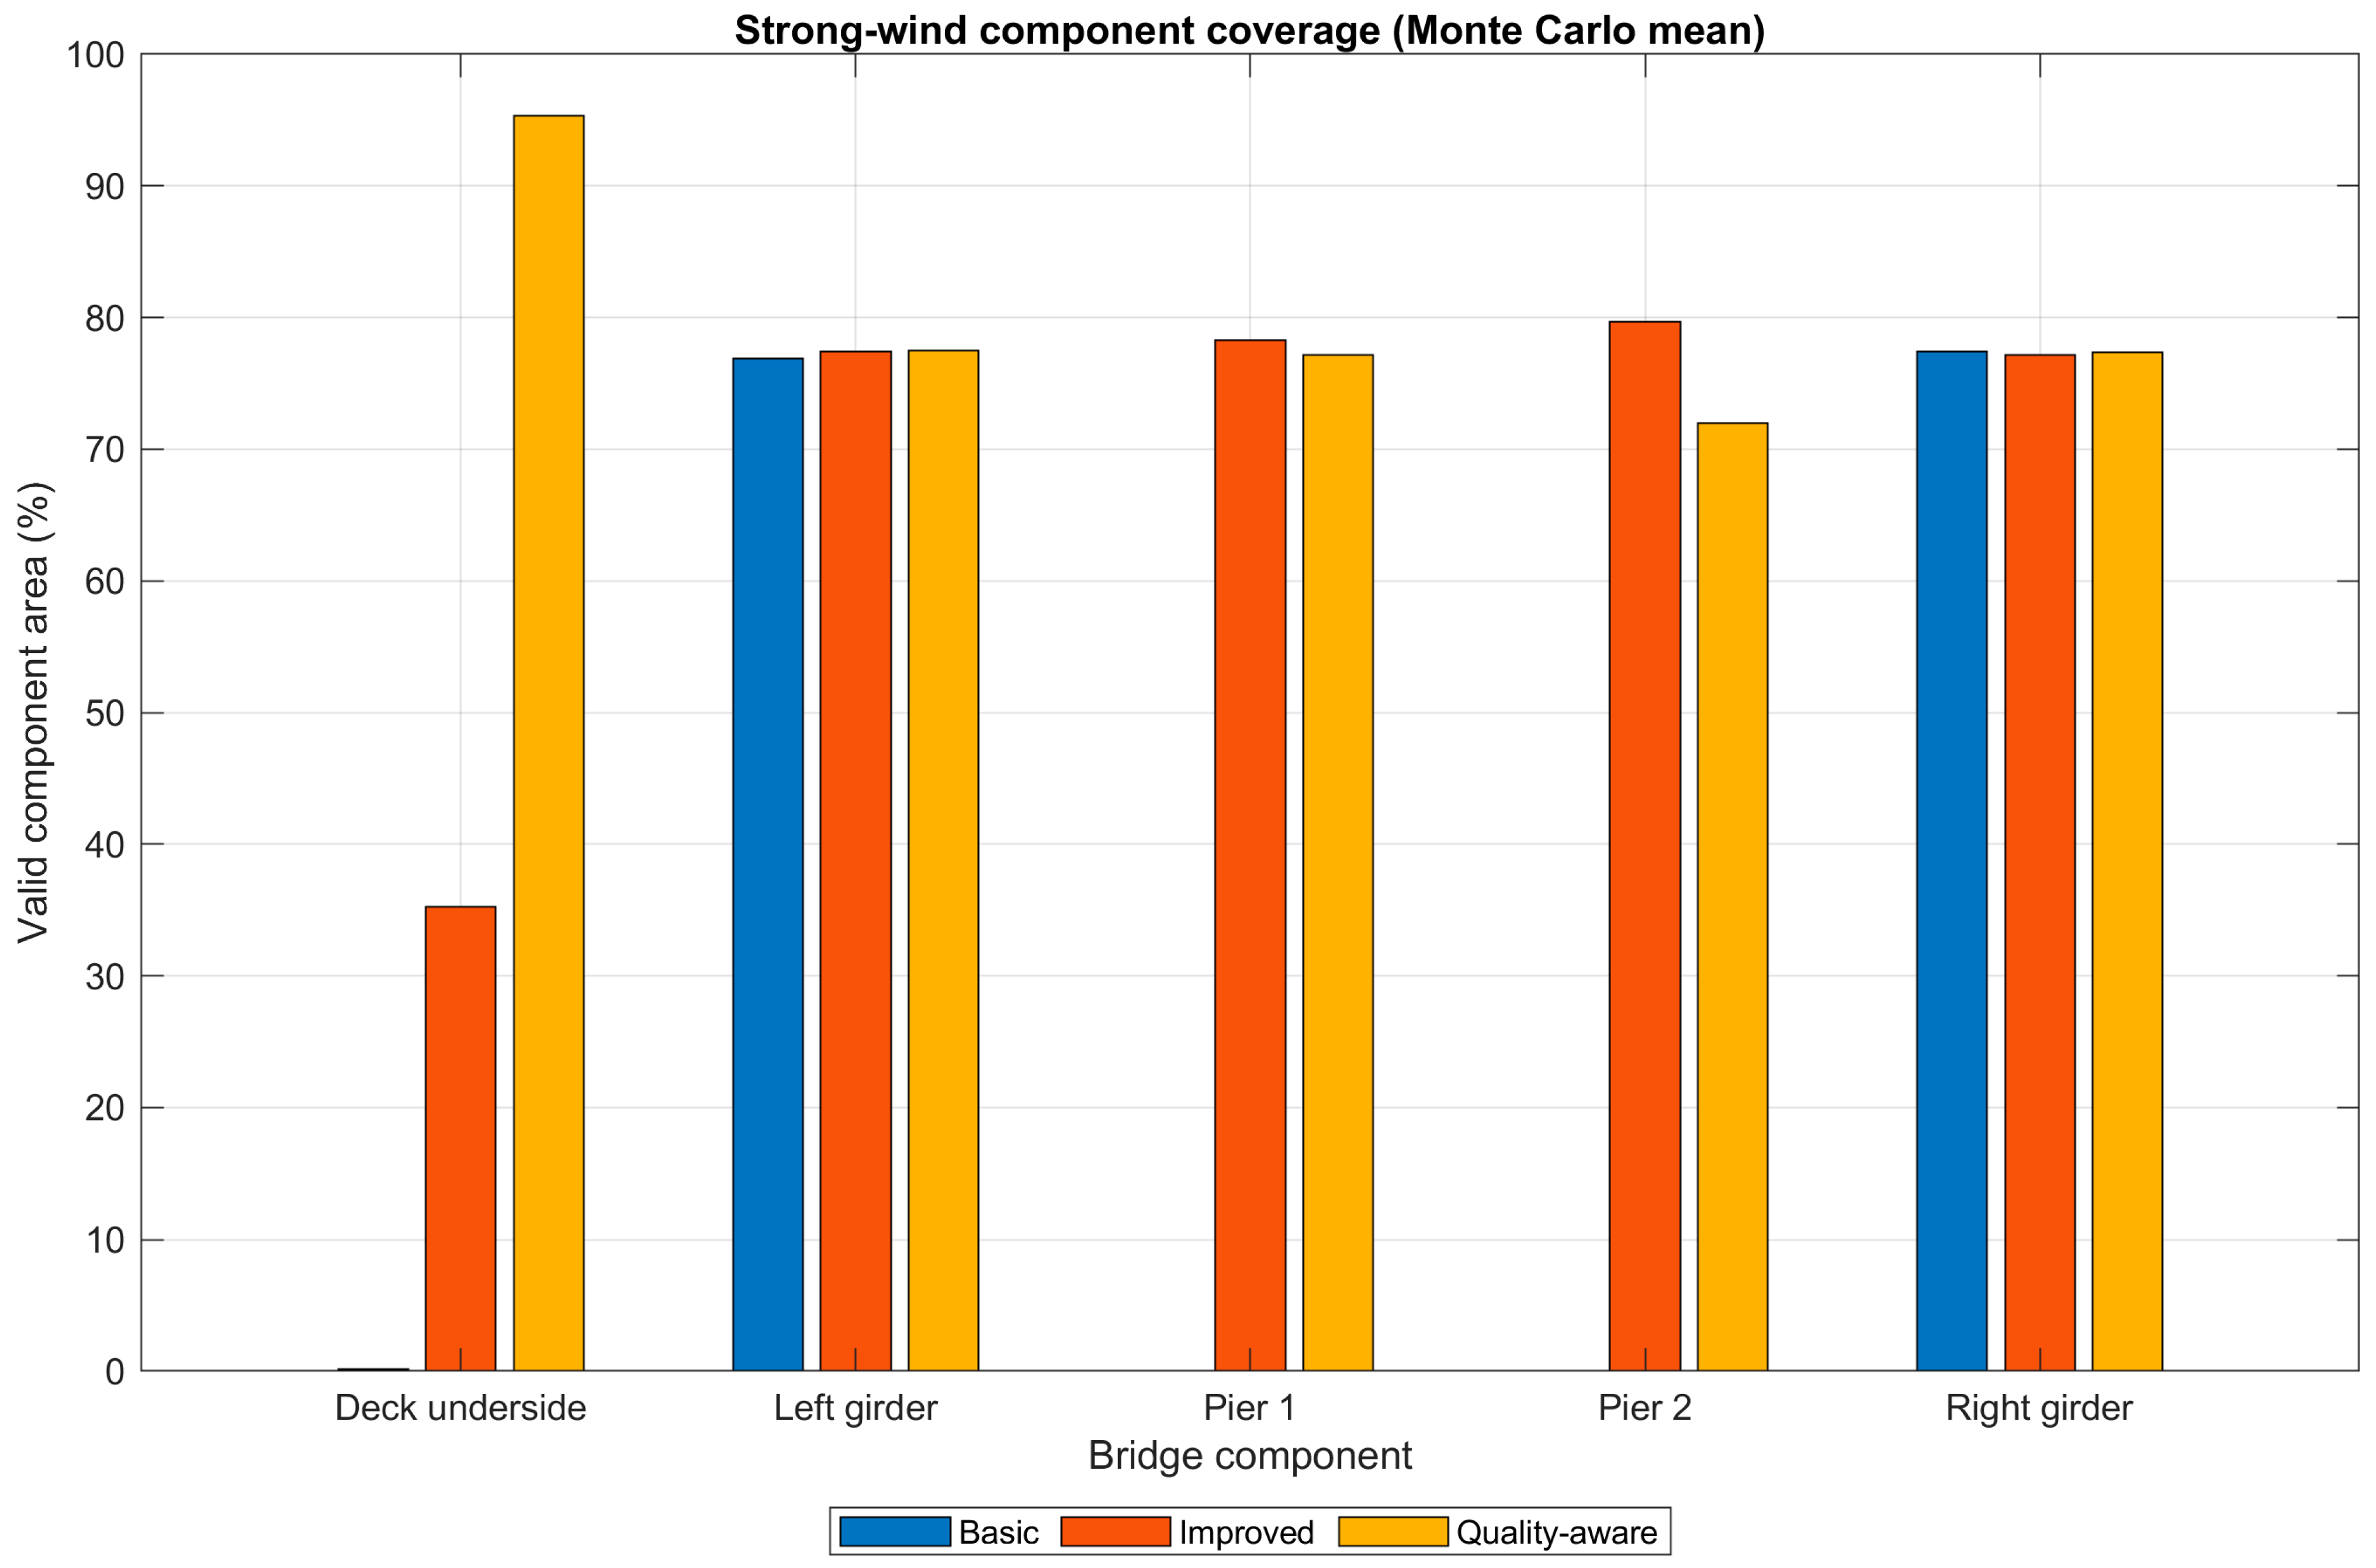
The Basic mission is 77.8 m and 48.9 s. Improved requires 159.4 m and 95.7 s, and Quality-aware requires 227.2 m and 139.6 s. The component-level comparison is shown in Figure 10 for the highest wind level tested and the full route level response is shown in Table 5 for all four wind levels. Much of the Quality-aware advantage is due to increased coverage of the underside of the deck. While Improved and Quality-aware share the same pier-pass idea, the entire mission sequences are different. The extra preceding segments in the Quality-aware route change the time history of the stochastic position and pointing perturbations, and the retained-frame sequence. Thus, even if the nominal pier-directed observations are similar, valid coverage of an individual pier face may be different for the two routes.
Figure 10.
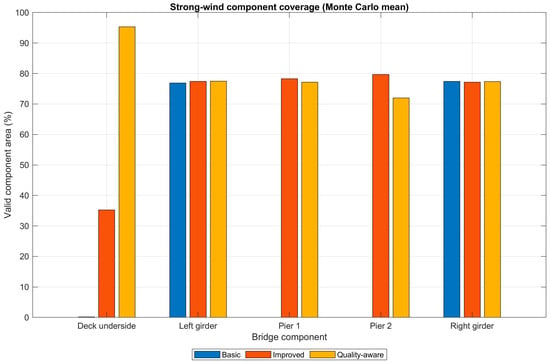
Strong-wind component-level valid coverage.
Table 9 makes the performance–cost tradeoff explicit. Relative to Basic, Quality-aware increases mission distance from 77.8 to 227.2 m, duration from 48.9 to 139.6 s, and retained capture frames from 161 to 417. Those additional observations explain the component-level gain in Figure 10, but they also imply higher battery and data-management requirements that must be checked before field deployment.
Table 9.
Mission geometry and sampling burden.
Distance-normalized coverage was also evaluated. Basic, Improved and Quality-aware deliver around 0.275, 0.309 and 0.414 percentage points of valid coverage per meter respectively, when no wind is present. For the highest wind level tested, the values are about 0.214, 0.297 and 0.396 percentage points per meter. So, in the current bridge configuration, the Quality-aware route still has the highest coverage efficiency even when total mission distance is considered.
The distance from Improved to Quality-aware increased from 159.4 m to 227.2 m, and the no-wind coverage is increased from 49.33% to 93.97%. This discrete comparison shows that more underside sampling is especially beneficial for the current geometry where the underside of the deck is a significant portion of the modeled inspection area. The present study does not include a general strip-number, spacing, and standoff optimization.
6. Discussion
The results show the significance of the component-specific route design. The Basic route follows the outside faces of the girders and leaves the underside of the deck and modeled pier areas mostly unobserved. The component-specific passes in the Improved route provide the greatest additional valid coverage and denser sampling of the underside of the deck in the Quality-aware route provides the greatest additional gain. The result is especially pertinent as the deck underside accounts for most of the modeled inspection area. In this context, these results illustrate the performance of the assessment framework for the current benchmark geometry and should not be used as a measure of performance for all bridge types.
The wind response is not a prediction of UAV flight dynamics, but a stochastic geometric and image-quality stress test. The impact of wind is manifested in position and pointing perturbations, frame retention, repeated-capture requirements, and the image-quality penalties adopted. The small non-monotonic increases in Improved and Quality-aware coverage are sometimes due to low disturbance which can occasionally enhance the observation of cells near geometric acceptance boundaries. Combined penalties prevail and the overall quality margin drops at higher disturbance.
The reported Monte Carlo confidence intervals describe sampling precision within this specified stochastic model. They are not a complete uncertainty quantification of threshold selection, wind coefficients, IQS weighting, or model form. Similarly, the IQS is a transparent comparative index rather than an empirically calibrated bridge-condition metric.
The numerical formulation is specified through the reported bridge geometry, camera parameters, inspection criteria, random-seed convention, wind levels, mission definitions, and Monte Carlo design so that the computational procedure can be independently examined. The present results should therefore be considered as route-assessment results and not path-optimization results. The existing approaches include iterative viewpoint resampling [26], search-space coverage planning [27], particle-swarm-based inspection planning [28], coverage and image-quality co-optimization [29], BIM-based bridge path generation [24] and more recent structural and bridge route planners [33,34,35,36,37] which aim to build or optimize inspection viewpoints and trajectories. The present framework, on the other hand, quantifies the expected results of a supplied candidate route under common FOV, range, incidence-angle, GSD, repeated-capture and stochastic wind-disturbance criteria. This makes the framework complementary to the route-generation methods: an externally generated trajectory can be assessed with the same area-weighted coverage, simulated-defect visibility, image-quality, uncertainty and mission-cost metrics used here. There is no direct numerical comparison with a particular path-generation algorithm since route synthesis, obstacle avoidance, vehicle dynamics, and planner-specific optimization variables are not part of the current simplified assessment model.
Deck-underside observations are critical to the Quality-aware advantage and can be affected by partial signal blockage and multipath. During a field mission, lower pose repeatability may lead to a lower capability to repeat the desired camera poses and repeated observations. A suitable GNSS-denied or relative-navigation capability would therefore be required for practical deployment, or calibration of the assessment using measured flight telemetry.
6.1. Practical Relevance and Deployment Considerations
Despite the current work being a simulation experiment, the framework developed aims at modeling the process of assessing possible UAV routes for a real-life mission of a UAV-based bridge inspection. In particular, the bridge shape should be converted into an inspection surface model, followed by generation of UAV trajectories for inspection based on inspection faces, camera FOV, standoff distance, and image resolution needed. Then, the framework described in this paper may be applied in advance of the flight to estimate the expected surface coverage and image quality of each candidate trajectory.
The numerical trajectories investigated in this paper correspond to three increasingly complex inspection strategies. The Basic trajectory mainly focuses on inspecting girder exterior surfaces, the Improved trajectory allows for underside and pier inspections, and the Quality-aware trajectory further expands the coverage of underside inspection using several inspection strips.
In practice, the nominal route would also need to be assessed based on UAV-specific limitations such as size, obstacle clearance, navigation capabilities, GNSS availability, wind, battery endurance, communication, and any applicable operational limitations. Specifically, the GNSS signal may be obstructed under the bridge region, which would render relative positioning and onboard navigation significant issues. These limitations have not been considered in the current research and thus, the reported routes need to be understood as nominal planning paths and not as executable flight paths.
The proposed system can therefore be considered a pre-flight analysis tool for route assessment. An actual field test would involve the nominal path along with the measurement of the UAV positions, attitudes, camera timestamp, and the environment. The resulting data could then be fed into the coverage assessment framework developed here to validate whether the actual inspection coverage achieved matches the predicted one.
6.2. Limitations and Validation Boundary
In the present study, simplified planar bridge representation is intentionally used. Interior girder faces, bearings, diaphragms, cross-bracing, remaining pier faces, occlusion, shadows, textures, collision volumes, live traffic, GNSS degradation and platform-specific dynamic constraints are not modeled. The camera is modeled as an ideal pinhole (no lens distortion or exposure-time blur), and the motion/stability term in IQS is only a proxy index.
The scope of the current research is purposefully confined to numerical route assessment only. It should be noted that the values of coverage achieved in the simulation should not be taken as measurements of the actual performance of the system, nor is it an indicator of the precision of defect detection in real-life cases of bridge degradation. Rather, the value of the research lies in its attempt to integrate route characteristics, observation quality, disturbances, and coverage assessment within a single pre-flight assessment system.
The wind formulation does not consider a particular UAV-controller combination, turbulence spectrum or bridge wake. The thresholds, wind coefficients and IQS weights selected are thus model choices for comparative route assessment. The Monte Carlo intervals provide a measure of stochastic sampling precision in those choices but are not a measure of full model-form uncertainty.
No real bridge images are used in the present study. Simulated-defect visibility is not a measure of crack, corrosion or spalling detection accuracy, but rather a measure of whether the prescribed physical locations meet the geometric and image-quality requirements. UAV imagery is supplemental to the physical and tactile inspection methods mandated by the bridge-inspection program in place.
The framework would not be a substitute for the vehicle dynamics or flight controller of a real UAV for future field application. Rather, camera poses, attitude histories, frame-retention statistics, and local wind data can be provided to the same coverage and visibility assessment layer, measured or simulated, and platform-specific. Then the generic disturbance parameters used here could be replaced by platform-specific quantities by calibration with flight telemetry and recorded imagery. The current wind model should thus be considered as a stress-test layer for numerical comparison only and not as a deployable flight-dynamics model.
For the future, the route-assessment layer would be fed with measured or platform-specific camera poses, attitude histories, image timestamps, frame-retention statistics, and local wind measurements from an actual UAV mission. These data would be used to replace or calibrate the generic disturbance assumptions used here, but would have the same coverage, viewing-geometry, resolution, and repeated-observation calculations. The current framework should thus be considered as the numerical assessment part of a future field-calibrated workflow and not as a stand-alone UAV flight-dynamics model. The present route comparison also only takes three predefined strategies and is not a continuous optimization of strip number, strip spacing or standoff distance. Future work will involve expanding the framework to other bridge geometries with occlusions, systematic sweeps of the routes, experimentally determined disturbance parameters, other IQS weightings, and field measurements of camera pose, image footprints, GSD, and visibility of defects. For this reason, the present study must be considered as a ‘proof of concept’ numerical tool for route assessment, and not necessarily as a validated engineering inspection tool. Simulated-defect geometric visibility or IQS must be correlated to actual inspection performance by performing field calibration and validation.
7. Conclusions
This study proposed a pre-flight assessment framework for comparing predefined UAV bridge-inspection routes based on area-weighted coverage, camera geometry, GSD, repeated observations, geometric visibility of simulated-defect locations, wind-disturbance stress testing, and mission cost, which was implemented in MATLAB. Exterior-only inspection was inadequate for the modeled bridge since it did not allow for observation of the underside of the deck and the pier areas. The no-wind valid coverage rose from 21.43% for Basic to 49.33% for Improved and 93.97% for Quality-aware with the addition of component-specific observations. The corresponding values for the highest wind level tested were 16.64%, 47.38% and 90.01%.
The Quality-aware route also achieved the highest valid-coverage efficiency (normalized by total mission distance), suggesting that the extra underside passes gave significant coverage benefit for the current geometry. This result should not be interpreted as a universal recommendation for three strips, however, as the number of strips and spacing required will vary depending on the bridge width, camera field of view, standoff, GSD requirement, occlusion and navigation constraints.
At low disturbance, the wind effects were not monotonic because small perturbations of the viewpoint can cause marginal cells to be moved into valid geometric configurations. With higher disturbance, the factors of pose variation, frame loss, repeated-capture requirements and reduced image-quality margin prevail.
The framework remains a numerical pre-flight assessment tool. It has wind coefficients, inspection thresholds, IQS weights, simplified geometry and assumptions for the underside-navigation that need to be further sensitivity analyzed and field validated before operational inspection performance can be claimed.
Author Contributions
Conceptualization, A.J., M.A. and A.Z.A.; methodology, A.J., M.A. and F.H.; software, A.J. and F.H.; validation, A.J. and F.H.; formal analysis, A.J., M.A. and A.Z.A.; investigation, A.J., F.H. and M.O.; resources, M.A., M.O., W.A. and L.K.; data curation, A.J.; writing—original draft preparation, A.J., M.A. and F.H.; writing—review and editing, M.A., F.H., M.O., A.Z.A., W.A. and L.K.; visualization, A.J.; supervision, M.A., W.A. and L.K.; project administration, M.A. All authors have read and agreed to the published version of the manuscript.
Funding
The authors gratefully acknowledge the Deanship of Scientific Research (DSR) at King Abdulaziz University, Jeddah, Saudi Arabia, for funding this project under grant No. (IPP: 1082-305-2026) and for providing technical support.
Data Availability Statement
The data supporting the findings of this study consist primarily of numerically generated simulation data. The predefined route geometries, coordinate definitions, model parameters, simulated-defect locations, wind conditions, random-seed settings, and principal simulation outputs are described in the manuscript and its tables. The MATLAB scripts used to generate the simulations and post-process the results, together with the corresponding route definitions and output data, are available from the corresponding author upon reasonable request. No experimental or proprietary field dataset was used in this study.
Conflicts of Interest
The authors declare no conflicts of interest.
Nomenclature
The following symbols are used in this paper:
| Ai | physical area of bridge-surface cell i |
| B | bounded motion/stability proxy |
| C | area-weighted valid coverage fraction |
| FOVx, FOVy | horizontal and vertical field of view |
| GSDeff | effective ground sampling distance |
| Ii | valid-coverage indicator for cell i |
| IQS | inspection quality score |
| Nmin | minimum valid retained-frame count |
| R | area-weighted resolution margin |
| V | fixed simulated-defect visibility fraction |
| W | nondimensional wind index |
| d | camera-to-surface distance |
| f | camera focal length |
| α | surface incidence angle |
| number of simulated defects | |
| accepted GSD associated with surface cell | |
| required GSD threshold | |
| nominal geometric GSD | |
| representative mission speed used in the stability proxy | |
| representative mission-level yaw rate used in the motion/stability proxy | |
| sensor width and sensor height | |
| horizontal image pixel count | |
| retained-frame loss probability | |
| simulated-defect visibility indicator | |
| n | surface unit normal |
| c | camera position vector |
| x | surface-point position vector |
References
- Available online: https://www.federalregister.gov/documents/2022/05/06/2022-09512/national-bridge-inspection-standards (accessed on 6 May 2022).
- Graybeal, B.A.; Phares, B.M.; Rolander, D.D.; Moore, M.; Washer, G. Visual inspection of highway bridges. J. Nondestruct. Eval. 2002, 21, 67–83. [Google Scholar] [CrossRef] [Scilit]
- Jeong, E.; Seo, J.; Wacker, J. Literature review and technical survey on bridge inspection using unmanned aerial vehicles. J. Perform. Constr. Facil. 2020, 34, 04020113. [Google Scholar] [CrossRef] [Scilit]
- Lovelace, B.; Zink, J. Unmanned Aerial Vehicle Bridge Inspection Demonstration Project; Research Project. Final Report 2015-40; Collins Engineers, Inc.: Chicago, IL, USA, 2015. [Google Scholar]
- Gillins, M.N.; Gillins, D.T.; Parrish, C. Cost-effective bridge safety inspections using unmanned aircraft systems (UAS). In Proceedings of the Geotechnical and Structural Engineering Congress 2016, Phoenix, AZ, USA, 14–17 February 2016; pp. 1931–1940. [Google Scholar]
- Dorafshan, S.; Maguire, M. Bridge inspection: Human performance, unmanned aerial systems and automation. J. Civ. Struct. Health Monit. 2018, 8, 443–476. [Google Scholar] [CrossRef] [Scilit]
- Jung, H.J.; Lee, J.H.; Yoon, S.; Kim, I.H. Bridge Inspection and condition assessment using Unmanned Aerial Vehicles (UAVs): Major challenges and solutions from a practical perspective. Smart Struct. Syst. 2019, 24, 669–681. [Google Scholar]
- Seo, J.; Duque, L.; Wacker, J.P. Field application of UAS-based bridge inspection. Transp. Res. Rec. 2018, 2672, 72–81. [Google Scholar] [CrossRef] [Scilit]
- Seo, J.; Duque, L.; Wacker, J. Drone-enabled bridge inspection methodology and application. Autom. Constr. 2018, 94, 112–126. [Google Scholar] [CrossRef] [Scilit]
- Peng, X.; Zhong, X.; Zhao, C.; Chen, Y.F.; Zhang, T. The feasibility assessment study of bridge crack width recognition in images based on special inspection UAV. Adv. Civ. Eng. 2020, 2020, 8811649. [Google Scholar] [CrossRef] [Scilit]
- Jeong, E.; Seo, J.; Wacker, J.P. UAV-aided bridge inspection protocol through machine learning with improved visibility images. Expert Syst. Appl. 2022, 197, 116791. [Google Scholar] [CrossRef] [Scilit]
- Jung, S.; Choi, D.; Song, S.; Myung, H. Bridge inspection using unmanned aerial vehicle based on HG-SLAM: Hierarchical graph-based SLAM. Remote Sens. 2020, 12, 3022. [Google Scholar] [CrossRef] [Scilit]
- Cano, M.; Pastor, J.L.; Tomás, R.; Riquelme, A.; Asensio, J.L. A new methodology for bridge inspections in linear infrastructures from optical images and HD videos obtained by UAV. Remote Sens. 2022, 14, 1244. [Google Scholar] [CrossRef] [Scilit]
- Mohammadi, M.; Rashidi, M.; Mousavi, V.; Karami, A.; Yu, Y.; Samali, B. Quality evaluation of digital twins generated based on UAV photogrammetry and TLS: Bridge case study. Remote Sens. 2021, 13, 3499. [Google Scholar] [CrossRef] [Scilit]
- Federal Highway Administration. Questions and Answers on the National Bridge Inspection Standards, 23 CFR Part 650, Subpart C; Section 650.313, Q313-2: Can Unmanned Aircraft Systems (UAS) or Drones Be Used in a Bridge Inspection? Federal Highway Administration: Washington, DC, USA, 2023.
- Chen, S.; Laefer, D.F.; Mangina, E.; Zolanvari, S.I.; Byrne, J. UAV bridge inspection through evaluated 3D reconstructions. J. Bridge Eng. 2019, 24, 05019001. [Google Scholar] [CrossRef] [Scilit]
- Khaloo, A.; Lattanzi, D.; Cunningham, K.; Dell’Andrea, R.; Riley, M. Unmanned aerial vehicle inspection of the Placer River Trail Bridge through image-based 3D modelling. Struct. Infrastruct. Eng. 2018, 14, 124–136. [Google Scholar] [CrossRef] [Scilit]
- Mandirola, M.; Casarotti, C.; Peloso, S.; Lanese, I.; Brunesi, E.; Senaldi, I. Use of UAS for damage inspection and assessment of bridge infrastructures. Int. J. Disaster Risk Reduct. 2022, 72, 102824. [Google Scholar] [CrossRef] [Scilit]
- Wang, F.; Zou, Y.; Chen, X.; Zhang, C.; Hou, L.; del Rey Castillo, E.; Lim, J.B. Rapid in-flight image quality check for UAV-enabled bridge inspection. ISPRS J. Photogramm. Remote Sens. 2024, 212, 230–250. [Google Scholar] [CrossRef] [Scilit]
- Lee, J.H.; Yoon, S.; Kim, B.; Gwon, G.H.; Kim, I.H.; Jung, H.J. A new image-quality evaluating and enhancing methodology for bridge inspection using an unmanned aerial vehicle. Smart Struct. Syst. 2021, 27, 209–226. [Google Scholar]
- Gwon, G.H.; Lee, J.H.; Kim, I.H.; Jung, H.J. CNN-based image quality classification considering quality degradation in bridge inspection using an unmanned aerial vehicle. IEEE Access 2023, 11, 22096–22113. [Google Scholar] [CrossRef] [Scilit]
- Liu, Y.; Han, K.; Rasdorf, W. Assessment and prediction of impact of flight configuration factors on UAS-based photogrammetric survey accuracy. Remote Sens. 2022, 14, 4119. [Google Scholar] [CrossRef] [Scilit]
- Wang, F.; Zou, Y.; Del Rey Castillo, E.; Lim, J.B.P. Optimal UAV image overlap for photogrammetric 3D reconstruction of bridges. In IOP Conference Series: Earth and Environmental Science; IOP Publishing: Bristol, UK, 2022; Volume 1101, p. 022052. [Google Scholar]
- Wang, F.; Zou, Y.; del Rey Castillo, E.; Ding, Y.; Xu, Z.; Zhao, H.; Lim, J.B. Automated UAV path-planning for high-quality photogrammetric 3D bridge reconstruction. Struct. Infrastruct. Eng. 2024, 20, 1595–1614. [Google Scholar] [CrossRef] [Scilit]
- Yu, K.; Shanthakumar, P.; Orevillo, J.; Bianchi, E.; Hebdon, M.; Tokekar, P. View Planning and Navigation Algorithms for Autonomous Bridge Inspection with UAVs. arXiv 2019, arXiv:1910.02786. [Google Scholar]
- Bircher, A.; Alexis, K.; Burri, M.; Oettershagen, P.; Omari, S.; Mantel, T.; Siegwart, R. Structural inspection path planning via iterative viewpoint resampling with application to aerial robotics. In 2015 IEEE International Conference on Robotics and Automation (ICRA); IEEE: Piscataway, NY, USA, 2015; pp. 6423–6430. [Google Scholar]
- Almadhoun, R.; Taha, T.; Dias, J.; Seneviratne, L.; Zweiri, Y. Coverage path planning for complex structures inspection using unmanned aerial vehicle (UAV). In International Conference on Intelligent Robotics and Applications; Springer International Publishing: Cham, Switzerland, 2019; pp. 243–266. [Google Scholar]
- Phung, M.D.; Quach, C.H.; Dinh, T.H.; Ha, Q. Enhanced discrete particle swarm optimization path planning for UAV vision-based surface inspection. Autom. Constr. 2017, 81, 25–33. [Google Scholar] [CrossRef] [Scilit]
- Shang, Z.; Bradley, J.; Shen, Z. A co-optimal coverage path planning method for aerial scanning of complex structures. Expert Syst. Appl. 2020, 158, 113535. [Google Scholar] [CrossRef] [Scilit]
- Song, C.; Chen, Z.; Wang, K.; Luo, H.; Cheng, J.C. BIM-supported scan and flight planning for fully autonomous LiDAR-carrying UAVs. Autom. Constr. 2022, 142, 104533. [Google Scholar] [CrossRef] [Scilit]
- Ibrahim, A.; Golparvar-Fard, M.; El-Rayes, K. Metrics and methods for evaluating model-driven reality capture plans. Comput.-Aided Civ. Infrastruct. Eng. 2022, 37, 55–72. [Google Scholar] [CrossRef] [Scilit]
- Ibrahim, A.; Golparvar-Fard, M.; El-Rayes, K. Multiobjective optimization of reality capture plans for computer vision–driven construction monitoring with camera-equipped UAVs. J. Comput. Civ. Eng. 2022, 36, 04022018. [Google Scholar] [CrossRef] [Scilit]
- Ivić, S.; Crnković, B.; Grbčić, L.; Matleković, L. Multi-UAV trajectory planning for 3D visual inspection of complex structures. Autom. Constr. 2023, 147, 104709. [Google Scholar] [CrossRef] [Scilit]
- Zhao, Y.; Lu, B.; Alipour, M. Optimized structural inspection path planning for automated unmanned aerial systems. Autom. Constr. 2024, 168, 105764. [Google Scholar] [CrossRef] [Scilit]
- Sato, J.; Nishio, M. Viewpoint importance consideration and UAV bridge point flight path optimization and 3D simulation in the ideal space. Artif. Intell. Data Sci. 2024, 5, 175–185. [Google Scholar] [CrossRef] [PubMed]
- Li, X.; Chen, Y.; Chen, Z.; Huang, Z. Coverage path planning of bridge inspection with Unmanned aerial vehicle. Eng. Appl. Artif. Intell. 2025, 156, 111253. [Google Scholar] [CrossRef] [Scilit]
- Bartczak, E.T.; Bassier, M.; Vergauwen, M. ORBIT: Optimized Routing for Bridge Inspection Toolkit. An open-source UAS flight path planning tool for comprehensive bridge inspections under realistic constraints. Int. Arch. Photogramm. Remote Sens. Spat. Inf. Sci. 2025, 48, 25–32. [Google Scholar] [CrossRef] [Scilit]
- Horton, L.M.; Cabral, K.M.; Surgenor, B.W.; Givigi, S.N.; Woods, J.E. A framework for autonomous inspection of bridge infrastructure using uncrewed aerial vehicles. In 2024 IEEE International Systems Conference (SysCon); IEEE: Piscataway, NY, USA, 2024; pp. 1–8. [Google Scholar]
- Lin, J.J.; Ibrahim, A.; Sarwade, S.; Golparvar-Fard, M. Bridge inspection with aerial robots: Automating the entire pipeline of visual data capture, 3D mapping, defect detection, analysis, and reporting. J. Comput. Civ. Eng. 2021, 35, 04020064. [Google Scholar] [CrossRef] [Scilit]
- Zhang, C.; Zou, Y.; Wang, F.; del Rey Castillo, E.; Dimyadi, J.; Chen, L. Towards fully automated unmanned aerial vehicle-enabled bridge inspection: Where are we at? Constr. Build. Mater. 2022, 347, 128543. [Google Scholar] [CrossRef] [Scilit]
- Kang, D.; Cha, Y.J. Autonomous UAVs for structural health monitoring using deep learning and an ultrasonic beacon system with geo-tagging. Comput.-Aided Civ. Infrastruct. Eng. 2018, 33, 885–902. [Google Scholar] [CrossRef] [Scilit]
- Perry, B.J.; Guo, Y.; Atadero, R.; Van De Lindt, J.W. Streamlined bridge inspection system utilizing unmanned aerial vehicles (UAVs) and machine learning. Measurement 2020, 164, 108048. [Google Scholar] [CrossRef] [Scilit]
- Jena, K.K.; Mishra, S.; Mishra, S.; Bhoi, S.K. Unmanned aerial vehicle assisted bridge crack severity inspection using edge detection methods. In 2019 Third International conference on I-SMAC (IoT in Social, Mobile, Analytics and Cloud) (I-SMAC); IEEE: Piscataway, NY, USA, 2019; pp. 284–289. [Google Scholar]
- Alheeti, K.M.A.; Al-Ani, M.S.; Al-Aloosy, A.K.N.; Alzahrani, A.; Rukan, D.A.S. Intelligent mobile detection of cracks in concrete utilising an unmanned aerial vehicle. Bull. Electr. Eng. Inform. 2022, 11, 176–184. [Google Scholar] [CrossRef] [Scilit]
- Escobar-Wolf, R.; Oommen, T.; Brooks, C.N.; Dobson, R.J.; Ahlborn, T.M. Unmanned aerial vehicle (UAV)-based assessment of concrete bridge deck delamination using thermal and visible camera sensors: A preliminary analysis. Res. Nondestruct. Eval. 2018, 29, 183–198. [Google Scholar] [CrossRef] [Scilit]
- Hallermann, N.; Morgenthal, G. From aerial photography to 3-dimensional inspection of bridges. In Proceedings of the IABSE Conf.: Bridges and Structures Sustainability-Seeking Intelligent Solutions, Guangzhou, China, 8–11 May 2016; pp. 546–553. [Google Scholar]
- Boller, C. High-resolution multisensor infrastructure inspection with unmanned aircraft systems. Int. Arch. Photogramm. Remote Sens. Spat. Inf. Sci. 2013, XL-1/W2, 125–129. [Google Scholar] [CrossRef] [Scilit]
- Chan, B.; Guan, H.; Jo, J.; Blumenstein, M. Towards UAV-based bridge inspection systems: A review and an application perspective. Struct. Monit. Maint. 2015, 2, 283–300. [Google Scholar] [CrossRef] [Scilit]
- Yin, Z.; Mao, Y.; Seto, C. Develop a UAV Platform for Automated Bridge Inspection; Mid-America Transportation Center: Lincoln, NE, USA, 2015. [Google Scholar]
- Paine, D.P.; Kiser, J.D. Aerial Photography and Image Interpretation; John Wiley & Sons: Hoboken, NJ, USA, 2012. [Google Scholar]
- Westoby, M.J.; Brasington, J.; Glasser, N.F.; Hambrey, M.J.; Reynolds, J.M. ‘Structure-from-Motion’ photogrammetry: A low-cost, effective tool for geoscience applications. Geomorphology 2012, 179, 300–314. [Google Scholar] [CrossRef] [Scilit]
- Zarco-Tejada, P.J.; Diaz-Varela, R.; Angileri, V.; Loudjani, P. Tree height quantification using very high resolution imagery acquired from an unmanned aerial vehicle (UAV) and automatic 3D photo-reconstruction methods. Eur. J. Agron. 2014, 55, 89–99. [Google Scholar] [CrossRef] [Scilit]
- Koutsoudis, A.; Vidmar, B.; Ioannakis, G.; Arnaoutoglou, F.; Pavlidis, G.; Chamzas, C. Multi-image 3D reconstruction data evaluation. J. Cult. Herit. 2014, 15, 73–79. [Google Scholar] [CrossRef] [Scilit]
- Tagliasacchi, A.; Delame, T.; Spagnuolo, M.; Amenta, N.; Telea, A. 3d skeletons: A state-of-the-art report. Comput. Graph. Forum 2016, 35, 573–597. [Google Scholar] [CrossRef] [Scilit]
- Jahanshahi, M.R.; Masri, S.F.; Padgett, C.W.; Sukhatme, G.S. An innovative methodology for detection and quantification of cracks through incorporation of depth perception. Mach. Vis. Appl. 2013, 24, 227–241. [Google Scholar] [CrossRef] [Scilit]
- Nishimura, S.; Kimoto, K.S.S.A.; Kusuhara, S.; Kawabata, S.; Abe, A.; Okazawa, T. Development of a hybrid camera system for bridge inspection. Bridge Maint. Saf. Manag. Resil. Sustain. 2012, 2012, 2197–2203. [Google Scholar] [CrossRef] [Scilit]
- Truong-Hong, L.; Laefer, D.F. Application of terrestrial laser scanner in bridge inspection: Review and an opportunity. In Proceedings of the IABSE Symposium: Engineering for Progress, Nature and People, Madrid, Spain, 3–5 September 2014. [Google Scholar]
- Truong-Hong, L.; Falter, H.; Lennon, D.; Laefer, D.F. Framework for bridge inspection with laser scanning. In Proceedings of the Fourteenth East Asia-Pacific Conference on Structural Engineering and Construction (EASEC-14), Ho Chi Minh City, Vietnam, 6–8 January 2016. [Google Scholar]
- Hinks, T.; Carr, H.; Laefer, D.F. Flight optimization algorithms for aerial LiDAR capture for urban infrastructure model generation. J. Comput. Civ. Eng. 2009, 23, 330–339. [Google Scholar] [CrossRef] [Scilit]
- Wang, Y.; Duan, C.; Huang, X.; Zhao, J.; Zheng, R.; Li, H. Task-driven path planning for unmanned aerial vehicle-based bridge inspection in wind fields. Fluids 2023, 8, 321. [Google Scholar] [CrossRef] [Scilit]
- Shalyhin, A.; Nerubatsky, V.; Denysova, S. The UAV flight route optimization by taking into consideration the wind influence. Hayкa i mexнiкa Пoвimpянuх Cuл Збpoйнux Cuл Укpaїнu 2018, 3, 20–24. [Google Scholar] [CrossRef] [Scilit]
- Yanhua, Y.; Yang, C. Wind disturbance rejection control based on the dynamic parameters estimation of quadrotors UAV. High Technol. Lett. 2019, 25, 443–451. [Google Scholar]
- Cao, B.; Sarkar, P.P. Numerical simulation of dynamic response of a long-span bridge to assess its vulnerability to non-synoptic wind. Eng. Struct. 2015, 84, 67–75. [Google Scholar] [CrossRef] [Scilit]
- Wang, D.; Zhang, Y.; Sun, M.; Chen, A. Characteristics of the wind environment above bridge deck near the pylon zone and wind barrier arrangement criteria. Appl. Sci. 2020, 10, 1437. [Google Scholar] [CrossRef] [Scilit]
- Green, J.J.; Mott, J. Identification of wind-induced hazard zones impacting UAS bridge inspection. Int. J. Aviat. Aeronaut. Aerosp. 2021, 8, 2. [Google Scholar] [CrossRef] [Scilit]
- Chen, S.; Laefer, D.F.; Byrne, J.; Natanzi, A.S. The effect of angles and distance on image-based, three-dimensional reconstructions. In Safety and Reliability: Theory and Applications; CRC Press: Boca Raton, FL, USA, 2017; pp. 2757–2761. [Google Scholar]
- Jung, J.T.; Merkle, D.; Reiterer, A. Automated camera pose generation for high-resolution 3D reconstruction of bridges by unmanned aerial vehicles. Remote Sens. 2024, 16, 1393. [Google Scholar] [CrossRef] [Scilit]

Disclaimer/Publisher’s Note: The statements, opinions and data contained in all publications are solely those of the individual author(s) and contributor(s) and not of MDPI and/or the editor(s). MDPI and/or the editor(s) disclaim responsibility for any injury to people or property resulting from any ideas, methods, instructions or products referred to in the content. |
© 2026 by the authors. Licensee MDPI, Basel, Switzerland. This article is an open access article distributed under the terms and conditions of the Creative Commons Attribution (CC BY) license.