


Abstract
Naringenin is a flavanone recognized for its diverse pharmacological properties, including anti-inflammatory and anticancer effects. This study aimed to produce novel structures with enhanced biological activity by subjecting (±)-naringenin (1) to γ-irradiation. Compound 1 in an ethanol solution was irradiated at doses of 30, 50, 70, and 100 kGy, among which the 100 kGy dose yielded the highest concentration of radiolysis products. These radiolysis products were further processed through multi-step semi-preparative HPLC utilizing a chiral column, yielding compounds 2–5. These compounds were identified as apigenin (2) and three stereoisomers of 2-(1-hydroxyethyl)-naringenin (2,3-dihydro-5,7-dihydroxy-2-(1-hydroxyethyl)-2-phenyl-4H-1-benzopyran-4-one; 3–5) via high-resolution electrospray ionization mass spectrometry and nuclear magnetic resonance spectroscopy. The absolute stereochemistry of compounds 3–5 was determined to be (2S,11S)-, (2S,11R)-, and (2R,11S)-configurations, respectively, by comparing experimental electronic circular dichroism data and specific optical rotations. Evaluation of nitric oxide inhibition in lipopolysaccharide-stimulated RAW 264.7 cells revealed that compound 2 exhibited greater activity to the parent compound 1, whereas derivatives 3‒5 were inactive. These findings indicate that γ-irradiation is an effective strategy for structural modification and enhancing the bioactivity in flavonoids.
1. Introduction
Flavonoids constitute a broad category of natural polyphenols predominantly found in the plant kingdom. Their primary sources include fruits (citrus, berries, and grapes), vegetables (leafy greens, onions, and olives), legumes, and cocoa [1]. Their diverse physiological and biological activities are dictated by their specific structural and physicochemical characteristics [2,3,4]. Major flavonoid subclasses include flavonols, flavones, flavanones, flava-3-ols, isoflavones, and anthocyanidins [2]. Naringenin, a member of the flavanone class, plays significant pharmacological roles in immunomodulation [5], inflammation management [5], oncology [6], melanogenesis modulation [7], and the management of metabolic disorders such as obesity and hypertension [1]. Although naringenin is a promising candidate for pharmaceutical and nutraceutical development, there is a distinct need for structural modifications to improve its functional properties or bioavailability [8].
Compared to traditional chemical synthesis, γ-irradiation offers distinct advantages for radical-mediated transformations under mild, reagent-free conditions in a time-efficient manner [9]. However, this method is limited by a lack of regioselectivity, as structural changes often occur randomly. The radiolysis of ethanol produces solvated electrons (esolv−) and various radicals, such as α-hydroxyethyl (CH3CH•OH), ethoxyl (CH3CHO•), hydroxyl (OH•), and hydrogen (H•) radicals [10]. Previous studies investigating radiation-induced structural modification of flavonoids have yielded significant findings: biochanin A was converted into hydroxyethylated derivative, 2-(1-hydroxyethyl)-2,3-dihydrobiochanin A, which exhibited greater antioxidant activity and enhanced water solubility compared to its parent compound [11]. Similarly, 2-(1-hydroxyethyl)-2,3-dihydrogenistein was synthesized through the reaction between genistein and radicals generated by the radiolysis of ethanol, resulting in improved antioxidant properties [12]. As research on radiation-induced flavonoid modification continues to accumulate, a systematic framework is being established to better understand radical-mediated reactions in specific solvent environments.
In the present study, (±)-naringenin (1) was irradiated in an ethanol solution to induce structural transformations. The resulting derivatives, including a mixture of stereoisomers, were separated using a semi-preparative LC method with a chiral column, and their structures were elucidated by comprehensive spectroscopic techniques. Additionally, these compounds were assessed for their ability to inhibit nitric oxide (NO) production in lipopolysaccharide (LPS)-stimulated RAW 264.7 macrophages.
2. Materials and Methods
2.1. General Procedures
Analytical high-performance liquid chromatography-diode array detector (HPLC-PDA) was performed on a 21 Nexera system (SHIMAZU Co., Kyoto, Japan) equipped with an Agilent Eclipse XDB-C18 column (5 μm, 250 × 4.6 mm, Agilent Technologies, Inc., Santa Clara, CA, USA). Medium-pressure liquid chromatography (MPLC, Biotage AB, Uppsala, Sweden) was performed using a RediSep RP C18 Column (100 g, 20–40 μm, Teledyne Technologies, Thousand Oaks, CA, USA). Thin-layer chromatography (TLC) was utilized to monitor MPLC fractions, with analysis performed under UV light (254 and 365 nm) both before and after treatment with 10% (v/v) sulfuric acid in ethanol and subsequent heating. The TLC was conducted using silica gel 60 F254 or 60 RP-18 F254S precoated 0.2 mm thick aluminum plates (Merck, Darmstadt, Germany). Liquid chromatography Mass spectrometry (LC-MS) data were obtained using Agilent technologies LC-MS (Agilent Technologies, Inc., Santa Clara, CA, USA) equipped with a Phenomenex Luna C-18 column (3 μm, 150 × 4.6 mm, Phenomenex Inc., Torrance, CA, USA). Semi-preparative HPLC was executed on a Waters system (Waters Corporation, Milford, CT, USA) consisting of a Waters 1525 binary pump and a Waters 2998 photodiode array detector using either an YMC-Pack ODS-AQ column (5 μm, 250 × 20 mm, YMC Co., Tokyo, Japan) or a CHIRALPAK IG column (250 × 4.6 mm, 5 μm; DAICEL Co., Ltd., Tokyo, Japan). High-resolution electrospray ionization mass spectrometry data (HRESIMS) were acquired by a Q Exactive Orbitrap mass spectrometer (Thermo Fisher Scientific, Waltham, MA, USA) at the Core Research Support Center for Natural Products and Medical Materials (CRCNM; NFEC-2021-01-267431). Optical rotation and electronic circular dichroism (ECD) measurements were taken in methanol (MeOH) using a JASCO P-2000 polarimeter (JASCO International, Tokyo, Japan) and a JASCO J-1500 spectropolarimeter (CRCNM; NFEC-2023-11-291899, JASCO International), respectively. Nuclear magnetic resonance spectroscopy was performed on a 400-MHz Bruker AVANCE spectrometer (Oxford Magnet, Zurich, Switzerland).
2.2. Sample Preparation
γ-Irradiation was carried out using a cobalt-60 experimental irradiator (150 TBq capacity; AECL, Nordion International Co. Ltd., Ottawa, ON, Canada), with a source intensity of approximately 320 kCi and the dose rate of 10 kGy/h. Dosimetry was verified using 5 mm alanine dosimeters (Bruker Instruments, Rheinstetten, Germany) calibrated according to the International Standard set by the International Atomic Energy Agency (Vienna, Austria). For initial analysis, 4 mg of (±)-naringenin (Sigma-Aldrich Co., St. Louis, MO, USA) dissolved in 4 mL of ethanol with 10% dimethyl sulfoxide (DMSO) was chapped in four vials, and then each vials was γ-irradiated at 30, 50, 70, and 100 kGy (absorbed dose), respectively. To isolate specific radiolysis products, 800 mg of (±)-naringenin in 0.8 L of ethanol with 10% DMSO was irradiated at 100 kGy. Following irradiation, samples were immediately evaporated and freeze-dried for further analysis.
2.3. HPLC-PDA and LC-MS Analysis
The irradiated samples was analyzed by HPLC-PDA using an Agilent Eclipse XDB-C18 (5 μm, 250 × 4.6 mm, Agilent Co., Santa Clara, CA, USA) with an isocratic mobile phase of acetonitrile/water (40:60, v/v). A flow rate of 1.0 mL/min was maintained for each 10 μL injection, and chromatograms were monitored at 280 nm. LC-MS analysis was performed using Agilent LC-MS system equipped with a Phenomenex Luna C-18 column (3 μm, 150 × 4.6 mm, Phenomenex Inc.) maintained at 30 °C. The isocratic mobile phase of acetonitrile/water (75:25, v/v) for 15 min at a flow rate of 1 mL/min. Mass spectrometric detection was conducted using electrospray ionization in positive-ion mode with a scan range of 100–1000. The operational parameters were set as follows: capillary voltage, 3.5 kV; source temperature, 300 °C; drying gas (N2) flow rate, 10 L/min; and nebulizer pressure, 35 psi.
2.4. Isolation of Compounds from γ-Irradiated (±)-Naringenin Sample
The irradiated (±)-naringenin sample (20 mg) was initially separated by semi-preparative HPLC using a reverse-phase (RP) C18 column with an isocratic mobile phase of MeOH/water (75:25, v/v) at a flow rate of 2 mL/min, obtaining compound 2 (5.8 mg, tR = 13.1 min) and a fraction containing peaks 1 and 2 (tR = 9.1–9.3 min). To obtain a sufficient quantity of the peak 1 and 2 mixture, MPLC was performed on the remaining irradiated (±)-naringenin sample using an RP C18 cartridge with a gradient elution system of MeOH/water (20:80 to 100:0, v/v) at a flow rate of 50 mL/min, which afforded compound 2 (239.75 mg) and the target fraction (8.51 mg). This target fraction was subjected to semi-preparative HPLC using a chiral column under isocratic conditions with acetonitrile/water (30:70, v/v) at 1 mL/min, yielding compounds 3 (1.81 mg) and 4 (1.52 mg), alongside a sub-fraction. Subsequent separation of this sub-fraction using acetonitrile/water (25:75, v/v) at 1 mL/min yielded compound 5 (0.91 mg).
Compound 2: Yellowish solid. 1H NMR (400 MHz, CD3OD) δH 7.85 (2H, d, J = 8.8, H-3′,5′), 6.93 (2H, d, J = 8.8, H-2’, 6’), 6.59 (1H, s, H-3), 6.44 (1H, d, J = 2.1, H-7), 6.15 (1H, d, J = 2.1, H-9), 13C NMR (100 MHz, CD3OD) δC 123.3 (C-2), 103.8 (C-3), 183.9 (C-4), 159.5 (C-5), 95.2 (C-6), 166.7 (C-7), 100.3 (C-8), 162.8 (C-9), 166.1 (C-1′), 117.0 (C-2′), 129.4 (C-3′), 163.2 (C-4′), 129.4 (C-5′), 117.0 (C-6′), LRESIMS m/z 271.0 [M+H]+.
Compound 3: Yellowish solid. [ +101.0 (c 0.18, MeOH); ECD (MeOH) Δε (nm) 225 (−13.9), 251 (+2.7), 292 (−1.0), 328 (+3.1); 1H and 13C NMR, see Table 1; HRESIMS m/z 317.1014 [M+H]+ (calcd. for C17H16O6+, 317.1020, mass error = −1.89 ppm).
Table 1.
1H (400 MHz) and 13C (100 MHz) NMR shifts of compounds 3–5 (CD3OD).
Compound 4: Yellowish solid. [ −50.4 (c 0.15, MeOH); ECD (MeOH) Δε (nm) 215 (−19.0), 254 (+3.3), 290 (−3.9), 328 (+2.9); 1H and 13C NMR, see Table 1; HRESIMS m/z 317.1018 [M+H]+, (calcd. for C17H16O6+, 317.1020, mass error = −0.63 ppm).
Compound 5: Yellowish solid. [ +52.0 (c 0.09, MeOH); ECD (MeOH) Δε 214 (+19.0), 254 (−2.9), 290 (+3.9), 333 (−2.7); 1H and 13C NMR, see Table 1; HRESIMS m/z 317.1018 [M+H]+, (calcd. for C17H16O6+, 317.1020, mass error = −0.63 ppm).
2.5. Quantum Mechanics-Based NMR and ECD Calculations
Gauge-Including Atomic Orbitals (GIAO) NMR calculation and Diastereomeric Parameter (DP4+) probability analysis were implemented to perform the Quantum mechanics-based NMR analyses [13]. The diastereomeric conformers were searched by Spartan 24 software (Wave function Inc., Irvine, CA, USA) using the MMFF force field, and the conformer selection was performed by considering the global minimum within 10 kJ/mol. The energy minimization and the 13C NMR calculations for the structures were performed using Density Functional Theory (DFT) at the mPW1PW91/6-31+G(d,p) level in Gaussian 16 software (Gaussian Inc., Wallingford, CT, USA); considering the Boltzmann weights of more than 1%, the conformers are selected for the DP4+ calculation.
The conformer search for the ECD calculation was followed by the same method used for the NMR calculation. The energy minimization of the conformers and the ECD calculations were conducted using Time-Dependent Density Functional Theory (TDDFT) at the B3LYP/6-31+G(d,p) level using Gaussian 16 software. SpecDis software (version 1.71, Berlin, Germany) was further used to process the calculated ECD spectra and for the comparison with the experimental spectra [14].
2.6. Cell Viability and Nitric Oxide Inhibition Assays
Anti-inflammatory potential and cell viability were assessed in RAW 264.7 macrophages as previously described [15]. Briefly, cells were seeded at 2 × 10⁵ cells/mL in 96-well plates and incubated for 24 h. Cytotoxicity was evaluated using the EZ-Cytox assay (Daeillab, Seoul, Republic of Korea) after a 24 h exposure to compounds (10, 20, 40, and 80 µM), measuring formazan formation at 480 nm. For NO production analysis, cells were pre-treated with the compounds for 2 h, followed by stimulation with 1 μg/mL LPS for 18 h. Nitrite accumulation was measured using the Griess reagent at 540 nm, and IC50 values were calculated via non-linear regression [16]. Data represent the mean ± standard deviation (SD) of technical replicates (n = 3 for the cell viability assay and n = 4 for the NO production assay). Statistical significance was determined using two-way analysis of variance (ANOVA) followed by Tukey’s honestly significant difference (HSD) test (p < 0.05 or 0.01) using GraphPad Prism software (version 5.01, San Diego, CA, USA).
3. Results and Discussion
3.1. Separation of the Radiolysis Products Obtained from γ-Irradiated (±)-Naringenin
Solutions containing (±)-naringenin (1) were subjected to γ-irradiation at four different dosages: 30, 50, 70, and 100 kGy. To achieve complete dissolution of the flavonoid substrate and ensure homogeneous γ-irradiation, 10% (v/v) DMSO was employed as a co-solvent. Although DMSO is known to participate in radical chemistry, the large molar excess of ethanol (>85 mol%) ensures that the radiolytic pathway is primarily driven by ethanol-derived radicals. Indeed, the identified transformation products consisted exclusively of ethanol-derived adducts, indicating that the contribution of DMSO-derived radical species to product formation was negligible.
The relative substrate conversion and product distribution were estimated based on HPLC-PDA peak area integration at 280 nm (Figure S1). As the radiation dose increased to 100 kGy, the relative peak area of parent compound 1 (peak 1, tR 14.39 min) significantly decreased (estimated conversion: 87.3%). Concurrently, peak 2 (tR 13.59 min) was consistently formed as the major radiolytic product, representing 79.4% of the total integrated area at 100 kGy. Peak 3 (tR 5.81 min) constituted a minor portion, reaching a relative area of 4.4% at the maximum dose. Furthermore, the ethanol sample irradiated at 100 kGy demonstrated enhanced inhibitory activity against NO production in LPS-activated RAW 264.7 macrophage cells (Figure S2).
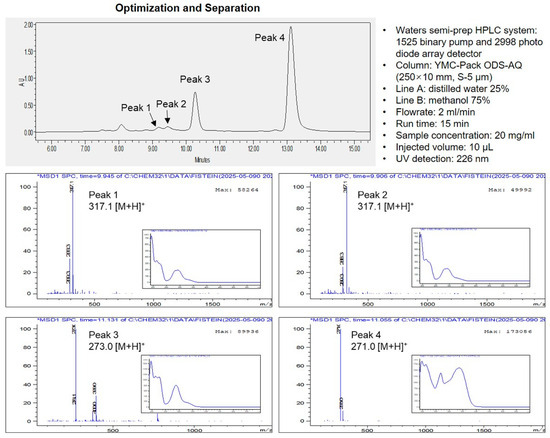
Consequently, large-scale irradiation of parent compound 1 (800 mg) was performed. The semi-preparative HPLC separation conditions were optimized to resolve the radiolysis products into four peaks (Figure 1). After purifying each peak, LC-MS analysis revealed that peaks 1 and 2 shared identical molecular weights (m/z 317 [M+H]+) and UV patterns. Peak 3 corresponded to the parent compound, (±)-naringenin (1, m/z 273 [M+H]+), and peak 4 showed a molecular weight of m/z 271 [M+H]+, 2 Da less than that of the compound 1.
Figure 1.
Optimization of HPLC conditions and separation profiles of (±)-naringenin (1) sample irradiated at 100 kGy.
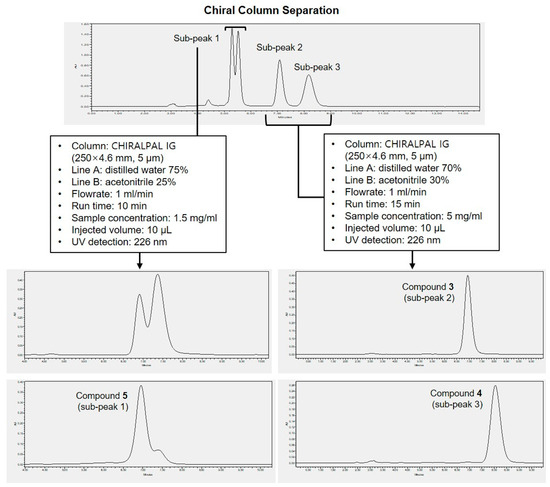
Because peaks 1 and 2 were presumed to be a stereoisomeric mixture, they combined for further separation. To separate this combined fraction, a CHIRALPAK IG column (250 × 4.6 mm, 5 μm) was selected based on previous report demonstrating its best resolution for naringenin isomer separation using a CHIRALPAK IG-3 column, which shares the identical chiral selector chemistry (amylose tris(3-chloro-5-methylphenylcarbamate)) [17]. In this study, the effects of five different isocratic mobile phases on stereoisomeric separation were investigated using acetonitrile/water solvent systems (40:60, 30:70, 25:75, 23:77, and 20:80, v/v) (Figure S3). Increasing the aqueous phase proportion above 75% increased both retention time and peak width. However, a high acetonitrile content compromised the resolution of sub-peak 1. Therefore, optimal resolution and sensitivity for the stereoselective separation of the combined fraction were achieved using an acetonitrile/water mixture (30:70, v/v). Under this optimized condition, separation into three sub-peaks was achieved (Figure 2). Chromatographic performance was quantitatively evaluated using the retention factor (k = (tR − t0)/t0), separation factor (α = k2/k1), and chromatographic resolution (Rs = 1.18 × (tR2 − tR1)/(W0.5,1 + W0.5,2), where W0.5 represents the peak width at half-height). Baseline resolution was successfully achieved between sub-peaks 2 and 3 (Rs = 1.94, α = 1.25) as well as between sub-peaks 1 and 2 (Rs = 3.14, α = 1.70). Sub-peaks 2 (tR = 7.08 min, k = 1.62) and 3 (tR = 8.18 min, k = 2.03) were purified and designated as compounds 3 and 4, respectively, and their structures were elucidated through subsequent spectroscopic experiments. Sub-peak 1 (sub-peak 1a, tR = 5.30 min, k = 0.96; sub-peak 1b, tR = 5.54 min, k = 1.05) was re-separated and purified using an acetonitrile/water system (25:75, v/v), which provided the best separation for this specific peak with resolution of Rs = 0.83 (α = 1.09) (Figure 2). Although the compound corresponding to the later-eluting peak (tR = 7.37 min, k = 1.73) could not be fully recovered due to trace amounts, the isolated compound from the earlier-eluting peak (tR = 6.91 min, k = 1.56) was designated as compound 5. The chromatographic purity of the isolated stereoisomers was assessed by analytical HPLC-PDA re-injection based on peak area integration at 226 nm under the optimized chiral chromatographic conditions, confirming purities of 98.4% for 3, 97.8% for 4, and 94.5% for 5 (Figure 2).
Figure 2.
Chiral column separation steps for the combined fraction of peaks 1 and 2.
3.2. Structural Elucidation of Compounds 2–5
Compound 2 was isolated as a yellow powder and displayed a protonated molecular ion at m/z 271.0 [M+H]+ in LRESIMS, consistent with the loss of two protons (−2 Da) via radiolytic dehydrogenation of the parent compound 1. of the structure of 2 was established through the 1H and 13C NMR spectroscopic analysis, where the characteristic C-3 olefinic proton singlet (δH 6.59) and downfield olefinic carbons (δC 123.3, C-2; 103.8, C-3) were in agreement with published literature values [18] (Figures S4 and S5). The unambiguous 1D NMR spectral correspondence of the purified compound confirms its structural assignment as apigenin (2).
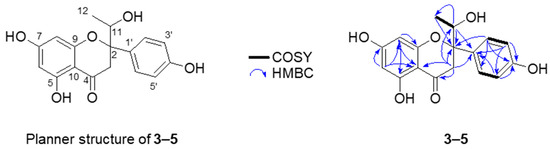
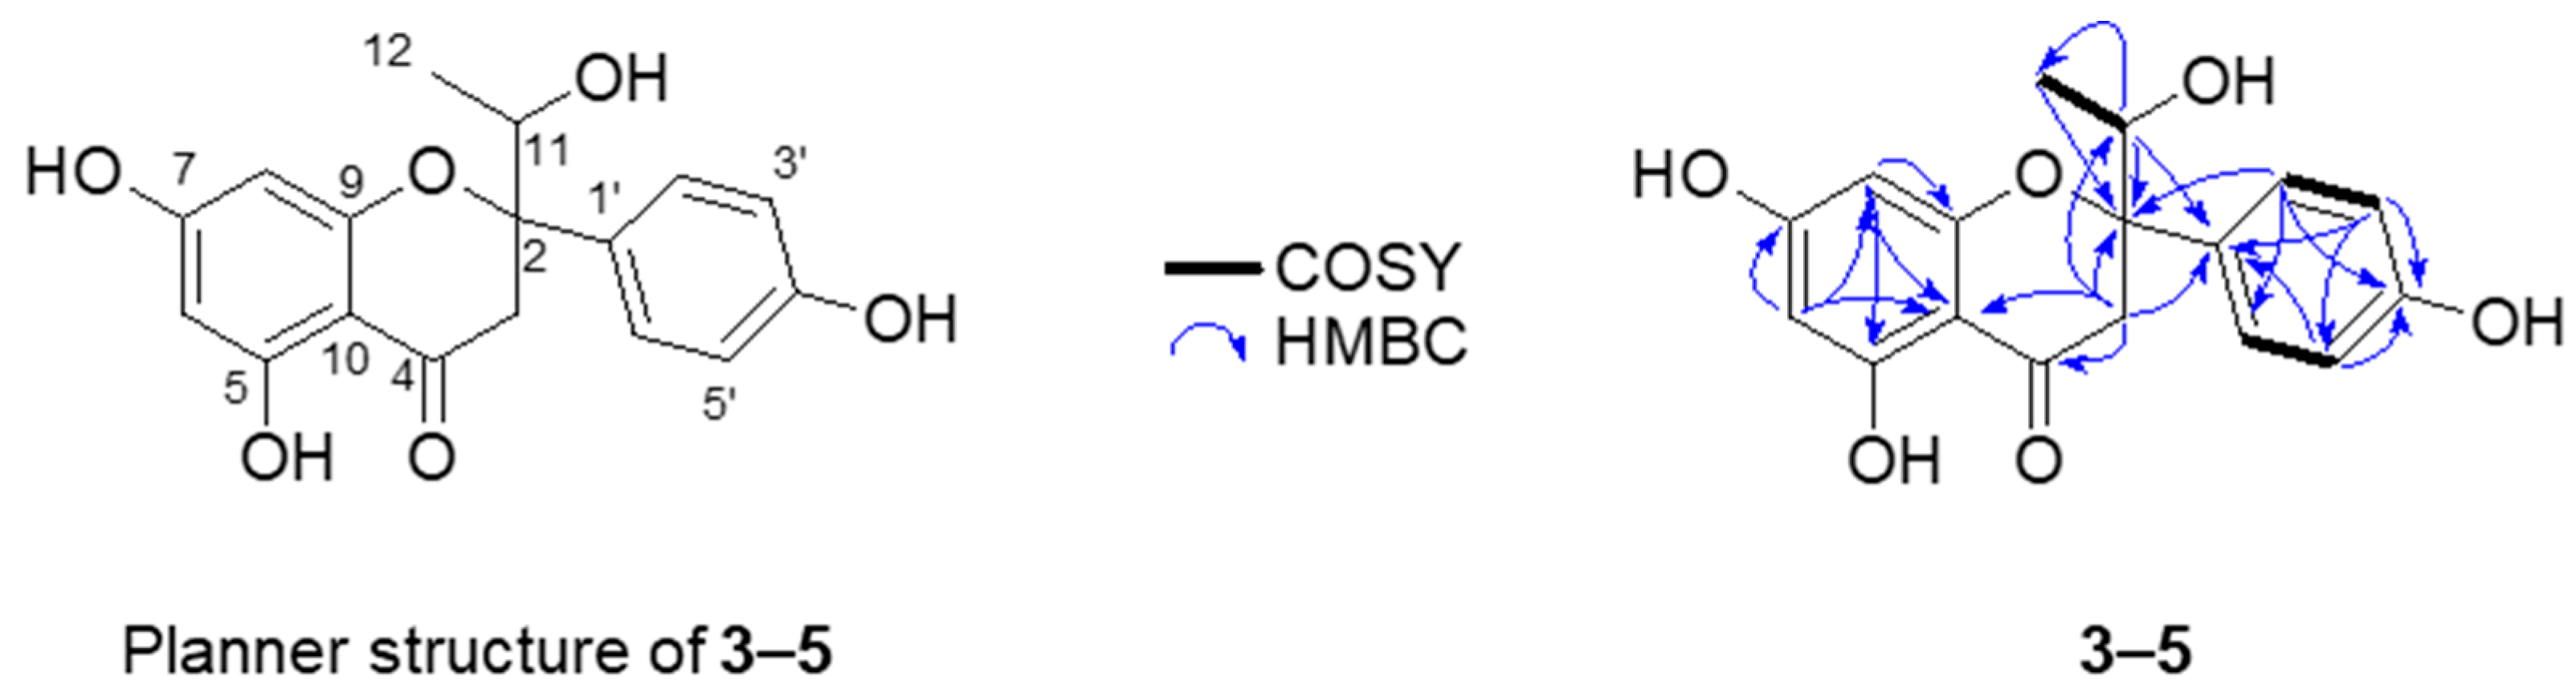
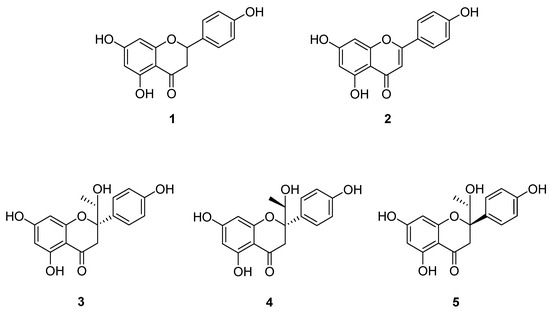
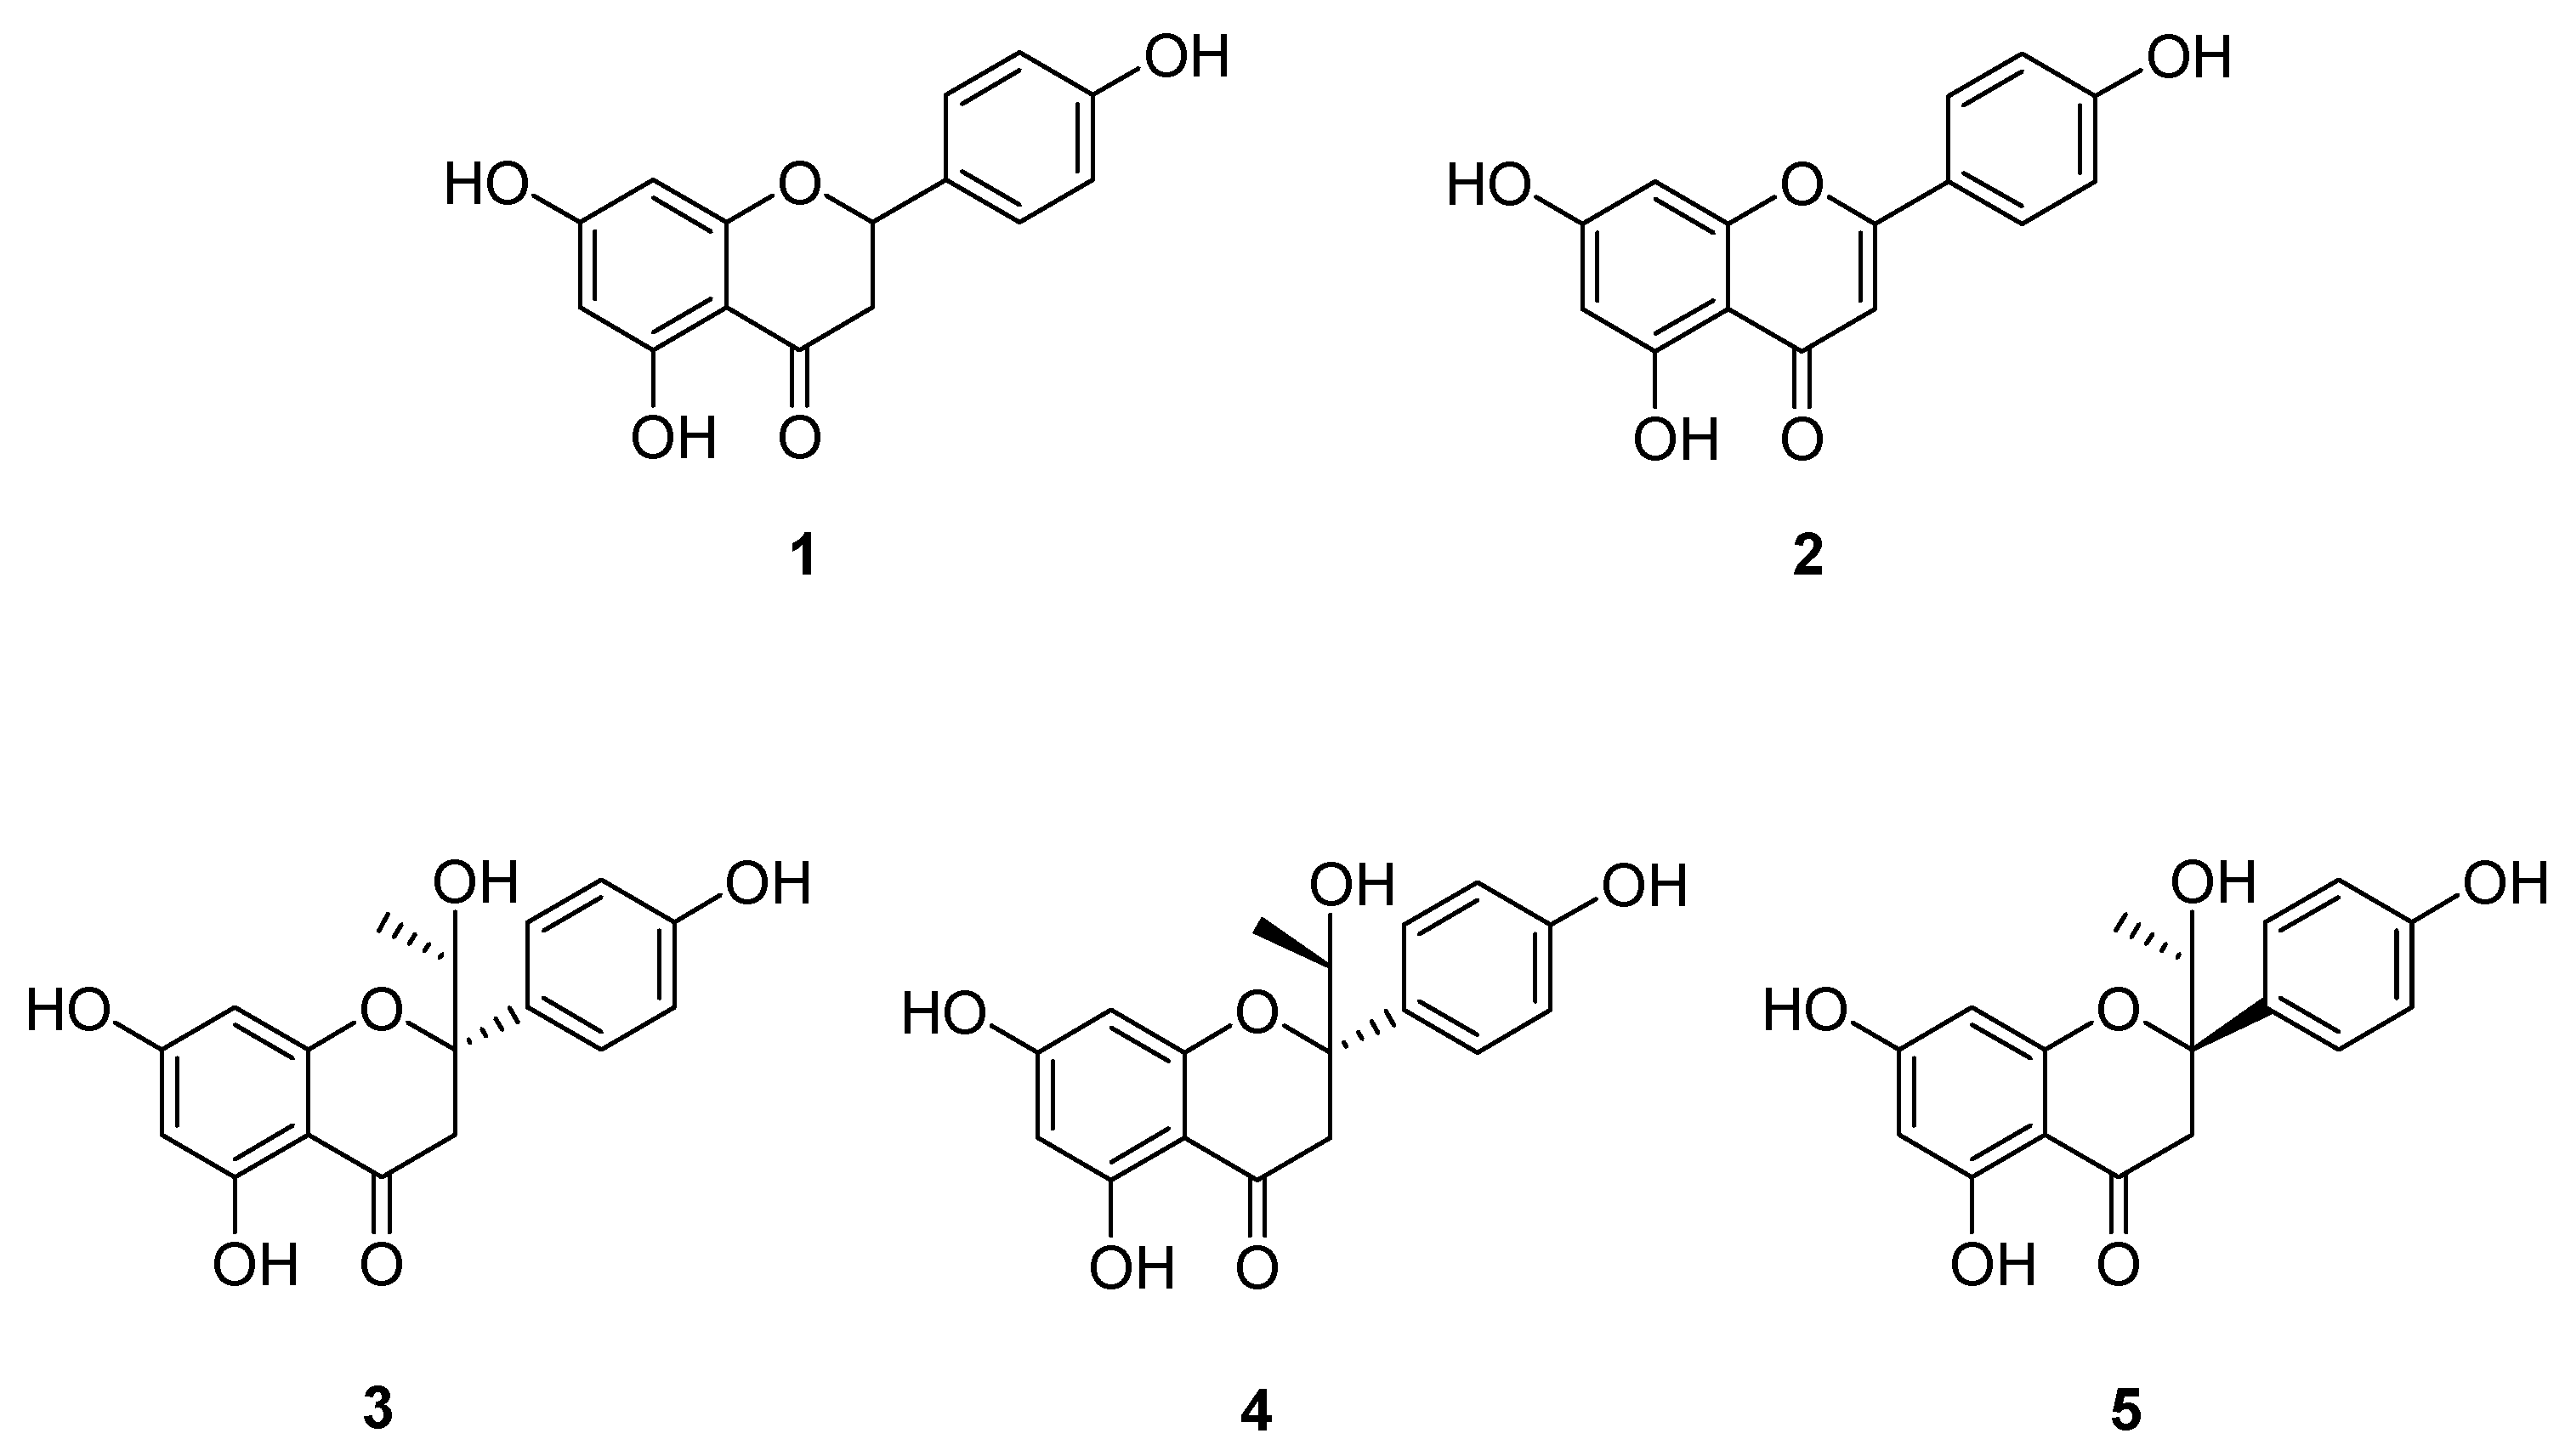
Compound 3 was obtained as yellow powder, showing a molecular ion at m/z 317.1018 [M+H]+ (calcd. for C17H16O6+, 317.1020; mass error, −1.89 ppm) in HRESIMS, which corresponds to an elemental formula of C17H16O6. The 1H NMR spectrum of 3 exhibited proton signals at δH 7.19 (2H, d, J = 8.8 Hz, H-2′, 6′) and 6.71 (2H, d, J = 8.8 Hz, H-3′, 5′), characteristic of a 1,4-disubstituted aromatic ring. Additionally, signals at δH 5.73 (1H, d, J = 2.1 Hz, H-6) and 5.93 (1H, d, J = 2.1 Hz, H-8) indicated another aromatic system, while methylene signals at δH 3.36 (1H, d, J = 17.1 Hz, H-3a) and 3.17 (1H, d, J = 17.1 Hz, H-3b) confirmed the presence of a naringenin backbone [19] (Table 1). Further observations include an oxygenated methane proton at δH 4.08 (1H, q, J = 6.6 Hz, H-11) and a methyl proton at δH 0.92 (3H, d, J = 6.6 Hz, H-12). Comparison of the 13C NMR spectrum of 3 with that of naringenin revealed carbon signals for the hydroxyethyl group at C-11 (δC 74.2) and C-12 (δC 17.0) and a quaternary carbon signal at C-2 (δC 89.0), instead of an oxygenated methine group found at C-2 [19]. The attachment of a hydroxyethyl substituent at the C-2 position was confirmed through 1H-1H correlation spectroscopy (COSY) correlation of H11/H-12 and 1H-13C heteronuclear multiple bond connectivity (HMBC) correlations of H-11/C-12, C-2, C-1′ and H-12/C-2 (Figure 3 and Figures S6–S11). Consequently, compound 3 was elucidated as 2,3-dihydro-5,7-dihydroxy-2-(1-hydroxyethyl)-2-phenyl-4H-1-benzopyran-4-one, also referred to as 2-(1-hydroxyethyl)-naringenin.
Figure 3.
Planar structure and key 1H-1H COSY and 1H-13C HMBC correlations of compounds 3–5.
The 1H NMR spectra of compounds 4 and 5 showed spin-spin splitting patterns and coupling constants similar to those of 3, although their chemical shifts were notably upfield (Table 1). Detailed analysis of 1D and 2D NMR data for 4 and 5 confirmed they share the same planar structures as 3 but possess different relative configurations (Figures S12–S23). The planar structure for 3–5, 2-(1-hydroxyethyl)-naringenin, was not matched to any existing entry upon a structure-based search of Scifinder-n, confirming that compounds are structurally novel, previously unreported compounds.
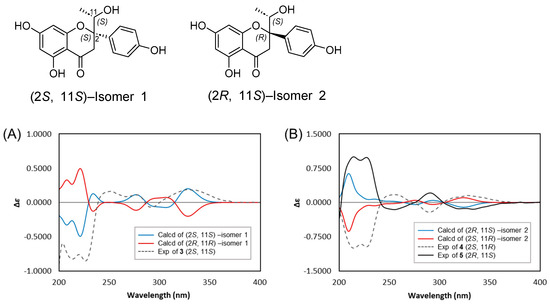
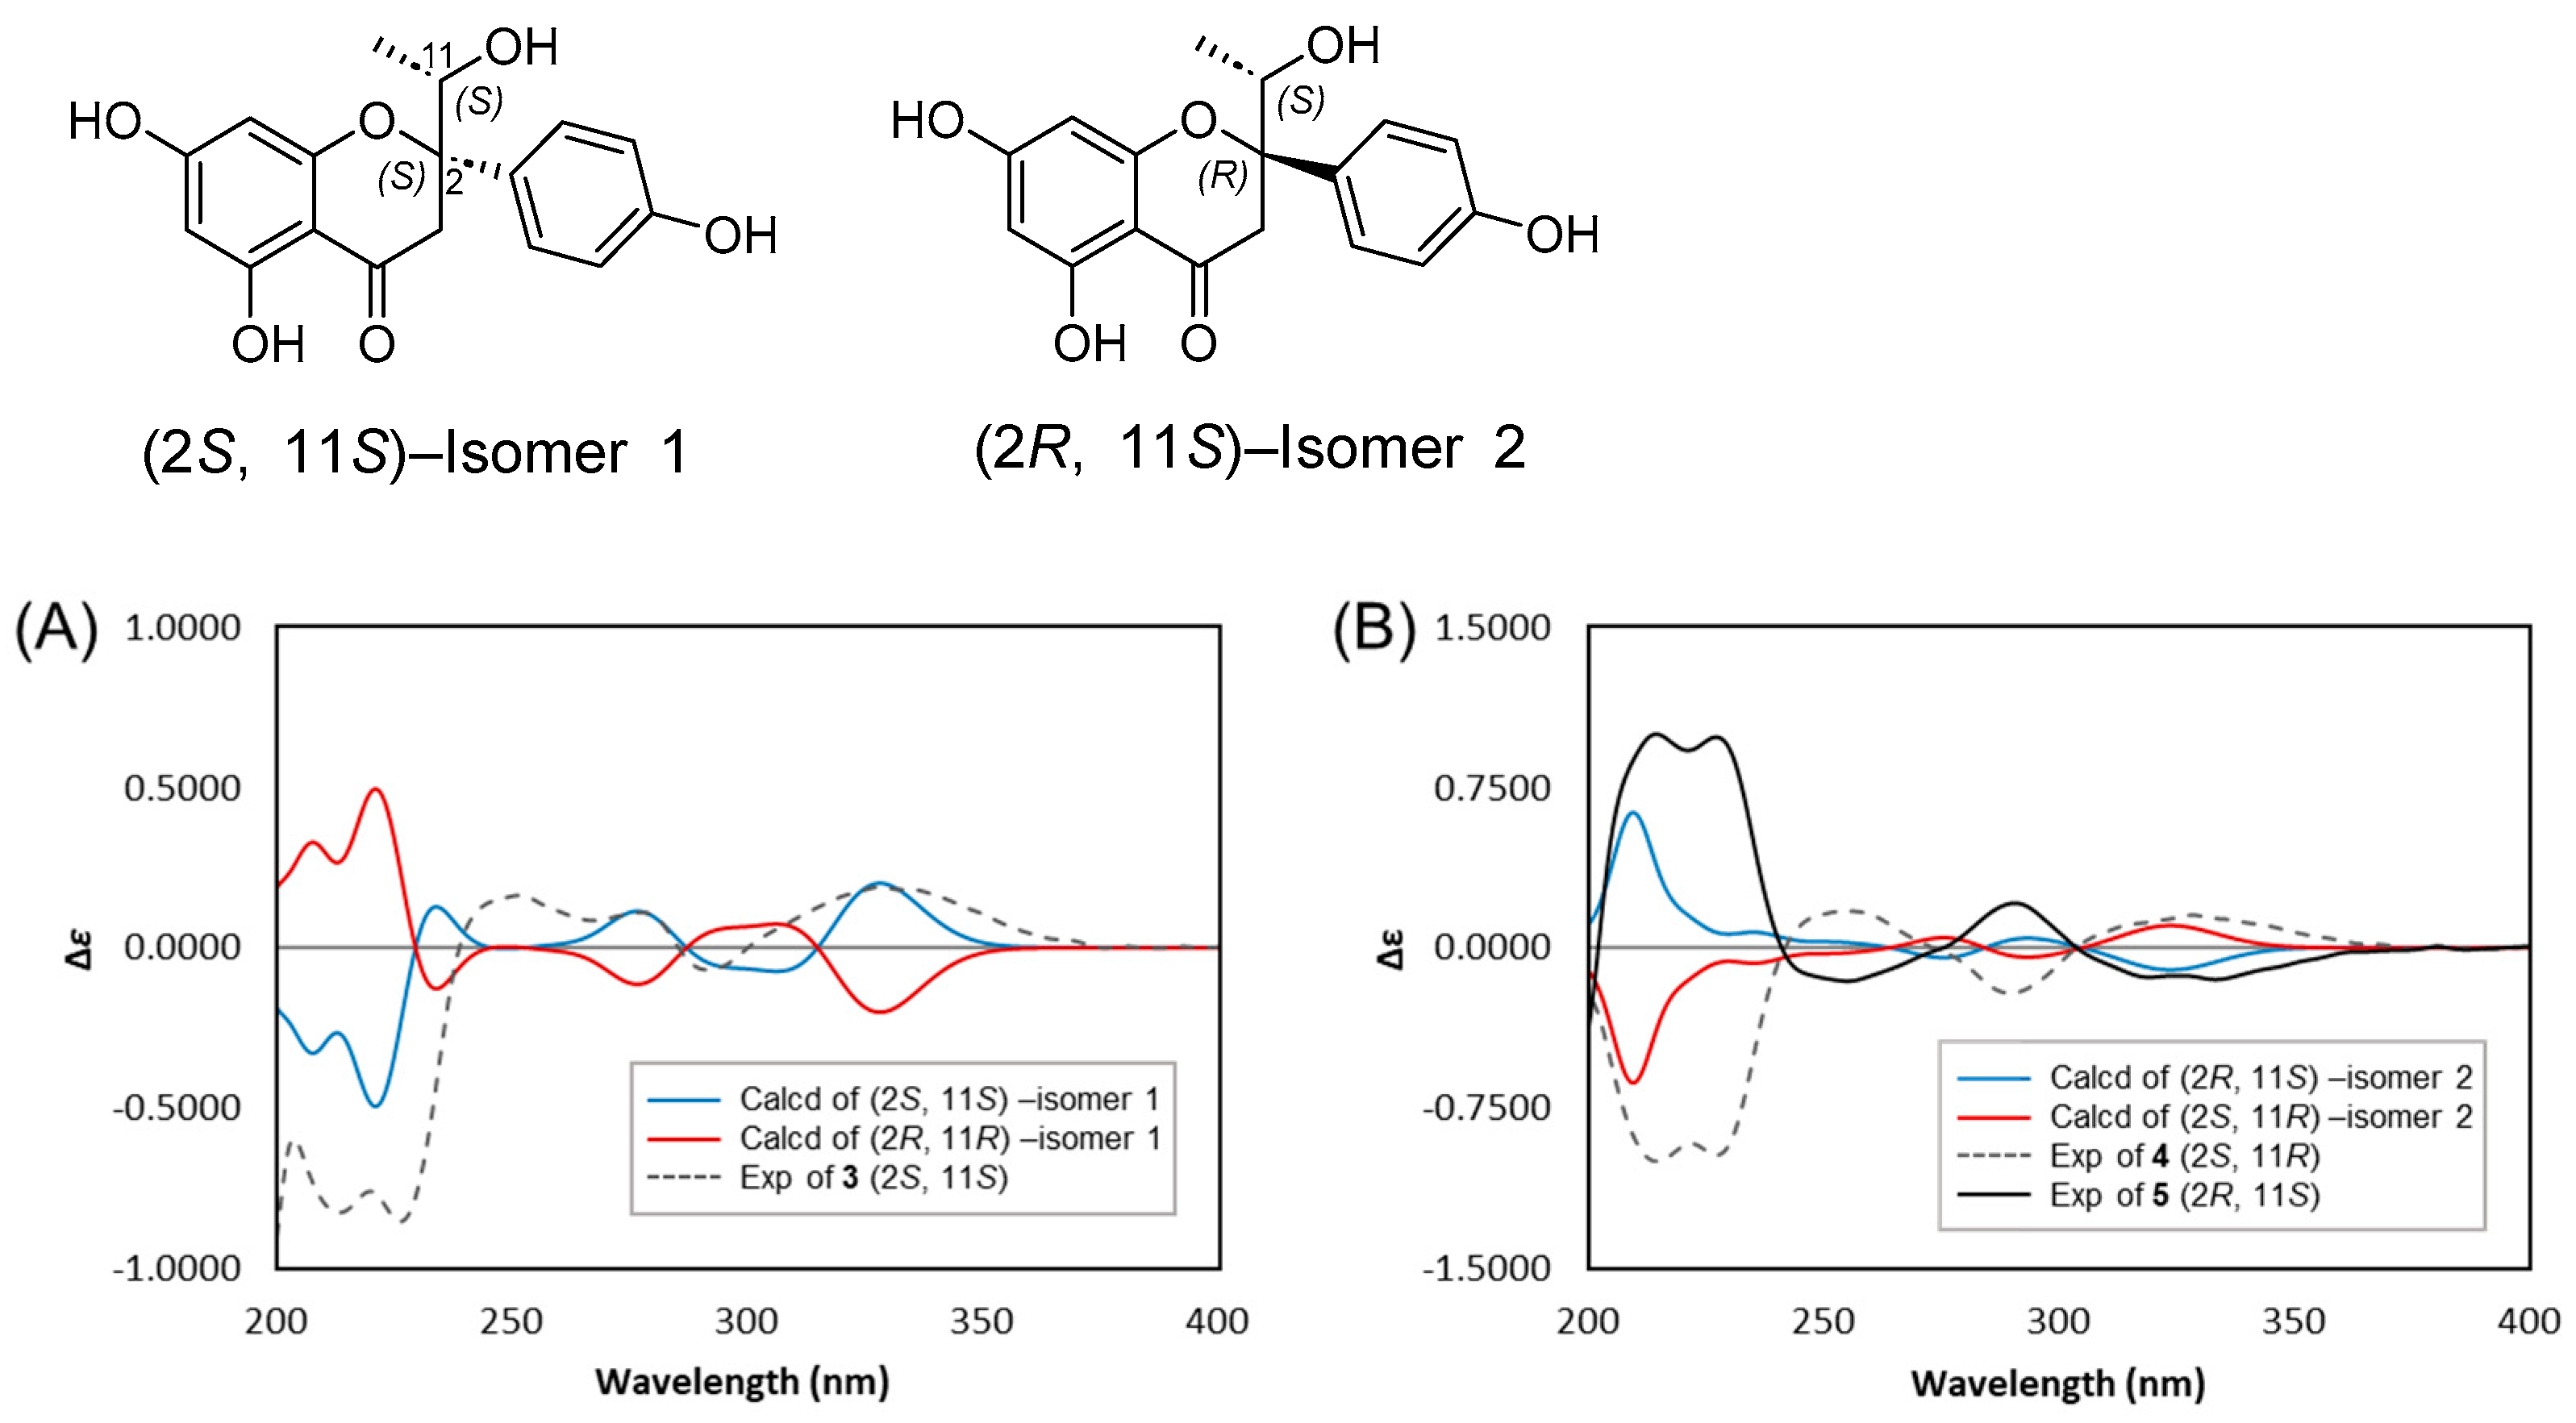
The relative configurations of compounds 3–5 were established using the DP4+ computational method, an NMR-based approach specifically designed for stereochemical determination. Theoretical 13C NMR calculations for 3 and 4 were performed using DFT at the mPW1PW91/6-31+G(d,p) level. To define the relative configurations, the calculated chemical shifts for two candidate stereoisomers, (2S,11S)-isomer 1 and (2R, 11S)-isomer 2, were compared against the experimental datasets using the DP4+ probability method (incorporating the mPW1PW91 functional, PCM solvent model, and a 6-31+G(d+p) basis set with shielding tensor) [20,21]. For compound 3, the DP4+ analysis yielded a strong preference for (2S,11S)-isomer 1 with a 99.99% for DP4+ (13C data) probability (Figure S24). For compound 4, the analysis favored (2R, 11S)-isomer 2 with an 89.06% for DP4+ (13C data) probability (Figure S25). Although this 89.06% probability for 4 provides supportive rather than independently definitive evidence for the relative configuration, the distinct 13C chemical shift disparities at diagnostic positions (C-2, C-3a/b, C-11, and C-12) between 3 and 4 further substantiate their diastereomeric relationship. To determine the absolute configurations of compounds 3–5, their experimental ECD spectra were compared with the calculated ECD spectra of the possible stereoisomers (Figure 4). The ECD calculation was performed by the TDDFT at the B3LYP/6-31+G(d,p) level using Gaussian 16 software [22]. The experimental ECD spectrum of 3 matched the calculated spectrum of (2S,11S)-isomer 1, defining 3 as (2S,11S)-2-(1-hydroxyethyl)-naringenin (Figure 4A). For compound 5, the experimental ECD profile was in agreement with the calculated spectrum of the (2R,11S)-isomer, confirming its (2R,11S)-2-(1-hydroxyethyl)-naringenin ([ +52.0) (Figure 4B). Compound 4 showed an inverted ECD spectrum and opposite specific optical rotation ([ −50.4) relative to 5, perfectly aligning with the calculated spectrum of (2S,11R)-isomer 2 (Figure 4B). Thus, the mutual combination of DP4+ calculation, ECD spectral matching, and optical rotation definitively established the absolute configuration of compounds 3–5 as (2S,11S)-, (2S,11R)-, and (2R,11S)-2-(1-hydroxyethyl)-naringenin, respectively (Figure 5).
Figure 4.
Experimental and TDDFT-calculated ECD spectra of stereoisomers 3–5 in MeOH. (A) Experimental ECD spectrum of 3 vs. calculated spectra of (2S,11S)- and (2R,11R)-isomers. (B) Experimental ECD spectra of enantiomeric pair 4 and 5 vs. calculated spectra of (2S,11R)- and (2R,11S)-isomers, verifying the assignment of 4 as (2S,11R) and 5 as (2R,11S).
Figure 5.
Chemical structures of compounds 1–5. Compound 1: the parent compound, (±)-naringenin; compound 2: the major radiolytic product, apigenin; compounds 3‒5: the minor radiolytic product, (2S,11S)-, (2S,11R)-, and (2R,11S)-2-(1-hydroxyethyl)-naringenin.
Ionizing radiation has been long utilized for the structural transformation of flavonoids. For instance, previous studies have demonstrated that flavonols (such as quercetin, kaempferol, morin, and galangin) undergo structural modifications initiated by radiolytically generated radical species, leading to reduction of the 2,3-double bond and hydroxyethylation [23]. Similarly, isoflavones such as genistin have been reported to undergo analogous radical-mediated transformations [12]. Based on these precedents and the structural elucidation of the isolated products, we proposed a plausible, hypothetical pathway for the γ-irradiation-induced transformation of (±)-naringenin (1). It is tentatively postulated that initial 2,3-dehydrogenation mediated by hydroxyl radicals may yield apigenin (2). The radiation-induced C2=C3 desaturation of naringenin (1) to apigenin (2) observed in the present study is mechanistically consistent with these previously reported dehydrogenation-type transformations of related flavonoids. The subsequent formation of compounds 3‒5 could be rationally hypothesized to proceed via hydrogen radical addition at C-3 of apigenin, generating a C-2 radical intermediate that subsequently couples with an α-hydroxyethyl radical. Because direct radical-trapping or kinetic evidence was not experimentally obtained in this study, this proposed reaction sequence remains a working hypothesis. Further detailed mechanistic investigations will be necessary to fully elucidate the exact radical intermediates and kinetic pathways involved in the generation of these novel structures.
3.3. Anti-Inflammatory Activity Evaluation of Compounds 1–5
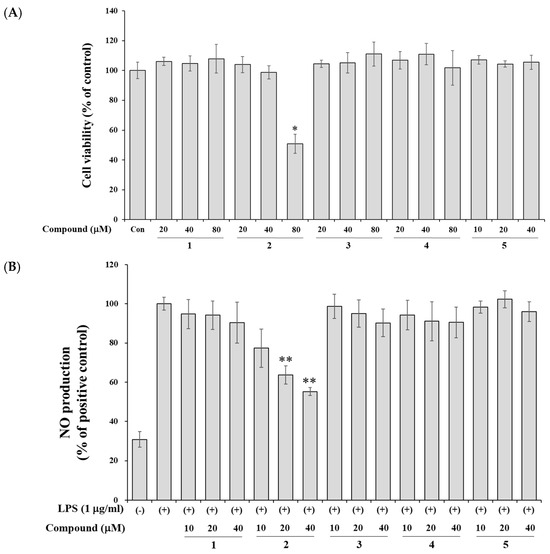
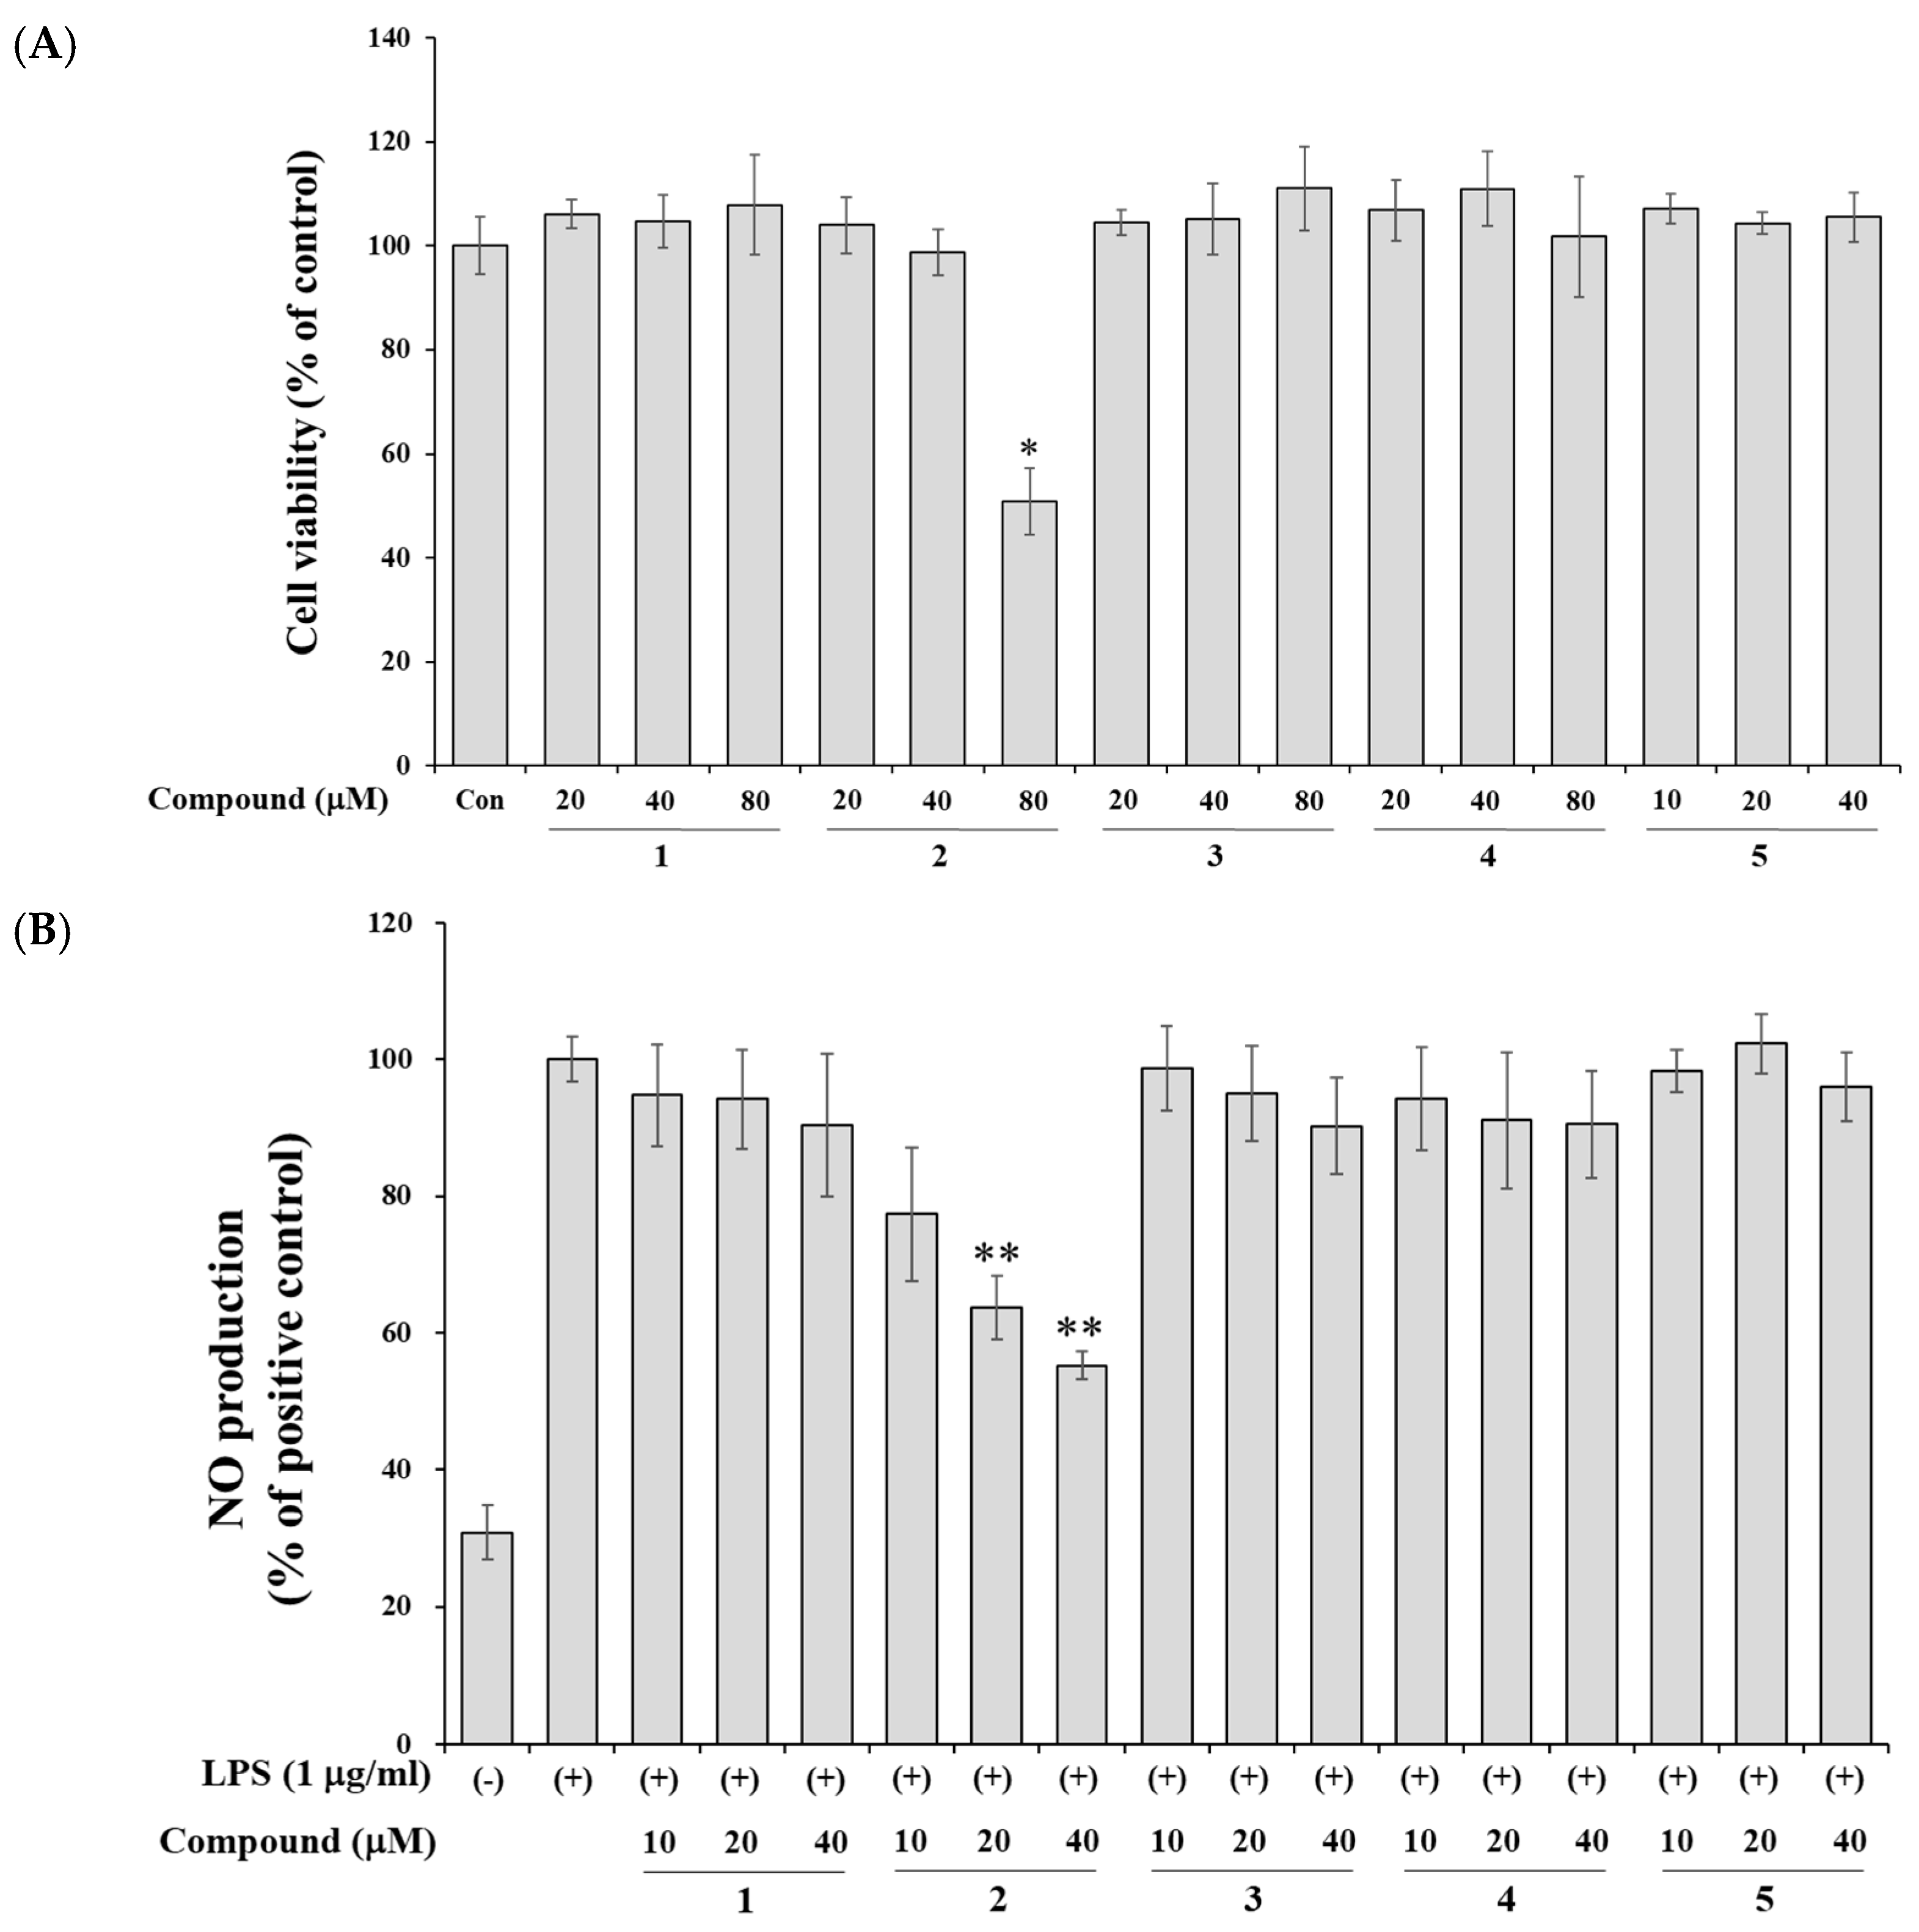
The cytotoxic profiles of compounds 1–5 were first assessed using the EZ-Cytox assay in RAW 264.7 macrophages. Compounds 1 and 3–5 exhibited no significant impact on cell viability at the tested concentrations. For compound 2, viability was unaffected up to 40 μM (>98%), whereas significant cytotoxicity was observed at 80 μM (50.9% of control, p < 0.05) (Figure 6A). In the NO inhibition assay, parent compound 1 showed only weak suppression at the maximum tested concentration (80 μM). Although non-linear regression yielded a calculated IC50 value of 161.2 μM (95% CI: 118.3–232.1 μM), because this value lies beyond the tested range, its activity is conservatively designed as IC50 > 80 μM. In contrast, pretreatment with apigenin (2) elicited potent, concentration-dependent inhibition of LPS-induced NO production (Figure 6B). To exclude potential artifacts arising from cell death at 80 μM, the IC50 of compound 2 was determined across the non-cytotoxic concentration range (10–40 μM), yielding an IC50 value of 19.1 μM (95% CI: 16.3–24.4 μM). These results demonstrate that the anti-inflammatory efficacy of apigenin is substantially superior to that of naringenin and operates independently of cell death. Compounds 3–5 showed no inhibitory effect on NO production at the tested concentrations.
Figure 6.
Effects of compounds 1–5 on cell viability (A) and NO production (B) in LPS-stimulated RAW 264.7 cells. RAW 264.7 cells were treated with the indicated concentrations of compounds 1–5 for 2 h prior to LPS addition (1 μg/mL) and were incubated for an additional 18 h. Data are presented as means ± SD from triplicate (n = 3, for cell viability) and quadruplicate (n = 4, for NO production) technical replicates. * p < 0.05 versus control group, ** p < 0.01 versus LPS only stimulated group.
The structural transition from naringenin to apigenin via radiation-induced C2=C3 desaturation creates a planar configuration and extends π-electron conjugation, which is known to enhance binding affinity to inflammatory targets [24]. This modification results in a marked enhancement of NO inhibitory potency. While our experimental investigation focused specifically on the suppression of NO production, the previous literature has reported that the anti-inflammatory properties of apigenin are associated with multiple molecular targets. For instance, apigenin has been documented in previous studies to suppress the expression of inducible nitric oxide synthase (iNOS) and cyclooxygenase-2 (COX-2) [25], modulate the Janus Kinase 1/Signal Transducer and Activator of Transcription 3 (JAK1/STAT3) pathway [15], and decreases the secretion of pro-inflammatory cytokines such as Tumor Necrosis Factor- α (TNF-α), Interleukin-6 (IL-6), and IL-1β [15]. Additionally, prior reports suggest that apigenin may regulate MicroRNA-155 (miR-155), to help restore immune homeostasis [26]. These literature-supported pathways provide a rational background for the potent anti-inflammatory effects observed with apigenin (2), although further molecular investigations would be necessary to directly verify these downstream signaling events under the current radiolytic transformation context.
4. Conclusions
γ-Irradiation of naringenin (1) in ethanol solution at 100 kGy successfully induced molecular modifications, yielding four derivatives: apigenin (2) and three stereoisomers of 2-(1-hydroxyethyl)-naringenin (3–5). Multi-step semi-preparative HPLC using a chiral column enabled the successful resolution of these structurally similar stereoisomers, leading to the clear elucidation of their absolute configurations as (2S,11S)-, (2S,11R)-, and (2R,11S)-forms via DP4+ calculations and ECD analysis. Anti-inflammatory evaluation in RAW 264.7 cells showed that apigenin (2) effectively inhibited NO production within a non-cytotoxic concentration range, exhibiting an IC50 value of 19.1 μM. This demonstrates a substantially enhanced anti-inflammatory efficacy compared to the parent compound naringenin (IC50 > 80 μM; calculated IC50 = 161.2 μM), which produced only marginal inhibition at the highest evaluated concentration. This enhanced efficacy results from radiation induced C2=C3 desaturation, which optimizes the planar configuration and π-electron conjugation for target binding. In contrast, the hydroxyethylated derivatives (3–5) showed no inhibitory activity against NO production. These results indicate that while γ-irradiation produces random structural changes, its combination with effective chiral separation techniques enabled the isolation and full stereochemical characterization of three structurally novel stereoisomers of 2-(1-hydroxyethyl)-naringenin (3–5). This demonstrates that the γ-irradiation combined with chiral HPLC separation is a powerful approach for accessing structurally novel, stereochemically defined flavonoid derivatives that would be difficult to obtain by conventional synthesis.
Supplementary Materials
The following supporting information can be downloaded at: https://www.mdpi.com/article/10.3390/separations13090265/s1, Figure S1. HPLC profiles (280 nm) of (±)-naringenin (1) γ-irradiated at doses of 30, 50, 70, and 100 kGy; Figure S2. Effects of solvent-specific samples of (±)-naringenin (IPA, isopropyl alcohol; M, methanol; E, ethanol) irradiated at 100 kGy on NO production in LPS-stimulated RAW 264.7 cells; Figure S3. Chromatograms and elution order of the combined fraction of peaks 1 and 2 on a CHIRALPAK IG column under various mobile phase conditions; Figure S4. 1H NMR (400 MHz, CD3OD) spectrum of compound 2; Figure S5. 13C NMR (100 MHz, CD3OD) spectrum of compound 2; Figure S6. 1H NMR (400 MHz, CD3OD) spectrum of compound 3; Figure S7. 13C NMR (100 MHz, CD3OD) spectrum of compound 3; Figure S8. 1H-1H COSY NMR (400 MHz, CD3OD) spectrum of compound 3; Figure S9. 1H-13C HSQC NMR (400 MHz, CD3OD) spectrum of compound 3; Figure S10. 1H-13C HMBC NMR (400 MHz, CD3OD) spectrum of compound 3; Figure S11. HRESIMS spectrum of compound 3; Figure S12. 1H NMR (400 MHz, CD3OD) spectrum of compound 4; Figure S13. 13C NMR (100 MHz, CD3OD) spectrum of compound 4; Figure S14. 1H-1H COSY NMR (400 MHz, CD3OD) spectrum of compound 4; Figure S15. 1H-13C HSQC NMR (400 MHz, CD3OD) spectrum of compound 4; Figure S16. 1H-13C HMBC NMR (400 MHz, CD3OD) spectrum of compound 4; Figure S17. HRESIMS spectrum of compound 4; Figure S18. 1H NMR (400 MHz, CD3OD) spectrum of compound 5; Figure S19. 13C NMR (100 MHz, CD3OD) spectrum of compound 5; Figure S20. 1H-1H COSY NMR (400 MHz, CD3OD) spectrum of compound 5; Figure S21. 1H-13C HSQC NMR (400 MHz, CD3OD) spectrum of compound 5; Figure S22. 1H-13C HMBC NMR (400 MHz, CD3OD) spectrum of compound 5; Figure S23. HRESIMS spectrum of compound 5. Figure S24. DP4+ calculation of compound 3 (experimental), isomer 1 (2S, 11S), isomer 2 (2R, 11S); Figure S25. DP4+ calculation of compound 4 (experimental), isomer 1 (2S, 11S), isomer 2 (2R, 11S).
Author Contributions
Conceptualization, E.-B.B. and J.-W.N.; methodology, A.-R.H. and J.-W.N.; software, M.M.M., C.H.J. and E.C.; validation, H.-Y.S., T.H.N., K.J.L. and H.C.; formal analysis, M.M.M., E.C. and C.H.J.; investigation, M.M.M., A.-R.H., C.H.J. and E.C.; resources, E.-B.B.; data curation, M.M.M., A.-R.H., C.H.J. and E.C.; writing—original draft preparation, M.M.M. and A.-R.H.; writing—review and editing, H.-Y.S., T.H.N., H.C., K.J.L. and J.-W.N.; visualization, M.M.M. and C.H.J.; supervision, J.-W.N.; project administration, E.-B.B.; funding acquisition, E.-B.B. All authors have read and agreed to the published version of the manuscript.
Funding
This research was funded by the research program of Korea Atomic Energy Research Institute, grant number 523320-26.
Data Availability Statement
Data is contained within the article or Supplementary Materials.
Conflicts of Interest
The authors declare no conflicts of interest.
References
- Karim, N.; Jia, Z.; Zheng, X.; Cui, S.; Chen, W. A recent review of citrus flavanone naringenin on metabolic diseases and its potential sources for high yield-production. Trends Food Sci. Technol. 2018, 79, 35–54. [Google Scholar] [CrossRef] [Scilit]
- Diwan, A.; Ninawe, A.; Harke, S. Gene editing (CRISPR-Cas) technology and fisheries sector. Can. J. Biotechnol. 2017, 1, 65–72. [Google Scholar] [CrossRef] [Scilit]
- Kopustinskiene, D.M.; Jakstas, V.; Savickas, A.; Bernatoniene, J. Flavonoids as anticancer agents. Nutrients 2020, 12, 457. [Google Scholar] [CrossRef] [Scilit] [PubMed]
- Jomova, K.; Alomar, S.Y.; Valko, R.; Liska, J.; Nepovimova, E.; Kuca, K.; Valko, M. Flavonoids and their role in oxidative stress, inflammation, and human diseases. Chem.-Biol. Interact. 2025, 413, 111489. [Google Scholar] [CrossRef] [Scilit] [PubMed]
- Alimohammadi, M.; Mohammad, R.N.; Rahimi, A.; Faramarzi, F.; Alizadeh-Navaei, R.; Rafiei, A. The effect of immunomodulatory properties of naringenin on the inhibition of inflammation and oxidative stress in autoimmune disease models: A systematic review and meta-analysis of preclinical evidence. Inflamm. Res. 2022, 71, 1127–1142. [Google Scholar] [CrossRef] [Scilit] [PubMed]
- Noman, A.M.; Sultan, M.T.; Raza, H.; Imran, M.; Hussain, M.; Mujtaba, A.; Mostafa, E.M.; Ghoneim, M.M.; Selim, S.; Al Jaouni, S.K.; et al. An updated review of the anticancer mechanisms and therapeutic potential of naringenin. Food Sci. Nutr. 2025, 13, e70626. [Google Scholar] [CrossRef] [Scilit] [PubMed]
- Tripathi, D.; Pandey, P.; Sabir, M.; Gupta, V.K.; Bou-Chacra, N. Naringenin in melanoma: Mechanistic insights and nanodelivery strategies for clinical translation. Mol. Pharm. 2025, 22, 6430–6455. [Google Scholar] [CrossRef] [Scilit] [PubMed]
- Yang, Y.; Trevethan, M.; Wang, S.; Zhao, L. Beneficial effects of citrus flavanones naringin and naringenin and their food sources on lipid metabolism: An update on bioavailability, pharmacokinetics, and mechanisms. J. Nutr. Biochem. 2022, 104, 108967. [Google Scholar] [CrossRef] [Scilit] [PubMed]
- Song, H.-Y.; Kim, K.-I.; Han, J.M.; Park, W.Y.; Seo, H.S.; Lim, S.; Byun, E.-B. Ionizing radiation technology to improve the physicochemical and biological properties of natural compounds by molecular modification: A review. Radiat. Phys. Chem. 2022, 194, 110013. [Google Scholar] [CrossRef] [Scilit]
- Russell, J.C.; Freeman, G.R. Radiolysis of ethanol. V. Reactions of the primary reducing species in the liquid phase. J. Phys. Chem. 1967, 71, 755–762. [Google Scholar] [CrossRef] [Scilit]
- Song, H.-Y.; Lee, Y.; Han, A.-R.; Kim, K.-I.; Yoo, B.-G.; Kang, B.S.; Han, J.M.; Lim, S.; Byun, E.-B. Novel hydroxyethyl derivative of Biochanin A induced by gamma irradiation increases water solubility and antioxidant activities in UVB-exposed HaCaT cells. Radiat. Phys. Chem. 2025, 237, 112980. [Google Scholar] [CrossRef] [Scilit]
- Kim, K.-I.; Song, H.-Y.; Han, J.-M.; Lim, S.; Seo, H.-S.; Byun, E.-B. Gamma Irradiation on genistein: Enhancement of antioxidant property through structural transformation. Radiat. Phys. Chem. 2022, 193, 109962. [Google Scholar] [CrossRef] [Scilit]
- Grimblat, N.; Zanardi, M.M.; Sarotti, A.M. Beyond DP4: An improved probability for the stereochemical assignment of isomeric compounds using quantum chemical calculations of NMR shifts. J. Org. Chem. 2015, 80, 12526–12534. [Google Scholar] [CrossRef] [Scilit] [PubMed]
- Bruhn, T.; Schaumlöffel, A.; Hemberger, Y.; Bringmann, G. SpecDis: Quantifying the comparison of calculated and experimental electronic circular dichroism spectra. Chirality 2013, 25, 243–249. [Google Scholar] [CrossRef] [Scilit] [PubMed]
- Dai, R.; Cao, L.; Ren, J.; Liu, J.; Zhu, K.; Chen, P.; Yao, W.; Zhao, X.; Bao, B.; Zhang, L. Apigenin ameliorates postoperative inflammation and accelerates wound healing in a rat model of perianal abscess by targeting the JAK1/STAT3 pathway in macrophages. Front. Immunol. 2026, 17, 1726917. [Google Scholar] [CrossRef] [Scilit] [PubMed]
- Choi, E.; Jin, C.H.; Huy Ngo, T.; Park, J.; Nam, J.-W.; Han, A.-R. Ionizing Radiation-Induced Structural Modification of Isoegomaketone and Its Anti-Inflammatory Activity. Molecules 2025, 30, 3466. [Google Scholar] [CrossRef] [Scilit] [PubMed]
- Yao, Z.; Wu, S.; Zhang, H.; Feng, X.; Wang, Z.; Lin, M. Chiral determination of naringenin by ultra-performance liquid chromatography-tandem mass spectrometry and application in citrus peel and pulp. Front. Nutr. 2022, 9, 906859. [Google Scholar] [CrossRef] [Scilit] [PubMed]
- Ha, T.J.; Lee, J.H.; Lee, M.-H.; Lee, B.W.; Kwon, H.S.; Park, C.-H.; Shim, K.-B.; Kim, H.-T.; Baek, I.-Y.; Jang, D.S. Isolation and identification of phenolic compounds from the seeds of Perilla frutescens (L.) and their inhibitory activities against α-glucosidase and aldose reductase. Food Chem. 2012, 135, 1397–1403. [Google Scholar] [CrossRef] [Scilit] [PubMed]
- Kulić, Ž.; Steiner, V.J.; Butterer, A. NMR Chemical Shifts of Common Flavonoids. Planta Medica 2026, 92, 58–80. [Google Scholar] [CrossRef] [Scilit] [PubMed]
- Smith, S.G.; Goodman, J.M. Assigning stereochemistry to single diastereoisomers by GIAO NMR calculation: The DP4 probability. J. Am. Chem. Soc. 2010, 132, 12946–12959. [Google Scholar] [CrossRef] [Scilit] [PubMed]
- Marcarino, M.O.; Cicetti, S.; Zanardi, M.M.; Sarotti, A.M. A critical review on the use of DP4+ in the structural elucidation of natural products: The good, the bad and the ugly. A practical guide. Nat. Prod. Rep. 2022, 39, 58–76. [Google Scholar] [CrossRef] [Scilit] [PubMed]
- Frisch, M.J.; Trucks, G.; Schlegel, H.B.; Scuseria, G.; Robb, M.; Cheeseman, J.; Scalmani, G.; Barone, V.; Petersson, G.; Nakatsuji, H. Gaussian 16; Gaussian, Inc.: Wallingford, CT, USA, 2016. [Google Scholar]
- Marfak, A.; Trouillas, P.; Allais, D.P.; Calliste, C.A.; Cook-Moreau, J.; Duroux, J.-L. Reactivity of flavonoids with 1-hydroxyethyl radical: A γ-radiolysis study. Biochim. Biophys. Acta (BBA)-Gen. Subj. 2004, 1670, 28–39. [Google Scholar] [CrossRef] [Scilit] [PubMed]
- Shamsudin, N.F.; Ahmed, Q.U.; Mahmood, S.; Shah, S.A.A.; Sarian, M.N.; Khattak, M.M.A.K.; Khatib, A.; Sabere, A.S.M.; Yusoff, Y.M.; Latip, J. Flavonoids as antidiabetic and anti-inflammatory agents: A review on structural activity relationship-based studies and meta-analysis. Int. J. Mol. Sci. 2022, 23, 12605. [Google Scholar] [CrossRef] [Scilit] [PubMed]
- Mushtaq, Z.; Sadeer, N.B.; Hussain, M.; Mahwish; Alsagaby, S.A.; Imran, M.; Mumtaz, T.; Umar, M.; Tauseef, A.; Al Abdulmonem, W.; et al. Therapeutical properties of apigenin: A review on the experimental evidence and basic mechanisms. Int. J. Food Prop. 2023, 26, 1914–1939. [Google Scholar] [CrossRef] [Scilit]
- Arango, D.; Diosa-Toro, M.; Rojas-Hernandez, L.S.; Cooperstone, J.L.; Schwartz, S.J.; Mo, X.; Jiang, J.; Schmittgen, T.D.; Doseff, A.I. Dietary apigenin reduces LPS-induced expression of miR-155 restoring immune balance during inflammation. Mol. Nutr. Food Res. 2015, 59, 763–772. [Google Scholar] [CrossRef] [Scilit] [PubMed]

Disclaimer/Publisher’s Note: The statements, opinions and data contained in all publications are solely those of the individual author(s) and contributor(s) and not of MDPI and/or the editor(s). MDPI and/or the editor(s) disclaim responsibility for any injury to people or property resulting from any ideas, methods, instructions or products referred to in the content. |
© 2026 by the authors. Licensee MDPI, Basel, Switzerland. This article is an open access article distributed under the terms and conditions of the Creative Commons Attribution (CC BY) license.