


Abstract
Severe foaming and a significant decrease in desulfurization performance were noted in a novel UDS solvent applied in a natural gas field in western Sichuan, China. The effects of hydrocarbon and ionic impurities on foaming behavior and the purification performance of candidate adsorbents were investigated. An extraction-gas chromatography method was established and validated for determining total hydrocarbons in amine solutions, enabling quantitative evaluation of hydrocarbon contamination. Controlled contamination experiments revealed that hydrocarbons had the strongest effect on foaming, while sulfate and chloride strongly promoted foam formation; organic acid anions showed only minor effects. Fixed-bed screening identified A-98FM anion-exchange resin as the most effective for anionic impurity removal and AC-02 activated carbon as the best candidate for hydrocarbon purification, with a cumulative adsorption capacity q0–12 of 14.86 mg/g over 12 h. Pore-structure and thermal-release analyses suggested that conventional pore descriptors alone could not fully explain the dynamic purification performance, while hydrocarbon-related loadings in spent AC-02 occupied accessible pore space and contributed to performance decay. Treatment of a field-aged UDS lean solvent further showed that reductions in target impurities were accompanied by lower foam height and shorter defoaming time. This work provides experimental support for impurity monitoring, foaming-risk identification, and adsorptive purification of UDS desulfurization solvent under flowback-contamination conditions.
1. Introduction
Against the backdrop of the clean and low-carbon transition and the rising share of natural gas in end-use energy, capacity expansion of acid gas removal (AGR) units has continued [1,2]. Among the available routes, including dry processes, wet processes, membrane separation, and biological approaches [2,3,4], regenerable-solvent-based wet desulfurization has become the mainstream option because of its large treatment capacity, high process maturity, and broad applicability to feeds with different sulfur contents [1,5]. In this context, an efficient and stable desulfurization solvent is essential for meeting product-gas specifications and ensuring smooth operation [5,6,7]. To meet the demand for treating natural gas with high acid-gas content, a variety of blended desulfurization solvent systems, such as Sulfinol, UCARSOL, FLEXSORB, and the CT8 series, have been developed and applied both domestically and internationally. Compared with conventional single-solvent systems, blended desulfurization solvents generally offer advantages in desulfurization selectivity, purification efficiency, and adaptability to operating conditions, and have therefore been widely adopted in natural-gas purification processes.
Despite these advantages, impurity buildup and the resulting foaming of blended solvents remain major challenges during long-term operation. In practice, hydrocarbons entrained in the feed gas, external aqueous phases, and other contaminants may enter the desulfurization unit and gradually accumulate in the amine solution, together with solvent degradation products during repeated absorption-regeneration cycles. The presence of these impurities can alter the apparent properties of the solvent, such as density, viscosity, and surface tension [8,9,10], thereby increasing its tendency to foam and ultimately impairing the stable operation of the unit [6,11,12]. However, existing studies on blended amine systems have mainly focused on acid-gas absorption performance and solvent degradation, whereas foaming behavior under impurity accumulation has received much less attention [7,10,13,14,15,16]. In particular, the respective roles of hydrocarbon and ionic impurities in promoting foaming and stabilizing foam in blended desulfurization solvents have not yet been systematically clarified. As a result, field operations still lack a sufficiently clear basis for evaluating impurity-specific foaming risks and for identifying the key contaminants that should be preferentially controlled [9,17,18,19,20].
In parallel, a range of technologies has been proposed and applied by both industry and academia for purification and reclamation of degraded amine solvents, including distillation-based reclamation, side-stream ion exchange, electrodialysis, and bipolar membrane electrodialysis, adsorption, precipitation-crystallization, membrane separation, and solvent extraction [21,22,23,24]. Overall, existing purification and reclamation methods have become relatively mature in removing salts, heat-stable salts, and some degradation products, but they generally still suffer from high energy consumption and cost, risks of secondary pollution, as well as equipment fouling, membrane fouling, or scaling [24,25,26,27,28,29,30,31]. Adsorption technologies, represented by activated carbon, are commonly used to remove color bodies, degradation products, and some nonpolar organics under mild conditions with relatively simple flow sheets, and can be integrated into existing systems as a parallel side-loop purification circuit [30,32]. Nevertheless, for blended amine systems, systematic studies on impurity removal remain limited, particularly with respect to the removal of dissolved hydrocarbon impurities by activated carbon. The adsorption behavior, structural matching of adsorbents, service life, and practical applicability in blended desulfurization solvents cannot be directly inferred from conventional amine systems and still require targeted investigation [12,17,32]. Therefore, for impurity-contaminated blended desulfurization solvents, two closely related questions remain insufficiently answered: which impurities dominate a foaming risk, and which purification media are truly effective for their selective removal.
To address the need for removing acid gases and complex organosulfur compounds from natural gas, our team developed a proprietary UDS blended desulfurization solvent through industry-academia-research collaboration [17,33,34,35,36,37]. The formulation contains functional components such as a five-membered sulfur-containing heterocyclic compound (SUL) and a cyclic amine (CA). The added formulation components are used to enhance the removal of methyl mercaptan and COS. Compared with MDEA, UDS solvent shows higher removal efficiencies for methyl mercaptan, COS, and total organosulfur, and has been applied in industrial natural-gas purification units. In one gas field in western Sichuan, improper upstream process control allowed part of the downhole flowback fluid to enter the main desulfurization unit together with the feed gas. The hydrocarbons and ionic impurities introduced by the flowback fluid subsequently entered the absorption-regeneration loop, contaminated the circulating amine solution, and led to operational instability accompanied by increased foaming risk. Under such field conditions, the UDS solvent provides a representative engineering case for examining how impurity accumulation affects foaming behavior and for evaluating practical purification strategies. However, for this system, systematic studies on impurity-specific foaming effects and corresponding impurity-control measures remain limited.
Against this background, this study focuses on the flowback-contamination scenario of UDS solvent in the target gas field, with emphasis on foaming risks induced by hydrocarbons and ionic impurities and on corresponding adsorptive purification measures. First, representative hydrocarbons and ionic impurities, selected to mimic the impurity composition of field-aged solvent, were introduced into fresh UDS solvent to construct controlled contamination systems. The impacts of impurity type and loading on the foaming behavior of the solvent were systematically examined. Second, considering the hydrocarbon composition of produced water from the gas field and the practical analytical requirements, an extraction-gas chromatography method applicable to the UDS solvent matrix was developed for quantitative determination of total hydrocarbons. Building on these results, commercial ion-exchange resins and activated carbons were evaluated under fixed-bed conditions to screen adsorbents suitable for removing anionic and hydrocarbon impurities from UDS solvent. Furthermore, pore-structure characterization and TG-FTIR-MS analysis were used to examine structural changes and thermally released species of spent AC-02, providing supporting evidence for discussing pore occupation and performance decay. In addition, a field-aged UDS lean solvent was treated with the selected adsorbents to examine their applicability in a real solvent matrix. This work provides an application-oriented experimental basis for impurity monitoring, foaming-risk identification, and adsorptive purification of UDS desulfurization solvent under flowback-contamination conditions.
2. Methods
2.1. Materials
Fresh UDS desulfurization solvent was provided by Shandong Jinlu Environmental Protection Technology Co., Ltd. (Jining, China), with the mass fraction of major active components exceeding 99.5%. The detailed formulation and component ratios of the solvent were not disclosed because of industrial confidentiality. In this study, the fresh solvent was diluted with deionized water to the industrial working concentration of 50 wt%. The basic properties and baseline foaming behavior of the 50 wt% fresh UDS working solution are provided in Table S1. Contaminated UDS solvent samples and produced water samples were supplied by a gas field in western Sichuan, China. Nitrogen (purity 99.999%) used for foaming tests was supplied by Shanghai Wetry Standard Gas Analysis Technology Co., Ltd. (Shanghai, China).
Formic acid, acetic acid, oxalic acid, hydrochloric acid, and sulfuric acid used to construct the representative anionic-impurity system were all of analytical grade and purchased from Shanghai Macklin Biochemical Co., Ltd. (Shanghai, China). Linear n-alkanes (n-C14 to n-C18), used as representative hydrocarbon impurities, were of analytical grade and purchased from the same supplier. n-Hexane (pesticide-residue grade), used as the extraction solvent, was supplied by Anpel Laboratory Technologies (Shanghai) Inc. (Shanghai, China). Anhydrous sodium sulfate (analytical grade), purchased from Shanghai Macklin Biochemical Co., Ltd., was used for drying the extracts. All reagents were used as received without further purification.
The commercial activated carbons used in the purification experiments were purchased from Shanghai Deep Chemical Technology Co., Ltd. (Shanghai, China), including water-treatment carbons, solvent-recovery carbons, coconut-shell activated carbon for gold refining, cylindrical carbon for desulfurization and denitrification, activated carbon for pressure swing adsorption, and activated coke. These activated carbons were coded as AC-01 to AC-13. Their basic physicochemical properties, including particle-size range, morphology, bulk density, moisture, ash content, and iodine value, are summarized in Table S2. In addition, four commercial strong-base anion-exchange resins, namely XRK207, A-98FM, IRA-900, and A-654, were purchased from Cohesion (Beijing) Co., Ltd. (Beijing, China). Before use, the resins were pretreated by acid-base activation and then rinsed to neutrality.
2.2. Experimental Procedures
2.2.1. Extraction-GC Method for Hydrocarbon Determination in UDS Solvent
An extraction-gas chromatography (extraction-GC) method was developed for quantifying hydrocarbon impurities in the UDS solvent system. Produced water samples associated with flowback contamination were collected from the stripper outlet of a gas treatment station in western Sichuan, China, and were used to characterize the composition of hydrocarbon impurities. The samples were subjected to multiple liquid–liquid extractions with n-hexane, and the combined organic phases were concentrated by rotary evaporation to obtain a concentrated extract for compositional analysis. Based on the analytical results, representative hydrocarbon components were selected to prepare a standard oil. Referring to the general framework for petroleum hydrocarbon determination in water and considering the matrix characteristics of the UDS solvent [38], an n-hexane extraction-GC method applicable to the UDS solvent system was established. The quantitative reliability and applicable range of the method were subsequently evaluated through repeated measurements of calibration standards and spiked samples.
2.2.2. Preparation of Contaminated UDS Solvent Samples
To prepare model contaminated UDS solvent samples, a specified mass of fresh UDS solvent was placed in a container and spiked with either the standard oil or the selected anionic impurities at calculated dosages. For the hydrocarbon-contaminated samples, the standard oil was added to obtain a series of samples with different total hydrocarbon concentrations. For the anion-contaminated samples, formic acid, acetic acid, oxalic acid, hydrochloric acid, and sulfuric acid were separately added to the fresh solvent at the designed concentrations to construct systems containing only anionic impurities. In each case, the mixture was vigorously shaken and thoroughly mixed at room temperature to ensure homogenization. The resulting samples were then used for foaming behavior tests and, where applicable, for subsequent evaluation of activated-carbon adsorption performance.
2.2.3. Fixed-Bed Dynamic Adsorption Experiments
Adsorption experiments with activated carbons and strong-base anion-exchange resins were conducted in the same double-jacketed glass column, which had an inner diameter of 2.0 cm and a packed-bed height of 12.5 cm. The column temperature was maintained at 40 °C using an external thermostatic water bath. Before use, the activated carbons were dried in an oven at 105 °C, whereas the anion-exchange resins were pretreated as described in Section 2.1 and then packed into the column. During packing, the column was gently tapped to compact the bed and improve bed uniformity. Prior to operation, the packed bed was prewetted with the solvent to be treated, and visible bubbles were removed.
During the adsorbent-screening experiments, either hydrocarbon-contaminated UDS solvent or anion-containing UDS solvent was used as the feed. After prewetting, the feed solution was continuously introduced into the column at a flow rate of 5 mL/min. After several minutes of operation, when the residual liquid associated with prewetting had been essentially displaced and the flow had stabilized, the effluent was collected. The concentrations of total hydrocarbons or anionic impurities in the effluent were then determined, and the removal efficiency was calculated by comparing the effluent concentration with the initial feed concentration.
For dynamic-performance evaluation, representative activated carbon samples were tested under the same apparatus configuration and operating conditions. After prewetting and stabilization, the first effluent sample was collected, and the column was then operated continuously for 12 h. Subsequent effluent samples were collected at 1 h intervals. The total hydrocarbon concentration in the effluent at each sampling time, Ct, was determined, and the instantaneous removal efficiency relative to the initial feed concentration, C0, was calculated as follows:
The dynamic purification efficiency curves were obtained by plotting ηt as a function of time.
2.3. Solvent Impurity Analysis
2.3.1. Determination of Total Hydrocarbon in UDS Solvent by Extraction-GC
Hydrocarbon impurities in UDS solvent were quantified by an extraction-GC method. The representative standard oil mixture prepared in Section 2.2.1 was serially diluted with n-hexane to prepare a series of calibration standards with different total hydrocarbon concentrations. An external calibration curve was established by plotting the total hydrocarbon concentration against the corresponding total chromatographic peak area.
Sample pretreatment was performed as follows. Approximately 50 g of a hydrocarbon-contaminated UDS solvent sample was weighed into a 125 mL separatory funnel, followed by the addition of 10 g of n-hexane. The mixture was vigorously shaken and then allowed to stand for phase separation, after which the upper organic phase was collected. A second extraction was performed with an additional 10 g of n-hexane. The two organic extracts were then combined and dried over anhydrous sodium sulfate. If necessary, the extract was vacuum-concentrated at approximately 30 °C to about 1 mL to obtain the test extract. The masses of the extract before and after concentration were recorded to calculate the concentration factor, N. A blank control was prepared by replacing the sample with fresh UDS solvent and following the same procedure.
The extracts were analyzed on a gas chromatograph equipped with a flame ionization detector (FID) and an HP-5 nonpolar capillary column. The carrier-gas flow rate was 2.0 mL/min. The oven temperature program was 60 °C for 2 min, followed by heating at 15 °C/min to 280 °C and holding for 15 min. The inlet and detector temperatures were set at 280 and 300 °C, respectively. The injection volume was 0.2 μL. Splitless injection was used initially, and the mode was switched to split after 0.75 min with a split ratio of 30:1. Under these conditions, both the test extract and the blank extract were analyzed. The n-hexane solvent peak and the peaks present in the fresh-UDS blank extract were not included in the hydrocarbon peak-area integration. The remaining resolved peaks in the contaminated UDS extract were summed and used with the external calibration curve to calculate the total hydrocarbon content in the UDS solvent.
2.3.2. Determination of Anionic Impurities in UDS Solvent by Ion Chromatography (IC)
The concentrations of anionic species were determined by ion chromatography (IC). Analyses were performed on an ICS-1100 ion chromatograph equipped with a conductivity detector. An IonPac AS-11 anion-exchange column was used in combination with 20 mmol/L NaOH as the eluent and an ASRS-ULTRA anion suppressor. The detailed operating conditions are summarized in Table S3.
Before analysis, the samples were diluted with deionized water to bring their concentrations within the linear range of the instrument and filtered through a membrane filter to remove suspended particles. External calibration curves were established using a series of standard solutions containing the target anions. Qualitative identification was based on retention time, and quantitative analysis was performed using peak area to determine the mass concentration of each anionic impurity. The results were used to evaluate the removal performance of the anion-exchange resins toward anionic impurities.
2.4. Determination of Foaming Behavior
The foaming behavior of the UDS solvent was evaluated using a previously reported laboratory bubbling test for UDS solvents [17]. A transparent glass foaming tube (inner diameter, ca. 30 mm) fitted with a G3 sintered-glass frit at the bottom was placed in a constant-temperature water bath maintained at 40 °C. For each test, the UDS solvent was introduced into the foaming tube until the static liquid height reached 100 mm and then allowed to equilibrate. According to this bubbling-test protocol, high-purity N2 was then introduced from the bottom at a constant flow rate of 250 mL/min. After the bubble distribution became stable, sparging was continued for 5 min. Immediately after the gas supply was stopped, the height difference between the upper foam boundary and the initial liquid level was recorded as the foam height. The foam was then continuously observed, and the time required for the foam to completely collapse and for a clear liquid surface to reappear was recorded as the defoaming time. Each sample was tested in triplicate, and the average value was used for subsequent analysis.
2.5. Characterization of Activated Carbon
The specific surface area and pore-structure parameters of the activated carbon samples were determined from N2 adsorption–desorption isotherms measured at 77 K on a BSD-660 automated high-throughput gas adsorption and micropore analyzer (BSD Instrument Technology (Beijing) Co., Ltd., Beijing, China) using high-purity N2 as the adsorptive. Prior to measurement, the samples were vacuum-degassed at 300 °C for 180 min. The specific surface area was calculated by the multipoint BET method. The micropore surface area and micropore volume were obtained by the t-plot method, and the external surface area was determined by t-plot extrapolation. The average pore diameter and mesopore volume were calculated by the BJH method based on the desorption branch, and the micropore size distribution was fitted using the NLDFT model. The isotherm types and pore-structure characteristics were identified according to IUPAC recommendations for subsequent comparison with hydrocarbon removal performance [39].
The surface adsorbates and thermal decomposition behavior of spent activated carbon were characterized by thermogravimetry coupled with Fourier transform infrared spectroscopy and mass spectrometry (TG-FTIR-MS). The measurements were carried out using a NETZSCH STA 449 F3 Jupiter simultaneous thermal analyzer coupled with a Bruker INVENIO S FTIR spectrometer and a NETZSCH QMS 403 D mass spectrometer [40]. The samples were heated from room temperature to 800 °C at a rate of 10 K/min under a high-purity nitrogen atmosphere. The TG signal recorded the mass change as a function of temperature, while FTIR and MS synchronously collected the infrared spectra and mass-to-charge ratio (m/z) signals of the evolved gases online. These data were used to identify representative adsorbed or decomposition products and their release temperature ranges after adsorption saturation, providing complementary evidence for the mechanistic analysis of hydrocarbon adsorption and activated-carbon deactivation.
3. Results and Discussion
3.1. Development and Validation of an Extraction-GC Method for Total Hydrocarbons Determination in UDS Solvent
3.1.1. Characterization of Hydrocarbon Impurities in Produced Water and Preparation of the Standard Oil
The concentrated extract obtained from field-produced gas-field water was first characterized by 1H NMR, as shown in Figure S1a. The characteristic resonances at approximately 0.9 and 1.2 ppm were assigned to methyl (-CH3) and methylene (-CH2-) protons of hydrocarbons, respectively, indicating that the oil-phase impurities in the extract were predominantly hydrocarbon species. A weak signal near 5.0 ppm was attributed to residual water or trace hydroxyl-containing species. To further identify the individual components and their distribution, the concentrated extract was analyzed by GC-MS. Major peaks were identified by mass spectral library matching, and the relative abundance of each component was estimated from chromatographic peak-area integration. The GC-MS chromatogram is shown in Figure S1b, and the identified major compounds and their relative abundances are summarized in Table S4. The results indicate that the hydrocarbon impurities in the produced-water extract span a carbon-number range of C10–C27, with a more pronounced enrichment in the C14–C18 range. In addition to n-alkanes, the extract also contained measurable amounts of branched and isoprenoid hydrocarbons, together with minor aromatic and naphthenic compounds.
Based on the above carbon-number distribution, and considering both compositional contribution and the availability of reference standards, n-alkanes in the C14–C18 range were selected as representative components for preparation of the standard oil. This representative standard oil was intended for fit-for-purpose quantification of total hydrocarbons in the present UDS solvent system rather than for exact reproduction of the full hydrocarbon composition of the field samples. The mixing ratio was normalized according to the relative abundances of the corresponding n-alkanes in the produced-water samples, and the composition and mass fractions of the standard oil are listed in Table S5. The C14–C18 n-alkanes were weighed into an amber bottle according to Table S5 and thoroughly mixed at room temperature until homogeneous. The resulting mixture was used as the standard oil for construction of the external calibration curve and preparation of model hydrocarbon-contaminated systems.
3.1.2. Development and Validation of the Extraction-GC Method
To quantify hydrocarbon impurities in UDS solvent, an extraction-gas chromatography method was developed using n-hexane extraction and GC-FID analysis. The method was adapted from extractable petroleum hydrocarbon analysis in water and adjusted for the UDS solvent matrix. A fresh-UDS blank was processed and analyzed under the same conditions as the contaminated samples.
The C14–C18 n-alkane mixture prepared in Section 3.1.1 was used as a surrogate calibration standard. Thus, the reported total hydrocarbon content represents standard-oil-equivalent concentration. This method was used for quantitative analysis of hydrocarbon impurities in UDS solvent samples.
The representative standard oil was serially diluted with n-hexane to prepare calibration standards at 200, 500, 1000, 3000, and 5000 mg/kg. The calibration curve was established using the summed peak areas of the standard oil-hydrocarbon peaks. The n-hexane solvent peak was not included in the integration. The GC-FID chromatogram of the standard oil and the calibration curve are shown in Figure S2. The linear regression coefficient was higher than 0.999, showing good linearity over the tested range.
The sample pretreatment procedure is described in Section 2.3.1. For each contaminated sample, the n-hexane solvent peak and the peaks present in the fresh-UDS blank extract were not included in the hydrocarbon peak-area integration. The remaining resolved peaks in the contaminated UDS extract were summed as Ax. Representative GC-FID chromatograms of the fresh-UDS blank extract and the 1000 mg/kg matrix-spiked UDS extract are shown in Figure S3, illustrating the matrix background and the hydrocarbon peaks used for integration. The total hydrocarbon content in the original UDS solvent, ω (mg/kg), was calculated as follows:
where Ax is the summed peak area used for total hydrocarbon calculation; a and b are the intercept and slope of the calibration curve; m is the sample mass (g); m1 is the mass of the combined extract (g); and N is the concentration factor. When the extract was not concentrated, N = 1.
The precision and accuracy of the method were evaluated using UDS matrix-spiked samples. Fresh UDS solvent was spiked with the representative standard oil at 500, 1000, and 3000 mg/kg. Each level was analyzed in triplicate. The recovery, relative standard deviation (RSD), and relative error (RE) were calculated. The results are summarized in Table 1, and the replicate data are provided in Table S6.
Table 1.
Validation results of the extraction-GC method for total hydrocarbon determination in UDS solvent.
The recoveries were 95.69–104.44%. The RSD values were 1.14–1.68%, and the RE values were −4.31–4.44%. These results indicate acceptable precision and accuracy for total hydrocarbon determination in the tested UDS solvent samples.
During method testing, the GC-FID signal was not stable enough for reliable integration when the standard oil concentration in the final n-hexane extract was below approximately 100 mg/kg. For a non-concentrated extract, this concentration corresponds to about 40 mg/kg in the original UDS solvent, based on an extract-to-sample mass ratio of approximately 20/50. When emulsification or turbidity occurred during extraction, centrifugation was used to improve phase separation.
3.2. Effects of Impurities on the Foaming Behavior of UDS Solvent
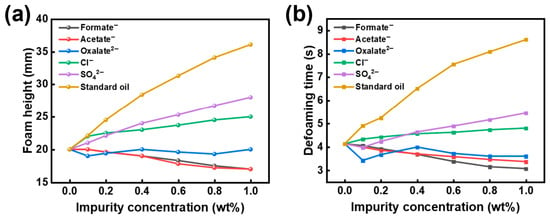
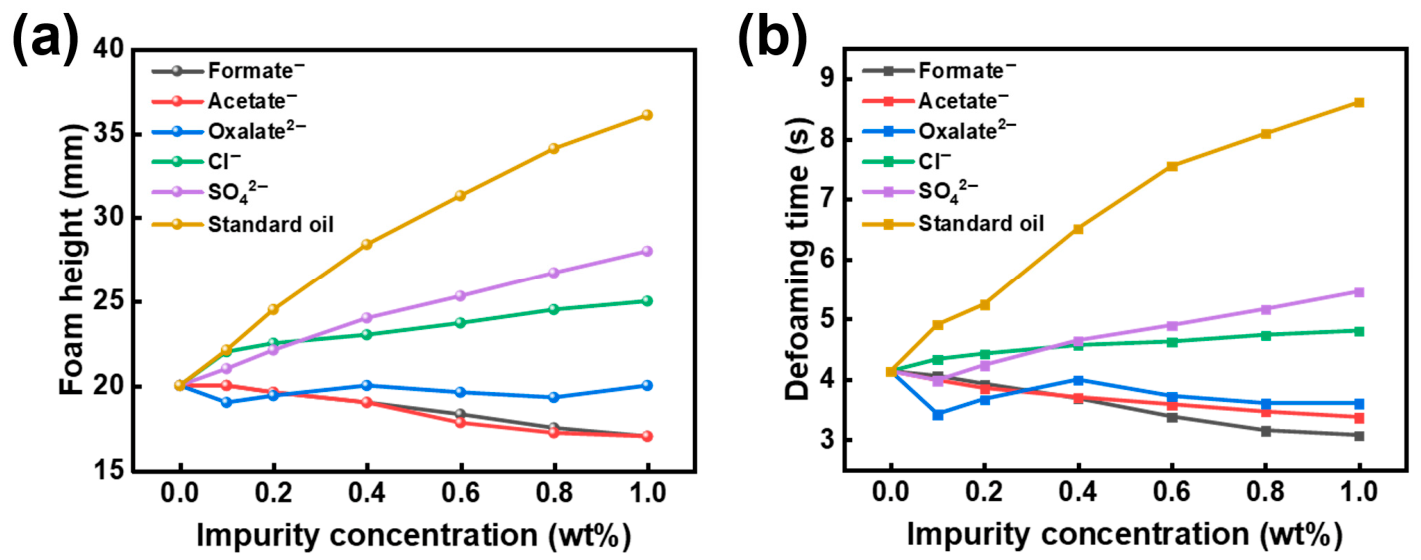
To evaluate the sensitivity of foaming behavior to typical impurities present in field amine solvents, fresh UDS solvent was used as the baseline system. Based on impurities commonly detected in field lean solvent, formate (Formate−), acetate (Acetate−), oxalate (Oxalate2−), chloride (Cl−), sulfate (SO42−), and the representative standard oil were individually introduced to construct controlled contamination systems. Foaming behavior was evaluated using the bubbling test described above, with foam height (mm) and defoaming time (s) used as the comparative metrics. The corresponding trends are shown in Figure 1a,b.
Figure 1.
(a) Foam height and (b) defoaming time of UDS solvent versus impurity concentration.
Under identical test conditions, the fresh solvent exhibited a foam height of 20.0 mm and a defoaming time of 4.13 s. Within the concentration range of 0–1.0 wt%, the different impurity systems showed distinct effects on foaming tendency and foam stability. Overall, the organic acid anions (formate, acetate, and oxalate) had relatively minor effects, whereas the inorganic anions (Cl− and SO42−) and the representative standard oil showed varying degrees of foam promotion and stabilization.
Among the organic acid anions, formate and acetate exhibited similar trends. Over the investigated concentration range, both foam height and defoaming time decreased slightly with increasing concentration, indicating no evident tendency to promote foaming or stabilize foam. Oxalate showed an even weaker effect: the foam height remained close to that of the fresh solvent, and the defoaming time showed only minor fluctuations. Taken together, these three organic acid anions contributed only weakly to foaming in the present system.
In contrast, the two inorganic anions showed more pronounced effects on foaming behavior. With increasing concentration, chloride continuously increased both foam height and foam stability. At 0.1 wt%, the foam height increased to 22.0 mm and the defoaming time to 4.33 s; at 1.0 wt%, these values further increased to 25.0 mm and 4.80 s, respectively. Sulfate exhibited a stronger effect, particularly on defoaming time. At 0.4 wt%, the foam height and defoaming time had already increased to 24.0 mm and 4.64 s, respectively; at 1.0 wt%, they further increased to 28.0 mm and 5.45 s. These results indicate that sulfate exerts a stronger amplifying effect on both foam height and defoaming time than chloride and is therefore more likely to become a key risk factor under impurity accumulation in field operation. Consistently, Figure 1a,b show increasing trends with concentration, with a steeper rise for sulfate.
The representative standard oil showed the strongest effect on foaming behavior, causing marked foam promotion and stabilization with rapidly increasing intensity as concentration increased. At a standard-oil concentration of 0.4 wt%, the foam height and defoaming time increased to 28.4 mm and 6.51 s, respectively; at 1.0 wt%, they further increased to 36.1 mm and 8.61 s. These results indicate that hydrocarbon contamination is the dominant driver of both increased foam height and prolonged defoaming time in the present system. Comparing the magnitude of change induced by each impurity within the same concentration window further shows that hydrocarbon contamination contributes much more strongly to foaming risk than any single anionic impurity. Meanwhile, the accumulation of inorganic anions, especially sulfate and chloride, also significantly aggravates foaming and foam stability. Therefore, hydrocarbon contamination should be regarded as the primary target for mitigation, while the accumulation of key inorganic anions should also be controlled to reduce their additional contributions to foaming risk.
These differences are related to the different effects of the impurities on the gas–liquid interface and foam-film stability. Formate, acetate, and oxalate have limited interfacial activity at the aqueous solution/vapor interface. Therefore, they only weakly affect foam-film drainage and rupture [41]. In contrast, Cl− and SO42− change the ionic strength and hydration environment of the liquid phase. These changes can modify the electrostatic and hydration conditions in foam films, slow film thinning, and delay bubble coalescence. The greater effect of SO42− may be related to its divalent charge and stronger hydration, which can alter the liquid-film environment more effectively than Cl− [42,43]. The standard oil acts as a hydrophobic organic phase in the UDS solvent. After mixing, dispersed hydrocarbon components can enter the gas–liquid interfacial region and make the interfacial layer less uniform. This hinders liquid drainage from foam films and delays bubble coalescence and rupture [44,45,46]. As a result, the standard oil produces the largest increase in both foam height and defoaming time.
3.3. Adsorptive Removal Performance Toward Ionic and Hydrocarbon Impurities
3.3.1. Removal of Anionic Impurities by Anion-Exchange Resins
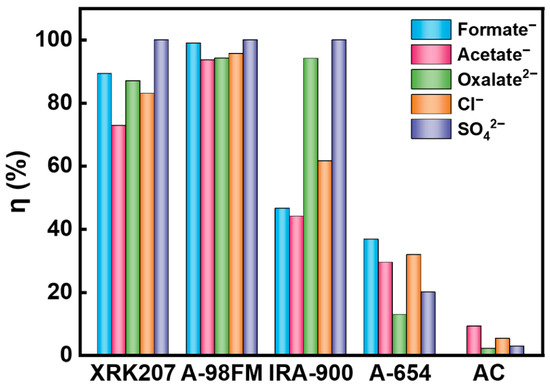
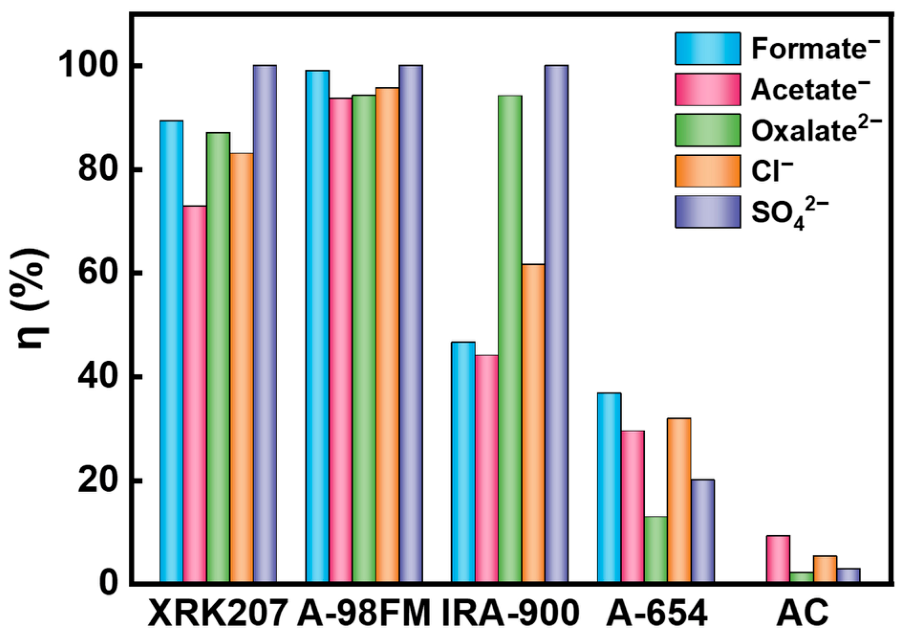
The removal performance of four anion-exchange resins (XRK207, A-98FM, IRA-900, and A-654) and coconut-shell activated carbon toward typical anionic impurities in the solvent, namely formate, acetate, oxalate, chloride, and sulfate, was compared. The results are shown in Figure 2. The corresponding ion concentrations before and after adsorbent treatment are provided in Table S7.
Figure 2.
Removal efficiencies of typical anions by anion-exchange resins and coconut-shell activated carbon.
Overall, the anion-exchange resins showed substantially higher removal efficiencies for anionic impurities than coconut-shell activated carbon, although clear differences were also observed among the resins. Among the tested materials, A-98FM exhibited the best overall performance, with removal efficiencies of 99.00, 93.62, 94.22, and 95.61% for formate, acetate, oxalate, and chloride, respectively; the sulfate concentration decreased from 60.8 mg/L to below the detection limit (<0.02 mg/L). XRK207 also performed well, achieving removal efficiencies of 89.26, 72.80, 86.99, and 83.02% for formate, acetate, oxalate, and chloride, respectively, while likewise reducing sulfate to below the detection limit. IRA-900 showed relatively limited removal of formate and acetate, with efficiencies of 46.51 and 43.96%, respectively, while still maintaining a high removal efficiency for oxalate (94.18%). Its removal efficiency for chloride was 61.55%, and sulfate was again reduced to below the detection limit. In contrast, A-654 exhibited the poorest overall performance, with removal efficiencies of 36.63, 29.38, 12.77, and 31.78% for formate, acetate, oxalate, and chloride, respectively, although sulfate could still be reduced to below the detection limit. These results indicate pronounced resin-dependent differences in removal performance and selectivity toward different anions under the present conditions. Overall, A-98FM showed the strongest comprehensive removal capability, followed by XRK207.
In contrast, the coconut-shell activated carbon showed no appreciable removal of the tested anionic impurities, as no significant decreases were observed in the concentrations of formate, acetate, oxalate, chloride, or sulfate after treatment. Taken together, these results indicate that effective control of ionic impurities in the present system relies primarily on anion-exchange resins.
3.3.2. Removal of Hydrocarbon Impurities by Activated Carbons
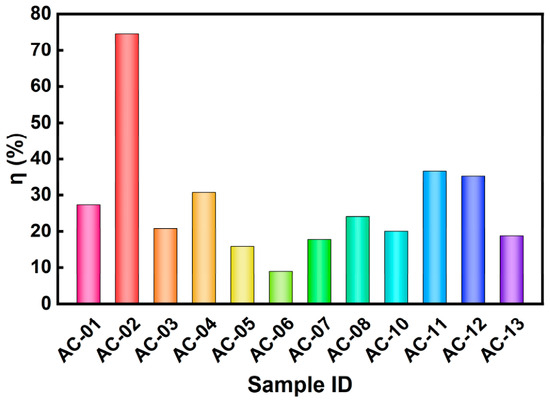
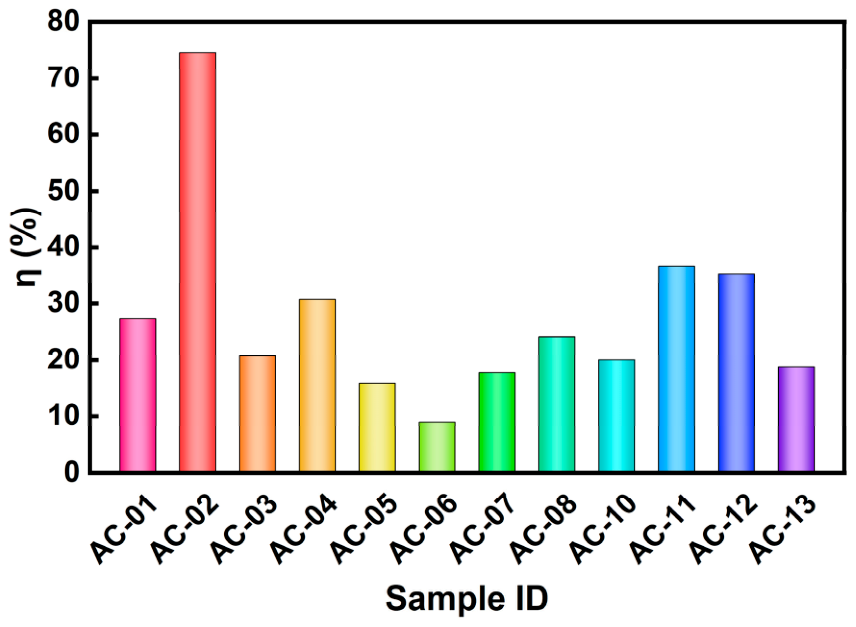
To evaluate the purification performance of different activated carbons toward hydrocarbon impurities in UDS solvent, comparative adsorption tests were conducted using 13 activated carbon samples. For these activated-carbon adsorption tests, the hydrocarbon-contaminated UDS feed was prepared with an initial total hydrocarbon content (C0) of 200 mg/kg. The removal efficiencies calculated from the first 50 g effluent sample collected after prewetting had been displaced and the column flow had stabilized are shown in Figure 3. Because the particle size of AC-09 was too small, it caused an excessive pressure drop in the adsorption column and prevented stable solvent flow; therefore, AC-09 was excluded from the comparison. Overall, the purification performance varied markedly with carbon type and particle size, with removal efficiencies ranging from 8.92 to 74.64%.
Figure 3.
Removal efficiencies of total hydrocarbons by activated carbons.
Among the tested samples, the water-treatment activated carbons showed the best overall performance. AC-02 exhibited the highest removal efficiency, reaching 74.64%, whereas AC-01 from the same series but with a larger particle size showed a much lower removal efficiency of 27.35%, indicating a pronounced particle-size-related effect within this series. The solvent-recovery carbons (AC-03 and AC-04) showed intermediate performance, with removal efficiencies ranging from 20.78 to 30.72%. In the gold-refining series, AC-11 achieved a removal efficiency of 36.64%, higher than that of AC-10 (20.06%). The gas-purification carbons and AC-07 showed relatively limited performance, with most removal efficiencies below 36%; among them, AC-12 performed slightly better, with a removal efficiency of 35.25%. The cylindrical carbons used for desulfurization and denitrification were the least effective overall, especially AC-06, which showed a removal efficiency of only 8.92%.
Overall, under identical packing and operating conditions, samples with smaller particle sizes generally exhibited higher removal efficiencies, whereas larger granules and formed rod- or cylindrical-shaped carbons showed poorer purification performance. In addition, activated carbons designed for different applications displayed substantially different compatibility with hydrocarbon removal from UDS solvent. The water-treatment series was better matched to the present system, whereas the desulfurization-denitrification carbons and some formed carbons were comparatively less suitable.
Taken together, the initial screening results provided the basis for selecting candidates for subsequent fixed-bed dynamic adsorption experiments. Considering both purification efficiency and sample representativeness, AC-02, AC-04, AC-07, AC-08, AC-11, AC-12, and AC-13 were selected for further continuous fixed-bed performance evaluation.
3.3.3. Dynamic Purification Performance of Selected Activated Carbons
To further evaluate the purification performance of the selected activated carbons toward hydrocarbon impurities in UDS solvent under continuous-flow fixed-bed conditions, dynamic adsorption experiments were conducted using AC-02, AC-04, AC-07, AC-08, AC-11, AC-12, and AC-13. The first 50 g effluent sample collected after prewetting had been displaced and the column flow had stabilized was defined as the 0 h data point, and subsequent 50 g effluent samples were collected at 1 h intervals.
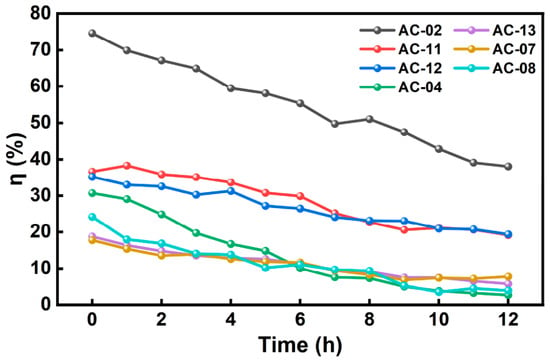
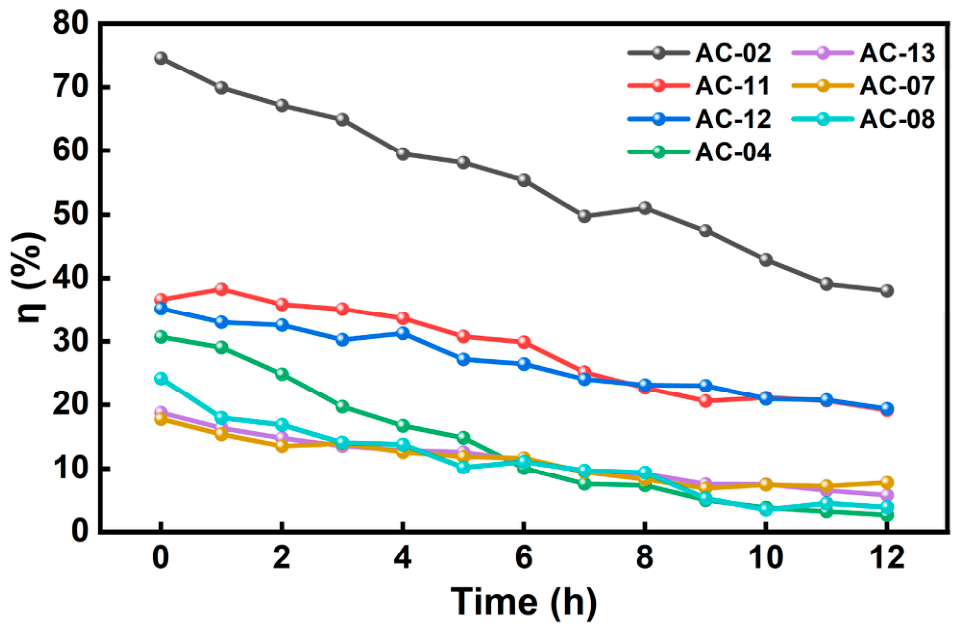
The time-dependent removal efficiencies of the seven activated carbons are shown in Figure 4. Overall, the ηt–t profiles can be divided into a high-performance group (AC-02), a medium-performance group (AC-11 and AC-12), and a low-performance group (AC-04, AC-07, AC-08, and AC-13). These groups differed markedly in initial removal level, decay rate, and the extent of curve fluctuation. AC-02 maintained the highest removal efficiency throughout the experiment, with an initial ηt of 74.64% and a value of 38.06% at 12 h, indicating a relatively slow decay. AC-11 and AC-12 exhibited similar initial ηt values (36.64% and 35.25%, respectively), followed by a steady decline to 19.14% and 19.37% at 12 h; among them, AC-12 showed a slightly more gradual decrease in the middle and late stages. In contrast, the low-performance group showed generally low ηt values and more rapid decay over time. Specifically, AC-04 decreased rapidly from 30.72% to 2.69% at 12 h, indicating a rapid loss of dynamic purification capacity. AC-13 showed an approximately monotonic decrease from 18.77% to 5.79%. AC-07 and AC-08 exhibited some fluctuations at low removal levels, but their overall performance remained substantially lower than that of the medium-performance group.
Figure 4.
Dynamic purification efficiency curves of selected activated carbons during continuous fixed-bed purification of total hydrocarbons.
Although the dynamic purification efficiency curves in Figure 4 provide a direct comparison of different activated carbons, removal efficiency alone does not describe the mass-based adsorption performance. Therefore, the cumulative adsorption capacity over 0–12 h, q0–12 (mg/g), was calculated from the dynamic effluent concentration data. The same hydrocarbon-contaminated UDS feed with C0 = 200 mg/kg was used for all dynamic fixed-bed tests. For the hourly sampling data, q0–12 was calculated by trapezoidal integration:
where C0 is the initial total hydrocarbon content of the feed solution (mg/kg), Fm is the mass flow rate of the feed solution (kg/h), ηi is the removal efficiency (%) at the i-th sampling point, Δt is the sampling interval (h), and mads is the mass of activated carbon packed in the column (g). The calculation parameters are listed in Table S8.
To obtain comparable descriptors for the decay of dynamic purification efficiency, ηt was further fitted using a Weibull-type empirical model:
where η0 is the initial removal efficiency, η∞ is the long-time limiting removal efficiency, and λ and k are the scale and shape parameters, respectively. Because the goal of this study is to characterize the decay of purification capability over operating time and to facilitate cross-sample comparison on the same basis, η∞ = 0, and the model simplifies to:
This Weibull-type equation was used as an empirical smoothing function rather than a mechanistic adsorption model. Based on the fitted parameters, characteristic times tη=20% and tη=10% were back-calculated from the fitted curves. These represent the time points when the removal efficiency decays to 20% and 10%, respectively, and were used to describe the decline in dynamic purification performance. Thus, q0–12 was used to compare cumulative adsorption capacity, while tη=20% and tη=10% were used to compare the decay of dynamic purification efficiency. The corresponding results are summarized in Table 2.
Table 2.
Dynamic purification performance and cumulative adsorption capacity of different activated carbon samples.
Table 2 summarizes the dynamic purification performance and cumulative adsorption capacity of the activated carbon samples. AC-02 showed the best overall performance across multiple indicators, including η0 (74.64%), η12 (38.06%), and q0–12 (14.86 mg/g). Its threshold times, tη=20% and tη=10%, reached 22.82 and 33.90 h, respectively, indicating the highest cumulative adsorption capacity and slower efficiency decay. AC-11 and AC-12 showed intermediate performance. Their q0–12 values were 10.55 and 8.68 mg/g, respectively. AC-11 had a higher q0–12, whereas AC-12 showed a longer tη=10% (23.62 h), indicating that cumulative adsorption capacity and efficiency-decay behavior were not fully consistent. AC-04, AC-13, AC-08, and AC-07 showed lower dynamic purification performance, with q0–12 values of 4.47, 4.14, 3.31, and 2.91 mg/g, respectively. Their tη=10% values were only 5.66–6.66 h, indicating rapid efficiency decay. The Weibull fits gave R2 > 0.950 for all samples, supporting the use of the fitted curves to extract comparable decay-time parameters [47].
Overall, AC-02 exhibited the highest cumulative adsorption capacity and the most sustained dynamic purification performance. Therefore, it was selected for further characterization before and after adsorption.
3.4. Pore-Structure Characteristics and Their Relation to Dynamic Purification Performance
To investigate the structural basis for the differences in dynamic purification performance among the activated carbons during continuous fixed-bed operation, the pore-structure characteristics derived from N2 adsorption–desorption measurements were compared with the dynamic performance metrics defined in Section 3.3.3. The pore descriptors considered in this analysis included BET specific surface area (SBET), t-plot micropore volume (Vmicro), total pore volume (Vtotal), external surface area (Sext), and equivalent average pore diameter (Davg). To further characterize mesopore-related transport features, the mesopore volume (Vmeso,des) and modal pore diameter (Dmode,des) derived from the BJH desorption branch were also included as representative parameters [48]. The raw values of all descriptors are summarized in Table 3. For the construction of the heat map, the raw values of q0–12 and the pore-structure descriptors were independently normalized to a 0–1 scale using min-max transformation, and the samples were arranged in descending order of q0–12. Figure 5a presents the comparison between pore descriptors and dynamic purification performance. For consistency, the samples in Figure 5b–e are ordered in the same sequence.
Table 3.
Summary of pore-structure parameters for different activated carbons.
As shown in Figure 5a, substantial differences in pore structure were observed among the activated carbons. Taking Vmicro as an example, AC-11 exhibited the highest micropore volume (0.4309 cm3/g), followed by AC-13 and AC-04 (0.3790 and 0.3306 cm3/g, respectively). AC-12 showed an intermediate value (0.2253 cm3/g), whereas AC-07, AC-02, and AC-08 exhibited relatively low Vmicro values of 0.0454, 0.0210, and 0.0130 cm3/g, respectively. SBET generally followed a similar trend, exceeding 1000 m2/g for AC-11 and AC-13 (1132.1 and 1032.5 m2/g, respectively), while remaining only about 70 m2/g for AC-02 and AC-08 (69.1 and 73.0 m2/g, respectively). At the mesopore level, both BJH mesopore volume and modal pore diameter also varied among samples. For example, AC-13 showed a relatively high Vmeso,des, whereas AC-12 and AC-08 exhibited comparatively larger Dmode,des values. Overall, Figure 5a provides a comparative overview of the relative distributions of pore descriptors and dynamic purification performance across the selected samples.
Figure 5.
(a) Relationship between pore-structure descriptors and dynamic purification performance. (b) Vmicro, (c) SBET, (d) Davg and (e) Dmode,des of activated carbons ordered by q0–12.
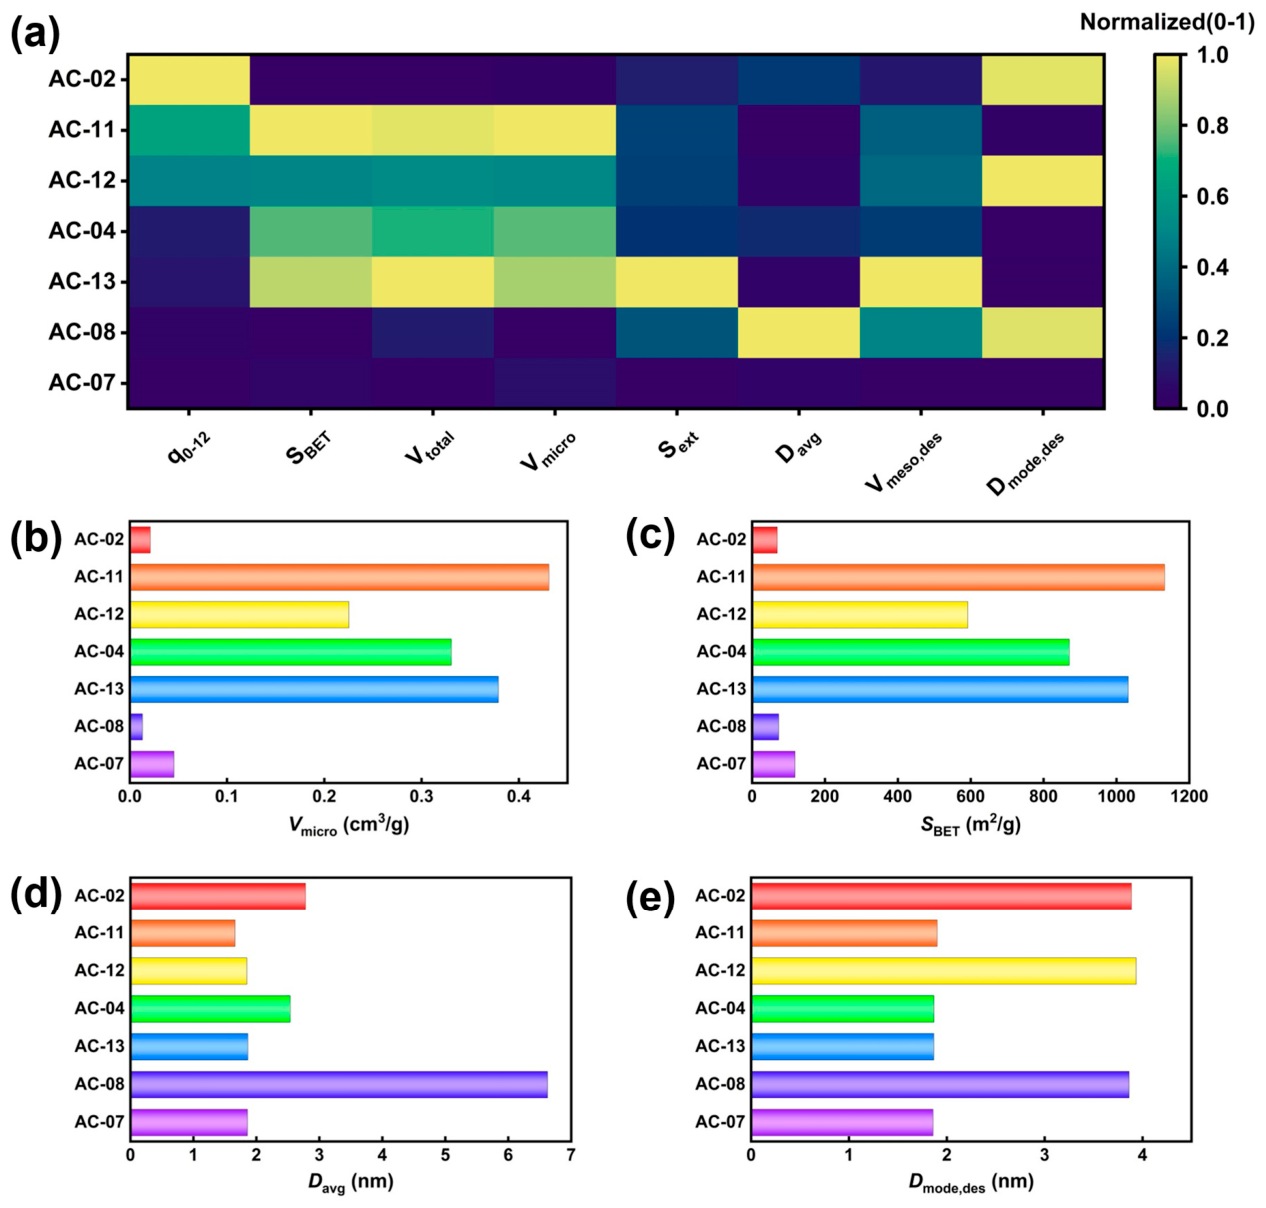
The comparison between pore structure and q0–12 shows a partial correspondence between micropore volume and cumulative adsorption capacity. AC-11 and AC-12 had relatively high q0–12 values and larger Vmicro, whereas AC-08 and AC-07 showed both lower q0–12 values and lower micropore volumes. This trend suggests that micropores may provide part of the adsorption space for hydrocarbon impurities. However, the correspondence was not consistent across all samples. Some carbons with higher SBET, Vmicro, or Vmeso,des did not show correspondingly higher q0–12. Thus, conventional pore-structure parameters are useful descriptors but are insufficient to fully account for fixed-bed hydrocarbon purification performance.
The differences among activated carbons should therefore be interpreted as the result of multiple factors. In fixed-bed operation, the effective use of adsorption sites may also be affected by pore accessibility, particle size, surface compatibility with the UDS solvent, and bed-level mass transfer. Accordingly, Vmicro can be regarded as a relevant pore descriptor associated with hydrocarbon adsorption, but it should not be used alone to explain the dynamic purification performance.
3.5. Deactivation Behavior and Pore-Structure Evolution of Activated Carbon
3.5.1. Pore-Structure Evolution Before and After Fixed-Bed Adsorption
To examine the pore-structure evolution associated with the performance decay of AC-02 during continuous fixed-bed purification, the N2 adsorption–desorption results of the sample before and after adsorption were compared. Changes in pore structure were characterized using SBET, Vmicro, Vtotal, Sext, and Davg. The corresponding results are summarized in Table 4, and the comparison of adsorption isotherms is shown in Figure 6.
Table 4.
Changes in pore-structure parameters of AC-02 before and after adsorption.
Figure 6.
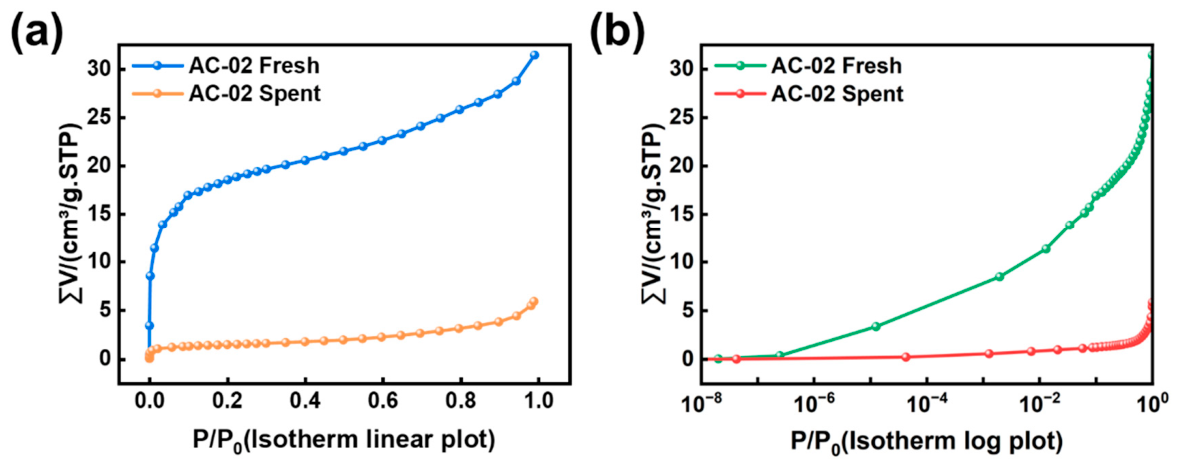
N2 adsorption–desorption isotherms of AC-02 before and after fixed-bed adsorption. N2 adsorption–desorption isotherms of AC-02 before and after fixed-bed adsorption: (a) linear plot; (b) log plot.
Before adsorption, AC-02 exhibited an SBET of 69.12 m2/g, a Vmicro of 0.0210 cm3/g, a Vtotal of 0.0485 cm3/g, a Sext of 18.89 m2/g, and a Davg of 2.81 nm. After fixed-bed adsorption, SBET, Vmicro, Vtotal, and Sext decreased to 5.10 m2/g, 0.0007 cm3/g, 0.0090 cm3/g, and 3.48 m2/g, respectively, corresponding to decreases of 92.62, 96.67, 81.44, and 81.58%, whereas Davg increased to 7.06 nm. These results indicate that the pore volume and surface area accessible for adsorption were substantially reduced after fixed-bed operation, with the most pronounced loss occurring in the micropore-related contribution. In addition, Vmicro/Vtotal decreased from 0.433 to 0.078, indicating that part of the originally accessible micropore space became occupied or inaccessible after adsorption.
As shown in Figure 6, fresh AC-02 exhibited a pronounced rapid uptake in the low-pressure region (P/P0 < 10−4), which is characteristic of micropore filling. For example, the adsorption uptake had already reached 3.37 cm3/g at P/P0 ≈ 1.25 × 10⁻⁵. The isotherm further turned upward at the high-pressure end (P/P0 → 1), reaching 31.44 cm3/g, indicating that mesopores and/or macropores also contributed to adsorption. In contrast, after fixed-bed adsorption, the isotherm of AC-02 shifted markedly downward over the entire pressure range. The rapid uptake in the low-pressure region nearly disappeared, and the adsorption uptake at the medium-to-high-pressure end increased only to about 5.86 cm3/g at P/P0 ≈ 0.99. This result indicates that the pore volume and accessible internal surface area, especially the micropore-related contribution, were greatly diminished after adsorption.
Taken together, the pore-structure parameters and adsorption isotherms show a substantial reduction in accessible pore volume and internal surface area after adsorption. The loss of low-pressure uptake further indicates that the micropore-related contribution was strongly reduced. This structural evolution is consistent with the decline in dynamic purification efficiency during fixed-bed operation and supports pore occupation as an important factor in the performance decay of AC-02.
3.5.2. Thermal-Release and Pyrolysis Evidence of Loaded Species on Spent Carbon
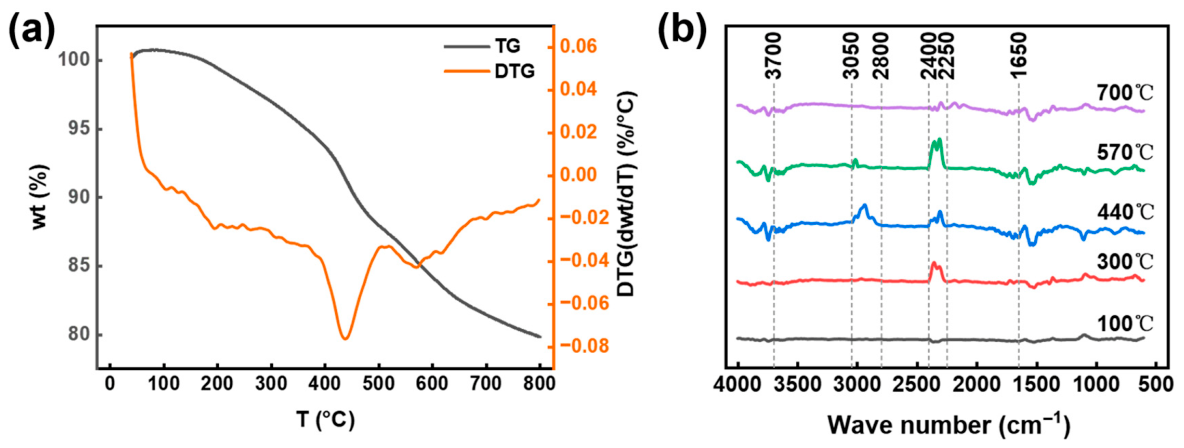
To further examine the species associated with the performance decay of AC-02 after fixed-bed operation and to elucidate the compositional characteristics of the organic loadings accumulated within the pore channels, the spent AC-02 sample was analyzed by thermogravimetry coupled with Fourier transform infrared spectroscopy and mass spectrometry (TG-FTIR-MS). Under programmed heating in a nitrogen atmosphere, this technique simultaneously records sample mass change and monitors the infrared bands and mass-spectral ion signals of the evolved gases, thereby revealing the stage-dependent characteristics of thermally released species from spent activated carbon over different temperature ranges, including both desorption and thermal cracking products. In this section, the main mass-loss intervals and the temperature ranges of the DTG rate peaks were first identified from the TG and DTG curves. The FTIR bands and MS channels were then correlated with these temperature intervals to analyze the evolved products in each stage.
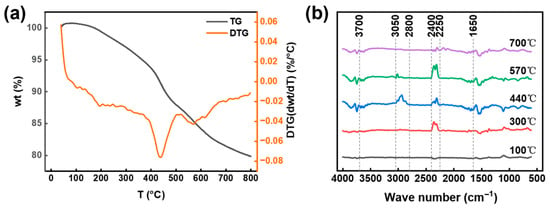
As shown in Figure 7a, the spent AC-02 sample exhibited only a small mass loss in the low-temperature range of 40–150 °C, with no pronounced overall change. When the temperature increased to around 150 °C, continuous mass loss became evident and could be divided into three intervals: 150–350 °C, with a mass loss of about 4.87%; 350–550 °C, with a mass loss of about 9.26%, representing the major contribution over the entire run; and 550–800 °C, with a further gradual mass loss of about 6.38%, indicating that thermal release continued even in the high-temperature range. The corresponding DTG curve displayed a pronounced mass-loss-rate peak in the intermediate-temperature region, with the main peak centered at about 440 °C, indicating that this stage corresponded to the most concentrated release rate. In the high-temperature region, a weaker secondary rate peak was observed at about 570 °C. These stage-wise mass-loss features and DTG peak temperatures provide the basis for assigning the FTIR and MS signals to specific temperature intervals.
Figure 7.
(a) TG and DTG curves of spent AC-02. (b) FTIR spectra of evolved gases at selected temperatures during TG-FTIR analysis of spent AC-02.
Accordingly, five representative temperature points, namely 100, 300, 440, 570, and 700 °C, were selected from the onset of mass loss, the vicinity of the main DTG peak, and the region near the secondary high-temperature peak. The corresponding gas-phase FTIR spectra obtained from the TG-FTIR measurement were extracted for comparison. The spectra were baseline-corrected and vertically offset to facilitate visualization of the relative changes in product bands across different temperature ranges (Figure 7b).
At 100 °C, the gas-phase FTIR spectrum was essentially featureless, with no obvious characteristic absorption bands, suggesting that only negligible amounts of volatile products were released at the initial heating stage. As the temperature increased to 300 °C, the water-related bands were still present but became weaker overall, whereas the characteristic CO2 absorption band at 2400–2250 cm−1 began to increase significantly, indicating that the thermal evolution of oxygen-containing structures had gradually started to contribute to gas-phase release.
When the temperature was further raised to 440 °C, the hydrocarbon C-H stretching bands in the 3050–2800 cm−1 region and the CH3/CH2 deformation bands at 1450–1470 cm−1 became much more pronounced and showed their strongest response in this temperature range. This observation suggests that this interval corresponds to the concentrated release of adsorbed hydrocarbon impurities and related organic residues through volatilization and/or cracking. Upon further heating, the characteristic CO2 absorption band became more intense at 570 °C. In this intermediate-to-high-temperature range, the enhancement of CO2 can be attributed to the removal and cracking of oxygen-containing structures in the adsorbed organic residues, possibly together with the thermal evolution of oxygen-containing functional groups on the activated-carbon surface. At 700 °C, the overall spectral bands weakened markedly and entered a tailing stage, with only weak signals remaining.
No NH3 or amine-related characteristic absorption bands showing significant enhancement with increasing temperature were observed in the present spectra, indicating that volatile or cracking products associated with amines made only a limited contribution under the present test conditions and at the selected temperature points. Therefore, no clear evidence of substantial retention of active solvent components was observed in the spent activated carbon. Overall, the sample exhibited more pronounced alkyl-related spectral responses in the intermediate-temperature region, whereas the CO2 characteristic band increased in the intermediate-to-high-temperature region and then entered a decaying tail at high temperature. These results indicate a stage-wise thermal-release behavior of the spent activated carbon, with intensified hydrocarbon-related release in the intermediate-temperature region, followed by enhanced release or transformation of oxygen-containing structures at higher temperatures.
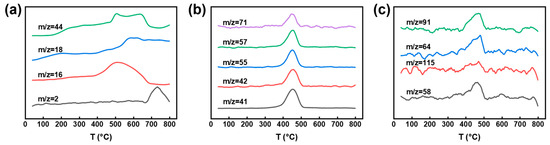
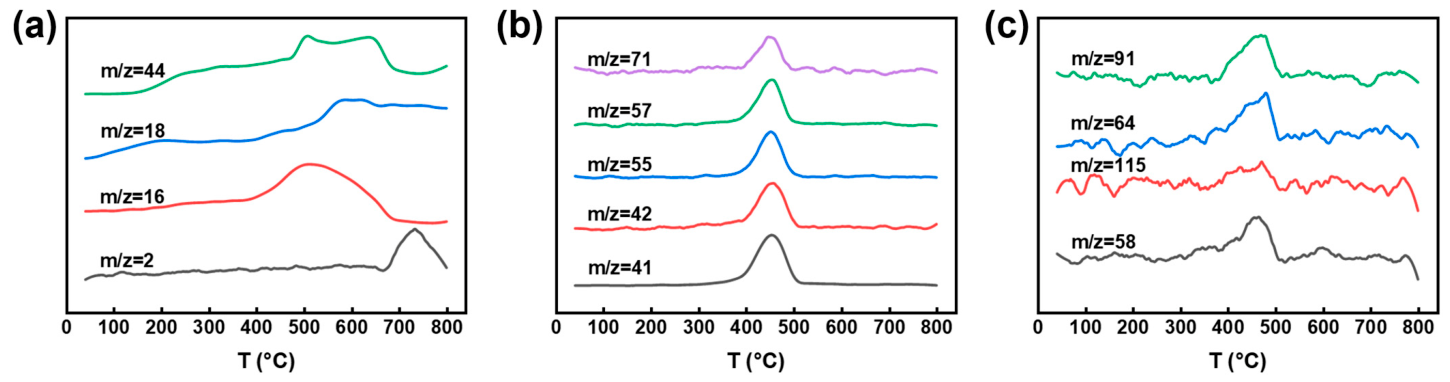
To further identify the volatile and cracking products released from the spent sample during heating, MS ion-current signals of several representative m/z channels were tracked, and the curves were normalized by peak intensity to compare the peak profiles and the corresponding temperature ranges of different channels (Figure 8). In the low-m/z region, channels such as m/z = 2, 16, 18, and 44 served as reference signals for small molecules. Among them, m/z = 44 maintained a relatively pronounced response in the intermediate-to-high-temperature region, consistent with the enhancement trend of the CO2 band observed in TG-FTIR, indicating the release of oxygen-containing small molecules during this stage. Meanwhile, hydrocarbon-related fragment channels showed more concentrated peak profiles in the intermediate-temperature region: the ion currents of m/z = 41, 42, 55, 57, and 71 increased synchronously in the range of about 400–500 °C and exhibited closely aligned main peaks around 440 °C (Figure 8b). These m/z channels are typical alkyl fragment-ion indicators commonly observed during thermal cracking of aliphatic hydrocarbons, and they are consistent with the enhanced alkyl C-H stretching and CH3/CH2 deformation bands observed by TG-FTIR in the same temperature range. Taken together, the major organic loadings released from the spent sample in the intermediate-temperature stage are more characteristic of aliphatic hydrocarbons and their related cracking fragments, which is consistent with the purification target of externally introduced hydrocarbon impurities during fixed-bed operation.
Figure 8.
Temperature-resolved MS ion-current profiles of selected m/z channels during TG-MS analysis of spent AC-02: (a) m/z = 2, 16, 18, and 44; (b) m/z = 41, 42, 55, 57, and 71; (c) m/z = 58, 64, 91, and 115.
In addition to hydrocarbon fragments, several channels displayed weak but distinguishable synchronous peaks during the same thermal-release stage, which can be used to screen for the co-release of low-abundance solvent-related species (Figure 8c). Among them, m/z = 58 and 115 may be regarded as screening channels for relatively polar organic fragments, while m/z = 64 and 91 may serve as screening indicators for sulfur-containing species and aromatic fragments. Their responses appearing near 440 °C, coincident with the main release stage, suggest that, in addition to hydrocarbons, the system may also contain small amounts of polar solvent-derived components or derivative fragments released simultaneously, possibly associated with polar residues and degradation products from the solvent system.
However, because the overall intensities of these channels were much lower than those of the hydrocarbon fragment channels, these non-hydrocarbon signals were assigned to minor co-released species under the present test conditions. The TG-MS results, therefore, indicate that hydrocarbon-related fragments were the main organic signals detected from spent AC-02 during thermal release. Combined with the pore-structure loss discussed in Section 3.5.1, these results support that hydrocarbon-related loadings occupied accessible pore space and were an important factor associated with the decay of dynamic purification performance of AC-02. At the same time, the weak amine-related signals suggest that substantial adsorption of active solvent components was not evident under the present conditions.
3.6. Practical Applicability in Field-Aged UDS Lean Solvent
To further examine the applicability of the selected adsorbents in a real solvent matrix, a field-aged UDS lean solvent was treated with AC-02 and A-98FM, respectively. The results are summarized in Table 5. The original field-aged lean solvent contained 424.03 mg/kg total hydrocarbons and 4288.8 mg/L total anionic impurities. Its foam height and defoaming time were 230 mm and 45.63 s, respectively.
Table 5.
Treatment of a field-aged UDS lean solvent by selected adsorbents.
After AC-02 treatment, the total hydrocarbon content decreased to 235.83 mg/kg. The foam height decreased to 185 mm, and the defoaming time decreased to 32.45 s. After A-98FM treatment, the total anionic impurity concentration decreased to 165.07 mg/L. The foam height and defoaming time decreased to 135 mm and 26.76 s. These results indicate that AC-02 and A-98FM showed their respective removal effects in the field-aged UDS lean solvent. The reductions in hydrocarbon and ionic impurities were also accompanied by lower foam height and shorter defoaming time.
In field operation, the resin and activated carbon can be managed according to their respective target impurities. The anion-exchange resin is periodically regenerated with NaOH solution to restore its exchange capacity, whereas activated carbon used for hydrocarbon removal is usually replaced at regular intervals. The regeneration or replacement interval can be adjusted according to the changes in target impurity concentrations before and after treatment, together with the required solvent purification level. Spent carbon and spent alkaline regenerant should be handled according to the waste-management requirements of the desulfurization unit.
4. Conclusions
In this study, an extraction-GC method suitable for the UDS solvent matrix was established for the quantitative determination of total hydrocarbons, and the effects of representative impurities on the foaming behavior of UDS solvent were evaluated under controlled contamination conditions. The results demonstrated that hydrocarbon impurities showed the strongest effect on foaming behavior, while SO42− and Cl− also promoted foam formation and prolonged defoaming time, whereas organic acid anions showed relatively limited effects. For impurity control, A-98FM exhibited the best overall performance for anionic impurity removal, and AC-02 showed the best continuous fixed-bed performance for hydrocarbon purification. Pore-structure and deactivation analyses further suggested that hydrocarbon-related loadings occupied accessible pore space, especially micropore-related regions, and were an important factor associated with the decline in purification performance. Treatment of a field-aged UDS lean solvent further showed that AC-02 reduced total hydrocarbon content, whereas A-98FM reduced total anionic impurity concentration; both treatments were accompanied by lower foam height and shorter defoaming time. The present study provides experimental support for impurity monitoring, foaming-risk identification, and adsorptive purification of UDS desulfurization solvent under flowback-contamination conditions.
Supplementary Materials
The following supporting information can be downloaded at: https://www.mdpi.com/article/10.3390/separations13050150/s1, Figure S1: (a) 1H NMR spectrum of the concentrated extract from produced water, (b) GC-MS of the concentrated extract from produced water; Figure S2: (a) GC chromatogram of the standard oil, (b) external calibration curve for total hydrocarbon quantification; Figure S3: Representative GC-FID chromatograms of (a) fresh-UDS blank extract and (b) 1000 mg/kg matrix-spiked UDS extract; Table S1: Basic properties of the 50 wt% fresh UDS working solution at 40 °C; Table S2: Basic properties of activated carbon samples; Table S3: Detailed ion chromatography conditions; Table S4: Composition analysis of major hydrocarbon impurities in produced water; Table S5: Composition of the standard oil; Table S6: Replicate determination results and method validation metrics; Table S7: Ion concentrations of UDS solvent before and after adsorbent treatment; Table S8: Packed masses of activated carbons used for q0−12 calculation; Table S9: Concentrations of individual anions in field-aged UDS lean solvent before and after A-98FM treatment.
Author Contributions
Conceptualization, H.S.; methodology, H.W.; software, H.W. and Q.Z.; validation, C.L. and H.S.; formal analysis, H.W., Q.Z., Y.W., Z.J. and Y.C.; investigation, H.W., Z.J. and M.X.; resources, H.S.; data curation, H.W., Q.Z., Z.J. and M.X.; writing—original draft preparation, H.W. and Q.Z.; writing—review and editing, H.W., Q.Z., Y.W., Z.J., Y.C., M.X., C.L. and H.S.; visualization, H.W. and Q.Z.; supervision, C.L. and H.S.; project administration, H.S.; funding acquisition, H.S. All authors have read and agreed to the published version of the manuscript.
Funding
This research was funded by the National Natural Science Foundation of China (Grant numbers 22178109 and 21878097) and the Natural Science Foundation of Shanghai (Grant number 21ZR1417700).
Data Availability Statement
The original contributions presented in this study are included in the article/Supplementary Materials. Further inquiries can be directed to the corresponding authors.
Conflicts of Interest
The authors declare no conflicts of interest.
References
- Zahid, U.; Sakheta, A.; Lee, C.-J. Techno-Economic Analysis of Acid Gas Removal from Associated and Non-Associated Sour Gas Using Amine Blend. Int. J. Greenh. Gas Control 2020, 98, 103078. [Google Scholar] [CrossRef] [Scilit]
- Peters, L.; Hussain, A.; Follmann, M.; Melin, T.; Hägg, M.-B. CO2 Removal from Natural Gas by Employing Amine Absorption and Membrane Technology—A Technical and Economical Analysis. Chem. Eng. J. 2011, 172, 952–960. [Google Scholar] [CrossRef] [Scilit]
- George, G.; Bhoria, N.; AlHallaq, S.; Abdala, A.; Mittal, V. Polymer Membranes for Acid Gas Removal from Natural Gas. Sep. Purif. Technol. 2016, 158, 333–356. [Google Scholar] [CrossRef] [Scilit]
- Haider, J.; Saeed, S.; Qyyum, M.A.; Kazmi, B.; Ahmad, R.; Muhammad, A.; Lee, M. Simultaneous Capture of Acid Gases from Natural Gas Adopting Ionic Liquids: Challenges, Recent Developments, and Prospects. Renew. Sustain. Energy Rev. 2020, 123, 109771. [Google Scholar] [CrossRef] [Scilit]
- Jassim, M.S. Sensitivity Analyses and Optimization of a Gas Sweetening Plant for Hydrogen Sulfide and Carbon Dioxide Capture Using Methyldiethanolamine Solutions. J. Nat. Gas Sci. Eng. 2016, 36, 175–183. [Google Scholar] [CrossRef] [Scilit]
- Verma, N.; Verma, A. Amine System Problems Arising from Heat Stable Salts and Solutions to Improve System Performance. Fuel Process. Technol. 2009, 90, 483–489. [Google Scholar] [CrossRef] [Scilit]
- Pal, P.; AbuKashabeh, A.; Al-Asheh, S.; Banat, F. Role of Aqueous Methyldiethanolamine (MDEA) as Solvent in Natural Gas Sweetening Unit and Process Contaminants with Probable Reaction Pathway. J. Nat. Gas Sci. Eng. 2015, 24, 124–131. [Google Scholar] [CrossRef] [Scilit]
- Alhseinat, E.; Pal, P.; Ganesan, A.; Banat, F. Effect of MDEA Degradation Products on Foaming Behavior and Physical Properties of Aqueous MDEA Solutions. Int. J. Greenh. Gas Control 2015, 37, 280–286. [Google Scholar] [CrossRef] [Scilit]
- Alhseinat, E.; Pal, P.; Keewan, M.; Banat, F. Foaming Study Combined with Physical Characterization of Aqueous MDEA Gas Sweetening Solutions. J. Nat. Gas Sci. Eng. 2014, 17, 49–57. [Google Scholar] [CrossRef] [Scilit]
- Abukashabeh, A.S.; Alhseinat, E.; Al-Asheh, S.; Banat, F. Thermophysical Properties of Fresh and Lean Thermally Degraded N-Methyldiethanolamine. J. Nat. Gas Sci. Eng. 2014, 19, 317–323. [Google Scholar] [CrossRef] [Scilit]
- Shahouni, R.; Abbasi, M.; Akrami, M. A Comprehensive Review on Control and Mitigating the Foam Formation in Amine-Based Solvents. Chem. Eng. J. Adv. 2024, 19, 100618. [Google Scholar] [CrossRef] [Scilit]
- Chen, Q.; Peng, X.; Xue, J.; Li, J.; Pan, C. Identification and Quantification of Organic Contaminants and Evaluation of Their Effects on Amine Foaming in the Natural Gas Sweetening Industry. ACS Omega 2022, 7, 46421–46427. [Google Scholar] [CrossRef] [Scilit]
- Pal, P.; AbuKashabeh, A.; Al-Asheh, S.; Banat, F. Accumulation of Heat Stable Salts and Degraded Products during Thermal Degradation of Aqueous Methyldiethanolamine (MDEA) Using Microwave Digester and High Pressure Reactor. J. Nat. Gas Sci. Eng. 2014, 21, 1043–1047. [Google Scholar] [CrossRef] [Scilit]
- Pal, P.; Banat, F. Comparison of Thermal Degradation between Fresh and Industrial Aqueous Methyldiethanolamine with Continuous Injection of H2S/CO2 in High Pressure Reactor. J. Nat. Gas Sci. Eng. 2016, 29, 479–487. [Google Scholar] [CrossRef] [Scilit]
- Gouedard, C.; Picq, D.; Launay, F.; Carrette, P.-L. Amine Degradation in CO2 Capture. I. A Review. Int. J. Greenh. Gas Control 2012, 10, 244–270. [Google Scholar] [CrossRef] [Scilit]
- Rochelle, G.T. Thermal Degradation of Amines for CO2 Capture. Curr. Opin. Chem. Eng. 2012, 1, 183–190. [Google Scholar] [CrossRef] [Scilit]
- Ke, Y.; Shen, B.; Sun, H.; Liu, J.; Xu, X. Study on Foaming of Formulated Solvent UDS and Improving Foaming Control in Acid Natural Gas Sweetening Process. J. Nat. Gas Sci. Eng. 2016, 28, 271–279. [Google Scholar] [CrossRef] [Scilit]
- Alhseinat, E.; Keewan, M.; Banat, F. Impact of Dissolved and Undissolved Organics on Foaming of Industrial Amine. Int. J. Greenh. Gas Control 2017, 60, 156–161. [Google Scholar] [CrossRef] [Scilit]
- Alhseinat, E.; Amr, M.; Jumah, R.; Banat, F. Removal of MDEA Foam Creators Using Foam Fractionation: Parametric Study Coupled with Foam Characterization. J. Nat. Gas Sci. Eng. 2015, 26, 502–509. [Google Scholar] [CrossRef] [Scilit]
- Edalatpour, A.; Abbasi, M.; Riahi, S.; Sanaye Mozaffari Sabet, N.; Tavakoli, O. Investigation of Foaming Tendency of Aqueous Mixture of MDEA+IPAE for Carbon Dioxide Absorption. J. CO2 Util. 2022, 62, 102079. [Google Scholar] [CrossRef] [Scilit]
- Dumée, L.; Scholes, C.; Stevens, G.; Kentish, S. Purification of Aqueous Amine Solvents Used in Post Combustion CO2 Capture: A Review. Int. J. Greenh. Gas Control 2012, 10, 443–455. [Google Scholar] [CrossRef] [Scilit]
- Wang, T.; Hovland, J.; Jens, K.J. Amine Reclaiming Technologies in Post-Combustion Carbon Dioxide Capture. J. Environ. Sci. 2015, 27, 276–289. [Google Scholar] [CrossRef] [Scilit] [PubMed]
- Garg, B.; Verheyen, T.V.; Pearson, P.; Feron, P.; Cousins, A. A Technology Review for Regeneration of Sulfur Rich Amine Systems. Int. J. Greenh. Gas Control 2018, 75, 243–253. [Google Scholar] [CrossRef] [Scilit]
- Tavan, Y.; Moradi, M.; Rostami, A.; Azizpour, H. Theoretical and Industrial Aspects of Amine Reclaiming Unit to Separate Heat Stable Salts. Sep. Purif. Technol. 2020, 237, 116314. [Google Scholar] [CrossRef] [Scilit]
- Pal, P.; Banat, F.; AlShoaibi, A. Adsorptive Removal of Heat Stable Salt Anions from Industrial Lean Amine Solvent Using Anion Exchange Resins from Gas Sweetening Unit. J. Nat. Gas Sci. Eng. 2013, 15, 14–21. [Google Scholar] [CrossRef] [Scilit]
- Meng, H.; Zhang, S.; Li, C.; Li, L. Removal of Heat Stable Salts from Aqueous Solutions of N-Methyldiethanolamine Using a Specially Designed Three-Compartment Configuration Electrodialyzer. J. Membr. Sci. 2008, 322, 436–440. [Google Scholar] [CrossRef] [Scilit]
- Zhou, Z.; Lin, Y.; Jin, Y.; Guan, K.; Matsuyama, H.; Yu, J. Removal of Heat-Stable Salts from Lean Amine Solution Using Bipolar Membrane Electrodialysis. J. Membr. Sci. 2022, 645, 120213. [Google Scholar] [CrossRef] [Scilit]
- Wang, Y.; Fang, M.; Huang, Y.; Wang, T.; Li, S.; Lu, X.; Xie, Y. Removal of Heat Stable Salts from Degraded Amine Solvent by “BMED+ED” Two-Stage Electrodialysis Unit. Int. J. Greenh. Gas Control 2023, 127, 103939. [Google Scholar] [CrossRef] [Scilit]
- Ghorbani, A.; Bayati, B.; Poerio, T.; Argurio, P.; Kikhavani, T.; Namdari, M.; Ferreira, L.M. Application of NF Polymeric Membranes for Removal of Multicomponent Heat-Stable Salts (HSS) Ions from Methyl Diethanolamine (MDEA) Solutions. Molecules 2020, 25, 4911. [Google Scholar] [CrossRef] [Scilit]
- Edathil, A.A.; Alhseinat, E.; Banat, F. Removal of Heat Stable Salts from Industrial Lean Methyldiethanolamine Using Magnetic Alginate/Iron Oxide Hydrogel Composite. Int. J. Greenh. Gas Control 2019, 83, 117–127. [Google Scholar] [CrossRef] [Scilit]
- Chen, F.; Chi, Y.; Zhang, M.; Yang, K.; Fu, C. Removal of Heat Stable Salts from N-Methyldiethanolamine Wastewater Using Electrodialysis: A Pilot-Scale Study. Desalin. Water Treat. 2020, 196, 48–57. [Google Scholar] [CrossRef] [Scilit]
- Aleghafouri, A.; Hasanzadeh, N.; Mahdyarfar, M.; SeifKordi, A.; Mahdavi, S.M.; Zoghi, A.T. Experimental and Theoretical Study on BTEX Removal from Aqueous Solution of Diethanolamine Using Activated Carbon Adsorption. J. Nat. Gas Sci. Eng. 2015, 22, 618–624. [Google Scholar] [CrossRef] [Scilit]
- Zhang, J.H.; Shen, B.X.; Sun, H.; Liu, J.C. A Study on the Desulfurization Performance of Solvent UDS for Purifying High Sour Natural Gas. Pet. Sci. Technol. 2011, 29, 48–58. [Google Scholar] [CrossRef] [Scilit]
- Zhang, J.H.; Shen, B.X.; Liu, J.C.; Sun, H.; Hu, W.J. Absorption Selectivities of Solvents for Organosulfurs in High Sour Natural Gas. Energy Sources Part A 2014, 36, 822–829. [Google Scholar] [CrossRef] [Scilit]
- Zhang, F.; Shen, B.; Sun, H.; Liu, J.; Liu, L. Rational Formulation Design and Commercial Application of a New Hybrid Solvent for Selectively Removing H2 S and Organosulfurs from Sour Natural Gas. Energy Fuels 2016, 30, 12–19. [Google Scholar] [CrossRef] [Scilit]
- Liu, L.; Shen, B.; Sun, H.; Xu, S. Kinetics Study of CO2 Absorption into Solutions of UDS. Pet. Sci. Technol. 2012, 30, 2563–2570. [Google Scholar] [CrossRef] [Scilit]
- Zhang, F.; Shen, B.-X.; Sun, H.; Liu, J.-C. Removal of Organosulfurs from Liquefied Petroleum Gas in a Fiber Film Contactor Using a New Formulated Solvent. Fuel Process. Technol. 2015, 140, 76–81. [Google Scholar] [CrossRef] [Scilit]
- Adeniji, A.O.; Okoh, O.O.; Okoh, A.I. Analytical Methods for the Determination of the Distribution of Total Petroleum Hydrocarbons in the Water and Sediment of Aquatic Systems: A Review. J. Chem. 2017, 2017, 5178937. [Google Scholar] [CrossRef] [Scilit]
- Thommes, M.; Kaneko, K.; Neimark, A.V.; Olivier, J.P.; Rodriguez-Reinoso, F.; Rouquerol, J.; Sing, K.S.W. Physisorption of Gases, with Special Reference to the Evaluation of Surface Area and Pore Size Distribution (IUPAC Technical Report). Pure Appl. Chem. 2015, 87, 1051–1069. [Google Scholar] [CrossRef] [Scilit]
- Dittmann, D.; Eisentraut, P.; Goedecke, C.; Wiesner, Y.; Jekel, M.; Ruhl, A.S.; Braun, U. Specific Adsorption Sites and Conditions Derived by Thermal Decomposition of Activated Carbons and Adsorbed Carbamazepine. Sci. Rep. 2020, 10, 6695. [Google Scholar] [CrossRef] [Scilit]
- Minofar, B.; Jungwirth, P.; Das, M.R.; Kunz, W.; Mahiuddin, S. Propensity of Formate, Acetate, Benzoate, and Phenolate for the Aqueous Solution/Vapor Interface: Surface Tension Measurements and Molecular Dynamics Simulations. J. Phys. Chem. C 2007, 111, 8242–8247. [Google Scholar] [CrossRef] [Scilit]
- Sett, S.; Karakashev, S.I.; Smoukov, S.K.; Yarin, A.L. Ion-Specific Effects in Foams. Adv. Colloid Interface Sci. 2015, 225, 98–113. [Google Scholar] [CrossRef] [Scilit] [PubMed]
- Schelero, N.; von Klitzing, R. Ion Specific Effects in Foam Films. Curr. Opin. Colloid Interface Sci. 2015, 20, 124–129. [Google Scholar] [CrossRef] [Scilit]
- Salonen, A.; Lhermerout, R.; Rio, E.; Langevin, D.; Saint-Jalmes, A. Dual Gas and Oil Dispersions in Water: Production and Stability of Foamulsion. Soft Matter 2012, 8, 699–706. [Google Scholar] [CrossRef] [Scilit]
- Khormali, A. Increasing the Efficiency of Demulsification Treatment in Petroleum Industry Using a Multicomponent Demulsifier Package. Pet. Chem. 2023, 63, 539–552. [Google Scholar] [CrossRef] [Scilit]
- Khormali, A. Using a New Mixture of Reagents for Effective Inhibition of Corrosion and Salt Precipitation in the Petroleum Industry. J. Chem. Pet. Eng. 2021, 55, 257–276. [Google Scholar] [CrossRef]
- Chu, K.H. Fixed Bed Adsorption of Chromium and the Weibull Function. J. Hazard. Mater. Lett. 2021, 2, 100022. [Google Scholar] [CrossRef] [Scilit]
- Zhang, Z.; Jiang, C.; Li, D.; Lei, Y.; Yao, H.; Zhou, G.; Wang, K.; Rao, Y.; Liu, W.; Xu, C.; et al. Micro-Mesoporous Activated Carbon Simultaneously Possessing Large Surface Area and Ultra-High Pore Volume for Efficiently Adsorbing Various VOCs. Carbon 2020, 170, 567–579. [Google Scholar] [CrossRef] [Scilit]

Disclaimer/Publisher’s Note: The statements, opinions and data contained in all publications are solely those of the individual author(s) and contributor(s) and not of MDPI and/or the editor(s). MDPI and/or the editor(s) disclaim responsibility for any injury to people or property resulting from any ideas, methods, instructions or products referred to in the content. |
© 2026 by the authors. Licensee MDPI, Basel, Switzerland. This article is an open access article distributed under the terms and conditions of the Creative Commons Attribution (CC BY) license.