


Abstract
Adsorption is a widely employed separation technique valued for its low energy requirements and its applicability to diverse processes, including air separation, water purification, chromatographic analysis, wastewater treatment, and protein immobilization on biomaterials. Industrial adsorption–desorption cycles are typically carried out in parallel packed-bed columns. The accurate design and optimization of these columns rely on experimental breakthrough curves. These curves provide essential information on adsorption capacity and mass-transfer kinetics. In this study, five modelling approaches, based on instantaneous adsorption, non-instantaneous adsorption, Fickian diffusion, and anomalous diffusion, were evaluated for their ability to predict breakthrough behaviour during the adsorption of butanol on activated carbon. The first four models were formulated using conventional partial differential equations of varying complexity, whereas the fifth model incorporated anomalous diffusion through fractional-order differential equations. The results indicate that model performance depended strongly on the adsorbent type: certain models provided superior predictions for one activated carbon, while different models were more accurate for the other.
1. Introduction
The design and optimization of a packed-bed adsorption column for a given application depend fundamentally on two key modelling components: the adsorption isotherm describing the equilibrium behaviour of the target species on the chosen adsorbent, and the dynamic adsorption model used to simulate breakthrough curves. Selection of an appropriate adsorbent is guided by multiple criteria, including adsorption capacity, adsorption kinetics, ease of regeneration, long-term stability over repeated adsorption–desorption cycles, molecular selectivity, and overall cost.
Despite recent theoretical advances in predicting adsorption isotherms, such as those enabled by molecular dynamics simulations [1,2], experimental measurements remain the primary and most reliable approach for determining isotherm equations. These equations describe the equilibrium adsorption capacity of an adsorbent for a given species as a function of that species’ concentration in the gas or liquid phase. When equilibrium adsorption data are available, the isotherm parameters can be obtained through nonlinear least-squares regression, allowing the selection of an appropriate model (e.g., Langmuir, Freundlich, or Sips) that best captures the relationship between equilibrium loading and solute concentration. More sophisticated approaches, including neural-network-based isotherm representations [3] or advanced model-selection techniques such as nonlinear frequency response analysis [4], may also be employed. For packed-bed design and optimization, however, the specific mathematical form of the isotherm is less critical than its ability to accurately represent equilibrium adsorption behaviour. Simulation of breakthrough curves in packed-bed adsorbers requires solving a coupled set of differential equations that describe convective transport through the column, intraparticle diffusion for each species, and adsorption at the adsorbent surface. Several well-established correlations are available to estimate key transport parameters, including mass-transfer coefficients, axial dispersion, intraparticle diffusion coefficients, and column void fraction [5,6]. Other parameters, such as particle porosity and adsorption kinetics, must typically be determined experimentally. In practice, many of the most influential model parameters are refined by fitting simulated breakthrough curves to experimental data collected under varying operating conditions. Once the simulated curves satisfactorily reproduce the experimental behaviour, the resulting model can be applied
Accurate design and optimization of packed-bed adsorption systems require the use of representative models that can reliably predict breakthrough behaviour under realistic operating conditions. As noted by Wiechert [7], “a model should always be as simple as possible and as complex as necessary,” underscoring the need to balance model complexity with computational efficiency. Accordingly, selecting an appropriate level of model sophistication is essential to ensure adequate representation of the adsorption process while avoiding unnecessary development and computational burden. In this study, adsorption models of varying complexity, including fractional-order diffusion models, were developed, evaluated, and compared for the adsorption of butanol from aqueous binary solutions onto activated carbon. Both experimental data sets generated in our laboratory and relevant data from the literature were used to assess model performance. Particular attention was given to determining whether incorporating a fractional-order diffusion term, representing anomalous diffusion behaviour, provides a more accurate description of the breakthrough curves observed in packed-bed adsorption systems. Although fractional-order diffusion models have been proposed to describe anomalous mass-transfer phenomena in porous adsorbents, their application to packed-bed adsorption of butanol from aqueous solutions remains limited, and existing studies provide little guidance on when the added complexity of fractional diffusion is justified. This gap makes it difficult to determine whether such models offer meaningful improvements over conventional approaches for practical system design. In this study, we explicitly address this problem by comparing adsorption models of varying complexity to evaluate their ability to reproduce breakthrough curves for butanol adsorption on activated carbon. Through this comparison, we aim to clarify the conditions under which fractional-order diffusion provides a more accurate and computationally efficient representation of packed-bed adsorption behaviour.
2. Materials and Methods
2.1. Materials
For the experiments conducted in our laboratory, butanol–water solutions were prepared using n-butanol (99% pure, Acros, Thermo Fisher Scientific, Ottawa, ON, Canada) and deionized distilled water. The adsorbent selected for these experiments was F-400 activated carbon (AC F-400), obtained from Calgon Corporation (Mississauga, ON, Canada). Relevant physicochemical properties of AC F-400 are summarized in Table 1. For comparison with the literature, isotherm and breakthrough measurements at 37 °C were extracted from the study by Xue et al. [8], in which butanol adsorption was performed using Norit ROW 0.8 activated carbon. The principal properties of AC Norit ROW 0.8, as reported by Mauguet et al. [9], are also provided in Table 1.
Table 1.
Some properties of the two activated carbon adsorbents used for butanol adsorption.
2.2. Methods
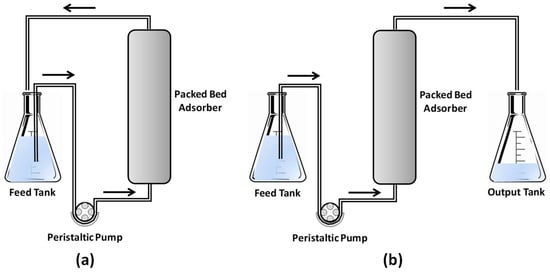
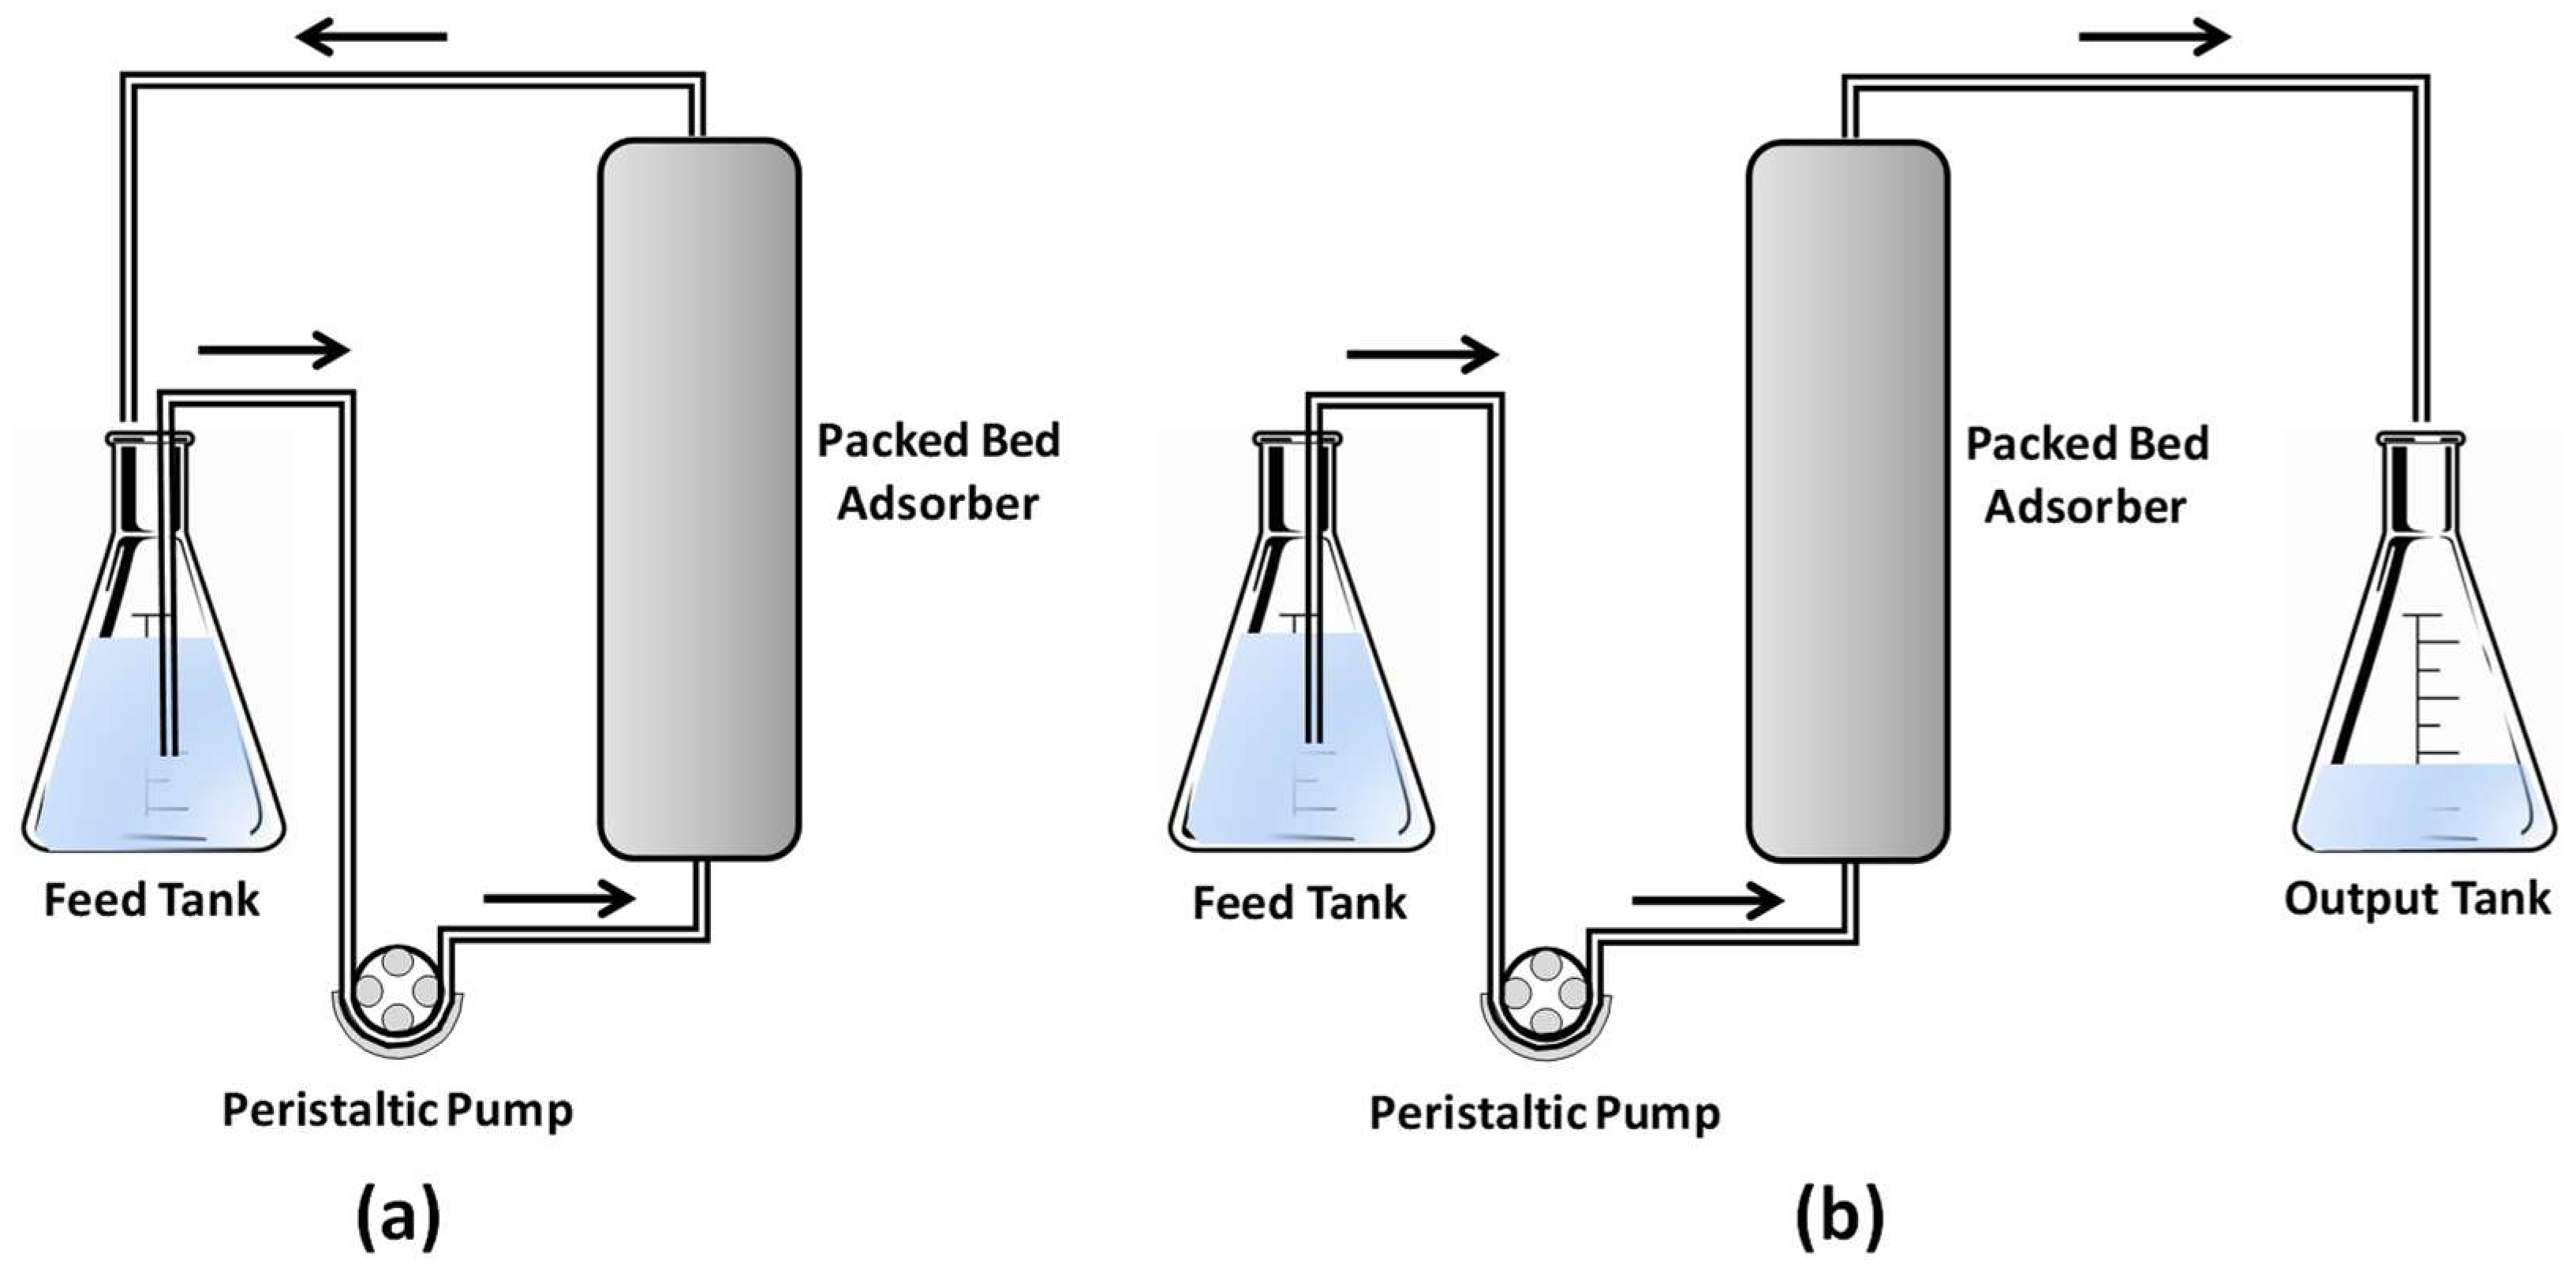
For the experiments conducted in our laboratory, the butanol adsorption isotherm at 25 °C was determined using a packed-bed adsorber (0.175 m in height and 0.015 m in diameter) containing 20 g of AC F-400, as shown in the experimental setup in Figure 1. A butanol solution of known initial concentration and volume was continuously recirculated through the packed bed until equilibrium was reached. This procedure was repeated for multiple initial butanol concentrations. For each run, a single isotherm point was obtained by performing a mass balance between the initial and final liquid-phase concentrations, with the decrease in butanol concentration attributed to adsorption onto the solid phase [10]. Concentrations were quantified using High-Performance Liquid Chromatography (HPLC, Waters, Mississauga, ON, Canada) equipped with a refractive index detector (Waters 2414), an isocratic pump (Waters 1515), and an autosampler (Waters 717 Plus). The resulting equilibrium data were fitted to a Freundlich isotherm.
Figure 1.
Schematic diagram of the adsorption setup used for (a) isotherm experiments and (b) breakthrough experiments.
For comparison, the literature data reported by Xue et al. [8] were also considered. In their study, the butanol isotherm at 37 °C was obtained using batch flask experiments in which varying masses of activated carbon (0.25–6 g) were added to 15 mL of a 40 g/L aqueous butanol solution and agitated at 150 rpm for 24 h to ensure equilibrium.
Breakthrough experiments were conducted in our laboratory using a packed-bed adsorption column constructed of stainless steel (0.195 m in height and 0.02 m in diameter) and loaded with 39 g of AC F-400 adsorbent. The inlet solution contained butanol at a concentration of 13–14 g/L, and three different flow rates were investigated [10]. To minimize uncertainty in the volumetric flow rate delivered by the peristaltic pump, the reported values were determined from three independent measurements. First, the pump was calibrated immediately before each experiment by collecting the effluent over a defined time interval and calculating the corresponding flow rate. Second, the same procedure was repeated at the conclusion of each experiment to obtain an independent post-experiment verification. Third, a mass balance was performed to confirm that the predicted total amount of butanol adsorbed was consistent with the experimentally measured adsorption capacity. The full procedure is provided in Appendix A. During each breakthrough experiment, the feed solution was introduced into the column using a peristaltic pump, and effluent samples were collected at predetermined time intervals until complete saturation of the adsorbent bed was achieved. Butanol concentrations were quantified by HPLC. Integration of the area above the breakthrough curve provided an additional isotherm point corresponding to the equilibrium adsorption capacity [11].
For comparison with literature data, breakthrough curves reported by Xue et al. [8] were digitized using GRABIT software (Version 1.7.5 Beta). In their study, a 10 g/L butanol solution was fed at 20 mL/min through a glass-packed column (0.15 m in height and 0.021 m in diameter) containing 25 g of Norit ROW 0.8 activated carbon.
3. Description of the Different Models
3.1. Problem Statement
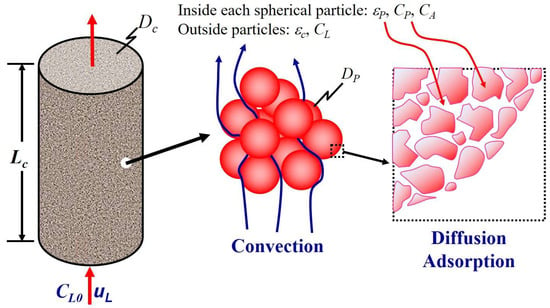
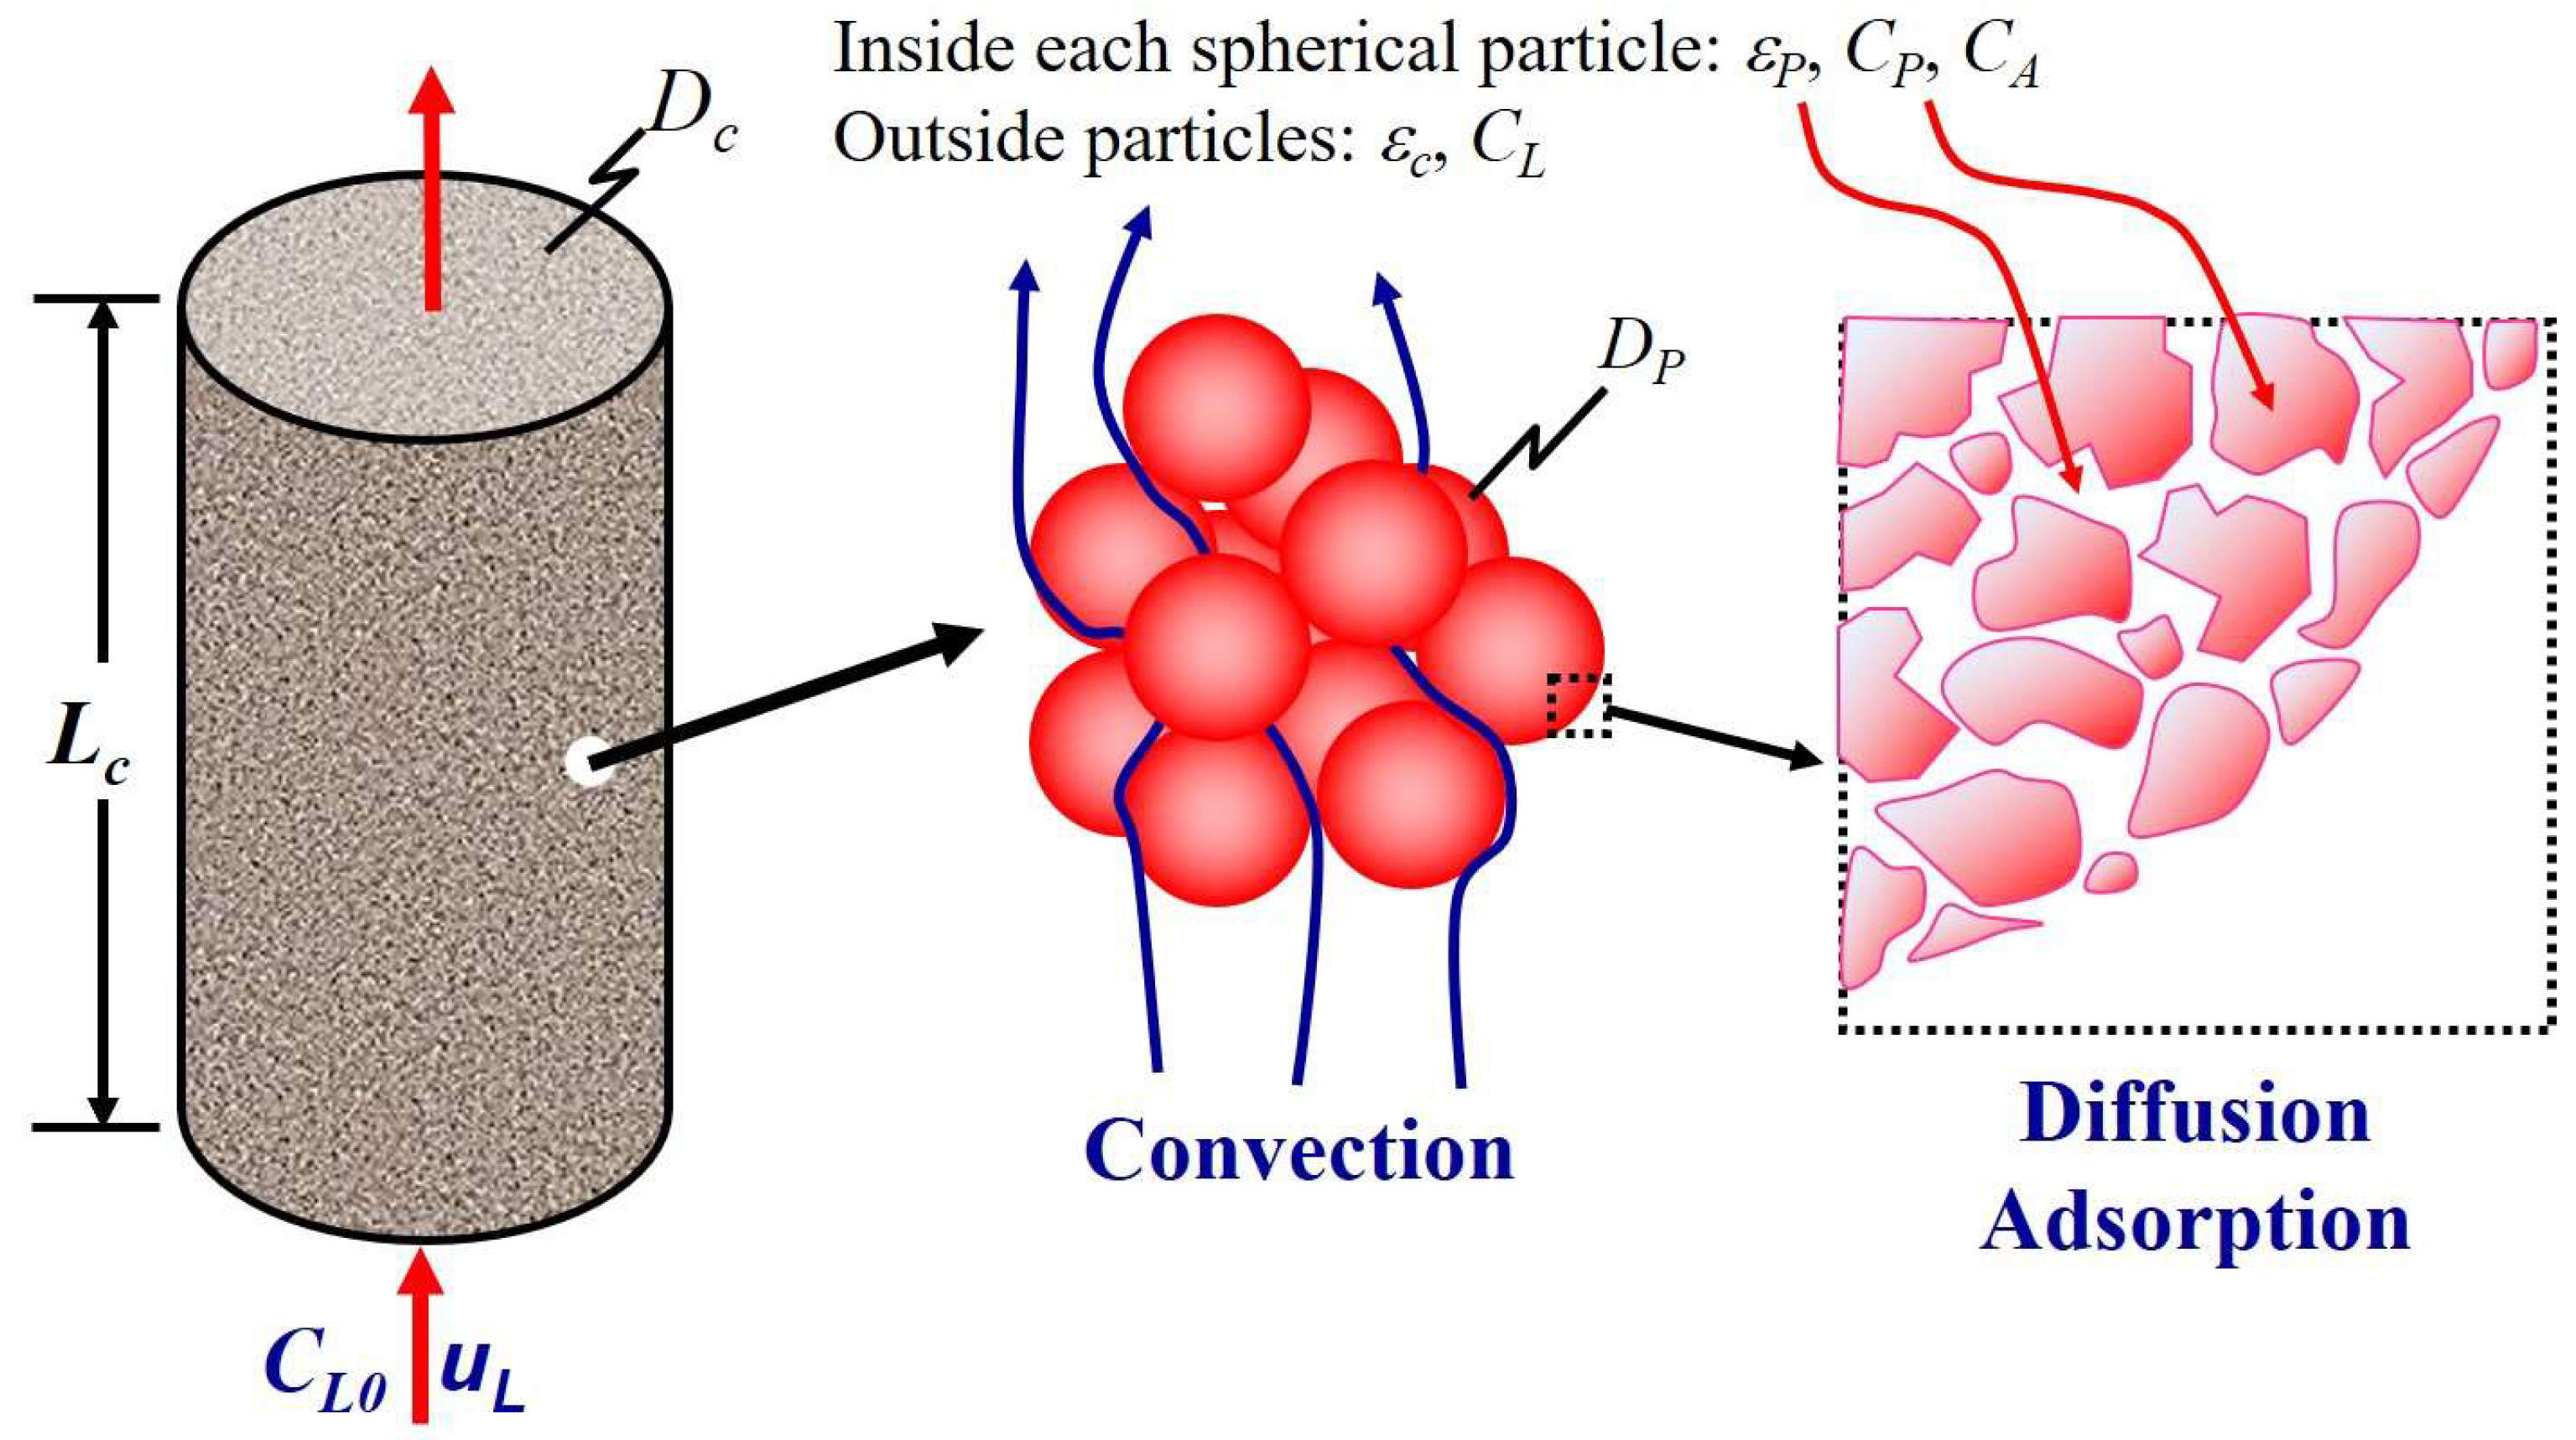
A packed bed of length and diameter is filled with porous solid adsorbent particles of uniform diameter , as illustrated schematically in Figure 2. An aqueous solution containing species A at an initial concentration enters the column at time zero with a volumetric flow rate F, corresponding to a constant superficial velocity . The solution flows through the interparticle void space of the bed, characterized by a void fraction , at an interstitial velocity toward the column outlet. As the solution traverses the bed, species A is transported convectively from the bulk fluid to the external surface of the adsorbent particles. It then diffuses in the intraparticle mobile phase, which occupies the particle void fraction , where adsorption progressively occurs. The concentration of species A in the intraparticle mobile phase is denoted as , while the concentration in the adsorbed phase is represented by . The density of an adsorbent particle is and the density of the solid matrix is , with the relationship .
Figure 2.
Illustration of the mass transfer of a species A of concentration traversing a packed bed filled with adsorbent porous spherical particles.
Simulation of breakthrough behaviour requires determining the outlet concentration of species A as a function of time. This can be achieved using models of varying complexity, depending on the level of detail needed to represent the underlying transport and adsorption phenomena [12]. In this study, five such models of different complexity were developed and evaluated; their formulations are presented in the following section.
3.2. Different Mathematical Models
3.2.1. Model 1
In Model 1, the temporal evolution of the concentration of species A within the bulk fluid phase occupying the bed void space is described by Equation (1). This formulation incorporates the effects of axial dispersion, convective flow through the column, and mass transfer from the bulk solution to the external surface of the adsorbent particles.
where is the mass transfer coefficient of species A, E is the axial diffusion coefficient, and a denotes the volumetric surface area of the packed bed. represents the concentration of species A in the mobile phase within the column, while is the hypothetical liquid-phase concentration that would be in equilibrium with the concentration of the adsorbed phase. Equation (1) serves as the foundational expression underlying all models evaluated in this investigation.
In Model 1, adsorption of species A is assumed to occur instantaneously upon contact with the external surface of the adsorbent particles, such that local equilibrium is immediately established between the surface concentration and the adjacent liquid-phase concentration. Under this assumption, the rate of adsorption is equal to the rate at which species A is convectively transferred from the bulk fluid to the particle surface. This relationship is expressed by Equation (2).
Equations (1) and (2) together form the system of differential equations defining Model 1. In the limiting case where the volumetric mass transfer coefficient becomes very large, the two equations can be reduced to a single governing equation, as mass-transfer resistance at the particle surface becomes negligible.
Equation (3) can be reformulated to express the governing relationship solely in terms of , as given in Equations (4) and (5).
The term is the slope of the adsorption isotherm equation evaluated at concentration .
3.2.2. Model 2
Model 2 shares the same fundamental assumptions as Model 1. The sole distinction lies in the formulation of the convective mass transfer term, which is expressed in terms of the adsorbed-phase concentration rather than the liquid-phase concentration . For example, when the adsorption equilibrium is described by a Freundlich isotherm, the relationship takes the form of Equation (6).
where K and n are the Freundlich isotherm constants for species A on the selected adsorbent. By isolating in Equation (6) and substituting the resulting inverse Freundlich expression into Equation (1), Equation (7) is obtained.
However, Equation (7) is often linearized with respect to , allowing the definition of an effective mass transfer coefficient , as shown in Equation (8). This formulation offers the advantage that the isotherm equation does not need to be inverted, unlike Model 1, to calculate .
3.2.3. Model 3
In Model 3, Equation (1) is used, as in Models 1 and 2, to describe the temporal and spatial evolution of the concentration of species A in the bulk liquid phase of the packed-column adsorber. Unlike the previous models, however, Model 3 does not assume instantaneous intraparticle diffusion or immediate attainment of adsorption equilibrium at the particle surface. Instead, species A diffuses into the intraparticle mobile phase, where it is progressively adsorbed at a finite rate proportional to an appropriate concentration driving force. The temporal change in the intraparticle mobile-phase concentration is governed by Equation (9), which accounts for both diffusive transport and adsorption kinetics within the porous spherical particles.
In Equation (9), is the effective diffusion coefficient of species A in the pores of the adsorbent particle, r is the radial location in the adsorbent particle, and is the adsorption kinetic rate constant.
Mass conservation requires that the amount of species A adsorbed onto the solid phase of the particles equals the amount depleted from the intraparticle mobile phase. This relationship is expressed in Equation (10).
3.2.4. Model 4
Model 4 is identical to Model 3, except that the adsorption of species A within the intraparticle mobile phase is assumed to occur instantaneously. This assumption corresponds to a very large adsorption kinetic rate constant, . To avoid the need for extremely small integration time steps when solving Equation (9) under such conditions, Equation (10) is used to reformulate Equation (9) into Equations (11)–(13), thereby incorporating the assumption of instantaneous adsorption within the particle pores.
where represents the slope of the adsorption isotherm evaluated at intraparticle mobile phase concentration of species A. When the adsorption equilibrium is described by the Freundlich isotherm given in Equation (6), this local derivative can be computed using Equation (14).
3.2.5. Model 5
For Models 1 to 4, the intraparticle diffusion was described using Fick’s second law, the classical framework for “ordinary” or Fickian diffusion, originally proposed in 1855 [13]. Although Fick’s first and second laws of diffusion provide macroscopic relationships for predicting concentration profiles of diffusing species, a microscopic interpretation of diffusion mechanisms did not emerge until 1905, when Einstein published his seminal work on molecular Brownian motion, later confirmed experimentally by Perrin [14]. Einstein’s analysis demonstrated that Fick’s second law can be derived from a stochastic description of particle motion. This stochastic perspective was subsequently generalized through the continuous-time random walk (CTRW) model, which assumes that the displacement x of an independently moving solute particle follows a probability density function λ(x), while the waiting time τ between successive jumps follows a probability density function w(τ) [15,16]. When λ(x) obeys a Gaussian probability density function and w(τ) is Poissonian, the CTRW framework yields Fick’s second law as the macroscopic limit. Both the CTRW formulation and Einstein’s Brownian motion model reveal the inherently Markovian nature of Fickian diffusion. In particular, Einstein showed that the mean-squared displacement of a particle or molecule satisfies <x2(t)> ~ 2Dt, where D is the diffusion coefficient [15].
However, numerous experimental studies [17,18,19,20] have demonstrated diffusion processes in which the mean-squared displacement does not scale linearly with time. Such deviations are referred to as anomalous or non-Markovian diffusion. In many cases, the mean-squared displacement follows the generalized form <x2(t)> ~ 2Dtα/Γ(1 + α). To capture this behaviour, the CTRW model replaces the Poisson waiting-time distribution with a power-law distribution, which possesses a heavy tail and allows for theoretically unbounded waiting times between particle jumps. When α lies between 0 and 1, the process is classified as subdiffusion, indicating slower transport than predicted by Fickian diffusion. Conversely, when α lies between 1 and 2, the process is termed superdiffusion, corresponding to faster-than-Fickian transport. These behaviours are often interpreted as arising from particle trapping or heterogeneous transport pathways within the medium. By incorporating power-law waiting-time statistics, the CTRW model leads to a macroscopic fractional diffusion equation, obtained by replacing classical derivatives with fractional-order operators, as shown in Equation (15). In this equation, C denotes the concentration of the adsorbate at position x and time t. D is the fractional diffusion coefficient, and is the fractional partial differential operator with respect to time whose order is 1 − γ. Physically, Equation (15) describes the temporal evolution of concentration under anomalous diffusion conditions.
In Model 5, diffusion within the bulk fluid of the packed bed adsorber is assumed to follow Fickian behaviour. Thus, axial dispersion in the column is described by Equation (1). In contrast, intraparticle diffusion is treated as anomalous diffusion [21,22]. As in previous models, adsorption can be represented as a finite-rate process, as in Model 3, or as an instantaneous process, as in Model 4. In the present study, Model 5 adopts the assumption of instantaneous adsorption. Anomalous diffusion within the adsorbent particles is modelled by assuming Brownian motion in which particle jump lengths follow a Gaussian probability density function, while waiting times between jumps follow a long-tailed distribution. Several mathematical frameworks exist to describe such non-Fickian transport. Among these, fractional partial differential equations (FPDEs) provide a robust macroscopic representation of anomalous diffusion and offer flexibility with respect to boundary conditions. Accordingly, to account for anomalous intraparticle diffusion under instantaneous adsorption, the diffusion term in Equation (13) is replaced by an FPDE, yielding Equation (16) [15,23,24,25]. The key modification involves substituting the classical integer-order time derivative with a fractional derivative of order 1 − γ.
In Equation (16), denotes the effective fractional diffusion coefficient within the adsorbent particle, with units of . The operator represents the Riemann–Liouville fractional derivative of order 1 − γ, defined over the interval from time 0 to time t. The formal definition of the Riemann–Liouville fractional derivative of a function f(x,t) is provided in Equation (17) [26].
In Equation (17), 1 − γ is the order of the fractional derivative, and Γ is the gamma function.
3.3. Initial and Boundary Conditions
To solve the system of partial differential equations associated with these models, appropriate initial and boundary conditions must be specified. At time t equal to zero, the concentrations of species A in the bulk liquid occupying the void of the column (), in the intraparticle mobile phase (), and in the adsorbed phase () are all assumed to be zero. At this same moment, the inlet concentration of the feed undergoes a step change from zero to at the column entrance (z = 0). The corresponding initial conditions are therefore expressed by Equations (18) and (19).
Because Equation (1) includes an axial dispersion term, two boundary conditions are required. In Equation (20) at the inlet of the column, Danckwerts showed that the physically correct boundary condition must balance the inlet convective flux with the dispersive flux at the boundary. At the outlet, the boundary condition is given by Equation (21).
Similarly, the second-order differential equation describing intraparticle diffusion (Equation (9)) requires two boundary conditions. At the particle surface, the convective mass transfer rate of species A from the bulk liquid to the particle must equal the diffusive flux of species A within the particles. This condition is expressed in Equation (22).
where denotes the concentration of species A in the liquid phase at the particle-solution interface. At the particle center, a symmetry condition prevails, as expressed in Equation (23).
4. Numerical Methods
Analytical solutions to the governing partial differential equations are often unavailable or exceedingly difficult to obtain, necessitating the use of numerical methods. In this study, a standard finite-difference framework was employed to solve the equations associated with Models 1–4. The axial-dispersion equation for the column was discretized using an explicit finite-difference scheme, whereas the intraparticle diffusion equation was solved using an implicit finite-difference method.
Model 5 was treated in a manner analogous to Model 4, with the exception that the fractional differential operator in Equation (16) requires specialized numerical handling. To approximate the Riemann–Liouville fractional derivative appearing in the intraparticle diffusion equation, the Grünwald–Letnikov formulation was adopted. Using this approach, and for a time step Δt, the fractional derivative of order (1 − γ) of a function f(t) is computed as a weighted sum of historical values, as expressed in Equations (24) and (25) [25,27].
where N is the number of past values of f(t) over which the weighted summation is performed, and ω(j) is the fractional weight. Γ is the gamma function. Therefore, Equation (24) can be interpreted as a weighted average of the function f(t) at different time intervals, which contains historical information of the function f(t).
Compared to the solution of classical (integer-order) partial differential equations, the Grünwald-Letnikov approximation for fractional partial differential equations is significantly more computationally demanding, as the number of terms in the summation grows with time. When N becomes large, the fractional derivative effectively represents the full memory of the function f(t) over its entire history. However, by invoking the short memory principle, the summation can be truncated to a reduced number of terms while still providing an accurate approximation of the Grünwald–Letnikov derivative [28]. This approach significantly decreases the computational effort required to solve the FPDE. The validity of the short-memory principle arises from the exponentially decaying weighting coefficients ω(j), which cause the fractional derivative to depend more strongly on the recent values of f(t) than on its distant past. Mathematically, the absolute weights are larger for small j (near-history contributions) and diminish as j increases (remote-history contributions). Applying this principle, Equation (24) can be approximated by Equation (26).
As shown in Equation (26), the full historical memory is approximated by retaining only the values of the function from to t. The parameter M, referred to as the moving-window length, represents the number of past function values included in the evaluation of the fractional derivative. In this study, a window length of 100 was employed, meaning that the most recent 100 concentration values, corresponding to the butanol concentrations at each axial position in the column and within the particles over the last 100 time steps, were used in the computation. The time step Δt was maintained constant at 0.01 s. Preliminary simulations were performed using progressively smaller time steps to ensure that the predicted breakthrough curves were insensitive to further refinement. The solution was considered converged when reducing Δt by a factor of two resulted in changes of less than 0.2% in the outlet concentration profile. This procedure ensured that the chosen time step provided stable and grid-independent results.
5. Results and Discussion
5.1. Experimental Results with Activated Carbon F-400
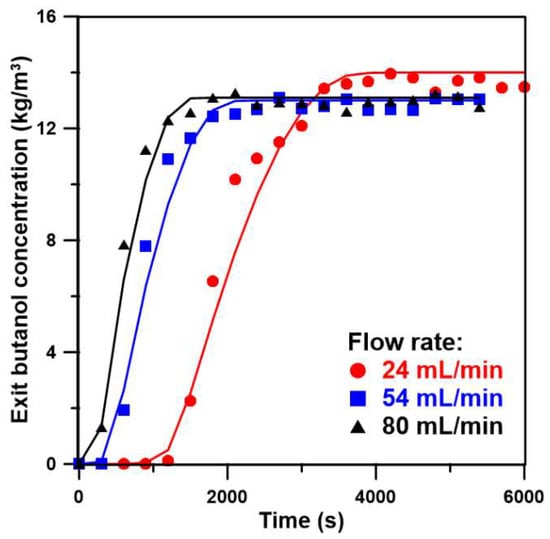
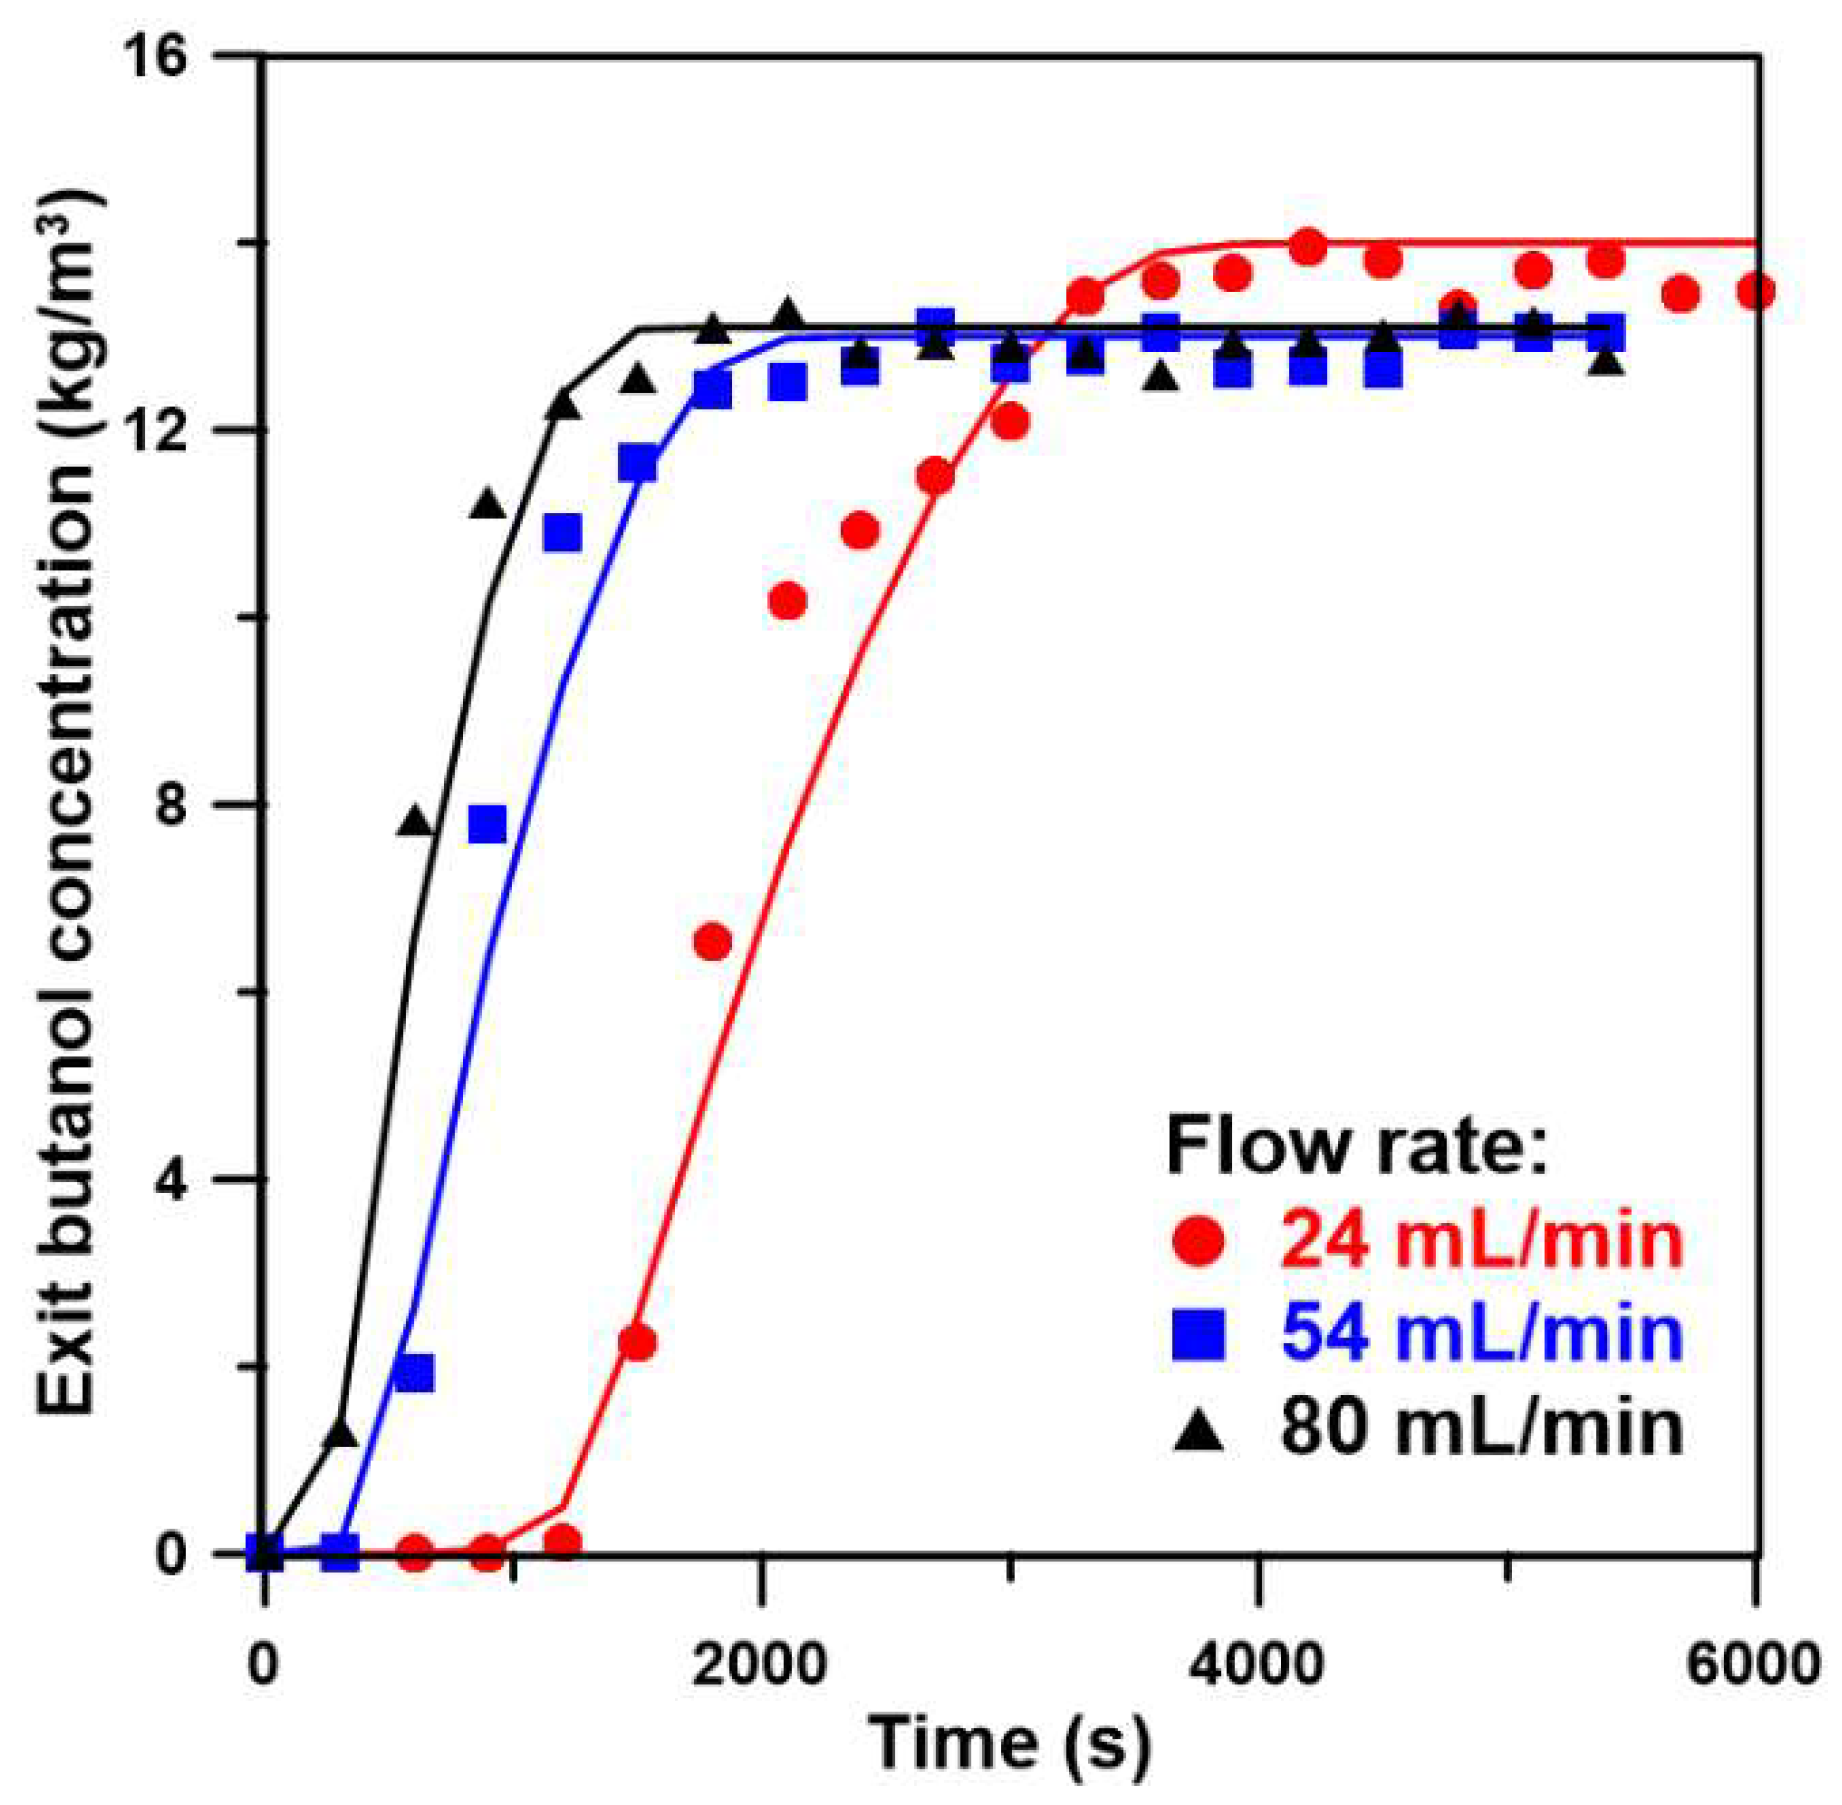
Isotherm and breakthrough experiments were conducted to characterize the adsorption of butanol from binary aqueous solutions onto activated carbon F-400. The isotherm data were fitted using the Freundlich model (Equation (6)) for butanol adsorption on activated carbon F-400 [29]. The resulting Freundlich parameters for this system are 0.189 kg butanol/kg adsorbent and 6.63 for K and n (R2 = 0.97), respectively. A series of breakthrough experiments using a butanol–water solution (13–14 g/L) were performed at three different inlet flow rates. The corresponding experimental and simulated breakthrough curves are shown in Figure 3. As expected, lower flow rates produced delayed breakthrough behaviour. Experimentally, the breakthrough profiles at all three flow rates exhibited similar shapes, characterized by a sharp rise in effluent concentration as the adsorption column approached saturation.
Figure 3.
Breakthrough curves of butanol with AC F-400 for three different flow rates. The continuous lines and the symbols correspond to the simulated (using Model 3) and experimental breakthrough curves, respectively.
Based on experimental isotherm and breakthrough data, the key model parameters, including , E, , , and γ, were estimated by minimizing the sum of squared errors (SSE) between model predictions and experimental measurements. The resulting parameter values for each model are summarized in Table 2 for the three volumetric flow rates of the butanol solution. Overall, the simulated concentration profiles accurately reproduce the observed butanol breakthrough behaviour. For clarity, only the breakthrough curves predicted by Model 3, together with the corresponding experimental data at the various flow rates, are shown in Figure 3. In retrospect, collecting additional samples during the early stages of the experiments would have provided more detailed breakthrough curves and further strengthened the model evaluation.
Table 2.
Model parameters yielding the minimum SSE for breakthrough butanol adsorption on activated carbon F-400 for the three different volumetric flow rates. Four other assessment metrics are also provided.
Models 1 and 2 are mathematically equivalent. Their only distinction lies in the formulation used to represent the convective mass-transfer coefficient. Consequently, both models yield identical SSE values. Because these two models include only two adjustable parameters, namely the liquid-phase mass-transfer coefficient and the axial dispersion E, their SSE values are larger than those of Models 3–5, in which intraparticle diffusion is explicitly accounted for. Analysis of all breakthrough experiments indicated that the axial dispersion coefficient E had a negligible influence on the predicted breakthrough behaviour and could therefore be omitted from the model formulation. This conclusion is further supported by the sensitivity analysis presented later for the second case study. The Péclet number (usLc/E) provides an additional criterion for assessing the relative importance of convection and axial dispersion in packed-bed systems. In adsorption columns, the Péclet number characterizes the balance between convective transport and axial dispersion, indicating whether the solute front advances sharply or spreads due to dispersive effects. For all conditions examined in Table 2, the Péclet number was very high, clearly demonstrating that convection dominated the transport process. As also shown in Table 2, accurately reproducing the butanol breakthrough curves required incorporating intraparticle diffusive resistance in addition to the external convective mass-transfer coefficient.
Comparison of the SSE values across all models shows that Models 3–5, which incorporate intraparticle diffusion, provide a substantially better description of the breakthrough curves than Models 1 and 2. These models successfully capture the progression of the butanol breakthrough profiles in the packed-bed adsorption column containing AC F-400. In addition to the SSE values, Table 2 reports the coefficient of determination (R2) and three commonly used information criteria, namely the Akaike Information Criterion (AIC), the corrected AIC (AICc), and the Bayesian Information Criterion (BIC), for each model. These likelihood-based criteria offer a rigorous framework for comparing competing models by balancing goodness of fit against model complexity, thereby mitigating the risk of overfitting. The equations used to compute these criteria, expressed in terms of SSE, are provided in Appendix B. Collectively, these additional evaluation metrics indicate that Models 3–5 perform equivalently in representing the breakthrough behaviour, although the fit quality is somewhat reduced for the lowest flow rate.
Model 3, which incorporates finite-rate adsorption within the adsorbent particles, yields substantially lower SSE values across all three flow rates when compared to Models 1 and 2. These results indicate that butanol adsorption on AC F-400 is governed by both external convective mass transfer and intraparticle diffusion. Model 5 yields SSE values and other evaluation metrics of the same order of magnitude as those obtained with Models 3 and 4, providing an alternative explanation for the observed slow adsorption behaviour. Despite its greater implementation complexity, Model 5 may offer additional insight into the underlying diffusion processes. The small values of the fractional derivative order associated with the minimum SSE, given in Table 2, suggest that intraparticle mass transfer is governed by subdiffusion rather than classical Fickian diffusion, while adsorption at the solid surface could be treated as instantaneous. These findings imply that the reduced mass-transfer rate within the particles arises not from slow adsorption kinetics but from a subdiffusive transport mechanism. When intraparticle diffusion proceeds more slowly than surface adsorption, the apparent adsorption rate becomes strongly influenced by the subdiffusive behaviour. Subdiffusion within the adsorbent particles may reflect the tortuous and highly interconnected pore structure, which can trap butanol molecules and prolong their residence time before subsequent jumps. This extended waiting time between molecular displacements is characteristic of subdiffusive transport. From a mathematical standpoint, the effects of slow mass transfer can be represented either by a reduced adsorption rate constant or a smaller fractional derivative order γ. In Model 5, the estimated value of γ is approximately 0.19, which is substantially lower than the value of unity associated with Fickian diffusion, further supporting the presence of subdiffusive transport within the adsorbent particles.
The model parameters listed in Table 2 were estimated independently for the three breakthrough experiments conducted at different flow rates. Different parameters, albeit close to each other, were obtained for the three experiments. Although the resulting parameter values were similar across experiments, certain parameters, specifically the intraparticle diffusion coefficient , the adsorption kinetic constant , and the fractional derivative order γ, in principle, should be independent of the bulk liquid flow rate. Conversely, the convective mass-transfer coefficient is expected to vary with flow conditions and can therefore be correlated with the bulk superficial velocity to generalize the model. To obtain a unified parameter set, a simultaneous optimization was performed in which the sum of squared errors for all three flow rates was minimized. In this approach, common values of , and γ were applied to all experiments, while was expressed as a function of the superficial velocity according to Equation (27).
The newly optimized parameter sets are reported in Table 3. Because the axial dispersion E was found to have a negligible influence on model performance, based on a sensitivity analysis, it was fixed at a constant value of 1.0 × 10⁻¹⁰ m2/s. As expected, the combined sum of squared errors (SSE) for the three breakthrough experiments is larger than the sum of the individually fitted SSE values reported in Table 2. However, the increase is approximately 50% for Models 1 and 2. The increase is substantially greater for Model 3 (about 120%) and Model 4 (50%). For Model 5, the total SSE increases by roughly 25%.
Table 3.
Model parameters giving the combined minimum SSE for the breakthrough curve of butanol adsorption on activated carbon F-400 for the three different flow rates. Four other assessment metrics are also provided.
Among the parameter sets in Table 3, Model 5 provides the best overall fit, yielding the smallest total SSE (29.1), whereas the remaining models exhibit higher values. The strong performance of Model 5, supported by the additional evaluation metrics, is attributed to its ability to capture the slow adsorption behaviour of butanol on AC F-400. The relatively small fractional derivative order (γ = 0.19) suggests that subdiffusive transport within the adsorbent plays a dominant role in compensating for the slow adsorption characteristics. In addition, it is noteworthy that the value of γ reported in Table 2 remained identical across the three independently optimized breakthrough experiments, thereby increasing confidence in both its estimated magnitude and its physical interpretation.
Model 3, which incorporates non-instantaneous adsorption, exhibits a larger total SSE of 43.3 when correlation in Equation (27) is applied. In contrast, when Equation (27) is not used, the individually fitted SSE values for Model 3 range from 4.39 to 8.27 (Table 2). Nonetheless, applying the correlation is justified, as it accounts for the dependence of the convective mass-transfer coefficient on the bulk liquid flow rate and enables the determination of unique values for the diffusion coefficient , the adsorption kinetic constant and the fractional derivative order γ. The parameter sets obtained through the combined optimization in Table 3, therefore, possess clearer physical significance than those in Table 2. The larger total SSE observed for Model 3 may indicate that the slow adsorption of butanol on AC F-400 arises primarily from subdiffusive transport within the particles rather than from intrinsically slow adsorption kinetics. Overall, Model 5, which incorporates subdiffusion, appears to provide the most accurate representation of butanol adsorption during breakthrough experiments. Nevertheless, Models 3 and 4 remain practical alternatives when the additional complexity and computational cost associated with fractional-order models are not warranted. Additional experiments, conducted with a higher sampling frequency, are needed to verify the hypotheses proposed on the basis of the current, limited dataset. Such experiments would also support the development of a more reliable correlation between the mass-transfer coefficient and the superficial velocity.
5.2. Experimental Results with Activated Carbon Norit ROW 0.8
Experimental isotherm and breakthrough data for the adsorption of butanol on activated carbon Norit Row 0.8, obtained from the literature [8], were analyzed using the same methodology applied to AC F-400. The isotherm data were fitted to the Freundlich model (Equation (6)), yielding parameters K = 0.1932 and n = 3.721 (R2 = 0.97). Using this isotherm representation, the optimal model parameters for each of the five adsorption models were subsequently determined by minimizing the sum of squared errors between the experimental and simulated breakthrough curves. The values of the parameters associated with the five breakthrough models are presented in Table 4. Table 4 also provides the SSE values along with the coefficient of determination (R2) and the three Akaike information criteria.
Table 4.
Model parameters determined by the method of least squares to minimize the SSE for experiments with activated carbon Norit Row 0.8. Four other assessment metrics are also provided.
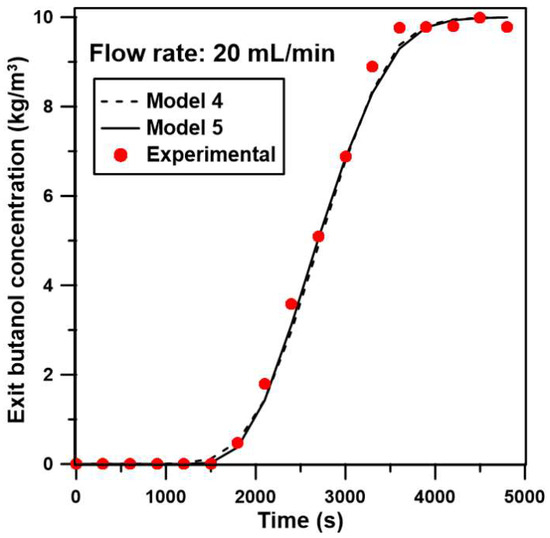
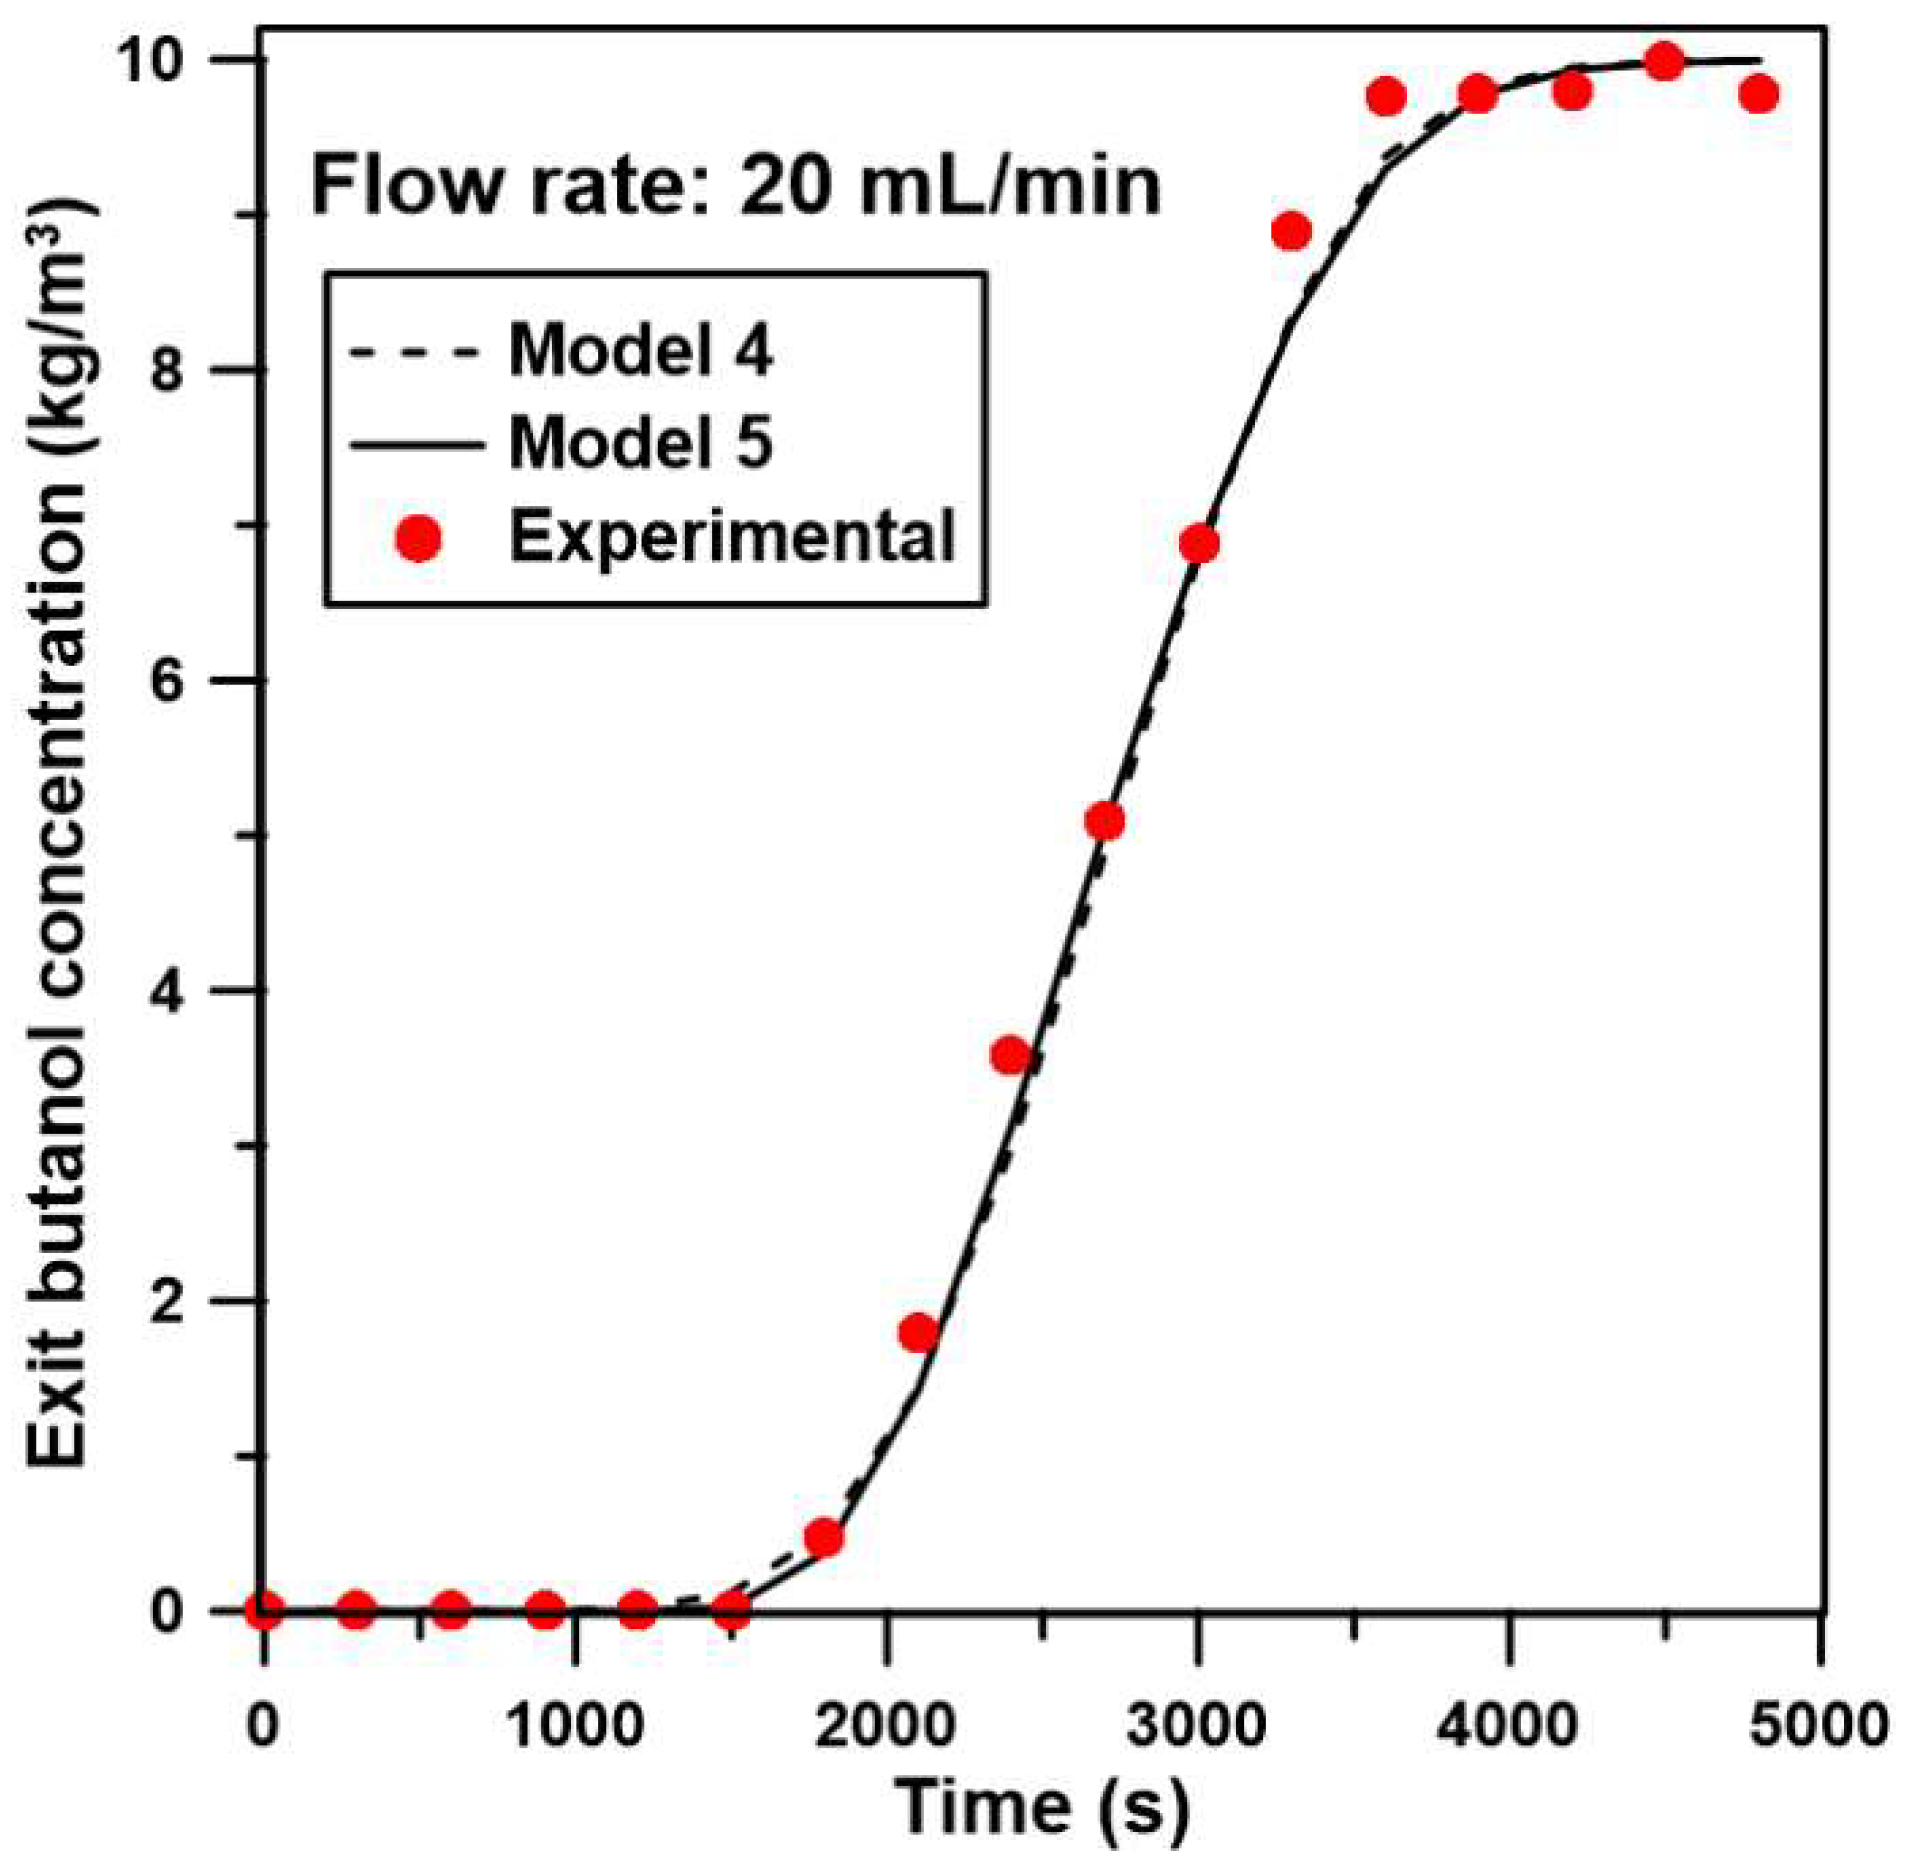
Using the model parameters that minimized the SSE for each formulation, all simulated breakthrough curves provided an excellent representation of the experimental data reported in the literature. Figure 4 compares the experimental breakthrough curves with those simulated using Models 4 and 5. The predicted butanol concentration profiles from both models closely match the experimental trends, and the two models yield nearly identical breakthrough curves. Minor deviations between the simulated and experimental results occur only as the adsorption column approaches saturation. Notably, when comparing the results in Figure 3 for butanol adsorption on AC F-400 with those in Figure 4, the agreement near the saturation region is substantially improved.
Figure 4.
Experimental and simulated breakthrough curves for the adsorption of butanol on AC Norit Row 0.8. Lines and symbols represent the predicted breakthrough curves with Models 4 and 5 and the experimental breakthrough curve, respectively.
Table 4 presents the model parameters for the five models. Consistent with the results obtained for AC F-400, Models 1 and 2 yield identical SSE values, which are substantially larger than those of the other three models. As these two models effectively possess only one significant adjustable parameter (), they are not suitable for accurately predicting the breakthrough behaviour of this system. For AC F-400, Model 3, which assumes non-instantaneous adsorption, provided a good fit to the experimental breakthrough curves. In contrast, for butanol adsorption on AC Norit ROW 0.8, Model 3 produces SSE values nearly an order of magnitude larger than those of Models 4 and 5. This outcome indicates that non-instantaneous adsorption does not govern the mass-transfer behaviour in this system and that models assuming instantaneous adsorption offer a more appropriate representation. Although increasing the adsorption kinetic constant in Model 3 slightly reduces the SSE, the use of very large values is computationally impractical because it necessitates extremely small integration time steps and consequently leads to prohibitively long computation times. Therefore, assuming instantaneous adsorption is both physically reasonable and computationally advantageous for this system.
Models 4 and 5 were formulated under the assumption of instantaneous adsorption. Their relatively small SSE values are consistent with the excellent agreement between the simulated and experimental breakthrough curves shown in Figure 4. The primary distinction between these two models lies in the description of intraparticle diffusion: Model 4 assumes classical Fickian diffusion, whereas Model 5 allows for the possibility of anomalous (fractional-order) diffusion. For Model 5, the optimal fractional derivative order was γ = 0.51. This result indicates that diffusion in AC Norit Row 0.8 is effectively more Fickian than for ACF-400. Since Models 4 and 5 are nearly identical, Model 4 is recommended as the most appropriate representation for this system, given its lower level of complexity. This recommendation is also supported by the relative values of the Akaike information criteria.
In Model 5, the fractional derivative order γ serves as an empirical indicator of the degree of anomalous (non-Fickian) mass transport within the packed bed. Although γ does not correspond to a single measurable physical property, it is influenced by structural features of the adsorbent that affect diffusion pathways, including pore size distribution, pore connectivity, and tortuosity. The lower value obtained for AC F-400 (γ = 0.19) suggests a stronger deviation from classical Fickian behaviour, consistent with its smaller micropore volume and more restrictive pore network. Conversely, the higher value for Norit ROW 0.8 (γ = 0.51) indicates transport behaviour closer to Fickian diffusion, which aligns with its larger and more accessible micropore structure. These results support the interpretation that the fractional-order model captures differences in internal mass-transfer resistance arising from the distinct pore architectures of the two activated carbons.
The micropore volumes of AC F-400 and Norit ROW 0.8 differ substantially (0.43 and 1.04 cm3/g, respectively), and this difference contributes to the higher adsorption capacity observed for Norit ROW 0.8. Because adsorption of small organic molecules such as butanol occurs predominantly through micropore filling, a larger micropore volume generally enhances the total uptake. However, micropore volume alone does not fully determine adsorption performance. Differences in pore size distribution, particularly the proportion of ultramicropores versus wider micropores, as well as variations in surface chemistry, also influence the affinity and accessibility of adsorption sites. Furthermore, mesoporosity and particle morphology affect mass-transfer resistance during breakthrough. Thus, while the larger micropore volume of Norit ROW 0.8 is consistent with its higher capacity, the relationship is not strictly proportional, indicating that multiple structural and chemical factors contribute to the observed adsorption behaviour. More experiments with different types of adsorbents are required to confirm these hypotheses.
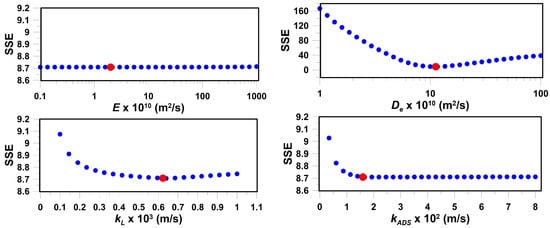
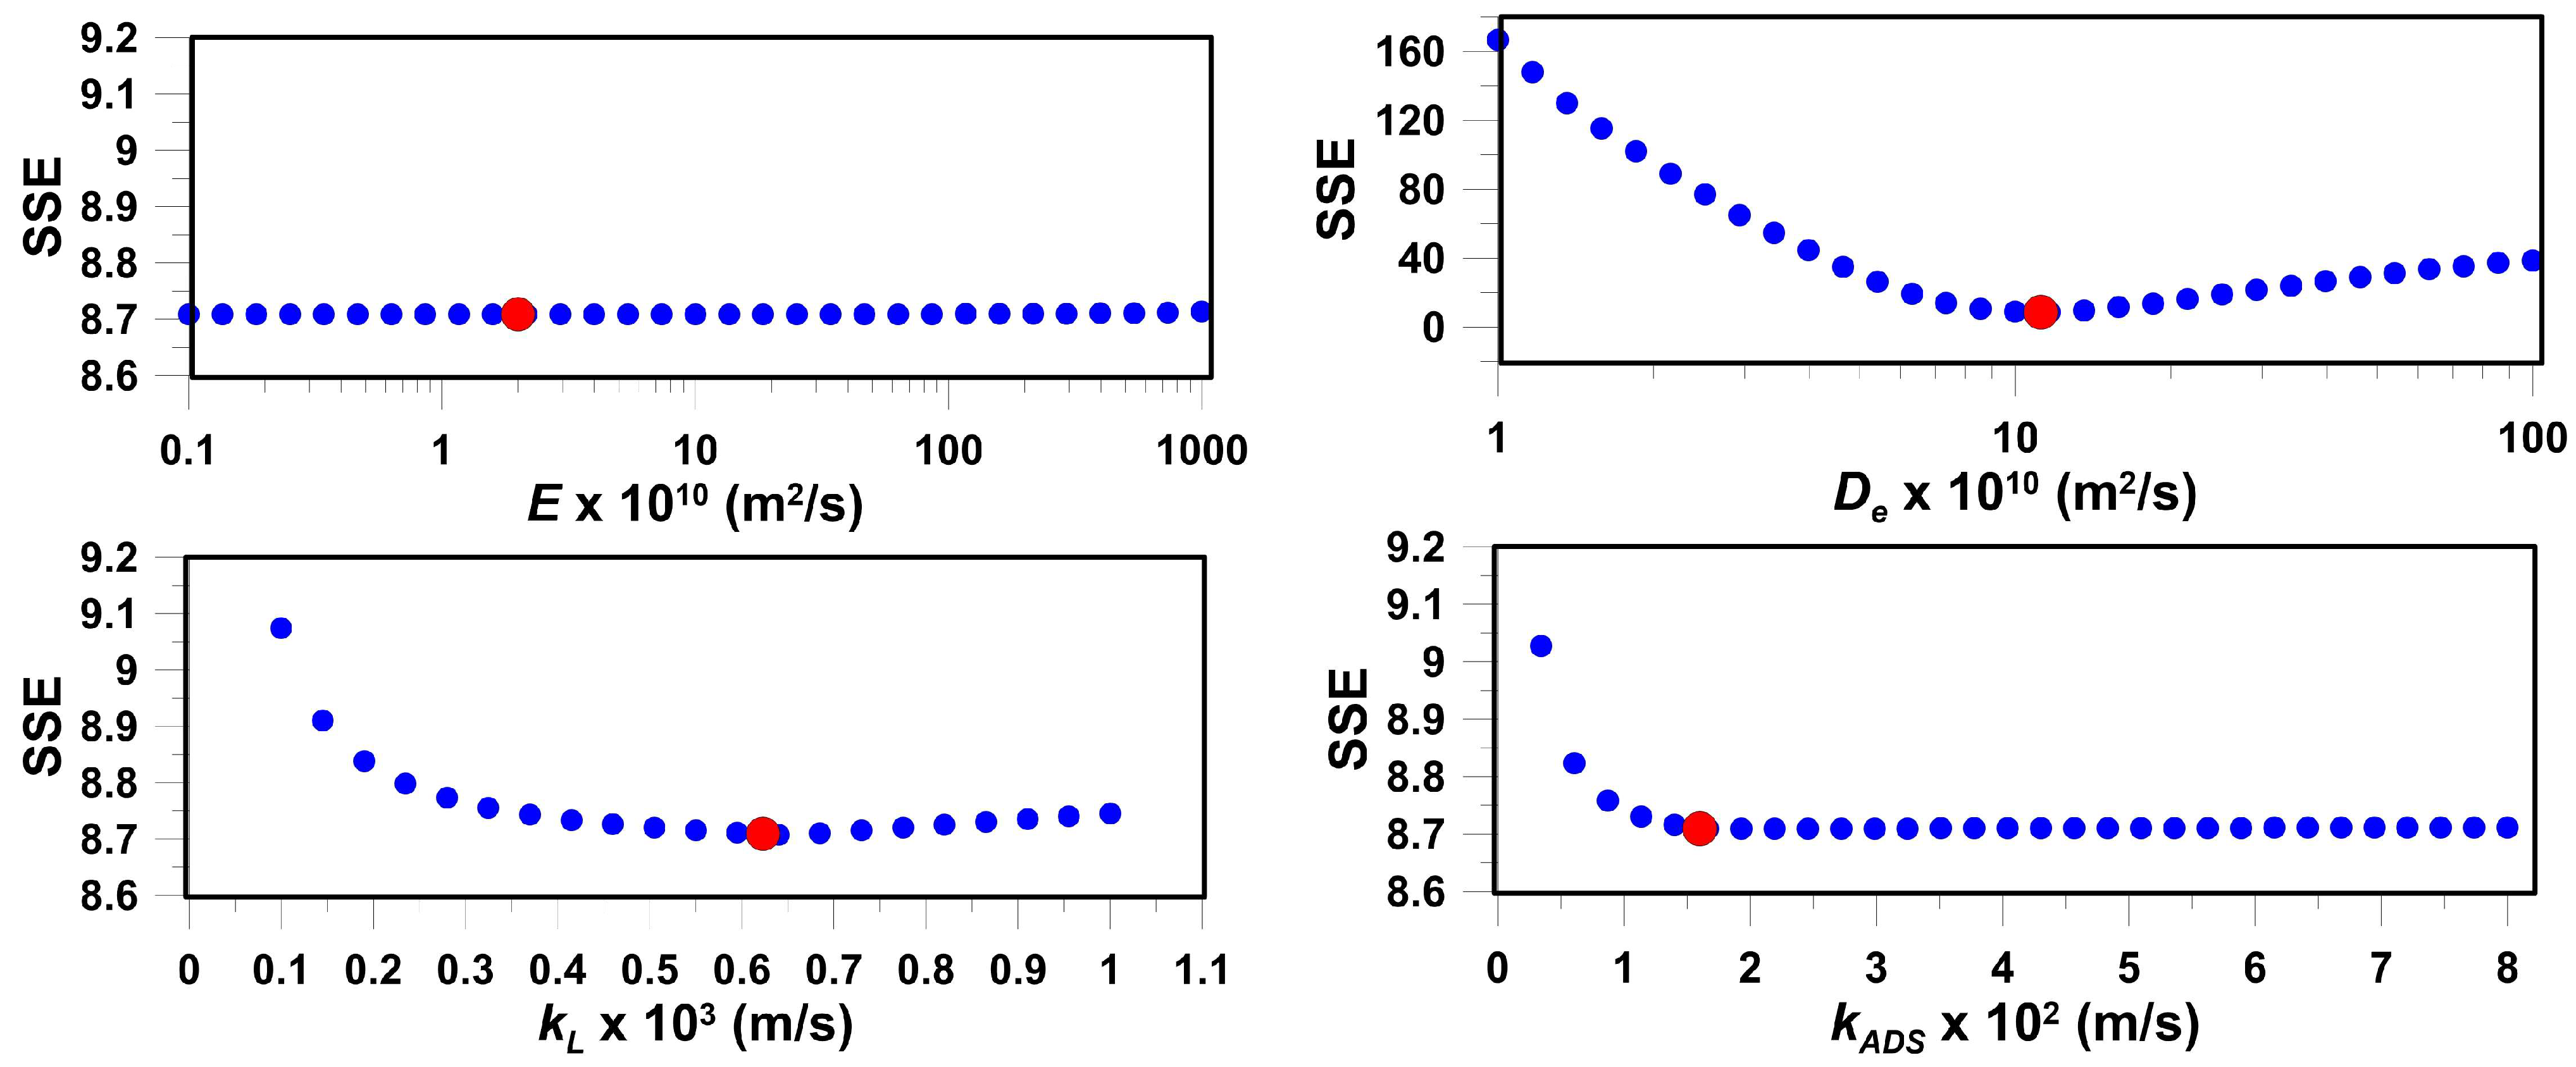
To assess the influence of the fitted parameters on each model’s ability to reproduce the breakthrough curves, a local sensitivity analysis was performed in the vicinity of the optimal parameter set. Figure 5 illustrates the dependence of the SSE for Model 3 on the convective mass-transfer coefficient kL, the axial dispersion E, the intraparticle diffusion coefficient , and the adsorption kinetic constant . The red symbols in Figure 5 are the optimal values, as reported in Table 4 for Model 3. The influence of on the SSE is relatively small over a broad range of values, possibly suggesting that the intraparticle diffusion of butanol is the dominant controlling mechanism. Indeed, as increases, the SSE initially decreases rapidly and subsequently rises smoothly, indicating an optimal intraparticle diffusion coefficient of approximately 1.12 × 10⁻⁹ m2/s. The minimum SSE value of 8.71 shown in Figure 5 corresponds to a value of of 6.23 × 10⁻⁴ m/s. The upper-left panel of Figure 5 shows the impact of the axial diffusion coefficient E on the SSE. Varying the axial dispersion coefficient over four orders produces no measurable changes in SSE, clearly demonstrating that the axial dispersion can be omitted from the model without a loss of accuracy. Finally, the lower-right panel of Figure 5 presents the sensitivity of the SSE to the adsorption kinetic constant . Its influence is comparatively weak relative to that of . As increases, the SSE decreases rapidly before reaching a pseudo-plateau with only a slight downward slope.
Figure 5.
Sensitivity of the sum of squared errors (SSE) to each of the four parameters in Model 3 for AC Norit Row 0.8. Each parameter was varied independently while the remaining three were held at their converged values. The converged parameter values are marked with red symbols.
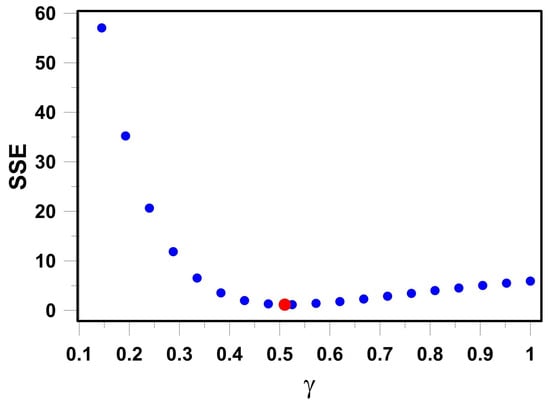
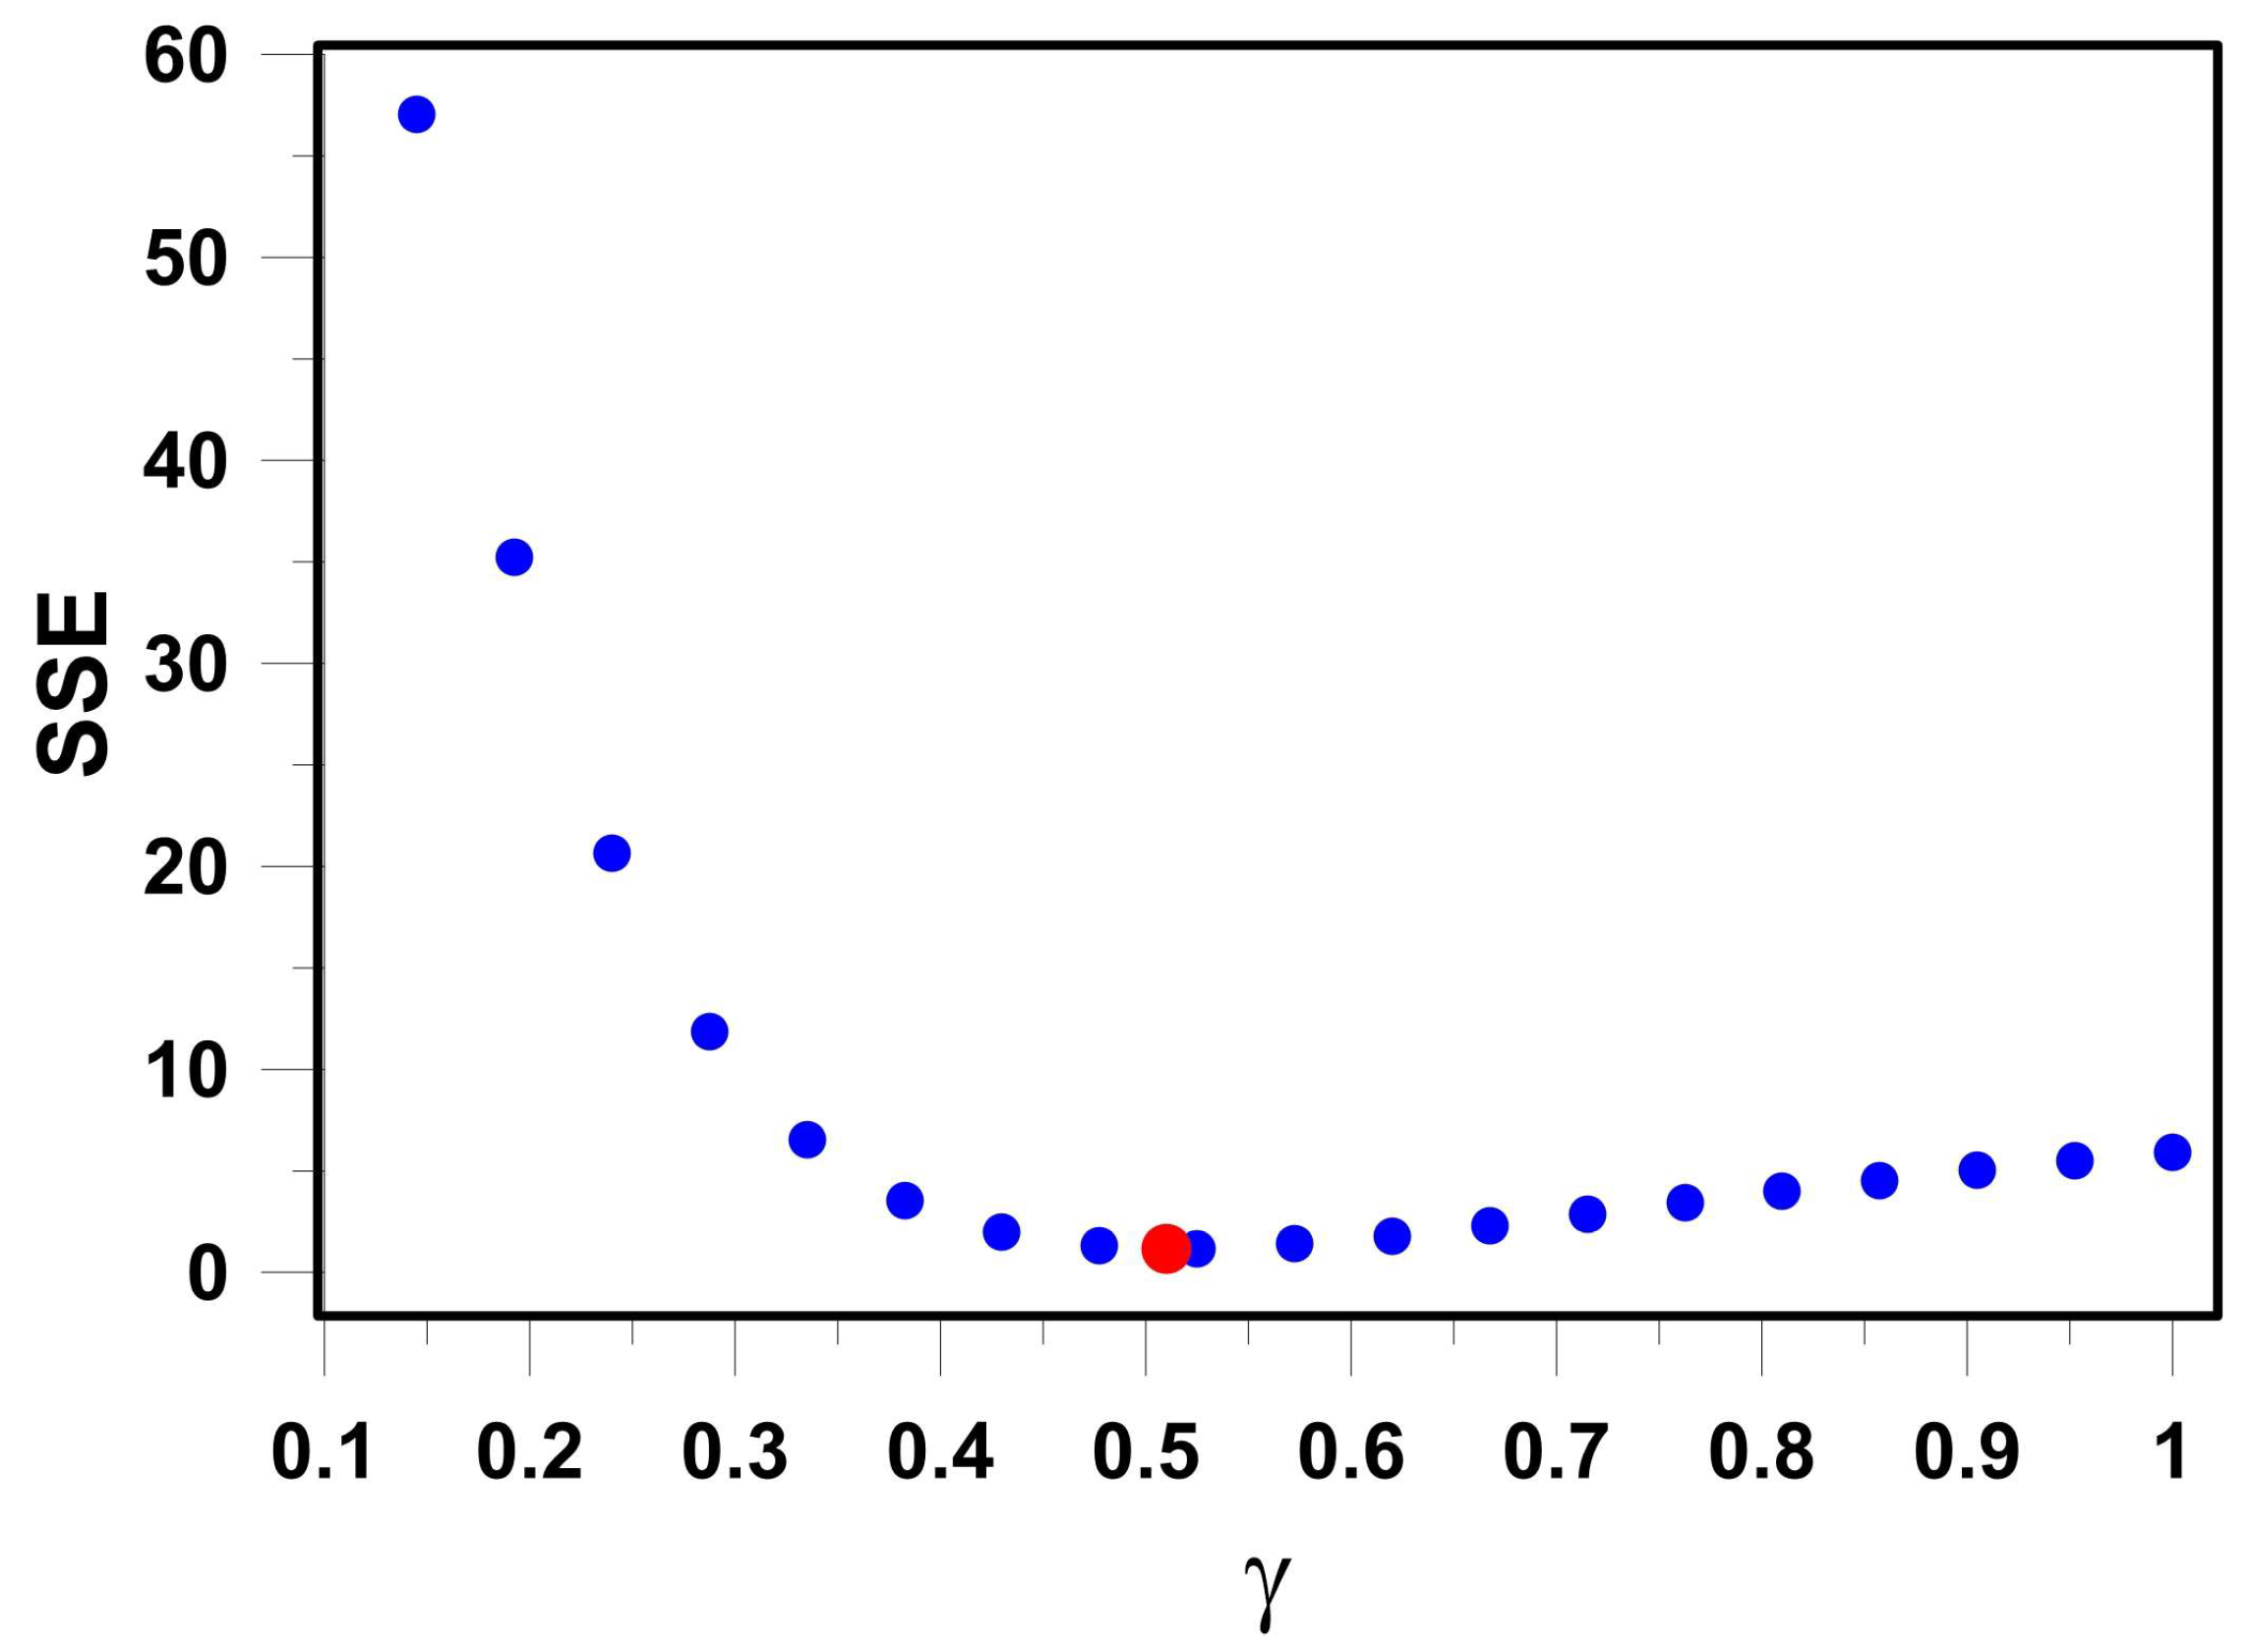
Figure 6 illustrates the variation in the SSE for Model 5 as the fractional order γ is perturbed around its optimal value. As γ increases, the SSE initially decreases sharply and then rises more gradually, indicating an optimal value of approximately 0.51. The pronounced change in SSE in the vicinity of this optimum enhances confidence in the robustness of the estimated fractional order. The next phase of this work will involve gathering additional data from the literature on a broader range of adsorbents, as well as conducting new breakthrough adsorption experiments, to further elucidate the physical significance of a fractional order diffusion.
Figure 6.
Sensitivity of the sum of squared errors (SSE) to the fractional order parameter (γ) in Model 5 for AC Norit Row 0.8. The other three parameters were held at their converged values (Table 4). The converged value of γ is marked with a red symbol.
6. Conclusions
Experimental data for the adsorption of butanol on two activated carbon adsorbents, F-400 and Norit Row 0.8, were obtained from previous laboratory studies and from the literature. The equilibrium data were fitted using the Freundlich isotherm model, which was subsequently incorporated into the breakthrough-curve simulations. Five transport models were developed to predict the temporal and spatial evolution of butanol concentration within the packed-bed adsorption column. For both adsorption systems, accurate prediction of the breakthrough curves required explicit consideration of intraparticle diffusion. For butanol adsorption on activated carbon F-400, a fractional-order diffusion model with instantaneous adsorption provided the best representation of the experimental data. In contrast, for adsorption on Norit Row 0.8, an integer-order diffusion model with instantaneous adsorption was sufficient. Given the substantial computational cost associated with fractional-order diffusion models and the absence of any improvement in fitting performance, the use of a fractional derivative for the Norit Row 0.8 system was not justified. Although several hypotheses regarding the physical significance of the fractional order were proposed, further investigation is needed to validate or refute these interpretations.
Supplementary Materials
The following supporting information can be downloaded at: https://www.mdpi.com/article/10.3390/separations13030100/s1.
Author Contributions
Conceptualization, X.S. and J.T.; methodology, X.S. and J.T.; software, X.S. and J.T.; validation, X.S. and J.T.; formal analysis, X.S. and J.T.; investigation, X.S. and J.T.; resources, X.S. and J.T.; data curation, X.S. and J.T.; writing—original draft preparation, X.S.; writing—review and editing, J.T.; visualization, X.S. and J.T.; supervision, J.T.; project administration, J.T.; funding acquisition, J.T. All authors have read and agreed to the published version of the manuscript.
Funding
The authors acknowledge the Natural Sciences and Engineering Research Council of Canada (NSERC) for funding this research (Grant: RGPIN-2018-04433).
Data Availability Statement
The original contributions presented in this study are included in the article/Supplementary Material. Dataset available on request from the authors.
Conflicts of Interest
The authors declare no conflict of interest.
Appendix A. Flow Rate Reconciliation for Breakthrough Experiments
To reduce uncertainty in the solution’s volumetric flow rate (F) for each breakthrough experiment, three independent verification methods were employed. First, the peristaltic pump was calibrated before each experiment by measuring the volume of solution collected over a defined time interval, thereby ensuring delivery of the target flow rate. Second, the same calibration procedure was repeated at the conclusion of each breakthrough experiment to obtain an independent post-experiment measurement of F. Third, an additional estimate of the volumetric flow rate was obtained from the predicted total amount of butanol adsorbed in the column during the breakthrough run. The total amount of adsorbate removed from the fluid phase, , was determined by performing a mass balance on the breakthrough curve and integrating the difference between the inlet and outlet concentrations until saturation was reached at time . This quantity represents the working adsorption capacity of the material under dynamic flow conditions. The mass of species A captured by the adsorbent during the experiment is given by Equation (A1).
The corresponding equilibrium adsorbed-phase concentration () was calculated by dividing the mass of species A adsorbed by the mass of adsorbent packed in the column, as expressed in Equation (A2).
Because the equilibrium concentration must lie on the adsorption isotherm, it is possible to infer the solution volumetric flow rate F that would yield the observed amount of species A adsorbed. This estimate is provided by Equation (A3).
In Equation (A3), corresponds to the equilibrium adsorbed-phase concentration associated with the feed solution concentration according to the isotherm. Thus, Equation (A3) offers an additional, independent estimate of the volumetric flow rate. In most experiments, the three estimates were essentially the same. In all cases, an average value of the three measurements was used.
Appendix B. Model Selection Based on Akaike Information Criterion
Information criteria, including the Akaike Information Criterion (AIC), the Corrected Akaike Information Criterion (AICc), and the Bayesian Information Criterion (BIC), are widely used to discriminate among competing predictive models. These criteria provide a quantitative balance between goodness of fit, reflecting how well the model represents the observed data, and model complexity, typically measured by the number of estimated parameters. When models are fitted using least-squares estimation under the assumption of independent and identically distributed Gaussian errors, the likelihood function can be expressed directly in terms of the residual sum of squares of the errors (SSE). This relationship yields the commonly used SSE-based formulations of AIC, AICc, and BIC [30,31].
The AIC originates from information-theoretic principles and provides an estimate of the expected Kullback–Leibler divergence between a candidate model and the unknown data-generating process. In practice, AIC rewards goodness of fit while imposing a penalty proportional to the number of estimated parameters, thereby discouraging over-parameterization. Its mathematical form is presented in Equation (A4).
where n denotes the number of data points, k the number of estimated parameters, and SSE is the residual sum of squares of the errors. The first term quantifies the goodness of fit, whereas the second term penalizes model complexity.
For datasets with a limited sample size, the corrected AIC (AICc) is recommended because it applies a stronger penalty for additional parameters, as shown in Equation (A5). When n is sufficiently large, the correction term becomes negligible, and AICc converges to AIC.
BIC is derived from Bayesian probability theory and penalizes complexity more strongly. As shown in Equation (A6), the additional penalty term increases more rapidly with the number of parameters and sample size, leading BIC to favour more parsimonious models.
In practice, the relative differences among information-criterion values are what determine model preference [30].
References
- Ran, Y.A.; Sharma, S.; Balestra, S.R.G.; Li, Z.; Calero, S.; Vlugt, T.J.H.; Snurr, R.Q.; Dubbeldam, D. RASPA3: A Monte Carlo code for computing adsorption and diffusion in nanoporous materials and thermodynamics properties of fluids. J. Chem. Phys. 2024, 161, 114106. [Google Scholar] [CrossRef] [Scilit]
- Liu, Z.; Li, W.; Li, S. High-efficiency prediction of water adsorption performance of porous adsorbents by lattice grand canonical Monte Carlo molecular simulation. RSC Appl. Interfaces 2025, 2, 230–242. [Google Scholar] [CrossRef] [Scilit]
- Morse, G.; Jones, R.; Thibault, J.; Tezel, F.H. Neural network modelling of adsorption isotherms. Adsorption 2011, 17, 303–309. [Google Scholar] [CrossRef] [Scilit]
- Petkovska, M. Discrimination between adsorption isotherm models based on nonlinear frequency response results. Adsorption 2014, 20, 385–395. [Google Scholar] [CrossRef] [Scilit]
- Wilkins, N.S.; Rajendran, A.; Farooq, S. Dynamic column breakthrough experiments for measurement of adsorption equilibrium and kinetics. Adsorption 2021, 27, 397–422. [Google Scholar] [CrossRef] [Scilit]
- Zhang, Z.; Shu, Y. An optimized method for solution of fixed-bed adsorption model considering particle-size distribution via method of characteristics. Chem. Eng. J. Adv. 2025, 24, 100926. [Google Scholar] [CrossRef] [Scilit]
- Wiechert, W. Modeling and simulation: Tools for metabolic engineering. J. Biotechnol. 2002, 94, 37–63. [Google Scholar] [CrossRef] [Scilit]
- Xue, C.; Liu, F.; Xu, M.; Tang, I.-C.; Zhao, J.; Bai, F.; Yang, S.-T. Butanol production in acetone-butanol-ethanol fermentation with in situ product recovery by adsorption. Bioresour. Technol. 2016, 219, 158–168. [Google Scholar] [CrossRef] [Scilit]
- Mauguet, M.C.; Montillet, A.; Comiti, J. Macrostructural characterization of granular activated carbon beds. J. Mater. Sci. 2005, 40, 747–755. [Google Scholar] [CrossRef] [Scilit]
- Abdehagh, N.; Gurnani, P.; Tezel, F.H.; Thibault, J. Adsorptive separation and recovery of biobutanol from ABE model solutions. Adsorpt. J. Int. Adsorpt. Soc. 2015, 21, 185–194. [Google Scholar] [CrossRef] [Scilit]
- Abdehagh, N.; Tezel, F.H.; Thibault, J. Separation techniques in butanol production: Challenges and developments. Biomass Bioenergy 2014, 60, 222–246. [Google Scholar] [CrossRef] [Scilit]
- Sharma, S.; Balestra, S.R.G.; Baur, R.; Agarwal, U.; Zuidema, E.; Rigutto, M.S.; Calero, S.; Vlugt, T.J.H.; Dubbeldam, D. RUPTURA: Simulation code for breakthrough, ideal adsorption solution theory. Mol. Simul. 2023, 49, 893–953. [Google Scholar] [CrossRef] [Scilit]
- Sokolov, I.M. Models of anomalous diffusion in crowded environments. Soft Matter. 2012, 8, 9043–9052. [Google Scholar] [CrossRef] [Scilit]
- Einstein, A. Investigations on the Theory of the Brownian Movement; Courier Corporation: Chelmsford, MA, USA, 1956. [Google Scholar]
- Metzler, R.; Klafter, J. The random walk’s guide to anomalous diffusion: A fractional dynamics approach. Phys. Rep. 2000, 339, 1–77. [Google Scholar] [CrossRef] [Scilit]
- Kenkre, V.M.; Montroll, E.W.; Shlesinger, M.F. Generalized master equations for continuous-time random walks. J. Stat. Phys. 1973, 9, 45–50. [Google Scholar] [CrossRef] [Scilit]
- Banks, D.S.; Fradin, C. Anomalous Diffusion of Proteins Due to Molecular Crowding. Biophys. J. 2005, 89, 2960–2971. [Google Scholar] [CrossRef] [Scilit]
- Berkowitz, B.; Scher, H.; Silliman, S.E. Anomalous transport in laboratory-scale, heterogeneous porous media. Water Resour. Res. 2000, 36, 149–158. [Google Scholar] [CrossRef] [Scilit]
- Havlin, S.; Movshovitz, D.; Trus, B.; Weiss, G.H. Probability densities for the displacement of random walks on percolation clusters. J. Phys. Math. Gen. 1985, 18, L719. [Google Scholar] [CrossRef] [Scilit]
- Jobic, H.; Méthivier, A.; Ehlers, G.; Farago, B.; Haeussler, W. Accelerated Diffusion of Long-Chain Alkanes between Nanosized Cavities. Angew. Chem. Int. Ed. 2004, 43, 364–366. [Google Scholar] [CrossRef] [Scilit]
- Baumann, G.; Stenger, F. Fractional adsorption diffusion. Fract. Calc. Appl. Anal. 2013, 16, 737–764. [Google Scholar] [CrossRef] [Scilit]
- Jiang, H.; Cheng, Y.; Yuan, L.; An, F.; Jin, K. A fractal theory-based fractional diffusion model used for the fast desorption process of methane in coal. Chaos Interdiscip. J. Nonlinear Sci. 2013, 23, 033111. [Google Scholar] [CrossRef] [Scilit] [PubMed]
- Bakalis, E.; Zerbetto, F. Adsorption Kinetics: Classical, Fractal, or Fractional? Langmuir 2025, 41, 19834–19844. [Google Scholar] [CrossRef] [Scilit] [PubMed]
- Bazhlekov, I.; Bazhlekova, E. Adsorption–Desorption at Anomalous Diffusion: Fractional Calculus Approach. Fractal Fract. 2025, 9, 408. [Google Scholar] [CrossRef] [Scilit]
- Chen, C.-M.; Liu, F.; Turner, I.; Anh, V. A Fourier method for the fractional diffusion equation describing sub-diffusion. J. Comput. Phys. 2007, 227, 886–897. [Google Scholar] [CrossRef] [Scilit]
- Luchko, Y. On a generic fractional derivative associated with the Riemann–Liouville fractional integral. Axioms 2024, 13, 604. [Google Scholar] [CrossRef] [Scilit]
- Li, C.; Zeng, F. Numerical Methods for Fractional Calculus; CRC Press: Boca Raton, FL, USA, 2015. [Google Scholar]
- Podlubny, I. Fractional Differential Equations: An Introduction to Fractional Derivatives, Fractional Differential Equations, to Methods of Their Solution and Some of Their Applications; Elsevier: Amsterdam, The Netherlands, 1998. [Google Scholar]
- Abdehagh, N. Improvements in Biobutanol Production: Separation and Recovery by Adsorption. Ph.D. Thesis, University of Ottawa, Ottawa, ON, Canada, 2016. Available online: http://ruor.uottawa.ca/handle/10393/34406 (accessed on 15 November 2025).
- Sutherland, S.; Hare, D.; Johnson, P.J.; Linden, D.W.; Montgomery, R.A.; Droge, E. Practical advice on variable selection and reporting using Akaike information criterion. Proc. Royal Soc. B 2023, 290, 20231261. [Google Scholar] [CrossRef] [Scilit]
- Burnham, K.P.; Anderson, D.R. Model Selection and Multimodel Inference: A Practical Information-Theoretic Approach, 2nd ed.; Springer: New York, NY, USA, 2002. [Google Scholar]

Disclaimer/Publisher’s Note: The statements, opinions and data contained in all publications are solely those of the individual author(s) and contributor(s) and not of MDPI and/or the editor(s). MDPI and/or the editor(s) disclaim responsibility for any injury to people or property resulting from any ideas, methods, instructions or products referred to in the content. |
© 2026 by the authors. Licensee MDPI, Basel, Switzerland. This article is an open access article distributed under the terms and conditions of the Creative Commons Attribution (CC BY) license.