1. Introduction
Rare Earth Elements (REEs), as one of China’s critical strategic mineral resources, play irreplaceable roles in fields such as new materials, renewable energy, advanced manufacturing, and national defense industries [
1,
2]. With the continuously increasing global demand for rare earth resources in recent years and the growing depletion of high-grade, easily exploitable rare earth deposits, the efficient recovery of rare earths from associated resources has become a crucial direction for the development and utilization of rare earth resources.
Sedimentary phosphate ores are one of the most significant types of phosphate resources worldwide, and they are also a crucial source of associated rare earth elements [
3]. According to the “Mineral Commodity Summaries 2024 Annual Report” released by the United States Geological Survey (USGS) in January 2025 [
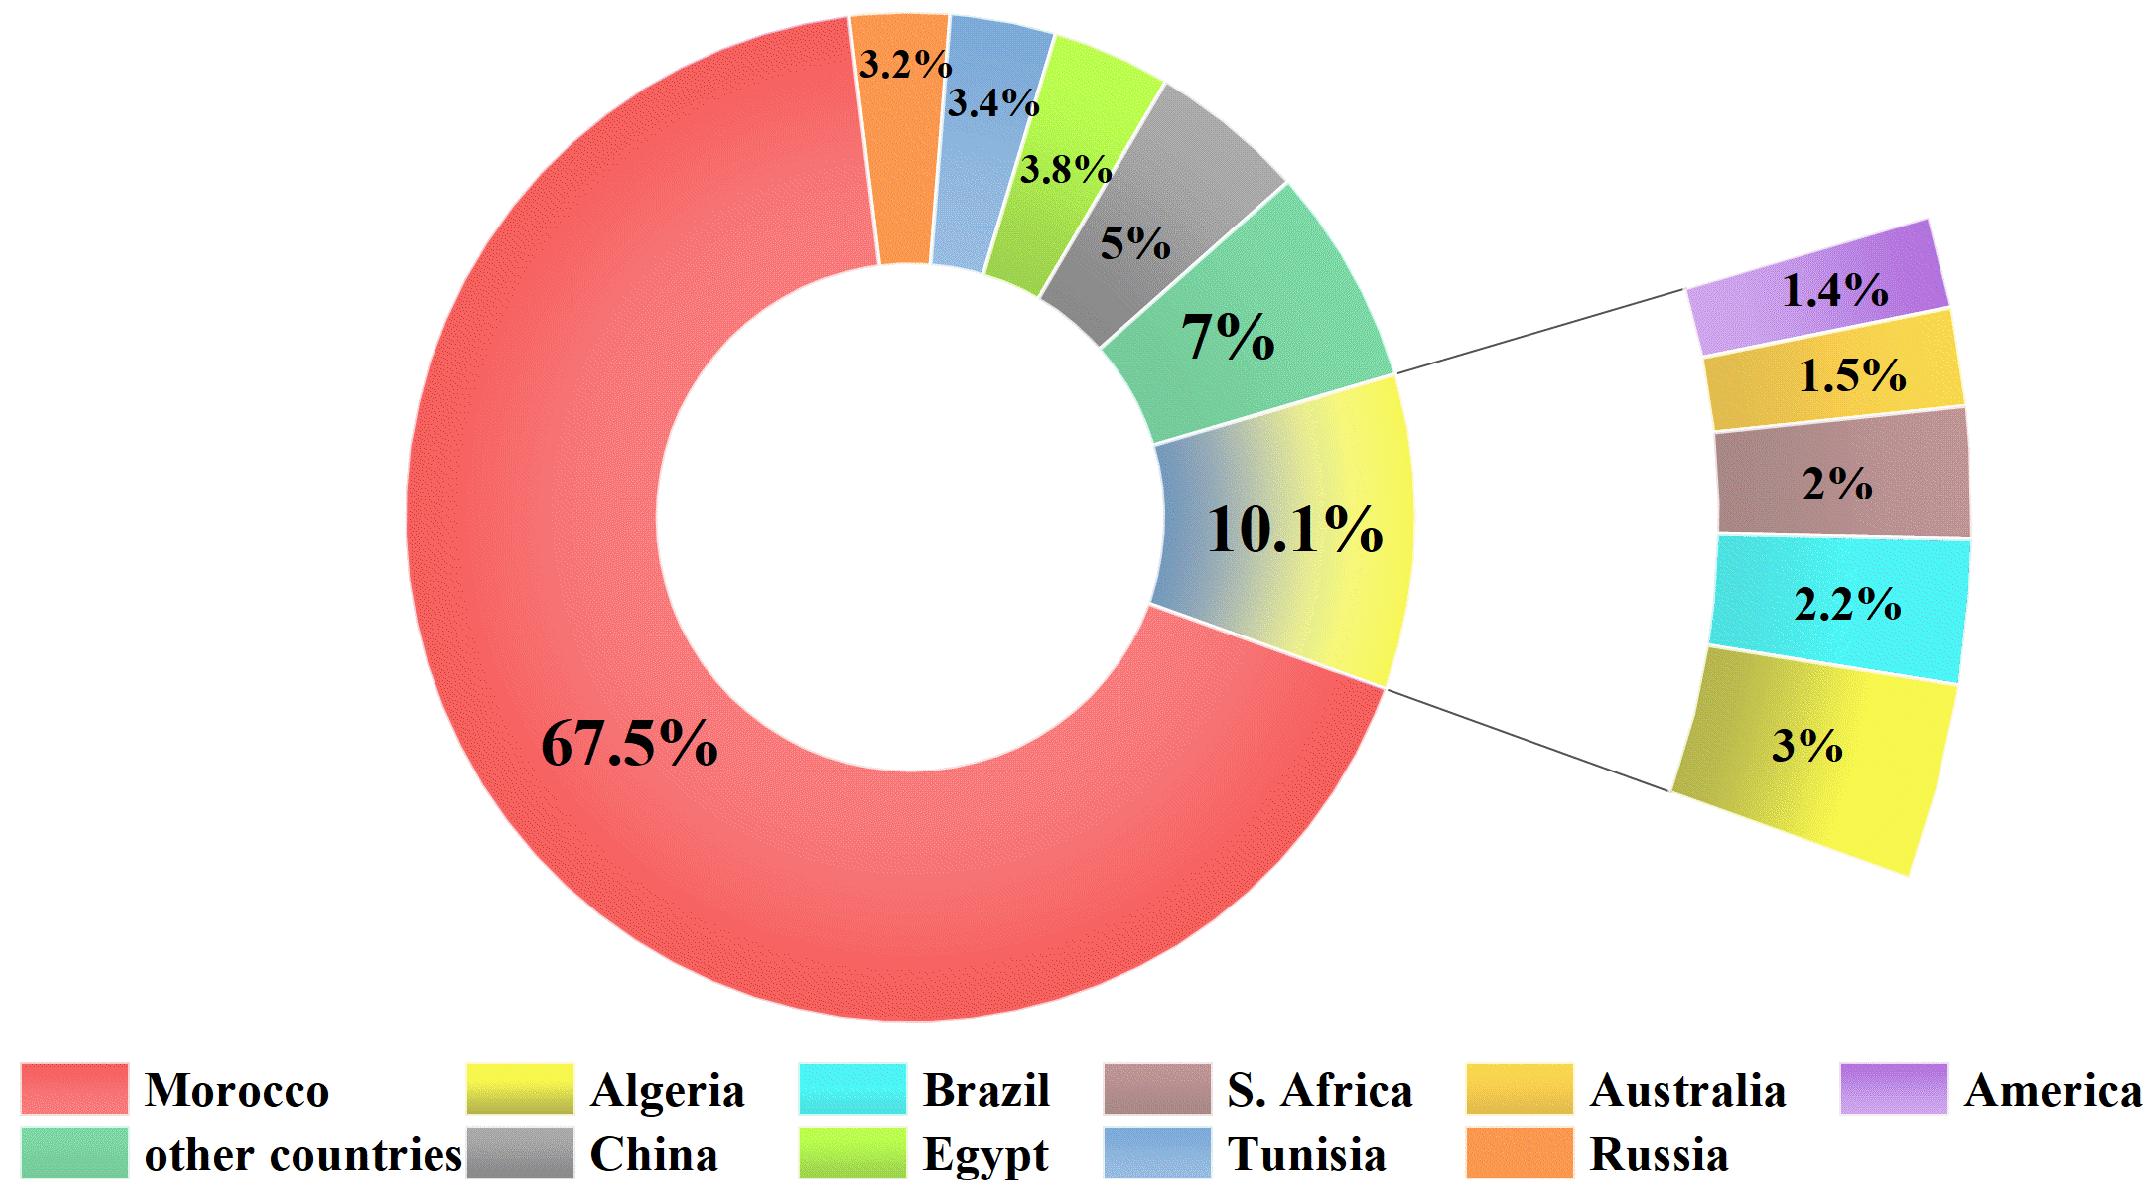
4], global proven phosphate reserves amount to 74 billion tons as of 2024. The distribution of phosphate resources by country is shown in
Figure 1, with sedimentary phosphorite deposits being the predominant type of ore body.
Rare earth resources are an important associated resource in phosphate ores [
5]. Rare earth elements (REEs) are closely related to phosphorus pentoxide (P
2O
5) and are primarily hosted in phosphates in the form of isomorphic substitution [
6,
7,
8].
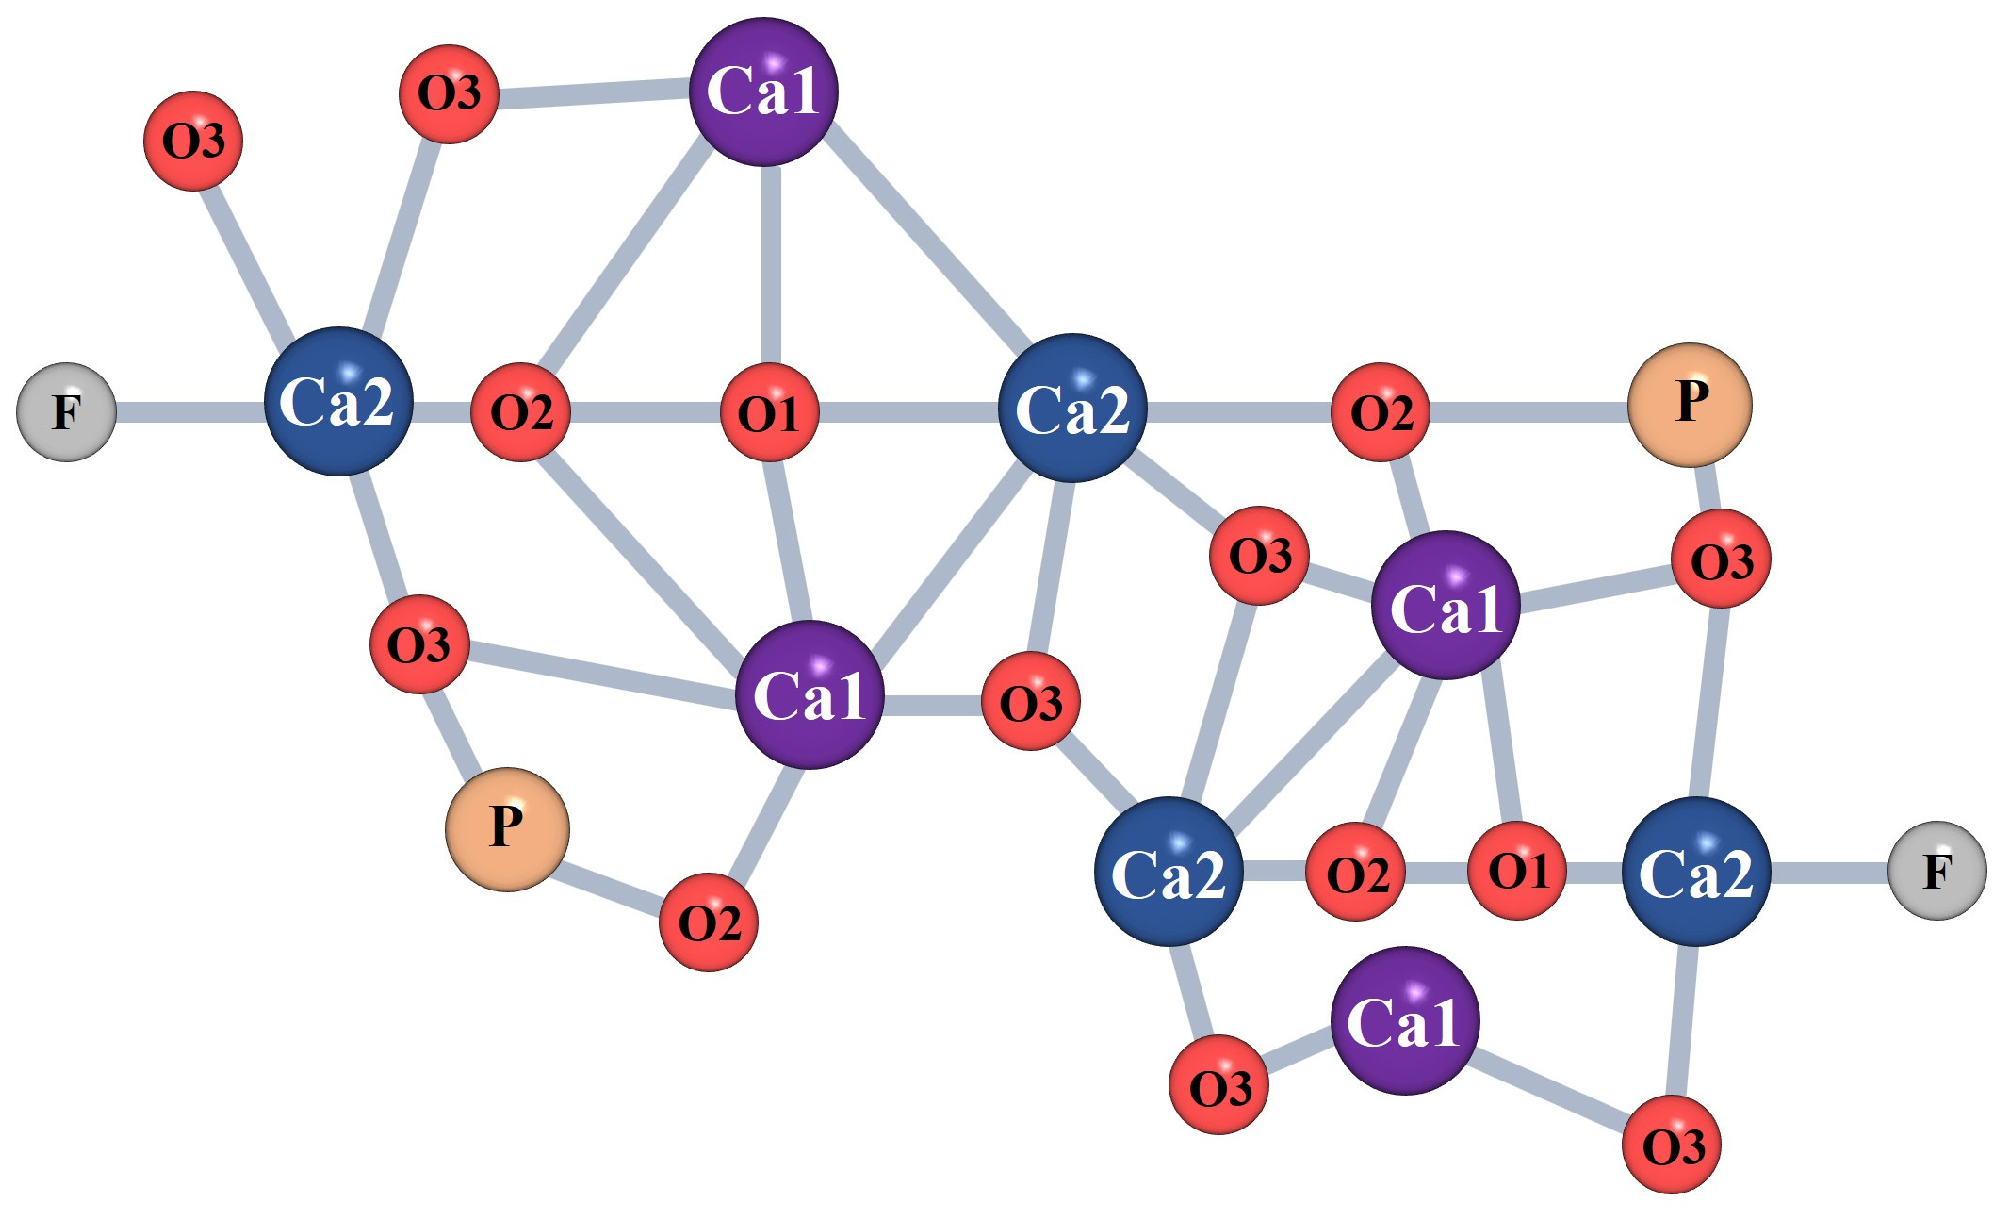
The rare earth sites in the fluorapatite lattice are typically occupied by two calcium atoms, which exhibit distinct crystallographic structures within the atomic arrangement of fluorapatite [
9], as illustrated by Ca1 and Ca2 in
Figure 2 [
10]. Ca1 is surrounded by nine oxygen atoms, while Ca2 is surrounded by six oxygen atoms and one fluorine atom, forming an irregular polyhedron [
11]. Computational results indicate that the effective elastic constant of the Ca2 site is lower, making it more flexible and stable than the Ca1 site in accommodating larger and smaller trivalent REE cations [
12].
The total amount of rare earth elements in phosphate ores worldwide is immense. The content of associated rare earths in phosphate ores from various countries is shown in
Table 1.
China ranks second in the world in terms of phosphate ore reserves and first in phosphate production. It is also the largest producer and consumer of phosphate ore globally. According to the “China Mineral Resources Report 2024” published in October 2024 [
13], as of the end of 2023, China’s phosphate ore reserves amounted to 3.441 billion tons [
14].
Guizhou Province is rich in phosphate ore resources, accounting for 13.9% of the total reserves in China. These resources are mainly concentrated in the Wengfu, Kaiyang, and Zhijin mining areas, and consist of low-to-medium grade marine sedimentary phosphate ores [
15]. The total reserve amounts to 488 million tons, ranking fourth in China. The Zhijin phosphate deposit was discovered in 1958 and is located southeast of Zhijin County, Guizhou Province. It formed during the Early Cambrian Meishuichun period [
16,
17,
18,
19] and is a sedimentary-type super-large rare earth-containing phosphate deposit. The proven phosphate reserves are approximately 339 million tons, with associated rare earth reserves (measured in REO) reaching 3.5018 million tons, particularly rich in medium and heavy rare earths. Notably, the heavy rare earth yttrium oxide (Y
2O
3) constitutes about 35.33% [
20,
21], second only to the BayanObo rare earth mine in Inner Mongolia. This deposit is the largest and most complete phosphate-associated rare earth resource discovered in China to date, with significant potential for comprehensive utilization [
22,
23,
24]. The ore structure is mostly in the form of gel-like aggregates, and these phosphate ores are characterized by complex properties, fine-grained embedding, low rare earth grade, and complex occurrences. In the traditional wet-process phosphoric acid production, it is difficult to recover rare earths, leading to a significant loss of valuable rare earth resources along with phosphogypsum or leaching residue, resulting in severe resource wastage. This issue has hindered the high-value utilization of associated rare earth phosphate resources [
25].
Currently, there are three main methods used in the wet-process phosphoric acid production in the phosphate chemical industry [
26,
27]: the sulfuric acid method [
28], the hydrochloric acid method (IMI) [
29], and the nitric acid method (Odda) [
30].
The sulfuric acid route remains the most widely employed method for the wet-process production of phosphoric acid [
31,
32]. Its principal advantages lie in its simplicity and technological maturity. However, this process generates approximately 4.5–5.5 t of phosphogypsum for every 1 t of phosphoric acid produced. If rare earth elements are to be secondarily recovered from phosphogypsum, the associated processing costs are considerably high. As of 2025, the cumulative stockpile of phosphogypsum in China has reached approximately 400 million tons. During the production of wet-process phosphoric acid via the sulfuric acid route, the commonly applied dihydrate process results in about 70% of the rare earth elements partitioning into phosphogypsum, while the remainder enters the phosphoric acid phase.
The Israeli Mining and Engineering Company (I.M.I) developed the renowned IMI method in the early 1960s, based on the characteristics of the Dead Sea resources. This method utilizes hydrochloric acid to react with phosphate ore to produce phosphoric acid. It is characterized by a low requirement for the grade of phosphate concentrate and a low yield of leaching residue, with the rare earth leaching rate reaching over 90% [
33]. Additionally, calcium chloride, a byproduct of this process, can be used as a drying agent, de-icing agent, industrial waste stabilizer, and animal feed additive, offering significant economic value.
The nitric acid decomposition process for phosphate ore was developed in 1927 by Erling Johansen of Norway, and is known as the Odda process [
34]. Its advantages include rapid reaction, complete decomposition, and the ability for nitrate ions to be retained in the phosphate fertilizer product as an effective nitrogen component, offering strong technical and economic benefits. The rare earth leaching rate can also exceed 90%. However, the crystallization of calcium nitrate requires the use of cryogenic crystallization technology, which presents significant industrial limitations.
This study focuses on a rare earth-associated phosphate concentrate from Zhijin County, Guizhou Province. Unlike the traditional IMI process, which aims for complete mineral decomposition, this research designs a novel selective phosphorus leaching process based on the differing reactivity of dolomite and fluorapatite in a hydrochloric acid system. The process is specifically tailored to the dolomitic phosphate concentrate from Zhijin. It not only reduces acid consumption but, more importantly, achieves efficient rare earth enrichment in the leaching residue. This provides a new approach for recovering critical metals from complex associated resources. Additionally, the study analyzes the mineral composition of the associated rare earth phosphate concentrate, the occurrence state of rare earth elements, and the occurrence state of rare earths in the selective phosphorus leaching residue. The migration patterns and enrichment effects of rare earth elements during the selective leaching of phosphorus are also explored.
In this study, a rare earth-bearing phosphate concentrate from Zhijin County, Guizhou Province, was selected as the research subject. Unlike the conventional IMI process, which aims at the complete decomposition of minerals, this work is founded upon the difference in reaction priority between dolomite and fluorapatite within a hydrochloric acid system. On this basis, a phosphorus-prioritized leaching process specifically suited to the dolomitic phosphate concentrate of the Zhijin region was proposed for the first time. This approach not only reduces acid consumption but, more importantly, achieves efficient enrichment of rare earth elements within the leaching residue, thereby offering a novel strategy for the recovery of critical metals from complex associated resources. Furthermore, the mineral composition of the rare earth-bearing phosphate concentrate and the occurrence states of rare earth elements were systematically characterized. The occurrence forms of rare earth elements in the leaching residue following preferential phosphorus leaching were also investigated, with the aim of elucidating the migration behavior and enrichment characteristics of rare earth elements during the phosphorus-prioritized leaching process.
3. Results and Discussion
3.1. Analysis of the Mineral Embedding Characteristics and Occurrence States of Rare Earth Elements in Rare Earth-Associated Phosphate Concentrate
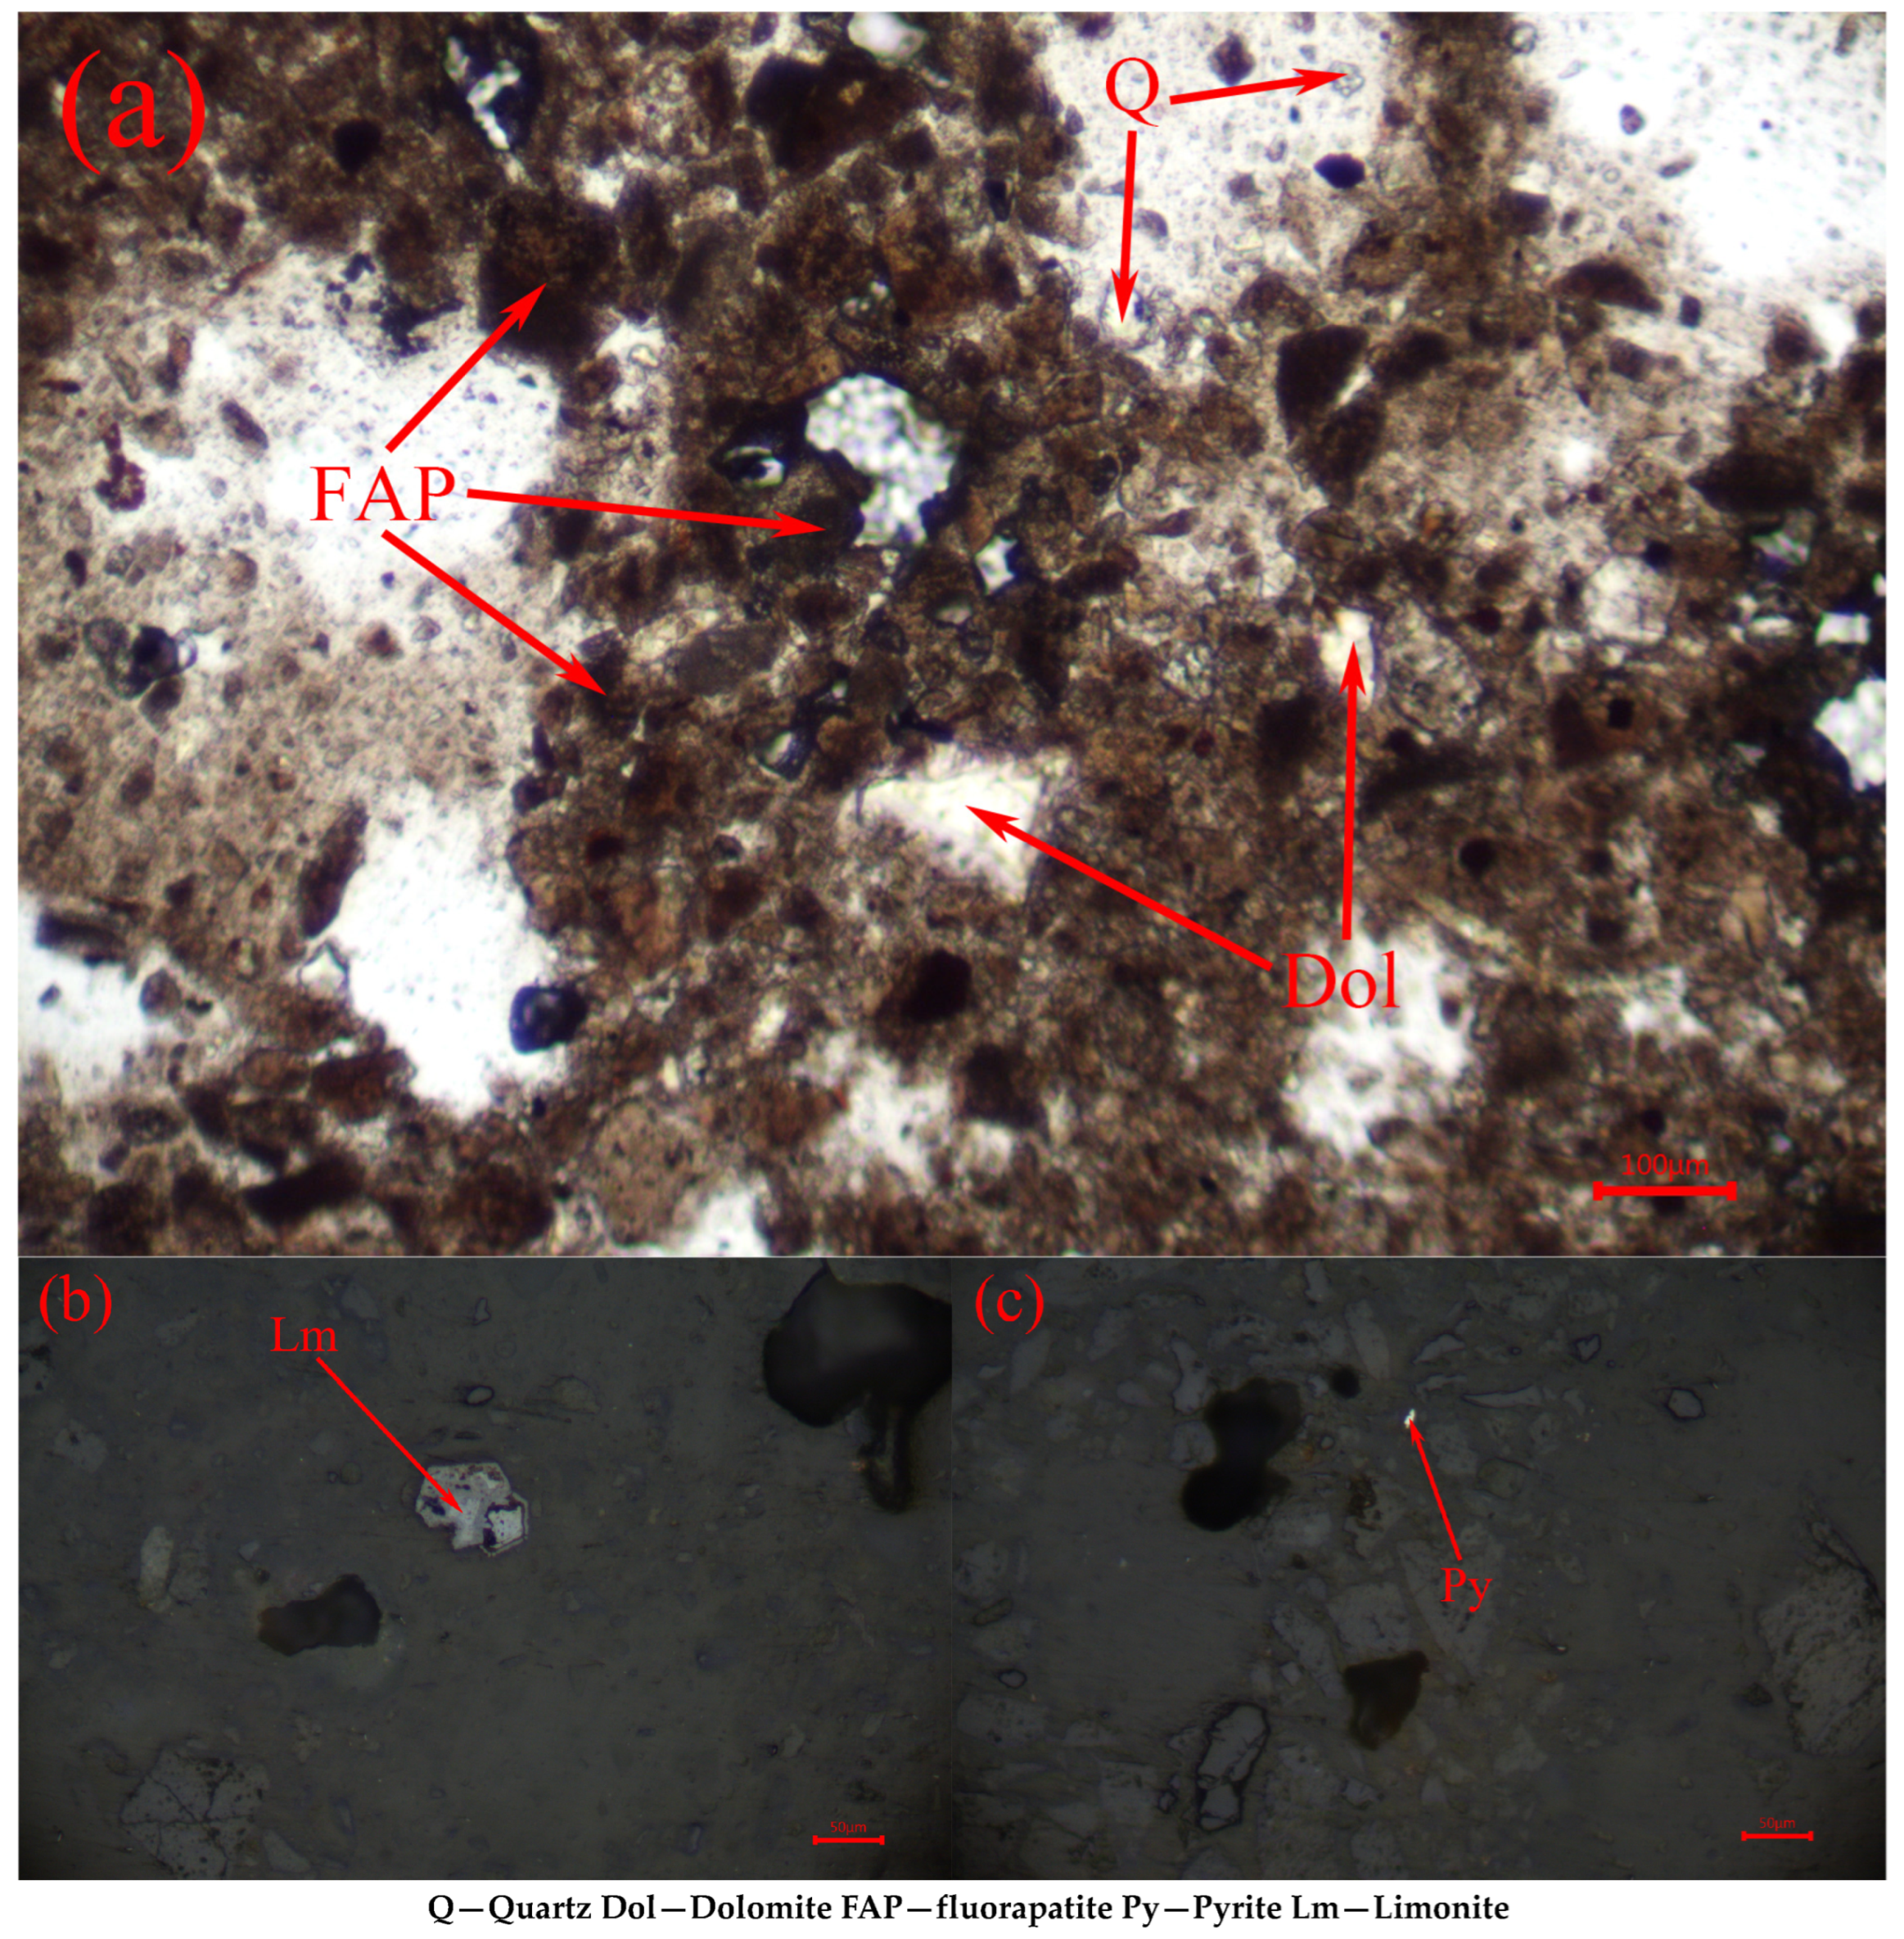
To determine the mineral composition of the rare earth-associated phosphate concentrate, both the transparent minerals and metallic minerals in the concentrate were identified using a polarized light microscope. The identification results are shown in
Figure 4.
As shown in
Figure 4a, the rare earth-associated phosphate concentrate is predominantly clastic, composed of fluorapatite, dolomite, and quartz. Fluorapatite occurs in a cryptocrystalline form and constitutes the main clastic component, with a chaotic distribution. Some aggregates are lens-shaped or irregularly piled, accounting for 80–85% of the concentrate. Dolomite appears as subhedral granular particles, typically ranging from 0.001 to 0.02 mm in size, with some particles measuring 0.02 to 0.05 mm and a few reaching 0.05 to 0.2 mm. It is distributed randomly, making up 20–25% of the concentrate. Quartz appears as subhedral granules, usually ranging from 0.05 to 0.1 mm in size, with some particles between 0.1 and 0.2 mm, scattered sporadically, comprising less than 5% of the sample. The metallic minerals in
Figure 4b,c are pyrite and limonite. Pyrite is subhedral to anhedral in shape, with particle sizes ranging from 0.01 to 0.05 mm, and some particles reaching 0.05 to 0.1 mm. It is distributed in a scattered manner and is partially replaced by limonite, with a very low content. Limonite occurs in a cryptocrystalline form, often finely dispersed, and some aggregates exhibit a pyrite-like appearance. Its content is extremely low.
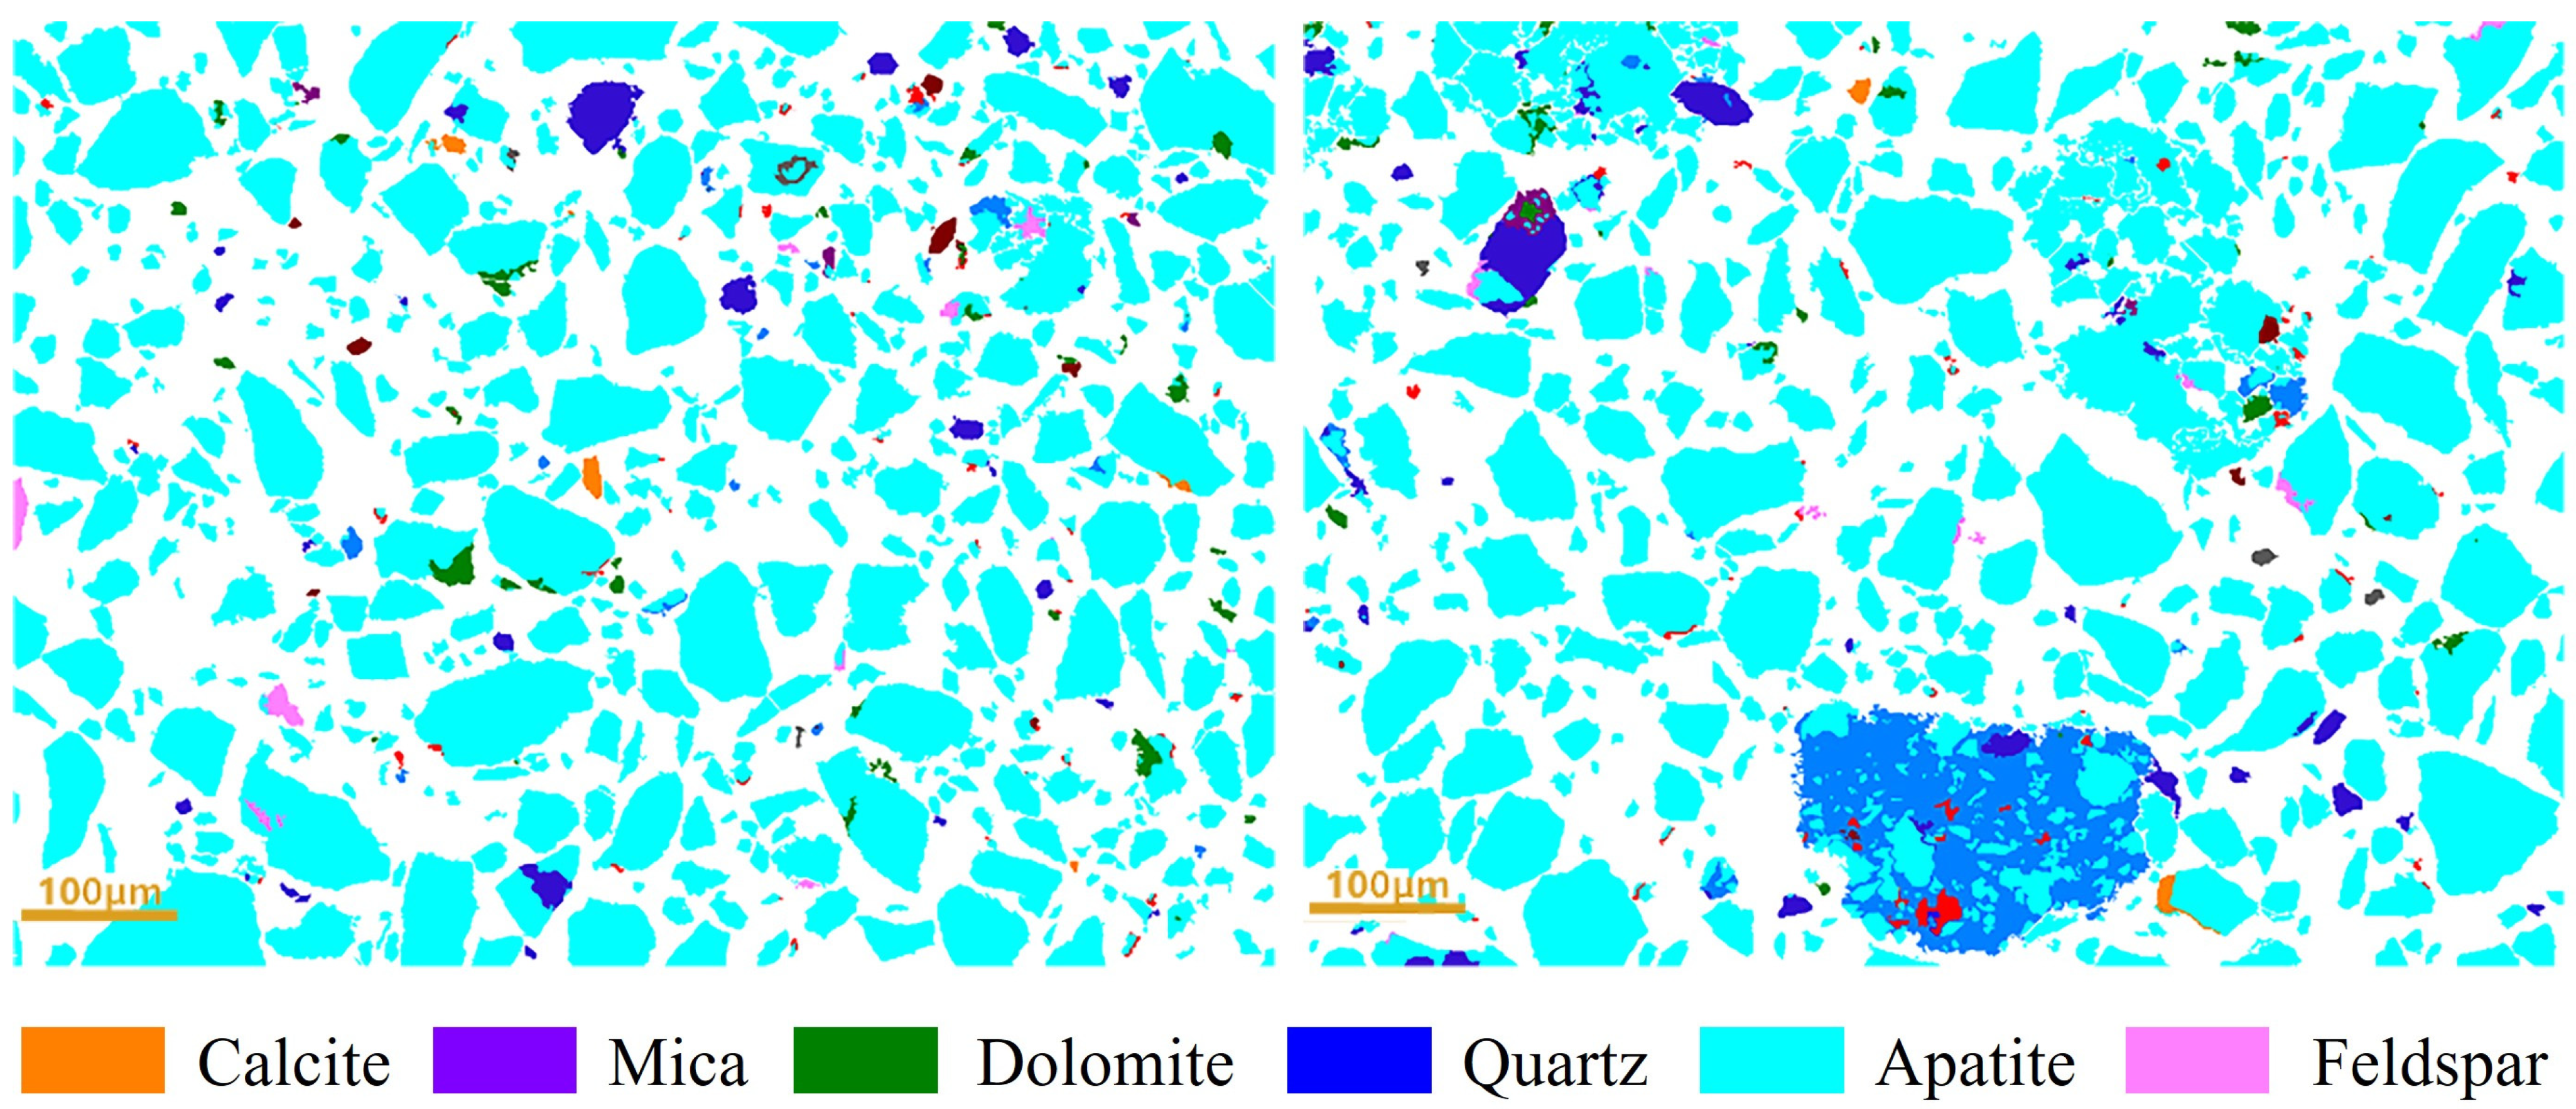
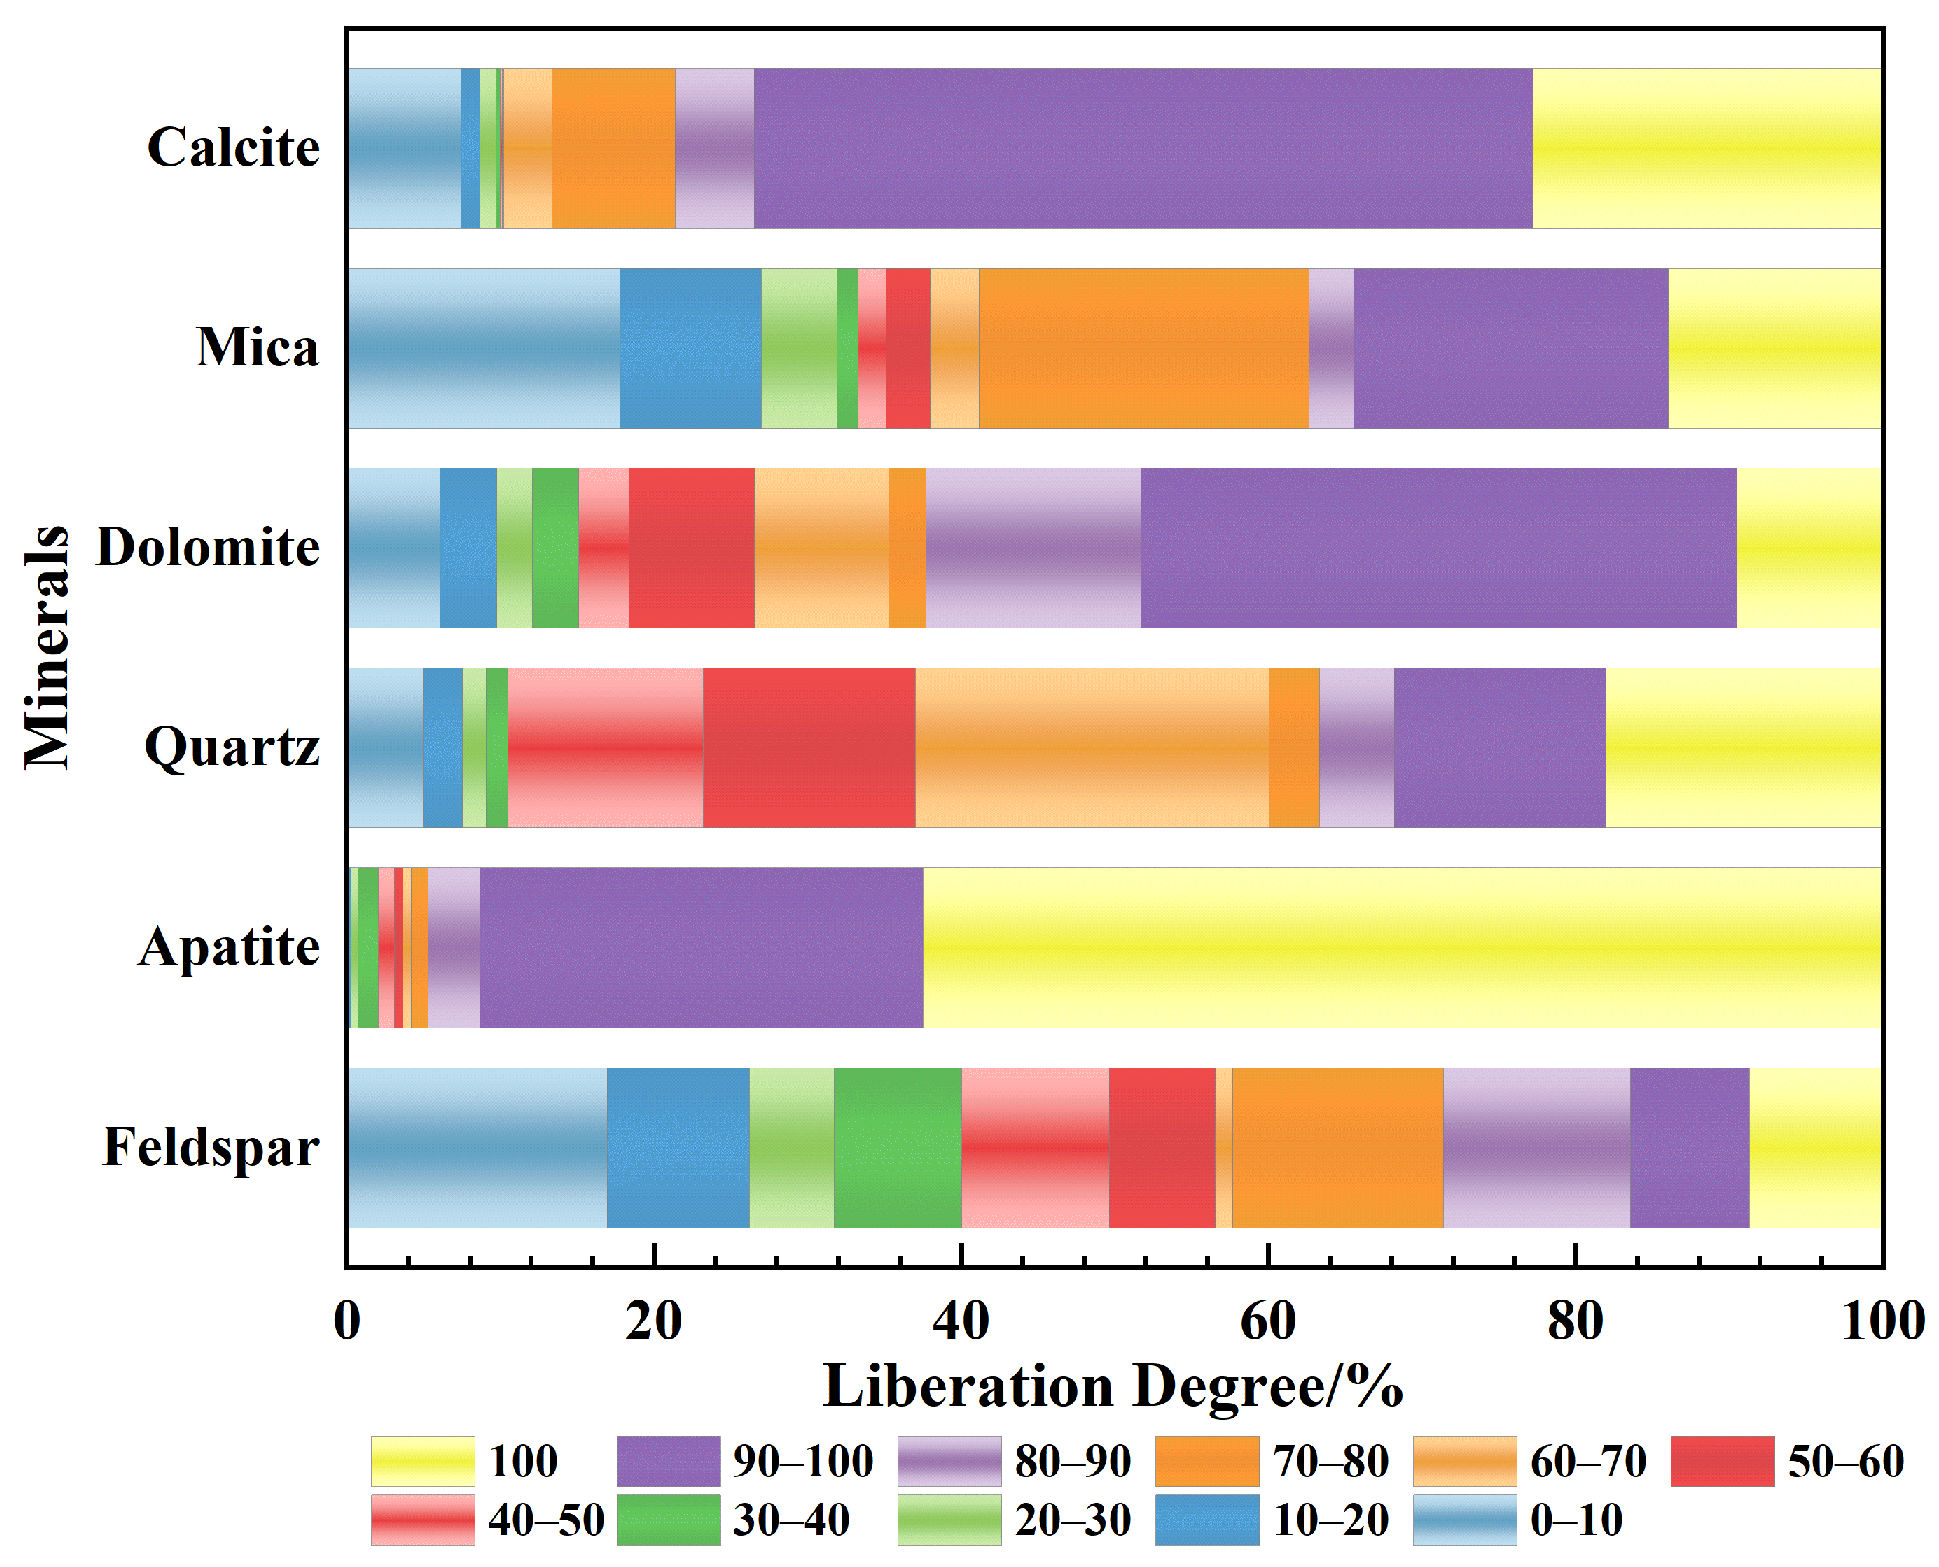
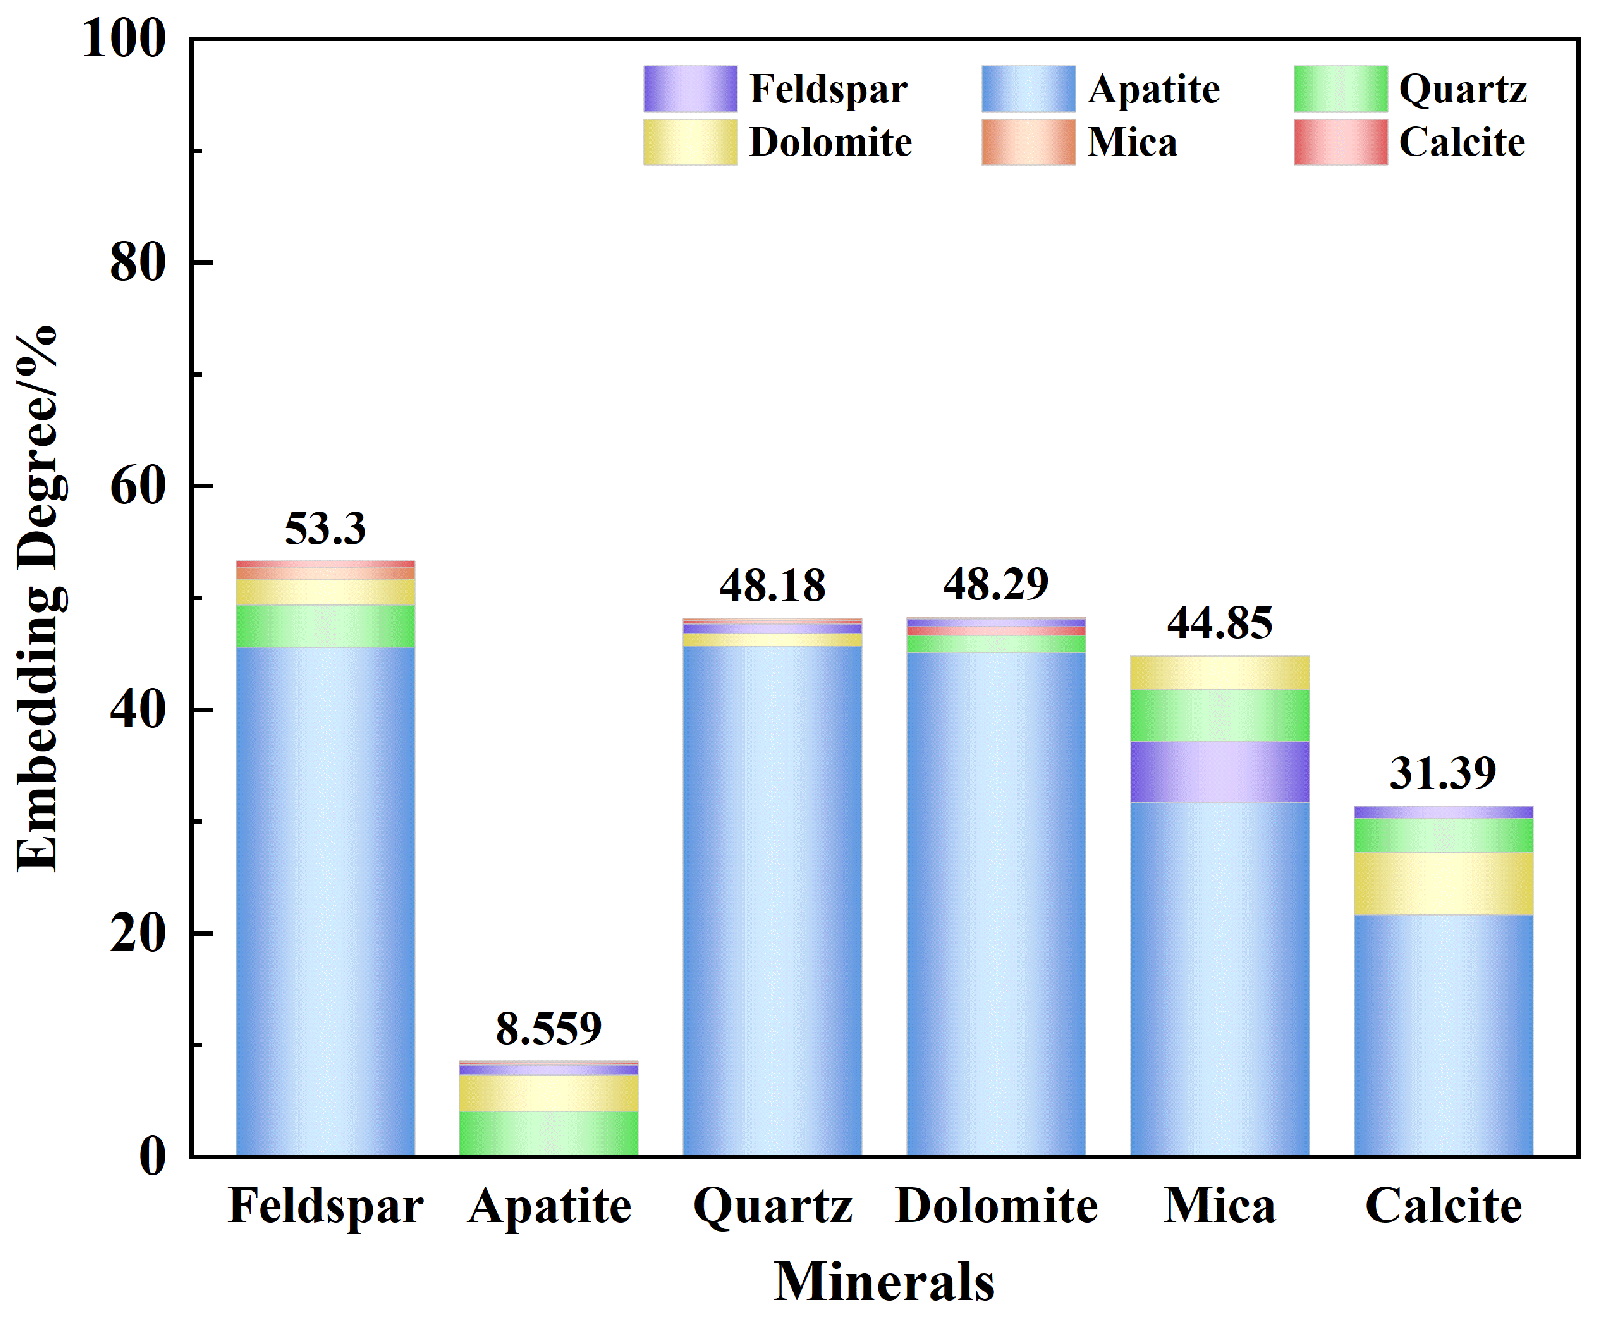
The intergrowth relationships and liberation characteristics of the rare earth-bearing phosphate concentrate were analyzed using an automated process mineralogy analysis system (BPMA), and the results are presented in
Figure 5,
Figure 6 and
Figure 7.
As seen in
Figure 5, the silicate minerals in the rare earth-associated phosphate concentrate, due to their fine embedding size, predominantly form intergrowths or inclusions with apatite, with only a small amount occurring as individual particles. Additionally, traces of dolomite-apatite intergrowths are observed, but no dolomite as a separate phase is detected.
Figure 6 presents the degree of liberation diagram for the minerals in the rare earth-associated phosphate concentrate. As observed from
Figure 6, apatite exhibits a high degree of liberation, with particles having a liberation degree greater than 90% accounting for a cumulative proportion of 91.32%. In contrast, the major gangue minerals exhibit lower degrees of liberation, with dolomite, calcite, and quartz showing cumulative proportions of 48.3%, 73.47%, and 31.8% for particles with a liberation degree greater than 90%, respectively. This indicates that the fine embedding size of the gangue minerals is due to their lower degree of liberation, which results in their presence in the phosphate concentrate.
According to the degree of embedding map of the rare earth-associated phosphate concentrate in
Figure 7, it can be observed that the mineral with the highest degree of embedding among all gangue minerals is apatite. The content of apatite and quartz intergrowths is the highest, at 4.11%, followed by the intergrowth with dolomite at 3.22%. Meanwhile, the mineral most frequently intergrown with apatite and the main gangue minerals is quartz, accounting for 45.69%, closely followed by feldspar, which makes up 45.58%.
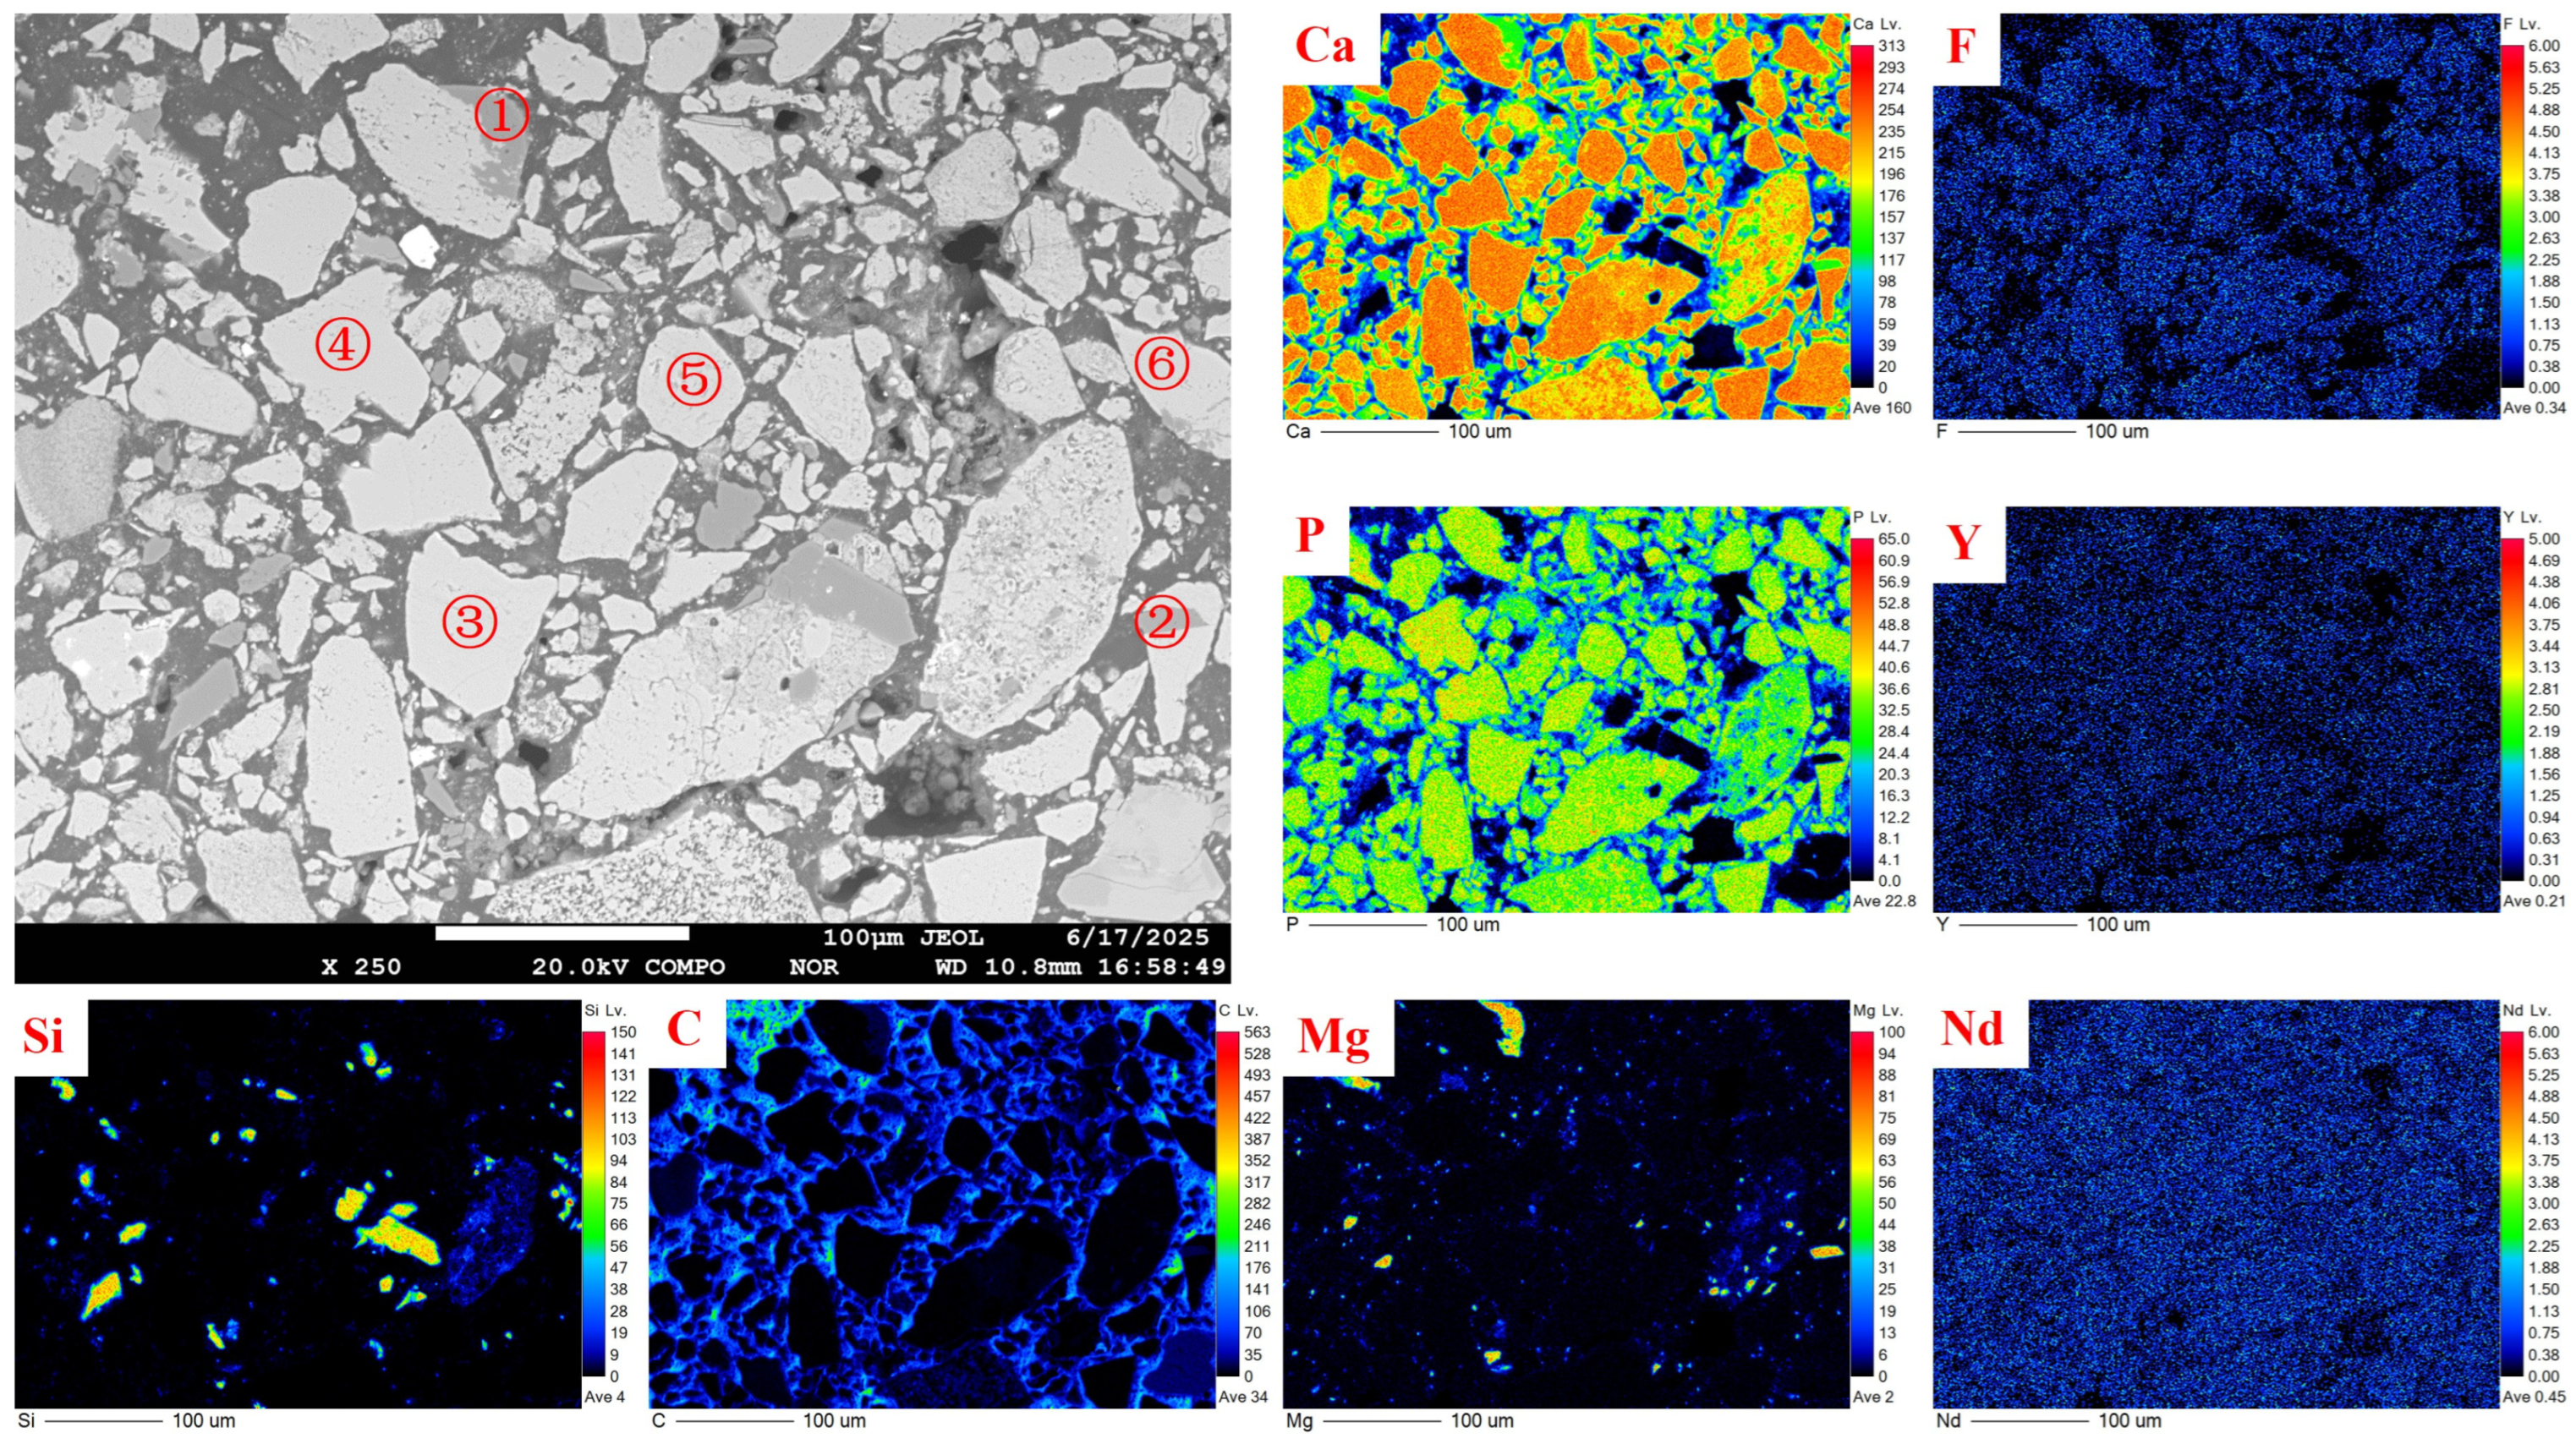
The mineral categories and content of rare earth elements in the collophane were analyzed using EPMA backscattered electron imaging and selective compositional analysis, with the results presented in
Figure 8 and
Table 5.
Backscattered electron imaging and localized compositional analysis using an electron probe microanalyzer (EPMA) were employed to identify the mineral hosts and quantify the content of rare earth elements in the rare earth-bearing phosphate concentrate. The results are presented in
Figure 8 and
Table 5.
From
Figure 8, it can be observed that a small amount of apatite in the rare earth-associated phosphate concentrate remains unseparated into individual grains. The element distribution maps reveal that apatite contains a large number of fine-grained dolomite particles, approximately 10 μm in size, along with a small quantity of silicate minerals (quartz, feldspar) that occur as intergrowths with apatite. Additionally, the spectral distribution of P, F, Y, and Nd elements highly overlaps, indicating that the rare earth elements are hosted within the apatite, with no independent rare earth minerals observed.
To further determine the content of rare earth elements in apatite, point analysis was conducted to quantitatively analyze the major elements in both apatite and dolomite, with the results presented in
Table 5.
Based on points 1 and 2 in
Table 5, it can be seen that no rare earth elements are present in dolomite. In contrast, by comparing points 4, 5, and 6, it is evident that all rare earth elements are hosted within apatite. Slight variations in the rare earth element content are observed depending on the specific locations of the point analysis.
3.2. Thermodynamic Analysis of Acid Leaching of the Rare Earth-Associated Phosphate Concentrate
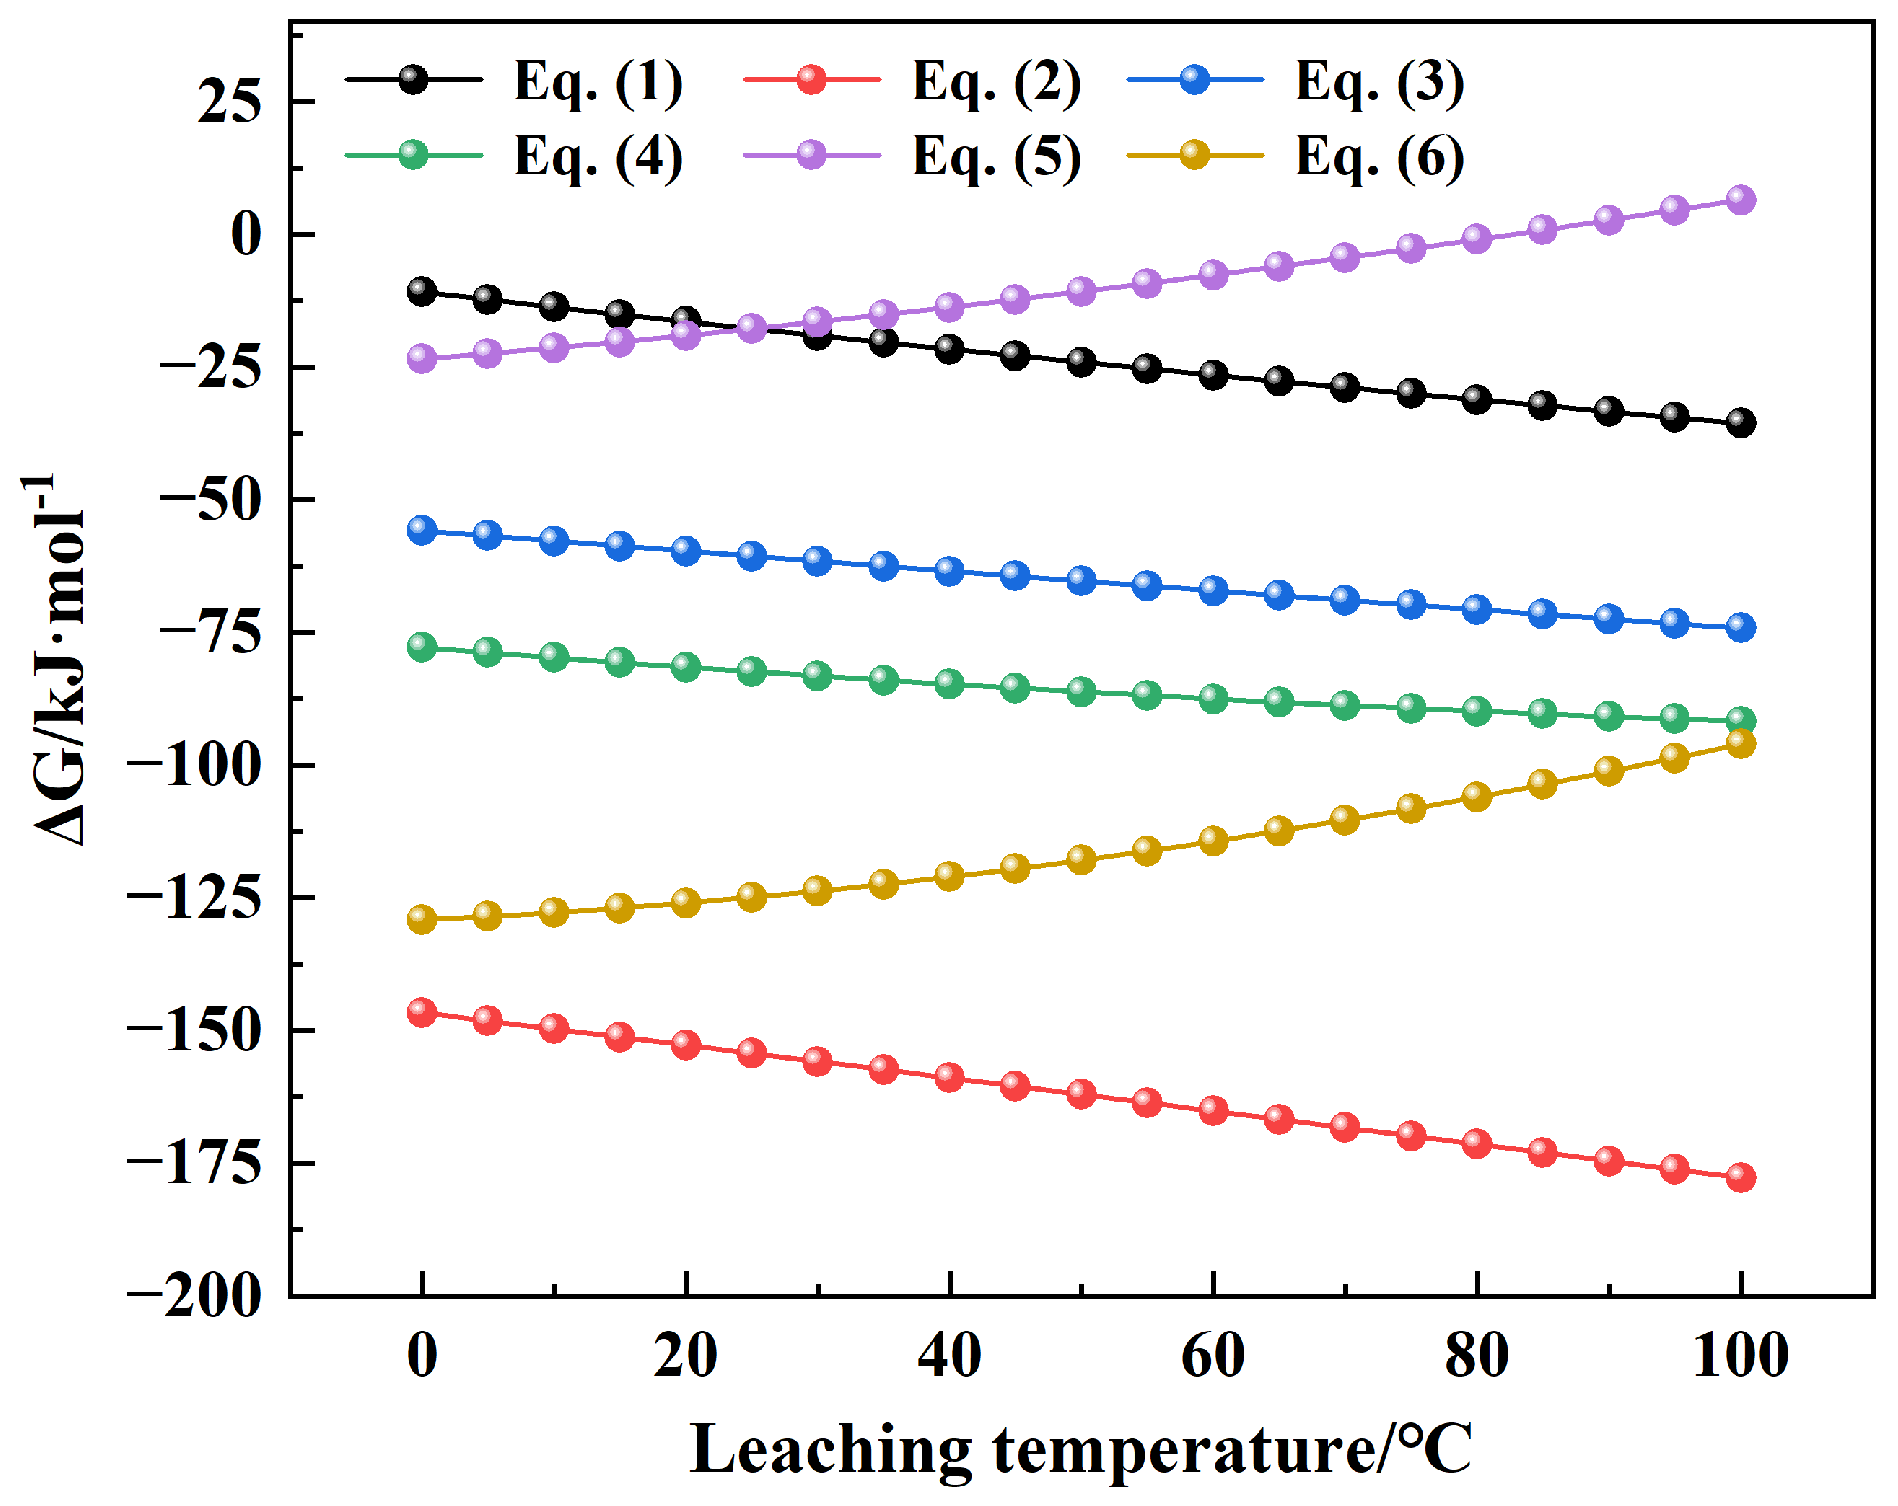
The primary objective of conducting the thermodynamic analysis of phosphate ore leaching is to theoretically elucidate the spontaneity and feasibility of the reactions by calculating key thermodynamic parameters, such as the Gibbs free energy change (ΔG) and enthalpy change (ΔH). Based on the phase composition and multi-element analysis results of the flotation phosphate concentrate, the main reactions involved during the hydrochloric acid decomposition of phosphate ore are as follows:
Since the rare earth elements in the rare earth-bearing phosphate concentrate are hosted within apatite and no independent rare earth minerals are present, the decomposition of phosphate ore using hydrochloric acid does not involve direct reactions between hydrochloric acid and discrete rare earth minerals. Therefore, the principal reactions involved in the hydrochloric acid decomposition of phosphate ore were thermodynamically evaluated using HSC Chemistry 6.0 software, and the results are presented in
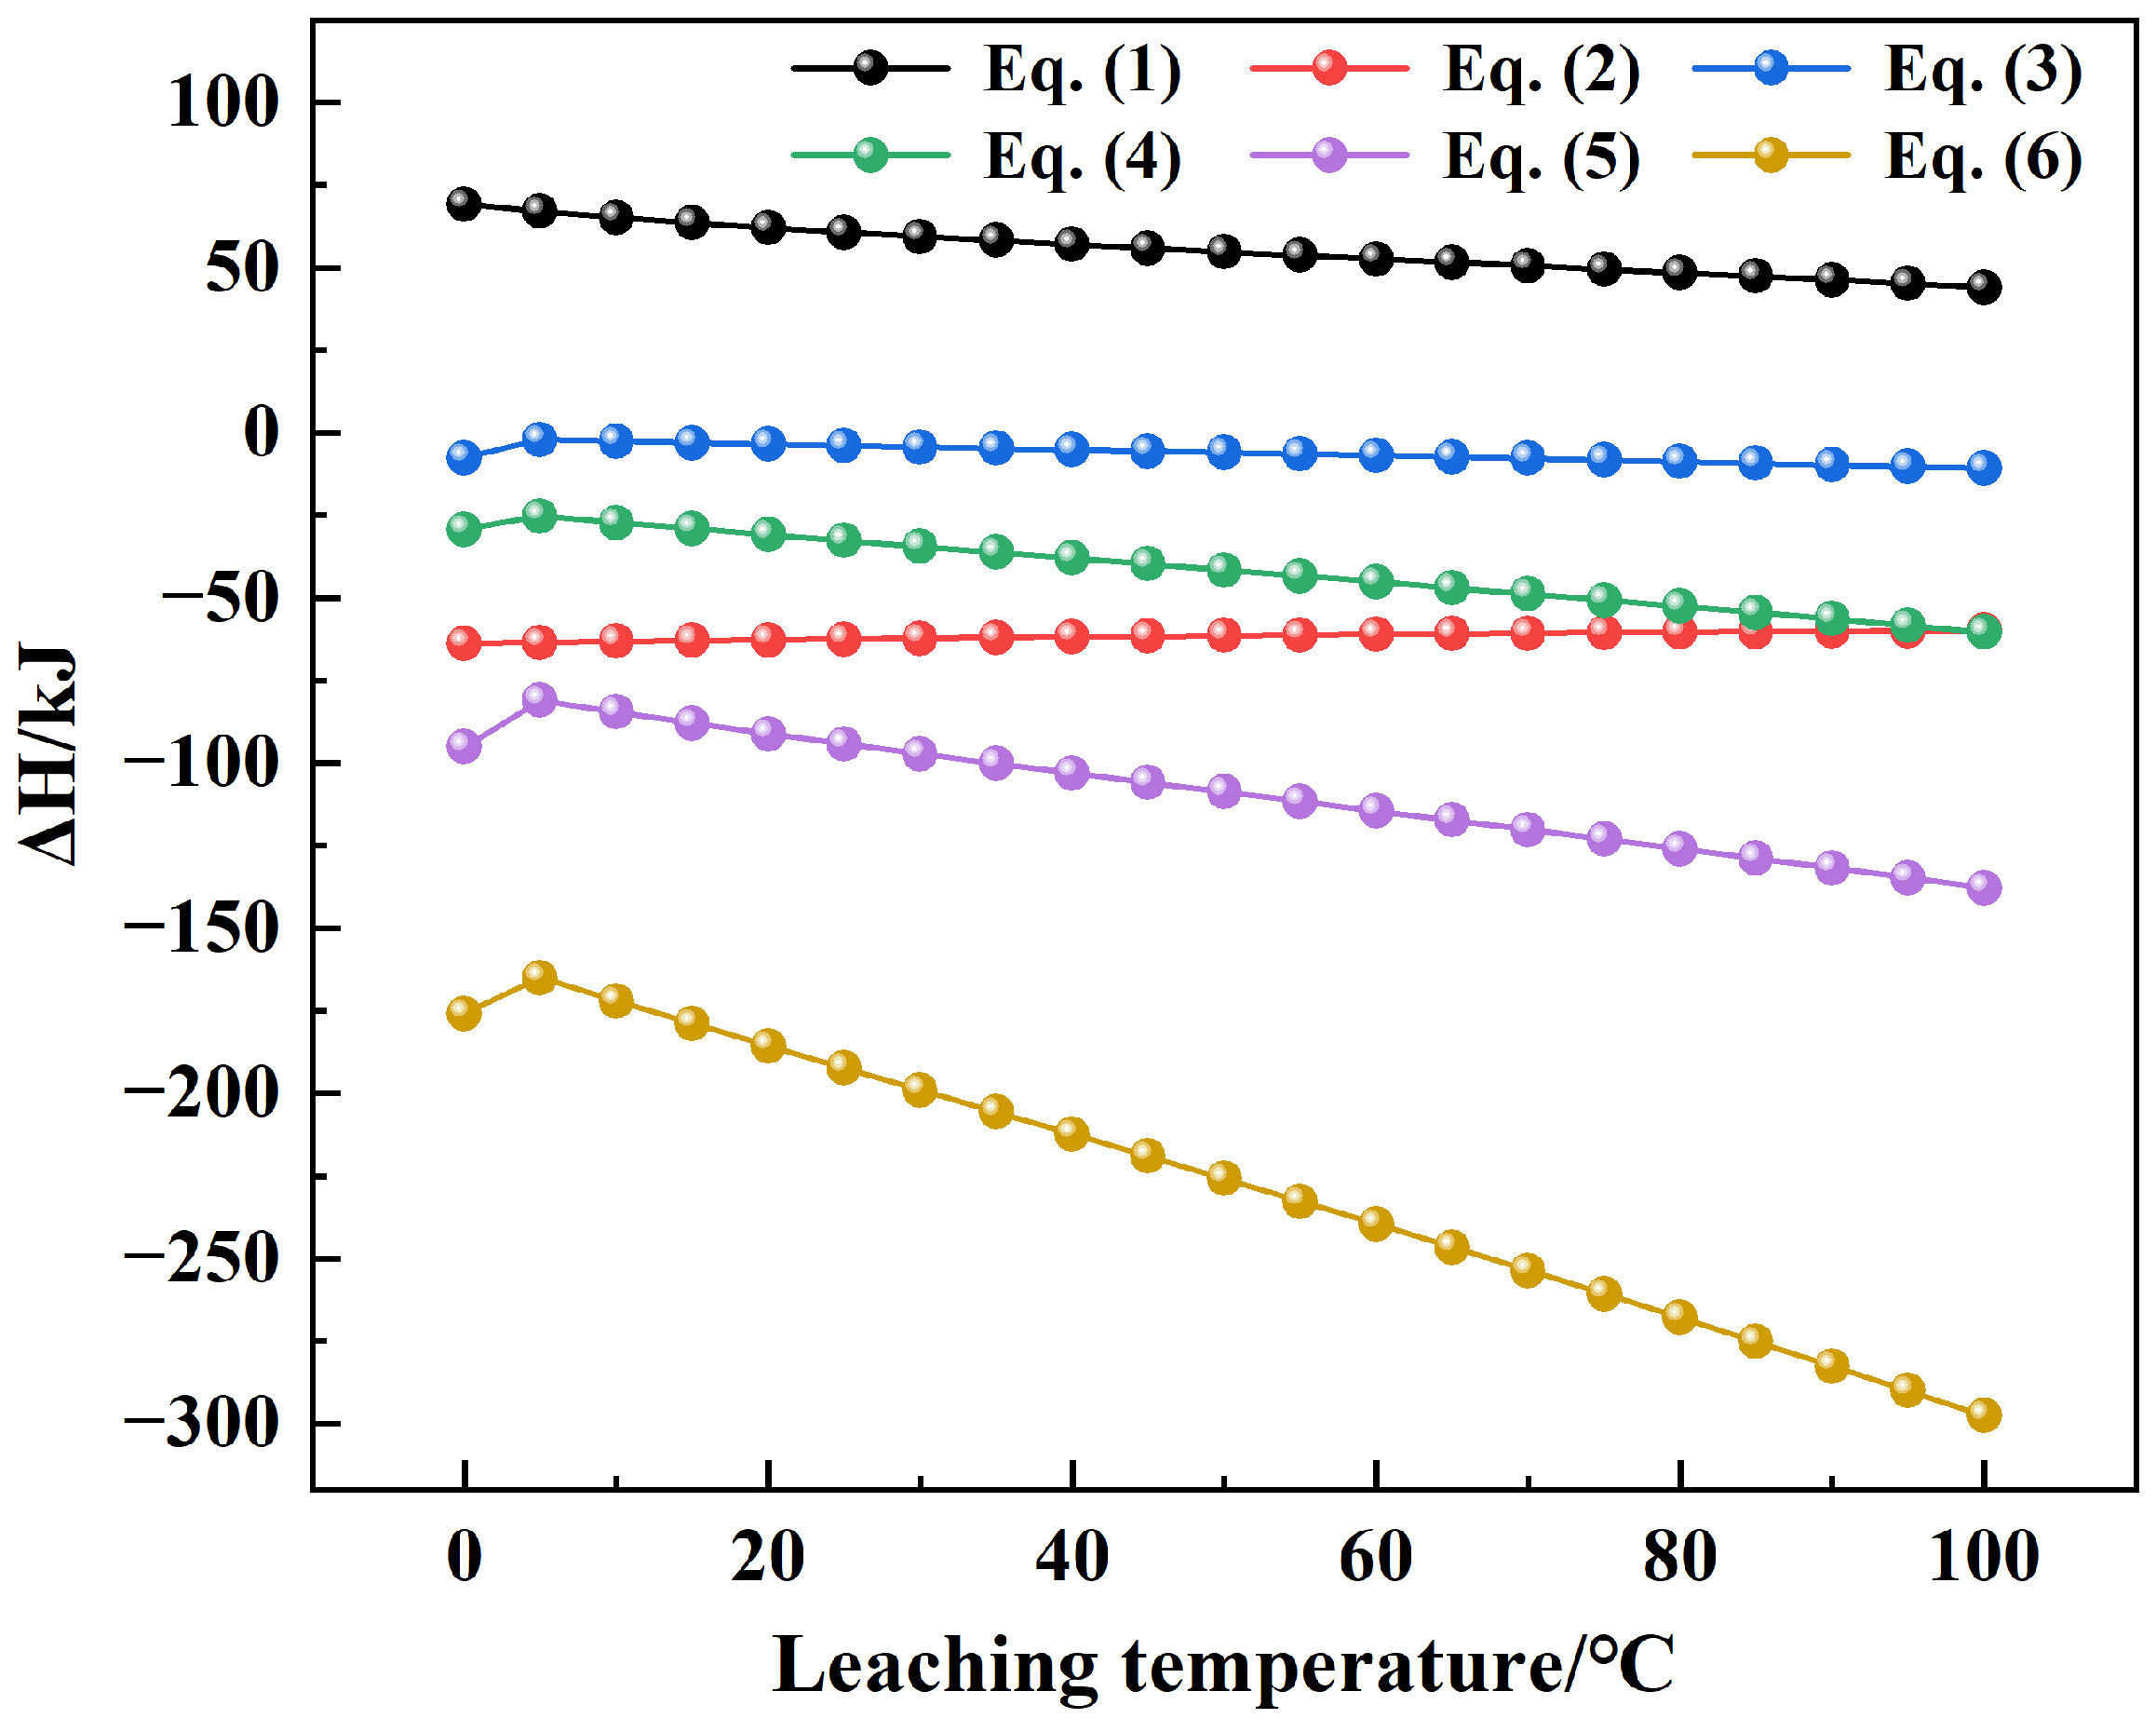
Figure 9 and
Figure 10.
Figure 9 and
Figure 10 show the relationship between Gibbs free energy (ΔG) and enthalpy change (ΔH) with temperature, within the temperature range of 0 °C to 100 °C.
Gibbs free energy (ΔG) is a crucial indicator for evaluating whether a reaction can occur spontaneously. If ΔG < 0, the reaction is spontaneous, and the smaller the value, the stronger the tendency for spontaneity. Conversely, if ΔG > 0, the reaction cannot proceed spontaneously. From
Figure 9, it can be seen that, except for reaction Equation (5), all reactions are spontaneous. Reactions (1) to (4) show a slight decrease in spontaneity with increasing temperature. Among these, the reaction between Ca
5(PO
4)
3F and hydrochloric acid is the least spontaneous, but its spontaneity increases with temperature. The reaction in Equation (1) produces HF, which reacts with the impurity mineral SiO
2 to form fluosilicate, and this reaction is the most spontaneous, although it is strictly limited by the main reaction. Reactions (3) and (4) are also quite spontaneous, and both consume a large amount of hydrochloric acid, increasing the acid consumption during the leaching process. For reaction (5), the spontaneity gradually decreases with temperature, and when the temperature exceeds 80 °C, the reaction no longer occurs spontaneously, indicating that temperature suppresses its spontaneity. Lastly, the reaction in Equation (6) shows a gradual decrease in spontaneity as the temperature increases.
Enthalpy change (ΔH) represents the thermal effect of a reaction. If ΔH < 0, the reaction is exothermic, and if ΔH > 0, the reaction is endothermic. Equation (1) is the only endothermic reaction, indicating that the hydrochloric acid decomposition of fluorapatite requires energy absorption. As the temperature increases, ΔH slowly decreases but remains positive. The reactions between the remaining gangue minerals and hydrochloric acid are all exothermic and exhibit weak dependence on temperature.
Therefore, thermodynamic calculations indicate that the reaction of dolomite takes precedence over that of fluorapatite, particularly at lower temperatures. This difference provides a theoretical basis for the subsequent selective dissolution of phosphorus from fluorapatite and the enrichment of rare earth elements by controlling the amount of leaching acid and leaching temperature.
3.3. Acid Leaching Process of Rare Earth-Associated Phosphate Concentrate
According to the phase analysis and multi-element compositional analysis of the rare-earth-bearing phosphate concentrate, the principal mineral phases present in the concentrate are fluorapatite, dolomite, pyrite, and hematite (limonite). Based on the reaction equations given in Equations (1) and (3) to (6), the theoretical hydrochloric acid consumption required for every 100 g of phosphate concentrate was calculated to be 70.93 g.
3.3.1. The Effect of Hydrochloric Acid Consumption on the Leaching Rates of Phosphorus and Rare Earth Elements
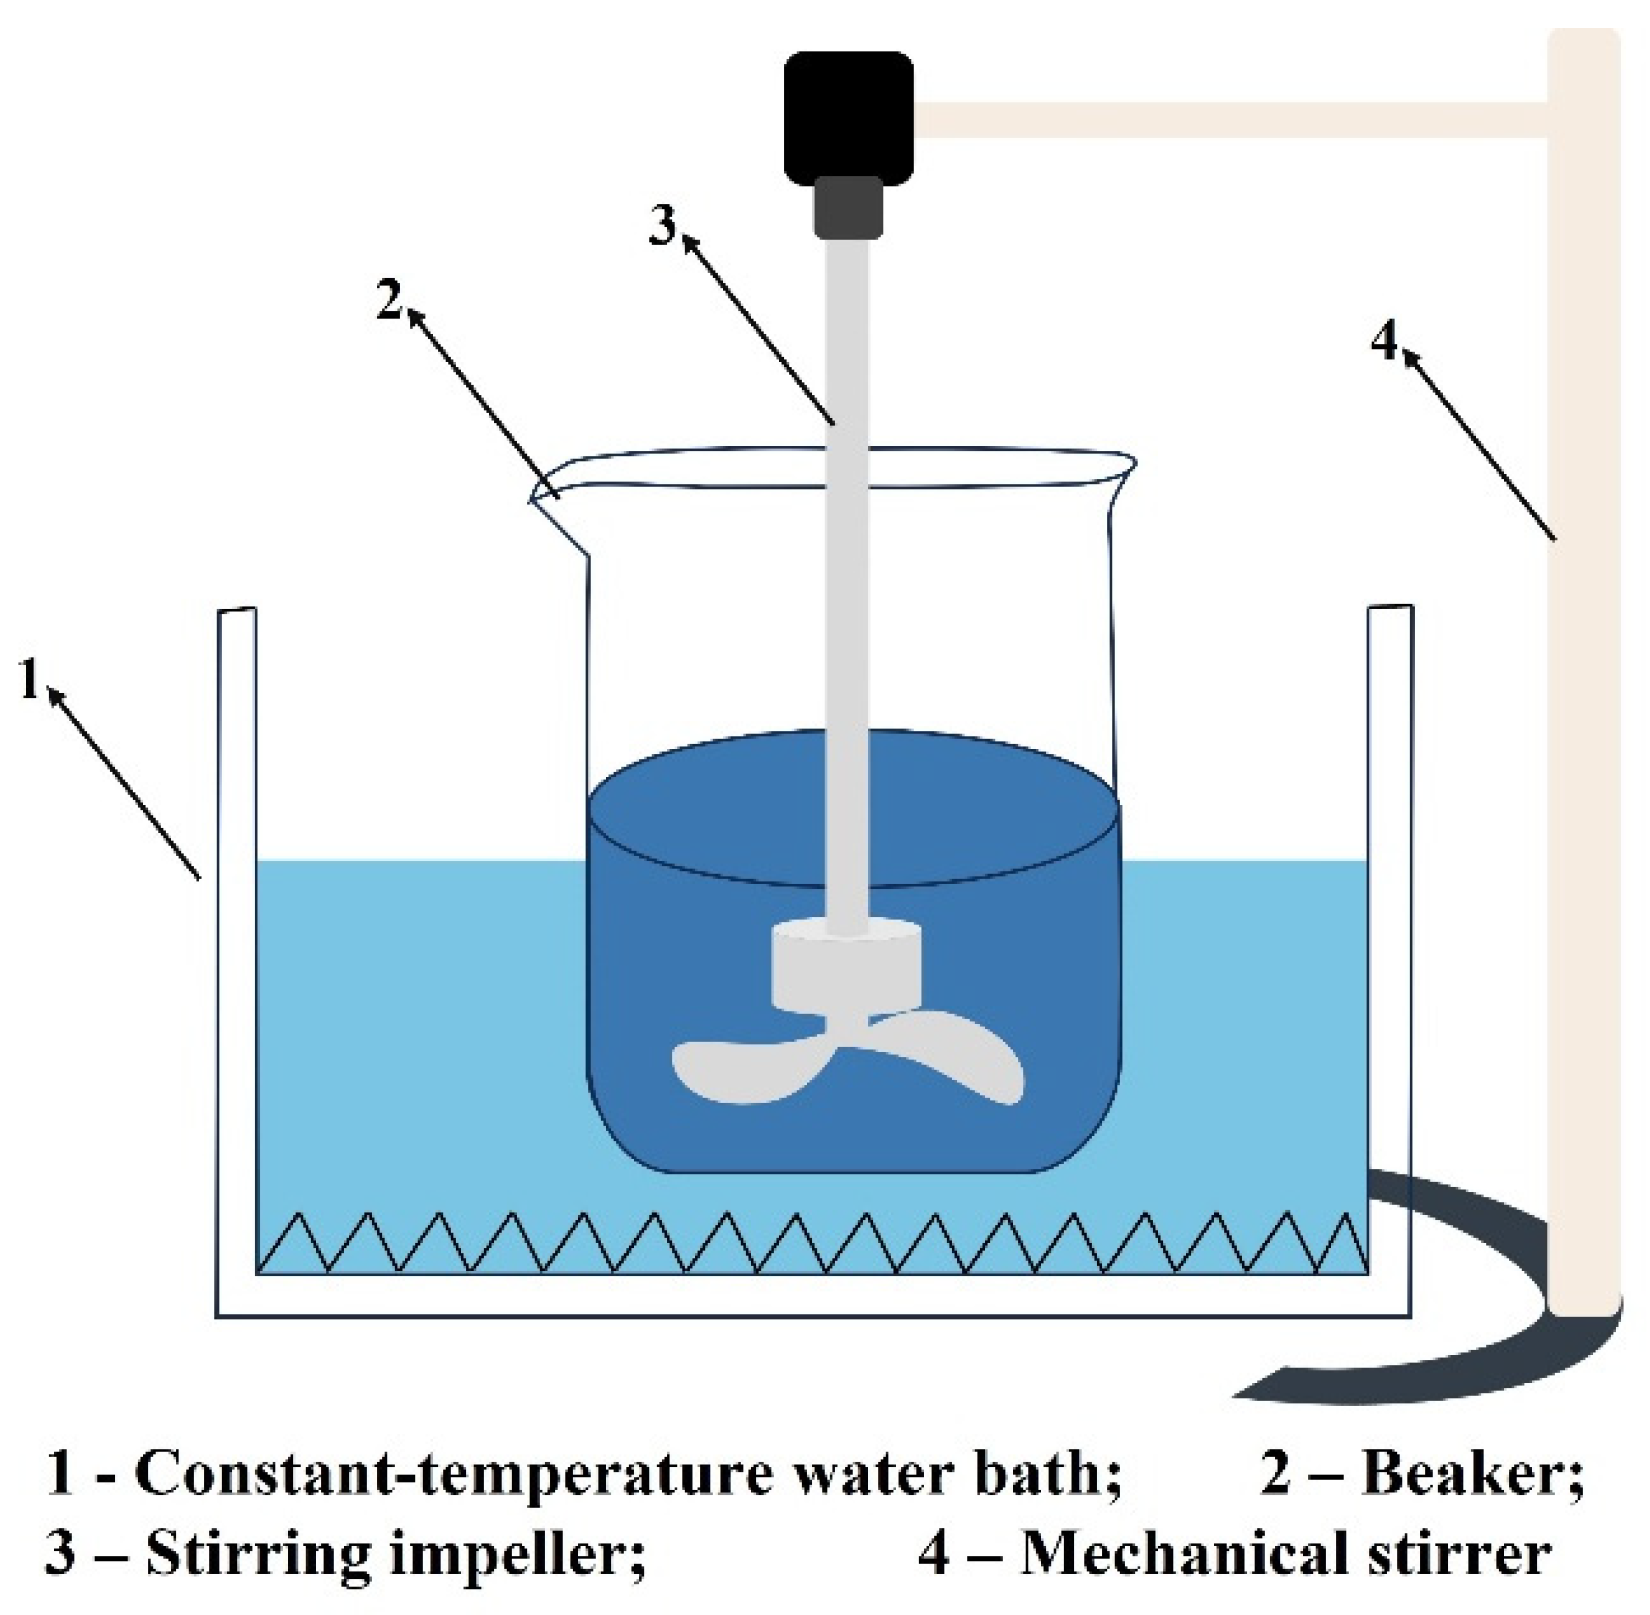
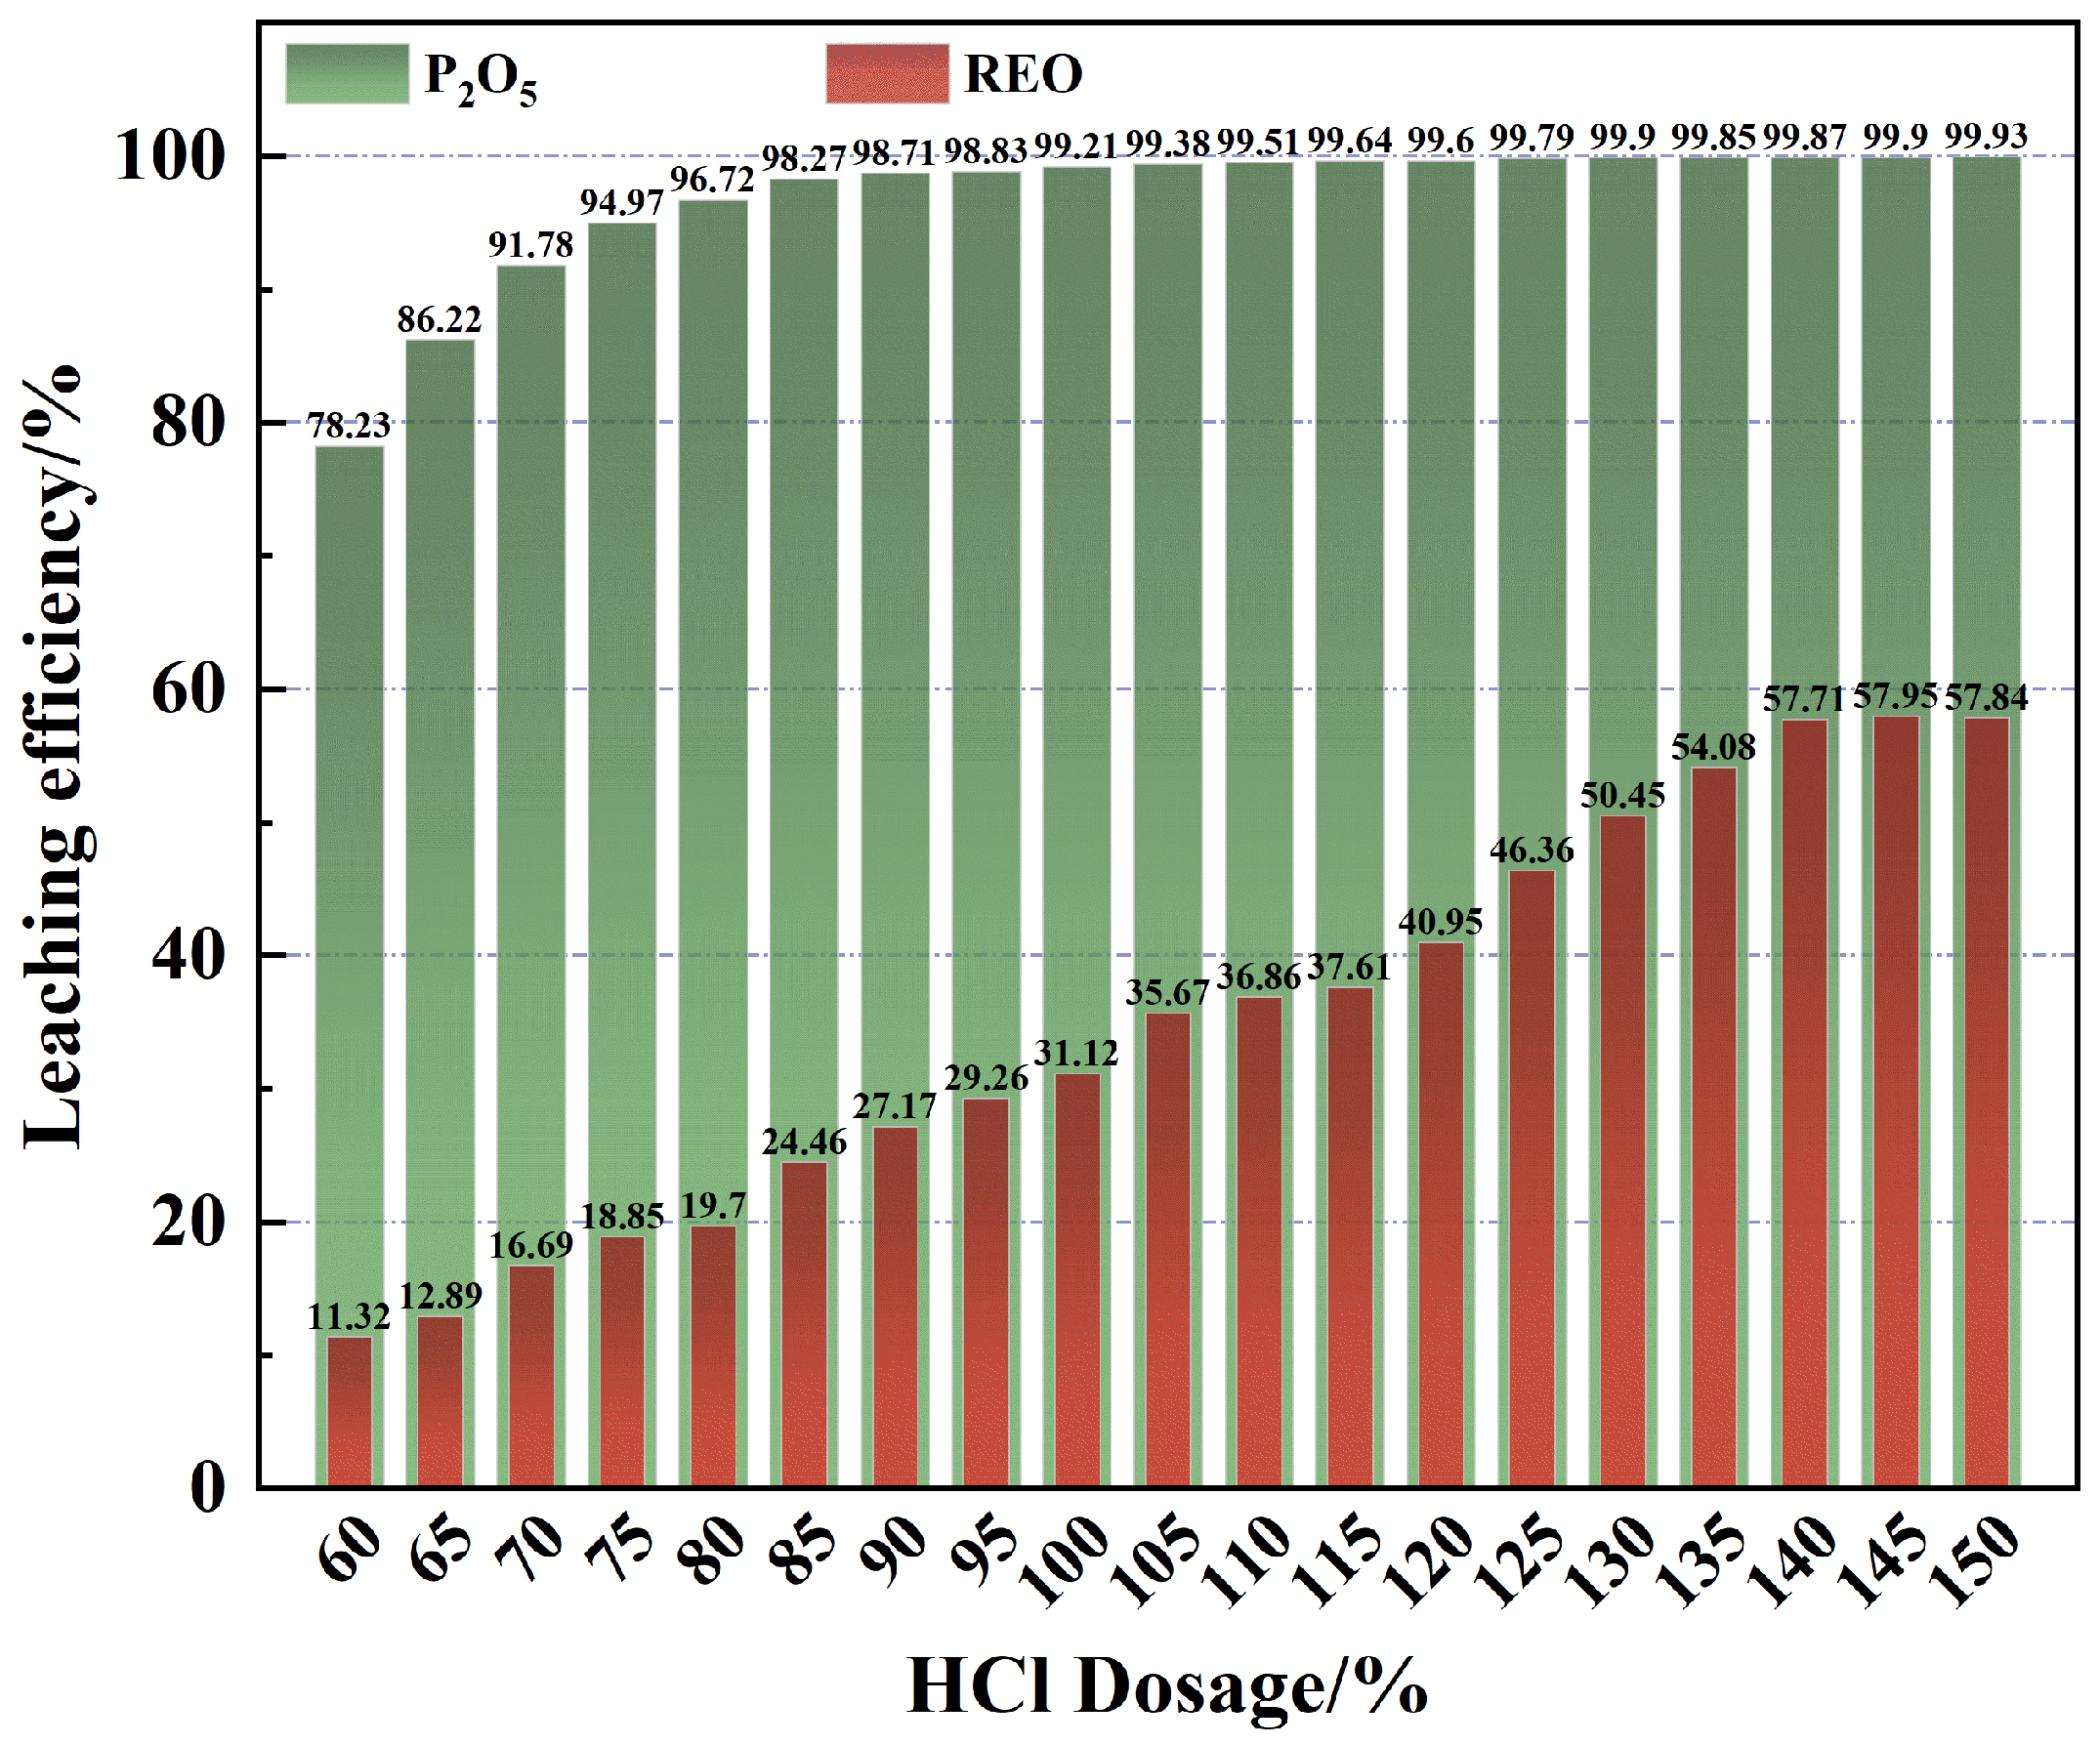
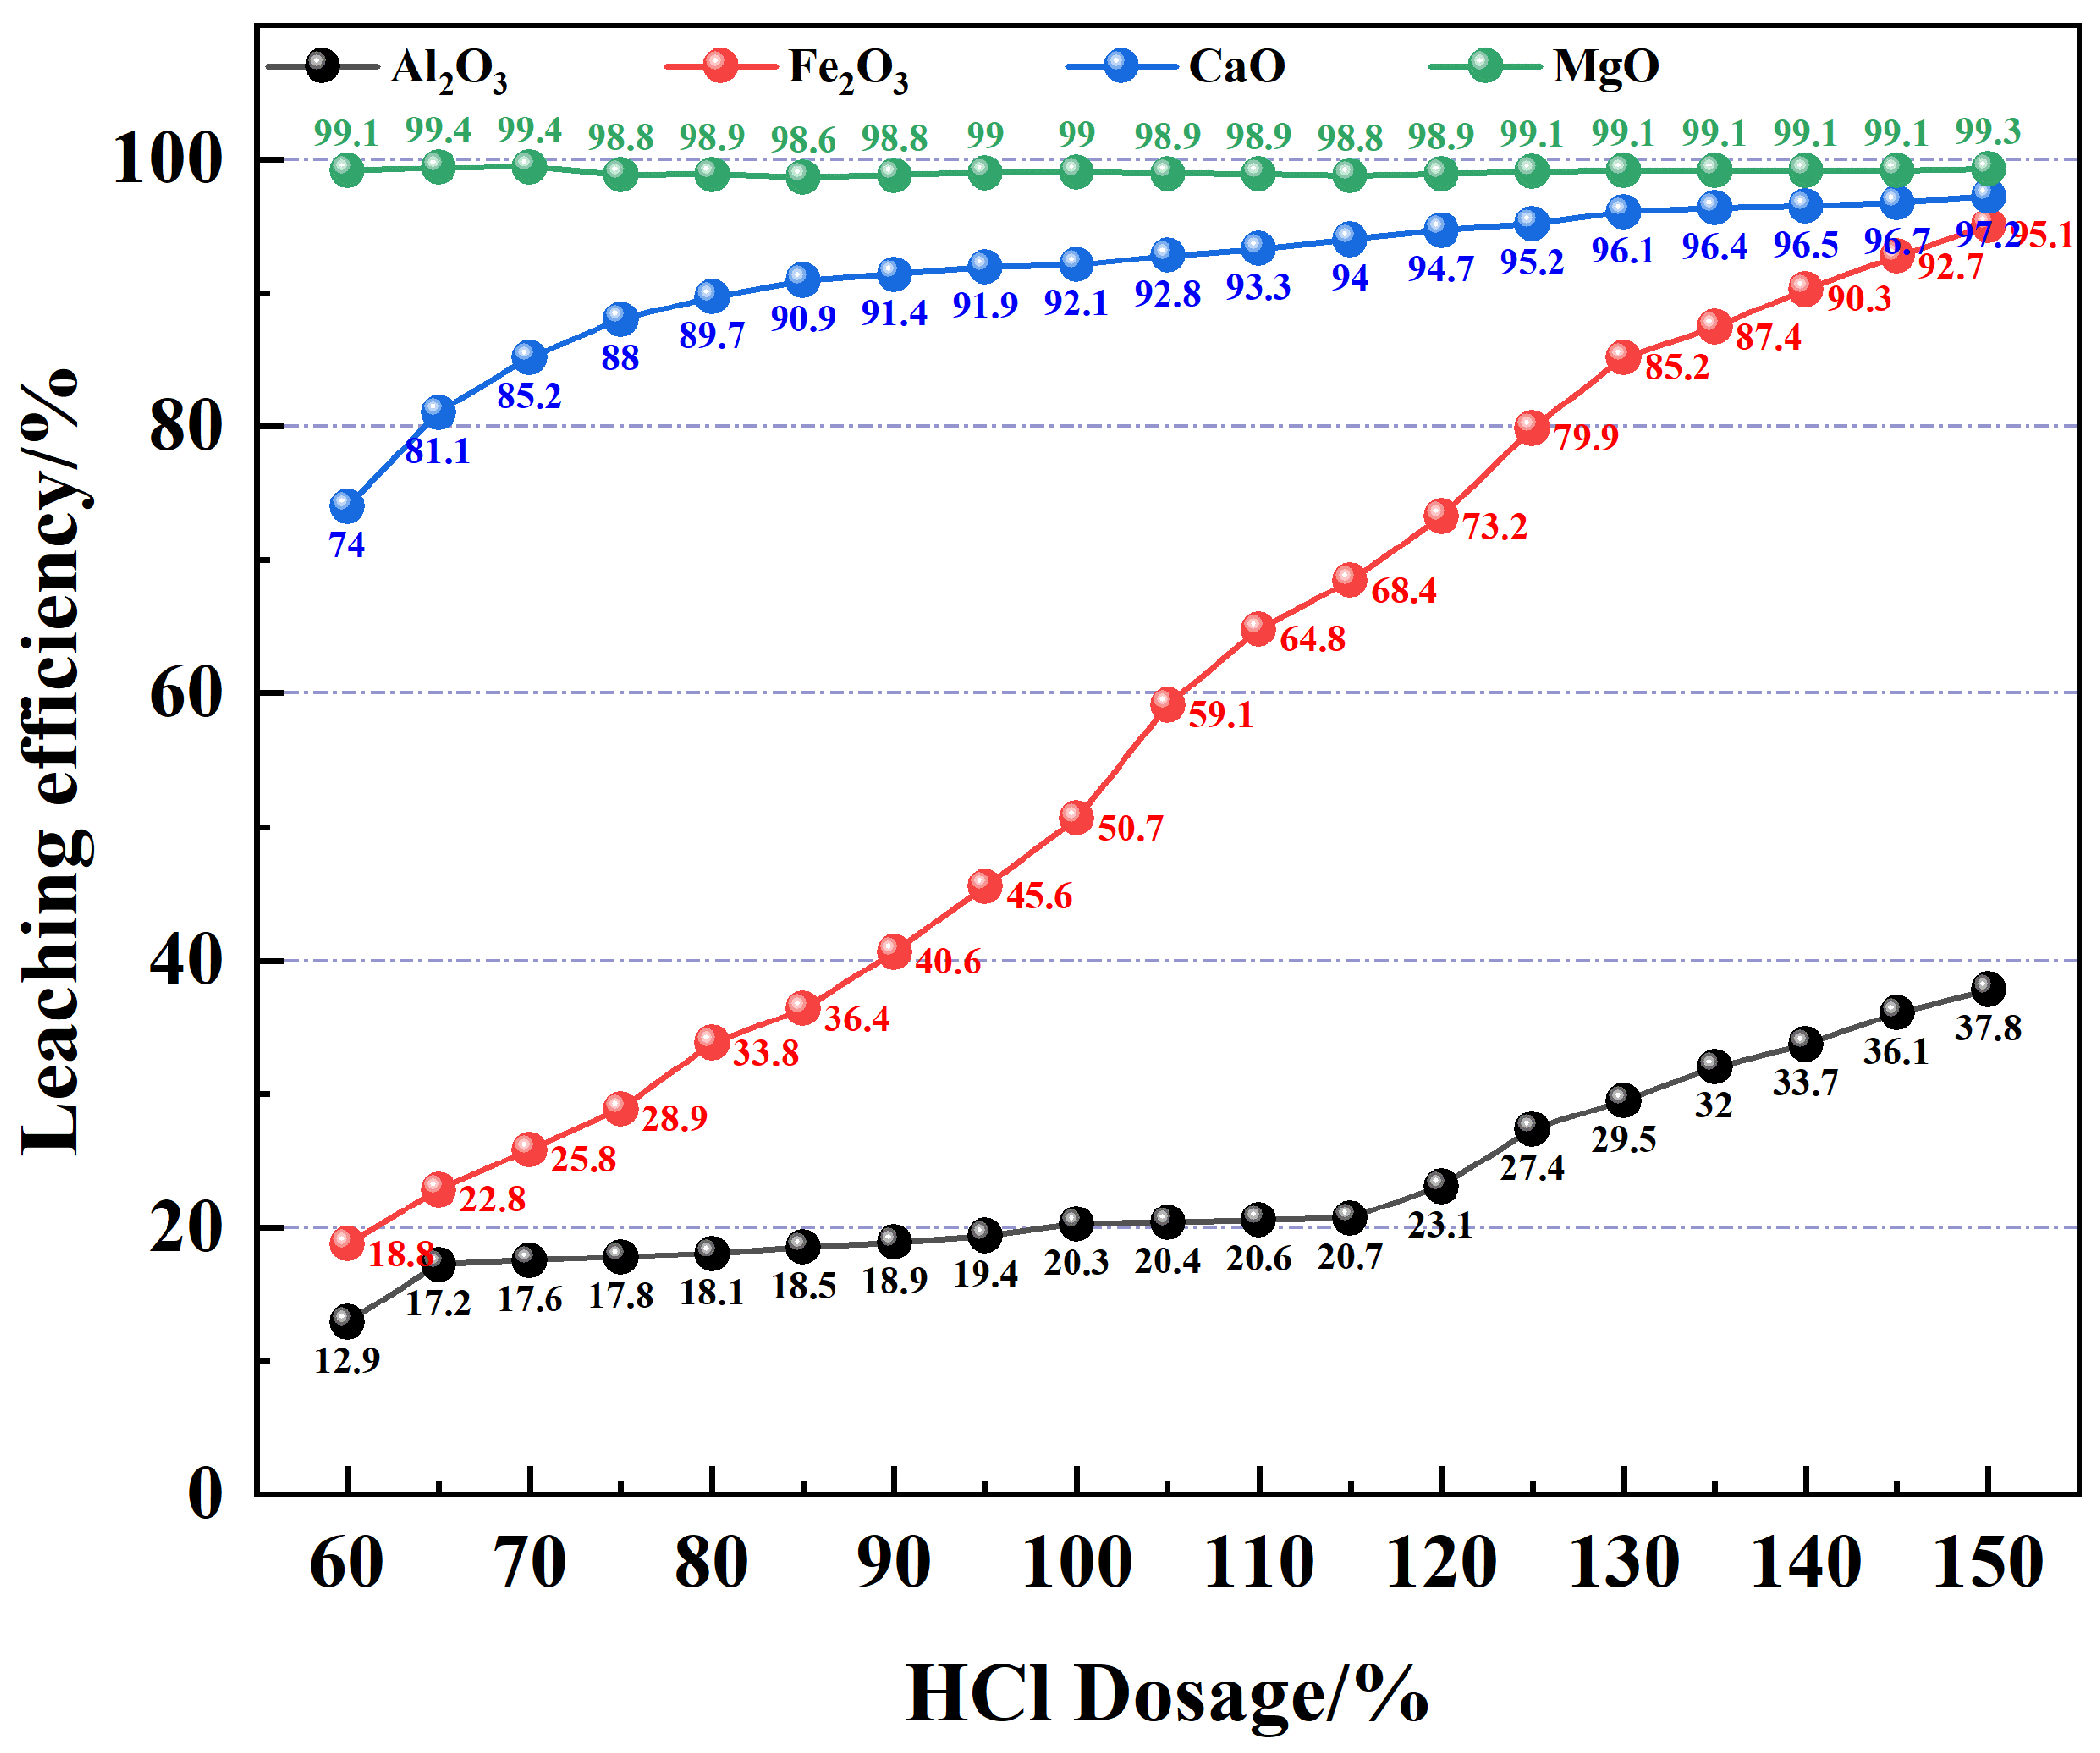
To investigate the effect of hydrochloric acid consumption on the leaching rates of phosphorus and rare earth elements during the hydrochloric acid decomposition of rare earth-associated phosphate concentrate, leaching experiments were conducted under the following conditions: temperature of 40 °C, leaching time of 40 min, stirring speed of 300 r/min, and solid–liquid ratio of 1:4. The amount of hydrochloric acid used in the leaching process was varied to examine its impact on the leaching rates of phosphorus and rare earth elements. A 0.1% concentration of polyacrylamide was used as a flocculant for the leach residue, with an addition rate of 1% to 2% of the leachate volume. The experimental results are presented in
Figure 11 and
Figure 12.
As illustrated in
Figure 11, the results of the hydrochloric acid dosage experiments indicate that when the acid dosage is below the theoretical requirement, the leaching rate of phosphorus increases with increasing hydrochloric acid addition. When the hydrochloric acid dosage reaches 70% of the theoretical requirement, the phosphorus leaching rate already exceeds 90%. In contrast, the leaching rate of rare earth elements exhibits a pronounced positive correlation with hydrochloric acid dosage. As the hydrochloric acid addition increases from 60% to 150% of the theoretical requirement, the leaching rate of rare earth elements rises from 11.32% to 57.87%.
From
Figure 12, it can be observed that the leaching rate of the impurity element magnesium (Mg) does not change with the increase in hydrochloric acid consumption, remaining above 99%. Magnesium is primarily hosted in dolomite (CaMg(CO
3)
2), and the thermodynamic calculations show that the reaction between dolomite and hydrochloric acid is highly spontaneous and does not require additional heat. This suggests that the residual dolomite in the rare earth-associated phosphate concentrate will react with hydrochloric acid first. The next impurity element is calcium (Ca). As the hydrochloric acid consumption increases, the leaching rate gradually slows, and although fluorapatite (Ca
5[PO
4]
3F) reacts easily with hydrochloric acid, its reaction priority is lower than that of dolomite. Therefore, the leaching rate of calcium in fluorapatite increases slowly as the hydrochloric acid consumption rises. Lastly, the leaching rates of iron (Fe) and aluminum (Al) both increase with the amount of acid used. The leaching rate of Fe is more significantly influenced by the increase in hydrochloric acid, rising from 18.8% to 95.1%, an increase of 76.3 percentage points. Since aluminum is primarily hosted in silicate minerals, the thermodynamic calculations show that although the reaction in Equation (1) is the most spontaneous, it is strictly limited by the main reaction. As a result, the leaching rate of Al is less affected by the increase in hydrochloric acid, rising from 12.9% to 37.8%, an increase of 24.9 percentage points.
Therefore, based on these experimental findings in conjunction with the thermodynamic analysis of the reactions, the increasing spontaneity of the reaction between fluorapatite and hydrochloric acid with rising temperature can be effectively exploited. By precisely controlling the dosage of hydrochloric acid and the reaction temperature, phosphorus within fluorapatite can be preferentially dissolved while rare earth elements remain enriched in the leaching residue, thereby achieving the objective of preferential phosphorus leaching from rare earth-bearing phosphate concentrate.
3.3.2. Study on the Preferential Leaching Process of Phosphorus from Rare Earth-Bearing Phosphate Concentrate
The results of the hydrochloric acid consumption leaching test indicate that during the hydrochloric acid decomposition of rare earth-associated phosphate concentrate, when the hydrochloric acid consumption reaches 70% of the theoretical amount, the leaching rate of phosphorus can exceed 90%. The leaching rate of rare earth elements in the concentrate is significantly affected by the amount of hydrochloric acid used. As the amount of hydrochloric acid increases, the leaching rate shows a marked increase. Considering the characteristics of this rare earth-bearing phosphate concentrate, the preferential leaching of phosphorus through controlled hydrochloric acid dosage can not only reduce acid consumption and limit the dissolution of impurity elements—thereby restricting their entry into the leachate—but also enable the effective enrichment of rare earth elements within the leaching residue.
(1) The effect of leaching time on phosphorus leaching rate
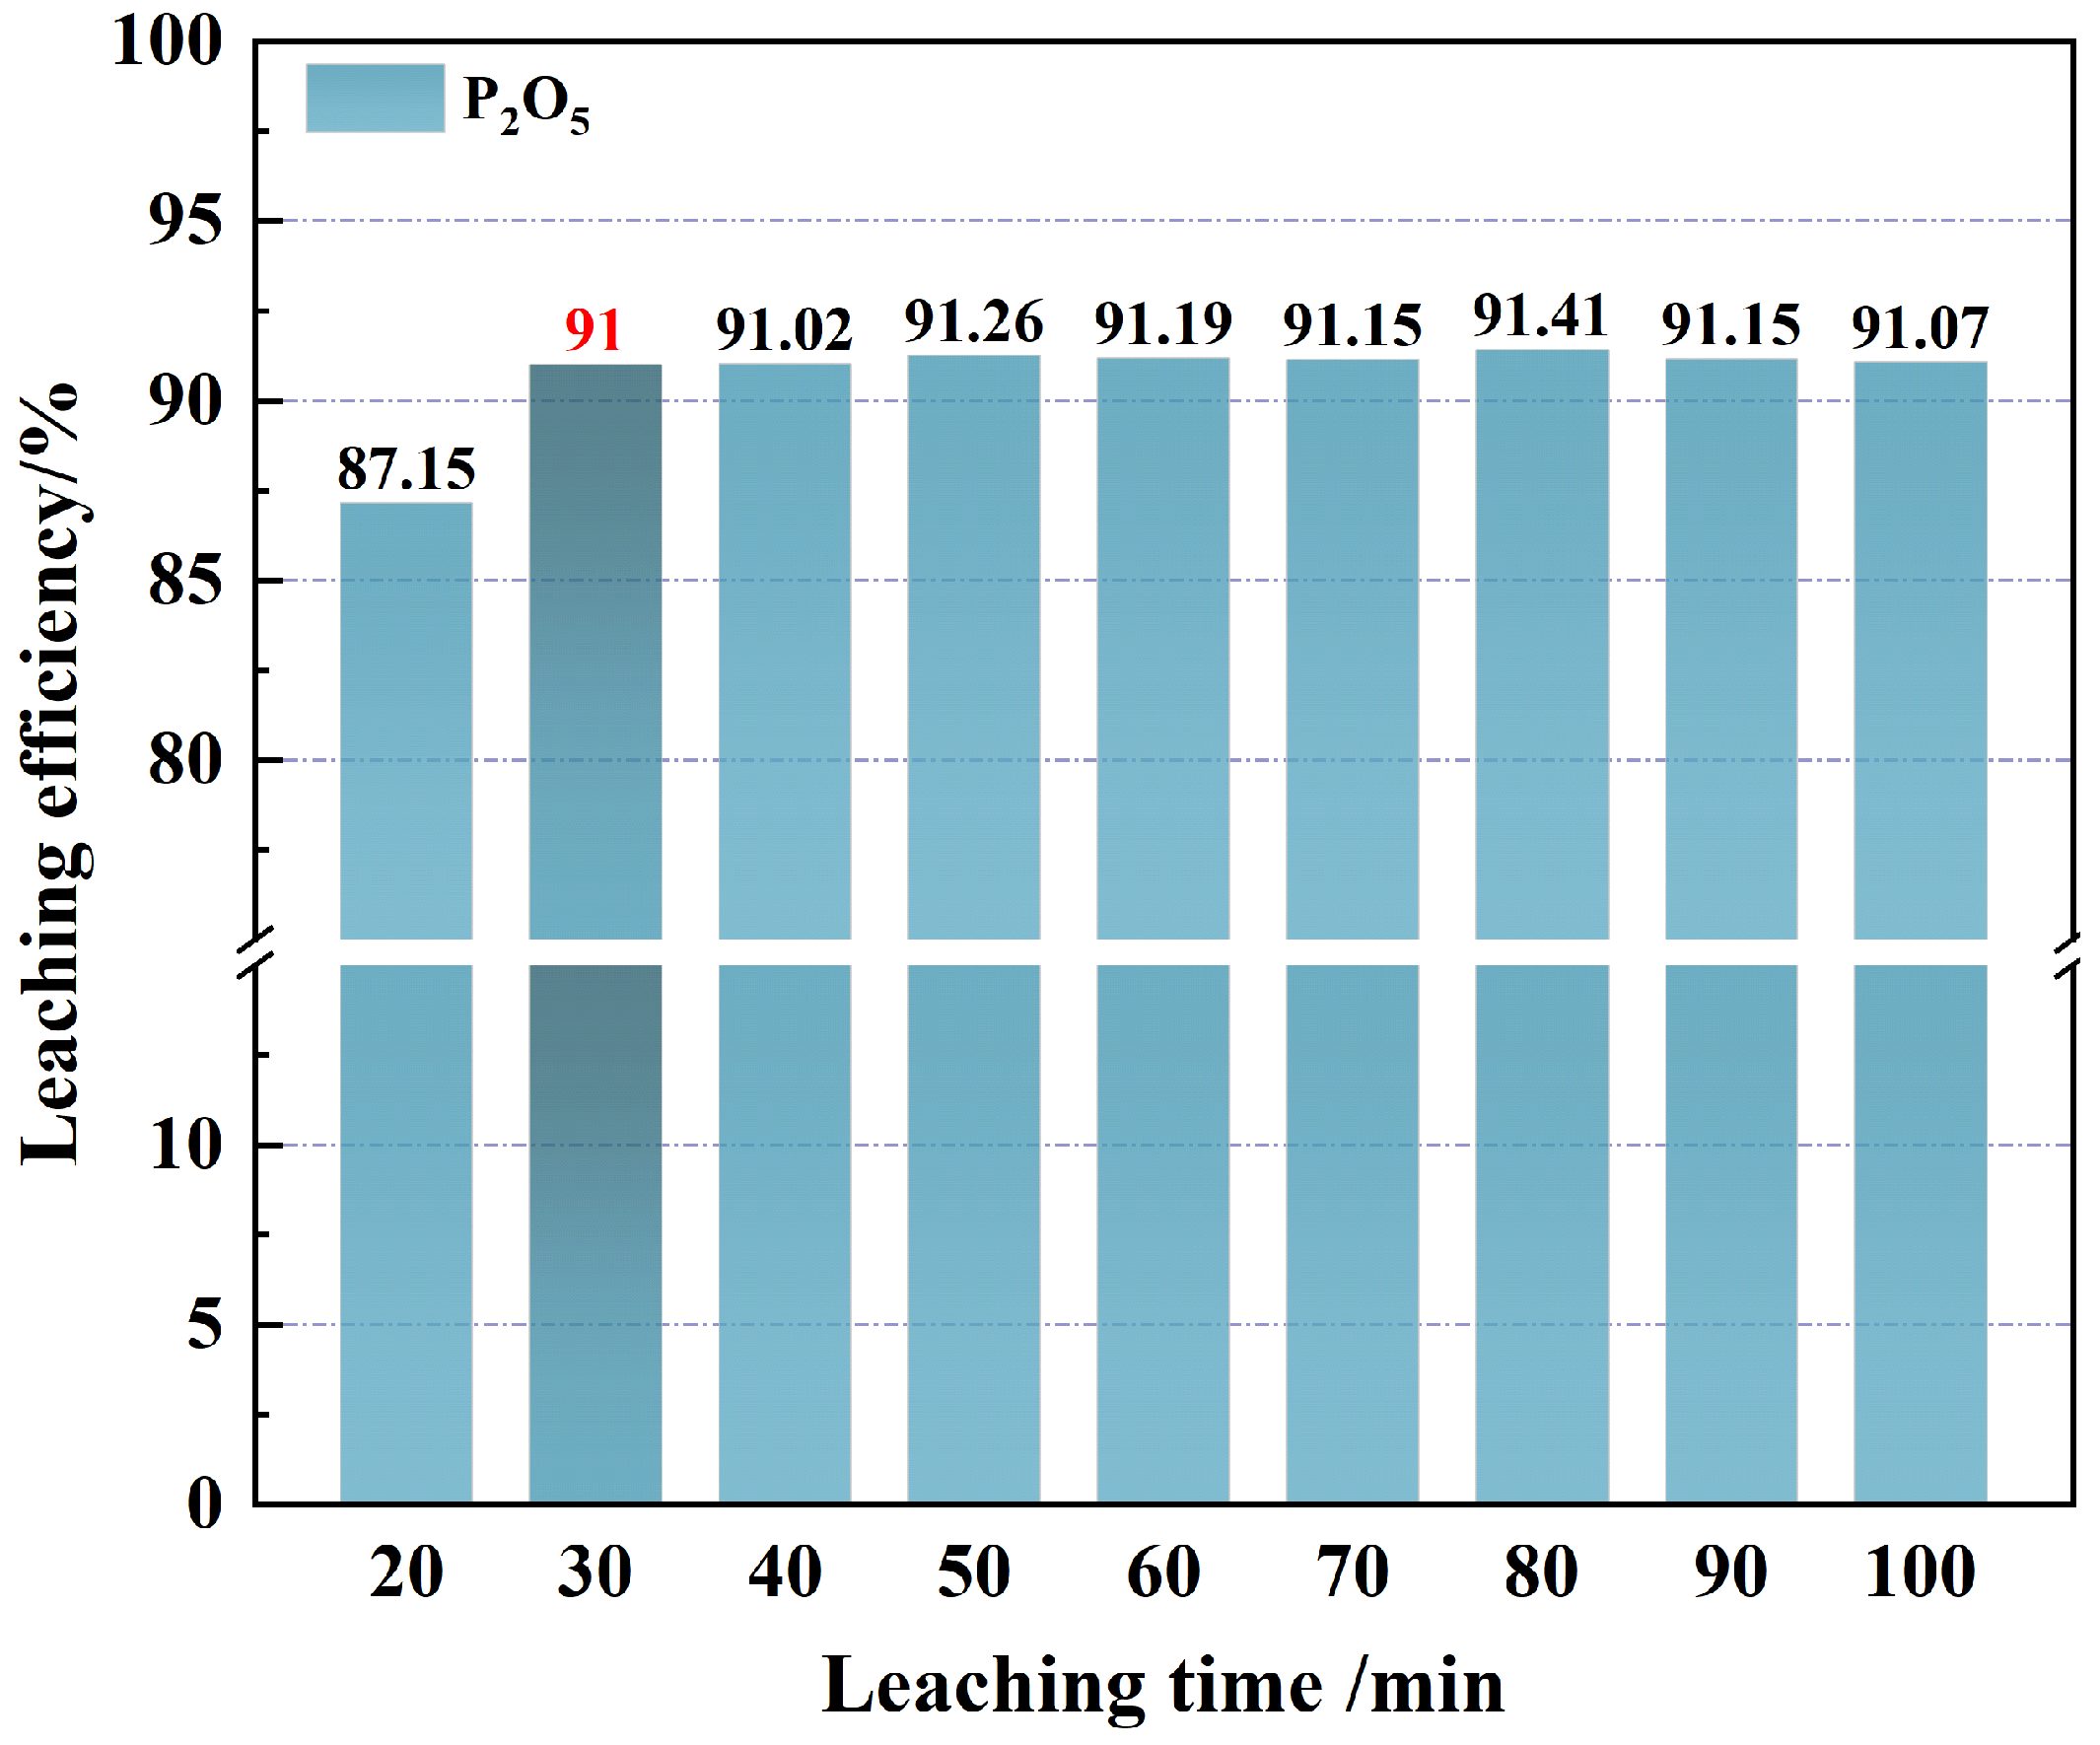
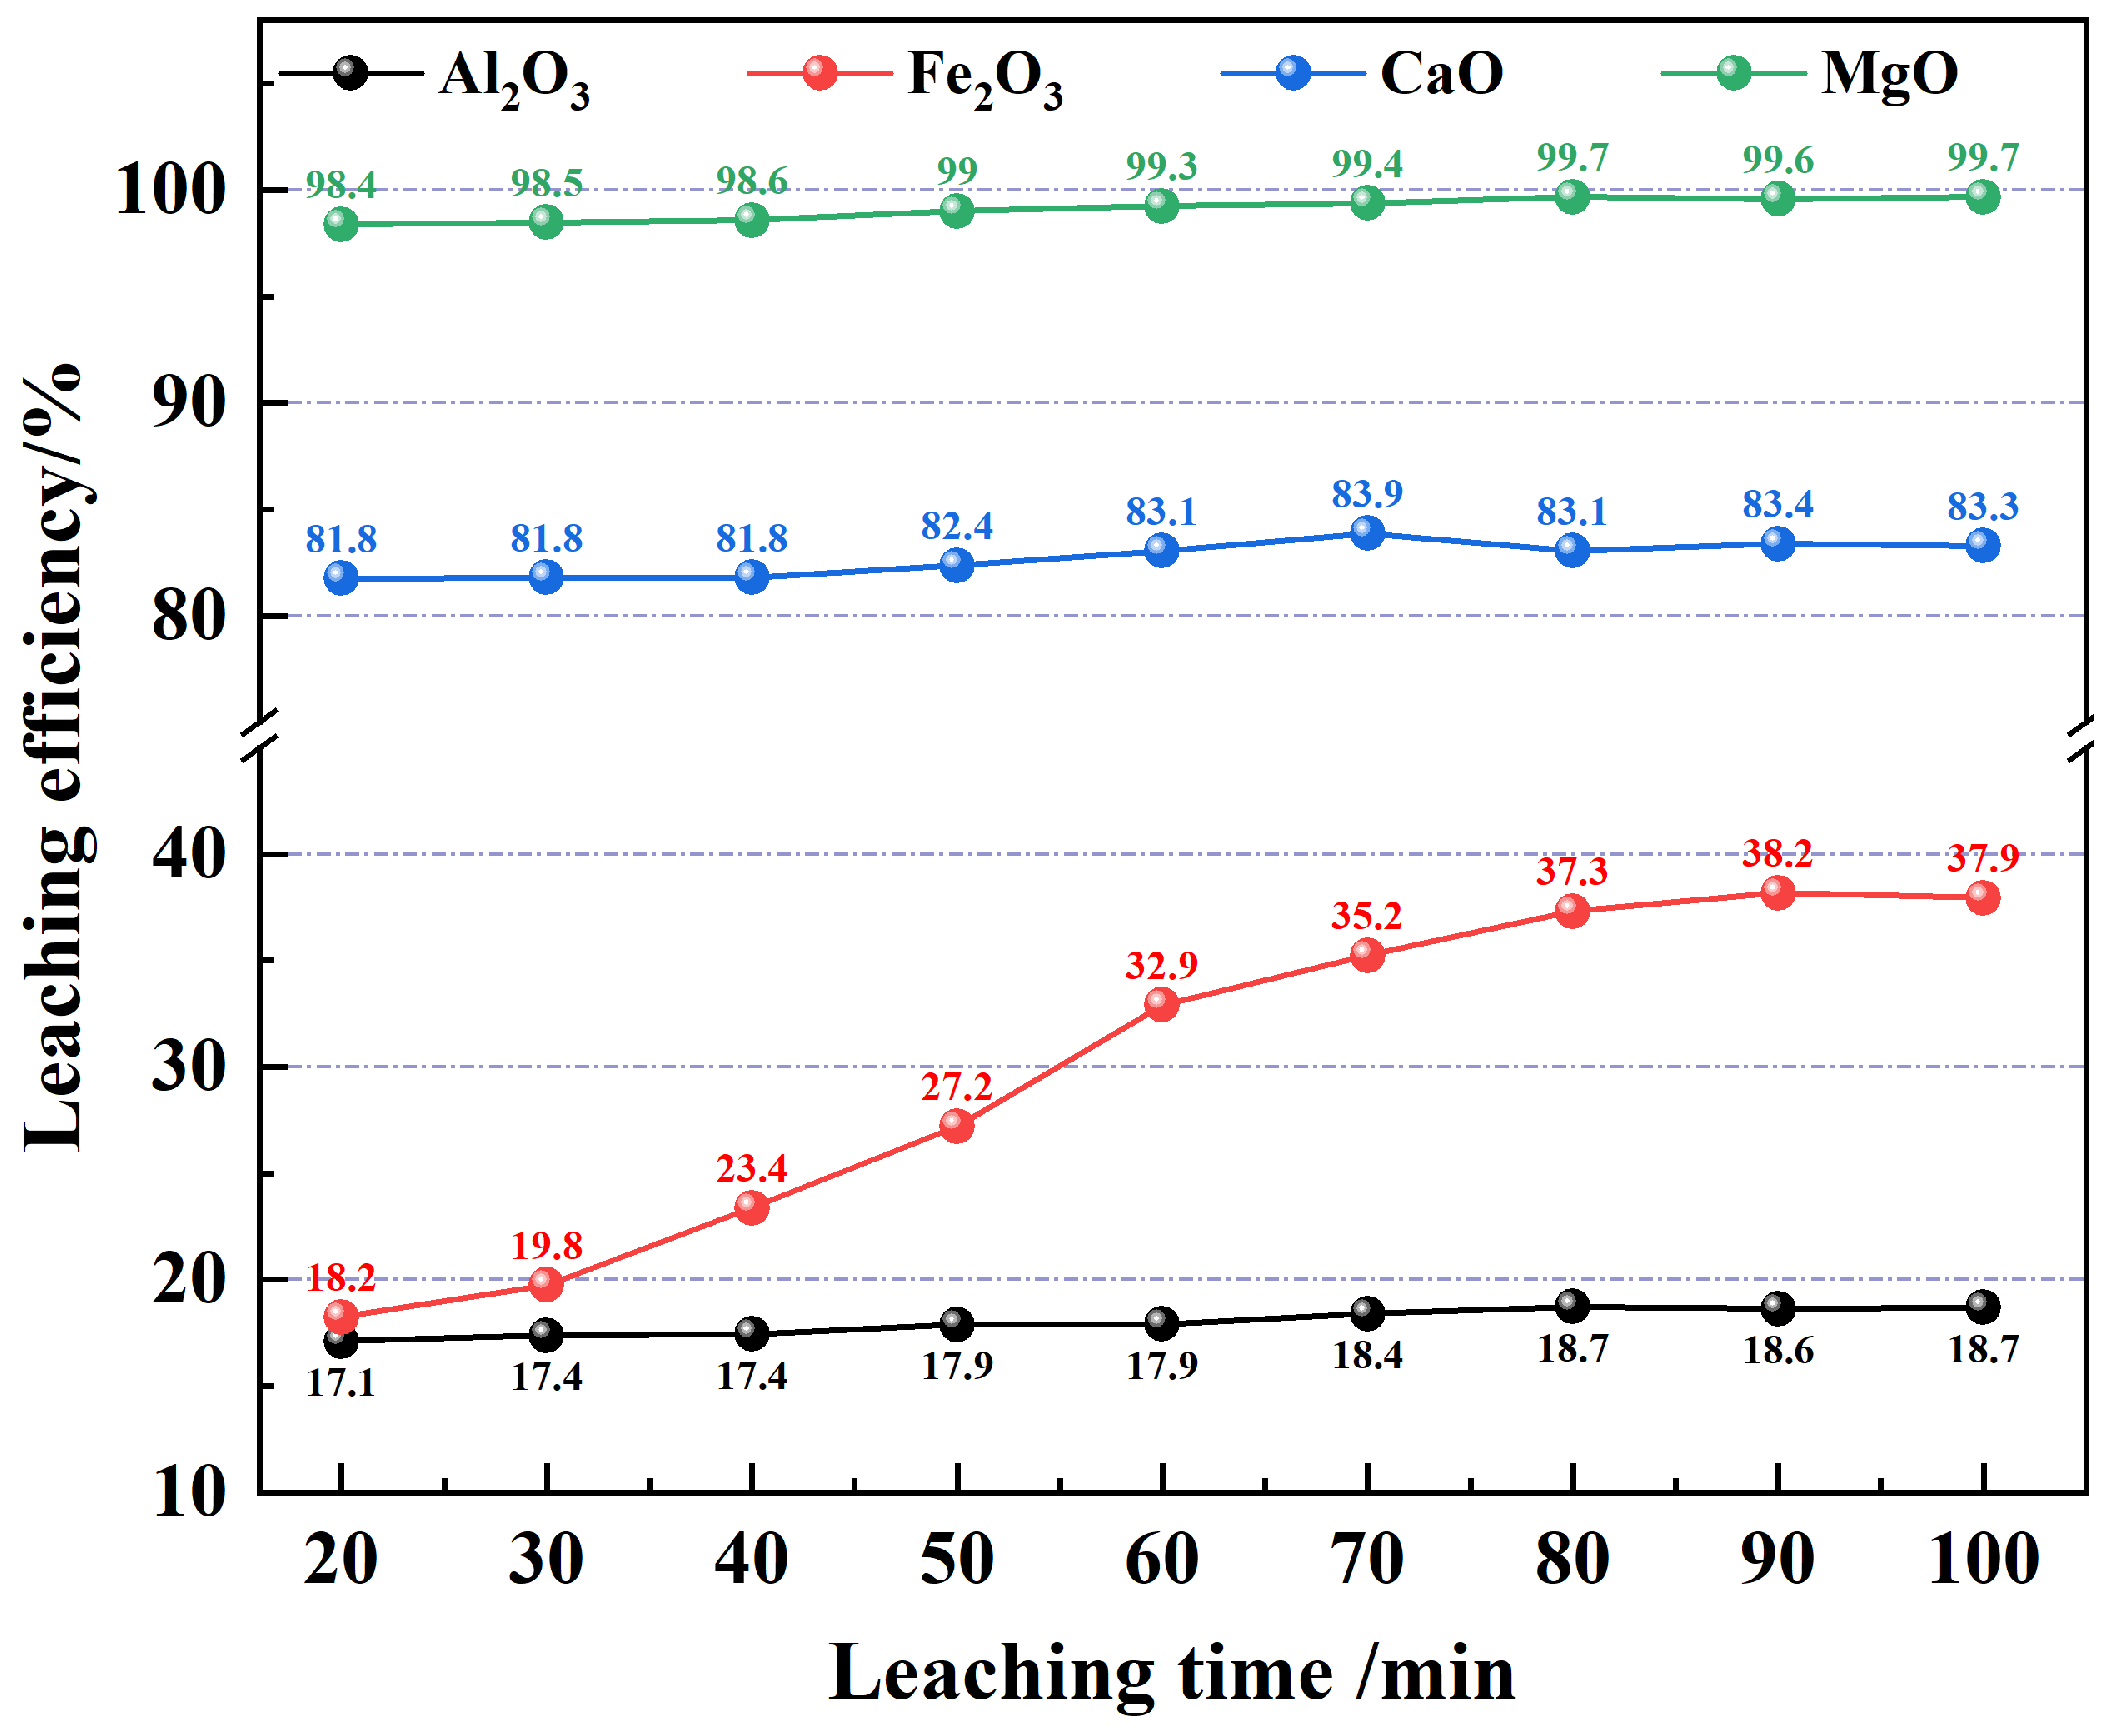
Based on the existing hydrochloric acid consumption test results, the optimal hydrochloric acid consumption for phosphorus leaching is determined to be 70% of the theoretical amount. Phosphorus and impurity elements, such as aluminum, iron, calcium, and magnesium, were selected as the main indicators for investigation. Under the conditions of a leaching temperature of 40 °C, stirring speed of 300 r/min, and solid–liquid ratio of 1:4, the leaching time was varied to conduct selective phosphorus leaching tests. The effect of leaching time on the phosphorus leaching rate was studied. The experimental results are presented in
Figure 13 and
Figure 14.
From
Figure 13, it can be observed that at a leaching time of 30 min, the phosphorus leaching rate reaches 91%. With an increase in leaching time, the phosphorus leaching rate does not show a significant rise. Combining the leaching rates of impurity elements from
Figure 14, it can be seen that as leaching time increases, the leaching rates of Ca, Al, and Mg remain relatively unchanged. However, at a leaching time of 30 min, compared to the hydrochloric acid consumption test results, the leaching rate of Ca decreases by 3.4 percentage points, Al decreases by 0.2 percentage points, and Mg decreases by 0.9 percentage points. The leaching rate of Fe is more significantly influenced by the increase in leaching time, rising from 18.2% at 20 min to 37.9% at 100 min, an increase of 19.7 percentage points. At 30 min of leaching time, compared to the hydrochloric acid consumption test, the leaching rate of Fe decreased by 6 percentage points. Therefore, the optimal leaching time is determined to be 30 min, reducing the leaching time by 10 min.
(2) The effect of leaching temperature on phosphorus leaching rate
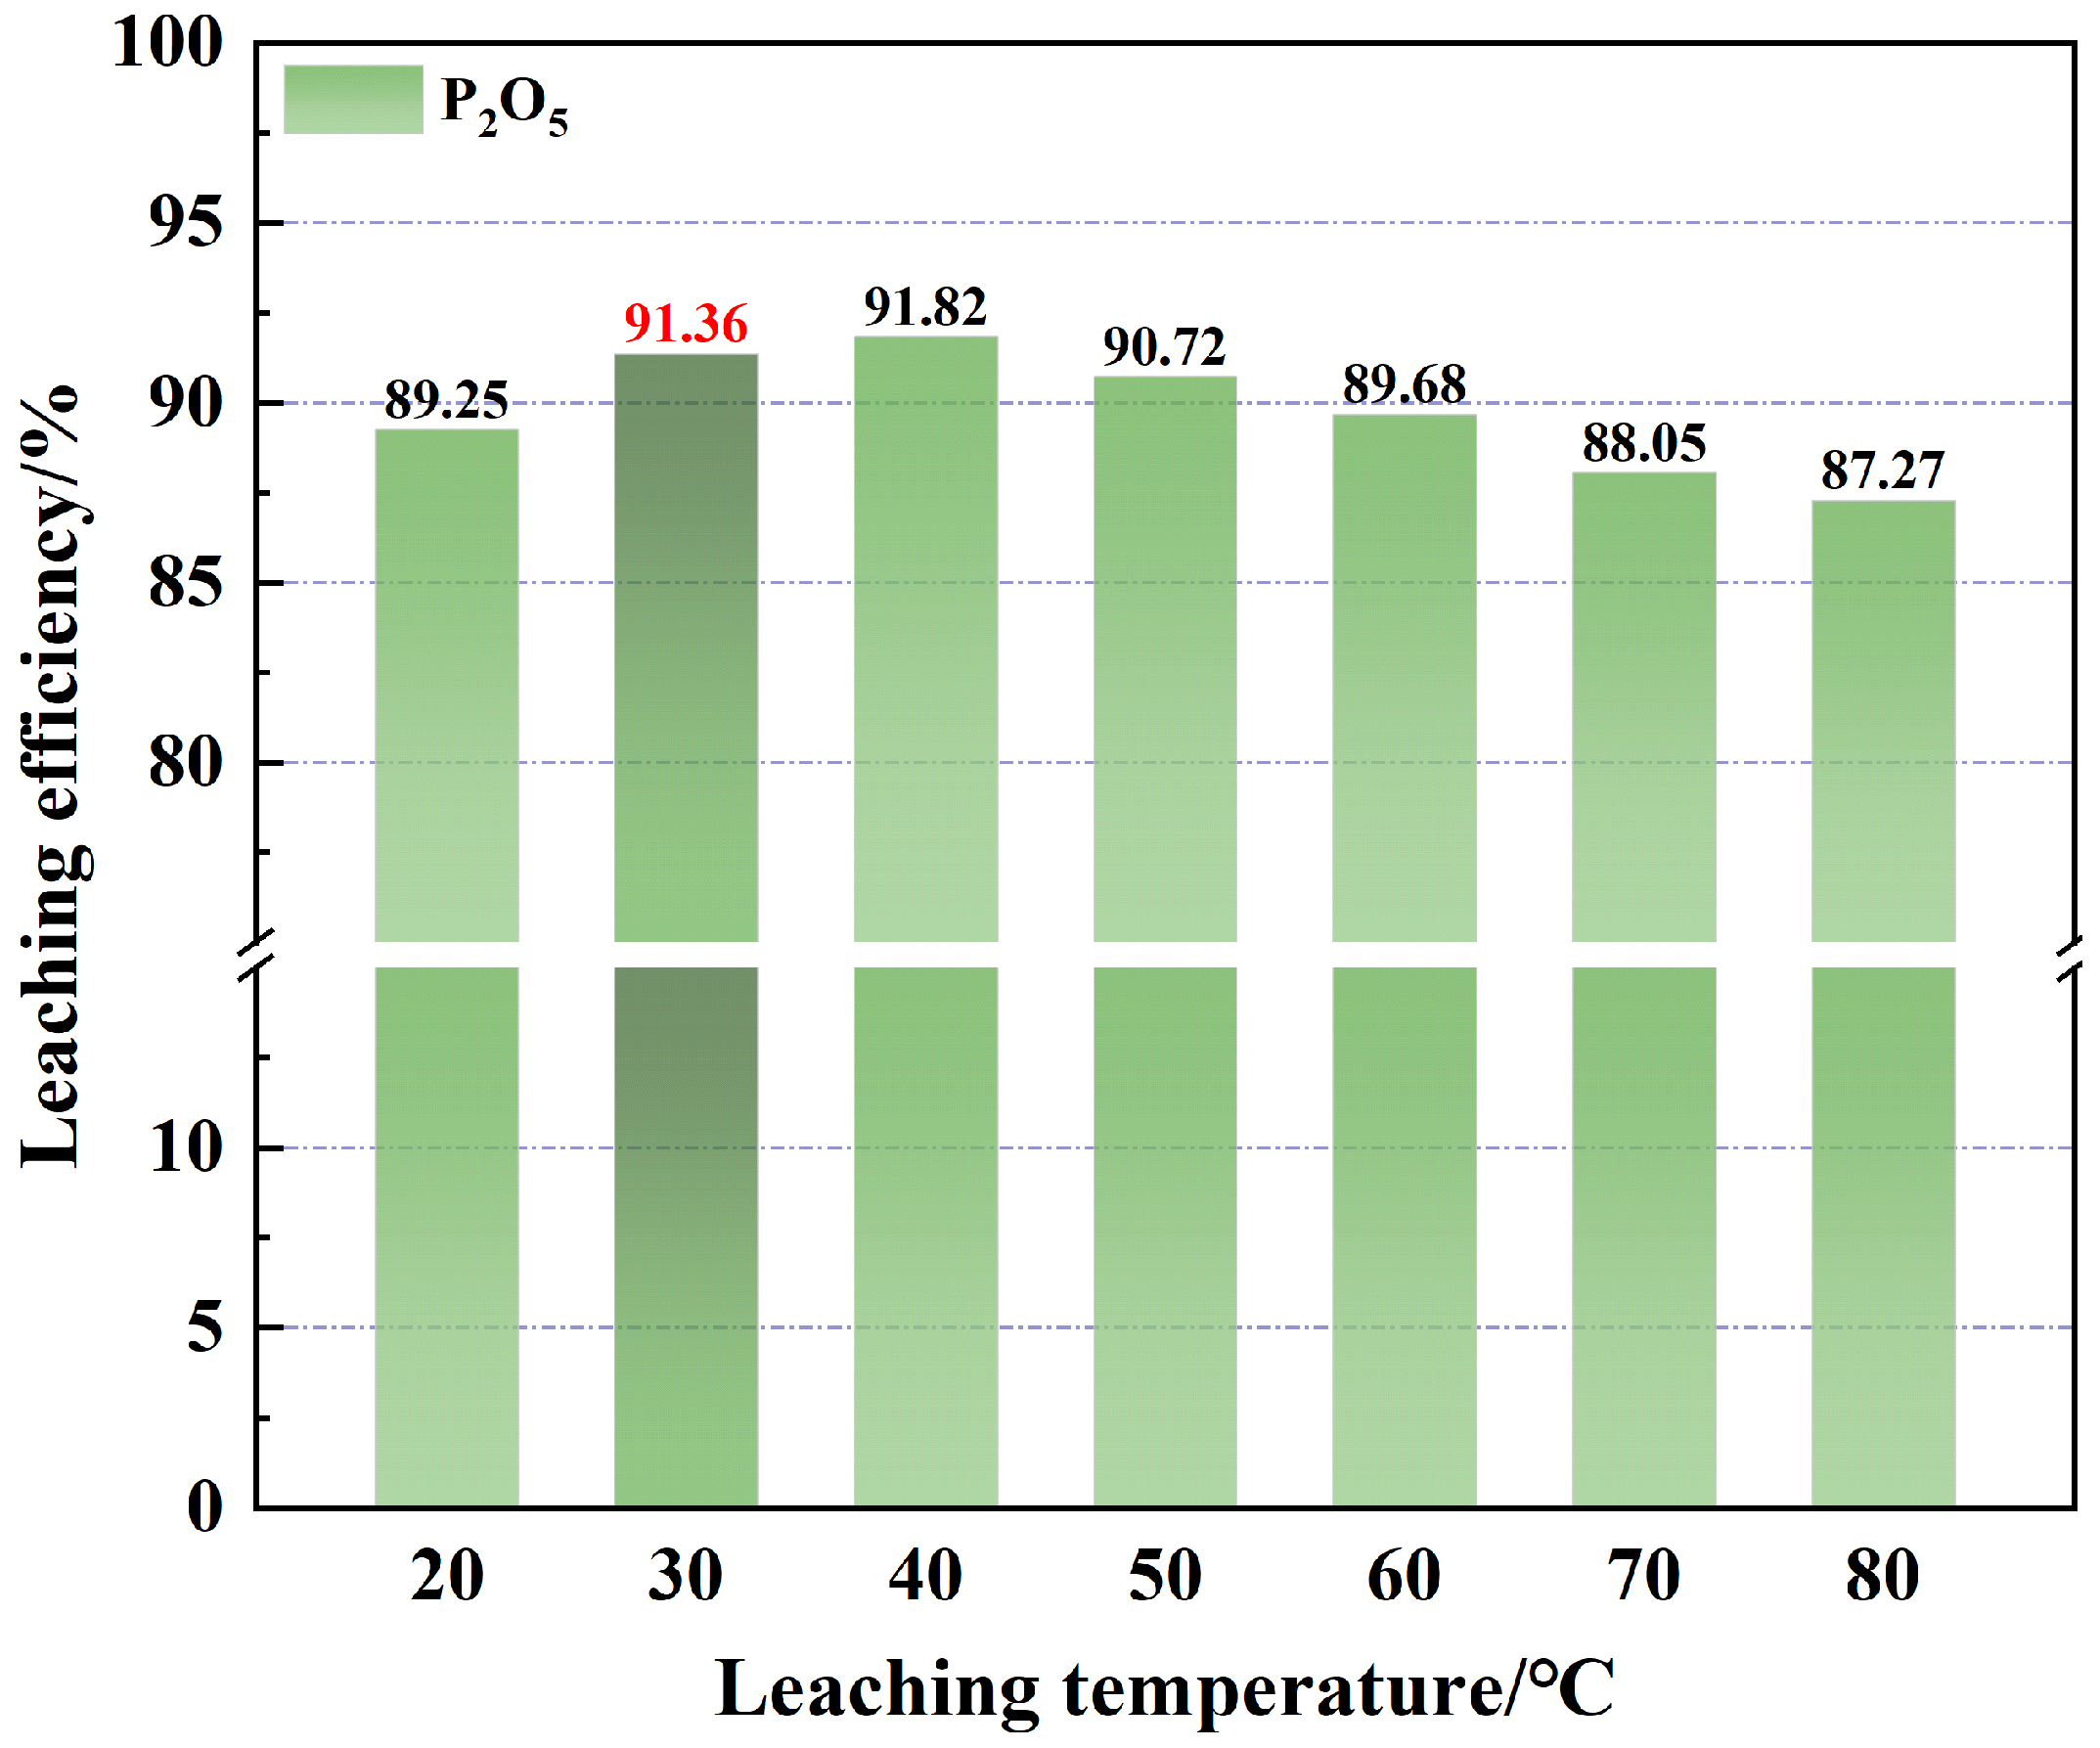
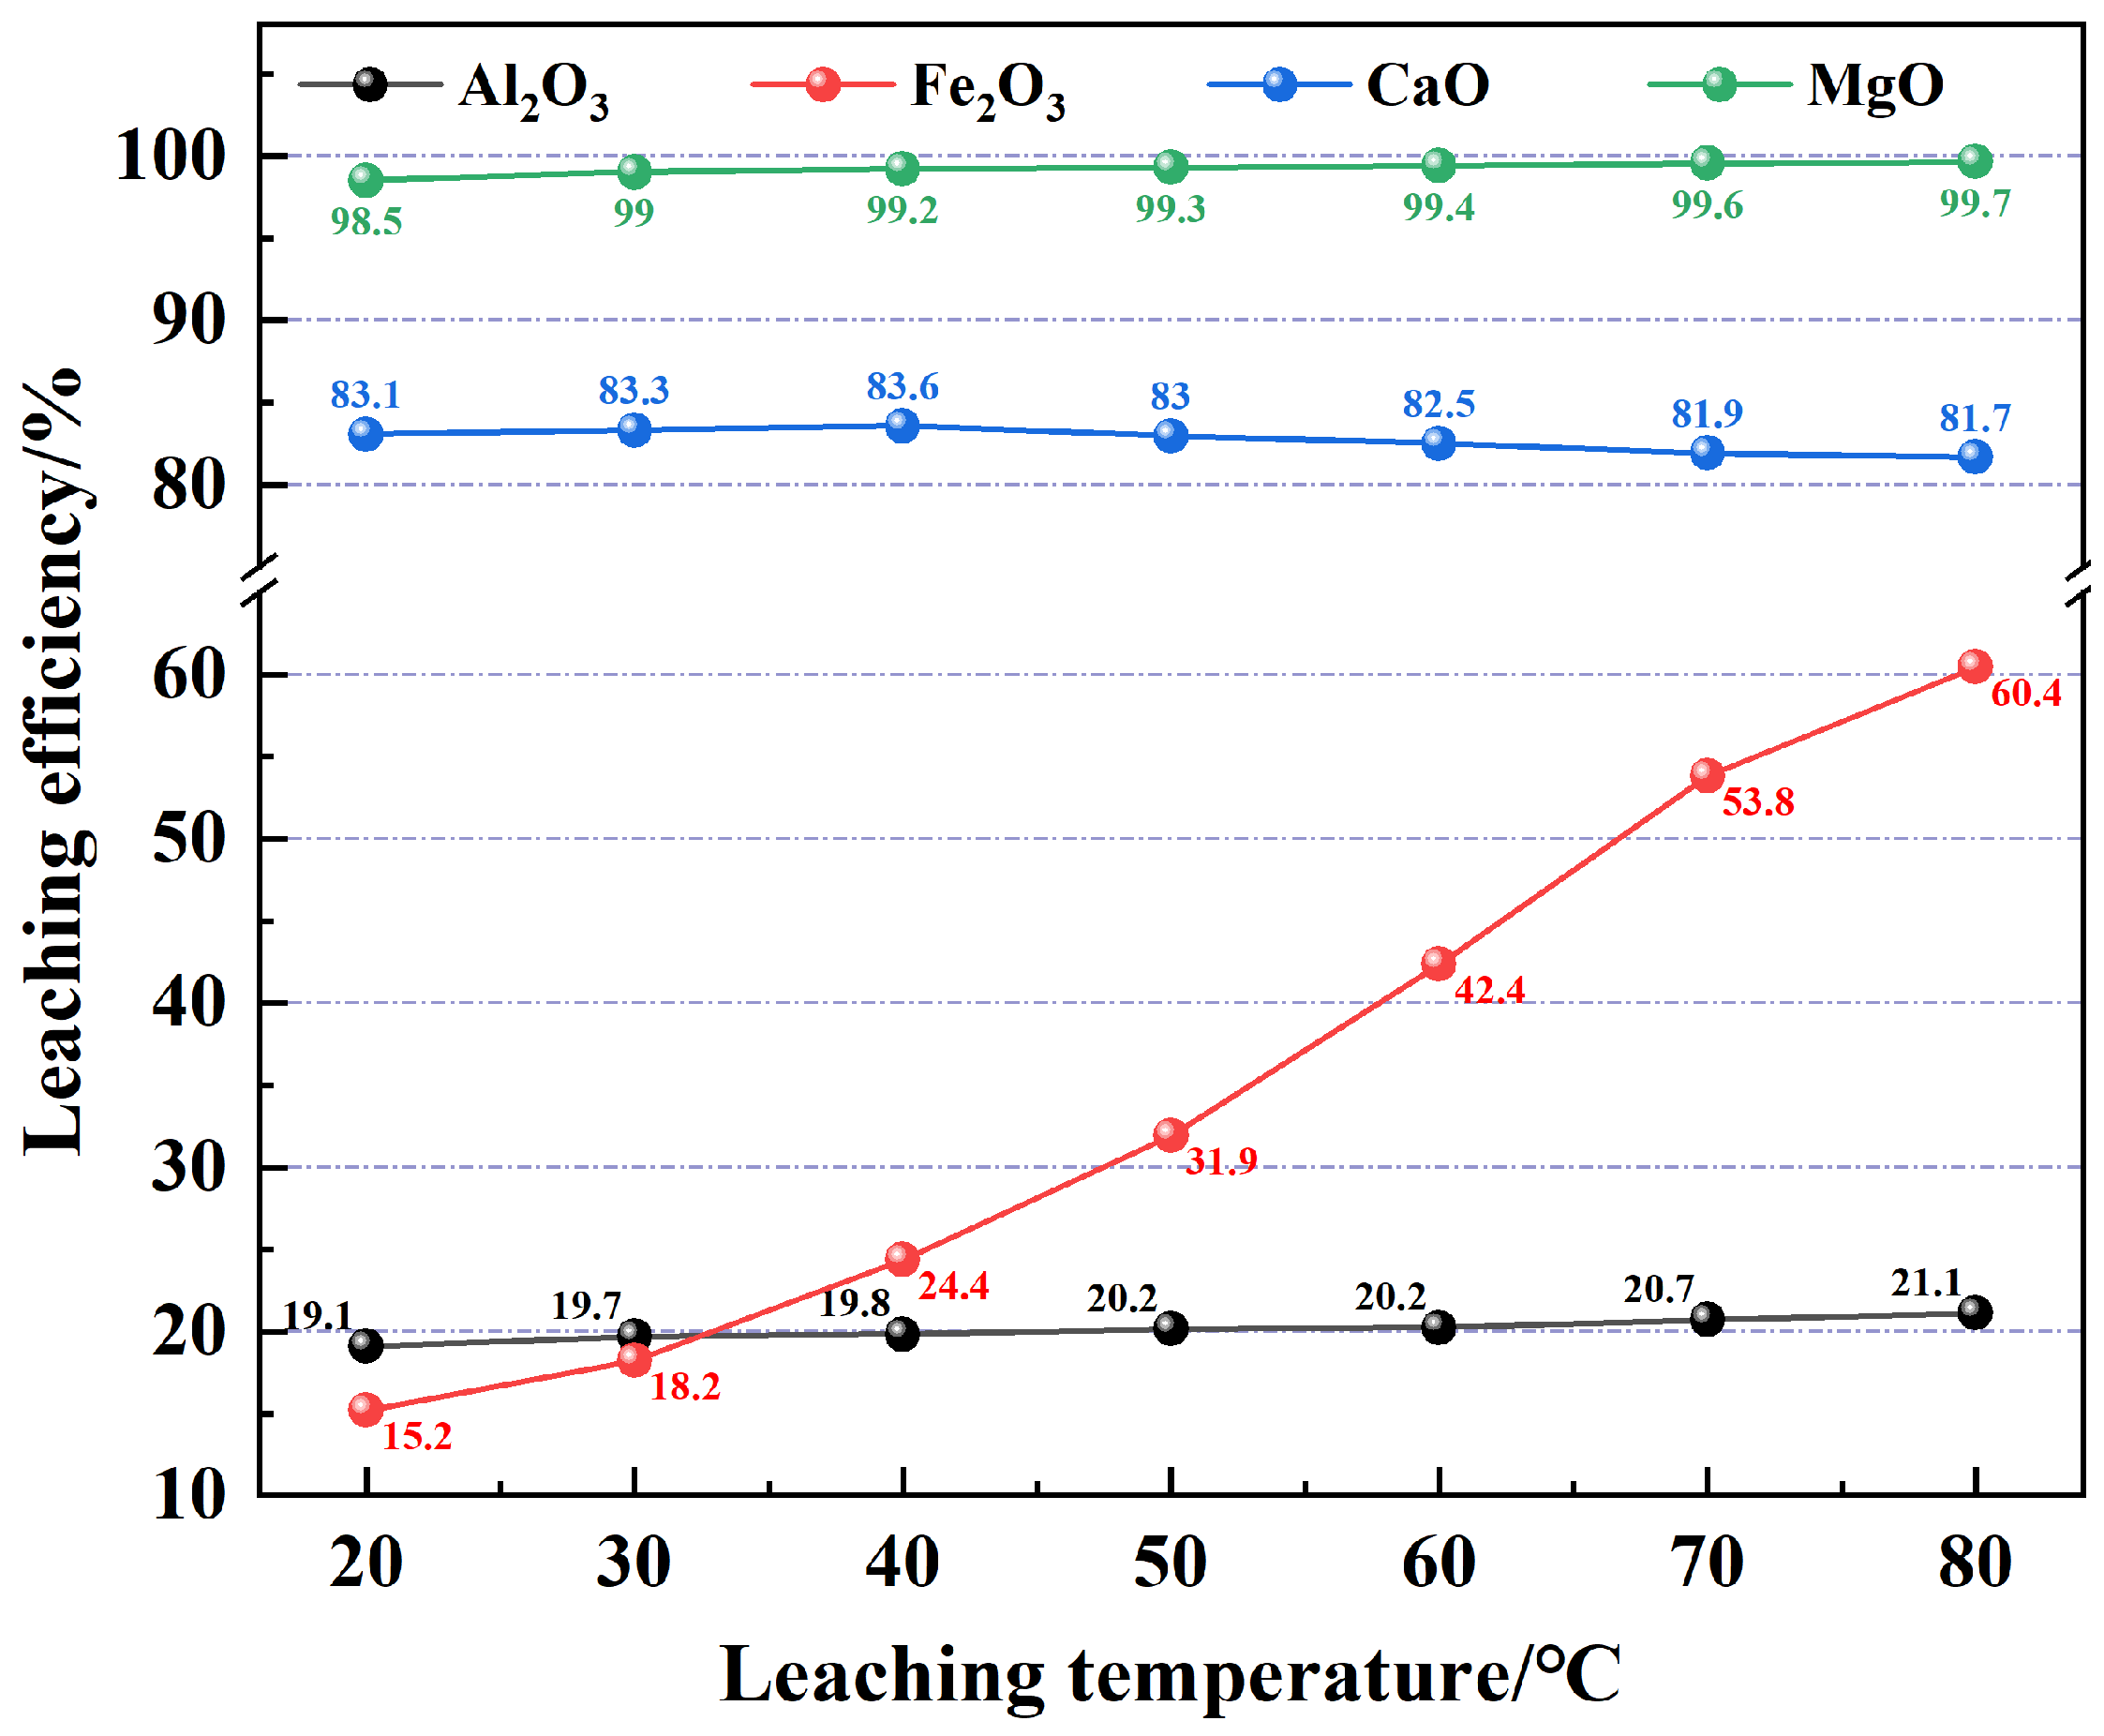
Using the optimal hydrochloric acid consumption (70%) and the optimal leaching time (30 min), the leaching temperature was varied while keeping other leaching conditions constant to study the effect of leaching temperature on the phosphorus leaching rate. The experimental results are shown in
Figure 15 and
Figure 16.
From
Figure 15, it can be observed that as the leaching temperature increases, the phosphorus leaching rate reaches a peak of 91.82% at 40 °C, after which it gradually decreases. This decline is attributed to the increased volatilization of HCl in the leaching system with higher temperature, leading to a slow decrease in phosphorus leaching rate. In
Figure 16, the leaching rates of impurity elements Mg and Al show little variation with increasing temperature. This is because Mg is hosted in dolomite, and the reaction between dolomite and hydrochloric acid has the highest priority. Aluminum, on the other hand, is hosted in silicate minerals and reacts with HF generated during the hydrochloric acid decomposition of fluorapatite. This reaction is strictly limited by the main reaction and has the lowest priority, so the effect of temperature on the leaching rates of Mg and Al is minimal. Since calcium is also abundant in fluorapatite, its leaching rate decreases slightly, similar to the trend of phosphorus leaching rate. The temperature has a significant impact on the leaching rate of iron (Fe), with the leaching rate increasing from 15.2% at 20 °C to 60.4% at 80 °C, an increase of 45.2 percentage points. By setting the reaction temperature at 30 °C, the leaching rate of Fe can be reduced by 1.6 percentage points while ensuring a high phosphorus leaching rate. Considering the leaching energy consumption and the leaching rates of impurity elements, the optimal leaching temperature is determined to be 30 °C, reducing the temperature by 10 °C.
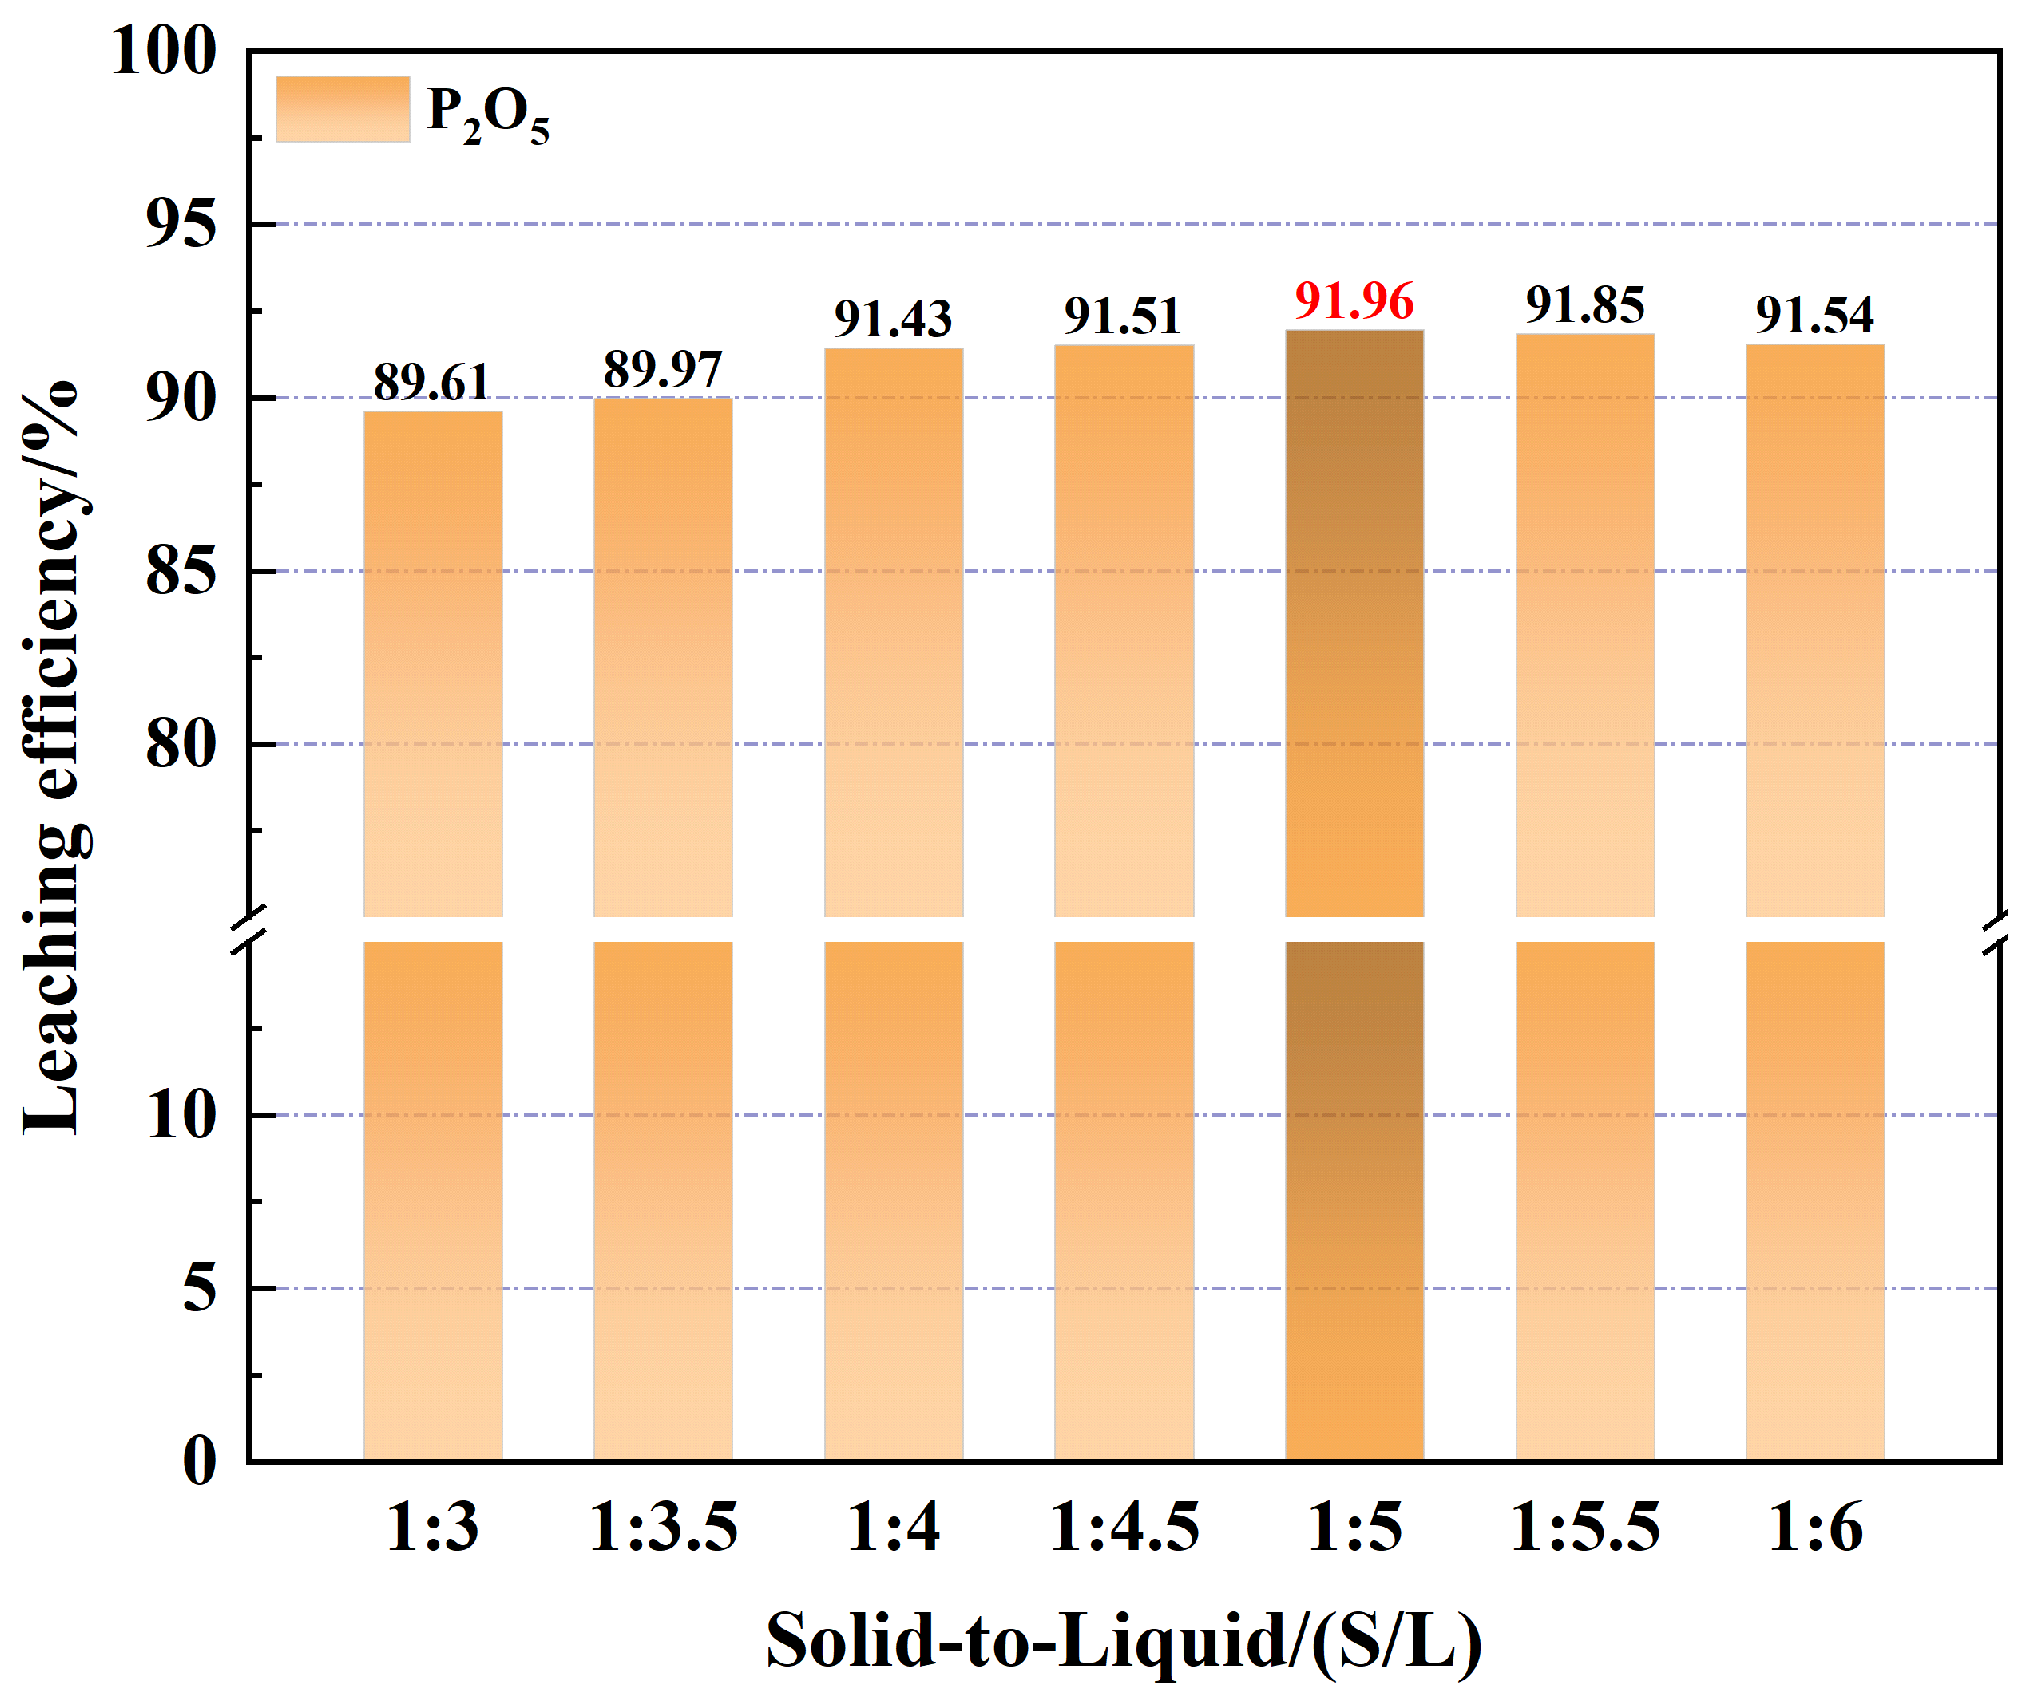
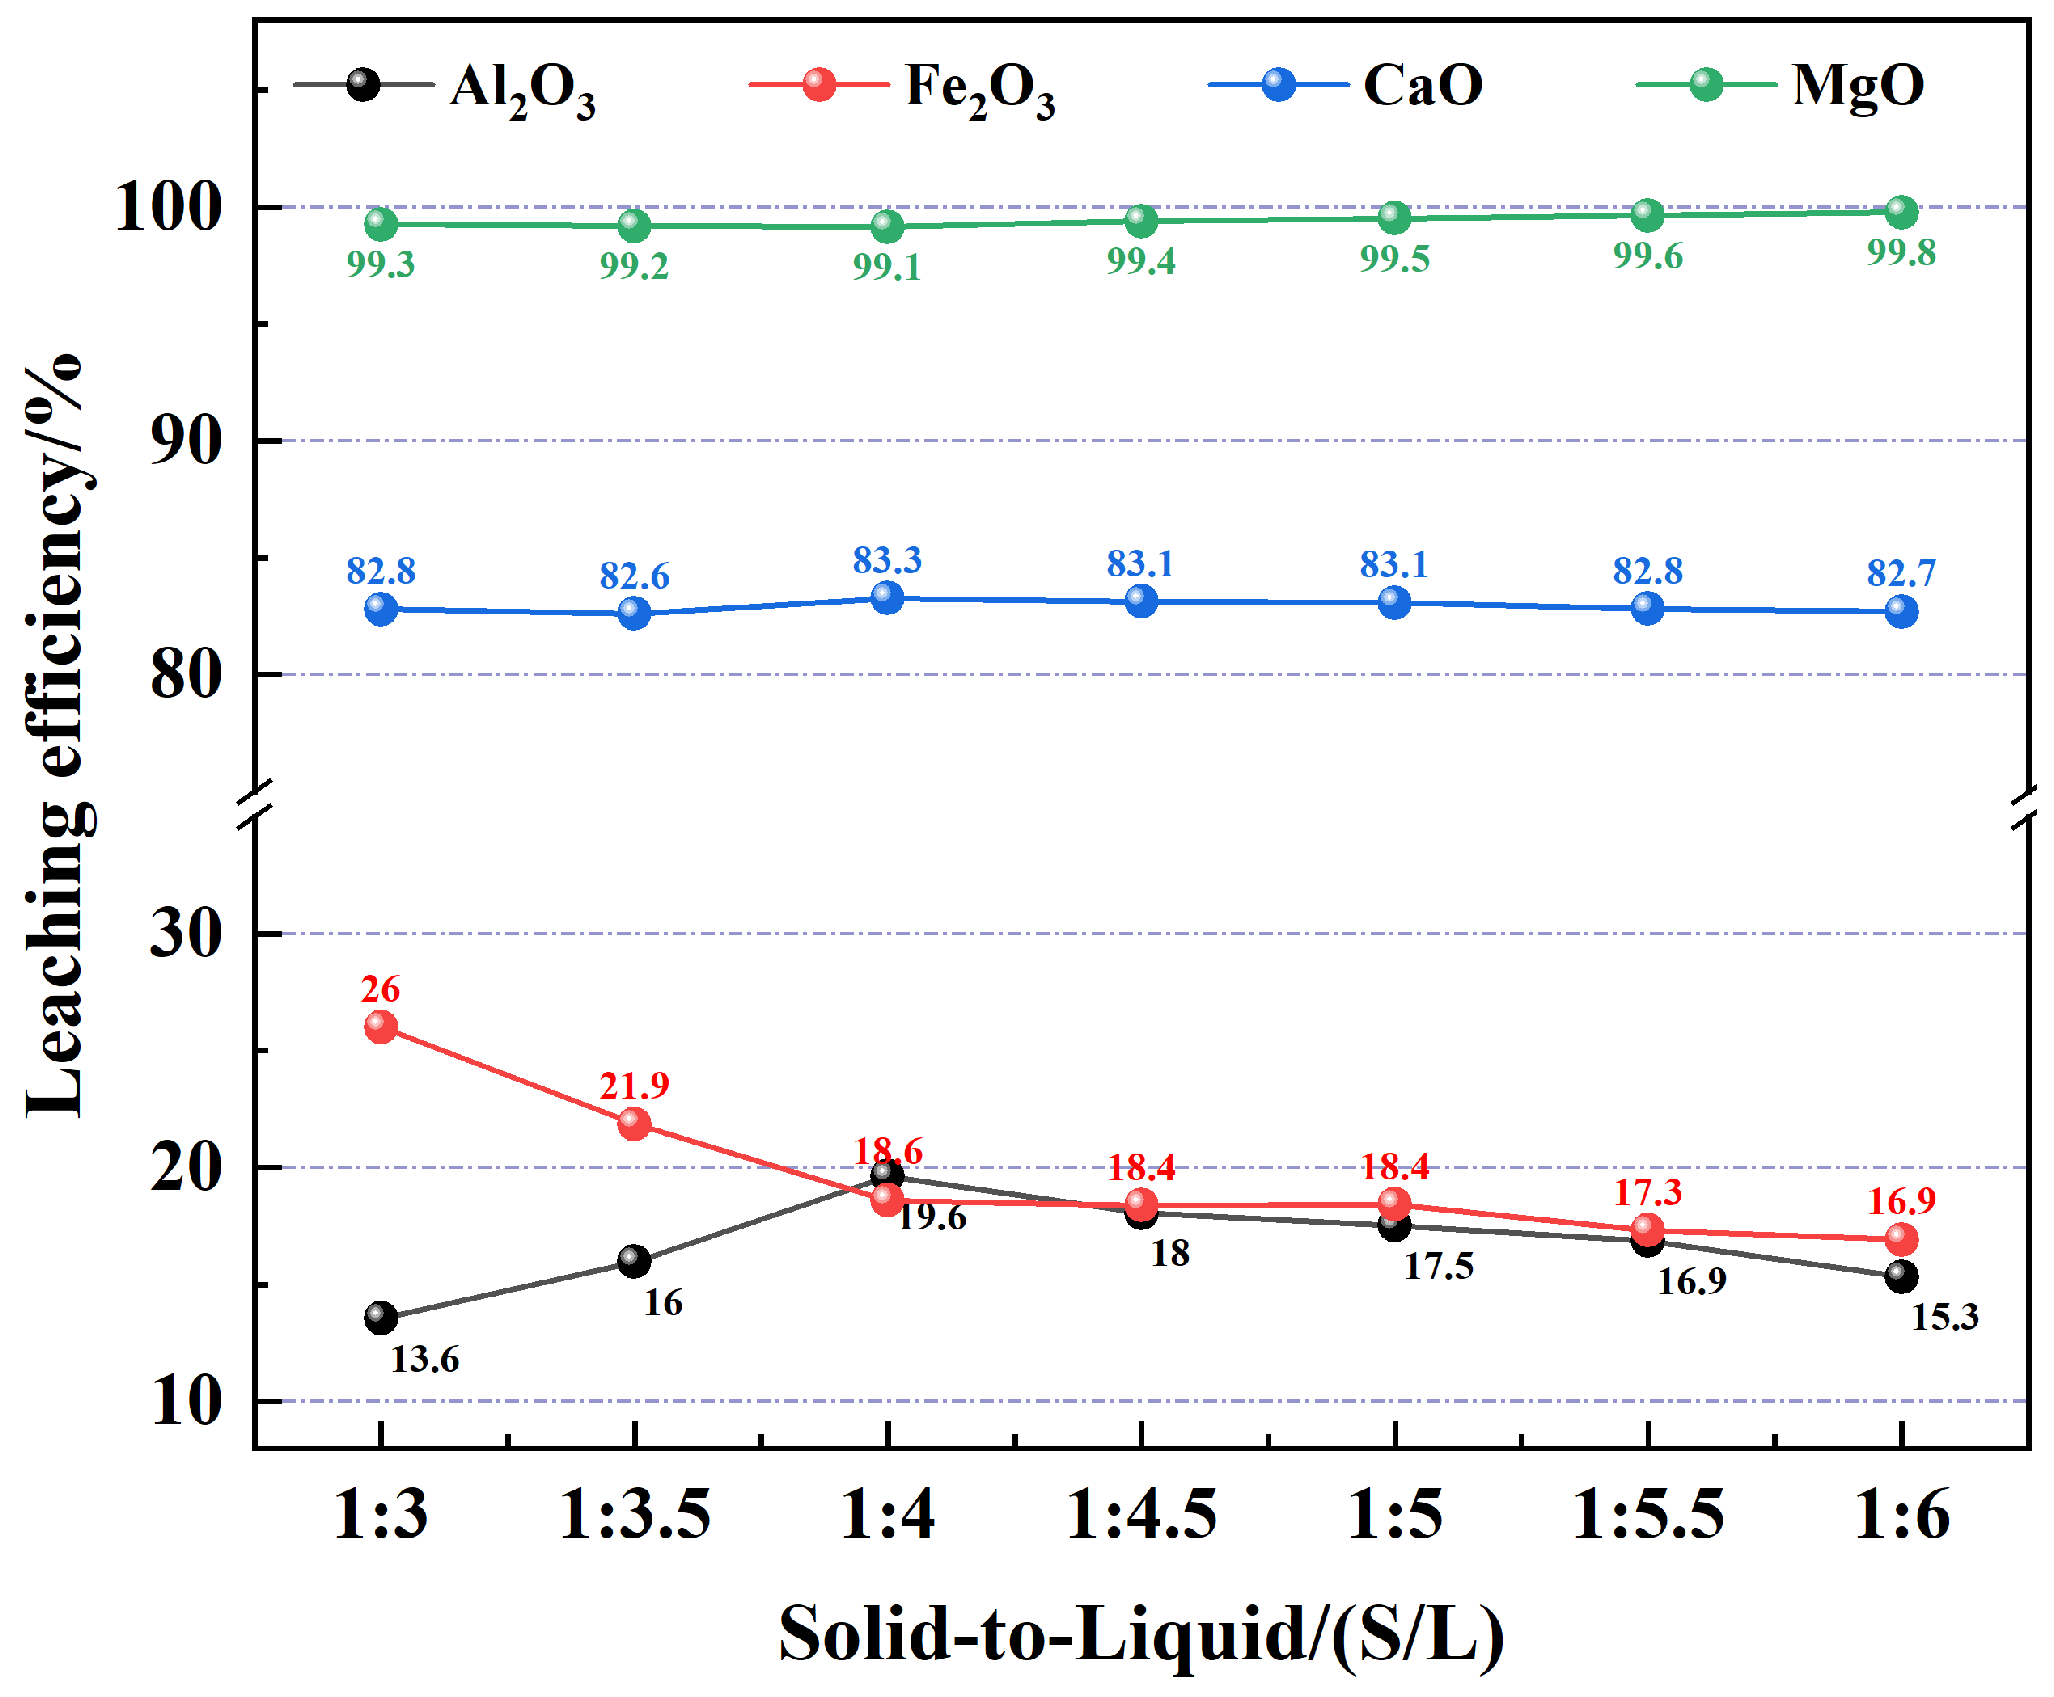
(3) The effect of solid–liquid ratio on leaching rate
Using the optimal hydrochloric acid consumption (70%), optimal leaching time (30 min), and optimal leaching temperature (30 °C), the solid–liquid ratio was varied while keeping other leaching conditions constant to study the effect of solid–liquid ratio on the phosphorus leaching rate. The experimental results are shown in
Figure 17 and
Figure 18.
From
Figure 17, it can be seen that as the solid–liquid ratio increases, the phosphorus leaching rate slightly increases. The highest leaching rate of phosphorus, 91.96%, is achieved at a solid–liquid ratio of 1:5. According to
Figure 18, it is observed that the increase in solid–liquid ratio has little effect on the leaching rates of Ca and Mg. The leaching rate of Al shows a trend of initially increasing and then decreasing. This is because, as the solid–liquid ratio increases, the concentration of HF in the system decreases, effectively inhibiting the leaching of Al. The leaching rate of Fe gradually decreases with an increase in the solid–liquid ratio, indicating that an appropriate increase in the solid–liquid ratio can effectively reduce the leaching rate of Fe. At a solid–liquid ratio of 1:5, the leaching rate of Al can be reduced by 2.2 percentage points. Therefore, the leaching solid–liquid ratio of 1:5 was ultimately determined to be the optimal ratio for preferential phosphorus leaching.
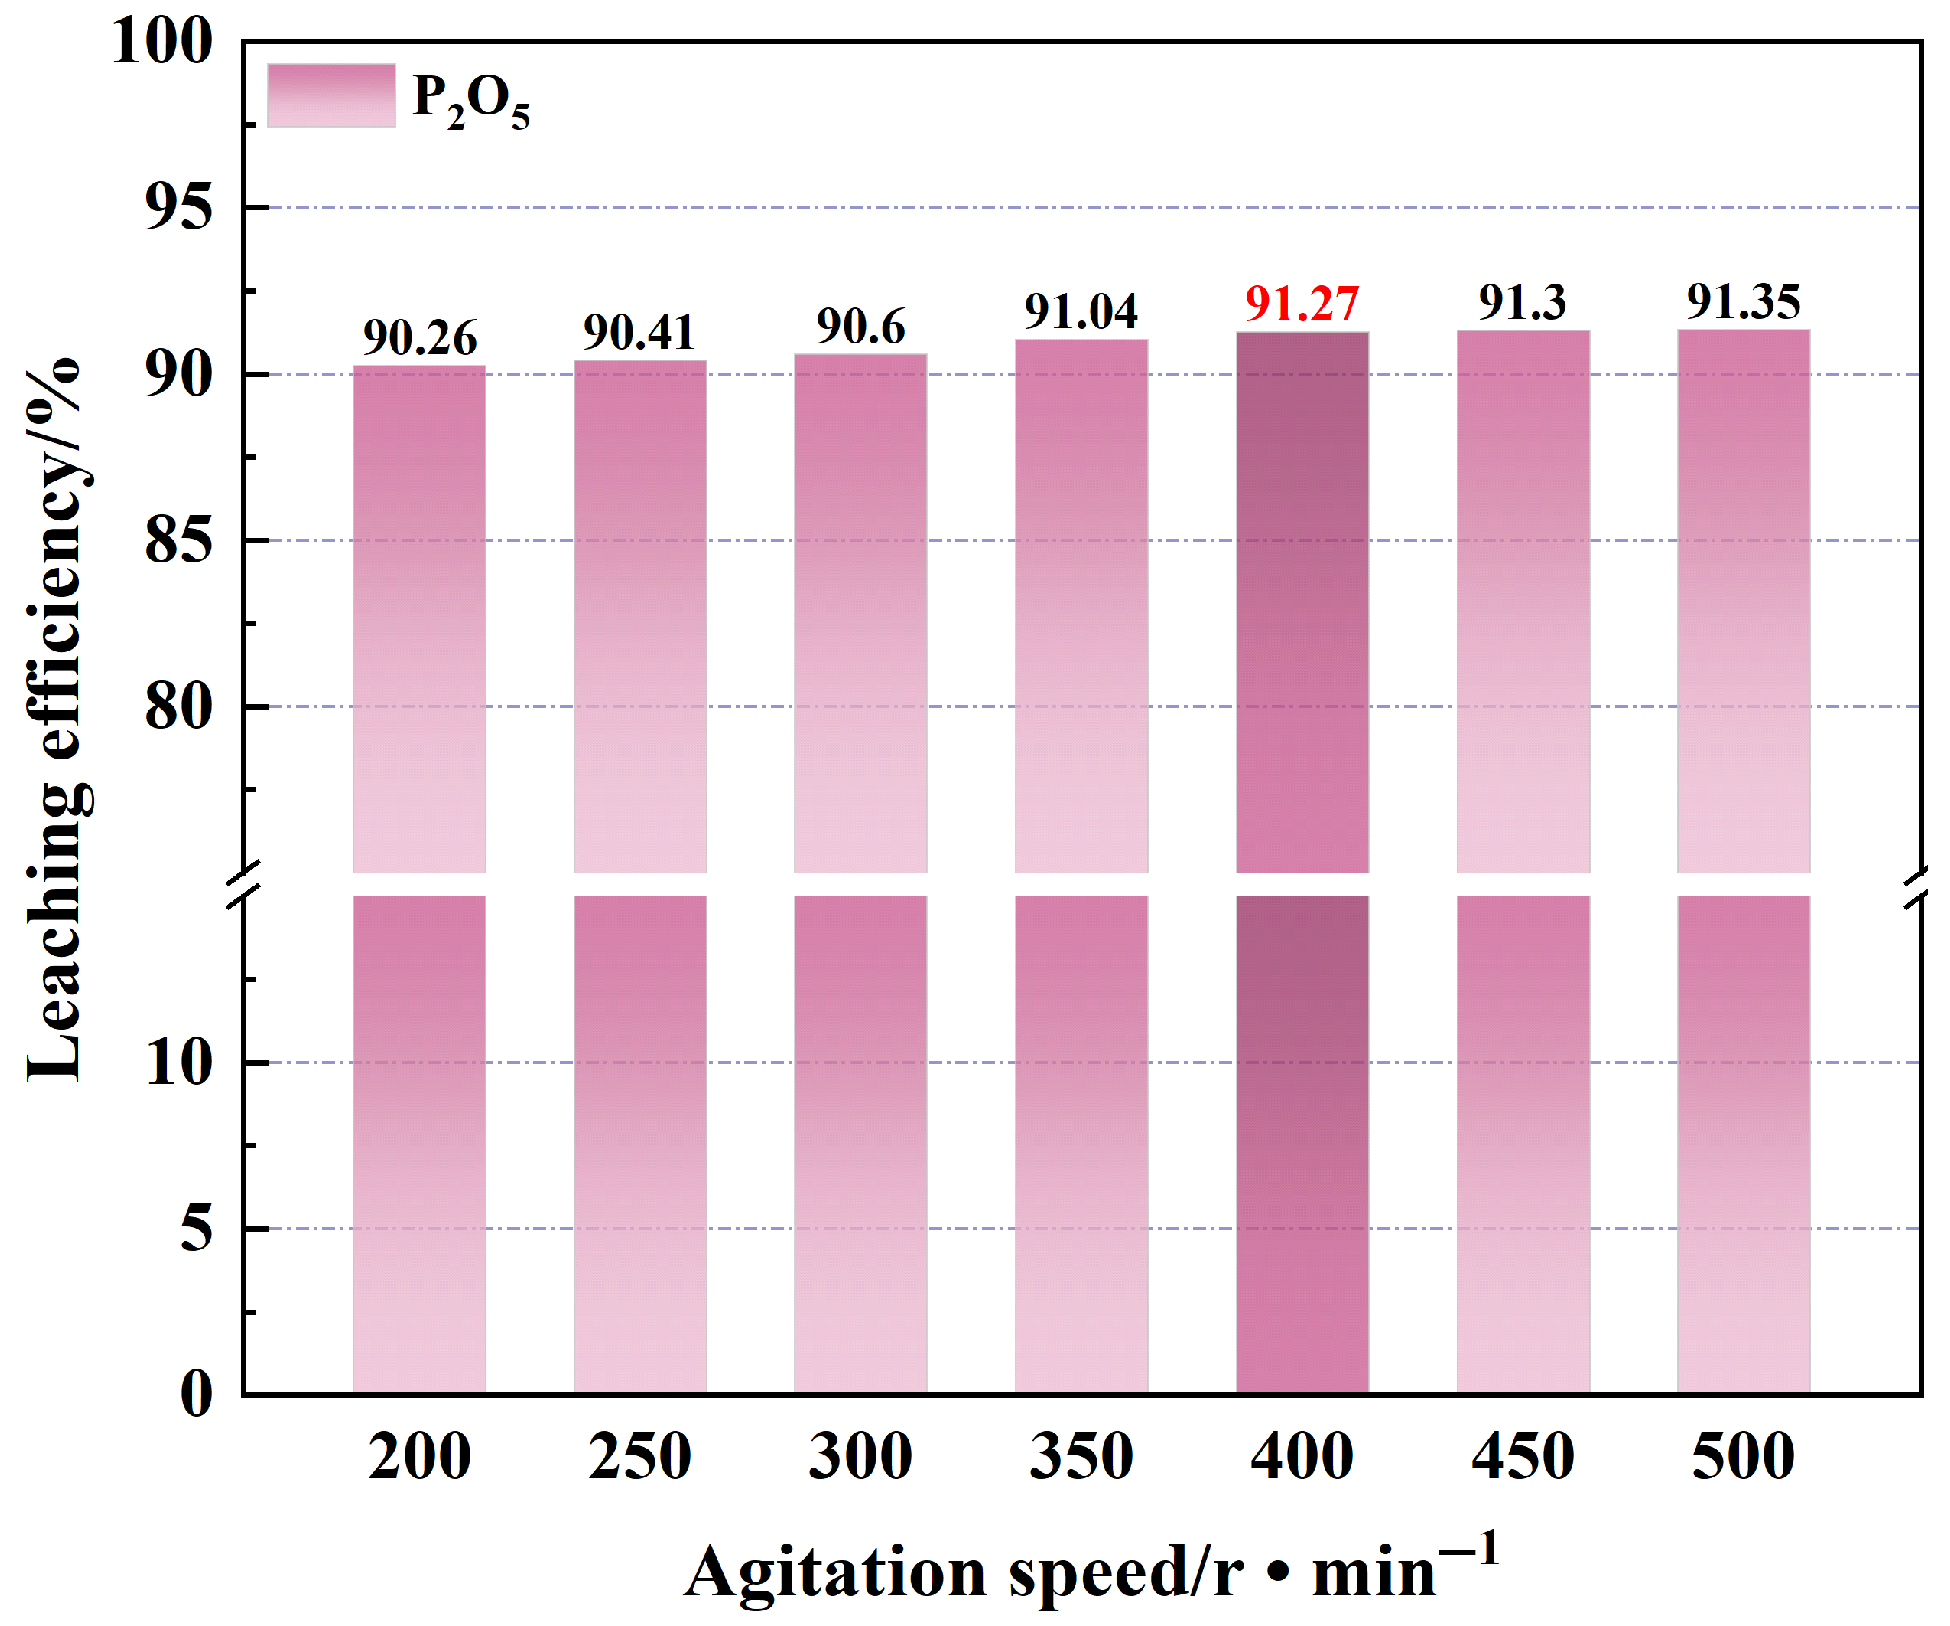
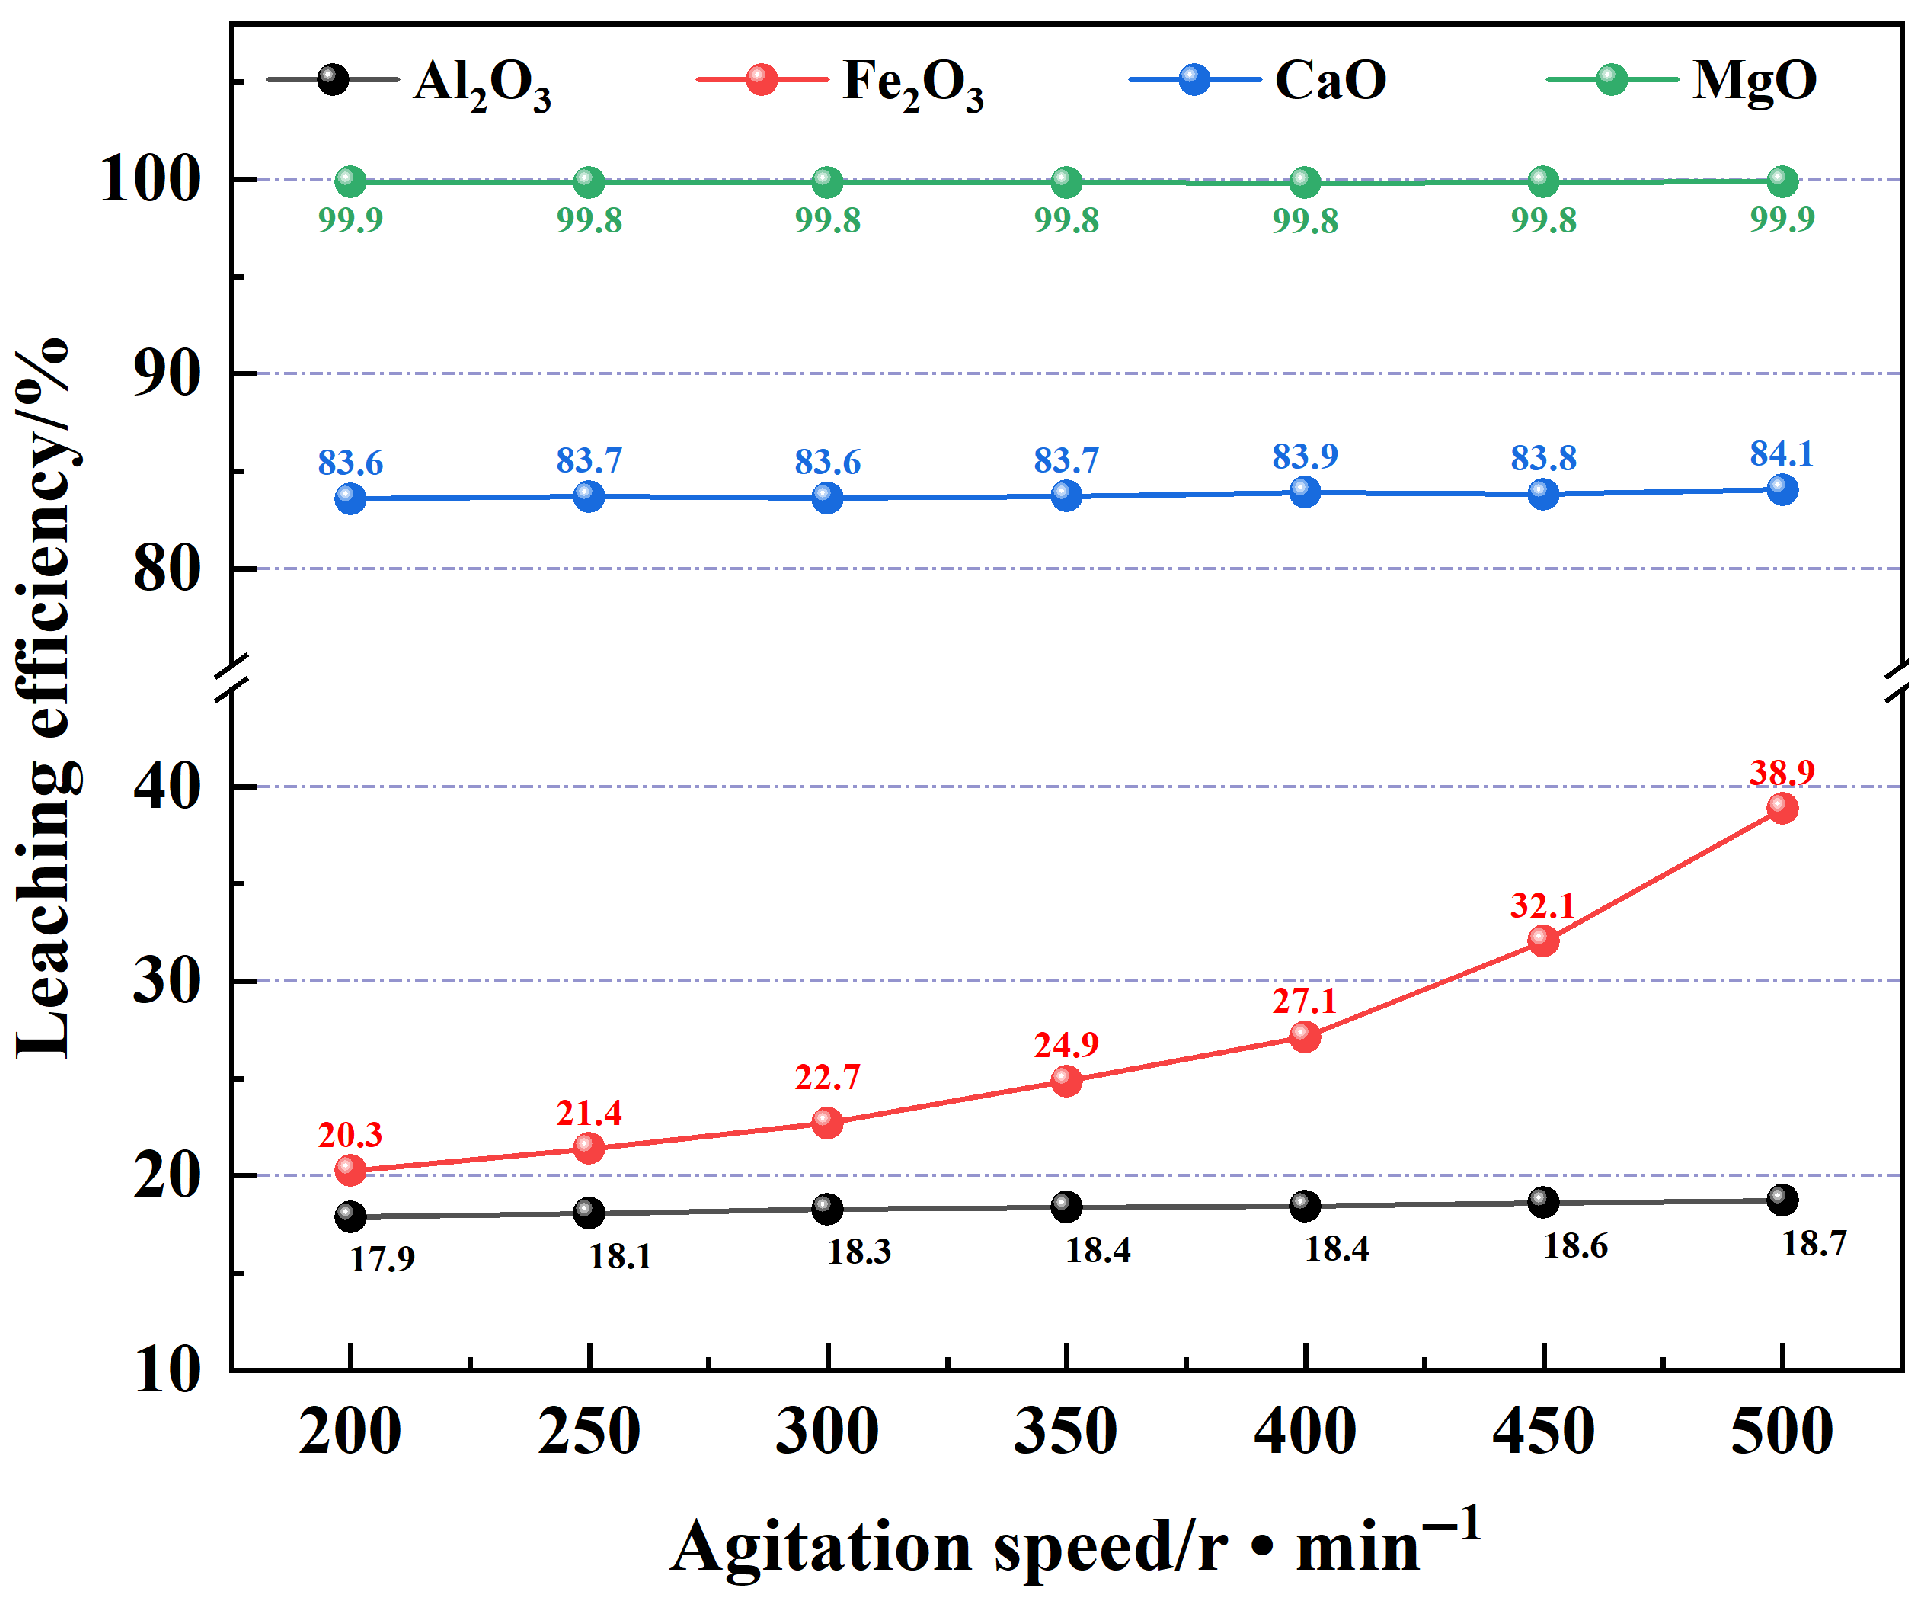
(4) The effect of stirring speed on leaching rate
Using the optimal hydrochloric acid consumption (70%), optimal leaching time (30 min), optimal leaching temperature (30 °C), and optimal solid–liquid ratio (1:5), the stirring speed was varied while keeping other leaching conditions constant to study the effect of stirring speed on the phosphorus leaching rate. The experimental results are shown in
Figure 19 and
Figure 20.
From
Figure 19, it can be seen that as the stirring speed increases, the phosphorus leaching rate slightly increases. At a stirring speed of 400 r/min, the phosphorus leaching rate reaches 91.27%. With further increases in stirring speed, the rise in phosphorus leaching rate becomes smaller. In
Figure 20, the increase in stirring speed has almost no effect on the leaching rates of Ca, Mg, and Al, while the leaching rate of Fe shows a slight increase with higher stirring speeds, rising from 20.3% at 200 r/min to 38.9% at 500 r/min. Therefore, the optimal stirring rate for preferential phosphorus leaching was determined to be 400 r/min.
Therefore, based on the above parametric experiments, the optimal process conditions for the preferential leaching of phosphorus from the rare earth-bearing phosphate concentrate were determined as follows: hydrochloric acid consumption at 70% of the theoretical amount, leaching time of 30 min, leaching temperature of 30 °C, solid–liquid ratio of 1:5, and stirring speed of 400 r/min. Under these conditions, the highest P2O5 leaching rate is 91.27%, while the leaching rates of impurity elements Al, Fe, Ca, and Mg are 18.4%, 27.1%, 83.9%, and 99.8%, respectively. The leaching time is reduced by 10 min, and the leaching temperature is lowered by 10 °C.
3.4. Migration and Enrichment of Rare Earth Elements in Leach Residue
Modern analytical techniques, including XRD, XRF, ICP-OES, ICP-MS, and EPMA, were employed to analyze the leaching residue, thereby determining its phase composition, the concentrations of major and trace elements, and the occurrence states of rare earth elements.
3.4.1. Phase and Chemical Composition Analysis of the Leach Residue
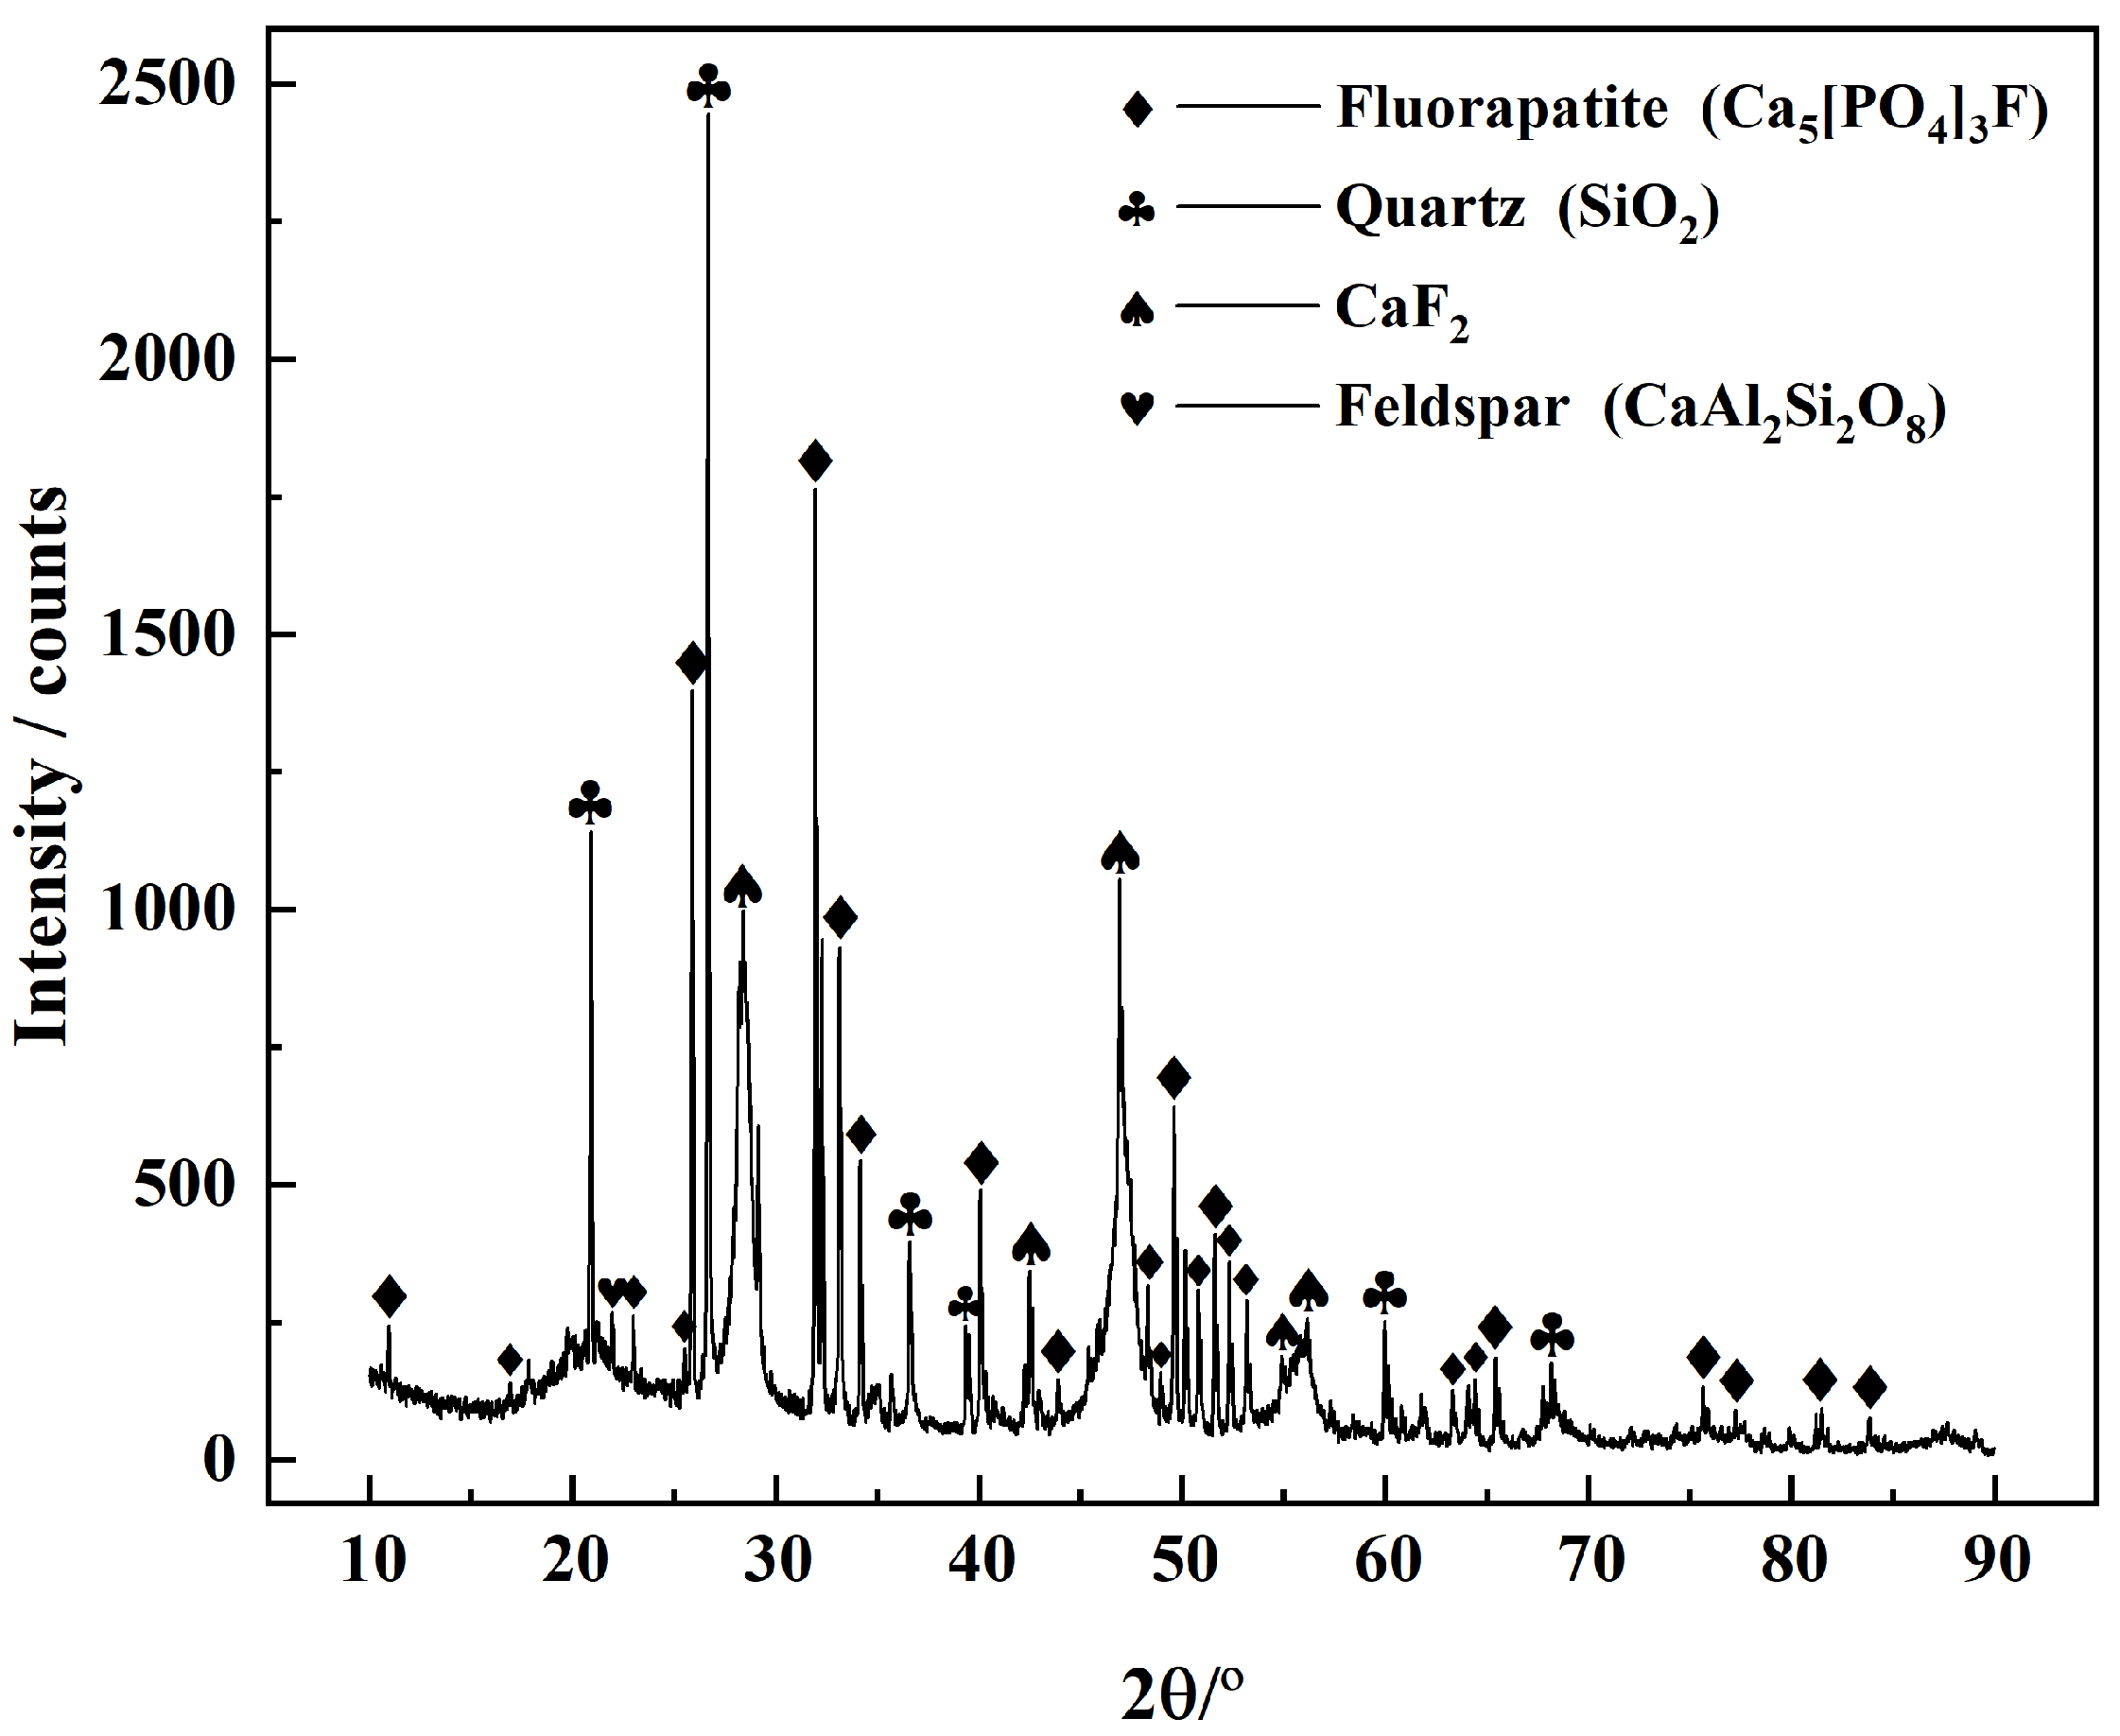
Firstly, XRD was used to analyze the phase composition of the leach residue, with the results shown in
Figure 21.
As shown in
Figure 21, the leaching residue contains a small amount of fluorapatite that was not decomposed by acid. Meanwhile, silicate minerals such as quartz and feldspar, which react poorly with hydrochloric acid, become relatively enriched in the leaching residue, resulting in an increased content. The formation of CaF
2 in the leaching residue is attributed to the preferential dissolution of phosphorus from fluorapatite under conditions of relatively low reaction temperature and short reaction time, leading to the generation of CaF
2.
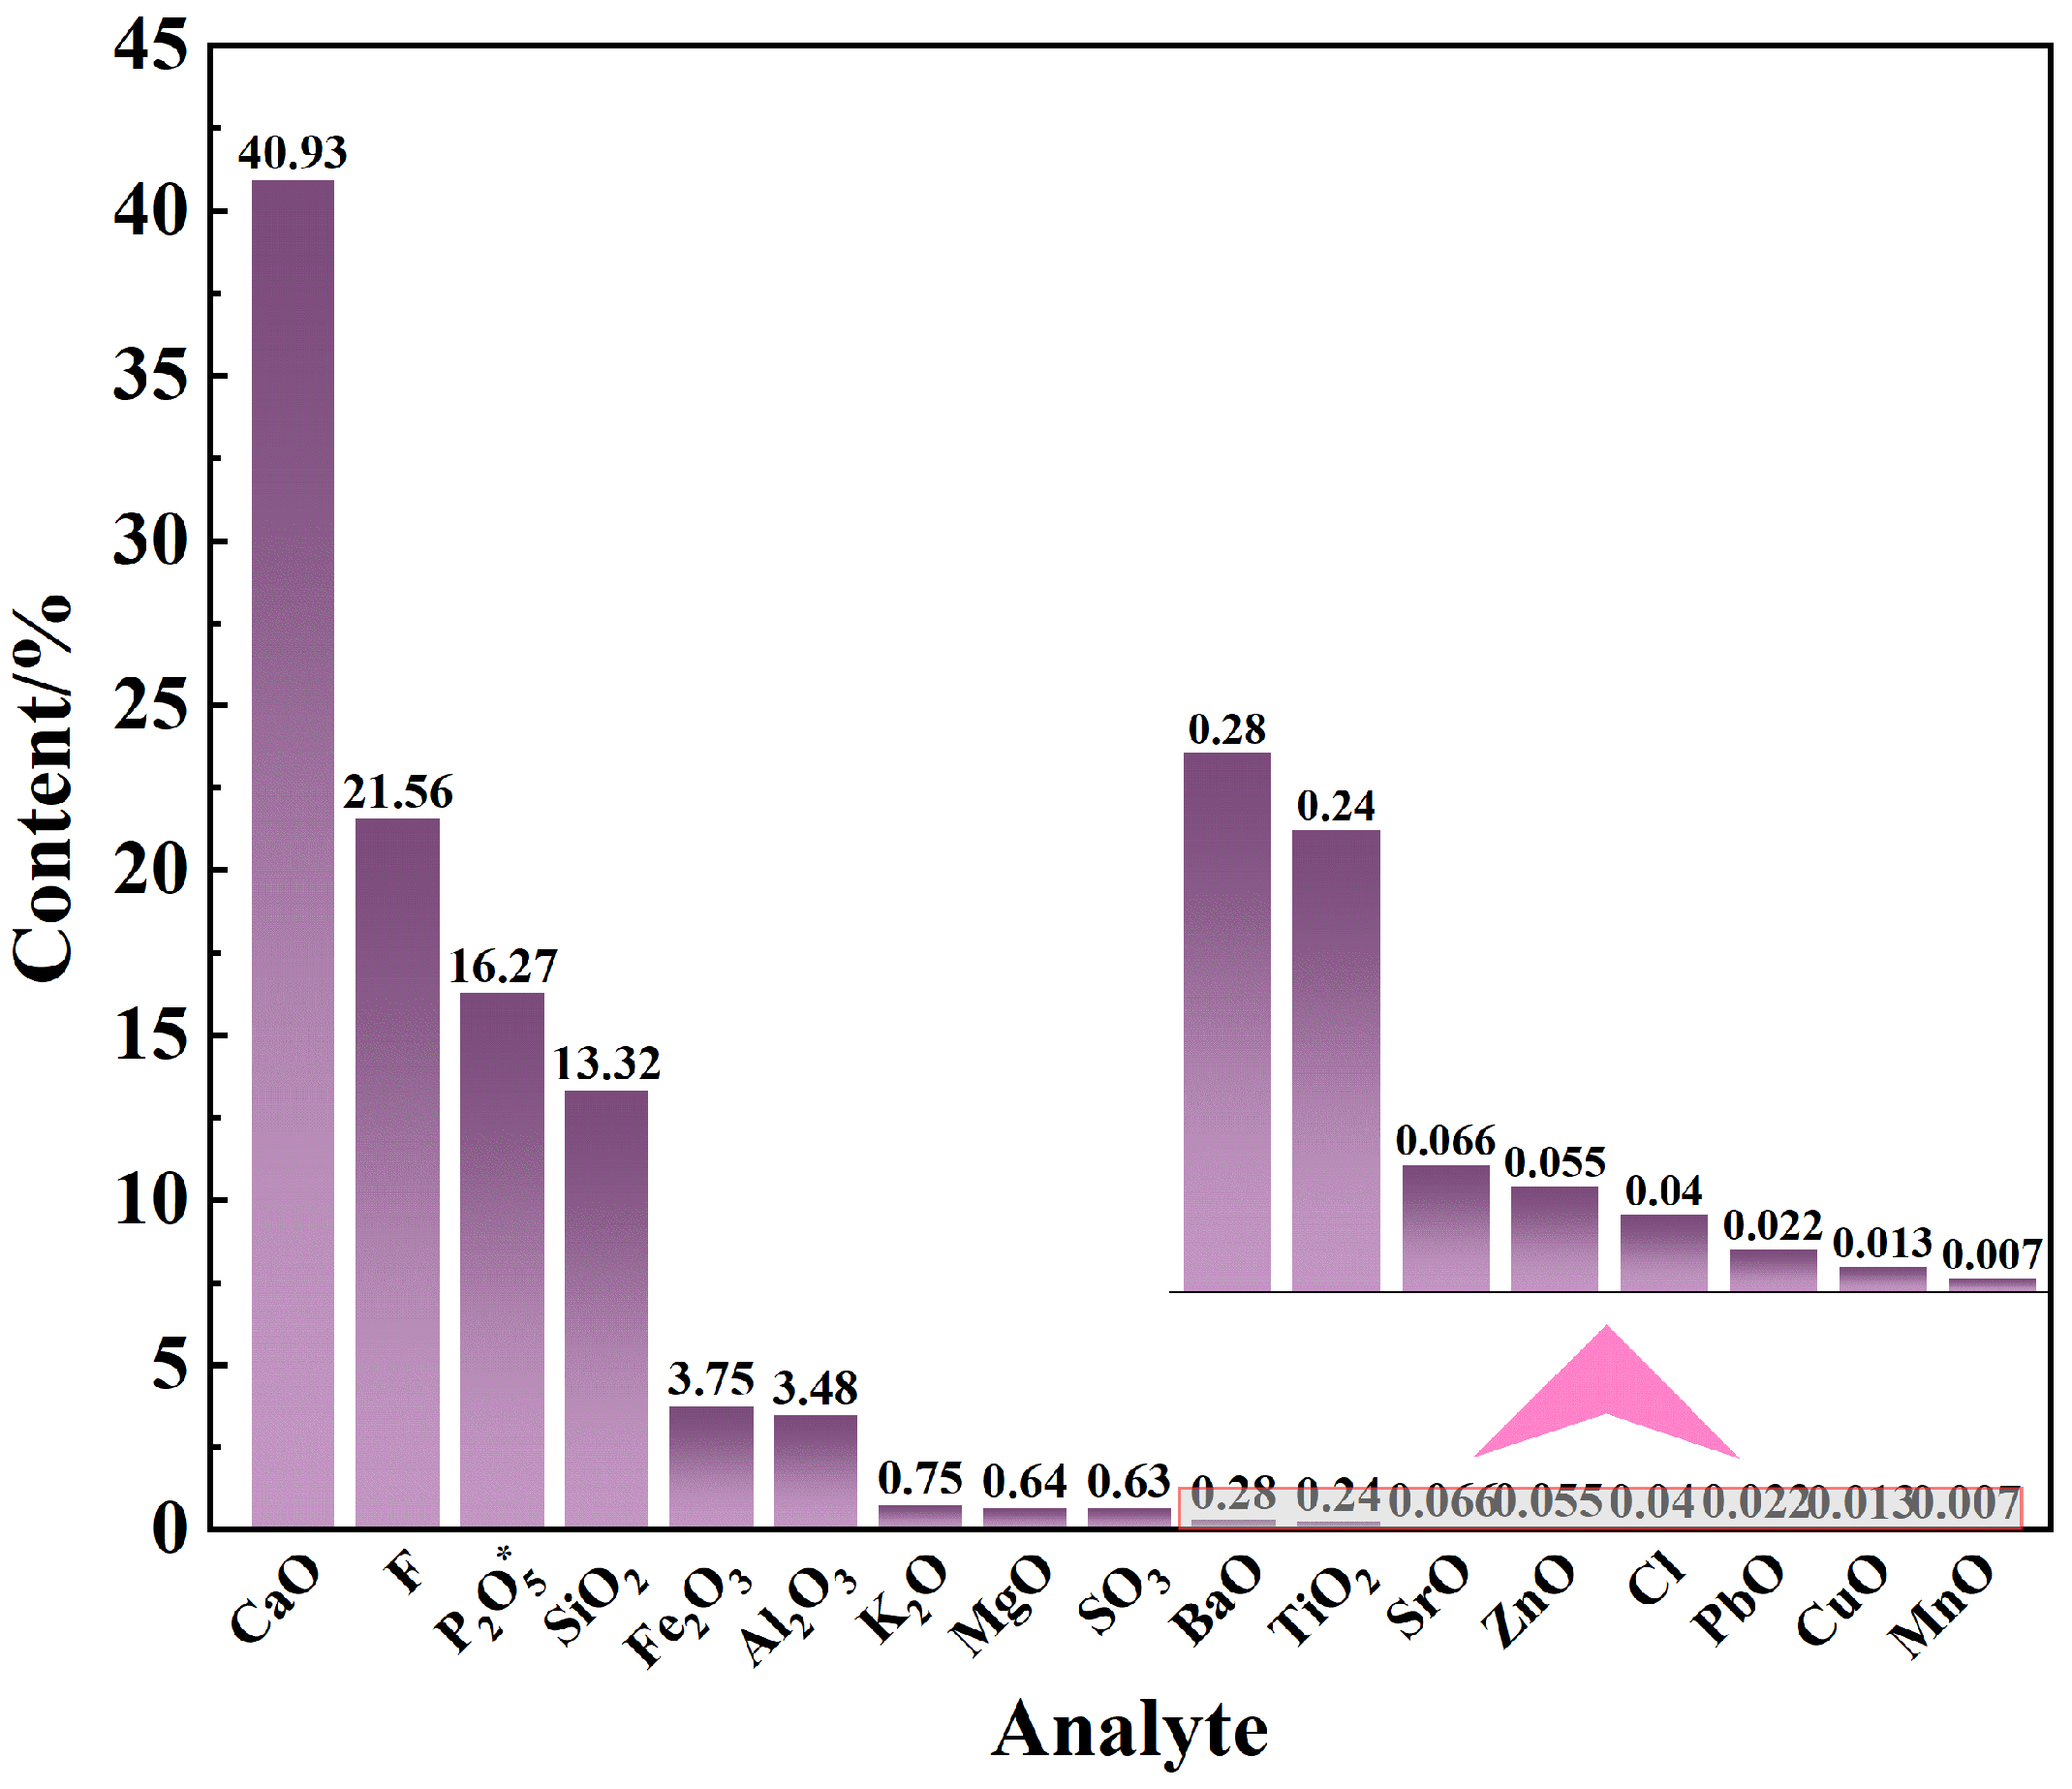
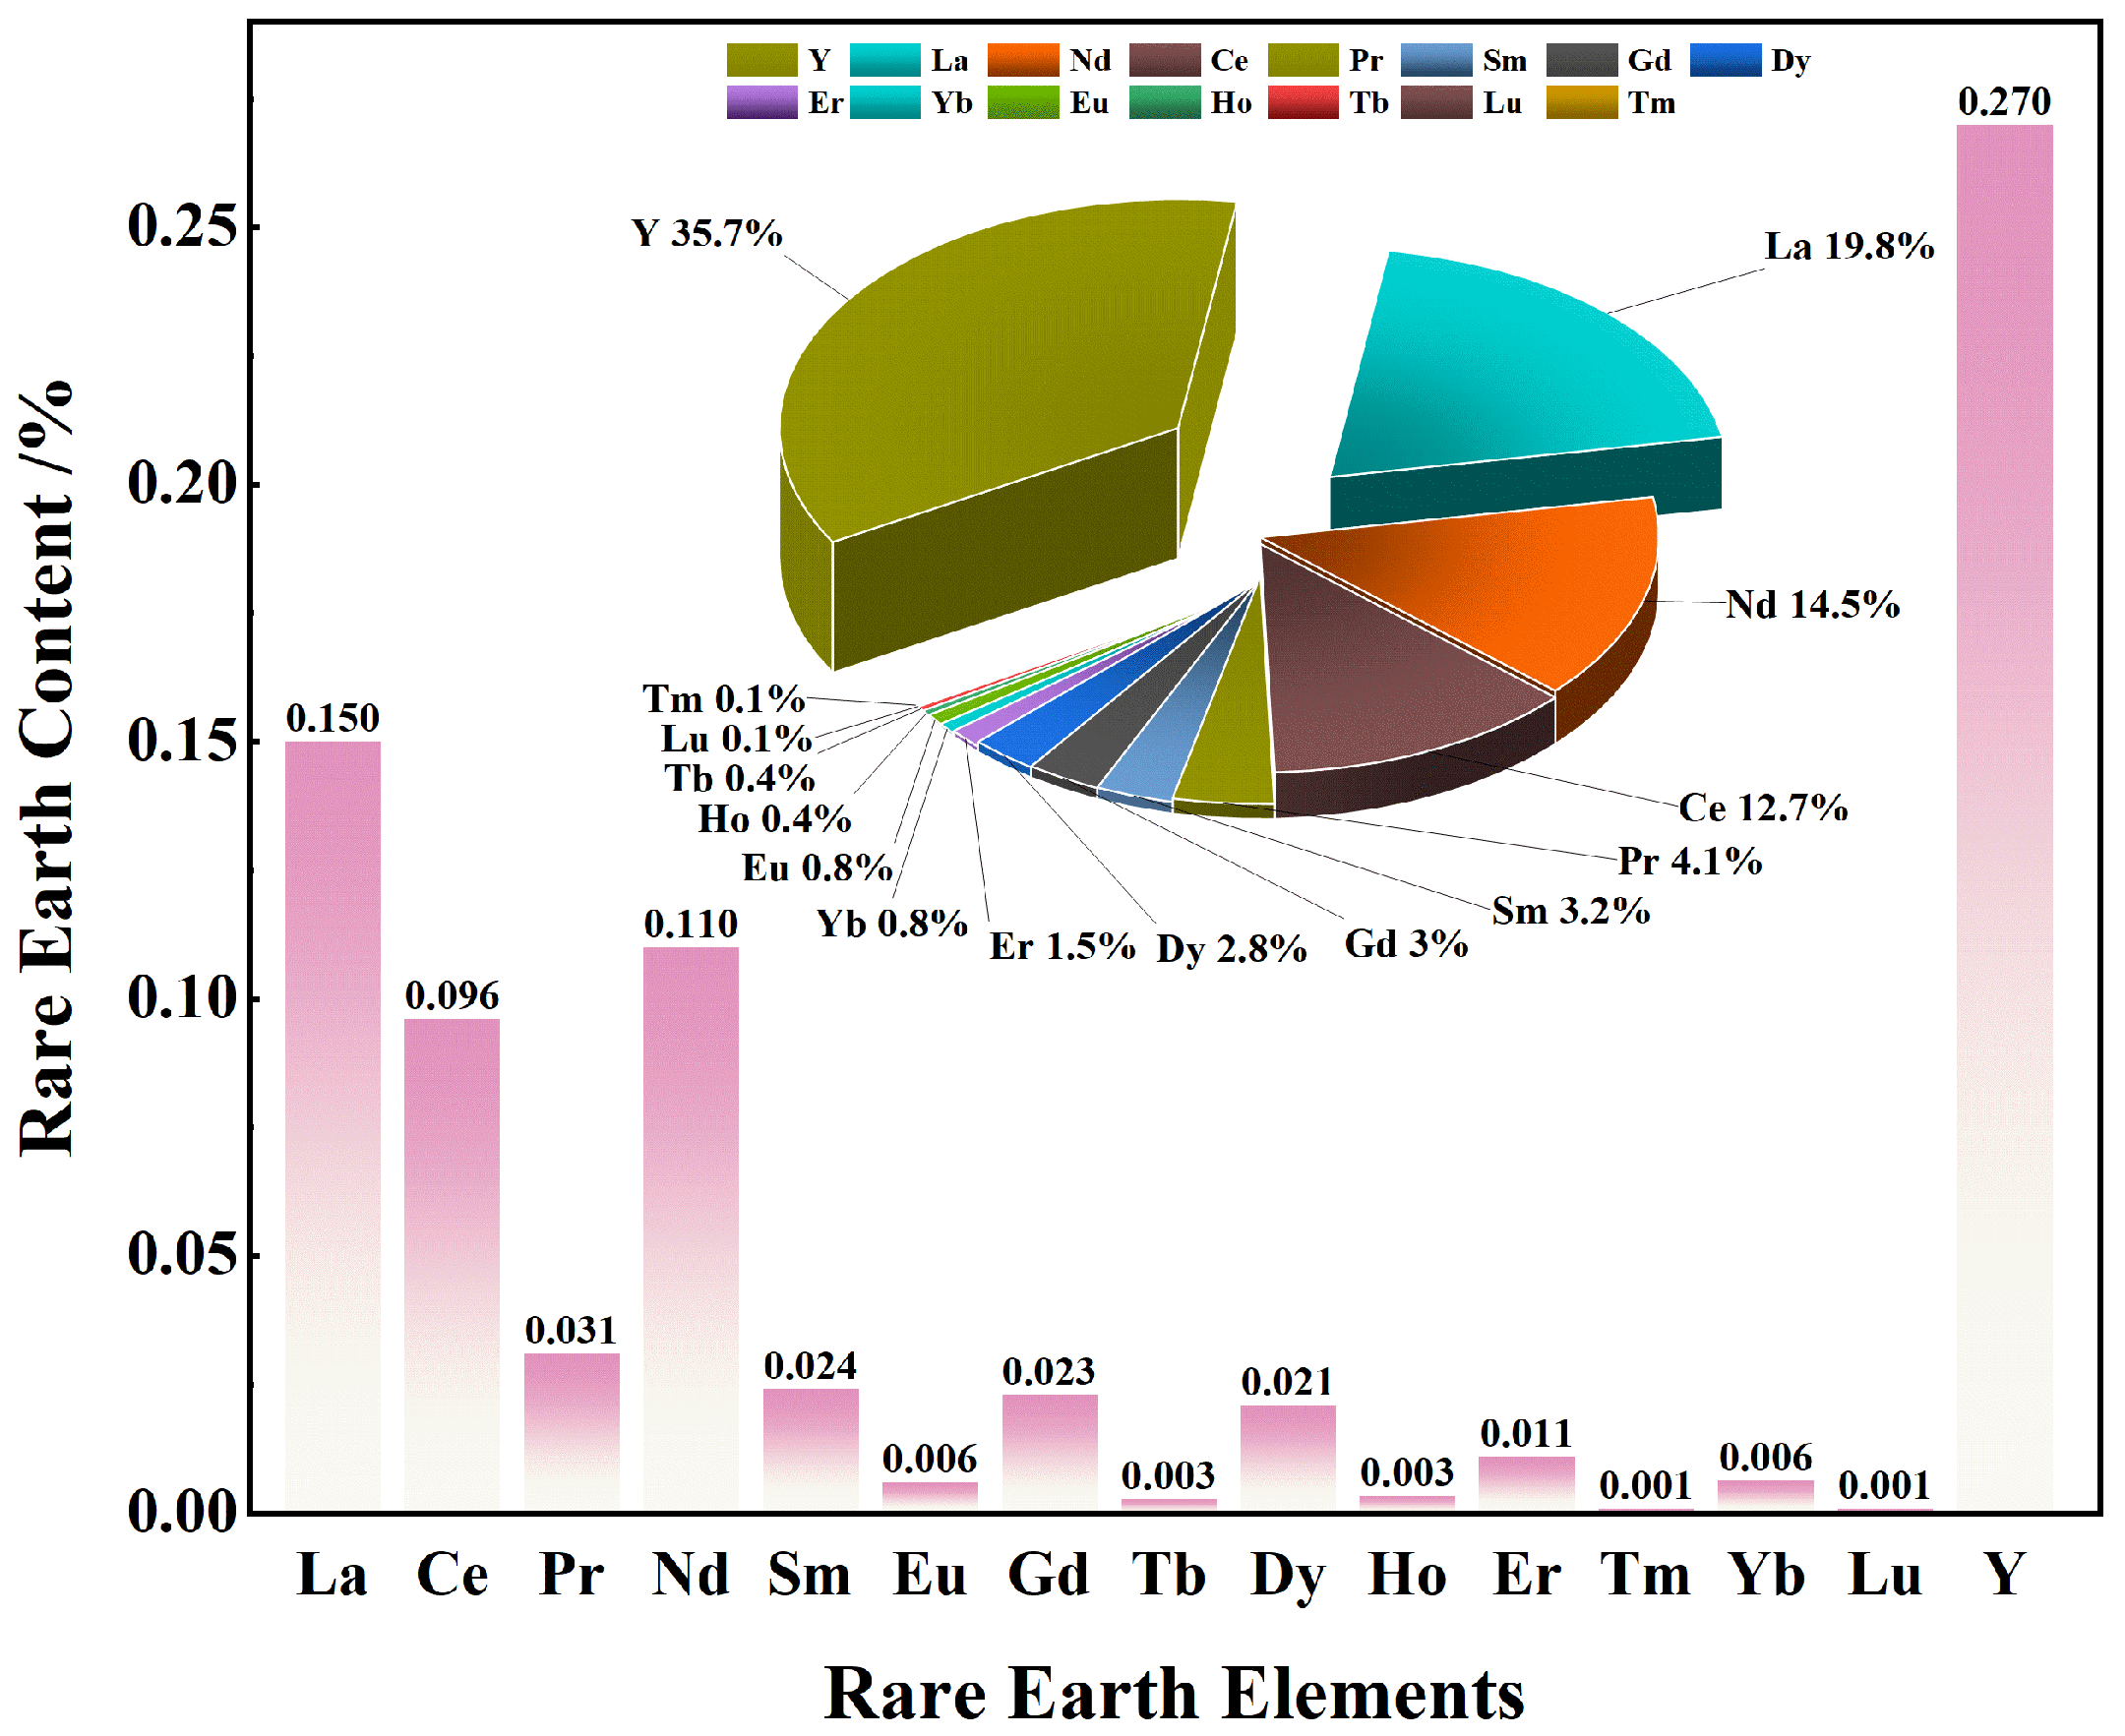
To further determine the chemical elemental composition of the leaching residue, as well as the concentrations and distribution of individual rare earth elements, XRF, ICP-OES, and ICP-MS analyses were conducted. The results are presented in
Figure 22 and
Figure 23.
As shown in
Figure 22, the P
2O
5 content in the leaching residue decreases markedly, declining from 31.61% in the rare-earth-bearing phosphate concentrate to 16.27%, representing a reduction of 15.34 percentage points. In contrast, the F content increases significantly, rising from 3.54% to 21.56%, an increase of 18.02 percentage points. Combined with the XRD results, fluorine is primarily present in the forms of CaF
2 and residual fluorapatite that was not decomposed by acid. Furthermore, the rare earth content and distribution patterns shown in
Figure 23 reveal a pronounced enrichment of rare earth elements in the leaching residue, increasing from 0.161% in the phosphate concentrate to 0.756%, an increment of 0.595 percentage points, corresponding to an enrichment ratio of 4.7. Meanwhile, the distribution proportions of individual rare earth elements remain essentially unchanged, indicating that all rare earth elements were enriched synchronously in the leaching residue. Under the optimal conditions for preferential phosphorus leaching, the loss of rare earth elements is extremely low, at only 1.517%, with a transfer rate to the leaching residue as high as 98.48%.
3.4.2. Analysis of Intergrowth Relationships in the Leaching Residue
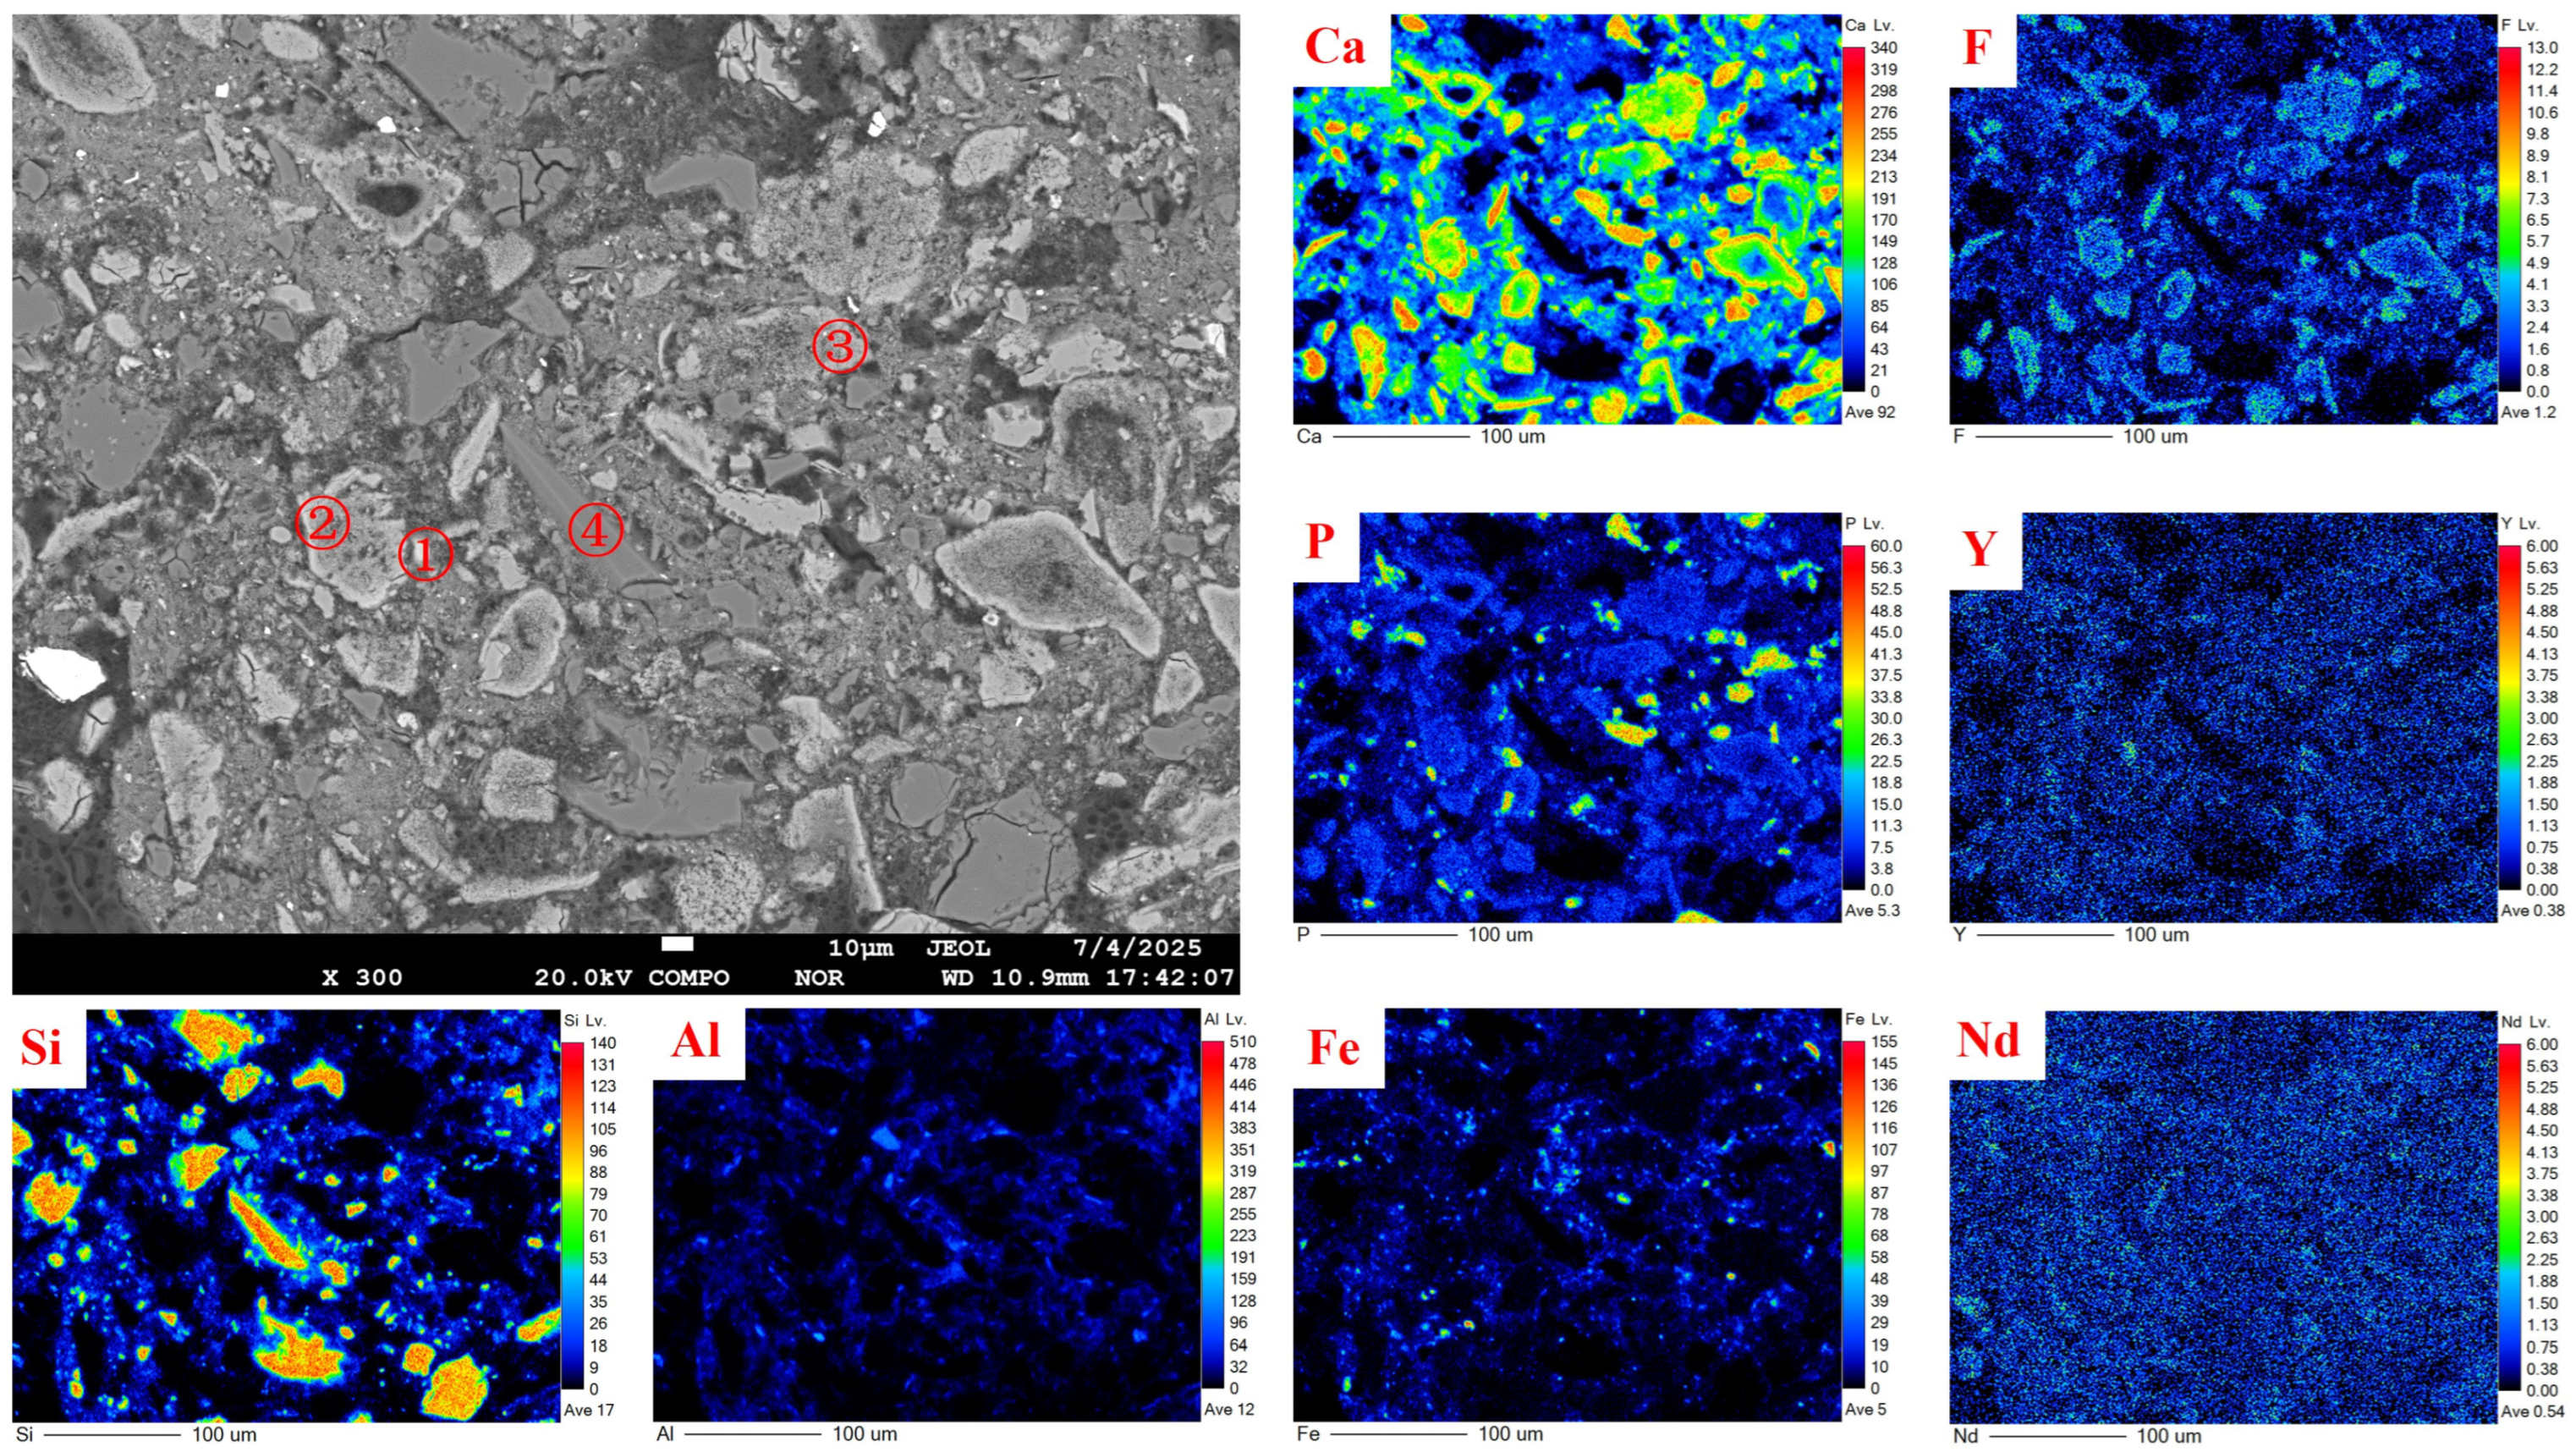
SEM-EDS was used to analyze the embedded relationships of the residual minerals in the leach residue, with the results shown in
Figure 24.
As revealed by the elemental distribution in
Figure 24, a small amount of residual phosphorus in the leaching residue remains hosted in fluorapatite and exhibits a ternary intergrowth relationship with silicate minerals, namely feldspar and quartz. The elemental distribution map of iron further indicates the presence of trace amounts of hematite (limonite) and pyrite in the leaching residue. In addition, the distribution patterns of calcium and fluorine show that the CaF
2 formed after the preferential leaching of a large proportion of phosphorus displays a characteristic honeycomb-like texture. When considered together with the distribution map of the rare earth element Y, it is evident that rare earth elements are hosted in both the residual fluorapatite and CaF
2, having undergone virtually no dissolution during phosphorus leaching, and no independent rare earth minerals were observed.
3.4.3. Analysis of Rare Earth Content in the Leaching Residue
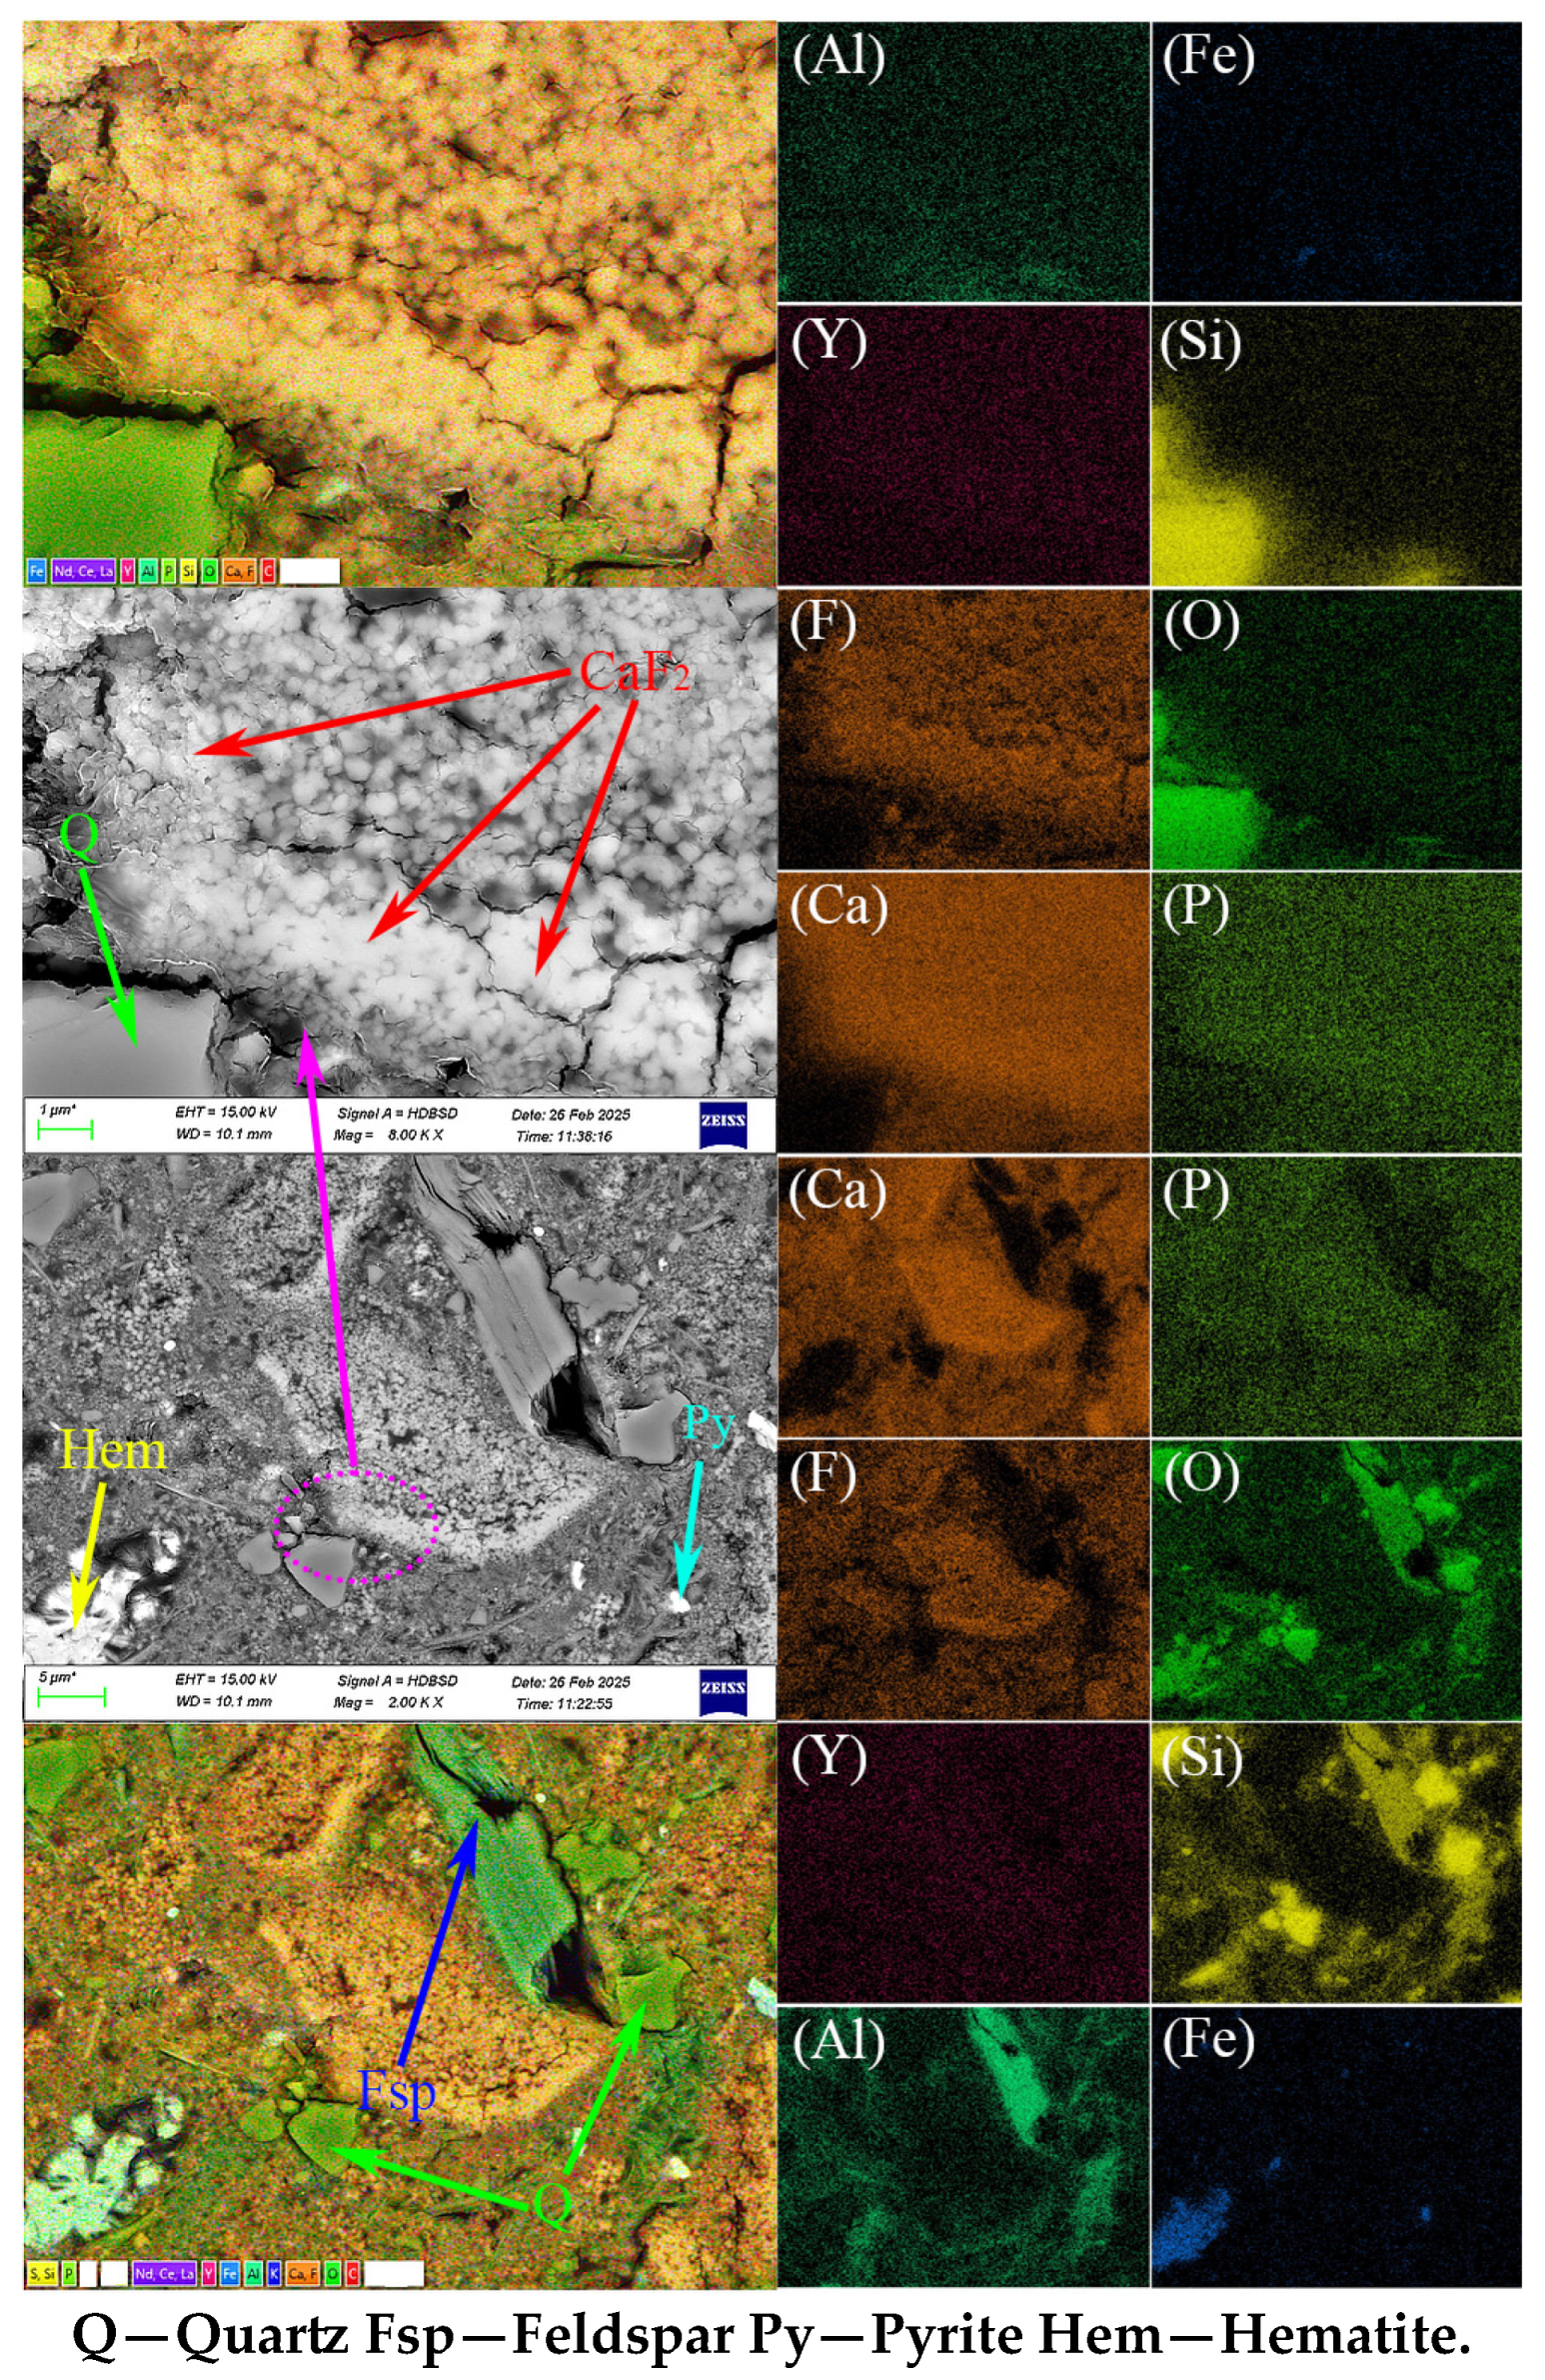
EPMA was used to analyze the distribution of rare earth elements and their content in the leach residue. The analysis results are shown in
Figure 25 and
Table 6.
As indicated by the surface analysis results in
Figure 25, the distributions of calcium, fluorine, residual phosphorus that was not leached, and trace amounts of enriched yttrium in the leaching residue exhibit a high degree of spatial overlap, consistent with the SEM–EDS analytical results. Moreover, it can be observed that the relative contents of fluorine and calcium are higher around the peripheries of large mineral particles, whereas the central regions of these particles display higher phosphorus concentrations. This suggests that, due to the relatively short reaction time and low reaction temperature, the reaction did not diffuse into the interiors of the larger mineral particles. In addition, minor iron-bearing minerals and silicate minerals were also enriched in the leaching residue, which, in combination with the SEM–EDS results, are inferred to be hematite (limonite), pyrite, quartz, and feldspar.
To further determine the content of rare earth elements in the leaching residue, quantitative analyses of the major elements were conducted using point analysis, and the results are presented in
Table 6.
The point quantitative analysis presented in
Table 6 shows that the mass fractions of Ca and F correspond well with those in CaF
2 [
36,
37]. Compared with the phosphate concentrate, the fluorine content in the leaching residue increased by approximately 14 percentage points, while the content of Y, the rare earth element with the highest distribution proportion, increased by about 1.5 percentage points. These results further confirm that the CaF
2 observed in the SEM–EDS analysis formed after the preferential dissolution of phosphorus. Moreover, rare earth elements substitute for Ca in fluorapatite through cationic substitution. During the preferential leaching of phosphorus, the relatively low acidity and mild temperature conditions allow the PO
43− groups within the apatite framework to dissolve preferentially, whereas the rare earth cations—owing to their higher valence and ionic radii comparable to that of Ca
2+ [
10,
11,
12]—remain within the partially reacted apatite remnants. This crystallochemical stability constitutes the fundamental reason why rare earth elements are difficult to leach and consequently become enriched in the residue.
3.5. Kinetic Study of Phosphorus Leaching
The results of the preferential phosphorus leaching process study reveal that, it can be observed that the hydrochloric acid consumption, leaching time, leaching temperature, solid–liquid ratio, and stirring speed all have an impact on the phosphorus leaching rate.
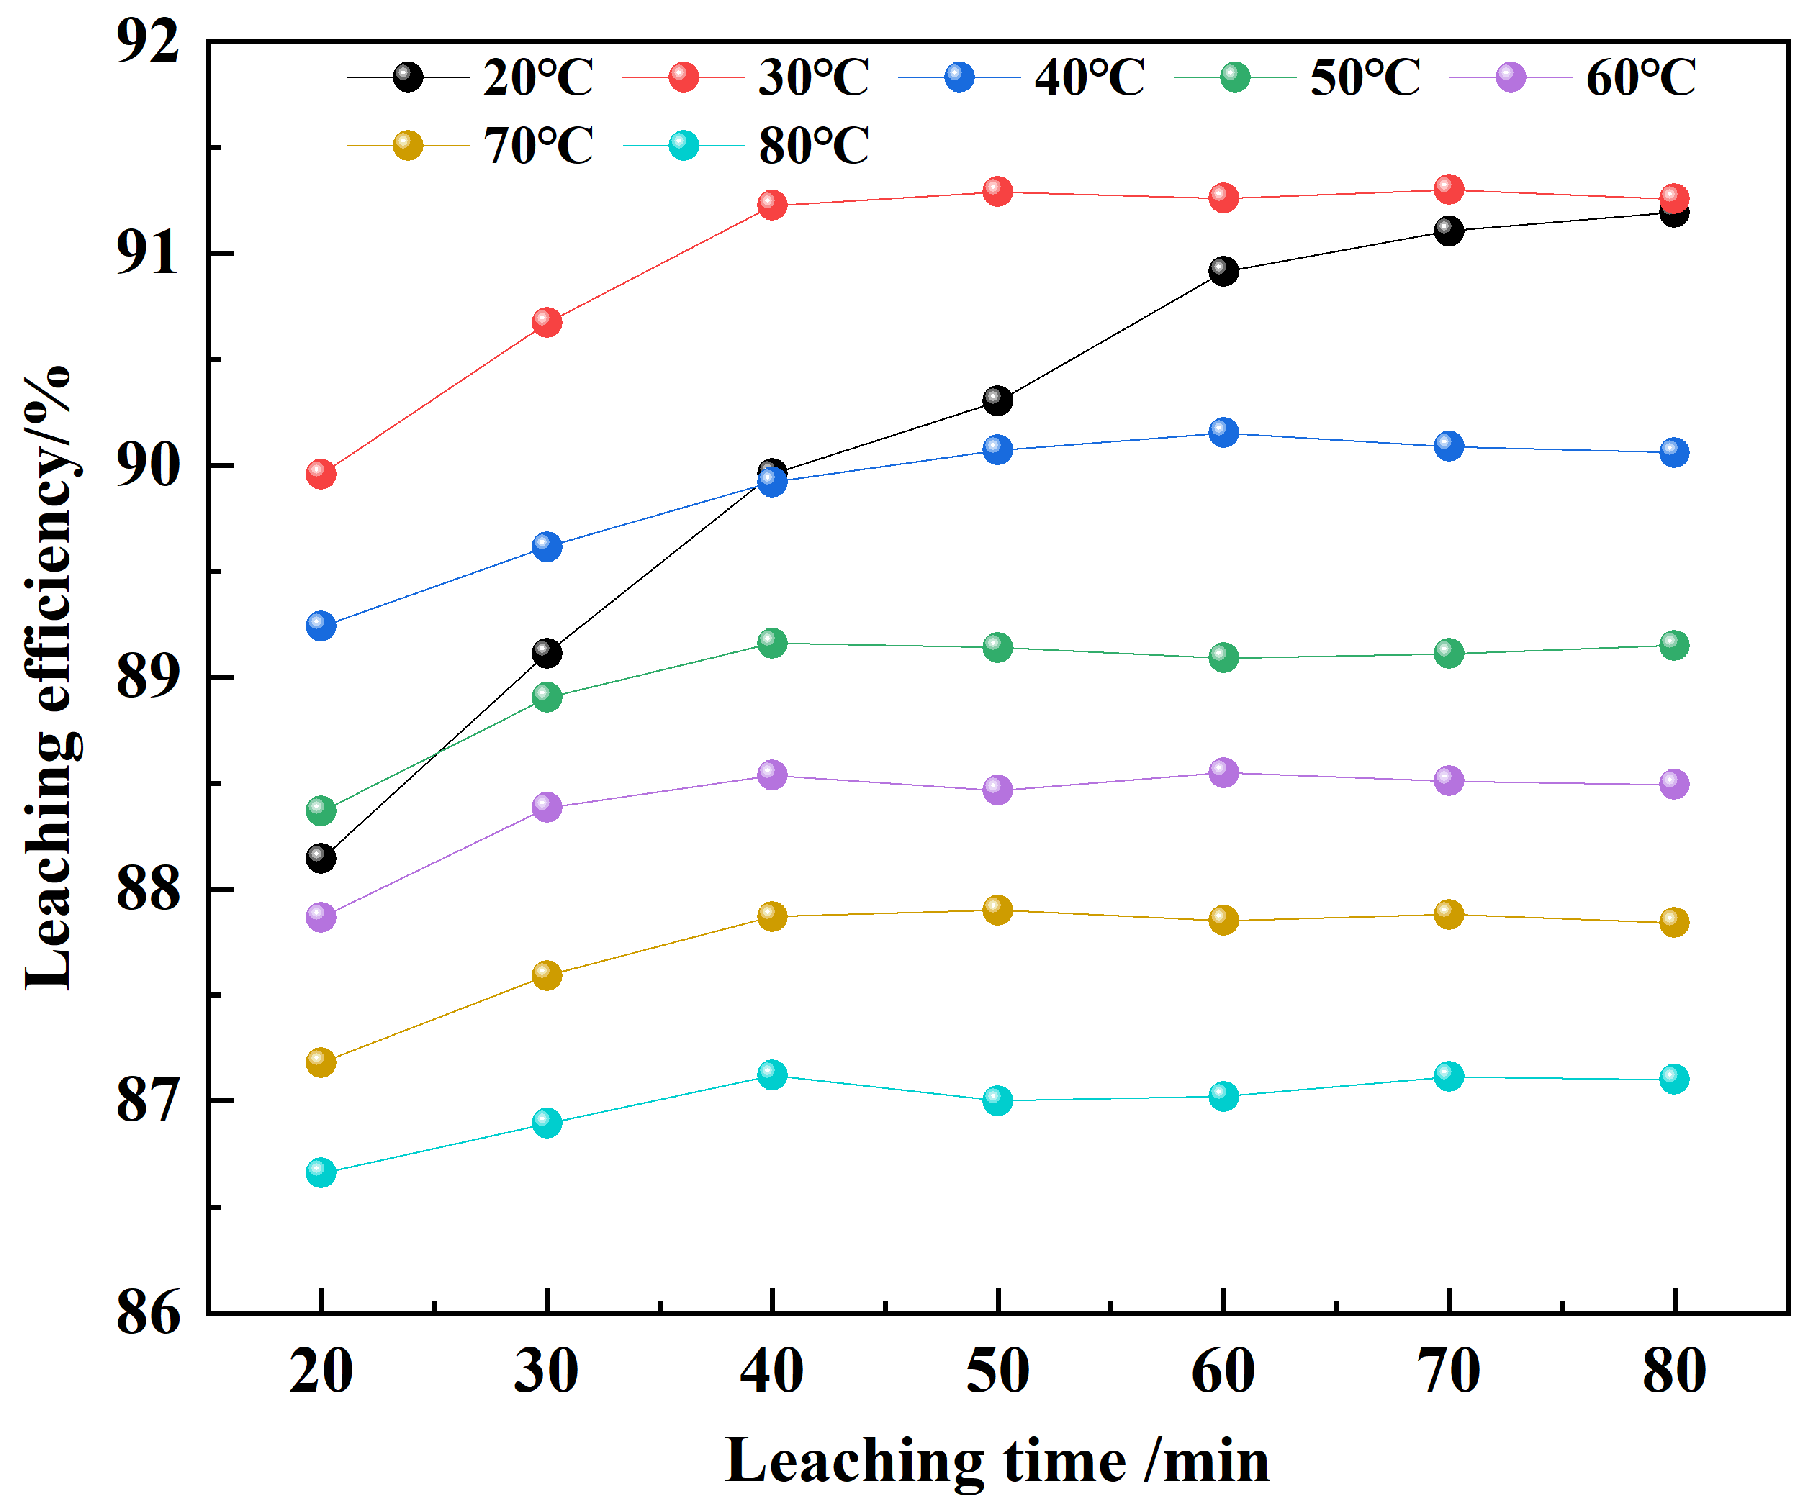
Figure 26 illustrates the effect of different leaching times and leaching temperatures on the P
2O
5 leaching rate during hydrochloric acid decomposition of phosphate concentrate. It can be seen that at leaching temperatures of 20 °C and 30 °C, the leaching time significantly affects the P
2O
5 leaching rate. In the early stages of the reaction, as the reaction time increases, the leaching rate improves notably. However, when the leaching temperature exceeds 40 °C, the P
2O
5 leaching rate generally shows a decreasing trend. This is because, as the leaching temperature increases, the volatilization of HCl during the system’s temperature rise increases, leading to a decrease in the overall P
2O
5 leaching rate.
The hydrochloric acid decomposition of phosphate ore is a typical liquid–solid non-catalytic reaction in the flow solid phase. During the initial stage of the reaction, the surface of the phosphate ore particles comes into contact with hydrochloric acid and dissolves. Due to the presence of inert substances (such as silicate minerals) in the phosphate ore particles, which are difficult to react with acid, the ore dissolves unevenly, leaving voids. The acid-insoluble substances form an inert residual layer that maintains the structure of the particle skeleton. As the reaction time increases, the phosphate ore particles continue to dissolve, and the unreacted core of the phosphate ore shrinks and expands inward. In the later stages of the reaction, the inert residual layer on the particle surface hinders acid from contacting the unreacted phosphate ore and restricts the dissolution of phosphorus. Therefore, the phosphate ore particle solid mixture is approximately spherical and follows the shrinking core model characteristics. This process can be described using the shrinking core model with a constant particle size. The corresponding kinetic equations are as follows:
(1) Fluid retention film diffusion control
(2) Diffusion control within the solid product layer
(3) Chemical reaction control
In the equation: x—P2O5 leaching rate (%);
t—Leaching time (min);
k—Apparent reaction rate constant.
After determining the reaction control model of phosphorus and hydrochloric acid, the apparent activation energy of the reaction can be calculated using the following Arrhenius Equation (10).
Taking the logarithm of both sides of Equations (3)–(10), we get:
In the equation: k: The apparent rate constant (min−1):
A: The pre-exponential factor (min−1);
Ea: The activation energy of the reaction (J/mol);
R: The molar gas constant, 8.314 J/(mol·k);
T: Thermodynamic temperature (K).
Based on the above leaching reaction kinetics equations, under the conditions of hydrochloric acid consumption at 70% of the theoretical amount, solid–liquid ratio of 1:5, and stirring speed of 400 r/min, the relationship between P
2O
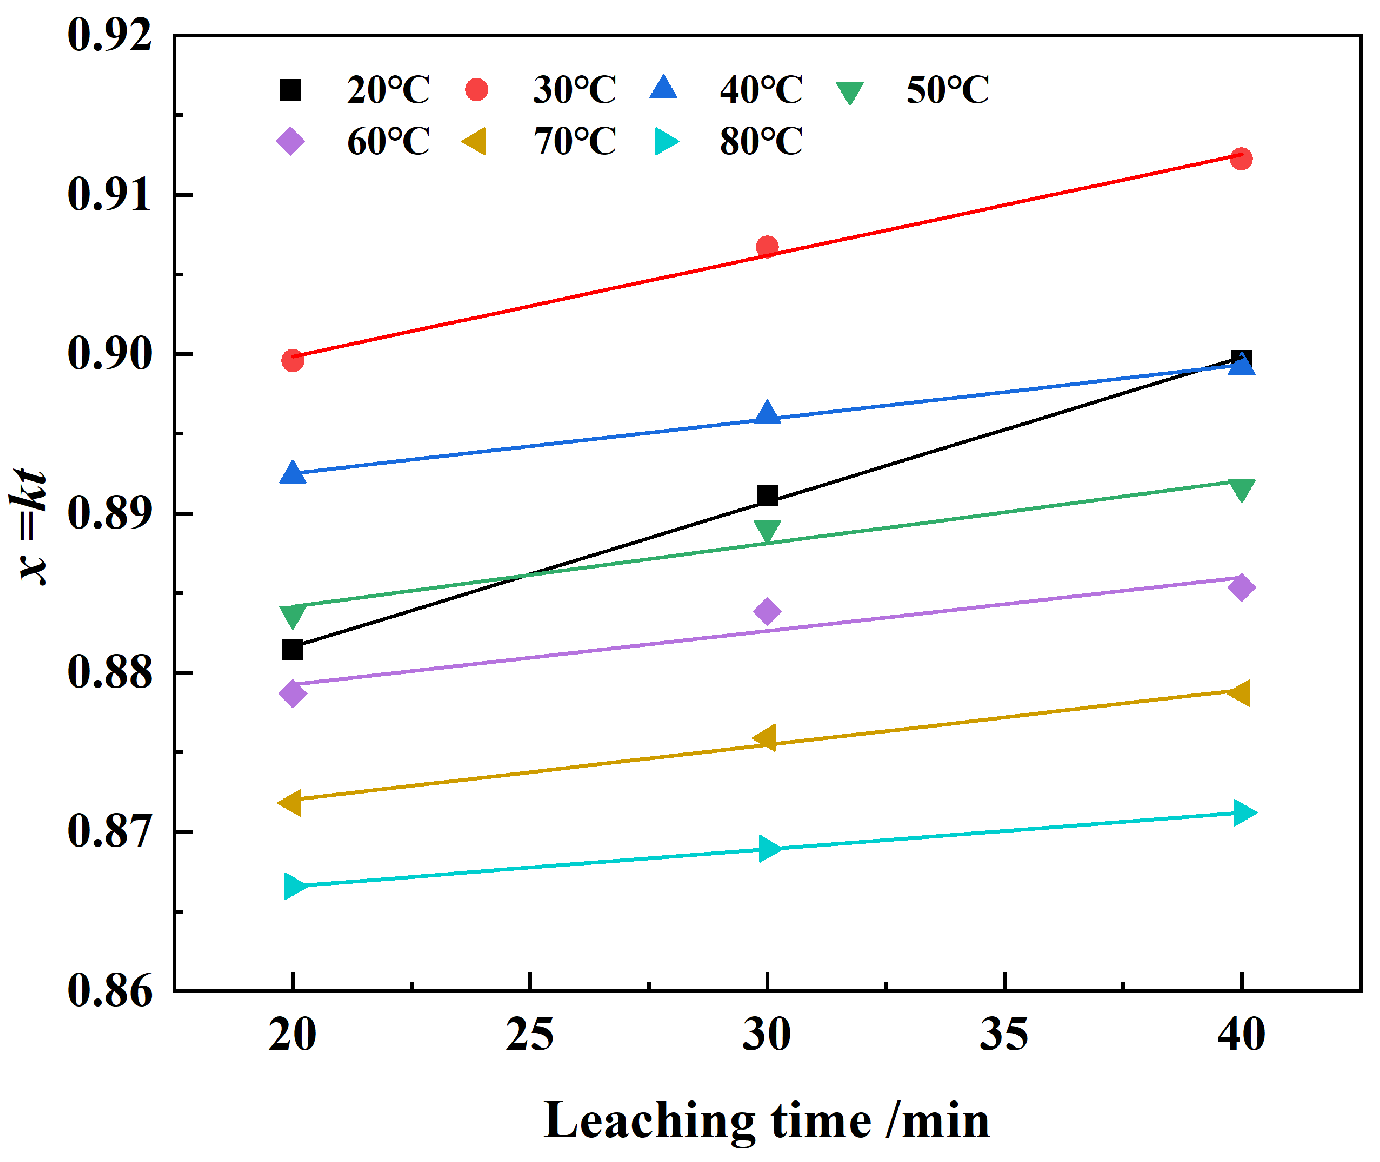
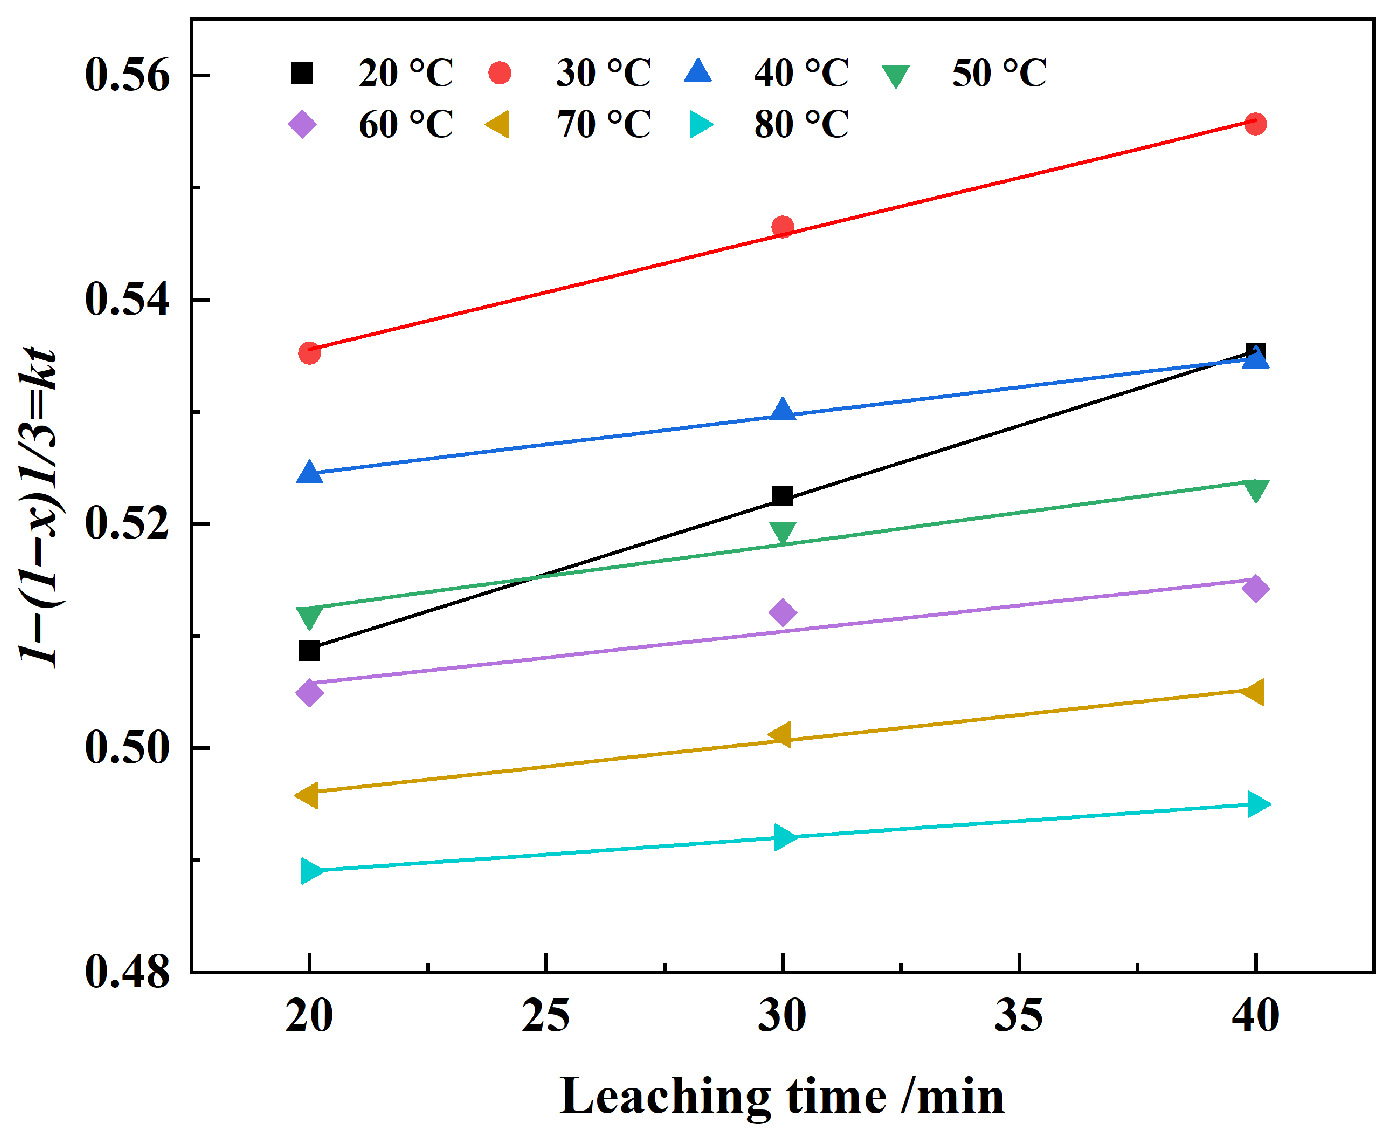
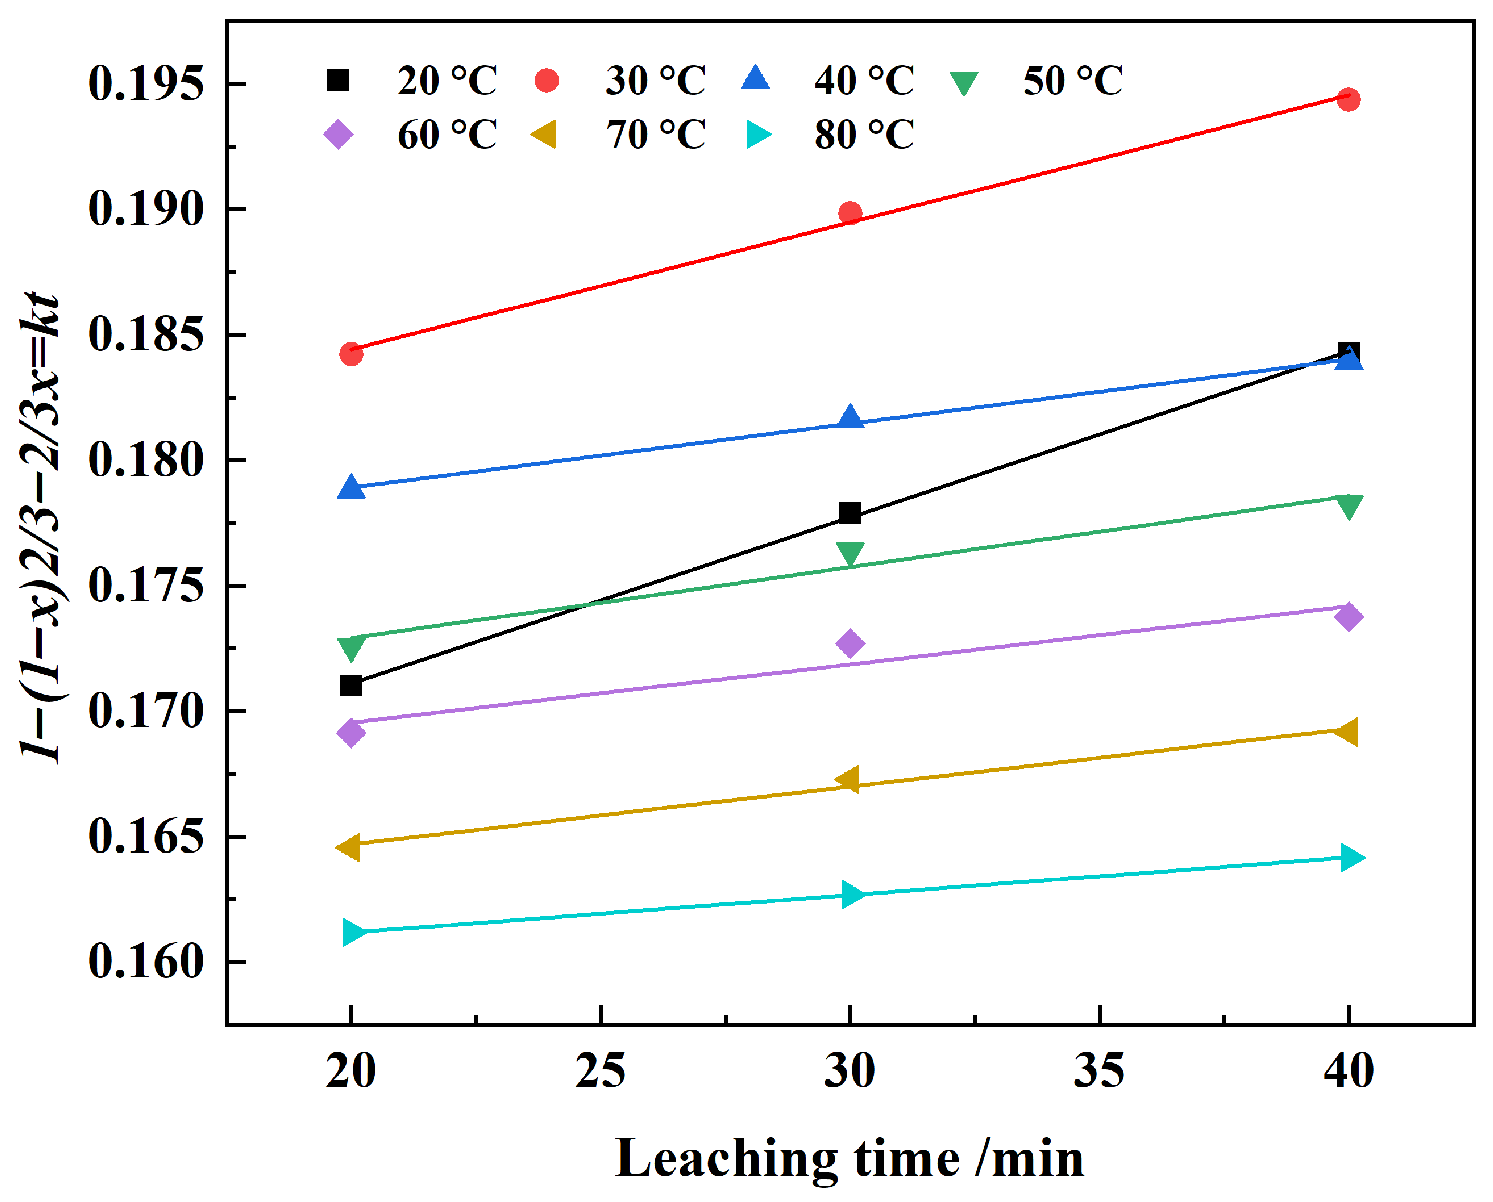
5 leaching rate and temperature was investigated at different leaching temperatures (20 °C, 30 °C, 40 °C, 50 °C, 60 °C, 70 °C, 80 °C). The data before reaching equilibrium were substituted into Equations (3)–(7) to (3)–(9) according to the three diffusion models to determine the kinetic model that best describes the reaction of P
2O
5 with hydrochloric acid. The results are shown in
Figure 27,
Figure 28 and
Figure 29 and
Table 7.
From
Table 8, it can be observed that the hydrochloric acid decomposition of rare earth-associated phosphate concentrate follows the solid product layer diffusion model.
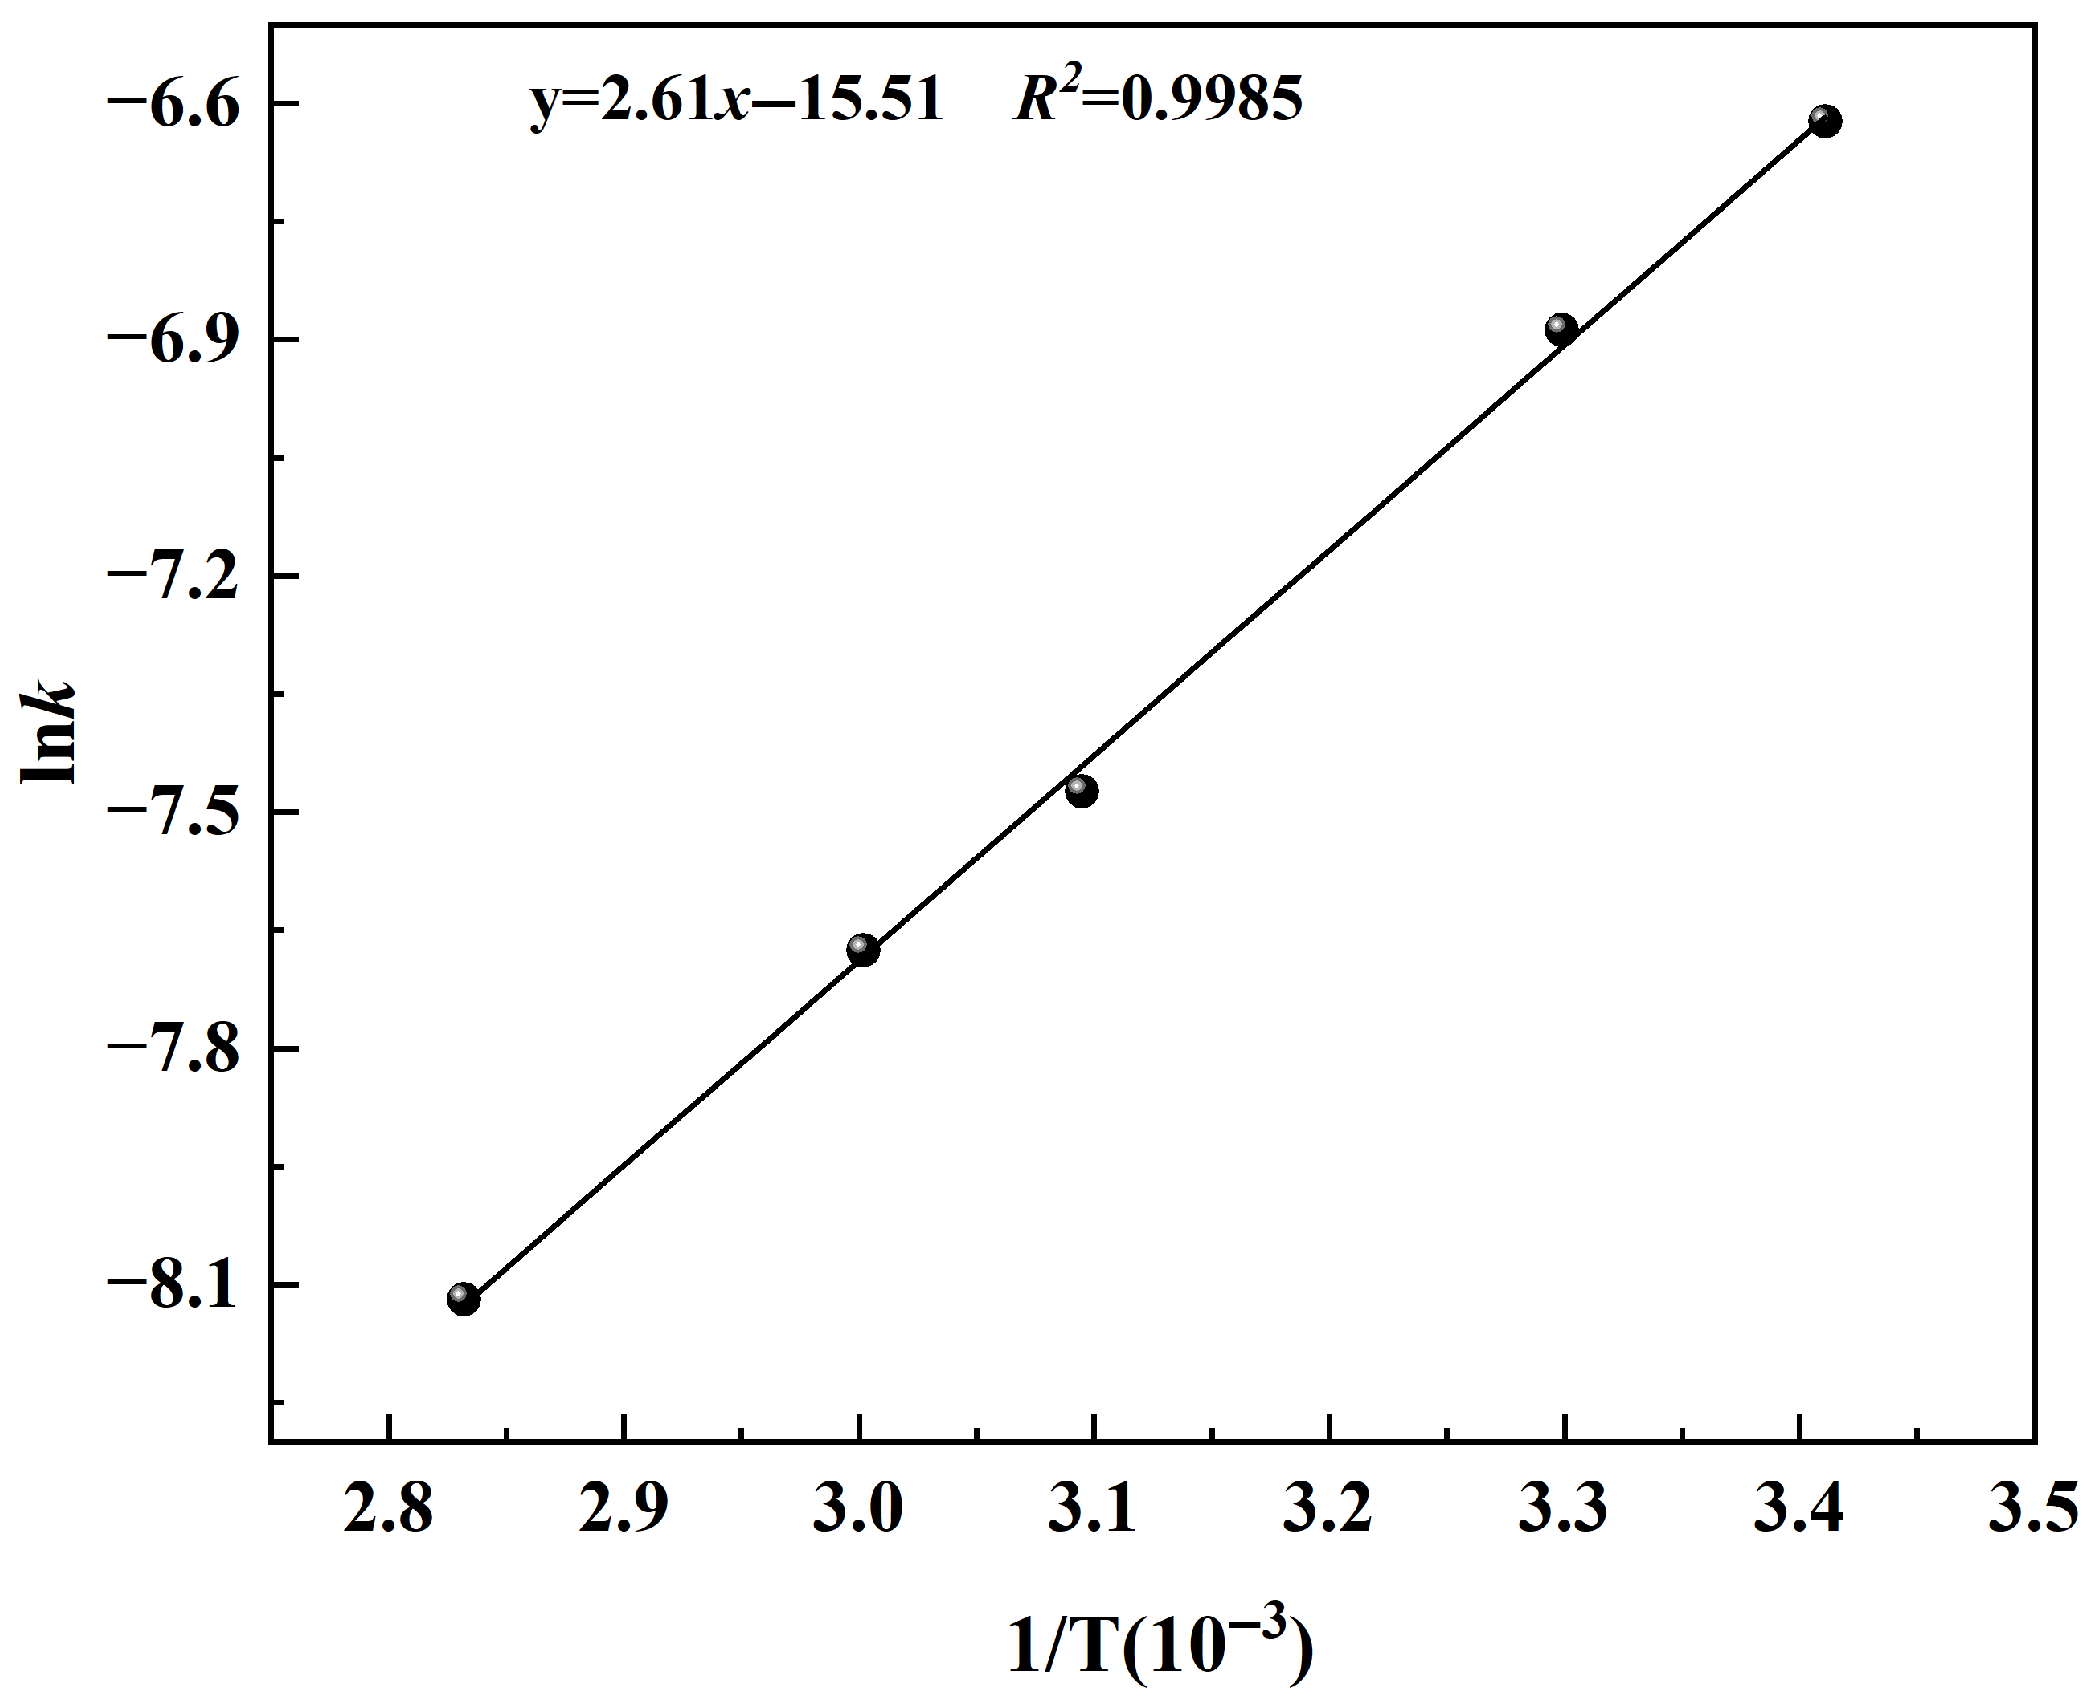
By substituting the temperature and corresponding chemical constants into Equation (11), the Arrhenius curve can be obtained. Additionally, the relationship between lnk and 1/T at different hydrochloric acid leaching temperatures was fitted, as shown in
Figure 30. The slope of the fitted line in the figure represents the value of −
Ea/R, from which the apparent activation energy (
Ea) for the leaching reaction of phosphorus in the original ore can be calculated as −19.16 kJ·mol
−1. The results indicate that the apparent activation energy (
Ea) for the hydrochloric acid decomposition of phosphate ore is negative, which suggests that, under the strict control of hydrochloric acid consumption, an increase in leaching temperature accelerates the volatilization of HCl in the solution, thereby reducing the phosphorus leaching rate.
3.6. Response Surface Analysis of Phosphorus Leaching
Response surface analysis method is a statistical experimental technique that analyzes the regression relationship between experimental factors and multiple variables. Response surface analysis method has significant advantages in multivariable optimization, rapid identification of optimal values, process simplification, high precision, and high efficiency, making it an effective tool for solving engineering optimization problems. Based on the results of the single-factor experiments, a five-factor, three-level experimental design was carried out using Design-Expert 13 software. The independent variables and their levels are shown in
Table 8.
The response surface experiment used rare earth-associated phosphate concentrate as the raw material, with the phosphorus leaching rate as the response variable. The variables considered were HCl consumption, leaching time, leaching temperature, solid–liquid ratio, and stirring speed. The experiment systematically investigated the effects of these five factors on the phosphorus leaching rate.
A multiple quadratic regression model was established between the phosphorus leaching rate (
R) and the variables HCl consumption (
A), leaching time (
B), leaching temperature (
C), solid–liquid ratio (
D), and stirring speed (
E) using the experimental data. The equation is shown in Equations (3)–(12), with a corrected coefficient of determination (adj
R2) of 0.97. This indicates that the model has a high fit, and it can be used to analyze the significance of the factors affecting the phosphorus leaching rate.
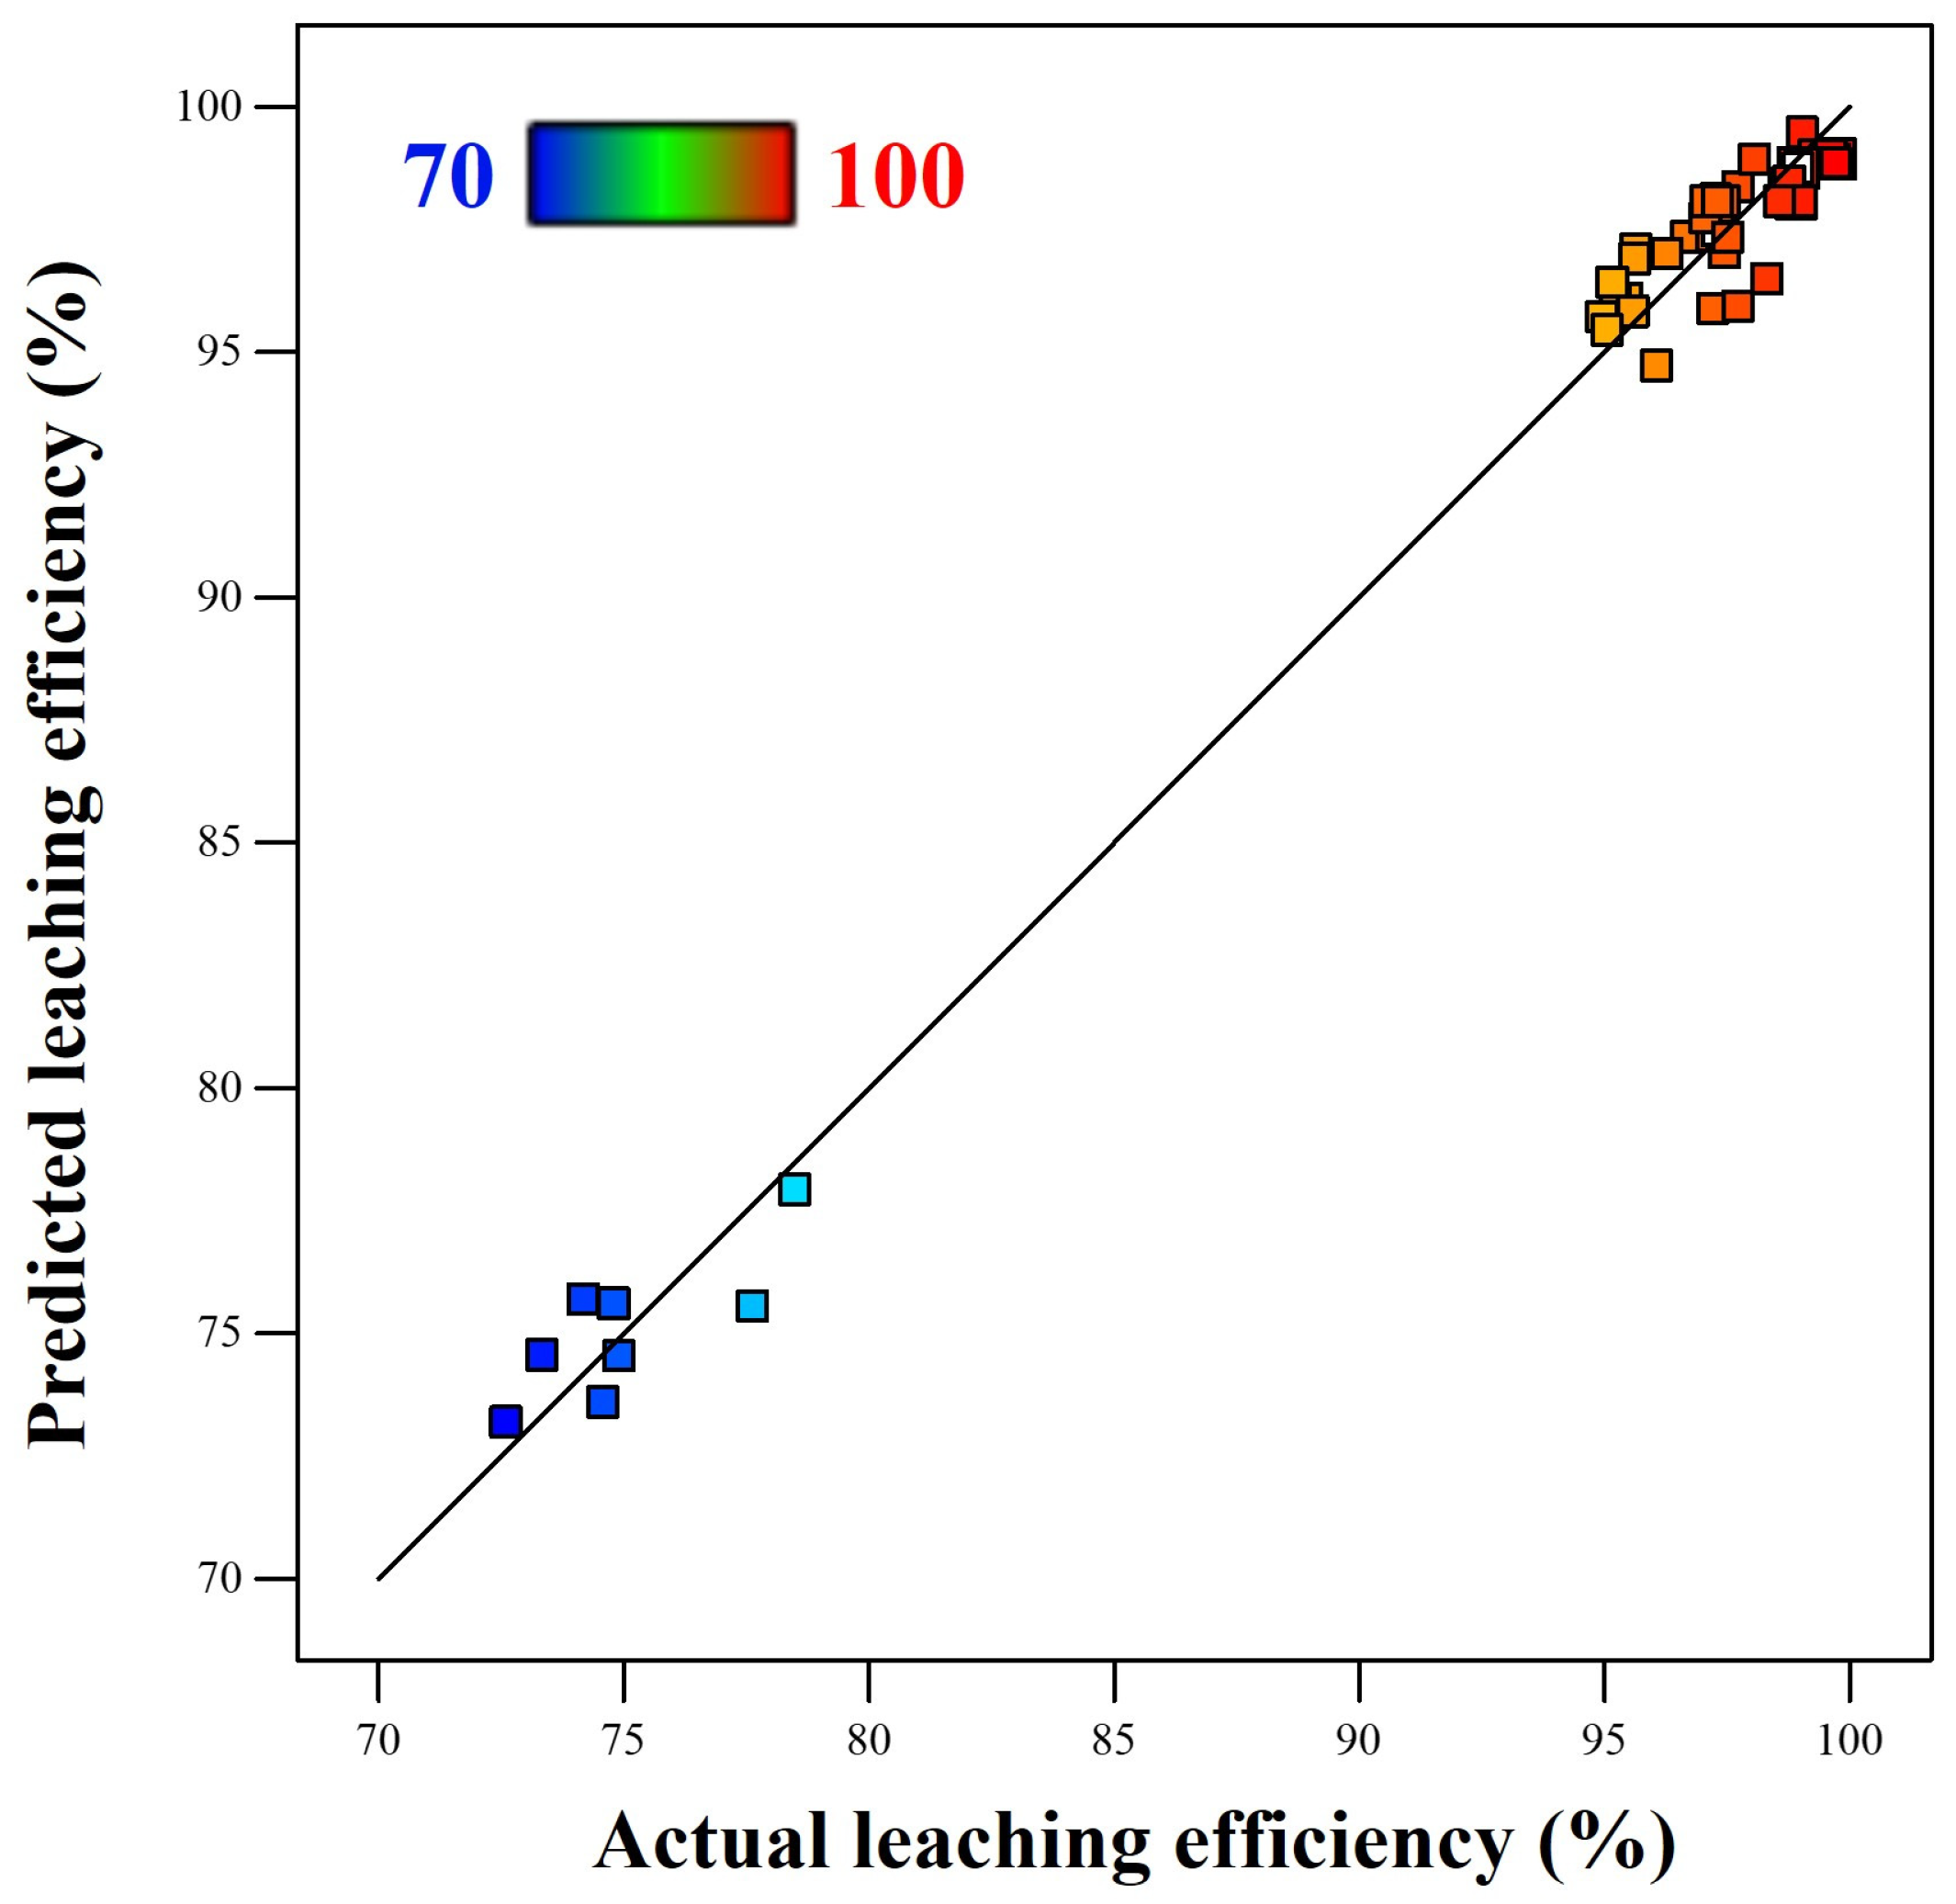
The relationship between the experimental phosphorus leaching rate and the predicted values from the multiple quadratic regression model is shown in
Figure 31. From the figure, it can be observed that the experimental values are generally close to the predicted values, indicating a high degree of correlation between the predicted and experimental values. This suggests that the fitted multiple quadratic regression model is reasonable and has high accuracy.
Table 9 presents the analysis of variance results for the multiple quadratic regression model. The model’s F-value is 108.25, and the difference between Adj R
2 and Pred R
2 is less than 0.2. The model’s signal-to-noise ratio is 31.09, with only a 0.01% probability of an abnormal signal-to-noise ratio. A signal-to-noise ratio greater than 4 indicates that the model is of reference value. The F and
p-values for the lack of fit are 2.33 and 0.1776, respectively, with the lack of fit being insignificant, indicating a high model fit and strong reliability. The
p-value is used to measure the significance level of each factor and their interactions. Typically, a
p-value less than 0.05 indicates significance, and a
p-value less than 0.01 indicates high significance. From the analysis of variance results, it can be concluded that the effects of HCl consumption (
A), leaching temperature (
C), and the interaction between leaching time and solid–liquid ratio (
BD) on the phosphorus leaching rate (
R) are significant. However, the effects of leaching time (
B), solid–liquid ratio (
D), stirring speed (
E), and the interactions between
AB,
AC,
AD,
AE,
BC,
BE,
CD,
CE, and
DE on the phosphorus leaching rate (
R) are not significant.
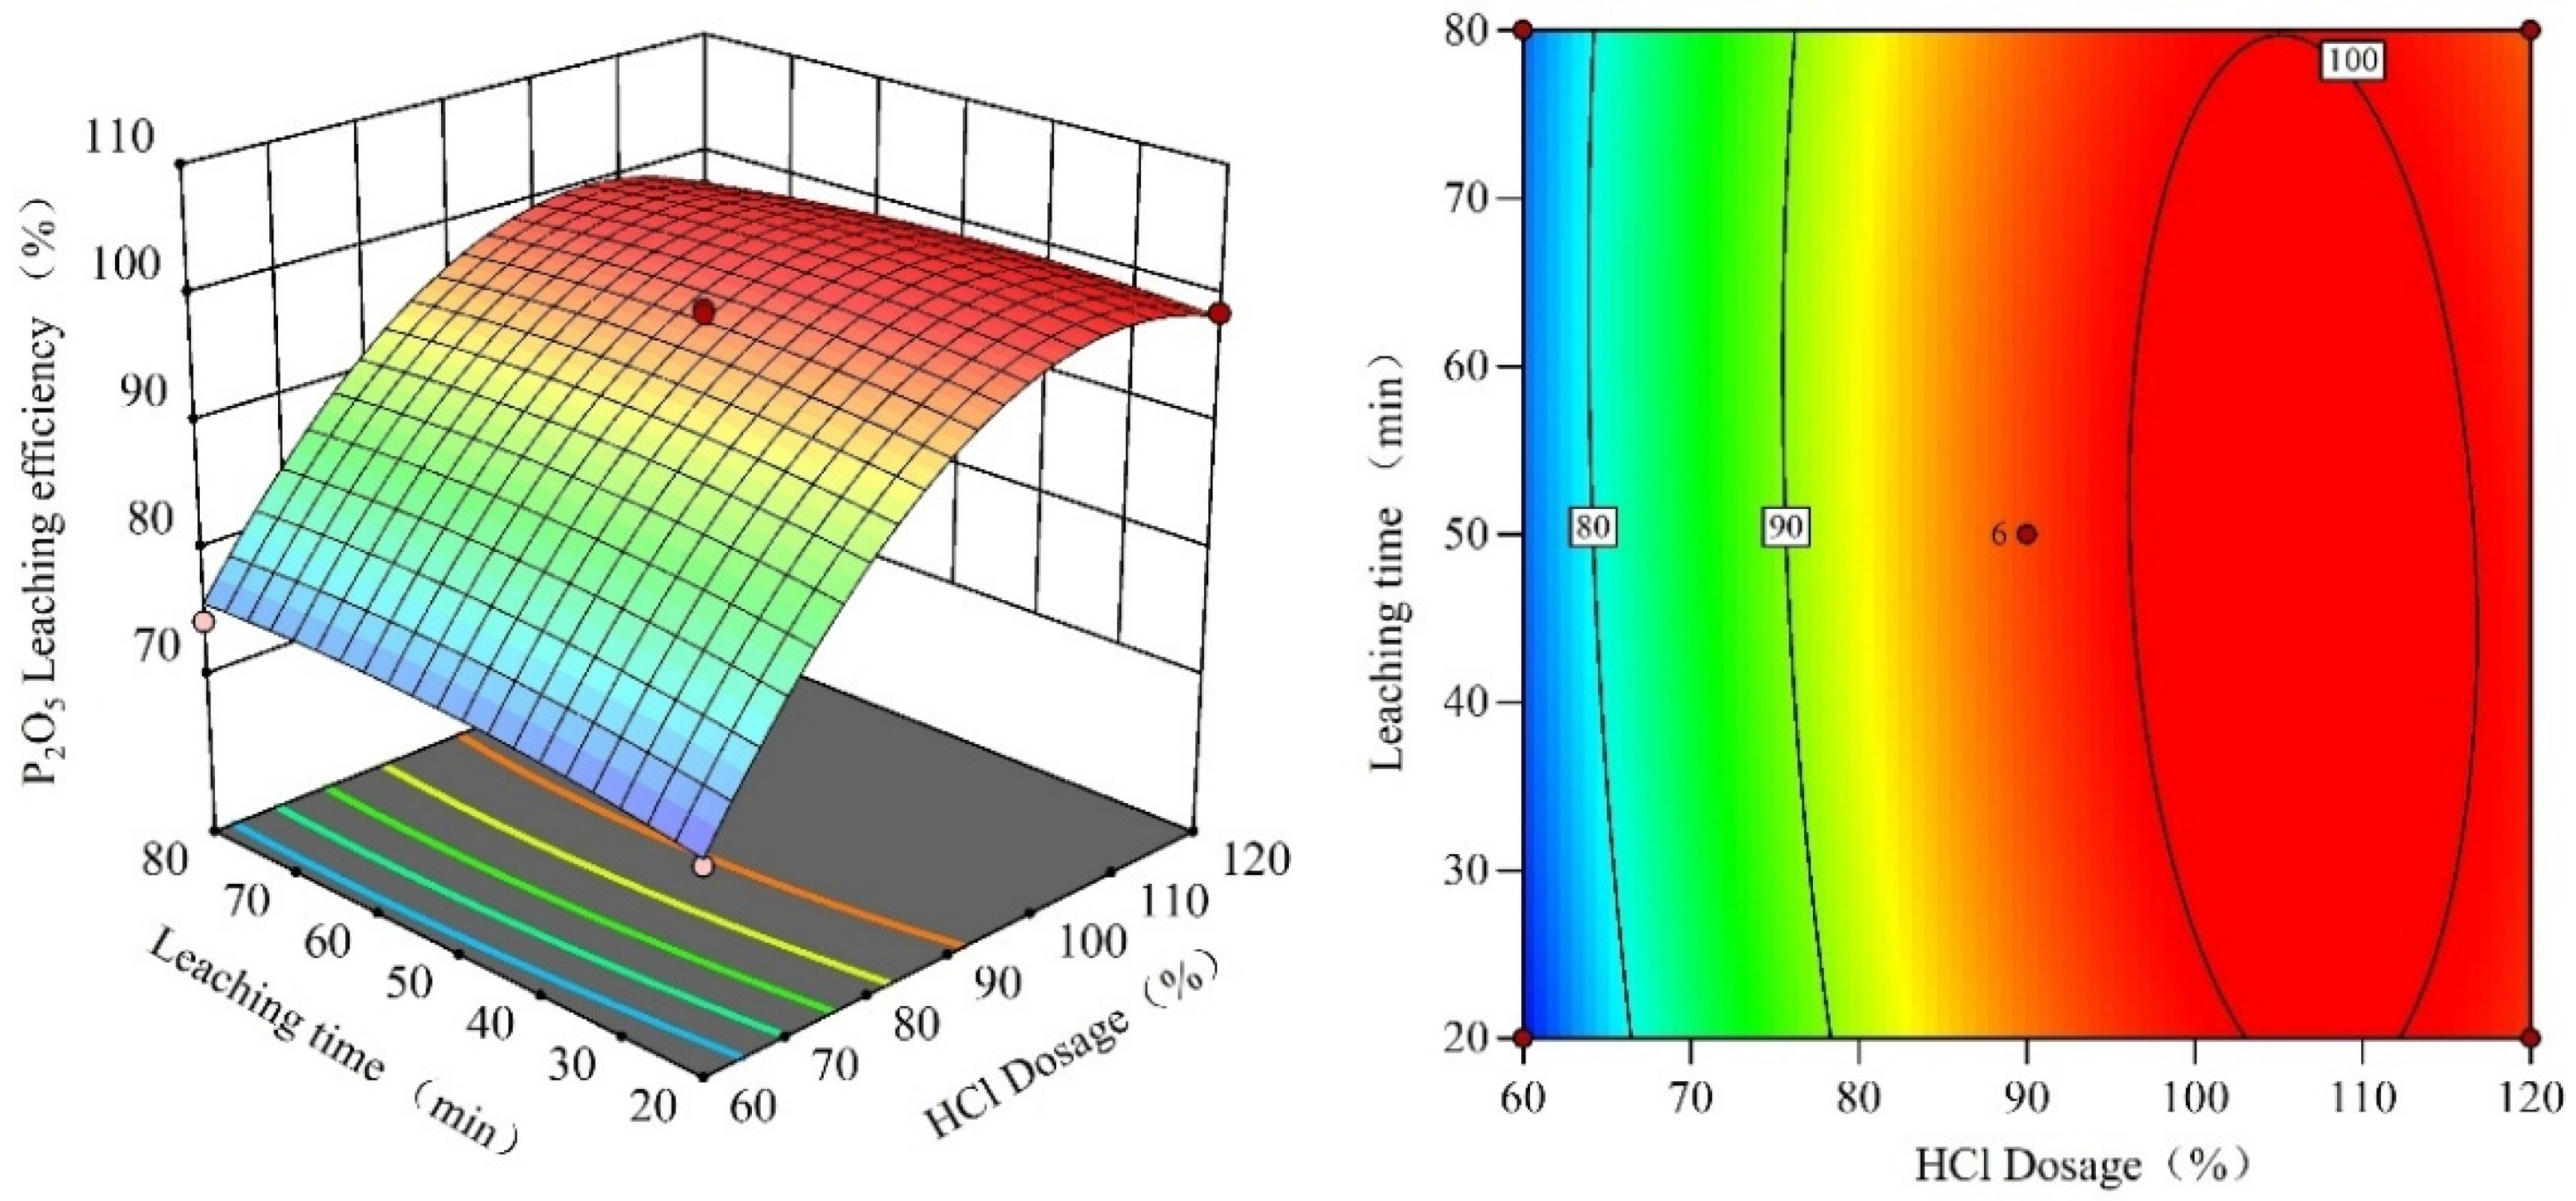
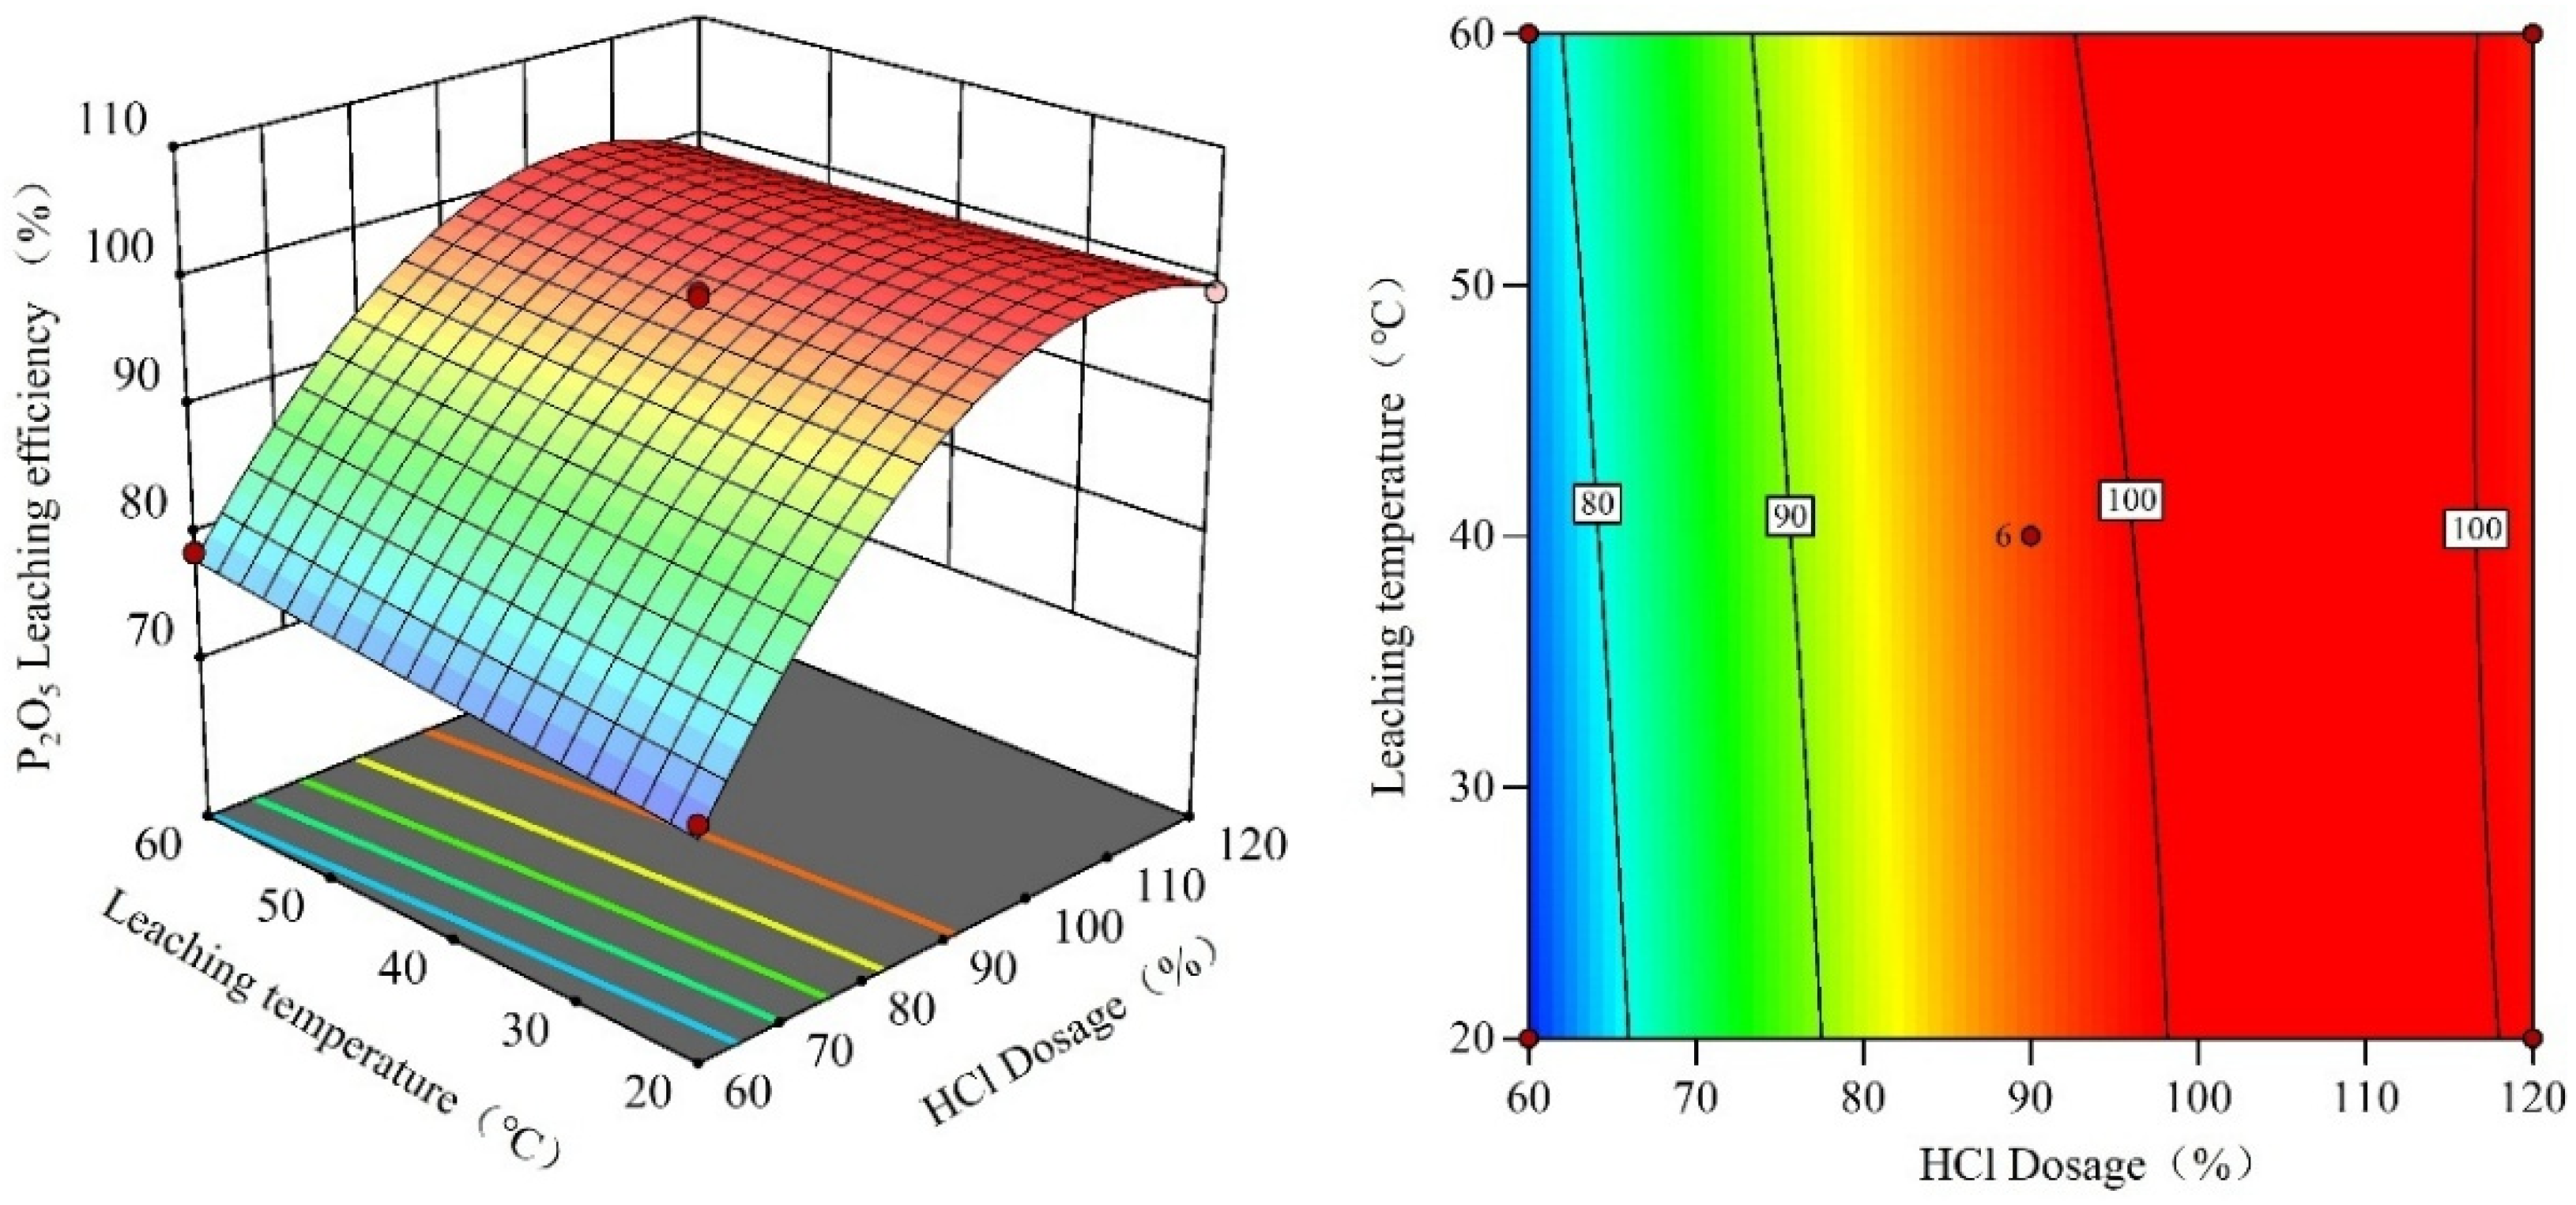
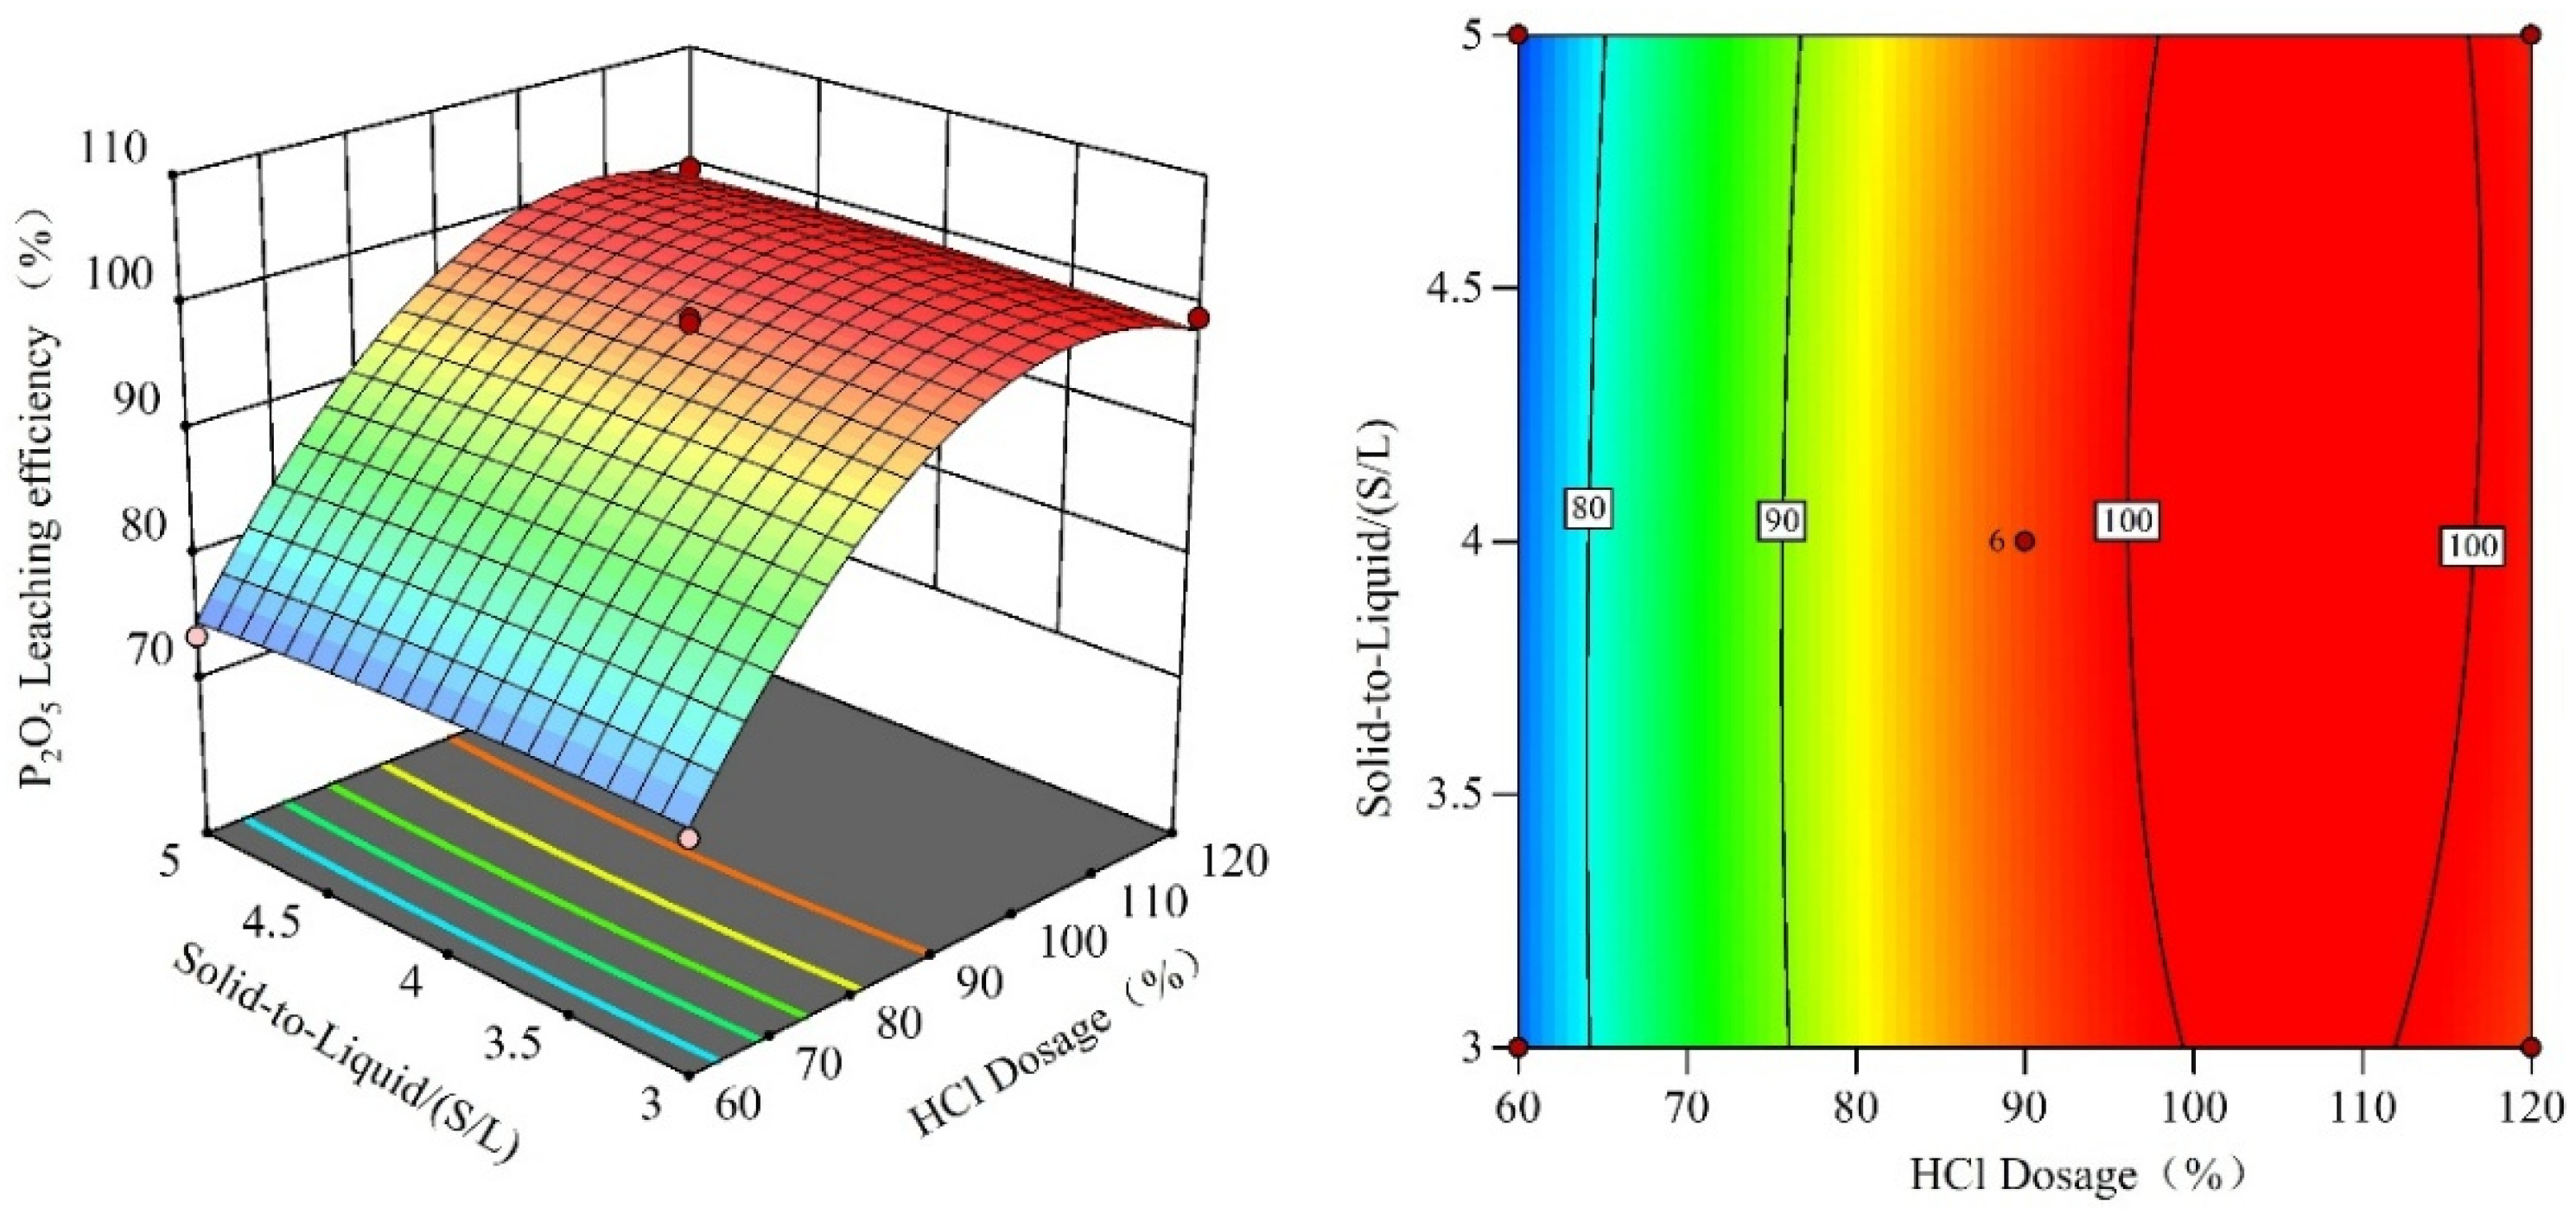
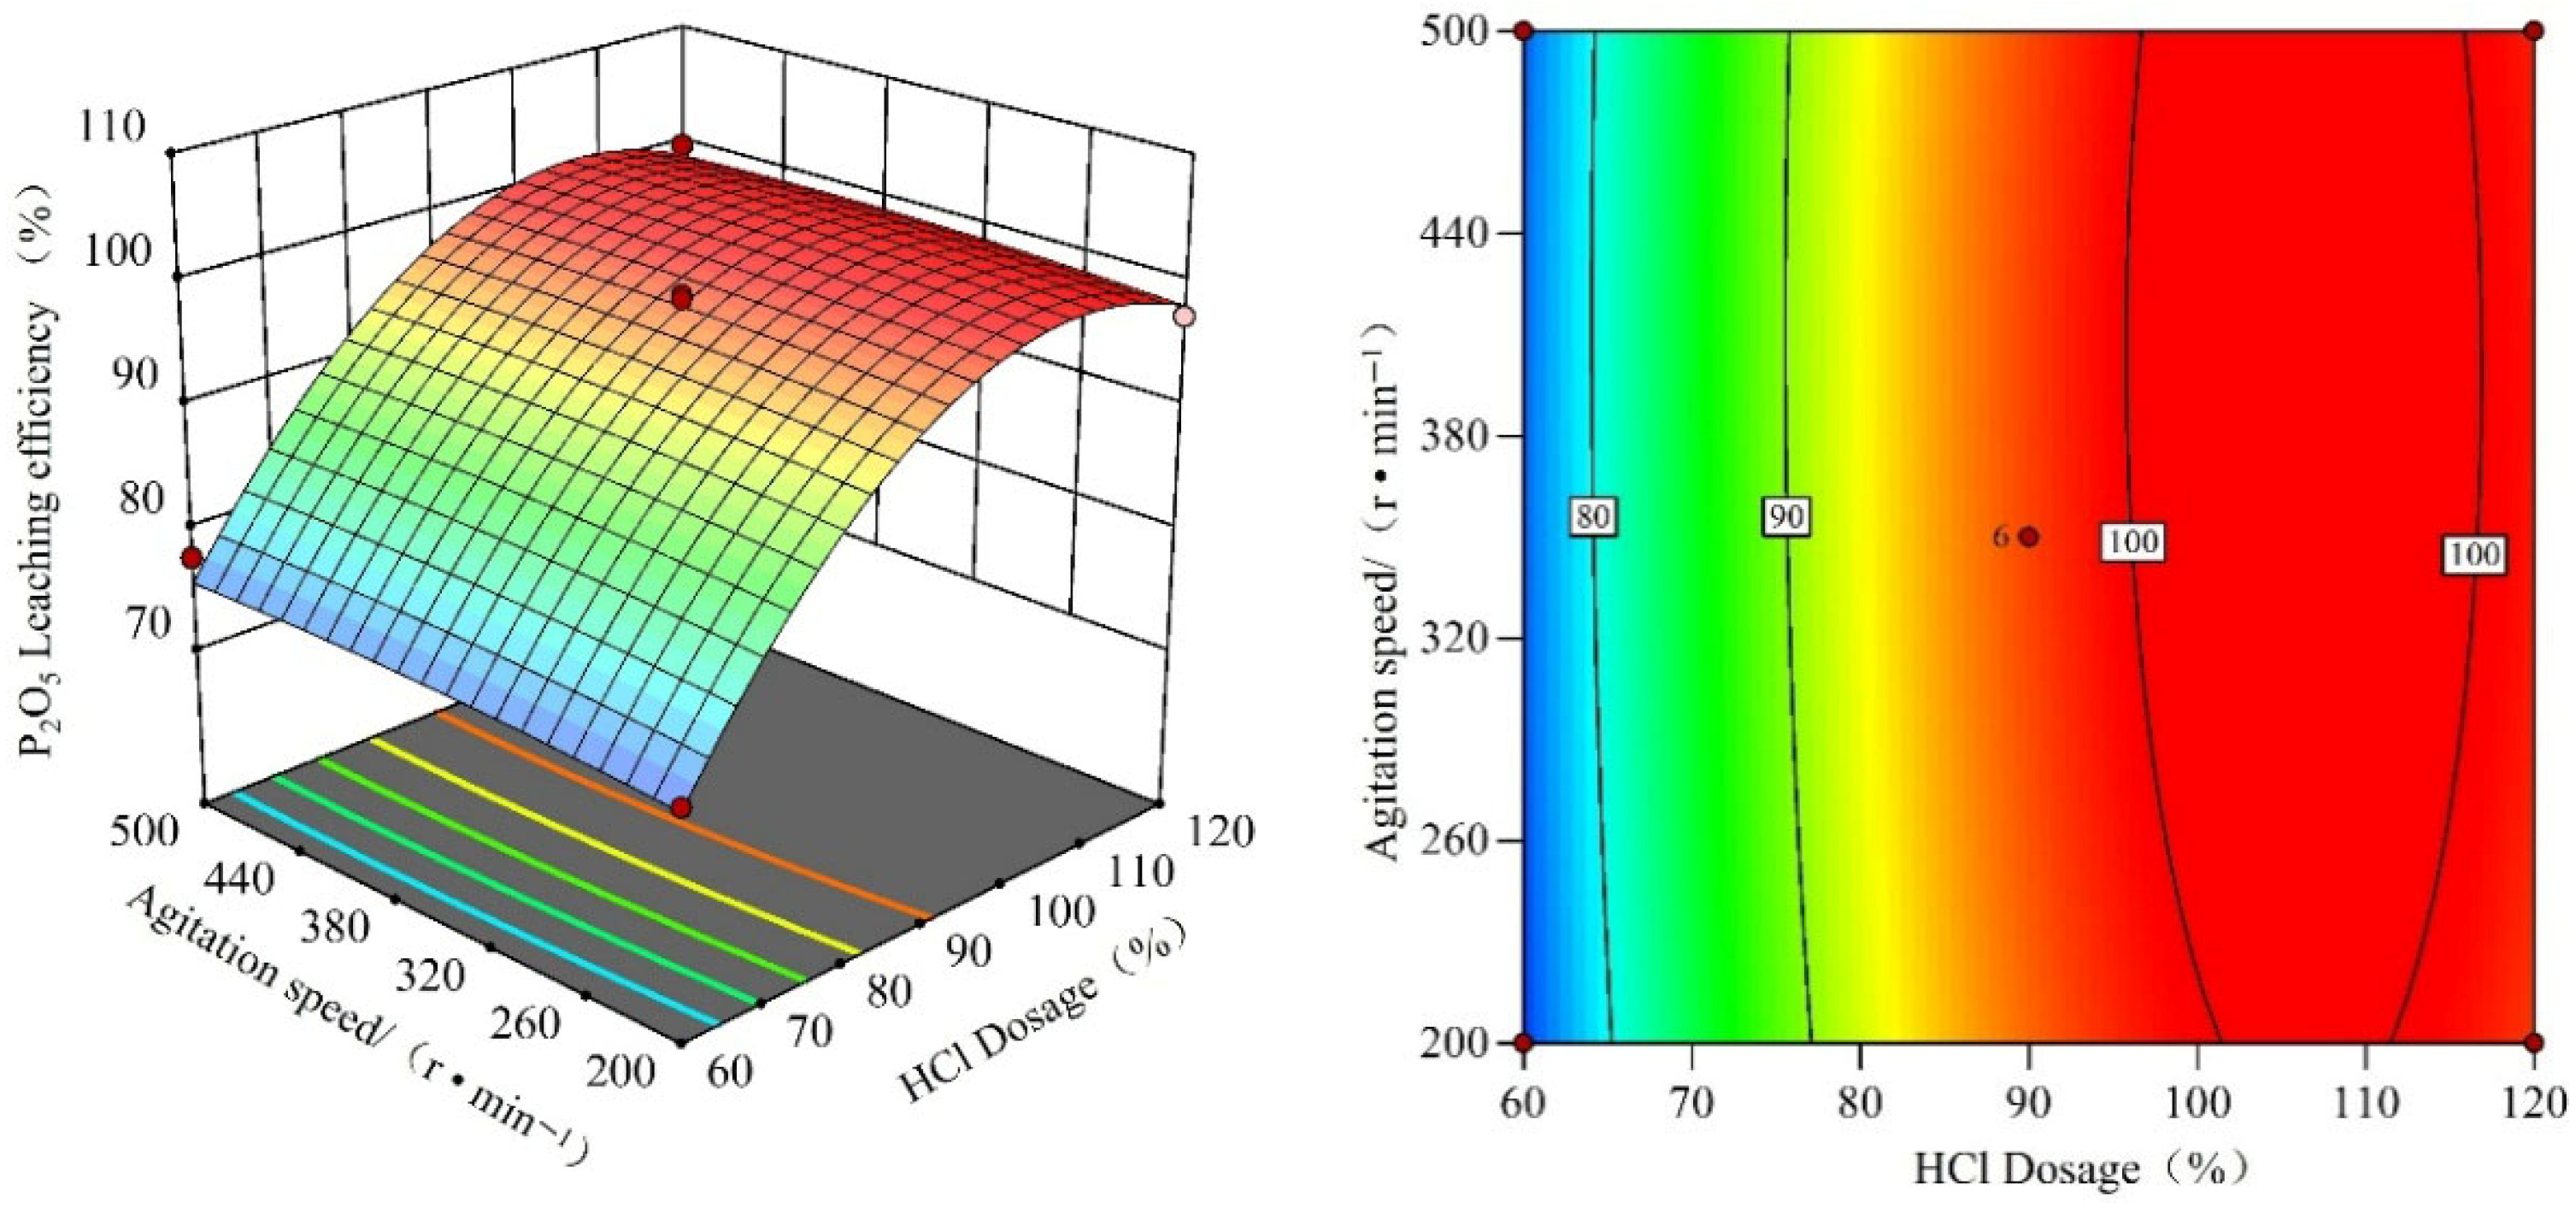
To further study the significance of the effects of HCl consumption, leaching time, leaching temperature, solid–liquid ratio, and stirring speed, as well as their interactions on the phosphorus leaching rate, three-dimensional response surface plots and two-dimensional contour plots were created based on Equations (3)–(12), as shown in
Figure 32,
Figure 33,
Figure 34 and
Figure 35.
From
Figure 32, it can be observed that the response surface has an upwardly curved plane. The leaching rate increases with the increase in HCl consumption and leaching time. The surface is non-planar, exhibiting slight curvature, indicating a nonlinear interaction between the factors. The contour plot is elliptical, tilting upward to the right. The region with lower leaching rates is concentrated in the areas of low HCl consumption and short leaching times, suggesting that changes in time have a significant impact. Conversely, the region with higher leaching rates is concentrated in areas of high HCl consumption and long leaching times, indicating that the leaching rate is more sensitive to changes in HCl consumption.
Figure 33 illustrates that the surface of the response surface curves upwards from the region of low HCl consumption and low temperature. The surface is non-planar, exhibiting a subtle “saddle” curvature, with a relatively flat center and a steep incline at higher values, indicating a pronounced secondary effect. In areas of low HCl consumption, the slope is gentle, suggesting that the low consumption of HCl limits the dissolution of phosphorus in the phosphate ore. The two-dimensional contour lines for HCl consumption and leaching temperature tilt upward to the right, displaying slight curvature, which suggests the presence of some interaction. The smaller vertical spacing of the contours indicates that variations in HCl consumption are more sensitive to leaching efficiency, while the larger horizontal spacing implies that temperature variations have a relatively moderate effect. However, in regions of high HCl consumption, the contour lines are compressed, amplifying the temperature effect due to the interaction.
The response surface of HCl consumption and solid–liquid ratio is shown in
Figure 34. The surface curvature distinctly takes on a “saddle” shape, with the leaching rate significantly increasing with higher HCl consumption and decreasing as the solid–liquid ratio increases. The surface curves downward non-linearly, indicating a negative interaction. In the contour plot, the horizontal spacing is narrow, with changes in HCl consumption dominating, and the contours tilt downward to the right, suggesting a negative interaction. The vertical spacing between the contours is relatively large, and in the high HCl consumption region, the contours are more densely packed, amplifying the negative effect of the solid–liquid ratio.
Figure 35 reveals that the response surface curves upwards from the region of low stirring rate and low HCl consumption, indicating that the leaching rate of phosphorus increases significantly with higher HCl consumption and stirring speed. The surface exhibits a non-linear upward curvature, demonstrating a strong positive interaction, while a slight curvature suggests the dominance of the primary effect. The contour lines show mild curvature, with moderate horizontal spacing, indicating a significant influence of HCl consumption. The vertical spacing is relatively large, but in the region of high HCl consumption, the contours are densely packed, amplifying the positive effect of stirring. In areas with higher stirring rates, the contours are compressed downward, signifying a positive interaction between stirring speed and HCl consumption.
4. Conclusions
This study takes a dolomitic rare earth-bearing phosphate concentrate from the Zhijin region of Guizhou Province as the research subject. Focusing on the critical challenge of the inefficient separation of phosphorus and rare earth elements in the conventional wet-process phosphoric acid production route, a systematic investigation was conducted on the preferential leaching of phosphorus and the migration–enrichment behavior of rare earth elements in a hydrochloric acid leaching system. The principal conclusions are as follows:
(1) Firstly, thermodynamic calculations were performed to elucidate the reaction priority of the principal mineral phases present in the dolomitic rare-earth-bearing phosphate concentrate. Within the hydrochloric acid leaching system, dolomite exhibits the highest reactivity with hydrochloric acid, followed by fluorapatite. This difference provides the theoretical basis for achieving preferential phosphorus leaching through the controlled regulation of hydrochloric acid dosage and leaching temperature, and fundamentally explains why dolomitic rare earth-bearing phosphate ores possess the inherent potential to realize preferential phosphorus leaching in a hydrochloric acid system.
(2) Through a systematic investigation of the effects of key process parameters—including hydrochloric acid dosage, leaching time, leaching temperature, solid–liquid ratio, and stirring rate—on the leaching efficiencies of phosphorus and rare earth elements, the optimal conditions for preferential phosphorus leaching from this type of phosphate concentrate were determined as follows: hydrochloric acid dosage at 70% of the theoretical requirement, leaching time of 30 min, leaching temperature of 30 °C, solid–liquid ratio of 1:5, and stirring rate of 400 r/min. Under these conditions, the leaching rate of P2O5 reached 91.27%, while rare earth elements exhibited significant enrichment in the leaching residue, with an enrichment ratio of 4.7 and a minimal loss rate of only 1.517%.
(3) The phase analysis of the leaching residue and the investigation of the occurrence states of rare earth elements indicate that, following the preferential dissolution of phosphorus, the residual Ca combines with F to form CaF2. Because rare earth elements occupy the Ca lattice sites in fluorapatite through isomorphic substitution, they do not dissolve extensively into the liquid phase during phosphorus leaching. Instead, they become synchronously enriched in the leaching residue together with CaF2 and the remaining fluorapatite, without forming independent rare earth mineral phases.
(4) The kinetic analysis indicates that the preferential leaching of phosphorus follows a diffusion-controlled model within the solid product layer. Combined with response surface methodology, the main effects of the influencing factors and their interactive impacts on phosphorus leaching were clearly elucidated. The resulting model exhibits a high degree of fit and demonstrates strong predictive capability.