


Summary
Mapping of cognitive evoked scalp potentials (EPs) offers excellent temporal and cognitive resolution. Its spatial resolution distinguishes even subtle differences in afferent and cognitive processes and is commonly underestimated. The noninvasive method reveals a temporally ordered sequence of transient, covert, functional microstates of the brain. Tomographic and gradientbased source localization can translate this spatial into neuroanatomical resolution which depends on the three-dimensional configuration of the active sources. Such functional brain mapping with EPs has the potential to integrate current structural (neurological) and dynamic (information processing) models of brain function and dysfunction. We review contributions to a neurophysiological understanding of language, attention, inhibition, and of psychiatric disorders such as schizophrenia and ADHD (attention deficit/hyperactivity disorders).
Cognitive evoked potentials
Human evoked potentials triggered by stimulation were described some twenty years after the human scalp electroencephalogram (EEG) [1]. However, the cumbersome overlay techniques needed to visualize consistent evoked potential (EP) traces [2] prevented wider applications. When digital computer technology permitted time-locked averaging which cancelled the spontaneous EEG, these averaged EP [3] provided a direct view on real-time information processing in the brain. This view was a fundamentally new one because the small (0.1–30µV) evoked potentials are normally invisible in the much larger spontaneous EEG (10–200µV); through averaging even activity from deep and tiny brainstem structures could be extracted [4].
The discovery of “endogenous” or cognitive-event-related potential components promised broad applications to cognitive processes in neuropsychology, psychiatry and psychology. Such EP components are defined by cognitive rather than by physical aspects of the stimuli [5]. Prominent examples are the Bereitschaftspotential preceding voluntary movements [6], the P300 component [7] following rare, task-relevant target stimuli or stimulus omissions, the contingent negative variation CNV [8] following warning signals, or the N400 [9] after semantically incongruous sentence endings. Cognitive studies have since demonstrated that the sequence of EP components tracks afferent, cognitive and efferent information processing stages and their interactions in real-time.
Topographic mapping and source modelling
The first multichannel EEG recordings were already used to understand the effects of volume conduction and to localize the alpha rhythm through sophisticated gradient analyses: Adrian and Yamagiwa [10] showed that the spatial gradients of the alpha rhythm were maximal over occipital regions and concluded that the alpha rhythm was mainly generated there. They also simulated the alpha EEG with an electrical generator in a cadaver skull to estimate the extent of the active region and to show that the orientation of their occipital generator determined polarity and phase at remote frontal channels. Recent quantitative multichannel work using FFT and dipole source analysis confirmed the occipital source for the alpha rhythm with eyes closed, but also demonstrated more anterior source locations for alpha EEG with eyes open [11]. When the technology for multichannel EP recordings became available, Lehmann et al. [12] showed that the scalp distribution of EPs is consistent with the neuroanatomy and neurophysiology of the activated afferent system, and that dipole source computations localized visually evoked activity to the visual cortex of the stimulated hemisphere. Such dipole computations [13] appear quite accurate (to about 1 cm) and similar for electric and magnetic fields, except that deep or radially oriented sources are attenuated or invisible in magnetic fields [14]. Dipole computations must constrain the source pattern to a predefined, small number of point sources, because the inverse problem states that there is no unique solution for an unconstrained source pattern of a given scalp field. Neurophysiologically more plausible constraints such as source stationarity [15], and particularly the 3-D source smoothness constraint implemented in low-resolution electromagnetic tomography (LORETA) [16] have recently provided both unique and meaningful solutions for more complex sources.
Mapping cognitive EPs
The main strength of EPs undoubtedly lies in their exquisite sensitivity to stimulus and task conditions, and in their high temporal resolution which is far beyond the effective resolution of current metabolic neuroimaging techniques. Topographic analysis can and need not improve on this temporal resolution. Maps of scalp voltage or current density also lack both the activity scales and the brain coordinates needed for source localization in the brain; interpreting them as activation images of the underlying cortex often leads to dramatically wrong conclusions [17]. Source localisation techniques are needed for this purpose. Given that single-channel measures often suffice for diagnostic purposes, what are the advantages of mapping?
Map topography characterises and discriminates neural source patterns without source localisation. This is not possible with a single channel, because many different topographies and source patterns can produce the same event in a single channel. Topographic EP mapping thus becomes crucial if the underlying neural events are complex, unknown or simply must be distinguished as is typical for cognitive EPs. Map analyses [18,19] quantify map topography, map strength and map timing. These descriptors permit comparing cognitive processes by their neurophysiological signatures. Mapping also reveals time segments of high topographic stability in the EP. Adaptive temporal segmentation can determine the number and duration of such microstates which reflect the sequence of split-second neural activation patterns during human information processing [20,21,22]. This provides a comprehensive definition of EP components which does not require preselecting a single channel. Mapping is also a prerequisite for neuroanatomical source localization. Selected applications in the fields of language processing and attention are reviewed below.
Functional brain mapping with cognitive EPs
The above studies illustrate that EP mapping in specific cognitive activation tasks tracks cognitive processes as microstates of the brain. The results also demonstrate the need for quantitative map analysis to detect subdivisions and variants of conventional components, to reveal subtle topographic effects, and to distinguish between effects on global amplitudes, on topography or on latency.
The language studies consistently reveal that high-level, language-specific effects are found earlier than previously suggested. Even earlier EP effects have been reported for face recognition [44]. This suggests that the conventional distinction between early, exogeneous and later, endogenous (cognitive) component must be revised, at least if highly overlearned cognitive processes are studied. On the other hand, these discoveries of “early cognition” converge with findings of plasticity of brain functions which previously were assumed to be basic and to become “hard wired” at an early age [45,46,47,48].
The studies of attention and inhibition distinguished a number of P300 components and P300 effects with distinct and specific attentional functions. The clinical applications contribute to a differentiated picture of neurophysiological deviance patterns underlying psychiatric disorders; of particular clinical importance appears the emergence of biological markers with predictive value and therapeutic relevance.
Even though these results demonstrate that a neurophysiology of cognitive processes can proceed without source localisation, neuroanatomical source localization permits relating such EP results more directly to results from neurological, neuropsychological and metabolic neuroimaging studies. No simple match can be expected because the methods have different weaknesses and strengths. However, robust phenomena and clear hypotheses can serve as consistency tests across different imaging modalities as illustrated below.
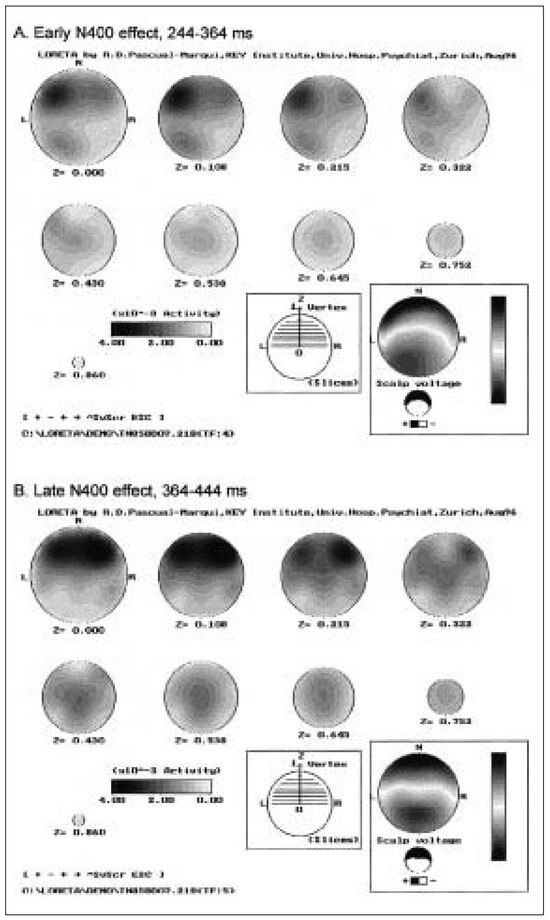
One troubling observation is that languagerelated EP work has not yielded the expected robust evidence for left-lateralisation in right handers. The N400 components and effects have even been described as right-lateralized posterior components, which has given rise to speculations about the role of right hemisphere involvement in semantic processes during reading [49]. However, these interpretations were based on amplitude comparison between waveshapes recorded from selected homologous channels. Mapping gradient strength, a more appropriate approach for localisation, instead revealed characteristic leftlateralisation for the N1 and the early N400. For the N400 effects, the gradients were strongest at anterior sites and left-lateralized in the early N400 microstate [29]. LORETA solutions for this data are consistent with the gradient based conclusions; they are shown in Figure 1. These results suggest that the lack of consistent lateralisation in EP of language may partly be due to the exclusive focus on the posterior negativity of the late N400, and on inadequate conclusions about source lateralisation based naively on the scalp distribution of voltage or current density extrema.
Figure 1.
Low-resolution electromagnetic tomography (LORETA) for the early (A) and the late (B) N400 effect (i. e. the difference map between incongruent and congruent endings). Anterior sources dominate during both segments of these posterior negative N400 effects. Left-lateralized anterior and posterior sources are only found in the early N400 segment. Grand mean over 17 subjects; 20 channel ERP data from [28].
The robust topographic anteriorisation of the no-go P300 during inhibitory processing [39] has been described above. That the expected frontal lobe activation indeed underlies this no-go anteriorisation was demonstrated with statistical analyses of LORETA solutions for the go and nogo P300 [50]. These tomographic 3-D solutions revealed that while there were posterior as well as frontal sources during both the go- and the no- go P300, statistics (with appropriate corrections) revealed a highly significant and focal increase of frontal activity in the no-go condition. No other difference between go and no-go P300, or between the go- and the no-go P100 in a control analysis achieved significance.
The finding that ADD children mainly show a reduced cue-P300 during the orienting phase of target processing [40] is difficult to reconcile with the hypothesis that frontal lobe deficits underly the problems of these children. Tomographic source solutions were therefore computed for the cue-P300 of the ADD and the control group computed for the P300 microstate following the Acues. The tomographies indicated strong posterior sources which differed between the groups, but only minimal frontal activity which did not differ between the groups [40]. This suggests that posterior rather than frontal attention systems of the brain are responsible for these group differences.
The tomographic solutions corresponding to the ERP map differences between ADD and control children in the Stop-test [43] further support this conclusion. The tomographies for the microstate preceding the stop signal showed posterior, right temporal and right frontal sources. The main difference was increased frontal activation in the ADD group, which is incompatible with the concept of frontal underactivation. To ensure that the tomographic solutions were sensitive to frontal sources, we also computed tomographies for the P300 microstate with central positivity in the successful stop condition, which is related to successful inhibition and resembles the no-go P300 in adults [39]. The tomographic source solution revealed the expected focal frontal activation but indicated no group differences in strength or distribution, which is consistent with the lack of group differences in the map analysis. These findings are not compatible with the mainstream theory that a core deficit in frontal response control underlies the attention problem of these children. They are, however, compatible with current models which associate a posterior attention system under noradrenergic control with phasic orienting, and with recent findings of a noradrenergic action component of stimulants [42,51].
Taken together, the review demonstrates that EP mapping provides the cognitive and temporal resolution which is necessary to track information processing in the human brain. Functional brain mapping with EPs also permits low resolution imaging of these processes in conventional, neuroanatomical coordinates. It has the potential to integrate current structural (neurological) and dynamic (information processing) models of brain function and dysfunction.
References
- Berger H. Über das Elektroenkephalogramm des Menschen. Arch Psychiatr Nervenkr 1929;87:527–70.
- Dawson GD. Cerebral responses to electrical stimulation of peripheral nerve in man. J Neurol Neurosurg Psychiat 1947;10:134.
- Cobb WA, Dawson GD. The latency and form of the occipital potentials evoked by bright flashes. J Physiol 1960;152:108–21.
- Jewett DL, Romano MN, Williston JS. Human auditory evoked potentials: possible brain stem components detected on the scalp. Science 1970;167:1517–8.
- Donchin E, Coles MGH. Is the P300 component a manifestation of context updating? Behav Brain Sci 1988;11:357–74.
- Kornhuber HH, Deecke L. Hirnpotentialänderungen bei Willkürbewegungen und passiven Bewegungen des Menschen: Bereitschaftspotential und reafferente Potentiale. Pflügers Arch Ges Physiol 1965;284:1–17.
- Sutton S, Braren M, Zubin J, John ER. Evoked potential correlates of stimulus uncertainty. Science 1965;150:1187–8.
- Walter WG, Cooper R, Aldridge VG, McCallum WC, Winter AL. Contingent negative variation: an electric sign of sensorimotor association and expectancy in the human brain. Nature 1964;203:380–4.
- Kutas M, Hillyard SA. Reading senseless sentences: brain potentials reflect semantic incongruity. Science 1980;207:203–5.
- Adrian ED, Yamagiwa K. The origin of the Berger rhythm. Brain 1935;58:322–51.
- Kondakor I, Brandeis D, Wackermann J, Kochi K, Koenig T, Frei E, et al. Multichannel EEG fields during and without visual input: frequency domain model source locations and dimensional complexity. Neurosci Lett 1997;226:49–52.
- Lehmann D, Kavanagh RH, Fender DH. Field studies of averaged visually evoked EEG potentials in a patient with a split chiasm. Electroenceph Clin Neurophysiol 1969;26:193–9.
- Kavanagh RN, Darcey TM, Lehmann D, Fender DH. Evaluation of methods for three-dimensional localization of electric sources in the human brain. IEEE Trans Biomed Eng 1978;25:421–9.
- Cohen D, Cuffin BN, Yunokuchi K, Maniewski R, Purcell C, Cosgrove CR, et al. MEG versus EEG localization test using implanted sources in the human brain. Ann Neurol 1990;28:811–7.
- Scherg M, von Cramon D. Two bilateral sources of the late AEP as identified by a spatio-temporal dipole model. Electroenceph Clin Neurophysiol 1985;62:32–44.
- Pascual-Marqui RD, Michel CM, Lehmann D. Low-resolution electromagnetic tomography: a new method for localizing electrical activity in the brain. Int J Psychophysiol 1994;18:49–65.
- Barrett G, Blumhardt L, Halliday AM, Kriss A. A paradox in the lateralisation of the visual evoked response. Nature 1976;261:253–5.
- Lehmann D, Skrandies W. Reference-free identification of components of checkerboard-evoked multichannel potential fields. Electroenceph Clin Neurophysiol 1980;48:609–21.
- Brandeis D, Lehmann D. Event-related potentials of the brain and cognitive processes: Approaches and applications. Neuropsychologia 1986;24:151–68.
- Brandeis D, Lehmann D. Segments of ERP map series reveal landscape changes with visual attention and subjective contours. Electroenceph Clin Neurophysiol 1989;73:507–19.
- Pascual-Marqui RD, Michel CM, Lehmann D. Segmentation of brain electrical activity into microstates: model estimation and validation. IEEE Trans Biomed Eng 1995;42:658–65.
- Brandeis D, Callaway E. While on the subject of closure. Behav Brain Sci 1988;11:377.
- Brown WS, Lehmann D. Verb and noun meaning of homophone words activate different cortical generators: A topographical study of evoked potential fields. Exp Brain Res 1979;2:159–68.
- Koenig T, Lehmann D. Microstates in language-related brain potential maps show noun-verb differences. Brain Lang 1996;53:169–82.
- Skrandies W. Evoked potential correlates of semantic meaning – A brain mapping study. Brain Res Cogn Brain Res 1998;6:173–83.
- Curran T, Tucker DM, Kutas M, Posner MI. Topography of the N400: brain electric activity reflecting semantic expectancy. Electroenceph Clin Neurophysiol 1993;88:188–209.
- Karniski W, Vanderploeg R, Lease L. Virtual N400 and Slow Wave topography to auditory sentence incongruity. Brain Lang 1993;44:58–79.
- Brandeis D, Lehmann D. ERP mapping: a tool for assessing language disorders? In: Heinze HJ, Münte TF, Mangun GR (editors). Cognitive Electrophysiology. Boston: Birkhäuser; 1994.
- Brandeis D, Lehmann D, Michel CM, Mingrone W. Mapping event-related potential microstates to sentence endings. Brain Topogr 1995;8:145–59.
- Nobre AC, McCarthy G. Language-related ERPs: scalp distributions and modulations by word type and semantic priming. J Cogn Neurosci 1994;6:233–55.
- Gevins A, Cutillo B, Smith ME. Regional modulation of high resolution evoked potentials during verbal and nonverbal matching tasks. Electroenceph Clin Neurophysiol 1995;94:129–47.
- Brandeis D, Vitacco D, Steinhausen HC. Mapping brainelectric microstates in dyslexic children during reading. Acta Paedopsychiatr 1994;56:239–47.
- Treisman AM, Gelade G. A feature-integrating theory of attention. Cogn Psychol 1980;12:97–136.
- Von der Heydt R, Peterhans E, Baumgartner G. Illusory contours and cortical neuron responses. Science 1984;224:1260–2.
- Strik WK, Dierks T, Franzek E, Stöber G, Maurer K. P300 in schizophrenia: interactions between amplitudes and topography. Biol Psychiat 1994;35:850–6.
- Heidrich A, Strik WK. Auditory P300 topography and neuropsychological test performance: evidence for left hemispheric dysfunction in schizophrenia. Biol Psychiat 1997;41:327–35.
- Strik WK, Fallgatter AJ, Stoeber G, Franzek E, Beckmann H. Specific P300 features in patients with cycloid psychosis. Acta Psychiat Scand 1996;94:471–6.
- Strik WK, Ruchsow M, Abele S, Fallgatter AJ, Mueller TJ. Distinct neurophysiological mechanisms for manic and cycloid psychoses: evidence from a P300 study on manic patients. Acta Psychiat Scand 1998. In press.
- Fallgatter AJ, Brandeis D, Strik WK. A robust assessment of the no-go-anteriorization of P300 microstates in a cued continuous performance test. Brain Topogr 1997;9:295–302.
- Van Leeuwen TH, Brandeis D, Overtoom KE, Pascual-Marqui RD, van’t Klooster B, Rothenberger A, et al. The continuous performance test revisited with neuroelectric brain mapping: impaired orienting in children with attention deficits. Beh Brain Res 1998;94:97–110.
- Brandeis D. Psychophysiologie der hyperkinetischen Störungen. In: Steinhausen HC (editor). Hyperkinetische Störungen im Kindes- und Jugendalter. Stuttgart: Kohlhammer; 1995.
- Pliszka SR, McCracken JT, Maas JW. Catecholamines in attention-deficit hyperactivity disorder: current perspectives. J Am Acad Child Adol Psychiat 1996:35:264–72.
- Brandeis D, van Leeuwen TH, Rubia K, Vitacco D, Steger J, Pascual-Marqui RD, et al. Neuroelectric mapping reveals precursors of failures to stop in children with attention deficits. Beh Brain Res 1998;94:111–25.
- Seeck M, Michel CM, Mainwaring N, Cosgrove R, Blume H, Ives J, et al. Evidence for rapid face recognition from human scalp and intracranial electrodes. Neuroreport 1997;8:2749–54.
- Tallal P, Miller SL, Bedi G, Byma G, Wang X, Nagarajan SS, et al. Language comprehension in language-learning impaired children improved with acoustically modified speech. Science 1996;271:81–4.
- Karni A, Meyer G, Jezzard P, Adams MM, Turner R, Ungerleider LG. Functional MRI evidence for adult motor cortex plasticity during motor skill learning. Nature 1995;377:155–8.
- Seitz RJ, Huang Y, Knorr U, Tellmann L, Herzog H, Freund HJ. Large-scale plasticity of the human motor cortex. Neuroreport 1995;6:742–4.
- Kraus N, McGee T, Carrell TD, King C, Tremplay K, Nicol T. Central auditory system plasticity associated with speech discrimination training. J Cogn Neurosci 1995;7:25–32.
- Kutas M, Hillyard SA. The lateral distribution of eventrelated potentials during sentence processing. Neuropsychologia 1982;20:579–90.
- Strik WK, Fallgatter AJ, Brandeis D, Pascual-Marqui RD. Three dimensional ERP tomography of inhibitory response control: evidence for phasic frontal lobe activation causing no-go-anteriorisation of the P300. Electroenceph Clin Neurophysiol 1998;108:406–13.
- Halliday R, Naylor H, Brandeis D, Callaway E, Yano L, Herzig K. The effect of D-amphetamine, clonidine and yohimbine on human information processing. Psychophysiology 1994;31:331–7.
This is an open-access article distributed under the terms of the Creative Commons Attribution Non-Commercial No Derivatives (CC BY-NC-ND) 4.0 License.