


Abstract
Against the backdrop of a low-carbon economy, the control of soot emissions from combustion processes is of paramount importance. In this study, the effects of CO2 dilution on soot formation in ethylene laminar diffusion flames are investigated through a combination of experimental measurements and numerical simulations. In addition, a virtual species, denoted as FxCO2, is introduced to progressively decouple the individual mechanisms by which different effects suppress soot formation. The results indicate that increasing the CO2/N2 dilution ratio leads to reductions in both the peak flame temperature and the soot volume fraction, with CO2 exhibiting a more pronounced inhibitory effect than N2. The decoupling analysis reveals that the dilution effect and the chemical effect are the dominant contributors to flame temperature reduction. The soot-inhibiting effectiveness of the individual effects follows the order: dilution effect > thermal effect > chemical effect > density effect > transport effect. With respect to their influence on C2H2 concentration, the effects are ranked as: dilution effect > chemical effect > transport effect > thermal effect > density effect. The chemical effect suppresses the formation of OH radicals, thereby reducing the flame temperature and H radical concentration. In contrast, the dilution effect enhances soot oxidation by increasing the OH radical concentration, effectively inhibiting soot particle formation.
1. Introduction
With the advancement of combustion technologies and the global consensus on carbon emission reduction, the establishment of efficient and low-emission combustion systems based on clean fuels is of critical importance for achieving carbon neutrality. Current studies indicate that the introduction of additives into combustion processes is an effective and feasible approach, among which carbon dioxide (CO2) and nitrogen (N2) are two major components of exhaust gases [1]. By introducing CO2 or N2 as additives on either the oxidizer side or the fuel side, the soot formation mechanisms and influencing factors of hydrocarbon fuels under oxygen-enriched combustion conditions can be systematically investigated, and combustion pathways can be regulated accordingly, which is considered an effective strategy for reducing pollutant formation [2,3,4]. The application of diluted combustion technology further optimizes the fuel combustion process in combustion devices, effectively reducing pollutant emissions while enhancing the combustion rate and thermal efficiency, thereby ensuring the simultaneous achievement of high combustion efficiency and environmental protection objectives.
At present, both domestic and international researchers have conducted extensive studies on diluted combustion based on established soot formation mechanisms. Sirignano et al. [5] investigated the effects of CO2 substitution in the oxidizer on counterflow ethylene diffusion flames using optical diagnostic techniques. Their results showed that soot formation gradually decreased with increasing CO2 concentration. The thermal effect of CO2 reduced the adiabatic flame temperature (T), thereby leading to a decrease in the total emissions of carbon-rich nanoparticles. Hoerlle C. A. et al. [6] performed numerical simulations to compare the mechanisms and suppression effects of introducing CO2 into the fuel side and oxidizer side, respectively, on soot formation in oxygen-enriched counterflow nonpremixed ethylene flames. The results indicated that, at identical CO2 concentrations, the overall flame structures were similar regardless of whether CO2 was introduced on the fuel side or the oxidizer side. However, comparative analysis revealed that introducing CO2 on the fuel side was more effective in suppressing soot formation than introducing it on the oxidizer side. Guo H. et al. [7] numerically studied the effects of CO2 addition on soot formation in ethylene/air diffusion flames and found that the dilution, thermal, and chemical effects of CO2 all contributed to soot suppression. The chemical effect was mainly attributed to the reaction CO + OH → CO2 + H, which reduced the concentration of H radicals and consequently inhibited soot nucleation and surface growth rates. Wang D. et al. [8] investigated the effects of pressure and CO2 dilution on soot formation in coflow ethylene/air laminar diffusion flames using numerical simulations. Their results showed that elevated pressure altered the flame structure and significantly increased soot formation. The addition of CO2 reduced the inception, HACA, and PAH coagulation rates of polycyclic aromatic hydrocarbons (PAHs), thereby suppressing soot formation. Al-Qurashi et al. [9] combined experimental measurements and numerical simulations to decouple and analyze the thermal, dilution, and chemical effects of exhaust gas recirculation (EGR) on soot reactivity in engines and flames. The results demonstrated that the simulated EGR conditions produced effects on soot reactivity consistent with those observed under actual EGR operation. The relative influence of each effect on soot reactivity followed the order: thermal effect > dilution effect > chemical effect. Dally et al. [10] introduced CO2 into nonpremixed methane/air flame systems using a combination of experimental and numerical approaches and found that CO2 reduced the flame temperature by decreasing the reactant concentration levels in the reaction zone. Guo J. et al. [11] investigated the effects of pressure and CO2 dilution on soot formation in laminar counterflow flames under near-autothermal reforming (ATR, natural gas hydrogen production) conditions through both experimental and numerical methods. The results showed that, at the experimental pressures considered, CO2 exhibited a stronger soot suppression effect than N2. The chemical effect of CO2 primarily removed H radicals through the reaction CO2 + H → CO + OH, and its contribution to soot suppression was approximately twice that of the thermal effect. Wang Y. et al. [12] studied the effects of CO2 dilution on soot formation in counterflow ethylene diffusion flames using experimental and numerical approaches. Their results indicated that the addition of CO2 inhibited soot formation; however, this inhibition was attributed mainly to the chemical effect rather than the thermal effect.
A survey of the existing literature indicates that previous studies have primarily focused on the macroscopic suppression effects of CO2 and N2 dilution on soot formation, the relative contributions of thermal and chemical effects, and their behaviors under different combustion configurations, such as counterflow and coflow diffusion flames. To some extent, these studies have decoupled and analyzed the influences of thermal, dilution, and chemical effects on soot reactivity. However, the analysis of flame images remains relatively limited in current studies. Most existing research mainly focuses on the macroscopic soot emission characteristics and temperature field distributions, while the microscopic mechanisms associated with dilution gas addition—such as detailed reaction pathways, soot nucleation, surface growth, oxidation rates under varying dilution ratios, and the dynamic competition between the formation and consumption of soot precursors under multi-effect coupling—have not been sufficiently investigated.
In this study, the effects of CO2 dilution on soot formation in an ethylene laminar diffusion flame are systematically investigated through a combined experimental and numerical approach. In the experiment, the two-color pyrometry method was employed to acquire and process flame spectral images in the visible wavelength range, from which the temperature field and soot volume fraction were obtained. To validate the experimental results, a numerical model was established using the FLUENT 14.5 software, and the effects of different CO2/N2 dilution ratios on soot formation characteristics in the ethylene laminar diffusion flame were systematically analyzed. In addition, detailed comparative analyses of flame images, major soot formation regions, flame temperature, and flame height were carried out based on the experimental data, and the primary mechanisms responsible for soot reduction were further discussed.
2. Numerical Model and Methodology
2.1. Numerical Computational Details
This research employed numerical simulations utilizing FLUENT, it has been widely applied in aerospace, automotive engineering, energy and power systems, and chemical research. It is capable of simulating a variety of chemical reaction processes, including combustion and catalytic reactions. In the field of combustion, the software can model fuel–oxidizer mixing, energy release during combustion, and pollutant formation, providing valuable insights for understanding reaction mechanisms, enhancing fuel combustion efficiency, and reducing pollutant emissions.
In the numerical simulations, a laminar finite-rate model was adopted to describe the combustion process. A reduced GRI reaction mechanism was employed, consisting of 40 species and 175 elementary reactions [13]. This mechanism is capable of accurately capturing the formation of gas-phase small-molecule radicals in flames, such as OH, C2H2, H2CCCH, and CH3. The Discrete Ordinates (DO) model was applied to solve radiative heat transfer. Radiative properties of the combustion gases and soot were evaluated using the gray gas weighted sum model (WSGG) proposed by Smith. Soot dynamics were simulated through the Moss–Brookes model, which includes the oxidation mechanisms involving OH and O2 [14].
The DO model performs angular discretization processing. It divides the entire 4π solid angle into several finite solid angles (directions), and each direction () corresponds to a weighting point. In this way, the original equation is transformed into a set of transport equations for radiation intensity (), with one equation being solved for each discrete direction:
where is the divergence form of in Cartesian coordinates, treating the radiation transfer as a field equation. is the size of the weight corresponding to the discrete direction j. N is the total number of discrete directions.
Prior to ignition, a cold-flow simulation was first performed, and ignition was subsequently initiated after the flow field reached a steady state to carry out the reactive simulations. Soot formation was predicted using the Moss–Brookes model, which accounts for soot nucleation, surface growth, and oxidation processes [15]. The soot nucleation process refers to the formation of the smallest solid soot particles through collisions and coagulation of soot precursor molecules, marking the transition of soot from gas-phase species to initial solid particles [16,17]. Soot surface growth is a key stage in the soot formation process, during which most of the soot mass is generated. More than 95% of the soot mass originates from surface growth. Soot oxidation refers to the chemical reactions between soot particles and gas-phase species (such as OH radicals), which lead to a continuous reduction in particle size and number concentration. The oxidation process was described using the Fenimore–Jones model. The Moss–Brookes model is a multi-factor coupled framework that comprehensively considers key parameters such as fuel properties, temperature fields, and oxygen concentration fields.
where is the mass fraction of soot; M is the mass concentration of soot, kg/m3; is the concentration of normalized radical nuclei (number of particles × 10−15/kg); N is the density of soot particles (number of particles/m3); Nnorm = 1015.
The production rate of soot particles is given by the following formula, which is mainly related to gas phase nucleation and condensation in the state of free molecules:
where , l are the model constant; is the Avogadro number; dp is the average diameter of soot particles.
The soot mass concentration is modeled by the following formula, which includes three steps: nucleation, surface growth, and oxidation:
where Mp = 144 kg·kmol−1 is the mass of the primary soot particles; Xsgs is the molar fraction of the material involved in the growth of the surface; Ta = 21,000 K (the temperature at which the soot begins to form); Cγ = 11,700 kg·m·kmol−1·s−1 (surface growth rate scale factor); = 12,100 K (surface growth rate, activation temperature); = 0.04 (crash efficiency parameter).
2.2. Computational Grid and Operating Conditions
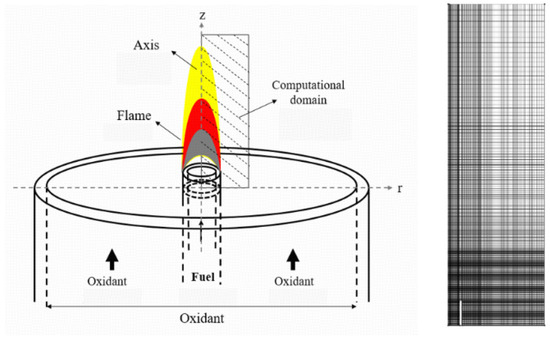
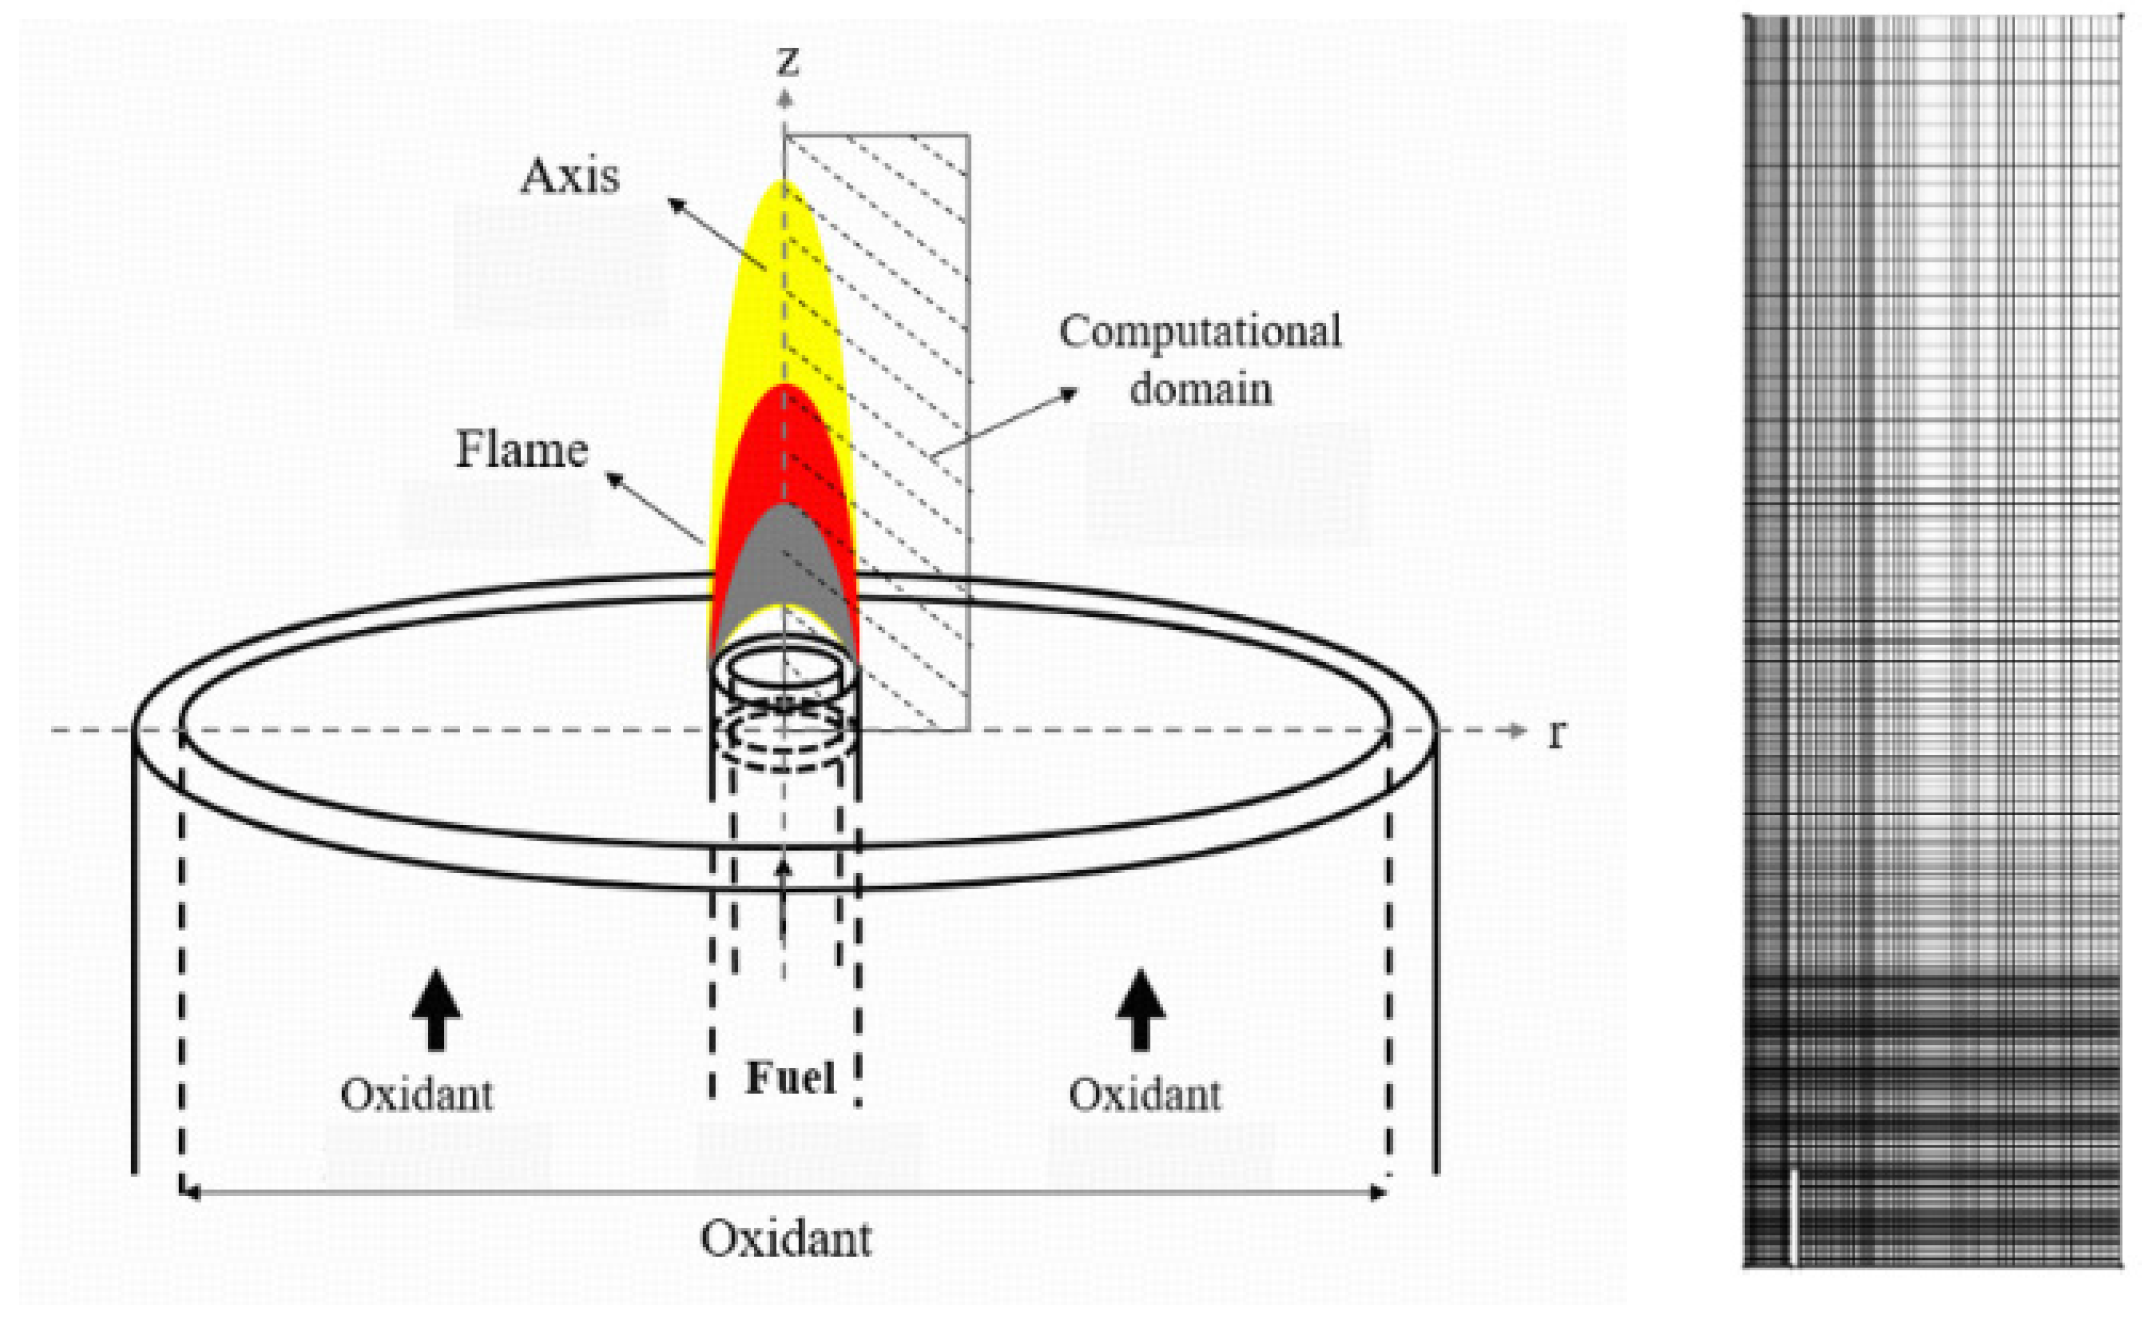
The numerical model employed in this study was developed based on the experimental configuration and adopted a Gülder-type burner. As shown in Figure 1, the computational domain was a two-dimensional axisymmetric geometry, with axial (z) and radial (r) dimensions of 118 mm and 45 mm, respectively. A non-uniform mesh was generated over the entire domain, consisting of 194 (z) × 88 (r) control volumes. Grid refinement was applied in key reaction regions, including the burner exit and the central axis.
Figure 1.
Schematic diagram of computational domain meshing.
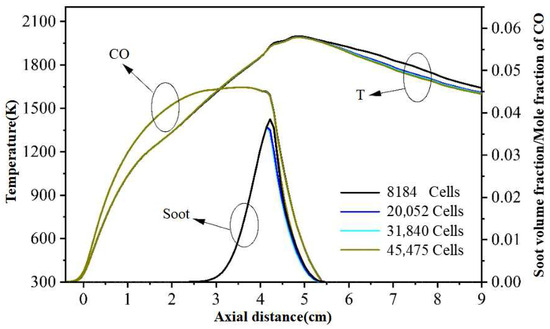
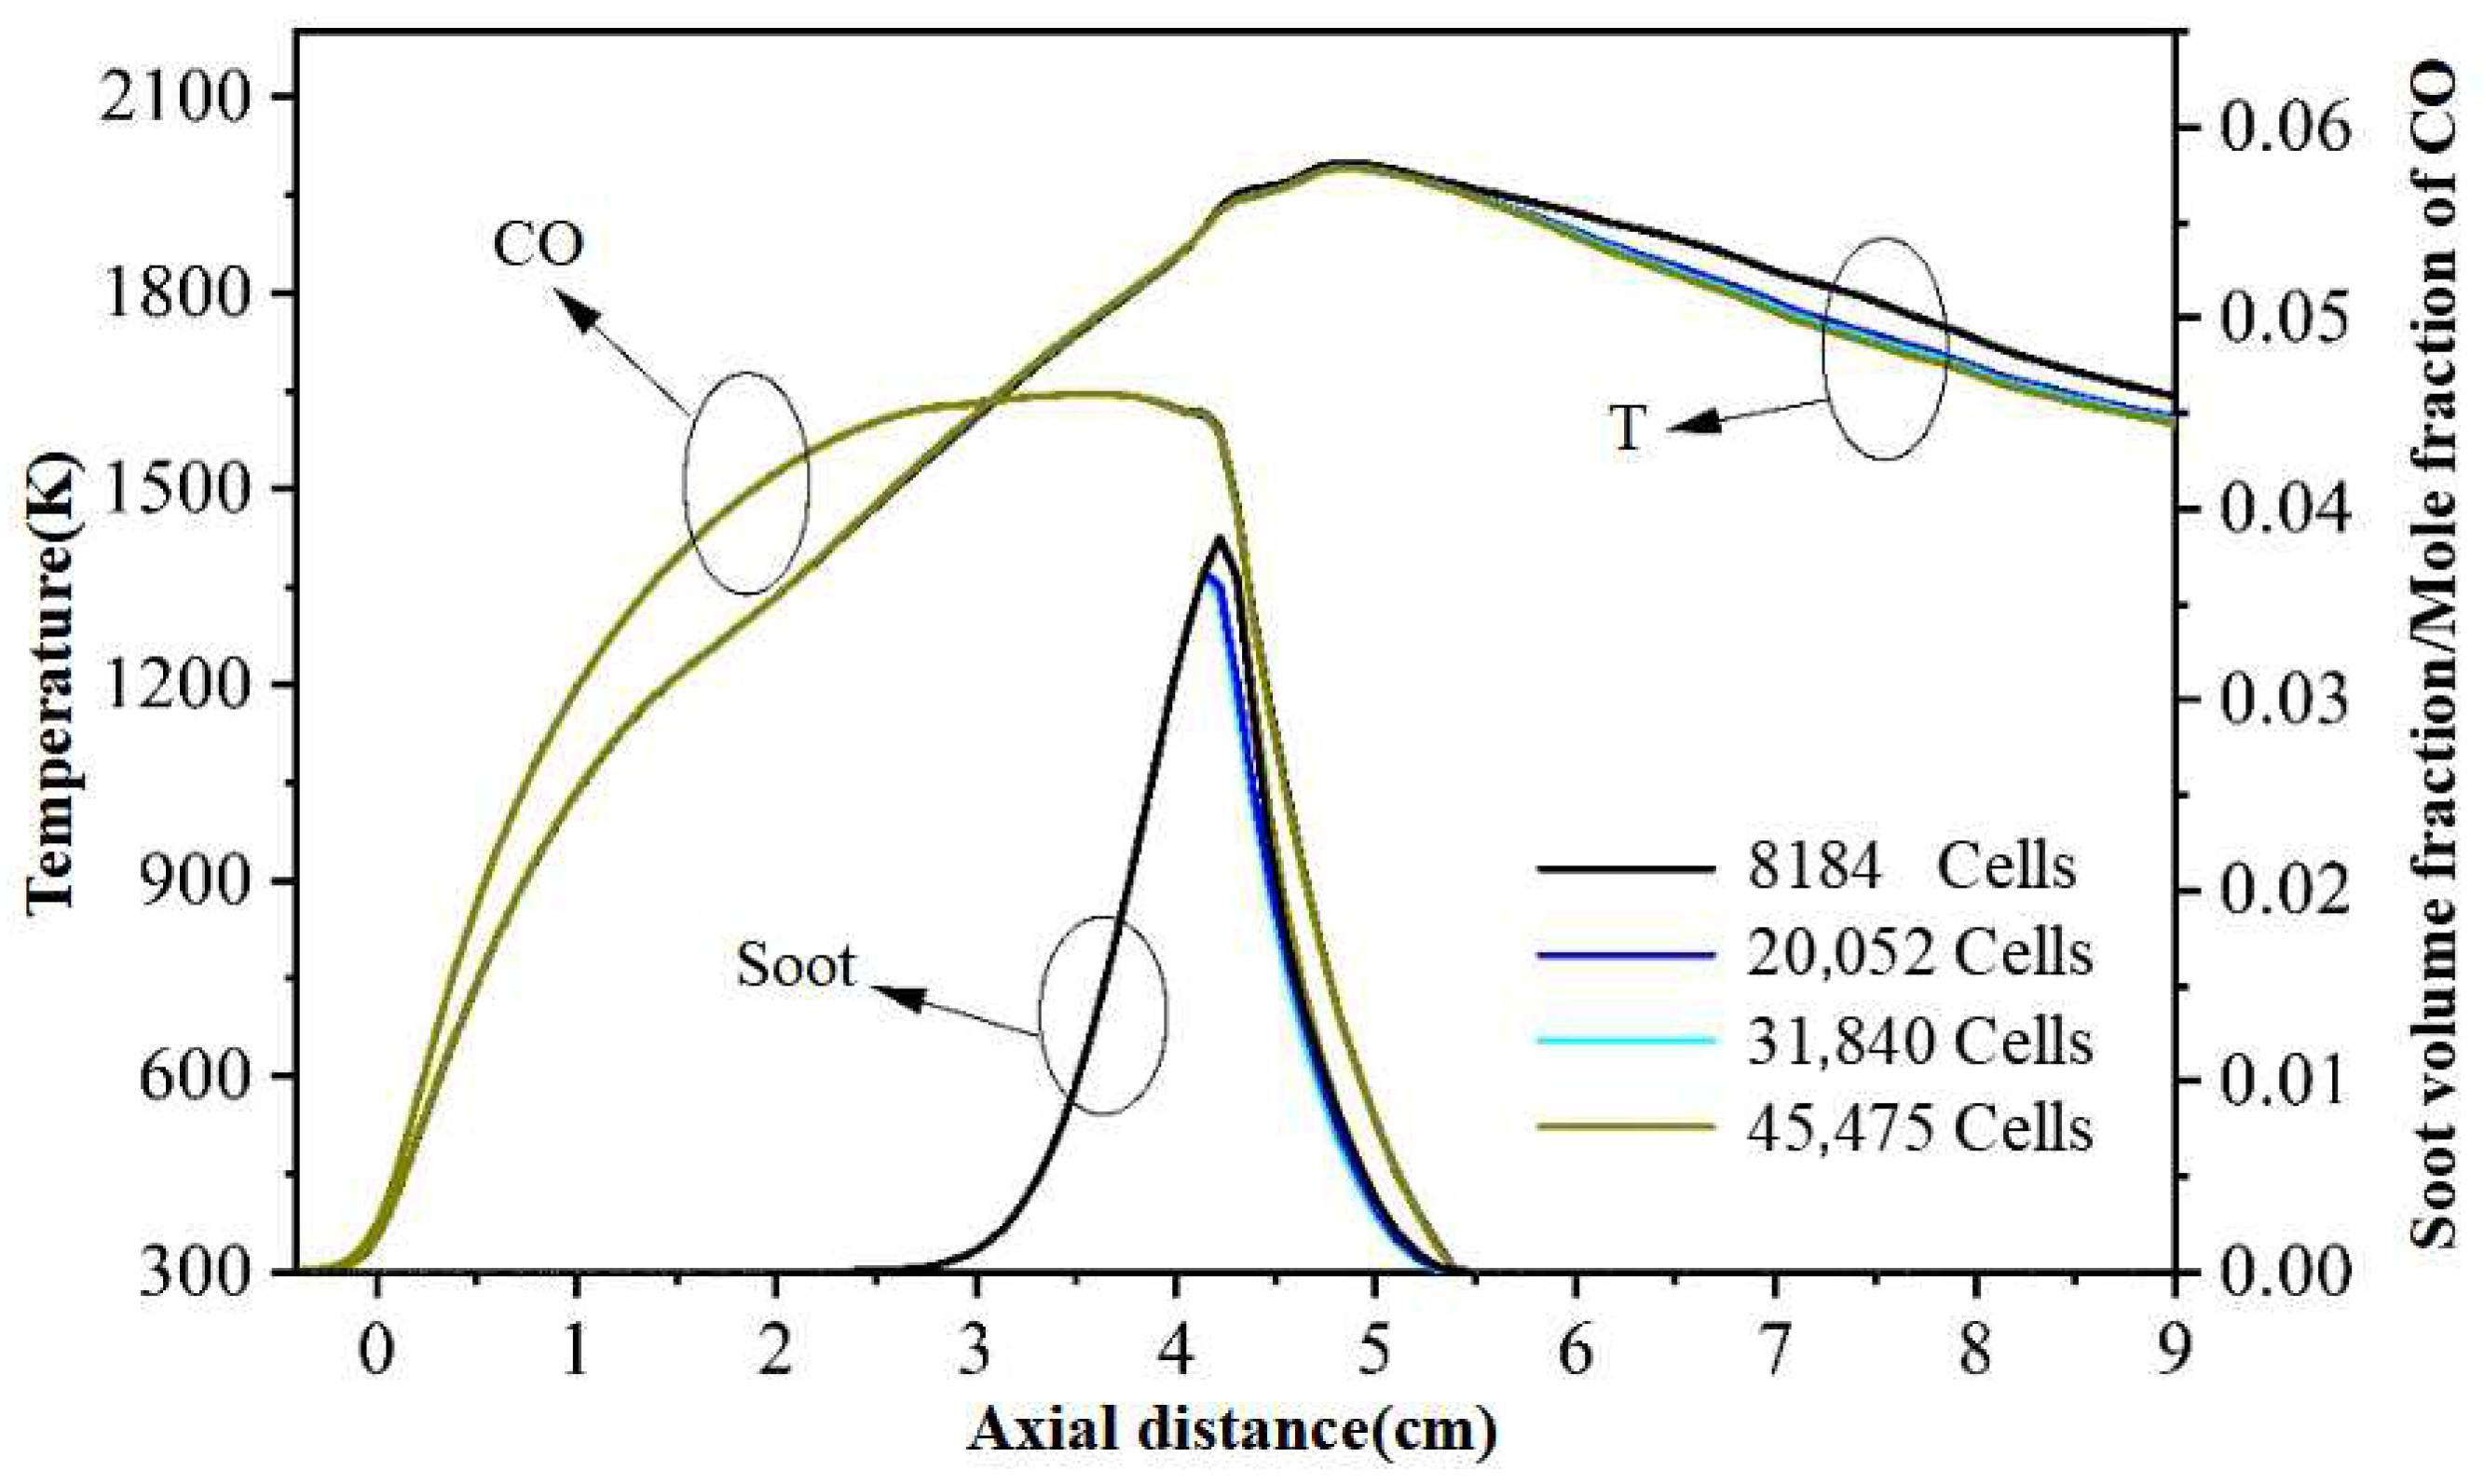
To ensure computational accuracy, four different grid resolutions were established, and a grid independence test was performed. The grid resolutions used consisted of 8184, 20,052, 31,840, and 45,475 cells. Figure 2 shows the axial temperature, soot volume fraction, and CO molar fraction distributions within the computational domain for different grid resolutions. The results for grid resolutions of 20,052, 31,840, and 45,475 cells showed no significant differences. A mesh sensitivity analysis was performed to balance computational cost and accuracy. The selected mesh, comprising 20,052 cells, ensures that the numerical results are independent of further grid refinement.
Figure 2.
Mesh independence detection.
This study examines the diluting gases N2 and CO2. The dilution ratio (α) is defined as the proportion of the volume of dilution gas with the whole amount of the fuel-air combination, as follows:
In the above equation, represents the volume of the dilution gas (N2/CO2), m3; denotes the total volume of the fuel mixture, m3.
In the present numerical simulations, both the fuel inlet and the coflow gas inlet of the burner were specified as velocity inlets, with the ethylene flow rate on the fuel side maintained at 194 mL/min. Air (21% O2 and 79% N2) was used as the oxidizer, and the oxidizer-side inlet velocity was set to 0.107 m/s. The outlet boundary was defined as a pressure outlet. The nozzle wall temperature was set to 400 K to achieve preheating of the fuel and to reasonably represent the heat transfer from the flame to the nozzle, thereby avoiding overestimation of the heat transfer intensity in the flame root region caused by an excessively low wall temperature. This treatment improves the accuracy of the predicted temperature field and soot formation in the numerical simulation. The selected temperature value was determined based on multiple iterative calculations and error analysis [13]. the outer wall temperature was set to 300 K. N2/CO2 with different dilution ratios was introduced on the fuel side. Since excessive dilution gas addition can lead to flame instability, the maximum dilution ratio considered in this study was limited to 35%. According to the selected dilution ratios of different dilution gases, a total of nine operating conditions were established, as summarized in Table 1.
Table 1.
Setting conditions.
2.3. Numerical Decoupling Method
To distinguish the thermal, chemical, and dilution effects of CO2 on soot formation, a decoupling strategy based on virtual species was employed in the numerical simulations. In this method, several virtual species were defined by modifying their thermal properties, transport properties, and chemical participation in the reaction mechanism, so that different effects of CO2 could be isolated while keeping all other simulation conditions unchanged.
The transport properties of all species were calculated using the mixture-averaged transport model, including viscosity, thermal conductivity, and diffusion coefficients. For the virtual species, these transport properties were explicitly reassigned according to the target gas (CO2 or N2) to ensure that only the intended physical effect was retained in each decoupling case.
For the thermal effect, a virtual species was introduced with thermal and transport properties identical to CO2, including specific heat capacity, viscosity, thermal conductivity, and diffusion coefficients. However, this species was removed from the chemical reaction mechanism so that it did not participate in any chemical reactions. In this way, the heat capacity and transport characteristics of CO2 were preserved, while its chemical influence was eliminated, allowing the thermal effect to be evaluated independently.
For the dilution effect, the virtual species was assigned the thermal and transport properties of N2 and was also excluded from all chemical reactions. Under this condition, the species acted purely as an inert diluent, so that the change in flame structure resulted only from concentration dilution without additional thermal or chemical interactions.
For the chemical effect, CO2 was retained in the reaction mechanism to allow chemical reactions with radicals such as H, O, and OH, while its thermal and transport properties were replaced by those of N2. By doing so, the influence of the high heat capacity and transport characteristics of CO2 was removed, and only the chemical interaction effect of CO2 was preserved.
During the decoupling simulations, the inlet velocity, fuel composition, oxidizer flow rate, boundary conditions, grid resolution, and numerical schemes were kept identical for all cases. Therefore, the differences in flame temperature, species distribution, and soot formation could be attributed solely to the thermal, chemical, or dilution effect introduced by the virtual species definition. This procedure ensured that the three effects of CO2 were effectively isolated and could be analyzed separately.
3. Experimental Validation
3.1. Experimental Table
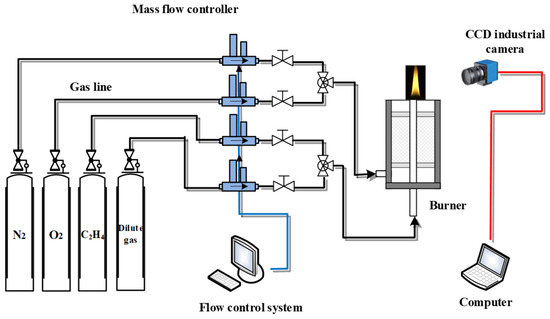
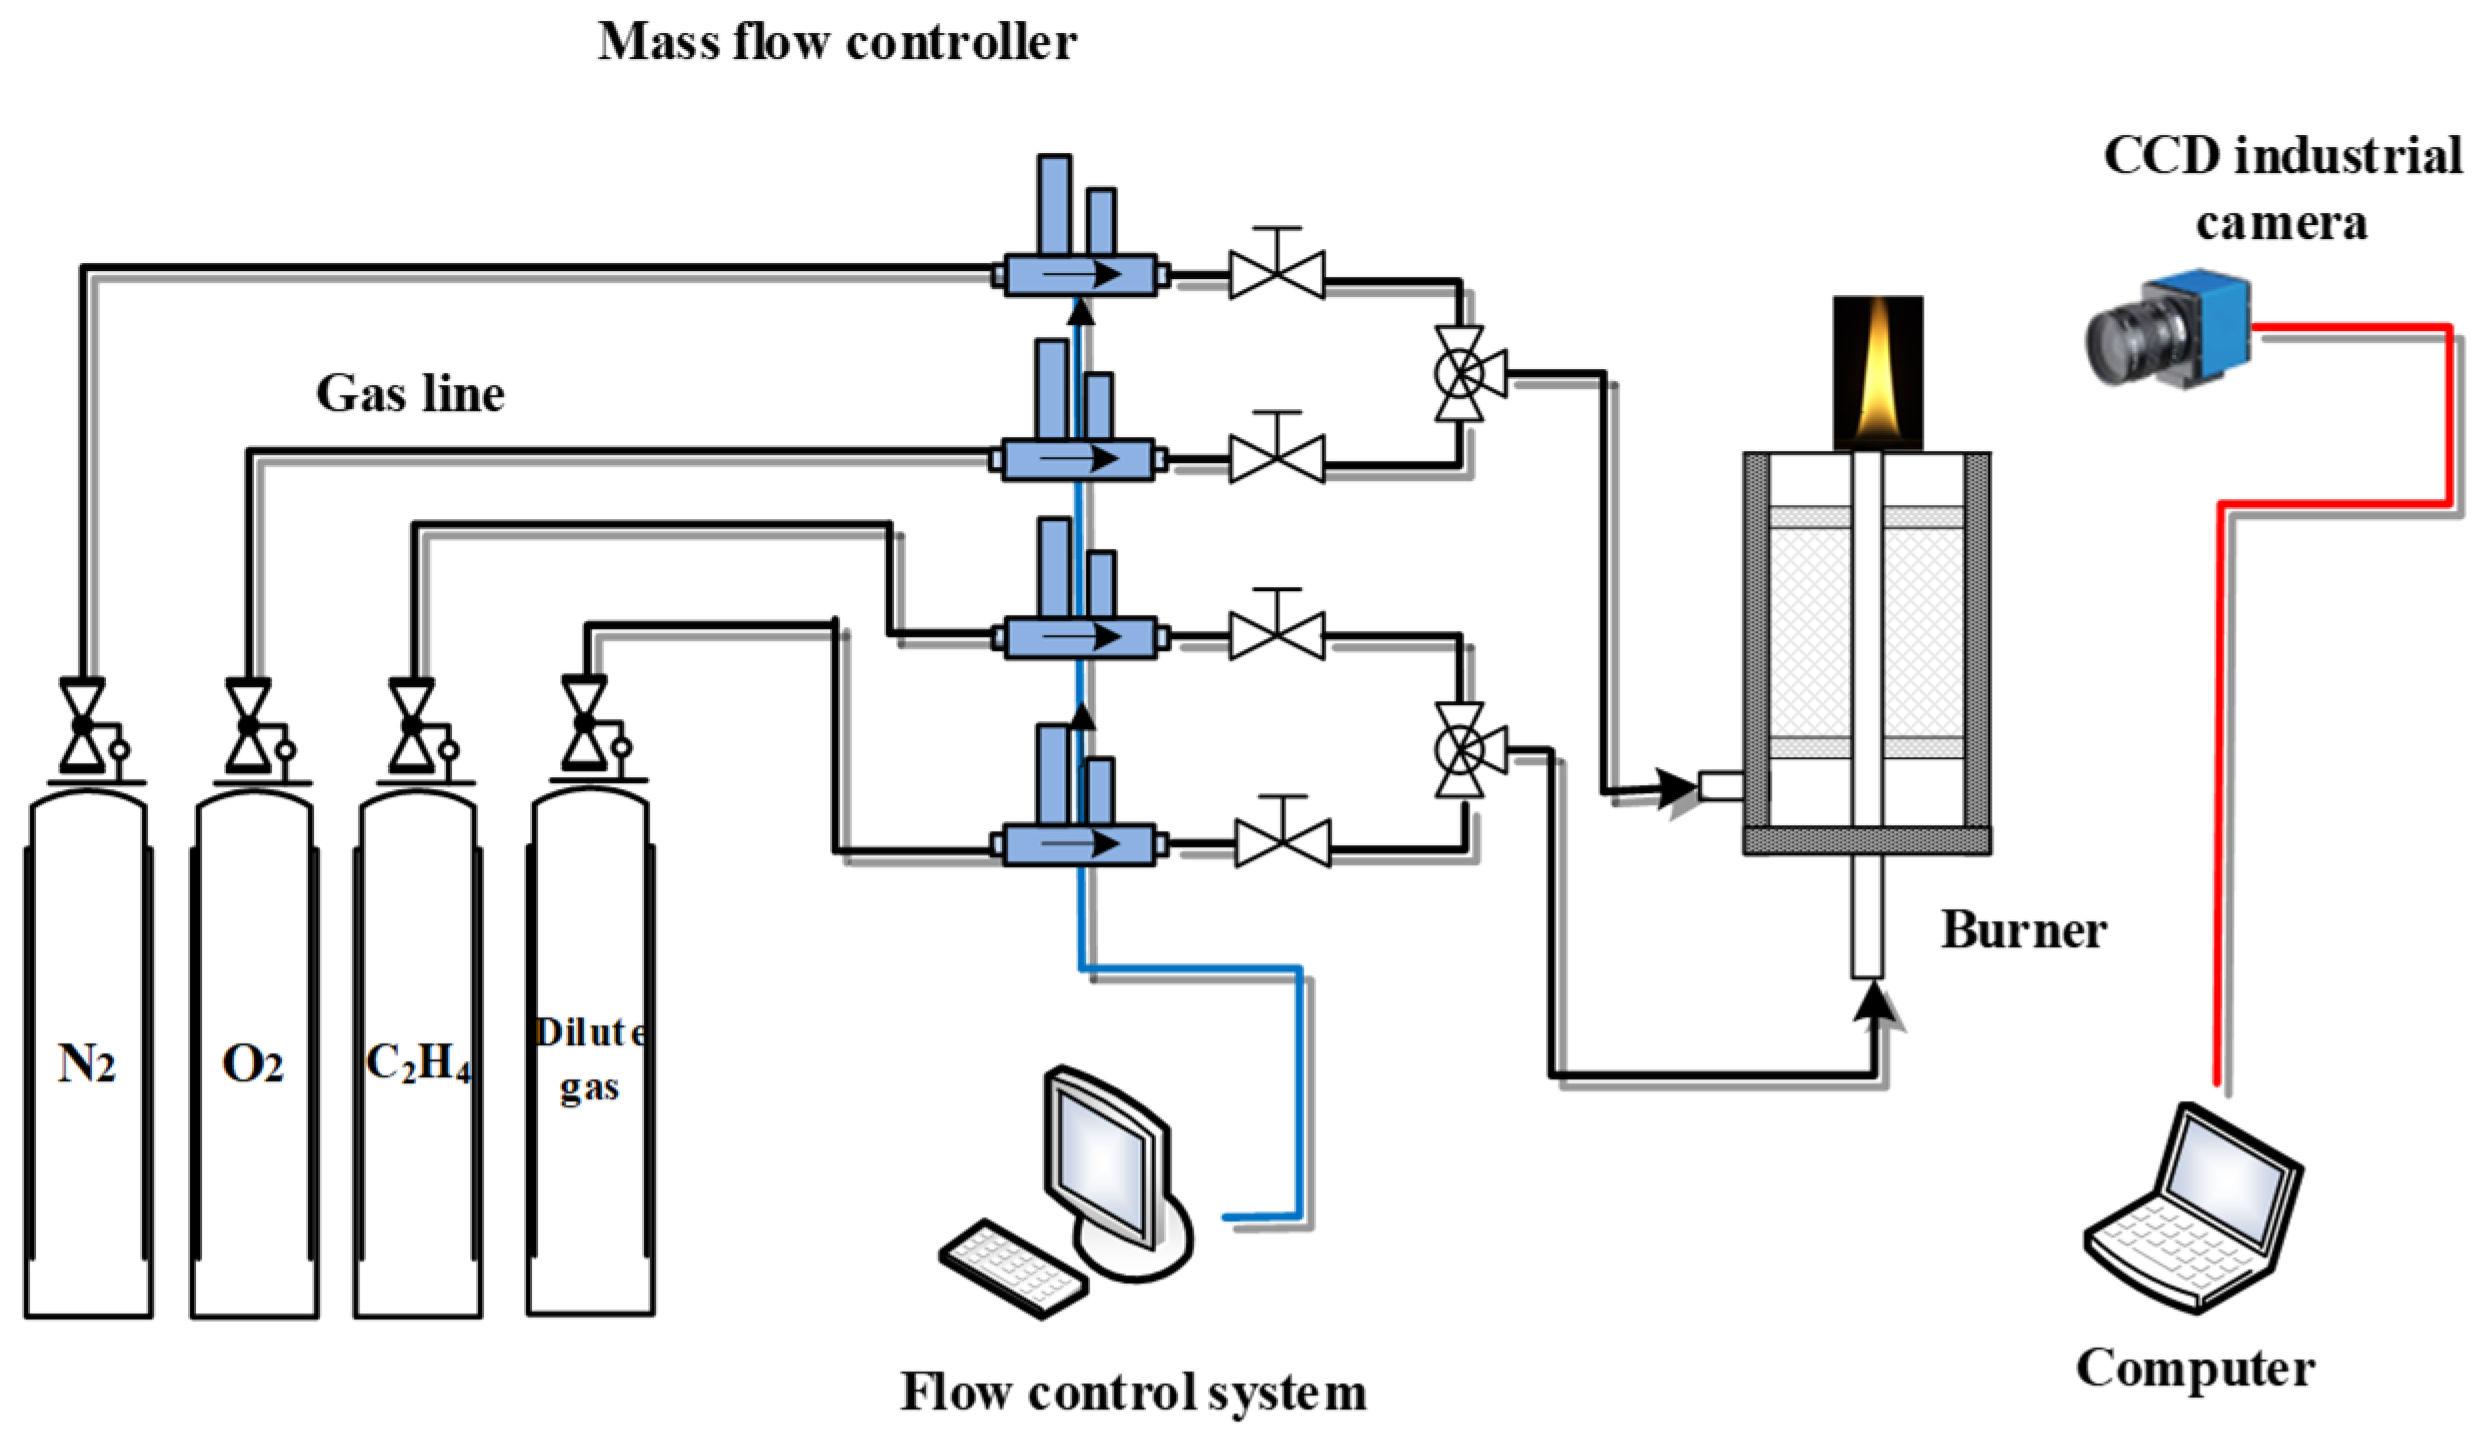
The experimental setup used in this study is shown in Figure 3 and mainly comprises a Gülder burner, an optical diagnostic system, and a flow control system. Experiments were conducted under standard conditions at an ambient pressure of 1 atm and a temperature of 293 K. The dimensions of the burner are as follows: the fuel tube has an inner diameter of 10.9 mm and a wall thickness of 0.95 mm, while the oxidizer tube has an inner diameter of 88 mm. Ethylene fuel and the oxidizer are supplied through the inner tube at the center and the annular outer passage of the burner, respectively. The annular region between the inner and outer tubes is filled with numerous glass beads and nickel foam to establish a stable laminar co-flow. A detailed description of the combustion system can be found in the literature [18].
Figure 3.
Experimental setup diagram.
In the experiment, a series of industrial cameras (Mercury model MER-200-14GC) were used, each featuring a 1/1.8″ CCD sensor with global exposure, a resolution of 1628 × 1236 pixels, and an adjustable exposure shutter time ranging from 20 to 1 × 10⁶ μs. The exposure time for each camera was carefully set to maintain pixel values within an effective range, ensuring reliable data acquisition. A fixed-focal-length lens (Computer 15c) was employed to capture visible thermal radiation images of the hydrocarbon diffusion flame. Image data were transmitted via Gigabit Ethernet. The gas mass flow controller used in the setup was the S48 300/HMT model, manufactured by Beijing HORIBA METRON Instruments Co., Ltd. (Beijing, China). This controller offers an accuracy of ±1.0% of the set point for flow rates at or above 30% of full scale, and ±0.30% of full scale for flow rates below 30% of full scale. Its calibration range covers 2% to 100% of the full scale.
A hyperspectral imager was employed to capture the laminar diffusion flame of ethylene, yielding high-resolution images embedded with multi-spectral data. Following acquisition, the spectral bands were analyzed and selected, and the corresponding radiation intensities were calibrated using a blackbody furnace. Through inversion, the two-dimensional distributions of flame temperature and soot volume fraction within the visible spectrum were derived. Additionally, contour maps illustrating the spatial distribution of these parameters, along with their peak values, were obtained.
3.2. Two-Color Method and Thermal Radiation Calibration
Utilizing the dual-color method—a non-contact optical diagnostic grounded in the gray-body assumption—this research captured the two-dimensional distributions of flame temperature and soot concentration. By synchronously measuring radiative intensities at two characteristic wavelengths and calibrating against a blackbody furnace, this technique effectively negates uncertainties in soot emissivity. The resulting data provides robust experimental evidence for elucidating soot formation mechanisms, validating combustion models, and refining burner designs.
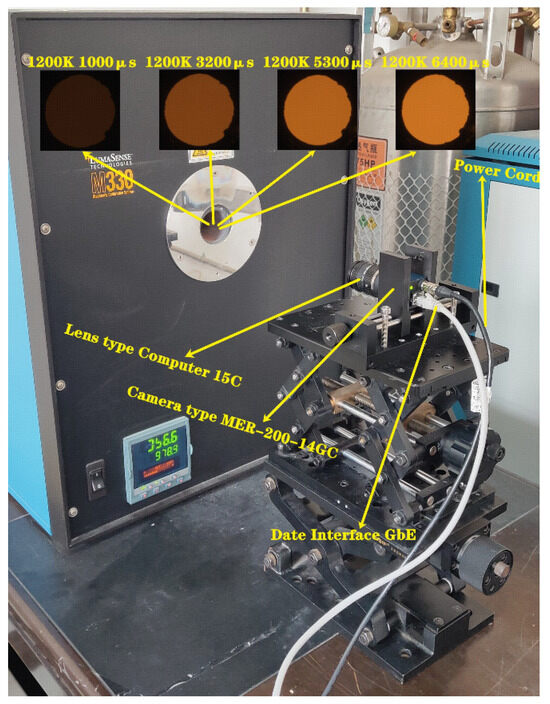
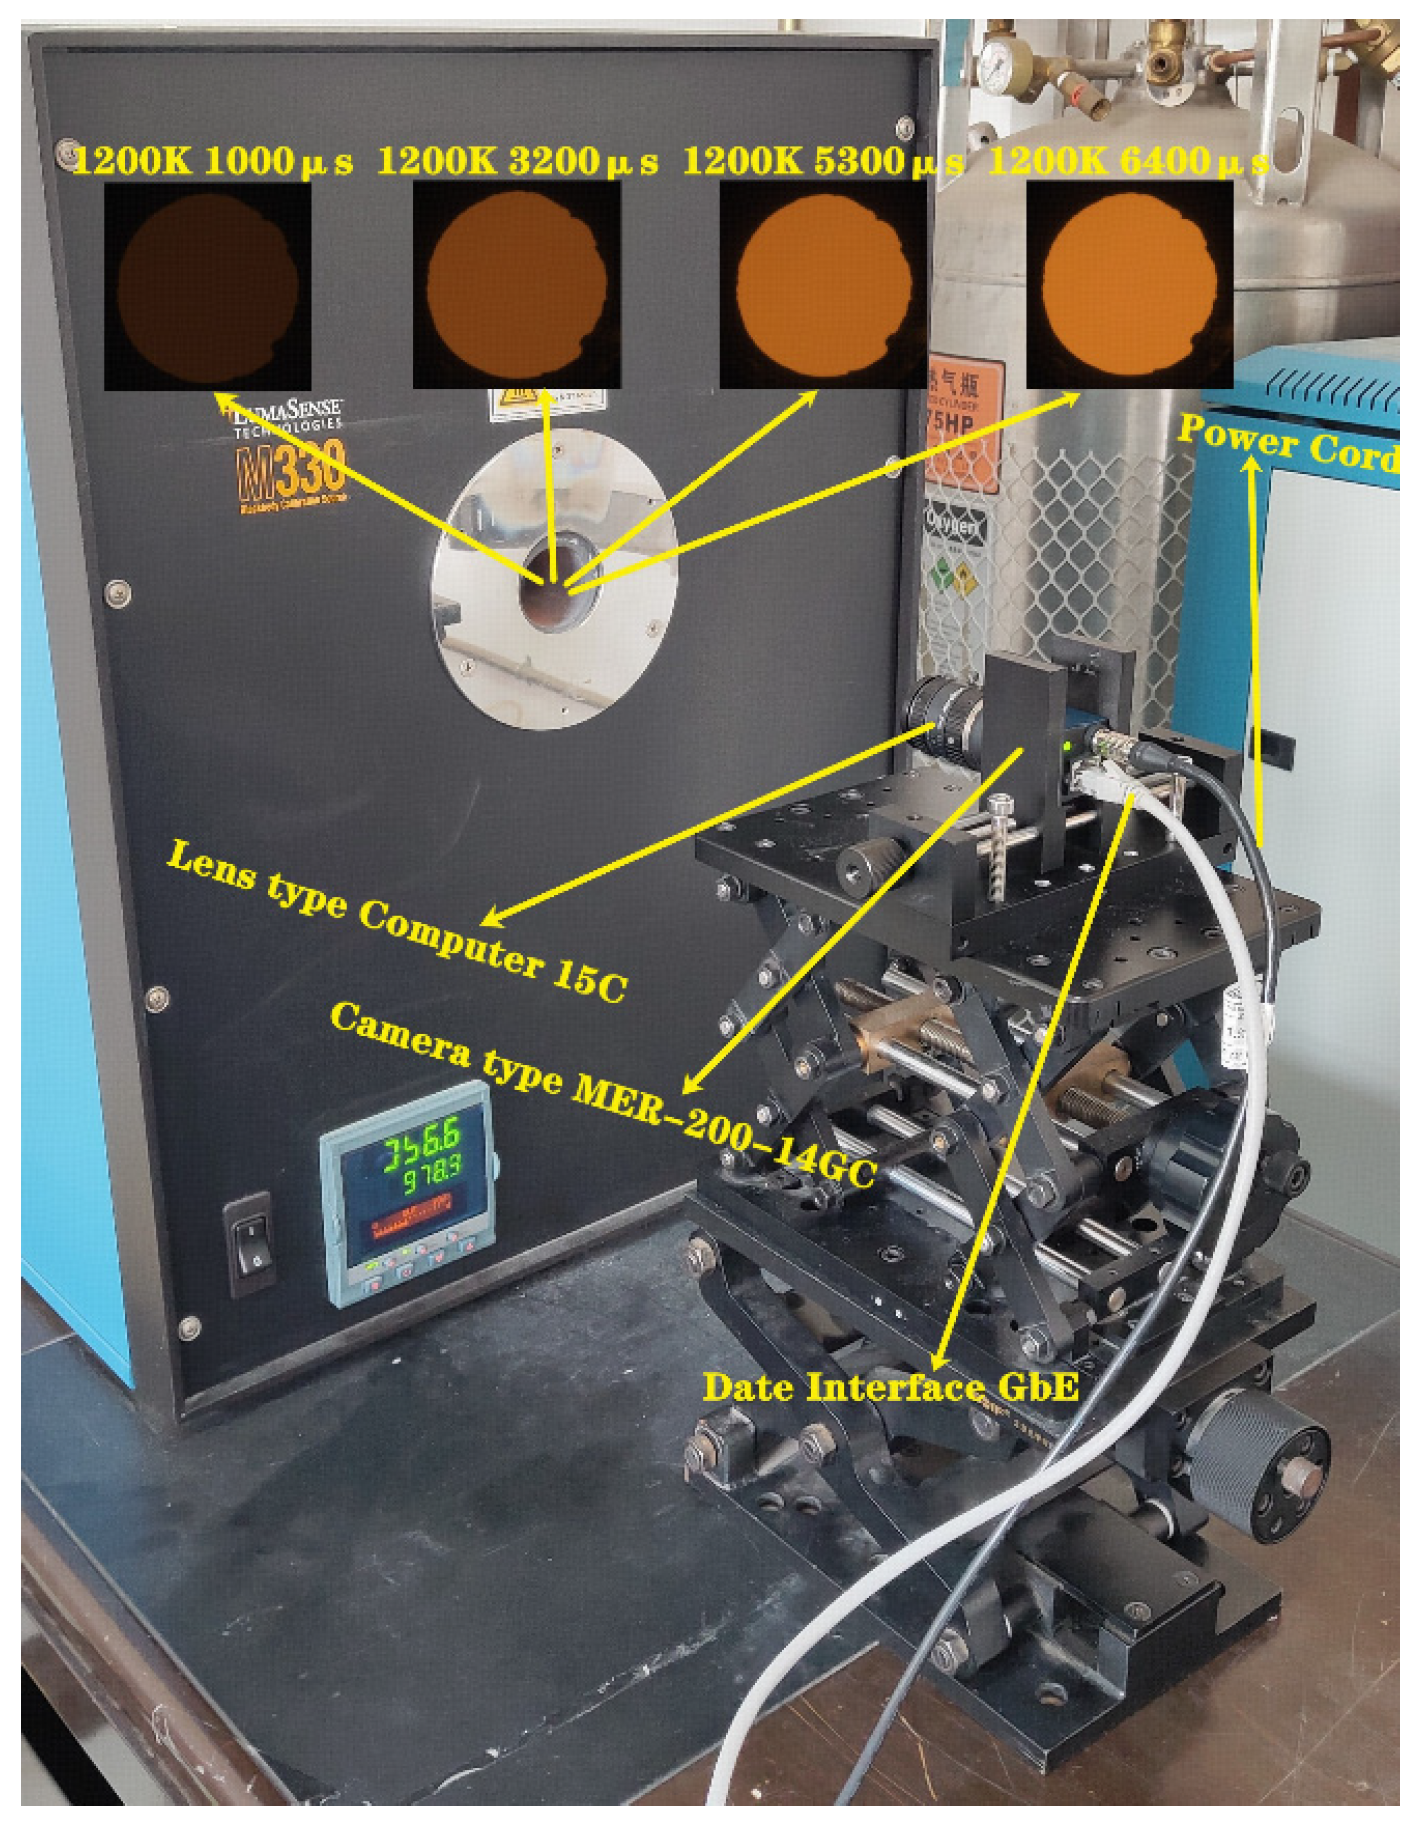
Accurate correlation between flame image color values and radiation intensity necessitated pre-experiment calibration of the visible-light imaging system. This process defined the functional relationship linking each color channel’s value to its radiation intensity. By employing the characteristic wavelengths of the red, green, and blue channels to represent the system’s overall response band—and deeming bandwidth-induced inaccuracies negligible—the calibration was performed. In this study, to ensure that the flame images captured by the camera directly represent the radiation energy emitted from the target surface of the blackbody furnace—without interference from the camera’s internal auto-correction functions—specific camera parameters were configured prior to acquiring calibration images. The aperture and white balance were both set to manual mode, and the automatic gain control was disabled. During the calibration process, images of the blackbody furnace at various temperatures were captured using different exposure times. For each calibration temperature point, a quartic polynomial was fitted to establish the relationship between the absolute radiation intensity and the color values of the images produced by the imaging system. This approach ensured the accuracy of temperature measurements throughout the experiment. Figure 4 illustrates the blackbody furnace used during this calibration.
Figure 4.
M330 high temperature black body furnace.
To ensure the flame image directly represents the target radiation without interference from the camera’s internal correction algorithms, specific parameters were configured prior to calibration. The aperture and white balance were set to manual mode, and the automatic gain function was disabled. This established a direct mapping between the blackbody furnace’s absolute radiation intensities (ER(i), EG(i)) and the image color values (R(i), G(i)) at each calibration temperature, thereby guaranteeing the accuracy of the subsequent temperature and soot measurements.
In addition, the measurement accuracy of the optical diagnostic system was evaluated through blackbody calibration and repeated measurements. The uncertainty of the temperature measurement is estimated to be within ±3%, while the uncertainty of the soot volume fraction is within ±8%. The flow rates of fuel and oxidizer were controlled using calibrated mass flow controllers with an accuracy of ±1%. These uncertainty levels are acceptable for laminar diffusion flame diagnostics.
The derivation of the double-color method for measuring the volume fraction of soot is based on the assumption of flame radiation and the simultaneous solution of the information from two wavelengths of radiation. The core logic is as follows: by measuring the radiation intensity of the flame at two specific wavelengths, the flame temperature is first determined, and then the volume fraction of soot is inversely calculated. The involved formulas are as follows:
where E(m) is a function of soot optical constant. is the spectral absorption coefficients of soot particles, approximate representation of Mie theory generally restricted by Rayleigh; is the volume fraction of soot; is Wavelength.
3.3. Model Verification
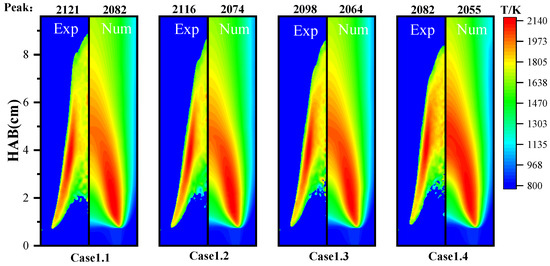
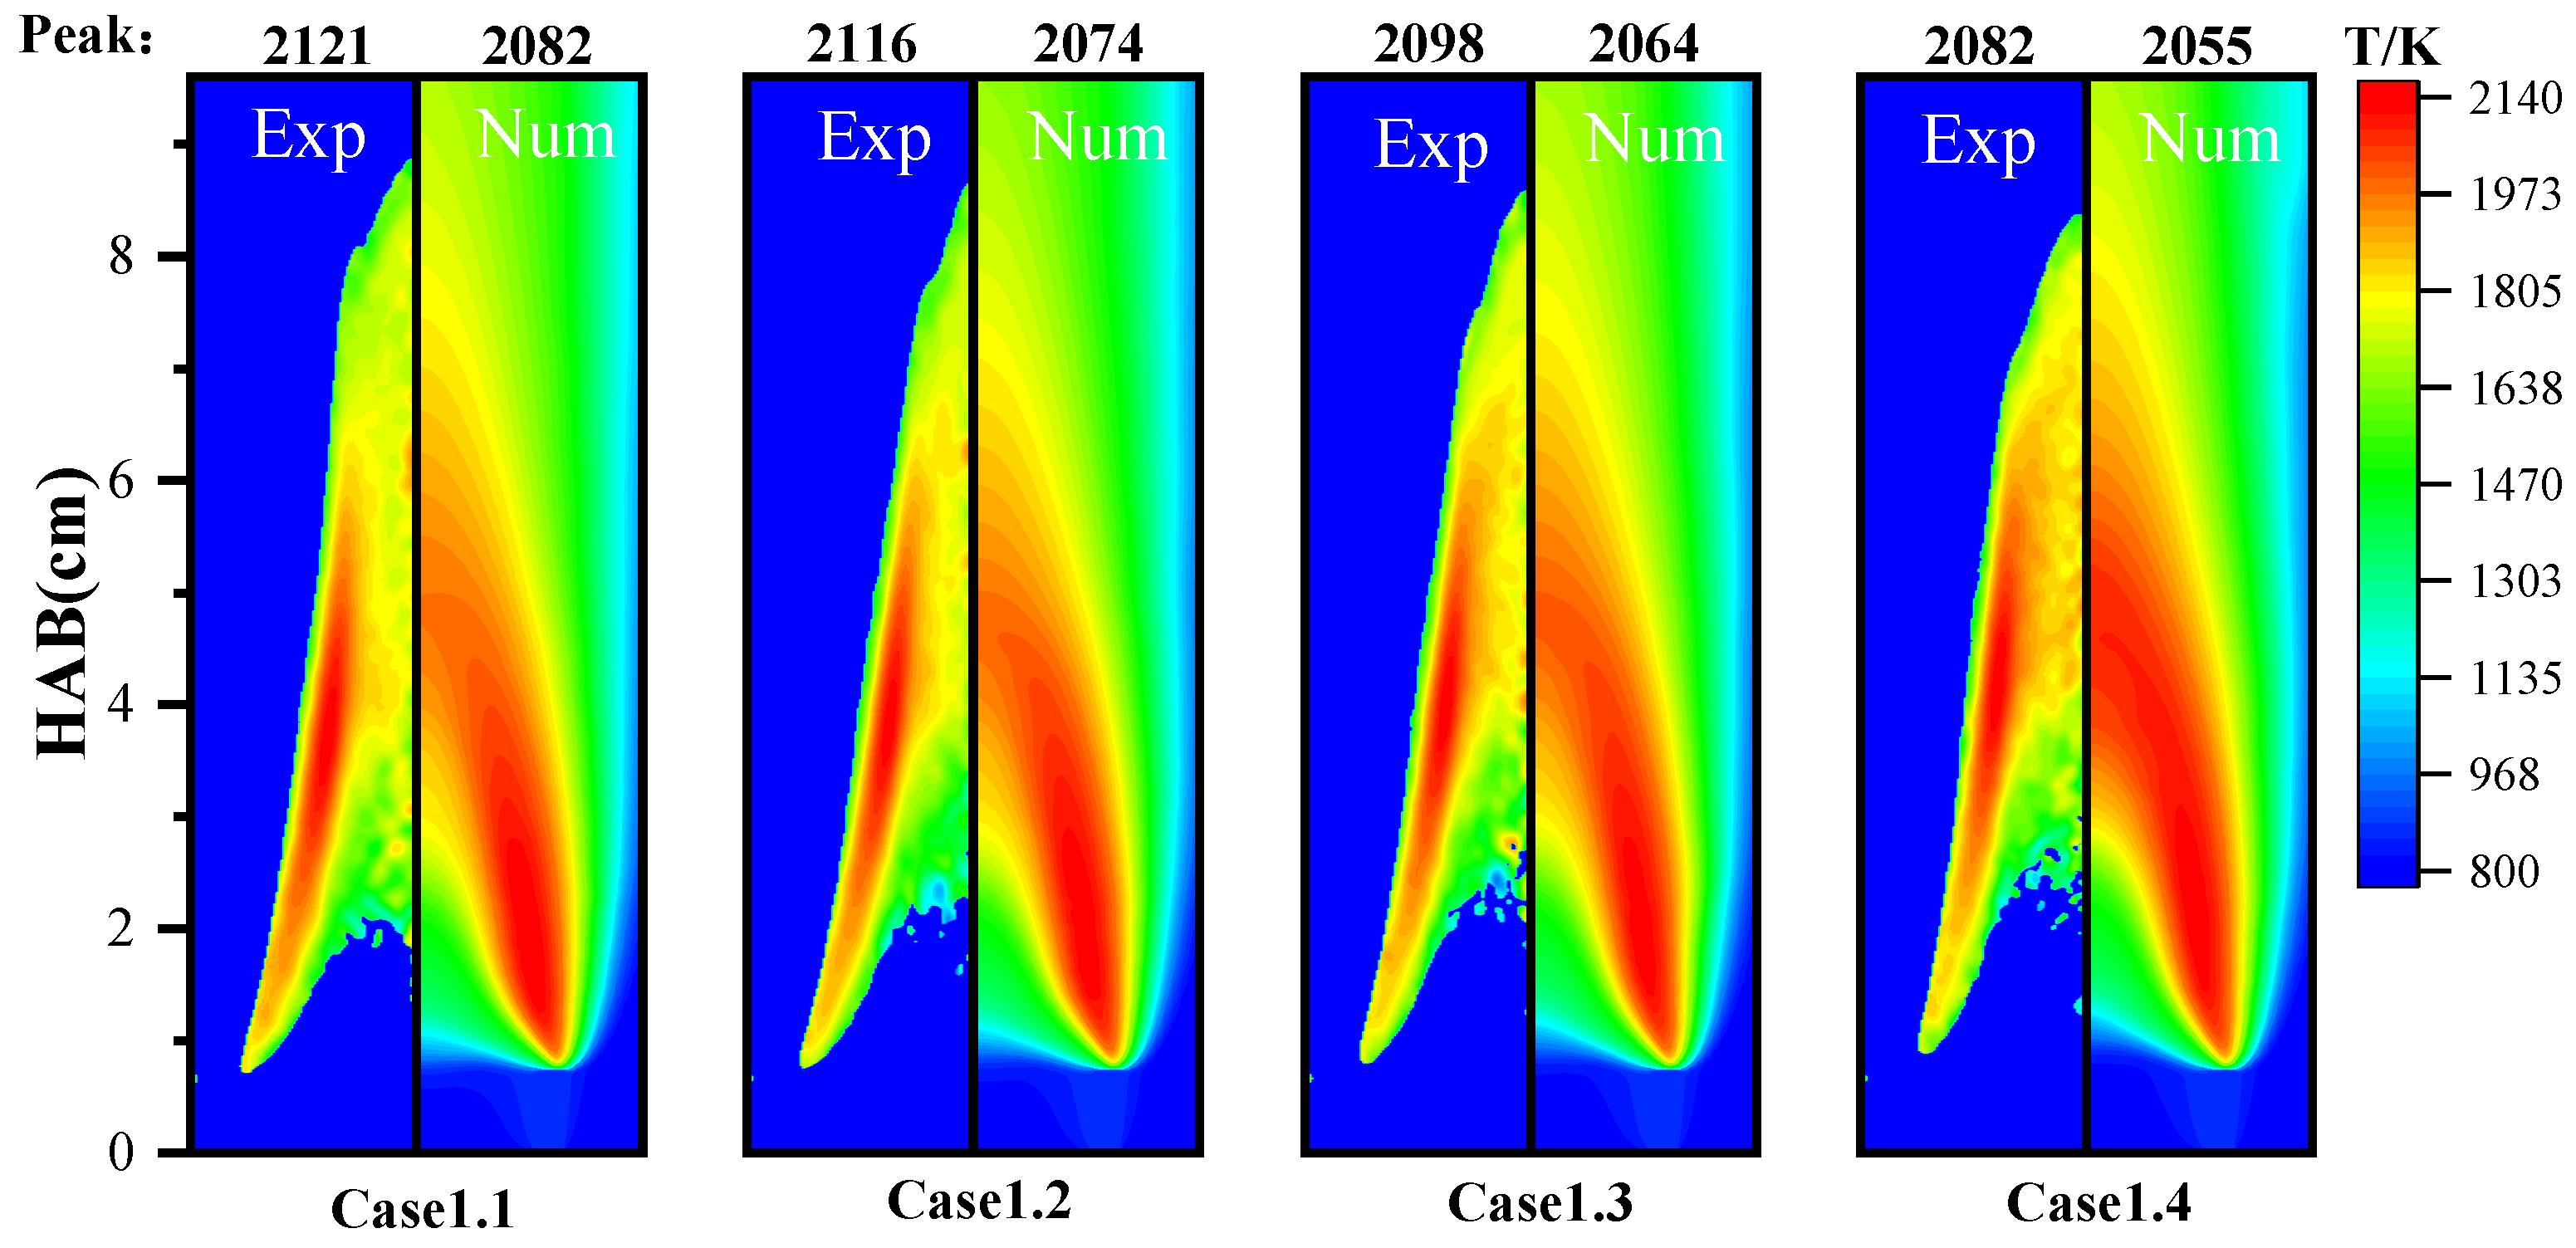
Figure 5 presents the two-dimensional temperature contour maps obtained from the experiment (left) and the numerical simulation (right). A comparative analysis reveals that, under the same operating conditions, the high-temperature regions in the numerical simulations are consistent with those observed in the experiments. Additionally, due to the buoyancy effect, the high-temperature regions move closer to the axial position. However, the experimental results show that the flame high-temperature region occupies a relatively smaller area and is mainly concentrated within the higher temperature range. In contrast, the numerical simulation exhibits a broader temperature distribution, providing a more comprehensive representation of the temperature field, including low-temperature regions. This discrepancy primarily arises from the different approaches used to obtain the temperature field. The observed discrepancies between the simulated and experimental results likely arise from a combination of factors. On one hand, numerical uncertainties inherent in the simulation, such as the simplified thermal boundary condition (e.g., fixed nozzle wall temperature at 400 K) and the detailed reaction kinetics, may contribute to prediction errors. On the other hand, experimental limitations, including the finite wavelength range of the optical diagnostics, could also lead to minor inaccuracies in the measured data. Therefore, the discrepancies should be considered as a cumulative effect of both modeling assumptions and measurement constraints.
Figure 5.
Experimental and simulated temperature distributions for different N2 dilution ratios.
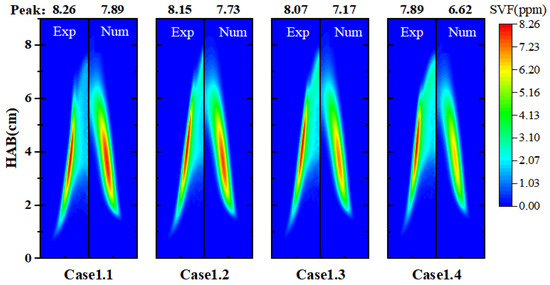
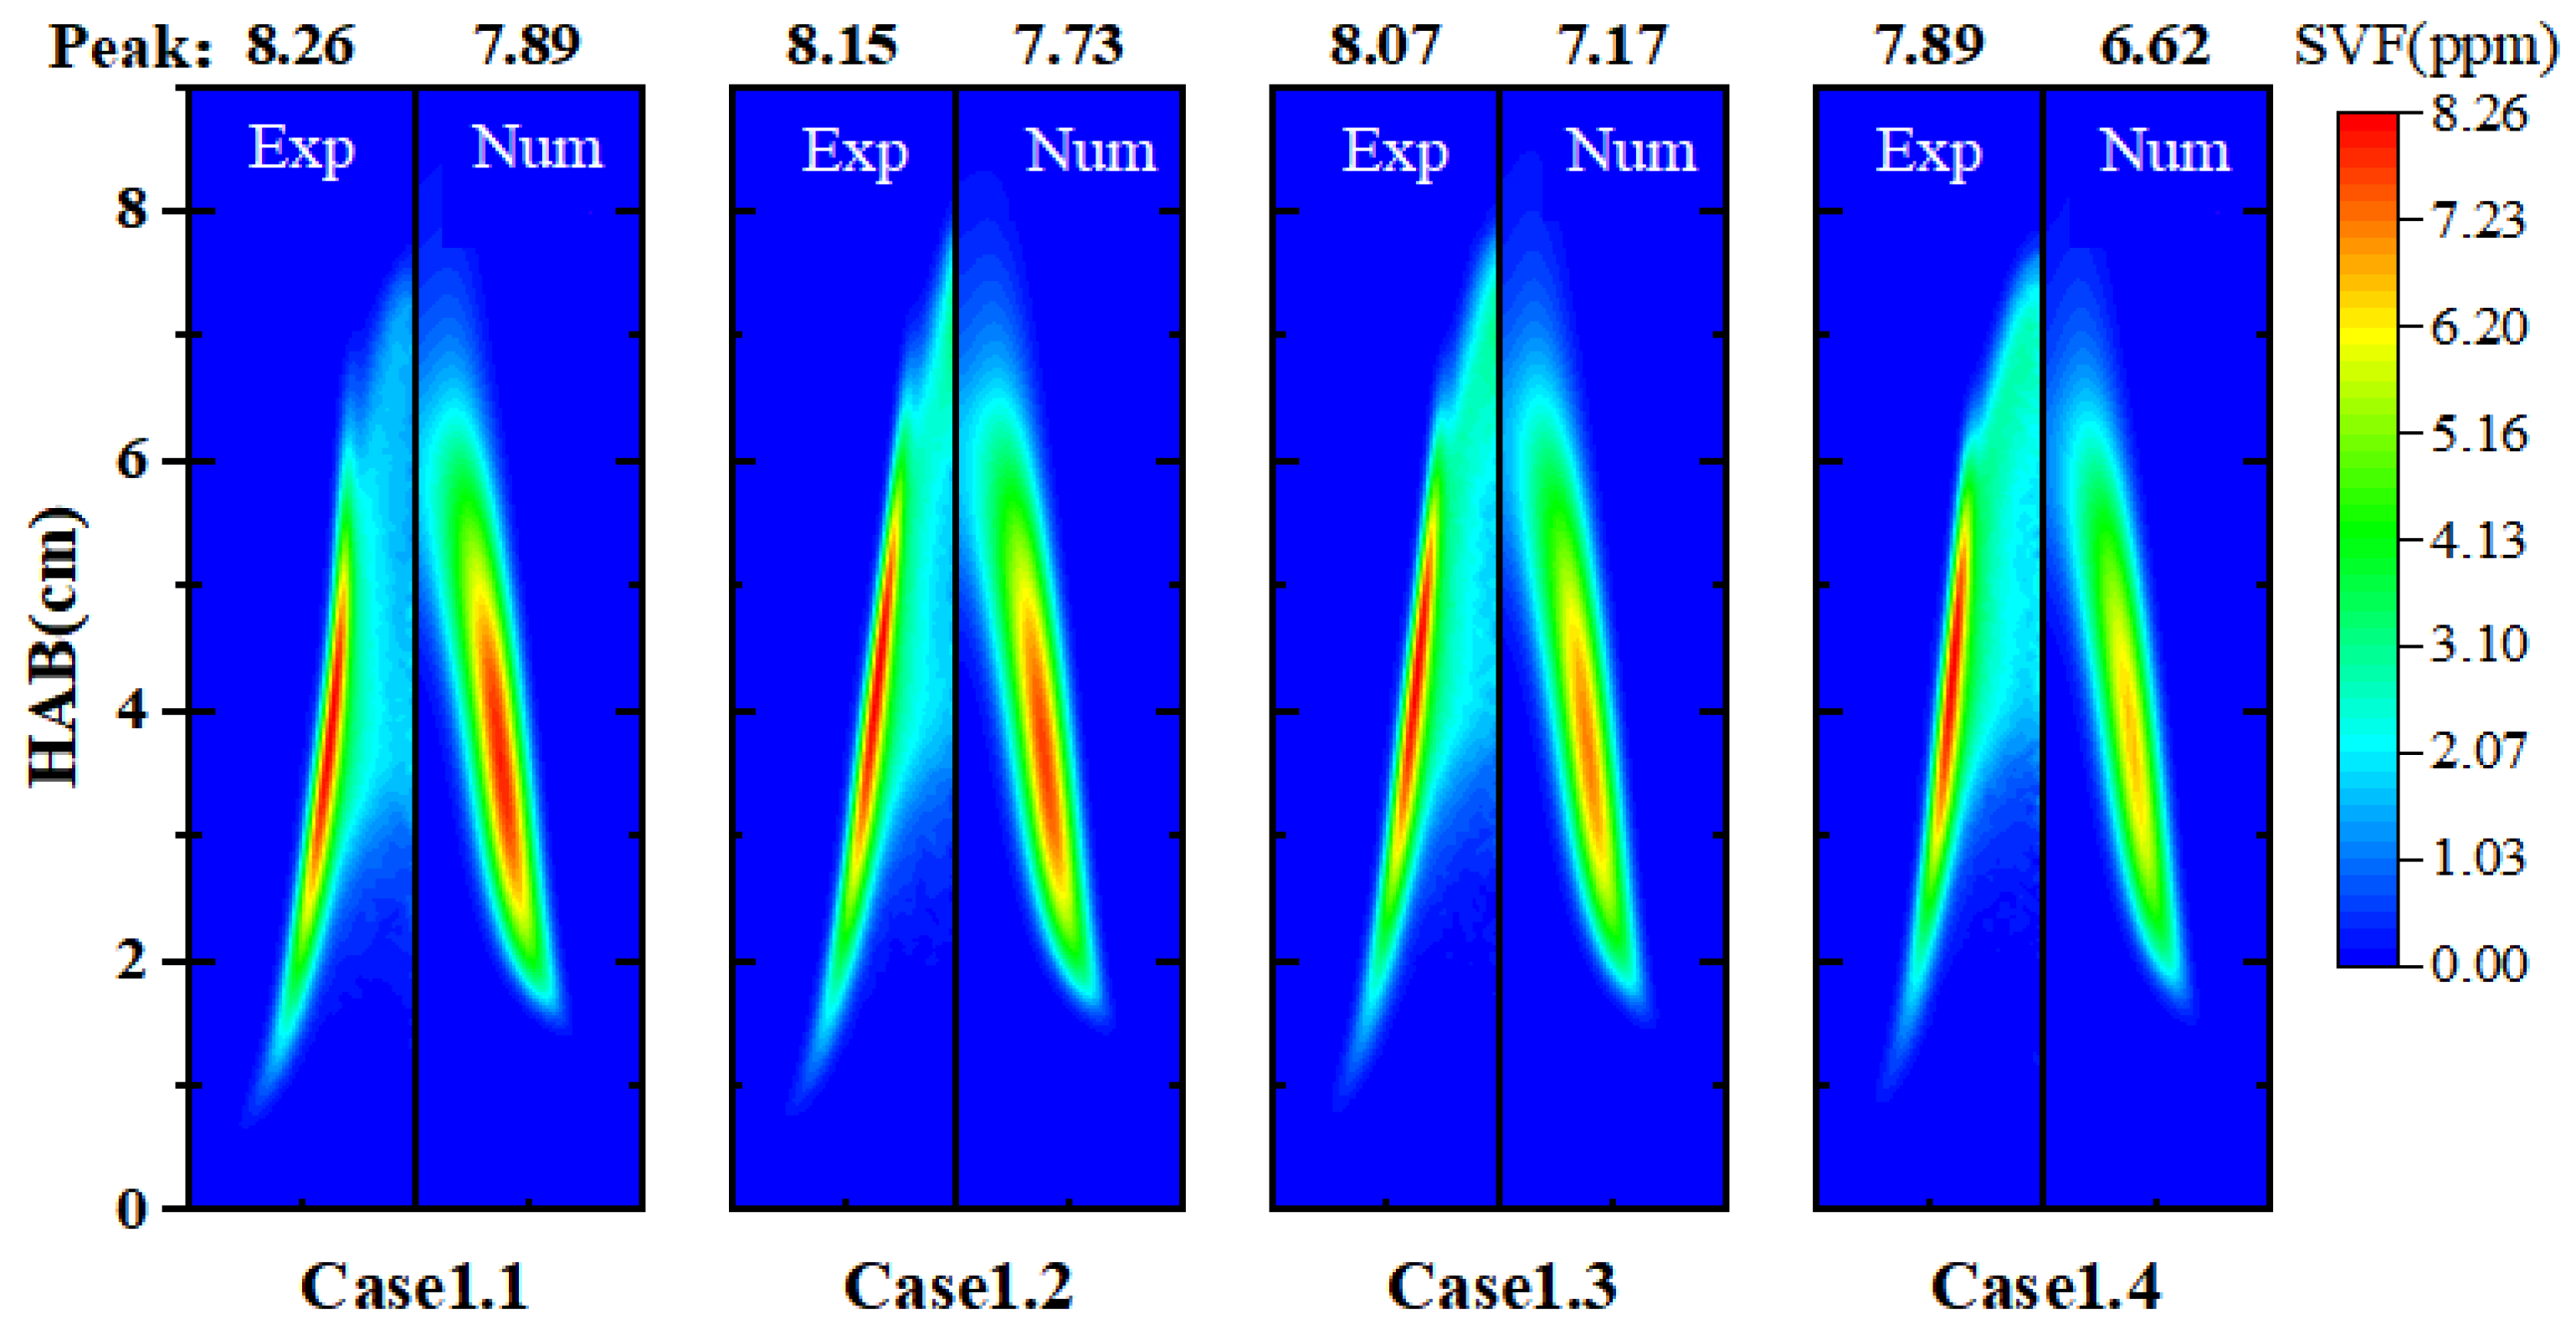
Figure 6 shows the contour maps of soot volume fraction obtained from the experiment (left) and the numerical simulation (right). The numerical simulation exhibits good agreement with the experimental results in terms of both the spatial distribution and the evolution trends of soot. Furthermore, as the N2 dilution ratio increases, the soot formation in the numerical simulations is suppressed, and the delayed formation location follows a trend consistent with the distribution of the high-temperature region. This validates the reliability of the numerical model developed in this study for predicting soot formation. However, noticeable discrepancies are observed between the simulated and experimental soot volume fraction along the centerline region. This discrepancy is primarily attributed to the limited sensitivity of the two-color optical diagnostic technique employed in the experiments under low-soot-concentration conditions, which reduces the reliability of measurements near the flame axis. Furthermore, the current soot model does not fully account for the detailed formation and evolution pathways of soot precursors, such as polycyclic aromatic hydrocarbons, and simplifies the gas-to-particle conversion process, thereby limiting its predictive accuracy in regions involving complex chemical reactions [19,20,21,22].
Figure 6.
Distribution of experimental and simulated soot volume fraction with different N2 dilution ratios.
As the N2 dilution ratio increases from 5% to 35%, both experimental and numerical results indicate a pronounced decrease in the peak flame temperature and the peak soot concentration. Experimental measurements show that N2 dilution reduces the peak temperature from 2121 K to 2082 K and the soot volume fraction from 8.26 ppm to 7.89 ppm. The numerical simulations exhibit the same trend, with the peak temperature decreasing from 2082 K to 2055 K and the peak soot concentration decreasing from 7.89 ppm to 6.62 ppm. The numerical simulations successfully reproduce the variation trends of both quantities under different operating conditions. However, the predicted peak values are generally lower than the experimental measurements, indicating that the current model exhibits certain discrepancies. The primary reasons for these differences are twofold. On the one hand, the treatment of the burner boundary in the simulations is relatively simplified, where the flame root is approximated as an isothermal wall at 400 K. This simplification fails to fully capture the fuel preheating effects present in the experiments, leading to deficiencies in the prediction of temperature and species evolution in the initial reaction zone [23]. On the other hand, the numerical calculations employ simplified chemical kinetics and soot formation models, which are unable to comprehensively describe the complex intermediate reaction pathways and soot formation mechanisms occurring in practical combustion processes, thereby resulting in deviations in the predicted soot peak values.
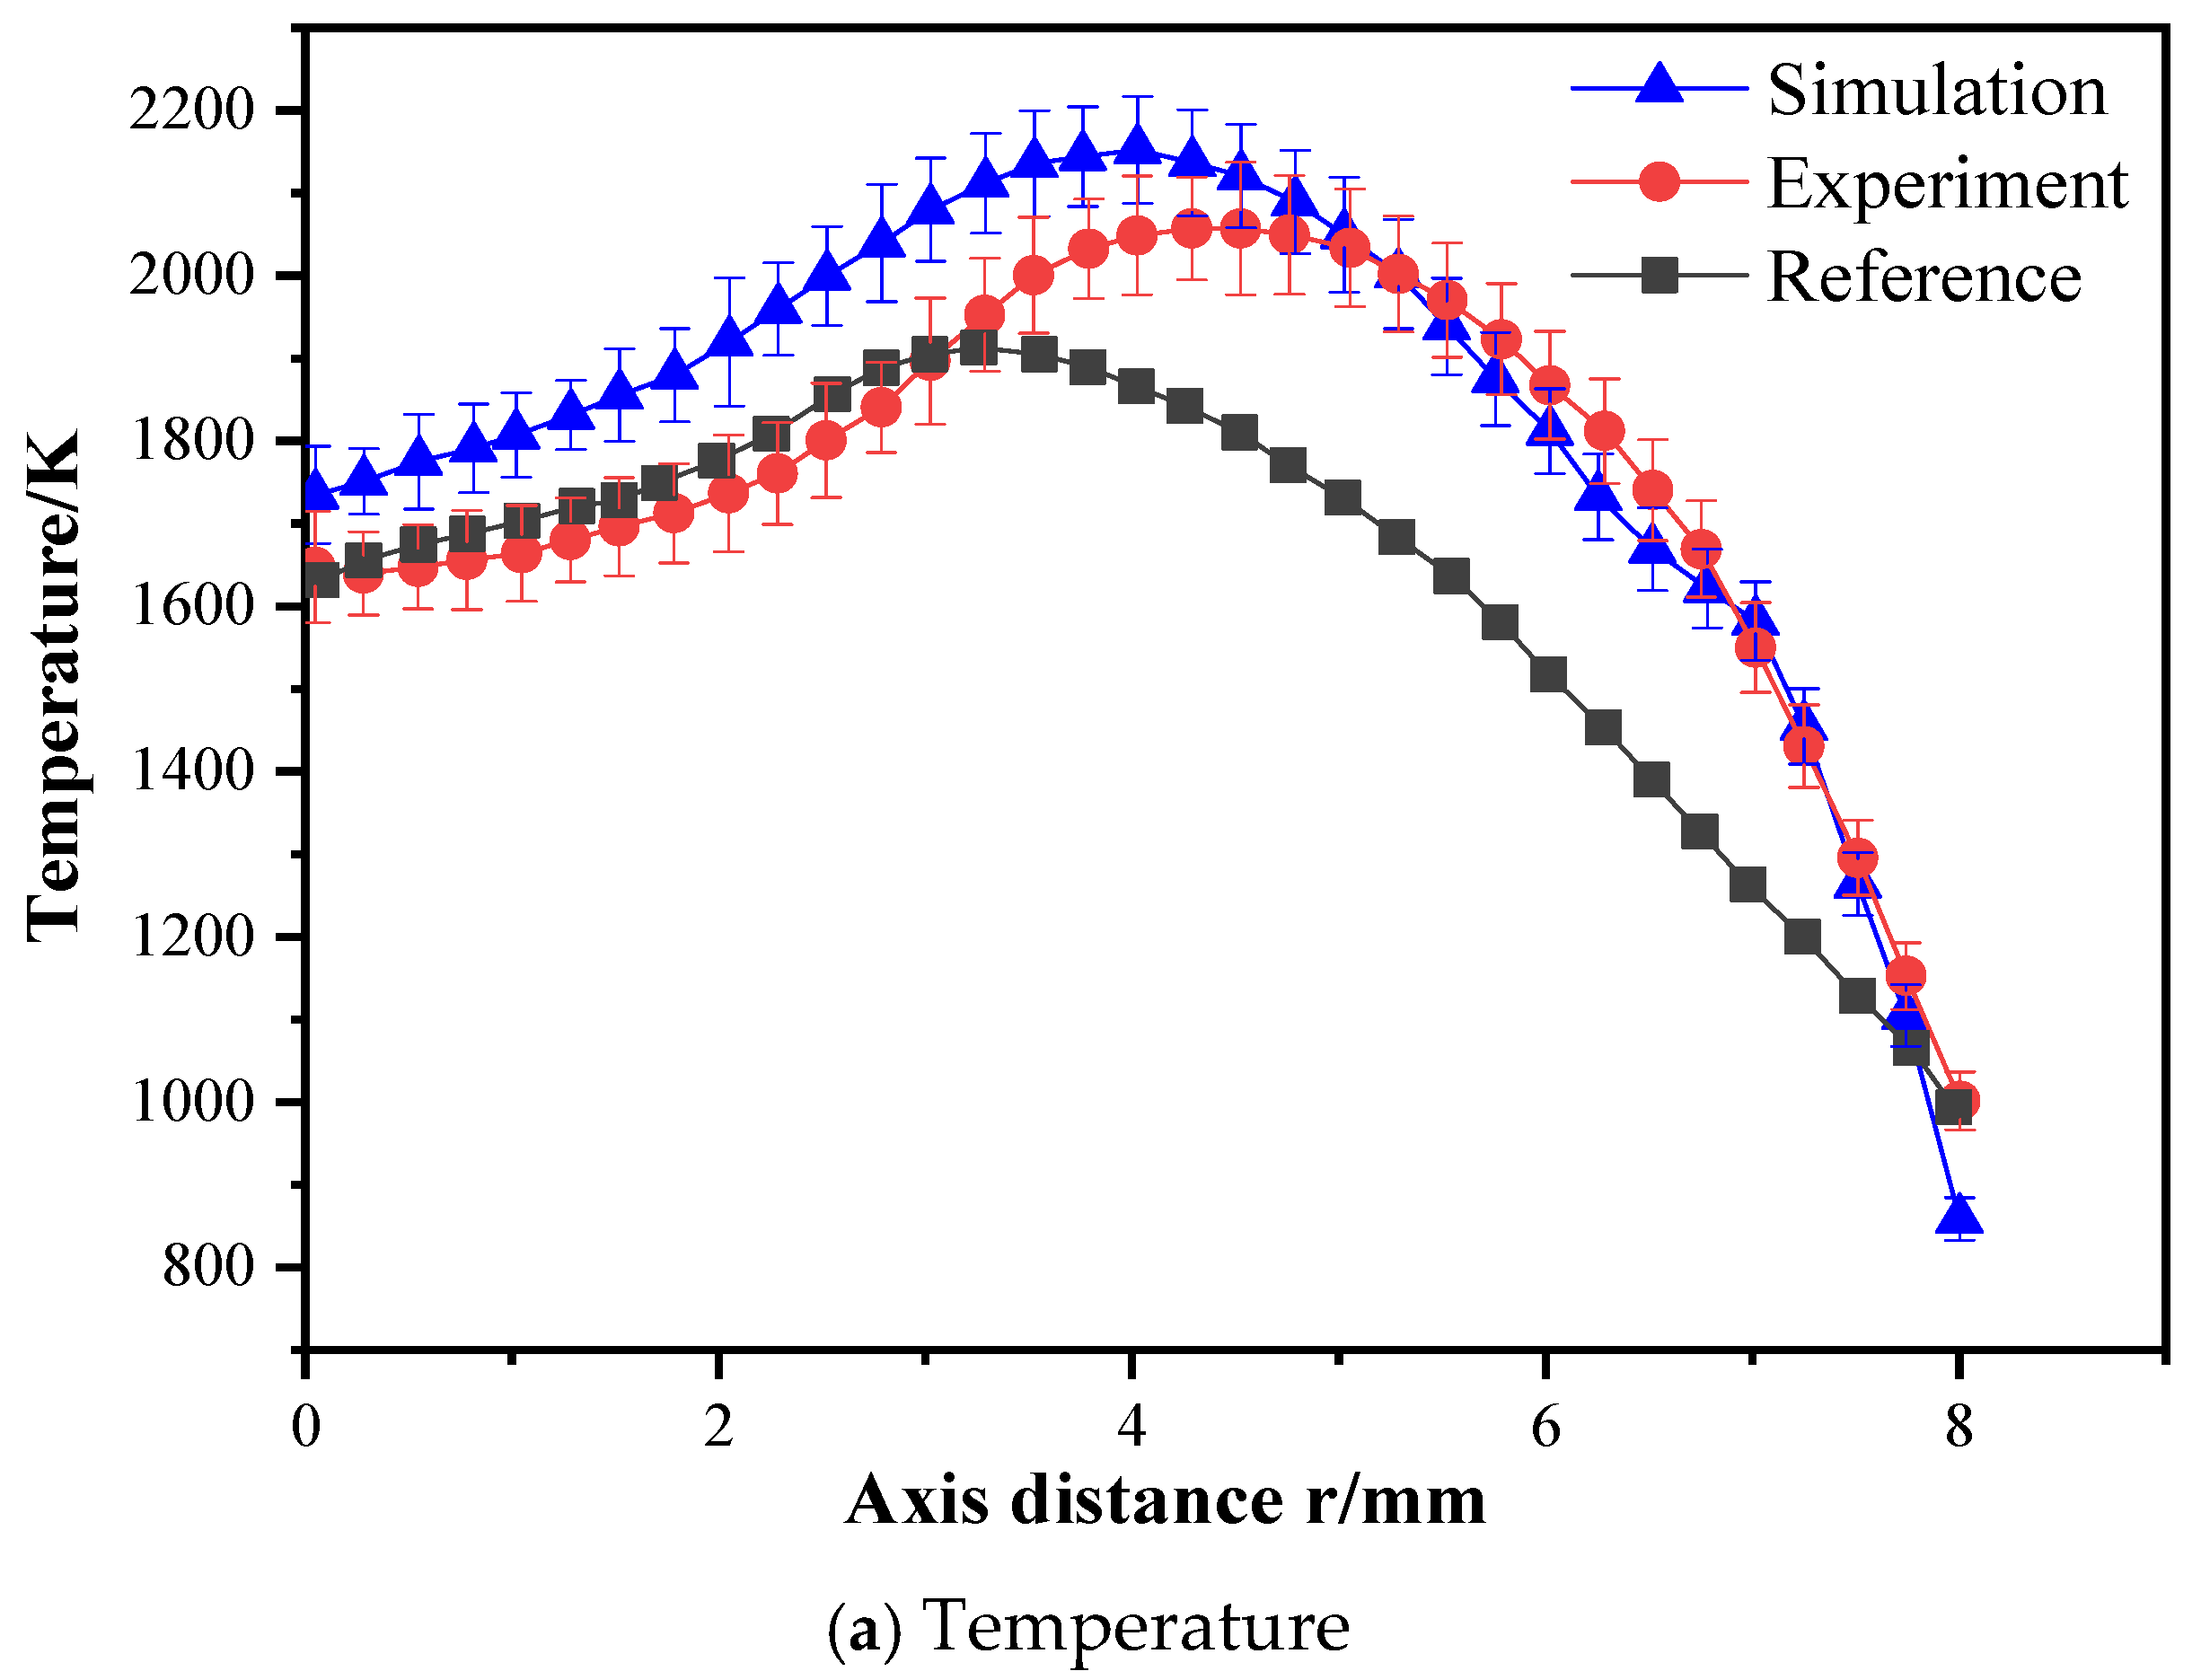
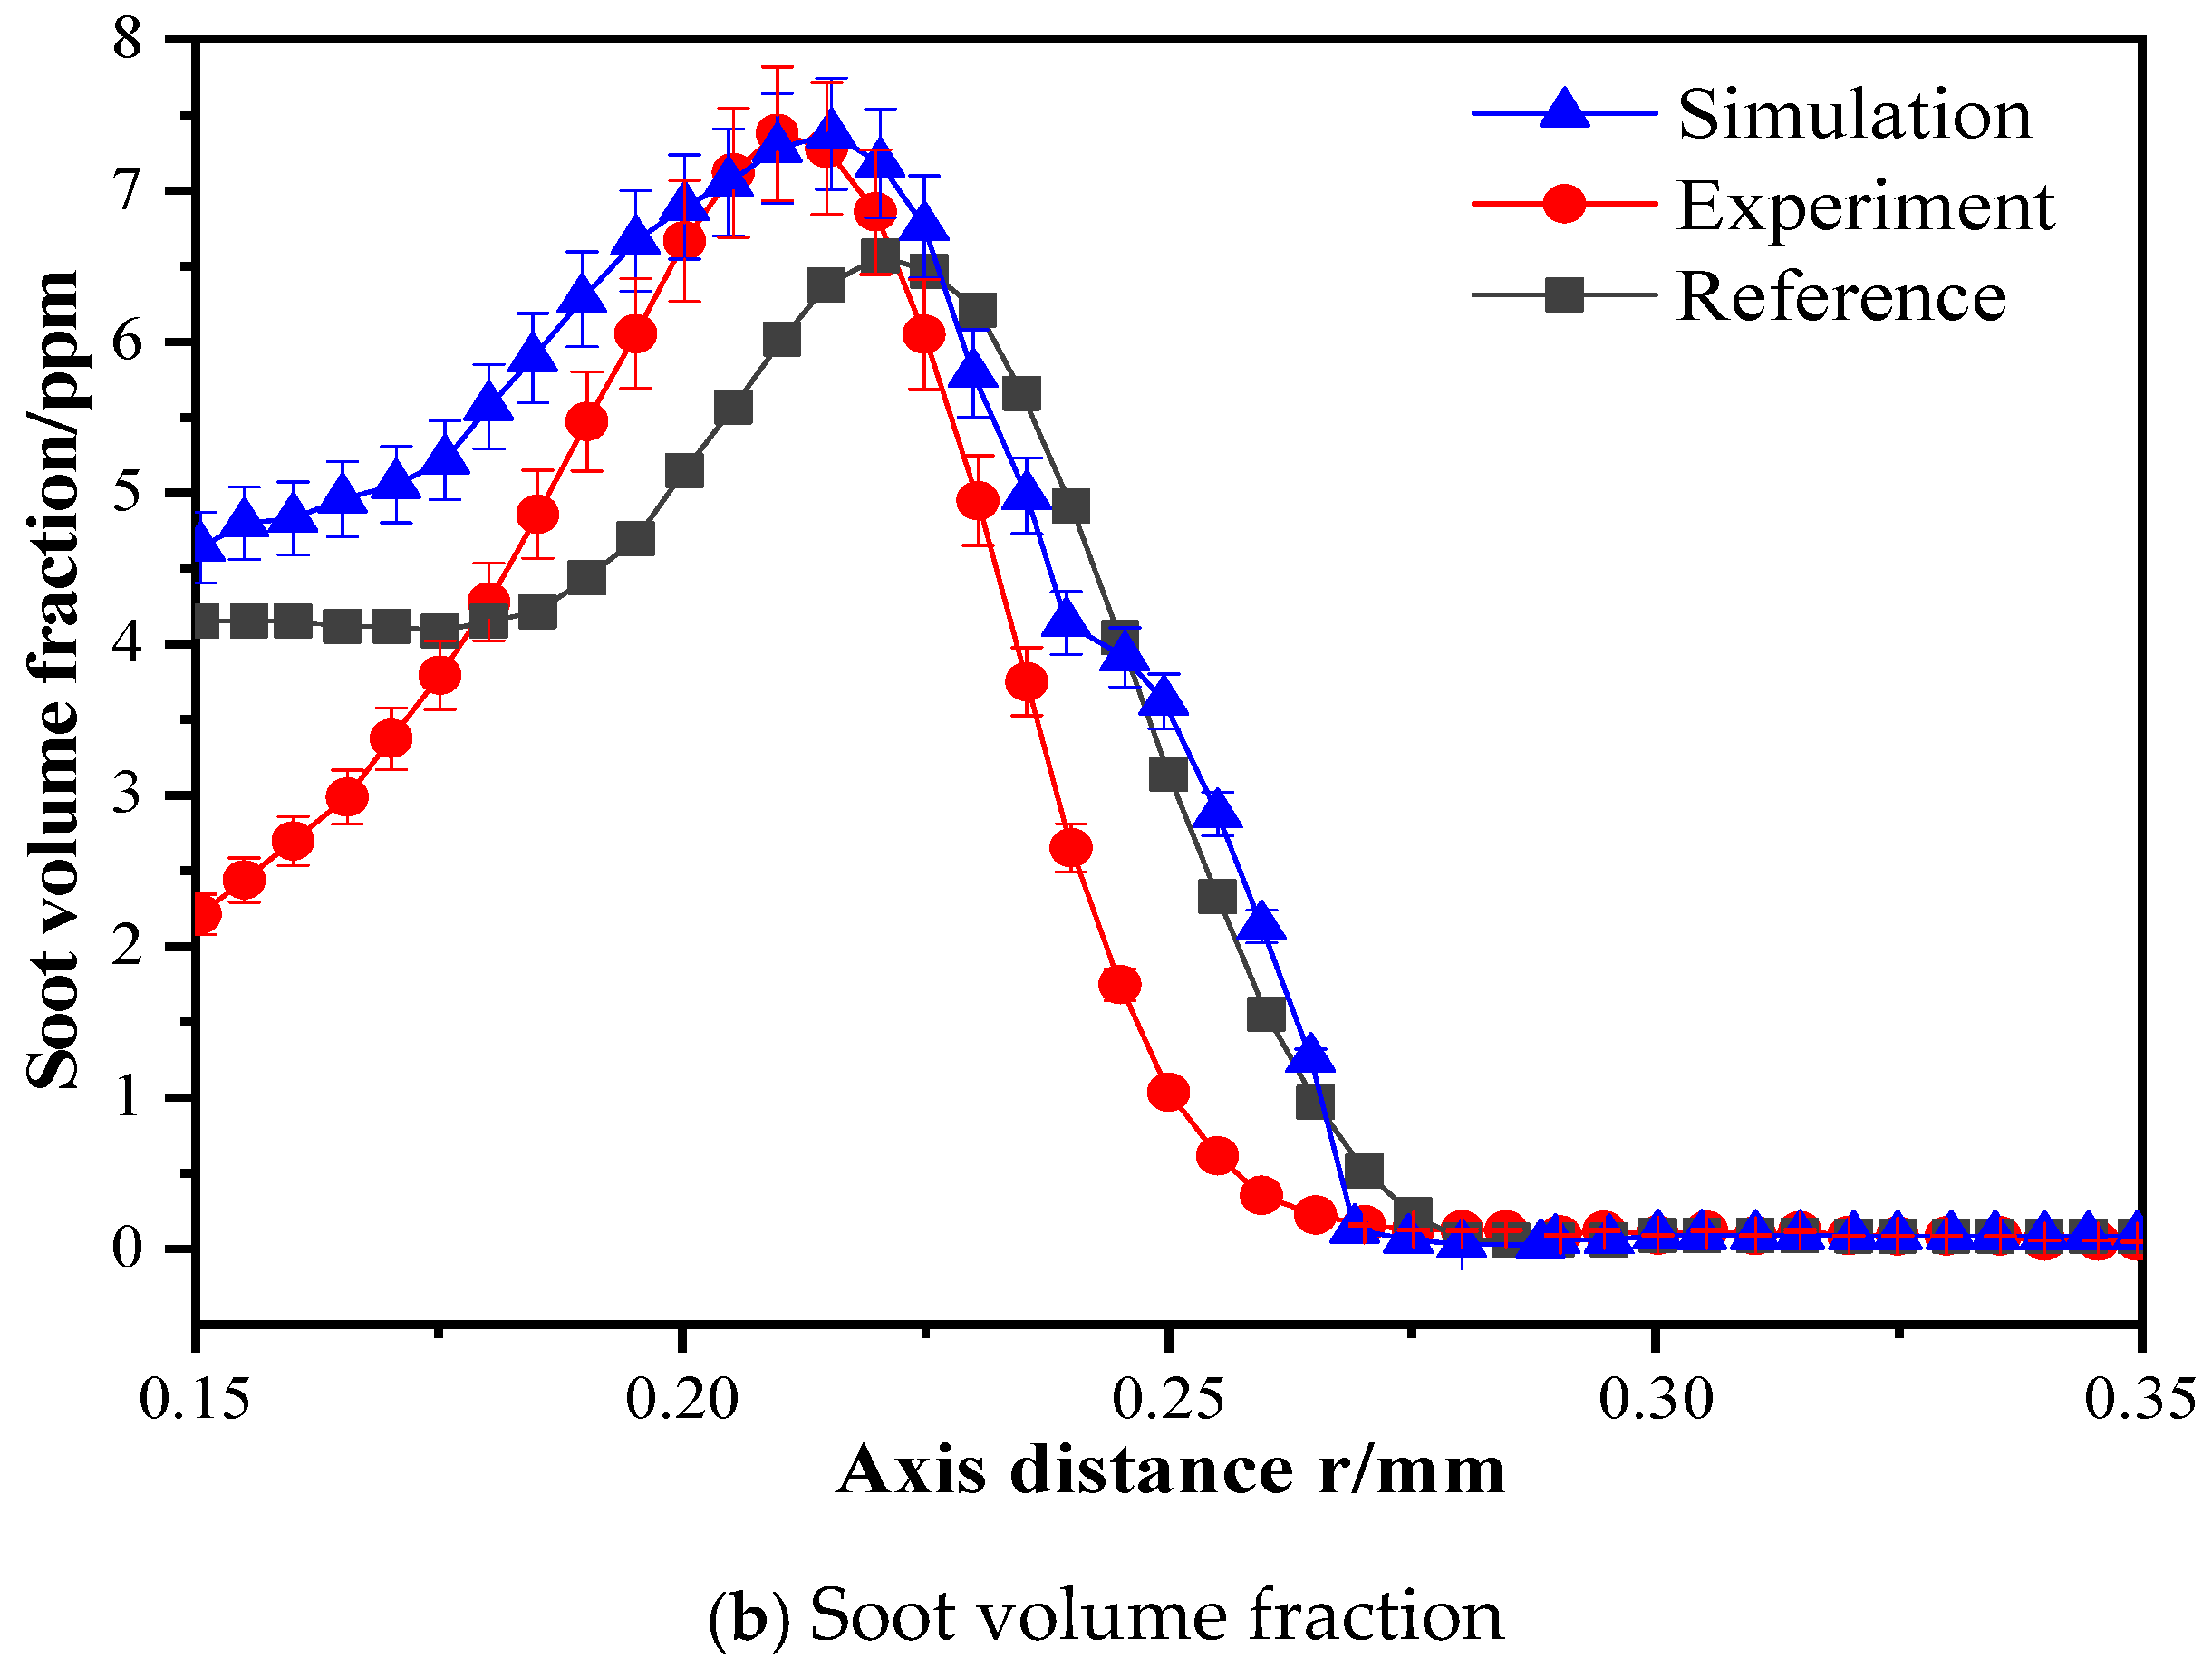
To validate the accuracy of the numerical model, a reference case from the literature [24], corresponding to the same experimental and numerical conditions, was selected for comparison. To evaluate the reliability and accuracy of the inversion reconstruction algorithm and measurement technique based on visible light images, the same oxygen atmosphere (21%O2 + 79%N2) and fuel flow rate used in the reference were adopted for both experimental and numerical simulations (this work: ethylene at 194 mL/min, oxygen at 40 L/min). Due to experimental constraints, the oxidizer flow rate in the present study is slightly different from that in the reference literature (reference: C2H4 194 mL/min, O2 284 L/min), while the fuel flow rate is kept the same. In conventional laminar diffusion flames, the influence of coflow rate on the overall flame characteristics is relatively small [25,26]. The numerical discrepancy between the experimental results and the literature data can be attributed to the significant effect of buoyancy in laminar diffusion flames under atmospheric pressure conditions. The flame is highly sensitive to minor variations in the burner exit temperature and environmental airflow disturbances. Even when the experimental conditions are nearly identical, these small differences may be amplified by buoyancy, leading to shifts in the flame temperature and soot distribution. Therefore, it is meaningful to compare the experimental results obtained in this study with both the numerical simulations and the reference data.
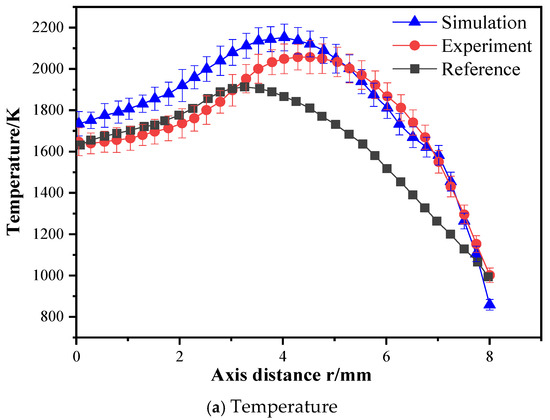
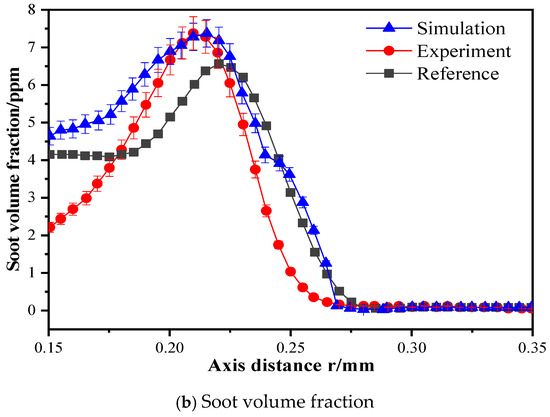
Figure 7 shows the radial distributions of temperature and soot volume fraction at Z = 40 mm. The results indicate that, at this flame height, the trends in the radial distribution of temperature and soot volume fraction are in good agreement between the reference literature, numerical simulations, and experimental results. Both the flame temperature and soot volume fraction increase and then decrease with increasing radial distance, following a characteristic distribution pattern. The discrepancies between the experimental results and numerical simulations primarily arise from the current soot model’s insufficient consideration of the detailed formation and evolution pathways of polycyclic aromatic hydrocarbons (PAHs). The differences between the experimental results and the reference data may be attributed to small variations in the burner exit temperature and environmental airflow disturbances. A comparison of the peak values reveals that the peak temperature predicted by the simulation is 2084 K, which differs from the experimental value (2162 K) and the literature value (2160 K) by approximately 3.5%. For the peak soot volume fraction, the simulated value is 7.51 ppm, and the deviations from the experimental value (7.5 ppm) and the literature value (6.87 ppm) are both within 8.3%, indicating relatively small discrepancies. Overall, the numerical model developed in this study is capable of accurately predicting soot formation in laminar ethylene diffusion flames, thereby confirming the validity of the model.
Figure 7.
Radial temperature and soot volume fraction distribution at Z = 40 mm.
4. Results and Discussion
4.1. The Combustion Characteristics of Ethylene Flame Under the Dilution of CO2
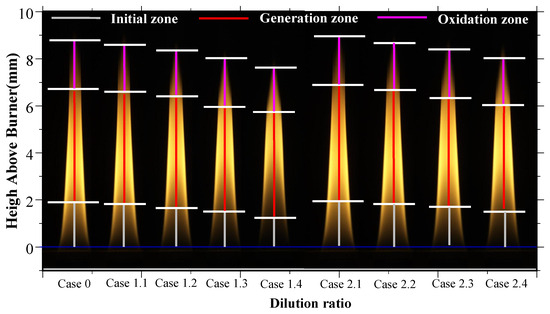
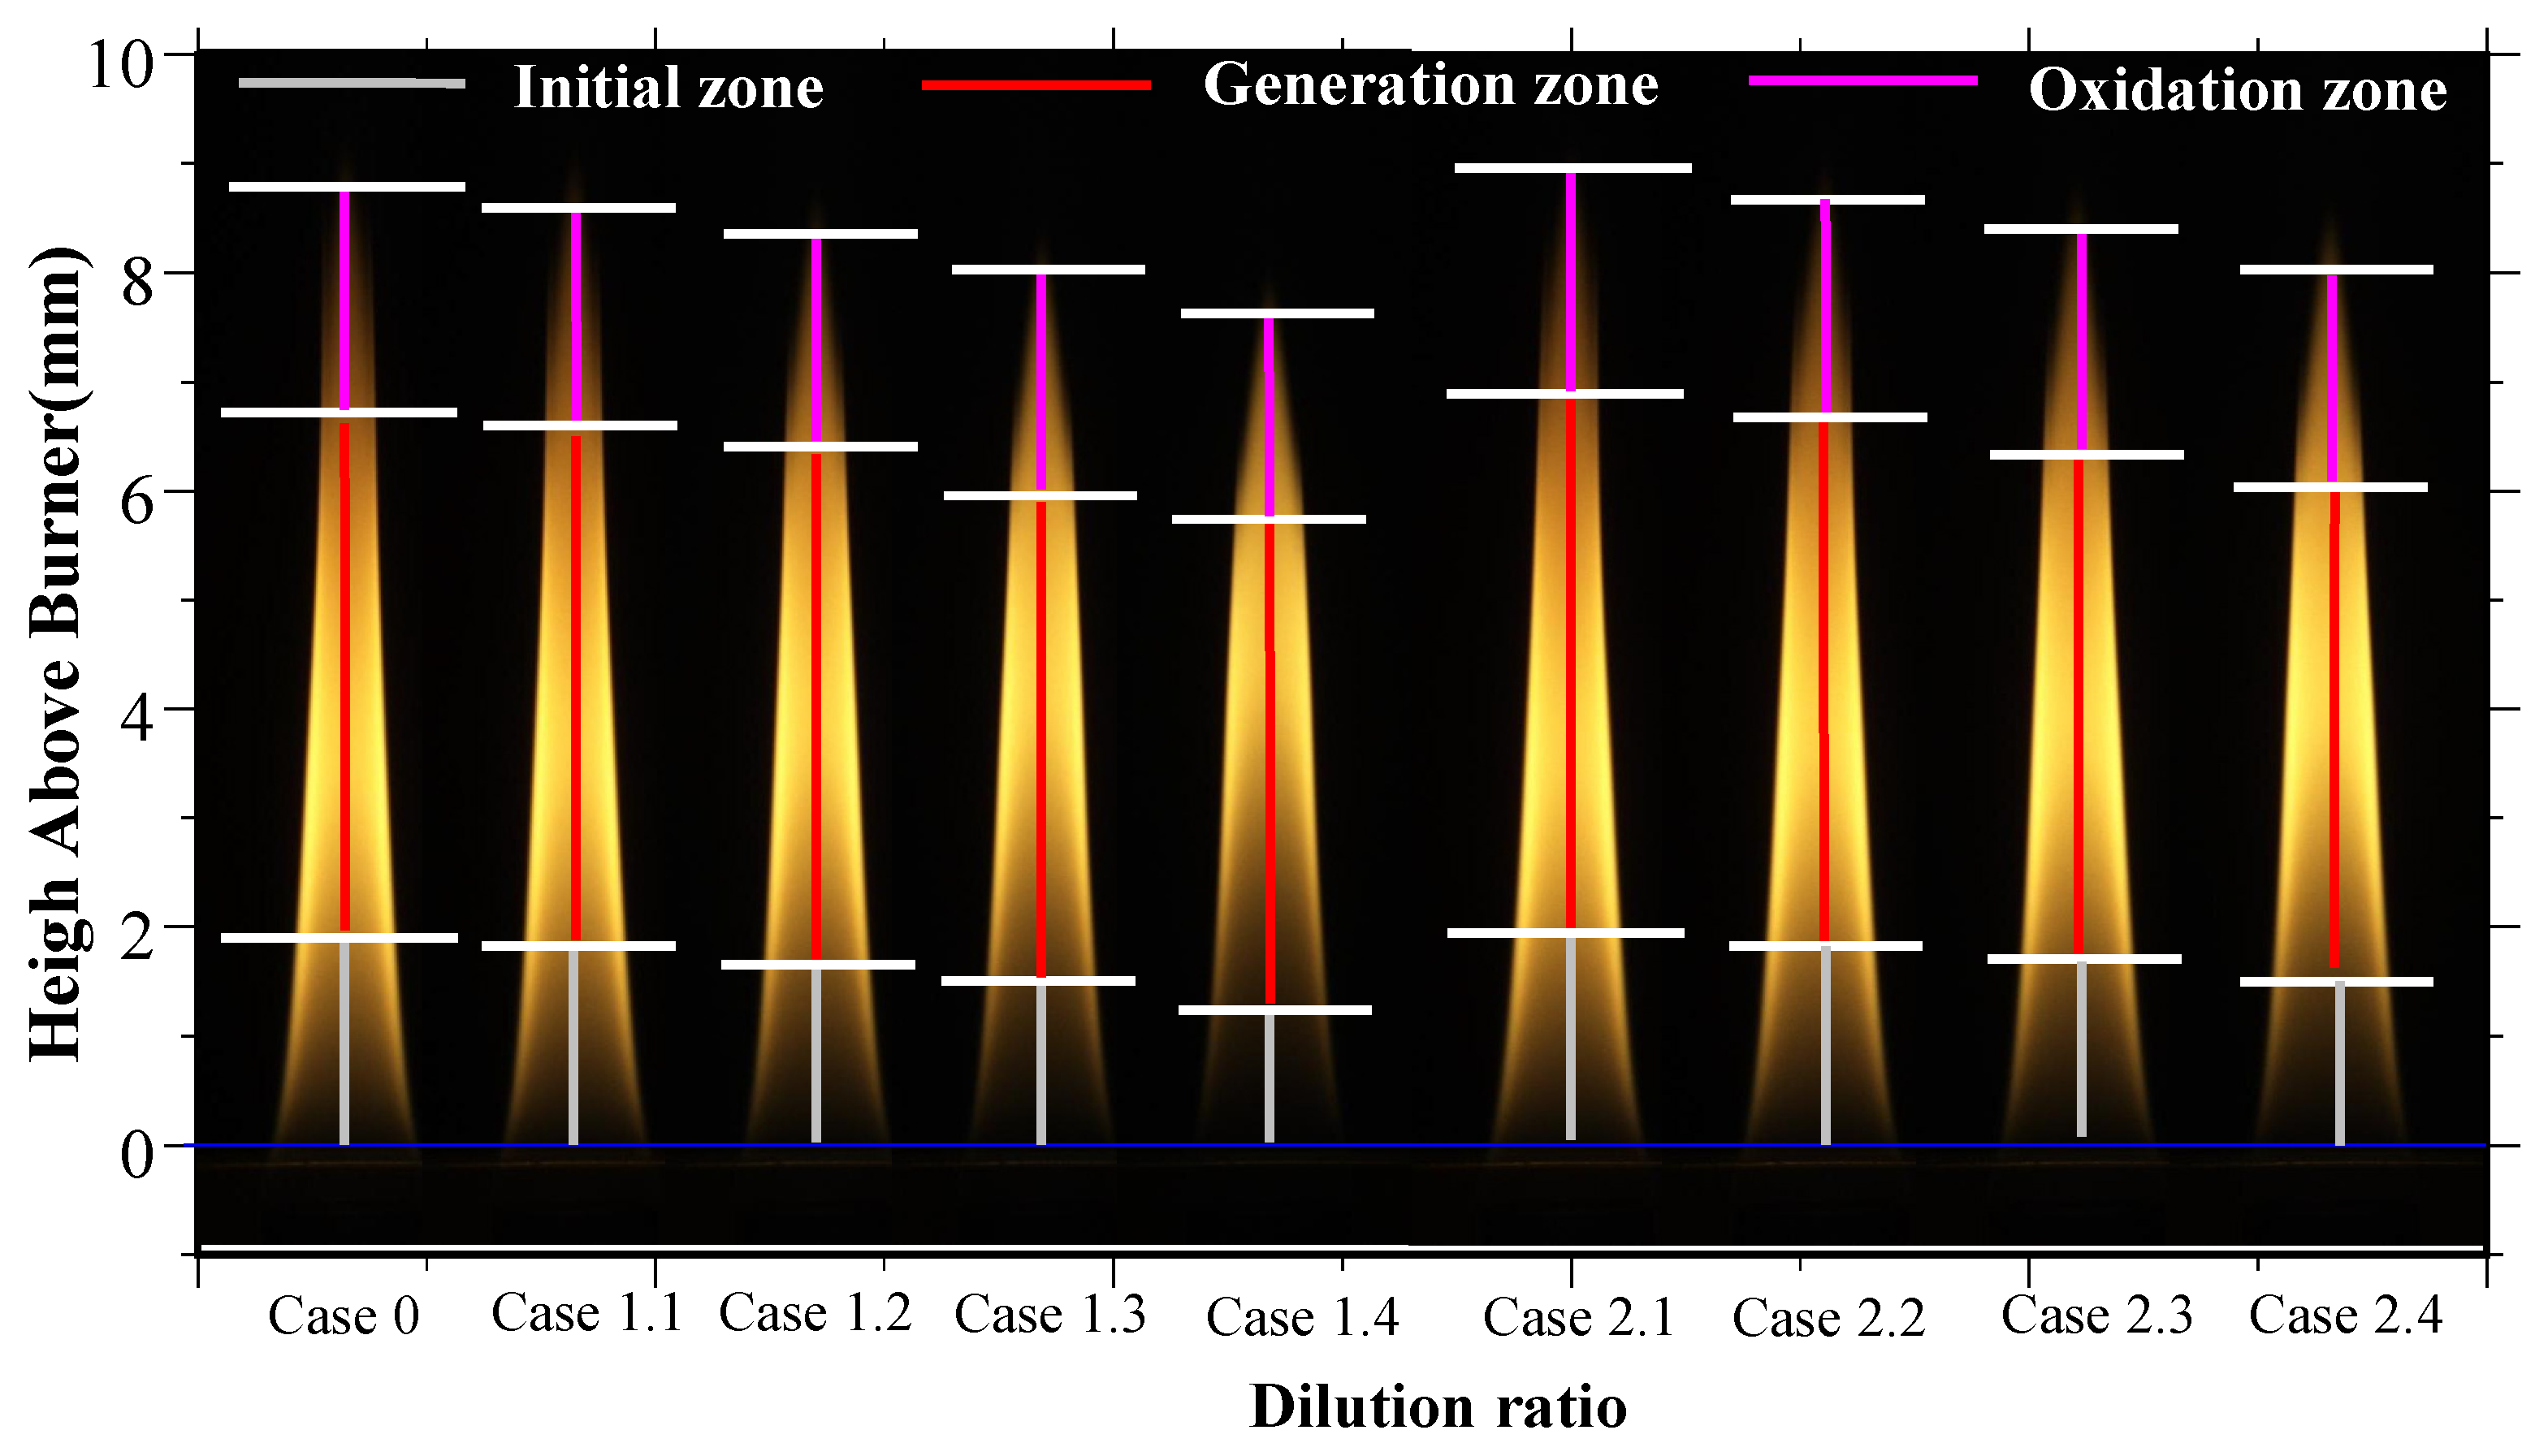
Figure 8 presents flame images obtained at different dilution ratios. To accurately describe the formation and evolution of soot within the flame, the flame axis is divided into three regions: the initial soot growth zone, the soot generation zone, and the soot oxidation zone. The initial soot growth zone is defined as the region from the base of the flame to the location where the soot volume fraction first deviates significantly from zero, characterized by a low soot concentration and temperature. The soot generation zone is the region where the soot volume fraction rapidly increases and reaches its peak value, with soot nucleation and surface growth processes dominating. The soot oxidation zone lies beyond the peak soot volume fraction, where soot particles are oxidized and consumed, resulting in a significant decrease in soot volume fraction. The boundaries of each region are determined by the axial variation in the soot volume fraction. Specifically, the end of the initial soot growth zone is defined as the position where the soot volume fraction first reaches 0.5%. The soot generation zone spans from the point where the soot volume fraction reaches 0.5% to the peak value, while the soot oxidation zone extends from the soot peak to the axial position where the soot volume fraction decreases to 0.5%. This method effectively describes the formation and consumption processes of soot and is consistent with the flame zone classifications proposed in the studies by El-Asrag et al. [27] and Mercier et al. [28].
Figure 8.
Flame images of different N2/CO2 dilution ratios.
As the dilution ratio increases, the ethylene flames diluted with N2 and CO2 exhibit pronounced changes, characterized by a reduction in flame height (HAB), contraction of the oxidation zone, and an expansion of the shadowed region near the flame base. In addition, the main flame body and the soot formation region shift upward as a whole, indicating that soot inception is partially suppressed. The observed phenomena can be attributed to two primary factors. On the one hand, the addition of dilution reduces the fuel concentration, requiring the fuel stream to reach a higher axial position to satisfy the reaction conditions, thereby causing an upward shift in the combustion zone [29,30]. On the other hand, the soot inception level decreases, while the effective contact area between soot and oxidizing species (O2/OH) is reduced, altering the competition between soot formation and oxidation. These combined effects ultimately lead to an overall reduction in flame height. Since flame height can be regarded as an indicator of the soot formation rate, the addition of either N2 or CO2 effectively delays the soot formation process.
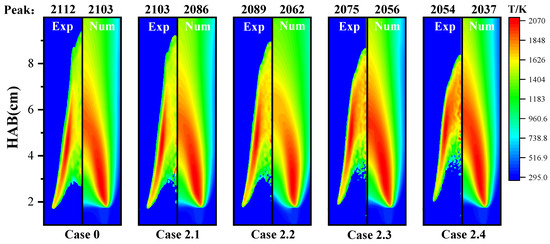
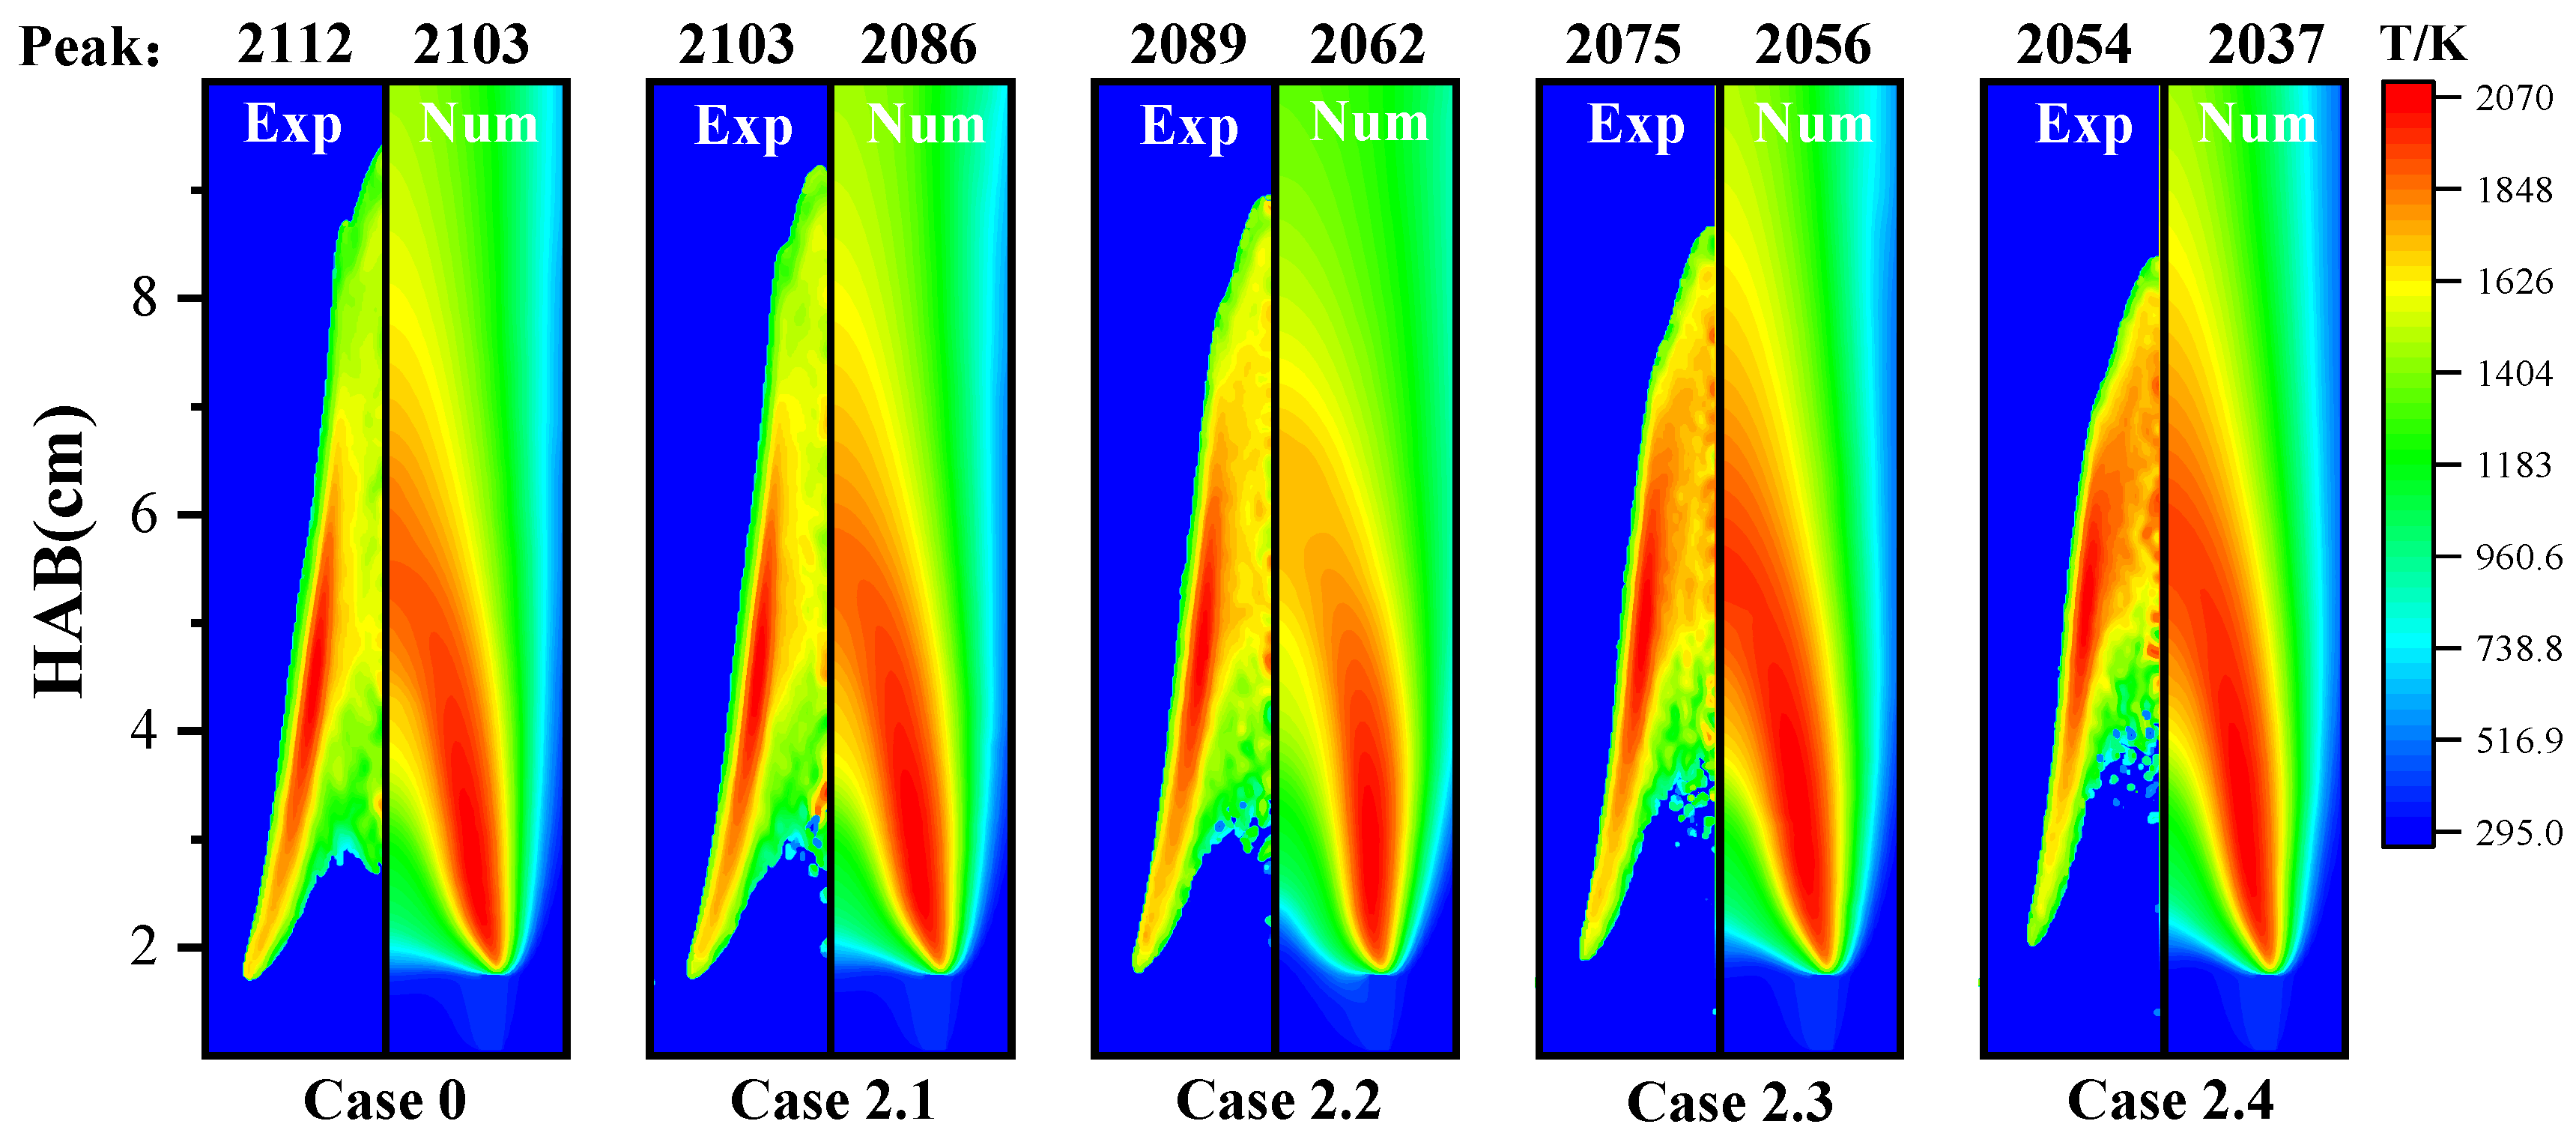
Figure 9 presents the experimental and simulated contour maps of flame temperature distributions under different CO2 dilution ratios. Similar to N2 dilution, as the CO2 dilution ratio increases, the high-temperature region of the flame gradually shifts toward the axial direction under the influence of buoyancy, accompanied by a progressive decrease in the peak temperature. The simulations reproduce this variation trend reasonably well. However, CO2 exhibits a stronger cooling effect than N2. Taking a dilution ratio of 35% as an example, the experimental results show that CO2 dilution reduces the peak temperature from 2112 K to 2054 K, corresponding to a decrease of 58 K, whereas N2 dilution lowers it only to 2082 K, with a reduction of 30 K. The simulation results show a similar tendency, with the temperature reduction induced by CO2 (68 K) being significantly greater than that by N2 (27 K). This difference is mainly attributed to the higher molar heat capacity of CO2 compared with N2, which enables it to absorb more heat released during combustion. In addition, CO2 participates in chemical reactions (e.g., CO2 + H CO + OH), introducing additional chemical heat effects. The combined influence of thermal and chemical effects makes CO2 more effective in reducing flame temperature than inert N2.
Figure 9.
Experimental and simulated flame temperature distributions at different CO2 dilution ratios.
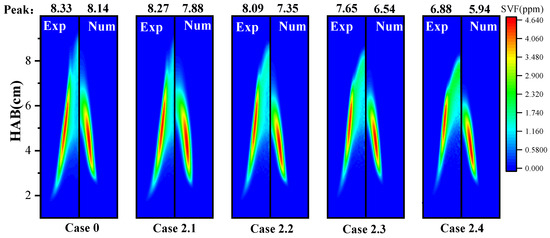
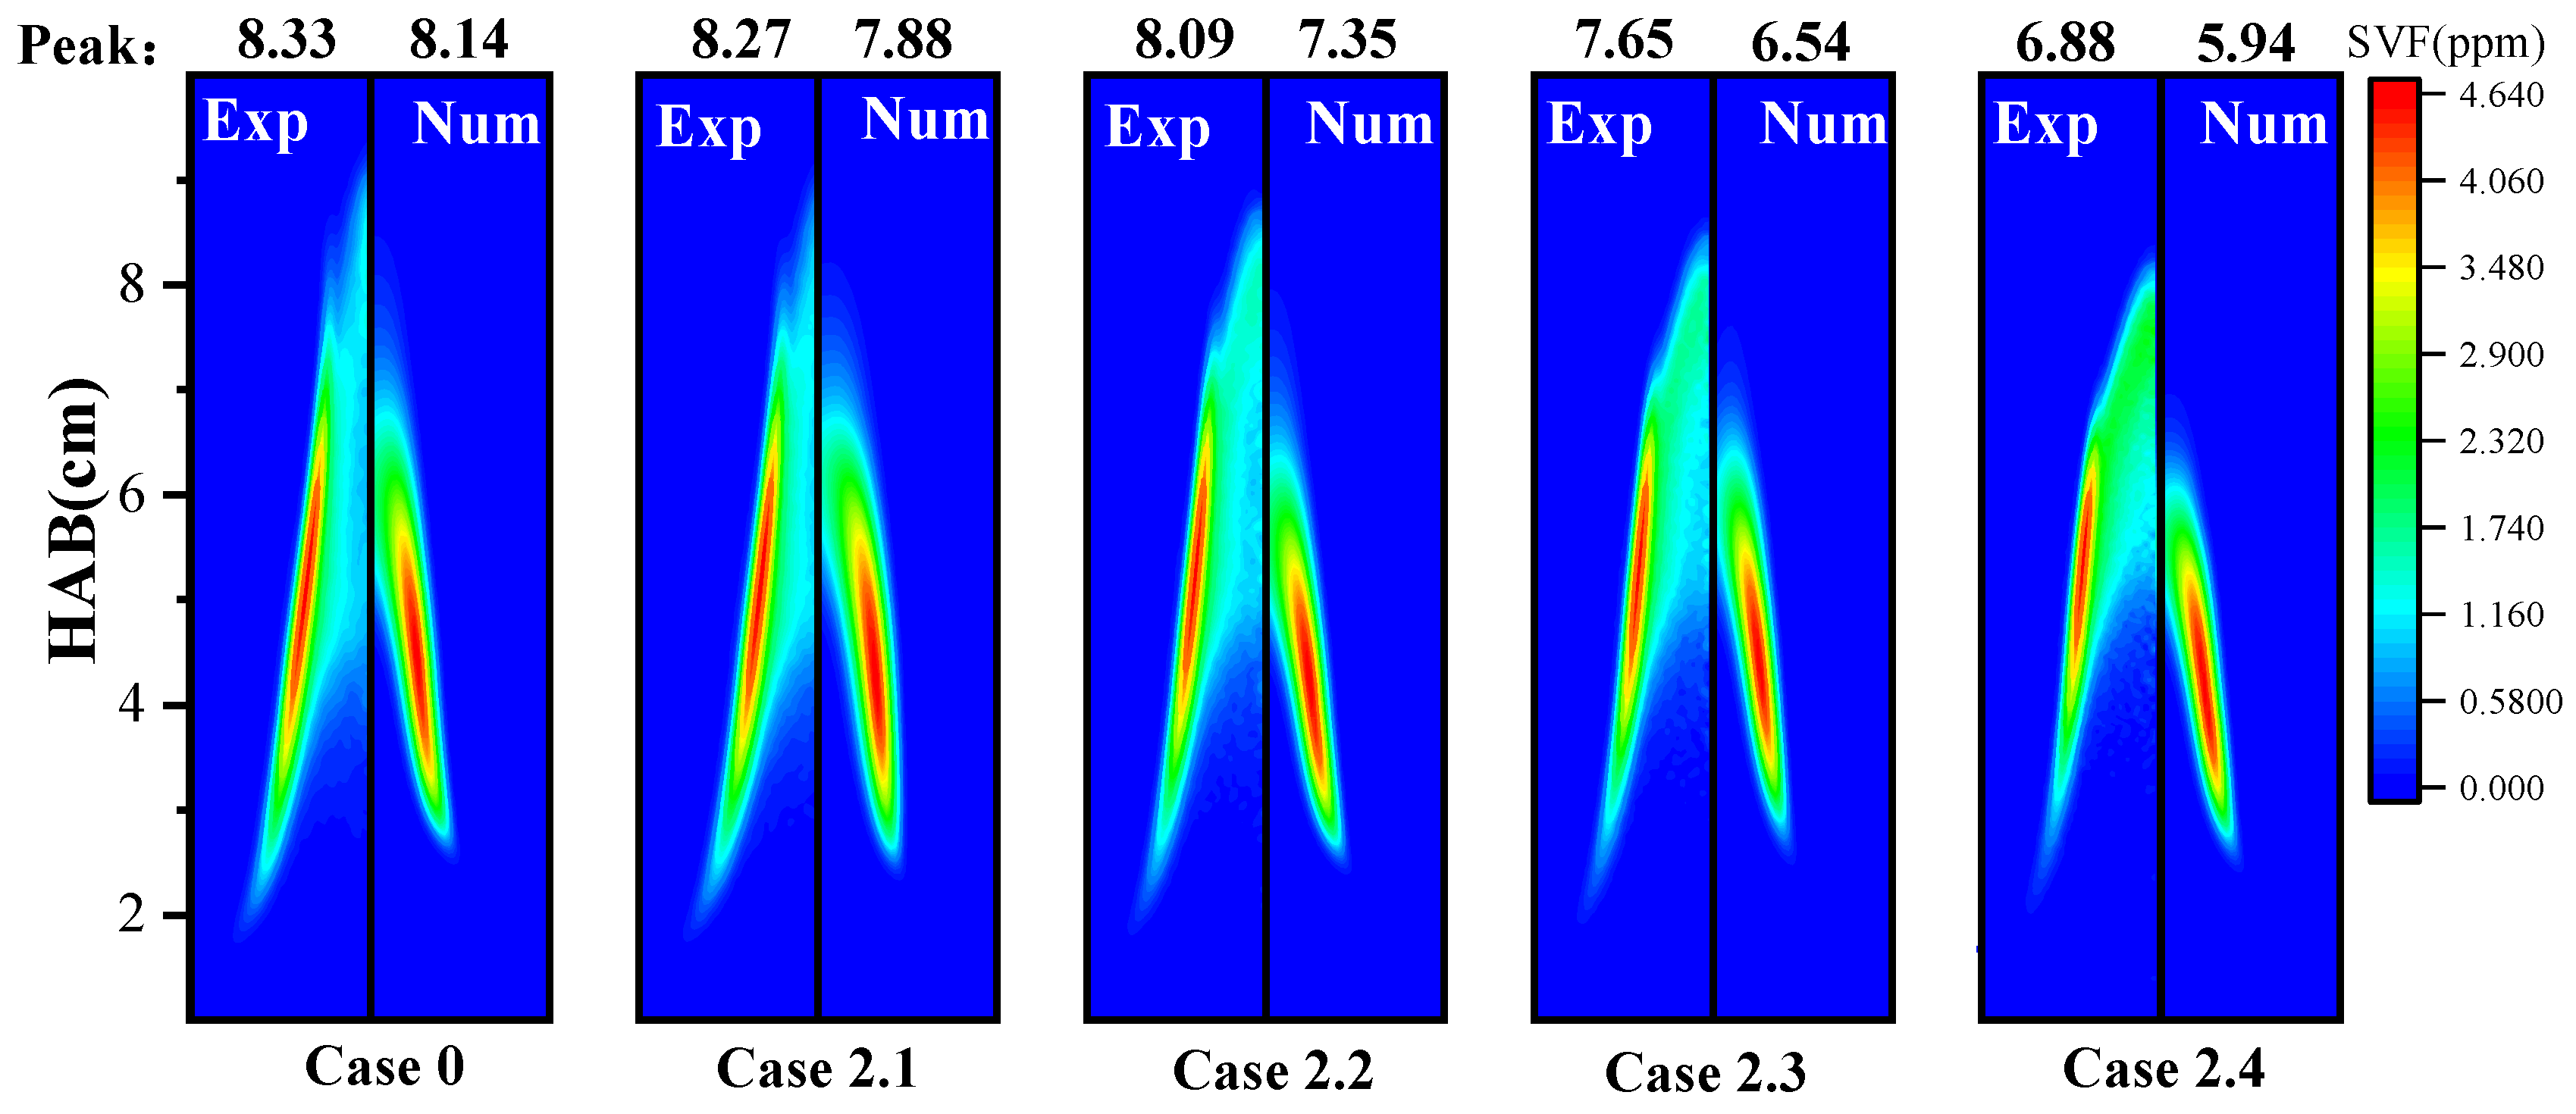
Figure 10 shows the experimental and simulated contour maps of soot volume fraction under different CO2 dilution ratios. By comparing the dilution effects of CO2 and N2 at the same dilution ratio, it can be observed that CO2 exhibits a stronger soot suppression capability. When the dilution ratio reaches 35%, the experimentally measured peak soot volume fraction under CO2 dilution decreases from 8.33 ppm to 6.88 ppm, corresponding to a reduction of 1.45 ppm, whereas N2 dilution results in a much smaller decrease of only 0.37 ppm. The simulation results show a consistent trend, indicating that the soot reduction induced by CO2 (2.20 ppm) is significantly greater than that by N2 (1.27 ppm). The fundamental reason lies in the dilution effect of CO2, which increases the relative concentration of OH radicals in the flame to some extent, thereby promoting the oxidative consumption of soot particles and further reducing the soot volume fraction. In contrast, N2, as an inert diluent, suppresses soot formation mainly through dilution, and its effect is relatively limited. Consequently, the overall inhibitory effect of CO2 on soot formation is markedly stronger than that of N2.
Figure 10.
Experimental and simulated soot volume fraction distributions at different CO2 dilution ratios.
Table 2 shows the soot peak differences between CO2 and N2 at different blending ratios. As can be seen from Table 2, CO2 dilution has a significantly stronger soot suppression effect compared to N2, and the difference in suppression gradually increases with the rise in dilution ratio. At a dilution ratio of 0.05, the soot peaks of CO2 and N2 are nearly identical. However, when the dilution ratio increases to 0.25 and 0.35, the experimental soot peak of CO2 decreases by 5.20% and 12.80%, respectively, compared to N2, while the simulated reduction is 8.79% and 10.27%, respectively. This indicates that under high dilution ratios, the suppression advantage of CO2 becomes more pronounced, mainly due to CO2’s combined dilution, thermal, and chemical effects on radical concentrations, which more effectively inhibit the nucleation and growth of soot.
Table 2.
Difference in soot volume fraction peak between CO2 and N2 dilution at the same blending ratio.
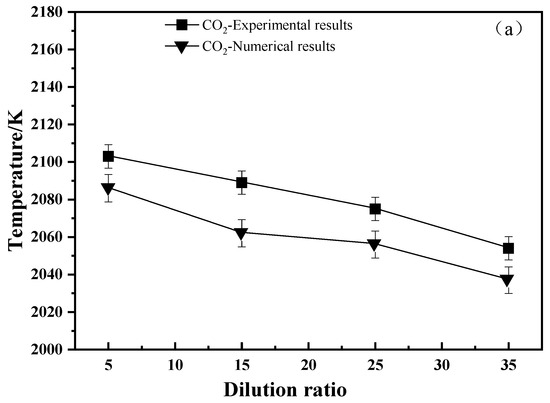
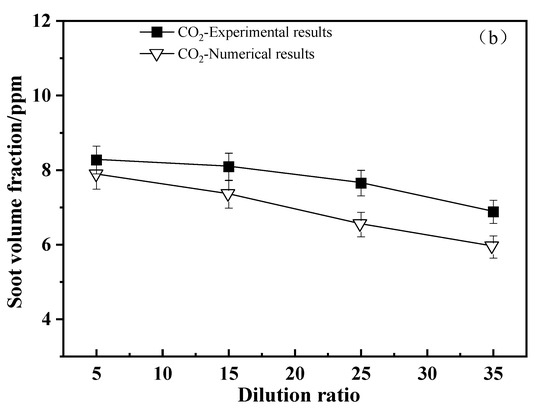
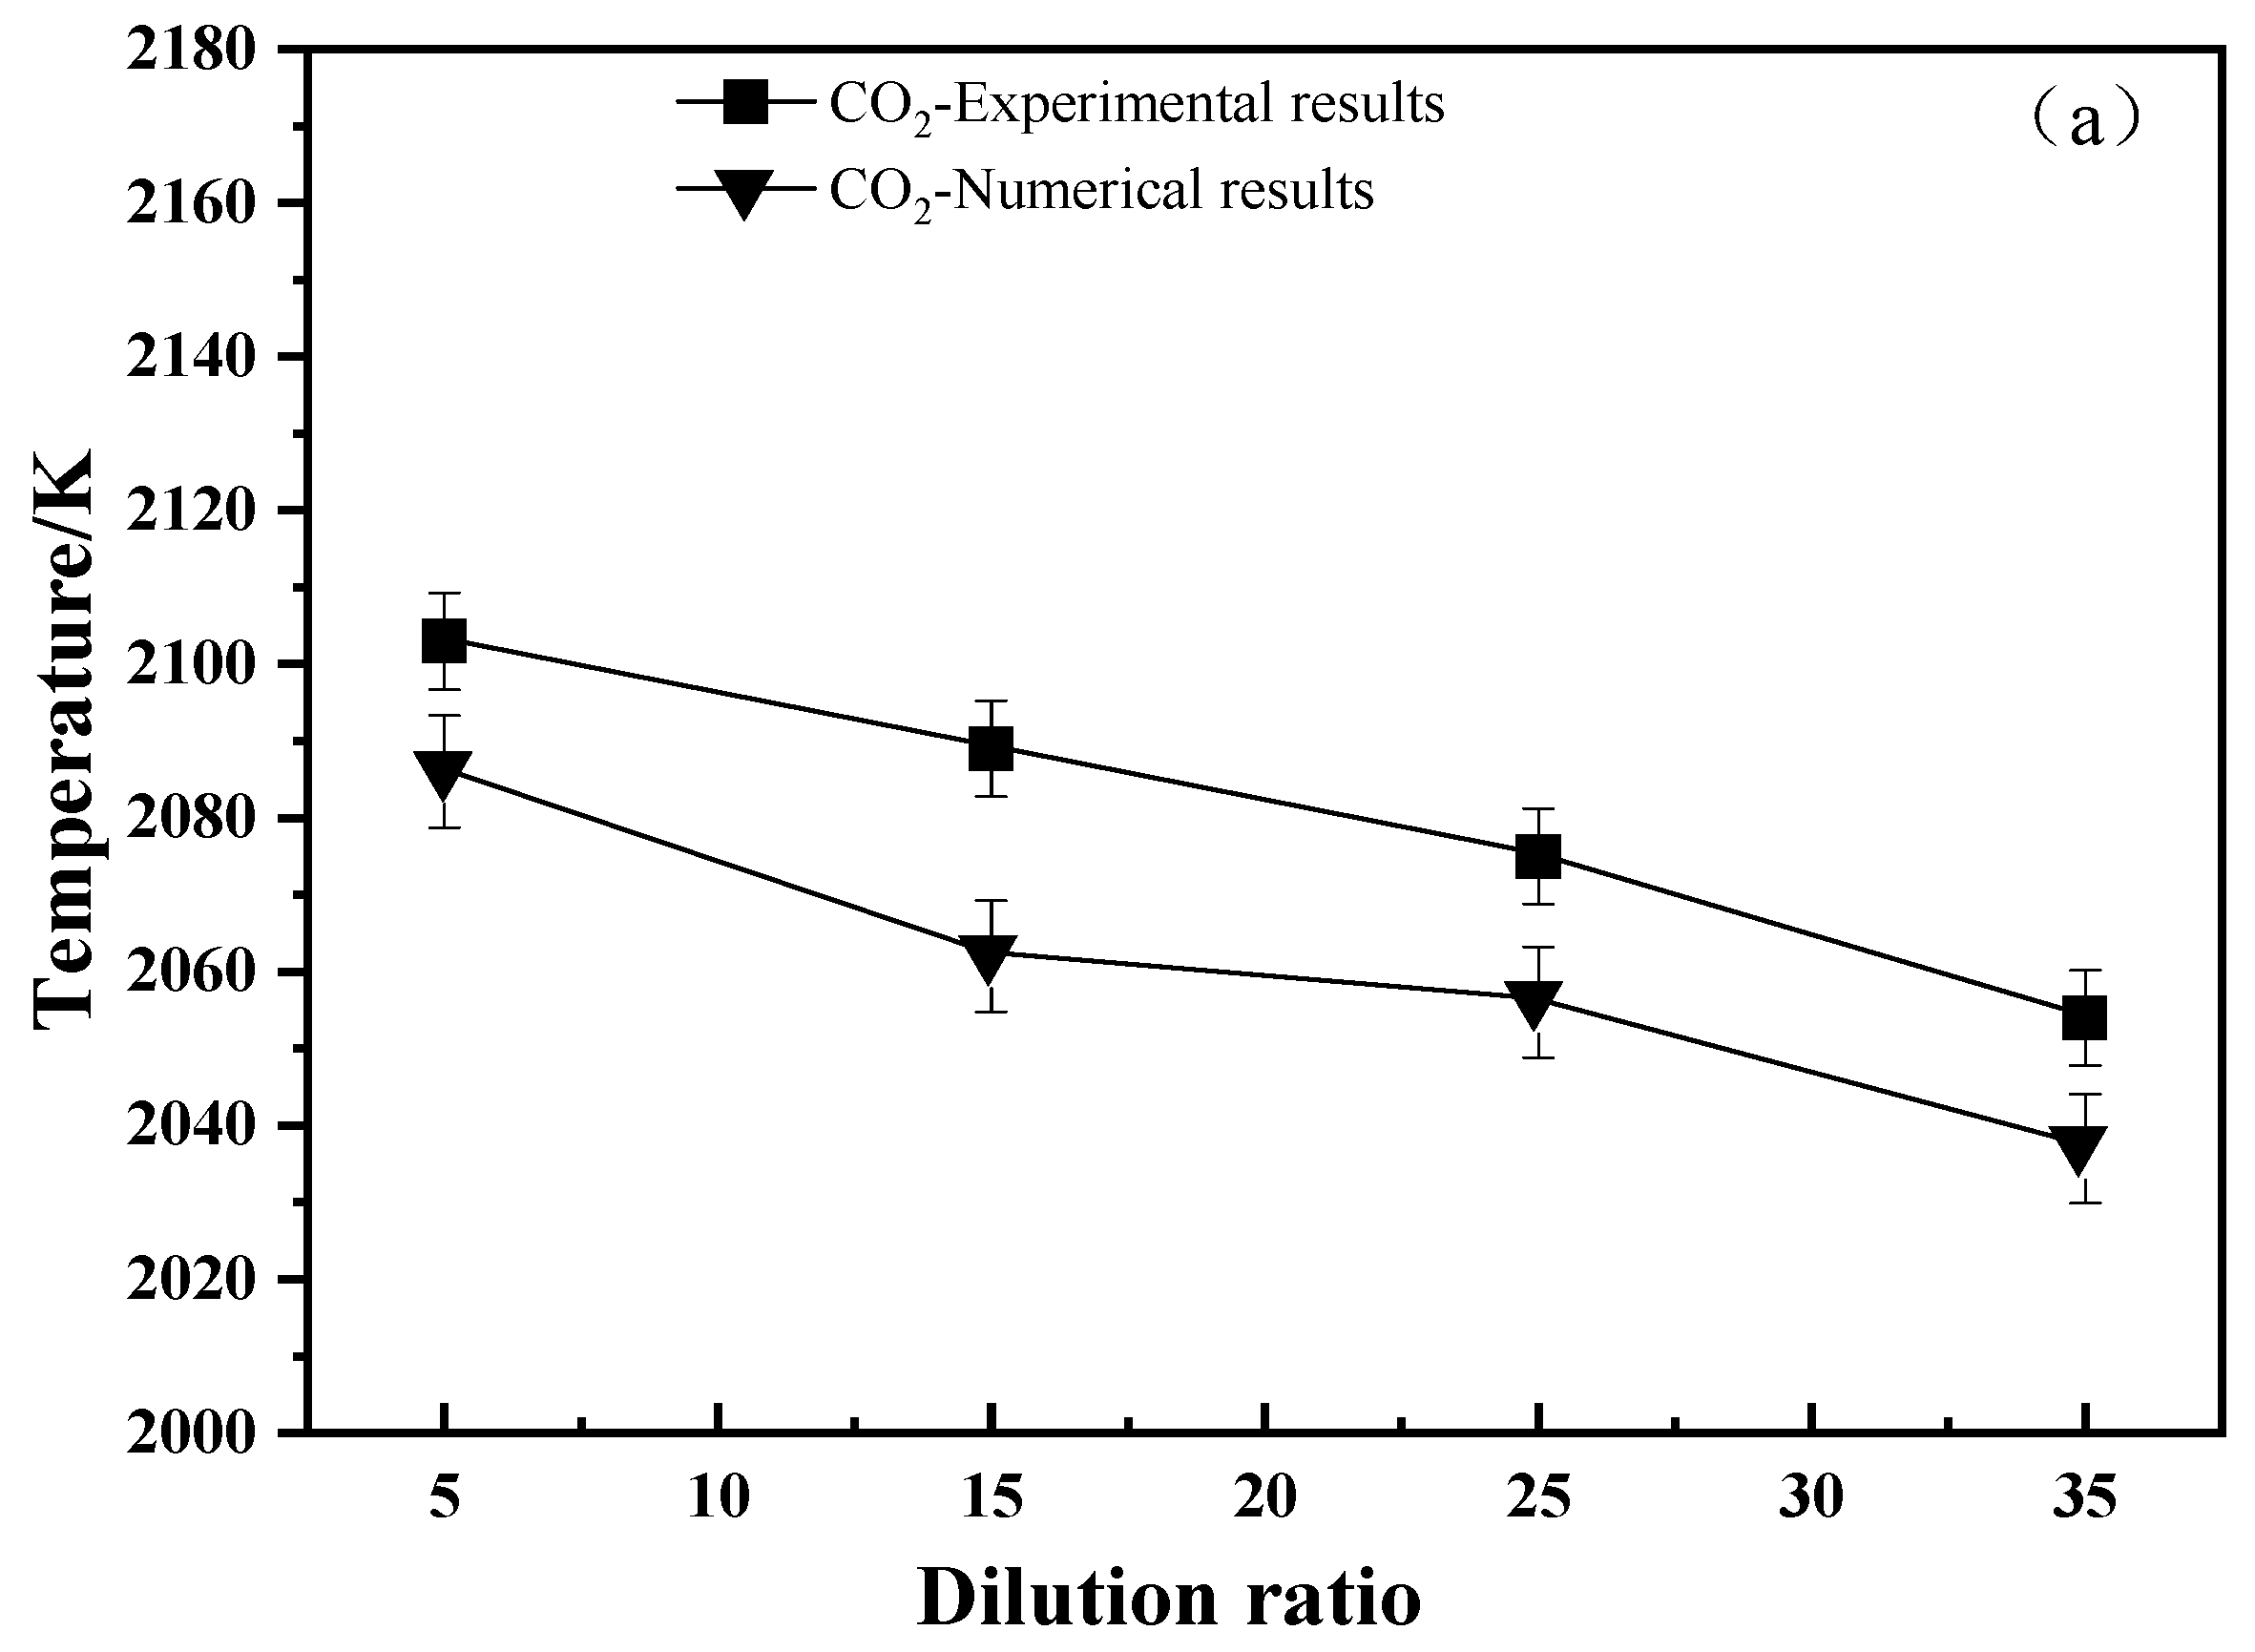
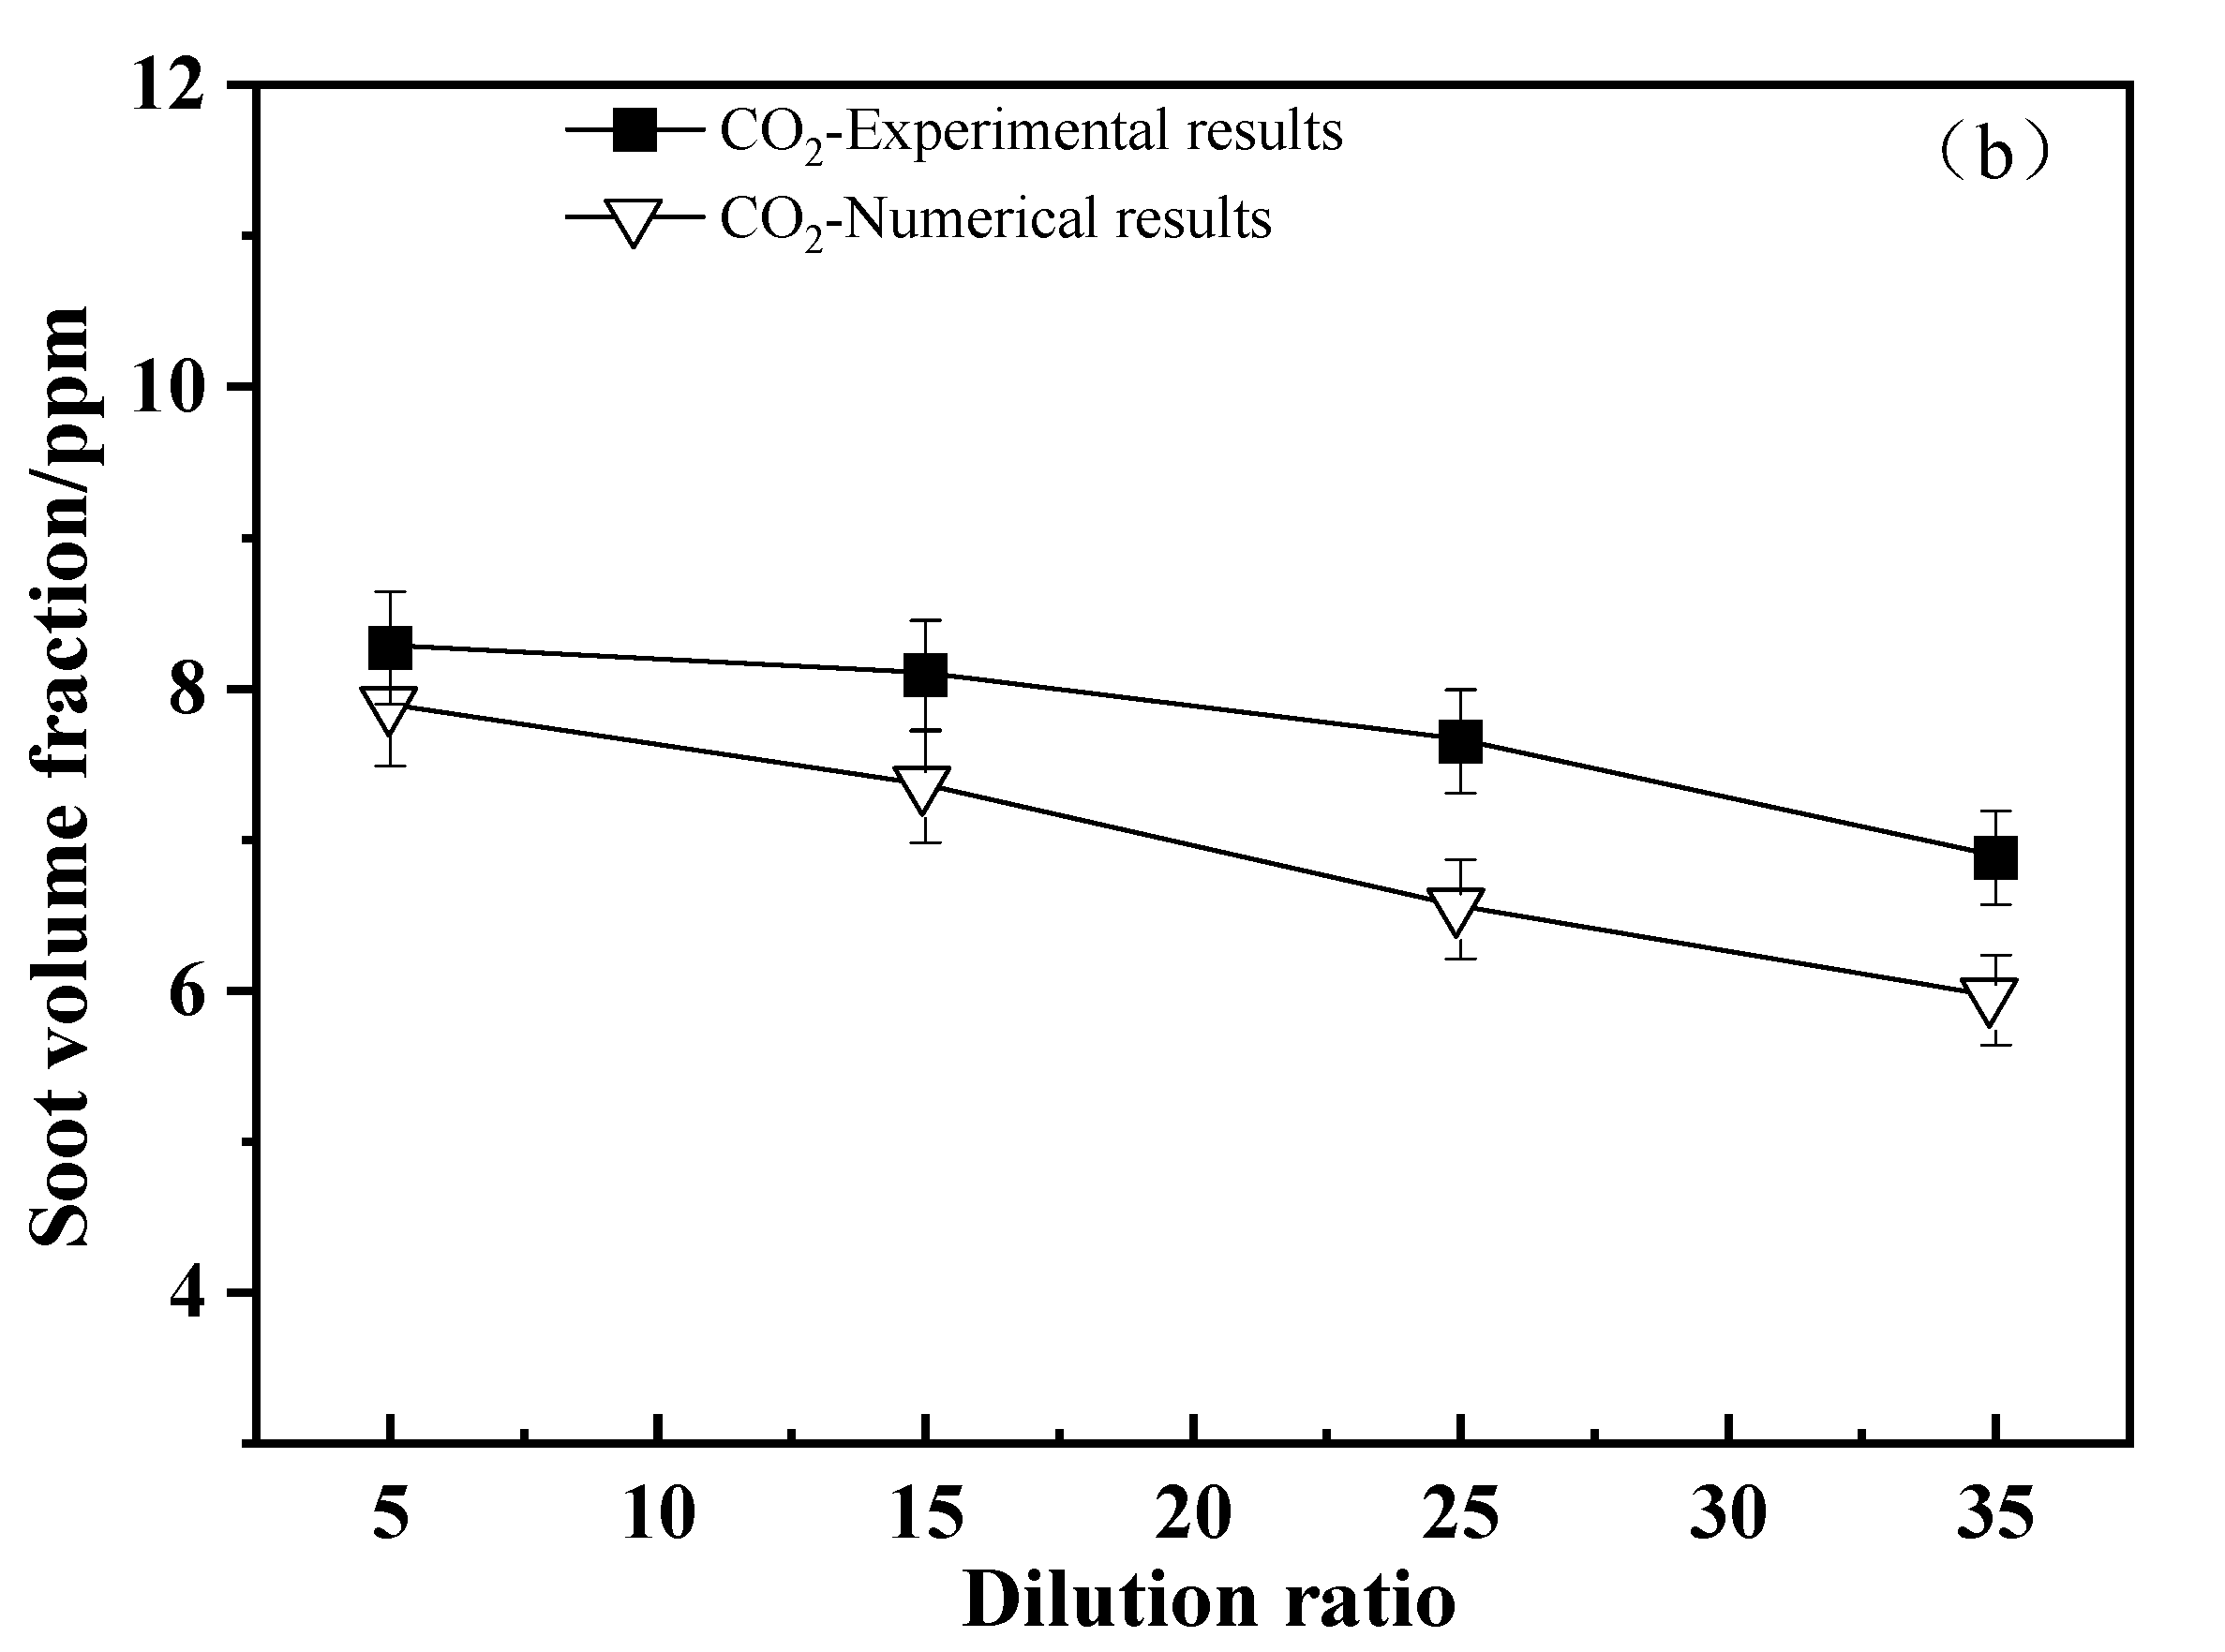
Figure 11 compares the peak temperature and soot volume fraction under different operating conditions between experimental measurements and numerical simulations. Both the experiments and simulations indicate that the trends of peak temperature and soot volume fraction are consistent across different CO2 dilution ratios. However, the simulated peak temperatures are lower than the experimental measurements. This discrepancy can primarily be attributed to the fact that the experimental flame temperatures are inferred from radiative signals emitted by soot particles, whereas the numerical simulations provide the local gas-phase temperature. Regarding the soot volume fraction, differences are observed between the simulated and experimental values. These discrepancies can be attributed to the current soot model, which has not been fully validated under these specific combustion conditions (diluted fuel mixed with nonpremixed oxygen) and thus has limited applicability. In addition, the model does not accurately capture the spatial variations in the chemical pathways of soot formation within the flame, which reduces its ability to predict the actual soot distribution and peak concentrations.
Figure 11.
Comparison chart of peak temperature and soot volume fraction under experimental and simulation conditions. (a) Temperature; (b) Soot volume fraction.
When the CO2 dilution ratio increases from 0% to 35%, both experimental measurements and numerical simulations indicate a pronounced decrease in the peak flame temperature and peak soot concentration, with the two showing a high degree of consistency in their variation trends.
Under CO2 dilution conditions, the experimentally measured peak temperature decreases from 2112 K to 2054 K, and the peak soot volume fraction decreases from 8.33 ppm to 6.88 ppm. The numerical simulations exhibit the same trend, with the peak temperature decreasing from 2105 K to 2037 K and the peak soot volume fraction from 8.14 ppm to 5.94 ppm. These results demonstrate that the numerical model effectively captures the overall variation trends of key parameters under different operating conditions, although it underestimates the peak values. The primary reasons for these discrepancies can be summarized as follows. First, in the simulations, the nozzle is modeled as an isothermal wall at 400 K to approximate the more complex fuel preheating process present in the experiments. This simplification leads to lower initial temperatures and energy conditions for the reactants in the simulations compared to the actual conditions [23]. Second, the simulations employ a simplified chemical reaction mechanism and soot formation model, which do not fully account for the detailed chemical reaction pathways occurring in practical combustion, thereby limiting the accuracy in predicting peak values.
4.2. The Impact of Various Effects on Soot Generation Under CO2 Decoupling
4.2.1. The Impact of Various Effects on Temperature Under CO2 Decoupling
To further investigate the influences of CO2 dilution on flame morphology and soot formation, five operating conditions (Case 3.1 to Case 3.4) were defined, as listed in Table 3. Based on the decoupling method described in Section 2.3, density, transport, thermal, and chemical effects of CO2 on soot formation were analyzed. N2 was treated as a chemically inert gas, meaning it does not participate in any combustion reactions. As summarized in Table 3. In Case 3.2, the virtual species F1CO2 shares the same thermal and transport properties as N2 (Case 3.1) and does not participate in any chemical reactions. However, its elemental composition is identical to that of CO2. Since the molar mass of CO2 is higher than that of N2, the oxidizer mixture in this case has a higher density than that under the reference condition. It should be noted that NOx formation is neglected in this work. Therefore, any differences between the results of Case 3.2 and Case 3.1 can be attributed to the density effect of CO2. In Case 3.3, the virtual species F2CO2 retains the thermal properties of N2 and remains chemically inert, but its transport properties and elemental composition are consistent with those of CO2. Thus, the differences between the outcomes of Case 3.2 and Case 3.3 reflect the transport effect of CO2. In Case 3.4, the virtual species F3CO2 possesses the same thermal properties, transport properties, and elemental composition as real CO2, while still being chemically non-reactive. Accordingly, the discrepancies between Case 3.3 and Case 3.4 results are ascribed to the thermal effect of CO2. Finally, in Case 3.5, real CO2 is used. By comparing Case 3.4 and Case 3.5, the contribution of the chemical effect of CO2 can be isolated and evaluated. Selected physical properties of N2 and CO2 are presented in Table 4.
Table 3.
Setting of working conditions for separating various effects of CO2.
Table 4.
Physicochemical properties of N2 and CO2 at 1200 K, 0.1 Mpa.
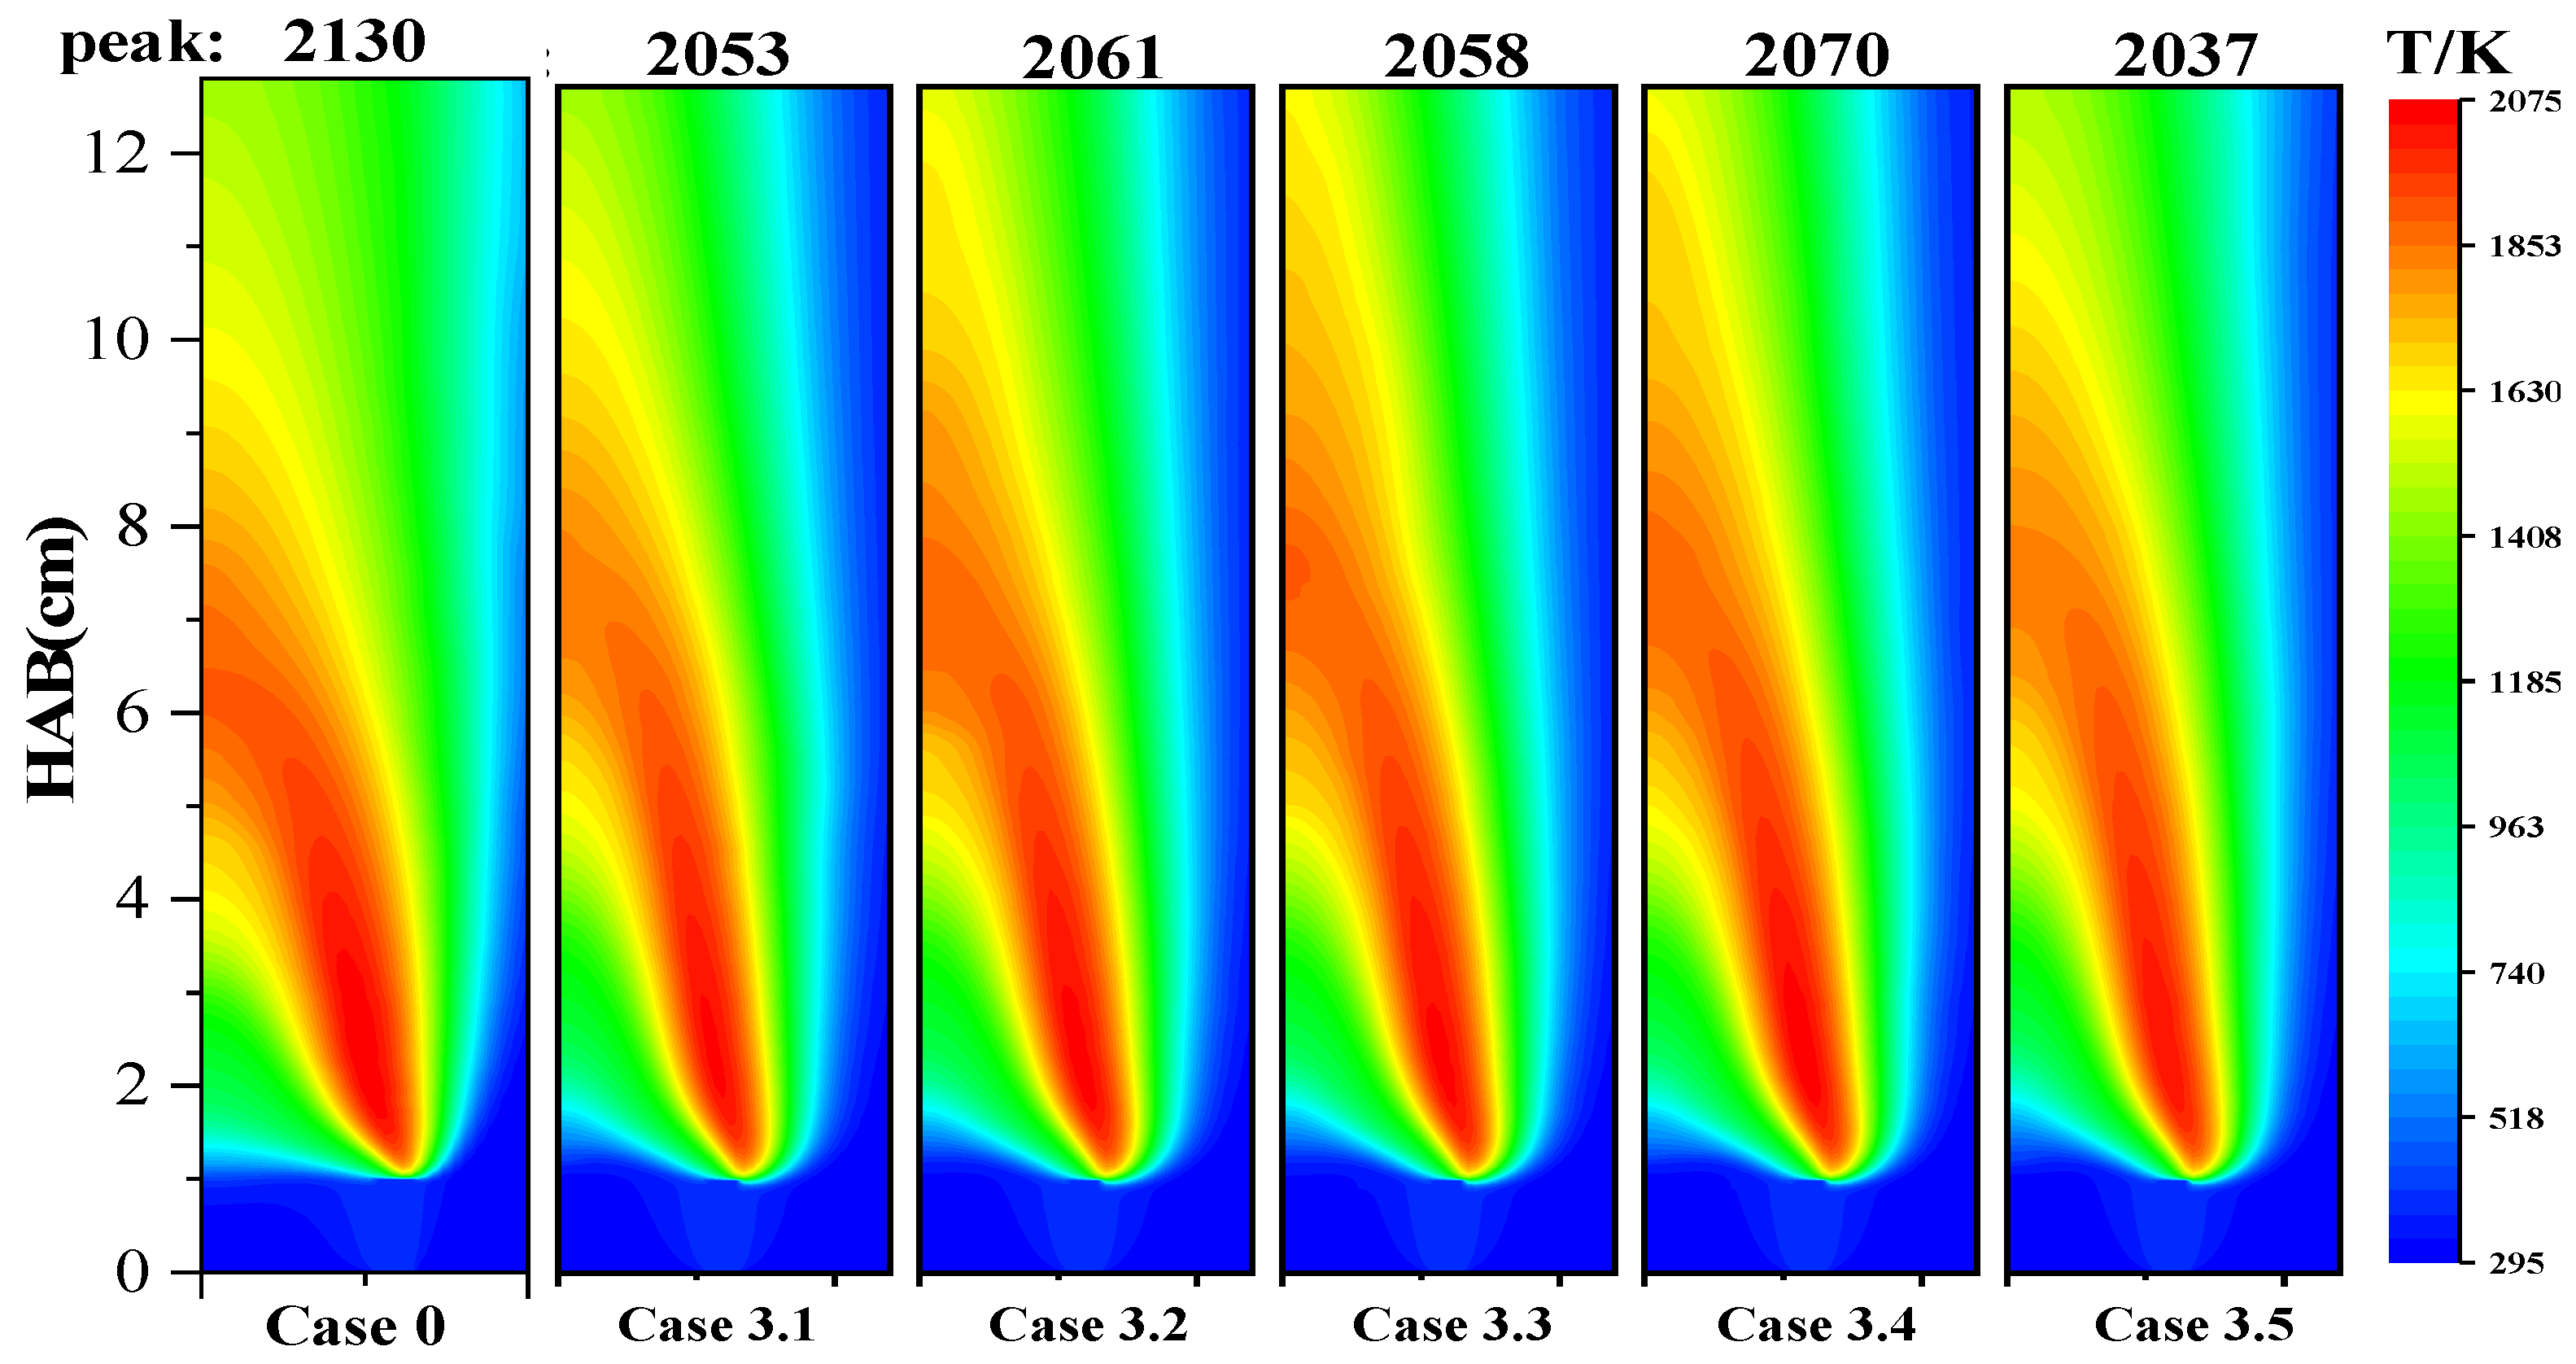
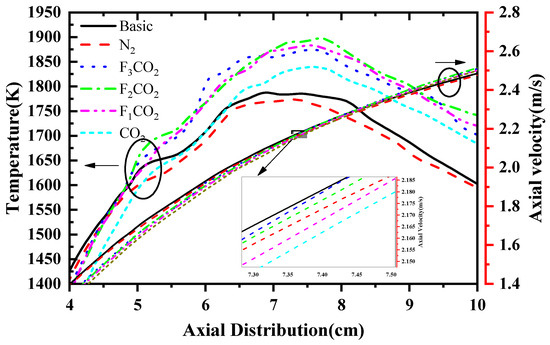
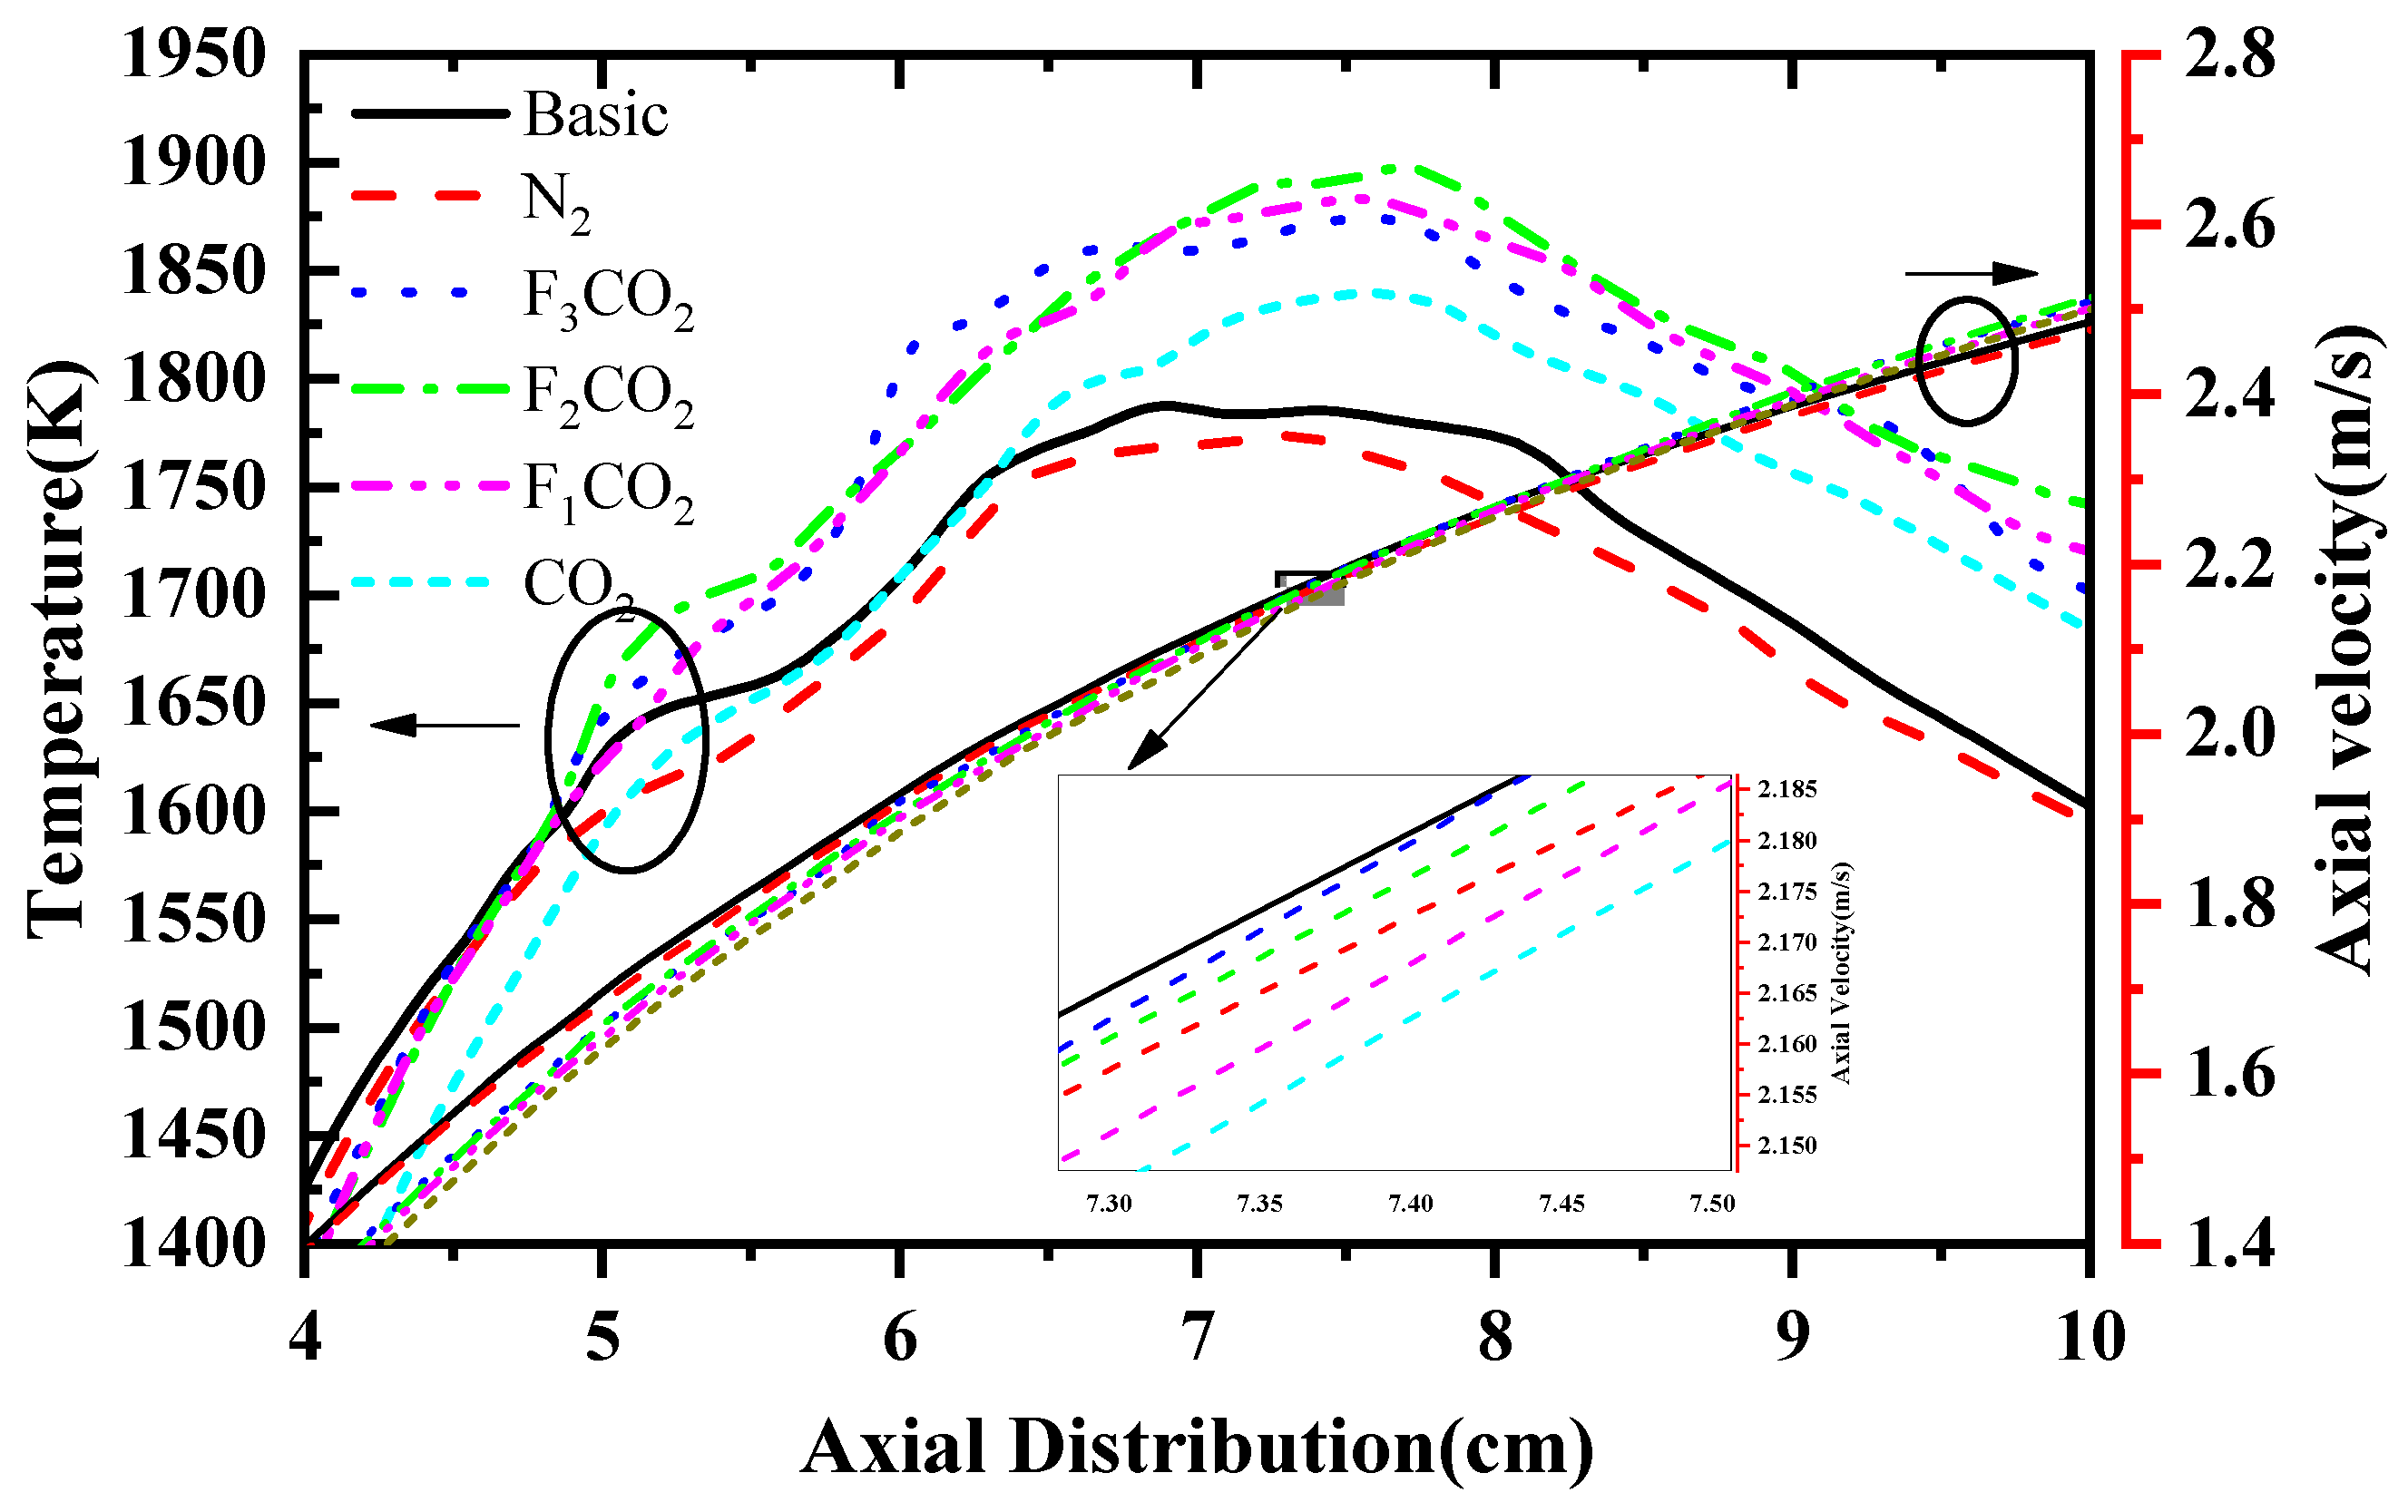
Flame temperature is an important indicator of the intensity of combustion reactions and the level of energy release in the flame. To further investigate the influence of different effects on flame temperature, Figure 12 presents the temperature contours of the flame under each decoupled effect. Figure 13 shows the distributions of temperature and axial velocity along the flame centerline. As shown in Figure 13, the high-temperature regions of the flame are primarily located at the lower parts of the two lateral wings. Among all the effects, the dilution effect has the most significant impact on flame temperature, substantially reducing the peak flame temperature and serving as the dominant mechanism for the observed temperature decrease. The chemical effect also exerts a certain inhibitory influence on flame temperature, but its impact is much smaller than that of the dilution effect. The other effects have minimal influence on flame temperature and can be considered negligible in practical analysis.
Figure 12.
Temperature distribution under FxCO2 dilution.
Figure 13.
Flame center axial temperature and axial velocity distribution.
A comparison of Figure 13 indicates that, under the influence of the density effect, the temperature along the centerline region increases noticeably, with a maximum rise of 105 K. Since CO2 has a higher molar mass than N2, it significantly increases the overall density of the fuel mixture, causing the high-temperature zone to appear at an upstream position. The chemical effect is the next most influential factor. Owing to CO2’s high specific heat capacity and relatively large diffusion coefficient, the local heat transfer is enhanced, and the distribution of kinetic energy at the outlet of the flow field is altered, resulting in a decrease in peak flame temperature and a reduction in axial velocity. These two effects exert the most pronounced influence on flame temperature. The transport effect contributes to an increase in the flame peak temperature, whereas the dilution effect and thermal effect have relatively minor impacts on flame temperature.
4.2.2. The Impact of Various Effects on Soot Under CO2 Decoupling
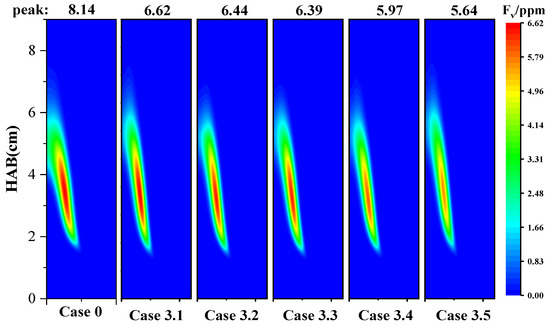
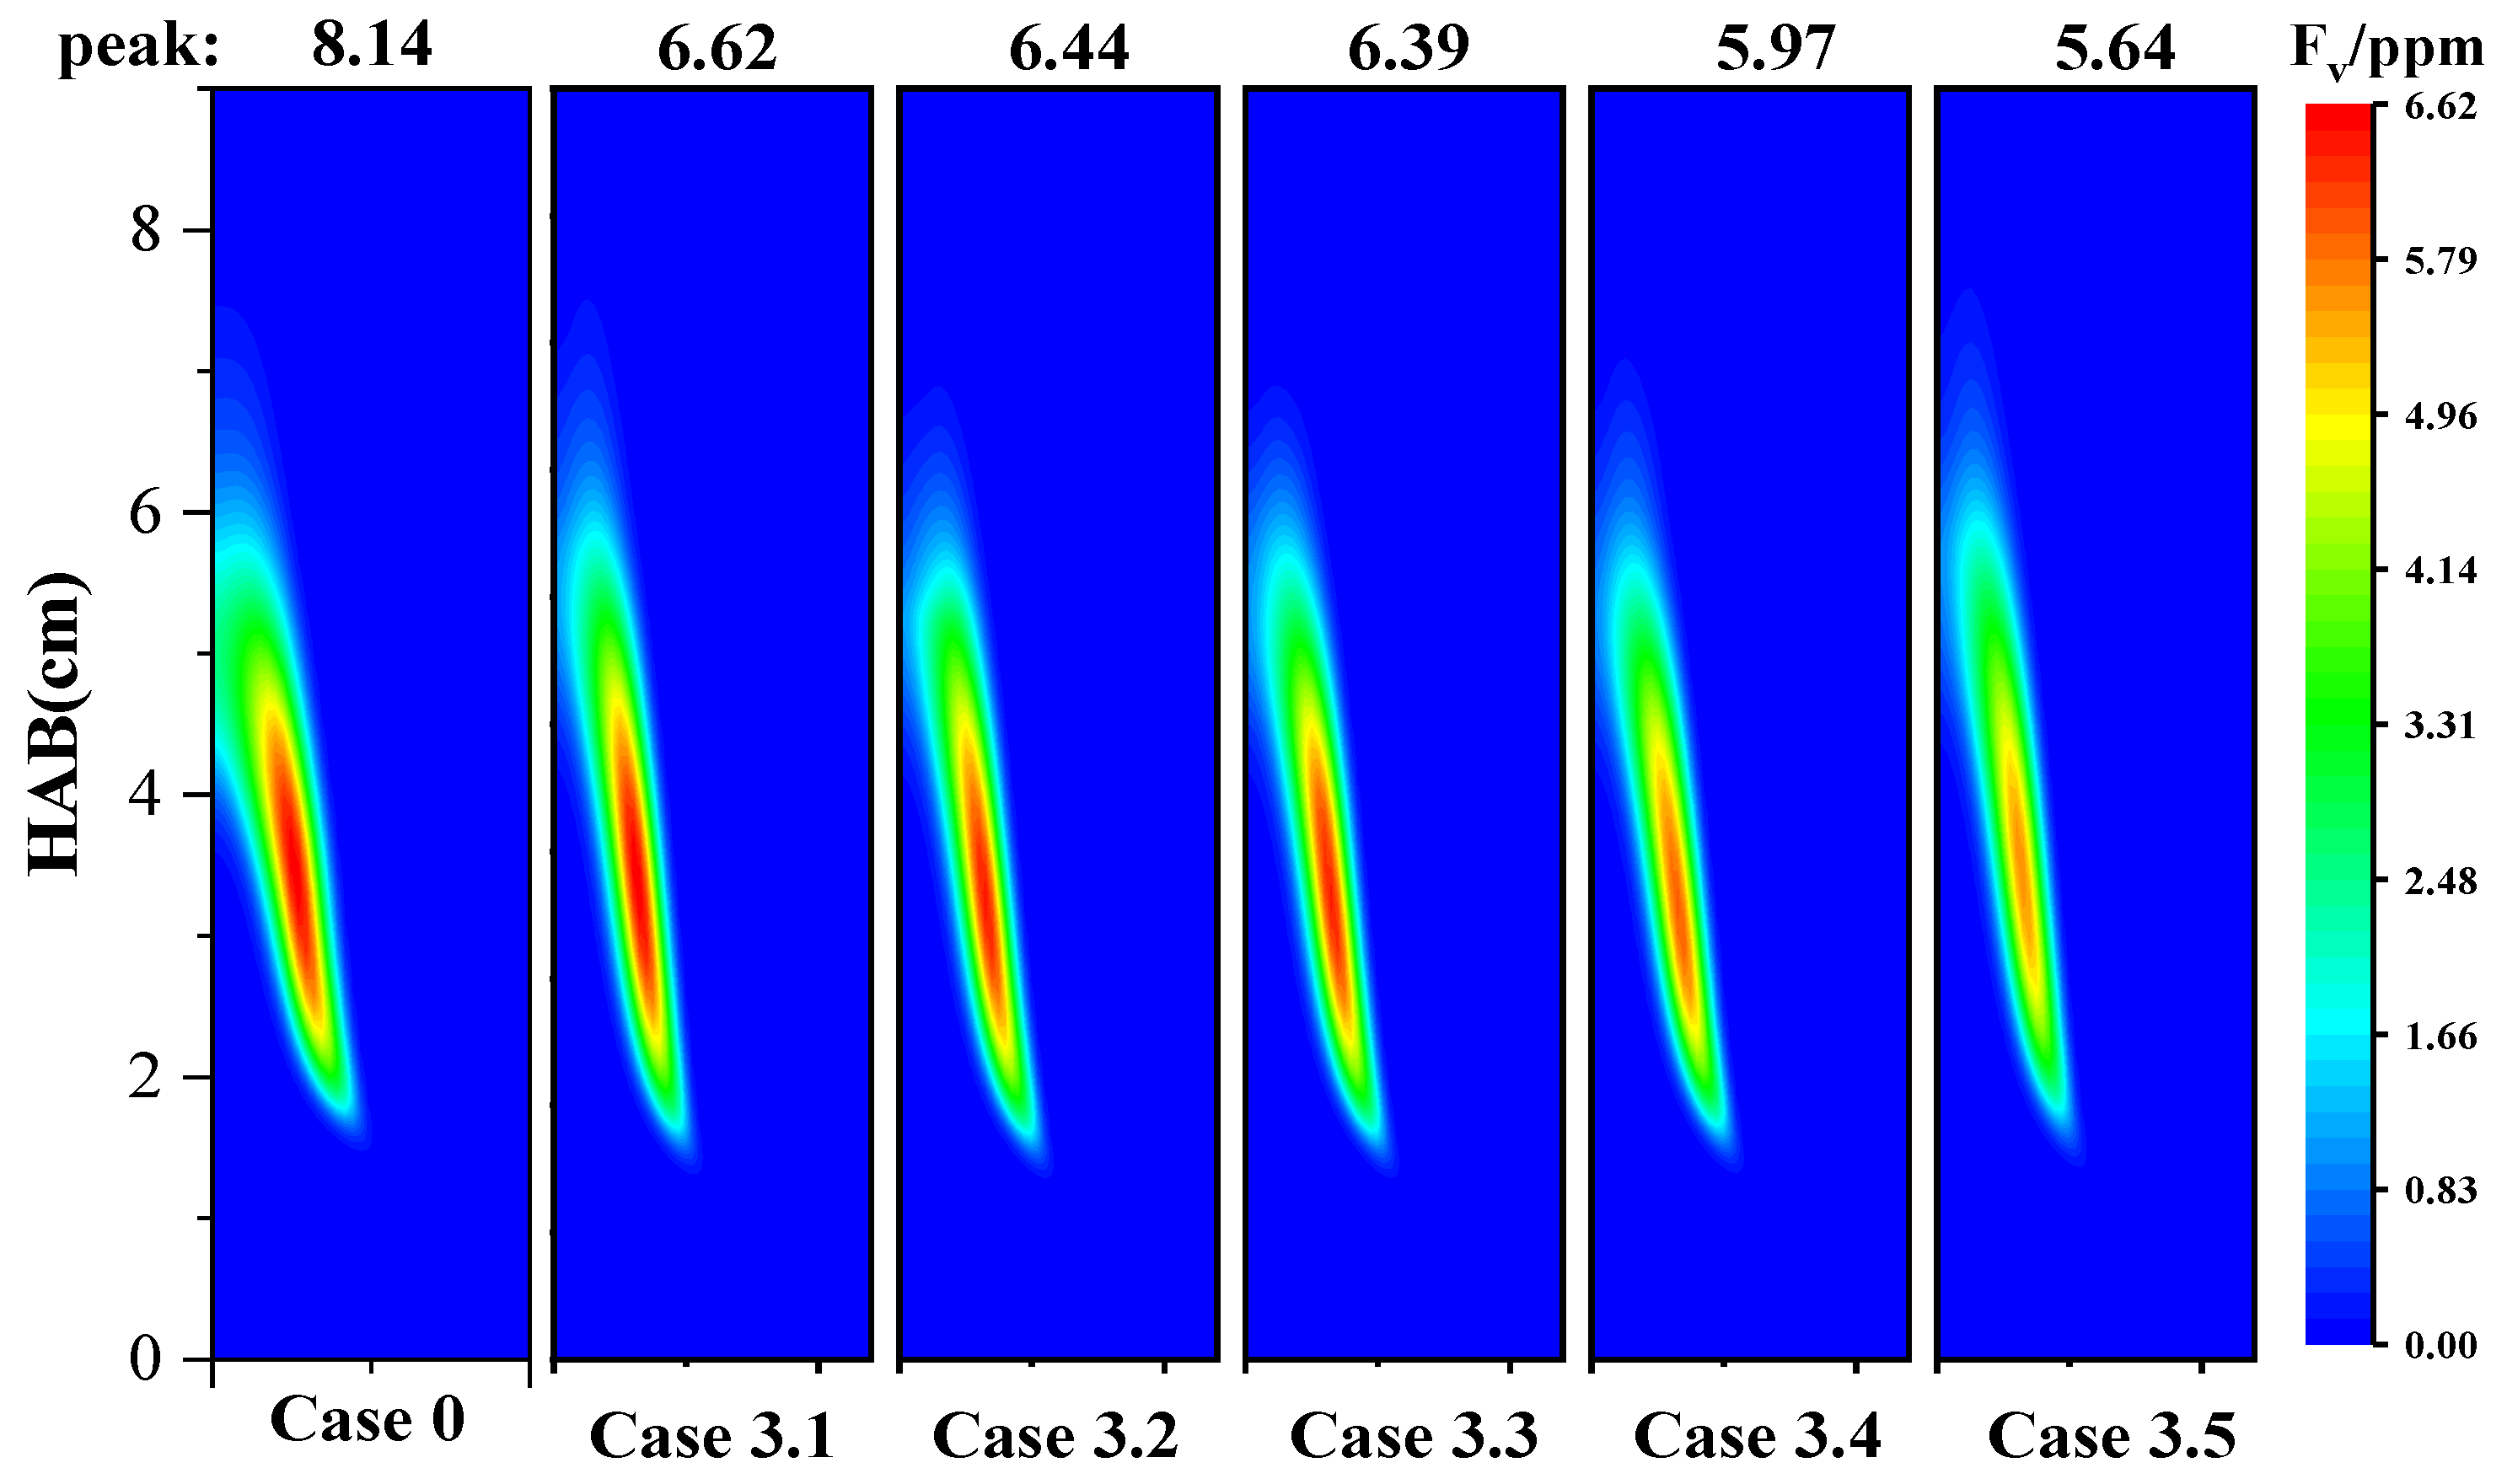
Figure 14 presents the soot volume fraction (SVF) distribution under FxCO2 dilution. The data indicate that the dilution effect of CO2 is the most prominent factor in suppressing soot, with a maximum reduction of 1.52 ppm, and its influence is more significant than that of the thermal and chemical effects. The chemical effect of CO2 primarily involves its participation in the key elementary reaction CO + OH CO2 + H, which indirectly affects the soot formation process. The specific mechanism remains a topic of debate in the literature: one view suggests that the addition of CO2 increases the concentration of OH radicals, thereby enhancing the oxidation of soot particles; another view proposes that this reaction pathway reduces the H radical concentration, thereby inhibiting soot formation [31]. In contrast, the density effect and transport effect have minimal impact on soot concentration and can be considered negligible in practical analysis.
Figure 14.
Soot volume fraction distribution under FxCO2 dilution.
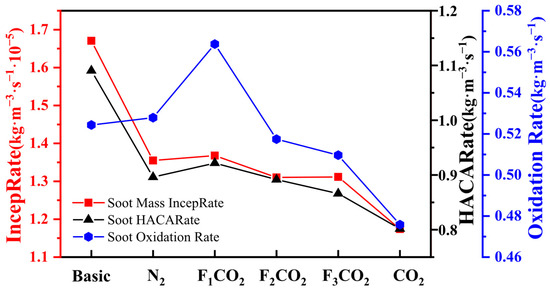
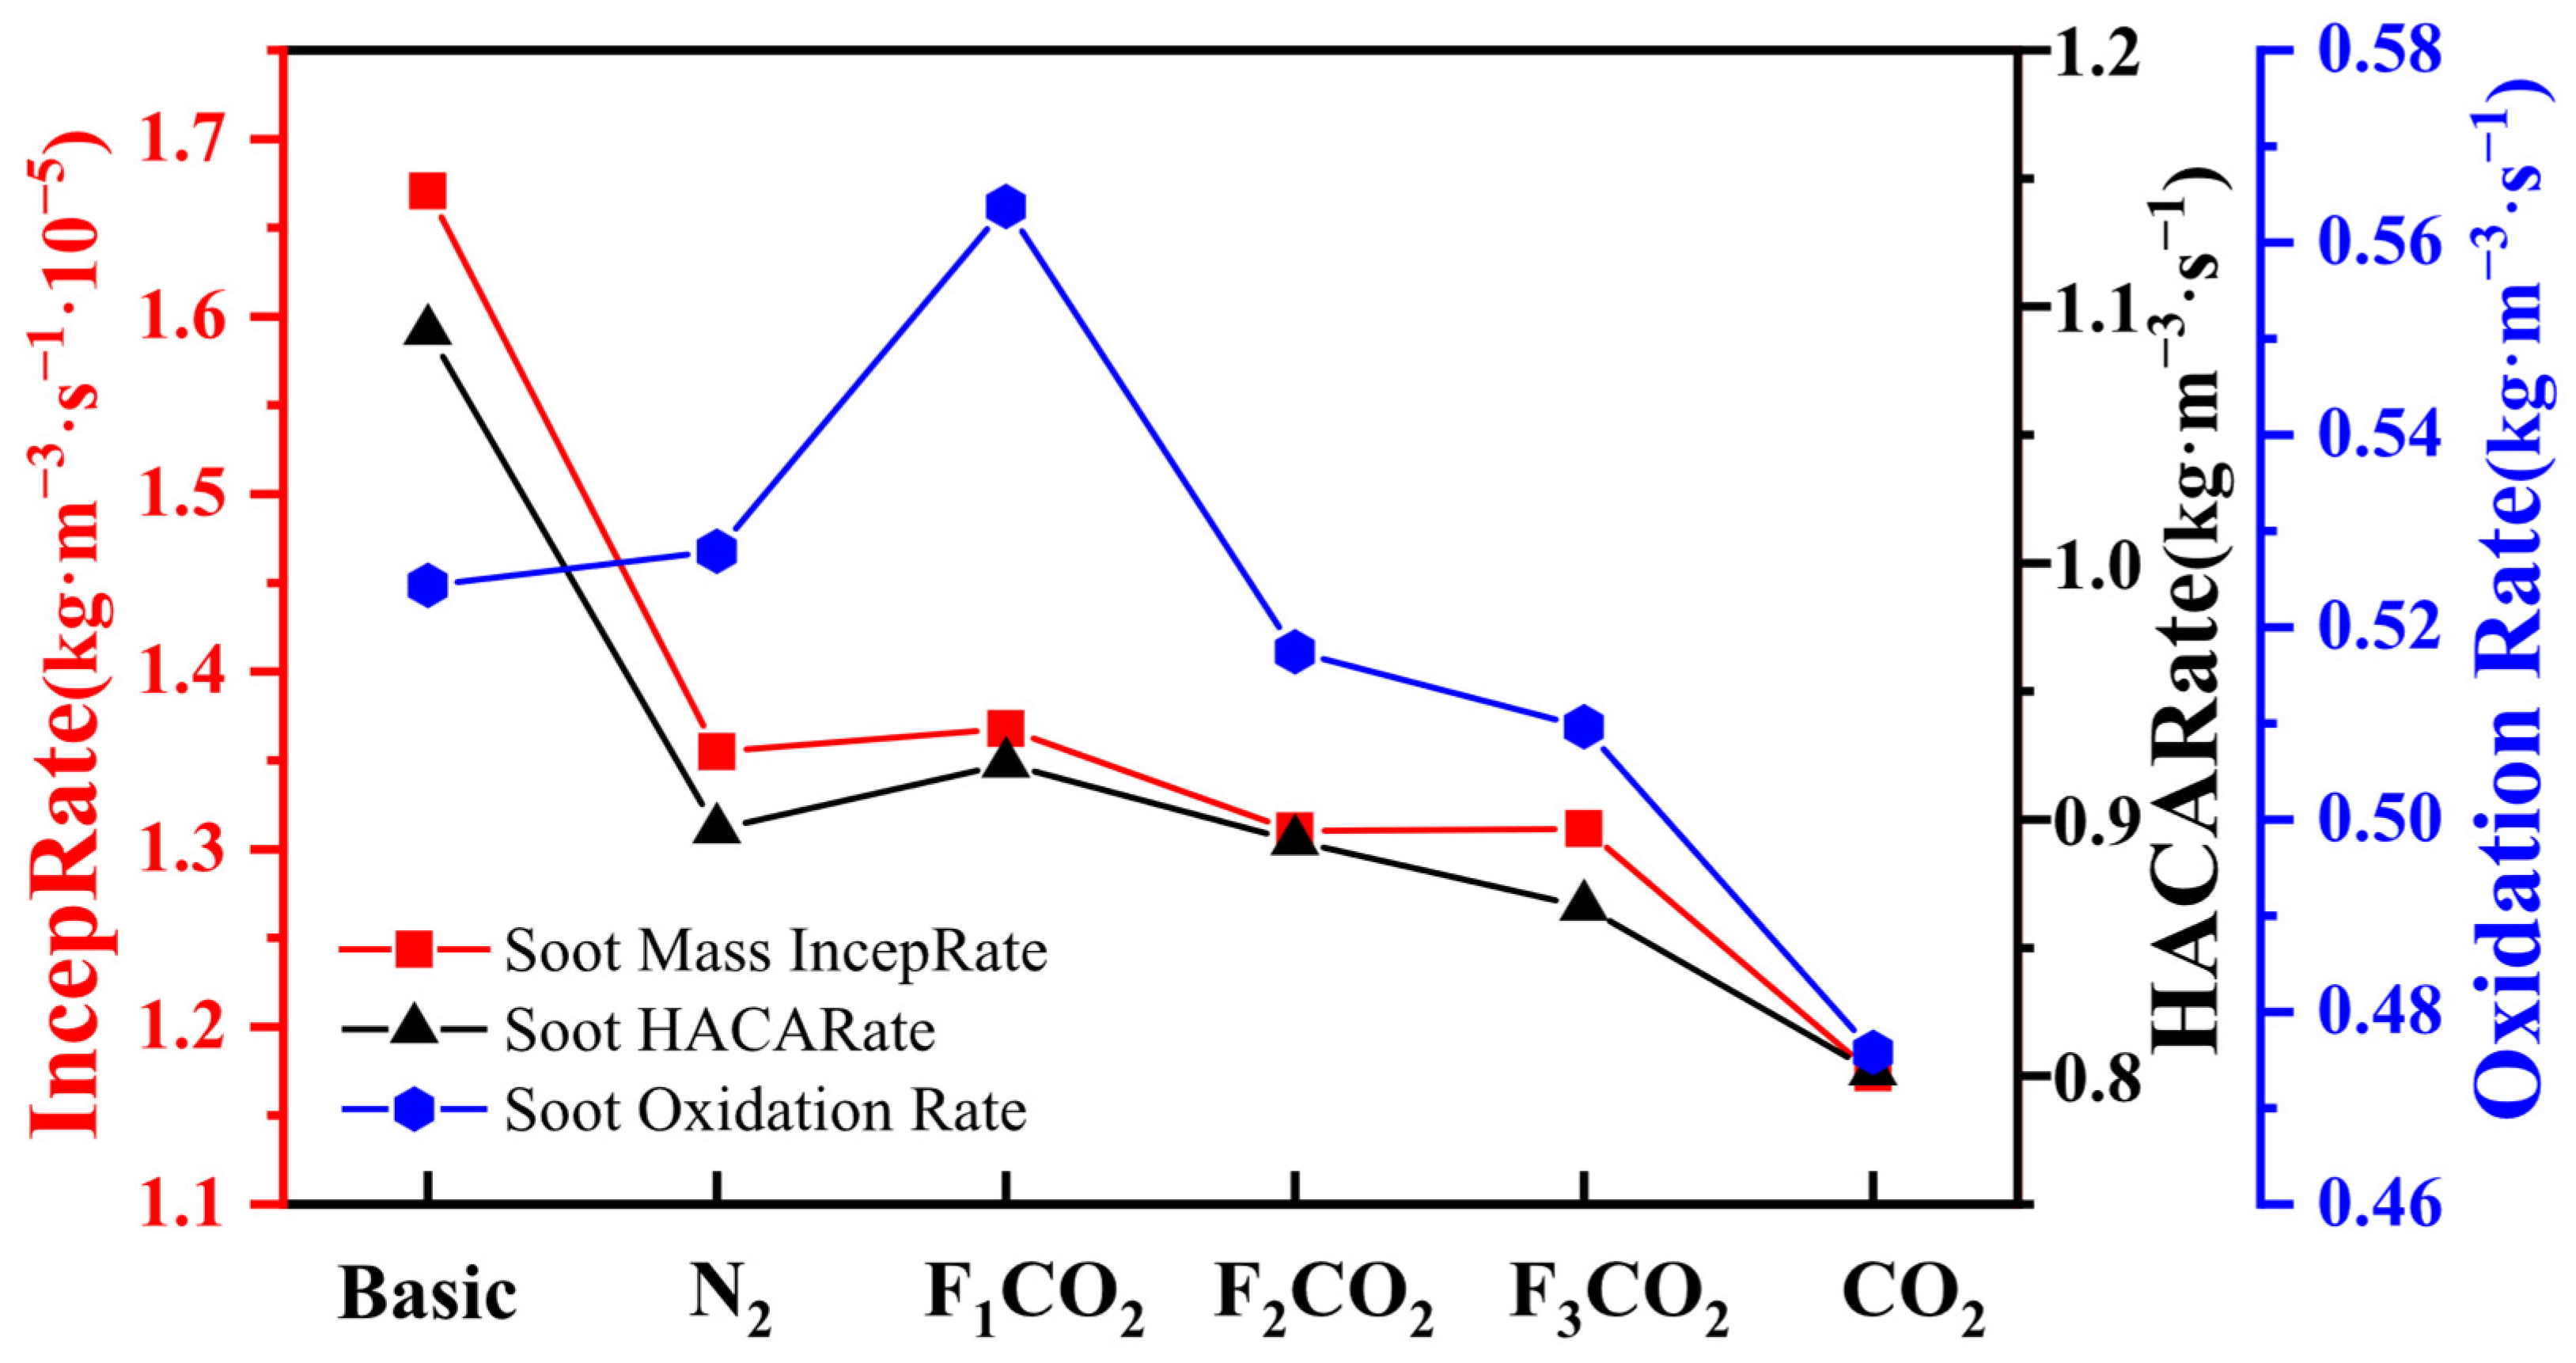
Figure 15 shows the peak rates of soot formation under CO2 dilution decoupling conditions. In Figure 15, Mass IncepRate represents the contribution of the soot nucleation process to mass generation, i.e., the rate at which gas-phase precursors are converted into incipient soot particles. HACARate denotes the soot surface growth rate based on the HACA (hydrogen-abstraction-acetylene-addition) mechanism, which is the dominant reaction pathway responsible for soot mass growth. By comparing the nucleation rate and surface growth rate under different effects, the regulatory mechanisms of each effect on the soot formation process can be more clearly revealed. The results indicate that, compared with the baseline Case 0, the dilution effect is the dominant factor responsible for the reduction in soot volume fraction, significantly inhibiting both soot nucleation and surface growth. The density effect enhances the rates of soot nucleation and surface growth, but its most pronounced influence is the increase in soot oxidation rate from 1.45 × 10⁻⁵ kg/m3·s to 1.68 × 10⁻⁵ kg/m3·s, thereby promoting soot consumption. The transport and thermal effects have minimal influence on soot nucleation and surface growth and can be considered negligible. However, the transport effect notably reduces the oxidation rate, partially diminishing soot consumption. The chemical effect exerts a comprehensive inhibitory influence on soot formation, suppressing nucleation, surface growth, and oxidation to varying degrees. Overall, the reduction in soot concentration arises from the combined action of two mechanisms: first, the dilution and chemical effects suppress the rates of soot nucleation and surface growth; second, the density effect enhances the soot oxidation rate.
Figure 15.
Peak rates of soot formation under FxCO2 dilution.
4.2.3. The Impact of Various Effects on Intermediate Products Under CO2 Decoupling
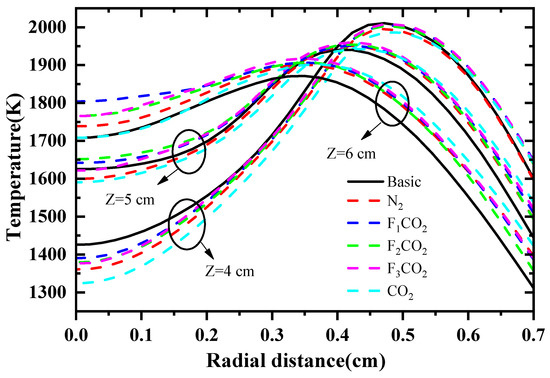
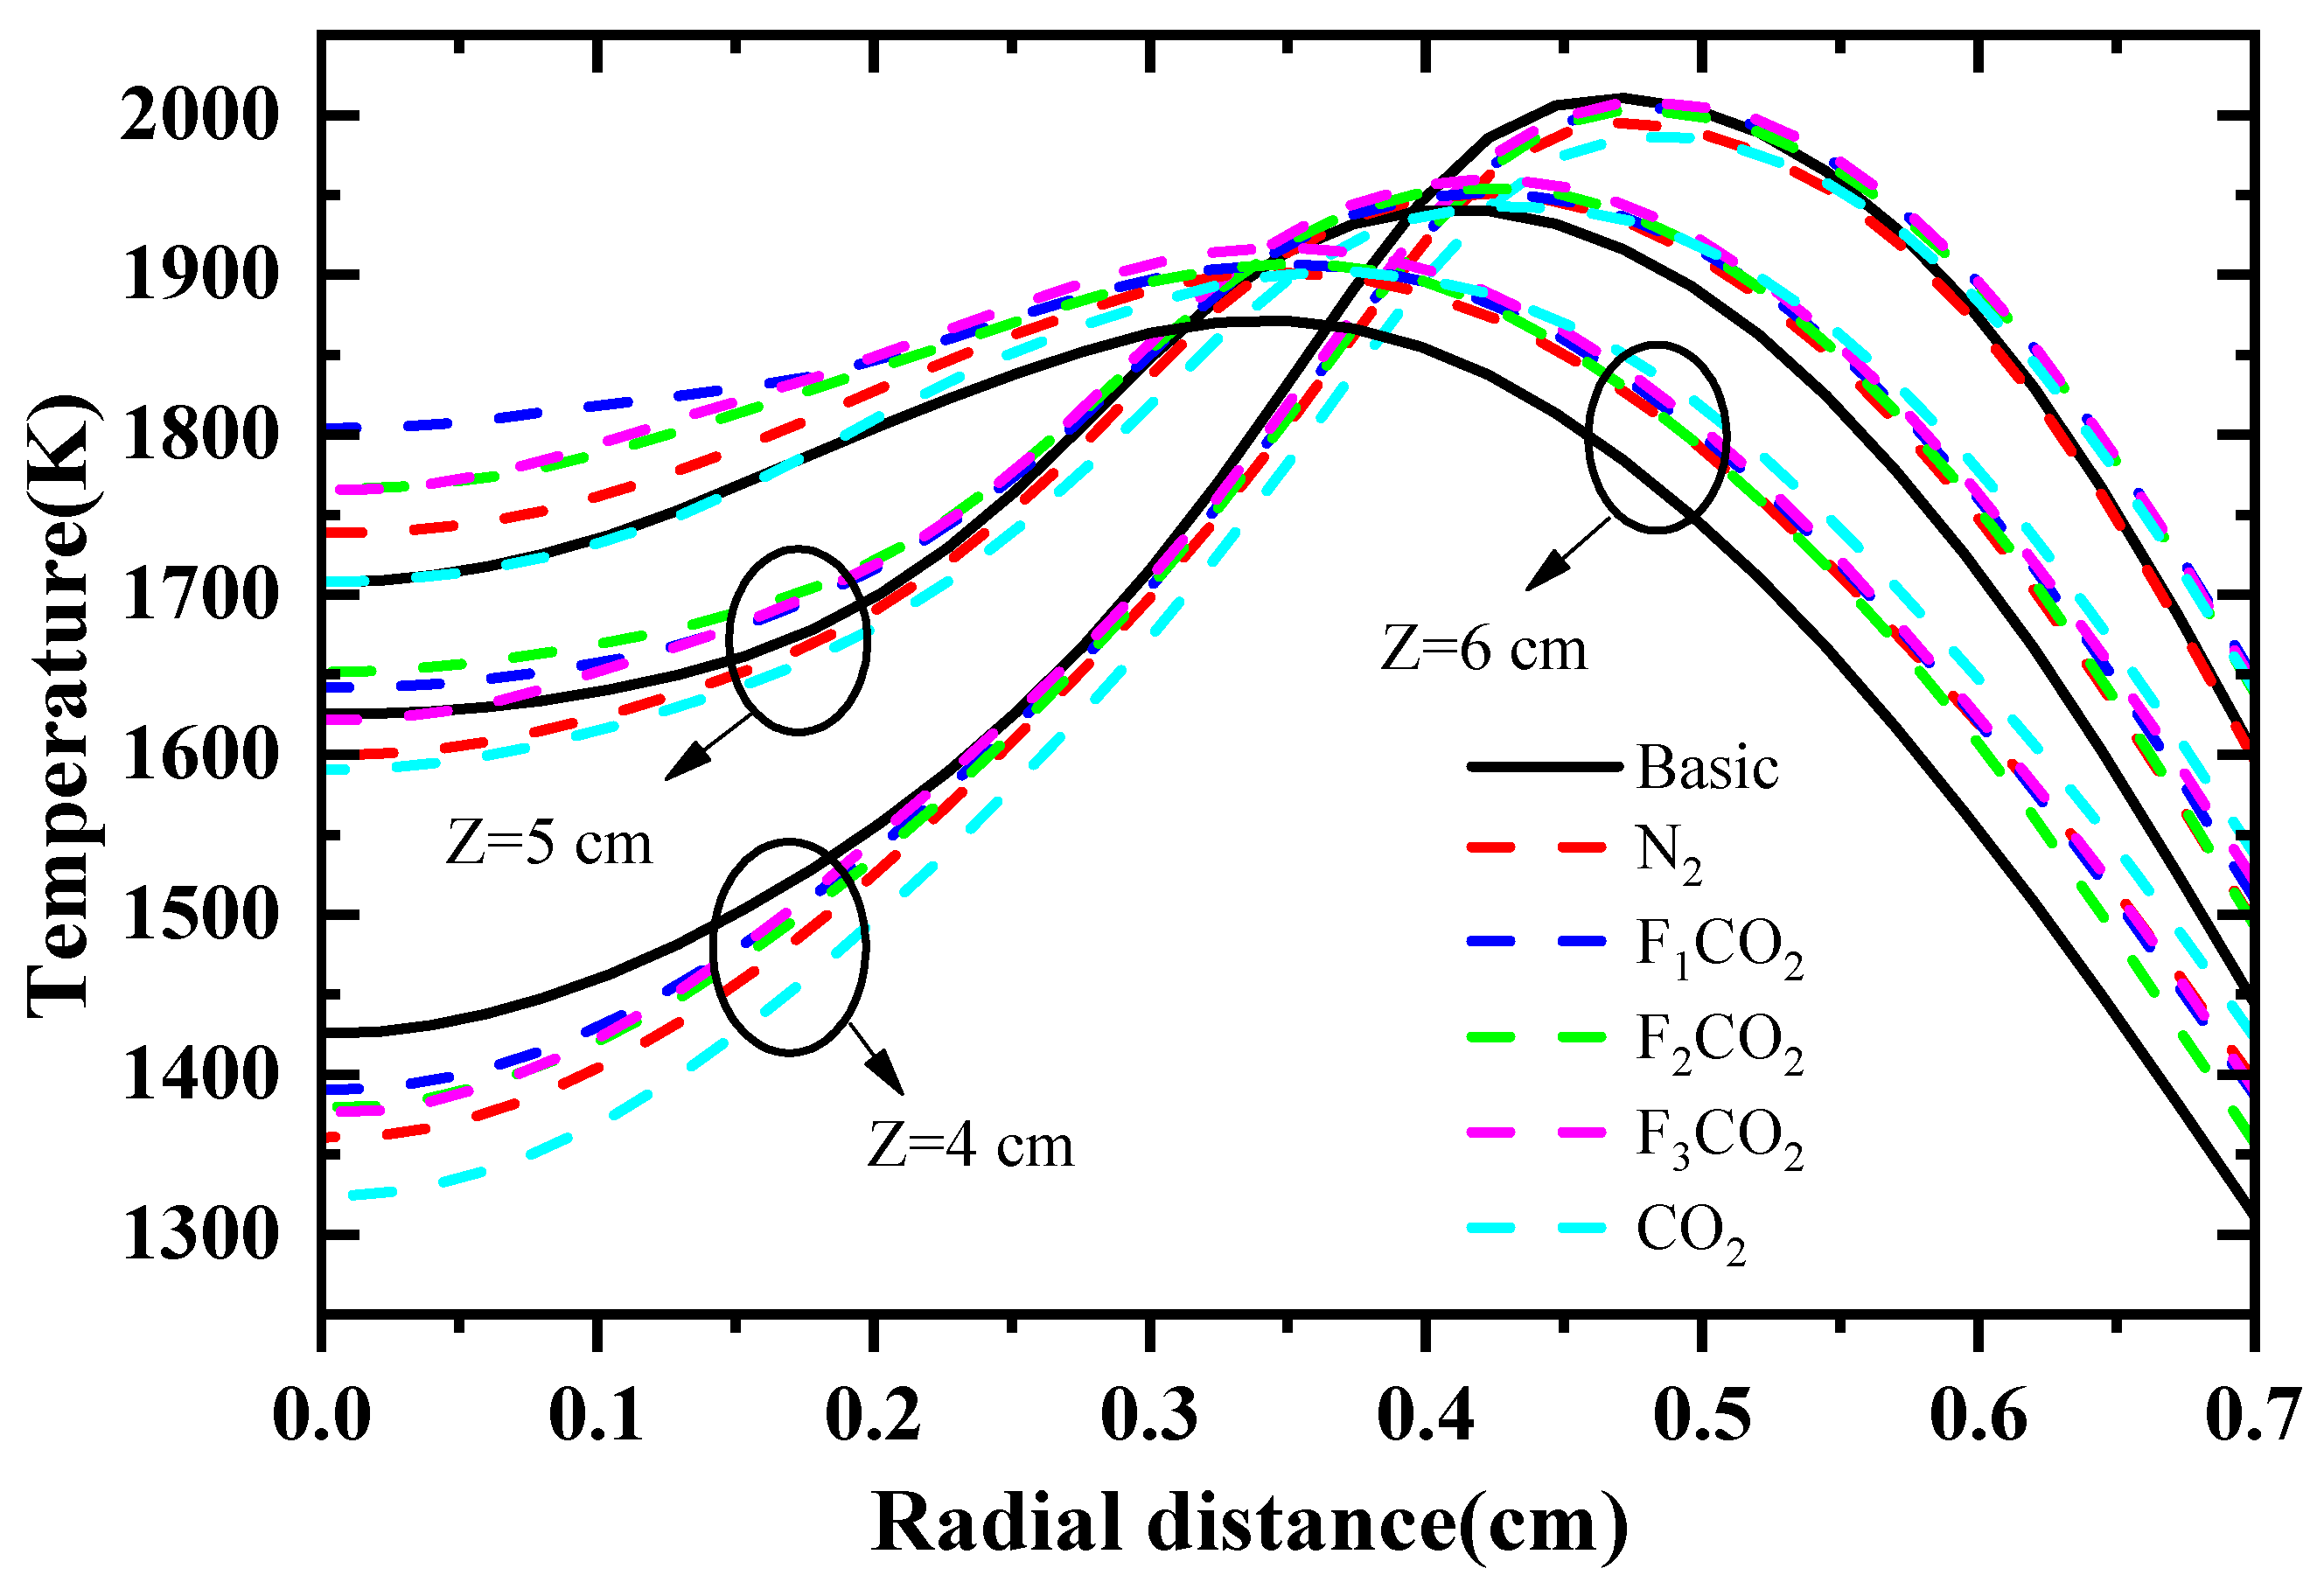
Flame temperature is one of the key factors influencing soot formation, and an increase in temperature generally promotes the rise in soot volume fraction [32]. Figure 16 presents the flame temperature under the influence of different effects at various heights. In the core reaction zone near the burner nozzle (Z = 4 cm), which corresponds to the centerline region where soot is primarily generated, the dilution and chemical effects exhibit strong temperature-suppressing influences. By significantly reducing the local temperature in this region, these two effects effectively decrease soot formation, making them the dominant mechanisms for soot suppression. In contrast, the density, thermal, and transport effects have a relatively minor impact on flame temperature. It is also observed that the overall flame temperature increases with height, which can be primarily attributed to the density effect. In summary, soot is predominantly generated along the centerline region near the burner, while the dilution and chemical effects suppress soot formation by lowering the local temperature in this key region.
Figure 16.
Radial distribution of flame temperature for FxCO2 dilution at different heights.
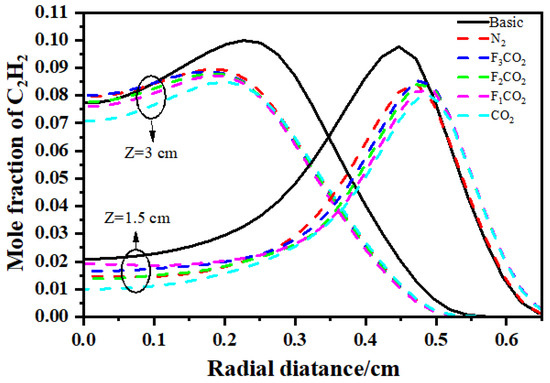
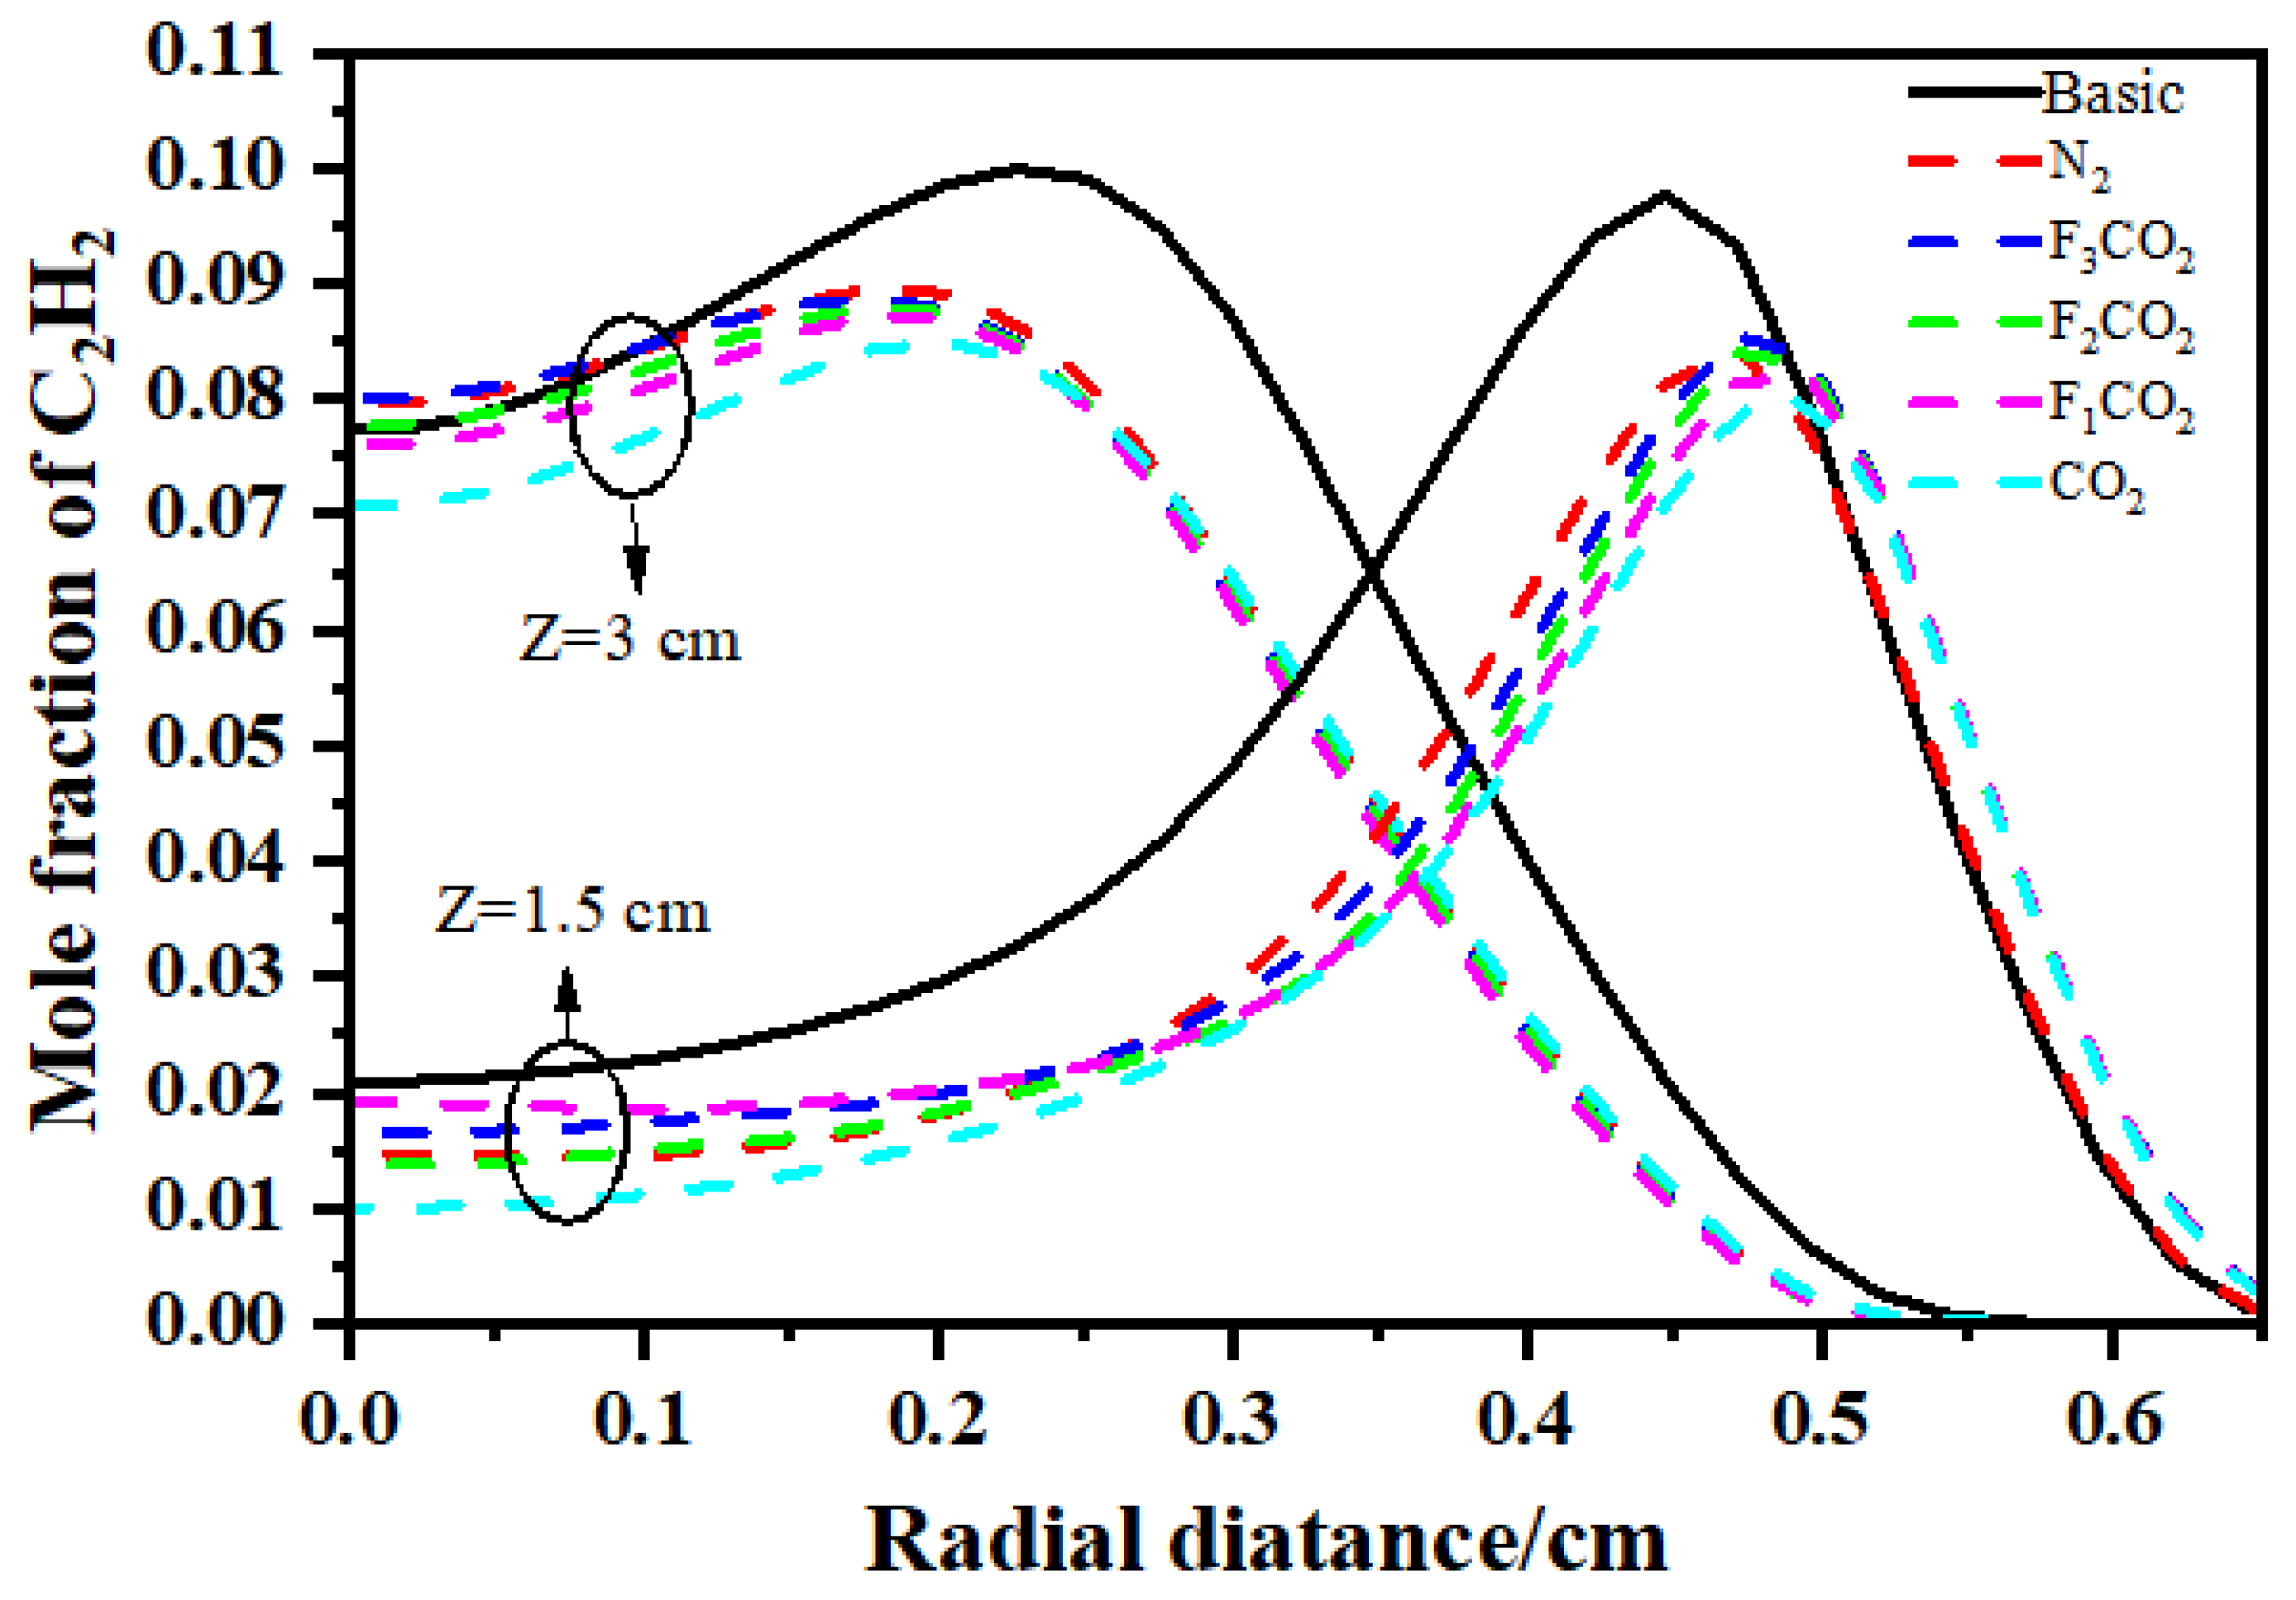
C2H2, as the primary precursor in the surface growth stage of soot, plays a crucial role in soot formation, making the study of its concentration variations highly significant. Figure 17 illustrates the radial distributions of C2H2 under the influence of different effects at various flame heights. The analysis shows that at Z = 1.5 cm, the dilution effect markedly suppresses C2H2 formation, resulting in a significant reduction in its concentration, followed by the chemical effect. The impacts of the other effects on the mole fraction of C2H2 are minimal and can be neglected. At a flame height of Z = 3 cm, the influences of each effect on C2H2 concentration are similar to those at Z = 1.5 cm, with the dilution and chemical effects being the most pronounced. In summary, the relative influence of each effect on C2H2 concentration, in descending order, is: dilution effect > chemical effect > transport effect > thermal effect > density effect.
Figure 17.
Radial distribution of C2H2 under the addition of virtual component CO2.
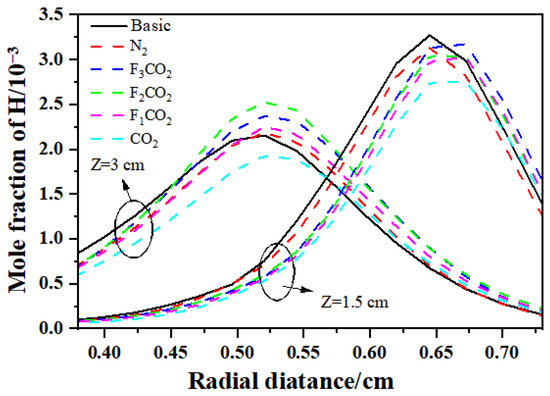
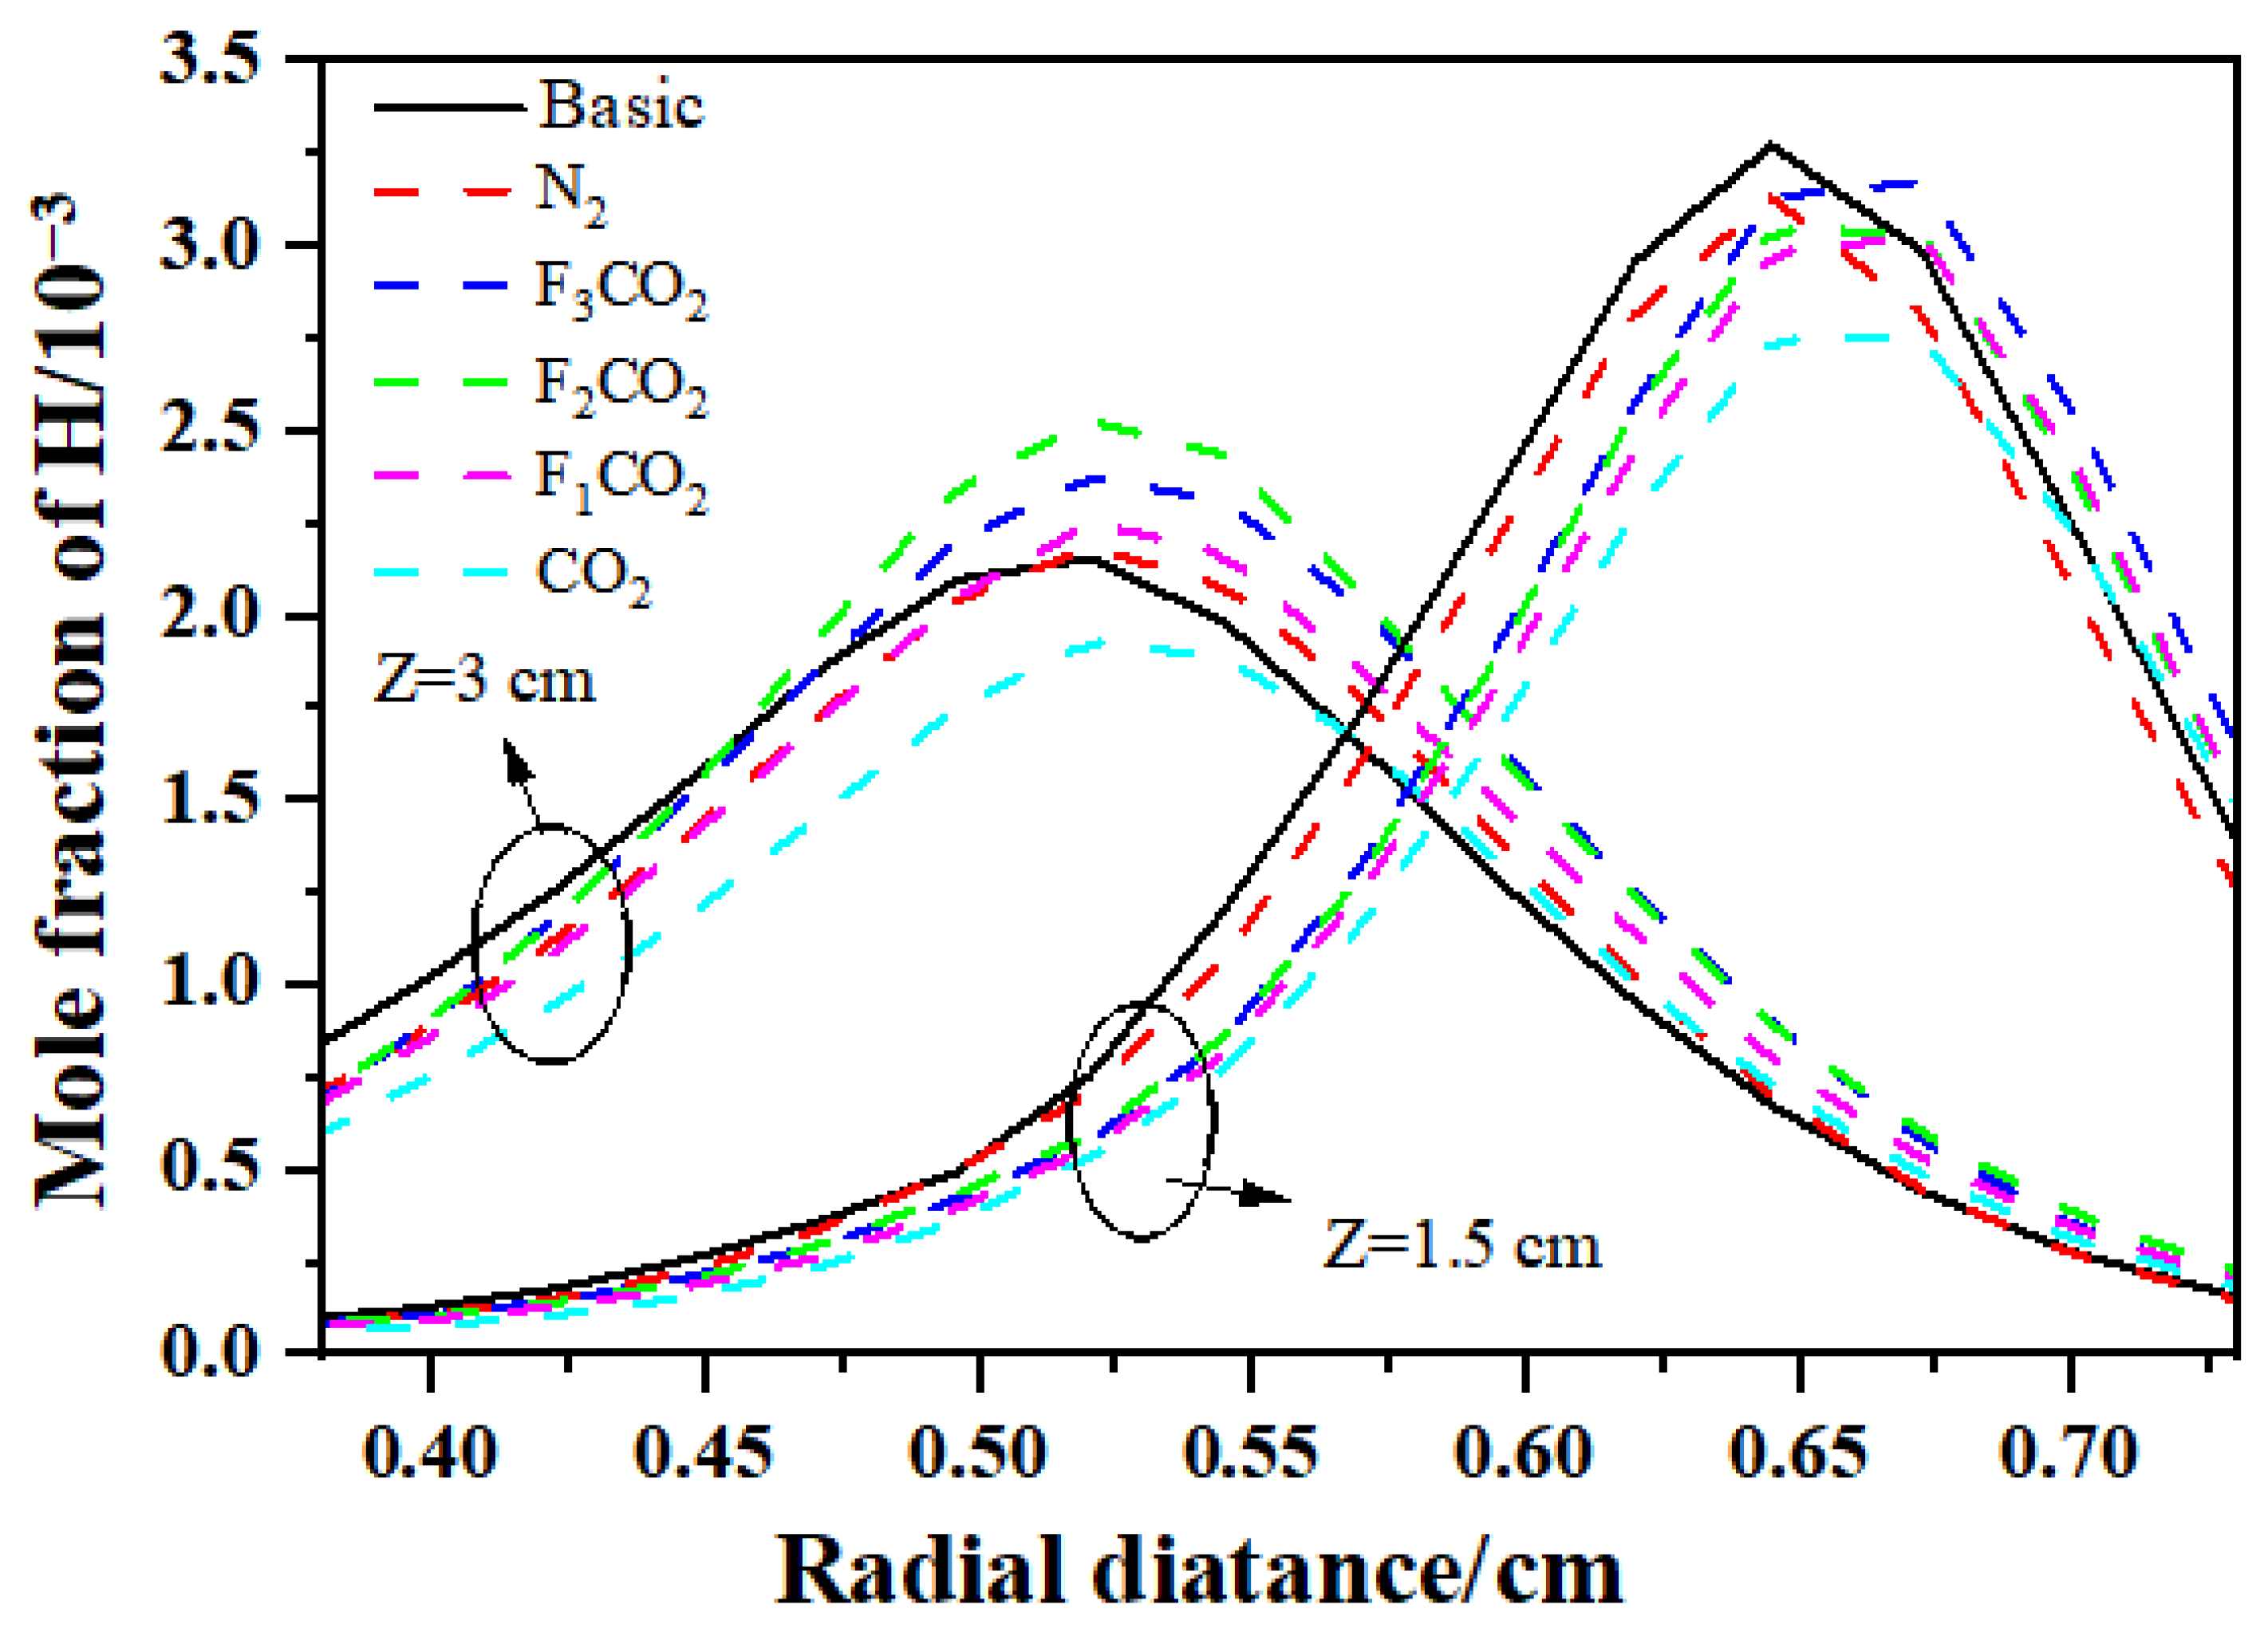
Previous studies have indicated that, in the acetylene addition reaction pathway, the concentration of H radicals plays a dominant role in controlling the reaction rate, thereby significantly affecting the soot formation process. Figure 18 presents the radial distributions of H radicals under the influence of different effects at various flame heights. At a lower flame height (Z = 1.5 cm), all effects—dilution, density, transport, thermal, and chemical—cause slight decreases in the H radical concentration. In contrast, at a higher flame height (Z = 3 cm), the density effect slightly promotes the H radical concentration, whereas the thermal and chemical effects exhibit an inhibitory influence. Overall, the chemical and thermal effects are the primary factors responsible for the reduction in H radical concentration, which in turn suppresses soot formation. The dilution, density, and transport effects have minimal influence on H radical concentration and can be considered negligible.
Figure 18.
H radial distribution.
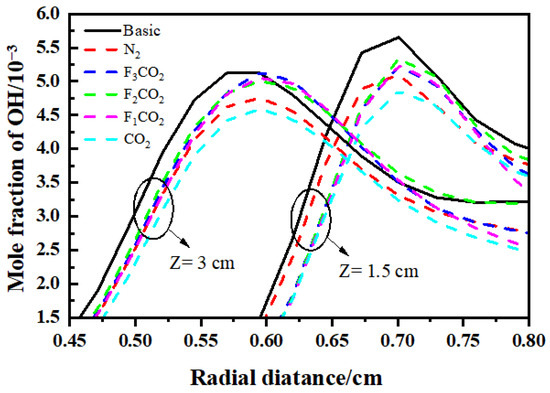
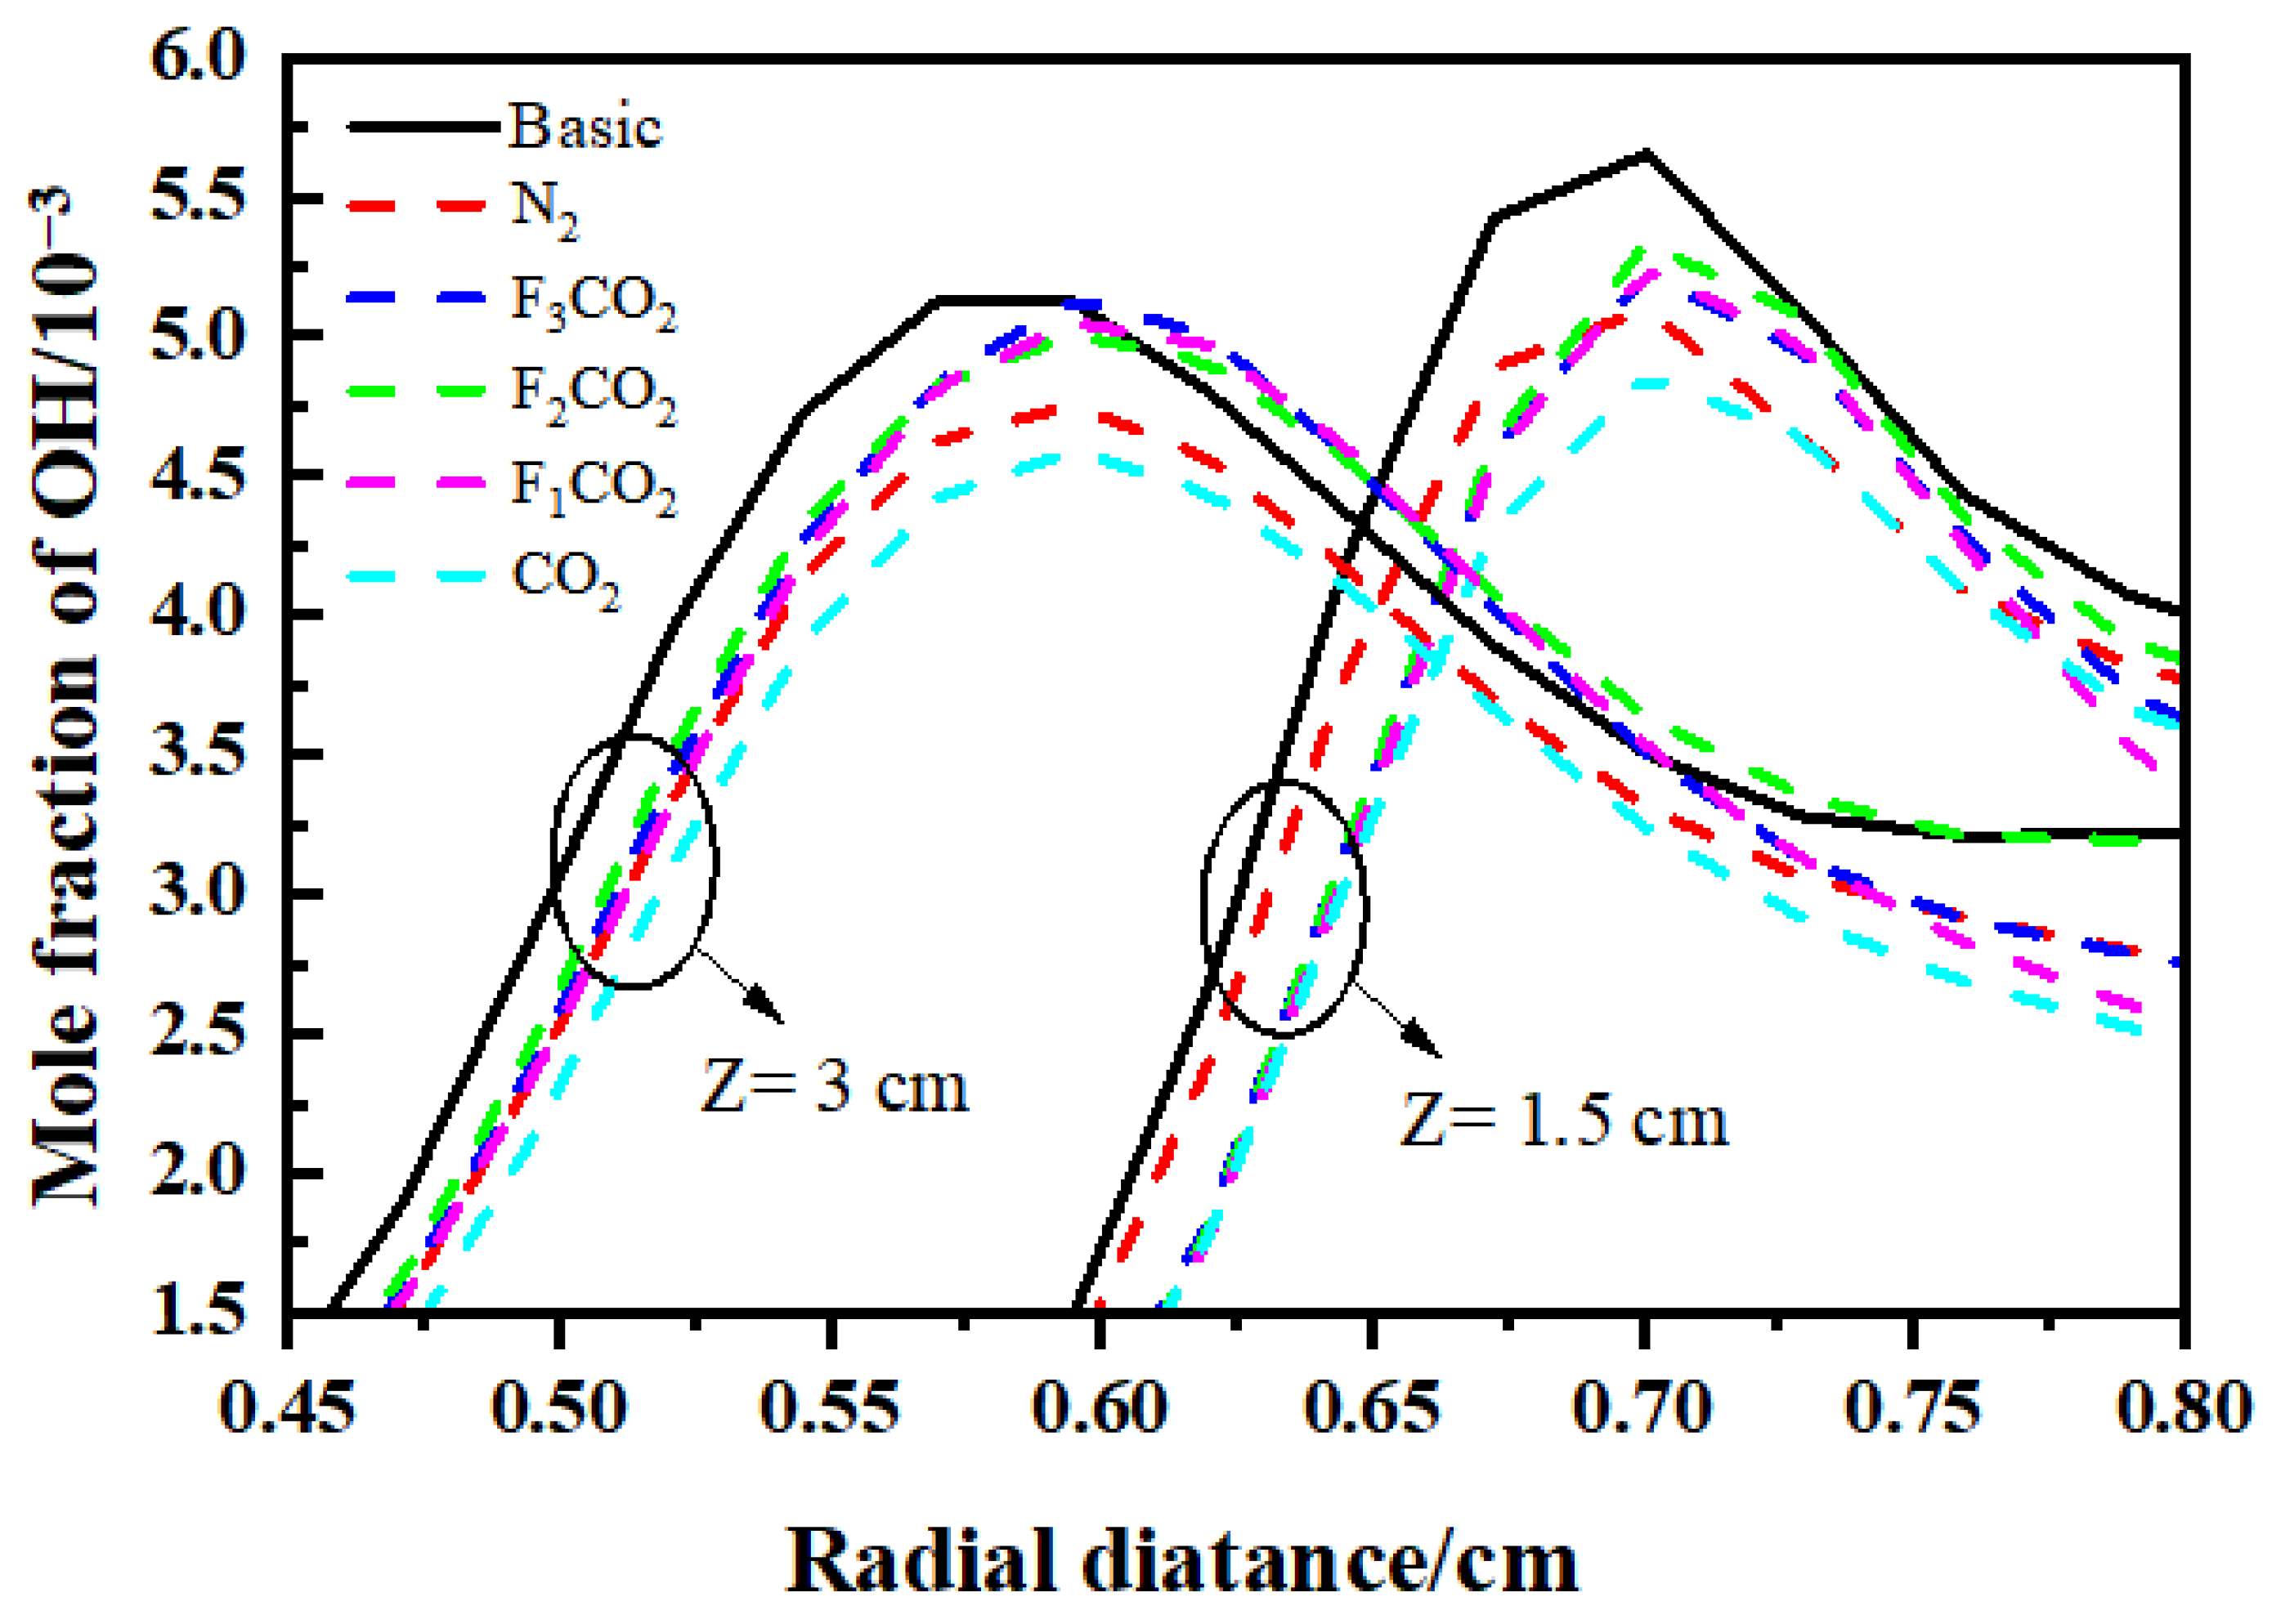
OH is the primary oxidizing radical, and its concentration directly affects the soot oxidation rate; higher OH concentrations in the flame lead to increased soot oxidation. Figure 19 presents the radial distributions of OH radicals under the influence of different effects at various flame heights. Figure 19 indicates that at a higher flame location (Z = 3 cm), the dilution effect has the most significant influence, substantially reducing the OH mole fraction, followed by the chemical effect. The density, transport, and thermal effects have minimal impacts on the OH mole fraction and can be considered negligible. At a lower flame height (Z = 1.5 cm), the density effect exhibits the strongest suppression of OH concentration, followed by the dilution effect.
Figure 19.
Distribution of C2H2, H, and OH radical concentrations in virtual CO2 dilution at different altitudes.
The concentration of OH radicals is positively correlated with the soot oxidation rate and serves as a key reactive species promoting soot oxidation. When CO2 is added on the fuel side, the chemical effect suppresses the production of OH radicals, primarily by reducing flame temperature and H radical concentration, thereby inhibiting soot nucleation and surface growth; its contribution to enhancing soot oxidation is relatively weak, consistent with the findings reported in the literature [33]. In contrast, the dilution effect suppresses soot primarily by significantly increasing the OH radical concentration, which accelerates soot oxidation and effectively reduces soot particle formation.
5. Discussion
The experimental and numerical results confirm that CO2 dilution suppresses soot formation more effectively than N2, with the decoupling analysis revealing that dilution and chemical effects are the dominant contributors. This finding aligns with previous studies while further clarifying that the dilution effect enhances soot oxidation by increasing OH concentration, whereas the chemical effect inhibits soot nucleation via H radical consumption. These insights support the potential application of CO2-diluted combustion as a low-carbon strategy.
6. Conclusions
This study systematically investigated the effects of CO2 dilution on soot formation in ethylene laminar diffusion flames, comparing flame shape, temperature, and soot production under different conditions. The experiments were conducted using a high-resolution spectrometer to capture laminar diffusion flames, and the results were compared with numerical simulations. In addition, virtual species FxCO2 were introduced to systematically decouple and isolate the individual effects of CO2 on soot formation. The main conclusions are summarized as follows:
- (1)
- Comparison of the experimental and numerical results under N2 dilution indicates that the regions of high temperature and soot formation are consistent, and both experiment and simulation exhibit the same trends with increasing N2 dilution ratio. The numerical model demonstrates good accuracy.
- (2)
- With increasing dilution ratio, the peak flame temperature and soot volume fraction decrease for flames diluted with N2 or CO2. Specifically, for CO2 dilution, the experimental peak temperature decreases from 2112 K to 2054 K, and the soot volume fraction decreases from 8.33 ppm to 6.88 ppm; the corresponding numerical predictions show a decrease in peak temperature from 2105 K to 2037 K and a reduction in soot volume fraction from 8.14 ppm to 5.94 ppm. Comparison between CO2 and N2 as diluents reveals that CO2 dilution has a significantly stronger inhibitory effect on soot formation than N2.
- (3)
- Analysis of the individual effects on flame temperature and soot volume fraction shows that the dilution and chemical effects substantially reduce flame temperature. The relative influence of each effect on soot suppression follows the order: dilution effect > thermal effect > chemical effect > density effect > transport effect, with CO2 dilution having the largest impact, reducing the soot volume fraction by 1.52 ppm.
- (4)
- The effects of each factor on C2H2 concentration, in descending order, are: dilution effect > chemical effect > transport effect > thermal effect > density effect. The reduction in H radical concentration is mainly influenced by the chemical and thermal effects. For OH radicals, the chemical effect suppresses OH production by lowering flame temperature and H radical concentration, thereby inhibiting soot nucleation and surface growth. In contrast, the dilution effect suppresses soot primarily by significantly increasing the OH radical concentration, which accelerates soot oxidation and effectively reduces soot particle formation.
Author Contributions
Methodology, B.L.; writing—original draft preparation, B.L. and N.K.; writing—review and editing, B.L.; software, N.K.; validation, N.K.; investigation, H.H.; resources, H.H.; visualization, Z.S. and F.X. All authors have read and agreed to the published version of the manuscript.
Funding
This research was funded by the National Natural Science Foundation of China (No. 52504057).
Data Availability Statement
The original contributions presented in this study are included in the article. Further inquiries can be directed to the first author (2021730018@yangtzeu.edu.cn).
Acknowledgments
The authors are grateful for the support of technology and computing resources of Yangtze University.
Conflicts of Interest
The authors declare no conflicts of interest.
Abbreviations
The following abbreviations are used in this manuscript:
| PAHs | polycyclic aromatic hydrocarbons |
| EGR | exhaust gas recirculation |
| ATR | near-autothermal reforming |
| SVF | soot volume fraction |
References
- Chen, Y.; Liu, Y.; Hu, S.; Wu, D.; Zhang, M.; Cheng, Z. Exploration of a novel electrochemical CN coupling process: Urea synthesis from direct air carbon capture with nitrate wastewater. Sci. Total Environ. 2024, 913, 169722. [Google Scholar] [CrossRef] [Scilit] [PubMed]
- Wang, H.; Frenklach, M. A detailed kinetic modeling study of aromatics formation in laminar premixed acetylene and ethylene flames. Combust. Flame 1997, 110, 173–221. [Google Scholar] [CrossRef] [Scilit]
- Senkan, S.; Castaldi, M. Formation of polycyclic aromatic hydrocarbons (PAH) in methane combustion: Comparative new results from premixed flames. Combust. Flame 1996, 107, 141–150. [Google Scholar] [CrossRef] [Scilit]
- Wang, T.; Liang, H.; Luo, Z.; Yu, J.; Cheng, F.; Zhao, J.; Su, B.; Li, R.; Wang, X.; Feng, Z.; et al. Thermal suppression effects of diluent gas on the deflagration behavior of H2–air mixtures. Energy 2023, 272, 127146. [Google Scholar] [CrossRef] [Scilit]
- Sirignano, M.; D’Anna, A. The role of CO2 dilution on soot formation and combustion characteristics in counter-flow diffusion flames of ethylene. Exp. Therm. Fluid Sci. 2020, 114, 110061. [Google Scholar] [CrossRef] [Scilit]
- Hoerlle, C.A.; Pereira, F.M. Effects of CO2 addition on soot formation of ethylene non-premixed flames under oxygen enriched atmospheres. Combust. Flame 2019, 203, 407–423. [Google Scholar] [CrossRef] [Scilit]
- Guo, H.; Liu, F.; Smallwood, G.J.; Gülder, Ö.L. Numerical study on the influence of hydrogen addition on soot formation in a laminar ethylene–air diffusion flame. Combust. Flame 2006, 145, 324–338. [Google Scholar] [CrossRef] [Scilit]
- Wang, D.; Yao, J.; Hong, R.; Dong, W.; Qiu, B.; Chu, H. Effects of pressure and CO2 dilution on soot formation in coflow ethylene/air laminar diffusion flames by numerical simulation. Int. J. Heat Fluid Flow 2024, 107, 109422. [Google Scholar] [CrossRef] [Scilit]
- Al-Qurashi, K.; Lueking, A.D.; Boehman, A.L. The deconvolution of the thermal, dilution, and chemical effects of exhaust gas recirculation (EGR) on the reactivity of engine and flame soot. Combust. Flame 2011, 158, 1696–1704. [Google Scholar] [CrossRef] [Scilit]
- Dally, B.B.; Riesmeier, E.; Peters, N. Effect of fuel mixture on moderate and intense low oxygen dilution combustion. Combust. Flame 2004, 137, 418–431. [Google Scholar] [CrossRef]
- Guo, J.; Liu, P.; Quadarella, E.; Gubba, S.R.; Saxena, S.; Chatakonda, O.; Kloosterman, J.W.; He, X.; Roberts, W.L.; Im, H.G. Effect of pressure and CO2 dilution on soot formation in laminar inverse coflow flame at conditions close to autothermal reforming. Combust. Flame 2023, 254, 112853. [Google Scholar] [CrossRef] [Scilit]
- Wang, Y.; Chung, S.H. Formation of soot in counterflow diffusion flames with carbon dioxide dilution. Combust. Sci. Technol. 2016, 188, 805–817. [Google Scholar] [CrossRef] [Scilit]
- Dworkin, S.B.; Zhang, Q.; Thomson, M.J.; Slavinskaya, N.A.; Riedel, U. Application of an enhanced PAH growth model to soot formation in a laminar coflow ethylene/air diffusion flame. Combust. Flame 2011, 158, 1682–1695. [Google Scholar] [CrossRef] [Scilit]
- Smith, T.F.; Shen, Z.F.; Friedman, J.N. Evaluation of coefficients for the weighted sum of gray gases model. J. Heat Transf. 1982, 104, 602–608. [Google Scholar] [CrossRef] [Scilit]
- Brookes, S.J.; Moss, J.B. Predictions of soot and thermal radiation properties in confined turbulent jet diffusion flames. Combust. Flame 1999, 116, 486–503. [Google Scholar] [CrossRef] [Scilit]
- Frenklach, M. Reaction mechanism of soot formation in flames. Phys. Chem. Chem. Phys. 2002, 4, 2028–2037. [Google Scholar] [CrossRef] [Scilit]
- Sirignano, M.; D’Anna, A. Coagulation of combustion generated nanoparticles in low and intermediate temperature regimes: An experimental study. Proc. Combust. Inst. 2013, 34, 1877–1884. [Google Scholar] [CrossRef] [Scilit]
- Liu, B.; Luo, G.; Zhang, Y.; Si, M.; Wang, C.; Adjei, S.T.; Huang, H. Experimental and numerical investigations of soot formation in propane laminar coflow flames in O2/N2 and O2/CO2 atmospheres. Case Stud. Therm. Eng. 2024, 61, 104030. [Google Scholar] [CrossRef] [Scilit]
- Appel, J.; Bockhorn, H.; Frenklach, M. Kinetic modeling of soot formation with detailed chemistry and physics: Laminar premixed flames of C2 hydrocarbons. Combust. Flame 2000, 121, 122–136. [Google Scholar] [CrossRef] [Scilit]
- Liu, F.; He, X.; Ma, X.; Zhang, Q.; Thomson, M.; Guo, H.; Smallwood, G.; Shuai, S.; Wang, J. An experimental and numerical study of the effects of dimethyl ether addition to fuel on polycyclic aromatic hydrocarbon and soot formation in laminar coflow ethylene/air diffusion flames. Combust. Flame 2011, 158, 547–563. [Google Scholar] [CrossRef] [Scilit]
- Jerez, A.; Consalvi, J.-L.; Fuentes, A.; Liu, F.; Demarco, R. Soot production modeling in a laminar coflow ethylene diffusion flame at different Oxygen Indices using a PAH-based sectional model. Fuel 2018, 231, 404–416. [Google Scholar] [CrossRef] [Scilit]
- Cepeda, F.; Jerez, A.; Demarco, R.; Liu, F.; Fuentes, A. Influence of water-vapor in oxidizer stream on the sooting behavior for laminar coflow ethylene diffusion flames. Combust. Flame 2019, 210, 114–125. [Google Scholar] [CrossRef] [Scilit]
- Liu, F.; Guo, H.; Smallwood, G.J.; Gülder, Ö.L. The chemical effects of carbon dioxide as an additive in an ethylene diffusion flame: Implications for soot and NOx formation. Combust. Flame 2001, 125, 778–787. [Google Scholar] [CrossRef] [Scilit]
- Zhang, Y.; Liu, F.; Lou, C. Experimental and Numerical Investigations of Soot Formation in Laminar Coflow Ethylene Flames Burning in O2/N2 and O2/CO2 Atmospheres at Different O2 Mole Fractions. Energy Fuels 2018, 32, 6252–6263. [Google Scholar] [CrossRef] [Scilit]
- Smooke, M.; McEnally, C.; Pfefferle, L.; Hall, R.; Colket, M. Computational and experimental study of soot formation in a coflow, laminar diffusion flame. Combust. Flame 1999, 117, 117–139. [Google Scholar] [CrossRef] [Scilit]
- Jeon, B.-H.; Fujita, O.; Nakamura, Y.; Ito, H. Effect of co-axial flow velocity on soot formation in a laminar jet diffusion flame under microgravity. J. Therm. Sci. Technol. 2007, 2, 281–290. [Google Scholar] [CrossRef] [Scilit]
- El-Asrag, H.; Menon, S. Large eddy simulation of soot formation in a turbulent non-premixed jet flame. Combust. Flame 2009, 156, 385–395. [Google Scholar] [CrossRef] [Scilit]
- Mercier, X.; Bourgalais, J.; Faccinetto, A.; Tran, L.-S.; Elias, J.; Demaux, P.; Lahccen, A.; Calimet, B.; Nahon, L.; Garcia, G.A. Direct observation and identification of resonance-stabilized radicals in a sooting flame. Commun. Chem. 2025, 8, 295. [Google Scholar] [CrossRef] [Scilit]
- McENALLY, C.S.; Pfefferle, L.D. The effect of nitrogen dilution on nonfuel hydrocarbons in laminar nonpremixed flames. Combust. Sci. Technol. 2000, 151, 133–155. [Google Scholar] [CrossRef] [Scilit]
- Kashif, M.; Guibert, P.; Bonnety, J.; Legros, G. Sooting tendencies of primary reference fuels in atmospheric laminar diffusion flames burning into vitiated air. Combust. Flame 2014, 161, 1575–1586. [Google Scholar] [CrossRef] [Scilit]
- Wang, Y.; Gu, M.; Zhu, Y.; Cao, L.; Zhu, B.; Wu, J.; Lin, Y.; Huang, X. A review of the effects of hydrogen, carbon dioxide, and water vapor addition on soot formation in hydrocarbon flames. Int. J. Hydrogen Energy 2021, 46, 31400–31427. [Google Scholar] [CrossRef] [Scilit]
- Khosousi, A.; Dworkin, S.B. Soot surface reactivity during surface growth and oxidation in laminar diffusion flames. Combust. Flame 2015, 162, 4523–4532. [Google Scholar] [CrossRef] [Scilit]
- Guo, H.; Smallwood, G.J. A numerical study on the influence of CO2 addition on soot formation in an ethylene/air diffusion flame. Combust. Sci. Technol. 2008, 180, 1695–1708. [Google Scholar] [CrossRef] [Scilit]

Disclaimer/Publisher’s Note: The statements, opinions and data contained in all publications are solely those of the individual author(s) and contributor(s) and not of MDPI and/or the editor(s). MDPI and/or the editor(s) disclaim responsibility for any injury to people or property resulting from any ideas, methods, instructions or products referred to in the content. |
© 2026 by the authors. Licensee MDPI, Basel, Switzerland. This article is an open access article distributed under the terms and conditions of the Creative Commons Attribution (CC BY) license.