


Abstract
The evaluation of vibro-acoustic comfort in vehicle cabins is frequently limited by fragmented treatment of noise and vibration indicators and by the absence of structured, reproducible assessment frameworks. This study proposes an advanced, correlation-driven and process-oriented methodology for vibro-acoustic comfort evaluation, designed to support systematic analysis and decision-making across varying vehicle operating conditions. The proposed framework is formulated as a sequential process comprising experimental data acquisition, signal preprocessing, statistical correlation analysis, and decision-oriented interpretation. The framework was experimentally validated on five special-purpose armored platforms under both stationary and dynamic operating regimes, with repeated measurement trials to ensure robustness. Interior and exterior sound pressure levels, together with vibration-related parameters, are experimentally measured under stationary and dynamic operating regimes. Pearson correlation coefficients are employed to quantify interdependencies among vibro-acoustic variables and identify dominant contributors affecting comfort-related conditions. The results indicate statistically significant correlations between interior noise levels and selected vibration indicators, revealing distinct correlation patterns associated with different operating states. Based on these findings, correlation strength was classified as weak (|r| < 0.3), moderate (0.3 ≤ |r| < 0.6), and strong (|r| ≥ 0.6), enabling structured contributor ranking. The primary contribution of this work consists in elevating correlation analysis from a descriptive statistical technique to a formalized assessment process suitable for integration into predictive modeling and optimization workflows. The framework provides a transferable methodological structure, validated within the investigated vehicle category.
1. Introduction
Vibro-acoustic comfort in vehicle cabins has been investigated from multiple perspectives. For example, X et al. [1] focused on experimental NVH characterization in heavy vehicles, while Y et al. [2] proposed numerical modelling approaches for vibration comfort assessment. Other studies [3,4,5] concentrated primarily on airborne noise indicators, whereas [6,7,8,9] addressed vibration exposure metrics without integrating acoustic response. Several investigations have examined combined noise–vibration exposure and its impact on human performance and fatigue, highlighting the importance of integrated assessment approaches [10,11,12,13,14,15].
Although the literature on vehicle acoustics and comfort is extensive, previous studies such as [16,17] focused primarily on acoustic exposure metrics, while [18] emphasized structural vibration transfer. Furthermore, works in [19,20,21,22] assessed vibration comfort using RMS-based indicators, whereas [23,24,25] reported acoustic measurements without formal integration of vibration data.
Assessments are frequently performed either in purely acoustic terms or exclusively through vibration-focused metrics, while the practical link between the two domains is often addressed only implicitly. As a result, it becomes difficult to produce repeatable evaluation outcomes that can support engineering decisions in a consistent manner, especially when vehicle operating conditions vary significantly between idling and real driving scenarios.
From a process-engineering perspective, vibro-acoustic comfort assessment can be formalized as a measurable workflow that transforms raw signals into decision-ready outputs. In this workflow, synchronized acoustic and vibration measurements constitute the inputs; preprocessing, indicator extraction, and statistical association analysis represent the transformation stages; and the outputs consist of:
- (i)
- regime-specific contributor identification and
- (ii)
- actionable prioritization for mitigation and design improvement.
However, many applied studies still present measurement results and correlations as isolated findings, without embedding them into a traceable process sequence that is reproducible and suitable for decision support.
Despite the extensive literature on vehicle noise and vibration, existing studies often treat acoustic and vibration measurements as parallel but independent assessment streams. Differences in measurement logic, indicator selection, and interpretation criteria lead to fragmented analytical approaches, limiting cross-domain comparability and reducing the practical applicability of statistical findings. Furthermore, correlation analysis is frequently employed in a descriptive manner without integration into a structured decision-support workflow. This fragmentation reveals a methodological gap in the formalization of a unified, reproducible, and operationally applicable vibro-acoustic assessment framework.
The methodological gap lies in the lack of process formalization for vibro-acoustic comfort assessment. Although vehicle cabin comfort has been widely investigated, many applied studies [19,20,21,22,23,24,25] still address acoustics and vibrations as separate assessment streams, using different measurement logics, indicator sets, and interpretation criteria. As a consequence, results obtained from noise monitoring are frequently discussed independently from structural vibration transfer, even though the two phenomena are physically coupled and may jointly shape perceived comfort and operational performance. In addition, statistical analyses are often employed only as descriptive post-processing tools (e.g., reporting correlation values without procedural context), which limits reproducibility and prevents consistent comparison across operating regimes.
This methodological gap becomes critical in engineering applications where comfort-related interventions must be justified under time, cost, and operational constraints. In such contexts, decision-making requires a transparent and repeatable workflow that links measurement evidence to actionable outputs rather than isolated statistical observations. Therefore, a structured process is needed to ensure that:
- (a)
- data acquisition is synchronized and aligned across domains,
- (b)
- preprocessing and indicator extraction are applied consistently,
- (c)
- relationships among variables are interpreted using explicit thresholds and significance criteria, and
- (d)
- conclusions are translated into ranked intervention targets and mitigation priorities.
Such process formalization enables traceability from raw signals to decision-ready results, supporting regime-specific contributor identification and systematic comfort optimization.
To overcome the fragmentation observed in prior studies [26,27], the proposed framework introduces a unified measurement and interpretation logic. First, acoustic and vibration signals are acquired synchronously under identical operating regimes, eliminating inconsistencies associated with separate measurement campaigns. Second, both signal types are transformed using standardized preprocessing rules into exposure-relevant scalar indicators (Leq for acoustics and RMS-based descriptors for vibration), which are organized within a structured, regime-indexed dataset. Third, identical statistical interpretation criteria, including predefined correlation strength thresholds and regression-based explanatory metrics, are applied across domains. Finally, rather than interpreting acoustic and vibration results independently, the framework integrates them within a contributor-ranking logic, enabling consistent identification of dominant transmission paths and mitigation priorities. Through this structured harmonization of acquisition, indicator definition, and interpretation criteria, the proposed methodology replaces fragmented analytical approaches with a traceable and decision-oriented workflow.
To address this gap, the proposed framework formalizes vibro-acoustic comfort assessment as a standardized sequential process integrating synchronized noise and vibration measurements. The methodology combines controlled data acquisition, consistent signal preprocessing, structured indicator extraction (Leq and RMS descriptors), and correlation–regression modelling within a unified workflow. By embedding statistical association analysis into a contributor-ranking logic, the framework transforms descriptive correlation into a decision-support mechanism capable of identifying dominant transmission paths and prioritizing mitigation strategies.
Accordingly, the central research question addressed in this study is: How can synchronized noise–vibration measurements be formalized into a repeatable, standardized, and decision-oriented framework applicable across distinct operating regimes?
In this work, we propose a correlation-driven, process-oriented framework for vibro-acoustic comfort assessment in special-purpose vehicle cabins under stationary and dynamic operating regimes. The framework defines a complete pipeline, from measurement planning and synchronized data acquisition to preprocessing, indicator computation, correlation and regression analysis, and decision-oriented ranking of dominant contributors. Within the proposed workflow, correlation analysis is employed to identify the strength and direction of association between vibration and acoustic indicators. Regression modelling extends this analysis by quantifying effect magnitude through slope estimation and explanatory power (R2), thereby enabling contributor ranking and predictive estimation of acoustic response based on vibration inputs.
By separating regimes and formalizing contributor classification, the proposed process improves traceability and supports consistent mitigation prioritization across operating conditions. To ensure traceability and reproducibility, the proposed methodology is summarized as a process workflow (Figure 1), linking synchronized measurements to decision-oriented outputs.
Figure 1.
Process workflow for integrated vibro-acoustic comfort assessment under stationary and dynamic regimes.
The key contribution of this study is the transformation of correlation analysis into an operational decision-support mechanism embedded in a reproducible workflow. Beyond reporting statistical associations, the proposed approach delivers explicit decision outputs (dominant contributors and mitigation priority) and provides a transferable structure that can be extended to predictive modeling, optimization, and regulation-oriented assessment protocols for special-purpose vehicles.
The novelty of the present work lies not in the isolated measurement of noise and vibration or in the use of correlation analysis per se, but in the formalization of vibro-acoustic comfort assessment into a structured, reproducible, and decision-oriented framework. The proposed methodology integrates synchronized acoustic and vibration acquisition under regime-separated operating conditions (stationary and dynamic), applies standardized preprocessing and indicator extraction rules, and embeds correlation and regression analysis within a contributor-ranking logic. Unlike conventional NVH studies that report statistical associations descriptively, the present approach transforms correlation strength and regression explanatory power into operational criteria for identifying dominant transmission paths and prioritizing mitigation strategies. This process-oriented structuring of vibro-acoustic evaluation represents the primary conceptual and methodological contribution of the study and provides a transferable template for comfort-oriented assessment in special-purpose transport platforms.
2. Materials and Methods
The framework is structured as a reproducible assessment pipeline consisting of four sequential stages: (1) synchronized vibro-acoustic acquisition, (2) standardized preprocessing and indicator extraction, (3) statistical association modelling, and (4) decision-oriented contributor classification.
The experimental methodology was developed to support a reproducible, process-oriented assessment of vibro-acoustic comfort across multiple special-purpose vehicle cabins. To account for platform-to-platform variability and to ensure transferability of the proposed workflow, synchronized measurements were collected for both acoustic exposure and structural vibration response in a set of vehicles operating under comparable test conditions. The experimental design explicitly separates stationary and dynamic regimes, enabling regime-specific interpretation while capturing distinct excitation mechanisms associated with engine operation, drivetrain behavior, and vehicle motion. The experimental investigation was conducted on five special-purpose armored platforms belonging to the heavy tracked military vehicle class. The vehicles share comparable structural architecture, diesel powertrain configuration, and drivetrain layout representative of modern armored combat platforms. Due to the restricted and classified nature of detailed structural and mass-distribution specifications, precise platform parameters (e.g., mass distribution, stiffness characteristics, torque maps) are not publicly disclosed. However, all tested platforms operate within the same structural class and mission profile, ensuring methodological consistency and comparability across measurements. The experimental design focused on vibro-acoustic behavior under controlled stationary and dynamic regimes rather than full structural parametric modelling. While the proposed workflow is structurally transferable to other transport platforms, practical implementation in a standard passenger car would require adaptation of several boundary conditions. These include adjustment of sensor placement to reflect passenger cabin geometry and occupant reference positions, redefinition of representative operating regimes (e.g., urban driving, highway cruising, transient acceleration), adaptation of engine and vehicle speed ranges to lighter powertrain configurations, and alignment with passenger-oriented comfort criteria and civil automotive standards. Importantly, these adaptations affect implementation parameters rather than the underlying process logic, which remains applicable across vehicle categories.
For each vehicle, multi-sensor acquisition was performed using a consistent measurement layout and standardized preprocessing rules. Acoustic signals were transformed into equivalent continuous sound pressure level indicators for interior and exterior environments, while vibration responses were recorded at comfort-relevant cabin interfaces (e.g., seat and floor) and processed into RMS-based descriptors (and additional metrics where applicable). The resulting multi-vehicle indicator dataset was analyzed using Pearson correlation and complementary linear regression to quantify noise–vibration interdependencies and to provide the quantitative basis for contributor identification within the decision-oriented workflow presented in this study.
2.1. Regulatory and Standardization Framework for Noise and Vibration Assessment in Special-Purpose Vehicles
The definition and determination of noise and vibration in special-purpose vehicles requires methodological alignment with existing standards and regulatory references in order to ensure traceability, comparability, and reproducibility of the results. An important limitation identified through a structured literature and regulatory review is the absence of integrated regulations prescribing a unified step-by-step procedure for vibro-acoustic comfort assessment in vehicles in general and in special-purpose platforms in particular. Current documents typically address either vibration comfort (often treated as ride comfort) or noise exposure separately, without providing an end-to-end framework that links synchronized measurements to decision-oriented outputs for mitigation prioritization.
For vibration comfort evaluation, the consulted standards emphasize the measurement or simulation of acceleration signals and the derivation of synthetic indicators reflecting exposure magnitude, frequency characteristics, direction (X, Y, Z axes), and exposure duration. Representative documents include BS 6841 [28] and ISO 2631-1 [29], complemented by sector guidelines such as UIC 513 [30] and EN 12299 [31]. These references [28,29,30,31] rely on frequency-weighted RMS indicators as a consistent basis for quantifying whole-body vibration influence on perceived comfort and operational performance.
For noise assessment, the consulted regulatory set includes both civil [32,33,34,35,36,37,38,39,40,41,42] and defense-oriented [43,44,45,46,47] references applicable to special-purpose vehicles. Interior noise determination was informed by professional military standards such as STP M 40527-98 [43], while exterior noise determination followed STP M 40544-99 [44]. Additional references include MIL-STD-1474 [45] and MIL-HDBK-767 [46], which provide design-oriented noise limits and guidance, as well as SAE procedures for vehicle exterior and engine sound characterization (e.g., SAE J366, SAE J986, SAE J1074) [32,33,34]. Worker exposure requirements were also considered through European directives addressing noise and vibration risks (2003/10/EC and 2002/44/EC) [35,36]. This regulatory framework [28,29,30,31,32,33,34,35,36,37,38,39,40,41,42,43,44,45,46,47] guided the selection of acoustic/vibration indicators, the sensor placement logic, and the processing steps applied throughout the proposed workflow.
Figure 2 summarizes the regulatory and standardization references considered for defining and determining noise and vibration in special-purpose vehicles. The color coding separates vibration-related documents from noise-related documents and distinguishes civilian standards from military-specific guidance. The grouped blocks (shaded areas) reflect the practical integration of heterogeneous regulatory sources into a unified workflow, indicating which documents inform each measurement stream (vibration, civil noise, and military noise) within the proposed process.
Figure 2.
Regulatory and standardization framework for noise and vibration assessment in special-purpose vehicles, highlighting vibration standards and civil/military noise-related references used to structure the measurement workflow.
The diagram groups the consulted documents into three practical categories: vibration-related standards addressing whole-body and hand-transmitted exposure, civil noise standards and occupational directives supporting standardized vehicle and worker-noise assessment, and military noise standards defining procedures and limits for interior/exterior noise characterization in mission-relevant contexts. This classification supports methodological traceability by clarifying how measurement indicators, sensor placement logic, and processing steps were selected to ensure comparability and reproducibility across vehicles and operating regimes.
2.2. Experimental Design: Vehicles and Operating Regimes
The proposed vibro-acoustic comfort assessment framework is structured as a sequential and decision-oriented process comprising four integrated stages:
Stage 1—Synchronized data acquisition: Acoustic and vibration signals are acquired simultaneously under controlled stationary and dynamic operating regimes using standardized sensor placement and fixed acquisition windows. This ensures temporal alignment and regime consistency between airborne and structure-borne indicators.
Stage 2—Standardized signal preprocessing and indicator extraction: Raw signals are subjected to consistent preprocessing procedures, including frequency and time weighting (for acoustic signals) and RMS computation (for vibration signals). Exposure-relevant scalar descriptors (Leq and RMS-based indicators) are extracted and organized into a structured dataset indexed by vehicle type, regime, and measurement location.
Stage 3—Statistical association modelling: Pearson correlation coefficients and linear regression models are applied to quantify interdependencies between acoustic and vibration indicators. Separate analyses are conducted for stationary and dynamic regimes to account for differences in excitation mechanisms.
Stage 4—Contributor classification and mitigation prioritization: Correlation strength thresholds and regression explanatory metrics (R2 values) are used as predefined interpretation criteria to classify vibro-acoustic contributors according to relative influence. This ranking enables identification of dominant transmission paths and supports regime-specific prioritization of mitigation strategies.
Through this structured embedding of correlation and regression analysis within a predefined interpretation logic, statistical associations are transformed from descriptive outputs into operational decision-support criteria. The framework thus provides traceable linkage from synchronized measurements to actionable engineering conclusions.
The experimental investigation was conducted on five types of heavy special-purpose vehicles, tested under comparable conditions to capture platform-to-platform variability while maintaining a consistent measurement workflow. For each vehicle type, the measurement campaign included three repeated acquisitions for both acoustic and vibration channels. This replication strategy was adopted to minimize the influence of random fluctuations and to reduce the risk of systematic errors associated with sensor placement tolerances, operational variability, and environmental disturbances, thereby improving the robustness of subsequent correlation and regression analyses.
The assessment protocol was structured across two operating regimes:
- (i)
- stationary operation, characterized by engine running under controlled conditions, and
- (ii)
- dynamic operation, corresponding to vehicle motion along a defined measurement sector and across multiple transmission stages.
This regime separation was introduced to reflect distinct excitation mechanisms—primarily powertrain-driven contributions in stationary conditions and combined powertrain–motion interactions during vehicle operation. To reduce uncontrolled variability, each test sequence included vehicle preparation and stabilization steps, including loading the vehicles with their operational inventory, reaching the required thermal regime of the engine and transmission, and documenting relevant environmental conditions prior to acquisition. Such preparation ensured consistency across the tested platforms and supported the reproducibility of the overall workflow.
2.3. Acoustic Measurements
Acoustic measurements were designed to quantify both in-cabin exposure and external noise levels under stationary and dynamic operating conditions. Interior noise assessment followed a staged procedure (Figure 3) that included vehicle preparation, environmental characterization (air temperature, wind speed, and absence of precipitation), equipment calibration, and acquisition of sound pressure level (SPL) time series. The procedure was structured to ensure repeatability across the tested vehicle platforms and to account for the operational constraints specific to special-purpose vehicles.
Figure 3.
Staged procedure for acoustic measurements under stationary and dynamic operating regimes.
Figure 3 summarizes the staged acoustic measurement procedure and highlights the regime-specific acquisition logic and the indicators extracted for subsequent statistical analysis. The workflow is organized into preparation, environmental characterization, instrument setup and calibration, interior/exterior SPL acquisition, and indicator computation. Under dynamic operation, measurements are performed along a defined test sector across transmission stages, in both driving directions, with paired acquisitions (P1/P2) to support consistency checks. The resulting indicators (Leq_in and Leq_out in dBA, with optional spectral/octave descriptors) are computed using a standardized procedure to ensure repeatability and comparability across vehicle platforms and operating regimes. P1 and P2 denote duplicate measurements acquired for the same operating condition (same direction and transmission stage). The agreement between P1 and P2 was used to verify repeatability and to mitigate systematic and random errors associated with vehicle pass-by variability and measurement setup tolerances.
The proposed interior noise investigation method consisted of a staged procedure developed in accordance with applicable regulations and standards for in-vehicle noise determination [48,49,50], while accounting for constraints specific to special-purpose platforms. The methodology was aligned with the relevant European regulatory framework and complementary reference standards [47,48,51] ensuring traceability of the measurement logic and compatibility with compliance-oriented assessment practices. The first stage consisted of vehicle preparation, including loading the vehicle with operational inventory and fluids (fuel, lubricants, and special liquids), as well as warming up the engine and transmission until the required thermal operating regime was reached. The second stage involved environmental characterization; measurements were performed in the absence of precipitation, with ambient temperature in the range of 10–12 °C and wind speed of 3.0–3.2 m/s. Ambient temperature and wind speed were monitored using a Calypso Mini ultrasonic anemometer (Calypso Instruments, Barcelona, Spain) positioned near the measurement area at approximately measurement height. The reported values represent averaged readings recorded during each measurement session to ensure environmental consistency.
In the subsequent stage, the sound level meter was positioned relative to the commander seat reference point, at 0.65 ± 0.05 m on the vertical line passing through the geometric center of the seat cushion and at 0.20 ± 0.02 m in the horizontal plane from the seat symmetry plane. The microphone reference axis was oriented parallel to the longitudinal axis of the vehicle. Real acoustic signals were then recorded using a fixed acquisition window of 5 min, followed by post-processing using acoustic and numerical software tools (time and frequency weighting) and database construction for the selected reference indicators. All interior noise measurements were performed at the commander seat location in the turret area, under idling conditions for a set of seven constant engine speeds, uniformly distributed between 1000 rpm and 0.8·nmax (where nmax represents the maximum rated engine speed). For dynamic testing, the upper operating point was defined as 0.8·nmax, where nmax represents the manufacturer-specified rated maximum engine speed for each vehicle platform. For the tested vehicles, the rated maximum engine speeds were comparable across platforms; however, the 0.8·nmax value was calculated individually for each vehicle to ensure proportional operating regime consistency.
Stationary measurements with the engine running were included because this operating condition is frequent in special-purpose military vehicles and can represent a dominant exposure scenario. Typical situations include engine warm-up to reach operating temperature before movement (especially at low ambient temperatures), battery charging or compressed-air system replenishment requiring sustained engine speeds (approximately 1400–1800 rpm), and mission-specific activities with high electrical power demand that require continuous generator operation.
For exterior noise measurements (Figure 4a), the sound level meter microphone was mounted on a tripod and equipped with a windscreen to minimize airflow-induced interference. The windscreen correction option was enabled in the instrument settings to ensure automatic compensation during acquisition. The microphone axis was aligned horizontally, positioned at a 45° angle relative to the median plane of the rectangular exhaust outlet, and placed at a distance of 500 mm from the center of the outlet. The 45° microphone orientation and 500 mm distance from the exhaust outlet were selected in accordance with STP M 40544-99 (Military vehicles—determining the exterior noise level) and complementary guidance from MIL-STD-1474. This geometry minimizes exhaust flow interference and ensures repeatable near-field acoustic characterization consistent with military exterior noise assessment requirements.
Figure 4.
Exterior noise measurement configuration used during dynamic tests: (a) microphone placement relative to the exhaust outlet (horizontal axis, 45° orientation, 500 mm distance, windscreen applied) and (b) measurement zone geometry and vehicle direction of motion along the test sector.
A dynamic pass-by procedure (Figure 4b and Figure 5) with controlled acceleration was applied to characterize exterior noise emission under representative loading conditions. A measurement sector of 20 m was marked using visible reference markers. The vehicle approached the sector entry at a constant speed corresponding to an engine speed of 2000 rpm, and a rapid acceleration was applied at the moment of entering the sector to increase engine load and rotational speed. The sound level meter was mounted on a tripod at a lateral distance of 10 m from the vehicle travel line, with the microphone axis aligned horizontally at a height of 1.2 m above ground level. The microphone position was located on the median plane of the measurement sector to ensure geometric consistency across repeated runs.
Figure 5.
Field configuration used for exterior noise acquisition during dynamic runs: (a) tripod-mounted sound level meter with windscreen positioned at the prescribed measurement location; (b) measurement-sector layout along the test route, including the marked reference points used to ensure consistent vehicle pass-by conditions.
To minimize confounding effects associated with vehicle speed and road–surface interaction, the methodology separates stationary and dynamic regimes. Stationary measurements were performed with the vehicle not moving, eliminating speed–surface effects. Dynamic measurements were conducted on a predefined test sector with consistent geometry and standardized measurement layout, under comparable route/surface conditions and repeated runs to reduce variability. The dynamic operating points were defined by gear stage and engine speed ranges, and results were interpreted regime-specifically. Future extensions may explicitly incorporate vehicle speed and surface roughness descriptors as covariates in multivariable models to further separate their contributions.
Following this staged procedure, the recorded SPL time histories were converted into standardized acoustic indicators (Leq_in and Leq_out in dBA) for each vehicle type, operating regime, and repeated trial. The resulting interior and exterior noise descriptors were subsequently integrated with the synchronized vibration measurements to enable cross-domain statistical association analysis and regime-specific interpretation.
2.4. Vibration Measurements
Cabin vibration measurements targeted exposure-relevant interfaces and vibration transmission paths associated with occupant comfort. Vibration signals were acquired simultaneously at two locations (Figure 6):
Figure 6.
Vibration measurement setup and sensor locations in the special-purpose vehicle cabin: (a) cabin floor measurement point beneath the seat area; (b) seat measurement point (seat cushion) using a monoaxial accelerometer; (c) triaxial accelerometer mounting point on the lower cabin structure beneath the operator position. The configuration enabled synchronized acquisition of vibration indicators for subsequent RMS-based processing and cross-domain correlation with acoustic measurements.
- (i)
- the cabin floor beneath the seat (lower vehicle structure under the operator position) and
- (ii)
- the seat assembly.
Measurements were conducted over a range of engine rotational speeds, enabling characterization of vibration magnitude variation under both stationary and dynamic operating conditions.
The experimental setup employed a combination of triaxial and monoaxial accelerometers integrated into a digital acquisition architecture. A PCB Piezotronics 356A26 triaxial accelerometer (PCB Piezotronics, Depew, NY, USA) was used for axis-specific acquisition (X–Y–Z) on the cabin floor, while a PCB Piezotronics 355B37 monoaxial accelerometer (PCB Piezotronics, Depew, NY, USA) was used for the seat vibration response (z-axis, where applicable). Data acquisition was performed using an IOtech 650u data acquisition board (IOtech, Inc., Cleveland, OH, USA) connected to a dedicated HP computer (HP Inc., Palo Alto, CA, USA), with standardized cabling ensuring consistent channel connectivity across all measurements. For each measurement point and operating condition, a fixed acquisition duration of 5 min was applied, supporting consistent segmentation and subsequent extraction of RMS-based vibration indicators within the unified vibro-acoustic workflow.
The synchronized vibration indicators were subsequently integrated with the acoustic Leq descriptors to enable cross-domain statistical association analysis.
2.5. Instrumentation and Data Acquisition System
The instrumentation used for the experimental campaign was selected based on criteria aimed at ensuring measurement accuracy, robustness, and operational suitability for special-purpose vehicle environments. For vibration acquisition, piezoelectric accelerometers with integrated preamplifiers (ICP/IEPE technology) were preferred to provide high sensitivity over a wide frequency range and to support the use of relatively long connection cables. The data acquisition system was required to provide a high sampling rate (above 10 kHz per channel), high analog-to-digital conversion precision (minimum 14-bit resolution), a minimum of four measurement channels, and integrated signal conditioning to ensure stable multi-channel recording.
For acoustic measurements, a sound level meter calibrated in a specialized metrological laboratory was required, equipped with a windscreen and integrated filters for free-field and diffuse-field corrections. The instrument was selected to support standard exponential time weightings (Fast, Slow, and Impulse), frequency weightings (at least A and C), peak detection, and linear averaging. Additional selection criteria included low power requirements (preferably without separate external power sources), reduced dimensions for field deployment, resistance to shocks and vibration, and safe operation under demanding test conditions.
The acoustic measurement system employed a precision sound level meter (Brüel & Kjær 2245—Brüel & Kjær, Nærum, Denmark), enabling real-time monitoring of equivalent continuous sound pressure levels (Leq), spectral variation, and peak/minimum/maximum sound pressure levels during acquisition. Measurement data were exported for post-processing and reporting using dedicated software suites, including Noise Partner 1.8.2.0 (Brüel & Kjær, Nærum, Denmark) and Enviro Noise Partner 1.8.2.0 (Brüel & Kjær, Nærum, Denmark), supporting standardized computation of Leq descriptors and additional frequency-domain outputs where required. The overall acoustic measurement architecture followed a structured measurement protocol, including instrument setup, calibration and background-noise verification, parameter documentation, data consolidation, and reporting.
The data acquisition system was configured with built-in anti-aliasing filters corresponding to the selected sampling rate (50 kHz), ensuring compliance with the Nyquist criterion and preventing high-frequency spectral folding.
To support synchronized vibro-acoustic acquisition, a digital measurement system was implemented by integrating the sound level meter with a multi-sensor vibration subsystem, including triaxial and monoaxial accelerometers, a data acquisition board (IOtech 650u), a dedicated computing unit, and standardized connection cabling. Multi-channel signal recording and real-time monitoring were managed through a dedicated application developed in DasyLab 12.0, which enabled sensor calibration parameter input based on certificate data, acquisition time configuration, sampling rate setup at 50,000 samples/s (50 kHz), real-time multi-channel visualization, online RMS monitoring, and data storage for subsequent processing. This architecture ensured temporal alignment between acoustic and vibration channels and enabled consistent dataset construction across vehicles, repetitions, and operating regimes.
The architecture of the proposed noise and vibration measurement system was defined starting from a set of performance-driven requirements derived from the objectives of vibro-acoustic comfort assessment in special-purpose vehicles. The primary goal was to ensure synchronized acquisition, reliable processing, and traceable storage of acoustic and vibration data under operationally realistic conditions. To this end, functional, performance, and compliance requirements were identified and mapped to corresponding system objectives, forming the basis for the integrated measurement architecture illustrated in Figure 7. Synchronization between acoustic and vibration channels (Requirement R1) was achieved through coordinated acquisition timing using fixed-duration measurement windows (5 min) under stabilized operating regimes. Start/stop procedures were aligned to ensure that Leq and RMS-based indicators were computed over identical temporal intervals corresponding to the same operating condition. Since the statistical analysis relied on equivalent scalar descriptors rather than time-history coherence analysis, window-level synchronization was sufficient to ensure valid cross-domain association.
Figure 7.
Block diagram of the integrated vibro-acoustic acquisition system.
Table 1 summarizes the key performance requirements considered during system design, together with their associated objectives. These requirements guided the selection of sensors, data acquisition hardware, software environment, and data handling strategy, ensuring that the proposed system supports correlated vibro-acoustic analysis, scalability, and compliance with applicable standards.
Table 1.
Performance requirements for the proposed vibro-acoustic measurement system.
Signal recording, monitoring, and preliminary processing were managed through a dedicated application developed in DasyLab 12.0. The application (Figure 8) enabled the input of sensor calibration parameters based on calibration certificates, configuration of acquisition parameters, and real-time management of the measurement process. Data acquisition was performed at a sampling rate of 50,000 samples/s (50 kHz), ensuring adequate temporal resolution for vibration analysis. The application provided start/stop control of the measurement process, real-time graphical visualization of vibration signals across four channels, and online computation and display of RMS values for each measurement axis and seat channel. A fixed processing window of 5 s was used for real-time RMS computation, while the overall duration of each vibration measurement sequence was 5 min, allowing stable and representative indicator extraction. All acquired data were automatically stored for subsequent post-processing and statistical analysis.
Figure 8.
Real-time vibration monitoring and RMS processing interface implemented in DasyLab 12.0.
The implemented instrumentation and data acquisition system fulfills the defined performance requirements by enabling synchronized measurement, digital processing, real-time visualization, and secure data storage. Its modular structure allows adaptation to different vehicle configurations and sensor layouts, supports scalable integration of additional measurement channels, and ensures traceability from raw signals to processed indicators within the proposed process-oriented vibro-acoustic assessment framework.
2.6. Data Processing and Indicators
The acquired acoustic and vibration signals were processed using a structured and reproducible workflow designed to ensure consistency across vehicle platforms, operating regimes, and repeated measurements. Data processing was performed after acquisition, following verification of signal integrity and synchronization between acoustic and vibration channels. This ensured that noise and vibration indicators corresponded to the same operational state and measurement window. Acoustic signal processing focused on the computation of equivalent continuous sound pressure levels (Leq), expressed in dBA, which were selected as the primary descriptors of interior and exterior noise exposure. Raw sound pressure level time histories were subjected to standardized frequency and time weighting procedures (A-weighting and Fast/Slow weighting, as applicable), in accordance with regulatory and methodological requirements. For each vehicle type, operating regime (stationary or dynamic), and repetition (including P1/P2 for exterior measurements), Leq values were computed over fixed acquisition windows and consolidated into regime-specific datasets. Where additional insight into frequency-dependent contributions was required, octave or one-third-octave band spectra were extracted as complementary descriptors.
Vibration signal processing was based on root mean square (RMS) indicators derived from acceleration time histories measured at the cabin floor and seat interfaces. For triaxial accelerometer data, RMS values were computed independently for the X, Y, and Z axes, while monoaxial seat measurements focused on the vertical (Z) direction, which is most relevant for whole-body vibration exposure. Prior to RMS computation, vibration signals were subjected to offset removal and consistency checks to ensure stable indicator extraction. RMS values were computed using fixed processing windows and subsequently averaged over the total measurement duration to obtain representative vibration descriptors for each operating condition.
To support the proposed process-oriented framework, all computed acoustic and vibration indicators were organized into a unified and structured dataset. The dataset was indexed by vehicle type, measurement location (interior/exterior for acoustics; floor/seat and axis for vibrations), operating regime, engine operating condition, and repetition index. This data structure enabled systematic comparison across platforms and regimes and provided the input for subsequent statistical association analyses, including correlation and regression modeling.
Figure 9 illustrates the process-oriented transformation of synchronized raw acoustic and vibration time-series into standardized vibro-acoustic indicators. Interior and exterior sound pressure level signals, together with floor and seat vibration signals, are subjected to time window selection, validation, synchronization, and frequency–time weighting. RMS- and Leq-based indicators are subsequently computed and organized into regime-specific datasets suitable for correlation and regression analysis, enabling consistent comparison across vehicle types and operating regimes.
Figure 9.
Process-oriented representation of vibro-acoustic data transformation.
By formalizing data processing and indicator extraction within a consistent workflow, the methodology ensures traceability from raw measurements to decision-ready indicators. This approach transforms raw vibro-acoustic signals into standardized descriptors suitable for regime-specific contributor identification, comparative assessment, and mitigation prioritization, as developed in the following sections.
2.7. Statistical Analysis
Based on the theoretical background, regulatory framework, and experimental design presented in the previous sections, the following research hypotheses were formulated:
H1.
There exists a statistically significant positive correlation between the interior equivalent sound pressure level (Interior Leq) and the exterior equivalent sound pressure level (Exterior Leq).
H2.
A positive correlation exists between interior acoustic pressure levels measured in stationary and dynamic operating regimes and the RMS vibration values recorded under corresponding operating conditions.
H3.
There exists a positive correlation between the RMS vibration values measured at the seat level and those measured at the lower cabin floor level along the vertical (Z) axis.
These hypotheses aim to validate the interdependence between acoustic and vibration phenomena in special-purpose vehicles and to support an integrated vibro-acoustic comfort assessment approach.
For statistical processing and correlation analysis, all experimental variables were classified according to their nature, measurement units, operational limits, and coding requirements for SPSS 29.0 (licensed) processing (IBM Corp., Armonk, NY, USA) (Table 2).
Table 2.
Definition and classification of experimental variables.
Statistical analysis was performed to quantify the relationships between acoustic and vibration indicators and to identify dominant contributors to vibro-acoustic comfort under stationary and dynamic operating regimes. Linear correlation analysis based on the Pearson correlation coefficient (r) was employed to assess the strength and direction of associations between interior noise levels (Leq_in) and vibration indicators (RMS_x, RMS_y, RMS_z, RMS_seat).
To further evaluate the contribution of vibration indicators to interior noise levels, linear regression models were developed using Leq_in as the dependent variable and vibration-related RMS indicators as independent variables. Separate analyses were conducted for stationary and dynamic operating regimes to account for regime-specific excitation mechanisms.
Statistical significance was assessed using a two-tailed test with a confidence level of 95% (p < 0.05). Correlation strength was interpreted using conventional thresholds, where |r| < 0.3 indicates weak correlation, 0.3 ≤ |r| < 0.5 moderate correlation, and |r| ≥ 0.5 strong correlation. All statistical analyses were conducted using SPSS 29.0 (licensed), ensuring consistency and reproducibility of results. For each reported mean value, 95% confidence intervals were calculated using Student’s t-distribution based on repeated measurement trials.
3. Results and Experimental Findings
This section presents the results obtained by applying the process-oriented vibro-acoustic assessment framework described in Section 2. The results are reported separately for stationary and dynamic operating regimes to account for differences in excitation mechanisms and signal characteristics. Acoustic and vibration indicators are first presented as descriptive outcomes, followed by statistical association results derived from correlation and regression analyses. Interpretation of the observed trends and engineering implications are addressed in Section 4 (Discussion).
3.1. Vibro-Acoustic Indicators Under Stationary Operating Regime
This section presents the experimental results obtained under stationary operating conditions, focusing on the relationship between exterior acoustic emissions and vibration levels measured at the cabin interfaces. All reported values represent arithmetic mean values, calculated from measurements performed on five special-purpose vehicles, with two repeated measurements for each engine speed level, in order to reduce random variability and enhance result robustness.
Figure 10 illustrates the variation in the mean exterior equivalent sound pressure level (LAeq,out) as a function of engine speed under stationary operating conditions. Measurements were performed on both sides of the vehicle (P1/P2 configuration), and the presented values correspond to the averaged results across all tested vehicles.
Figure 10.
Variation in mean exterior equivalent sound pressure level (LAeq,out) with engine speed under stationary operating conditions (mean values obtained from five vehicles, both sides P1/P2).
In Figure 10, the green bars represent the mean exterior equivalent sound pressure levels measured on side P1 of the vehicle, while the blue bars correspond to the measurements performed on side P2. The values shown represent the averaged results obtained from measurements performed on five vehicles under stationary operating conditions. As engine speed increases from 1000 to 1600 rpm, a clear rising trend of the exterior noise level can be observed, reaching a maximum mean value of approximately 122 dBA at 1600 rpm. Beyond this operating point, a slight decrease is noted at higher engine speeds, which can be attributed to changes in engine loading conditions and exhaust flow characteristics under stationary operation. The high exterior level (~122 dB (A)) recorded at 1600 rpm corresponds to near-field LAeq,out measurements conducted under stationary high engine load. Given the measurement proximity and exhaust-dominated acoustic field, such values are physically plausible for heavy armored platforms. Instrument calibration was verified before testing, and background noise was significantly lower than the measured levels, ensuring data validity. These high values are consistent with heavy tracked armored platforms operating under near-field measurement geometry.
Figure 11 presents the corresponding variation in the mean interior equivalent sound pressure level (LAeq,int) measured inside the cabin under stationary conditions. The results indicate a progressive increase in interior noise with engine speed, from 85.36 dBA at 1000 rpm to 93.80 dBA at 2200 rpm. Compared to exterior noise levels, interior values exhibit lower absolute magnitudes, reflecting the attenuation provided by the vehicle structure and cabin enclosure.
Figure 11.
Variation in mean interior equivalent sound pressure level (LAeq,int) with engine speed under stationary operating conditions.
The non-monotonic behavior observed around intermediate engine speeds (e.g., 1600–1800 rpm) suggests the presence of resonance phenomena and structure-borne transmission paths, which contribute differently to cabin noise depending on excitation frequency.
Table 3 summarizes the mean RMS vibration values measured at the cabin floor and seat level for each engine speed under stationary operating conditions. Triaxial vibration components (X, Y, Z) were recorded at the floor level, while the vertical component (Z) was considered at the seat interface, as it is the most relevant direction for whole-body vibration exposure.
Table 3.
Mean RMS vibration values measured at floor and seat level as a function of engine speed under stationary operating conditions.
The results show that vibration amplitudes increase with engine speed, particularly along the vertical z-axis, which dominates both floor and seat responses. Floor-level Z RMS values increase from 0.89 m/s2 at 1000 rpm to 2.25 m/s2 at 2200 rpm, indicating a strong contribution of engine-induced vertical excitation. Seat-level vibration values remain significantly lower than floor values, confirming the vibration isolation effect provided by the seat suspension system.
Nevertheless, the increasing trend of seat Z RMS values with engine speed highlights the progressive transmission of low-frequency vibrations to the occupant interface, which may have implications for comfort and fatigue during prolonged stationary operation.
3.2. Vibro-Acoustic Indicators Under Dynamic Operating Regime
This section presents the experimental results obtained under dynamic operating conditions, focusing on the evolution of exterior and interior acoustic indicators and vibration levels as a function of gear selection and engine speed. As in the stationary regime, all reported values represent arithmetic mean values, computed from measurements performed on five special-purpose vehicles, with two repeated measurements for each operating point, in order to reduce random variability and improve result reliability.
Dynamic tests were conducted in four transmission stages (Gear I–IV), for engine speeds ranging from 1400 to 2000 rot/min, corresponding to representative operational conditions during vehicle motion. The selected operating points ensure coverage of increasing mechanical load and drivetrain excitation levels.
Figure 12 illustrates the variation in the mean exterior equivalent sound pressure level (LAeq,out) as a function of transmission gear under dynamic operating conditions. A clear increase in exterior noise levels can be observed with both gear progression and engine speed, reflecting the combined contribution of the powertrain, exhaust system, and rolling interaction with the test surface. Compared to stationary conditions, dynamic operation results in systematically higher LAeq,out values, particularly in Gears III and IV, where engine load and torque transmission are significantly increased. The highest exterior noise levels were recorded in Gear IV, reaching mean values above 106 dBA, indicating a substantial acoustic footprint during high-load vehicle operation.
Figure 12.
Variation in mean interior equivalent sound pressure level (LAeq,out) with engine speed under dynamic operating conditions.
Figure 13 presents the variation in the mean interior equivalent sound pressure level (LAeq,int) with engine speed for the four transmission stages. The results highlight a monotonic increase in interior noise levels with engine speed, regardless of the selected gear. However, for identical engine speeds, higher gears generally exhibit increased interior noise levels, suggesting enhanced structure-borne and airborne transmission paths from the drivetrain to the cabin. Mean LAeq,int values ranged from approximately 91.4 dBA at 1400 rot/min (Gear I) to over 104 dBA at 2000 rot/min (Gear IV). These levels significantly exceed commonly accepted comfort thresholds, emphasizing the relevance of vibro-acoustic mitigation strategies for special-purpose vehicles operating under sustained dynamic loads.
Figure 13.
Variation in mean interior equivalent sound pressure level (LAeq,int) with engine speed under dynamic operating conditions.
The mean RMS vibration values measured at floor and seat level under dynamic conditions are summarized in Table 4. The vibration data reveal several important trends:
Table 4.
Mean RMS vibration values measured at floor and seat level as a function of engine speed under dynamic operating conditions.
- (1)
- Floor-level vibrations exhibit a strong dependence on both gear selection and engine speed, with RMS values increasing markedly from Gear I to Gear IV.
- (2)
- The z-axis (vertical direction) consistently shows the highest RMS values, confirming its dominant role in whole-body vibration exposure.
- (3)
- Maximum Z RMS values at floor level reached 12.94 m/s2 in Gear IV at 2000 rot/min, indicating severe vibrational excitation.
- (4)
- Seat-level vibrations, although attenuated compared to floor-level values, still exhibit substantial RMS magnitudes, particularly in higher gears, demonstrating partial but insufficient isolation provided by the seat system.
The observed amplification of vibrations with gear progression reflects increased drivetrain stiffness engagement and higher transmitted torque, which intensifies structure-borne excitation paths.
By comparing stationary and dynamic results, it becomes evident that:
- (1)
- Dynamic exterior noise levels show a different regime-dependent profile compared to stationary operation; in the tested conditions, stationary operation yields the highest peak LAeq,out values, while dynamic operation exhibits lower maxima but broader variability across operating points. The combined action of engine excitation, drivetrain dynamics, and vehicle motion amplifies both airborne and structure-borne contributions.
- (2)
- The correlation between interior noise levels and vertical vibration components (z-axis) becomes more pronounced under dynamic conditions, supporting the hypothesis of coupled vibro-acoustic transmission mechanisms.
These findings justify the subsequent statistical analysis focusing on correlation and regression between acoustic and vibration indicators, as introduced in Section 2.7.
The observed increase in acoustic and vibration indicators under dynamic conditions can be explained through an energy superposition model. While stationary operation is primarily governed by engine-induced excitation, dynamic operation introduces additional independent excitation sources such as drivetrain torque transmission, tire–road interaction, suspension dynamics, and structural coupling. Since acoustic pressure contributions combine energetically and vibration RMS values combine quadratically, the resulting equivalent sound pressure level and vibration magnitude increase according to:
and
respectively. The presence of these additional excitation mechanisms explains the systematically higher vibro-acoustic indicators recorded during dynamic operation.
3.3. Analysis of the Relationship Between Interior and Exterior Acoustic Pressure Levels Under Stationary and Dynamic Operating Conditions
Following the correlation analysis, the results presented in Table 5 and Figure 14 were obtained. The analysis aimed to quantify the statistical relationship between engine speed, interior equivalent sound pressure level (InteriorLeq), and exterior equivalent sound pressure level (ExteriorLeq), under both stationary and dynamic operating regimes.
Table 5.
Pearson correlation matrix and two-tailed significance test results for engine speed, interior and exterior equivalent sound pressure levels (N = 26).
Figure 14.
Correlation and linear regression analysis between interior and exterior equivalent sound pressure levels: (a) Pearson correlation scatter plot; (b) Linear regression model with 95% confidence intervals.
The Pearson correlation coefficients, corresponding significance levels (two-tailed test), and sample size (N = 26) are summarized in Table 5. The variables considered were defined as follows:
- (1)
- VAR001—engine speed (rpm),
- (2)
- VAR002—interior equivalent sound pressure level (InteriorLeq),
- (3)
- VAR003—exterior equivalent sound pressure level (ExteriorLeq).
The main findings of the correlation analysis are:
- (1)
- VAR001 and VAR003 (engine speed—exterior noise): The Pearson correlation coefficient is r = 0.845, indicating a strong positive correlation. The associated significance level (p = 0.000) confirms that this relationship is statistically significant at conventional confidence levels (α = 0.05 and α = 0.01).
- (2)
- VAR001 and VAR002 (engine speed—interior noise): A very strong positive correlation was identified, with r = 0.930 and p = 0.000. This result demonstrates that increases in engine speed are strongly associated with increases in interior noise levels.
- (3)
- VAR003 and VAR002 (exterior noise—interior noise): The correlation coefficient r = 0.803 indicates a strong positive relationship between exterior and interior acoustic levels. The correlation is statistically significant (p = 0.000), suggesting a consistent coupling between external acoustic emissions and in-cabin noise.
Overall, all correlation coefficients are positive and statistically significant, indicating strong interdependencies between the analyzed variables. The correlation coefficient close to unity observed between engine speed and interior noise suggests a high degree of interdependence, likely reflecting the dominant contribution of engine-related excitation mechanisms to interior acoustic conditions. Use of a calibrated sound level meter in a specialized metrology laboratory, equipped with a windscreen and built-in filters for free-field or diffuse-field corrections.
In addition to correlation analysis, a linear regression model was developed to describe the relationship between InteriorLeq (independent variable) and ExteriorLeq (dependent variable). The regression results are illustrated in Figure 14b. The estimated regression parameters are:
- (1)
- Slope (regression coefficient): 2.3573
- (2)
- Intercept: −113.5920
This indicates that for each 1 dBA increase in the interior equivalent sound pressure level, the exterior equivalent sound pressure level increases on average by approximately 2.36 dBA, after accounting for the intercept.
The statistical significance of the regression coefficients was evaluated using a two-tailed t-test:
- (1)
- Intercept: t = −3.7005, p = 0.0010158
- (2)
- Slope: t = 6.8913, p = 2.5743 × 10⁻⁷
The very low p-values (p < 0.05) confirm that both coefficients are significantly different from zero, demonstrating a statistically significant linear relationship between the variables.
The goodness-of-fit indicators further support the validity of the model:
- (1)
- Coefficient of determination (R2): 0.646
- (2)
- Adjusted R2: 0.633.
These values indicate that approximately 64.6% of the variability in exterior noise levels can be explained by variations in interior noise levels. Such an R2 value denotes a statistically meaningful and practically relevant model.
The Root Mean Squared Error (RMSE) of the regression model is 5.16 dBA, representing the standard deviation of the residuals. This value suggests an acceptable prediction accuracy for vibro-acoustic field measurements conducted under real operating conditions.
The regression plot shows the experimental data points alongside the fitted regression line and the 95% confidence intervals. The relatively narrow confidence bands indicate a stable and reliable model within the analyzed operating range.
The study was conducted on two vehicle types belonging to the same special-purpose vehicle category, under identical test conditions, in order to enhance the robustness and generalizability of the findings.
Based on the statistical evidence provided by the correlation and regression analyses, research hypothesis H1 is confirmed:
H1.
There is a statistically significant positive correlation between interior and exterior equivalent sound pressure levels (Leq).
Consequently, the results demonstrate a strong and statistically significant linear relationship between interior and exterior noise levels. This finding implies that mitigation strategies targeting interior noise reduction may also contribute to reducing exterior acoustic emissions, and vice versa, which is particularly relevant for the vibro-acoustic optimization of special-purpose vehicles.
3.4. Analysis of the Relationship Between Interior and Exterior Acoustic Pressure Levels Under Stationary and Dynamic Operating Conditions
This subsection investigates the relationship between the root mean square (RMS) vibration levels measured along the vertical (Z) axis at the seat and floor level of special-purpose vehicles, under both stationary and dynamic operating regimes, across a representative range of engine speeds. The analysis aims to quantify the degree of interdependence between vibration transmission paths and to assess the influence of engine speed on vibration amplitudes perceived at different cabin interfaces.
The statistical evaluation was performed using Pearson correlation analysis and linear regression models, based on the experimental dataset described above. The results obtained from the two-tailed t-test and Pearson correlation analysis are summarized in Table 6, while the graphical representation of correlations and regression models is presented in Figure 15.
Table 6.
Pearson correlation matrix and two-tailed t-test results between engine speed and RMS vibration levels on the z-axis at floor and seat level (stationary and dynamic operating conditions).
Figure 15.
Correlation and linear regression analysis of RMS vibration values on the z-axis measured at floor and seat level under stationary and dynamic operating conditions: (a) Pearson correlation between RMS Z-floor and RMS Z-seat vibration levels; (b) Linear regression model between RMS Z-floor and RMS Z-seat vibration levels (95% confidence interval); (c) Linear regression analysis between engine speed and RMS Z-seat vibration levels; (d) Linear regression analysis between engine speed and RMS Z-floor vibration levels.
The Pearson correlation coefficients indicate distinct relationships between the analyzed variables:
- (1)
- The correlation between engine speed (VAR001) and RMS Z-floor vibration levels (VAR002) yielded a Pearson coefficient of r = 0.412, with a significance level of p = 0.051. This result indicates a moderate positive correlation, which is marginally statistically significant at the 5% level, suggesting that increases in engine speed tend to be associated with higher vibration levels at the floor interface.
- (2)
- The correlation between engine speed (VAR001) and RMS Z-seat vibration levels (VAR003) resulted in a Pearson coefficient of r = 0.260, with p = 0.230, indicating a weak and statistically non-significant relationship. This suggests that vibration transmission to the seat is less directly dependent on engine speed, likely due to damping effects introduced by seat structure and mounting systems.
- (3)
- A strong and statistically significant correlation was identified between RMS Z-floor (VAR002) and RMS Z-seat (VAR003) vibration levels, with a Pearson coefficient of r = 0.781 and p < 0.001. This finding demonstrates a strong positive relationship, indicating that vibrations measured at the floor level are effectively transmitted to the seat, despite attenuation mechanisms.
To further characterize these relationships, linear regression models were applied:
- (1)
- The regression model describing the relationship between engine speed and RMS Z-floor vibrations is given by:with an R2 value of 0.17 and p ≈ 0.05, indicating that approximately 17% of the variability in floor-level vibrations can be explained by engine speed.
- (2)
- The regression between engine speed and RMS Z-seat vibrations showed a low explanatory power (R2 = 0.068, p = 0.230), confirming the absence of a statistically significant linear dependency.
- (3)
- The regression model between RMS Z-floor and RMS Z-seat vibrations is expressed as:with a coefficient of determination R2 = 0.61 and p < 0.001, indicating that over 60% of the variability in seat-level vibrations can be explained by vibrations measured at the floor interface.
The combined correlation and regression analyses highlight a clear transmission pathway of vertical vibrations from the vehicle floor to the seat structure. While engine speed has a limited direct influence on seat-level vibrations, its effect on floor-level vibrations is more pronounced and subsequently propagates through the structural system. These results confirm research hypothesis H3, which states that a significant positive correlation exists between RMS vibration values measured at seat level and those measured at the lower floor interface along the z-axis. The findings are consistent across both stationary and dynamic operating conditions and were validated for two special-purpose vehicle configurations under identical test conditions.
3.5. Analysis of the Relationship Between Weighted RMS Vibration Levels at the Vehicle Floor and Interior Acoustic Pressure Level Under Stationary and Dynamic Operating Conditions
This subchapter investigates the relationship between the weighted RMS vibration levels measured at the vehicle floor and the equivalent interior acoustic pressure level (InteriorLeq), under both stationary and dynamic operating conditions, for a wide range of engine speeds. The objective of this analysis is to identify and quantify the extent to which structural vibrations transmitted through the vehicle floor contribute to the acoustic environment perceived inside the cabin. The analysis is based on experimental data acquired under identical test conditions, including stationary engine operation and vehicle motion across different gears and engine speeds. The dataset includes engine speed, weighted RMS vibration values calculated from the vibration components measured along the X, Y, and Z axes at floor level, and the corresponding interior equivalent sound pressure level (InteriorLeq). The weighted RMS vibration indicator was used to provide a global measure of vibration severity at the vehicle–structure interface. To evaluate the strength and direction of the linear relationship between the weighted RMS vibration values and the interior acoustic pressure level, the Pearson correlation coefficient was calculated. Statistical significance was assessed using a two-tailed t-test. In addition, a linear regression model was developed to quantify the dependence of InteriorLeq on the weighted RMS vibration levels and to assess the predictive capability of the vibration indicator.
The results of the correlation analysis are presented in Table 7, while the graphical representation of the correlation and the fitted regression model is shown in Figure 16.
Table 7.
Pearson correlation results between weighted RMS vibration levels at floor level and interior equivalent sound pressure level (InteriorLeq).
Figure 16.
Relationship between weighted RMS vibration levels at floor level and interior equivalent sound pressure level under stationary and dynamic operating conditions: (a) Pearson correlation between weighted RMS vibration values and interior equivalent sound pressure level (InteriorLeq); (b) Linear regression model between weighted RMS vibration values and interior equivalent sound pressure level (InteriorLeq).
The Pearson correlation analysis reveals a very strong positive relationship between the weighted RMS vibration levels measured at the vehicle floor and the interior equivalent sound pressure level. The correlation coefficient obtained between the two variables is r = 0.931, with a significance level p < 0.001, indicating that the observed relationship is statistically significant at conventional confidence thresholds (α = 0.05 and α = 0.01).
This result demonstrates that increases in vibration severity at the floor level are strongly associated with increases in interior noise levels, confirming a high degree of interdependence between structural-borne vibrations and airborne noise perceived inside the vehicle cabin. The magnitude of the correlation coefficient suggests that vibration transmission through the vehicle structure plays a major role in shaping the acoustic environment of the habitacle.
To further quantify this relationship, a linear regression model was developed to describe the dependence between the weighted RMS vibration values and the interior equivalent sound pressure level. The resulting regression equation is:
The positive slope (1.527) ind.cates that an increase of 1 m/s2 in the weighted RMS vibration level is associated, on average, with an increase of approximately 1.53 dBA in the interior equivalent sound pressure level. The coefficient of determination for the model is R2 = 0.868, indicating that 86.8% of the variability in the interior acoustic pressure level can be explained by variations in the weighted RMS vibration levels. This high R2 value confirms the strong explanatory power of the model and highlights the dominant influence of structural vibrations on the interior acoustic response. The statistical significance of the regression coefficients (p < 0.001) confirms that the relationship is not due to random variation. The regression plot further illustrates a clear linear trend, with data points closely clustered around the fitted regression line and narrow confidence intervals, reinforcing the robustness of the model.
The combined results of the correlation and regression analyses demonstrate a strong, positive, and statistically significant relationship between weighted RMS vibration levels at floor level and the interior equivalent sound pressure level, under both stationary and dynamic operating conditions. These findings indicate that structural-borne vibrations contribute directly and substantially to the interior noise perceived by the vehicle occupants. Consequently, vibration mitigation strategies at the structural level—such as improved damping, isolation, or optimized material selection—are expected to yield measurable reductions in interior noise levels. Based on these results, the research hypothesis is confirmed:
H3.
There exists a positive correlation between interior acoustic pressure levels under stationary and dynamic conditions and the RMS values of vibrations measured under the same operating regimes.
4. Discussion
The present study provides a systematic interpretation of vibro-acoustic interactions in special-purpose vehicle cabins by integrating synchronized experimental measurements with correlation and regression-based statistical analysis. Unlike conventional approaches that address noise and vibration separately, the results demonstrate that interior acoustic comfort is governed by strongly coupled airborne and structure-borne mechanisms, whose relative influence depends on operating regime and structural transmission paths.
The instrumentation architecture was selected to ensure operational feasibility and cross-platform comparability within a process-oriented assessment framework. While additional accelerometers and frequency-resolved acoustic acquisition would enable advanced source separation and transfer path analysis, such extensions were beyond the methodological scope of the present study and represent a direction for future work.
A first key observation emerging from the results is the pronounced contrast between stationary and dynamic operating regimes. Under stationary conditions, both interior noise levels and RMS vibration amplitudes increase progressively with engine speed, but remain significantly lower than those recorded during vehicle motion. This confirms that engine-related excitation represents a dominant but not exclusive contributor to cabin vibro-acoustic conditions. The non-monotonic behavior observed at intermediate engine speeds suggests the presence of resonance effects and frequency-dependent structural amplification, consistent with prior findings in vehicle NVH studies [49,50,52,53,54] that identify specific engine orders and structural modes as dominant contributors in idle and quasi-steady regimes. In contrast, dynamic operation introduces additional excitation mechanisms associated with drivetrain loading, rolling interaction, and body–chassis coupling. The substantially higher LAeq values and RMS vibration magnitudes recorded under dynamic conditions indicate that vibration transmission paths become more efficient as mechanical load increases. This explains why interior noise levels exceed stationary values even at comparable engine speeds, highlighting the cumulative effect of powertrain excitation and vehicle motion on perceived comfort.
One of the most significant outcomes of this study is the identification of a very strong statistical coupling between weighted RMS vibration levels at floor level and the interior equivalent sound pressure level. The Pearson correlation coefficient of r = 0.931, together with a high coefficient of determination (R2 = 0.868), provides compelling evidence that structure-borne vibrations transmitted through the vehicle floor play a dominant role in shaping the in-cabin acoustic environment. From a physical perspective, this result confirms that the vehicle floor acts as a primary transmission interface, converting mechanical energy into radiated sound within the cabin. While airborne noise paths (e.g., through panels and apertures) remain relevant, the regression model demonstrates that a substantial proportion of interior noise variability can be explained solely by vibration severity at the structural interface. This finding is consistent with the recent literature emphasizing the growing importance of structure-borne noise in modern vehicles, especially in heavy and special-purpose platforms characterized by stiff structural layouts and high mechanical excitation. The strong correlation identified between floor-level and seat-level RMS vibration values along the z-axis further reinforces this interpretation. Although seat suspension systems provide partial attenuation, the transmission of vertical vibrations remains significant, confirming that vibration isolation alone is insufficient to decouple structural excitation from occupant exposure. This result has direct implications for both comfort and fatigue, as vertical whole-body vibration is known to be particularly detrimental during prolonged exposure.
Beyond individual statistical relationships, the results validate the proposed correlation-driven, process-oriented framework for vibro-acoustic comfort assessment. By embedding correlation and regression analysis into a structured workflow—from synchronized measurement to decision-oriented interpretation—the study demonstrates how statistical tools can be elevated from descriptive post-processing techniques to actionable engineering instruments. The ability to classify contributors based on correlation strength and explanatory power enables transparent prioritization of mitigation strategies. For example, the strong RMS-weighted–InteriorLeq relationship clearly indicates that interventions targeting structural vibration reduction at floor level are likely to yield greater comfort improvements than isolated airborne noise treatments alone. This supports a shift toward integrated NVH strategies that combine damping, isolation, and optimized material deployment at structurally critical interfaces.
The findings of this study are in strong agreement with recent experimental and review-based research highlighting the coupled nature of noise and vibration exposure in vehicular environments. Studies [1,32] emphasize that treating noise and vibration as independent phenomena can lead to incomplete or misleading comfort assessments. Similarly [2,49] demonstrated that engine-induced vibration patterns significantly influence in-cabin acoustic response, particularly in mechanically intensive operating regimes. What differentiates the present work is the explicit formalization of this coupling into a reproducible assessment process. Rather than reporting isolated correlations, the study establishes quantitative thresholds, regression-based explanatory models, and regime-specific interpretations that can be directly integrated into design and optimization workflows for special-purpose vehicles.
From an engineering standpoint, the results suggest that effective vibro-acoustic mitigation should prioritize:
- (1)
- structural vibration control at floor and lower-body interfaces through damping layers, constrained-layer treatments, or optimized structural stiffness;
- (2)
- improved vibration isolation strategies for seat mounting systems, particularly along the vertical axis;
- (3)
- coordinated noise and vibration mitigation, recognizing that reductions in vibration severity can yield simultaneous reductions in interior noise.
Such measures are particularly relevant for special-purpose and military vehicles, where operational constraints often limit the applicability of lightweight acoustic treatments and where prolonged exposure amplifies the impact of vibro-acoustic discomfort on operator performance.
To strengthen comfort interpretation, the measured vibro-acoustic indicators were contextualized with reference to established comfort assessment principles. For vibration exposure, RMS values were interpreted in relation to commonly adopted whole-body vibration evaluation criteria (e.g., ISO 2631 framework), allowing qualitative classification of exposure severity.
For acoustic levels, interior LAeq values were discussed relative to typical comfort and annoyance thresholds reported in the vehicle NVH literature. Although the present study focuses on process-oriented assessment rather than psychoacoustic modelling, these contextual references enable practical interpretation of the measured magnitudes in terms of perceived comfort impact.
It should be emphasized that the present study identifies statistically significant vibro-acoustic associations within a structured process framework rather than demonstrating strict physical causation. Detailed frequency-domain vibration analysis has been performed within the broader research program; however, full spectral coupling investigation between vibration and interior sound pressure is beyond the scope of this process-oriented study and will be addressed in a dedicated follow-up publication.
Despite the robustness of the proposed process-oriented framework, several limitations should be acknowledged.
First, although strong statistical associations were identified between acoustic and vibration indicators, correlation and regression analysis do not establish direct causality between specific excitation sources and interior acoustic response. The identified relationships indicate dominant transmission tendencies; however, controlled source-separation experiments or advanced coherence-based analyses would be required to confirm direct causal mechanisms.
Second, the experimental validation was conducted on a limited number of vehicles within a specific special-purpose vehicle category. While repeated measurements were performed to improve robustness, the quantitative thresholds and regression coefficients should be interpreted within the tested operational context.
Third, certain structural and mass-related parameters (e.g., detailed vehicle mass distribution, structural stiffness properties, and drivetrain load characteristics) were not explicitly introduced as independent variables in the statistical modelling stage. This is partly due to the classified and restricted nature of the tested special-purpose vehicle platforms, where detailed structural specifications are not publicly accessible. Consequently, the framework relies on experimentally measurable vibro-acoustic indicators rather than full parametric modelling of structural properties. Future research conducted on non-restricted platforms could integrate such parameters within multivariable models to further refine source attribution and predictive capability.
The identification of dominant contributors reflects statistical association patterns under controlled operational conditions and should not be interpreted as definitive physical causation without complementary transfer-path or frequency-domain validation.
5. Conclusions
This study proposed and validated a correlation-driven, process-oriented framework for vibro-acoustic comfort assessment in special-purpose vehicle cabins, addressing a methodological gap identified in current practice. By formalizing vibro-acoustic evaluation as a structured workflow—from synchronized measurements to statistically supported decision outputs—the approach enhances traceability, reproducibility, and engineering relevance.
The experimental and statistical analyses confirm that interior acoustic conditions are strongly influenced by structure-borne vibration mechanisms, particularly those transmitted through the vehicle floor. The strong coupling identified between weighted RMS vibration levels and interior equivalent sound pressure levels demonstrates that vibration severity is a key driver of in-cabin noise, underscoring the need for integrated vibration–noise mitigation strategies rather than isolated acoustic treatments.
From an application perspective, the results support a shift toward system-level vibro-acoustic optimization in special-purpose vehicles, where structural vibration control at critical interfaces can deliver substantial comfort improvements. The proposed framework enables objective contributor ranking and mitigation prioritization, making it suitable for design evaluation, retrofit decision-making, and comparative assessment across operating regimes.
A detailed frequency-domain analysis of vibration signals and their coupling with interior acoustic pressure has been conducted within the broader research program. However, to preserve the process-oriented focus of the present study, the spectral coupling investigation is not expanded here and will be presented in a dedicated follow-up publication addressing frequency-resolved vibro-acoustic interaction mechanisms. Future work will include controlled intervention experiments (before/after damping or isolation at floor interfaces), band-limited vibro-acoustic coupling validation in the frequency domain, and transfer-path-oriented analysis (e.g., TPA) to quantify structure-borne contributions and strengthen causal validation.
Future work should extend the methodology by incorporating frequency-domain and psychoacoustic indicators, expanding the vehicle dataset, and integrating predictive or optimization-based models. Such developments would further strengthen the framework’s applicability to advanced vehicle design, lifecycle management, and regulation-oriented comfort assessment.
Author Contributions
Conceptualization, B.-M.C. and C.V.; methodology, B.-M.C. and M.T.; software B.-M.C.; validation, C.V. and P.B.; formal analysis, B.-M.C.; investigation, B.-M.C.; resources, B.-M.C.; data curation, C.V.; writing—original draft preparation, B.-M.C.; writing—review and editing, B.-M.C., C.V. and P.B.; visualization, C.V.; supervision, C.V.; project administration, B.-M.C.; funding acquisition, M.T. All authors have read and agreed to the published version of the manuscript.
Funding
This work was supported by the University of Medicine, Pharmacy, Science and Technology “George Emil Palade” of Târgu Mureș Research Grant number 163/1/10.01.2023.
Data Availability Statement
The original contributions presented in this study are included in the article. Further inquiries can be directed to the corresponding author.
Conflicts of Interest
The authors declare no conflicts of interest.
References
- Khan, D.; Burdzik, R. Noise and vibration as environmental impacts of transportation: Comprehensive review. Transp. Res. Interdiscip. Perspect. 2025, 34, 101578. [Google Scholar] [CrossRef] [Scilit]
- Lv, W.; Chen, K.; Li, W.; Dong, M. A Method for Analysing In-Vehicle Acoustic Response to Engine Excitation. Eng 2025, 6, 285. [Google Scholar] [CrossRef] [Scilit]
- Fu, Y.; Wang, X. Advancements and trends in vehicle sound package for noise control: A comprehensive review. Adv. Mech. Eng. 2025, 17, 16878132251345867. [Google Scholar] [CrossRef] [Scilit]
- Zhao, H.; Chen, K.; Li, H.; Luo, J.; Dang, J. Method of satisfaction based on-board acoustic comfort classification and its applications. Acta Acust. 2025, 9, 22. [Google Scholar] [CrossRef] [Scilit]
- Back, J.; Lee, S.K.; Lee, S.M.; An, K.; Kwon, D.H.; Park, D.C. Design and implementation of comfort-quality HVAC sound inside a vehicle cabin. Appl. Acoust. 2021, 177, 107940. [Google Scholar] [CrossRef] [Scilit]
- Qian, K.; Hou, Z. Intelligent evaluation of the interior sound quality of electric vehicles. Appl. Acoust. 2021, 173, 107684. [Google Scholar] [CrossRef] [Scilit]
- Navai, M.; Veitch, J.A. Acoustic Satisfaction in Open-Plan Offices: Review and Recommendations; Research Report RR-151; Institute for Research in Construction, National Research Council Canada: Ottawa, ON, Canada, 2003.
- Borelli, D.; Gaggero, T.; Rizzuto, E.; Schenone, C. Onboard ship noise: Acoustic comfort in cabins. Appl. Acoust. 2021, 177, 107912. [Google Scholar] [CrossRef] [Scilit]
- Bocanegra, J.A.; Borelli, D.; Gaggero, T.; Rizzuto, E.; Schenone, C. Characterizing onboard noise in ships: Insights from statistical, machine learning and advanced noise index analyses. Ocean Eng. 2023, 285, 115273. [Google Scholar] [CrossRef] [Scilit]
- Sainati, T.; Locatelli, G.; Smith, N.; Brookes, N.; Olver, G. Types and functions of special purpose vehicles in infrastructure megaprojects. Int. J. Proj. Manag. 2020, 38, 243–255. [Google Scholar] [CrossRef] [Scilit]
- Klyusov, N.; Garin, N.; Usenyuk-Kravchuk, S.; Vasilieva, E.; Ustinov, K. A Biomorphic Approach to Designing Special-Purpose Vehicles for Arctic Conditions. Biomimetics 2023, 8, 360. [Google Scholar] [CrossRef] [Scilit]
- Nowakowski, M. Operational Environment Impact on Sensor Capabilities in Special Purpose Unmanned Ground Vehicles. In Proceedings of the 21st International Conference on Mechatronics—Mechatronika (ME 2024), Brno, Czech Republic, 4–6 December 2024; pp. 1–5. [Google Scholar] [CrossRef] [Scilit]
- Mousavi Kordmiri, S.H.; Aliabadi, M.; Golmohammadi, R.; Bovenzi, M.; Farhadian, M. Combined Effects of Noise and Hand-Transmitted Vibration on Workers’ Muscle and Mental Fatigues in a Simulated Construction Operation. Int. J. Environ. Res. Public Health 2023, 20, 6060. [Google Scholar] [CrossRef] [Scilit] [PubMed] [PubMed Central]
- Mousavi Kordmiri, S.H.; Aliabadi, M.; Golmohammadi, R.; Farhadian, M.; Abbasi Balochkhaneh, F. Effect of concurrent exposure to noise and hand-transmitted vibration on auditory and cognitive attention under simulated work with construction tools. Int. J. Occup. Saf. Ergon. 2024, 30, 754–764. [Google Scholar] [CrossRef] [Scilit] [PubMed]
- Sommer, H.C.; Harris, C.S. Combined effects of noise and vibration on human tracking performance and response time. Aerosp. Med. 1973, 44, 276–280. [Google Scholar] [PubMed]
- Munder, M.; Carbon, C.-C. A literature review (2000–2022) on vehicle acoustics: Investigations on perceptual parameters of interior soundscapes in electrified vehicles. Front. Mech. Eng. 2022, 8, 974464. [Google Scholar] [CrossRef] [Scilit]
- Ali, Y.; Sharma, A.; Zheng, Z. Empirical research on car-following and lane-changing: Recent developments, emerging vehicle technologies’ impact, and future research needs. Transp. Res. Interdiscip. Perspect. 2025, 31, 101368. [Google Scholar] [CrossRef] [Scilit]
- Ozkan, A.; Yildiz, M.; Yildiz, A. Development of a New Sound Quality Parameter for Road Noise Perception Inside Vehicle Cabinet. Appl. Sci. 2024, 14, 10473. [Google Scholar] [CrossRef] [Scilit]
- Kumar, P. Traffic noise prediction and optimization using response surface method (RSM). Arab. J. Geosci. 2021, 14, 2181. [Google Scholar] [CrossRef] [Scilit]
- Dratva, J.; Zemp, E.; Dietrich, D.F.; Bridevaux, P.-O.; Rochat, T.; Schindler, C.; Gerbase, M.W. Impact of road traffic noise annoyance on health-related quality of life: Results from a population-based study. Qual. Life Res. 2010, 19, 37–46. [Google Scholar] [CrossRef] [Scilit]
- Araújo Alves, J.; Neto Paiva, F.; Torres Silva, L.; Remoaldo, P. Low-frequency noise and its main effects on human health—A review of the literature between 2016 and 2019. Appl. Sci. 2020, 10, 5205. [Google Scholar] [CrossRef] [Scilit]
- Tiwari, S.K.; Kumaraswamidhas, L.A.; Prince; Kamal, M.; Rehman, M.U. A hybrid deep leaning model for prediction and parametric sensitivity analysis of noise annoyance. Environ. Sci. Pollut. Res. 2023, 30, 49666–49684. [Google Scholar] [CrossRef] [Scilit]
- Chu, T.; Nguyen, T.; Yoo, H.; Wang, J. A review of vibration analysis and its applications. Heliyon 2024, 10, e26282. [Google Scholar] [CrossRef] [Scilit]
- Popa, G.; Oprea, R.A.; Tudor, E.; Gheti, M.A.; Munteanu, I.S. Vibration Measurement and Monitoring in Railway Vehicles. Technologies 2025, 13, 370. [Google Scholar] [CrossRef] [Scilit]
- Khan, D.; Burdzik, R. Measurement and analysis of transport noise and vibration: A review of techniques, case studies, and future directions. Measurement 2023, 220, 113354. [Google Scholar] [CrossRef] [Scilit]
- Capasso, G.; Gogu, C.; Baroth, J.; Navarro, J.-P.; Kempeneers, M. Comparative review of probabilistic frameworks for structural integrity in aeronautical and civil engineering design codes. Prog. Aerosp. Sci. 2025, 158, 101141. [Google Scholar] [CrossRef] [Scilit]
- Slusser, V.E. Optimizing Fleet Management: Evaluating the Feasibility of Electric Vehicles and Leasing Strategies at the UTRGV Police Department. Doctoral Dissertation, Liberty University, Lynchburg, VA, USA, 2025. Available online: https://digitalcommons.liberty.edu/cgi/viewcontent.cgi?article=8635&context=doctoral (accessed on 24 January 2026).
- BS 6841:1987; Guide to Measurement and Evaluation of Human Exposure to Whole-Body Mechanical Vibration and Repeated Shock. British Standards Institution: London, UK, 1987.
- ISO 2631-1:1997; Mechanical Vibration and Shock—Evaluation of Human Exposure to Whole-Body Vibration—Part 1: General Requirements. International Organization for Standardization: Geneva, Switzerland, 1997.
- UIC Code 513; Guidelines for Evaluating Passenger Comfort in Relation to Vibration in Railway Vehicles. UIC: Paris, France, 1994.
- EN 12299:2024; Railway Applications—Ride Comfort for Passengers—Measurement and Evaluation. European Committee for Standardization: Brussels, Belgium, 2024.
- SAE J366; Exterior Sound Level for Heavy Trucks and Buses. SAE International: Warrendale, PA, USA, 2011.
- SAE J986; Sound Level for Passenger Cars and Light Trucks. SAE International: Warrendale, PA, USA, 2018.
- SAE J1074; Engine Sound Level Measurement Procedure. SAE International: Warrendale, PA, USA, 2014.
- European Union. Directive 2003/10/EC—Minimum Health and Safety Requirements Regarding the Exposure of Workers to the Risks Arising from Physical Agents (Noise). Official Journal of the European Union, 6 February 2003.
- European Union. Directive 2002/44/EC—Minimum Health and Safety Requirements Regarding the Exposure of Workers to the Risks Arising from Physical Agents (Vibration). Official Journal of the European Union, 25 June 2002.
- ISO 5349; Mechanical Vibration—Measurement and Evaluation of Human Exposure to Hand-Transmitted Vibration. International Organization for Standardization: Geneva, Switzerland, 2001.
- ISO 8041; Human Response to Vibration—Measuring Instrumentation. International Organization for Standardization: Geneva, Switzerland, 2017.
- ISO 10326; Mechanical Vibration—Laboratory Method for Evaluating Vehicle Seat Vibration. International Organization for Standardization: Geneva, Switzerland, 2016.
- ISO 5805; Mechanical Vibration and Shock Affecting the Human Body—Vocabulary. International Organization for Standardization: Geneva, Switzerland, 1997.
- ISO 2041; Vibration and Shock—Vocabulary. International Organization for Standardization: Geneva, Switzerland, 2018.
- ISO 15037-3; Road Vehicles—Vehicle Dynamics Test Methods. International Organization for Standardization: Geneva, Switzerland, 2022.
- STP M 40527-98; Military Vehicles: Determining the Interior Noise Level. Military Standard: Arlington, VA, USA, 1998.
- STP M 40544-99; Military Vehicles: Determining the Exterior Noise Level. Military Standard: Arlington, VA, USA, 1999.
- MIL-STD-1474; Noise Limits. U.S. Department of Defense: Washington, DC, USA, 2015.
- MIL-HDBK-767; Design Guide for Reducing Interior Noise in Light Tracked Vehicles. U.S. Department of Defense: Washington, DC, USA, 1993.
- MIL-STD-1474D; Department of Defense Design Criteria Standard: Noise Limits. Department of Defense: Washington, DC, USA, 1997.
- Directive 540/2014; Sound Level of Motor Vehicles and of Replacement Silencing Systems. European Parliament and Council: Brussels, Belgium, 2014.
- Horváth, K.; Zelei, A. Simulating Noise, Vibration, and Harshness Advances in Electric Vehicle Powertrains: Strategies and Challenges. World Electr. Veh. J. 2024, 15, 367. [Google Scholar] [CrossRef] [Scilit]
- Hazra, S.; Khan, A. A Review on Electric Vehicle NVH Challenges and Recent Trends. In Proceedings of the Noise & Vibration Conference & Exhibition; SAE Technical Paper 2025-01-0042; SAE International: Warrendale, PA, USA, 2025. [Google Scholar] [CrossRef] [Scilit]
- STAS 6926/16-79; Acoustics—Measurement of Noise Emitted by Road Vehicles. Romanian Standards Institute (ASRO): Bucharest, Romania, 1979.
- Song, D.; Hong, S.; Ha, C.; Song, Y.E. Acoustic analysis and data-driven control of vehicle NVH: A framework for manufacturing process optimization. Appl. Acoust. 2025, 233, 110618. [Google Scholar] [CrossRef] [Scilit]
- Antony, A.; Theimer, W.; Grossetti, G.; Friedrich, C.M. Acoustic Event Detection in Vehicles: A Multi-Label Classification Approach. Sensors 2025, 25, 2591. [Google Scholar] [CrossRef] [Scilit]
- Fiebig, A.; Diechmann, M.; Kolingba-Froidevaux, P.; Mundt, A.; Schuck, M. Psychoacoustic assessment of loud vehicles recorded by a noise radar. In Proceedings of the 11th Convention of the European Acoustics Association (Euronoise 2025), Málaga, Spain, 23–26 June 2025; European Acoustics Association: Madrid, Spain, 2025. [Google Scholar]
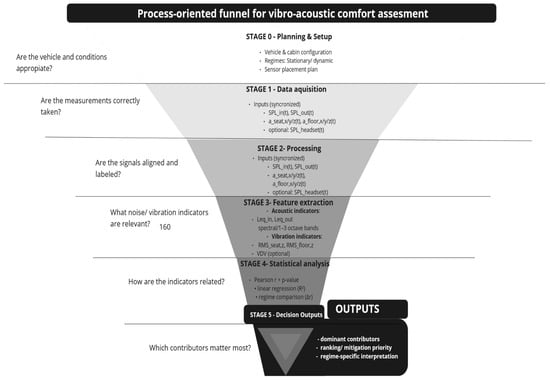
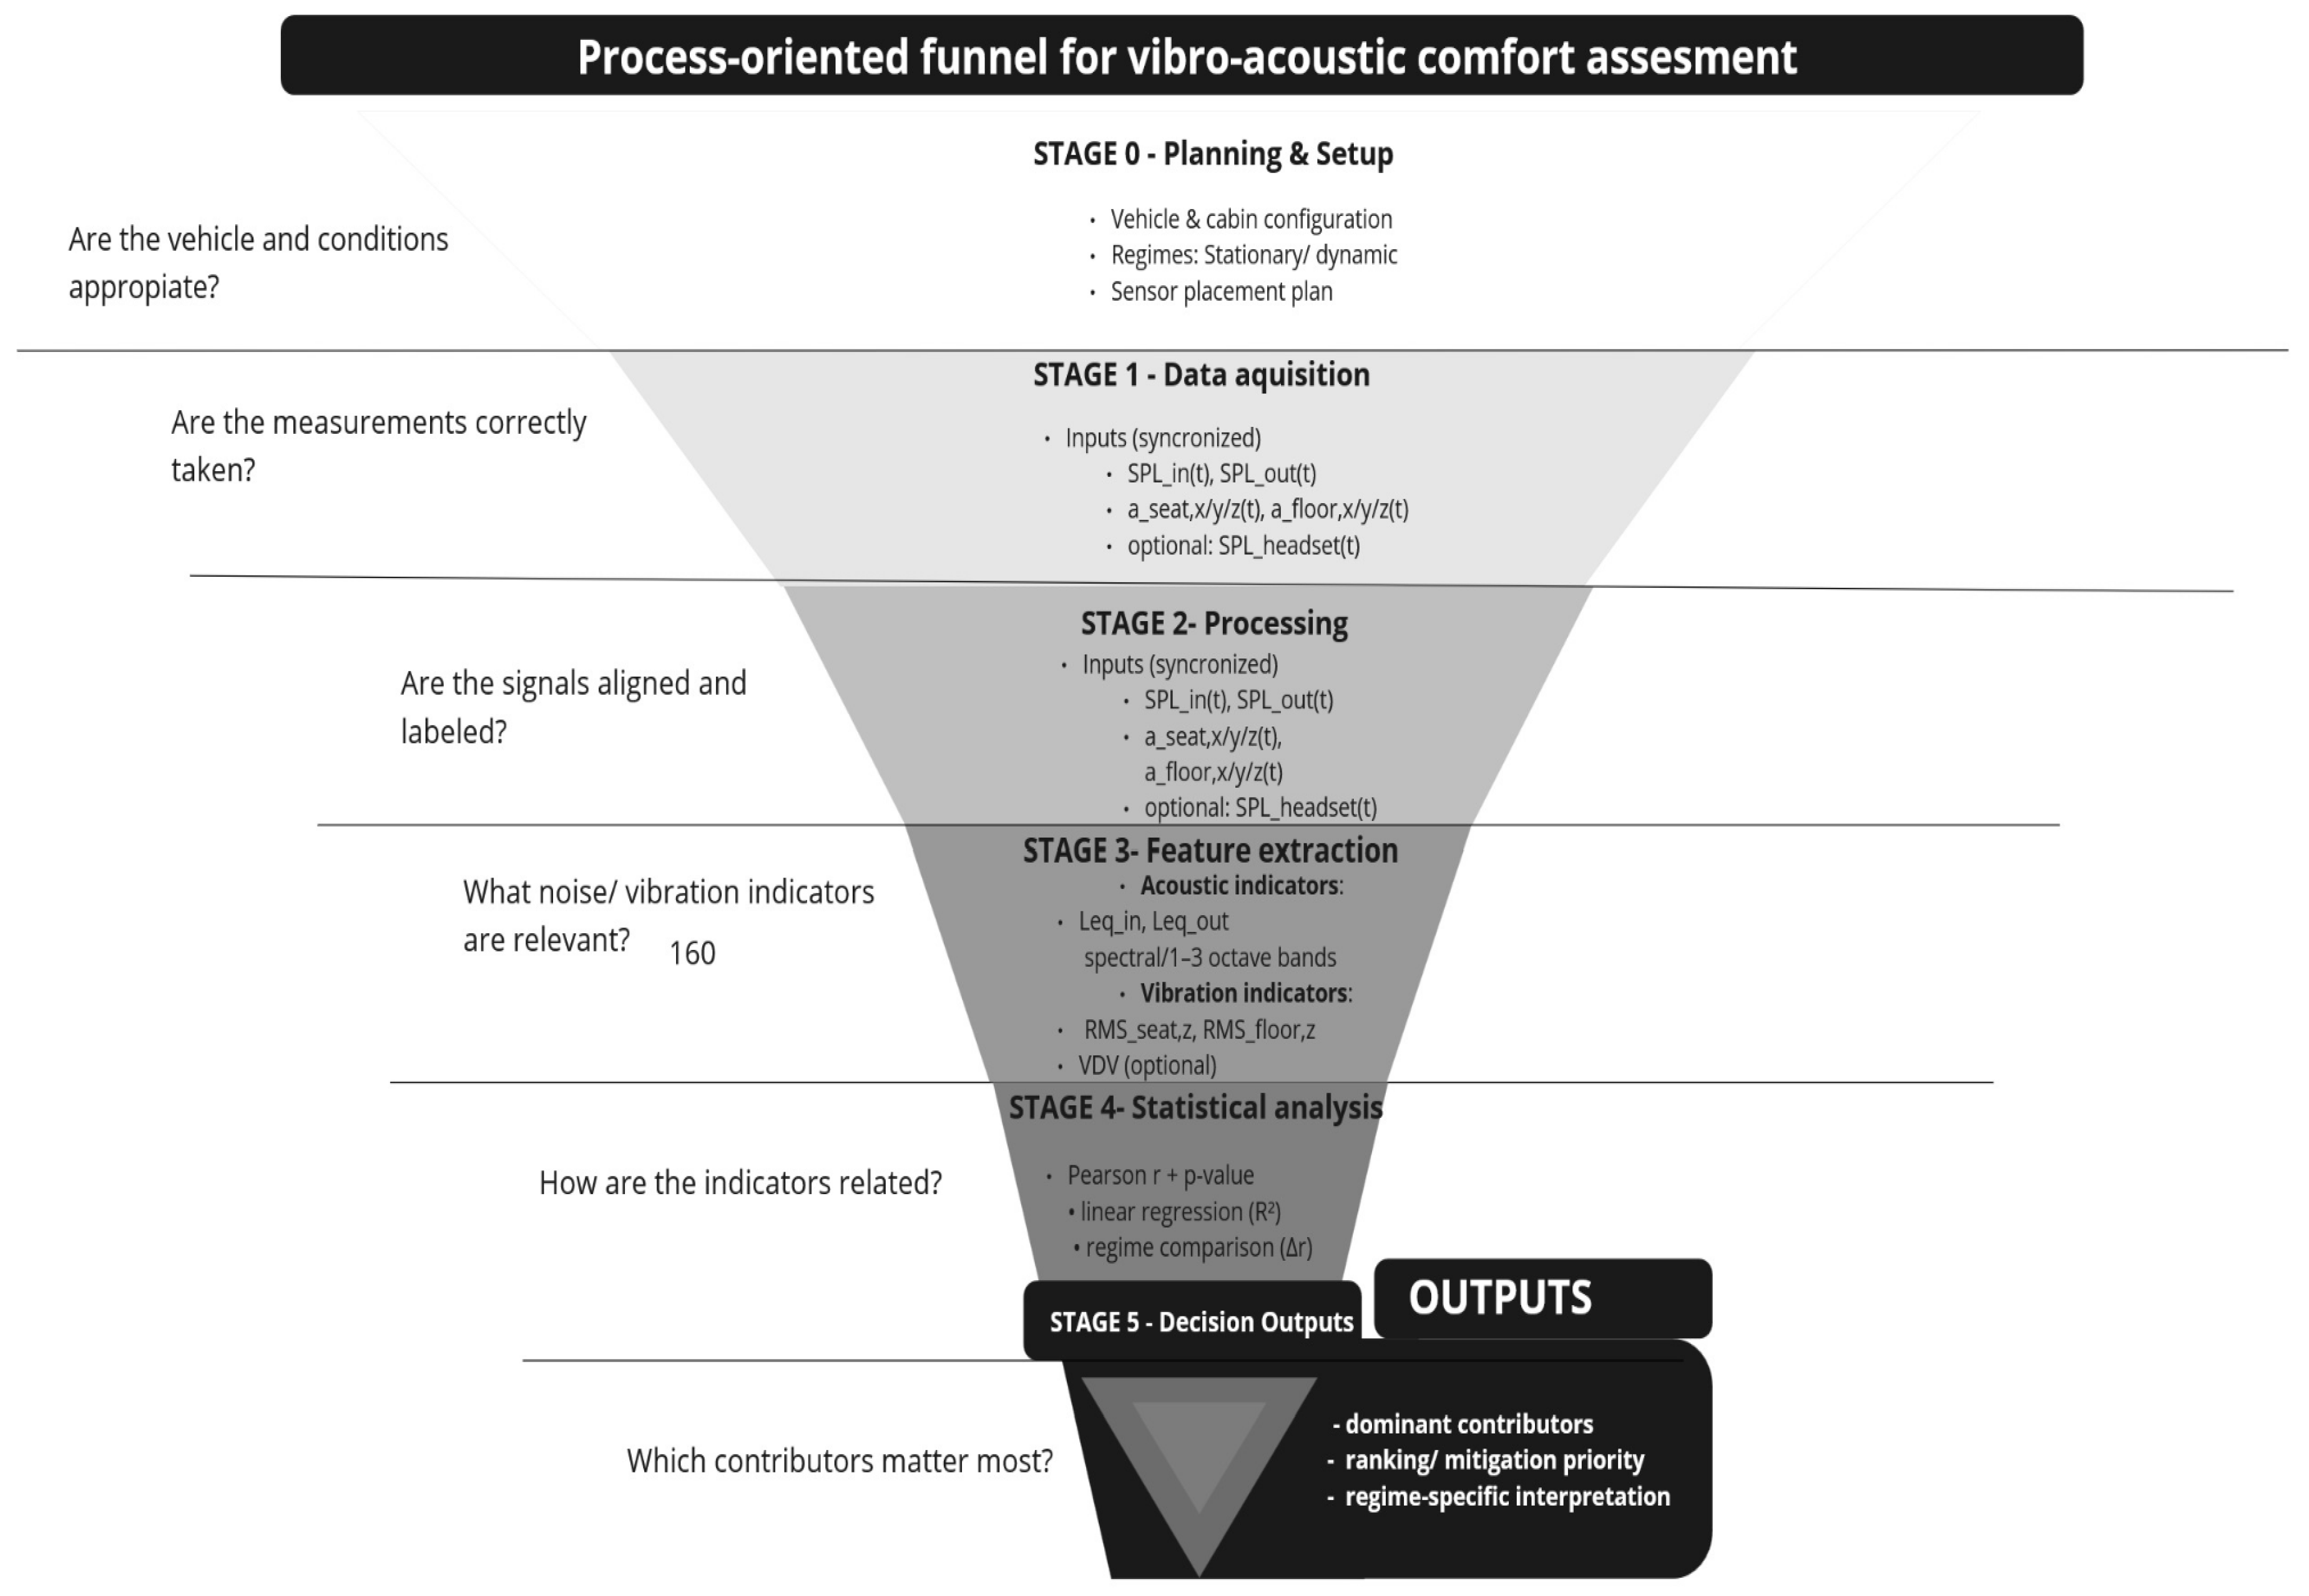
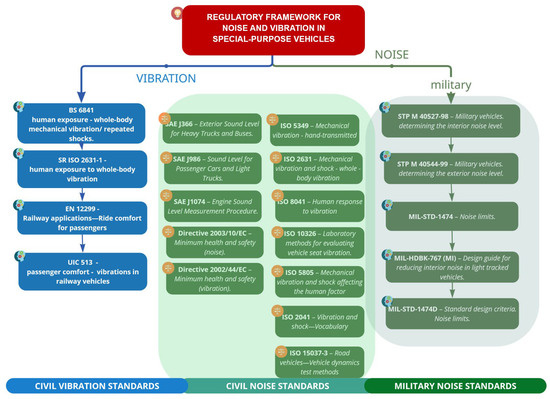
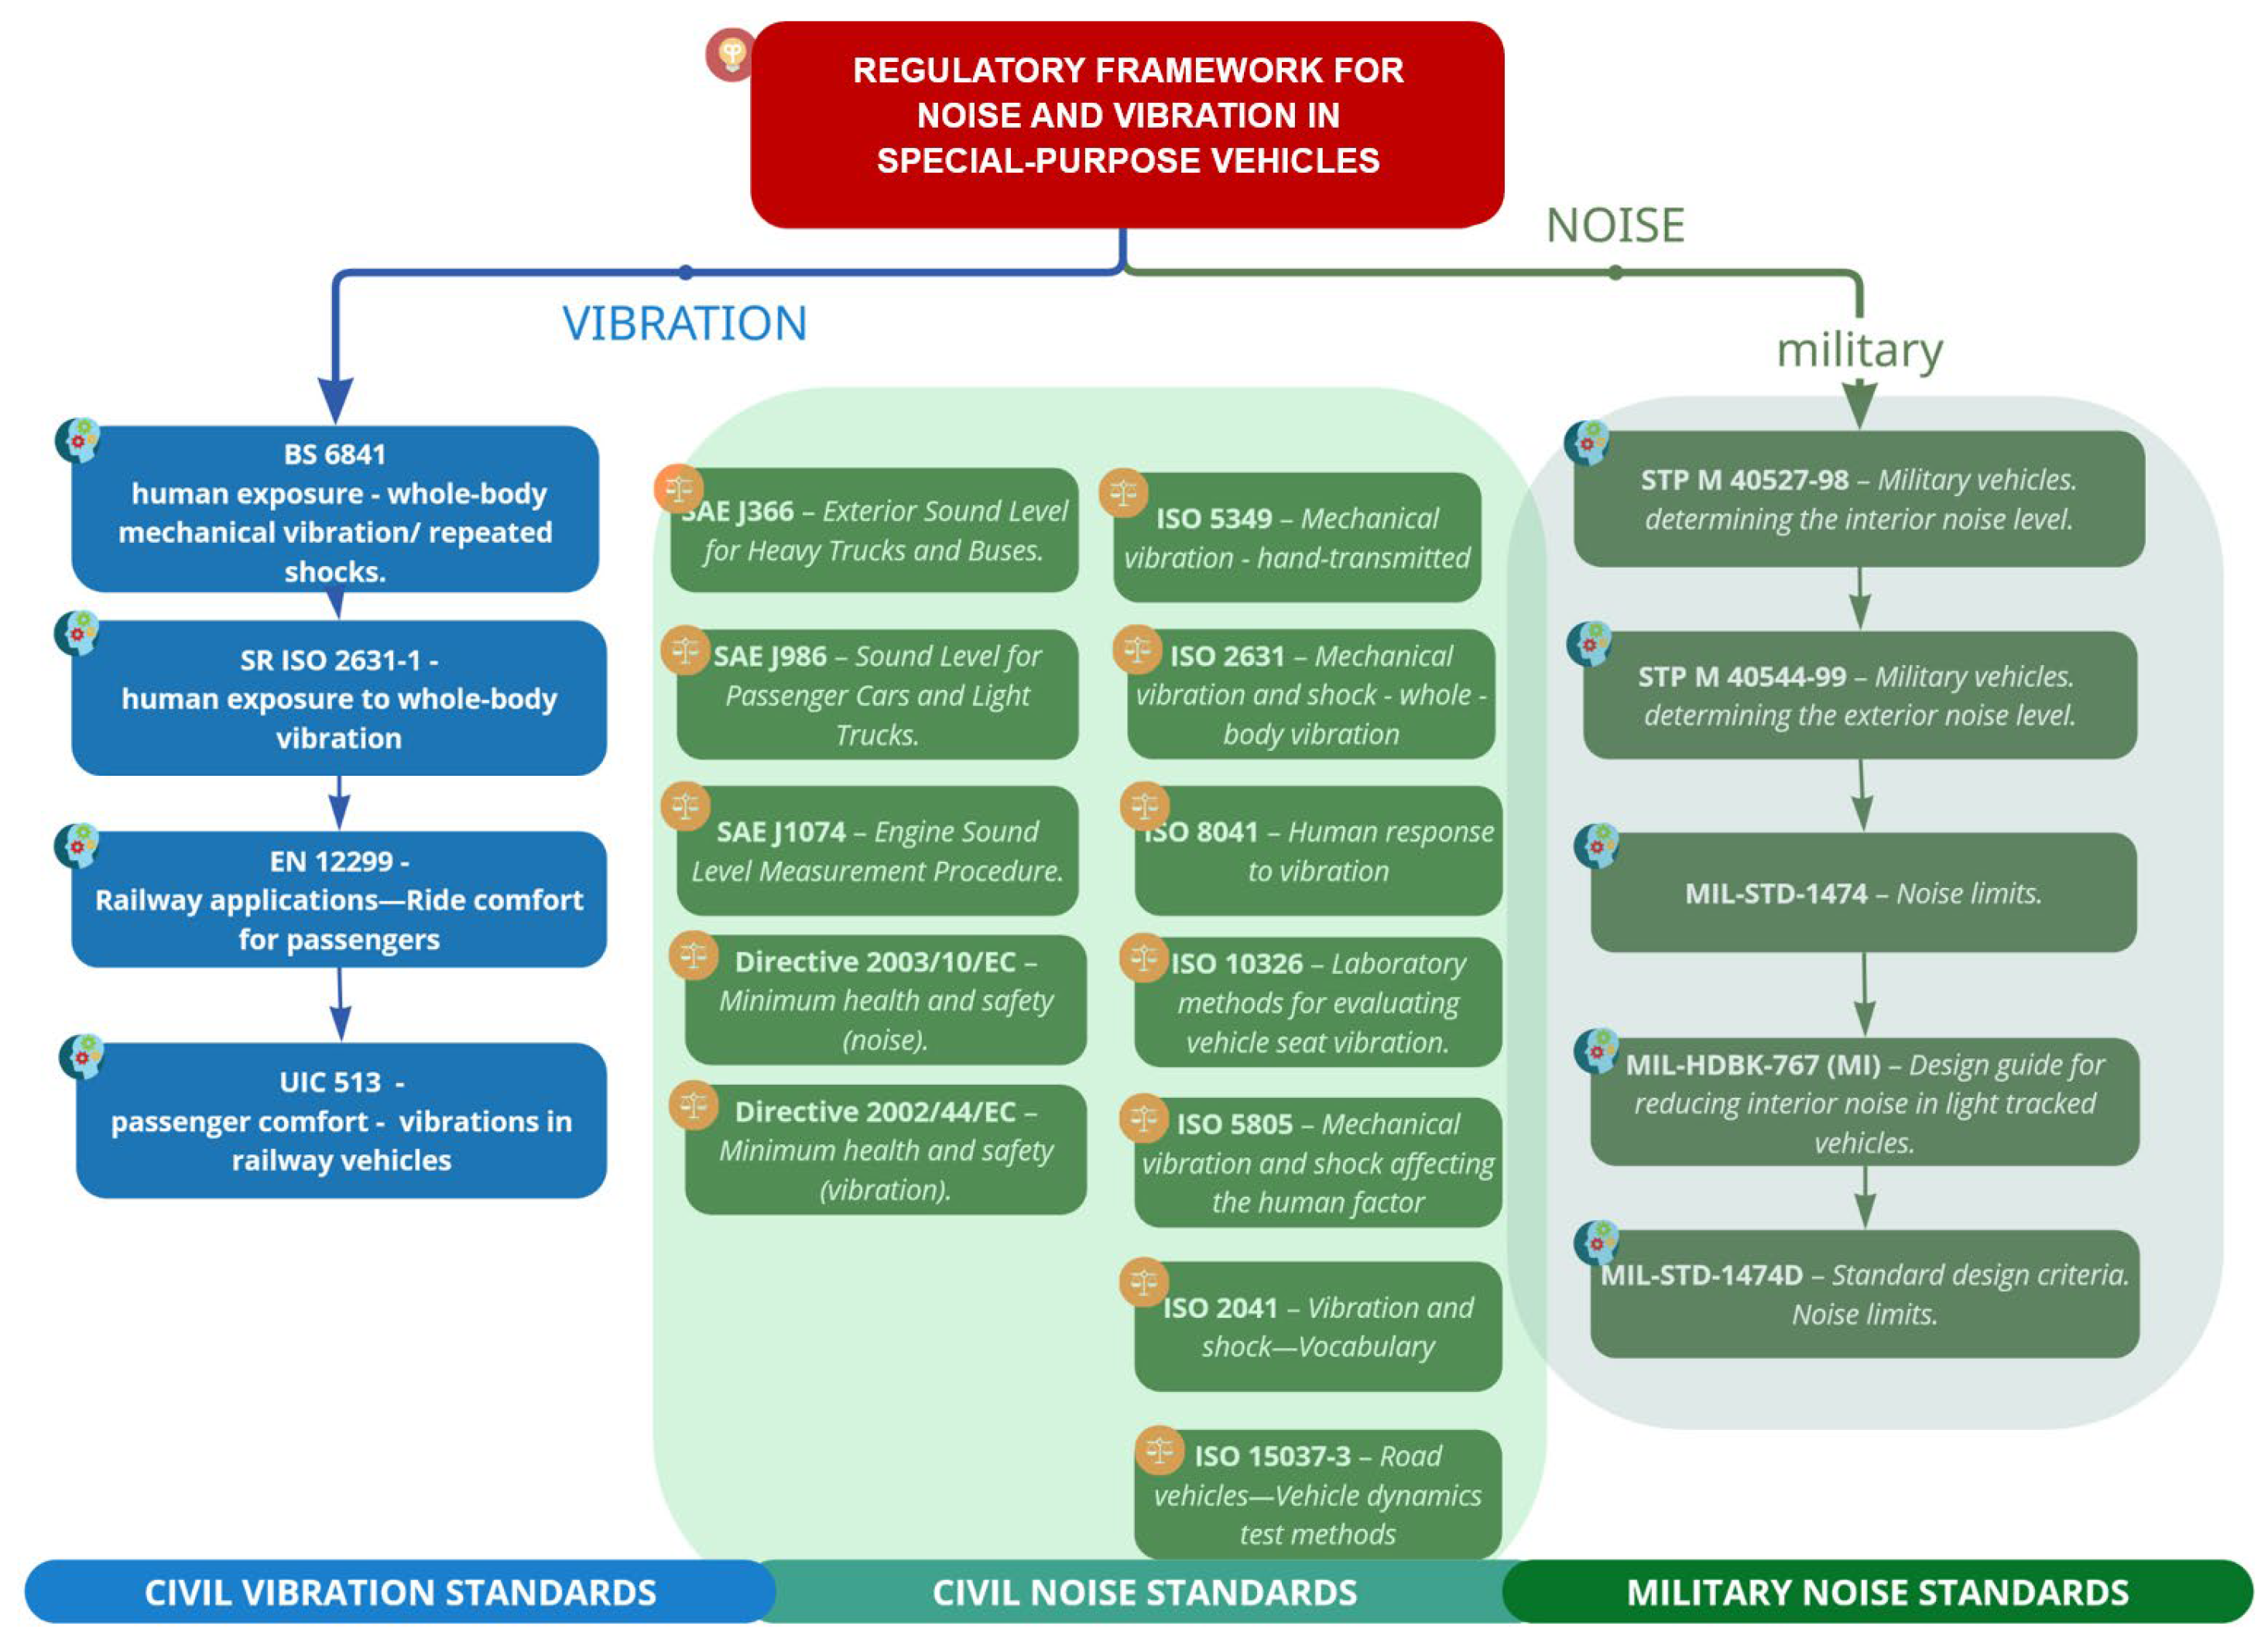
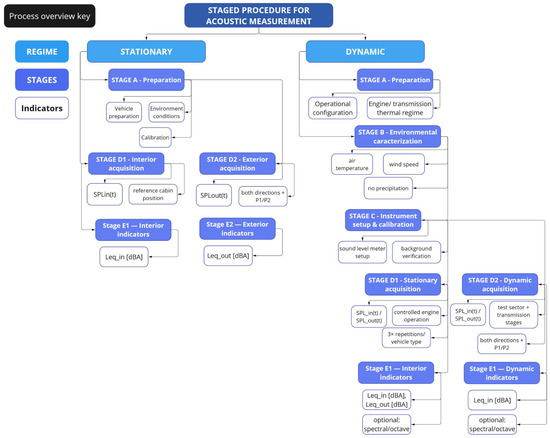
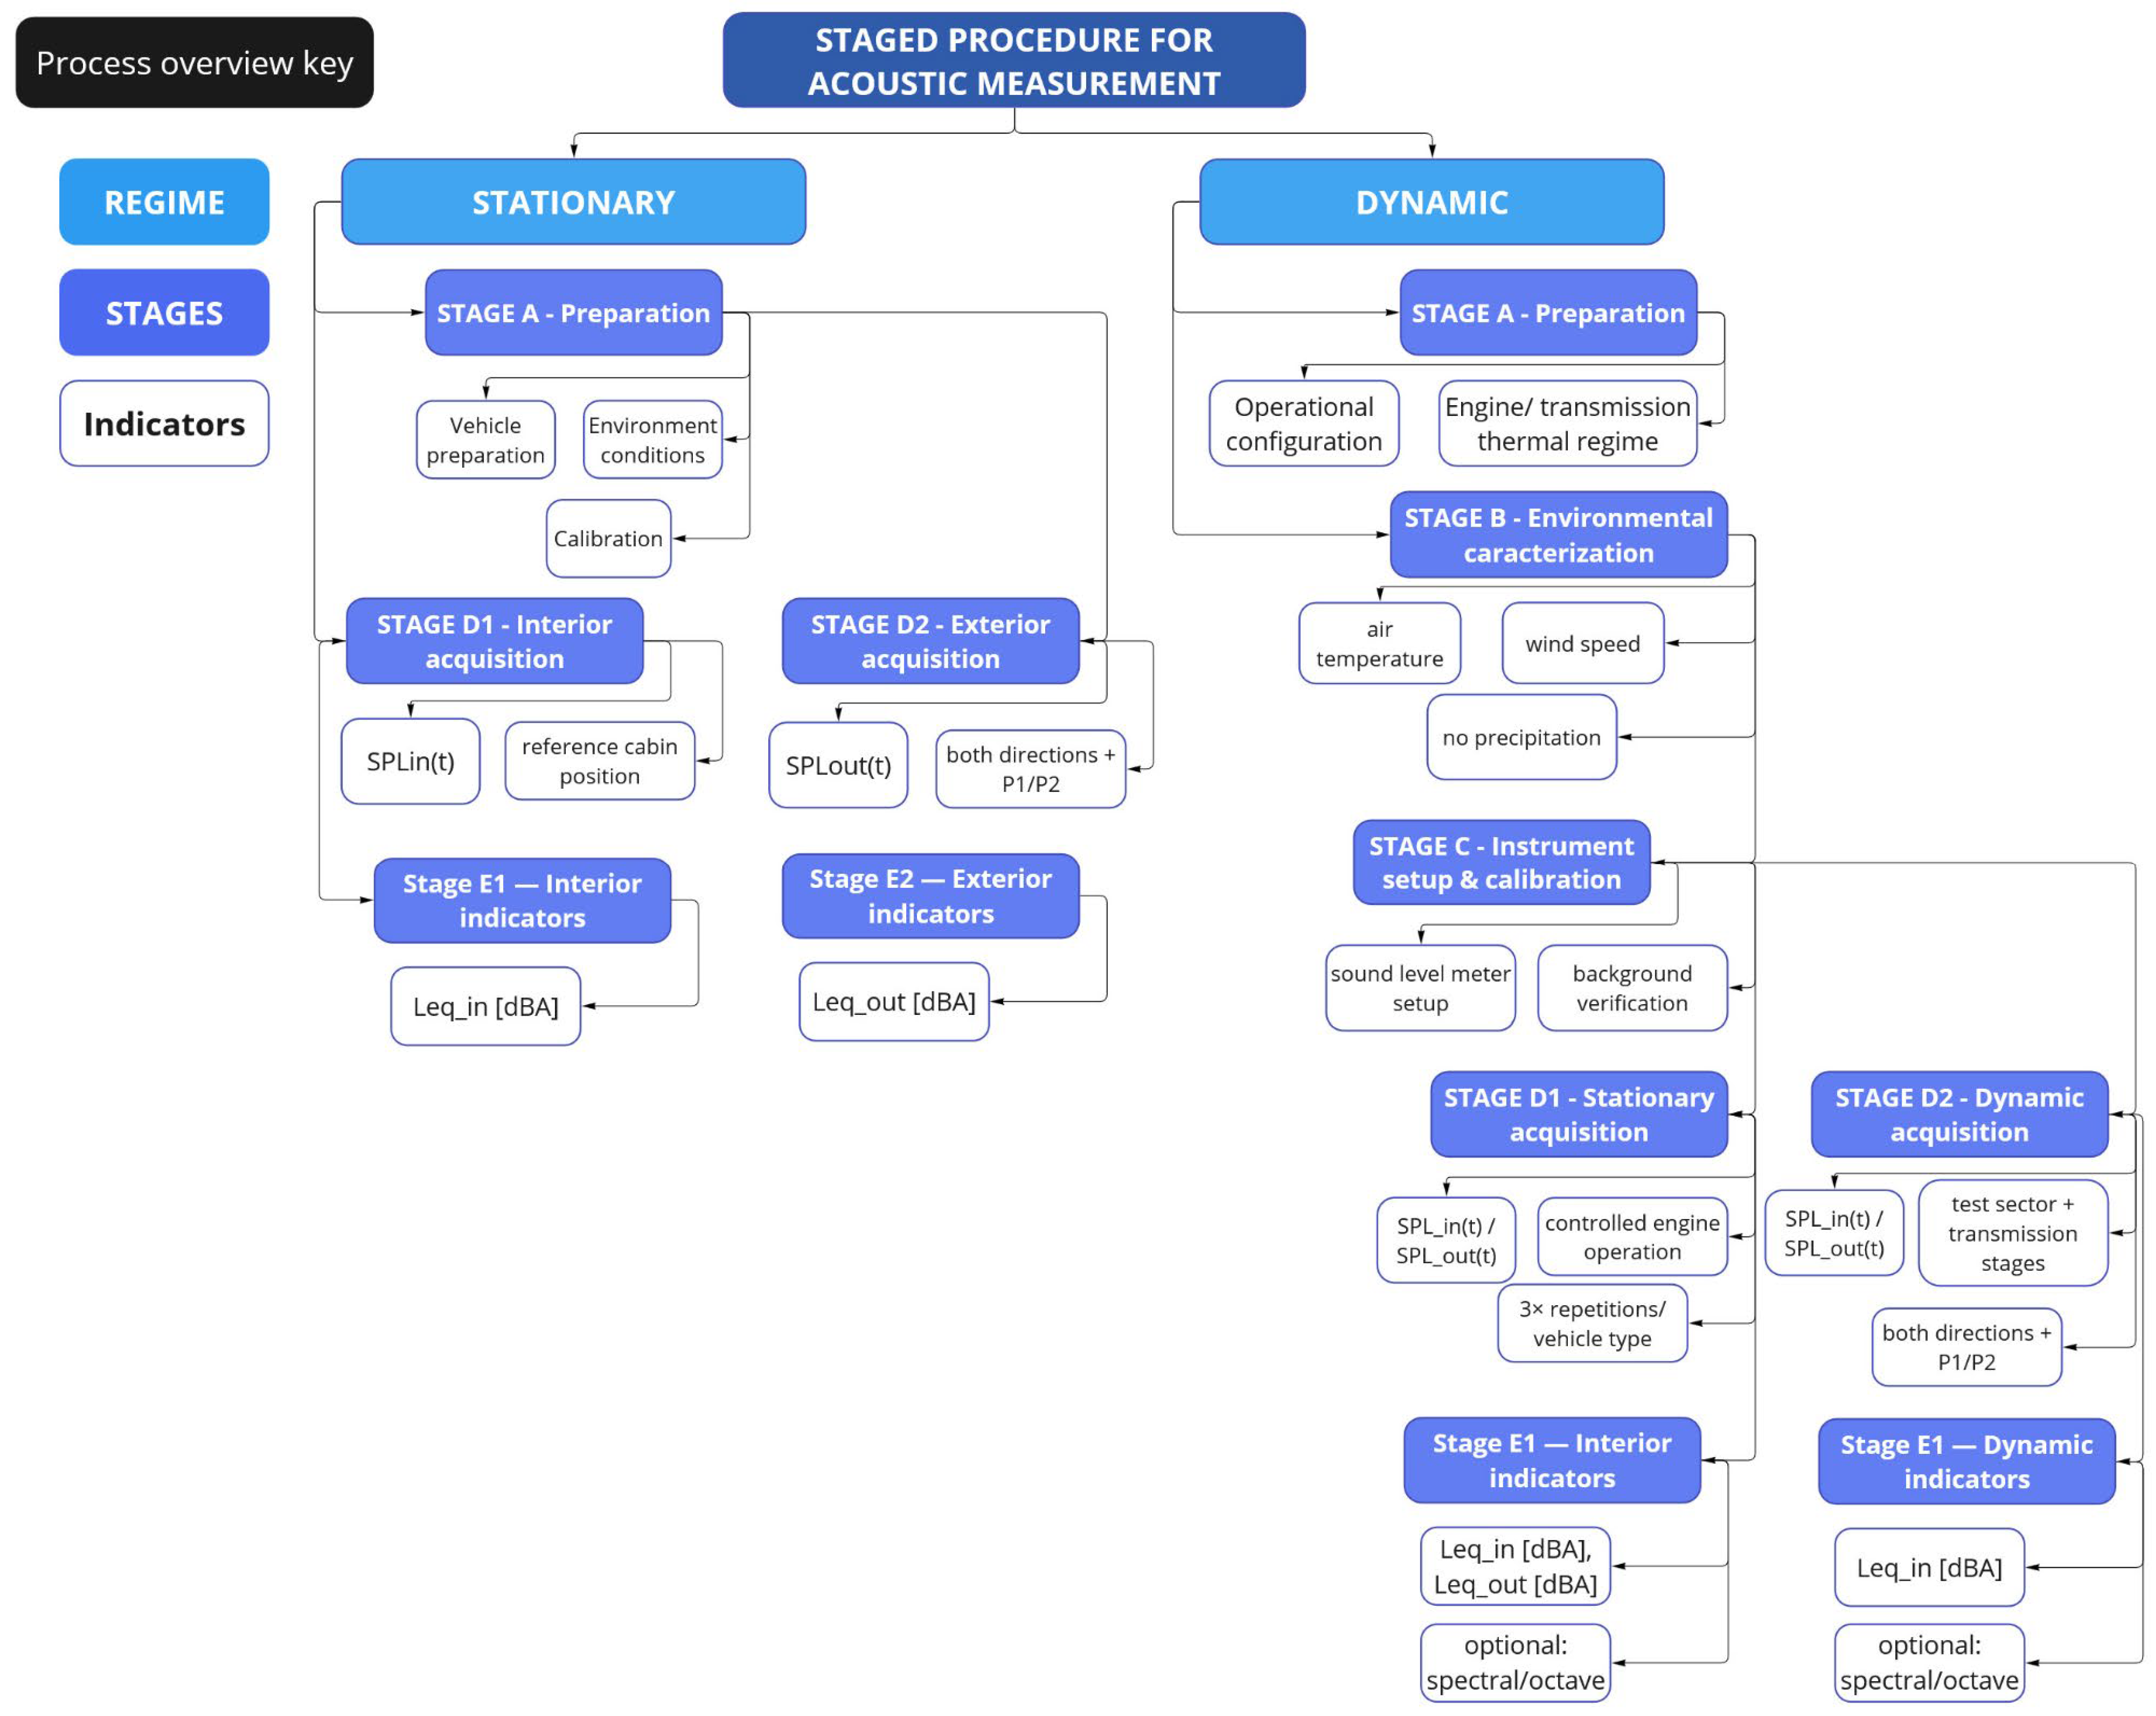
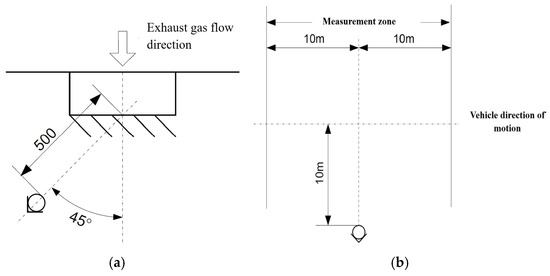
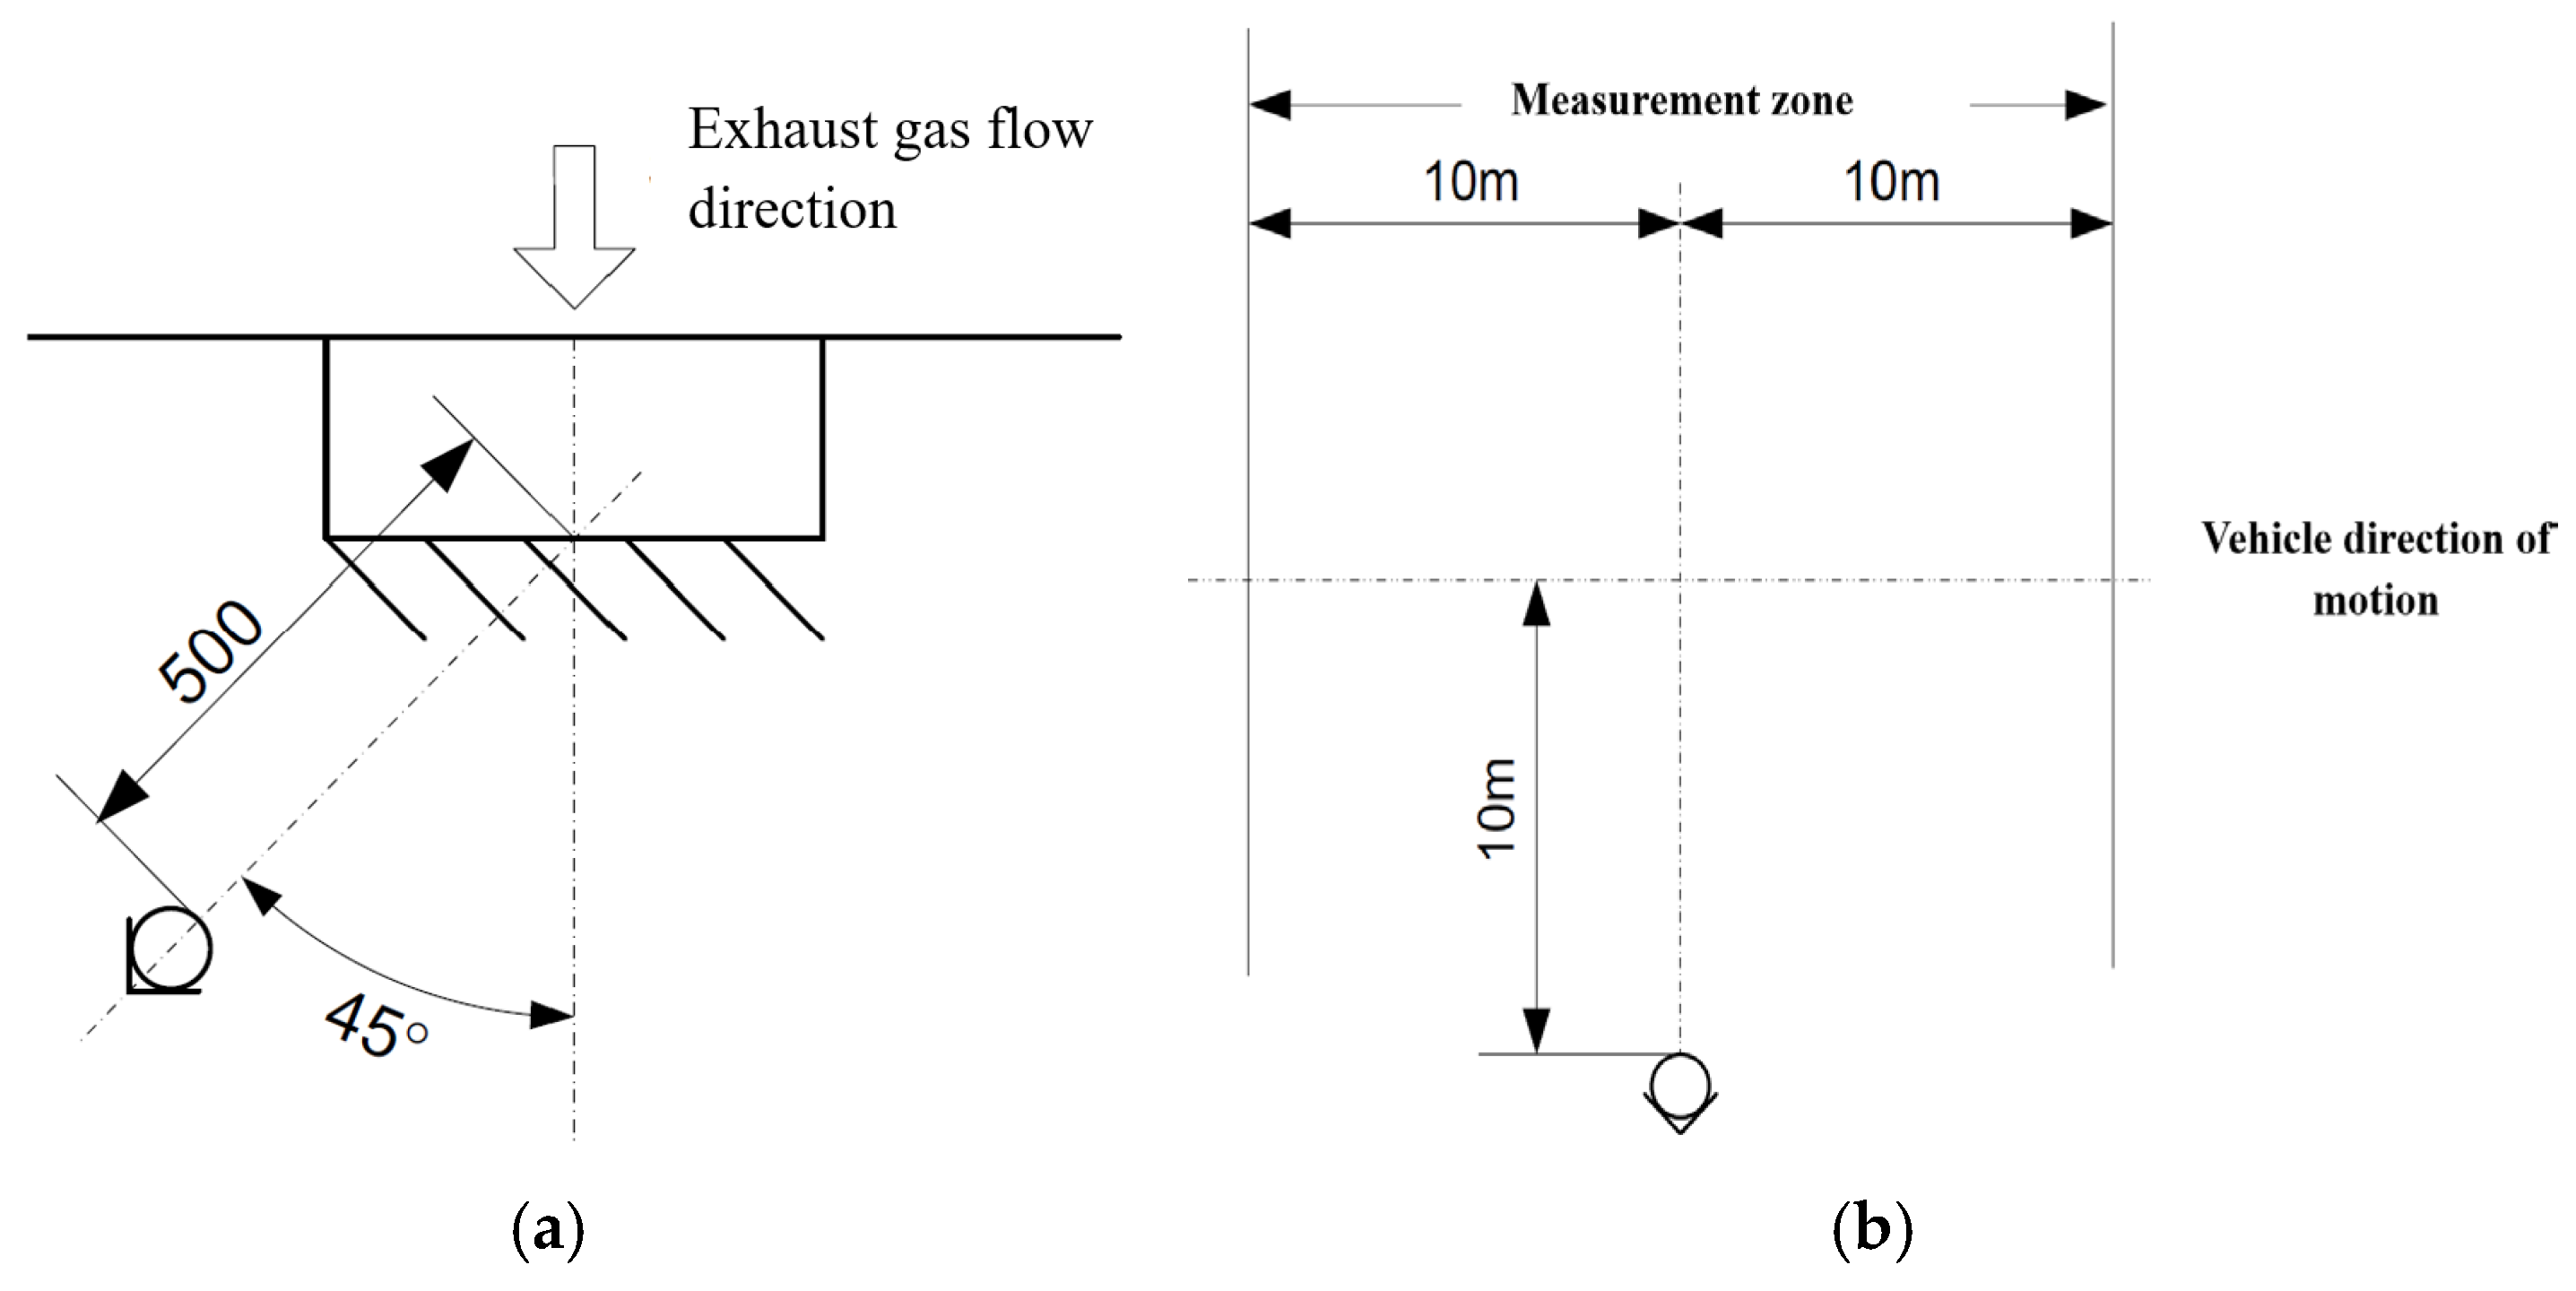
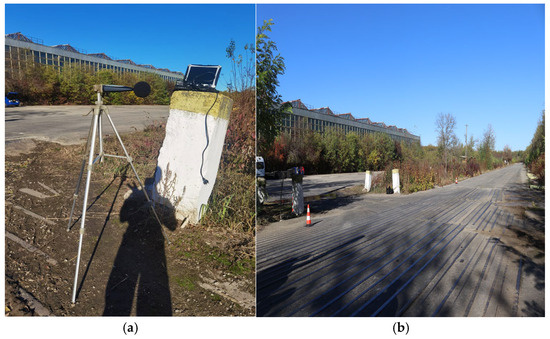
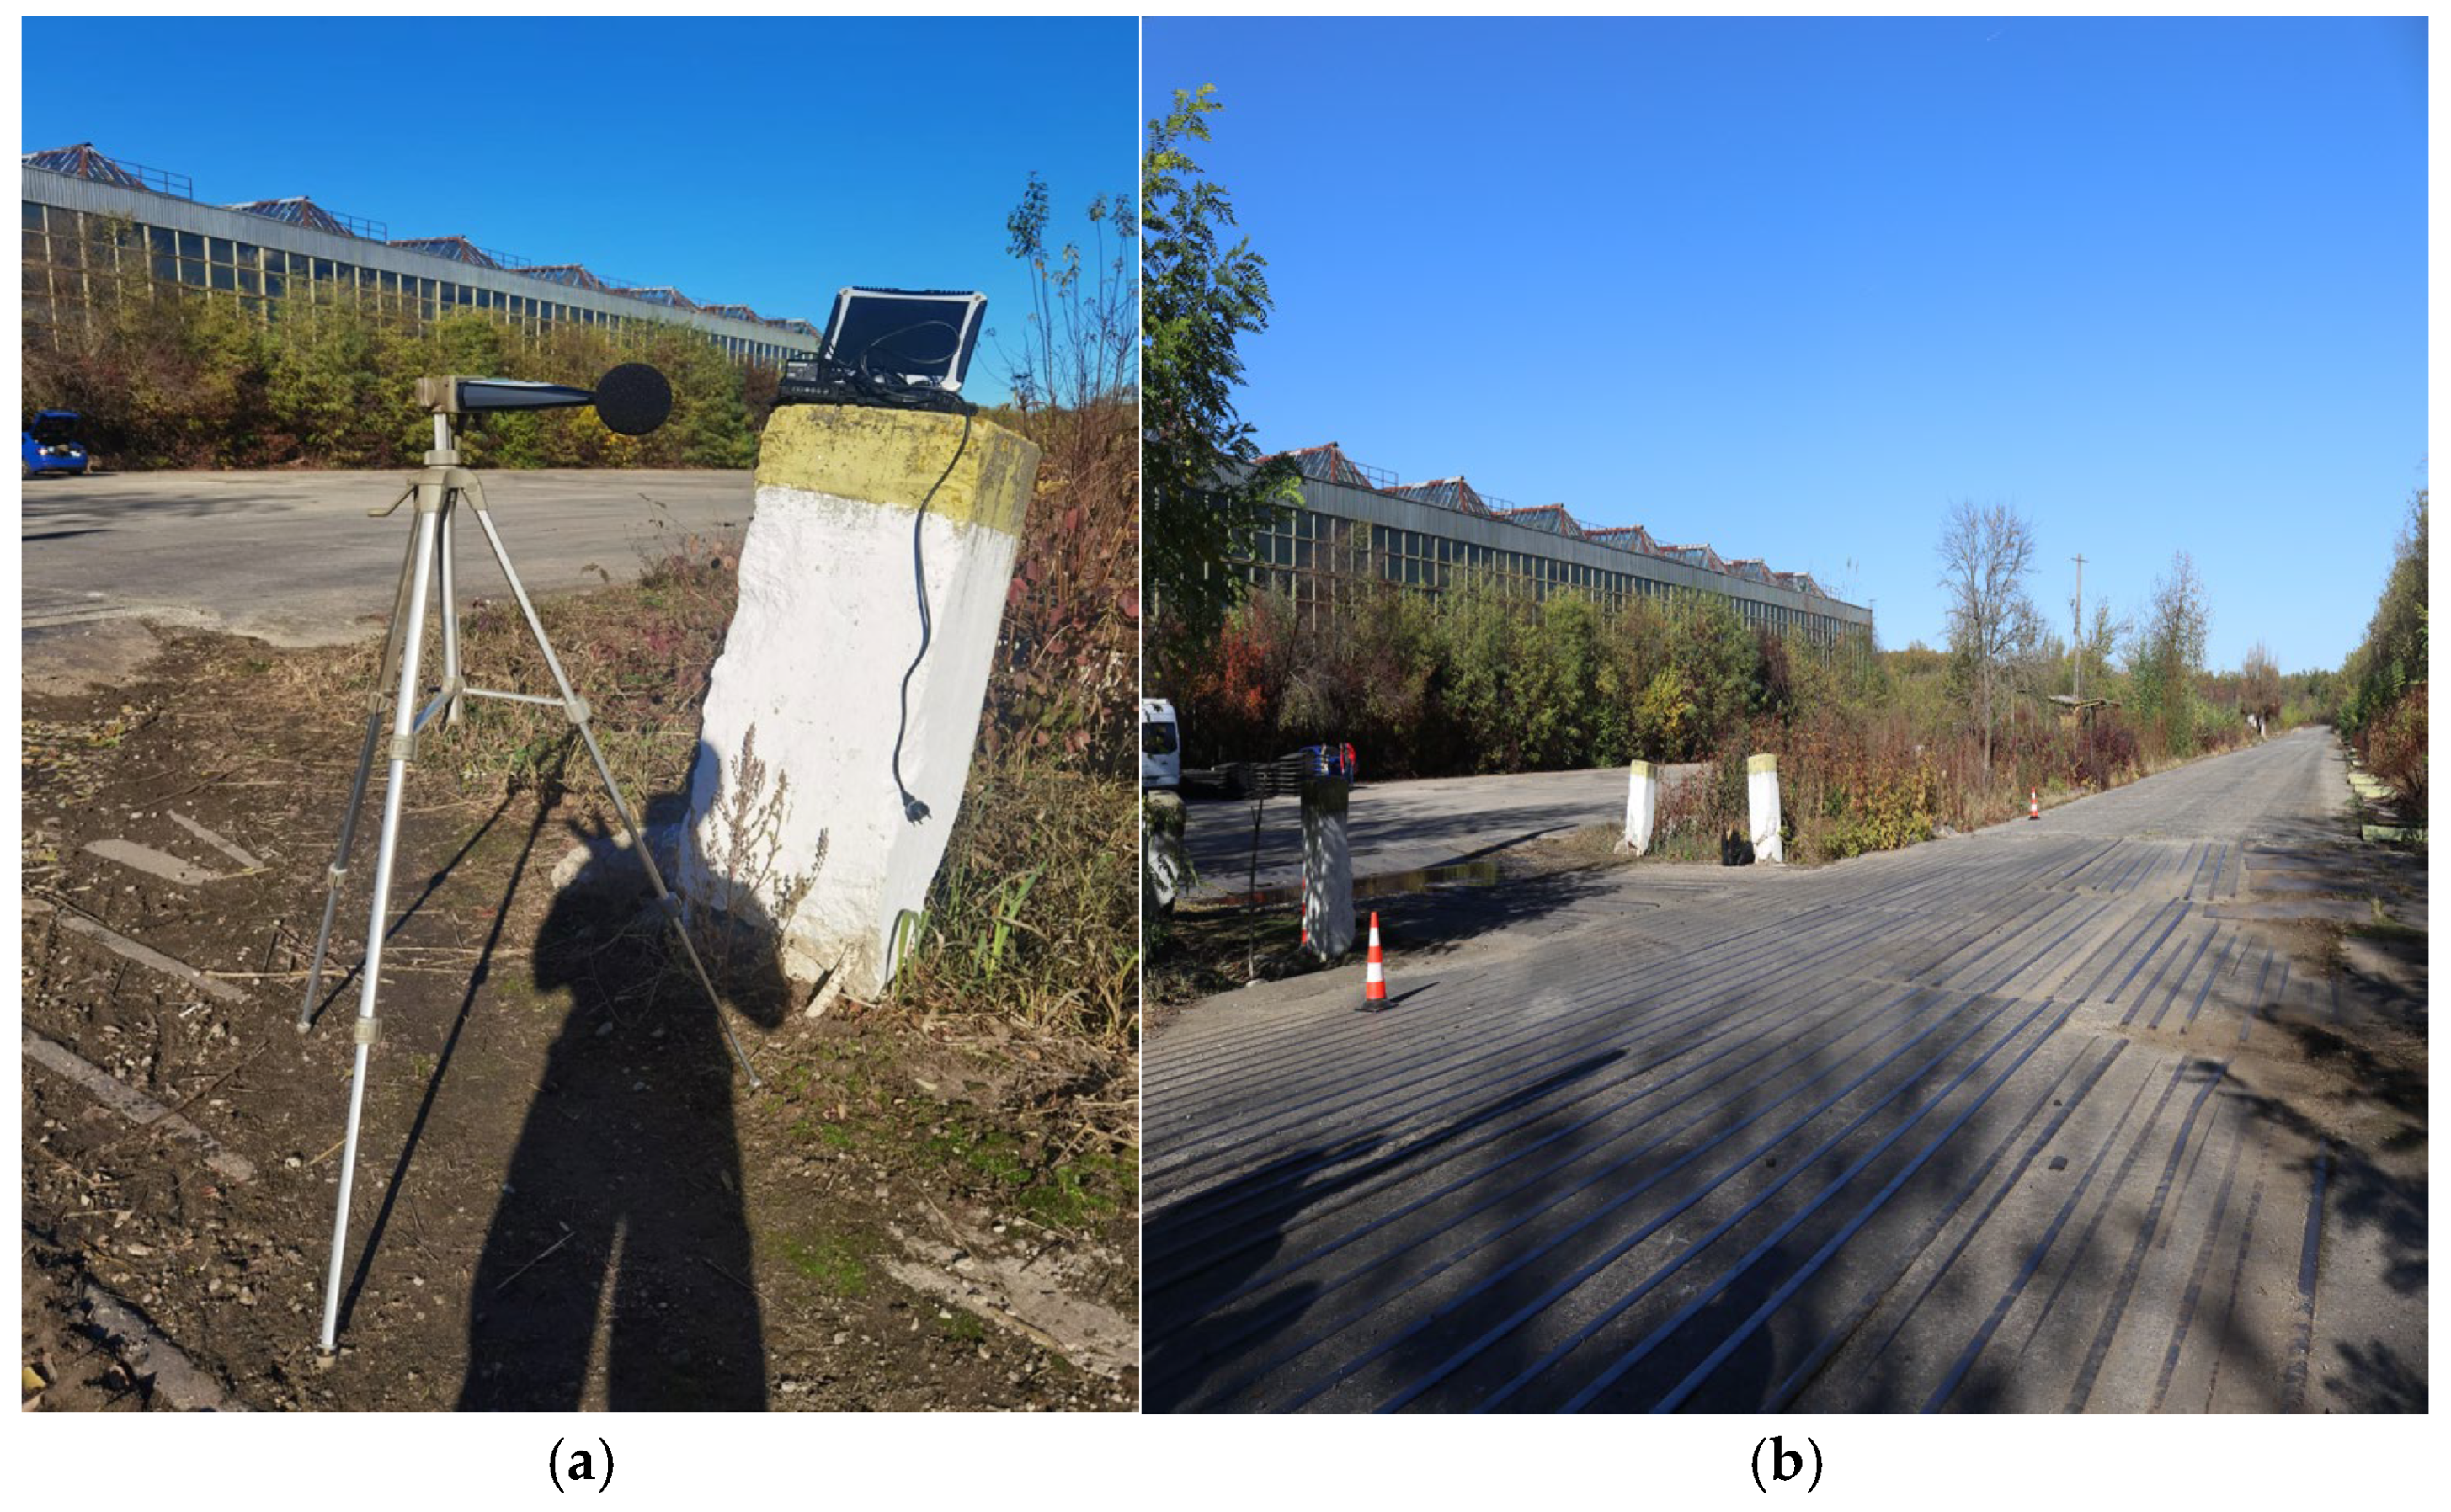
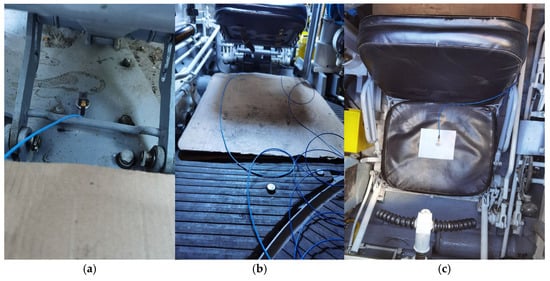
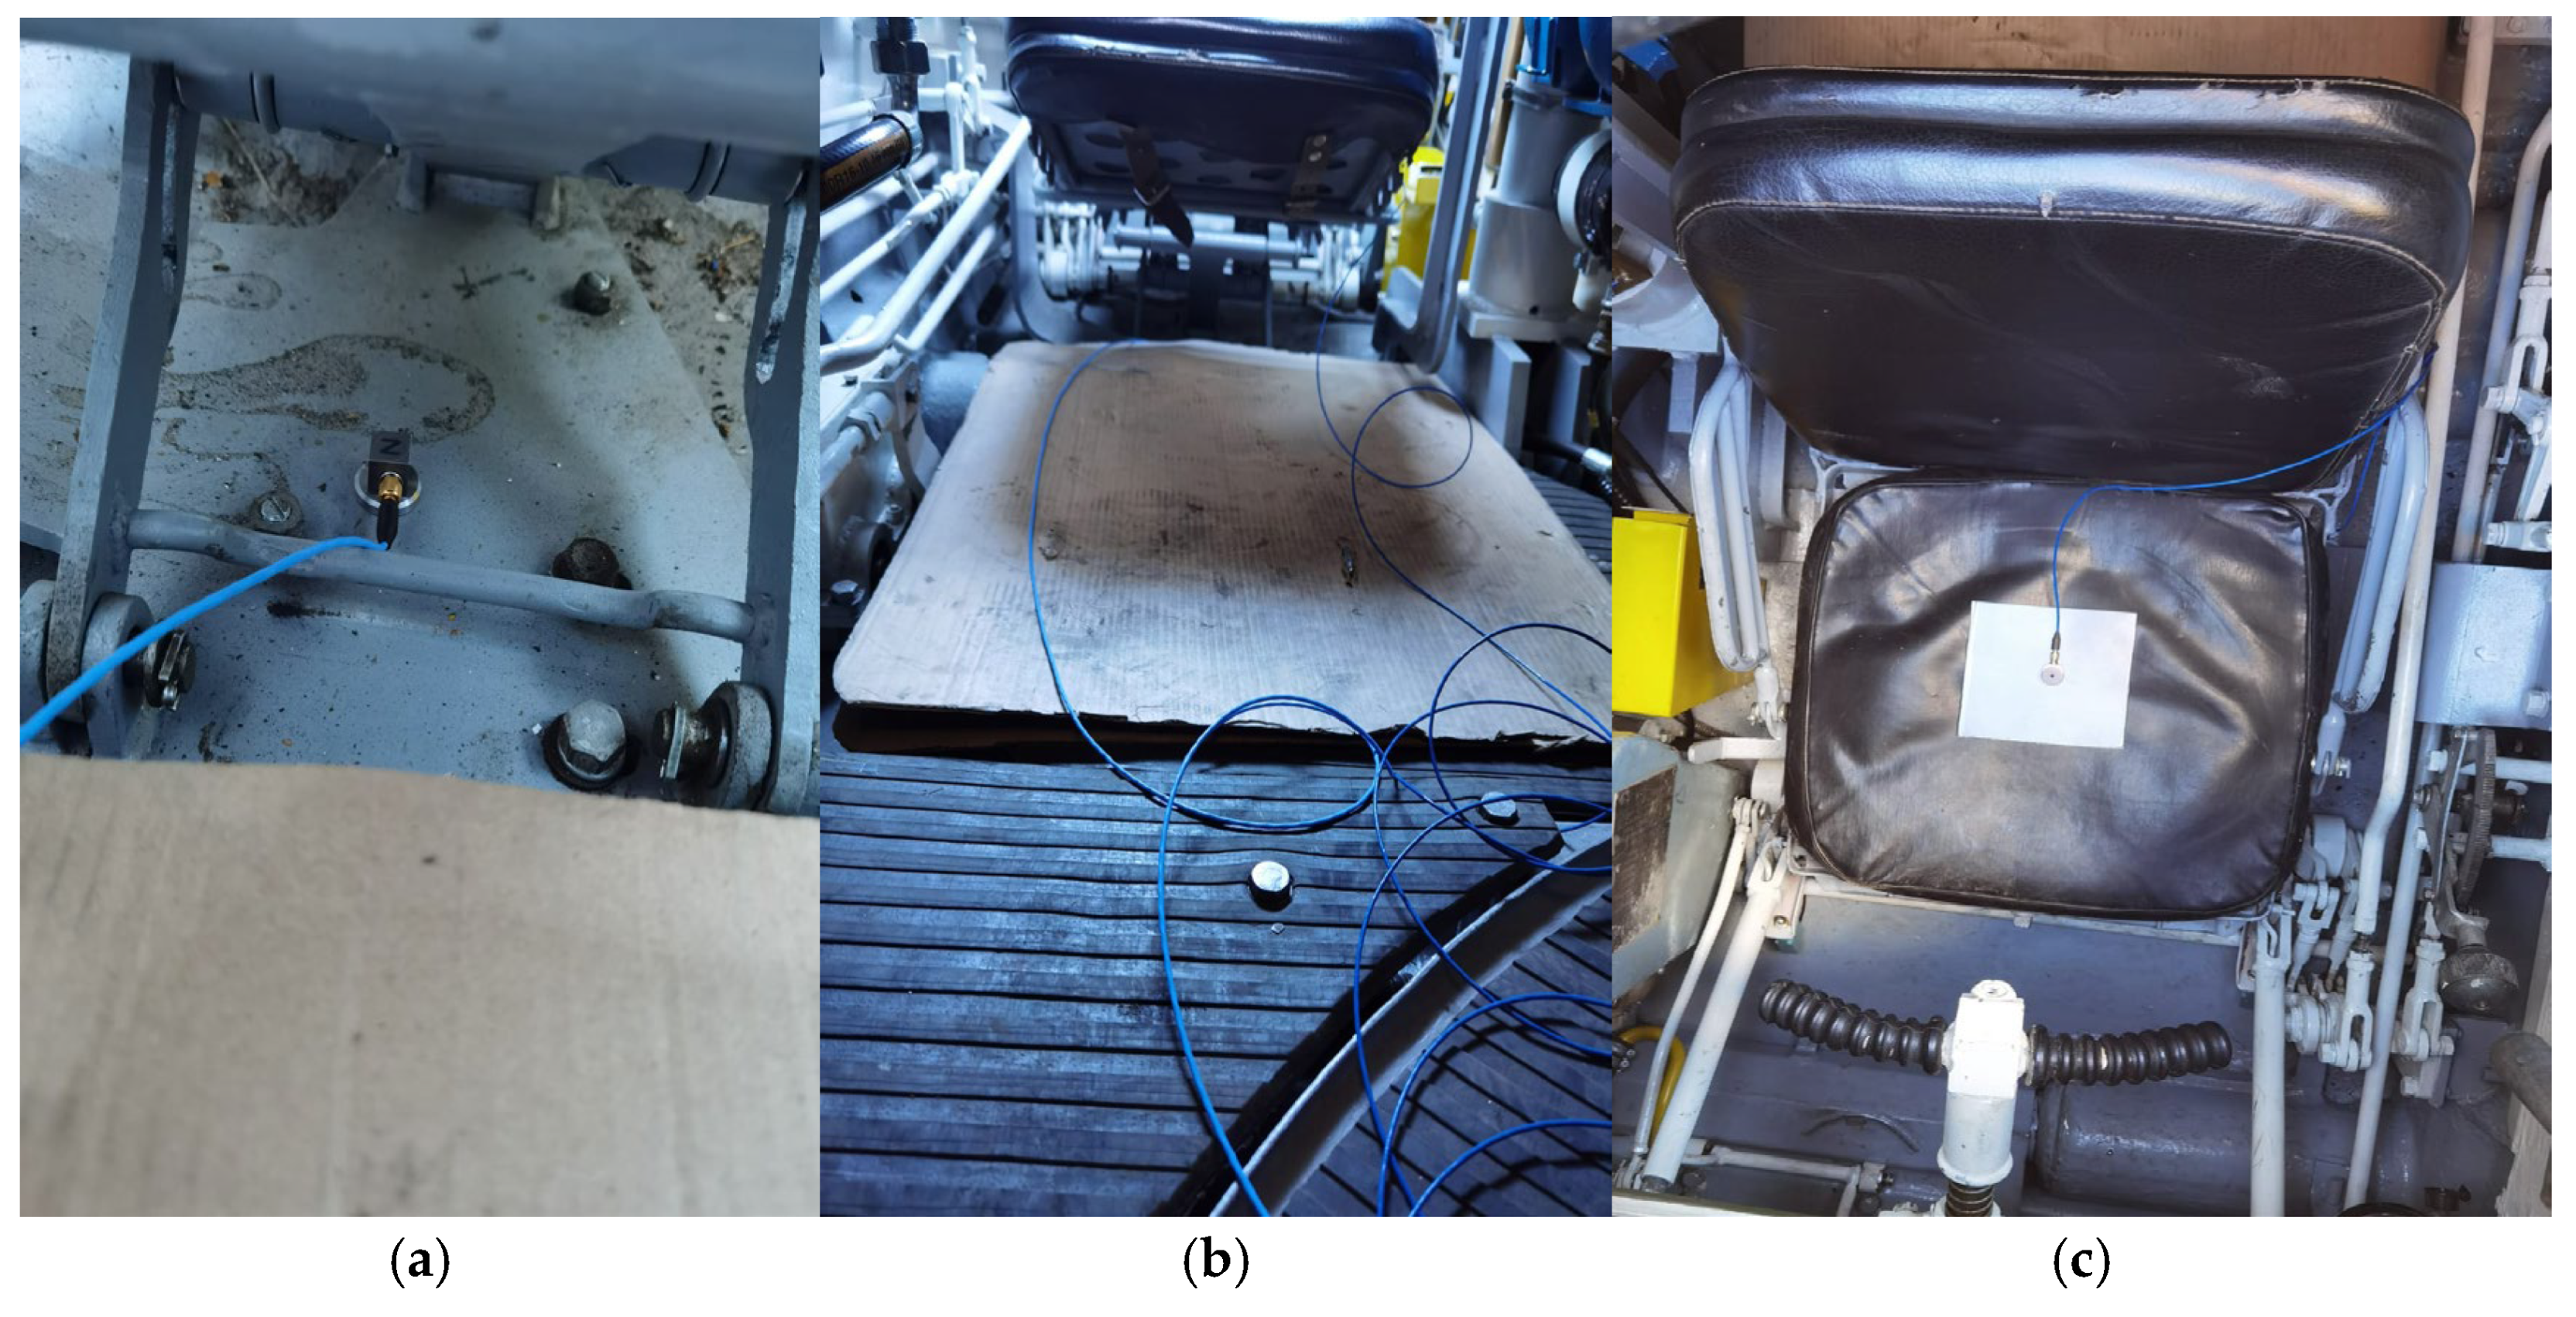
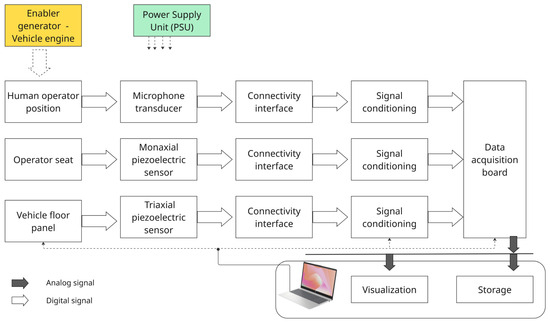
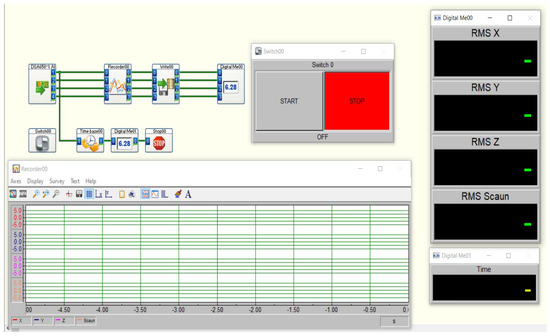
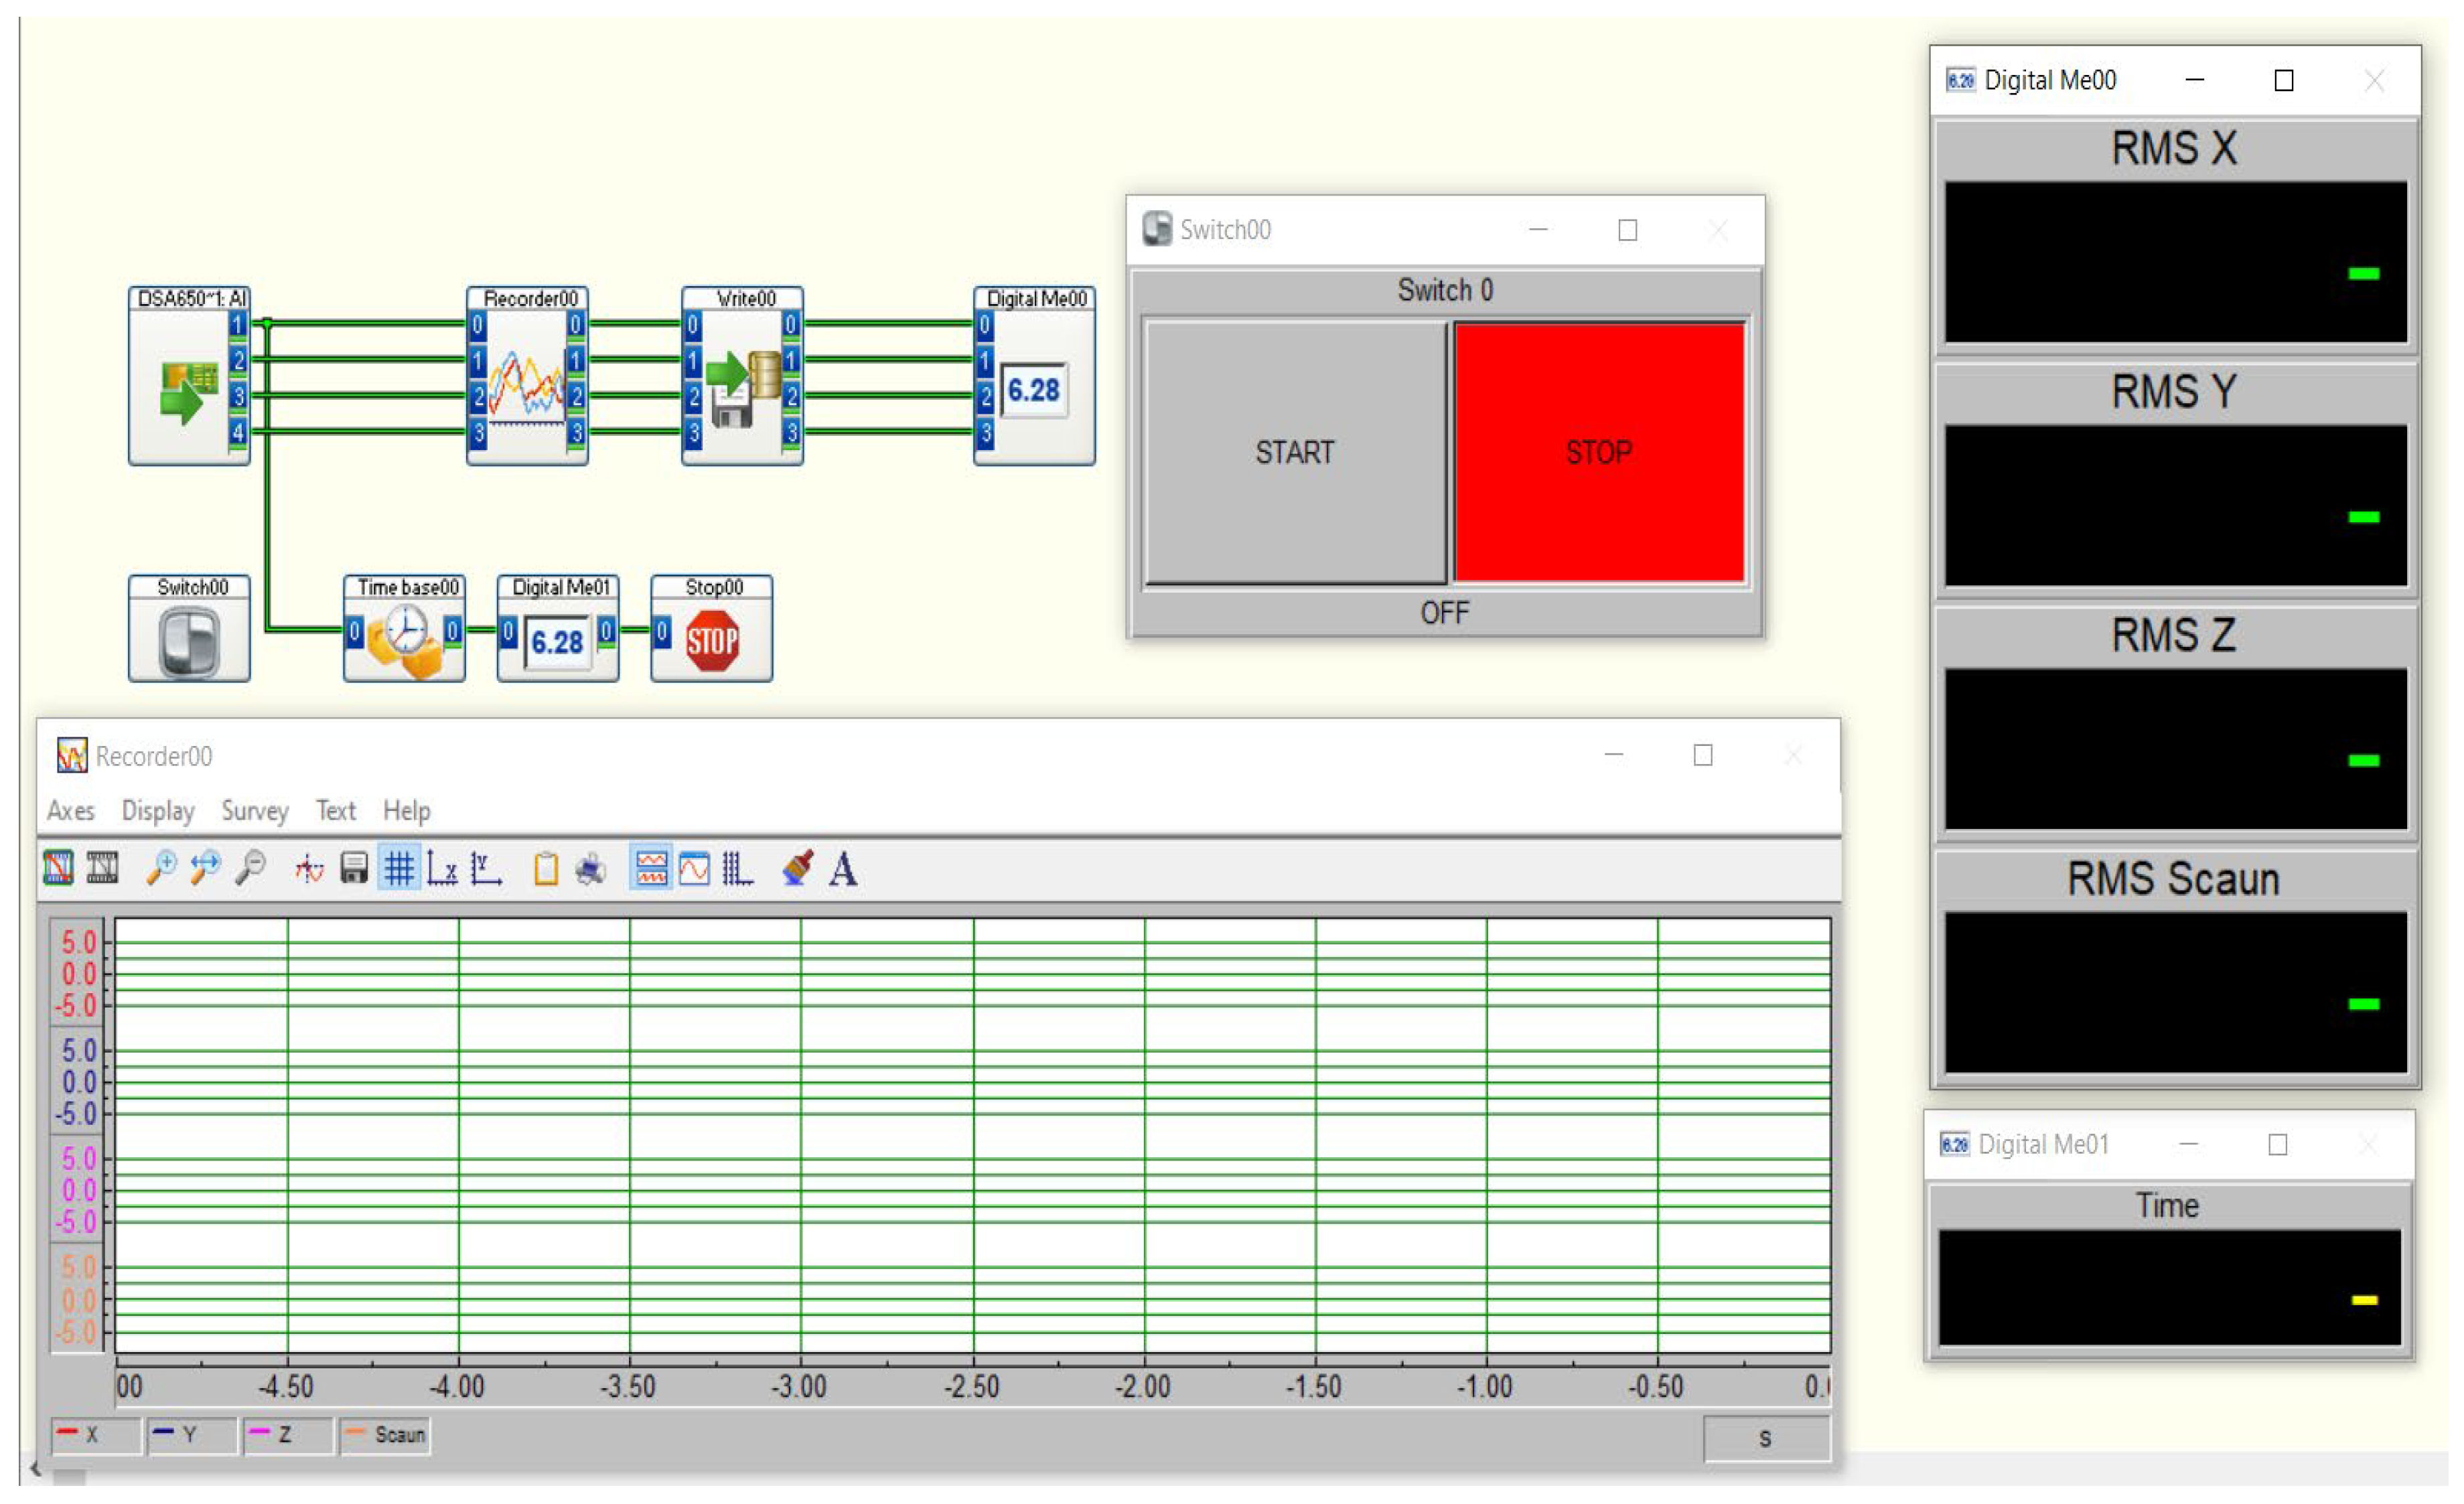
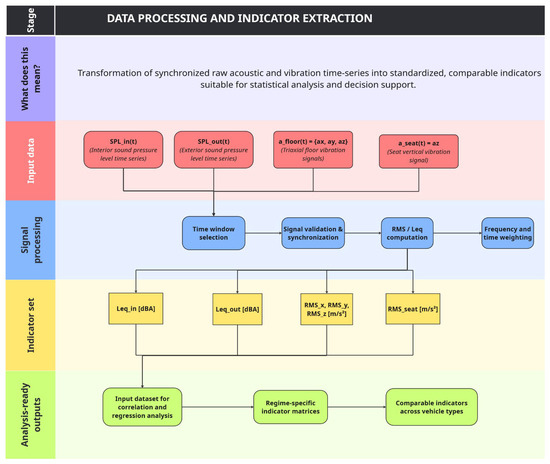
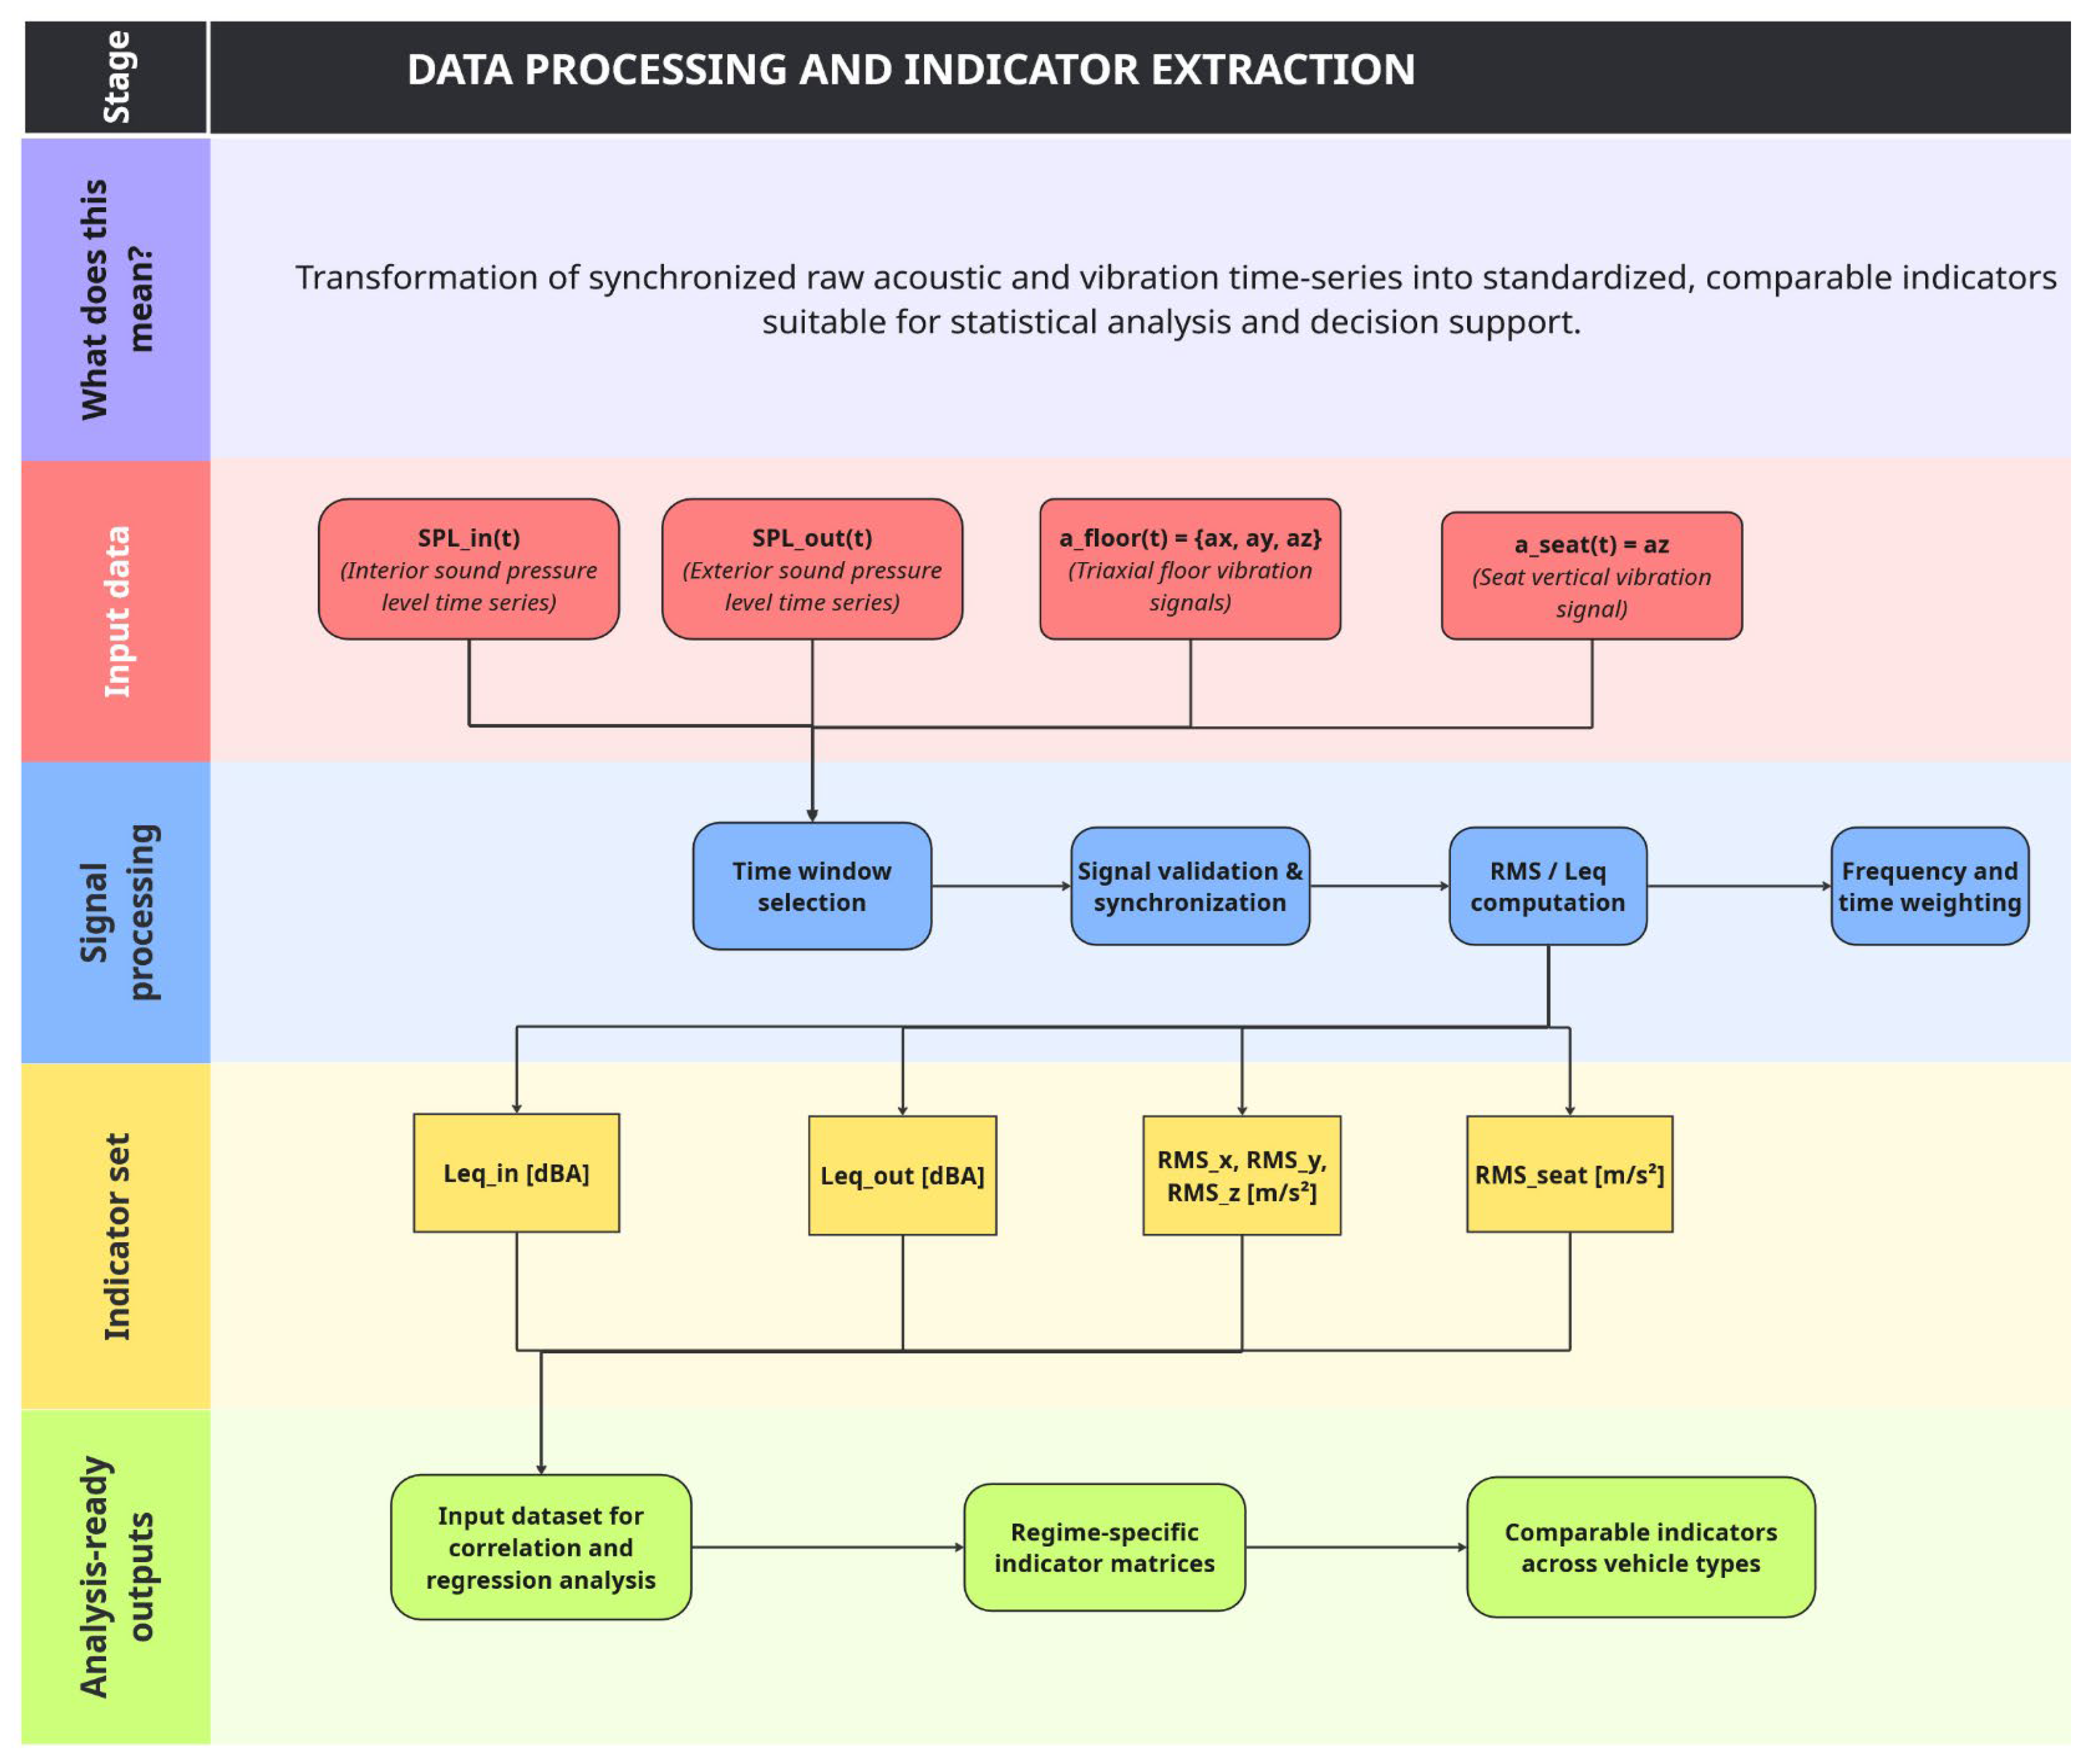
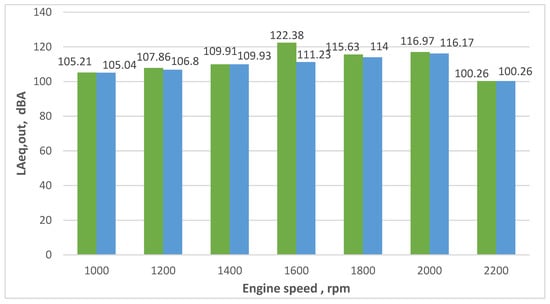
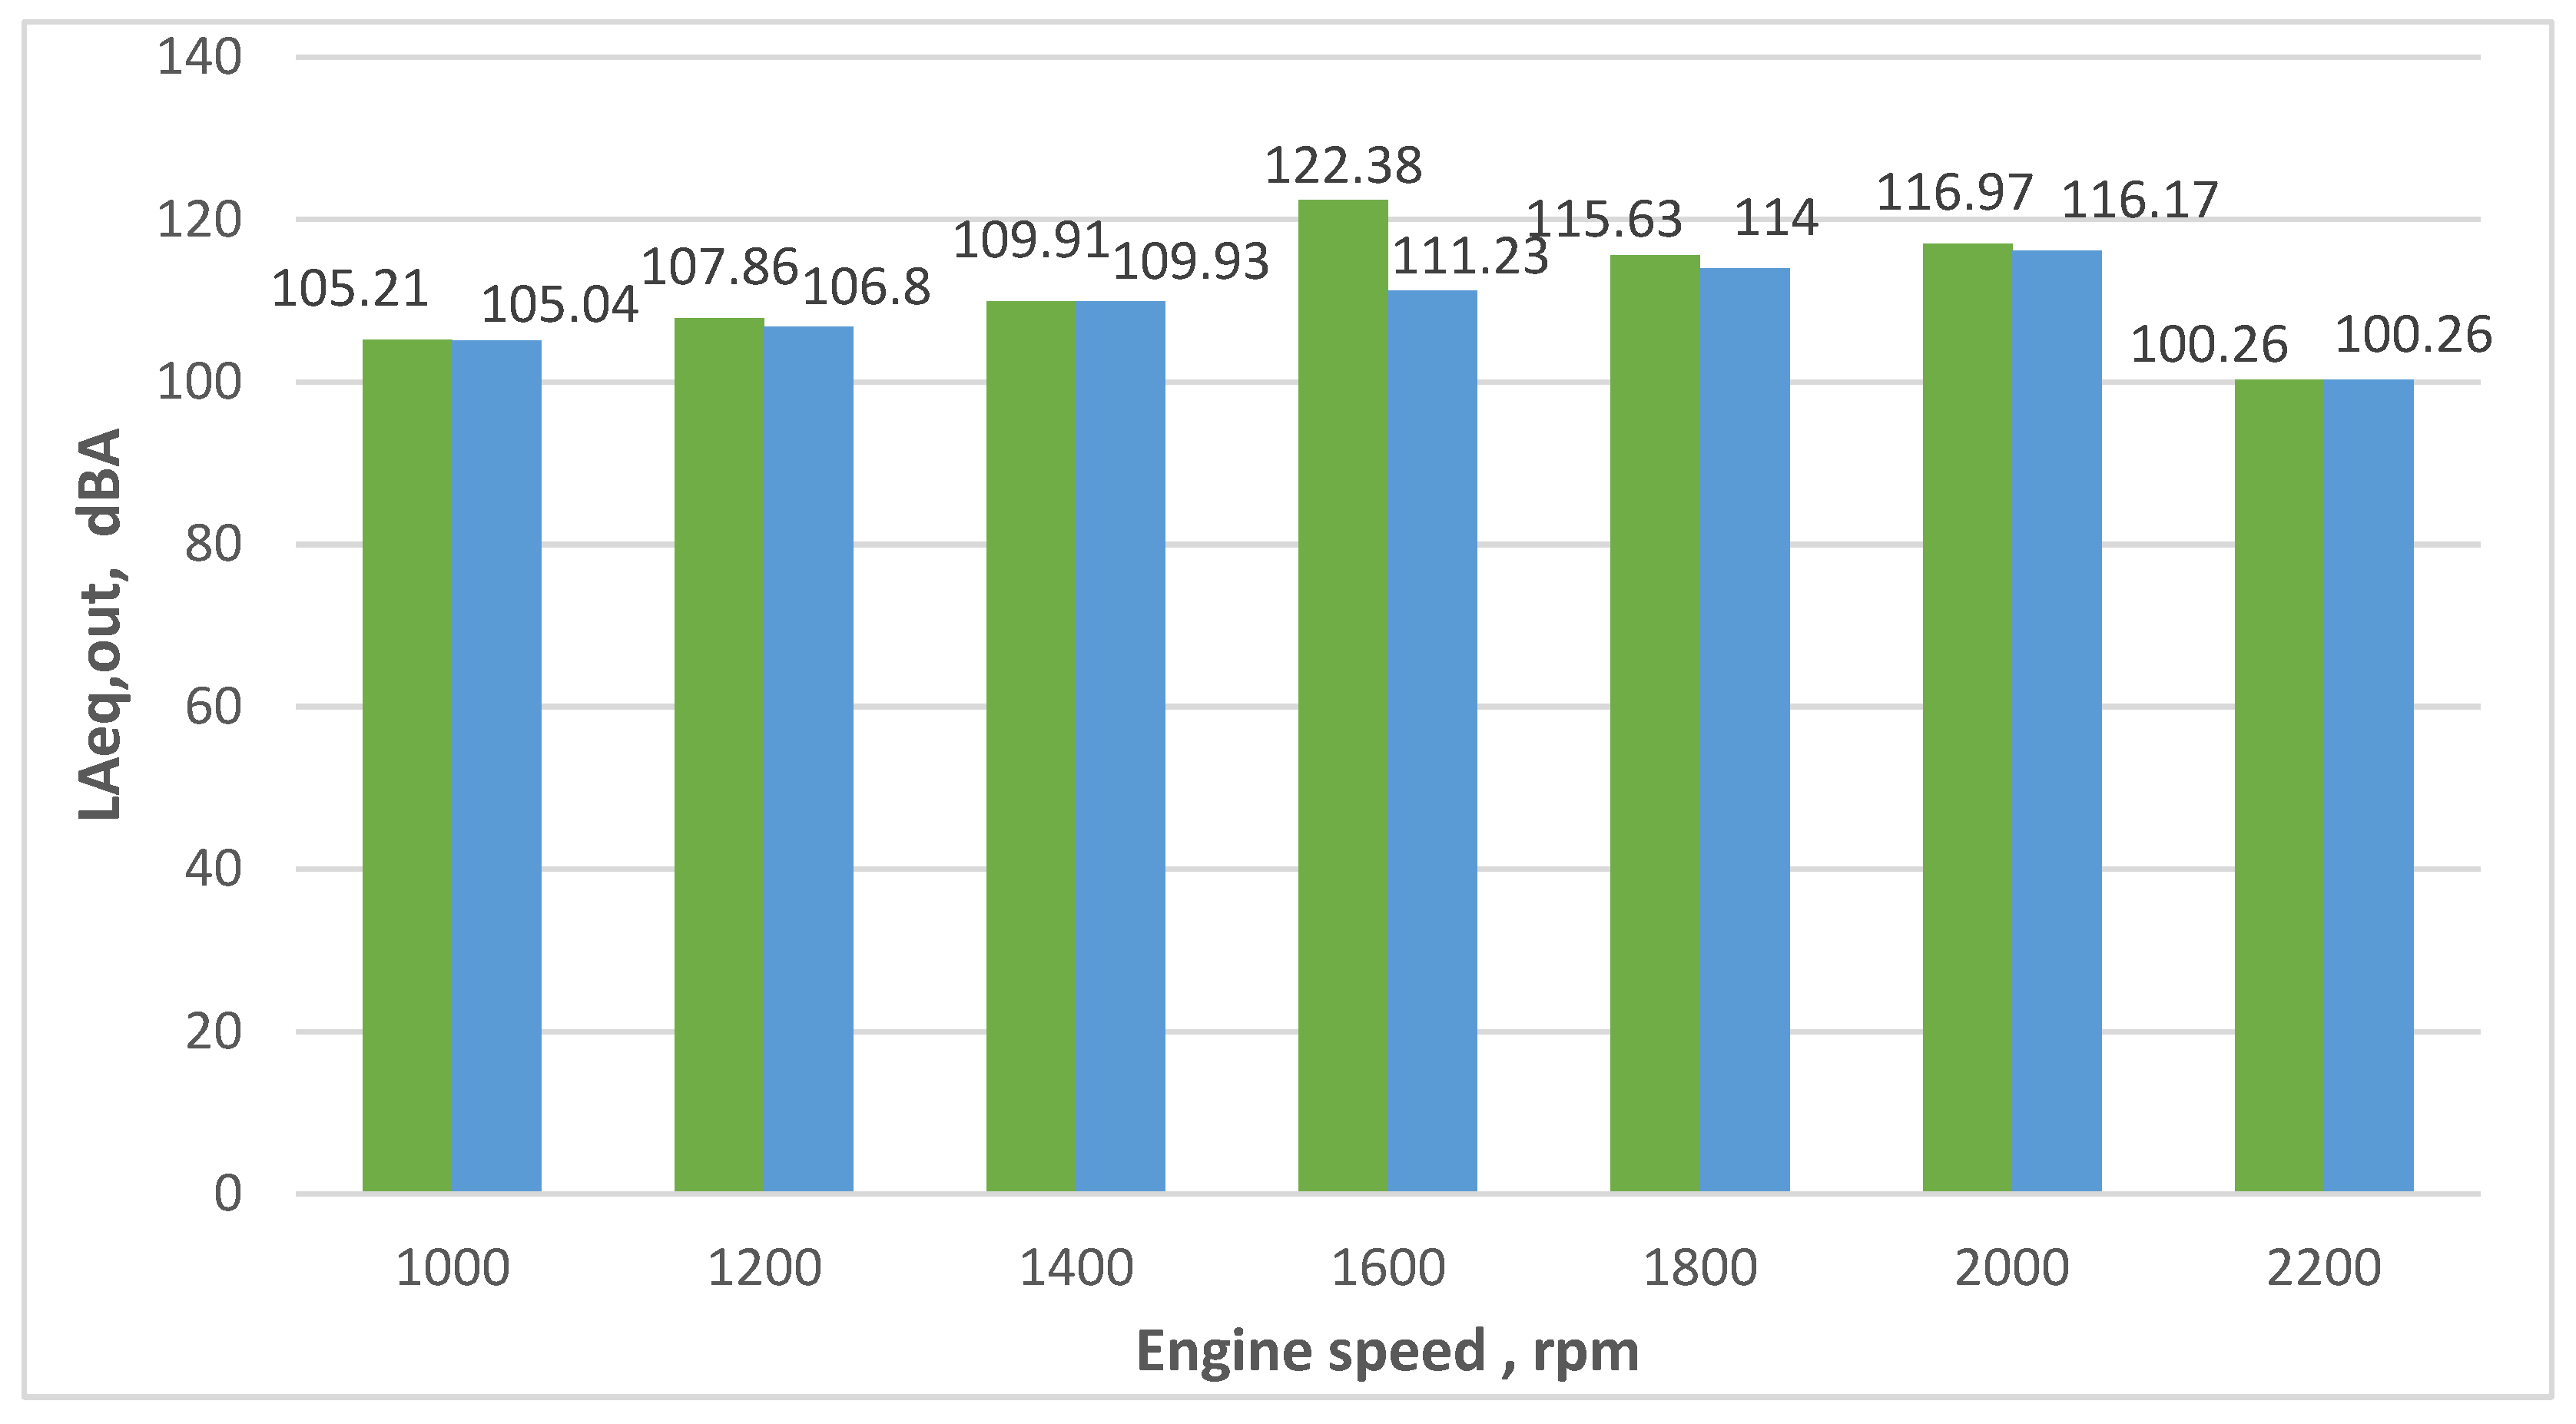
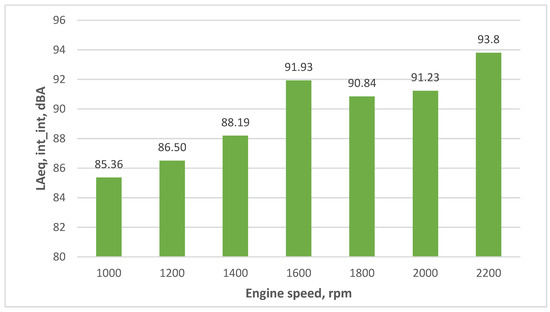
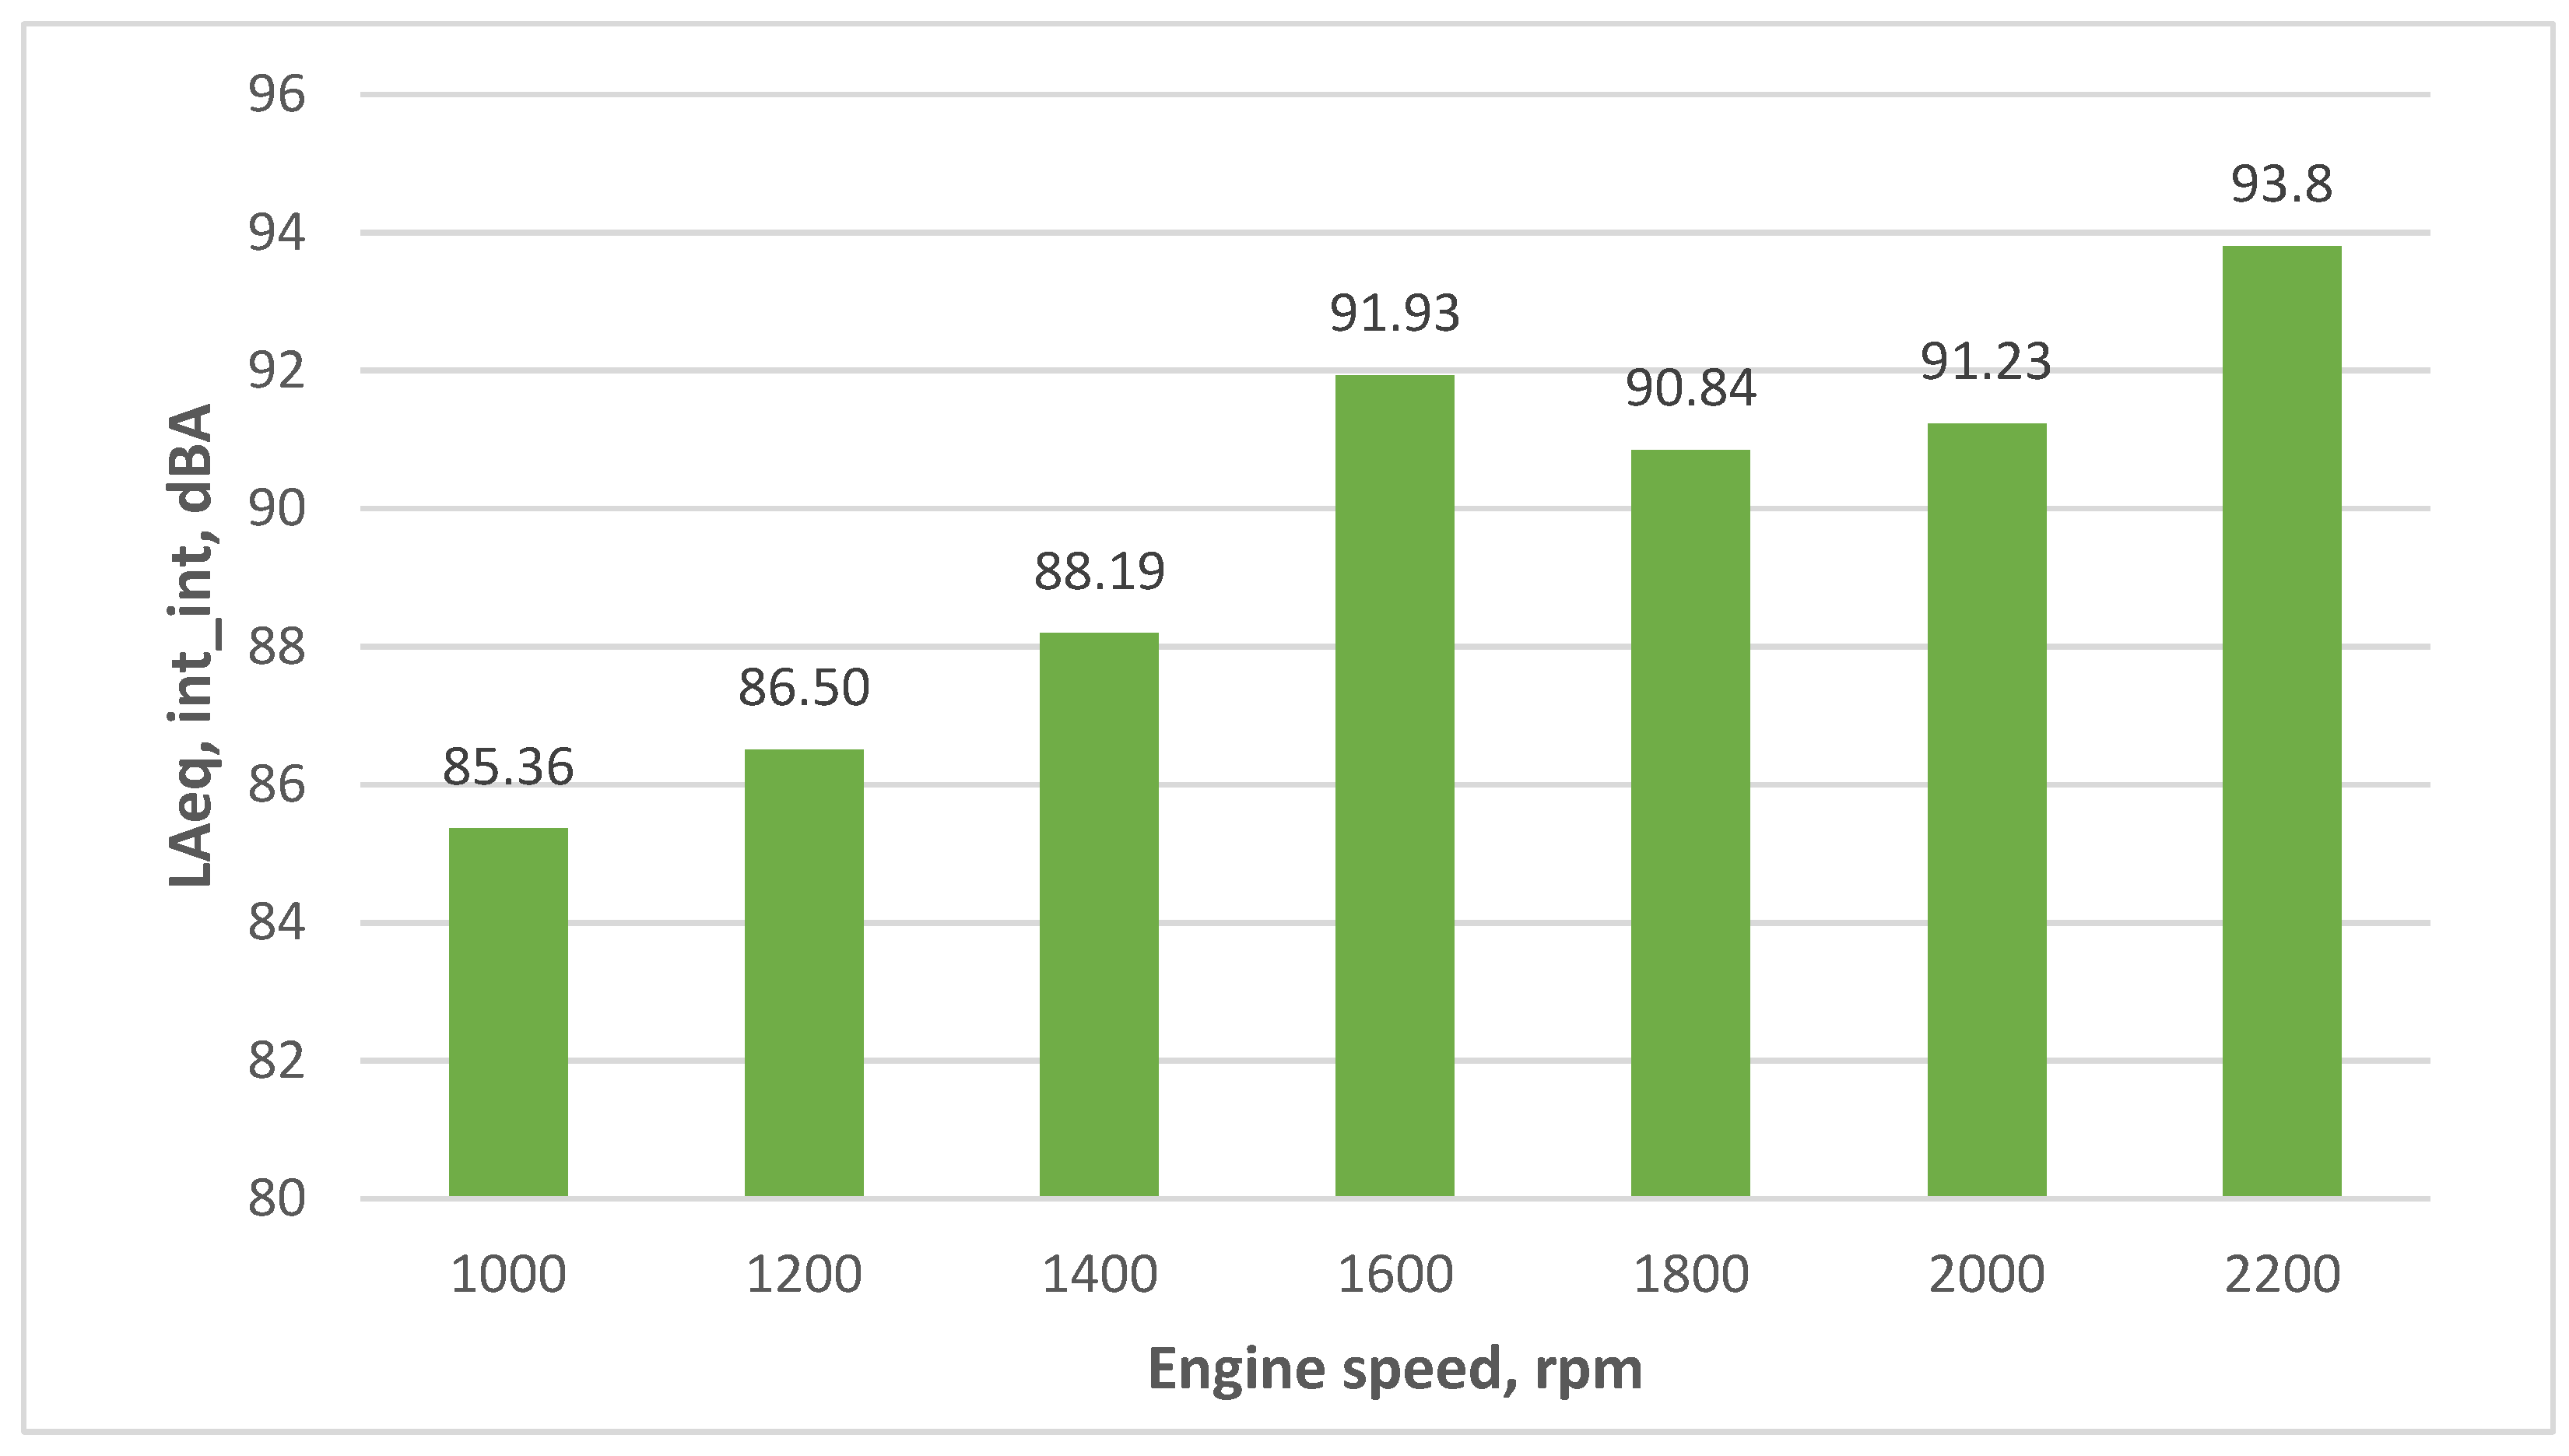
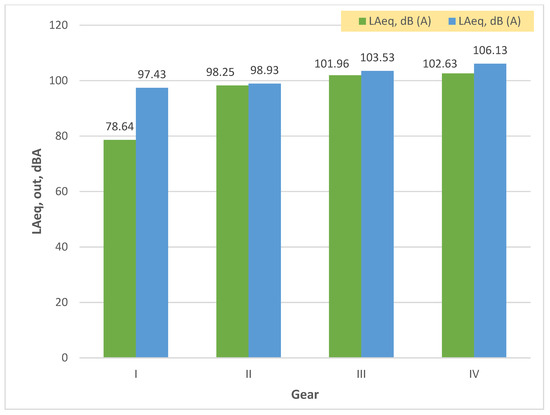
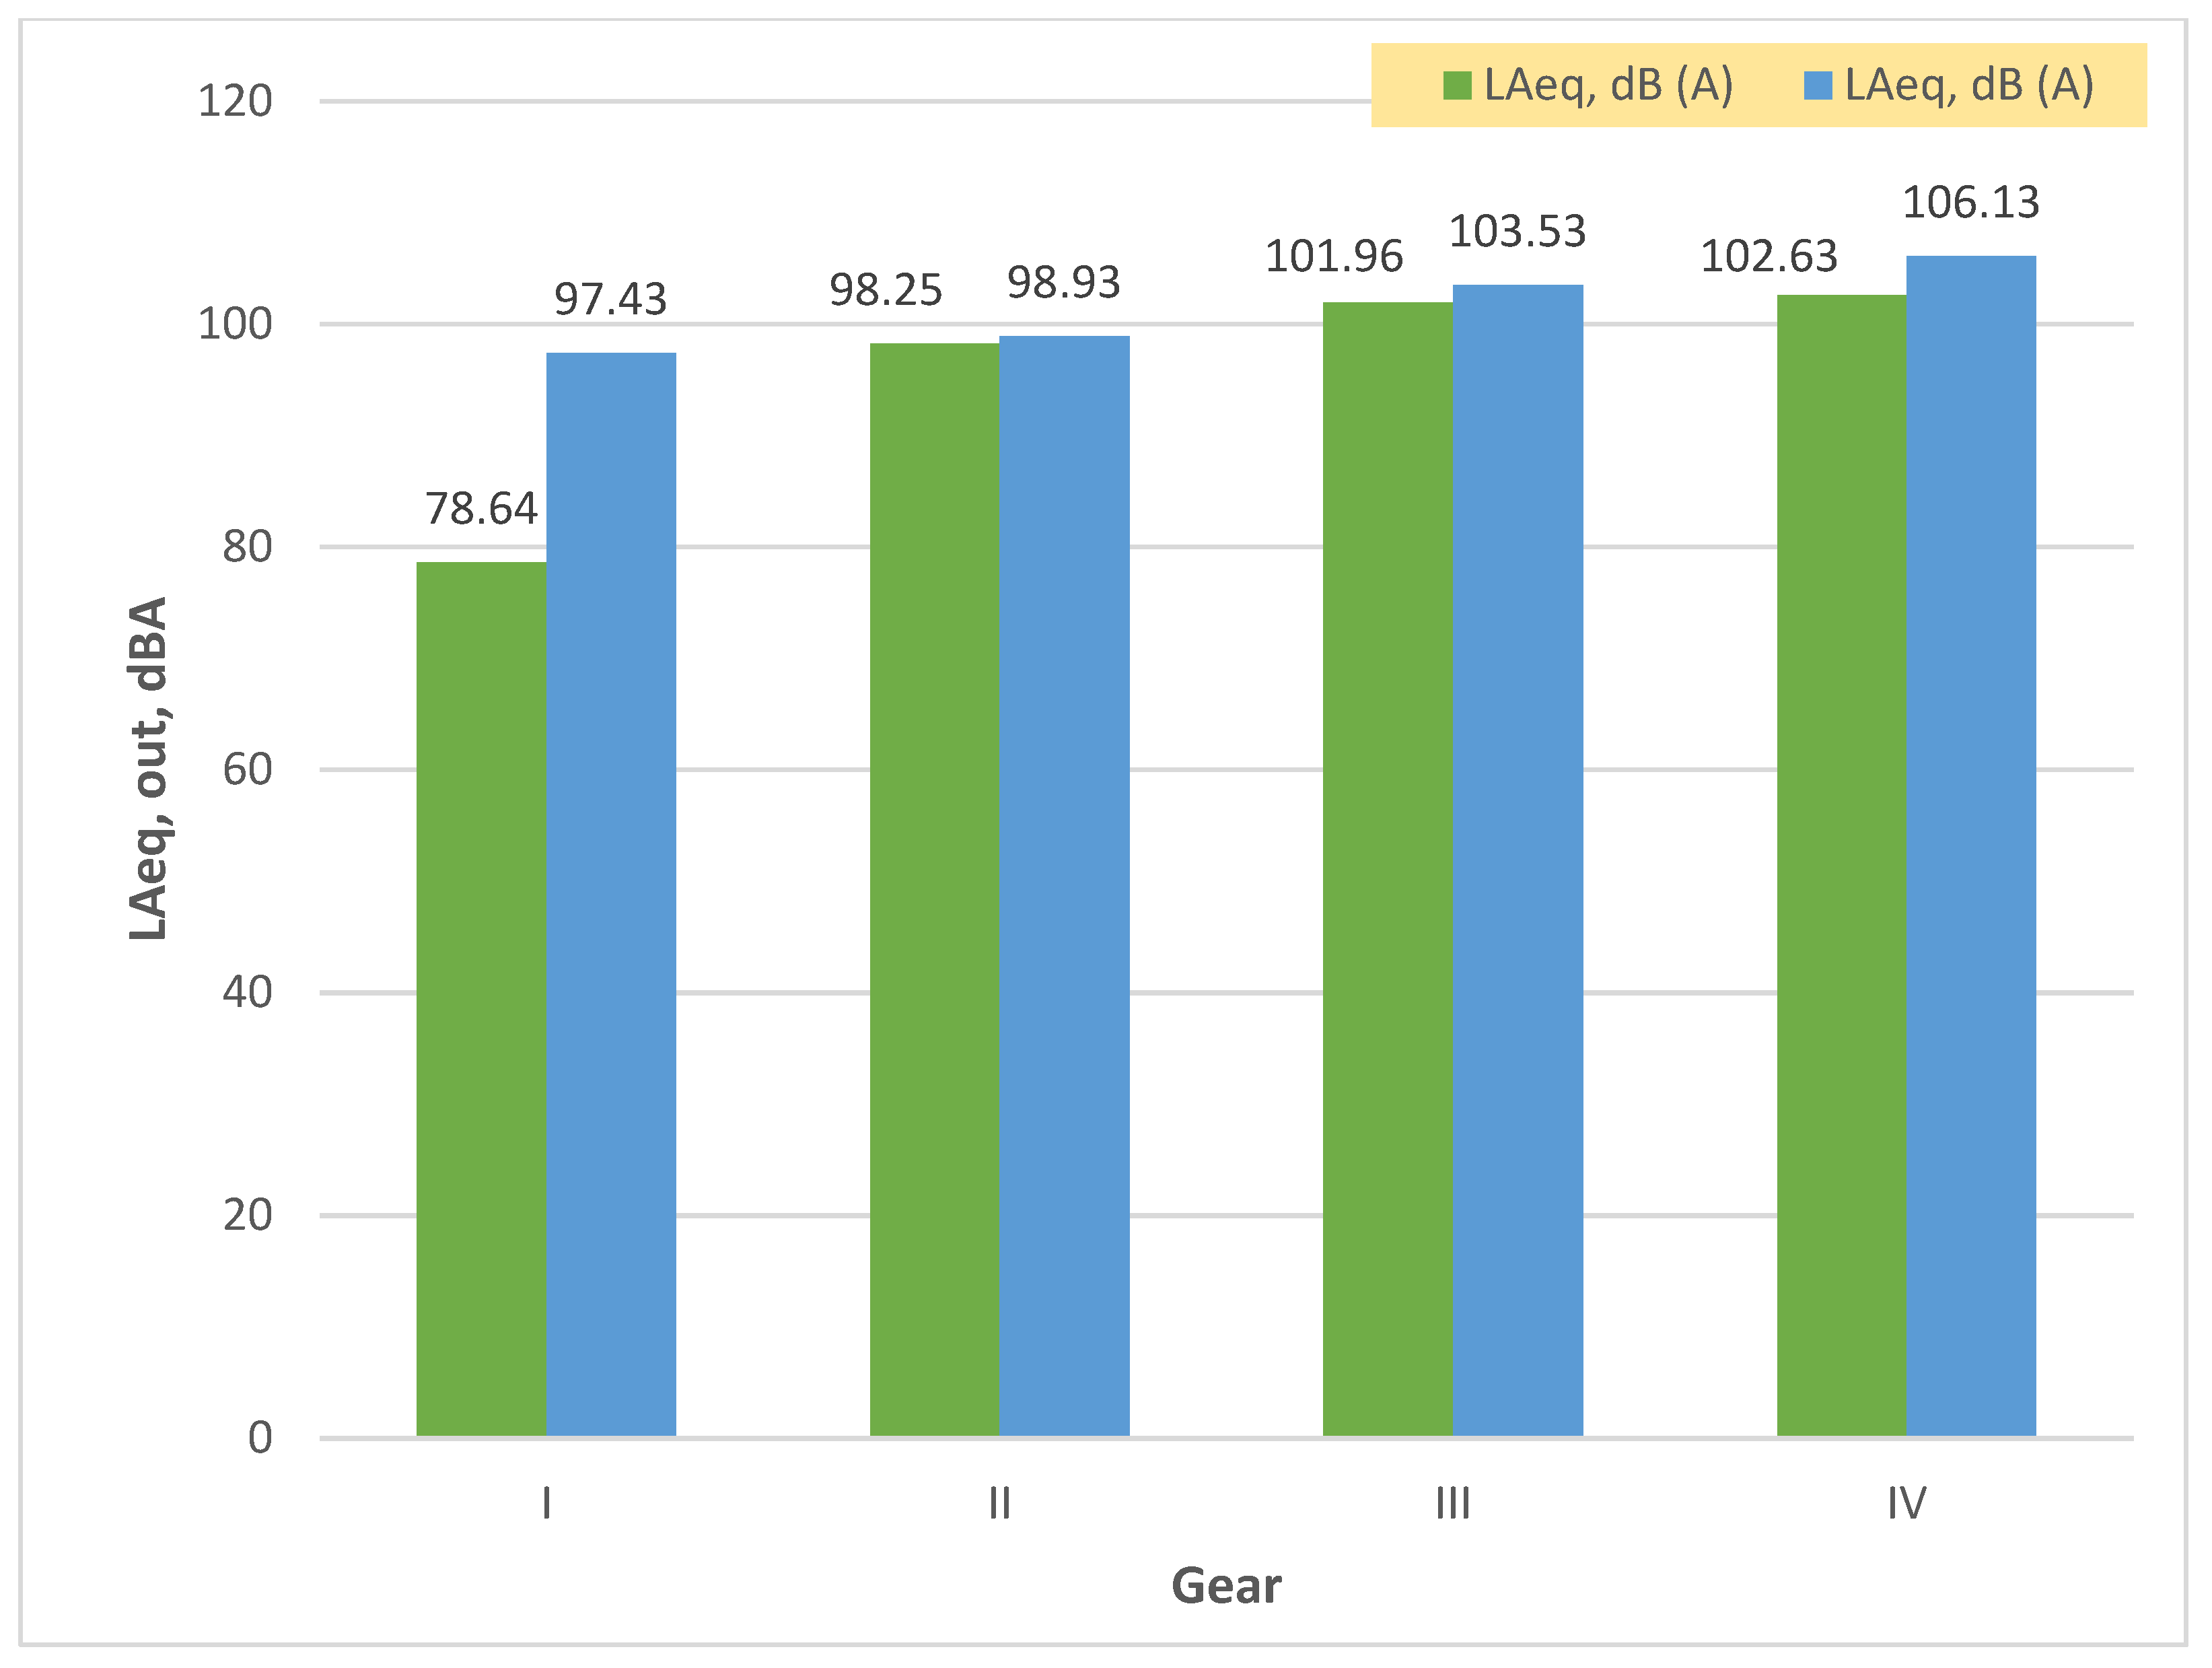
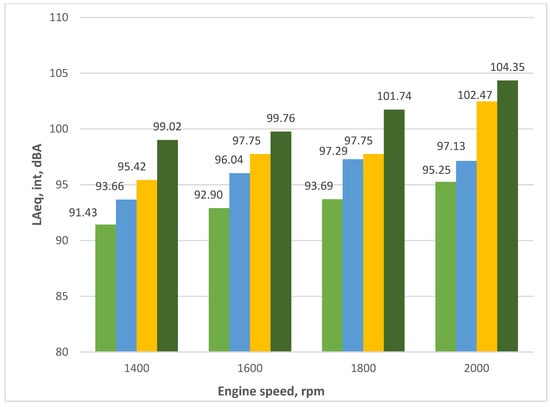
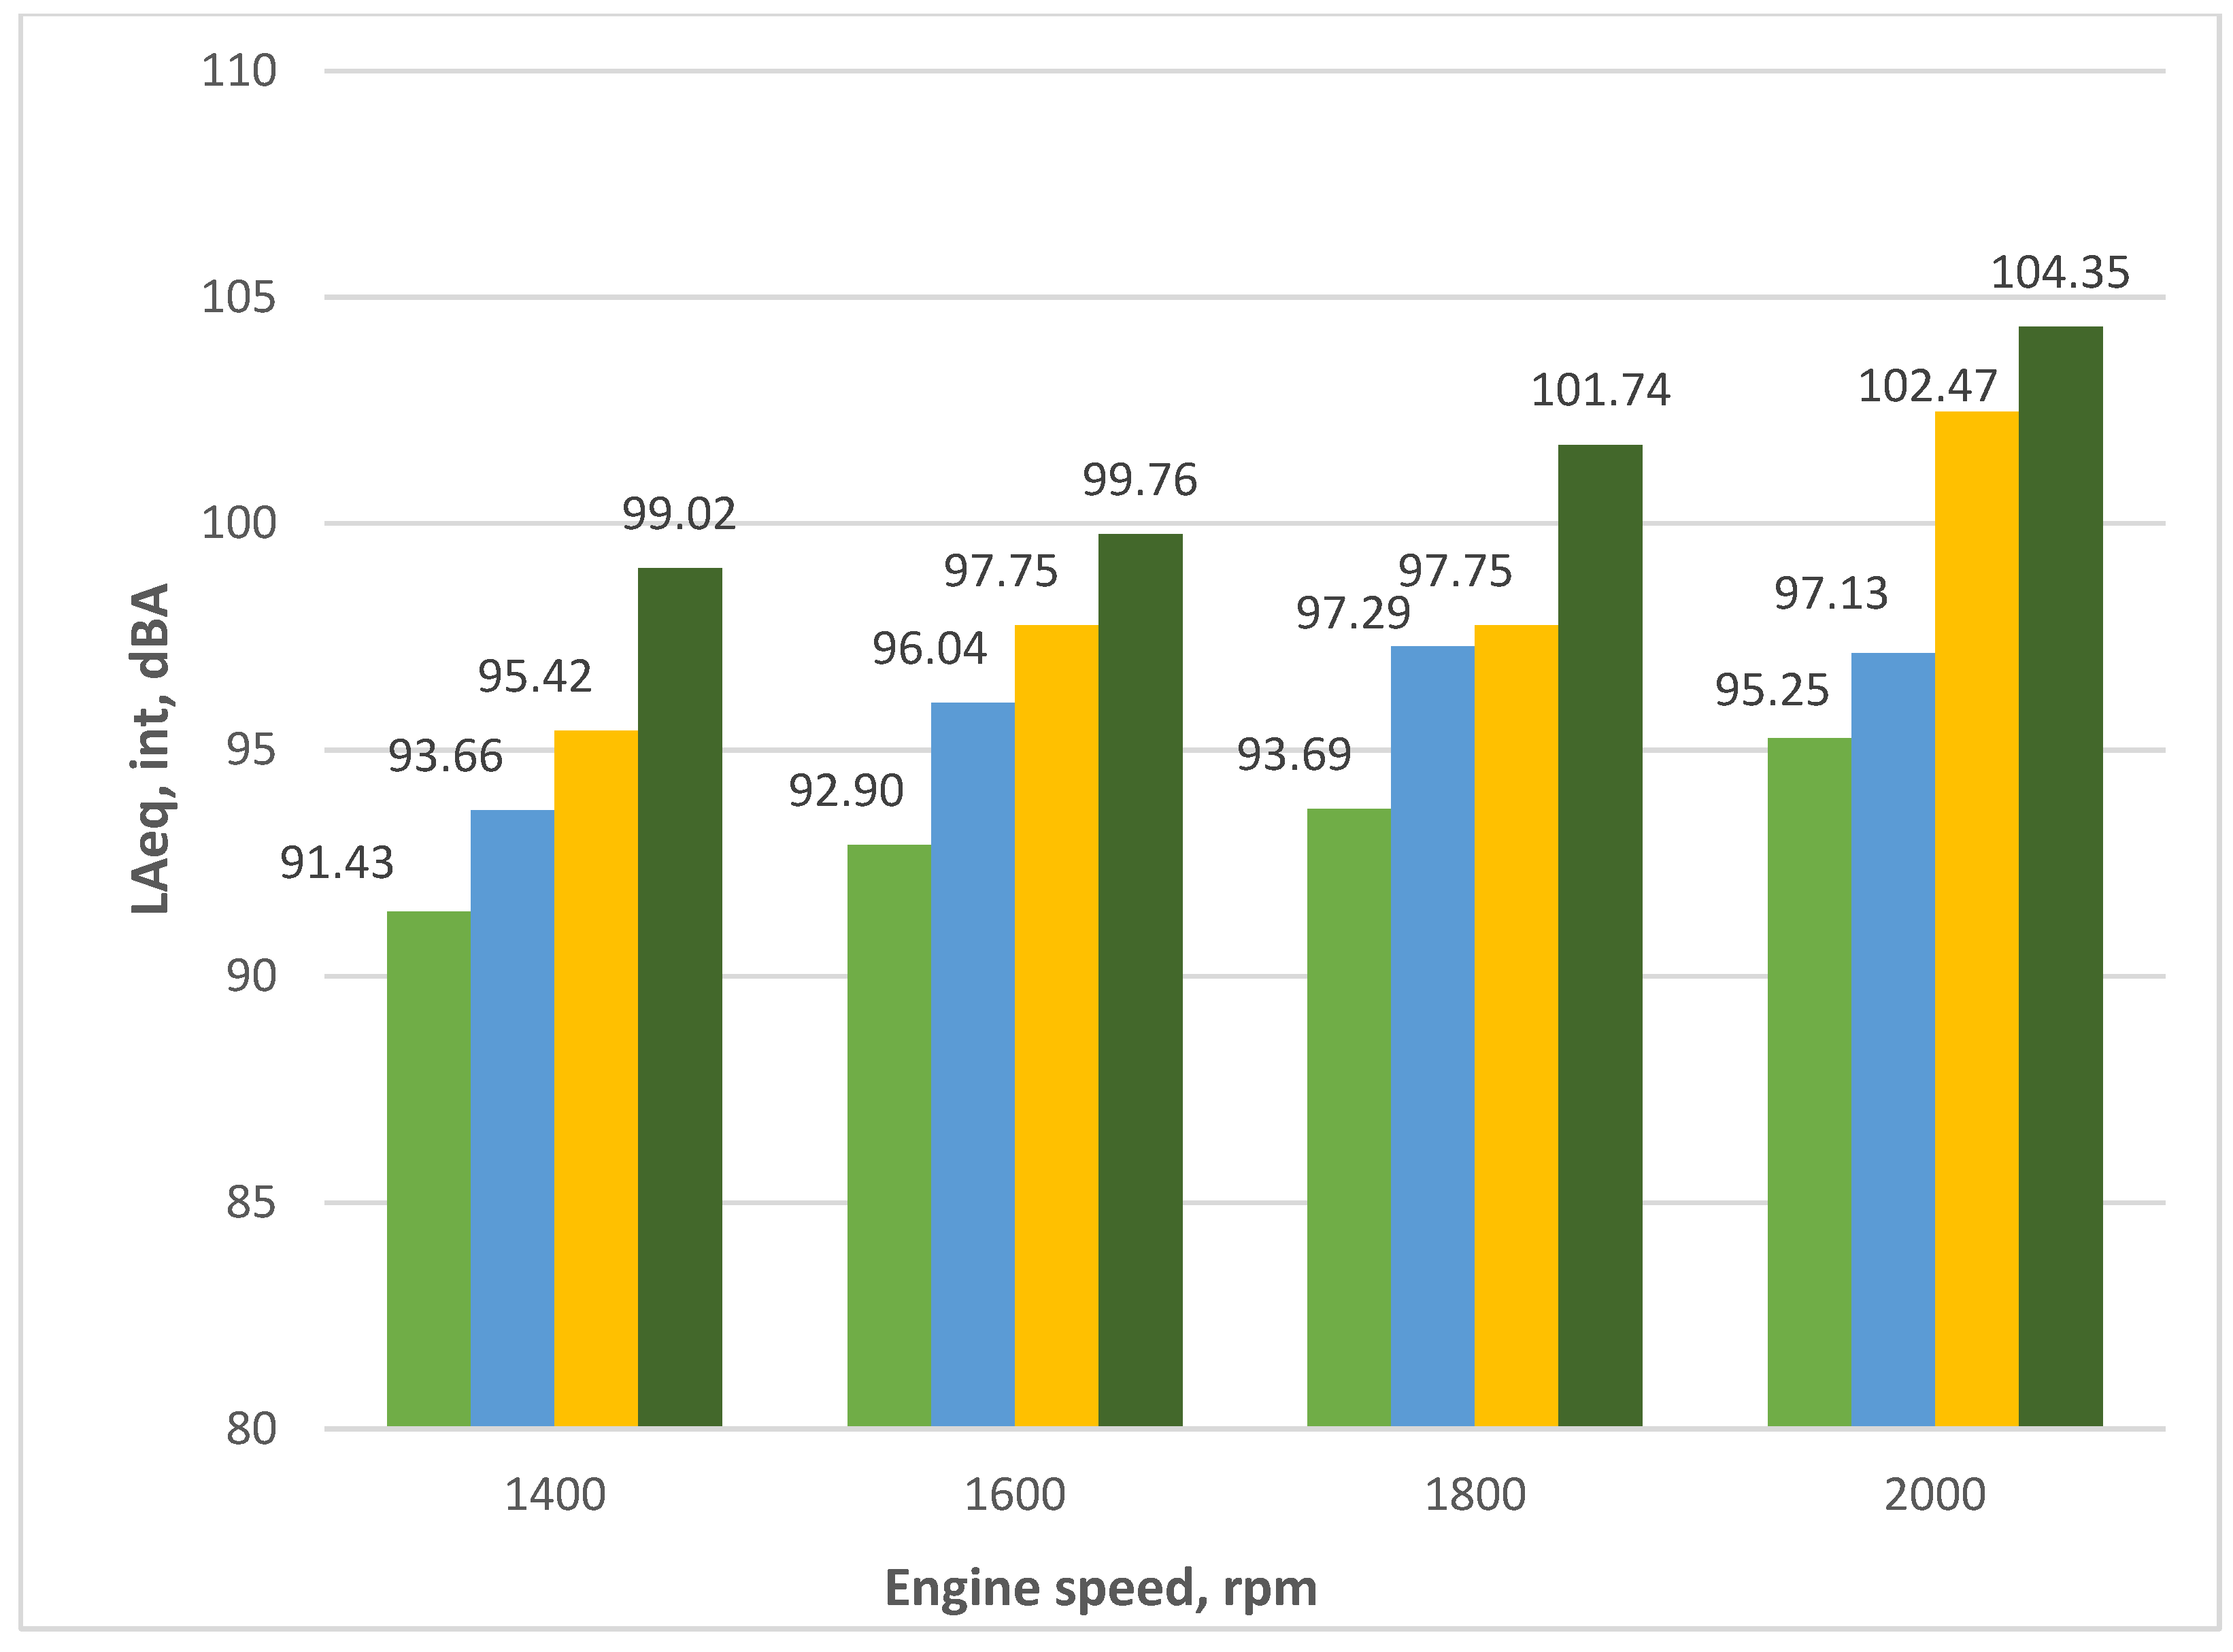
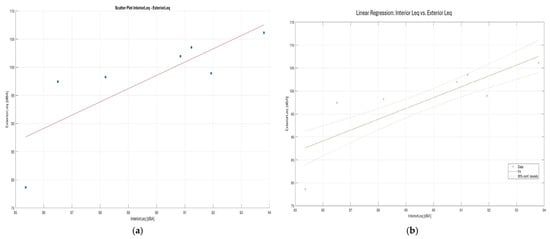
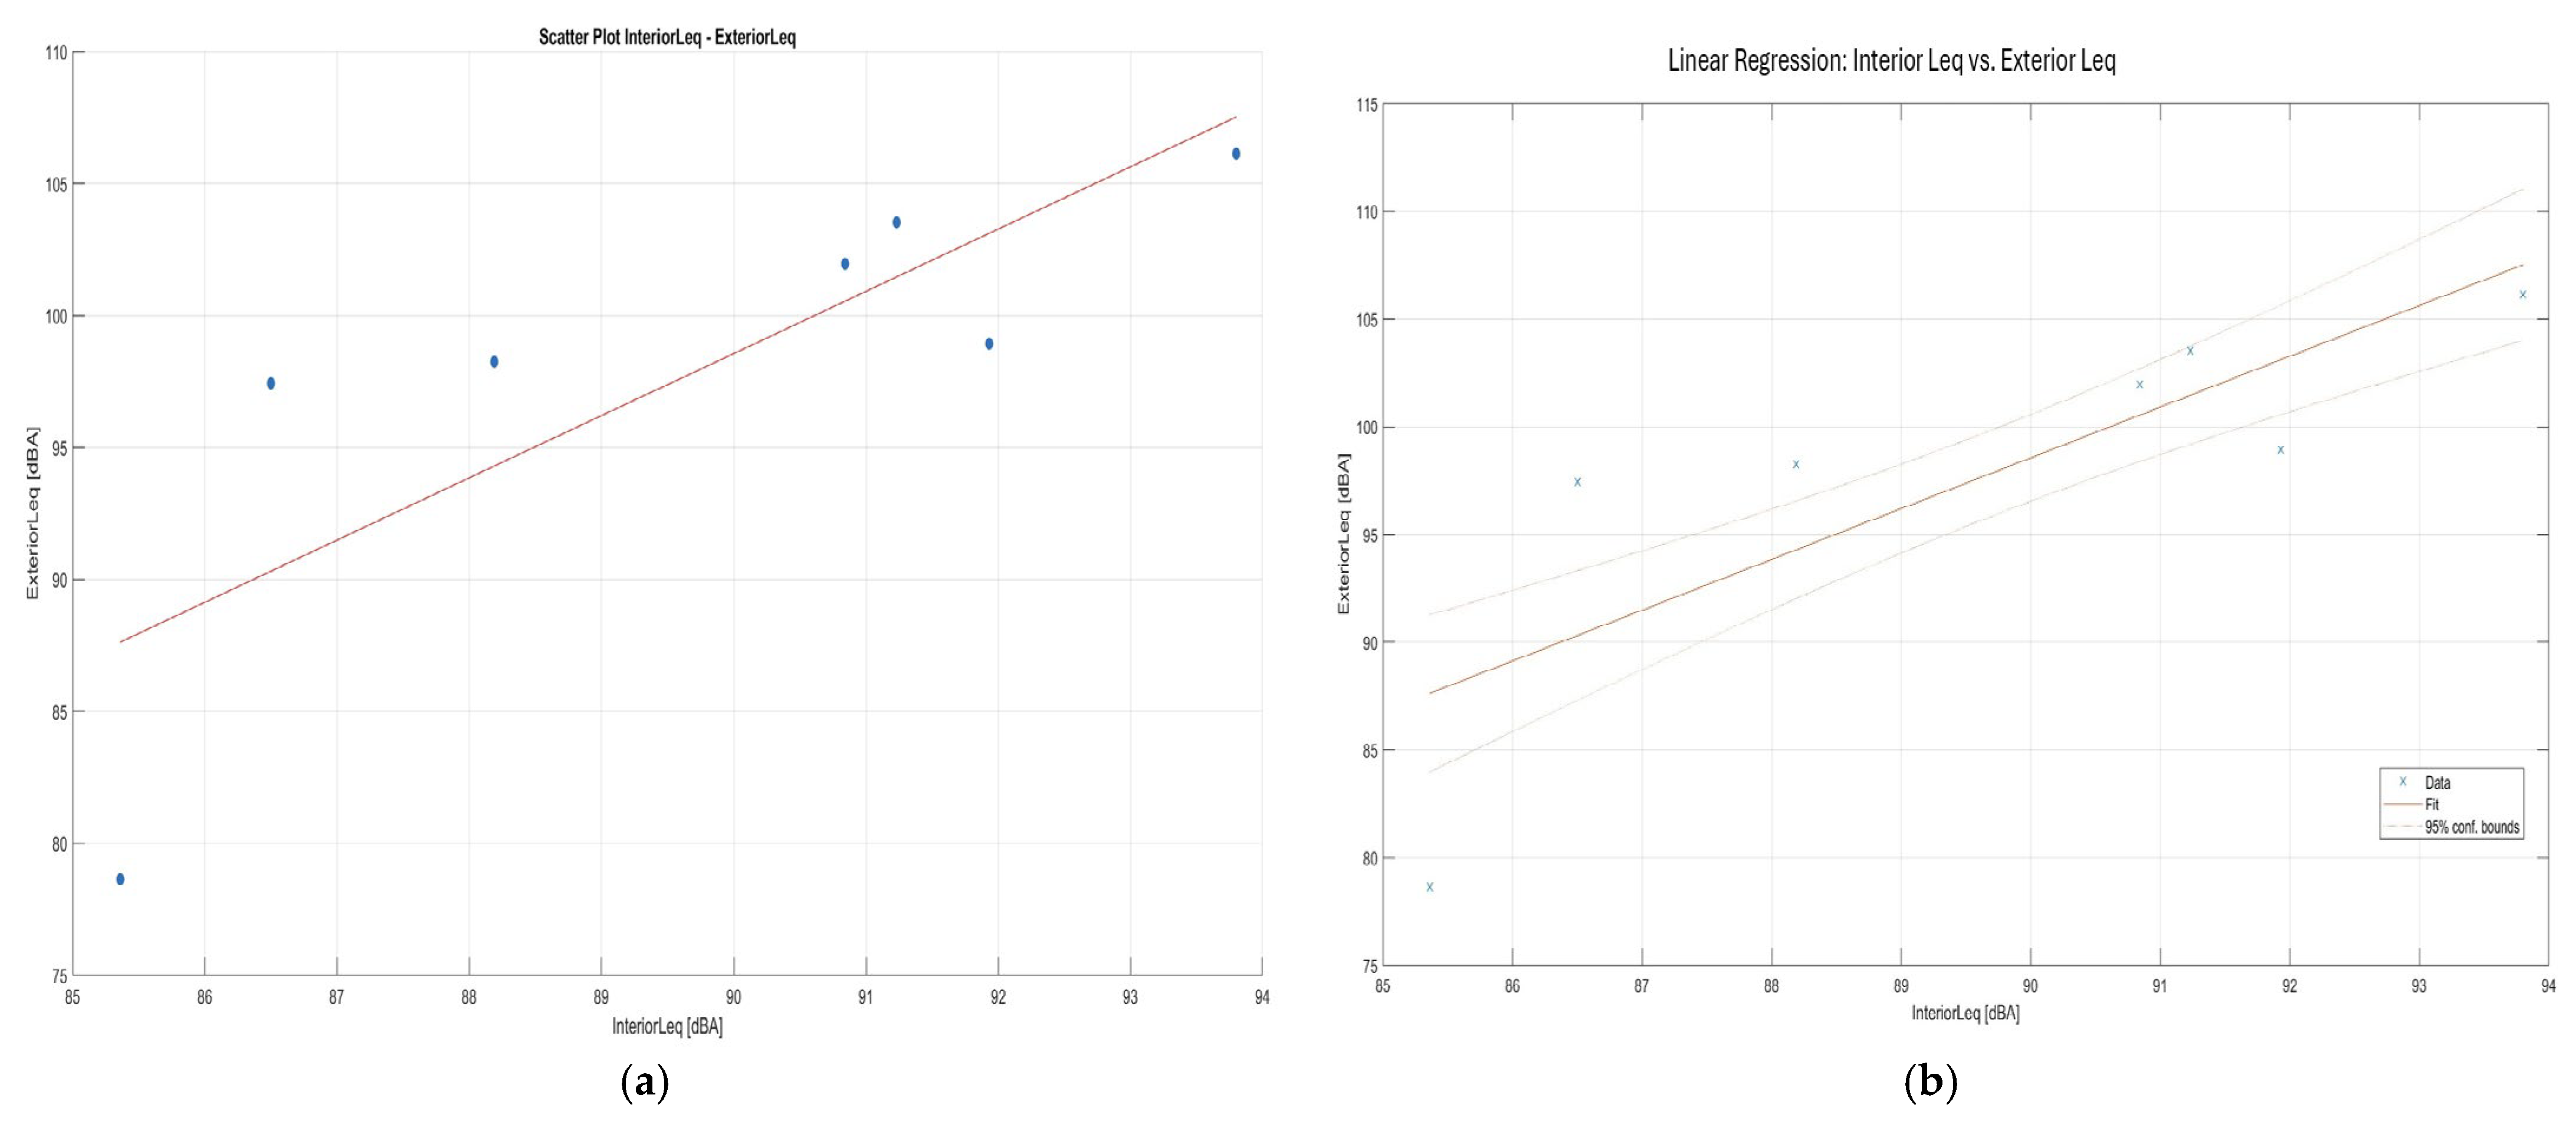
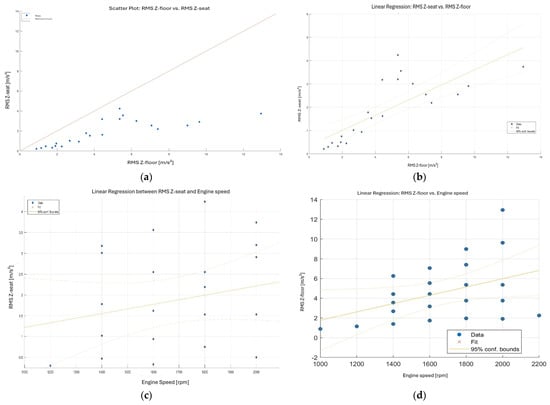
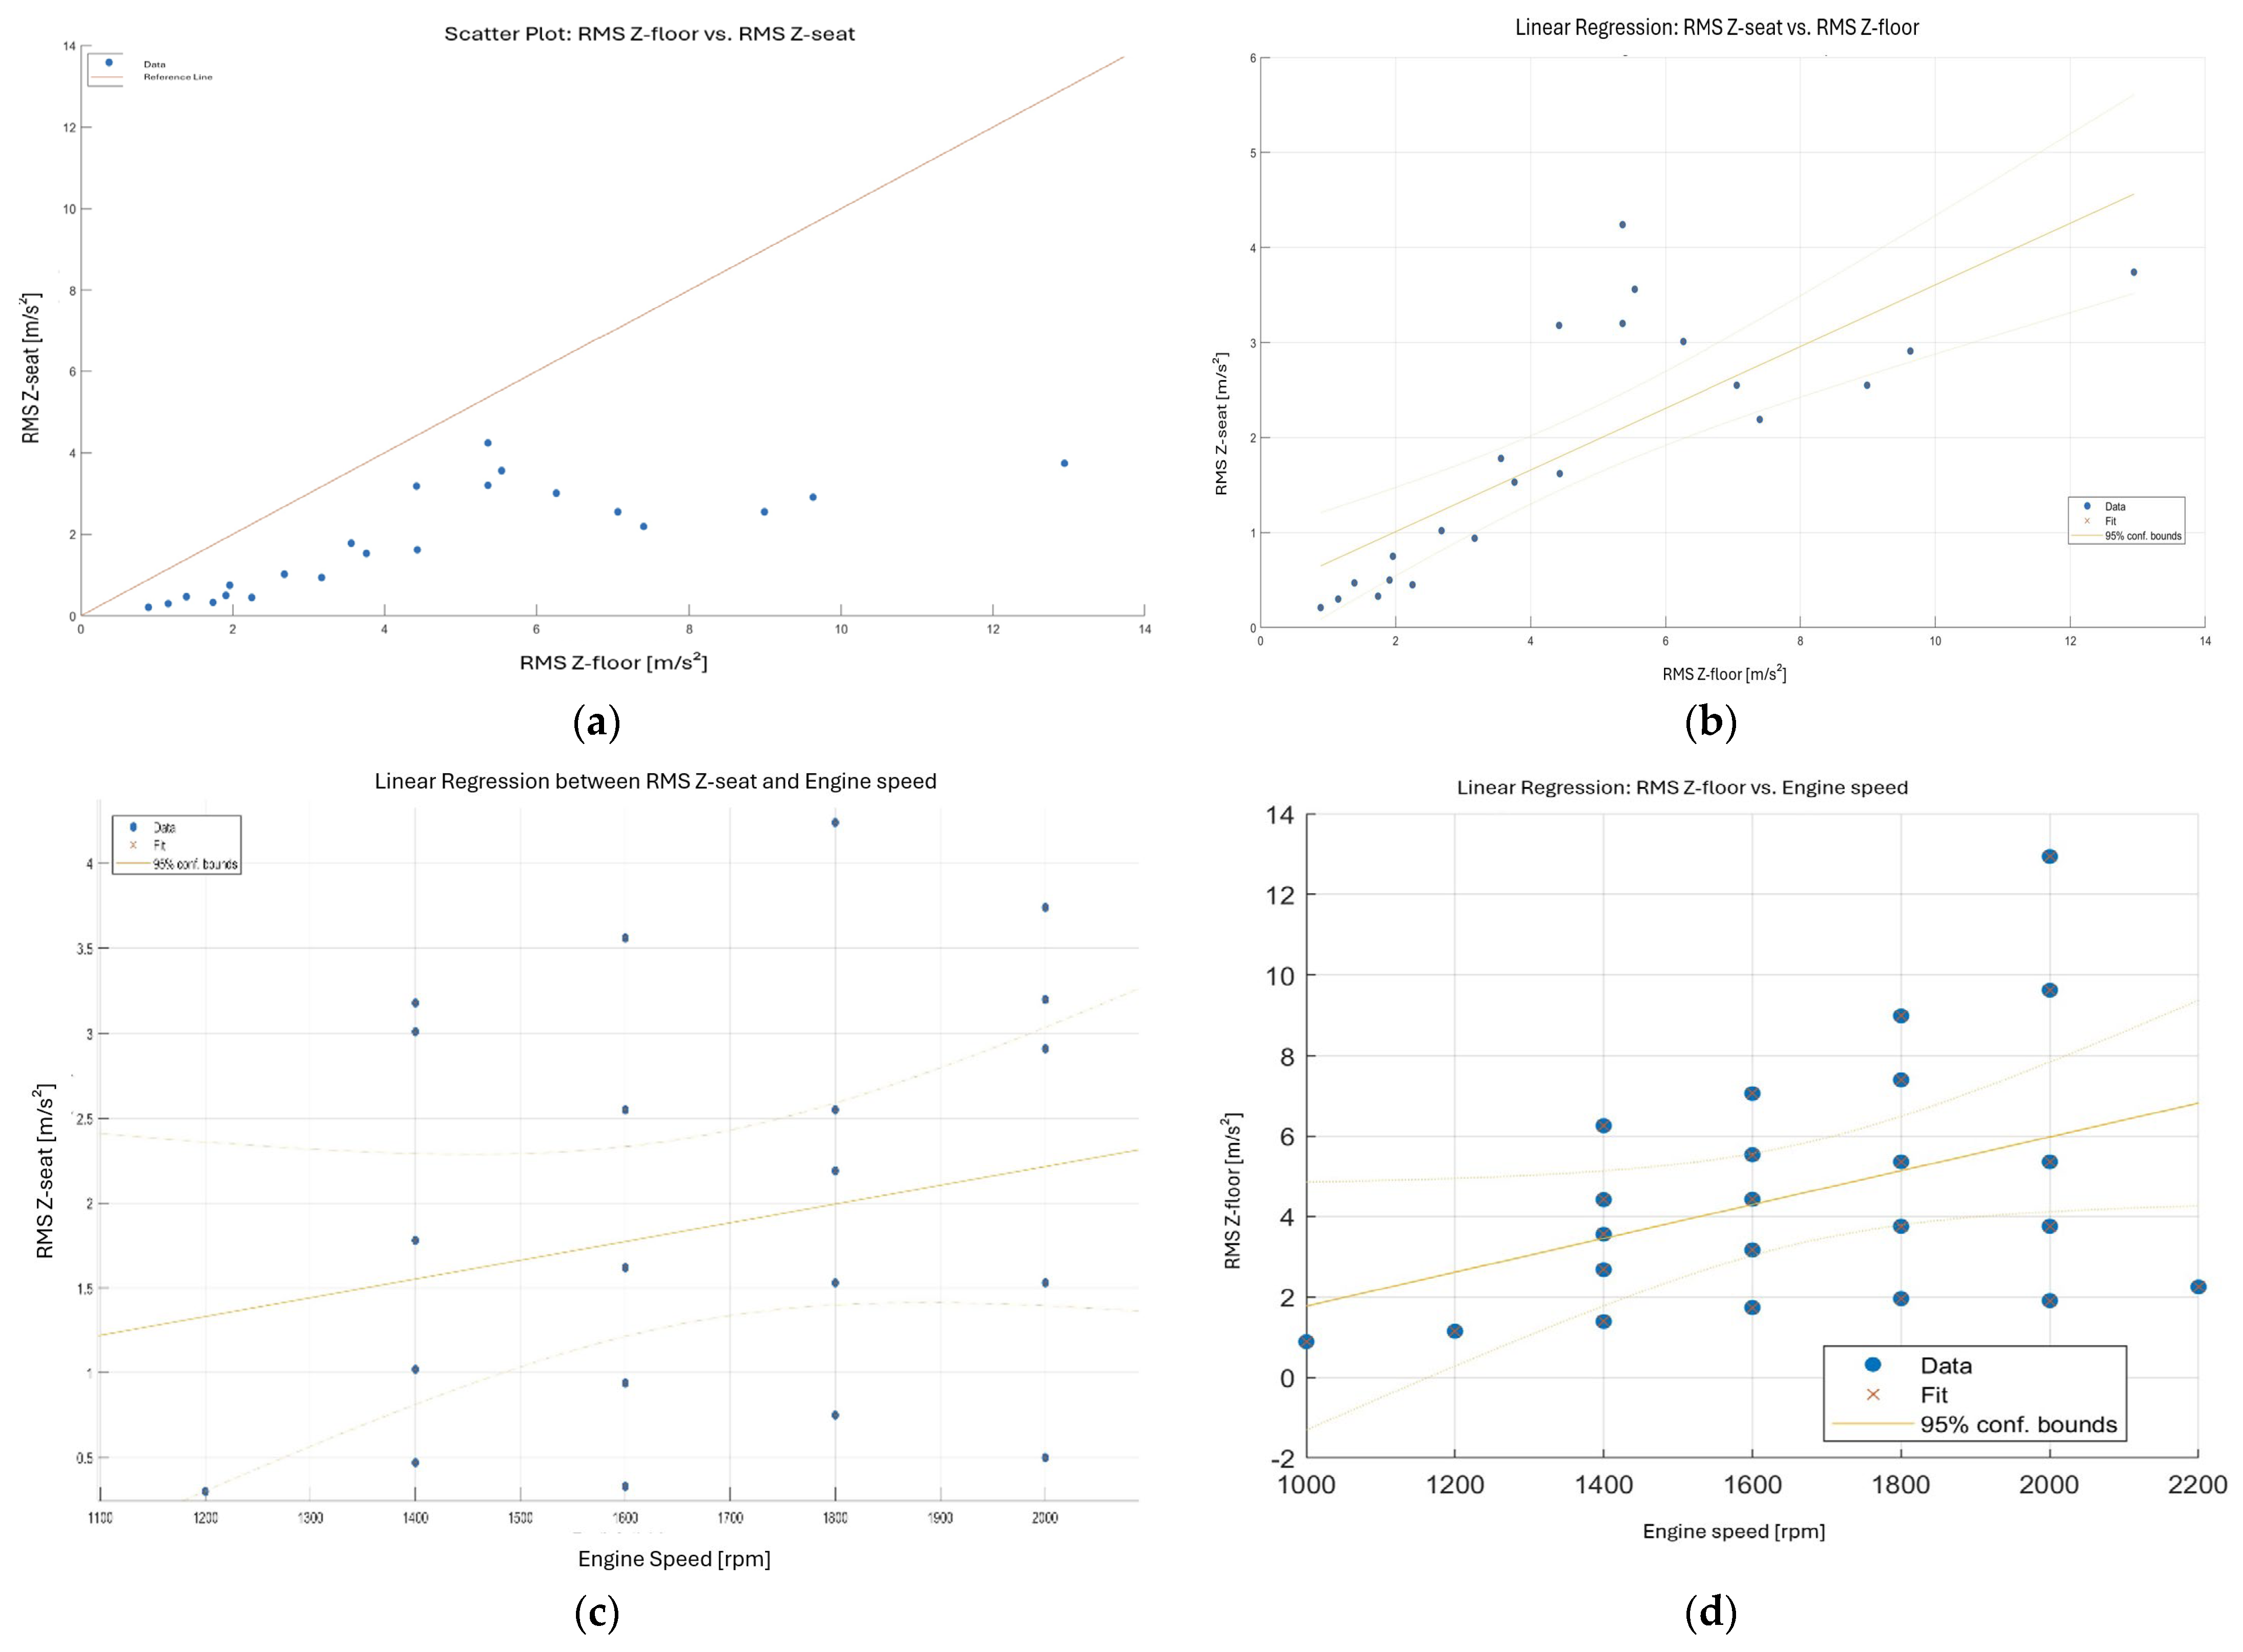
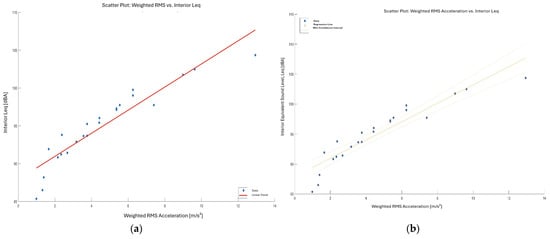
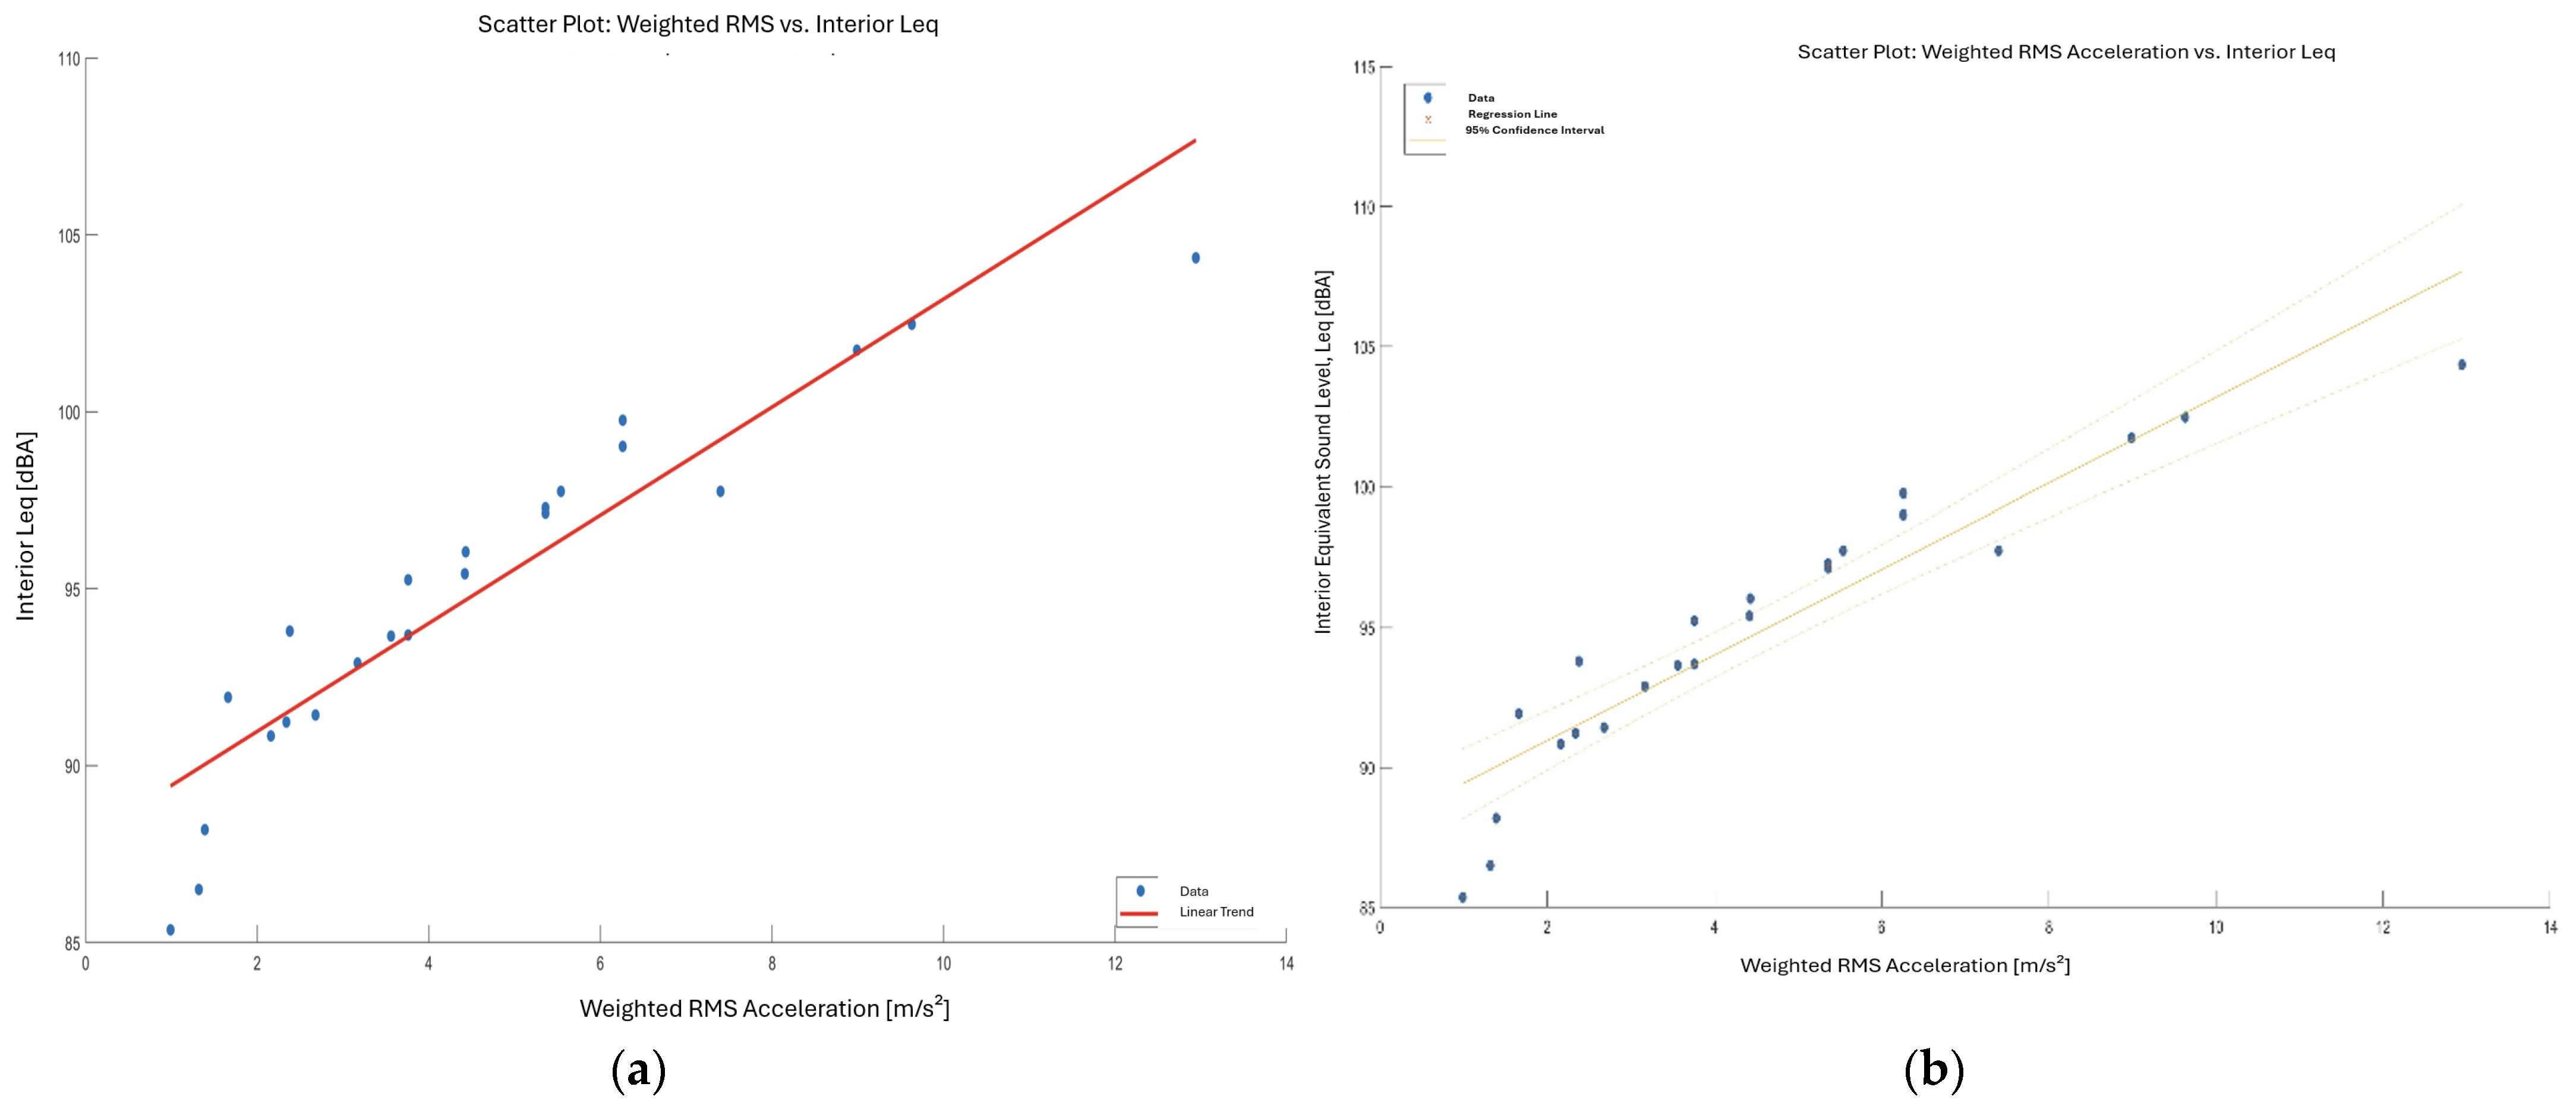

Disclaimer/Publisher’s Note: The statements, opinions and data contained in all publications are solely those of the individual author(s) and contributor(s) and not of MDPI and/or the editor(s). MDPI and/or the editor(s) disclaim responsibility for any injury to people or property resulting from any ideas, methods, instructions or products referred to in the content. |
© 2026 by the authors. Licensee MDPI, Basel, Switzerland. This article is an open access article distributed under the terms and conditions of the Creative Commons Attribution (CC BY) license.