


Abstract
We investigated the effects of atmospheric-pressure plasma treatment on the growth of Saccharomyces cerevisiae by directly comparing plasma exposure and plasma-activated medium (PAM) under strictly identical discharge conditions. An atmospheric-pressure plasma jet operated with argon (Ar) or nitrogen (N2) was used. Yeast growth was analyzed using a phase-resolved kinetic framework that separately evaluated early growth behavior and exponential growth rate based on optical density measurements. Growth curves were normalized to same-day untreated controls to minimize day-to-day variability. Under N2 plasma conditions, both direct exposure and PAM treatment resulted in limited changes in growth kinetics (μrel = 0.67–0.97; trel ≈ 1.02–1.09). In contrast, Ar plasma treatment produced clear mode-dependent effects. Direct exposure delayed growth initiation (trel = 1.00–1.40) with a moderate reduction in μrel (0.63–0.84). PAM treatment strongly suppressed μrel (0.19–0.50), whereas trel varied across conditions without systematic prolongation (0.59–1.09). These findings demonstrate that treatment mode strongly influences which growth phase is predominantly affected, highlighting the importance of phase-resolved kinetic analysis for distinguishing plasma-induced biological effects beyond conventional endpoint measurements.
1. Introduction
Atmospheric-pressure plasma has been widely applied in microbial control technologies for food processing, environmental treatment, and bioprocessing applications, as reported in numerous studies employing dielectric barrier discharge and plasma jet systems [1,2,3]. In these applications, plasma is typically applied either by direct exposure of microorganisms to the plasma phase or indirectly through plasma-activated liquids. Plasma-activated water and plasma-activated culture media are commonly used, and plasma-activated medium (PAM) is a representative example [4,5,6,7].
Although both treatment modes are frequently employed, direct comparison between them remains difficult. In many previous studies, plasma treatment conditions differed between experiments, including plasma source configuration, discharge voltage, working gas composition, and treatment duration [2,8]. Because of these differences, the influence of the treatment mode itself has not been clearly identified. In addition, microbial responses to plasma treatment are often evaluated using endpoint measurements, such as final biomass, cell number, or colony-forming units. Such measurements do not provide information on growth dynamics during early or exponential growth phases, which have been shown to be critical for understanding sublethal stress and post-treatment recovery following plasma exposure [9,10].
Microbial growth consists of multiple phases, including lag phase, exponential growth phase, and stationary phase. Plasma treatment may affect these phases in different ways. Plasma exposure may delay growth initiation without affecting exponential growth rate, while plasma treatment may also suppress exponential growth rate without extending the lag phase [9,11,12,13]. Therefore, evaluation based only on endpoint measurements can mask treatment-mode-dependent effects that appear at different growth phases.
In this study, we performed a controlled comparison of direct plasma exposure and PAM treatment under strictly identical atmospheric-pressure plasma discharge conditions. Saccharomyces cerevisiae was selected as a model eukaryotic microorganism because its growth behavior is well characterized and reproducible [11,12,13]. Growth responses were analyzed using a phase-resolved kinetic framework that separates early growth behavior from exponential growth capacity. This approach allows quantitative comparison of plasma treatment modes based on which growth phase is affected.
2. Materials and Methods
2.1. Yeast Strain and Culture Medium
The budding yeast Saccharomyces cerevisiae (NBRC 1136) was used as a model eukaryotic microorganism in this study. A representative optical microscopy image of the yeast cells is provided in Supplementary Figure S3. Yeast cells were precultured in yeast extract–peptone–dextrose (YPD) medium at 30 °C with shaking until they reached the exponential growth phase. Prior to plasma treatment, the cultures were diluted with fresh YPD medium so that the initial optical density at 620 nm (OD620) was the same for all experimental conditions. This procedure ensured comparable initial biomass at the start of growth measurements.
2.2. Atmospheric-Pressure Plasma Jet
Plasma treatment was carried out using an atmospheric-pressure plasma jet (APPJ). The plasma source consisted of a quartz tube equipped with inner and outer electrodes, generating a dielectric barrier discharge inside the tube. An AC high-voltage power supply (LHV-10AC, Logy Electronics, Tokyo, Japan) was used. Argon (Ar) or nitrogen (N2) was supplied as the working gas.
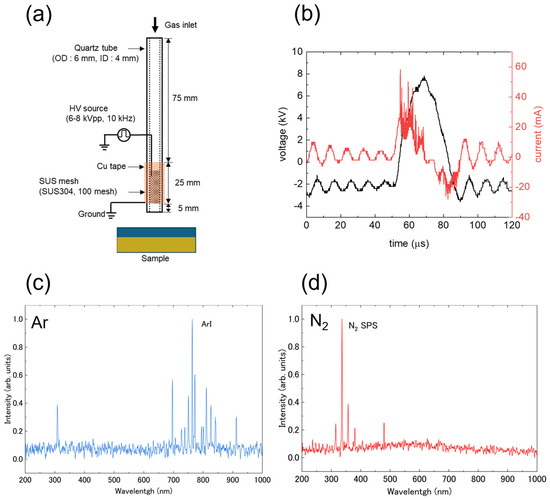
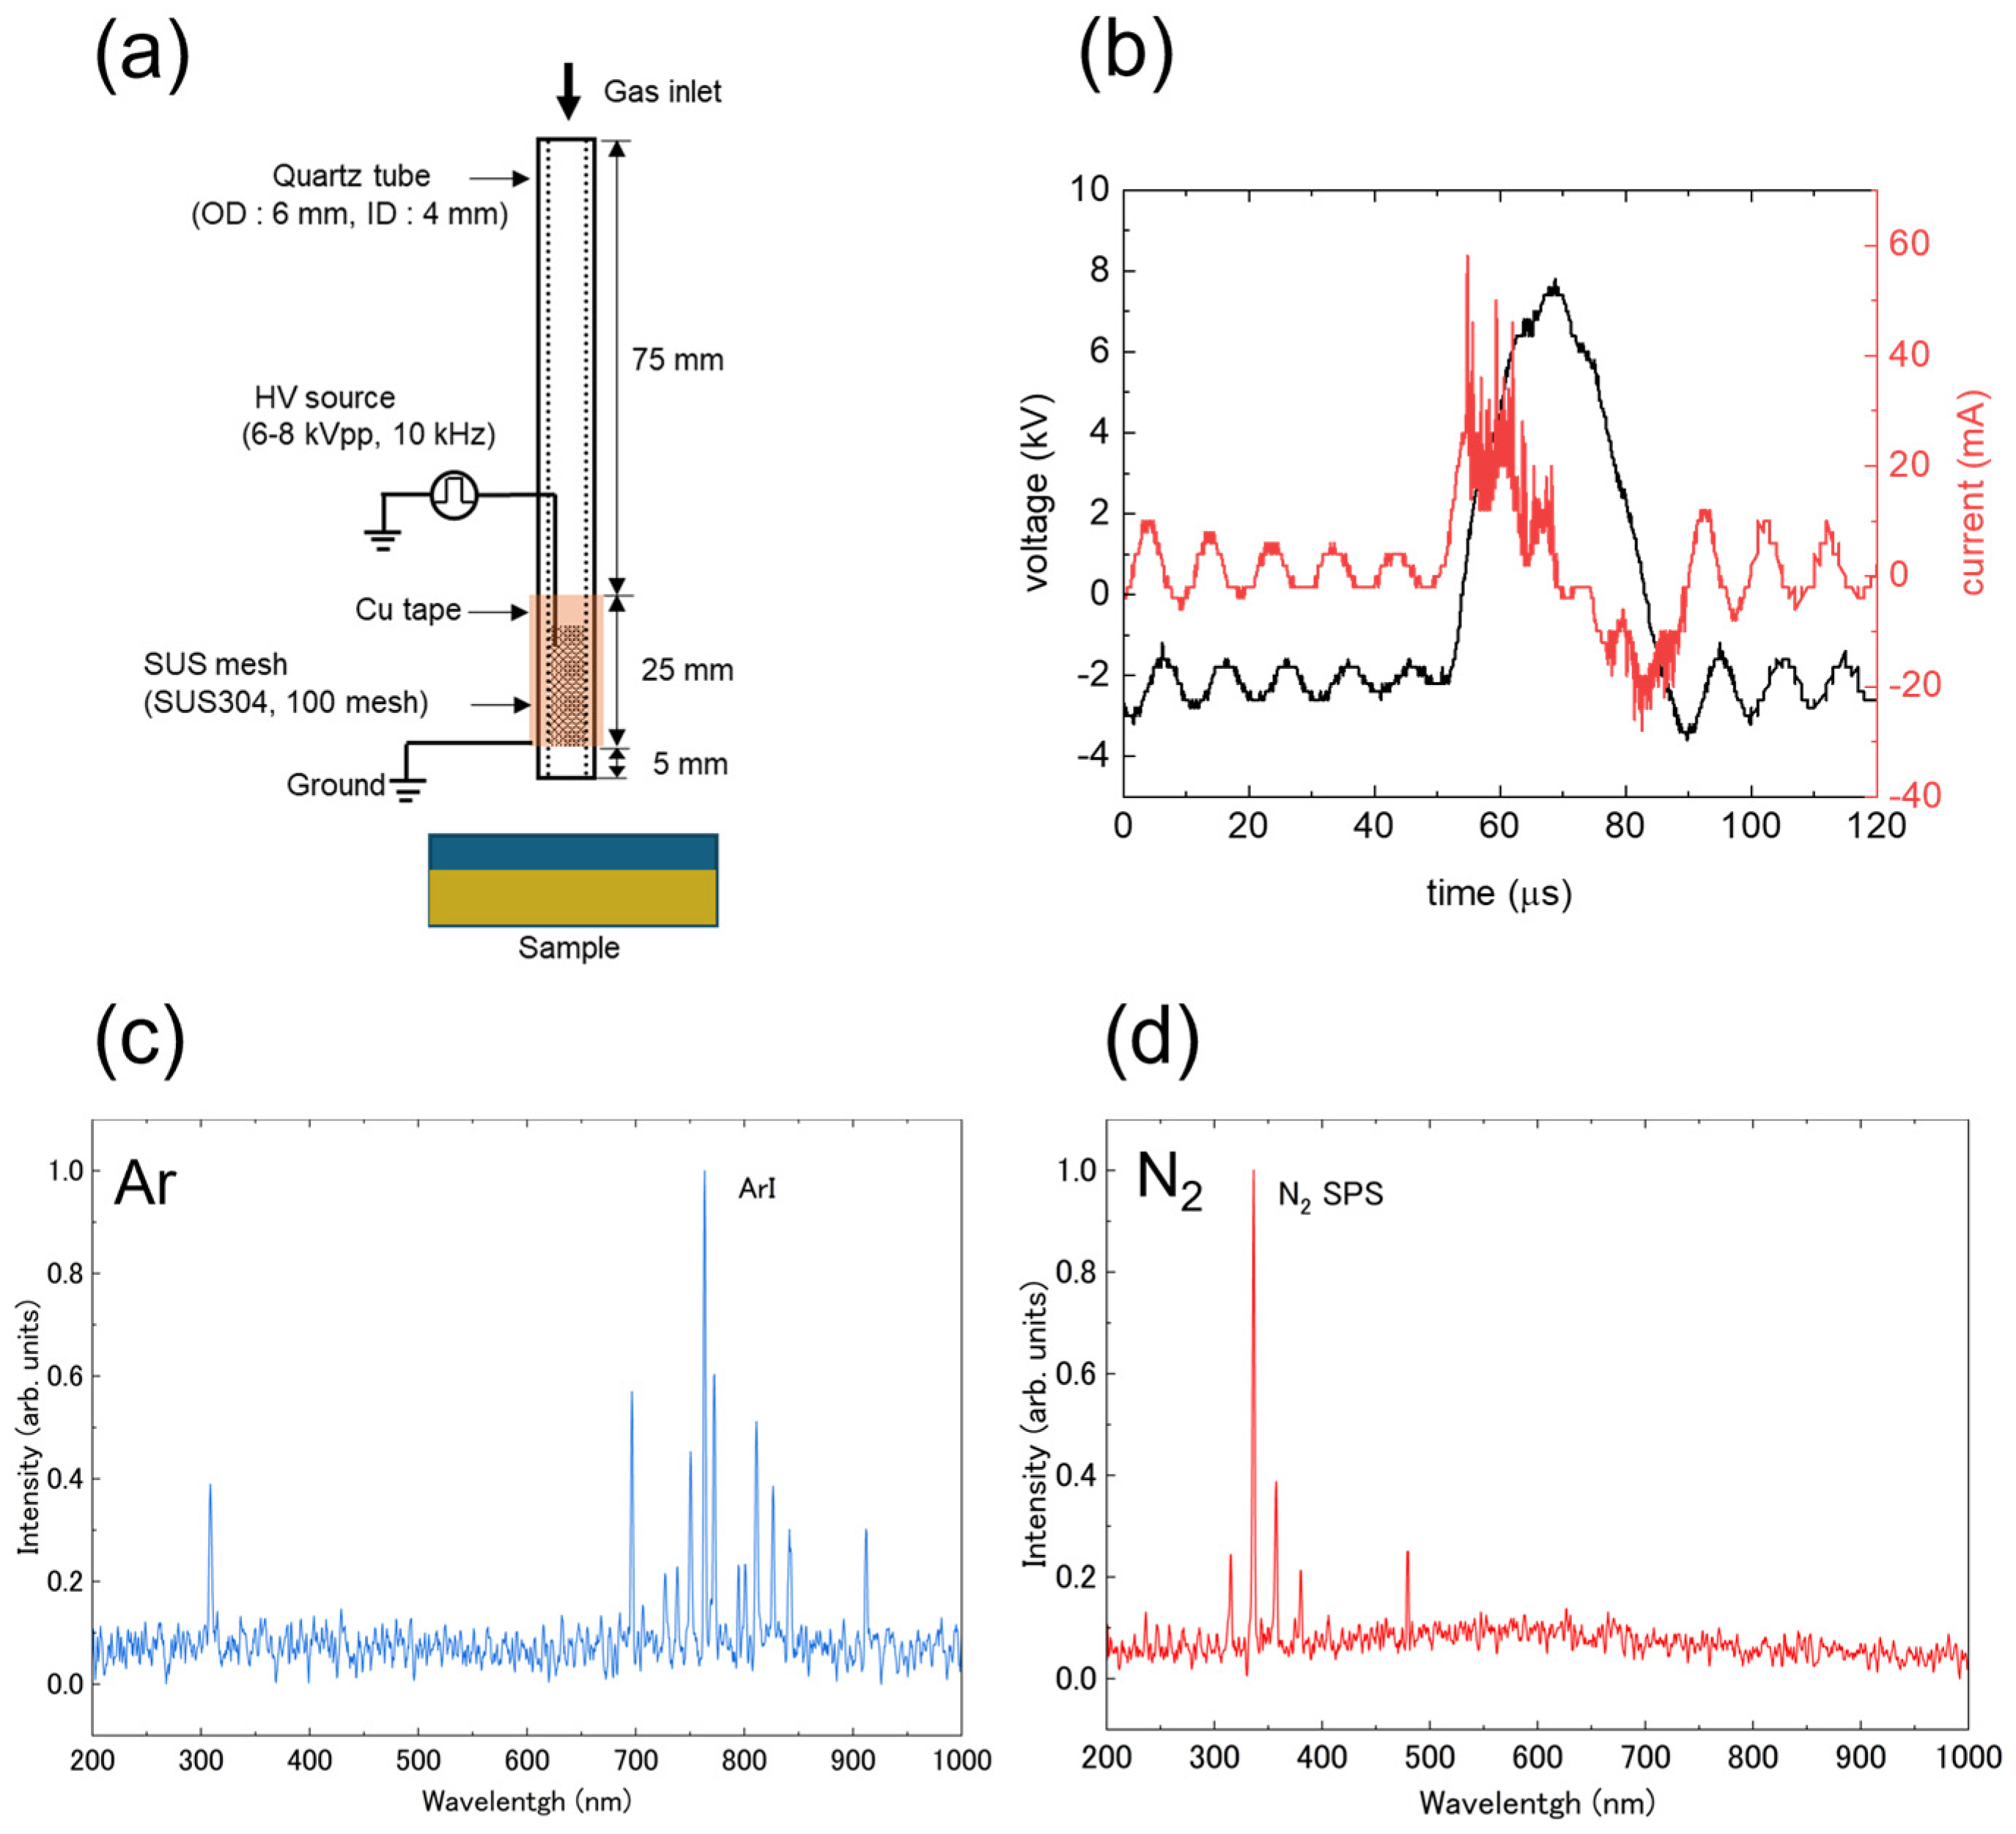
The applied voltage was controlled using a variac, with voltage settings (VSs) of 60 and 80. These settings corresponded to measured peak-to-peak discharge voltages of approximately 6 kVpp (VS = 60) and 8 kVpp (VS = 80) under the present operating conditions. vs. = 60 represents the minimum voltage required to sustain stable discharge for both Ar and N2, whereas vs. = 80 corresponds to the upper limit of stable glow-like operation before arc-like discharge occurred between the electrode and the liquid surface. The gas flow rate was adjusted between 1 and 3 L min−1. The distance between the jet nozzle and the liquid surface was fixed at 10 mm to ensure stable plasma–liquid interaction while preventing surface disturbance and splashing caused by the gas flow. Plasma irradiation time was set to 10 min for all experiments. Representative discharge characteristics of the atmospheric-pressure plasma jet (APPJ), including a schematic diagram of the plasma source, voltage–current waveforms, and optical emission spectra, are shown in Figure 1.
Figure 1.
Atmospheric-pressure plasma jet (APPJ) system and representative discharge characteristics. (a) Schematic diagram of the APPJ used in this study, consisting of a quartz tube with a dielectric barrier configuration. (b) Representative voltage–current waveforms recorded during plasma operation. (c) Optical emission spectrum of the plasma jet operated with argon (Ar). (d) Optical emission spectrum of the plasma jet operated with nitrogen (N2). All measurements were performed under identical discharge conditions.
2.3. Direct Plasma Exposure
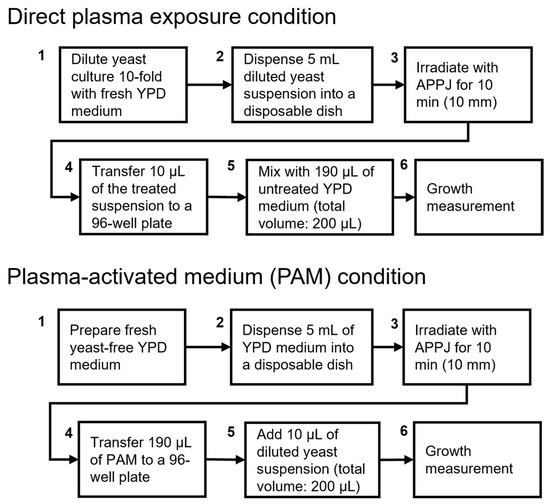
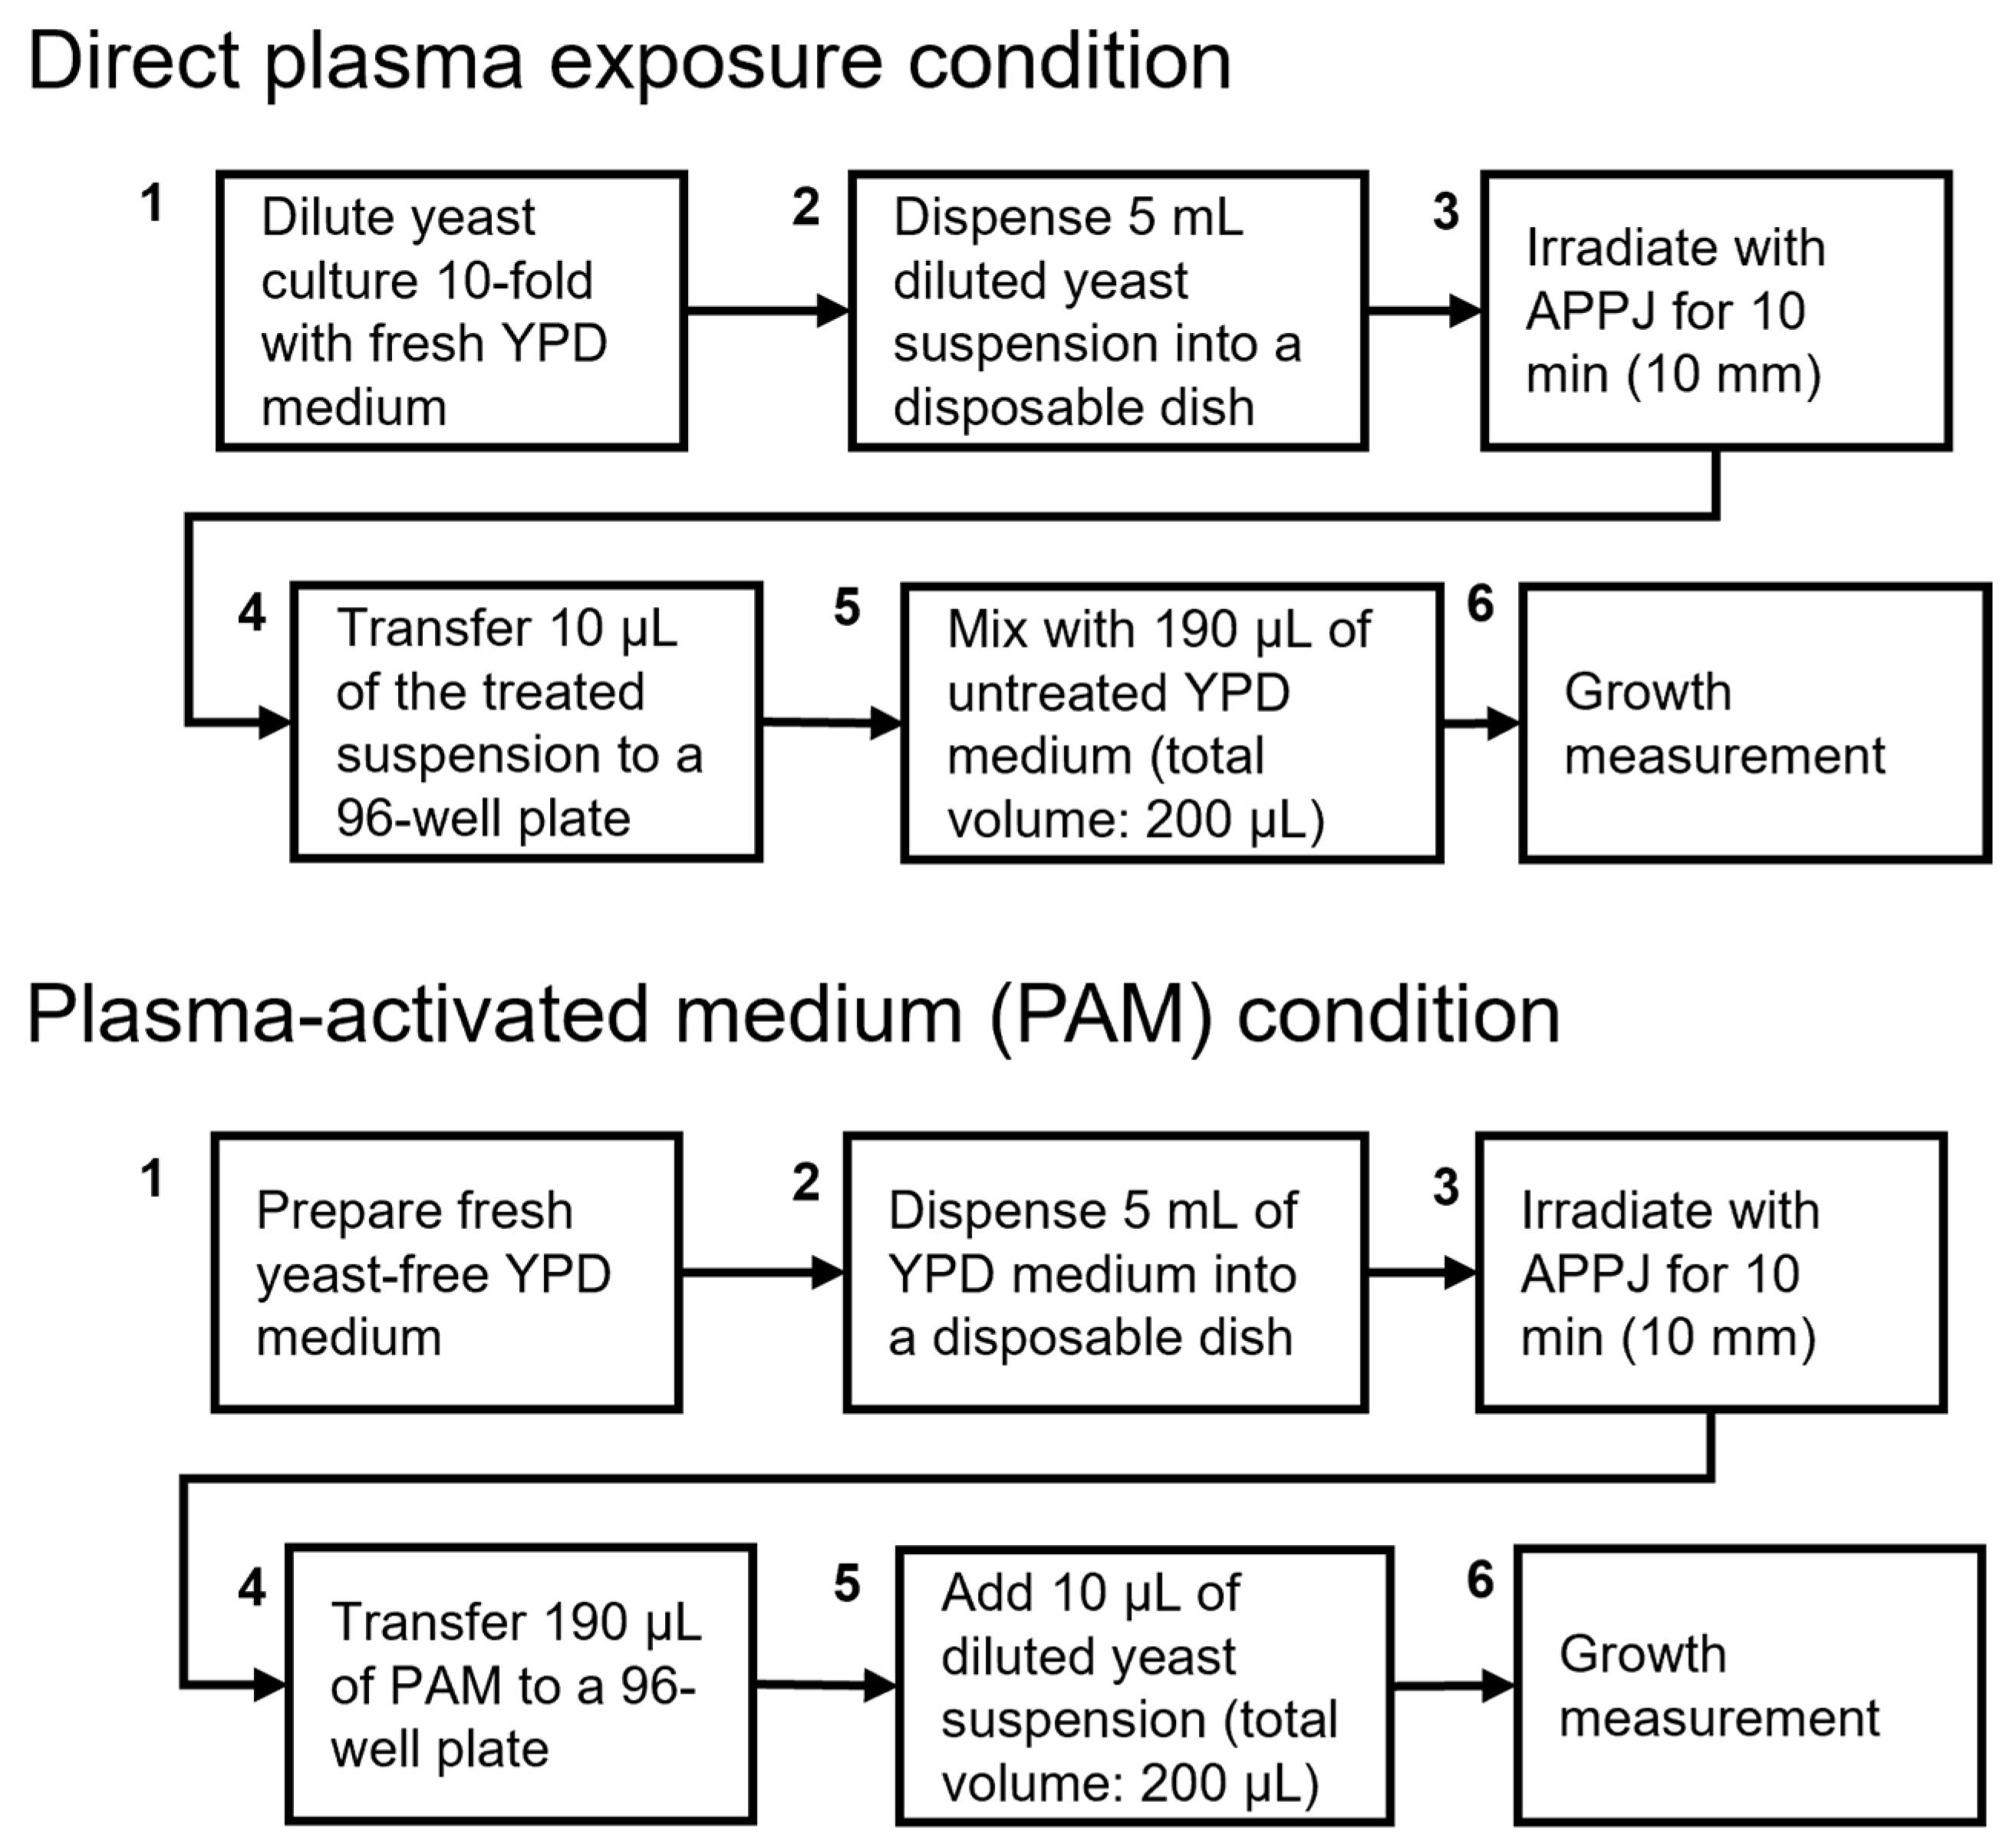
For direct plasma exposure, 5 mL of yeast-containing YPD medium was dispensed into a disposable dish and irradiated with the APPJ for 10 min. The plasma jet was positioned 10 mm above the liquid surface during irradiation. Immediately after irradiation, 10 μL of the treated yeast suspension was collected and mixed with 190 μL of untreated YPD medium in a 96-well microplate to prepare a 200 μL sample for growth measurements. This procedure ensured that yeast cells were present during plasma irradiation and were directly exposed to the plasma phase.
2.4. Plasma-Activated Medium Treatment
Plasma-activated medium (PAM) was prepared by irradiating 5 mL of yeast-free YPD medium with the APPJ under the same discharge conditions used for direct plasma exposure. After plasma irradiation, 190 μL of PAM was dispensed into a 96-well microplate, and 10 μL of untreated yeast suspension was added to prepare a 200 μL sample. This protocol ensured that the only difference between direct exposure and PAM treatment was the timing of plasma–cell interaction. A schematic comparison of the two treatment procedures is shown in Figure 2.
Figure 2.
Schematic illustration of plasma treatment protocols. Comparison of direct plasma exposure and plasma-activated medium (PAM) treatment. In the direct exposure condition, yeast cells were present during plasma irradiation. In the PAM condition, yeast-free medium was plasma-treated first, followed by the addition of untreated yeast cells. The two protocols differ only in the timing and location of plasma–cell interaction.
2.5. Growth Measurements
Yeast growth was monitored using a 96-well microplate reader (Multiskan FC, Thermo Fisher Scientific, Waltham, MA, USA) by measuring OD620 at 30-min intervals for up to 20 h at 30 °C. The microplate was shaken briefly before each measurement. Same-day untreated controls were included in all experiments. Each experimental condition was replicated on two or three independent experimental days.
For the main kinetic analysis, growth curves up to 12 h were used to focus on early growth behavior and the exponential growth phase. Complete growth curves up to 20 h are provided in the Supplementary Materials.
2.6. Growth Kinetic Analysis
Growth kinetics were analyzed by separating early growth behavior and exponential growth capacity. The exponential growth phase was defined as the time interval between 3 and 10 h after inoculation. This interval was initially selected based on visual inspection of representative growth curves across all experimental conditions and was subsequently evaluated by linear regression analysis of ln(OD620) versus time, performed using OriginPro 2026 (OriginLab Corporation, Northampton, MA, USA). The specific growth rate (μ) was calculated from the slope obtained by linear regression of the natural logarithm of OD620 within this interval. The robustness of the selected regression window was assessed by evaluating the coefficient of determination (R2) for all Ar and N2 experimental replicates. The mean R2 across all regression fits was 0.93 ± 0.04, and more than 99% of replicates showed R2 > 0.80, indicating that the 3–10 h interval adequately captured the exponential growth phase across conditions.
To minimize day-to-day variability, all kinetic parameters were normalized to same-day untreated controls. The relative specific growth rate (μrel) was defined as the ratio of μ for the treated sample to that of the corresponding control. Early growth behavior was evaluated using the time required for OD620 to reach 0.3. OD620 measurements were recorded at 30-min intervals; therefore, the threshold time was defined as the first recorded time point at which OD620 reached or exceeded 0.3. The relative threshold time (trel) was calculated as the ratio of the threshold time for the treated sample to that of the control.
Heatmap values represent the mean of day-normalized μrel (or trel) values obtained from independent experimental days. Detailed calculation procedures and definitions are provided in Supplementary Methods S1.
2.7. Reactive Species Measurements
Reactive oxygen and nitrogen species were evaluated semi-quantitatively using colorimetric test strips (MQuant, Merck, Darmstadt, Germany). Hydrogen peroxide (H2O2), nitrite (NO2−), and nitrate (NO3−) were measured immediately after plasma treatment. Both deionized water and YPD medium were treated under identical plasma conditions to evaluate medium-dependent differences in reactive species accumulation. Because colorimetric and UV–vis-based assays of aqueous reactive species are known to be influenced by pH, matrix composition, and analytical interferences [14,15,16,17], the present measurements were used to compare gas-dependent trends rather than to obtain quantitative concentrations.
In addition, pH was measured immediately after plasma treatment using a calibrated pH meter (HORIBA LAQUA F-72, Kyoto, Japan) equipped with a glass electrode (9615S-10D).
3. Results
3.1. Growth Response Under Different Plasma Treatment Modes
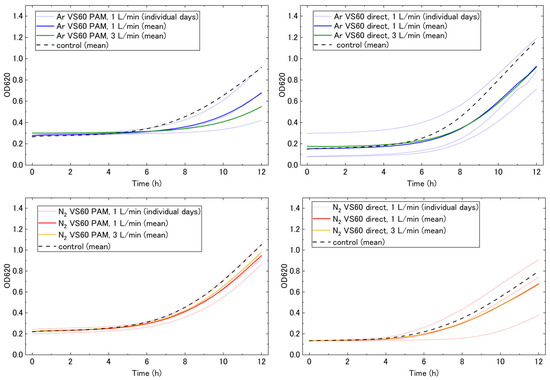
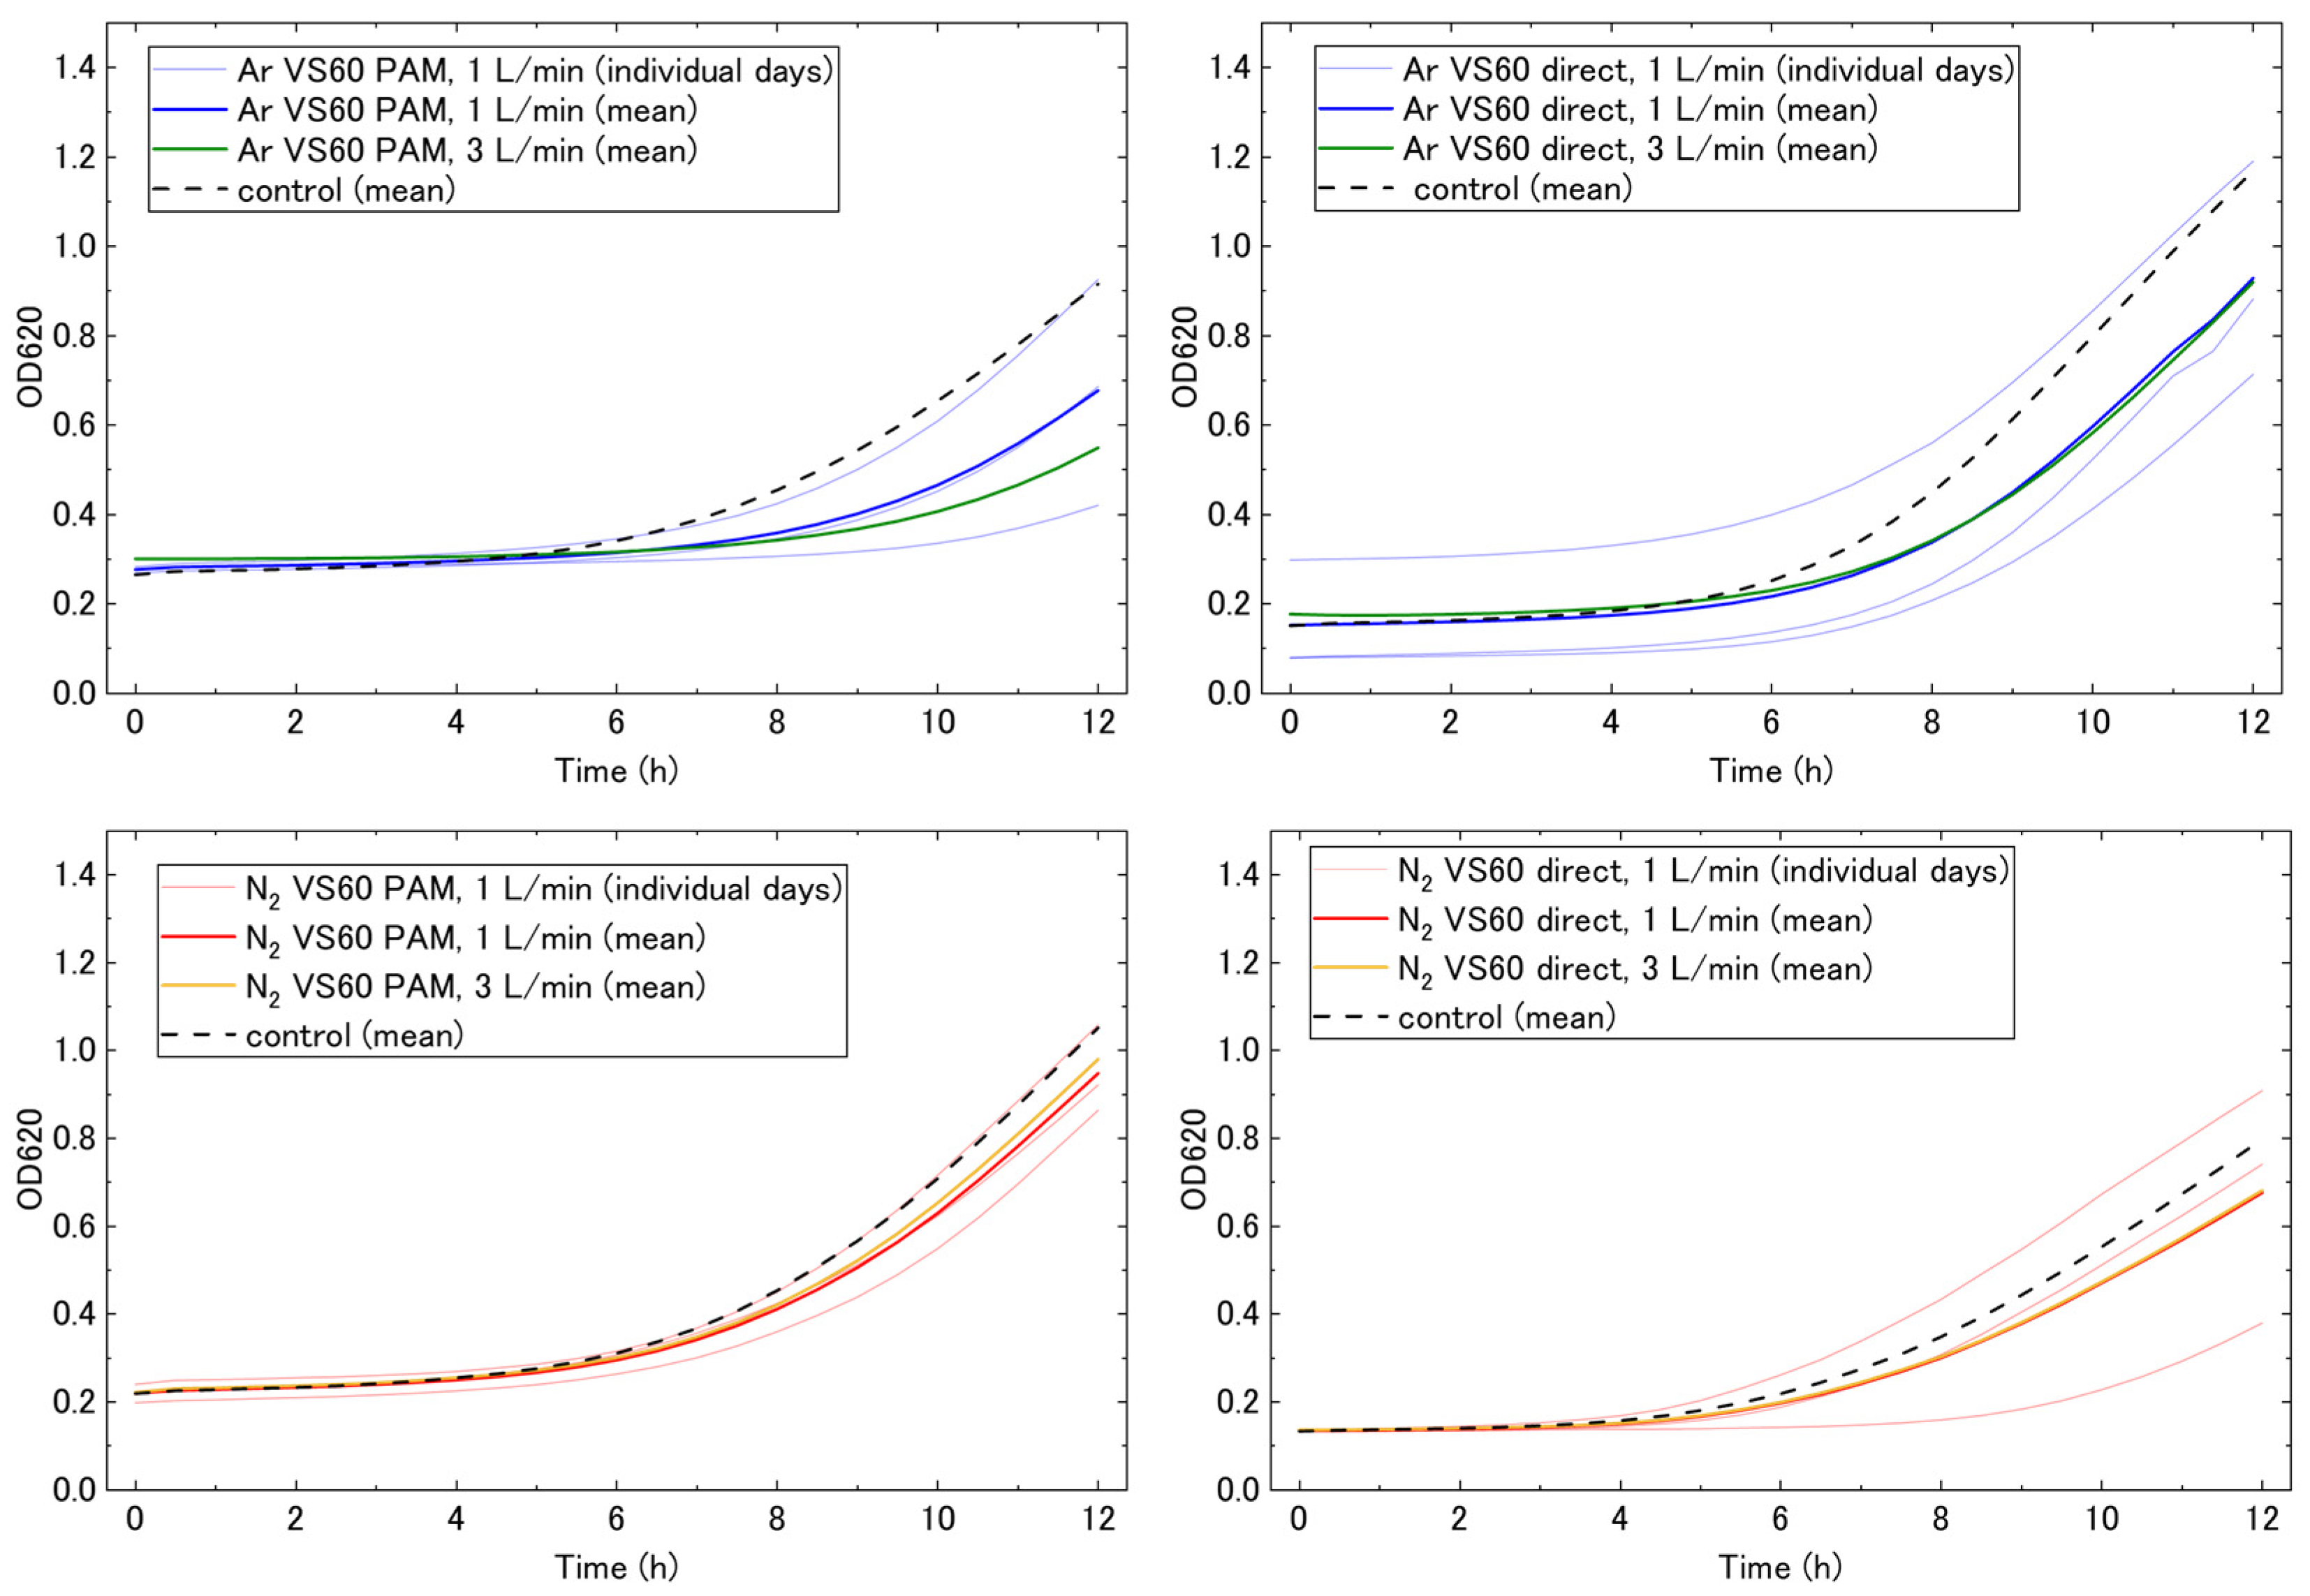
Representative growth curves obtained under direct plasma exposure and plasma-activated medium (PAM) treatment are shown in Figure 3. Growth curves were obtained at gas flow rates of 1, 2, and 3 L min−1 and at voltage settings of vs. = 60 and 80. Similar trends were observed at all tested gas flow rates and voltage settings (see Supplementary Figure S1).
Figure 3.
Representative growth curves of Saccharomyces cerevisiae under direct plasma exposure and plasma-activated medium (PAM) treatment. Growth curves measured up to 12 h under argon (Ar, upper panels) and nitrogen (N2, lower panels) plasma at voltage setting vs. = 60. Representative gas flow rates of 1 and 3 L min−1 are shown. Thin lines represent individual biological replicates obtained on different experimental days, bold lines indicate mean growth curves, and dashed lines denote same-day untreated controls.
Under N2 plasma conditions, growth curves for both direct exposure and PAM treatment showed only modest deviations from same-day untreated controls. These results indicate that N2 plasma treatment resulted in limited changes in yeast growth dynamics under the present experimental conditions. This trend was observed consistently across all tested gas flow rates.
In contrast, Ar plasma treatment caused mode-dependent changes in growth behavior. Direct Ar plasma exposure delayed growth initiation compared with untreated controls. The lag phase was extended, and the increase in OD620 started later than in the control. However, once exponential growth began, the growth rate was only moderately reduced relative to untreated cells.
PAM treatment using Ar plasma showed a different growth pattern. In many cases, OD620 began to increase earlier than in the direct exposure condition. However, the growth rate during the exponential phase was markedly reduced, resulting in lower OD620 values at 12 h. These results indicate that direct plasma exposure primarily affected early growth behavior, whereas PAM treatment predominantly affected exponential growth capacity.
3.2. Phase-Resolved Growth Kinetics
To quantitatively compare growth responses, phase-resolved growth kinetic parameters were evaluated. The relative specific growth rate (μrel) and relative threshold time (trel) were calculated for all experimental conditions and normalized to same-day untreated controls. The mean and standard deviation of μrel and trel across independent experimental days for all experimental conditions are summarized in Supplementary Table S2. The threshold time represents the time required for OD620 to reach 0.3 and was used as a measure of early growth behavior.
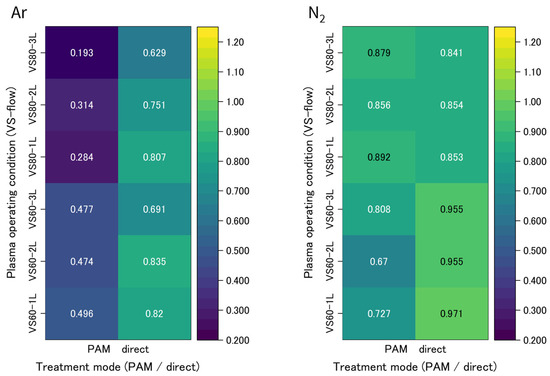
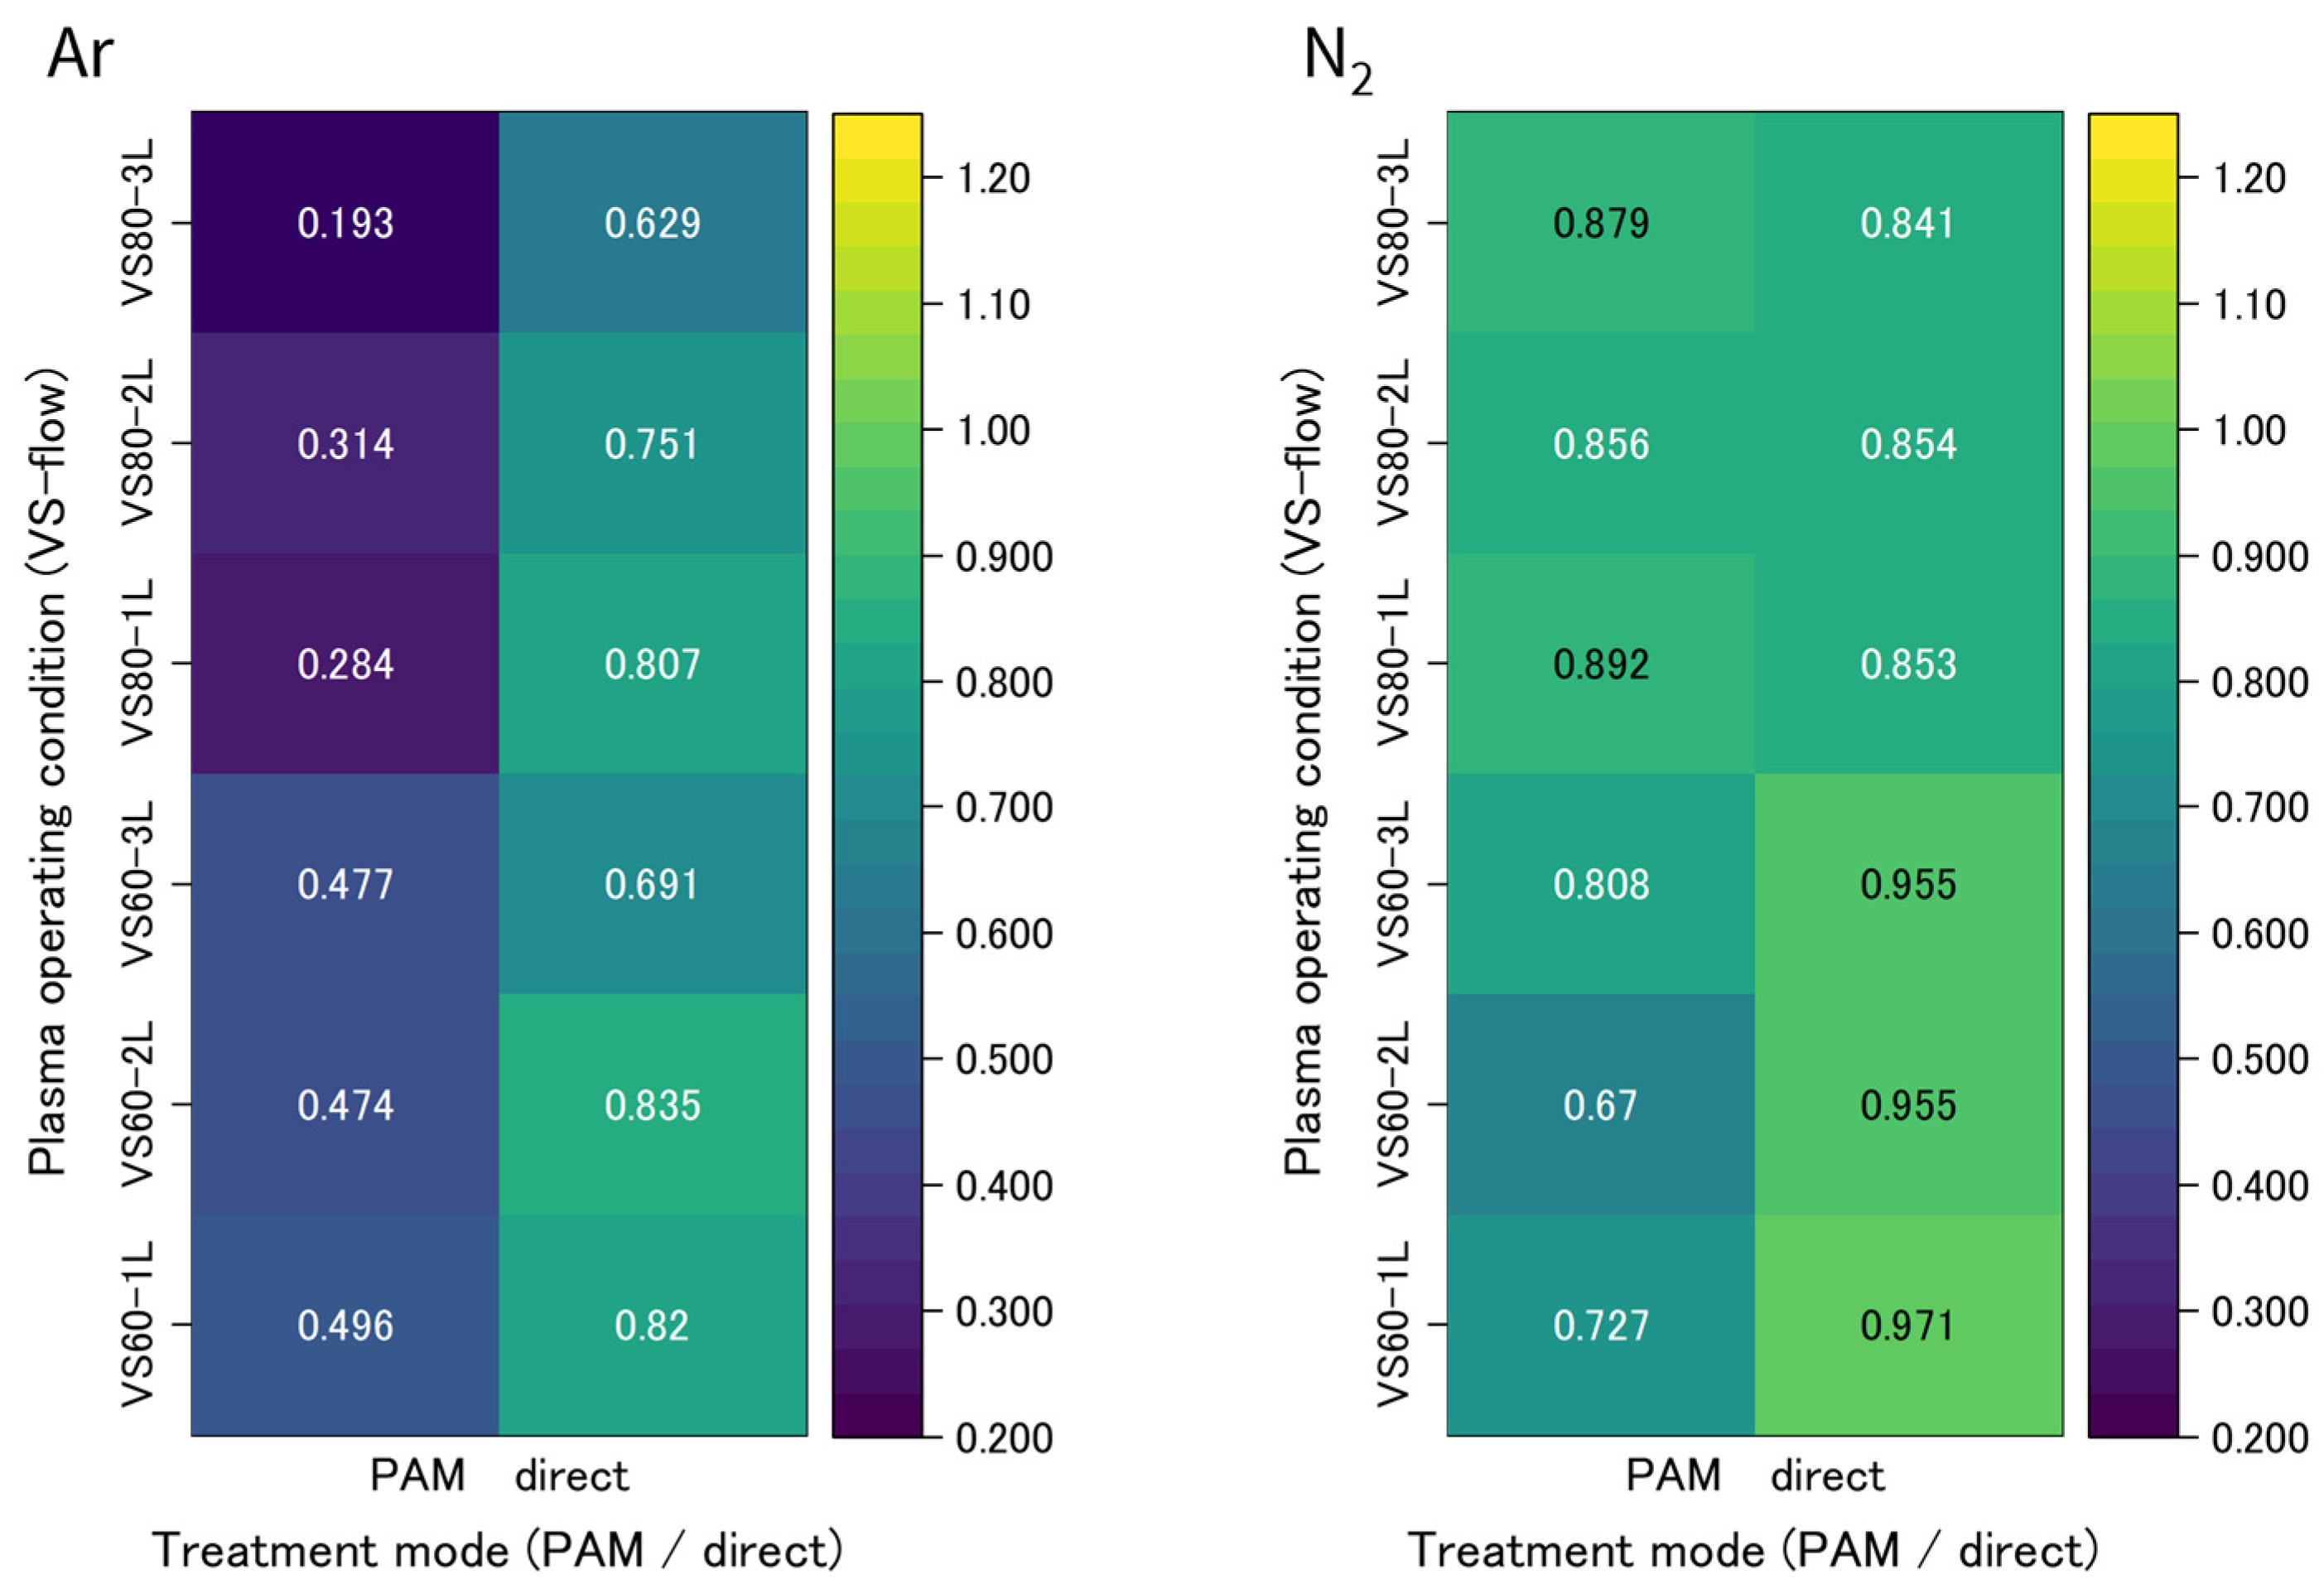
Figure 4 summarizes μrel values obtained under different plasma treatment conditions. Under Ar plasma conditions, PAM treatment resulted in low μrel values ranging from 0.19 to 0.50, consistent with strong suppression of exponential growth. In contrast, direct Ar plasma exposure resulted in moderately reduced μrel values between 0.63 and 0.84. These trends were observed consistently at all tested voltage settings and gas flow rates.
Figure 4.
Heatmaps of relative specific growth rate (μrel) under direct plasma exposure and plasma-activated medium (PAM) treatment.
Early growth behavior showed an opposite trend. Direct plasma exposure resulted in trel values greater than 1, indicating delayed growth initiation relative to controls. PAM treatment generally produced trel values around or below unity, suggesting no consistent prolongation of early growth.
Under N2 plasma conditions, μrel and trel values showed only limited deviations from unity for both treatment modes across operating conditions. These results indicate that N2 plasma treatment produced modest changes in both early and exponential growth phases.
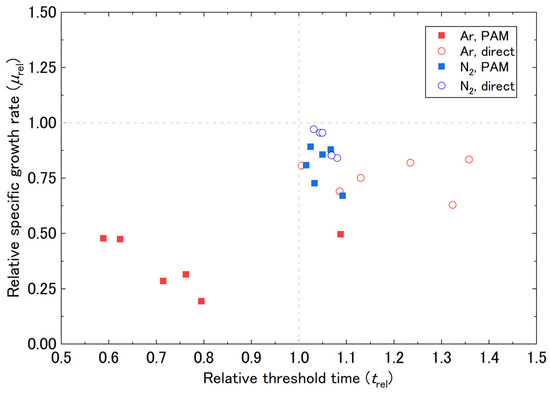
The relationship between trel and μrel is summarized in the kinetic phase space plot shown in Figure 5. Under Ar plasma conditions, data points corresponding to direct exposure and PAM treatment formed two distinct groups. Direct exposure conditions were characterized by increased trel and moderately reduced μrel, whereas PAM treatment conditions were characterized by reduced or unchanged trel and strongly reduced μrel. Under N2 plasma conditions, data points for both treatment modes clustered near the control point (trel ≈ 1, μrel ≈ 1). These results indicate that the combination of working gas and treatment mode is associated with distinct growth response patterns.
Figure 5.
Kinetic phase space representation of plasma-induced growth responses.
3.3. Reactive Species Analysis
Semi-quantitative analysis of reactive oxygen and nitrogen species was performed using colorimetric test strips. The results for hydrogen peroxide (H2O2), nitrite (NO2−), and nitrate (NO3−) are summarized in Table 1.
Table 1.
Semi-quantitative ranges of long-lived reactive oxygen and nitrogen species generated by plasma treatment.
Plasma treatment of deionized water showed clear gas-dependent differences in reactive species generation. Ar plasma produced higher levels of H2O2, NO2−, and NO3− than N2 plasma under comparable discharge conditions.
When YPD medium was treated under identical plasma conditions, detected reactive species levels were lower than those observed in deionized water. This result indicates that components in the medium reduce detectable reactive species signals. However, the gas-dependent trend was preserved, with Ar plasma producing higher overall reactive species signals than N2 plasma. Because the measurements were semi-quantitative, the results are used to compare trends rather than to establish quantitative relationships between reactive species levels and growth kinetics.
To provide physicochemical context for the semi-quantitative reactive species analysis, pH was measured for both deionized water and the YPD medium after plasma exposure at vs. = 80 (single measurement per condition). In water, pH decreased from 5.99 (untreated) to 5.34–5.66, whereas in YPD medium, the decrease was smaller, from 6.01 to 5.54–5.78. The attenuated pH shift observed in the YPD medium is consistent with its buffering capacity and suggests that matrix effects may influence the effective concentrations and persistence of plasma-generated reactive species in the growth medium.
4. Discussion
This study compared the growth responses of Saccharomyces cerevisiae to atmospheric-pressure plasma treatment under two distinct treatment modes: direct plasma exposure and plasma-activated medium (PAM) treatment. Argon (Ar) and nitrogen (N2) were used as working gases, and all discharge parameters were kept identical between the two treatment modes. Under these strictly controlled conditions, mode-dependent differences in growth dynamics were observed for Ar plasma, whereas N2 plasma produced only limited changes.
Under Ar plasma conditions, direct plasma exposure mainly delayed growth initiation, as indicated by increased relative threshold times (trel > 1), while the exponential growth rate was moderately reduced (μrel = 0.63–0.84). In contrast, PAM treatment using Ar plasma did not markedly delay early growth but strongly suppressed exponential growth rate (μrel = 0.19–0.50). These differences were observed consistently across tested gas flow rates and voltage settings, indicating that treatment mode strongly influences which growth phase is predominantly affected.
The delayed growth initiation observed after direct Ar plasma exposure suggests that yeast cells experience transient stress during irradiation. During direct exposure, cells are present in the liquid while plasma is active and are therefore subjected to short-lived reactive species and other plasma-phase effects. Such transient exposure may temporarily perturb cell division processes and delay entry into exponential growth. Once irradiation ceases and cells are transferred to a fresh medium, the influence of these short-lived species diminishes, allowing recovery of exponential growth capacity. This interpretation is consistent with the notion that lag phase duration and exponential growth rate can respond independently to stress conditions, highlighting the importance of separating these phases in growth analysis [9].
In contrast, PAM treatment exposes cells to plasma-treated medium after the discharge has ended. In this case, cells are likely influenced by long-lived reactive oxygen and nitrogen species and stable reaction products remaining in the liquid phase [17,18,19,20]. As these species persist beyond the irradiation period, cells are subjected to sustained chemical exposure throughout cultivation. Such prolonged exposure is consistent with strong suppression of exponential growth (μrel), while early growth initiation showed no consistent prolongation (trel = 0.59–1.09). The patterns observed in the kinetic phase space (Figure 5) separate these two modes: direct exposure is characterized by increased trel with moderately reduced μrel, whereas PAM treatment is characterized by strongly reduced μrel with unchanged or decreased trel.
Under N2 plasma conditions, both direct exposure and PAM treatment produced only limited changes in yeast growth. This modest biological response is consistent with the semi-quantitative reactive species analysis, which showed comparatively lower levels of hydrogen peroxide and nitrogen oxides than those generated by Ar plasma (Table 1). These findings suggest that not only the presence but also the magnitude and composition of reactive oxygen and nitrogen species may influence growth responses, in line with the broader framework of redox biology and plasma–biological interactions [21,22].
The present results demonstrate that evaluation based only on final biomass or single-time-point measurements is not sufficient to characterize plasma treatment effects. Direct plasma exposure and PAM treatment can produce different growth curves even when final OD values appear similar. Phase-resolved kinetic analysis provides a useful framework for comparing plasma treatment modes by identifying which growth phases are affected.
In this study, a single microorganism and a limited set of plasma discharge conditions were investigated. Further studies are required to clarify the mechanisms responsible for the observed mode-dependent effects. Additional experiments focusing on cellular responses, such as viability assays and molecular analyses, will be valuable. It will also be important to examine whether similar mode-dependent growth responses occur in other microorganisms. It should be emphasized that the present findings demonstrate consistent correlations between treatment mode, reactive species trends, and growth kinetics but do not establish direct causal mechanisms.
5. Conclusions
We investigated the effects of atmospheric-pressure plasma treatment on the growth of Saccharomyces cerevisiae by comparing direct plasma exposure and plasma-activated medium (PAM) under identical discharge conditions. Growth behavior was analyzed using phase-resolved kinetic parameters that separately evaluate early growth and exponential growth capacity.
The main conclusions of this study are summarized as follows:
- The effects of atmospheric-pressure plasma treatment on yeast growth are strongly influenced by the treatment mode, even when plasma discharge conditions are identical.
- Under Ar plasma conditions, direct plasma exposure delays growth initiation but results in only a moderate reduction in exponential growth rate.
- Under Ar plasma conditions, PAM treatment suppresses exponential growth rate without consistent prolongation of early growth.
- Under N2 plasma conditions, both direct plasma exposure and PAM treatment produce only limited changes in yeast growth under the present experimental conditions.
- Phase-resolved kinetic analysis is useful for evaluating plasma treatment effects and for comparing different treatment modes based on which growth phase is predominantly affected.
These results demonstrate that evaluation based solely on endpoint measurements is not sufficient to characterize plasma treatment effects. Phase-resolved analysis provides additional information that is important for systematic comparison of plasma treatment modes. The approach used in this study can be applied to other microorganisms and plasma treatment conditions to further clarify mode-dependent plasma–biological interactions.
Supplementary Materials
The following supporting information can be downloaded at: https://www.mdpi.com/article/10.3390/pr14050832/s1. Methods S1: Detailed calculation procedures for growth kinetic parameters; Table S1: Experimental dates and number of biological replicates for each plasma treatment condition; Table S2: Mean ± SD of μrel and trel for all 24 plasma treatment conditions; Figure S1: Complete growth curves of Saccharomyces cerevisiae up to 20 h under all plasma treatment conditions; Figure S2: Heatmaps of relative threshold time (trel) under direct plasma exposure and PAM treatment; Figure S3: Representative optical microscopy image of Saccharomyces cerevisiae (NBRC 1136).
Author Contributions
Conceptualization, S.K.; methodology, S.B. and S.K.; software, S.B.; validation, S.B. and S.K.; formal analysis, S.B.; investigation, S.B.; resources, S.K.; data curation, S.B.; writing—original draft preparation, S.B.; writing—review and editing, S.K.; visualization, S.B.; supervision, S.K.; project administration, S.K. All authors have read and agreed to the published version of the manuscript.
Funding
This research received no external funding.
Data Availability Statement
The original contributions presented in this study are included in the article and Supplementary Materials. Further inquiries can be directed to the corresponding author.
Acknowledgments
During the preparation of this manuscript, the authors used ChatGPT (OpenAI, version 5.2, accessed February 2026) for language polishing and clarification of scientific expressions. The authors reviewed and edited the output and take full responsibility for the content of this manuscript.
Conflicts of Interest
The authors declare no conflicts of interest.
References
- Surowsky, B.; Schlüter, O.; Knorr, D. Interactions of Non-Thermal Atmospheric Pressure Plasma with Solid and Liquid Food Systems: A Review. Food Eng. Rev. 2015, 7, 82–108. [Google Scholar] [CrossRef] [Scilit]
- Bruggeman, P.J.; Kushner, M.J.; Locke, B.R.; Gardeniers, J.G.E.; Graham, W.G.; Graves, D.B.; Hofman-Caris, R.C.H.M.; Maric, D.; Reid, J.P.; Ceriani, E.; et al. Plasma–liquid interactions: A review and roadmap. Plasma Sources Sci. Technol. 2016, 25, 053002. [Google Scholar] [CrossRef] [Scilit]
- Chen, Y.Q.; Cheng, J.H.; Sun, D.W. Chemical, physical and physiological quality attributes of fruit and vegetables induced by cold plasma treatment: Mechanisms and application advances. Crit. Rev. Food Sci. Nutr. 2020, 60, 2676–2690. [Google Scholar] [CrossRef] [Scilit]
- Traylor, M.J.; Pavlovich, M.J.; Karim, S.; Hait, P.; Sakiyama, Y.; Clark, D.S.; Graves, D.B. Long-term antibacterial efficacy of air plasma-activated water. J. Phys. D Appl. Phys. 2011, 44, 472001. [Google Scholar] [CrossRef] [Scilit]
- Ma, R.; Wang, G.; Tian, Y.; Wang, K.; Zhang, J.; Fang, J. Non-thermal plasma-activated water inactivation of food-borne pathogen on fresh produce. J. Hazard. Mater. 2015, 300, 643–651. [Google Scholar] [CrossRef] [Scilit] [PubMed]
- Inguglia, E.S.; Oliveira, M.; Burgess, C.M.; Kerry, J.P.; Tiwari, B.K. Plasma-activated water as an alternative nitrite source for the curing of beef jerky: Influence on quality and inactivation of Listeria innocua. Innov. Food Sci. Emerg. Technol. 2020, 59, 102276. [Google Scholar] [CrossRef] [Scilit]
- Georgescu, N.; Apostol, L.; Gherendi, F. Inactivation of Salmonella enterica serovar Typhimurium on egg surface, by direct and indirect treatments with cold atmospheric plasma. Food Control 2017, 76, 52–61. [Google Scholar] [CrossRef] [Scilit]
- Dharini, M.; Jaspin, S.; Mahendran, R. Cold plasma reactive species: Generation, properties, and interaction with food biomolecules. Food Chem. 2023, 405, 134746. [Google Scholar] [CrossRef] [Scilit] [PubMed]
- Hamill, P.G.; Stevenson, A.; McMullan, P.E.; Williams, J.P.; Lewis, A.D.R.; Sudharsan, S.; Stevenson, K.E.; Farnsworth, K.D.; Khroustalyova, G.; Takemoto, J.Y.; et al. Microbial lag phase can be indicative of, or independent from, cellular stress. Sci. Rep. 2020, 10, 5948. [Google Scholar] [CrossRef] [Scilit] [PubMed]
- Pan, Y.; Cheng, J.H.; Sun, D.W. Oxidative lesions and post-treatment viability attenuation of listeria monocytogenes triggered by atmospheric non-thermal plasma. J. Appl. Microbiol. 2022, 133, 2348–2360. [Google Scholar] [CrossRef] [Scilit]
- Stulic, V.; Vukusic, T.; Butorac, A.; Popovic, D.; Herceg, Z. Proteomic analysis of Saccharomyces cerevisiae response to plasma treatment. Int. J. Food Microbiol. 2019, 292, 171–183. [Google Scholar] [CrossRef] [Scilit]
- Recek, N.; Zhou, R.; Zhou, R.; Te’o, V.S.J.; Speight, R.E.; Mozetic, M.; Vesel, A.; Cvelbar, U.; Bazaka, K.; Ostrikov, K.K. Improved fermentation efficiency of S. cerevisiae by changing glycolytic metabolic pathways with plasma agitation. Sci. Rep. 2018, 8, 8252. [Google Scholar] [CrossRef] [Scilit]
- Kitazaki, S.; Koga, K.; Shiratani, M.; Hayashi, N. Growth Control of Dry Yeast Using Scalable Atmospheric-Pressure Dielectric Barrier Discharge Plasma Irradiation. Jpn. J. Appl. Phys. 2012, 51, 11PJ02. [Google Scholar] [CrossRef] [Scilit]
- Tsikas, D. Analysis of nitrite and nitrate in biological fluids by assays based on the Griess reaction: Appraisal of the Griess reaction in the L-arginine/nitric oxide area of research. J. Chromatogr. B Anal. Technol. Biomed. Life Sci. 2007, 851, 51–70. [Google Scholar] [CrossRef] [Scilit] [PubMed]
- Giustarini, D.; Rossi, R.; Milzani, A.; Dalle-Donne, I. Nitrite and nitrate measurement by Griess reagent in human plasma: Evaluation of interferences and standardization. Methods Enzym. 2008, 440, 361–380. [Google Scholar] [CrossRef] [Scilit]
- He, B.; Ma, Y.; Gong, X.; Long, Z.; Li, J.; Xiong, Q.; Liu, H.; Chen, Q.; Zhang, X.; Yang, S.; et al. Simultaneous quantification of aqueous peroxide, nitrate, and nitrite during the plasma–liquid interactions by derivative absorption spectrophotometry. J. Phys. D Appl. Phys. 2017, 50, 445207. [Google Scholar] [CrossRef] [Scilit]
- Oh, J.-S.; Szili, E.J.; Ogawa, K.; Short, R.D.; Ito, M.; Furuta, H.; Hatta, A. UV–vis spectroscopy study of plasma-activated water: Dependence of the chemical composition on plasma exposure time and treatment distance. Jpn. J. Appl. Phys. 2018, 57, 0102B9. [Google Scholar] [CrossRef] [Scilit]
- Brubaker, T.R.; Ishikawa, K.; Takeda, K.; Oh, J.-S.; Kondo, H.; Hashizume, H.; Tanaka, H.; Knecht, S.D.; Bilén, S.G.; Hori, M. Dynamic analysis of reactive oxygen nitrogen species in plasma-activated culture medium by UV absorption spectroscopy. J. Appl. Phys. 2017, 122, 213301. [Google Scholar] [CrossRef] [Scilit]
- Lukes, P.; Dolezalova, E.; Sisrova, I.; Clupek, M. Aqueous-phase chemistry and bactericidal effects from an air discharge plasma in contact with water: Evidence for the formation of peroxynitrite through a pseudo-second-order post-discharge reaction of H2O2and HNO2. Plasma Sources Sci. Technol. 2014, 23, 015019. [Google Scholar] [CrossRef] [Scilit]
- Zhao, Y.M.; Ojha, S.; Burgess, C.M.; Sun, D.W.; Tiwari, B.K. Influence of various fish constituents on inactivation efficacy of plasma-activated water. Int. J. Food Sci. Technol. 2020, 55, 2630–2641. [Google Scholar] [CrossRef] [Scilit]
- Graves, D.B. The emerging role of reactive oxygen and nitrogen species in redox biology and some implications for plasma applications to medicine and biology. J. Phys. D Appl. Phys. 2012, 45, 263001. [Google Scholar] [CrossRef] [Scilit]
- Wu, H.; Sun, P.; Feng, H.; Zhou, H.; Wang, R.; Liang, Y.; Lu, J.; Zhu, W.; Zhang, J.; Fang, J. Reactive Oxygen Species in a Non-thermal Plasma Microjet and Water System: Generation, Conversion, and Contributions to Bacteria Inactivation—An Analysis by Electron Spin Resonance Spectroscopy. Plasma Process. Polym. 2012, 9, 417–424. [Google Scholar] [CrossRef] [Scilit]

Disclaimer/Publisher’s Note: The statements, opinions and data contained in all publications are solely those of the individual author(s) and contributor(s) and not of MDPI and/or the editor(s). MDPI and/or the editor(s) disclaim responsibility for any injury to people or property resulting from any ideas, methods, instructions or products referred to in the content. |
© 2026 by the authors. Licensee MDPI, Basel, Switzerland. This article is an open access article distributed under the terms and conditions of the Creative Commons Attribution (CC BY) license.