


Abstract
The traditional Discrete Element Method (DEM) can track the motion details of individual particles, but its computational cost becomes excessively high when simulating large-scale systems involving millions or even billions of particles. In this study, a coarse-grained DEM approach was employed to analyze the flow behavior of mixed particles in a coal powder silo. This method maintains reasonable simulation accuracy while effectively reducing the total number of computational particles and significantly improving computational efficiency. After conducting investigations on the mesh-to-particle size ratio and model validation, this paper focuses on examining the effects of coal particle size distribution and mixing ratio on the characteristics of particle motion. The results indicate that during the discharge process of mixed particles, the downward velocity of particles in the central axis region near the outlet is significantly higher than that in the wall region, exhibiting typical funnel flow characteristics. The particle size distribution has a notable impact on the particle descent velocity. The uniform distribution case shows the highest descent velocity, the linear distribution case the lowest, while the normal distribution case falls between the two. Notably, in the normal distribution case, the descent velocity in the central axis region is similar to that of the uniform distribution, while the descent velocity in the wall region approaches that of the linear distribution. This presents a combined characteristic of the two extreme distributions rather than a simple transitional state. In contrast, the particle mixing ratio has a relatively minor influence on the overall motion characteristics. The mass flow rate of particles and the cross-sectional velocity distribution remain largely consistent, with only slight differences observed in the velocity within the central axis region.
1. Introduction
Bulk storage silos constitute vital facilities for powder storage. They serve not only to house process powders (raw materials, products, intermediates, etc.) and auxiliary materials (such as catalysts), but also function to homogenize material properties, balance process materials, and provide emergency storage during incidents. Compared to liquid or liquefied gas storage tanks, powder silos are relatively simple equipment. However, unlike liquids, powders within silos do not flow uniformly. Instead, they exhibit complex movement behaviors such as rolling, sliding, and settling under the influence of gravity. To enhance economic efficiency, multi-coal blending technology is widely adopted in thermal power plants. By stratifying coal types with differing characteristics within silos according to predetermined ratios, gravity-driven layered and phased discharge aims to stabilize boiler load operation while further optimizing operational economics and emission characteristics [1,2]. However, variations in particle size and blending ratios frequently cause issues such as excessive discharge, coal blockages, and arching within raw coal bunkers during feeding. Consequently, gaining a thorough understanding of the discharge flow behavior of multi-coal-type mixed pulverized coal within bunkers holds significant engineering importance for ensuring the successful application of blending technology [3,4].
The flow behavior of granular materials within hoppers is complex and may exhibit multiple flow states. Under abnormal conditions, phenomena such as blockages [5], particle size or density segregation [6,7], and avalanches [8] may occur. Under normal operating conditions, pulverized coal flow states can be primarily categorized into three types [9,10,11]: mass flow, funnel flow, and mixed flow. In mass flow, particles descend along the hopper wall and central axis in near-synchrony; Funnel flow exhibits a “first-in, last-out” pattern where central particles discharge preferentially while wall particles lag; mixed flow combines characteristics of both. Accurate prediction and control of flow patterns are crucial for preventing flow failures and optimizing hopper design. Experimental studies have systematically investigated the influence of pulverized coal properties, moisture content, and hopper geometry through discharge tests and high-speed photography. Findings indicate that the particle size of pulverized coal possesses an optimal range conducive to flow. Excessively fine particles (e.g., below 20 μm) readily induce pronounced cohesive effects leading to arching and blockage [12], whilst overly coarse particles may impede flow through mechanical interlocking [13]. Moisture content significantly impacts flowability; increased moisture generally heightens pulverized coal cohesion and increases angle of repose, thereby reducing mass flow rate and enhancing arching tendency [14,15], although specific trends regarding the internal friction angle remain subject to differing findings [16]. Regarding hopper design, increasing the outlet inclination angle typically helps reduce blockage probability [17], though it may exacerbate particle retention on the wall surfaces [18]. Hyperboloid hoppers, owing to their constant contraction ratio, exhibit superior flow properties compared to conventional conical hoppers [19,20]. For multi-component blending systems, research has predominantly focused on mixing particles of varying sizes. Findings indicate that mixing methods (such as layer-by-layer blending versus homogeneous mixing) and component configurations significantly influence discharge rates and segregation behaviour [6,21]. Notably, layer-by-layer blending with finer particles positioned in the upper layer often yields higher mass flow rates [21].
Traditional experimental methods struggle to capture the detailed characteristics of particle discharge processes. Numerical simulation techniques such as the dual Eulerian method and the discrete element method (DEM) have been extensively applied to studying silo discharge phenomena. Among these, the DEM method resolves the motion and collision details of individual particles, establishing itself as a powerful tool for investigating granular flows [22,23,24]. Through simulation approaches, researchers have conducted more in-depth parametric studies on the aforementioned influencing factors. Simulation results confirm that higher particle sphericity generally correlates with improved flowability [25]. When employing particle size distribution (PSD), increased distribution width (σ/μ) reduces mass flow rate and exacerbates segregation [13,26,27]. Regarding structural optimization, simulation studies not only validated the superiority of hyperbolic hoppers [20] but also identified a critical exit angle for conical hoppers, providing insights for designing specialized structures such as eccentric discharge systems [9,28]. Despite extensive research, classical DEM methods remain constrained by computational resources, typically simulating particle numbers limited to the 105 orders of magnitude. This renders them ill-suited for modelling industrial-scale systems involving billions of particles [29,30], and even laboratory-scale hopper discharge simulations involving millions of particles prove challenging. To address this, this paper introduces the Coarse-grained Particle-Discrete Element Method (CGP-DEM) to simulate the discharge of pulverized coal from silos. This approach represents a group of real particles with a single “computational particle,” significantly reducing computational costs while preserving key physical mechanisms. This makes it feasible to simulate real hoppers [31,32].
This study employs the coarse-grained particle-based discrete element method (CGP-DEM) to establish a numerical model applicable to the discharge flow within meter-scale silos. The software used in this study is MFIX, an open-source code developed by the National Energy Technology Laboratory (NETL) of the United States. The research focuses on investigating the effects of pulverized coal particle size and mixing ratios on the macroscopic flow patterns, blending characteristics, and mass flow rates during the discharge process. The objective is to elucidate the flow behavior of blended pulverized coal within silos at the particle scale, thereby providing theoretical foundations and data support for optimizing the design of raw coal silos in power plants and achieving precise control of coal blending and co-firing processes.
2. Simulation Setup and Model Validation
2.1. Coarse-Grained Method
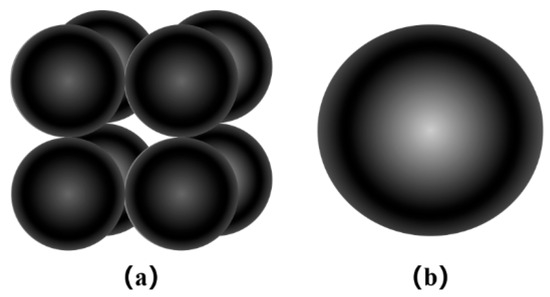
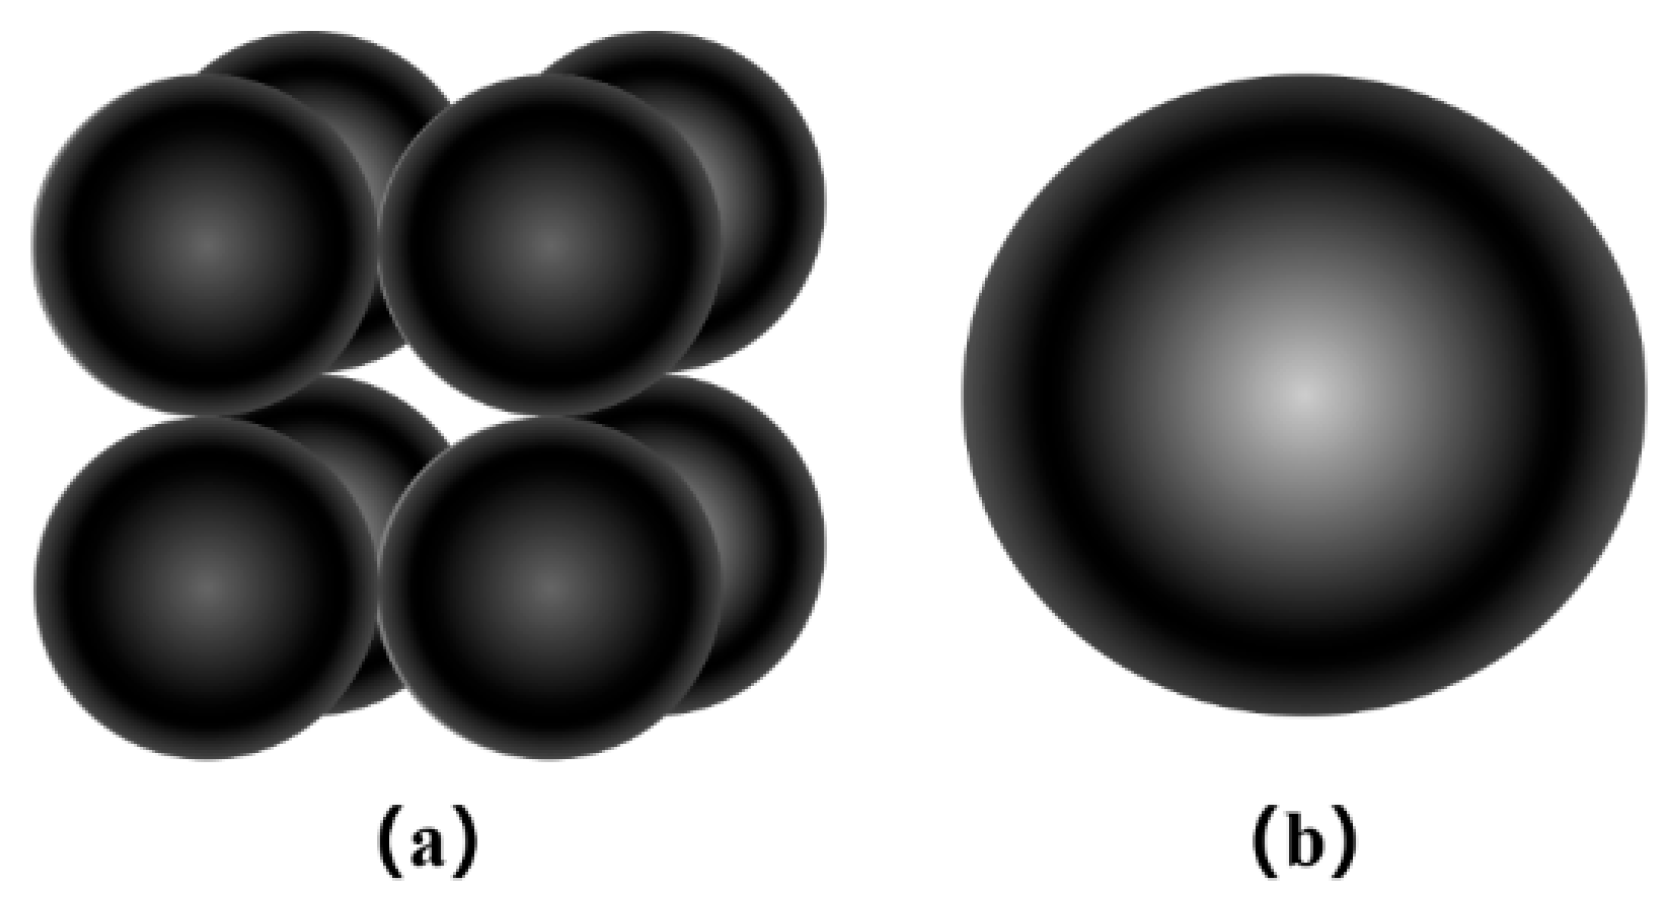
The concept of particle clusters can be broadly categorized into two approaches: the MP–PIC method and the coarse-grained DEM (CG-DEM) method. The MP–PIC approach can be regarded as a hybrid Eulerian–Lagrangian framework, in which particle clusters are employed to represent assemblies of real particles sharing identical physical properties, and the collision process is simplified through the introduction of a solid stress model. A key feature of this method is that all variables are exchanged between particle locations and the Eulerian grid via two-way interpolation. However, by neglecting explicit inter-particle collisions, the MP–PIC method sacrifices a certain degree of computational accuracy. In contrast, although the coarse-grained DEM also adopts the concept of particle clusters to reduce the number of computational particles, it retains explicit resolution of inter-particle collisions, thereby preserving numerical accuracy. This makes CG-DEM a promising alternative for simulating large-scale, dense gas–solid flow systems. Based on scaling laws, the coarse-grained particles are constructed such that the total energy of the coarse-grained system is equivalent to that of the original particle assembly. Compared with the MP–PIC approach, the coarse-grained DEM achieves a favorable balance between computational efficiency and accuracy, enabling a more faithful description of solid particle dynamics [33]. To address the need for computational efficiency in large-scale DEM simulations, Coarse-Grained Models have been introduced to this field. The core concept of this model involves reducing computational scale by constructing equivalent granular units: a single coarse-grained unit represents a cluster of k3 original particles, with geometric dimensions k times those of the original particles, as illustrated in Figure 1. This scale-up strategy fundamentally reduces the total number of particles in the system, thereby substantially decreasing computational load. Regarding physical mechanism modelling, coarse-grained models achieve effective simulation of particle system behavior by comprehensively considering the coupled effects of contact forces and drag forces [34].
Figure 1.
Coarse-grained model (k = 2). (a)particles, (b) grains.
The calculation formulae for the particle size and mass of coarse-grained material are shown in Equations (1) and (2):
where and denote the coarse-grained mass and diameter; and denote the actual particle mass and diameter; k is the amplification factor.
2.2. Control Equations
Within the CGP-DEM, each coarse-grained motion applies Newton’s second law, and the kinematic equations for each coarse-grained translational and rotational motion within this framework are as shown in Equations (3) and (4) [35]:
where denotes the particle’s mass, I represents the particle’s inertia tensor, whose formula is , where g denotes gravitational acceleration, represents translational acceleration, denotes angular acceleration, vCGP and ωCGP are translational velocity and angular velocity, respectively, Fc and Tc are contact force and contact torque, and is defined as in Equation (5) [36]:
where L denotes the distance from the particle’s centre of mass to the contact point, N represents the total number of particles colliding with the current particle, and Fijt is the tangential collision contact force between particle iand particle j. The calculation formula for is shown in Equation (6):
where Fijn and Fijt represent the normal collision contact force and tangential collision contact force between particles i and j, respectively. Their detailed calculation formulas are shown in Equations (7)–(9):
where kn and kt denote elastic coefficients, ηn and ηt denote damping coefficients, while δn and δt represent the thickness of the overlapping region. nij and tij denote the unit normal and tangential vectors, respectively, from the centre of mass of particle i to that of particle j. The tangential unit velocity vt,ij can be calculated using Equation (10):
When the tangential force acting on a particle exceeds the maximum static friction force, sliding occurs. At this point, the coefficient of sliding friction μ is introduced to calculate the particle’s tangential force. Consequently, the final tangential force is expressed as shown in Equation (11):
2.3. Collision Model
Previous studies have extensively validated the applicability and accuracy of both the linear spring–dashpot (LSD) collision model and the Hertz collision model. In comparison, the Hertz collision model involves a significantly higher computational cost, with a calculation time approximately 6.8 times that of the LSD model. Therefore, to ensure sufficient simulation accuracy while improving computational efficiency and reducing computational cost, the LSD collision model is adopted in this study for particle collision calculations [37]. The study will employ the Linear Spring Dashpot (LSD) model as the particle collision model [33]. Within the LSD model, when particles i and j collide, the normal damping coefficient ηn,ij and normal restoring velocity en,ij are defined as shown in Equation (12):
where meff = mjmi/(mi + mj) represents the effective mass of the particle, while denotes the collision time of the particle. This may be specifically expressed as shown in Equation (13):
In the equation, the normal damping coefficient ηn,ij can also be calculated using Equation (14):
2.4. Simulation Parameters and Operating Conditions Configuration
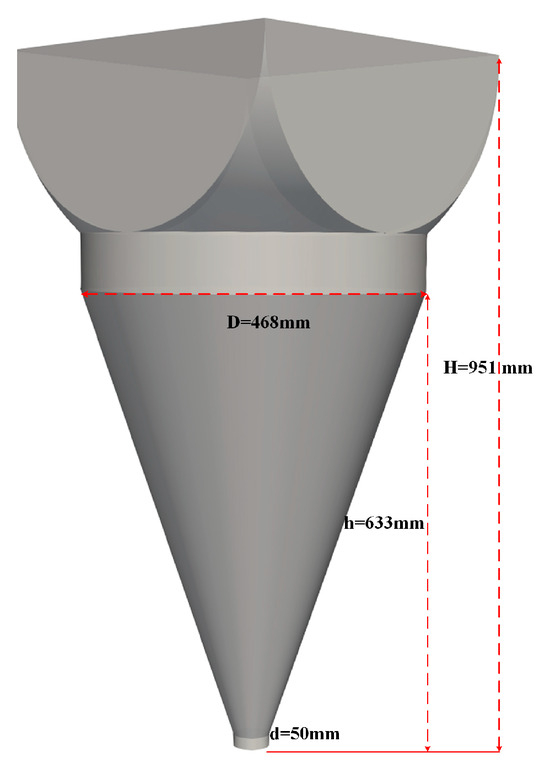
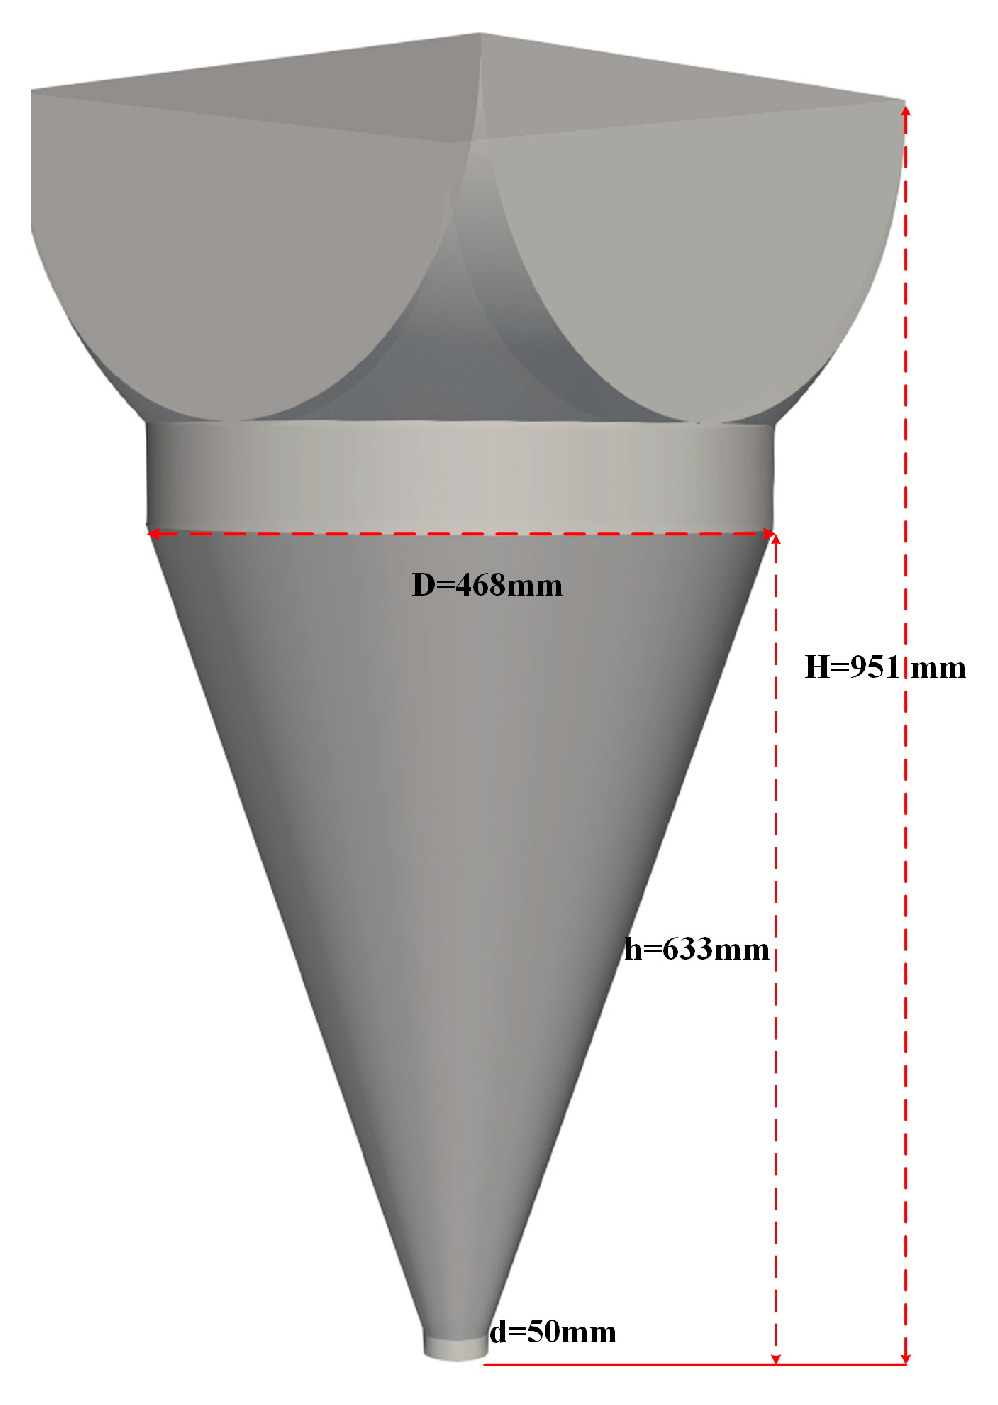
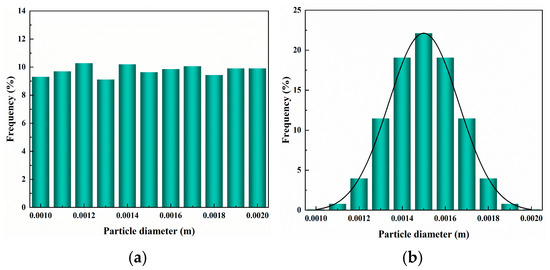
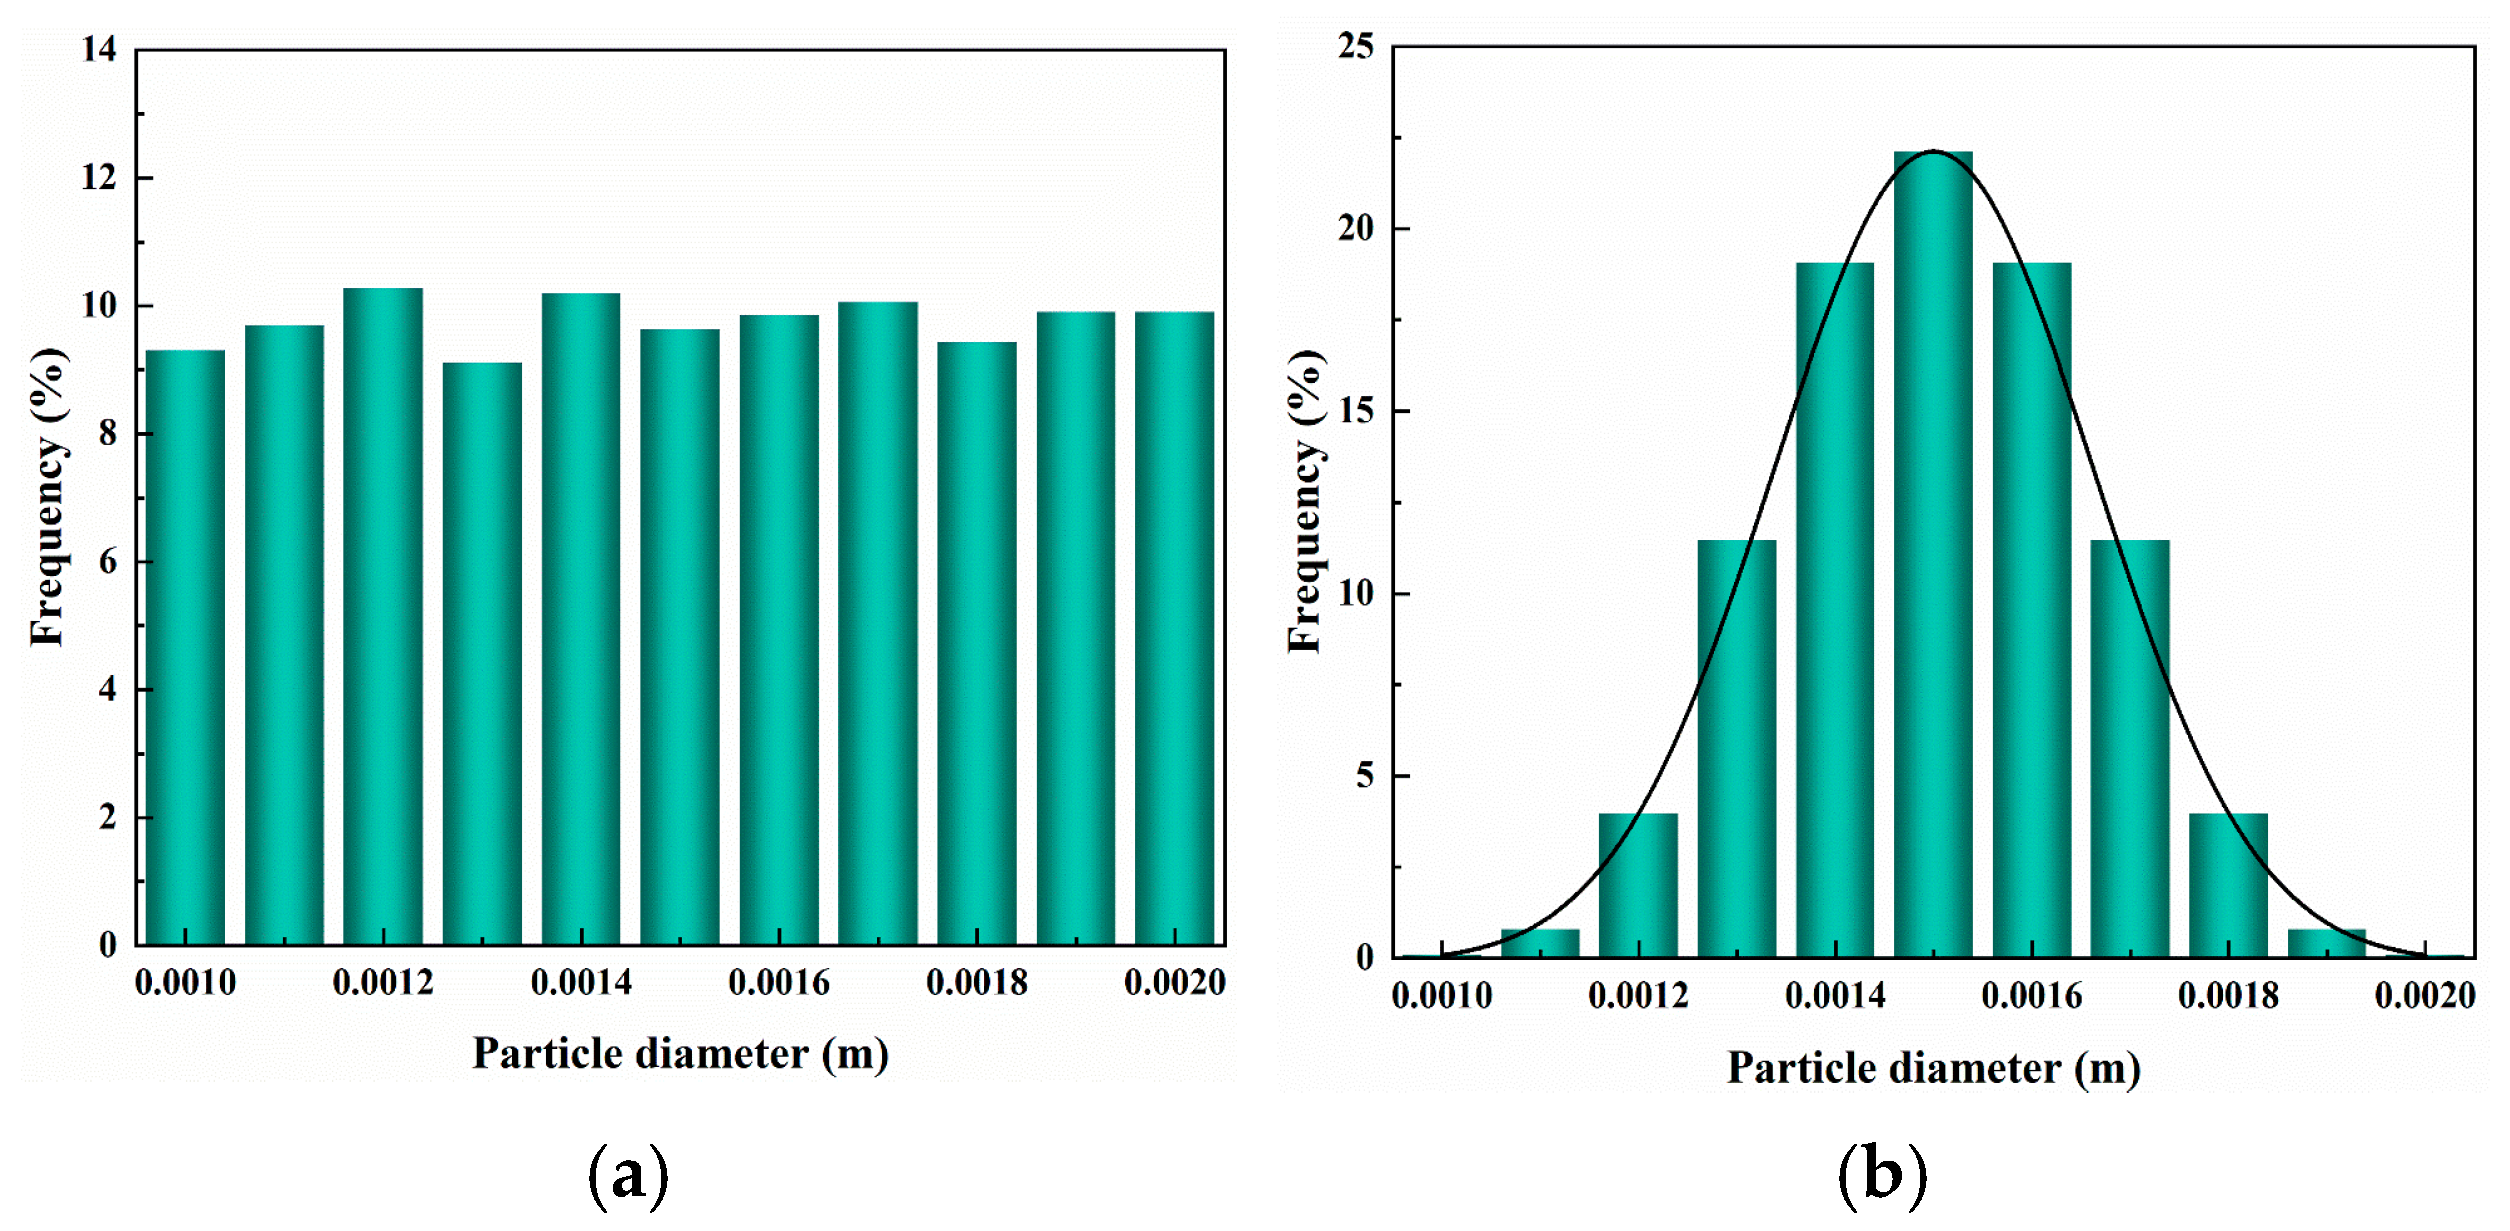
The two pulverized coal types employed in this study are Longwanggou coal and Indonesian coal. The simulation model is depicted in Figure 2. The model stands at 951 mm in height, comprising a conical section measuring 633 mm tall, with an outlet diameter of 50 mm and an inlet diameter of 468 mm. To simulate actual power plant conditions, the coal powder was deployed solely within the hopper’s conical section. Indonesian coal was positioned in the lower region near the conical vessel’s outlet, while Longwanggou coal occupied the upper portion of the conical segment. This study employed a pure granular flow model, disregarding fluid drag forces and considering only particle–particle collisions, particle–wall collisions, and gravitational effects. The simulation examined the influence of particle size distribution and mixing ratios. (i) The hopper’s conical section was divided into five equal height segments, each 123.4 mm tall. This was achieved by controlling the initial filling height ratio of the two coal powders, setting the height ratio h = HY/HL, where HY is the filling height of Indonesian coal and HL is the filling height of Longwanggou coal. For the four operating conditions, h was set to 1:4, 2:3, 3:2, and 4:1, respectively. (ii) Three particle size distributions were configured: a uniform size of 1.5 mm, a linear distribution from 1 mm to 2 mm, and a normal distribution with mean x = 1.5 mm, standard deviation 3σ = 0.5 mm, and restricted within the 1–2 mm range, as shown in Figure 3. Detailed simulation parameter settings are presented in Table 1.
Figure 2.
Hopper Model.
Figure 3.
Particle size distributions: (a) linear distribution, (b) normal distribution.
Table 1.
Simulation Parameters.
2.5. Model Validation
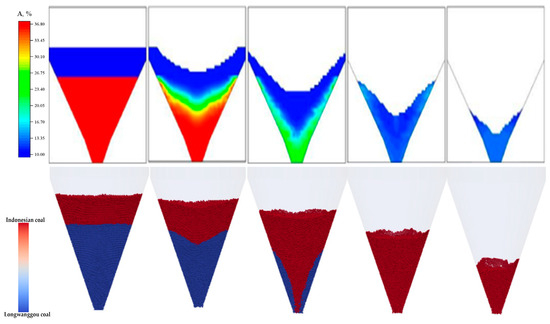
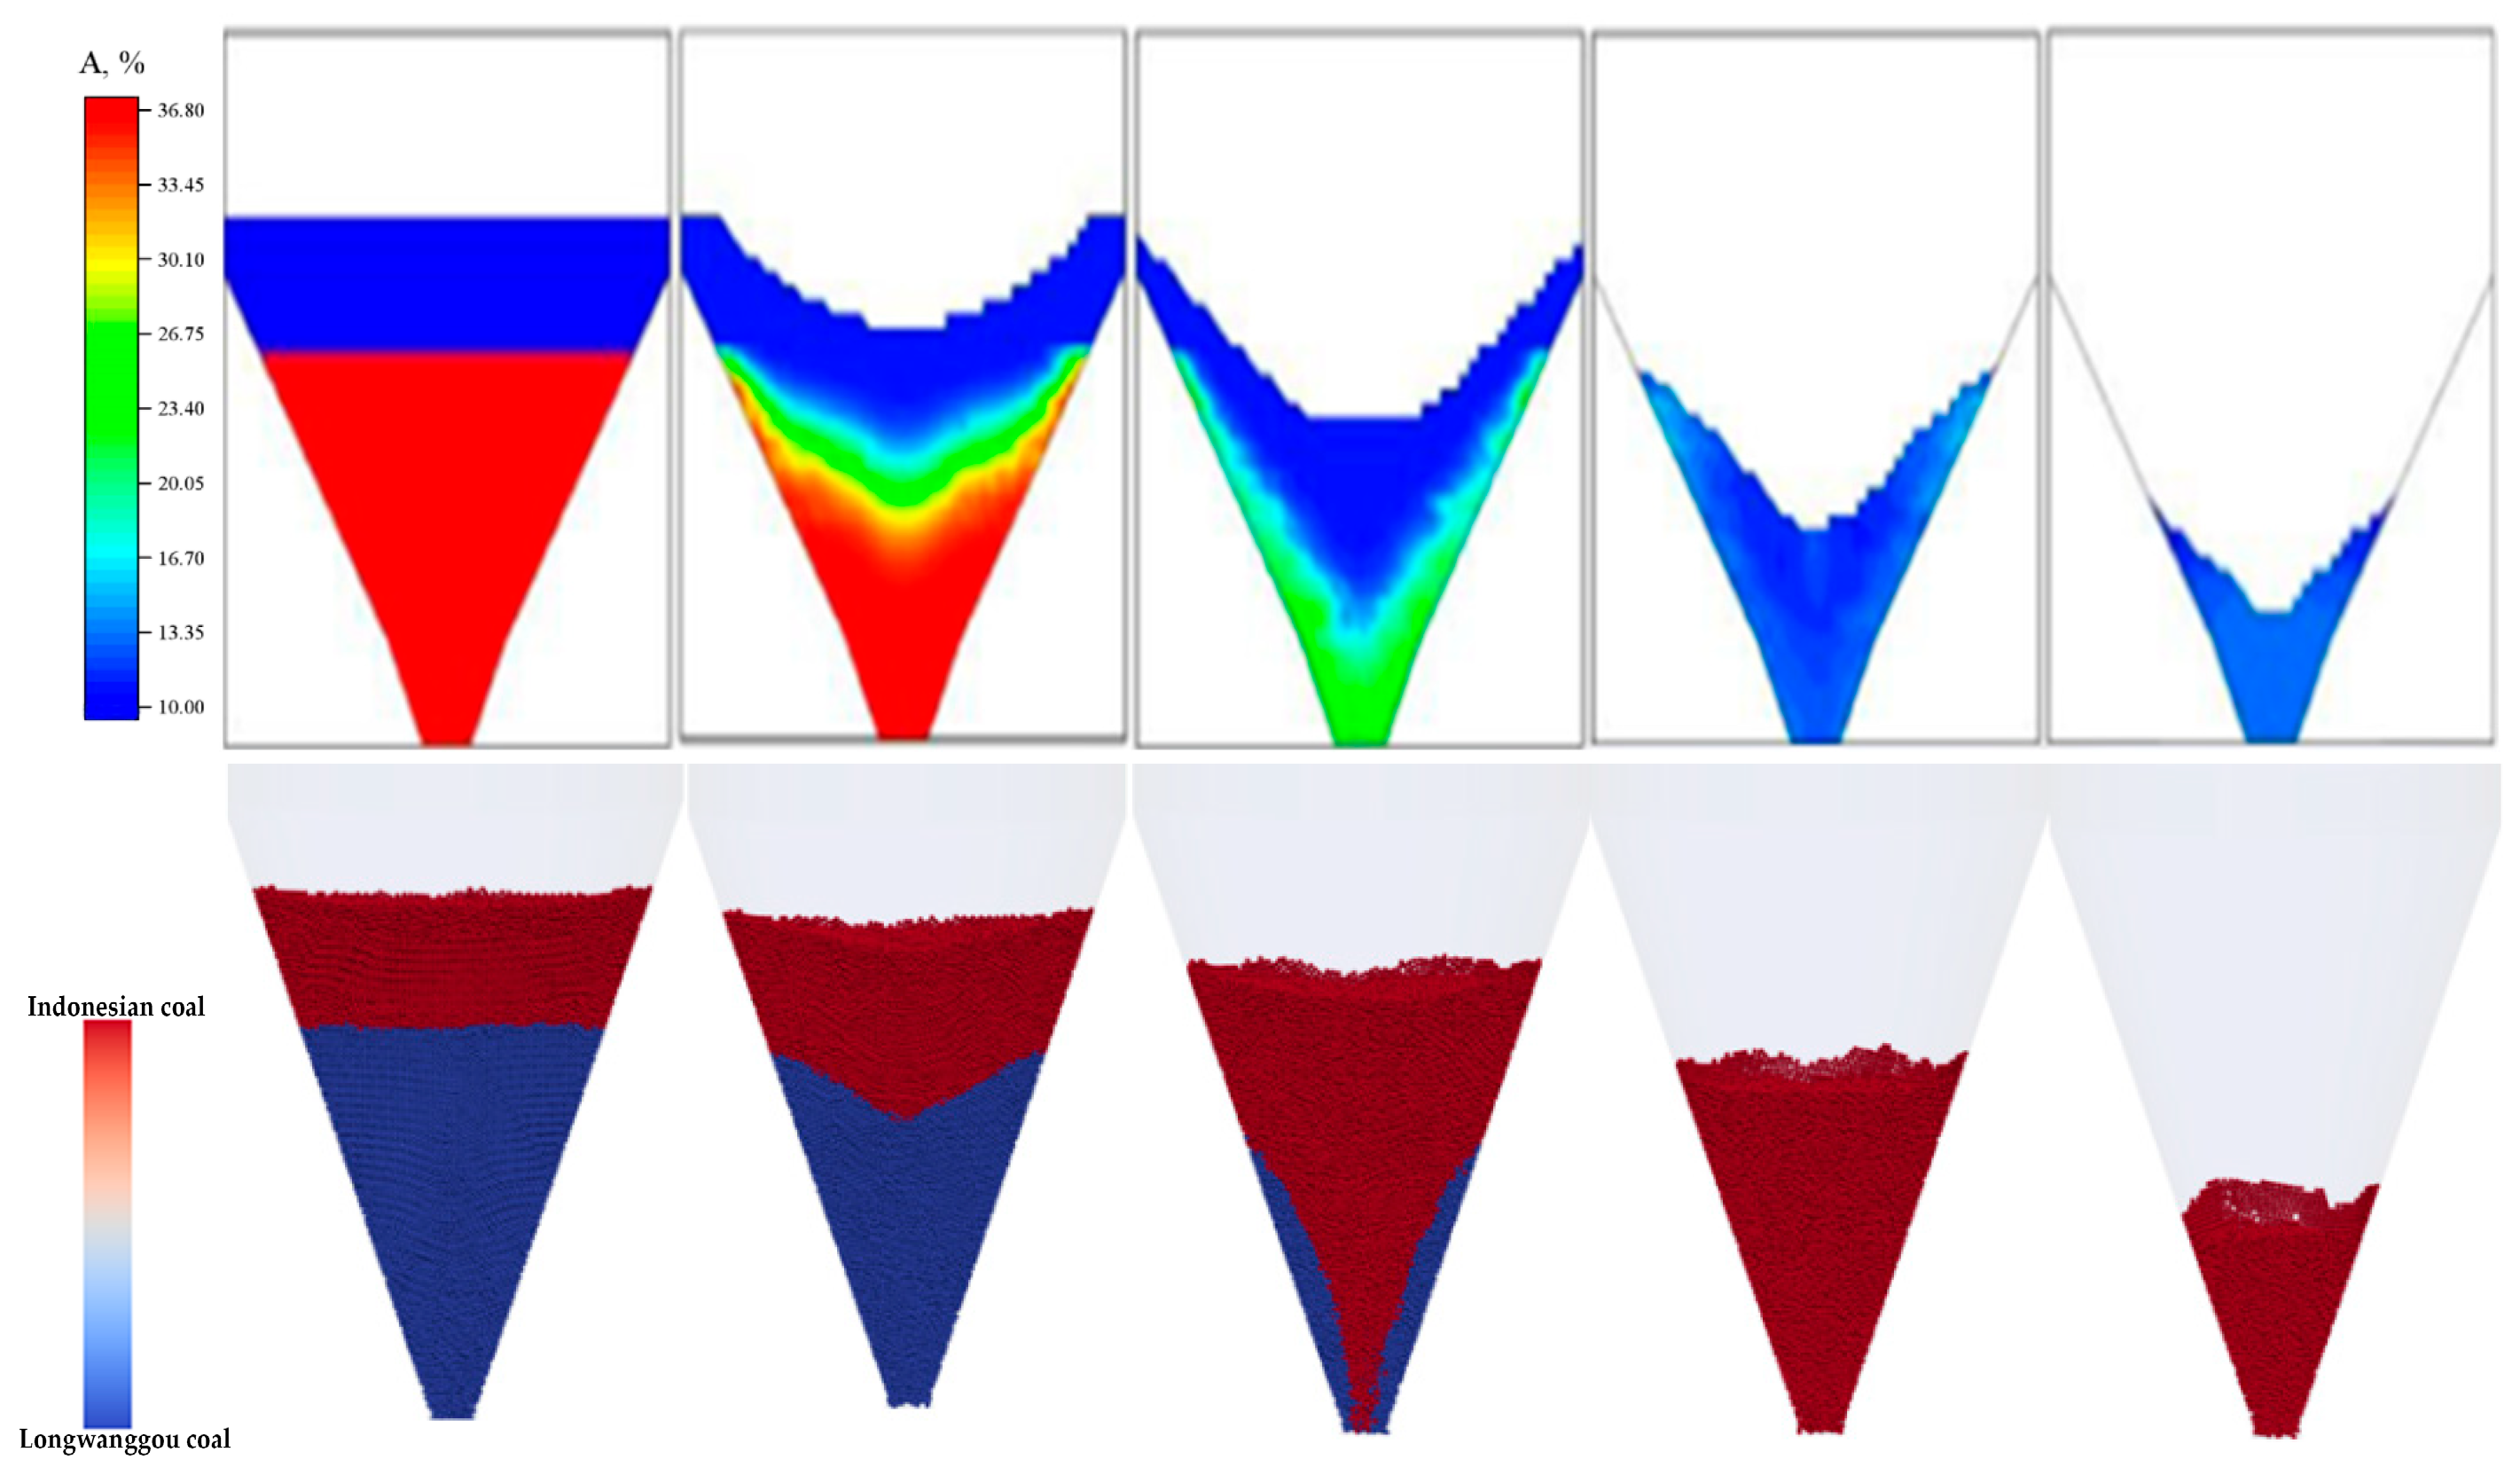
To validate the accuracy of the constructed model, this study conducted a comparative analysis of the simulation results for the silo discharge process against the research by Dai et al. [16]. As shown in the upper panel of Figure 4, Dai et al. quantified the mixing state of two particle species by mapping ash concentration to color: blue indicates low ash content, red indicates high ash content, and a shift toward green denotes a higher degree of mixing. In contrast, as illustrated in the lower panel of Figure 4, the present study adopts a component-based color scheme, where blue represents Indonesian coal and red represents Longwanggou coal. The mixing behavior is directly examined by extracting hopper cross-sections and visualizing the spatial distribution of the two particle species within the section. The figure indicates that the overall trends in particle flow patterns under both conditions are largely consistent, with similar flow structure and development processes, both exhibiting a typical funnel-mixing flow pattern. In the simulation results, the total mass of pulverized coal filling the hopper was approximately 180 kg, with the discharge process lasting about 18 s. Through comparative analysis of key parameters, including flow patterns, material level changes, and discharge duration, the simulation results obtained in this study demonstrate good consistency with the experimental and simulation conclusions of Dai et al. This not only validates the reliability of this model in capturing the macroscopic flow behavior of pulverized coal discharge but also further demonstrates that the established coarse-grained discrete element model possesses good accuracy and applicability when simulating such granular systems.
Figure 4.
Comparative Diagram of Manifold Evolution.
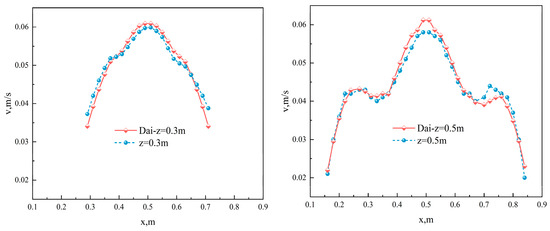
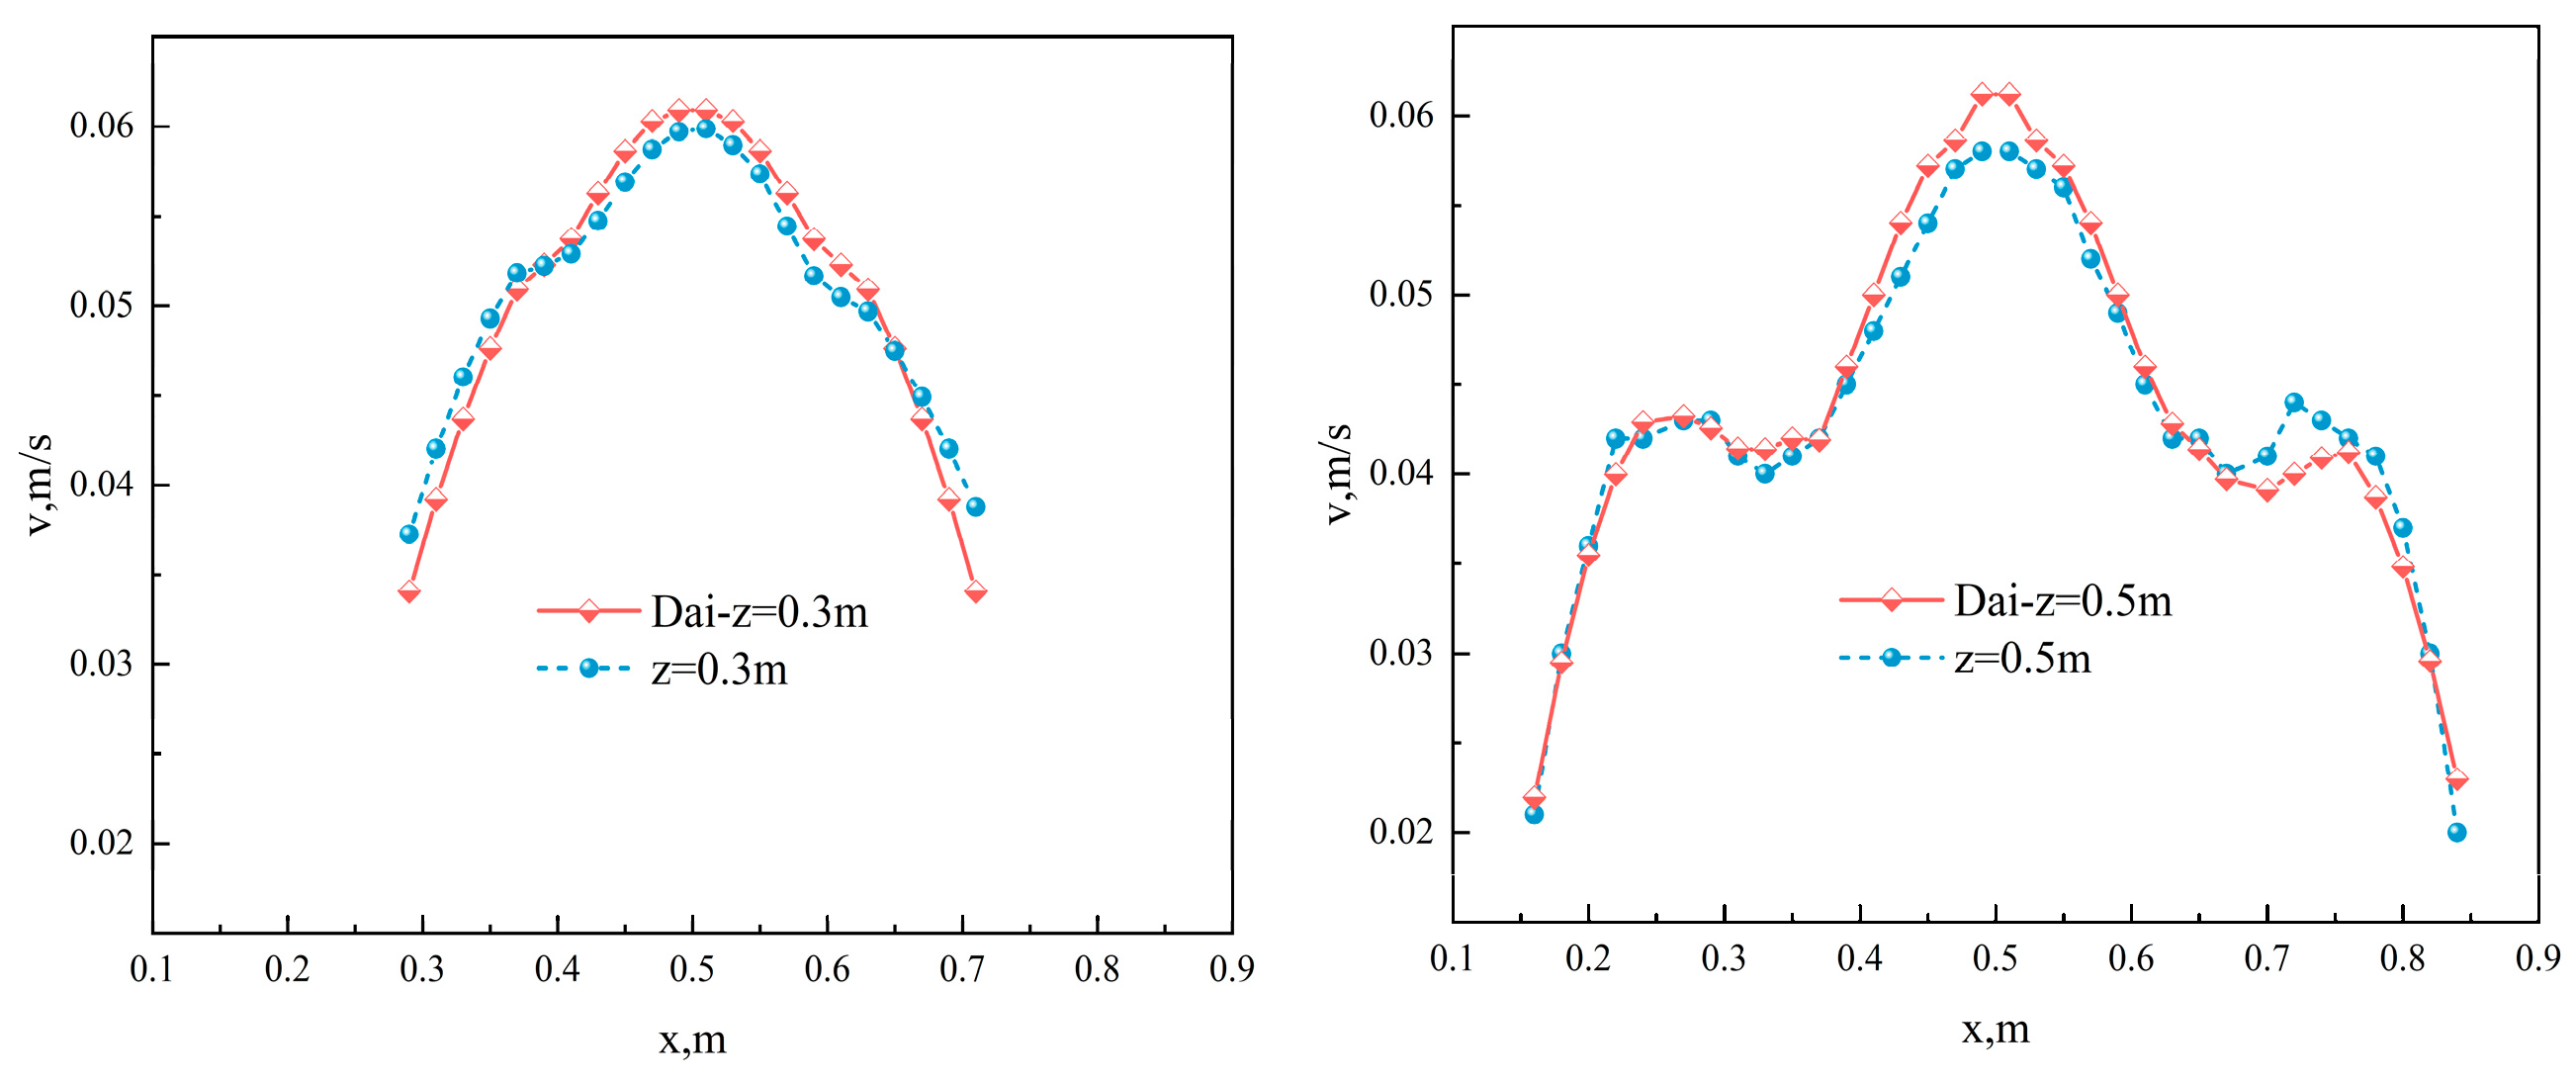
This study conducts a comparative analysis between the model proposed by Dai et al. and the model developed in the present work under different hopper heights (0.3 m and 0.5 m), focusing on the distribution of particle velocity along the x-direction at t = 1 s. As shown in Figure 5, the results indicate that the two models exhibit highly consistent velocity distribution trends, with good agreement in their overall variation patterns. Although some differences in velocity magnitude are observed in localized regions, the overall shape and evolution of the particle velocity profiles along the x-axis remain highly consistent at both hopper heights. This suggests that the discrepancies are mainly quantitative rather than qualitative and do not affect the interpretation of particle flow mechanisms or flow regime characteristics. These findings further confirm the reliability of the present model in capturing particle velocity distributions during hopper discharge.
Figure 5.
Validation of the present model through comparison of particle velocity distributions.
The Stokes number (Stk) is a dimensionless parameter used to characterize the relative importance of particle (or droplet) inertia with respect to the characteristic time scale of the surrounding fluid flow. It is defined as the ratio of the particle relaxation time () to the characteristic flow time (Tf): . The particle relaxation time is given by , The particle relaxation time is given by .where is the particle diameter, is the particle’s true density, is the dynamic viscosity of air, H is the characteristic height of the flow field, and is the terminal settling velocity, which is expressed as . Using the given parameters (dp = 6 mm, = 1400 kg/m3, = 1.2 kg/m3, H = 0.63 m, T = 20 °C, Pa.s). The Stokes number is calculated as Stk ≈ 3.92 × 10⁴. This extremely large Stokes number (Stk ≫ 1) indicates that particle motion during settling is overwhelmingly dominated by inertial effects, while aerodynamic influences can be neglected. Consequently, the particle trajectory approaches that of an ideal ballistic motion and is largely insensitive to external flow disturbances. In practical discharge processes, the particles therefore exhibit high-speed, nearly straight-line descent, characterized by strong impact kinetic energy and high resistance to airflow interference.
3. Results and Discussion
3.1. Verification of Mesh Independence and Coarse-Grained Ratio
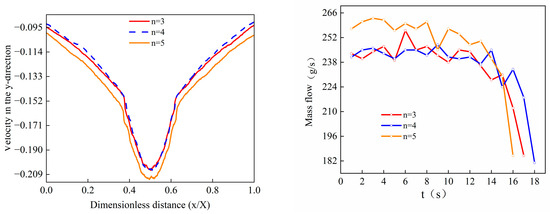
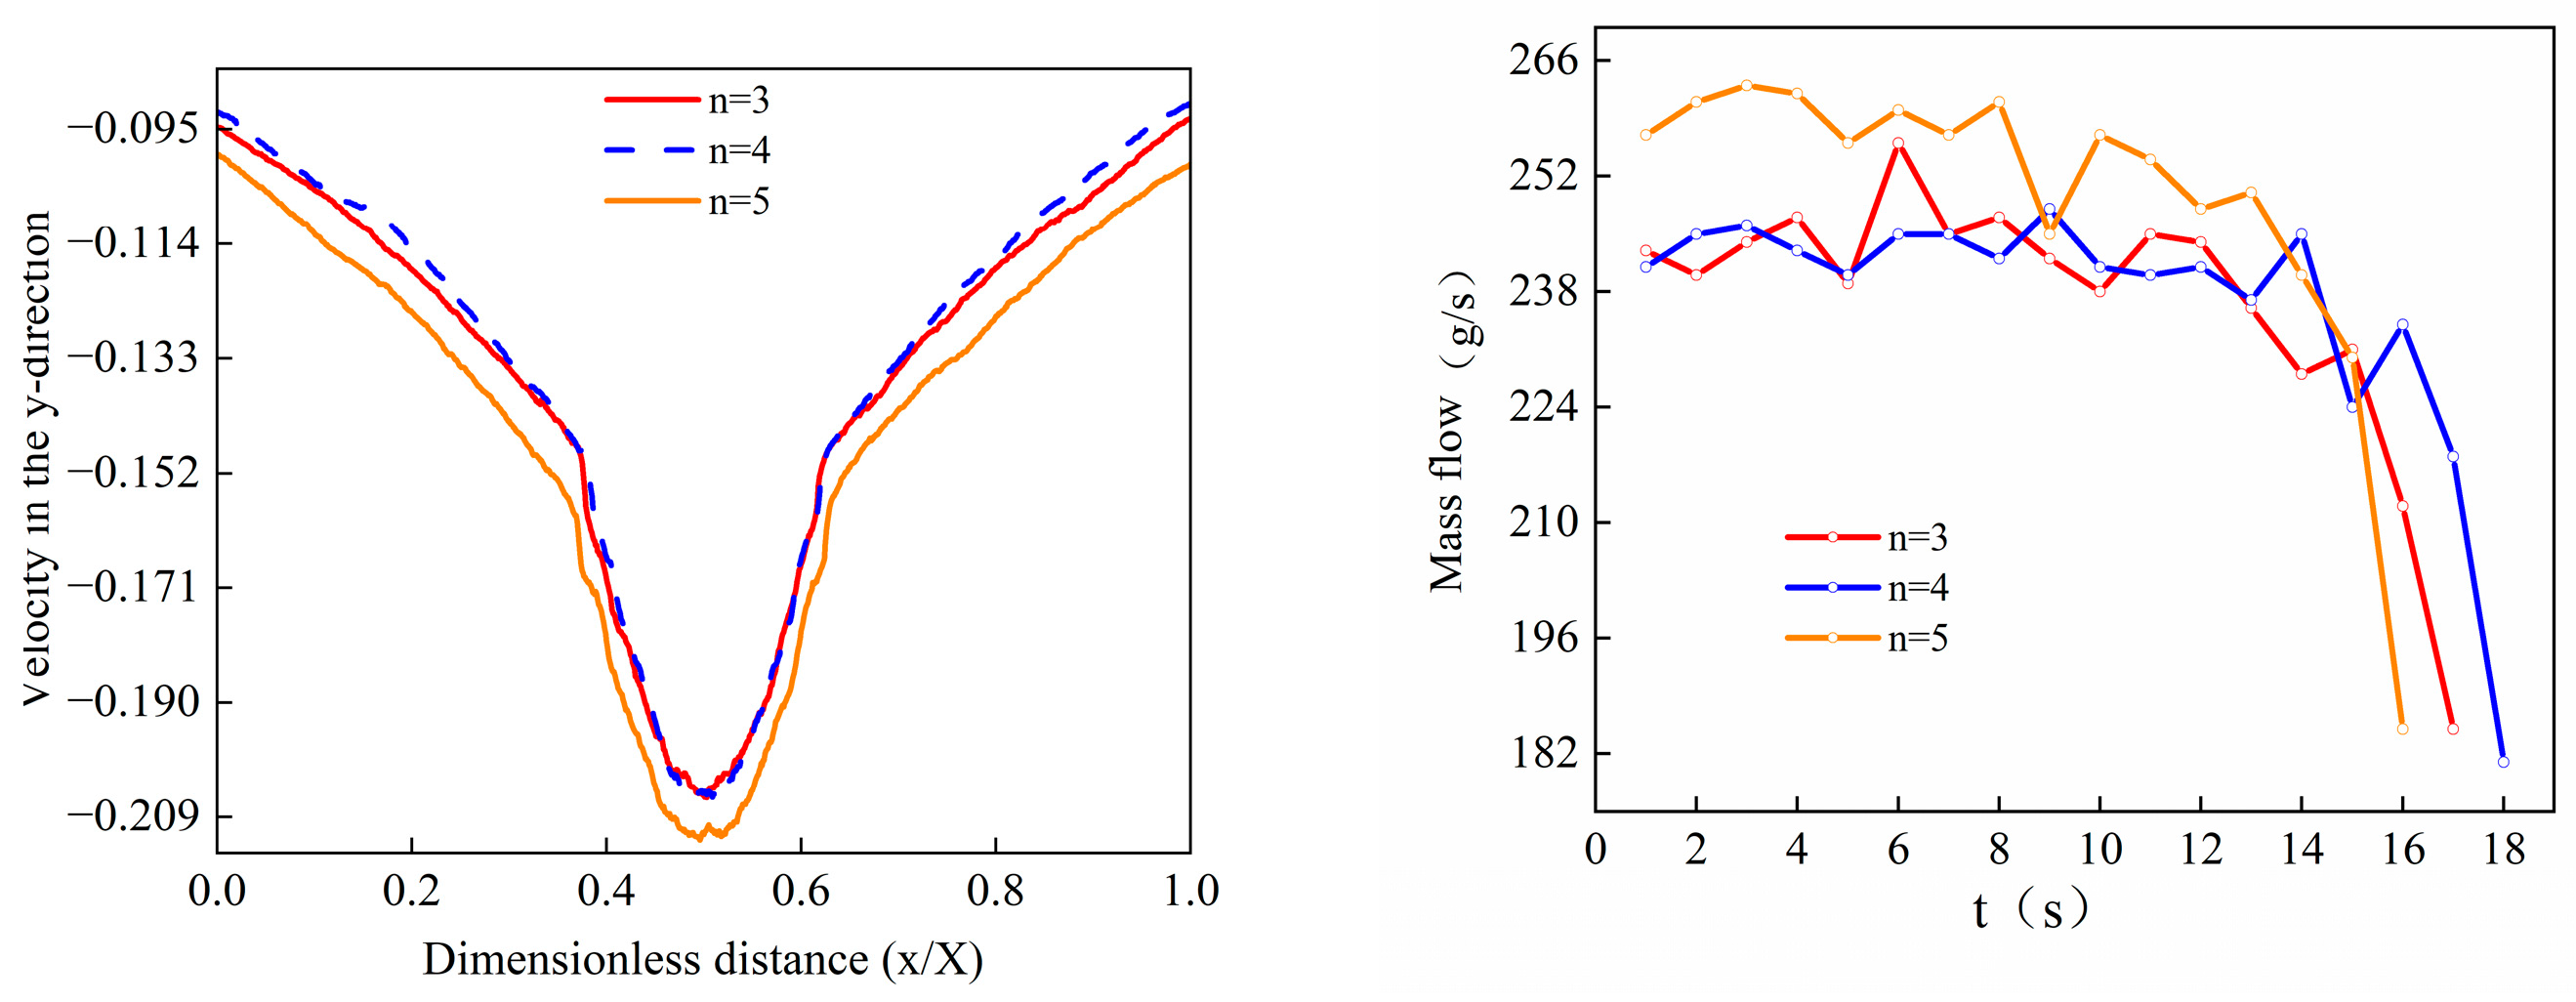
To validate mesh independence, comparisons were conducted with n = 3, 4, and 5 as variables, where n represents the ratio of mesh size to coarse-grained particle diameter. As shown in Figure 6.The corresponding grid numbers in the x, y, and z directions were (26, 53, 26), (20, 40, 20), and (16, 32, 16), respectively. As evident from the figure, the influence of the coarse-grained grid size exhibits a critical range. When the scale increases from n = 3 to n = 4, the velocity distribution and feed rate curves remain largely consistent. However, when the size further increases to n = 5, both the cross-sectional average velocity and feed rate show significant changes. Considering the above, this study selects n = 4 as the grid size for subsequent investigations. Each simulation requires approximately 4–5 days of wall-clock time to complete.
Figure 6.
Particle velocity distribution and feed rate under different mesh sizes.
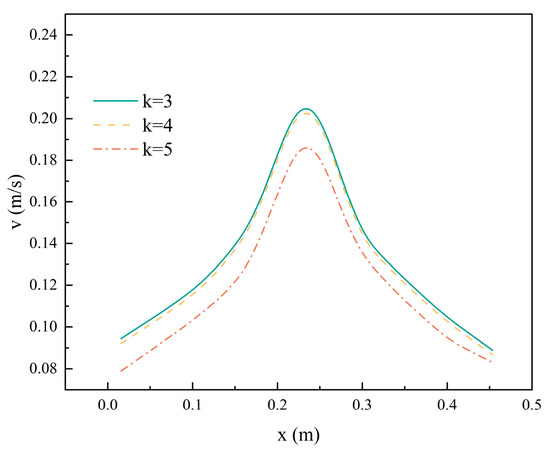
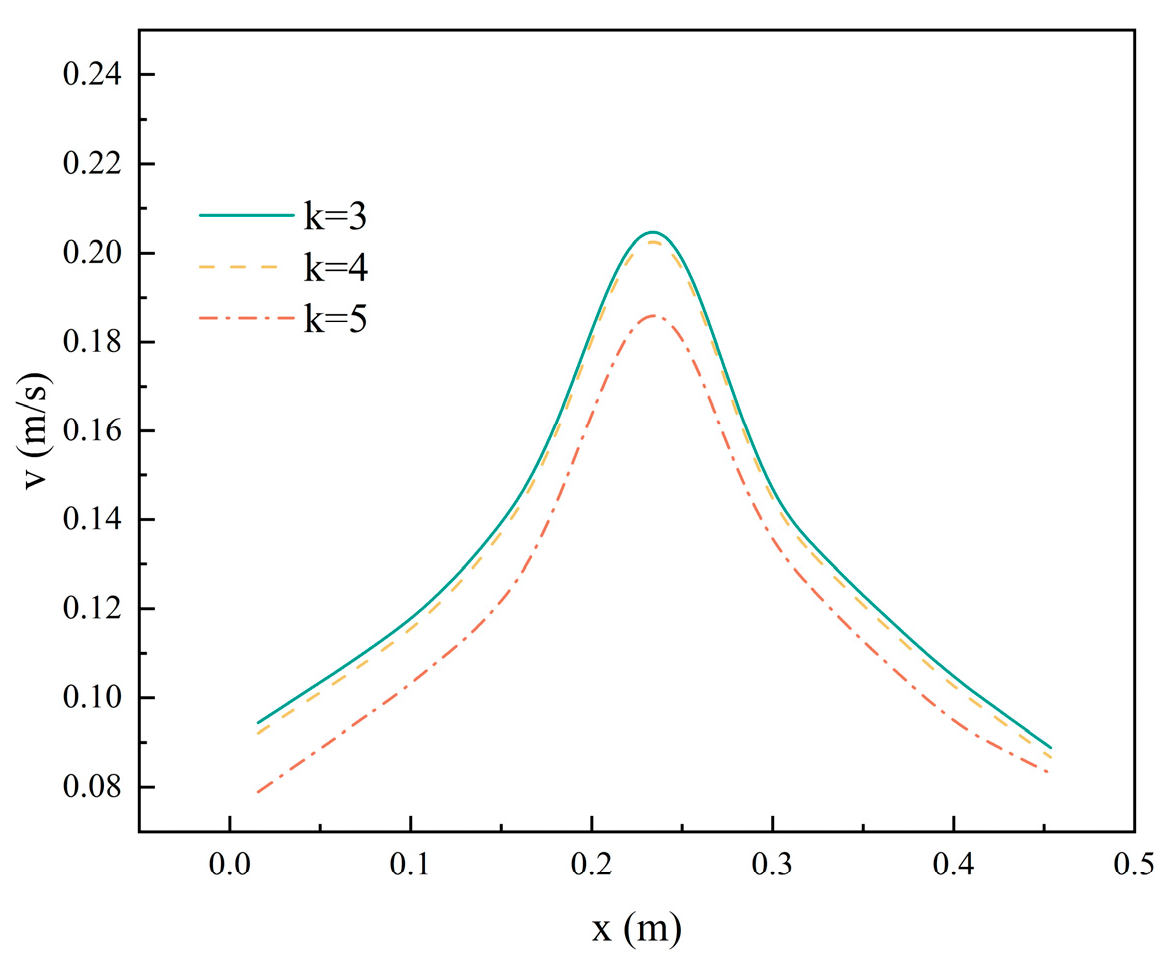
Figure 7 presents the validation results for coarse-graining factors of 3, 4, and 5, showing the time-averaged particle velocity in the y-direction at a height of 0.1 m above the hopper outlet. The results indicate that the time-averaged velocity distributions obtained with coarse-graining factors of 3 and 4 are very similar, whereas a noticeable deviation is observed when the coarse-graining factor is increased to 5. In terms of computational efficiency, the simulation with a coarse-graining factor of 3 requires approximately 7 days to complete, while the simulation time is reduced to about 3 days when a factor of 4 is employed. Without coarse-graining, conventional DEM simulations under such dense particle flow conditions would be computationally impractical. Considering both numerical accuracy and computational efficiency, a coarse-graining factor of 4 is therefore adopted in this study.
Figure 7.
Verification of Coarse-grained ratio.
3.2. Evolution of Flow Patterns
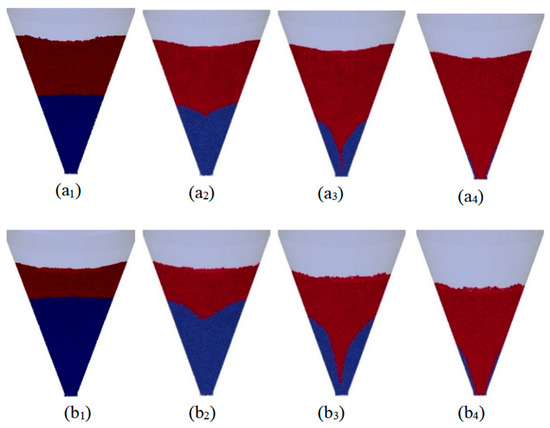
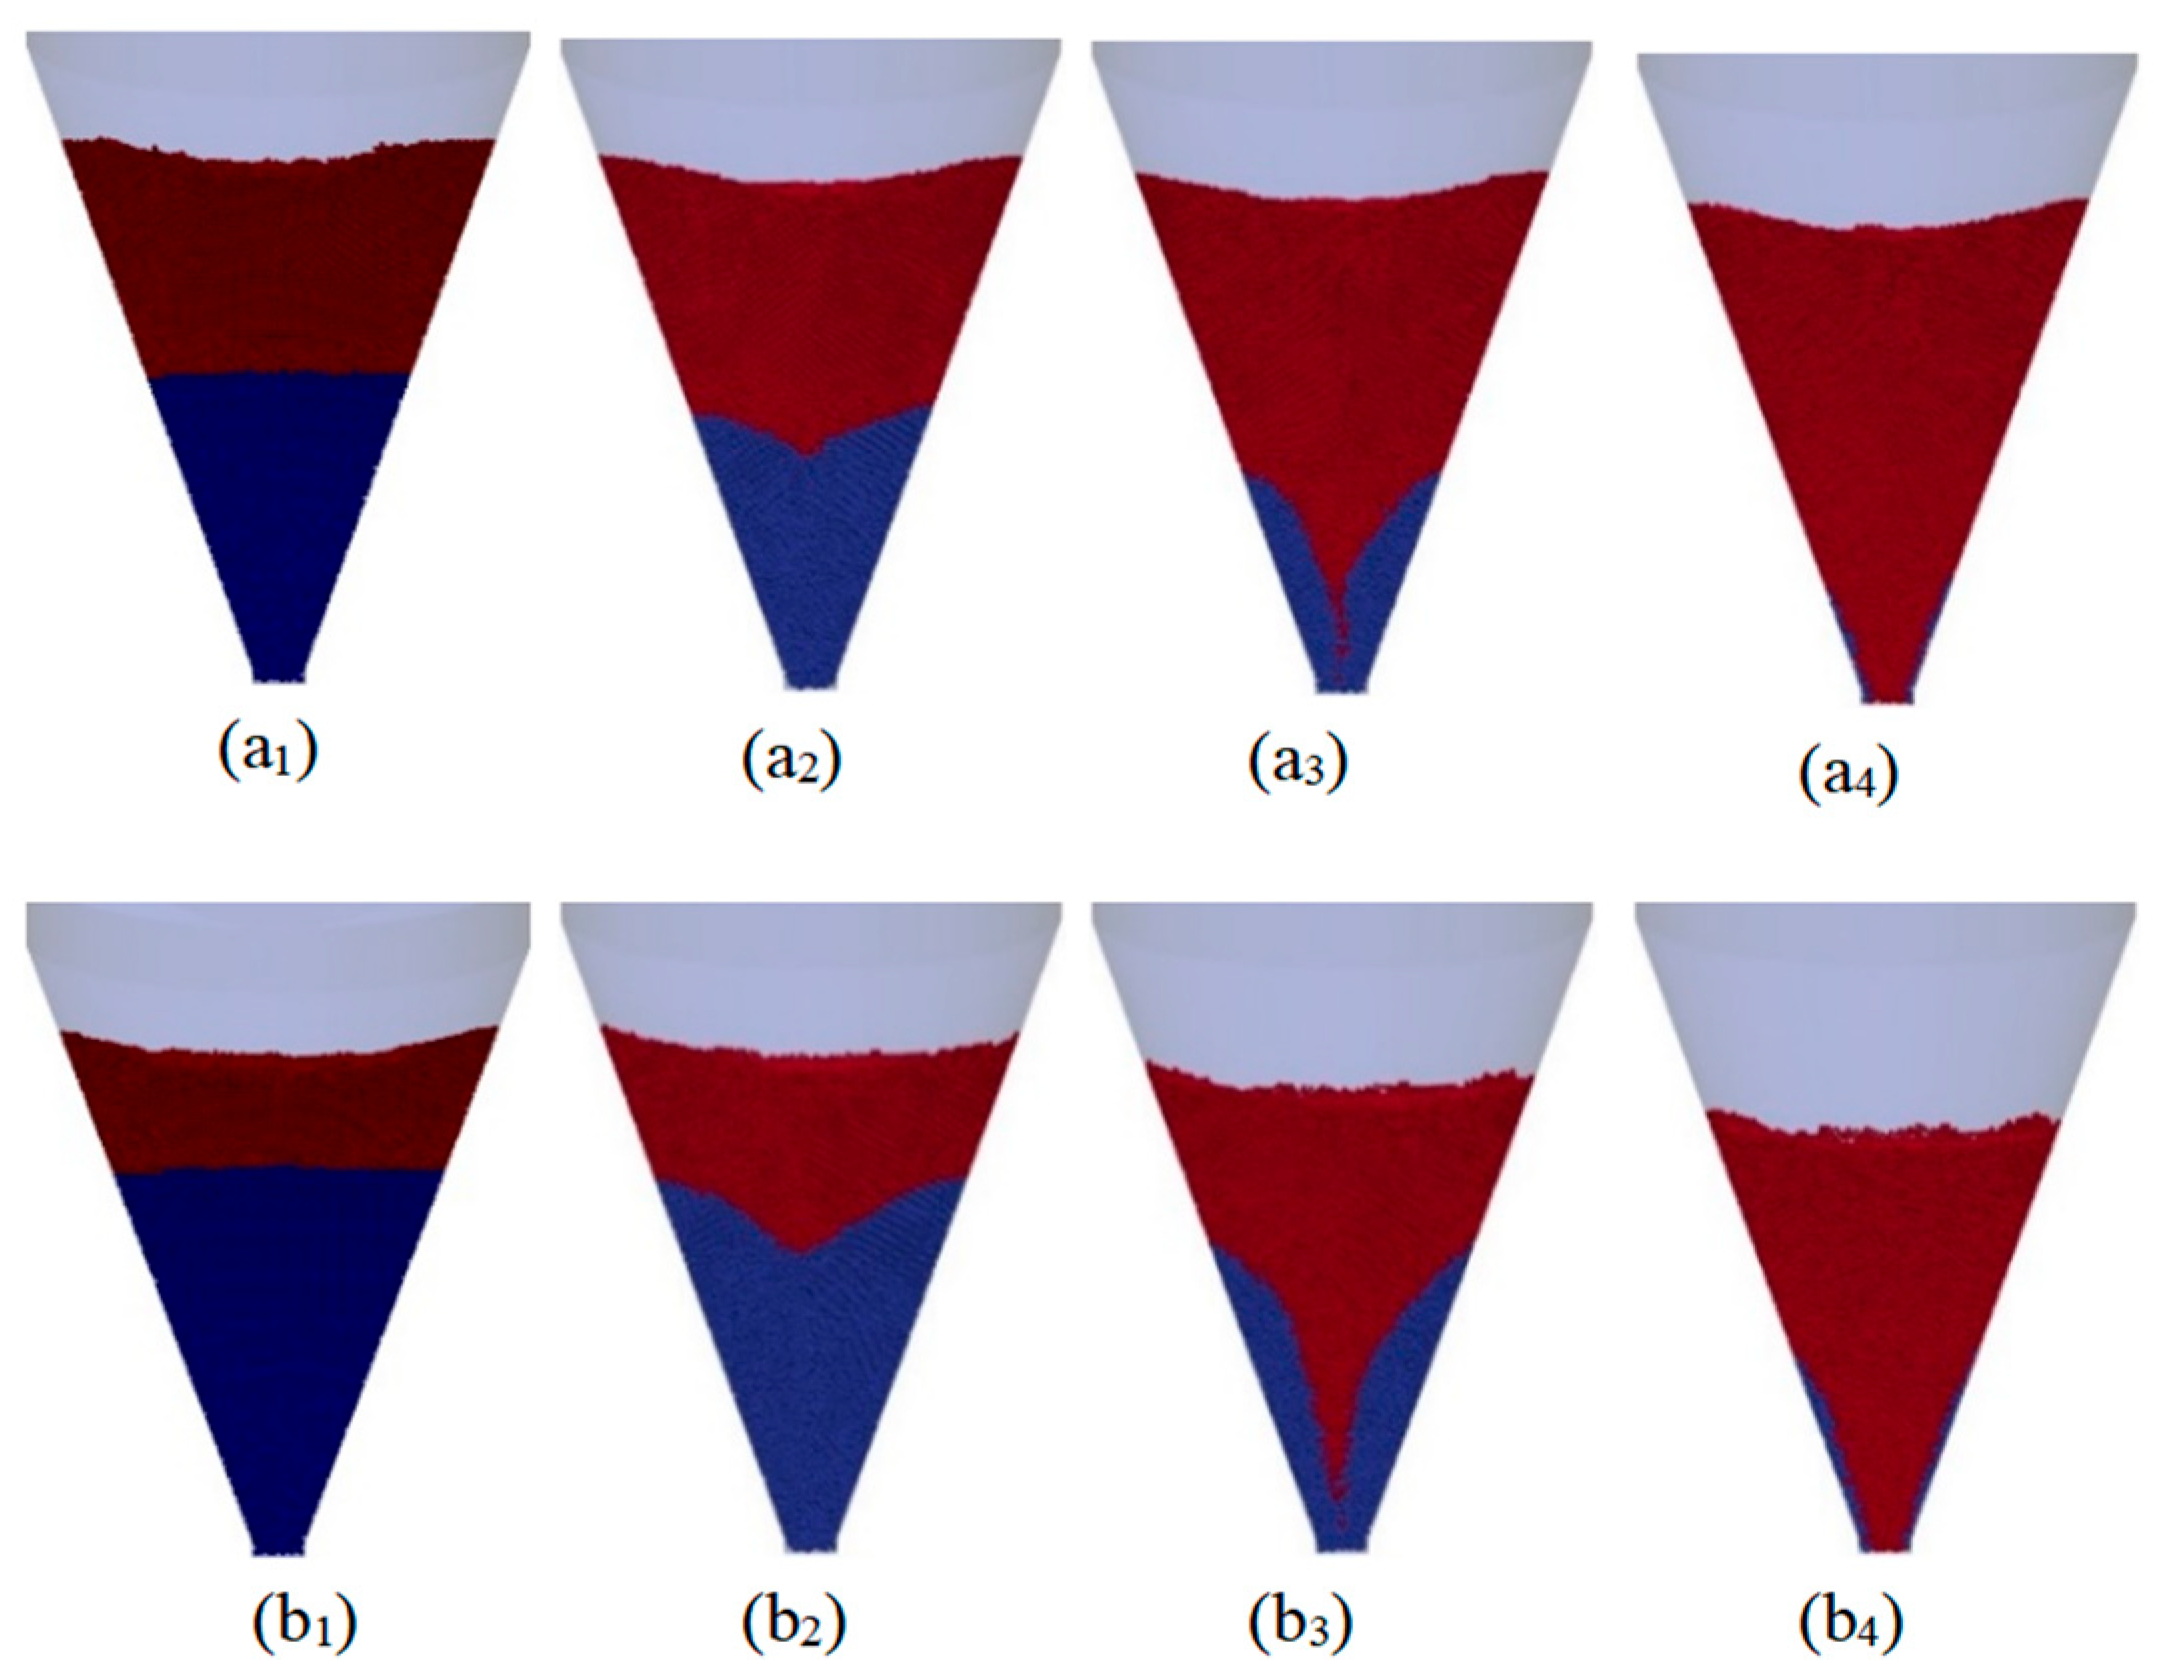
To clearly observe the evolution of particle flow patterns during discharge, this study employs color coding based on particle type: blue denotes Indonesian coal particles, while red represents Longwanggou coal particles. Findings indicate that under the blending ratio h = 1:4 condition, Indonesian coal particles—being fewer in number and exhibiting significantly increased descent velocity near the outlet—were entirely discharged within approximately 0.5 s after discharge commencement, rendering their flow pattern evolution difficult to capture effectively. At h = 3:2, Indonesian coal particles were fully discharged around 5.5 s. At h = 4:1, discharge was only complete after approximately 11 s, providing a more extended timescale for observing flow pattern evolution. Three time points at equal intervals were selected for comparative analysis from the initial distribution to complete discharge of Indonesian coal particles. The flow pattern cross-sections are shown in Figure 8. During the early evolution stage (Figure 8a2,b2), Longwanggou coal particles began penetrating downward along the axial region, gradually forming a distinct penetration interface. During the intermediate stage (Figure 8a3,b3), portions of the Longwanggou coal approached the outlet position, with the intrusion interface exhibiting a distinct V-shaped structural characteristic. In the final stage (Figure 8a4,b4), the majority of discharge particles at the hopper outlet had transformed into Longwanggou coal, while a small number of Indonesian coal particles remained retained near the wall surfaces.
Figure 8.
Evolution of the Flow Pattern (a1) h = 3:2 t = 0.15 s; (a2) h = 3:2 t = 1.5 s; (a3) h = 3:2 t = 3 s; (a4) h = 3:2 t = 4.5 s; (b1) h = 4:1 t = 0.15 s; (b2) h = 4:1 t = 3 s; (b3) h = 4:1 t = 6 s; (b4) h = 4:1 t = 9 s. (Blue denotes Indonesian coal particles, while red represents Longwanggou coal particles).
The results indicate that throughout the discharge process, material predominantly descends along the central axis of the hopper, with particles near the walls exhibiting marked lag in discharge. This movement characteristic of “central flow precedence and wall lag” aligns with the flow pattern description of typical funnel flow, wherein only a portion of the material participates in continuous discharge, while the remaining regions undergo slow rearrangement or remain relatively stationary. This observation is consistent with the numerical results reported by Dai et al., who demonstrated that the formation of funnel flow is closely associated with the combined effects of hopper geometry and particle–wall interactions [16]. A relatively small outlet size and a moderate-to-large hopper angle promote the development of a preferential flow channel along the central axis, while enhanced frictional resistance at the wall suppresses particle mobilization in the peripheral regions. As a result, particle motion becomes highly non-uniform, with the central core dominating the discharge process and wall-adjacent particles remaining stagnant or slowly rearranging.
3.3. Velocity Distribution Within the Hopper
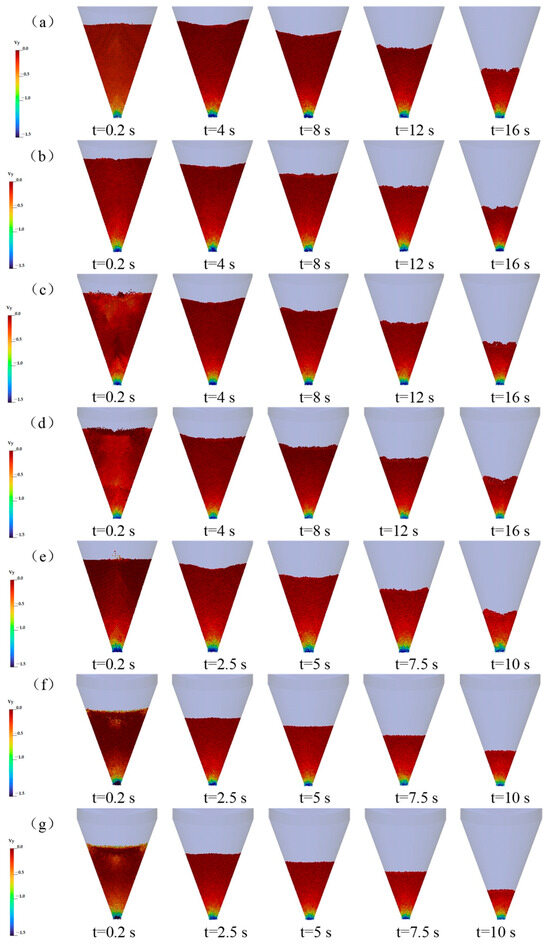
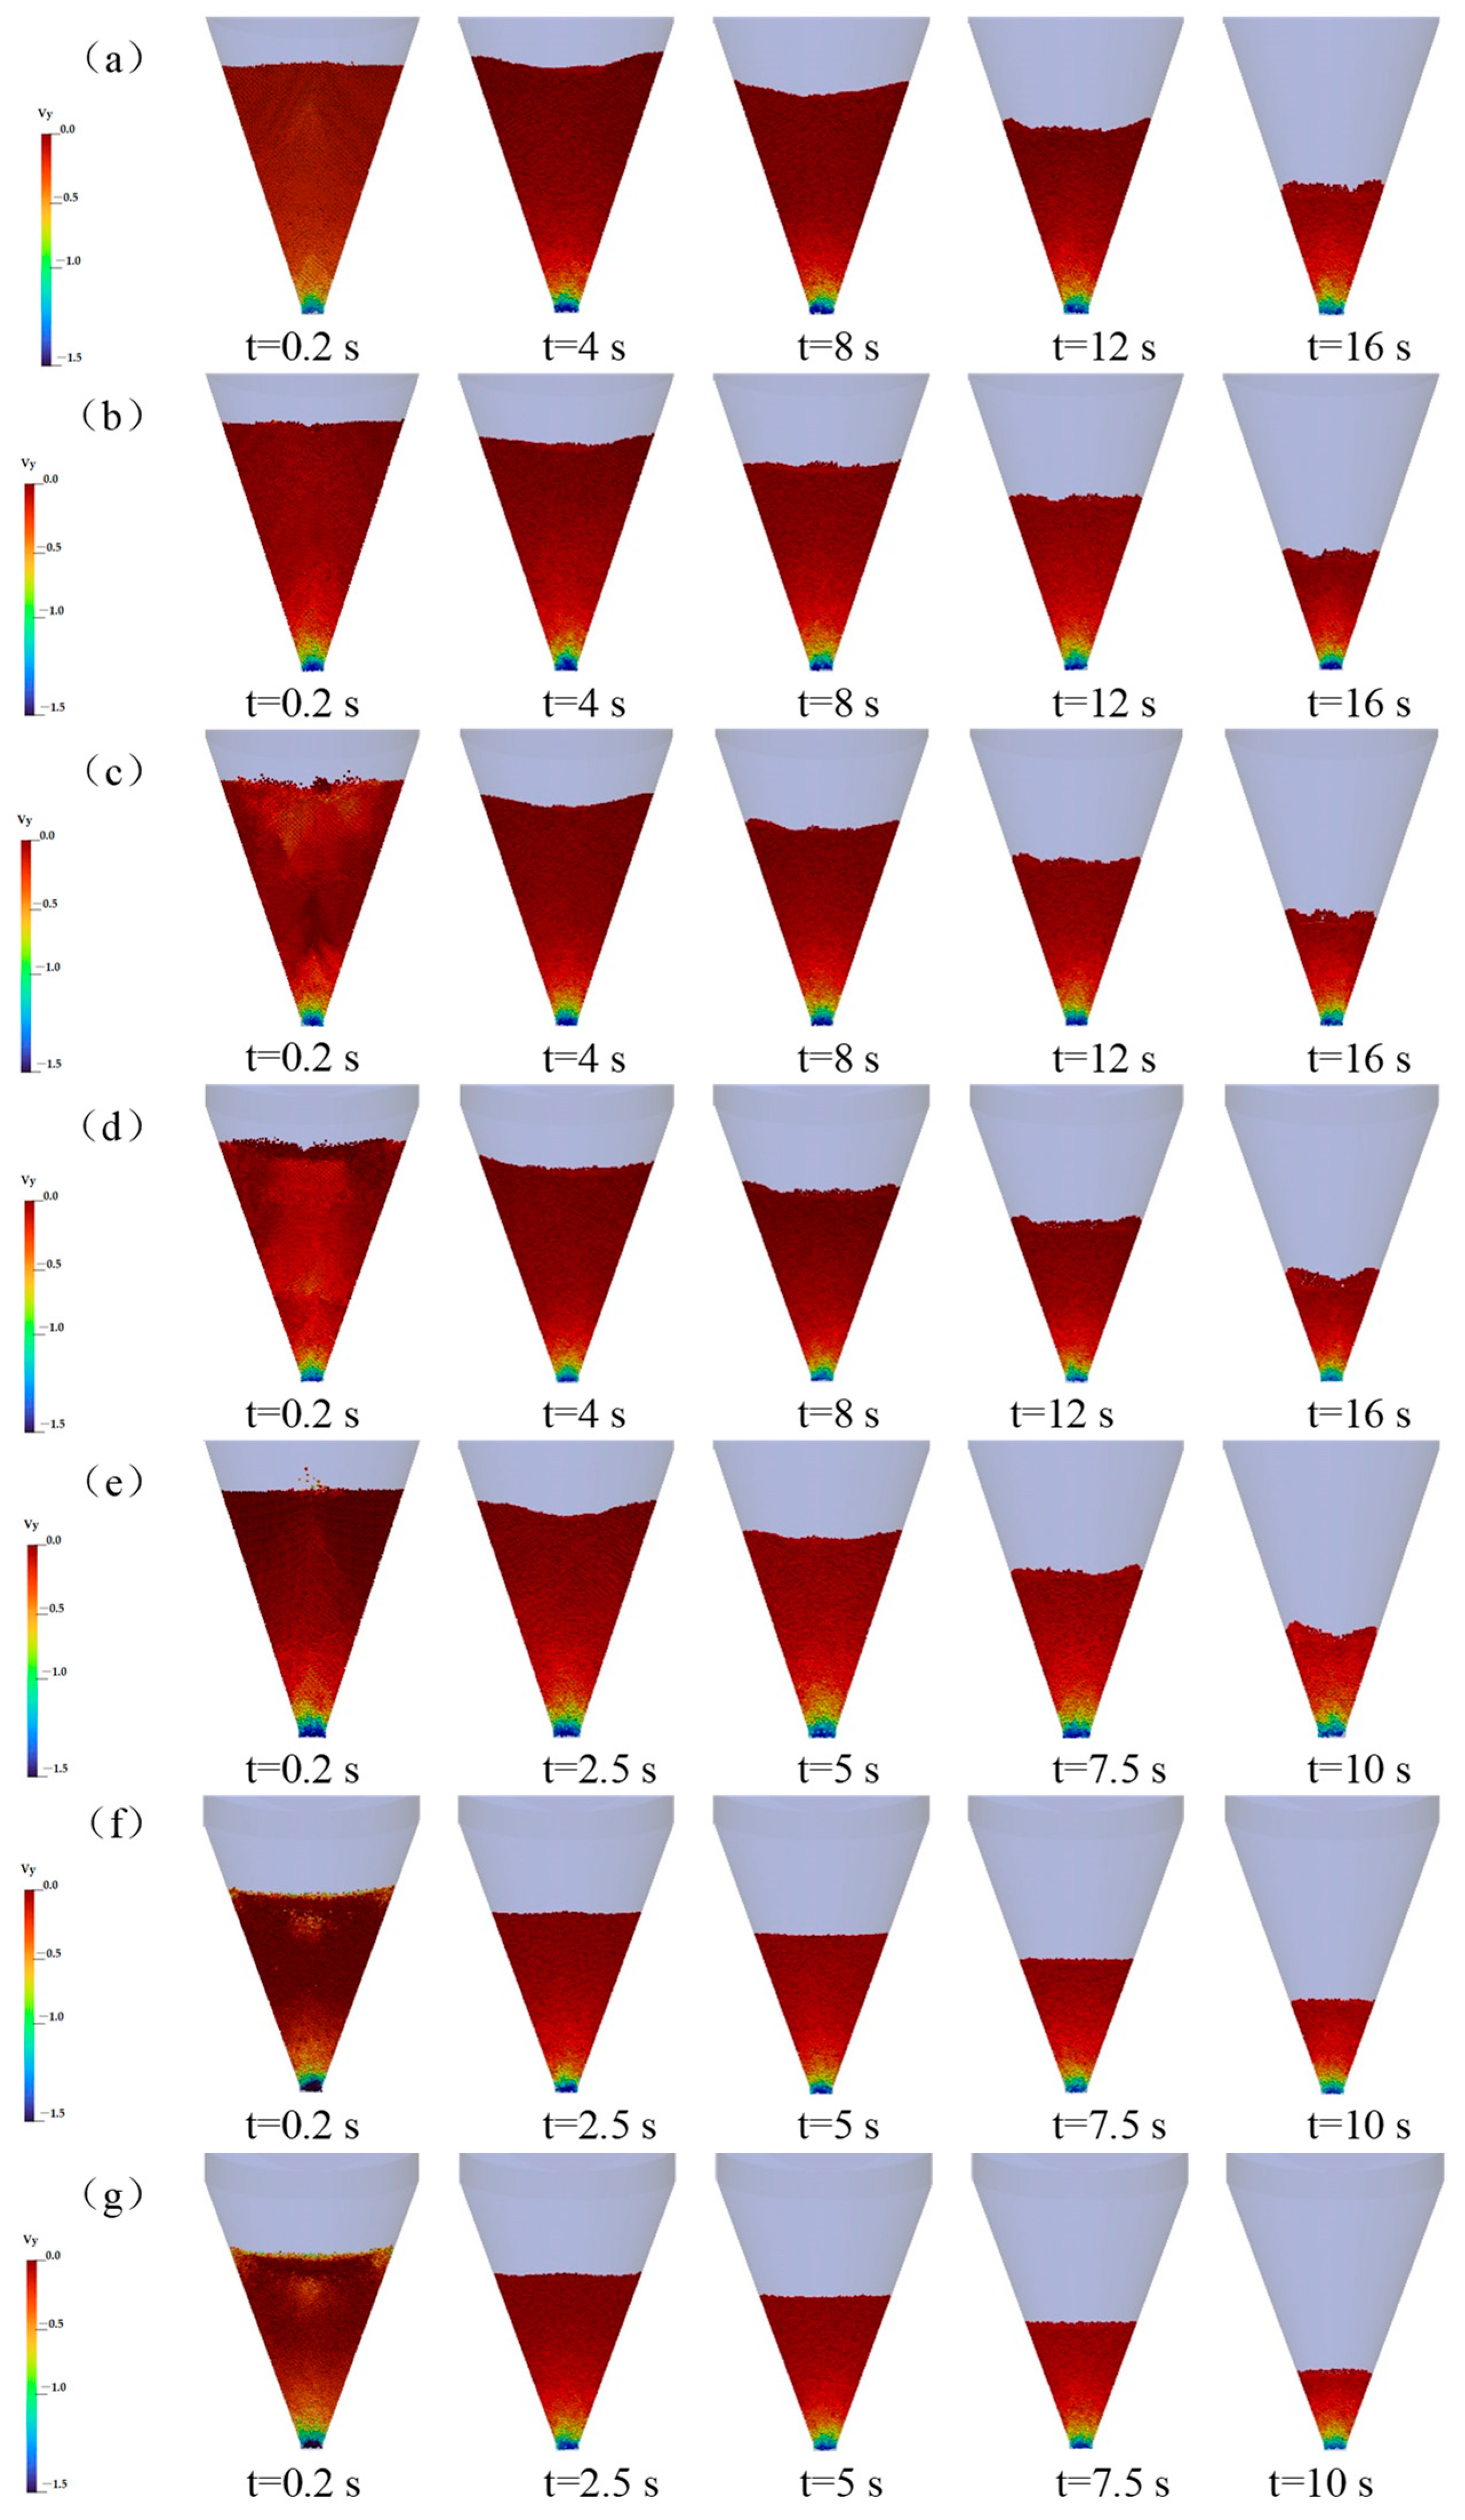
To visually demonstrate the flow characteristics within the particles, the study presents transient results of the discharge process via a central cross-section of the hopper. Under operating conditions α and γ, the discharge duration was approximately 16–18 s, whereas under condition β, with fewer particles, it was approximately 11 s. Consequently, five time points were selected for Groups α and γ: 0.2 s, 4 s, 8 s, 12 s, and 16 s. For Group β, five time points were chosen: 0.2 s, 2.5 s, 5 s, 7.5 s, and 10 s. The results are depicted in Figure 9. Figure 9 employs vertical velocity (VY) magnitude to color-code particles: bluer hues indicate greater descent velocity, while redder tones denote near-stationary motion. Overall, only particles near the outlet exhibit significant descent velocity, with particles in the upper-middle layers remaining largely stationary. This indicates discharge is primarily governed by the outlet region, revealing spatially non-uniform flow characteristics. Further observation reveals that after flow stabilization, particles exhibiting pronounced descent are predominantly concentrated in the axial region, whereas those near the wall surface move slowly. This velocity distribution pattern of “active axial flow and sluggish near-wall motion” aligns with prior research, indicating that under restricted outlet conditions, material preferentially forms a discharge channel along the axis, while particles near the wall predominantly remain stationary or undergo slow rearrangement. Consequently, the flow characteristics observed in this study more closely resemble the typical funnel flow pattern, wherein only localized particles participate in continuous discharge, with the remainder of the flow domain operating at low velocity or in a stationary state [38,39].
Figure 9.
Particle velocity distribution profiles (a) h = 1:4, discharge time t = 18.24 s; (b) h = 2:3, discharge time t = 18.22 s; (c) h = 3:2, discharge time t = 18.05 s; (d) h = 4:1, feeding time t = 17.91 s; (e) uniform distribution, feeding time t = 11.16 s; (f) linear distribution, feeding time t = 11.80 s; (g) normal distribution, feeding time t = 11.17 s.
3.4. Particle Velocity Distribution Across the Cross-Section
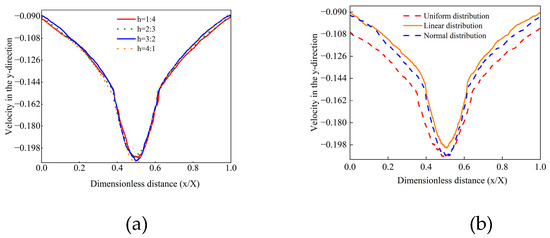
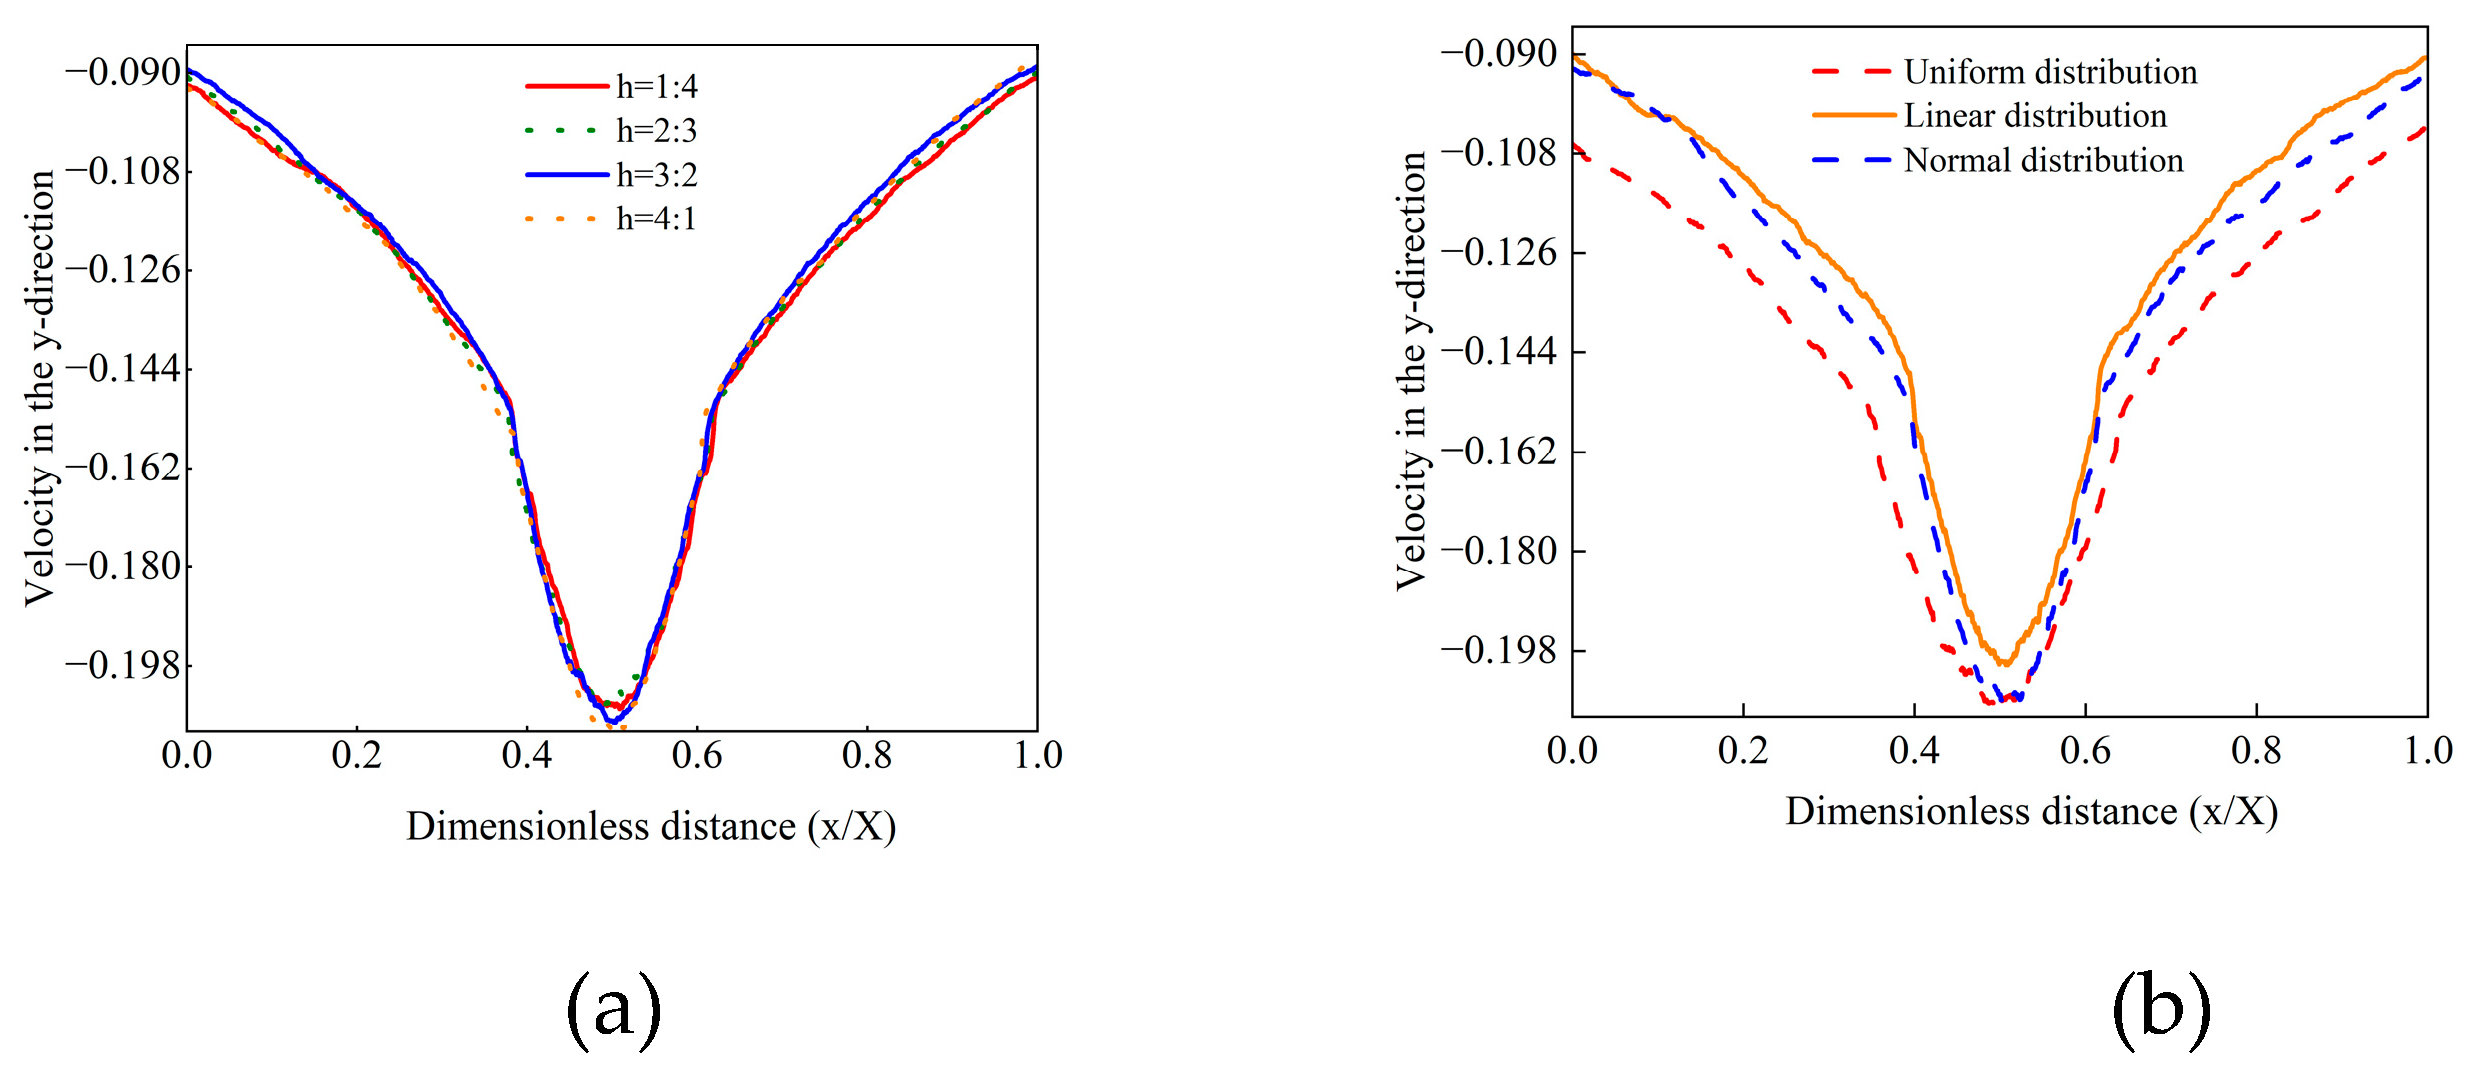
To analyze the flow characteristics of particles near the outlet, this study statistically examined the average longitudinal velocity distribution of particles throughout the entire discharge process at a cross-section located at a height H = 0.1 m from the outlet. Given that the axial scale of the conical hopper varies along its height, a dimensionless distance (x/X) was employed to facilitate a unified analysis of flow characteristics across hoppers of different dimensions. Here, X denotes the total axial distance of the hopper, while x represents the axial distance at a specific height measured from the hopper base. As illustrated in Figure 10, the velocity distribution curves exhibit a distinct V-shaped profile across all simulated operating conditions, with particle descent velocities significantly higher in the axial center region than in the wall regions. Specifically, under typical conditions, the velocity at the axis can exceed that at the wall surface by more than twofold. For instance, at a blending ratio of 4:1, the axial velocity reaches 0.210 m/s, whereas the wall velocity is merely 0.087 m/s. This further confirms that material preferentially forms a primary flow channel along the axis, exhibiting the characteristic flow pattern of a funnel flow. Variations in Indonesian coal blending ratios exert minimal influence on the overall velocity distribution profile. Although axial velocities exhibit slight increases with higher blending ratios, distribution curves across operating conditions remain nearly identical. Furthermore, the initial spatial distribution of particles significantly impacts velocity distribution: uniform distribution yields the highest average velocity, followed by normal distribution, with linear distribution producing the lowest values, demonstrating a consistent pattern of variation. Regarding the wall–particle retention rate. In the present study, a semi-quantitative assessment can be made by comparing the particle falling velocities. The results show that the average falling velocity of particles near the wall is approximately 54.5% lower than that in the central region, indicating that the ability of wall-adjacent particles to participate in effective discharge is significantly suppressed. From a kinematic perspective, a reduced falling velocity implies a markedly lower probability of particles passing through the outlet per unit time. It can therefore be reasonably inferred that the proportion of particles remaining in a stagnant or slowly rearranging state in the wall region is on the order of half that in the central region. This finding provides indirect evidence of the characteristic funnel-flow behavior during discharge, in which preferential flow occurs in the central zone while particle motion near the walls is substantially retarded.
Figure 10.
Average particle velocity at the cross-section at H = 0.1 m (a) For different blending ratios (b) For different particle size distributions.
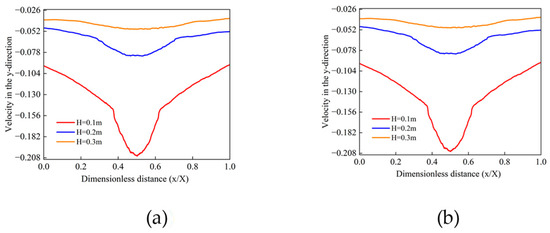
Subsequently, to analyze the variation patterns in particle motion characteristics at different height sections, the average fall velocity distribution across each section was statistically recorded throughout the entire discharge process at heights H = 0.1 m, 0.2 m, and 0.3 m from the outlet. Three representative operating conditions were selected: Group A (h = 1:4) and Group B (normal distribution). The results are presented in Figure 11. Across all conditions, the particle fall velocity at the centerline consistently exceeded that near the wall surface, consistent with previous findings. As the cross-sectional height increased, the velocity difference between the axis and the wall diminished significantly, with the velocity distribution curve gradually flattening. Specifically, across all operating conditions, the velocity at the axis was only approximately 30–40% higher than at the wall, contrasting sharply with the difference observed at the H = 0.1 m cross-section, where the axis velocity exceeded the wall velocity by more than double. These results indicate that particle motion near the outlet exhibits typical funnel flow characteristics, whereas at higher cross-sections, particles tend towards synchronous descent. The overall flow pattern lies between funnel flow and mass flow, demonstrating intermediate flow behavior. It should be noted that the prolonged absence of particles passing through the higher cross-sections after particle discharge may have partially reduced the statistical difference in average velocities between the axis and the wall. A distinct velocity depression remains observable at the H = 0.2 m cross-section, though it is less pronounced than at H = 0.1 m, with a broader range of velocity gradient variations.
Figure 11.
Average particle velocity at different height sections (a) Under h = 1:4 operating conditions (b) Normal distribution.
In the present study, a semi-quantitative assessment can be made based on a comparison of particle descending velocities. The results indicate that the average descending velocity of particles near the wall is approximately 54.5% lower than that in the central region, demonstrating that wall-adjacent particles are significantly inhibited from participating in effective discharge. From a dynamical perspective, the reduced descending velocity implies a markedly lower probability of particle passage per unit time; therefore, it is reasonable to infer that the proportion of particles in a retained or slowly rearranging state near the wall is on the order of one-half of that in the central region. This finding provides indirect evidence supporting the characteristic funnel flow behavior, in which discharge is dominated by central flow while particles near the wall exhibit pronounced lag.
3.5. Feed Rate
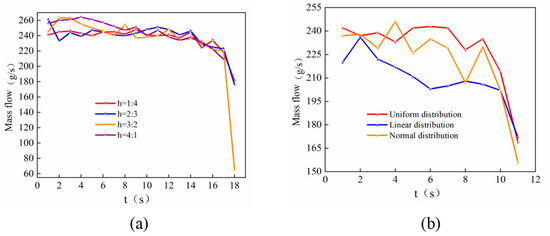
Figure 12 illustrates the temporal variation in mass flow rate during hopper discharge. In the initial discharge phase, the mass flow rate enters a relatively stable quasi-steady state. Subsequently, it gradually diminishes as the number of free-flowing particles decreases. During the quasi-steady state, mass flow rate fluctuations remain moderate without discernible periodic oscillations, indicating overall stability in the discharge process. Although the average mass flow rate exhibits variations under different operating conditions, the range of change remains limited. This indicates that, for a given hopper structure and discharge conditions, the system’s discharge capacity is primarily governed by the discharge conditions themselves. The parameter variations examined in this study—such as blending ratio and particle size distribution—exert a relatively minor influence.
Figure 12.
Mass Flow Rate (a) Different blending ratios (b) Different particle size distributions.
Combined with the preceding analysis of the velocity field, it is evident that although the region near the outlet exhibits pronounced funnel flow characteristics, this localized flow inhomogeneity does not significantly disrupt the stability of the macroscopic mass flow rate. This implies that no direct correspondence exists between the localized funnel flow structure and the overall mass transport capacity. The decay observed in the later stages of discharge is primarily attributable to material depletion and the reduction in the effective flow area, rather than being dominated by instantaneous flow pattern changes. In contrast to the findings reported by Anand et al., where a rectangular hopper exhibited a discharge behavior characterized by an initially high mass flow rate followed by a gradual decline, the conical hopper considered in the present study shows a markedly different trend [40]. Specifically, the mass flow rate during discharge remains relatively stable and maintains an approximately constant value throughout most of the unloading process. This difference can be primarily attributed to the geometric configuration of the hopper. In a conical hopper, the converging geometry facilitates a more continuous stress redistribution toward the outlet, which helps sustain a stable flow channel along the central axis. As a result, although funnel flow dominates the local flow pattern near the outlet, the global discharge rate is less sensitive to temporal variations in particle availability, leading to a more uniform mass flow rate compared with that observed in rectangular hoppers. Simulation results under different blending ratios (Table 2) show that the mean mass flow rate increases slightly with changes in the blending ratio, with an increase of approximately 3.7%, indicating that the ratio has a limited effect on throughput. The coefficient of variation (CV) for all conditions falls within the range of 5.08–7.58%, with the lowest CV (5.08%) observed at the 3:2 blending ratio, suggesting the most stable flow under this condition. Overall, under the simulated conditions where particle properties are similar, the blending ratio has a weak influence on flow stability, and the system exhibits good robustness across different ratios.
Table 2.
Mass flow rate stability analysis.
In summary, the observed mass flow rate variation indicates that, under the conditions of this study, the hopper discharge process exhibits good macroscopically stable behavior. Localized funnel flow characteristics primarily influence the spatial distribution of particle motion, exerting a limited impact on the overall discharge capacity. This conclusion provides a basis for distinguishing between localized flow patterns and overall transport performance.
4. Conclusions
Coal blending technology effectively reduces the requirement for stable coal quality in power plants, holding significant engineering value. This paper employs the coarse-grained discrete element method (CGP-DEM) to numerically simulate the flow characteristics of blended coal particles during hopper discharge. It systematically analyses the influence of coarse-grained mesh size, blending ratio, and particle size distribution on discharge behavior. The principal conclusions are as follows:
- (1)
- The discharge process exhibits a distinct funnel flow pattern in the vicinity of the outlet, where particles along the hopper axis descend significantly faster than those near the wall, accompanied by pronounced particle stagnation in the peripheral regions. With increasing distance from the outlet, the velocity difference between axial and wall regions gradually diminishes, indicating that funnel flow behavior is spatially localized rather than dominant throughout the entire hopper.
- (2)
- Among the investigated parameters, particle size distribution plays the most significant role in determining discharge dynamics. Uniformly distributed particles produce the highest discharge velocities, followed by normal distributions, while linear distributions result in the slowest flow. In contrast, variations in the blending ratio of different coal types exert only a minor influence on the overall discharge behavior, except for slight modifications in the axial velocity magnitude.
- (3)
- A sharp reduction in the overall discharge rate is consistently observed during the final stage of unloading. This phenomenon is not caused by insufficient particle supply at the outlet but instead results from a reduced particle bed height in the axial region combined with stagnant wall-adjacent particles, which limits upward momentum transfer and inter-particle collision excitation, thereby weakening particle mobility.
It should be emphasized that the present modeling approach is based on several key assumptions, including spherical particles, coarse-grained representation of particle assemblies, isotropic random packing, and contact interactions governed by frictional and rolling resistance laws. These assumptions enable efficient simulation of industrial-scale systems while preserving the dominant kinematic and dynamic features of granular discharge. Consequently, the conclusions drawn herein are most applicable to gravity-driven hopper flows under similar geometric and material conditions. Overall, this study demonstrates that CGP-DEM provides a computationally efficient yet physically representative tool for analyzing mixed-coal discharge behavior, offering valuable insights for the design and operation of coal handling systems in co-firing power plants.
Author Contributions
Conceptualization, Z.Z., T.C., D.L. and X.C.; methodology, Z.Z., T.C., Z.L. and Y.W.; software, Y.W. and K.D.; validation, X.Z. and H.L.; formal analysis, T.C. and Z.L.; investigation, X.Z., Z.L. and C.G.; resources, Z.Z., T.C., D.L. and X.C.; data curation, H.L. and C.G.; writing—original draft preparation, Z.Z., Z.L. and K.D.; writing—review and editing, Z.Z., Z.L. and K.D.; visualization, K.D. and Y.W.; supervision, T.C., D.L. and X.C.; project administration, Z.Z., T.C., X.Z., D.L. and X.C.; funding acquisition, D.L. All authors have read and agreed to the published version of the manuscript.
Funding
This research was funded by Research and Application Project on the One-Step Automatic Mixing System for the Entire Process, grant number S11330B42545 and Postgraduate Research & Practice Innovation Program of Jiangsu Province, grant number SJCX25_0728.
Data Availability Statement
Data are available on request from the authors.
Conflicts of Interest
Authors, namely Zhiyong Zhang, Tianxiao Chen, Xiao Zhang, Zhaoxi Liu, Yi Wang, Huaichen Li, and Chun Ge, were employed by the company of Datang Najing Powr Plant. The remaining authors declare that the research was conducted in the absence of any commercial or financial relationships that could be construed as a potential conflict of interest.
References
- Cai, Y.; Zhang, P.; Liang, J.; Wang, Q.; Ding, Y. Power production waste. Water Environ. Res. 2020, 92, 1711–1716. [Google Scholar] [CrossRef] [Scilit] [PubMed]
- Ben Khaled, M.W.; Ouertani Abaoub, N. Energy Sector Evolution: Perspectives on Energy Platforms and Energy Transition. Platforms 2024, 2, 68–83. [Google Scholar] [CrossRef] [Scilit]
- Kumar, A.; Tiwari, A.K. Solar-assisted post-combustion carbon-capturing system retrofitted with coal-fired power plant towards net-zero future: A review. J. CO2 Util. 2022, 65, 102241. [Google Scholar] [CrossRef] [Scilit]
- Vig, N.; Ravindra, K.; Mor, S. Environmental impacts of Indian coal thermal power plants and associated human health risk to the nearby residential communities: A potential review. Chemosphere 2023, 341, 140103. [Google Scholar] [CrossRef] [Scilit] [PubMed]
- Janda, A.; Zuriguel, I.; Garcimartín, A.; Pugnaloni, L.A.; Maza, D. Jamming and critical outlet size in the discharge of a two-dimensional silo. Europhys. Lett. 2008, 84, 44002. [Google Scholar] [CrossRef] [Scilit]
- Zhang, T.F.; Gan, J.Q.; Yu, A.B.; Pinson, D.; Zhou, Z.Y. Segregation of granular binary mixtures with large particle size ratios during hopper discharging process. Powder Technol. 2020, 361, 435–445. [Google Scholar] [CrossRef] [Scilit]
- Shinohara, K.; Golman, B.; Nakata, T. Size segregation of multicomponent particles during the filling of a hopper. Adv. Powder Technol. 2001, 12, 33–43. [Google Scholar] [CrossRef] [Scilit]
- Hung, C.Y.; Aussillous, P.; Capart, H. Granular surface avalanching induced by drainage from a narrow silo. J. Fluid Mech. 2018, 856, 444–469. [Google Scholar] [CrossRef] [Scilit]
- Jappert, S.E.; Puccini, G.D. Discrete element method simulations of pearl urea discharge in an asymmetric industrial hopper with insert. Part. Sci. Technol. 2026, 44, 255–264. [Google Scholar] [CrossRef] [Scilit]
- Zhang, D.; Dong, S.; Guo, H.; Yang, X.; Cui, L.; Liu, X. Flow behavior of granular material during funnel and mixed flow discharges: A comparative analysis. Powder Technol. 2022, 396, 127–138. [Google Scholar] [CrossRef] [Scilit]
- Watson, G.R.; Rotter, J.M. A finite element kinematic analysis of planar granular solids flow. Chem. Eng. Sci. 1996, 51, 3967–3978. [Google Scholar] [CrossRef] [Scilit]
- Liu, Y.; Lu, H.; Guo, X.; Sun, X.; Zhao, W. An investigation of the effect of particle size on discharge behavior of pulverized coal. Powder Technol. 2015, 284, 47–56. [Google Scholar] [CrossRef] [Scilit]
- Zhao, Y.; Cocco, R.A.; Yang, S.; Chew, J.W. DEM Study on the effect of particle-size distribution on jamming in a 3D conical hopper. AIChE J. 2019, 65, 512–519. [Google Scholar] [CrossRef] [Scilit]
- Lu, H.; Guo, X.; Jin, Y.; Gong, X. Effect of moisture on flowability of pulverized coal. Chem. Eng. Res. Des. 2018, 133, 326–334. [Google Scholar] [CrossRef] [Scilit]
- Dai, L.; Yuan, Z.; Guan, L.; Gu, C. Discharge and mixing of moisture coal particles in silos. Energy Sources Part A Recovery Util. Environ. Eff. 2024, 46, 15537–15552. [Google Scholar]
- Dai, L.; Yuan, Z.; Guan, L.; Gu, C. Investigation of wet coal flow characteristics in silos by experiments and simulations. Asia-Pac. J. Chem. Eng. 2021, 16, E2618. [Google Scholar] [CrossRef] [Scilit]
- López-Rodríguez, D.; Gella, D.; To, K.; Maza, D.; Garcimartin, A.; Zuriguel, I. Effect of hopper angle on granular clogging. Phys. Rev. E 2019, 99, 032901. [Google Scholar] [CrossRef] [Scilit]
- Albaraki, S.; Antony, S.J. How does internal angle of hoppers affect granular flow? Experimental studies using digital particle image velocimetry. Powder Technol. 2014, 268, 253–260. [Google Scholar] [CrossRef] [Scilit]
- Liu, H.; Jia, F.; Xiao, Y.; Han, Y.; Li, G.; Li, A.; Bai, S. Numerical analysis of the effect of the contraction rate of the curved hopper on flow characteristics of the silo discharge. Powder Technol. 2019, 356, 858–870. [Google Scholar] [CrossRef] [Scilit]
- Guo, C.; Ye, K.; Xu, Y.; Dai, X.; Zheng, J.; Ya, M. Discharge characteristics of conical and hyperbolic hoppers based on discharge time distribution. Powder Technol. 2023, 426, 118665. [Google Scholar] [CrossRef] [Scilit]
- Jian, B.; Gao, X. Investigation of spherical and non-spherical binary particles flow characteristics in a discharge hopper. Adv. Powder Technol. 2023, 34, 104011. [Google Scholar] [CrossRef] [Scilit]
- Zhu, H.P.; Zhou, Z.Y.; Yang, R.Y.; Yu, A.B. Discrete particle simulation of particulate systems: Theoretical developments. Chem. Eng. Sci. 2007, 62, 3378–3396. [Google Scholar] [CrossRef] [Scilit]
- Amjad, W.; Chen, Z.; Ambrose, K. Design assessment of grain inverters in cross-flow grain dryer via CFD-DEM numerical simulation. Biosyst. Eng. 2024, 239, 147–157. [Google Scholar] [CrossRef] [Scilit]
- Liu, Z.; Ma, H.; Zhao, Y. CFD-DEM Simulation of Fluidization of Polyhedral Particles in a Fluidized Bed. Energies 2021, 14, 4939. [Google Scholar] [CrossRef] [Scilit]
- Zhao, Y.; Chew, J.W. Discrete element method study on hopper discharge behaviors of binary mixtures of nonspherical particles. AIChE J. 2020, 66, E16254. [Google Scholar] [CrossRef] [Scilit]
- Zhao, Y.; Yang, S.; Zhang, L.; Chew, J.W. Understanding the varying discharge rates of lognormal particle size distributions from a hopper using the Discrete Element Method. Powder Technol. 2019, 342, 356–370. [Google Scholar] [CrossRef] [Scilit]
- Zhao, Y.; Chew, J.W. Effect of lognormal particle size distributions of non-spherical particles on hopper discharge characteristics. Chem. Eng. Res. Des. 2020, 163, 230–240. [Google Scholar] [CrossRef] [Scilit]
- Guo, C.; Ya, M.; Xu, Y.; Zheng, J. Comparison on discharge characteristics of conical and hyperbolic hoppers based on finite element method. Powder Technol. 2021, 394, 300–311. [Google Scholar] [CrossRef] [Scilit]
- Song, Y.; Zhou, T.; Bai, R.; Zhang, M.; Yang, H. Review of CFD-DEM Modeling of Wet Fluidized Bed Granulation and Coating Processes. Processes 2023, 11, 382. [Google Scholar] [CrossRef] [Scilit]
- Yuan, J.; Jin, C.; Ye, F.; Hu, Z.; Chen, H. Dust Suppression Analysis of a New Spiral Hopper Using CFD-DEM Simulations and Experiments. Processes 2020, 8, 783. [Google Scholar] [CrossRef] [Scilit]
- Lin, J.; Luo, K.; Wang, S.; Hu, C.; Fan, J. An augmented coarse-grained CFD-DEM approach for simulation of fluidized beds. Adv. Powder Technol. 2020, 31, 4420–4427. [Google Scholar] [CrossRef] [Scilit]
- Kieckhefen, P.; Pietsch, S.; Dosta, M.; Heinrich, S. Possibilities and Limits of Computational Fluid Dynamics–Discrete Element Method Simulations in Process Engineering: A Review of Recent Advancements and Future Trends. Annu. Rev. Chem. Biomol. Eng. 2020, 11, 397–422. [Google Scholar] [CrossRef] [Scilit]
- Wang, S.; Shen, Y. Coarse-grained CFD-DEM modelling of dense gas-solid reacting flow. Int. J. Heat Mass Transf. 2022, 184, 122302. [Google Scholar] [CrossRef] [Scilit]
- Sakai, M.; Koshizuka, S. Large-scale discrete element modeling in pneumatic conveying. Chem. Eng. Sci. 2009, 64, 533–539. [Google Scholar] [CrossRef] [Scilit]
- Fan, T.; Liu, M.; Ma, H.; Liu, B.; Shao, Y.; Zhao, Y. Investigation of the vibrating feeding system for sphericity separation of coated fuel particles using DEM. Powder Technol. 2021, 383, 131–142. [Google Scholar] [CrossRef] [Scilit]
- Wang, S.; Luo, K.; Fan, J. CFD-DEM coupled with thermochemical sub-models for biomass gasification: Validation and sensitivity analysis. Chem. Eng. Sci. 2020, 217, 115550. [Google Scholar] [CrossRef] [Scilit]
- Wang, S.; Shen, Y. CFD-DEM modelling of dense gas-solid reacting flow: Recent advances and challenges. Prog. Energy Combust. Sci. 2025, 109, 101221. [Google Scholar] [CrossRef] [Scilit]
- Dantoin, B.; Hossfeld, R.J.; McAtee, K.R. Converting from funnel flow to mass flow. Power 2003, 147, 61–64. [Google Scholar]
- Zhu, D.; Ji, X.; Huo, Y.; Wang, Z.; Yu, B.; Wang, D. Numerical investigation of particles flow pattern and pressure distribution of coal bunker. J. Geophys. Eng. 2023, 20, 841–853. [Google Scholar] [CrossRef] [Scilit]
- Anand, A.; Curtis, J.S.; Wassgren, C.R.; Hancock, B.C. Predicting discharge dynamics from a rectangular hopper using the discrete element method (DEM). Chem. Eng. Sci. 2008, 63, 5821–5830. [Google Scholar] [CrossRef] [Scilit]

Disclaimer/Publisher’s Note: The statements, opinions and data contained in all publications are solely those of the individual author(s) and contributor(s) and not of MDPI and/or the editor(s). MDPI and/or the editor(s) disclaim responsibility for any injury to people or property resulting from any ideas, methods, instructions or products referred to in the content. |
© 2026 by the authors. Licensee MDPI, Basel, Switzerland. This article is an open access article distributed under the terms and conditions of the Creative Commons Attribution (CC BY) license.