


Abstract
Deep coalbed methane (CBM) is not only an important alternative resource but also plays a crucial role in ensuring energy security and optimizing energy structure in China. However, with the progress of exploration, the gas adsorption characteristics and heterogeneity of the coal reservoirs’ pore structure have become critical factors influencing the enhancement of CBM production capacity. This study investigates the micropore structure and fractal characteristics of medium-to-high rank coal samples from deep coal seams in the Benxi Formation, Ordos Basin. The primary objective is to examine the impact of thermal maturity on the evolution of micropore structures and their effect on methane adsorption. A series of coal samples with varying thermal maturities were analyzed using CO2 adsorption. The results reveal that thermal maturity leads to a decrease in both specific surface area and pore volume, attributed to the collapse and compaction of pre-existing pores. Despite this, new micropores are formed at higher coal ranks, although their development is insufficient to fully offset the loss of pore volume. Fractal analysis demonstrates that thermal maturity reduces surface heterogeneity, rendering micropore structures more irregular and complex. These findings indicate that thermal maturation significantly influences the evolution of the pore structure, which, in turn, affects methane storage potential in deep coal seams.
1. Introduction
Deep coalbed methane (CBM), as an important, unconventional natural gas resource, has attracted widespread attention in China’s energy sector in recent years. Significant progress has been made in the exploration and development of deep CBM, particularly on the eastern edge of the Ordos Basin, driving the full release of the region’s CBM resource potential [1,2,3]. Deep CBM is mainly found in coal seams buried at depths exceeding 1500 m. With continuous advancements in exploration technology, the recoverable reserves and production capacity of CBM have shown a gradual upward trend [4,5,6]. In 2023, the Shenfu area on the eastern edge of the Ordos Basin achieved a major breakthrough in deep CBM exploration, with proven geological reserves surpassing 100 billion cubic meters, providing new momentum for the development and utilization of China’s CBM resources [7,8,9]. This progress indicates that deep CBM is not only an important direction for resource substitution but will also play a key role in ensuring China’s energy security and optimizing its energy structure. However, as exploration efforts deepen, the production differences between different coal reservoirs in the exploration area have gradually become apparent, particularly the heterogeneity of gas adsorption properties and pore structures in medium- to high-rank coal seams, which has become a critical factor affecting production improvement [10,11,12,13].
Current techniques for characterizing micropore structures predominantly rely on carbon dioxide (CO2) adsorption, complemented by low-temperature nitrogen adsorption and high-pressure mercury intrusion experiments to construct a full-scale pore size distribution [14,15,16,17]. Since the compatibility between the micropore scale and the molecular kinetic diameter of methane, CO2 adsorption experiments offer irreplaceable advantages in characterizing slit- and wedge-shaped micropores in the 0.3–1.5 nm range [11,18,19]. Zhang et al. (2022) conducted CO2 adsorption experiments, revealing that as CO2 pressure increased from 2.3 to 5.5 MPa, coal samples exhibited significant strain, with vertical laminae deformation consistently greater than parallel laminae deformation, highlighting the internal expansion pattern of coal during adsorption [20]. Zhang et al. (2025) found that tectonic deformation significantly increases pore volume and surface area in coal, with micropores (0.5–0.9 nm) contributing most to these changes [21]. Su et al. (2025) used CO2 adsorption experiments to demonstrate that temperature affects methane adsorption by altering molecular kinetic energy, with a decline in adsorption capacity at higher temperatures, particularly in pores larger than 0.76 nm, while methane is primarily adsorbed in micropores (0.38–1.5 nm) [22]. Zhang et al. (2024) investigated the multi-fractal characteristics of coal pore structures during coalification, revealing that CO2 adsorption experiments showed increased homogeneity and improved pore connectivity in medium-to-high rank coal, with micro-pores exhibiting stronger heterogeneity and poorer connectivity compared to macro- and meso-pores [23].
Although the aforementioned studies have advanced the understanding of the micropore structure in coal rocks, there remains a lack of systematic research on the thermodynamic mechanisms governing the evolution of micropore structures in deep medium- to high-rank coal reservoirs and their impact on methane adsorption capacity. The scientific challenges that need to be addressed are twofold: first, there is no systematic, quantitative characterization method for the heterogeneity of micropore distribution in deep coal reservoirs; and second, the affect mechanisms of thermal maturity on the formation and evolution of micropore structures remain unclear.
Therefore, the study focuses on the Benxi Formation medium- to high-rank coal reservoirs in the eastern margin of the Ordos Basin, systematically collecting a series of coal samples with varying degrees of thermal alteration. Using single-fractal and multi-fractal theories, the fractal nature and heterogeneous characteristics of microporous structures were studied, and the impact of thermal maturity on pore structure heterogeneity was investigated, aiming to provide a theoretical basis for geological prediction of ‘sweet spot’ zones in deep coalbed methane.
2. Experimental Methods
2.1. Geological Setting and Sample Collection
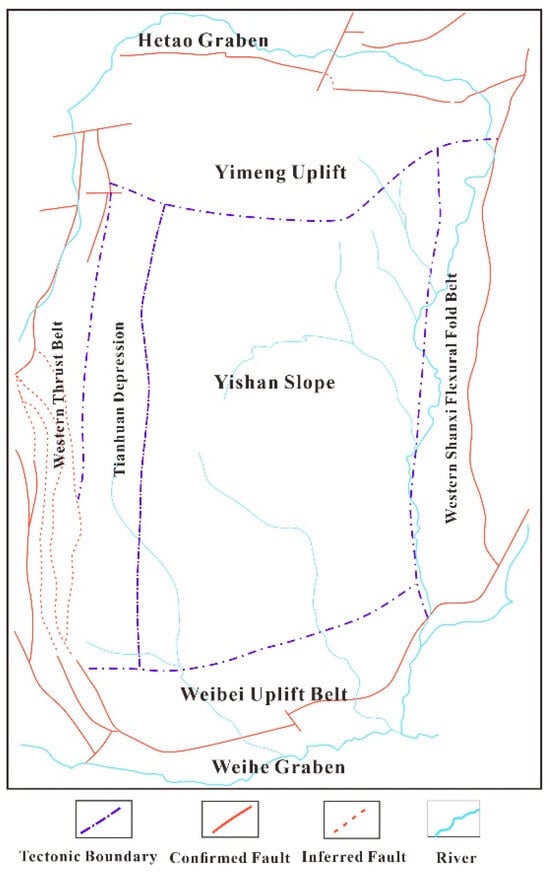
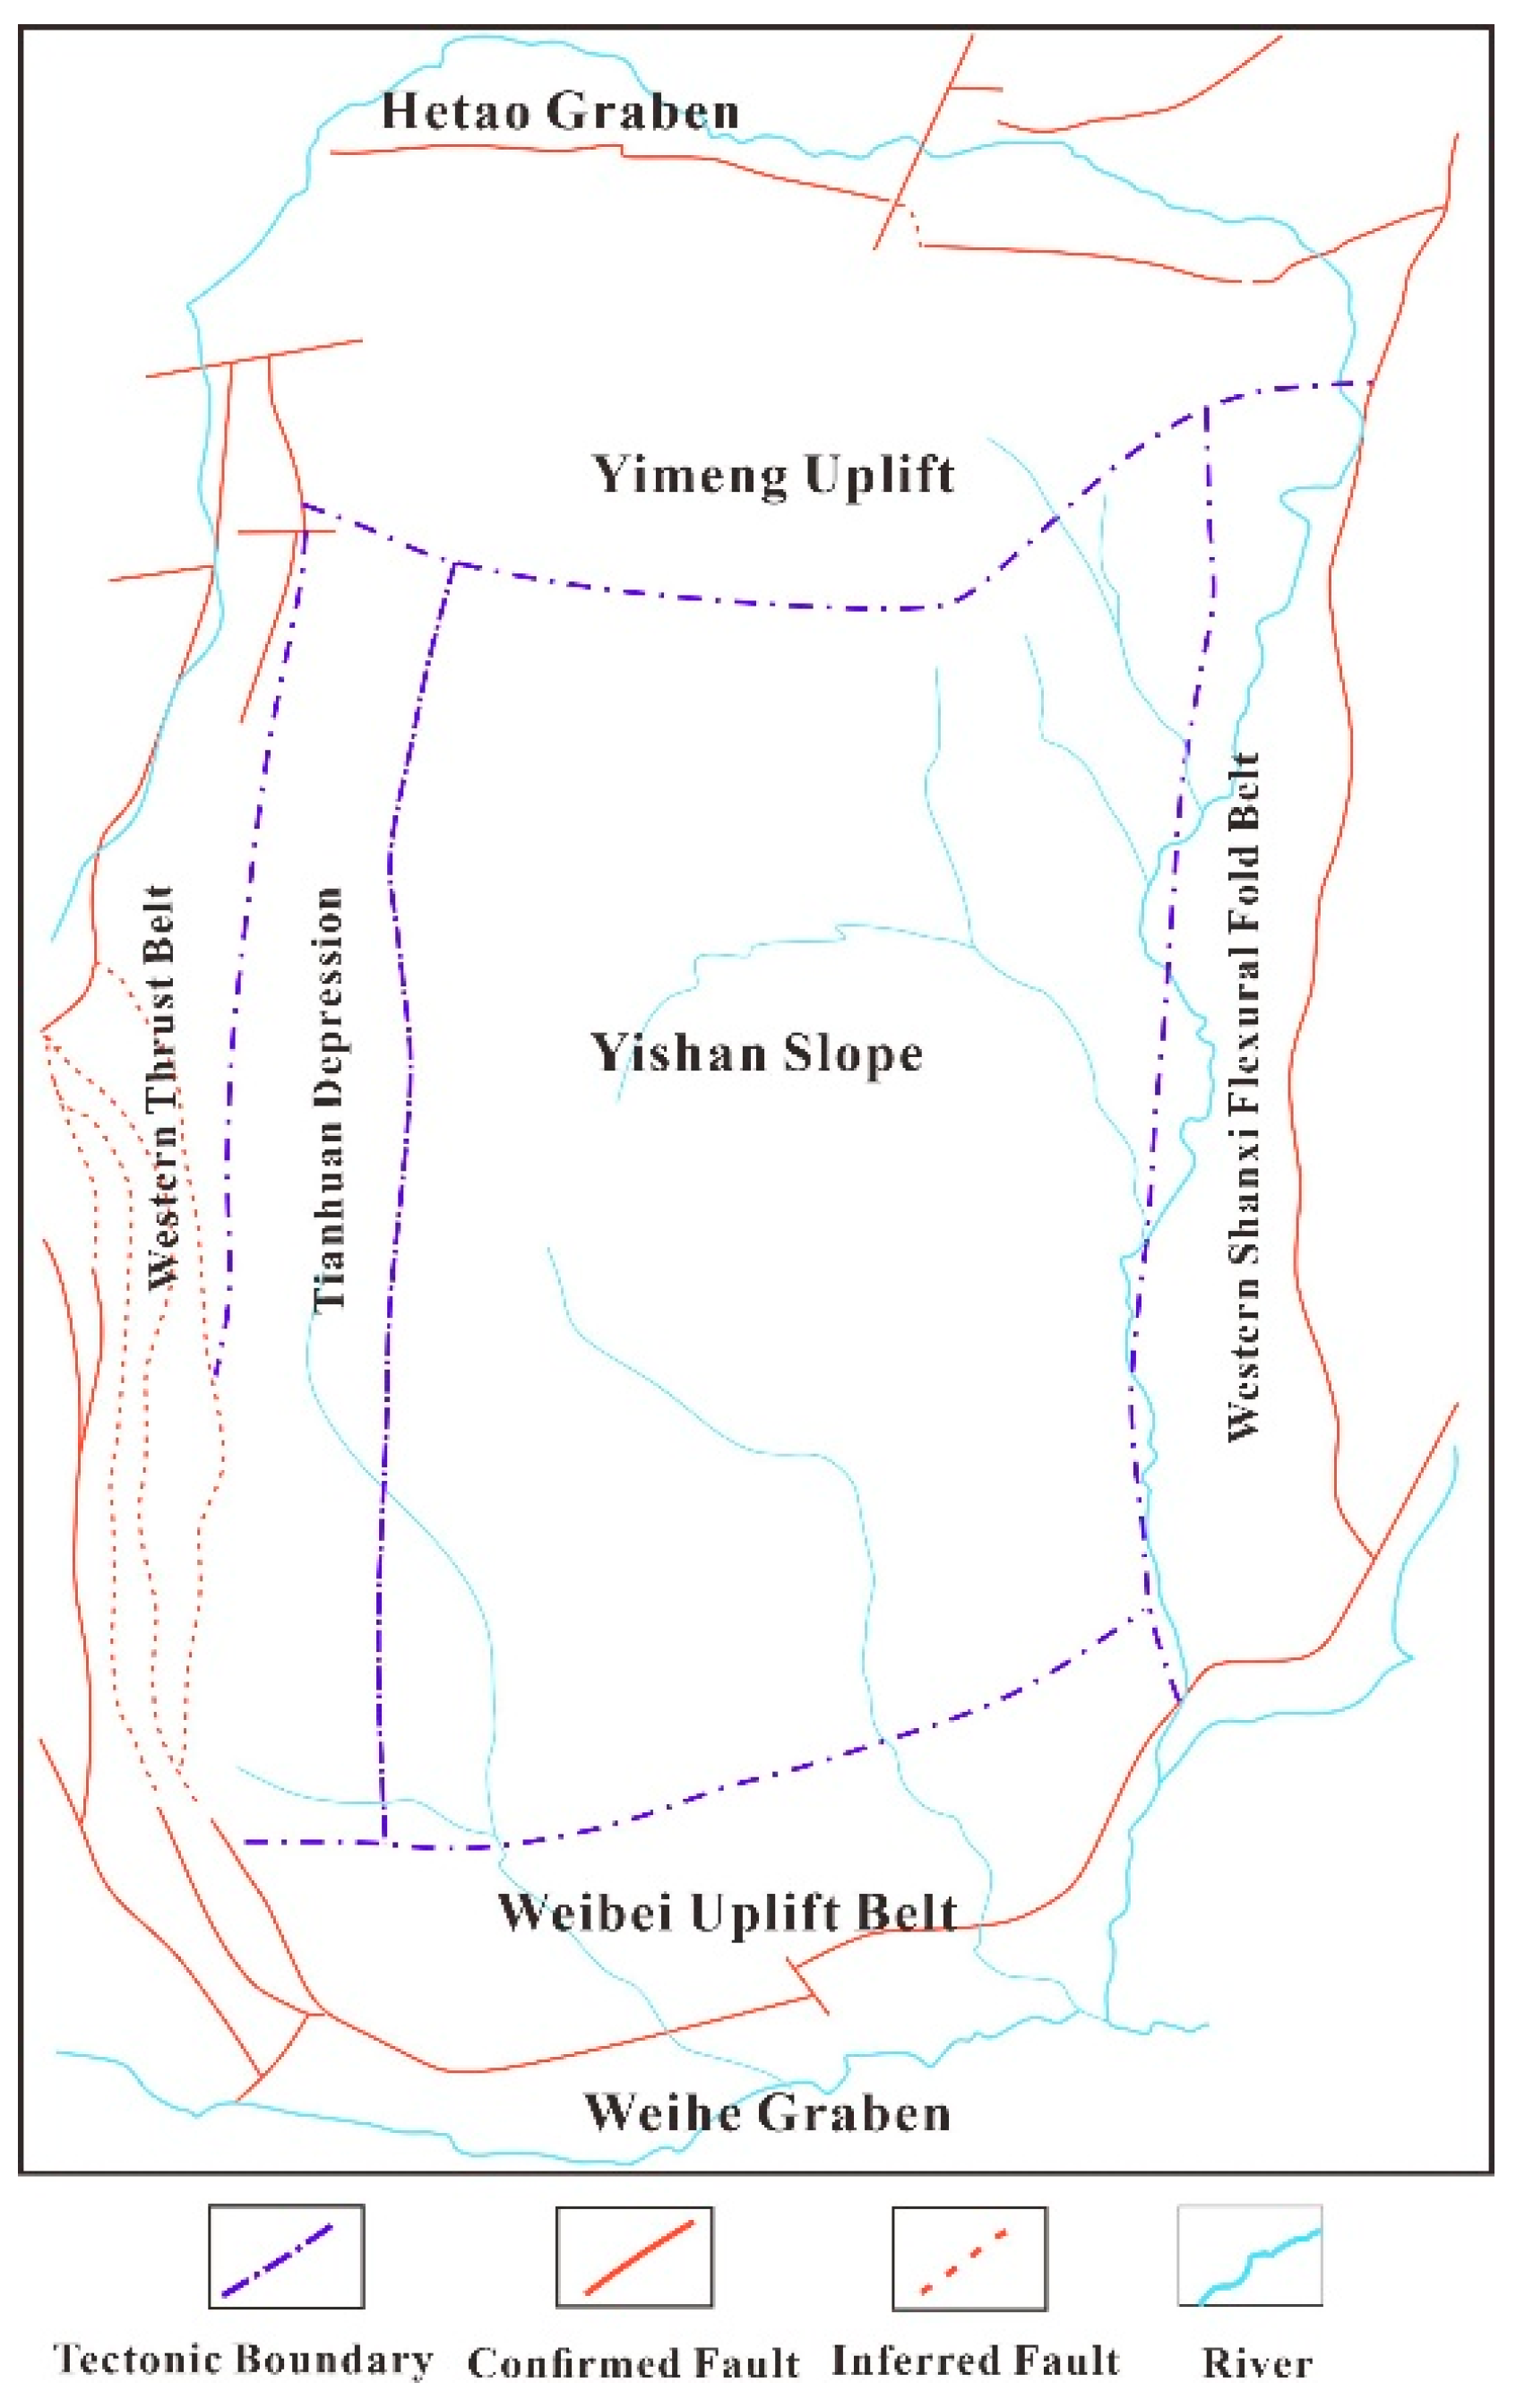
The eastern margin of the Ordos Basin, located in the northwest of China, spans from the Zhunhua region in Inner Mongolia to Hancheng in Shaanxi, bordered by the central slope of the basin to the west and the Lüliang uplift to the east. This area includes several key exploration blocks, such as Danning–Jixian, Baode, Hancheng, Daniu, and Nalinhe, where CBM exploration and development are particularly prominent. The focus of CBM exploration is deep coal seams (depth >2000 m, mainly concentrated below 3000 m) in this region [24]. The area is characterized by stable subsidence, with a complete sedimentary cover from the Paleozoic to Mesozoic, providing an ideal foundation for CBM accumulation. The Carboniferous to Permian sedimentary sequences form the primary coal-bearing strata, which evolved from marine-continental transitional facies to terrestrial facies, facilitating the widespread distribution of coal-bearing formations. Tectonic movements during the Indosinian and Yanshanian orogenies shaped the “high-east, low-west” monocline structure, with weak deep structural activities and low fault development, creating favorable conditions for CBM migration and preservation [25]. The key coal-bearing formations in the study area include the Carboniferous Benxi Formation, the Permian Taiyuan Formation, and the Shanxi Formation. Among them, coal seam 8 of the Benxi Formation stands out attribute to its strong lateral continuity and stability, with burial depths ranging from 3133 to 3319 m, an average depth of 3295 m, and stable thickness without significant thinning (Figure 1). These coal seams are divided as medium- to high-rank coal, with low ash content and strong methane adsorption capacity. The micro- and mesopore systems within these seams provide ideal spaces for effective methane storage [26].
Figure 1.
Location of the Study Area and Regional Structural Outline.
2.2. Experimental Method and Theory
All coal samples were processed and analyzed according to the relevant national standards. The sample pretreatment followed the procedures outlined in GB/T 19222-2003 [27], while macroscopic coal lithotype classification was conducted based on GB/T 18023-2000 [28]. Microscopic maceral analysis was performed in accordance with GB/T 6948-1998 [29], and proximate analysis adhered to the method specified in GB/T 212-2001 [30].
The nanopore structure of the coal samples was characterized using CO2 gas adsorption methods. Low-pressure nitrogen adsorption was conducted at 77 K, and low-pressure CO2 adsorption was performed at 273 K under vacuum conditions using a Quantachrome Autosorb-1 instrument. The specific surface area (SSA) of pores in the 2–100 nm range was determined using the Brunauer-Emmett-Teller (BET) method. Pore size distribution (PSD) and pore volume were derived using density functional theory (DFT) based on adsorption-desorption data.
To gain further insight into the complexity of the coal’s pore structure, fractal analysis was employed. The Frenkel-Halsey-Hill (FHH) model was used to estimate the fractal dimension of nanopores within the 2~100 nm range. The model is expressed as:
where represents the equilibrium pressure (MPa), is the nitrogen saturation pressure (MPa), is the volume of nitrogen adsorbed at equilibrium pressure (cm3/g), is the monolayer coverage volume (cm3/g), is a constant, and is the power-law exponent, which is related to the fractal dimension () and the adsorption mechanism. The relationship between the volume fractal dimension () and the exponent can be expressed as (D = 3A + 3/D = A + 3) for the relevant adsorption phases [27,31].
To characterize the surface heterogeneity of micropores, the surface fractal dimension () was determined using the following relationship:
where is the total specific surface area, is the pore radius (nm), and is the slope of the lnS/lnr curve. The surface fractal dimension can be estimated using the expressions Ds = 2 + C or Ds = (C − 3)/3, providing an effective quantification of the geometric heterogeneity and irregularity of the coal’s surface.
The advantage of this fractal model is that it can describe structures with self similarity or statistical self similarity. The pores and fractures of coal reservoirs often exhibit a certain degree of scale invariance at multiple scales, such as nanometer micrometer millimeter, such as the linear relationship between ln (V) and ln (r) or ln (P) in mercury intrusion and low-temperature nitrogen adsorption data. This model is particularly suitable for characterizing such multi-scale, heterogeneous pore fracture networks.
3. Results and Discussion
3.1. Sample Classification and Basic Parameters
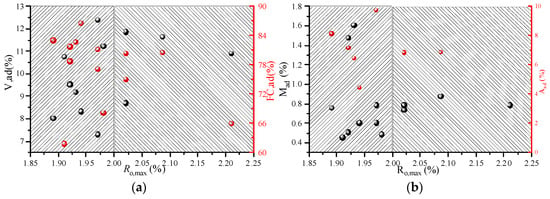
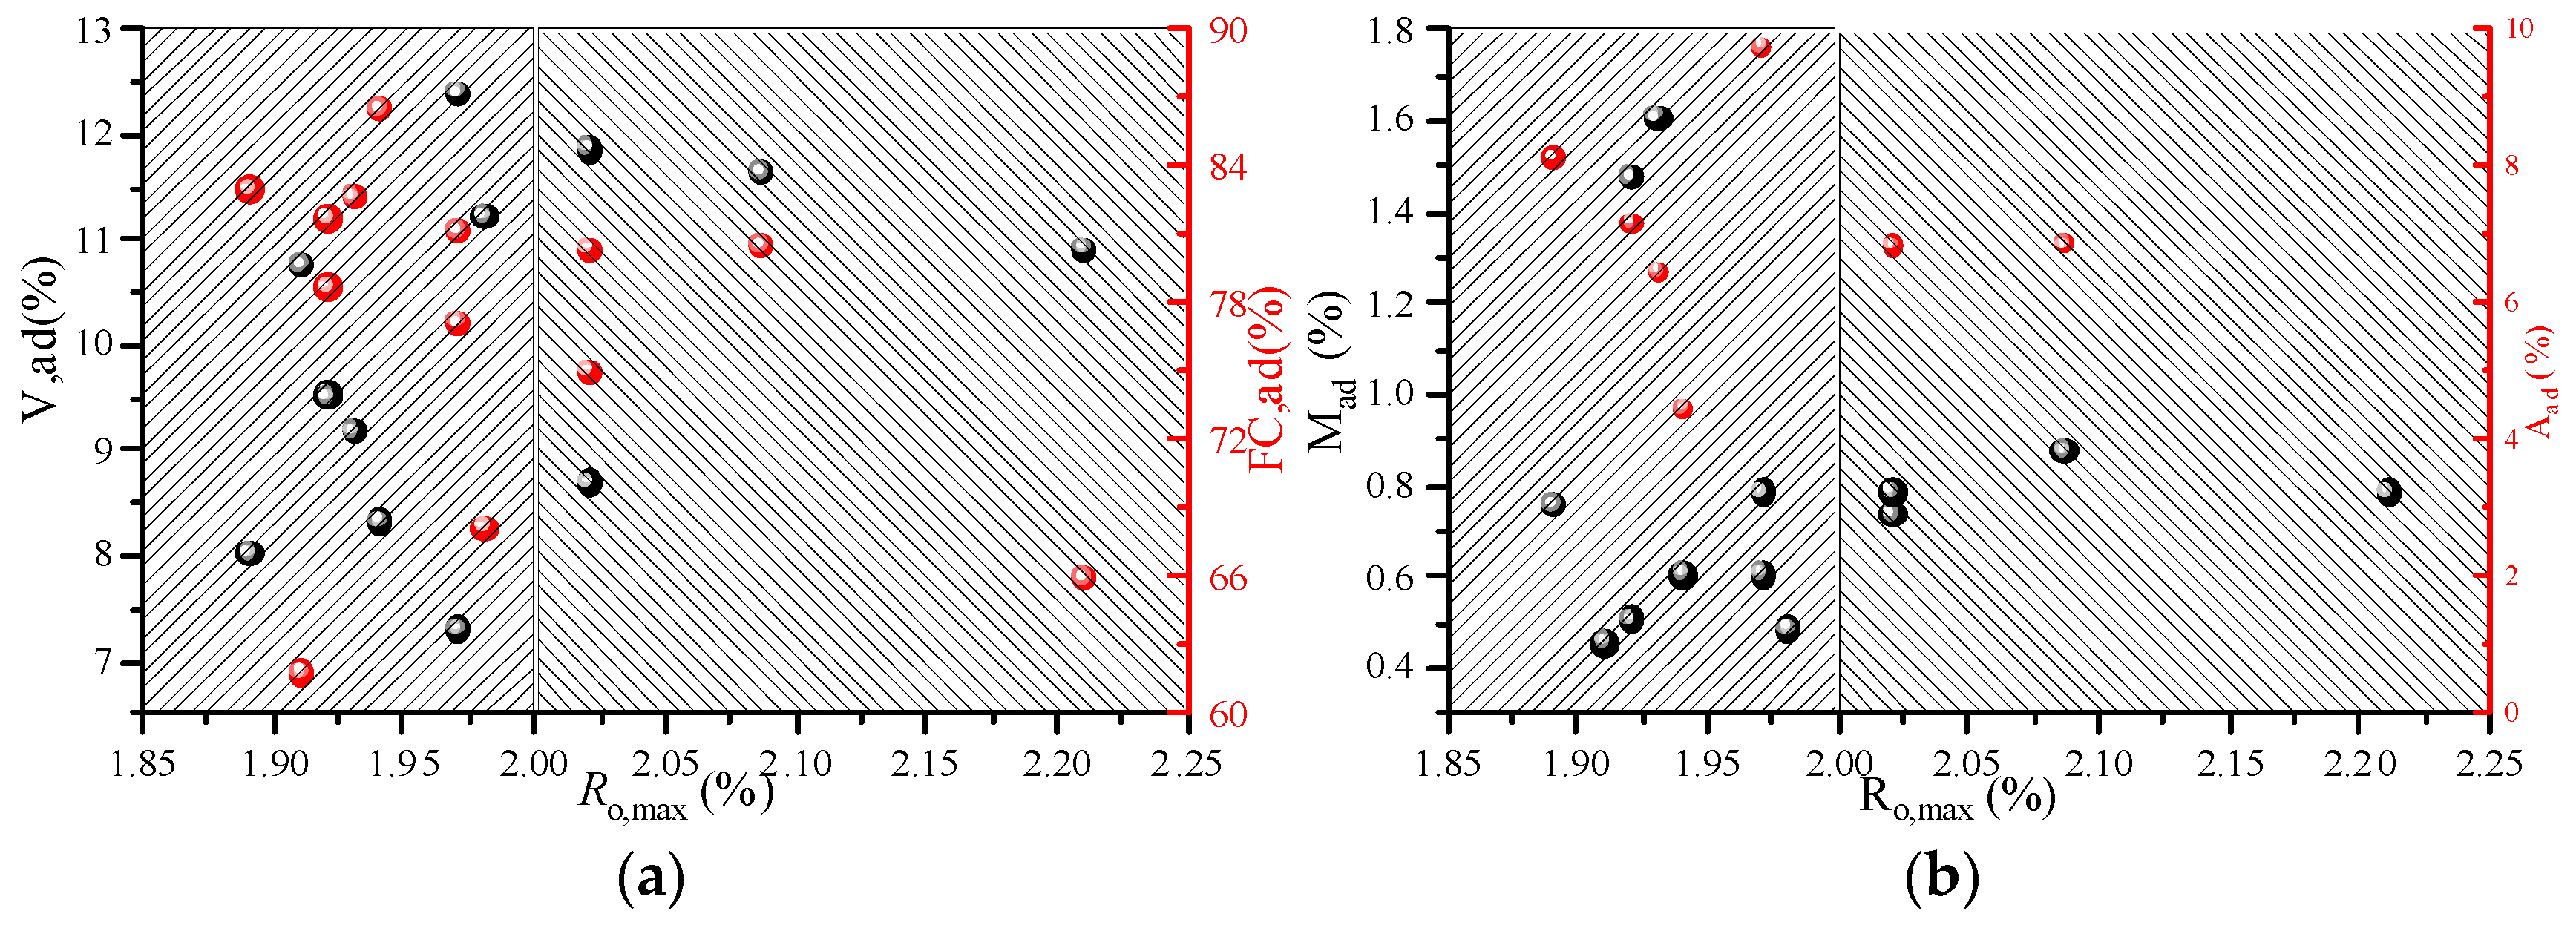
Table 1 shows that the vitrinite reflectance (Ro, max) of the selected samples ranges from 0.93% to 3.03%. To facilitate comparative analysis, the coal reservoirs were divided into two types by using Ro, max is 2% [3]. The maceral composition of the samples is predominantly vitrinite, followed by inertinite, with liptinite present only in minor amounts. Proximate analysis results indicate moisture content (Mad%) ranges from 0.46% to 1.61%, ash yield (Aad%) from 4.49% to 26.89%, volatile matter (Vad%) from 8.03% to 11.88%, and fixed carbon (FCad%) from 61.88% to 86.55%. As shown in the correlation analysis between vitrinite reflectance and proximate, with increasing coal rank, the volatile matter content gradually decreases while the fixed carbon content increases, primarily due to devolatilization/oxidation during coalification. The bituminous coal samples exhibit higher Mad% (with an average of 1.70%) and Aad% (with an average of 12.12%) compared to medium-rank coal (Mad% with an average of 1.43% and with an average of Aad%: 13.07%). This discrepancy is interpreted to be mainly related to the macroscopic coal lithotype of the high-rank samples in this study (Figure 2).
Table 1.
Basic Sample Information.
Figure 2.
Relationship between Coal Rank and Fundamental Parameters ((a), Volatile matter and FCad versus Ro, max; (b), Mad, Aad versus vitrinite reflectance).
3.2. Pore Types and Their Distribution Characteristics in Micropores (0–2 nm)
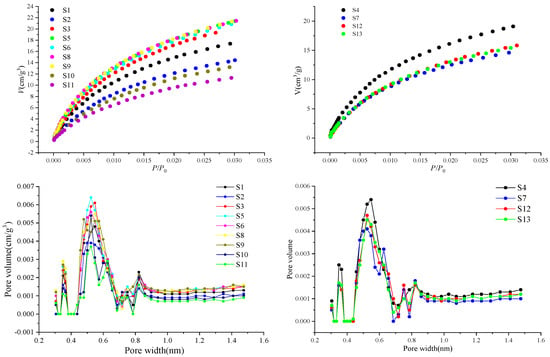
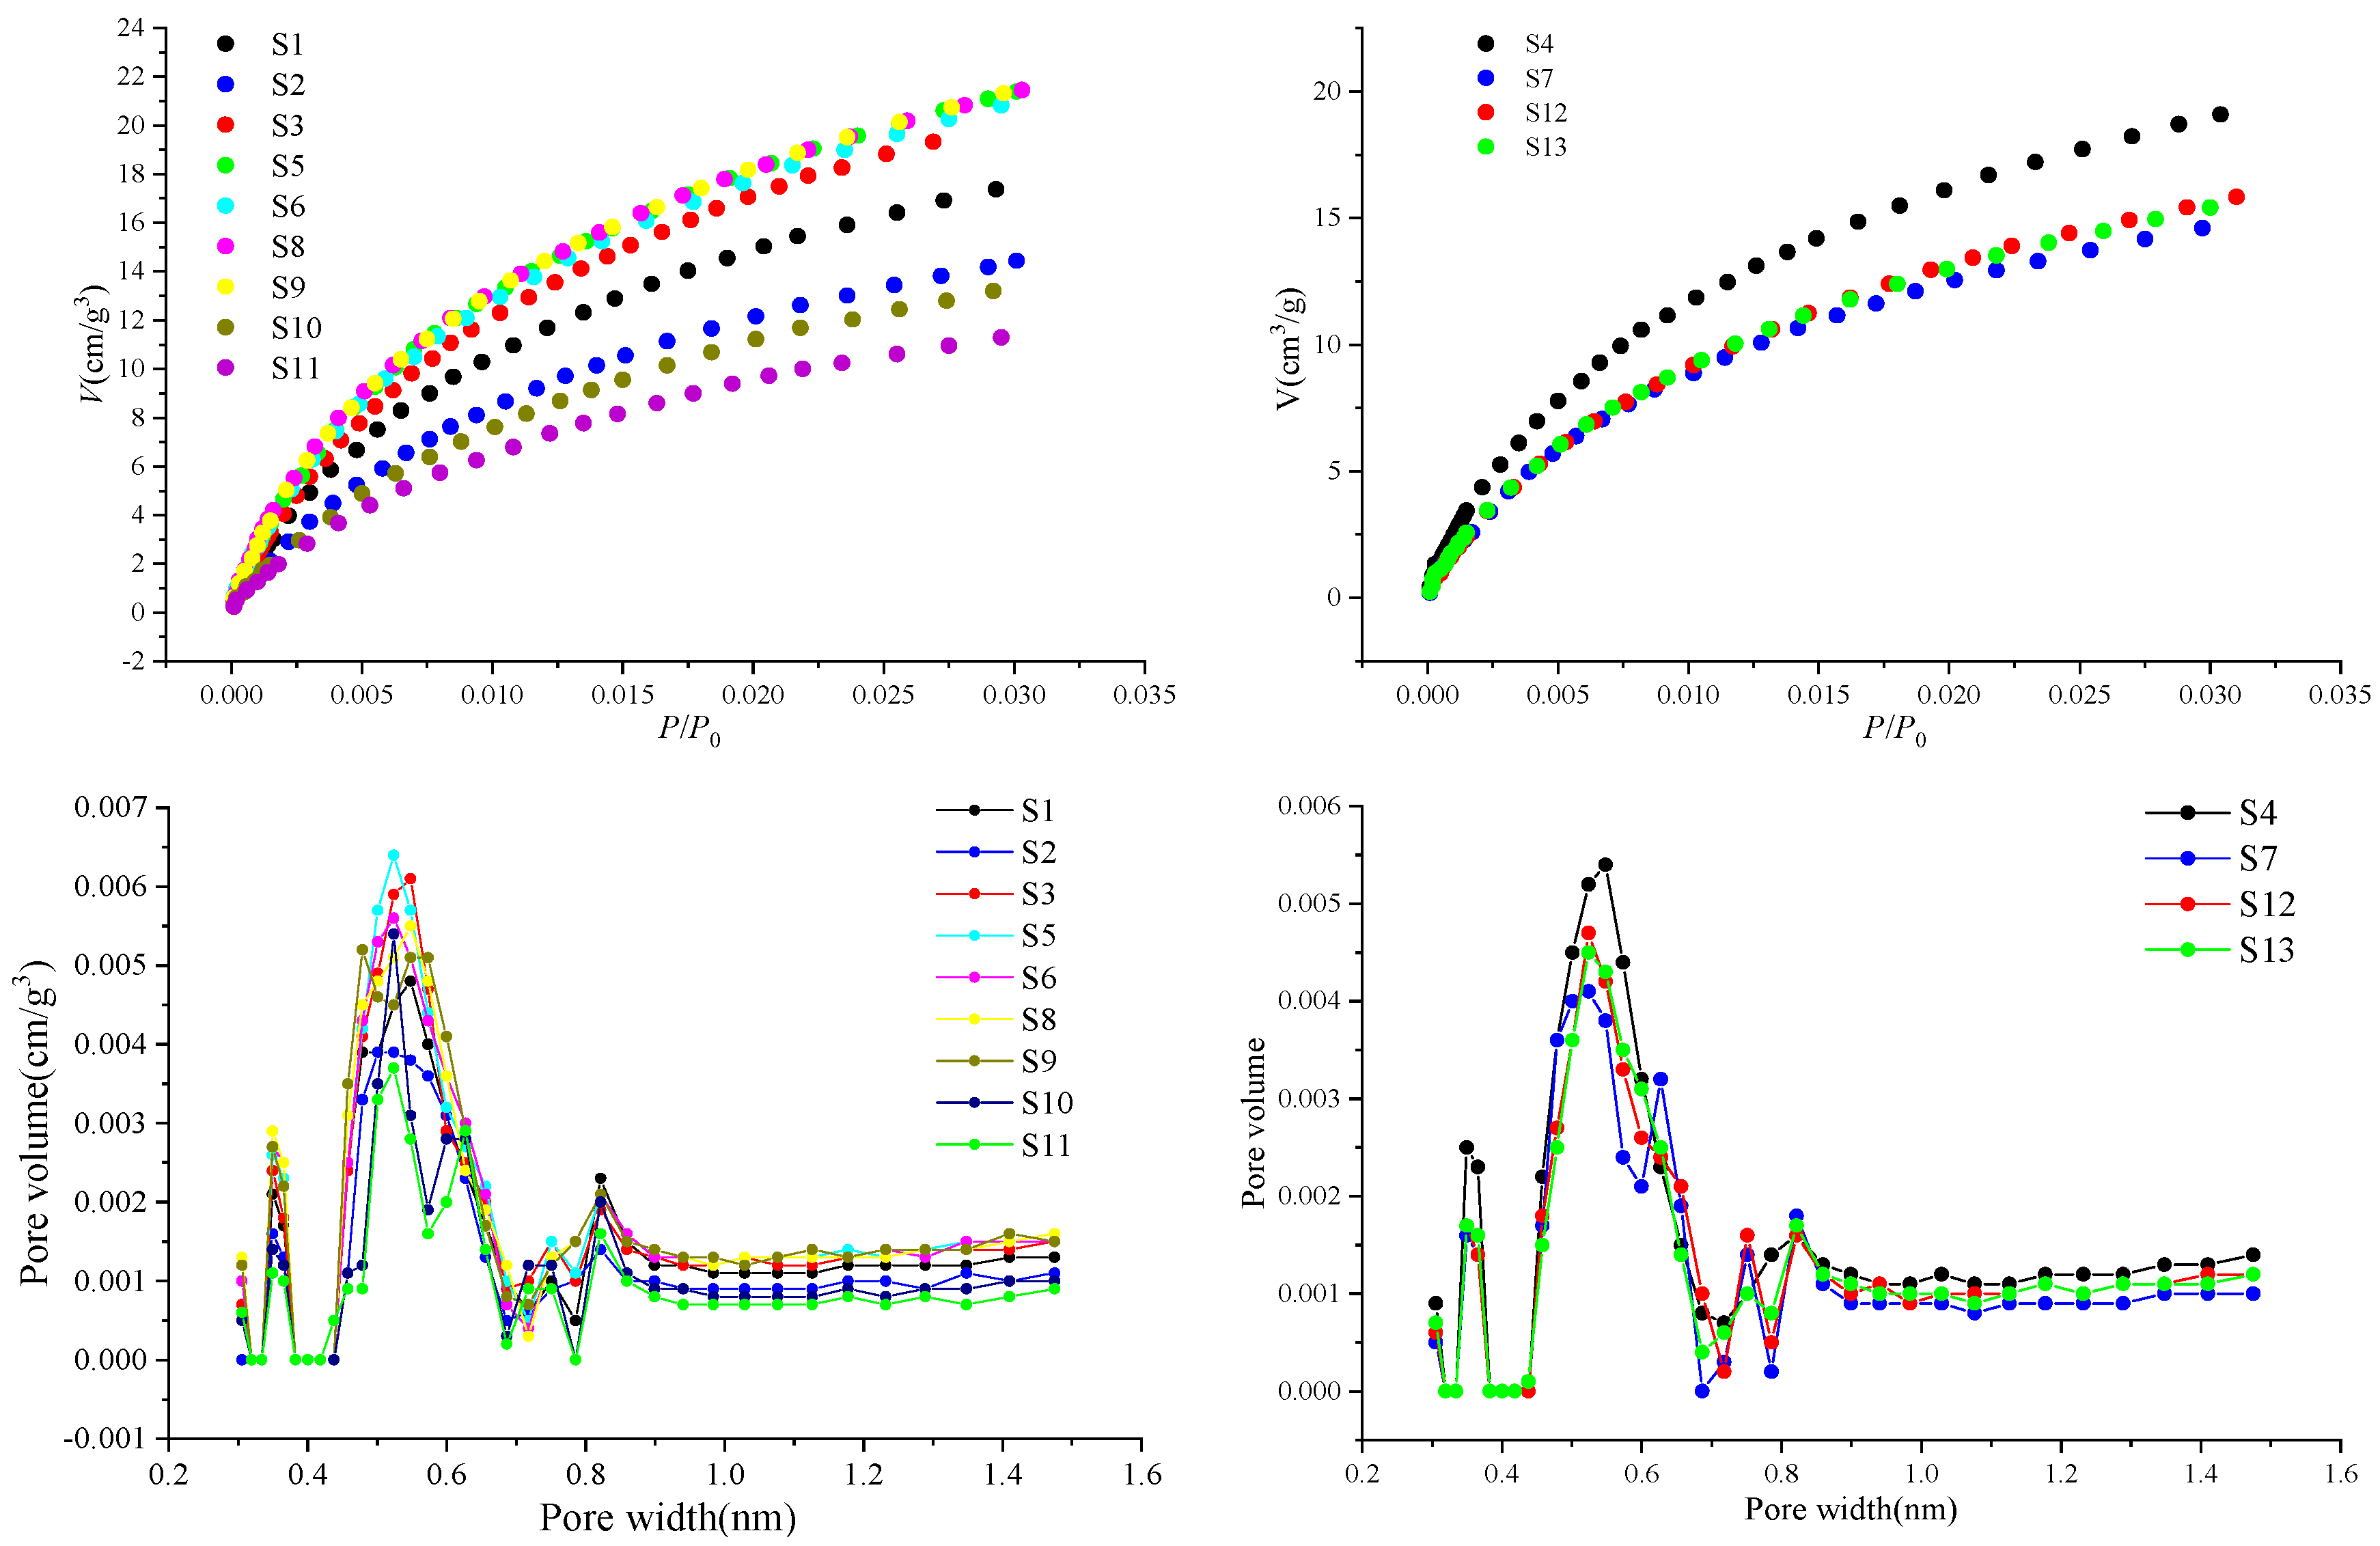
CO2 adsorption curves for various samples were studied. The results indicate a distinct step-like difference in the CO2 adsorption capacity among the different coal types: Type A exhibits adsorption capacities ranging from 19.0845 cm3·g−1 to 14.5992 cm3·g−1, with an value of 16.23 cm3·g−1; whereas Type B shows adsorption capacities ranging from 11.3014 cm3·g−1 to 21.44 cm3·g−1, with an average of 17.8450 cm3·g−1.The micropore structure parameters were discussed, showing that the CO2-derived specific surface area (CO2-SSA) of the samples ranges from 147.51 to 221.16 m2·g−1, and the total micropore volume (CO2-TPV) ranges from 0.036 to 0.067 mL·g−1, highlighting the significant contribution of the micropore system to the specific surface area (Figure 3).
Figure 3.
Distribution of Incremental Pore Volume a Different Pore Size Ranges.
From the perspective of pore size distribution, the peak pore volume mainly appears in the range of 0.5–0.6 nm, with some samples reaching a pore volume of 0.006–0.007 cm3·g−1 in this interval; when the pore size exceeds 0.8 nm, the pore volume significantly decreases and tends to level off. Overall, the micropore volume is highly concentrated in the 0.4–0.7 nm range, and the differences in pore volume among different samples, especially for pore sizes less than 0.7 nm, are particularly significant, revealing the sensitivity of micropore development to coal rank (Figure 3).
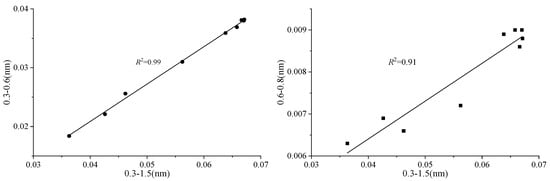
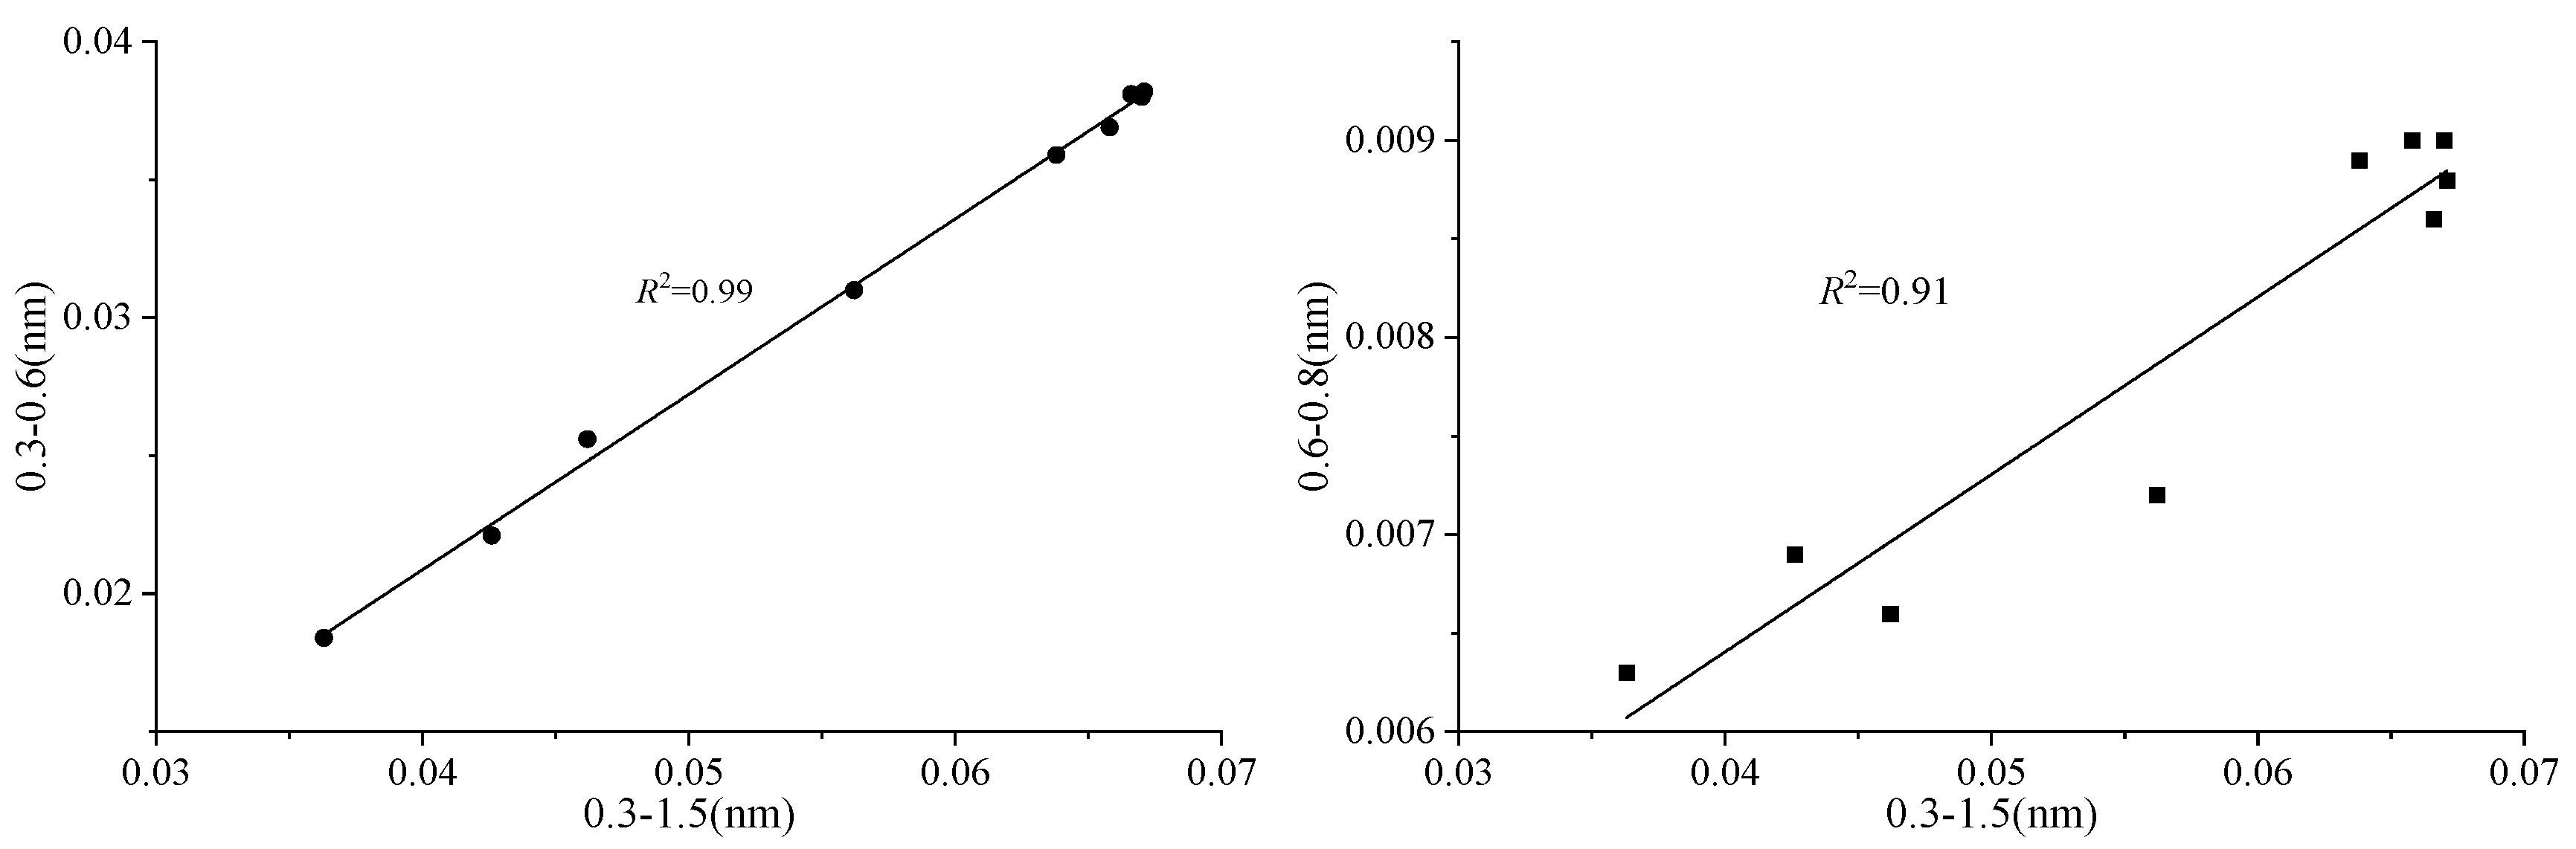
The pore volumes across different pore size scales reveal that the pore volume within the 0.3–1.5 nm range shows significant positive correlations with the pore volumes in the subdivided intervals of 0.3–0.6 nm, 0.6–0.8 nm, and 0.8–1.5 nm (Figure 4). Among these, the correlation between the 0.3–0.6 nm pore volume and the total 0.3–1.5 nm pore volume is particularly strong. Furthermore, the percentage of the pore volume within the 0.3–0.6 nm range is significantly higher than that of the other intervals. Therefore, it can be confirmed that the micropore volume in both types of samples is predominantly contributed by pores in the 0.3–0.6 nm size range. This conclusion, drawn from both the correlation of pore volumes and their percentage distribution, clearly reveals the primary source of micropore volume and provides key evidence for further understanding the characteristics of the micropore structure and the patterns of pore development in the samples (Figure 4).
Figure 4.
Relationship between pore volume and different pore diameter for type A samples.
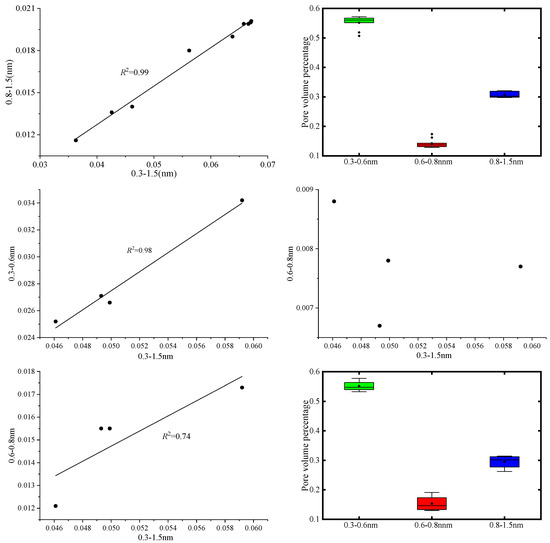
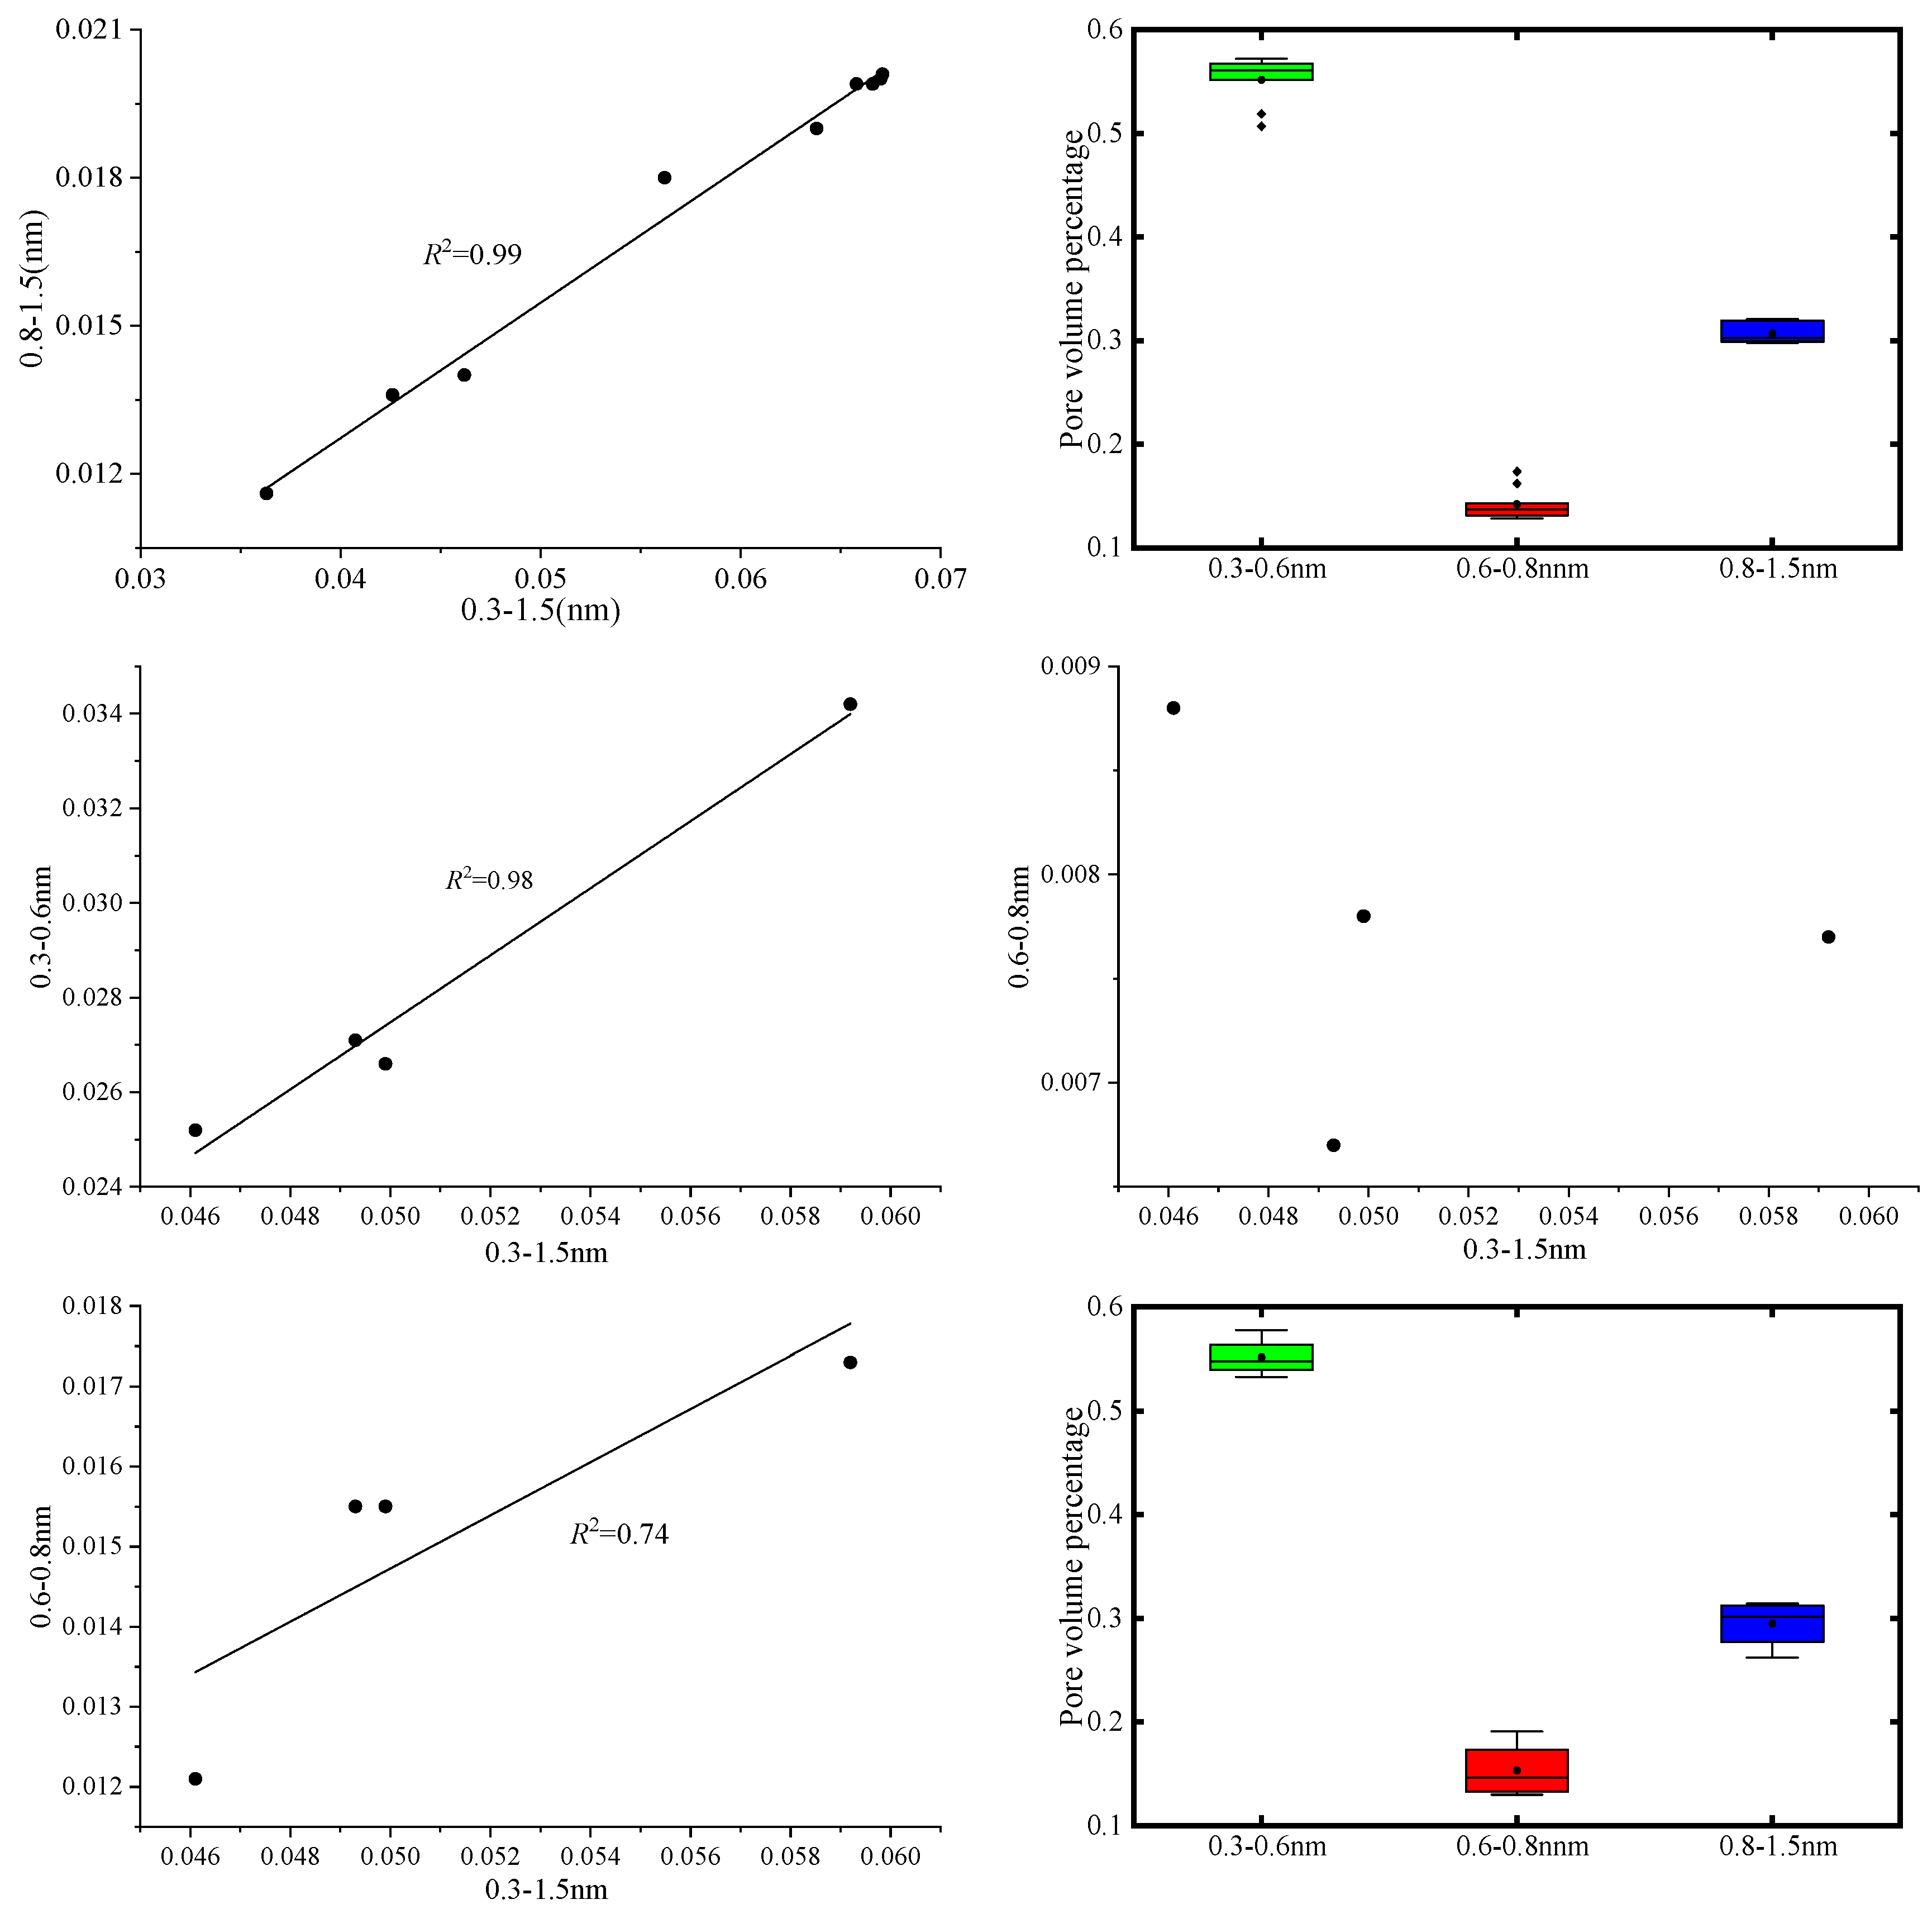
By comparing the specific pore volumes across different pore size ranges, it is observed that the specific pore volumes within the 0.3–1.5 nm range exhibits strong positive correlations with the specific pore volumes in the subdivided intervals of 0.3–0.6 nm, 0.6–0.8 nm, and 0.8–1.5 nm (Figure 5). Among these, the correlation between the specific pore volumes in the 0.3–0.6 nm range and the total specific pore volumes in the 0.3–1.5 nm range is high. Furthermore, the percentage contribution of the specific pore volumes in the 0.3–0.6 nm range (0.648 < TSS < 0.722, average 0.694) is significantly higher than that of the other intervals. Thus, it can be concluded that the micropore specific pore volumes of both types of samples is predominantly contributed by pores in the 0.3–0.6 nm range. This clarifies the dominant contribution range of the micropore specific pore volumes and provides important quantitative support for further investigating the formation mechanisms and developmental characteristics of the micropore structure in the samples.
Figure 5.
Relationship between pore volume and different pore diameter for Type B samples.
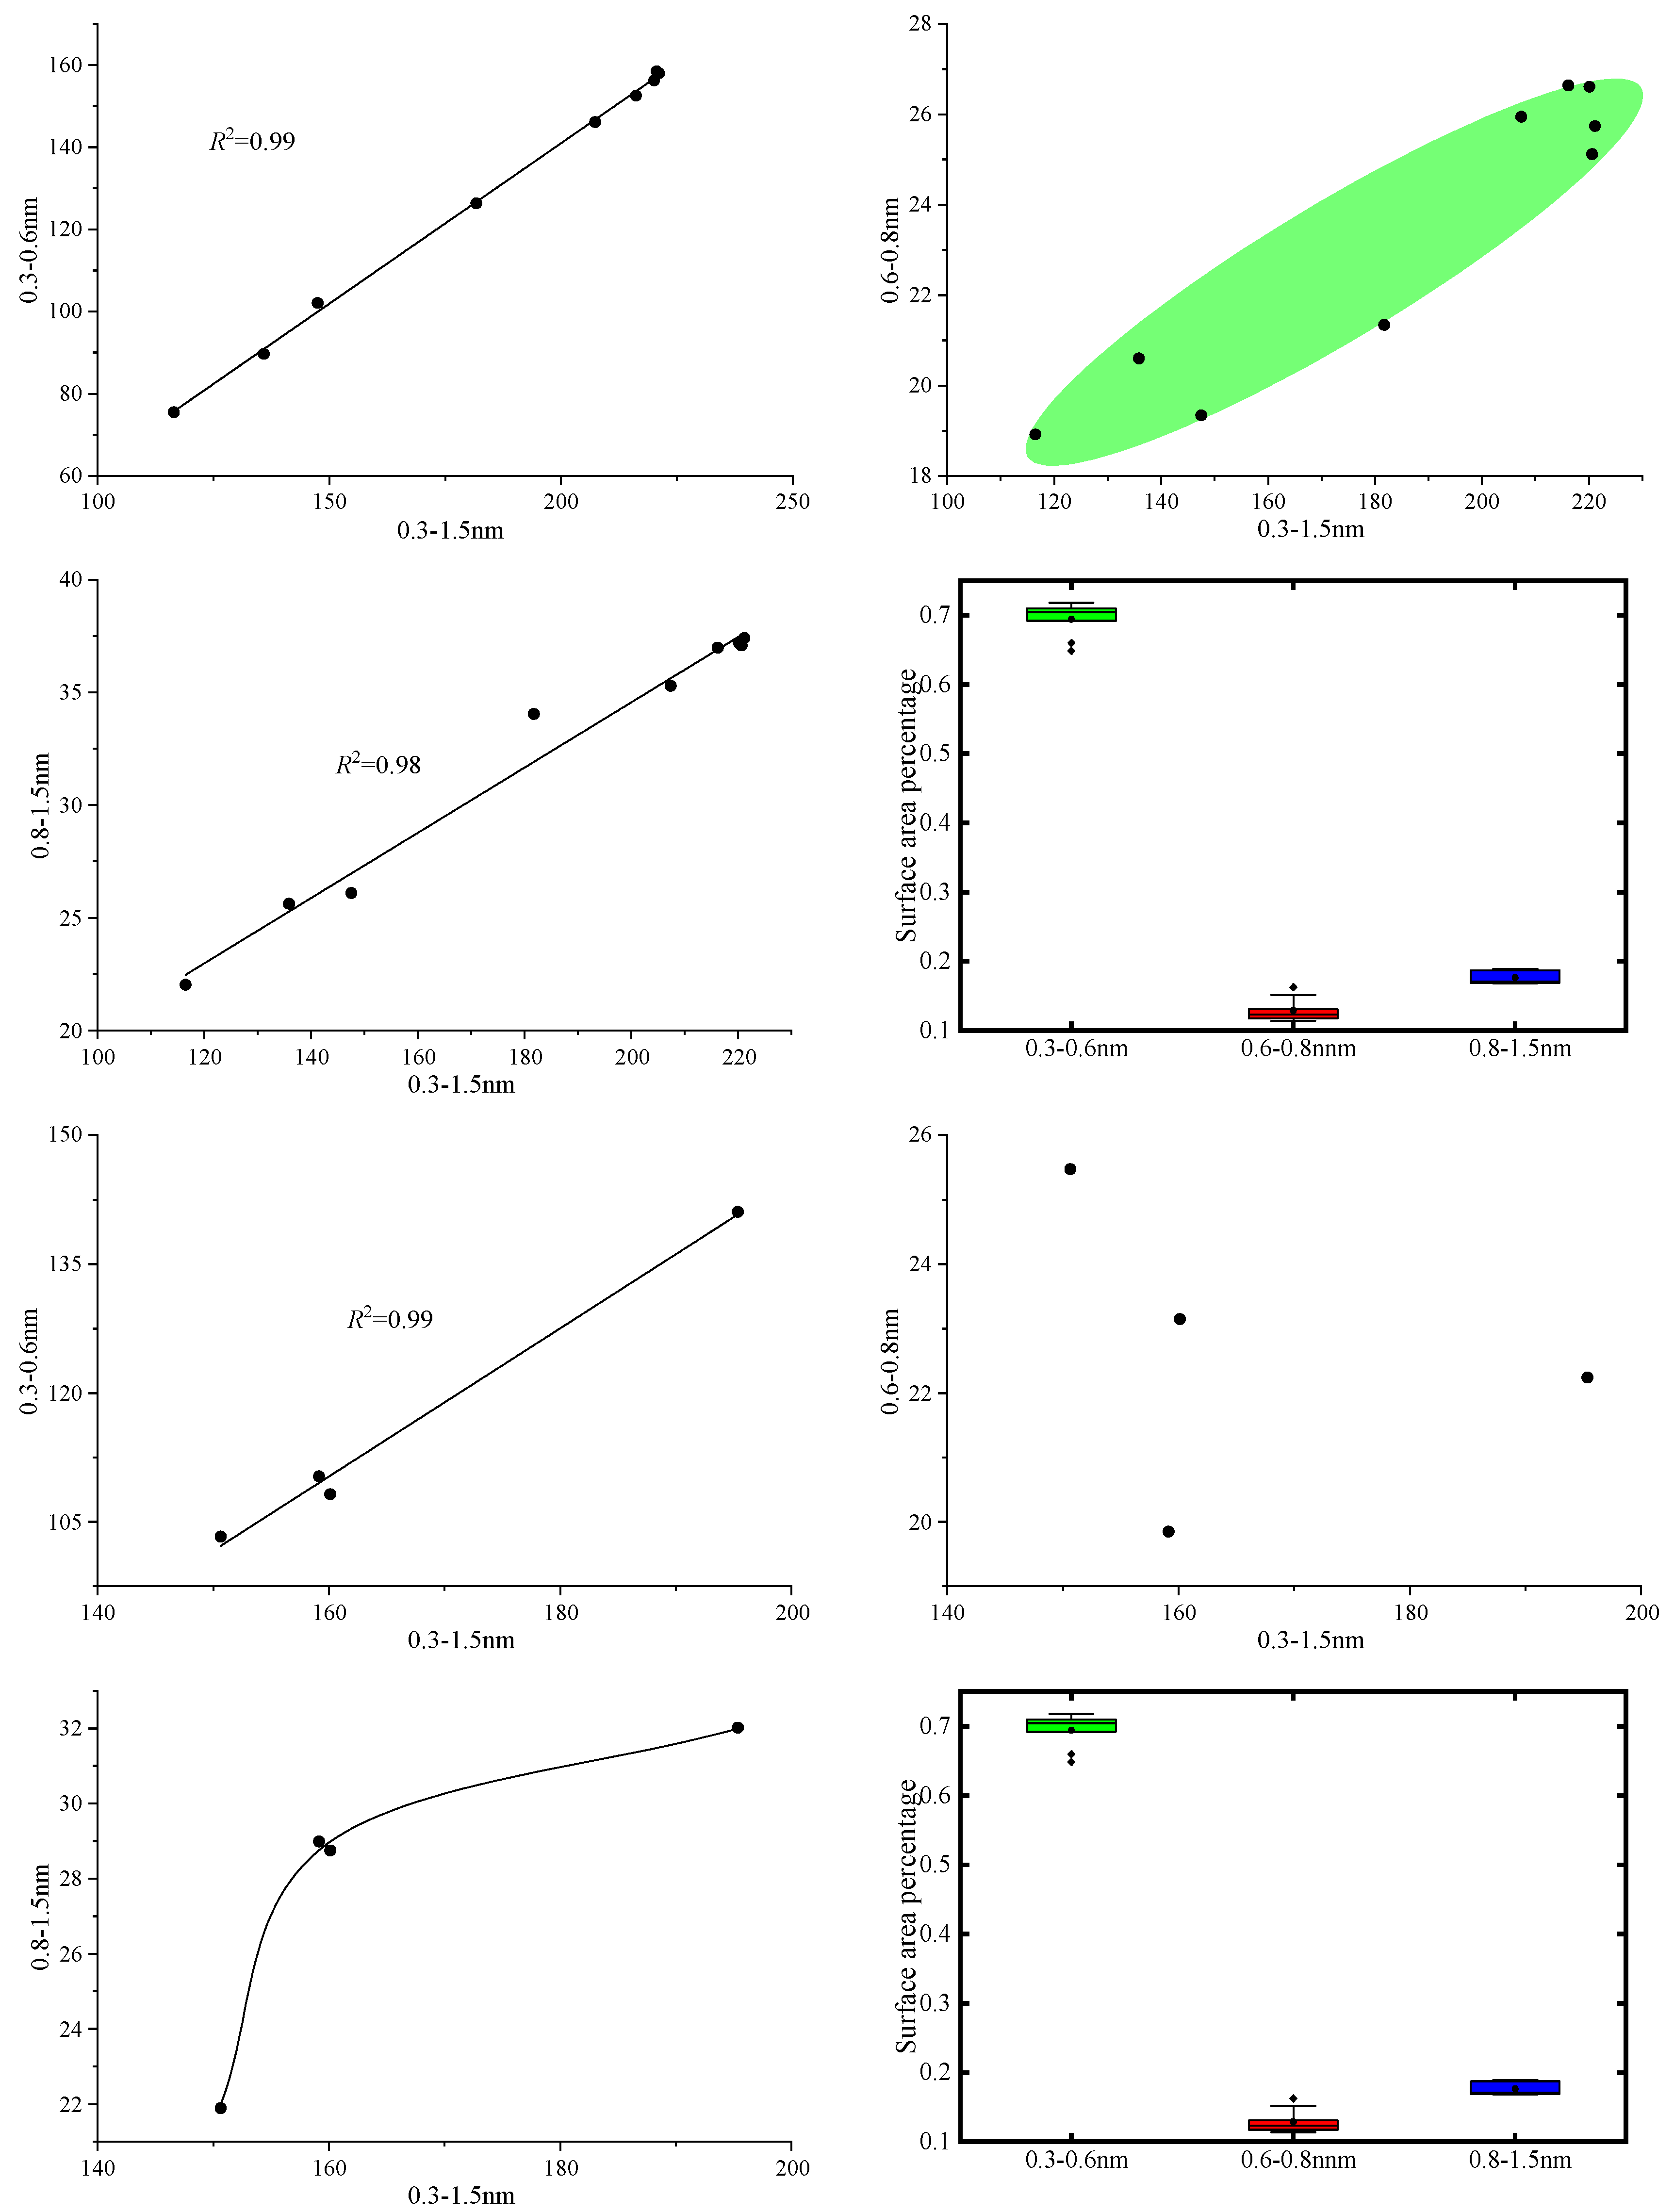
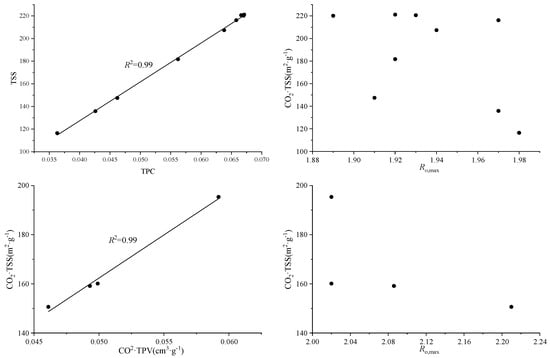
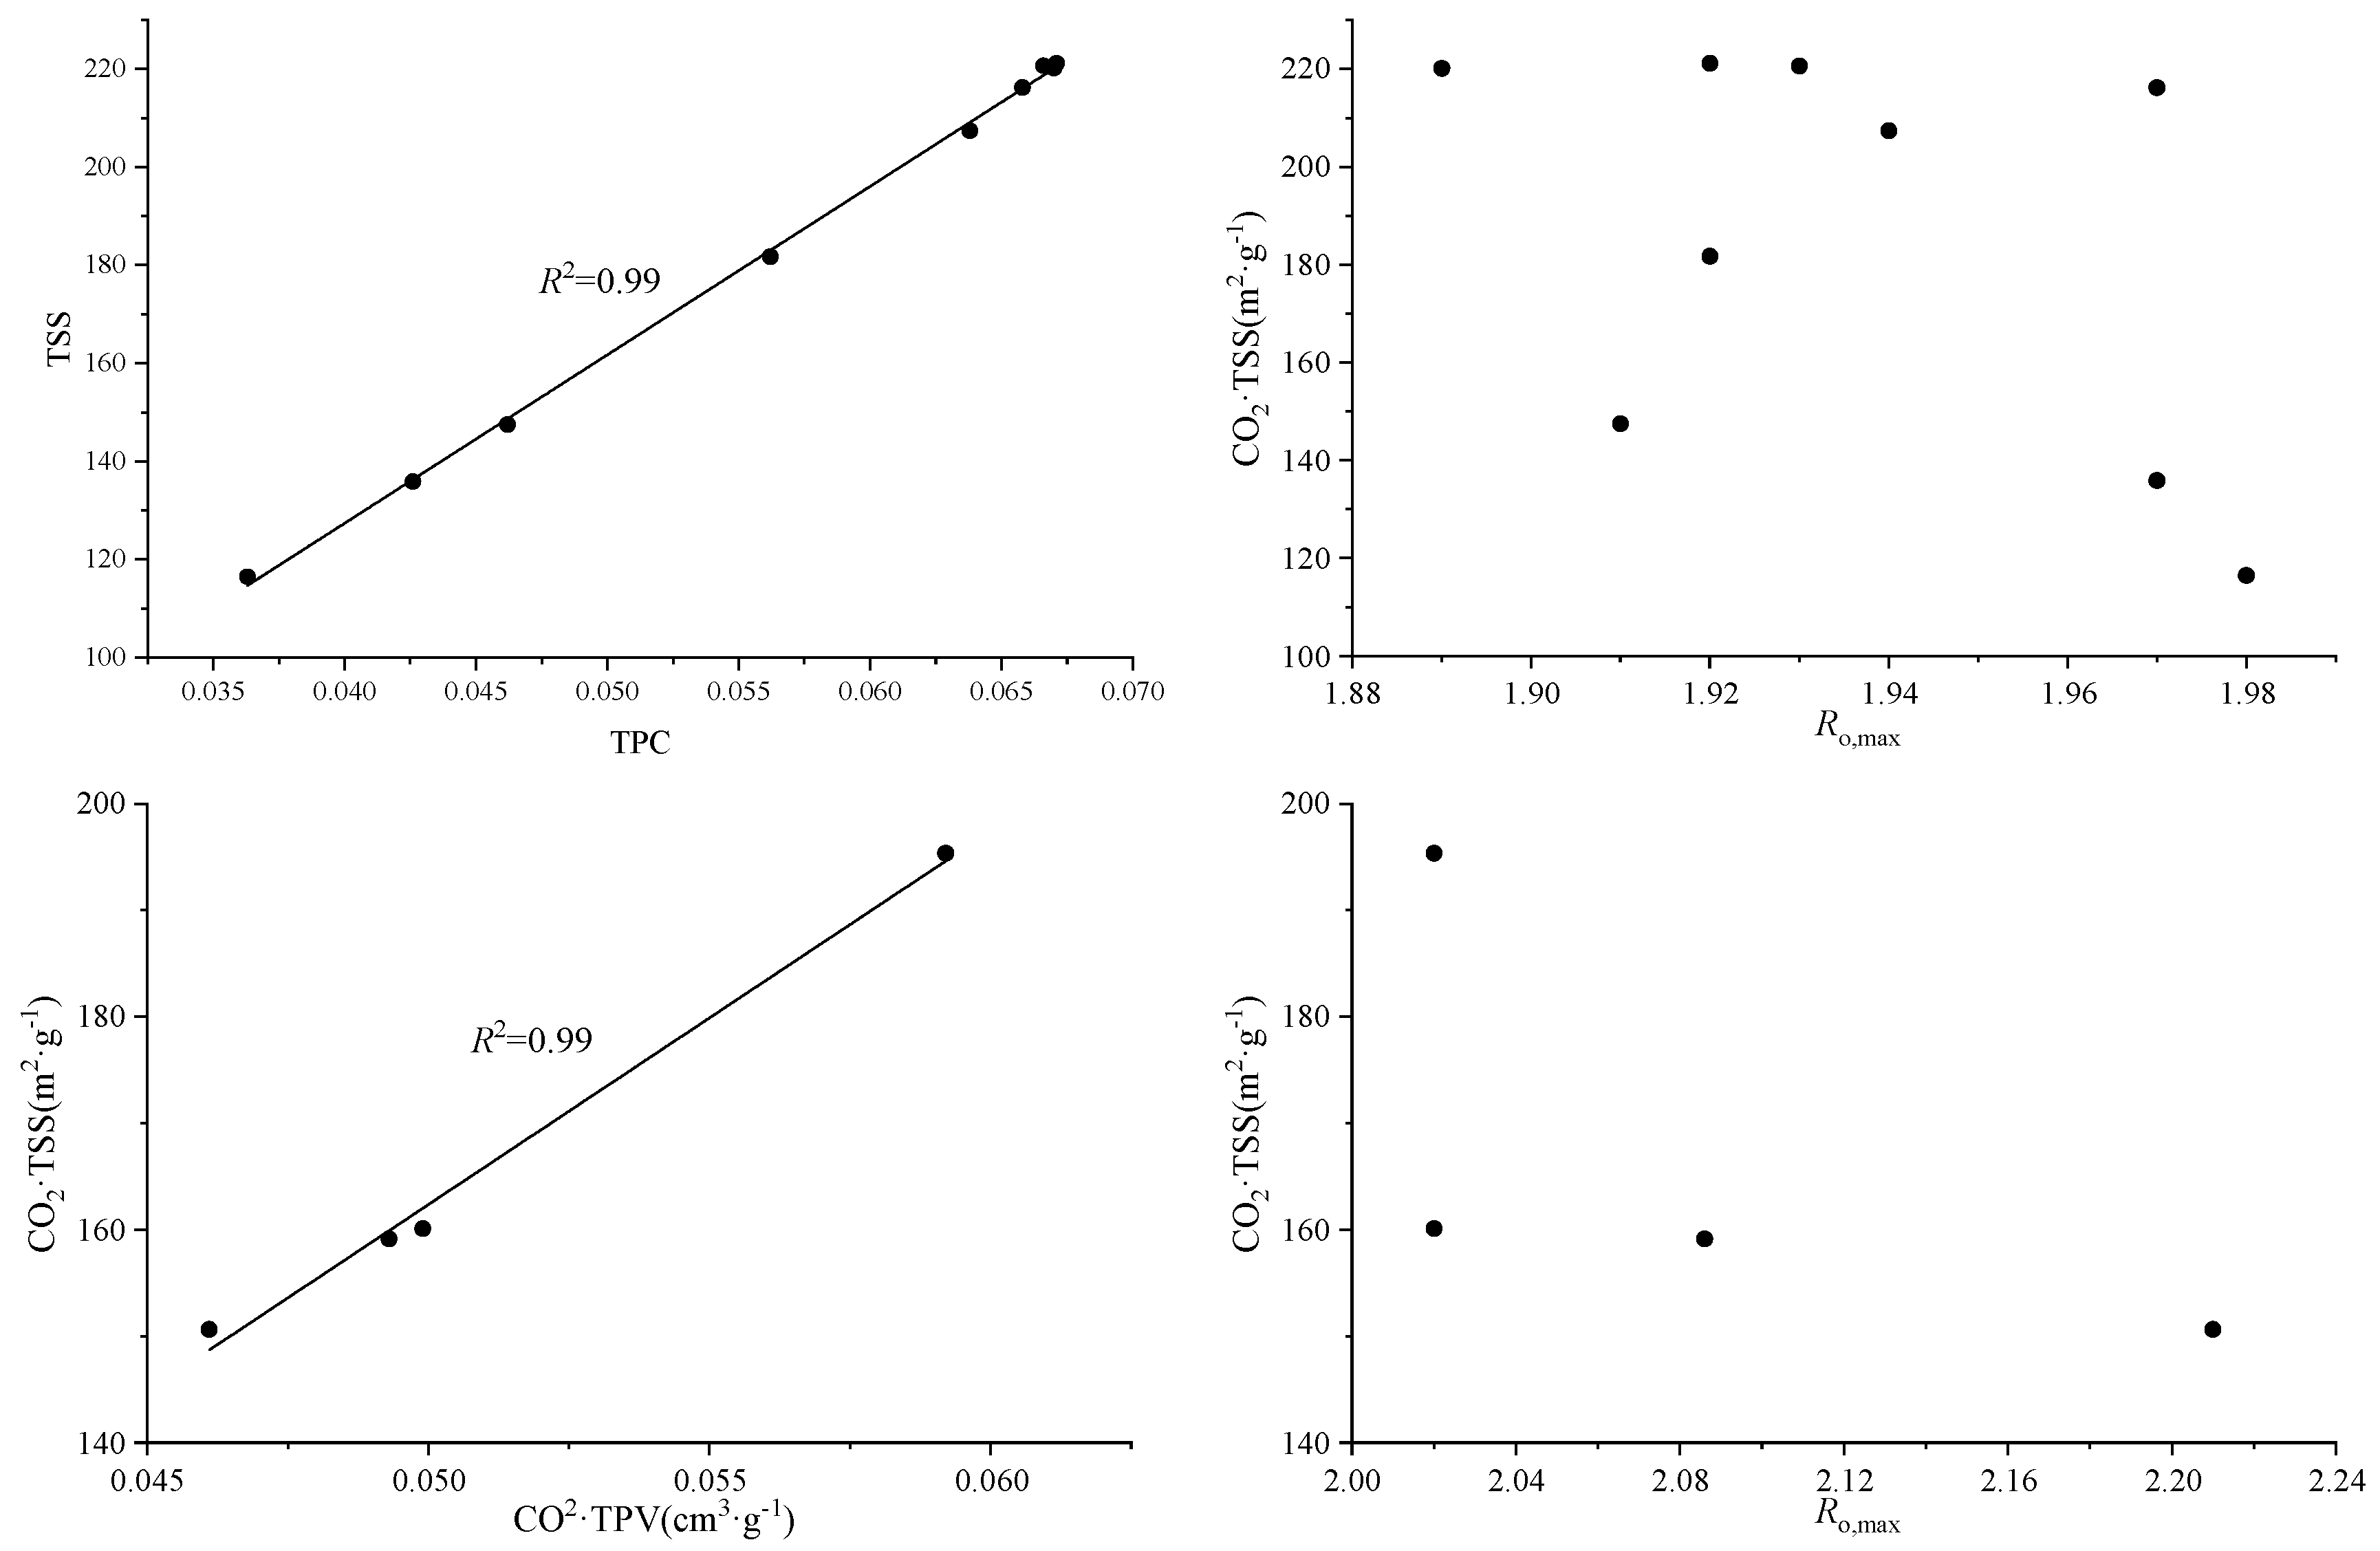
TSS and total pore volume (TPV) exhibit an extremely strong positive correlation (R2 = 0.99). This is because an increase in pore volume is often accompanied by an expansion in either the number of pores or their diameters, while the specific surface area is directly related to the degree of pore development; more pores provide richer surface sites. Therefore, an increase in total pore volume significantly drives the growth of the total specific surface area, and both parameters demonstrate a synergistic linear growth characteristic during the development of the pore structure (Figure 6).
Figure 6.
Relationship between micropore volume and specific surface area.
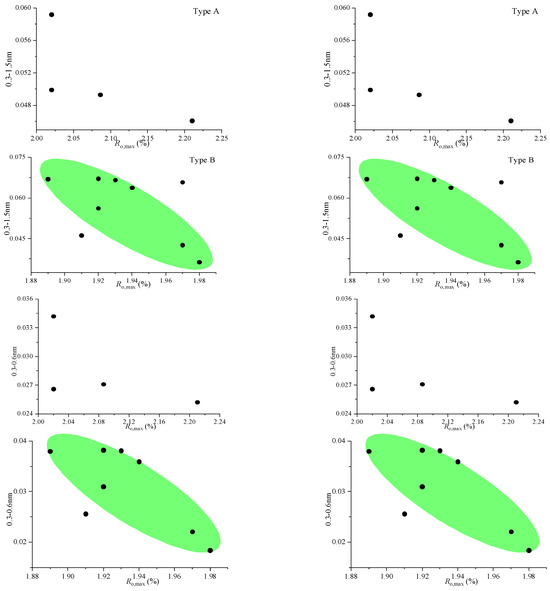
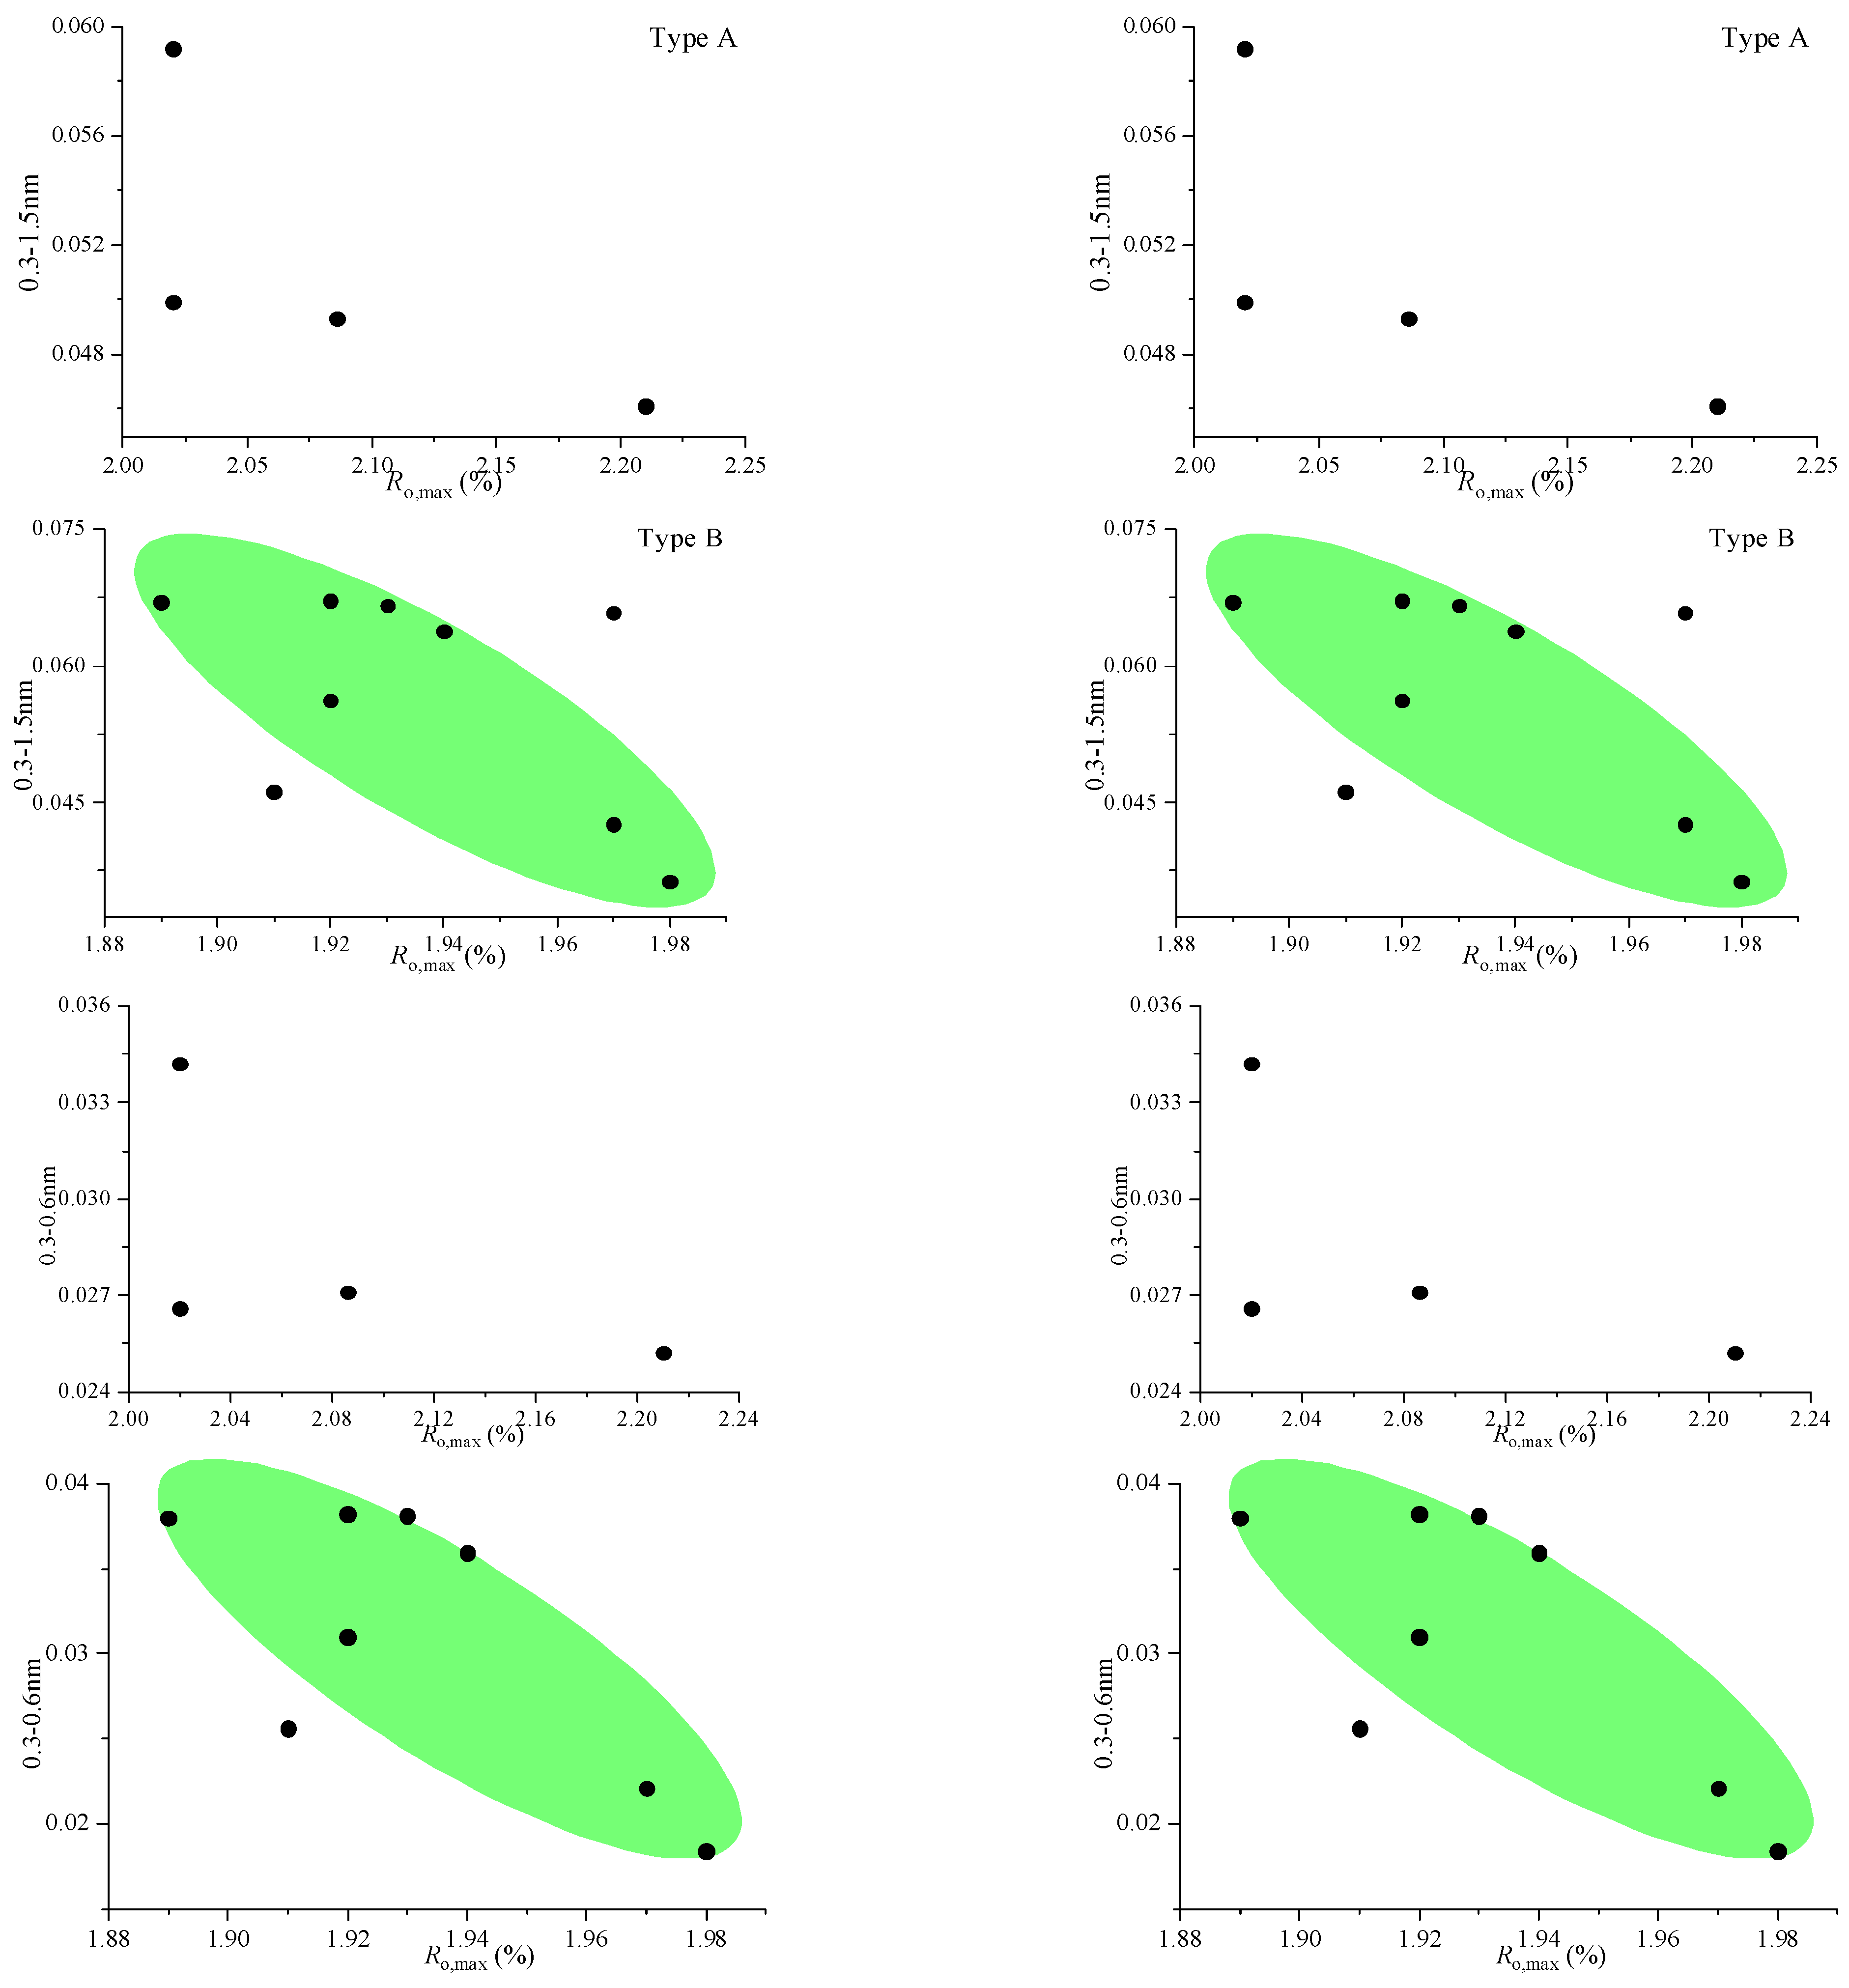
A weak negative correlation between vitrinite reflectance (Ro, max) and specific surface area was observed, suggesting that as the thermal maturity increases, the organic matter structure in coal undergoes shrinkage and densification. Some of the original micropores may collapse or merge due to thermal stress, leading to a reduction in the number of micropores and consequently a decrease in specific surface area. It is noteworthy that in Type B samples, the pore volumes in the 0.3–1.5 nm and 0.3–0.6 nm ranges show a significant positive correlation with Ro, max, reflecting the continuous generation of new micropores with increasing maturity. In contrast, no significant correlation was observed between pore volume and Ro,max in Type A samples, which was related to differences in maceral composition or thermal evolution pathways among the samples, indicating that their pore development is less influenced by maturity.
Figure 7 shows that as vitrinite reflectance (Ro,max) increases, the thermal evolution degree of coal deepens, leading to a systematic evolution of its pore structure. It indicates that in the samples from the study area, vitrinite reflectance generally exhibits a negative correlation with the pore volumes of both micropores (<2 nm) and nanopores (2–100 nm). This phenomenon reveals the dynamic interplay of different pore-forming mechanisms during the thermal evolution process.
Figure 7.
Correlation between pore diameter distribution and coal rank.
Specifically, for Type A and Type B samples, the pore volumes in the 0.3–1.5 nm and 0.3–0.6 nm show a decreasing trend with increasing Ro,max. This phenomenon is primarily affected by thermal compaction effects and organic matter condensation. As coal rank increases, formation temperature and pressure continuously rise, and the coal matrix is compressed under immense lithostatic pressure, resulting in the physical collapse and volume reduction of pre-existing pore spaces, particularly in the micropore system. Meanwhile, organic matter undergoes intense aromatic condensation reactions at high temperatures, causing the molecular structure to become denser and more ordered. This chemical process likewise annihilates a portion of the small pores, resulting in a net loss of pore volume.
It is noted that although Type B (high-rank coal) samples are generally expected to generate new micropores during the catagenetic stage, the data from this study indicate that the volume of newly formed pores at this stage may be insufficient to fully compensate for the pore loss caused by intense compaction and condensation. Consequently, an overall negative correlation between increasing Ro,max and decreasing pore volume is still observed.
3.3. Micro-Pore Fractal Dimension
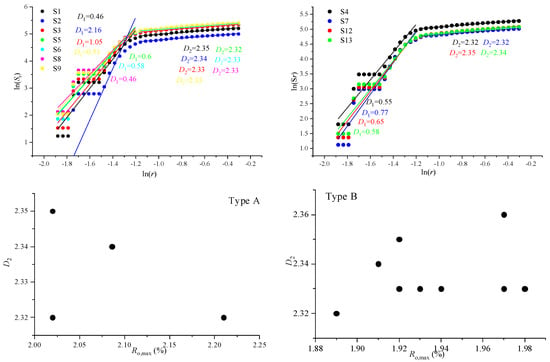
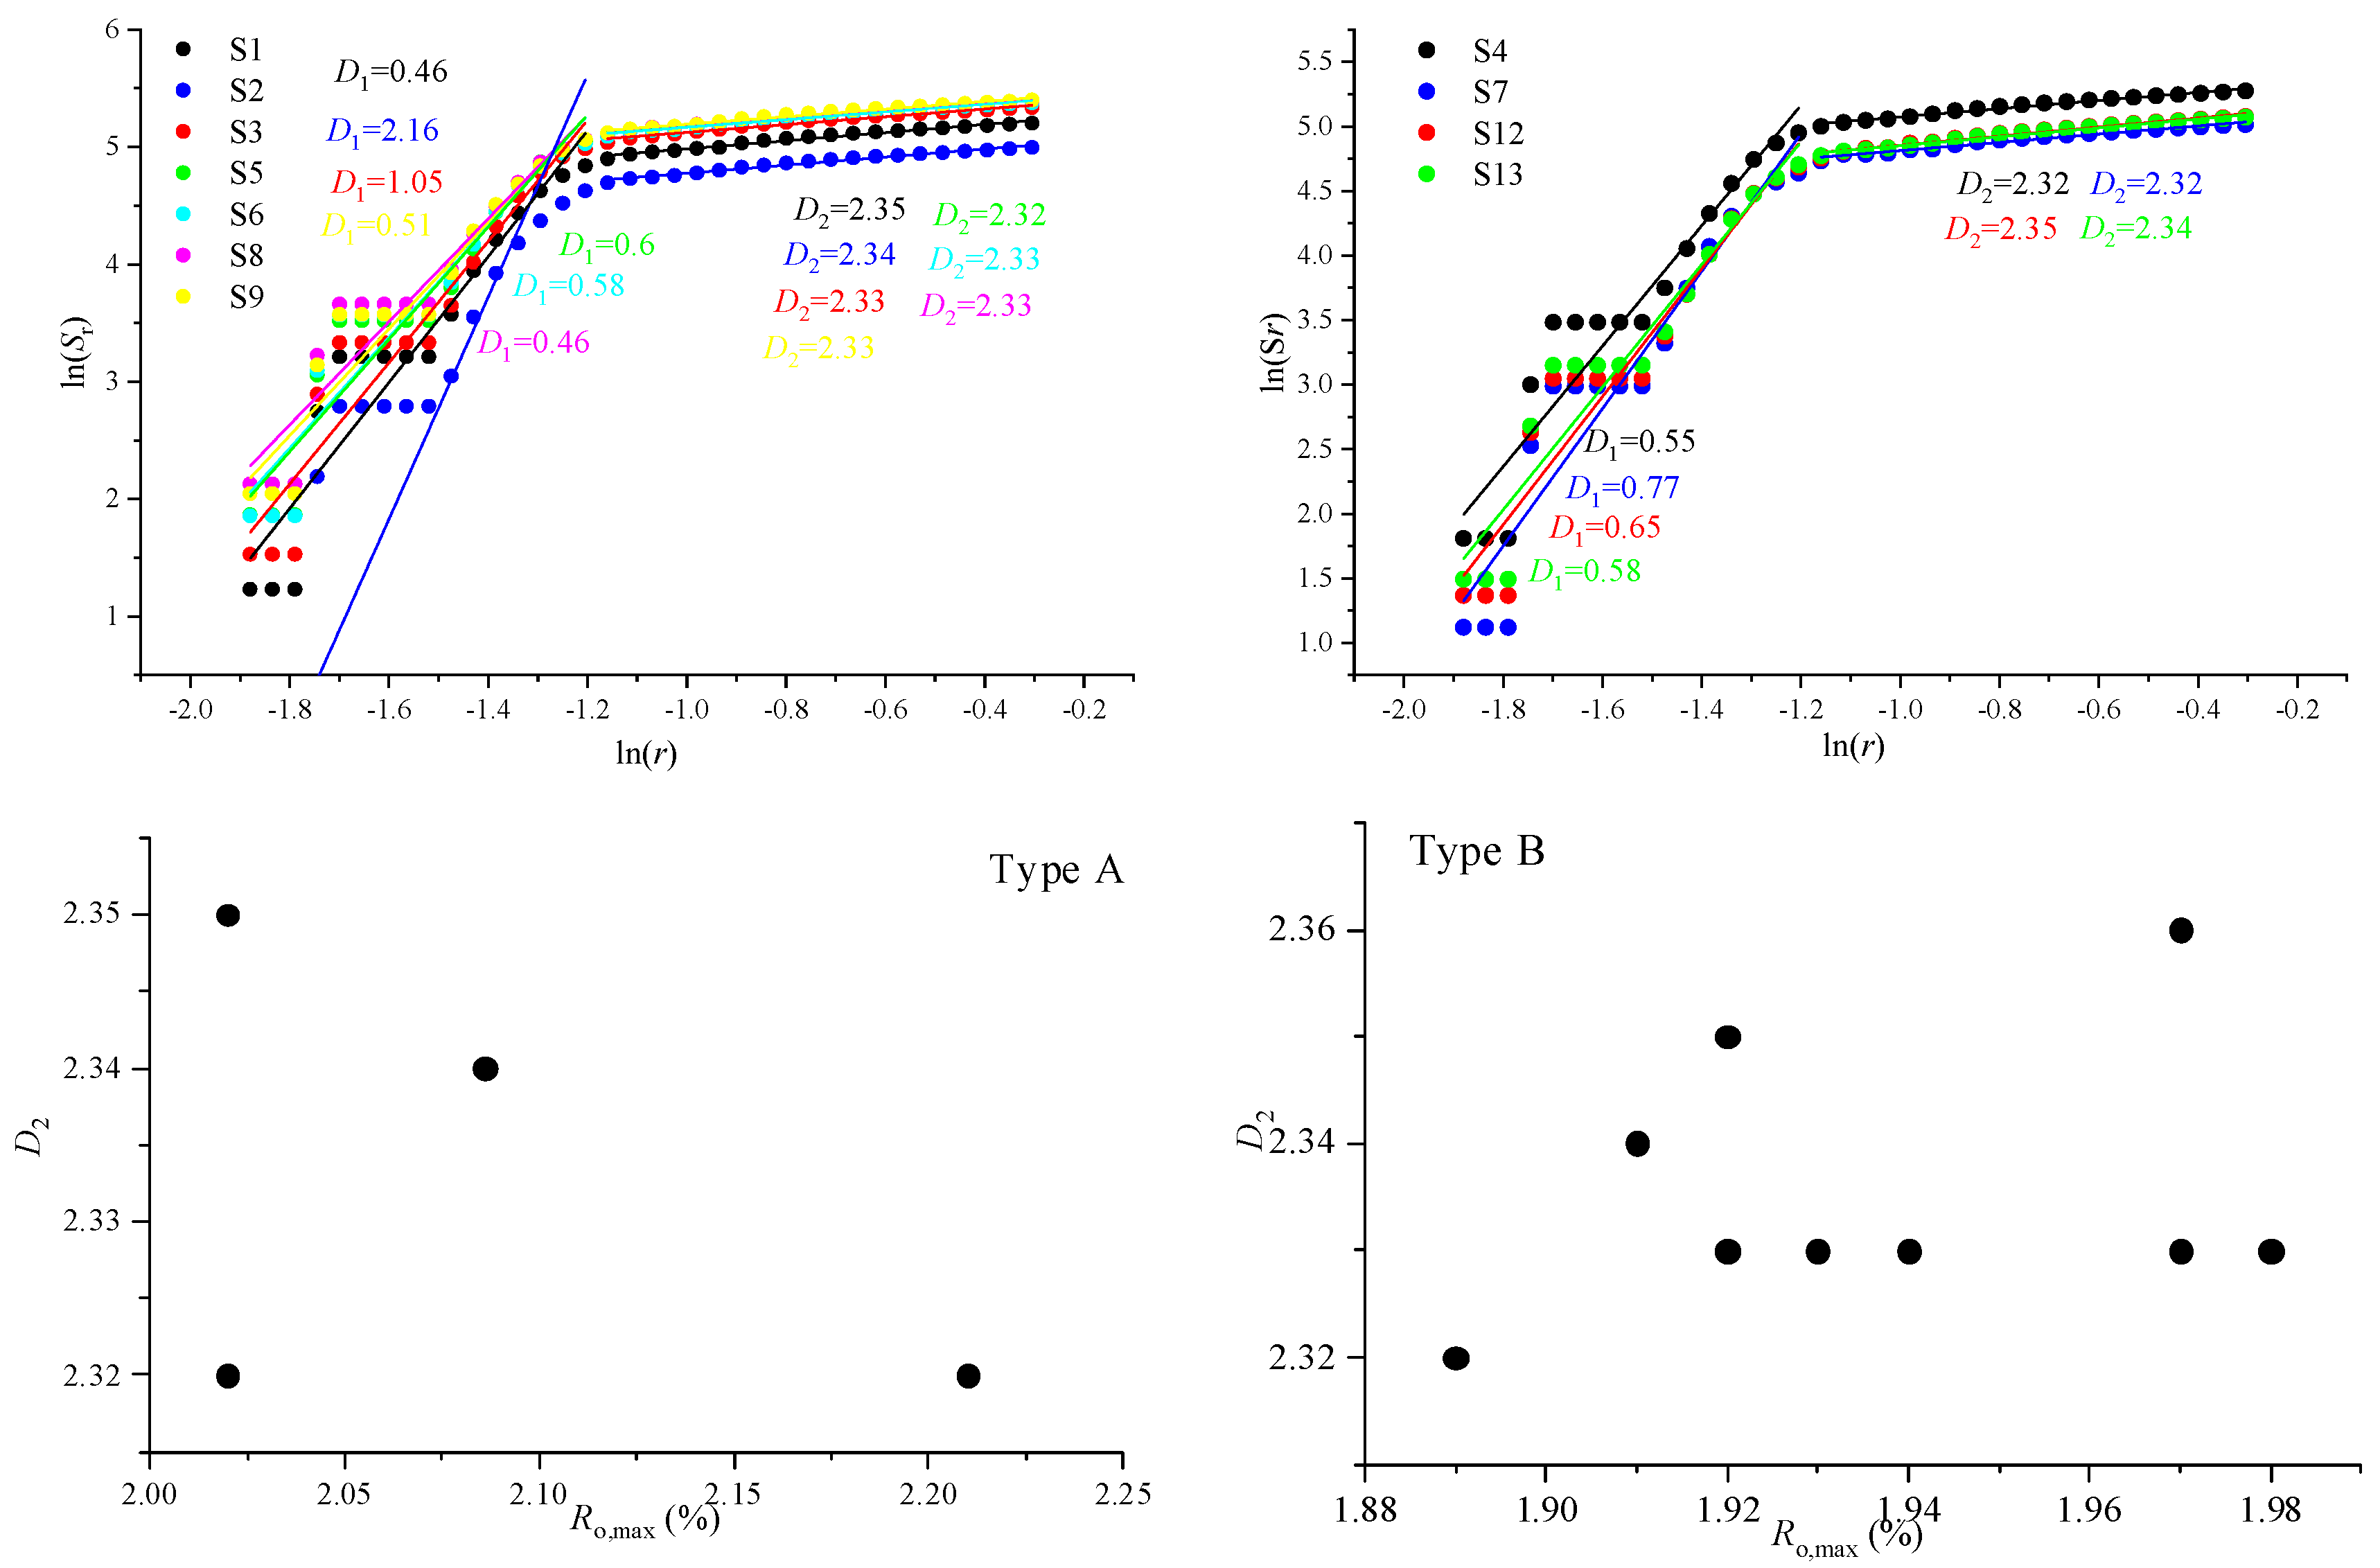
Table 2 shows that micropores contribute the majority of the specific surface area, indicating that the adsorption capacity of coal reservoirs during CBM accumulation is governed by micropores. Quantitative fractal analysis of micropore surface characteristics is therefore highly significant for CBM exploration and development. Based on Equation 2, fractal characteristics of micropores were investigated. Figure 8 shows that the relationship between ln(S) and ln(r) exhibits distinct fractal characteristics on either side of a boundary near ln(r) = −1.2.
Table 2.
Presentation of CO2 Fractal Parameter Calculation Results for Selected Samples.
Figure 8.
Relationship between Single-Fractal Dimension and Ro, max.
Table 2 shows that D1 ranges from 0.46 to 2.16, which does not conform to the established conclusion that 2 < D1 < 3. This indicates that the pore size at this stage does not have fractal characteristics, which is consistent with the understanding in published literature. Therefore, this study only describes the fractal characteristics of micropores with ln(r) = −1.2, and D2 range from 2.32 to 2.35, demonstrating clear fractal characteristics (Figure 8).
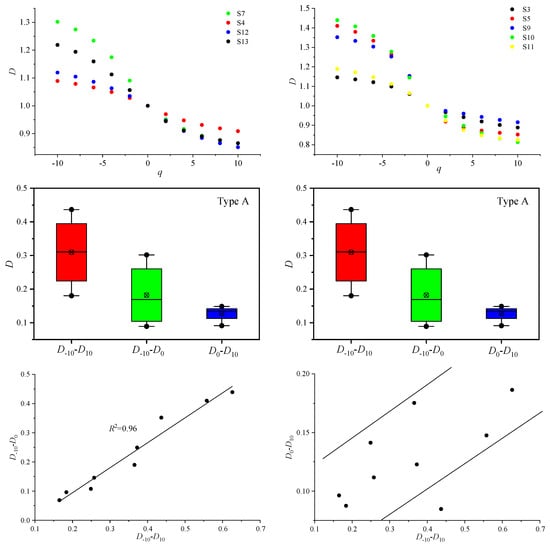
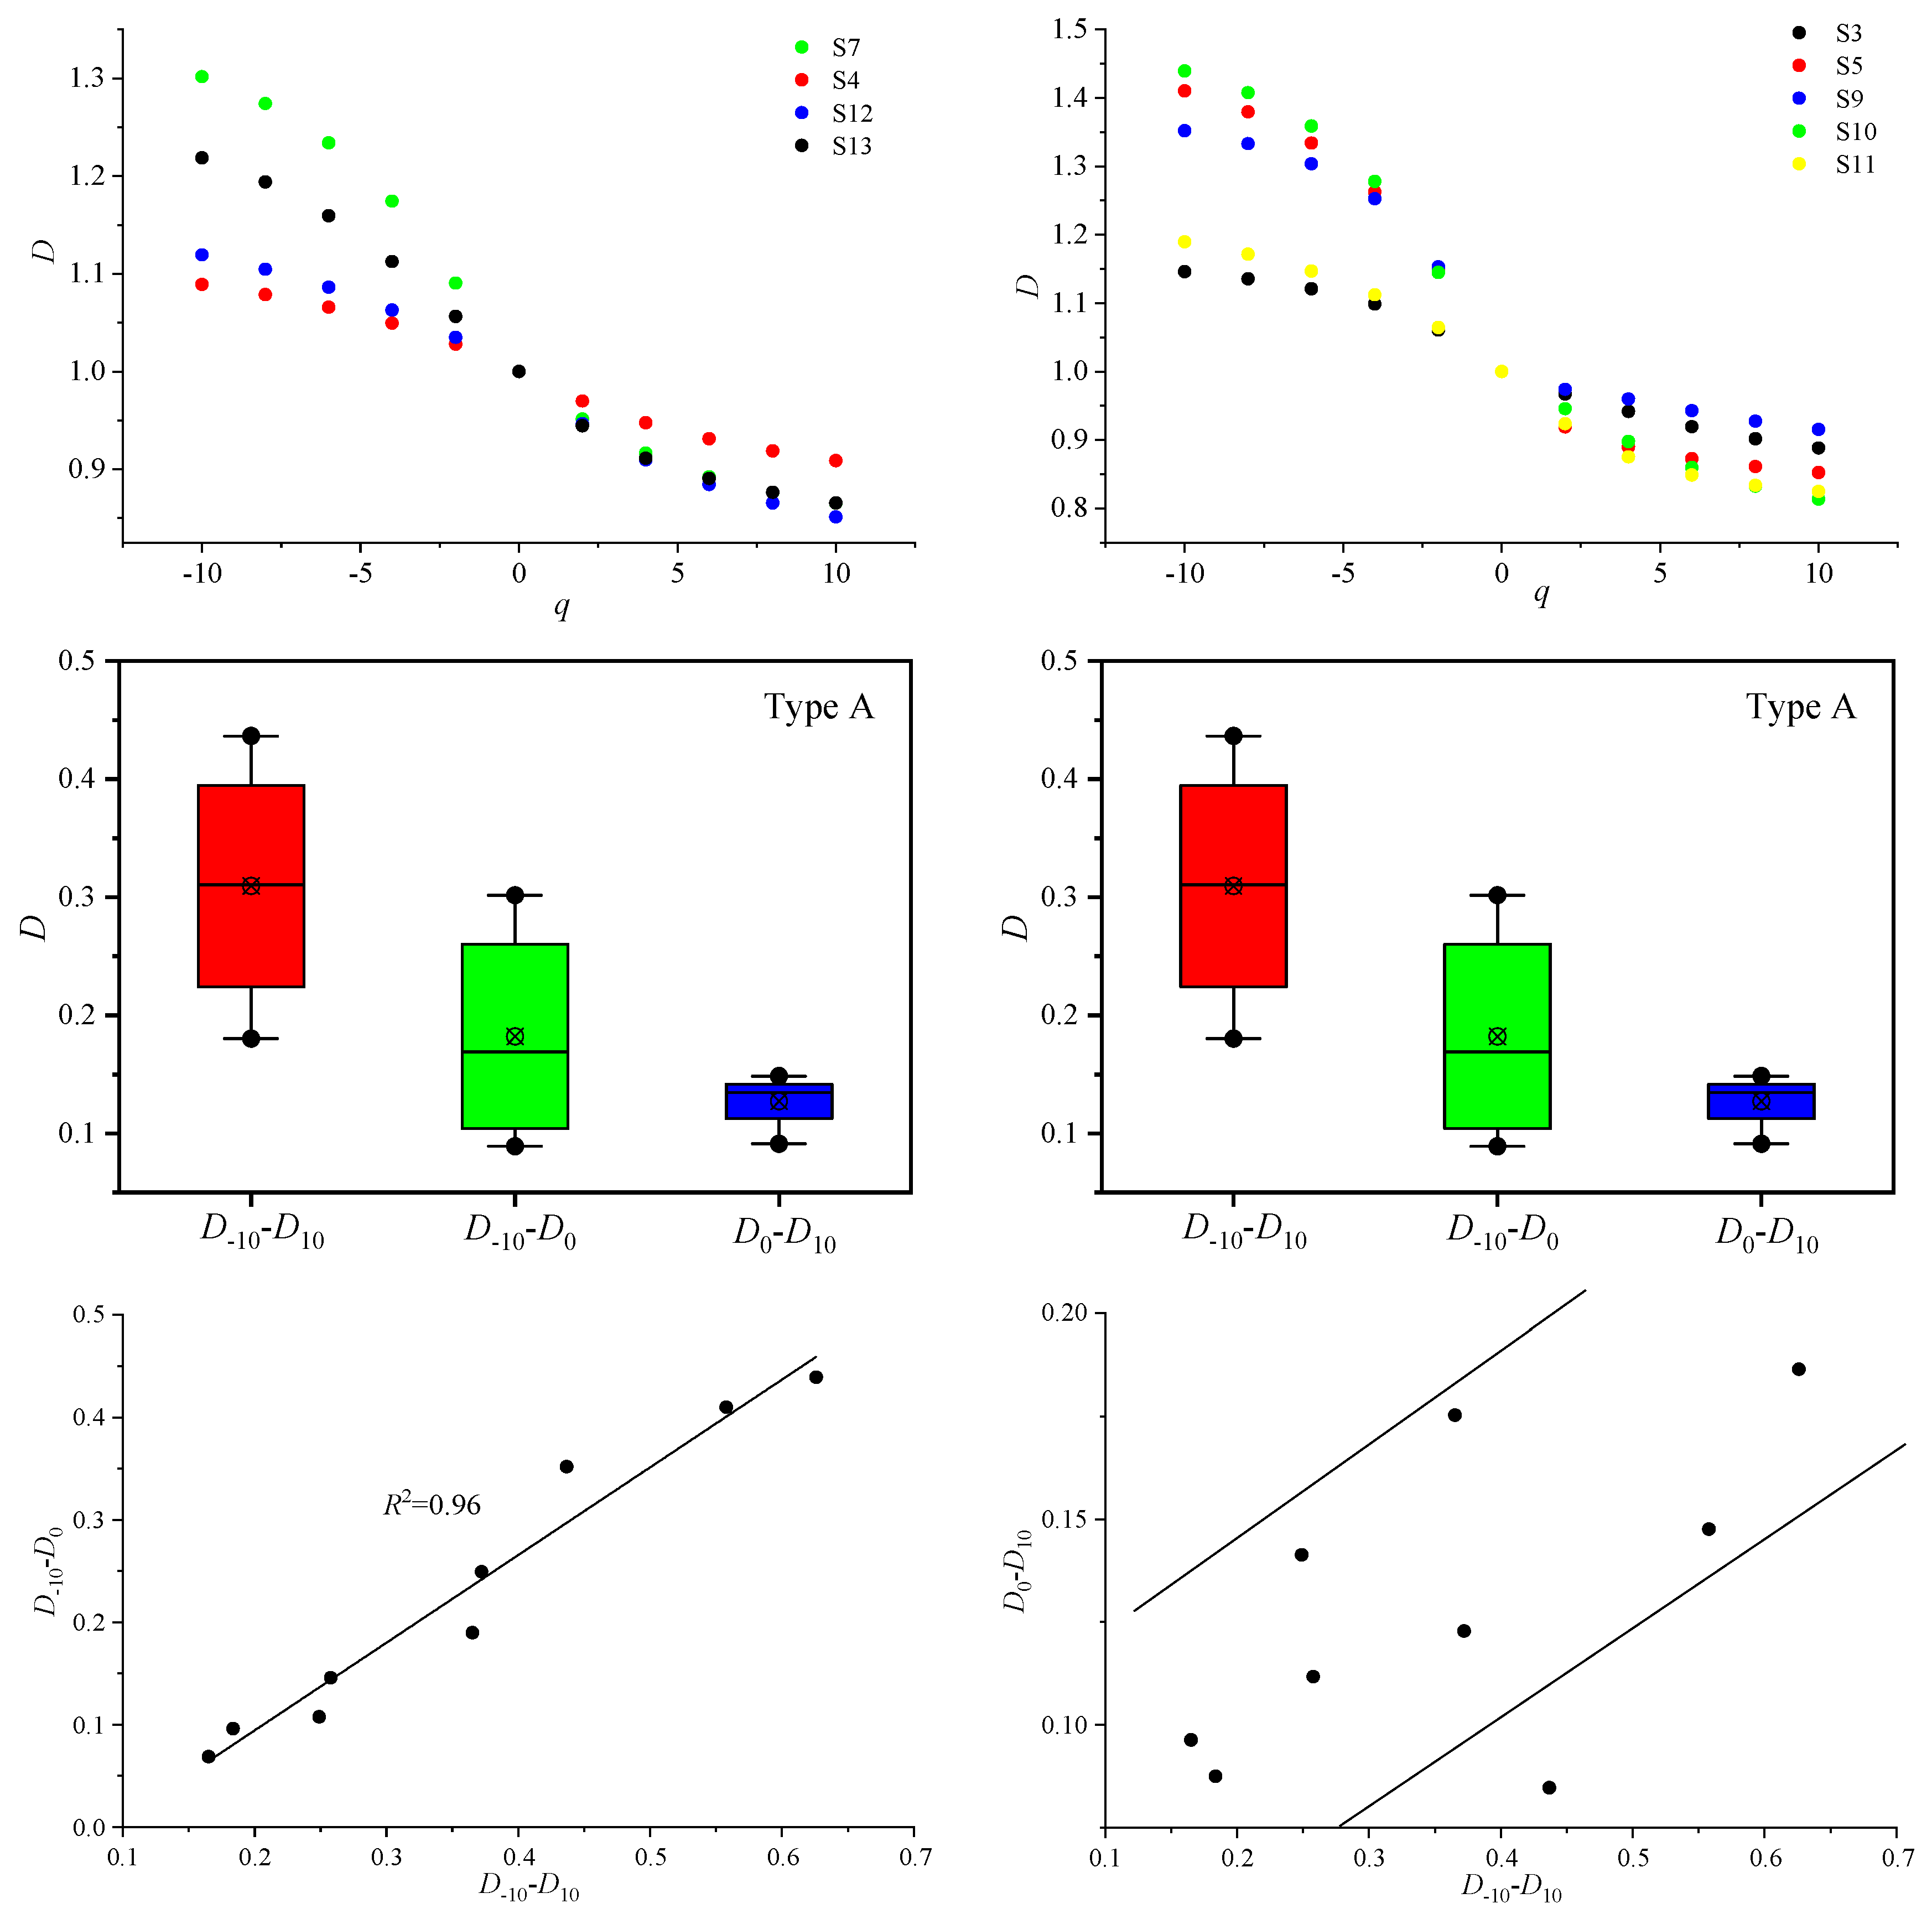
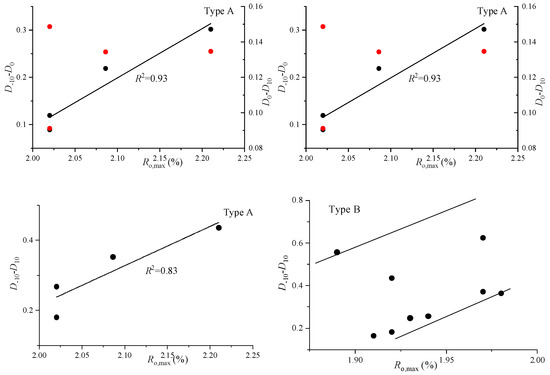
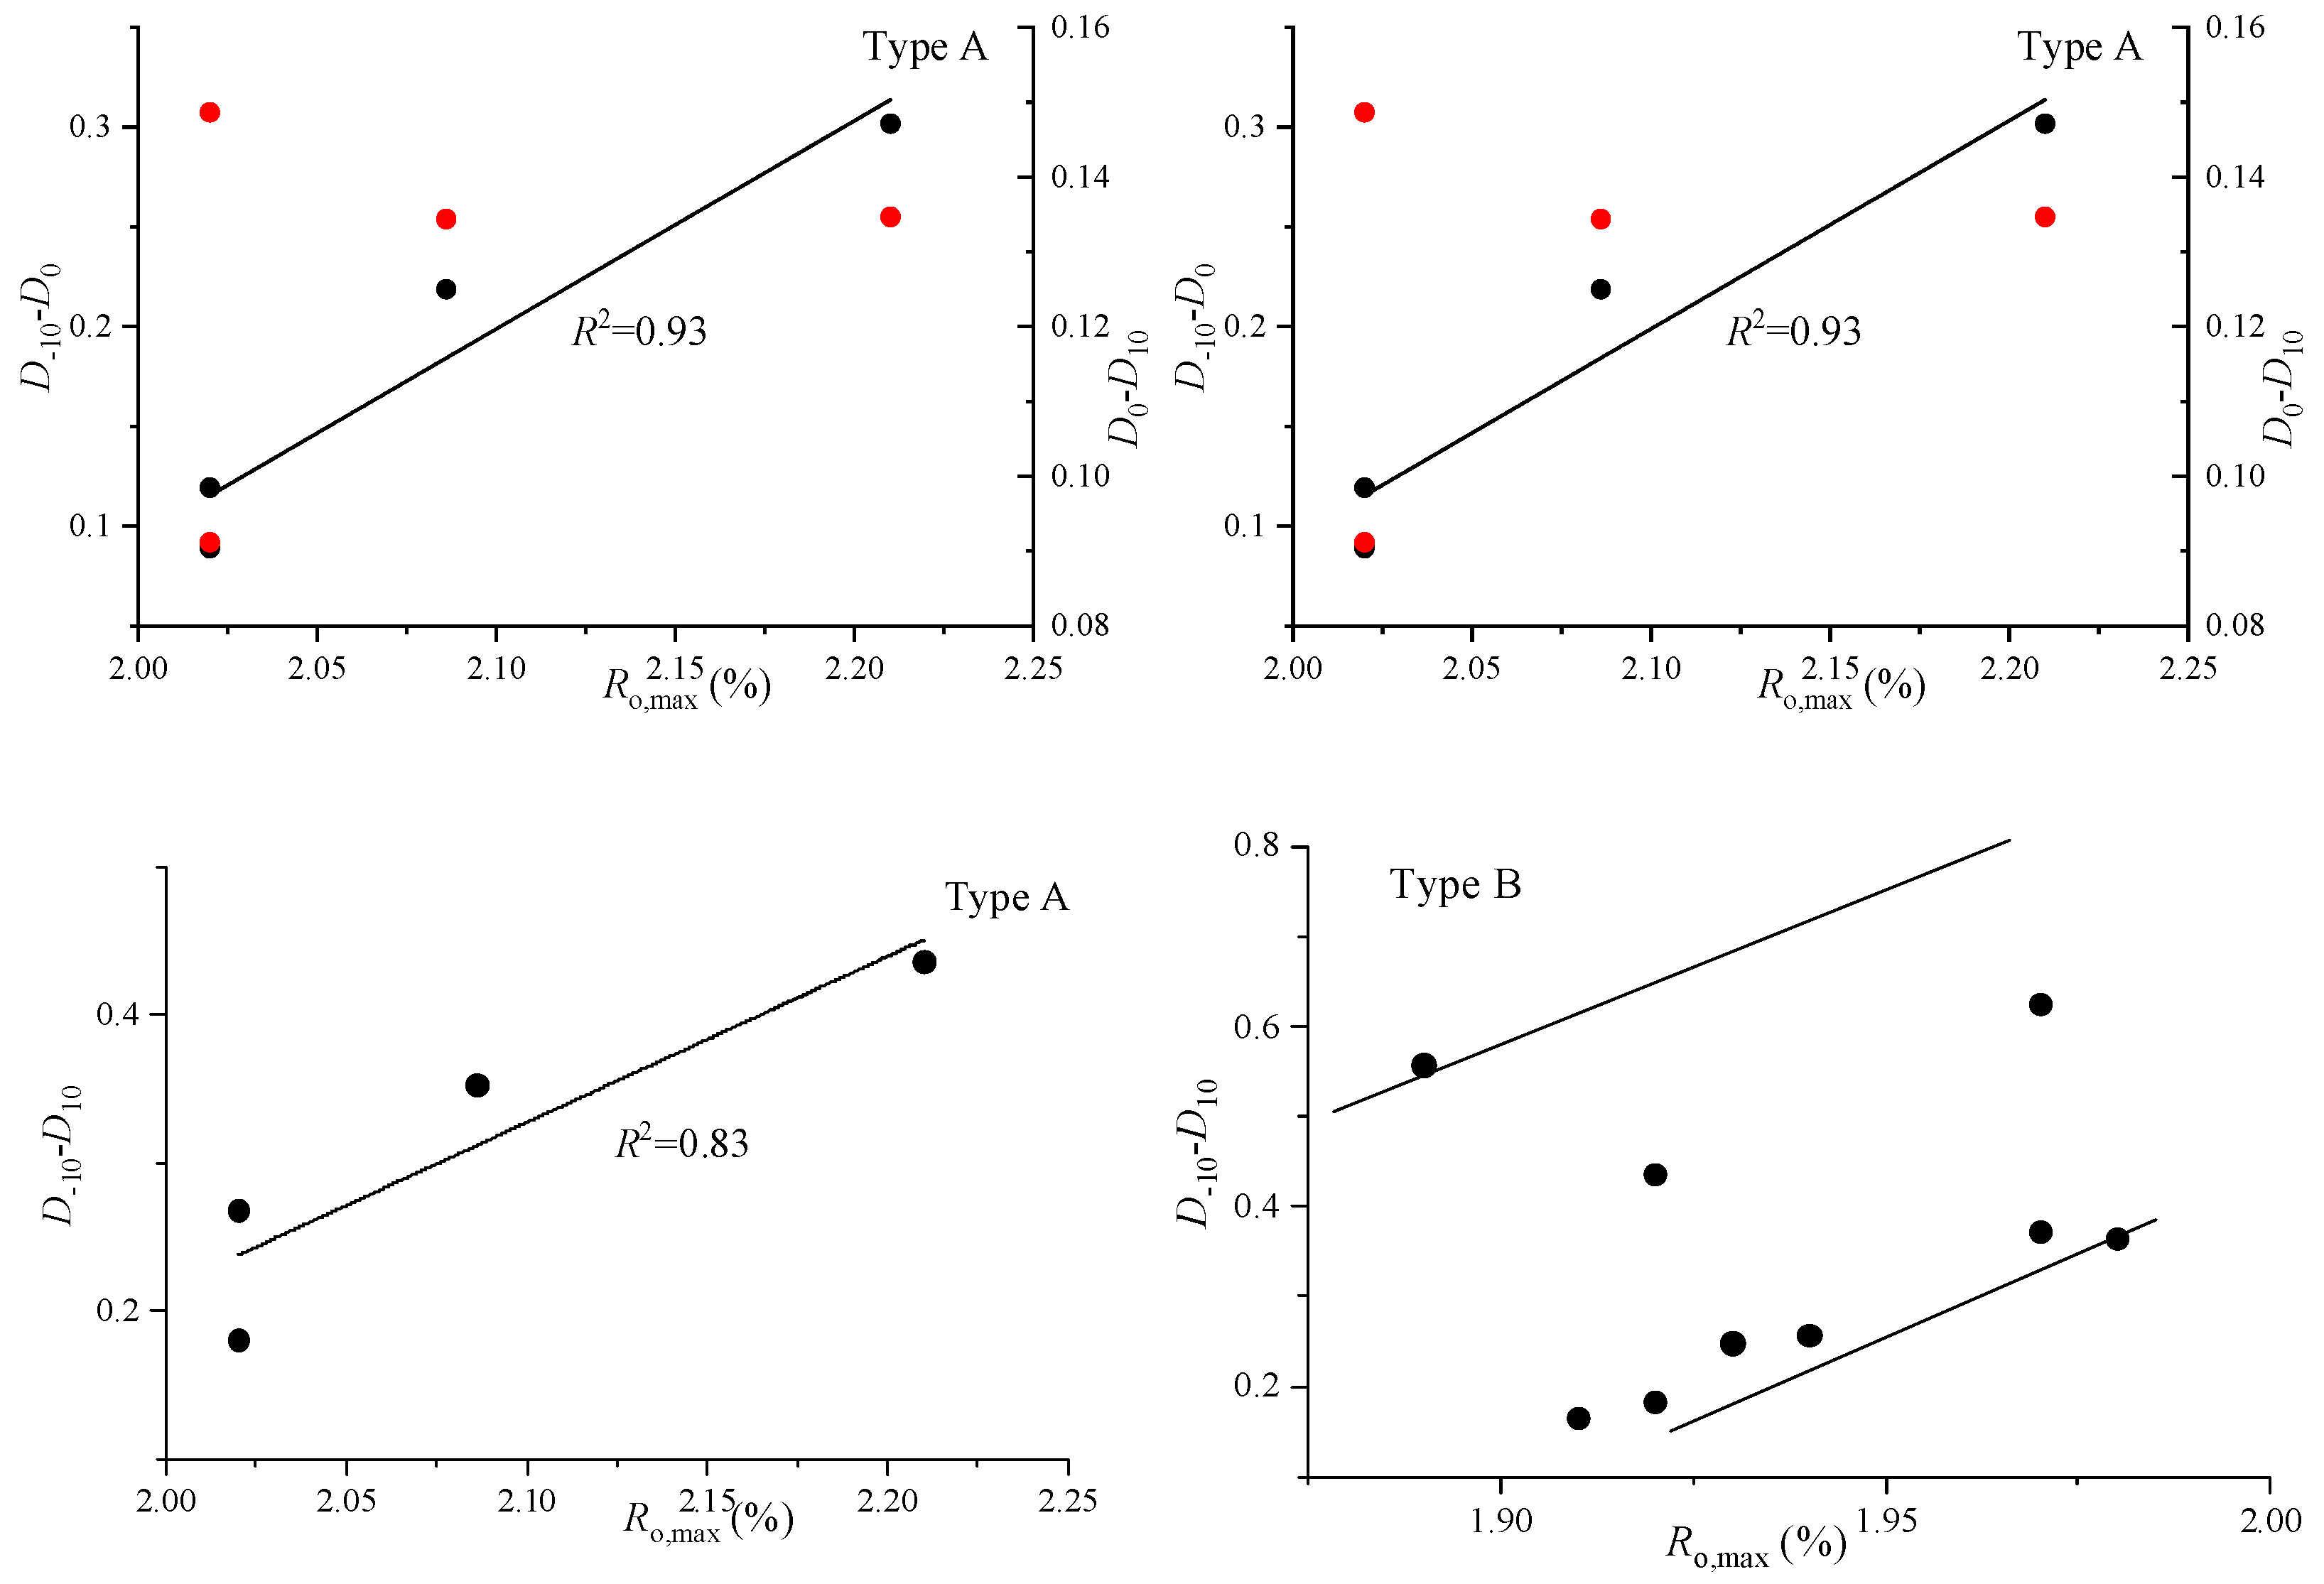
Based on the formula, the multi-fractal characteristics of the selected samples were studied (Figure 9). The multi-fractal curves of the selected samples mostly exhibit a distinct inverse S-shape, with the left-side width generally significantly larger than the right-side width, indicating that all samples exhibit clear multifractal characteristics. The fractal dimension values of Type B range from 0.17 to 0.63, and its spectrum width is notably larger than that of Type A. This further demonstrates significant differences in the multi-fractal characteristics of pore-fracture structures among different types. The results shows that the Dmin–D0 values of Type B (ranging from 0.06 to 0.44, with an average of 0.23) are generally larger than those of Type A (Dmin–D0 ranging from 0.08 to 0.3, with an average of 0.18). This indicates that the heterogeneity in the low-value region of pore volume distribution in Type B is stronger than that in Type A, which is primarily affected by its more complex pore structure. The figure also reveals that both Dmin–D0 and D0–Dmax exhibit positive correlations with Dmin–Dmax. However, the correlation between Dmin–D0 and Dmin–Dmax is stronger, suggesting that the low-value region of pore volume dominates the overall heterogeneity of pore distribution.
Figure 9.
Characterization and Correlation Analysis of Multi-fractal Parameters.
3.4. Influencing Factors of Micropore Fractal Dimension
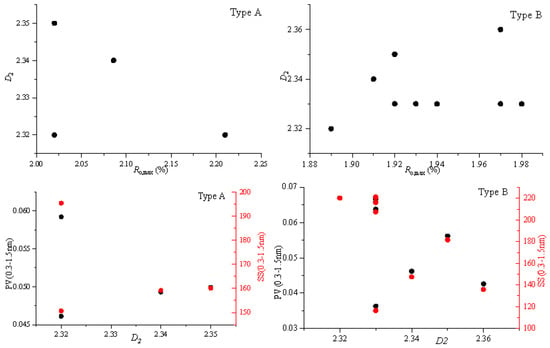
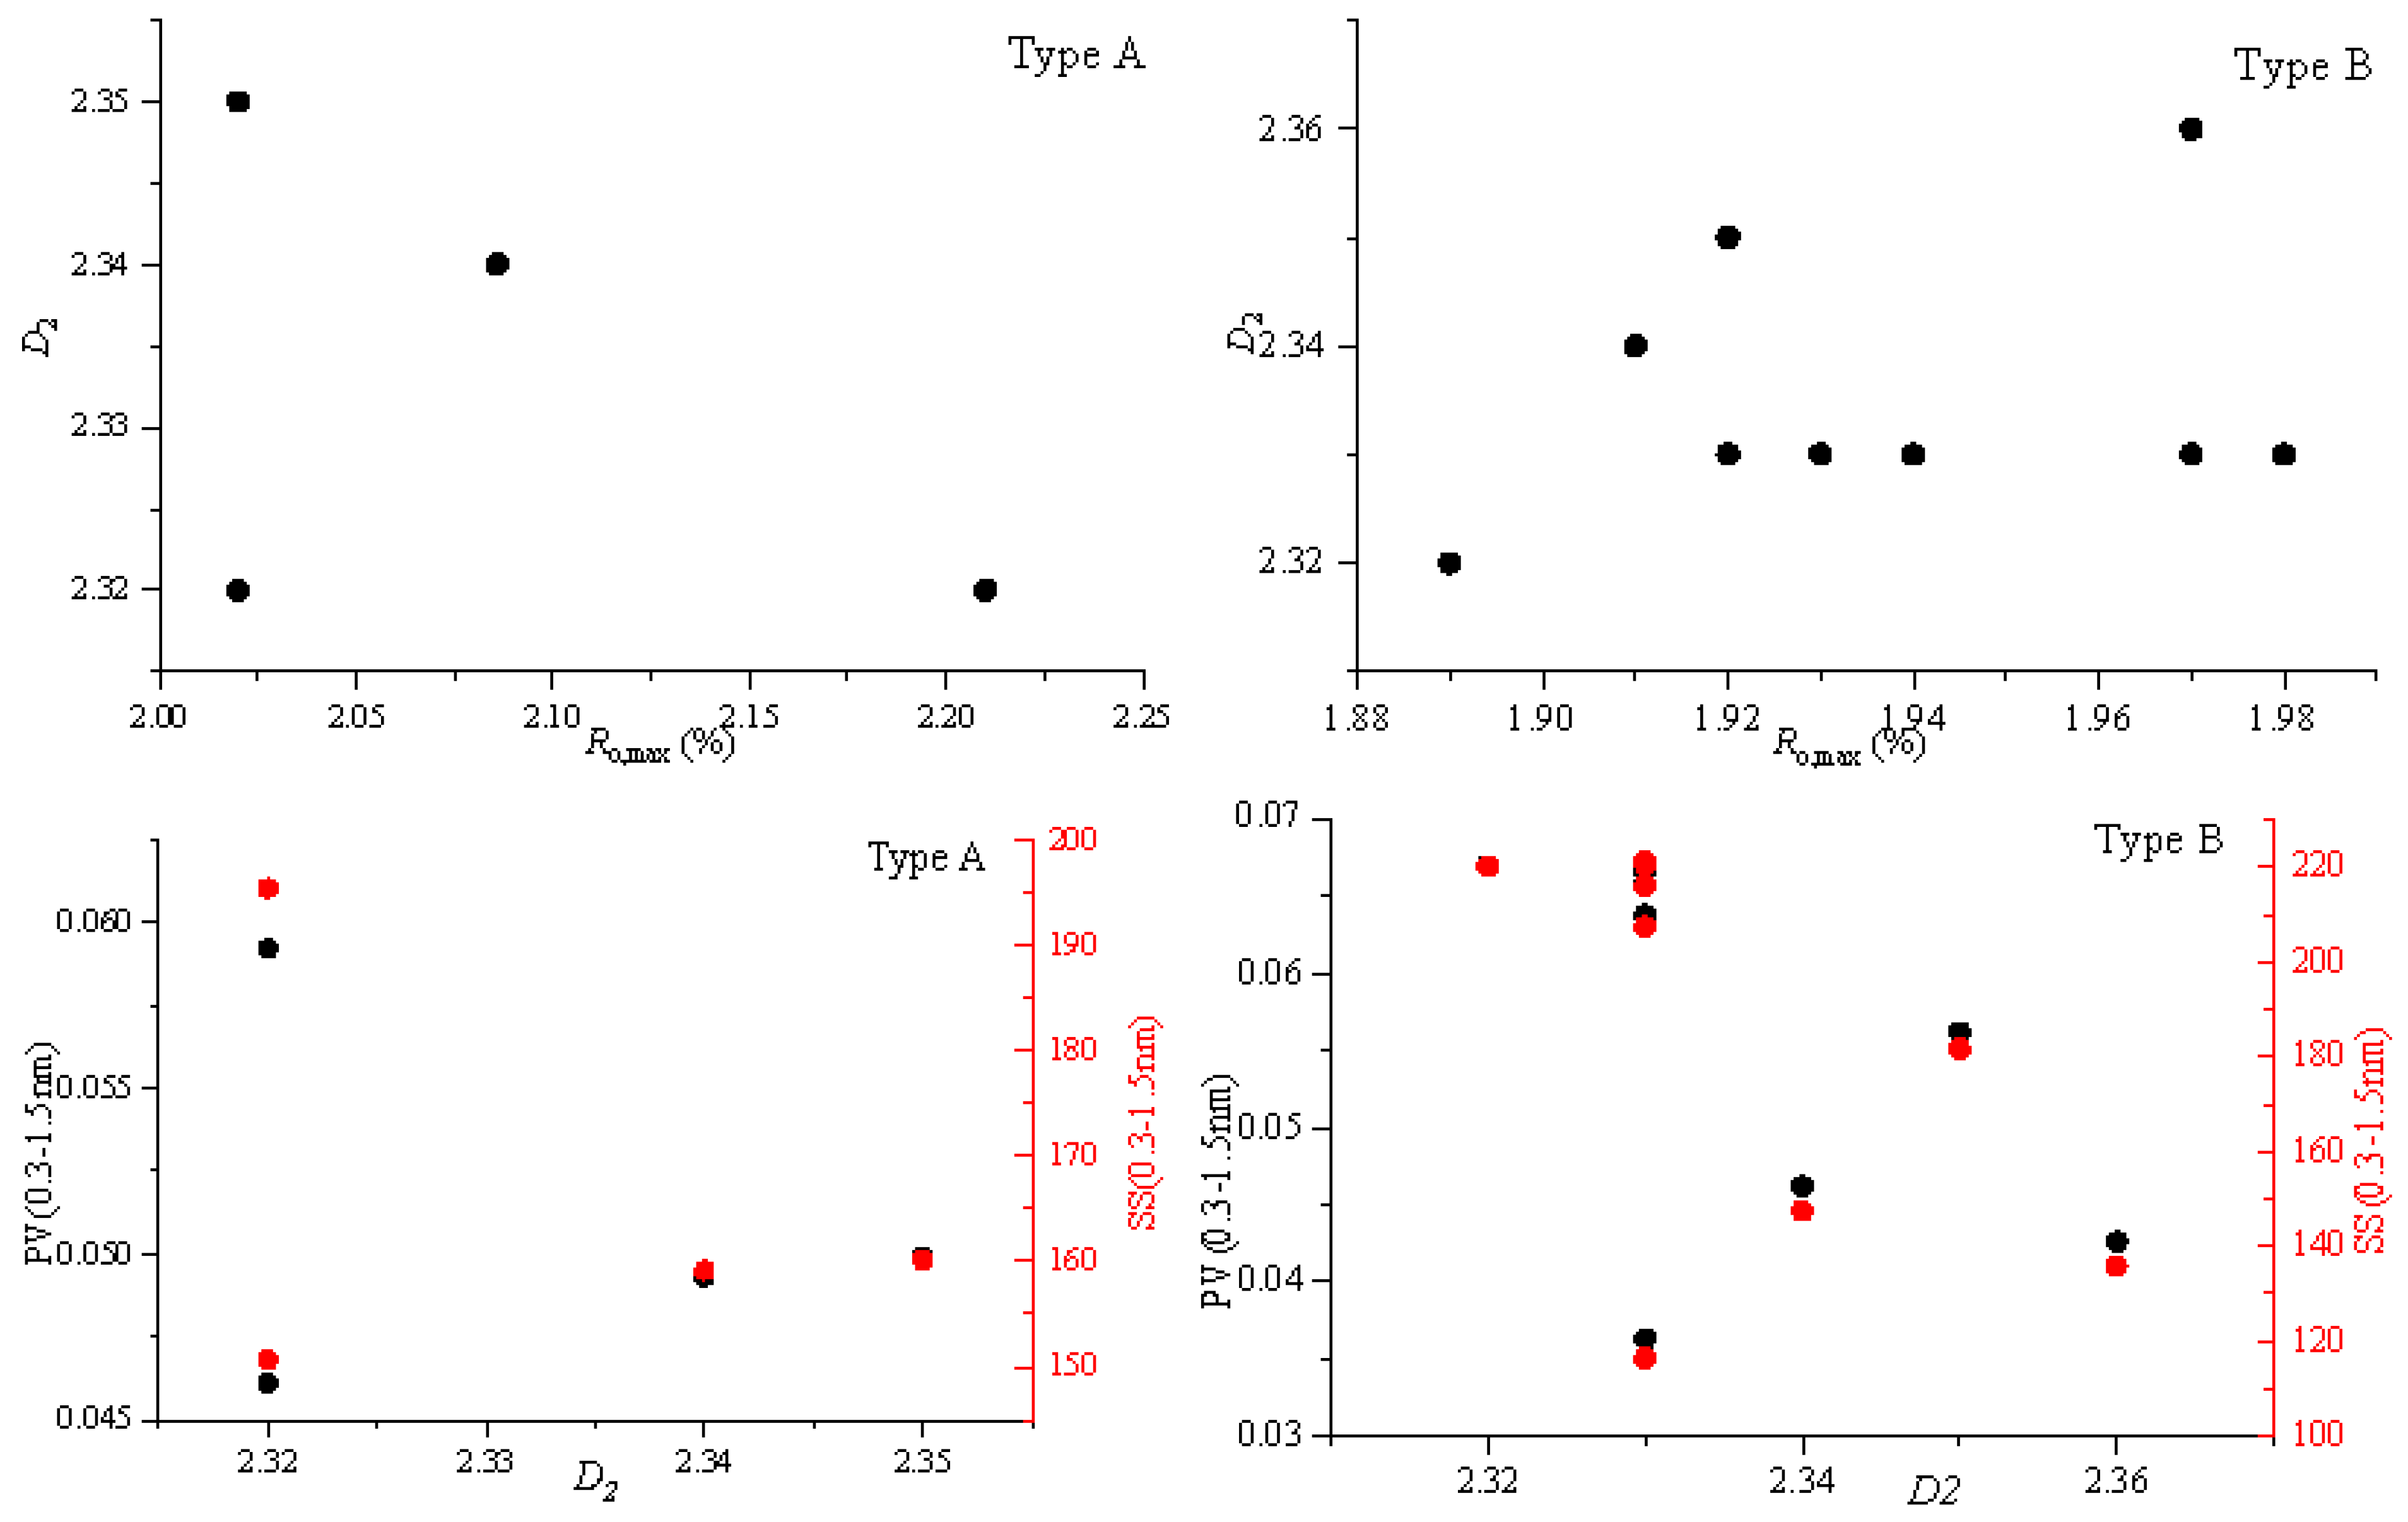
The correlation analysis between vitrinite reflectance (Ro, max) and fractal dimension D2 indicates a weak negative correlation between the two. This phenomenon reveals the dual effects of thermal evolution on the complexity of micropore surfaces: on the one hand, with increasing coal rank, the aromatization and condensation of organic matter are enhanced, potentially generating new, irregularly shaped ultramicropores, which tend to increase heterogeneity; on the other hand, strong thermal compaction and the ordered rearrangement of organic molecules can cause some small pores to collapse or merge, effectively ‘smoothing’ the pore surfaces. In the samples of this study, the latter effect slightly predominates, resulting in a gradual decrease of D2 with the deepening of thermal evolution, indicating that micropore surface structures tend to become uniform in advanced metamorphic stages. However, the weak correlation also suggests that Ro, max is not the sole factor affecting D2, and differences in microscopic components as well as local thermal stress distribution may together lead to the data dispersion (Figure 10).
Figure 10.
Relationship between multi-fractal dimension and Ro,max.
A more significant and systematic relationship with key pore structure parameters is exhibited by the single-fractal dimension D2, characterized by a stable negative correlation with both the CO2-TPV and TSS. This indicates that the increase in micropore volume and specific surface area in medium-high rank coal reservoirs does not rely on the enhancement of pore surface complexity, but rather stems from a significant increase in the number of pores. As pores develop with high density and relatively regular shapes, they can provide substantial storage space and adsorption sites while maintaining a relatively low surface fractal dimension, i.e., exhibiting higher structural homogeneity. A positive correlation with the average micropore diameter is observed for D2, indicating that a slight increase in pore size is accompanied by a significant increase in surface complexity. This is likely because an increase in the average pore size leads to greater diversity in pore morphology, resulting in more complex pore types such as ink-bottle pores and interconnected slit pores, thereby enhancing heterogeneity. There is a significant positive correlation between D2 and the percentage of specific surface area contributed by pores in the 0.6–1.50 nm range (R2 = 0.89), while it is negatively correlated with the percentage from pores <0.6 nm. This key finding reveals that pores within the 0.6–1.50 nm scale are the primary contributors to the surface heterogeneity of the micropore system, and their development directly controls the value of D2. As coal rank increases, the dominant pore size for micropore development shifts to <0.6 nm. Pores within this scale possess relatively more regular and uniform surface characteristics, ultimately leading to a decrease in D2.
In summary, the fractal characteristics of micropores are primarily governed by the pore structure itself, specifically the evolution of the pore size distribution and the number of pores, while the thermal maturity plays an indirect role by influencing these structural parameters. The micropore fractal dimension D2 serves as a comprehensive parameter that effectively quantifies the degree of heterogeneity of micropore surfaces in coal reservoirs. lower D2 value often indicates a higher density of regular ultra-micropores within the reservoir, which is more favorable for forming high-quality CBM reservoirs characterized by high adsorption capacity and a homogeneous adsorption field (Figure 11).
Figure 11.
Affecting mechanisms for single-fractal dimension.
4. Conclusions
This study highlights the significant impact of thermal maturity on the micropore structure and fractal characteristics of coal, particularly in the medium-to-high rank coals from the Benxi Formation of the eastern Ordos Basin.
- (1)
- Thermal maturity leads to a reduction in specific surface area and pore volume due to pore collapse and compaction. Although new micropores form at higher coal ranks, their development is insufficient to compensate for the loss of pore volume caused by thermal maturation.
- (2)
- Fractal analysis indicates that thermal maturity reduces the surface heterogeneity of micropores, making the pore structure more irregular and complex at higher coal ranks. This increased surface irregularity can affect the coal’s gas adsorption capacity.
- (3)
- Despite the overall reduction in pore volume, the formation of new micropores at higher ranks still allows for methane adsorption. This finding is crucial for identifying potential “sweet spot” zones for coalbed methane exploration, where methane storage and production are optimized.
- (4)
- Thermal maturity is a key factor in the evolution of coal’s micropore structure. The physical and chemical changes that occur during coalification influence the coal’s ability to store and release methane, which is important for assessing the methane production potential in deep coal seams.
Author Contributions
Methodology, Z.W., J.S. and P.Z.; Formal analysis, Z.W. and J.S.; Resources, Z.W., J.S., P.Z. and V.A.; Data curation, Z.Z.; Writing—original draft, Z.Z.; Writing—review and editing, T.Y. and V.A.; Supervision, P.Z.; Funding acquisition, T.Y. All authors have read and agreed to the published version of the manuscript.
Funding
This research was supported by the Open Project Funding from the Geophysical Survey Team of Shandong Coalfield Geological Bureau (grant number 2025-003).
Data Availability Statement
The original contributions presented in this study are included in the article. Further inquiries can be directed to the corresponding author.
Conflicts of Interest
The authors declare no conflicts of interest.
References
- Yu, L.; Wang, D.; Feng, X.; Gu, X.; Chen, M.; Wu, X.; Kong, J. Discussion on the Production Mechanism of Deep Coalbed Methane in the Eastern Margin of the Ordos Basin. Energy Explor. Exploit. 2025, 43, 118–141. [Google Scholar] [CrossRef] [Scilit]
- Chen, B.; Li, S.; Tang, D.; Pu, Y.; Zhong, G. Evaluation of Recoverable Potential of Deep Coalbed Methane in the Linxing Block, Eastern Margin of the Ordos Basin. Sci. Rep. 2024, 14, 9192. [Google Scholar] [CrossRef] [Scilit]
- Li, S.; Tang, D.Z.; Pan, Z.J.; Xu, H.; Tao, S.; Liu, Y.F.; Ren, P.F. Geological Conditions of Deep Coalbed Methane in the Eastern Margin of the Ordos Basin, China: Implications for Coalbed Methane Development. J. Nat. Gas Sci. Eng. 2018, 53, 394–402. [Google Scholar] [CrossRef] [Scilit]
- Tao, S.; Pan, Z.; Tang, S.; Chen, S. Current Status and Geological Conditions for the Applicability of CBM Drilling Technologies in China: A Review. Int. J. Coal Geol. 2019, 202, 95–108. [Google Scholar] [CrossRef] [Scilit]
- Xu, F.; Hou, W.; Xiong, X.; Xu, B.; Wu, P.; Wang, H.; Feng, K.; Yun, J.; Li, S.; Zhang, L.; et al. The Status and Development Strategy of Coalbed Methane Industry in China. Pet. Explor. Dev. 2023, 50, 765–783. [Google Scholar] [CrossRef] [Scilit]
- Li, S.; Qin, Y.; Tang, D.; Shen, J.; Wang, J.; Chen, S. A Comprehensive Review of Deep Coalbed Methane and Recent Developments in China. Int. J. Coal Geol. 2023, 279, 104369. [Google Scholar] [CrossRef] [Scilit]
- Ji, L.; Yu, H.; Wang, X.; Grigore, M.; French, D.; Gözükara, Y.; Yu, J.; Zeng, M. CO2 Sequestration by Direct Mineralisation Using Fly Ash from Chinese Shenfu Coal. Fuel Process. Technol. 2017, 156, 429–437. [Google Scholar] [CrossRef] [Scilit]
- Xu, K.; Hu, S.; Zhang, L.; Li, H.; Chen, Y.; Xiong, Z.; Xu, J.; Jiang, L.; Wang, Y.; Su, S.; et al. Effect of Temperature on Shenfu Coal Pyrolysis Process Related to Its Chemical Structure Transformation. Fuel Process. Technol. 2021, 213, 106662. [Google Scholar] [CrossRef] [Scilit]
- Ma, L.; Yang, F.; Yang, J.; Cui, Y.; Wang, W.; Liu, C.; Zhang, B.; Yang, J.; Tao, S. Gas Content and Gas Occurrence Mechanism of Deep Coal Seams in the Shenfu-Linxing Block. Energies 2025, 18, 699. [Google Scholar] [CrossRef] [Scilit]
- Fu, H.; Tang, D.; Xu, T.; Xu, H.; Tao, S.; Li, S.; Yin, Z.; Chen, B.; Zhang, C.; Wang, L. Characteristics of Pore Structure and Fractal Dimension of Low-Rank Coal: A Case Study of Lower Jurassic Xishanyao Coal in the Southern Junggar Basin, NW China. Fuel 2017, 193, 254–264. [Google Scholar] [CrossRef] [Scilit]
- Hu, B.; Cheng, Y.; Pan, Z. Classification Methods of Pore Structures in Coal: A Review and New Insight. Gas Sci. Eng. 2023, 110, 204876. [Google Scholar] [CrossRef] [Scilit]
- Yang, C.; Meng, Y.; Li, X.; Nie, B.; Zhu, F. Effects of Nanoscale Pore Structure Characteristics on Coalbed Methane Diffusion. J. Nanosci. Nanotechnol. 2017, 17, 6347–6355. [Google Scholar] [CrossRef] [Scilit]
- Li, Z.; Ren, T.; Li, X.; Cheng, Y.; He, X.; Lin, J.; Qiao, M.; Yang, X. Full-Scale Pore Structure Characterization of Different Rank Coals and Its Impact on Gas Adsorption Capacity: A Theoretical Model and Experimental Study. Energy 2023, 277, 127621. [Google Scholar] [CrossRef] [Scilit]
- Dong, K.; Zhong, D.; Lu, Y.; Yan, J.; Dai, W. Facilitating Desorption and Diffusion of Coalbed Methane by Wetting-Corrosion: Perspectives from the Change of Pore Structure. Gas Sci. Eng. 2023, 119, 205138. [Google Scholar] [CrossRef] [Scilit]
- Niu, Z.; Li, J.; Yao, P.; Zhang, J.; Sun, S.; Liu, W.; Cui, S.; Sun, J. Heterogeneity of Pore and Fracture Structure in Coal Reservoirs by Using High-Pressure Mercury Intrusion and Removal Curve. Processes 2023, 11, 3120. [Google Scholar] [CrossRef] [Scilit]
- He, J.; Wang, B.; Zhang, G. Influence of Microwave-Assisted Supercritical Carbon Dioxide Treatment on the Pore Structure of Low-Rank Coal. ACS Omega 2024, 9, 45117–45126. [Google Scholar] [CrossRef] [Scilit]
- Zhang, N.; Wang, S.; Wu, J.; Li, Z.; Wang, X. Full-Scale Pore Structure Characterization and Its Impact on Methane Adsorption Capacity and Seepage Capability: Differences between Shallow and Deep Coal from the Tiefa Basin in Northeastern China. Fractal Fract. 2024, 8, 48. [Google Scholar] [CrossRef] [Scilit]
- Ding, Y.; Li, B.; Li, J.; Tang, C.; Song, H.; Yang, J. Characteristics of CO2 Adsorption Influenced by Coal Pore Structure-Temperature Interaction, Including Its Implications for Geological Storage. Chem. Eng. J. 2025, 518, 164626. [Google Scholar] [CrossRef] [Scilit]
- Murugesu, M.; Prasad, M.; Pylypenko, S. Surface and Bulk Characterization of Reservoir and Cap-Rocks: Past, Present, and Future. J. Vac. Sci. Technol. A 2020, 38, 050801. [Google Scholar] [CrossRef] [Scilit]
- Zhang, X.; Huang, G.; Shu, Z.; Tong, Y. Study on Key Influencing Factors of Competitive Adsorption of Coalbed Methane by Carbon Dioxide Displacement. Front. Chem. 2022, 10, 998592. [Google Scholar] [CrossRef] [Scilit]
- Zhang, J.; Huang, H.; Zhou, W.; Sun, L.; Huang, Z. Study on Pore Structure of Tectonically Deformed Coals by Carbon Dioxide Adsorption and Nitrogen Adsorption Methods. Energies 2025, 18, 887. [Google Scholar] [CrossRef] [Scilit]
- Su, X.; Cheng, Y.; Cheng, X. Methane Occurrence Characteristics Influenced by Temperature: Investigating the Mechanism of Molecular Kinetic Energy. Nat. Resour. Res. 2025, 34, 2627–2641. [Google Scholar] [CrossRef] [Scilit]
- Zhang, M.; Liu, Q.; Wang, X.; Dong, Z. Multiple fractal characterization of medium-high rank coal integrating mercury intrusion porosimetry, N2 and CO2 adsorption experiments. J. China Coal Soc. 2024, 49, 2394−2404. [Google Scholar]
- Zhang, Z.; Qin, Y.; Wang, G.; Sun, H.; You, Z.; Jin, J.; Yang, Z. Evaluation of coal body structures and their distributions by geophysical logging methods: Case study in the Laochang block, eastern Yunnan, China. Nat. Resour. Res. 2021, 30, 2225–2239. [Google Scholar] [CrossRef] [Scilit]
- Zhao, J.L.; Tang, D.Z.; Xu, H.; Li, Y.; Li, S.; Tao, S.; Liu, Z.X. Characteristic of In Situ Stress and Its Control on the Coalbed Methane Reservoir Permeability in the Eastern Margin of the Ordos Basin, China. Rock Mech. Rock Eng. 2016, 49, 3307–3322. [Google Scholar] [CrossRef] [Scilit]
- Li, Z.B.; Ren, T.; Li, X.C.; Qiao, M.; Yang, X.H.; Tan, L.H.; Nie, B.S. Multi-scale pore fractal characteristics of differently ranked coal and its impact on gas adsorption. Int. J. Min. Sci. Technol. 2023, 33, 389–401. [Google Scholar] [CrossRef] [Scilit]
- GB/T 19222-2003; Sampling of Coal Petrology. Chinese National Standard; Standards Press of China (SPC): Beijing, China, 2003.
- GB/T 18023-2000; Classification of Macrolithotype for Bituminous Coal. Standards Press of China (SPC): Beijing, China, 2000.
- GB/T 6948-1998; Microscopical Determination of the Reffectance of Vitrinite in Coal. Chinese National Standard. Standards Press of China (SPC): Beijing, China, 1998.
- GB/T 212-2001; Proximate Analysis of Coal. Chinese National Standard. Standards Press of China (SPC): Beijing, China, 2001.
- Zhang, Z.; Qin, Y.; Yang, Z.; Li, G.; You, Z. Primary Controlling Factors of Coalbed Methane Well Productivity and High Productive Well Patterns in Eastern Yunnan and Western Guizhou, China. Nat. Resour. Res. 2023, 32, 2711–2726. [Google Scholar] [CrossRef] [Scilit]

Disclaimer/Publisher’s Note: The statements, opinions and data contained in all publications are solely those of the individual author(s) and contributor(s) and not of MDPI and/or the editor(s). MDPI and/or the editor(s) disclaim responsibility for any injury to people or property resulting from any ideas, methods, instructions or products referred to in the content. |
© 2026 by the authors. Licensee MDPI, Basel, Switzerland. This article is an open access article distributed under the terms and conditions of the Creative Commons Attribution (CC BY) license.