Article

Evaluation Methods for Aeration Parameters in Flotation Separation Modelling with Neural Network Applications


by
Tatiana Aleksandrova
1,
Bulat Gatiatullin
1,
Valentin Kuznetsov
1,* and
Shlykov Nikita
2
1
Mineral Processing Department, Empress Catherine II Saint-Petersburg Mining University, Saint-Petersburg 199106, Russia
2
Department of Machines and Automated Systems, Saint Petersburg State University of Industrial Technologies and Design, Saint-Petersburg 191186, Russia
*
Author to whom correspondence should be addressed.
Processes 2026, 14(4), 728; https://doi.org/10.3390/pr14040728
Submission received: 19 December 2025 / Revised: 9 February 2026 / Accepted: 20 February 2026 / Published: 23 February 2026
(This article belongs to the Special Issue Mineral Processing Equipments and Cross-Disciplinary Approaches)

Abstract

This study is dedicated to the application of neural network technologies for determining aeration parameters in order to predict the efficiency of flotation separation. Within the framework of the research, digital technology solutions were actively employed, including a neural network for segmentation at the stage of determining the granulometric characteristics of bubbles and a convolutional neural network module for determining the froth layer height. An analysis was conducted to examine the variation in the statistical parameter d32, which characterizes the bubble size distribution, as a function of flotation time and measurement height. The analysis revealed that the d32 values determined by neural network processing remained within the range of acceptable dispersion and are therefore suitable for subsequent analytical procedures. Furthermore, a comparative evaluation of the obtained size distributions indicated the absence of statistically significant differences between the neural network measurements and manually labelled data with a p-value equal to 0.64. A neural network for object detection was used to record the height of the froth layer during the experiment to obtain a time series, that were subsequently processed with data processing approaches including Savitzky–Golay and Singular Spectra Analysis. Based on the analysis of the sum of the obtained dependences, a criterion is proposed and modeled for evaluating the selectivity of frother by connecting the diameter of bubble in pulp and bubble in froth. Based on the modeling results, it was determined that the optimal range of bubble sizes and froth size ratios for MIBC is constrained to d32 values ranging from 1.058 to 1.089 mm, with the ratio of froth bubble radius to d32 ranging from 1.302 to 2.098, depending on the floatability ratios of the respective fractions. When employing OPF, the values for d32 fall within the interval of 0.868 to 1.113 mm, while the Dₓ parameter ranges from 0.559 to 0.931.

1. Introduction

Flotation methods of beneficiation have become widely used in mineral processing due to their versatility and selectivity, which are achieved using flotation reagents [1,2].
Meanwhile, flotation, as a complex heterophase process, has many factors affecting it. That opens a wide range of possibilities for its optimization and makes it one of the most promising areas of modernization along with disintegration processes [3,4,5]. Flotation technologies are of particular importance in the concentration of mineral components that serve as trace element markers of ongoing geological processes. The flexibility of reagent regimes enables the selective separation of mineral morphological associations characteristic of a specific genesis, which is highly significant for predicting the location and characteristics of mineral deposits [6,7].
The active development of flotation beneficiation processes is also driven by policies aimed at improving the environmental sustainability of mining operations. In this context, extensive research is being conducted on the processing of waste from the mineral resource sector and on enhancing the overall environmental performance of production facilities [8,9,10].
A significant portion of research is focused on studying the mechanisms of action of reagents that modify the physicochemical properties of mineral surfaces [11,12,13]. This information enables a more precise justification of the reagent regime and directly influences the enhancement of the contrast of the separation attribute—one of the most critical factors in the flotation process.
At the same time, research in this field is not limited to existing reagents. Active development and investigation of new compounds continue, aimed at improving selectivity, along with the pursuit of solutions for optimizing flotation processes [14,15,16].
An equally important component of the flotation system is the gas phase. It performs the transport function during the separation of mineral particles and serves as a carrier of hydrophobic particles, concentrating them in the froth layer. Therefore, the characteristics of the gas phase have a direct impact on the technological performance of flotation and can be considered another key group of factors that warrant thorough investigation [17,18].
One of the direct methods for influencing these factors is the use of reagents from the class of frothers, which reduce bubble coalescence and thereby affect both the bubbles and the froth formed from them. This makes research related to this group of reagents particularly relevant [19].
Coalescence processes, along with the breakup of gas bubbles in the liquid, play an important role in forming local distributions of bubble sizes within the volume of the flotation cell. This significantly affects the probability of collision with mineral particles and, consequently, the recovery of minerals in the froth product. Knowledge of these distributions allows, based on numerical solutions of fluid mechanics equations, the calculation of the specific interfacial area, mass transfer, and the performance of both static and dynamic modeling of the flotation process [20,21].
In addition to this, some modern studies focus on exploring the possibility of using various gases other than air in flotation [22,23]. In this case, changes may be caused both directly by alterations in the physical properties of the supplied gas and by the initiation of various physicochemical processes occurring with the reagents and mineral surfaces.
An essentially alternative approach may be the structural modification of the aeration units of flotation machines, where the diffuser, impeller, and stator play an important role in the parameters of air dispersion [24,25,26]. Significant emphasis in such research is placed on studying the hydrodynamic characteristics of flows inside the apparatus chamber that ensure bubble formation.
The latter would not be possible without the active implementation of digital technologies, which are playing an increasingly important role in the development of both mining in general and beneficiation in particular, enabling the management of technological processes and their comprehensive optimization [27,28]. This makes them worthy of attention from the perspective of their potential use in the planning and conduct of research.
These methods have become especially important today in the improvement of control and optimization tools for the flotation process. Due to its dynamic nature, there is a need for the rapid determination of parameter values related to process efficiency, including aeration parameters. Modern control and measurement systems are focused on the visual analysis of froth using machine vision technologies [29,30]. These approaches allow for the rapid adjustment of the ongoing process by assessing the structural features of the froth phase. However, the challenge in applying such methods lies in the need for fine-tuning algorithms and their high sensitivity to changes in the properties of the raw material. Moreover, the results obtained using these methods are difficult to replicate and use for predicting efficiency on ores from other deposits. Establishing patterns between the parameters of the air phase will improve the accuracy of flotation process models, which will help both to enhance existing automatic control systems and to reduce costs for preliminary flotability studies.
Among the current research directions of particular relevance, studies dedicated to secondary concentration processes within the froth layer, associated with corresponding parameter in flotation kinetics model. Various models have been proposed to describe these phenomena [31]. The model proposed by Neethling represents the most rigorous approach from a first-principles perspective [32]. However, this model necessitates the determination of interfacial surface flux and froth mineralization, which consequently requires knowledge of the bubble size entering the froth layer.
Due to aforementioned points, the aim of this work was to investigate the features of determining aeration parameters using neural network methods. The ultimate objective of this work was to develop a criterion that enables the determination of optimal aeration parameters as a function of the frother type employed, thereby ensuring maximum selectivity in material recovery to the froth phase. Furthermore, the work aims to establish values for the incoming interfacial surface area, which is intended for application in subsequent research efforts directed toward elucidating the correlations with processes occurring within the froth layer.

2. Materials and Methods

2.1. Flotation Kinetics Model

One of the main methods for mathematically describing the flotation beneficiation process is the flotation kinetics model, which is based on an analogy with the kinetic model of a chemical reaction [33]. The first order model is described by Equation (1):
R = R 1 e k t
where R —recovery at time t, fraction units; R —the maximum achievable recovery at t ; k —flotation rate constant, s1; t —flotation time, s.
In turn, the effect of varying the aeration regime can be described by the dependence of the parameter k according to Equation (2):
k = P S b R f
where P —flotability, fraction units; S b —specific aeration intensity parameter, s−1; R f —froth recovery parameter, fraction units.
The floatability parameter P characterizes the tendency of material to flotation processes. This parameter is influenced by mineralogical composition, particle size distribution, and the reagent regime employed. Furthermore, this formulation demonstrates that aeration parameters exert influence on the flotation process across multiple subprocess levels. These effects encompass direct flotation through the attachment of hydrophobic particles to bubbles within the flotation chamber during the elementary flotation act, which is expressed through the parameter S b , and extend to secondary concentration processes within the froth layer, which are likewise affected by aeration characteristics. The latter influence is represented by the froth recovery factor R f , which indicates the fraction of material retained in the froth at the moment of discharge relative to the quantity of material initially transferred to the froth from cell. The parameter S b represents the specific quantity of bubble interfacial surface area within the chamber that participates in the elementary flotation act upon contact with bubbles.
The S b parameter characterizes the specific interfacial area at the gas–liquid boundary per unit cross-sectional area of the flotation cell and is one of the key parameters describing the aeration processes within the apparatus [34]. It can be calculated using Equation (3):
S b = 6 J g d 32
where J g —superficial air velocity, mm/s; d 32 —Sauter bubble size diameter, mm.
Statistical parameter d32, which requires experimental determination and is calculated based on the diameters of individual bubbles according to Equation (4):
d 32 = d n 3 d n 2 = γ i d i 3 γ i d i 2
where d n —diameter of the nth bubble, mm; d i —mean diameter of the ith size fraction, mm; γ i —yield of the ith size fraction, fraction units.
Another important parameter linking aeration parameters with flotation process indicators is the froth layer height, which has a high correlation with aeration parameters. The froth layer height is understood as the average distance from the pulp-froth interface to the boundary of the bubble surface within the froth boundary layer.
The parameter R f included in Equation (2) also implicitly depends on the values of the aeration parameters. The volume of water carried into the froth phase is determined by the S b parameter and the size of the bubbles. Water, present as films on the bubbles and within the Plateau borders formed in the froth, gradually drains from these channels during the residence time of the froth in the flotation cell. Along with the water, solid particles that were mechanically carried into the froth, as well as valuable component particles detached from the bubbles due to their breakup and coalescence, return to the pulp. In turn, the lifetime of the bubbles is determined by the amount of water in the channels between them and the stabilizing effect of the solid phase, directly influencing the optimal froth residence time before it enters the concentrate.
In the work of Zheng, Equation (5) was proposed, allowing the superficial air velocity to be related to the characteristics of the froth layer [35].
J g = ε w 1 α r 2 255.6 ρ g η
where ε w —froth water hold-up, r —radius of the bubble entering the froth layer, m; α —fraction of the air leaving cell as unburst bubbles, fraction units; η —Water dynamic viscosity, Pa s; ρ —water density, kg/m3; g —gravitational acceleration, m/s2.
Parameter α is described by Equation (6), which can be calculated based on froth layer height measurements using neural networks:
α = 1 H H max
where H max —maximum froth layer height, mm; H —froth layer height at the moment of recovery, mm.
The study emphasizes that bubble diameter determination in industrial practice is typically conducted at the surface of the froth layer, a methodology that remains prevalent in contemporary industrial flotation monitoring solutions [36]. However, the presented model requires the diameter of bubbles entering the froth layer, as this parameter governs the characteristics of mass transfer from the chamber to the froth in accordance with Equations (2) and (3). The study notes that, in industrial practice, bubble diameter is typically measured from the surface of the froth layer, whereas the presented model requires the diameter of the bubble entering the froth layer. The referenced article proposes to perform calculations under the assumption of a linear change in bubble diameter with height [35], however the author states that this approach may lead to high measurement errors. For the remaining parameters, reference values under standard conditions may be used.
Thus, in this work, neural network modeling was used to determine two aeration parameters for creating flotation separation models—the froth layer height and the bubble diameter according to Sauter.
The necessity of calculating the diameter of bubbles entering the froth layer is predicated on the occurrence of coalescence processes at the pulp-froth interface, which may result in discrepancies between the diameter measured in the pulp and the diameter of bubbles entering the froth layer [37,38]. The obtained dimensions can be employed for optimizing mass transfer into the froth layer, as well as for calculating interfacial surface area values required for the Neethling model [32].
Thus, the use of neural network models presented in this work makes it possible to determine the values of parameters d 32 and J g , which are necessary for calculating the target parameter S b . The overall structure of the proposed approach is shown in Figure 1.

2.2. Determination of Bubble Size Using Neural Network

A considerable number of computer vision algorithms have been developed for bubble size assessment, both at the froth surface and within the liquid volume [39,40]. However, these approaches are constrained by several significant limitations. The algorithms require parameter adaptation when imaging conditions or bubble sizes change. Furthermore, they encounter considerable difficulty in processing dense bubble flows where distinctive contrast features necessary for object delineation are absent. Manual parameter calibration introduces additional sources of error arising from the subjective nature of filter adjustment procedures.
An alternative technology for bubble image analysis is represented by neural networks, which have recently been implemented for bubble size measurement and have demonstrated superior recognition accuracy compared to classical algorithms [41,42]. Notably, when trained on diverse datasets, these networks are capable of operating without additional adaptation procedures under varying experimental conditions. Consequently, for direct bubble size measurement, the implementation of a machine vision technology based on the YOLO-11 neural network for instance segmentation has been proposed. This particular neural network architecture was selected due to its high capability to process complex visual information, which in the present study consisted of bubble swarms, while maintaining relatively modest computational requirements for signal processing. This characteristic potentially enables the deployment of the model on compact computing devices integrated directly within measurement systems, thereby offering prospects for streamlined operational implementation.
However, neural networks also have disadvantages, which include processing images with a large number of small elements [43], as well as images with densely located objects [44]. These problems have been identified as separate research directions for optimizing the performance of neural networks.
The task of instance segmentation makes it possible to distinguish the boundaries of visually similar elements in an image and to identify the areas occupied by individual objects, which in this work are represented by bubbles [45,46]. A model pre-trained on the standard COCO dataset was further fine-tuned for bubble recognition using 200 original manually annotated bubble images and 600 augmented images generated from the original dataset [47]. The validation dataset comprised 25 annotated images, while the test dataset for network performance evaluation consisted of 25 images. Dataset partitioning was performed through random allocation. The total number of objects across the datasets was 12,479, 1762, and 1813 for the training, validation, and test sets, respectively.
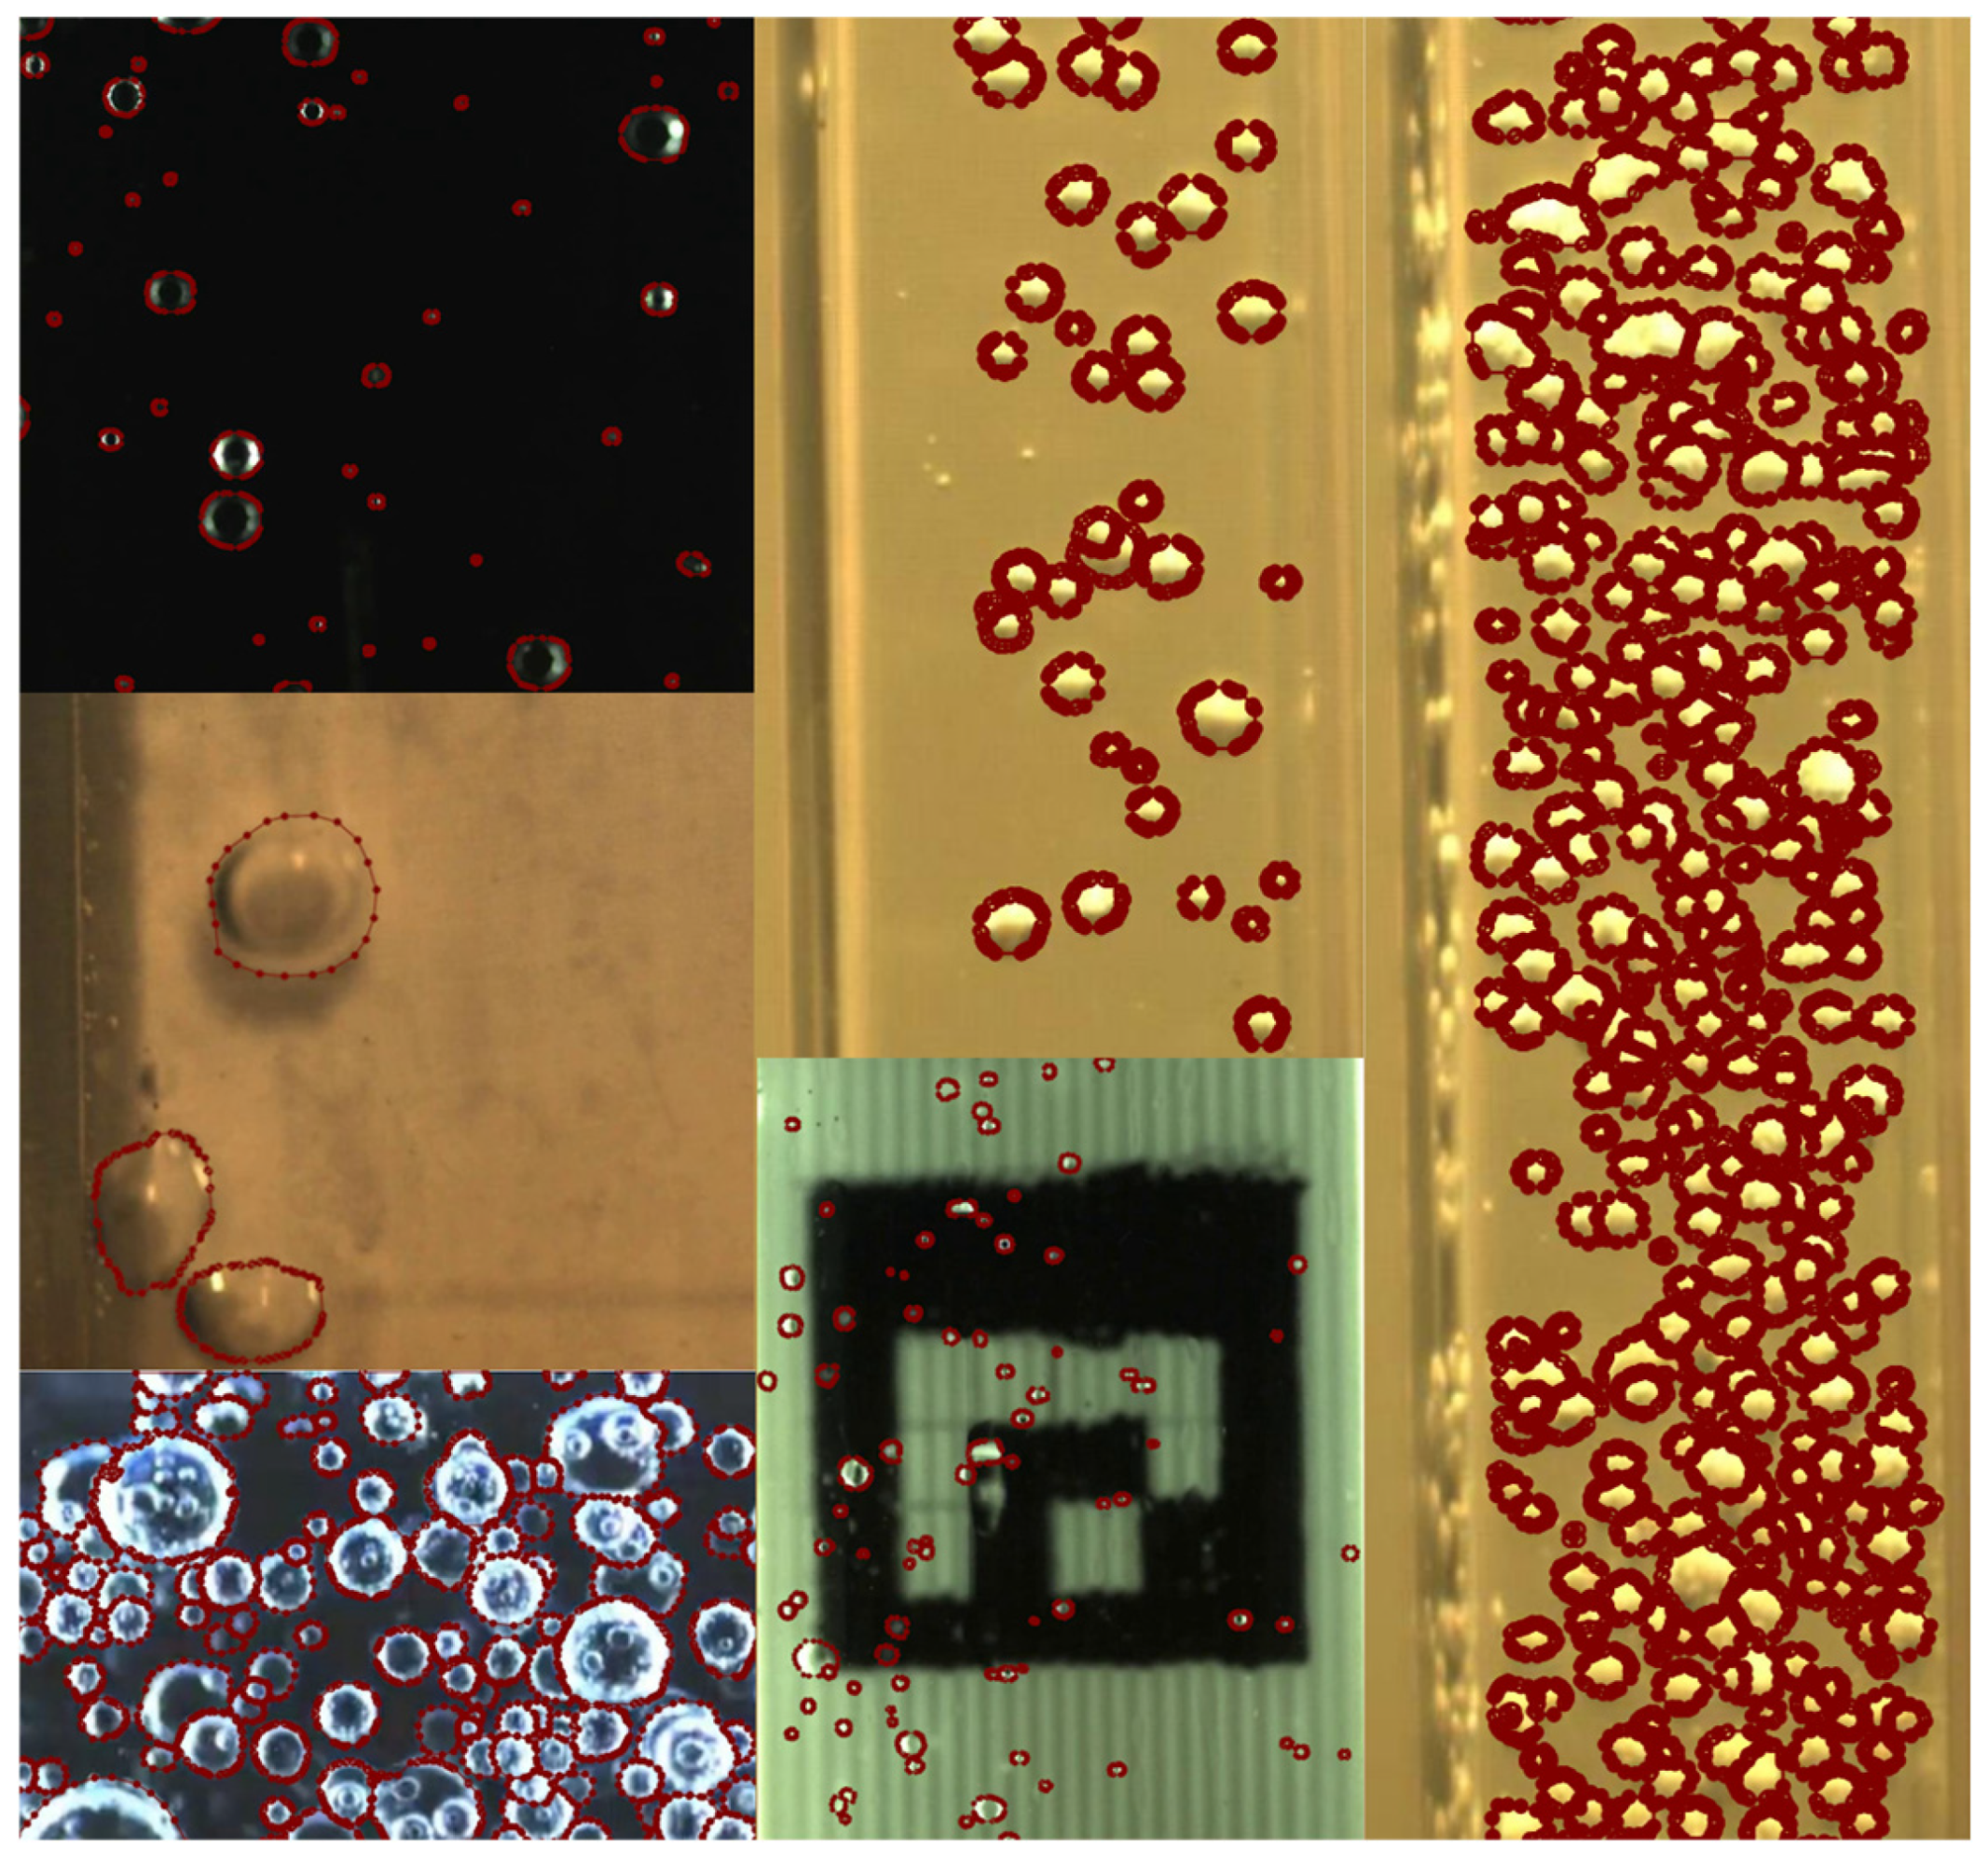
The dataset images incorporated frames captured from experiments conducted at various stages of tube development and under diverse experimental conditions. These conditions included light, dark, and heterogeneous backgrounds to ensure reduced sensitivity to chromatic parameters. The dataset encompassed recordings of bubbles in solutions containing different frothers as well as in water, thereby incorporating both small spherical bubbles and large deformed objects. Furthermore, the images exhibited varying degrees of frame occupancy by bubbles, ranging from frames with predominantly isolated bubble arrangements to frames containing dense bubble swarms characterized by numerous intersections and refracted elements. Representative examples of the various image types included in the dataset are presented in Figure 2.
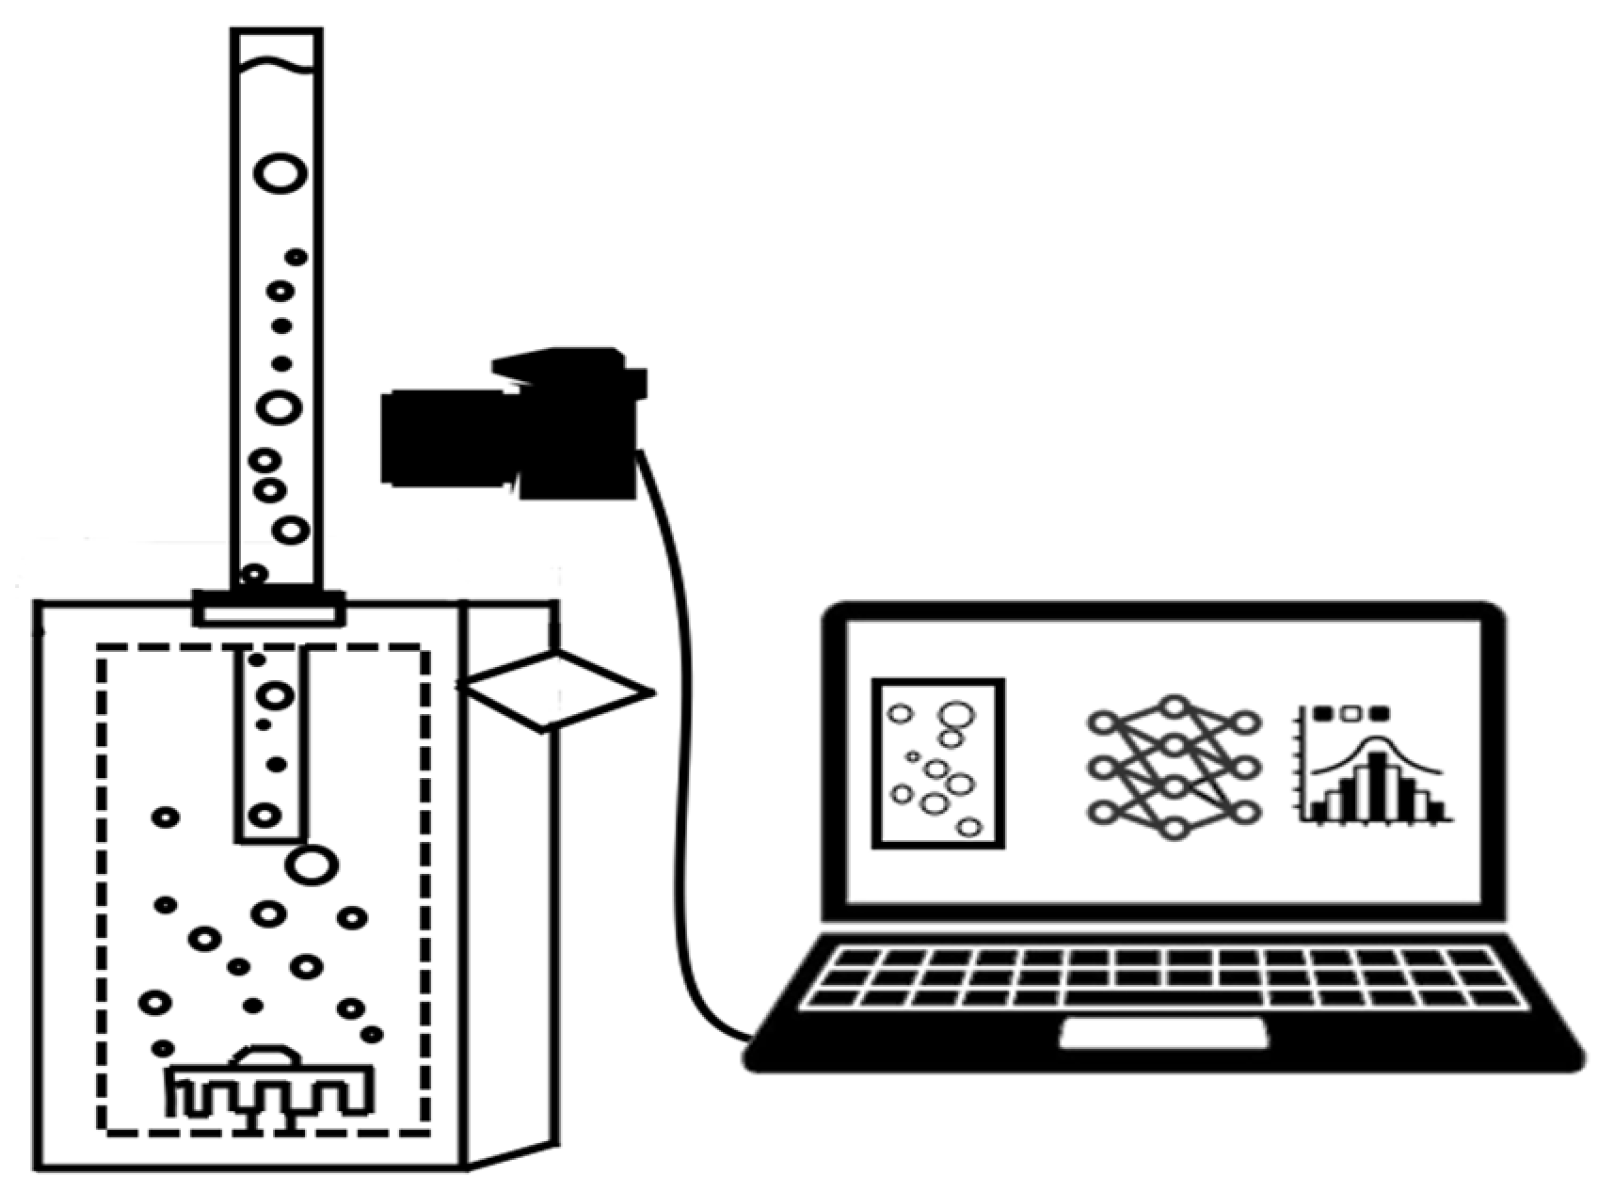
The images, both for the training dataset and for the actual experiment, were obtained using high-speed camera, produced by LLC Research Center “Industial Optics”, Moscow, Russia. The recordings were done with a macro lens through a specialized tube. This tube was mounted above the flotation machine, which contained water. Under the influence of negative pressure, water was retained inside the tube, while bubbles were moving into it, with their sizes recorded by the high-speed camera (Figure 3).
The tube was filled with a frother solution at a concentration equivalent to that present in the pulp during ore flotation. The use of this solution was intended to minimize coalescence of bubbles as they moved into the imaging zone and to prevent dilution of the frother in the flotation chamber by the displaced solution. Bubble diameter measurements were conducted in an aqueous solution without solid phase, as the bubble stream caused pulp flow into the tube, thereby limiting bubble visibility during image acquisition.
The operational principle of this approach bears similarity to widely adopted aeration measurement devices such as the Anglo Platinum Bubble Analyzer [48] and McGill Bubble Sizer [49], which are considered standard instruments for bubble measurement in mineral processing applications. The fundamental distinction from these established devices lies in the utilization of a custom-fabricated tube and the implementation of a fine-tuned neural network trained for bubble segmentation to assess bubble sizes, as opposed to the classical computer vision algorithms and manual processing methods employed by conventional systems.
The value of d32 parameter was determined based on the distribution function parameters of the detected objects by size, established from the results of the neural network’s output.

2.3. Neural Network for Froth Layer Height Determination and Data Post-Processing Methodology

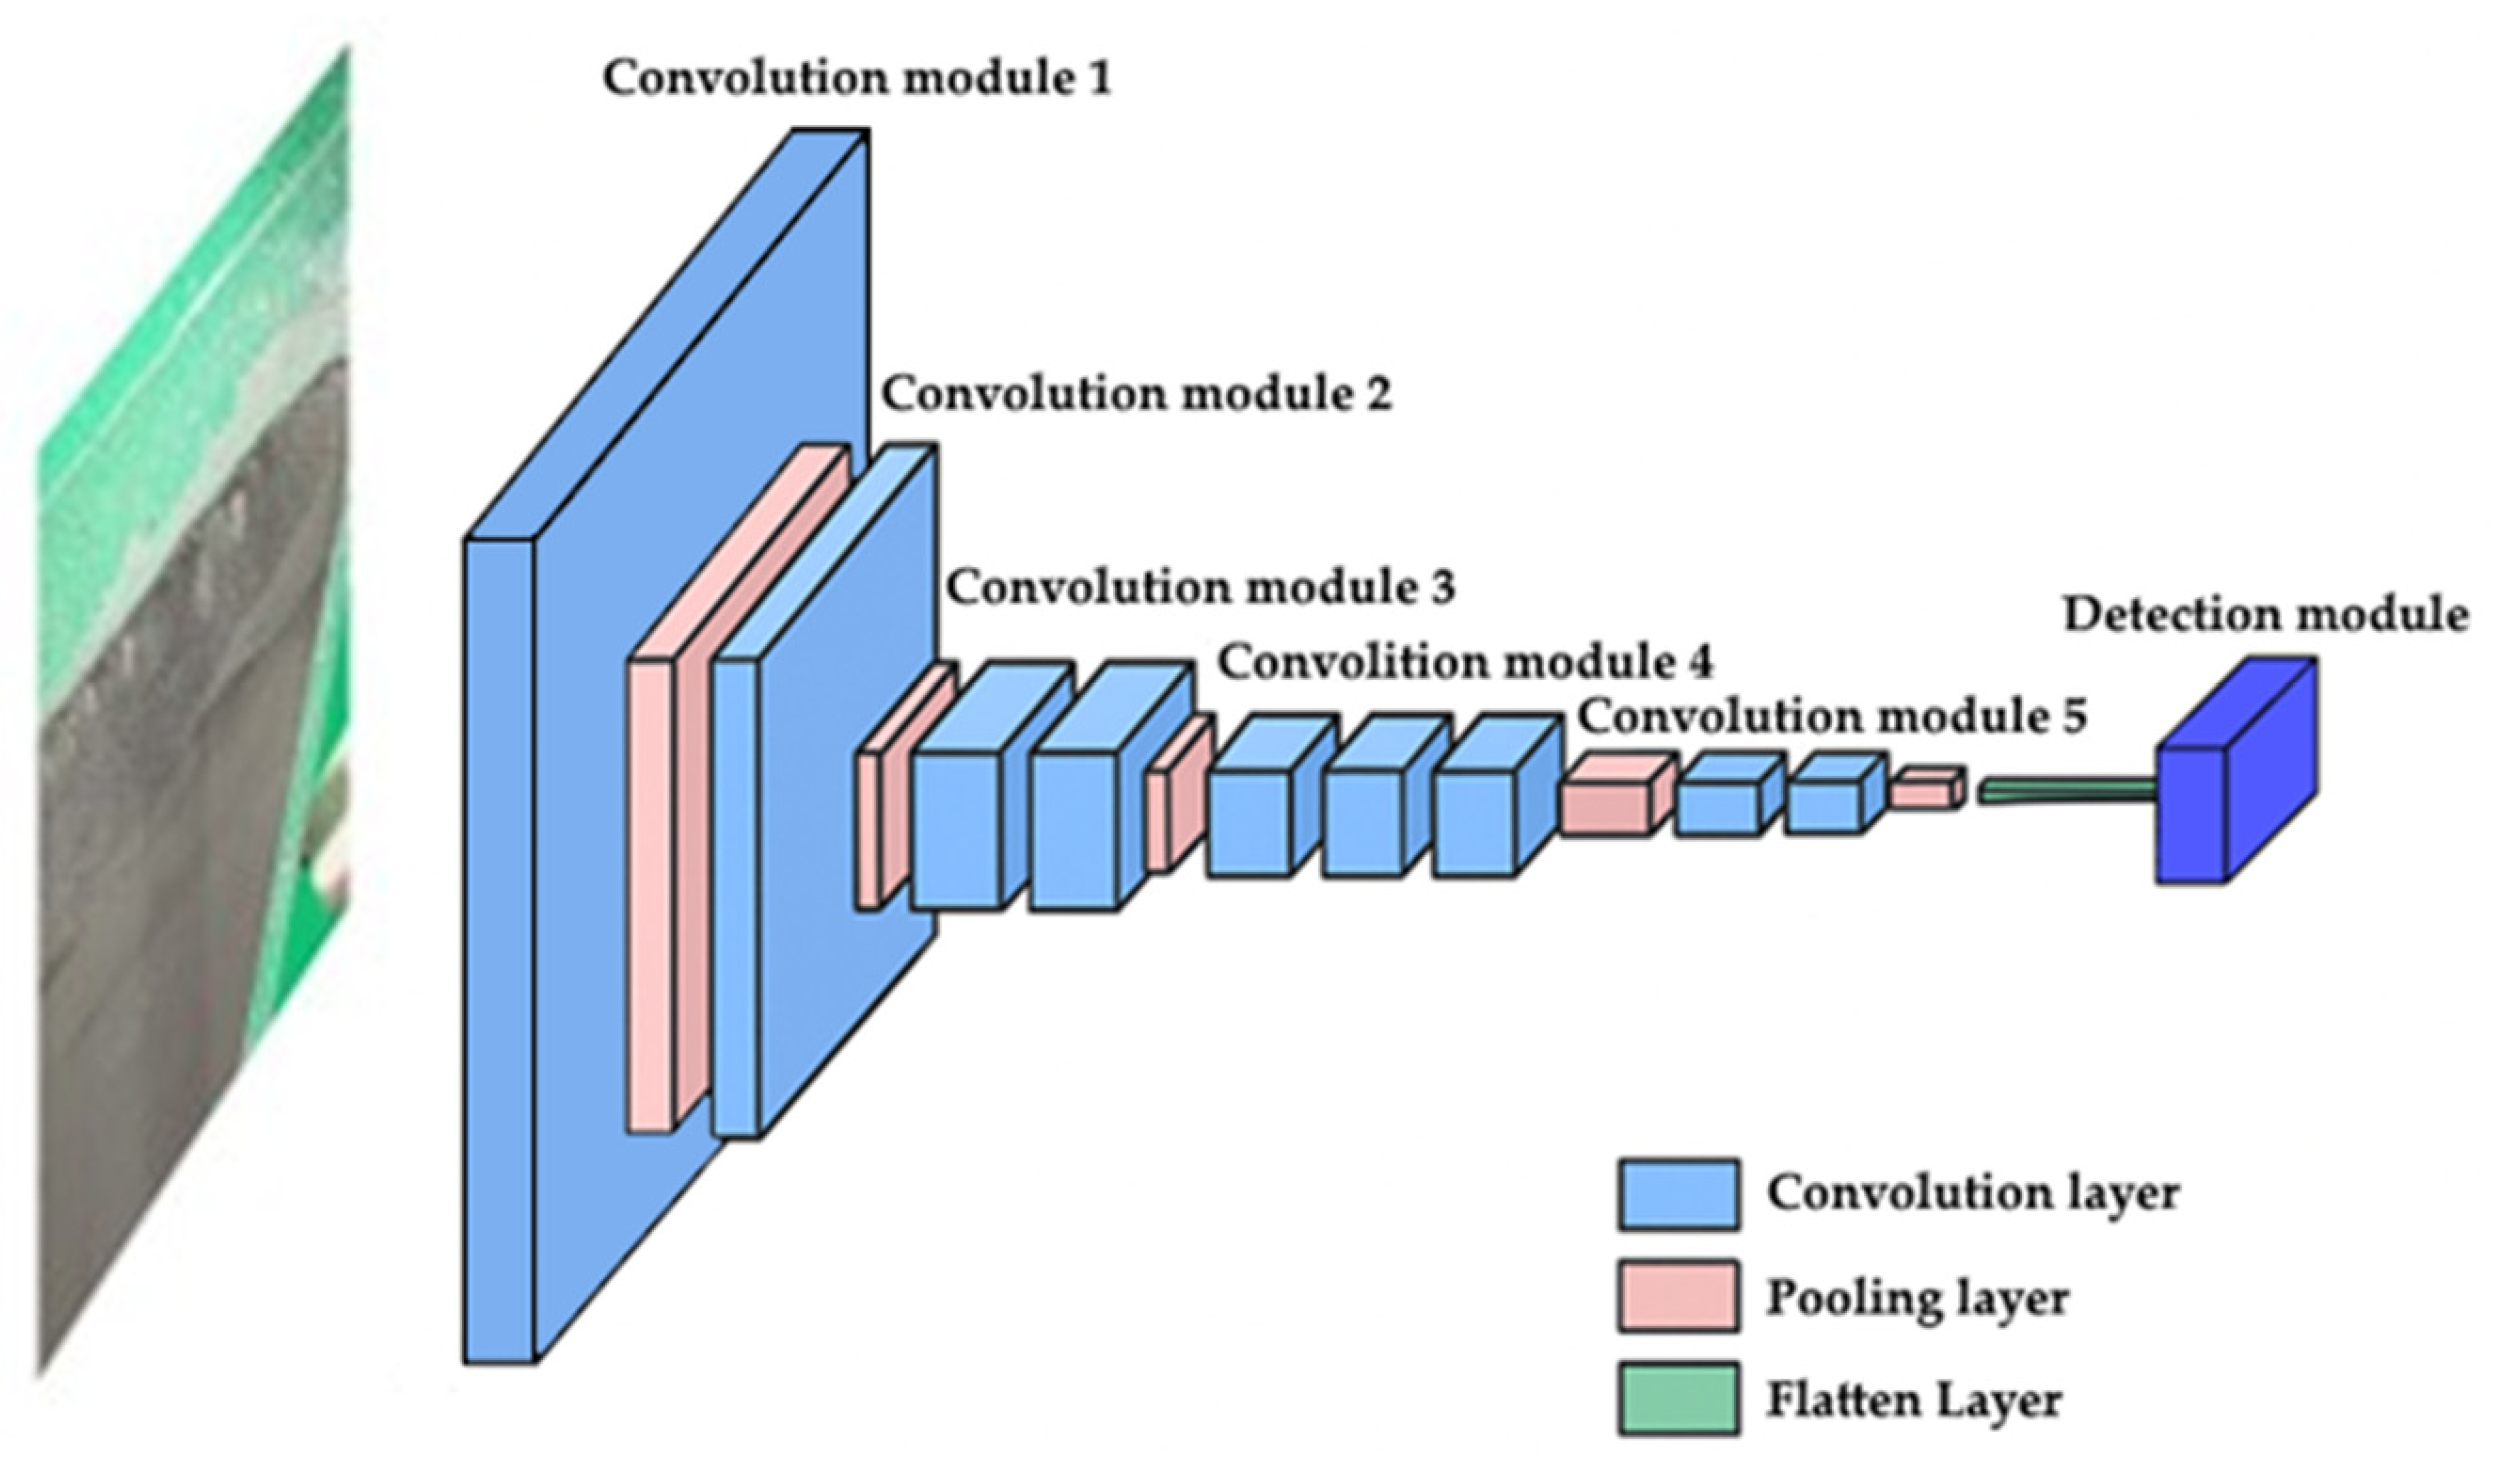
The numerical determination of froth layer height parameters during the flotation separation process was carried out using object detection with the YOLOv11 neural network model. The choice of neural network instead of classical thresholding algorithms was based on its ability to jointly use color data and textural features to detect objects, what is especially useful in situations when there is no clear color difference between pulp and flotation froth. The model belongs to the category of convolutional networks. Visual data extracted from the annotated object in the flattening layer is passed through sequential convolutional blocks with dimensionality reduction via convolution and pooling operations. The final data is transmitted to the detection block to define the boundaries of the froth layer. The overall scheme is presented in Figure 4.
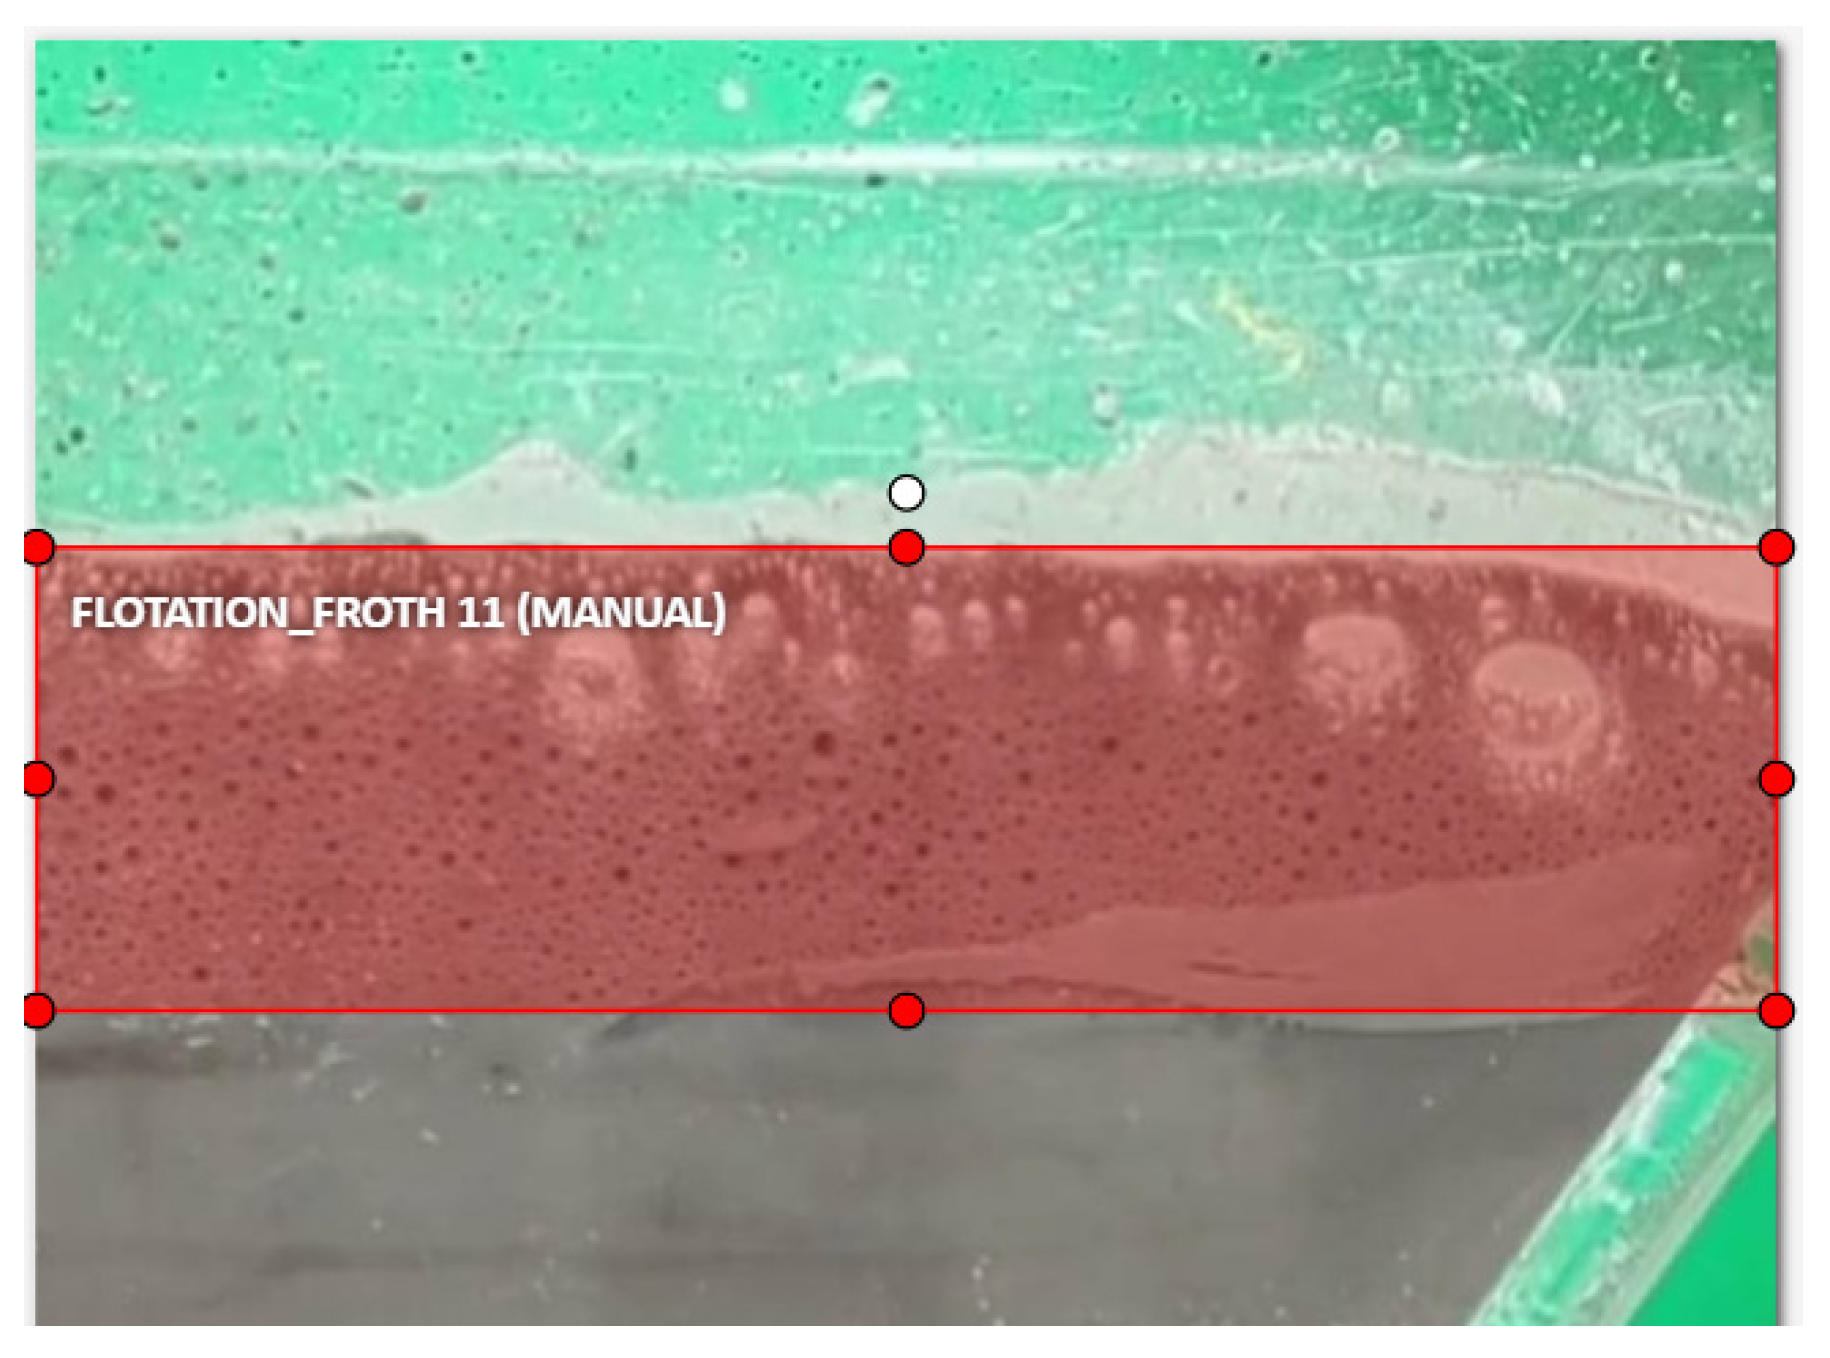
The presented network is trained using a supervised learning approach—first, a training dataset is prepared to fine-tune the parameters for recognizing target objects. The training dataset was built from 500 video frames recorded during the flotation beneficiation experiment. The extracted images were uploaded to the annotation platform, where the training dataset was prepared. An example of an annotated object used for creating the dataset is shown in Figure 5.
The neural network processed the froth layer region at the launders, with the area of interest subdivided into vertical segments. Height measurements within each segment were conducted independently to eliminate local disturbances caused by froth oscillations resulting from the formation of large bubbles and impeller operation.
The model output consisted of time series data of froth layer height values averaged across the segments. These time series were processed using the Savitzky–Golay filter, which performs convolution with a polynomial approximation. The convolution window size was set to 19 elements, and a quadratic function was chosen for the approximation. This filter enabled the minimization of high-frequency noise effects associated with oscillations resulting from impeller operation, while simultaneously eliminating outliers from the time series data.
The selection of window length was substantiated by the width of peaks associated with froth removal, which corresponded to 23–27 time intervals. To preserve these peak characteristics, the window width was established below the mean peak width. Conversely, the filtration of high-frequency noise necessitates an increase in window length. The polynomial order was specified as 2, representing a commonly adopted value in standard practice. Elevating the polynomial order results in increased filter sensitivity to noise; therefore, maintaining lower values is considered rational. Verification of filtration result adequacy was performed through residual analysis of the filtered data.
Through interpolation of the filtered results, the data were represented as a time series with a fixed temporal resolution of 0.5 s. This temporal step was selected to minimize the influence of high-frequency noise on subsequent analysis and to reduce computational burden, while simultaneously ensuring that peaks associated with froth removal were not omitted. The interpolated values were employed to construct a Hankel matrix for subsequent singular spectrum analysis [50]. The number of rows in the matrix was established as 30, with a minimum value of 20 justified by the froth layer removal period. This value was determined empirically as sufficient for decomposing distinct components of the time series into independent constituents. Lower values resulted in insufficient separation between the periodic component and the trend within the derived components, whereas higher values led to excessive decomposition of the trend and periodic dependencies. The selection of components incorporated into the trend and periodic parts was performed based on examination of cumulative spectral contribution plots and correlation matrix analysis.
Interactions with the neural network, as well as the subsequent processing of segmentation results, were carried out using Python 3.11 in combination with the Numpy 2.1.2 and Scipy 1.15.2 libraries for statistical analysis.
Experimental studies of flotation separation were conducted using a JK Batch Flotation Cell by JKTech Pty Ltd., Brisbane, Australia, with a bottom-mounted drive, which allowed for the placement of a bubble measurement device above the flotation cell. This device consisted of a tube filled with a frother solution and immersed in the flotation cell.

2.4. Laboratory Experiments Methodology

The experiment was conducted in a cell with a volume of 1.5 L. A frother solution was used in the reactor at a concentration equivalent to that in the flotation experiment. The air flow rate was set at 1 L/min, and the impeller rotation speed was 900 rpm. This operational regime was selected on the basis of previously conducted studies [34].
Froth layer height measurements were conducted during the flotation of freshly ground sulfide ore with a particle size distribution of 70% passing 71 μm. The valuable components in the ore are represented by pyrite and arsenopyrite, while quartz constitutes the primary gangue mineral.
Flotation was performed using the following reagent regime: potassium butyl xanthate at a dosage of 100 g/t, sodium diisobutyl dithiophosphate at 50 g/t as collectors, and copper sulfate as activator at a consumption rate of 250 g/t. Both xanthate and dithiophosphate, with active substance contents of 90% and 70% respectively. The study was conducted using two frothers: MIBC and OPF, a mixture of alcohols, aldehydes, ethers, polyglycols, and polyethylene glycol. The frother dosage was 30 g/t. The copper sulfate was analytical grade produced by LLC Russian Vitriol Company, Blagoveshchensk, Russia. The initial concentration of the frothers was 99%. The initial solid concentration in the flotation cell was 30%.

3. Results and Discussion

3.1. Neural Network for Bubble Size Measurment

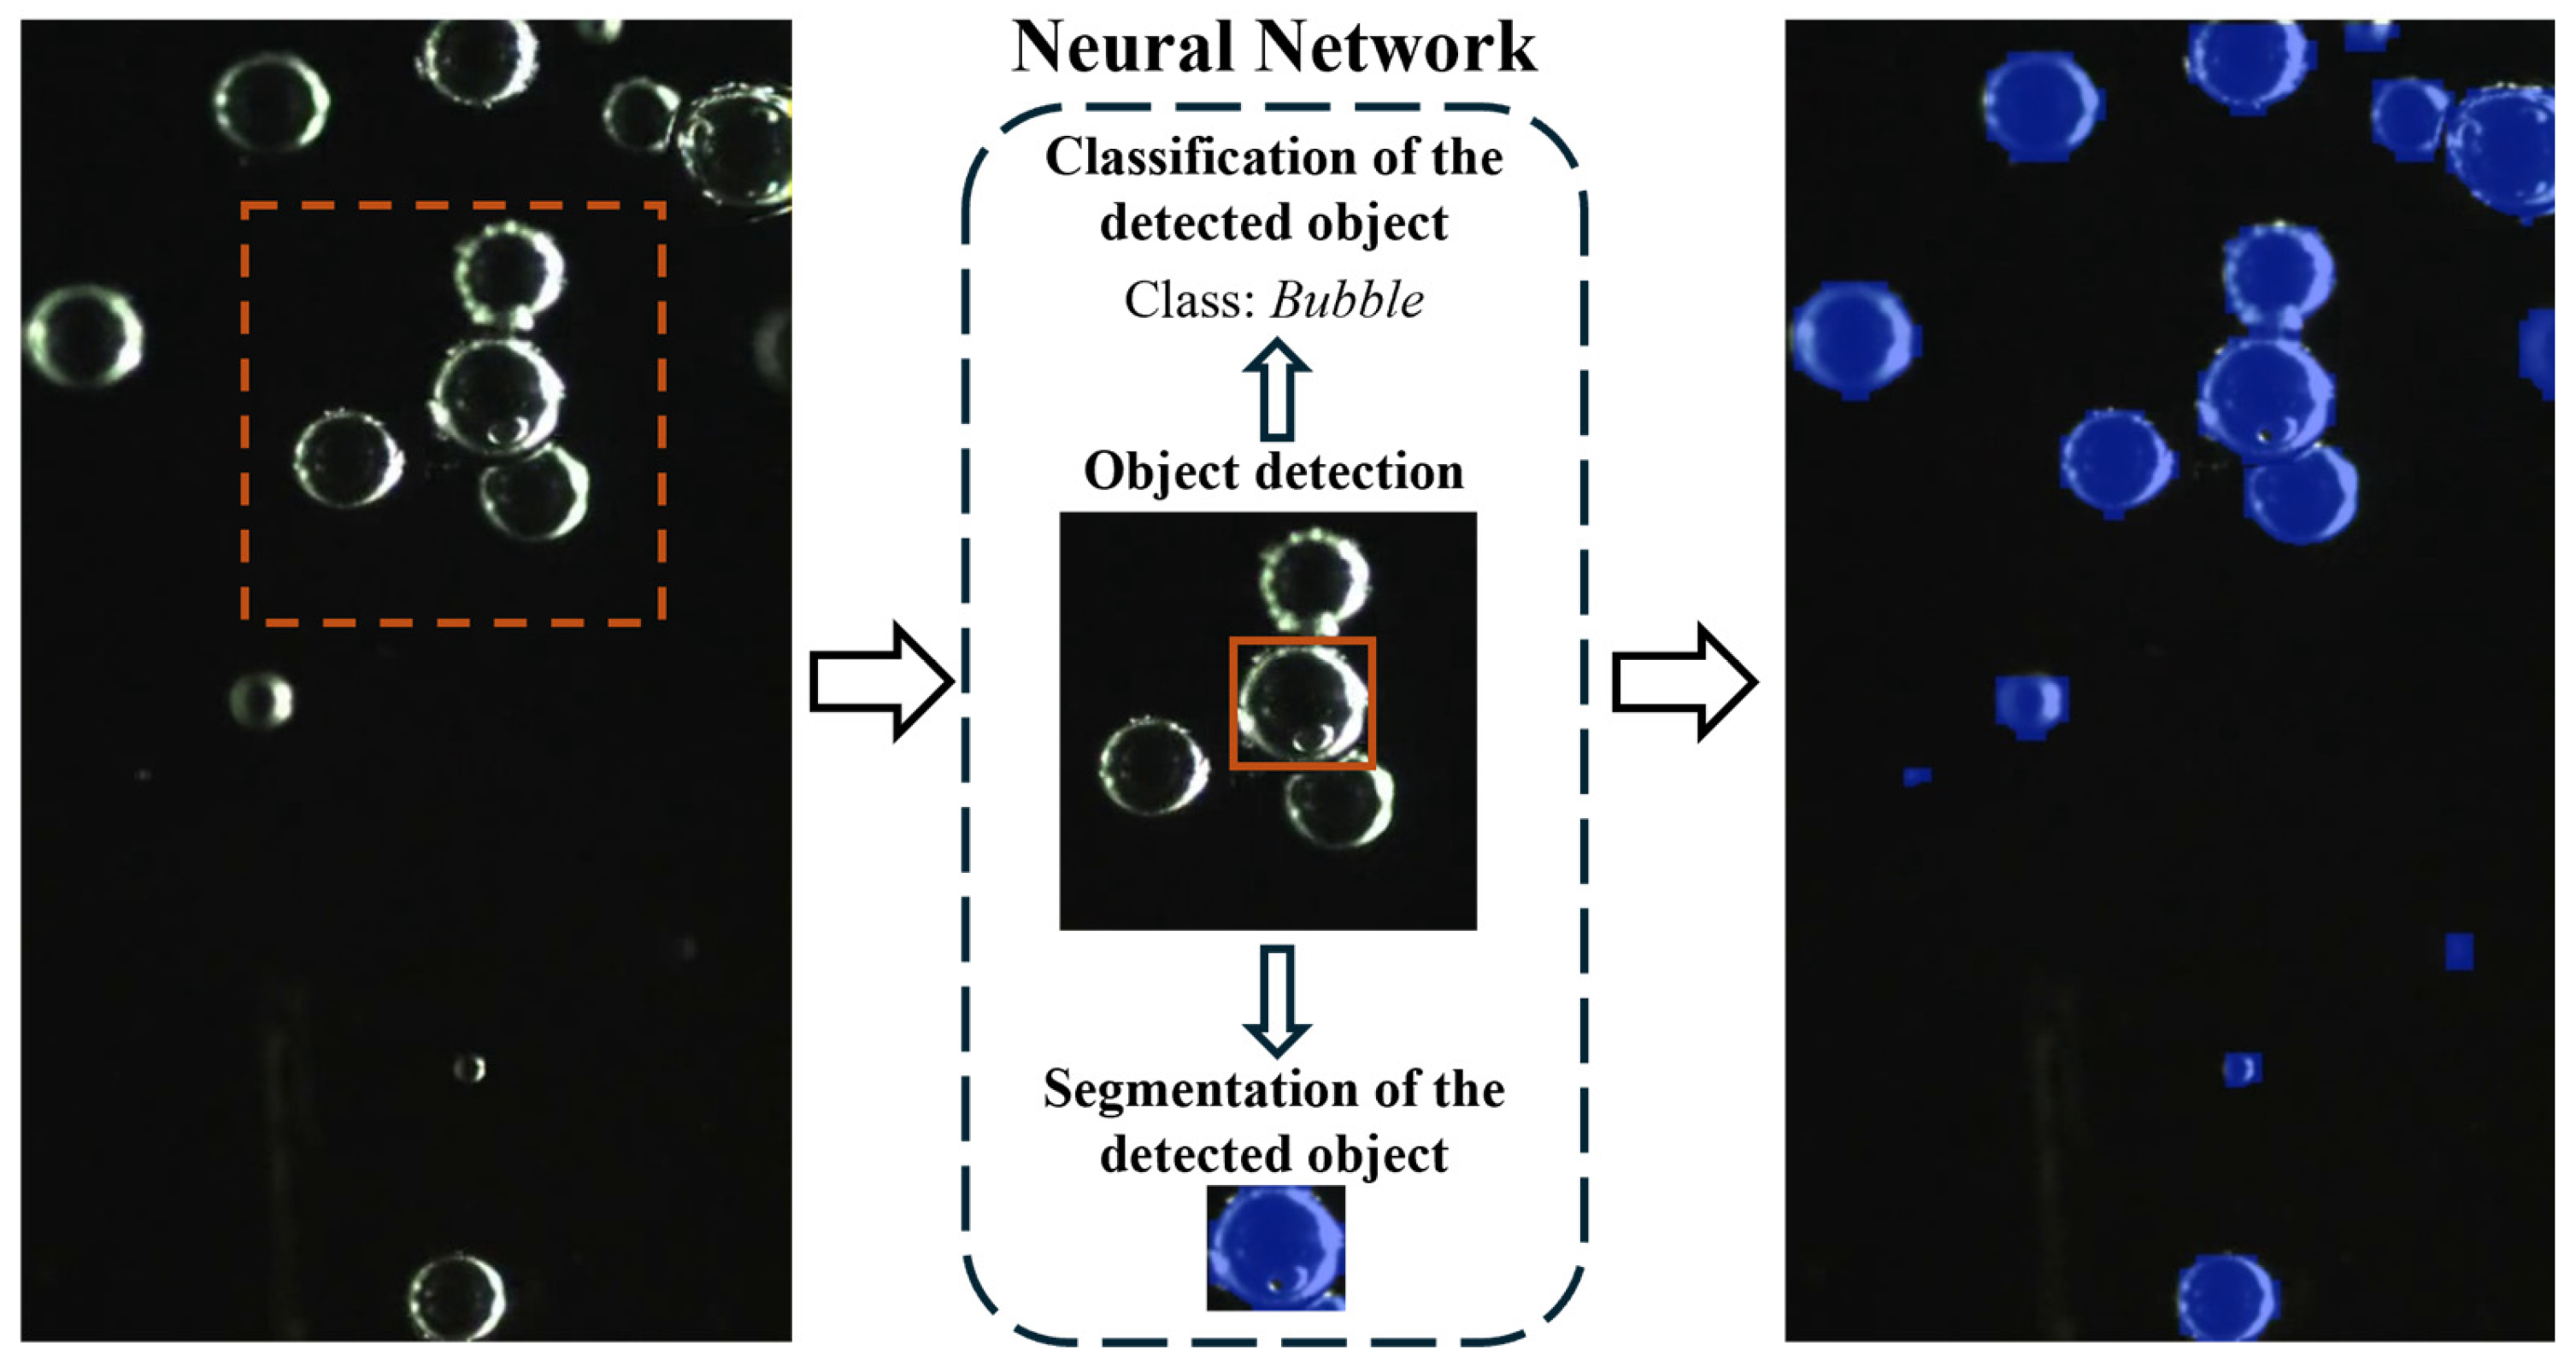
During the experimental studies, time series of the weight fractions of bubbles with specific diameters relative to the total number of detected bubbles were obtained. The basic neural network workflow is illustrated in Figure 6. The algorithm is designed to operate in two stages. The first stage involves detecting the bubble as an object with distinct visual features. This is followed by segmentation and diameter determination according to a scale reference. The network trained via transfer learning achieved a bubble detection accuracy of 73%.
The suboptimal recognition performance of the neural network in bubble detection can be attributed to a combination of methodological limitations and constraints associated with object dimensions.
One factor affecting detection completeness is the periodic omission of the smallest bubbles, which constitute no more than 2% of the total sample. This characteristic of algorithm performance is associated with difficulties in identifying small-sized objects given the current model training parameters and input image characteristics. The limited representation of microbubbles in the training dataset contributes to this limitation. Furthermore, during network processing, additional compression of image resolution occurs to match the operational dimensions of the network, which consequently results in degraded recognition quality for the smallest size classes.
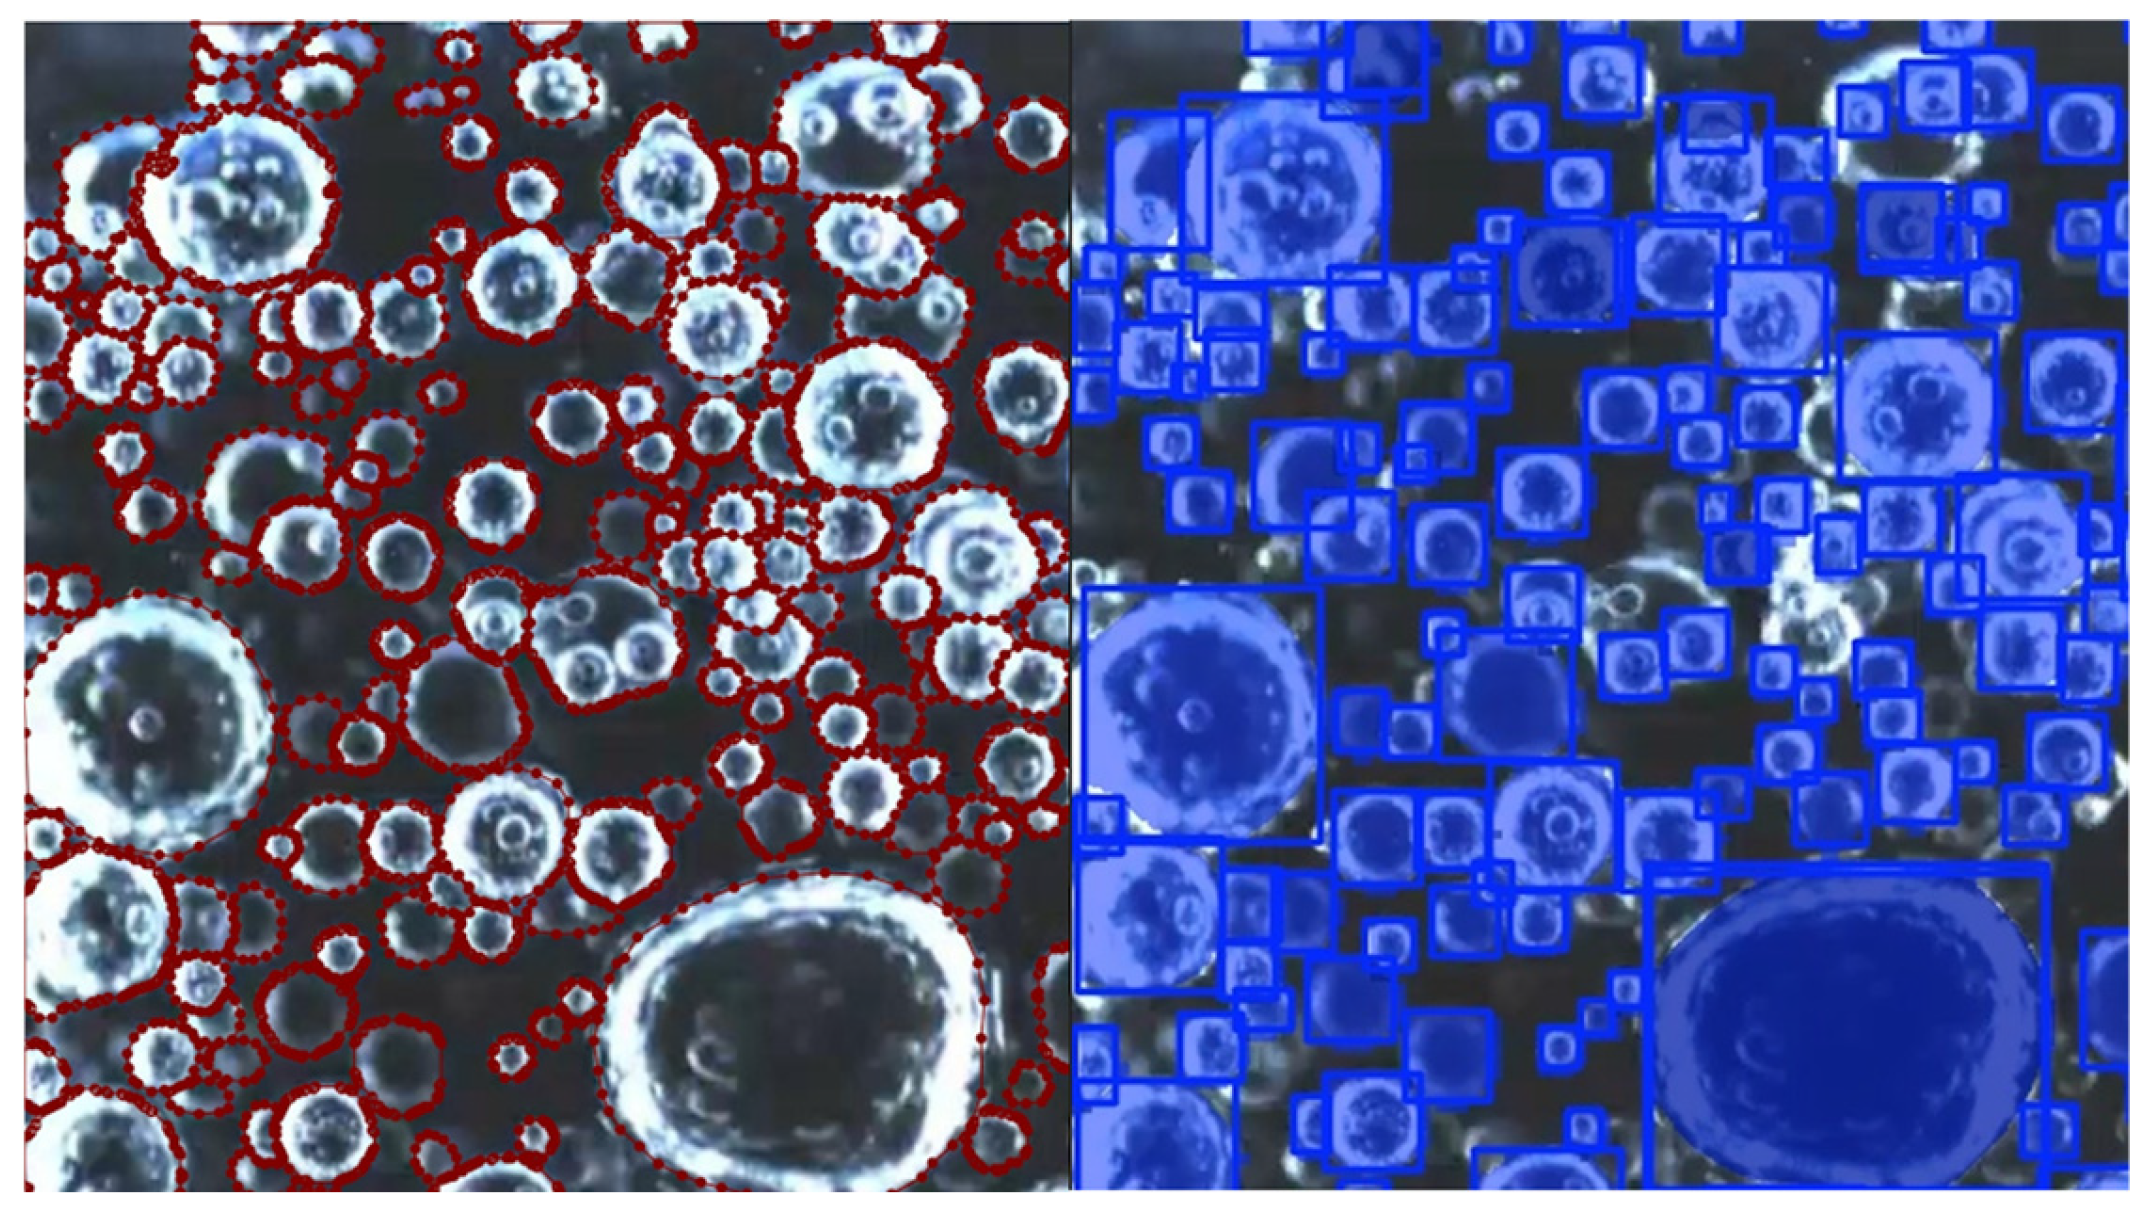
The primary cause of diminished recognition quality metrics is the deliberate establishment of an intersection-over-union threshold at 0.1 and the inherent difficulty in detecting bubble boundaries within dense groupings in the images. The decision to set the intersection threshold at this specified value was dictated by the necessity of preventing false detection of distorted bubble images located behind bubbles in the foreground. Implementation of a higher intersection threshold would result in the registration of distorted fragments of background bubbles, which would consequently introduce systematic error toward underestimation of the measured diameter values. An example of an annotated image and its subsequent processing by the neural network from the test dataset, where the described limitations associated with refracted bubbles and mutual intersections can be observed, is presented in Figure 7.
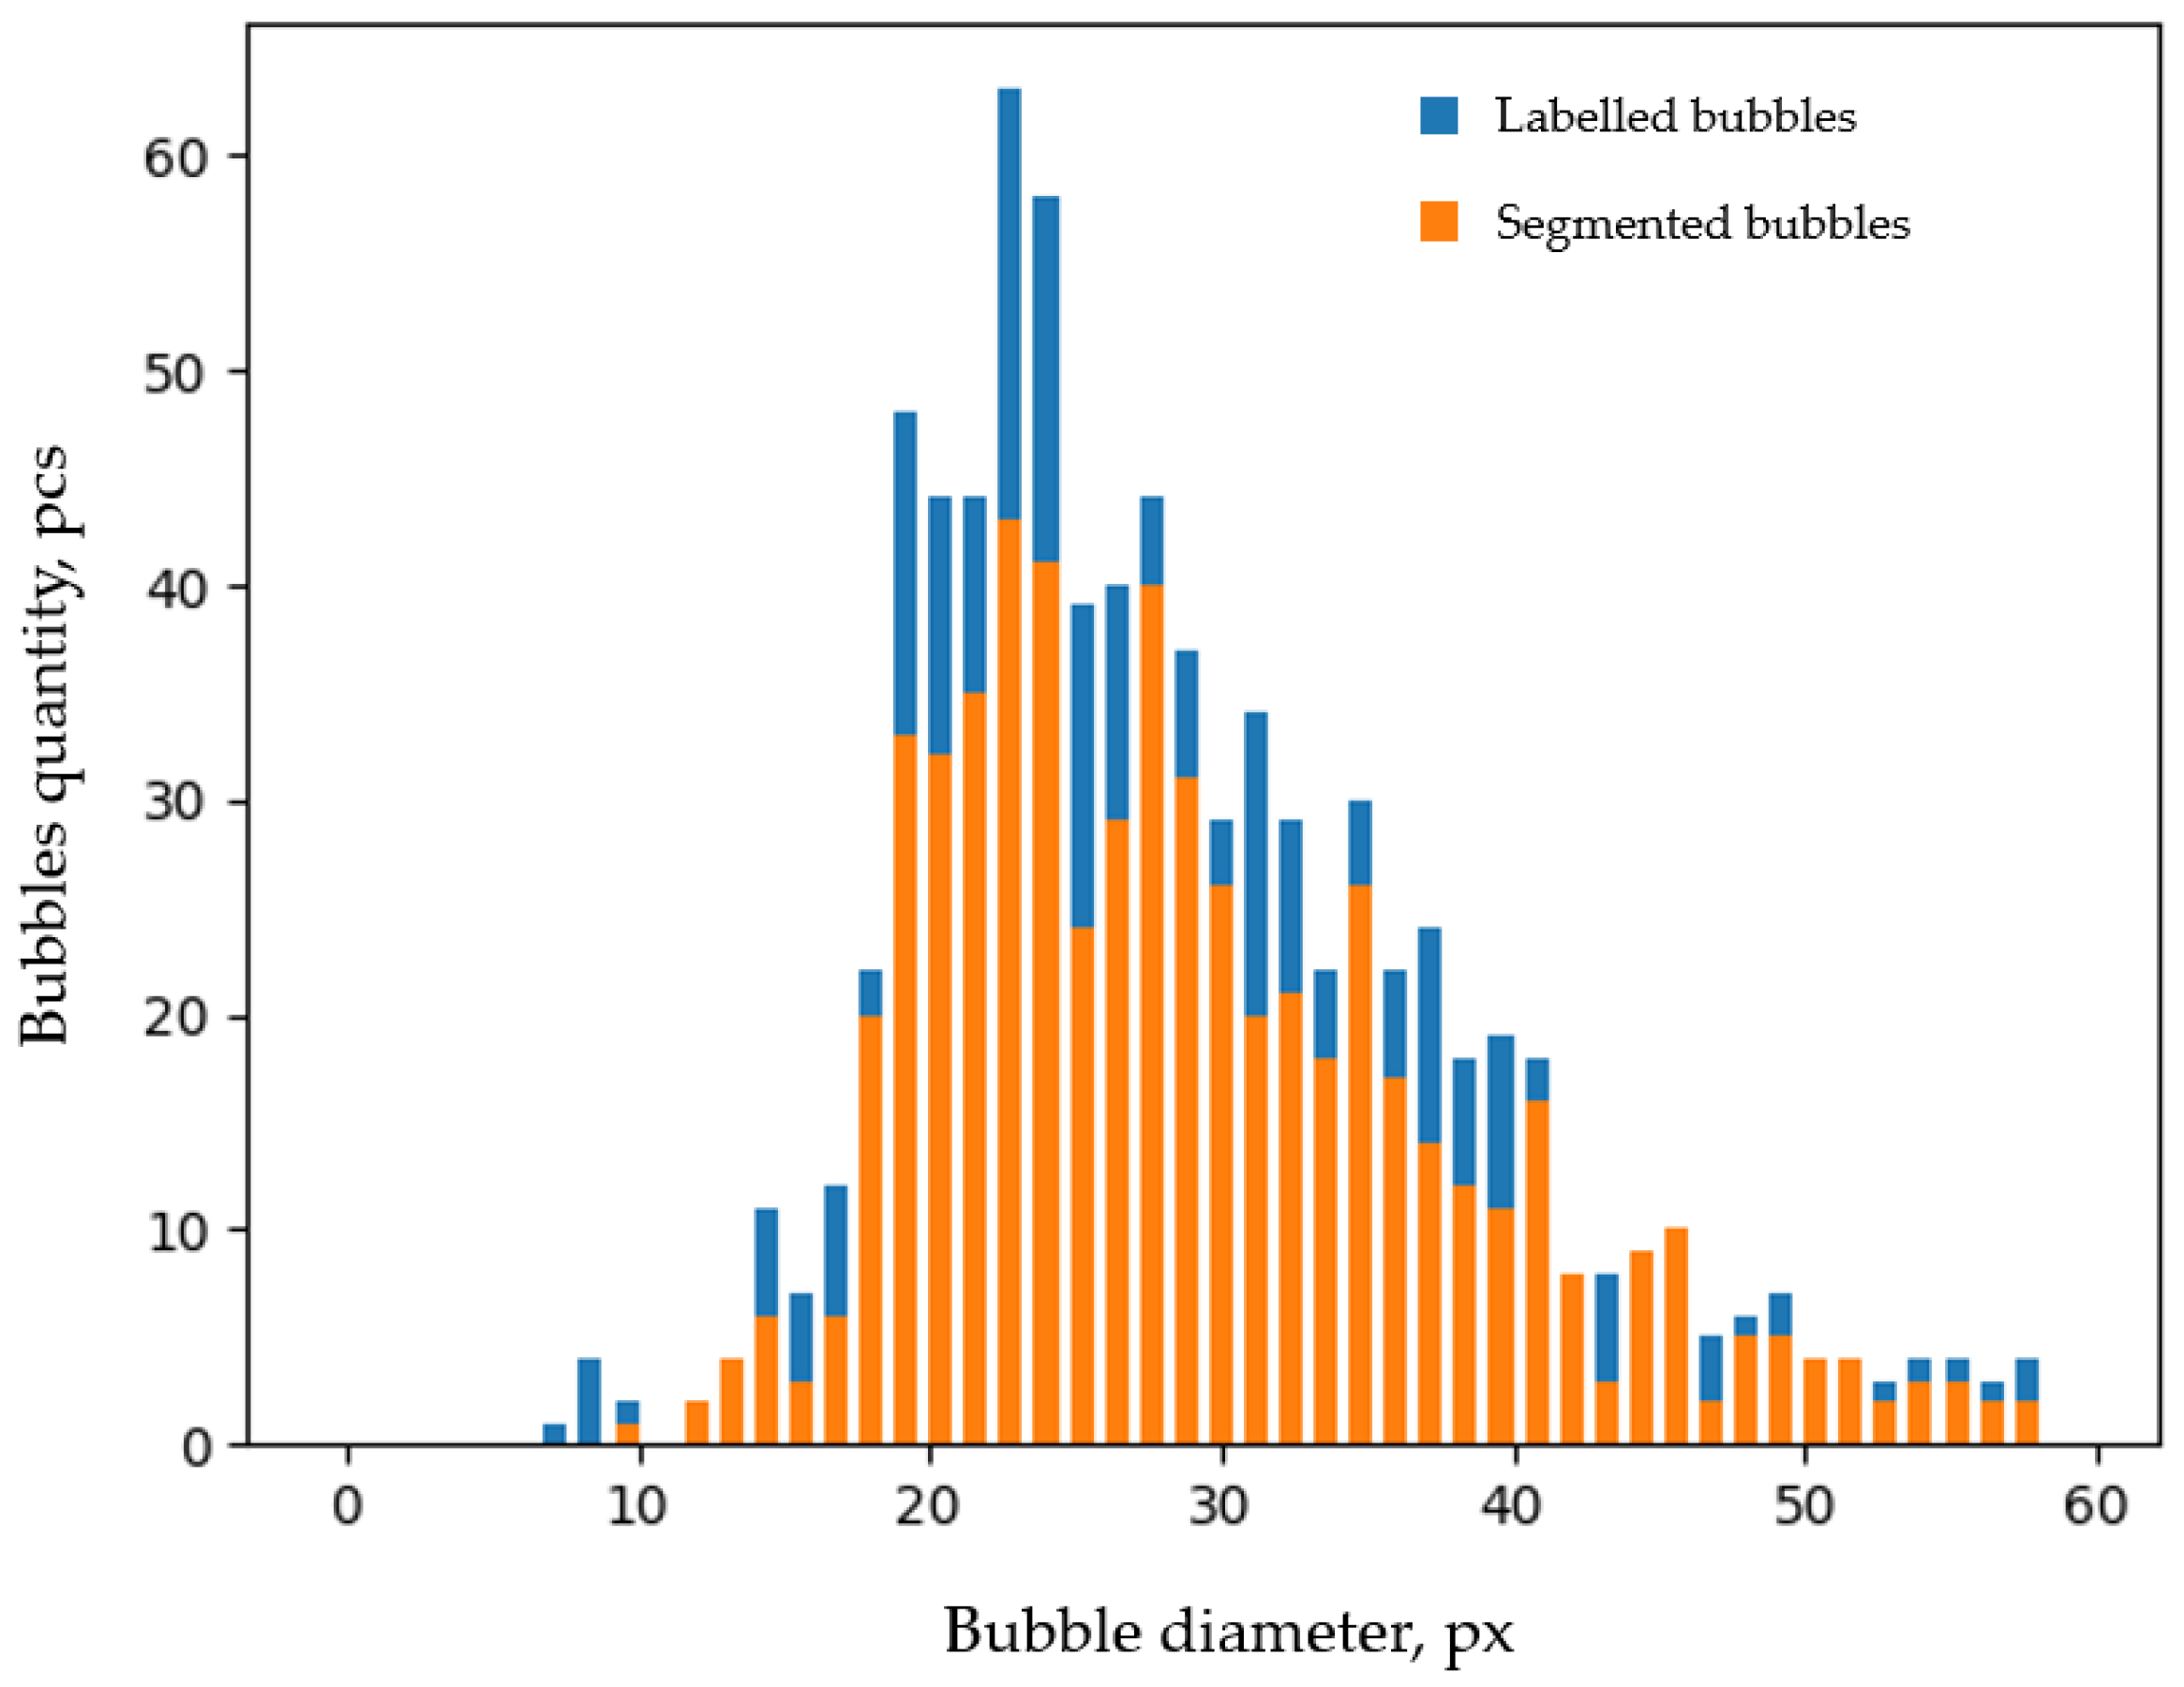
This image type represents the most challenging category for recognition purposes; consequently, this class of images from the test dataset was selected for statistical analysis. Statistical analysis of the bubble size distributions obtained through manual annotation and neural network processing revealed no statistically significant deviations. The analysis was conducted using the test dataset, with the Kolmogorov–Smirnov test employed for comparison. The established p-value was 0.64, while the d32 values for the manually annotated data and neural network results were 40.47 pixels and 40.68 pixels, respectively. The omission of certain bubbles in this case is compensated by the substantial number of processed frames and bubbles. The distribution of detected and annotated bubbles is presented in Figure 8.
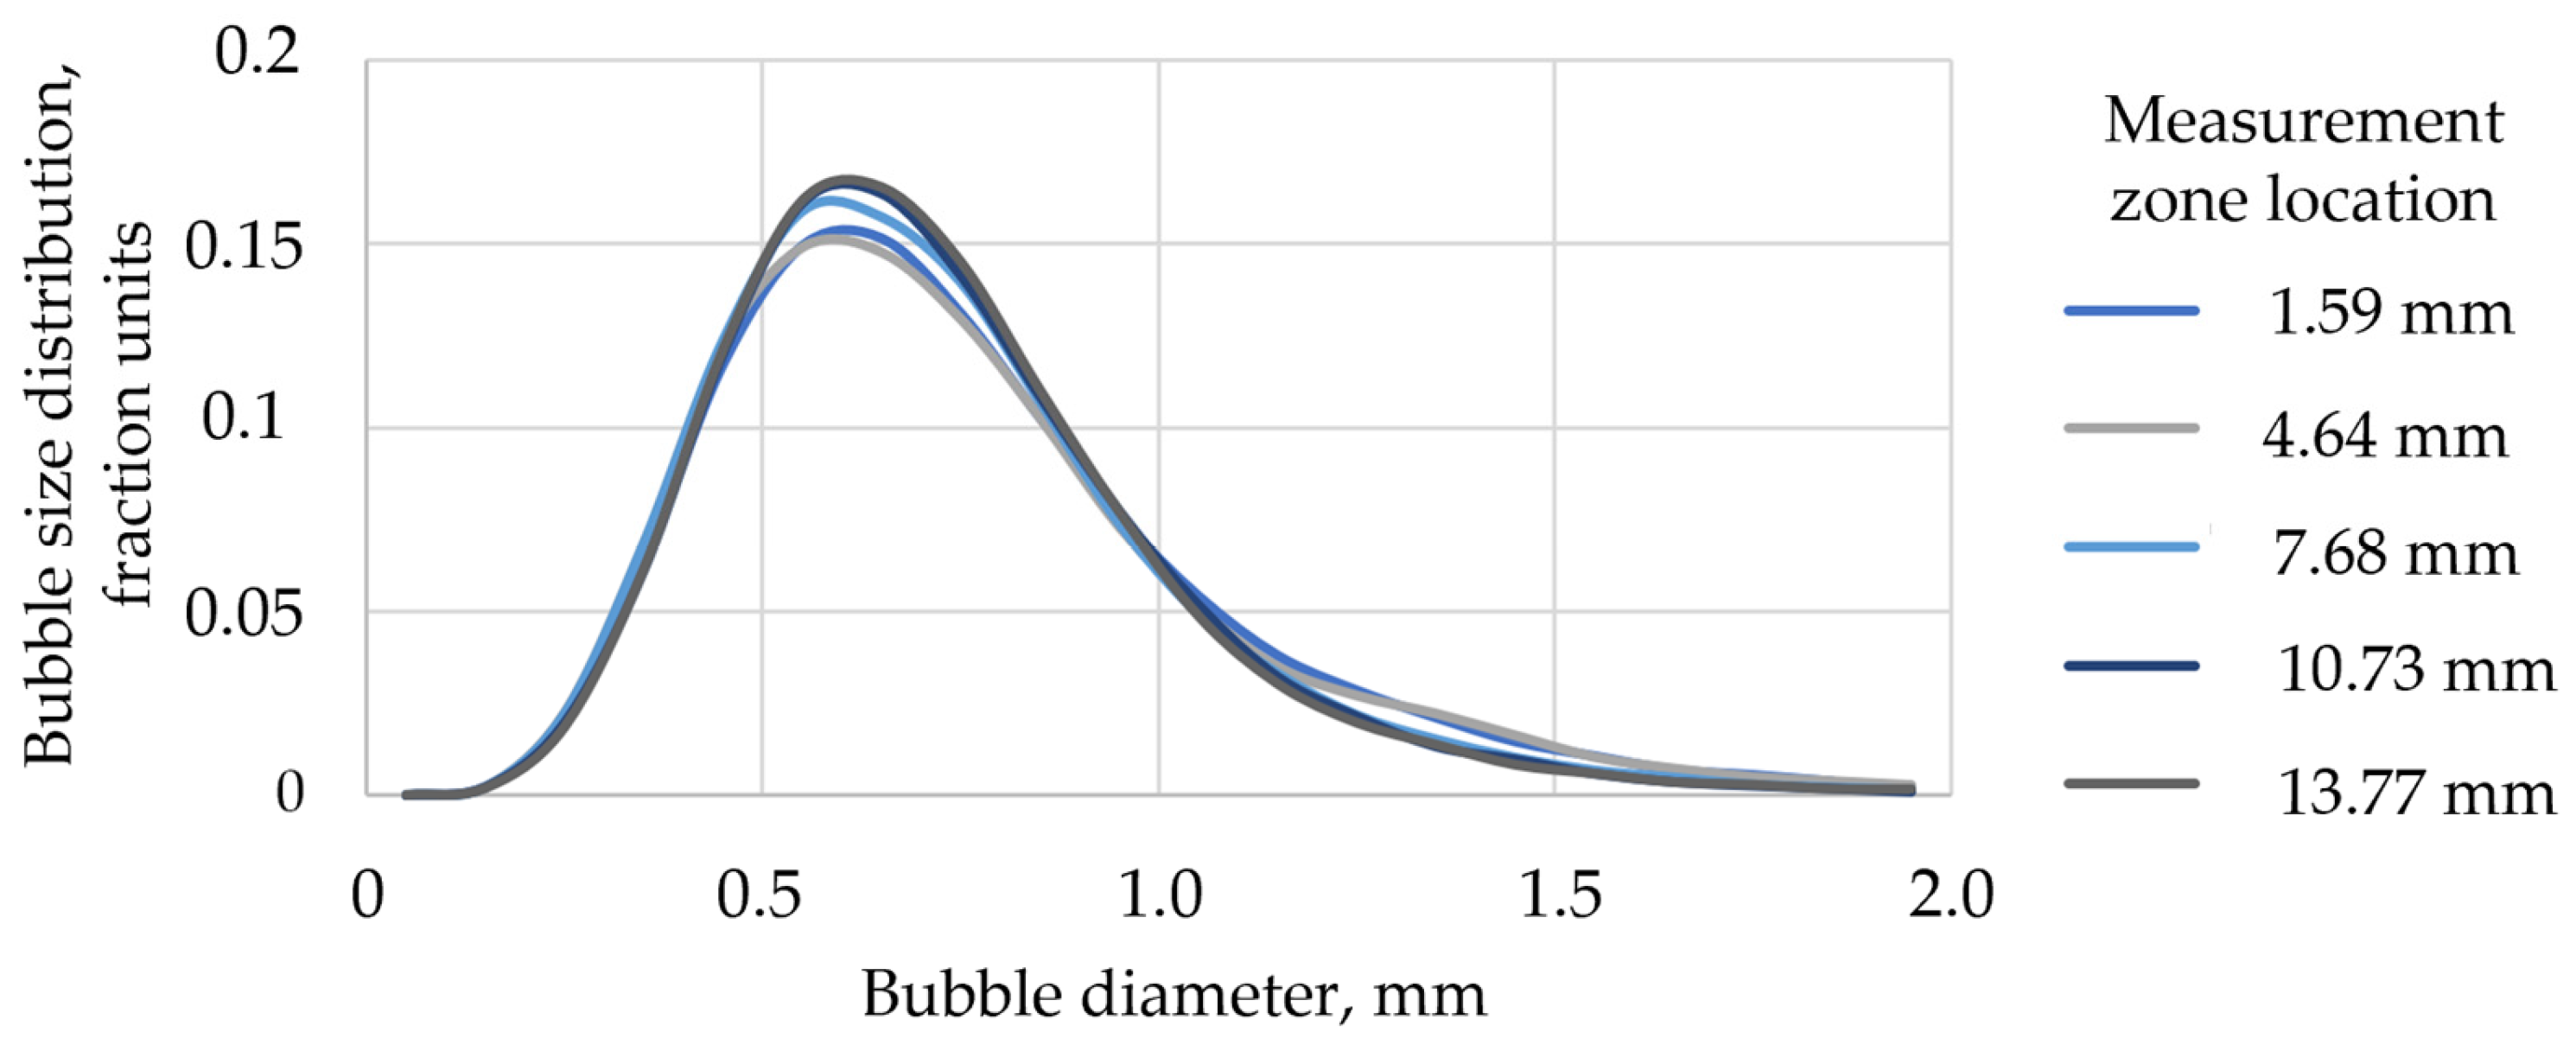
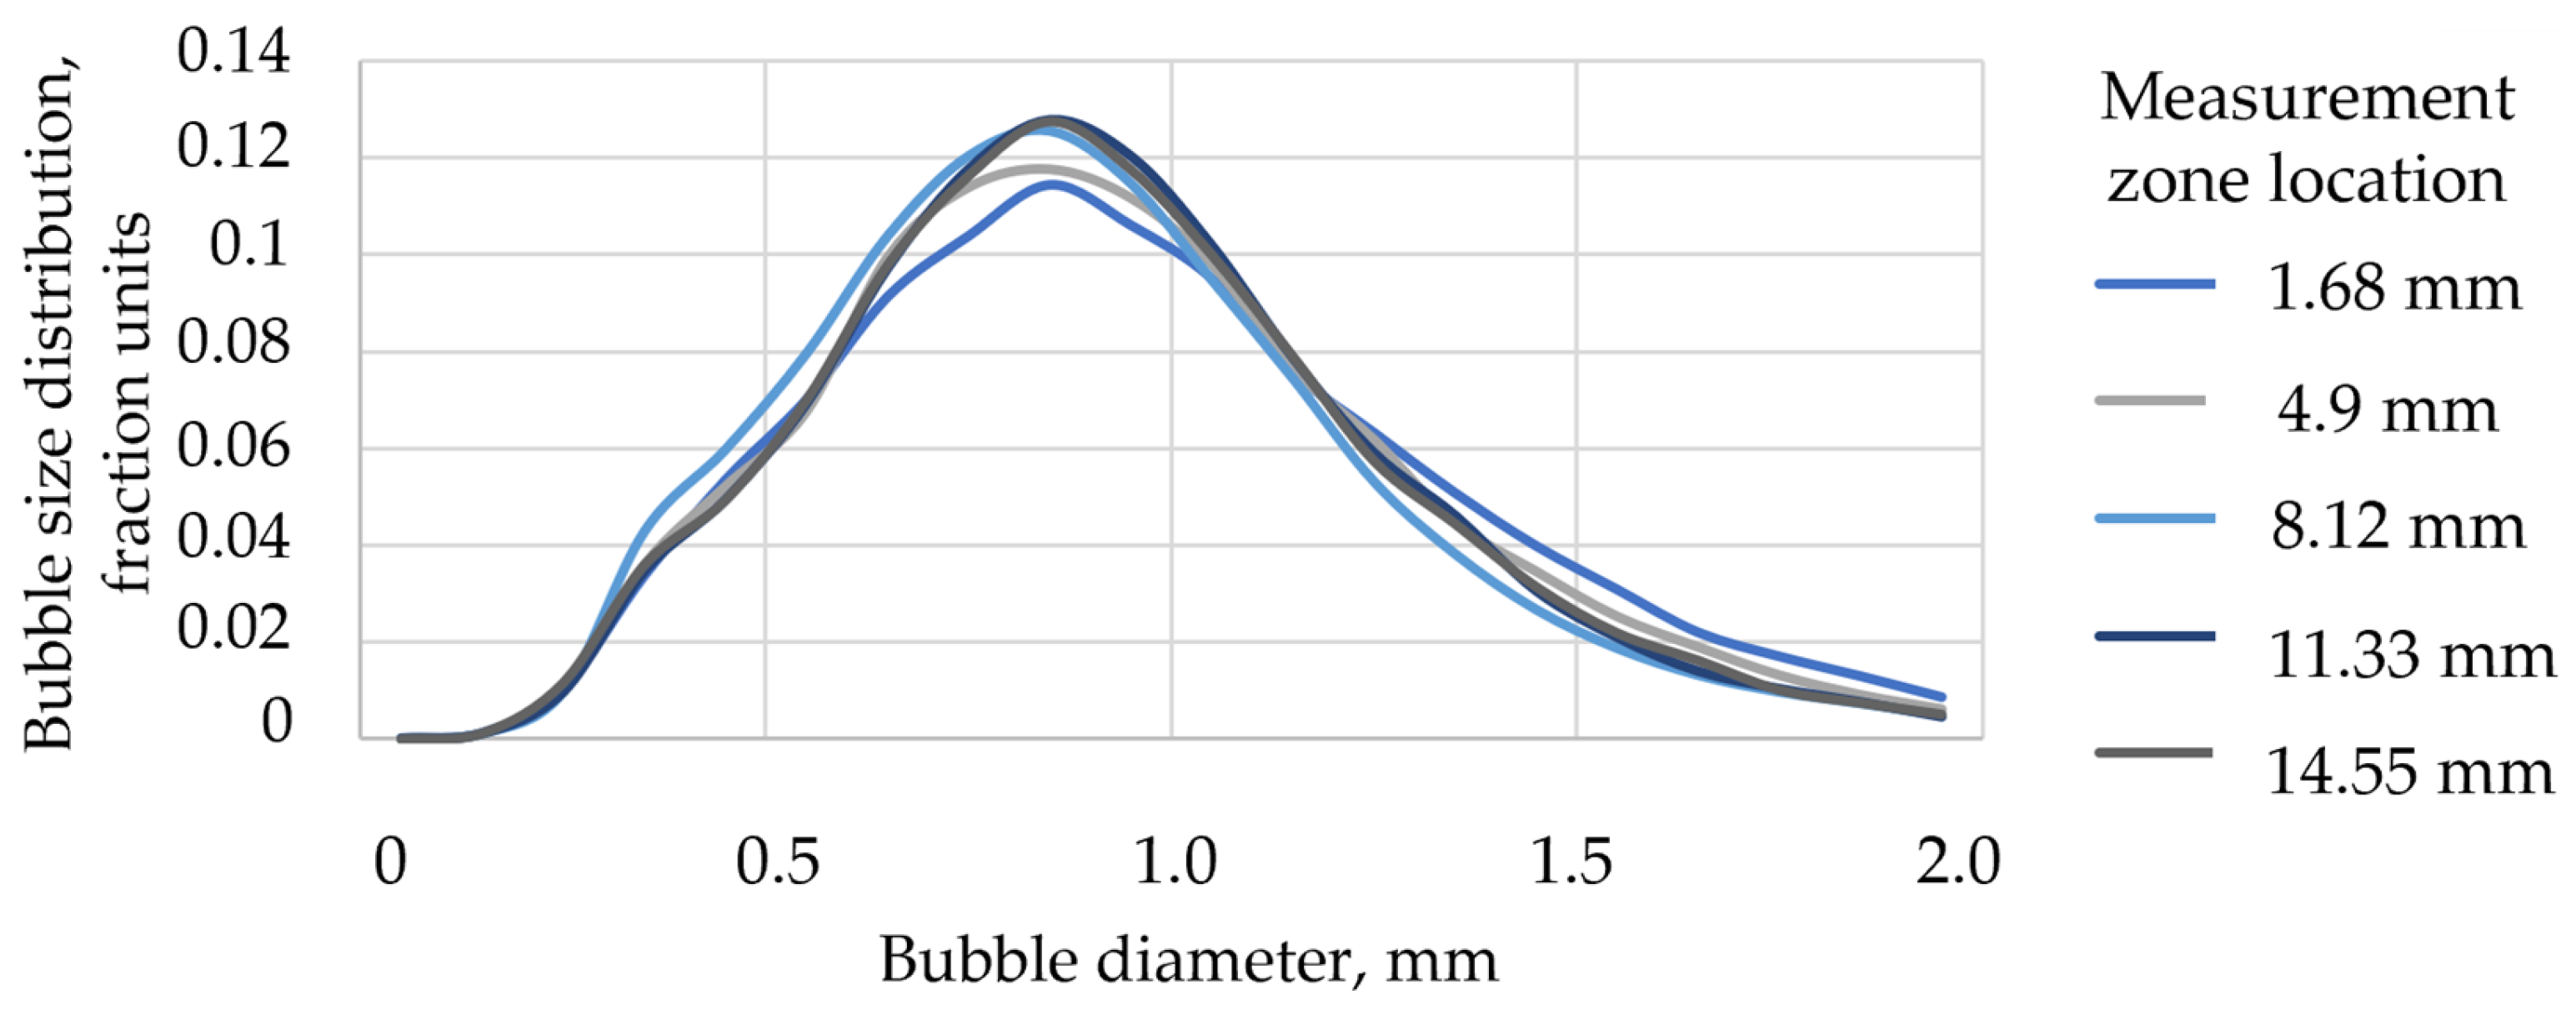
Object detection was performed at different heights from the base of the tube to assess potential errors in determining the d 32 parameter. The processing results were obtained in the form of discrete bubble size distribution functions. The experimentally averaged bubble diameter distribution curves for the investigated time interval are shown in Figure 9 and Figure 10.
Based on the analysis of the obtained curves, it was established that the cumulative distributions when using MIBC are characterized by left-skewness relative to the median value. Unlike kurtosis, the shape of the skewness does not change with the fixation height. The peak weight fractions fall within the range of 14% to 17%. The predominance of smaller bubbles in the swarm is likely due to the more active action of the frother during the initial stages of flotation, which prevents coalescence processes from occurring.
In contrast, when OPF is used, the distribution appears more symmetric relative to the median value, although the kurtosis still varies depending on the fixation height. The peak weight fractions in this case lie within the range of 10% to 13%.
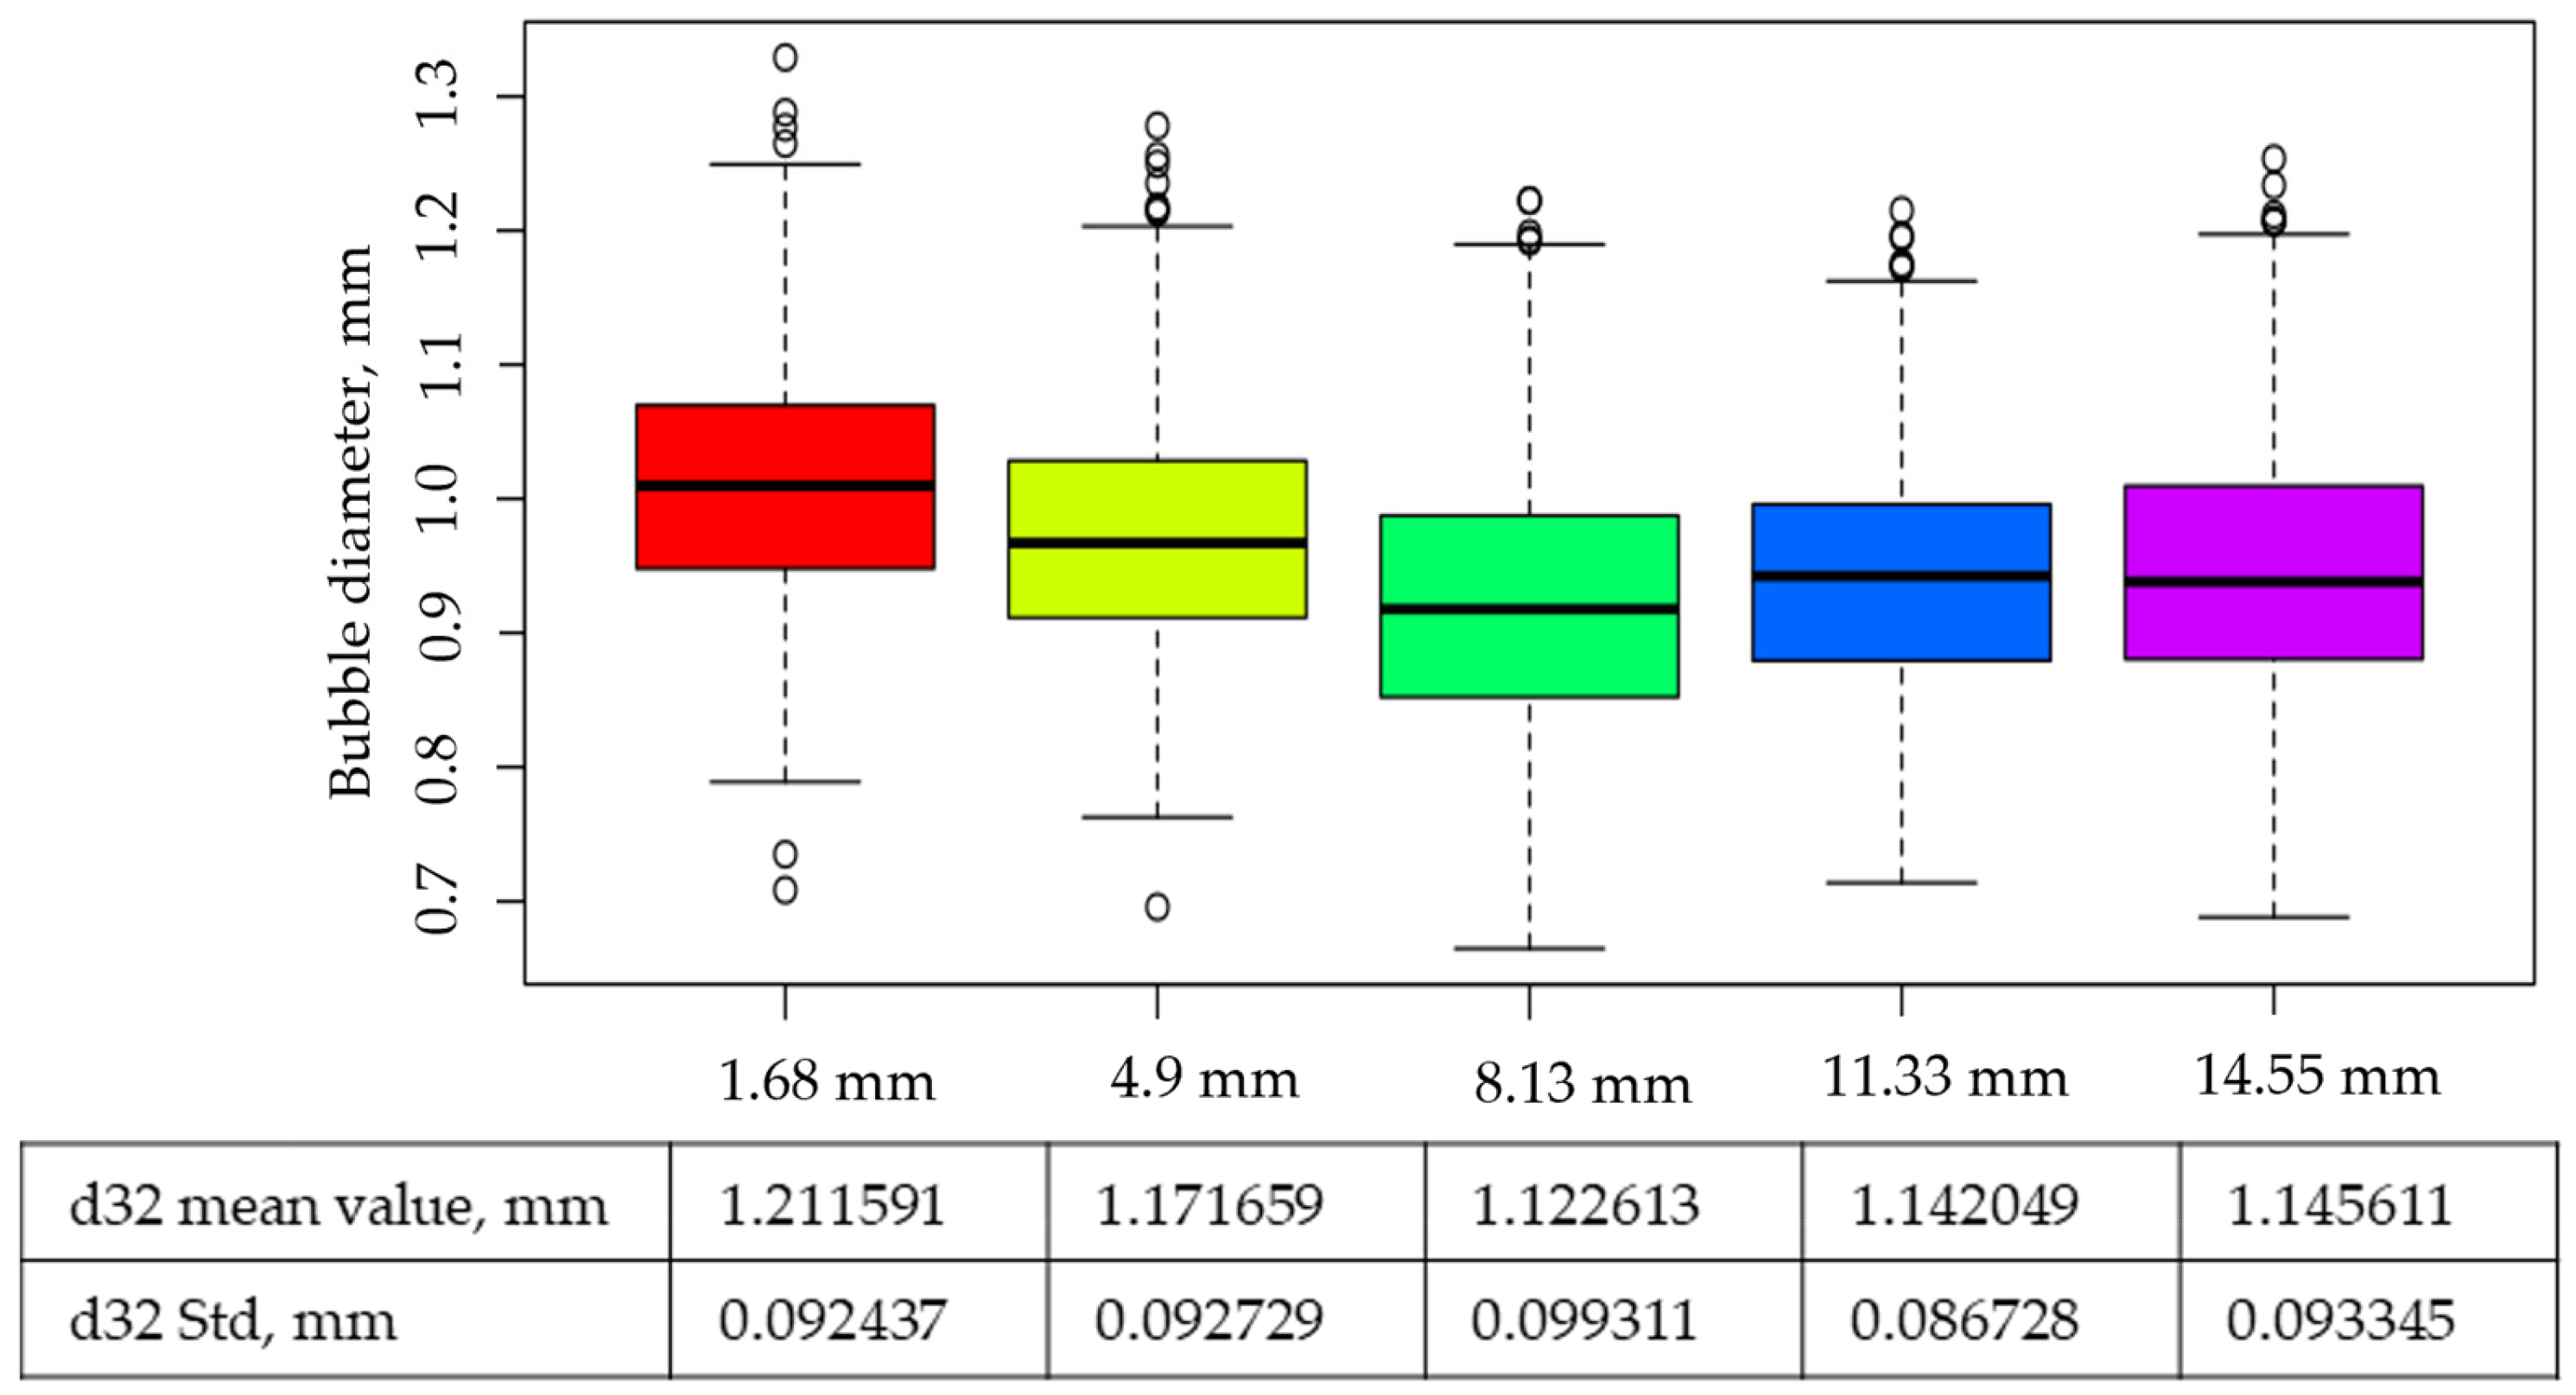
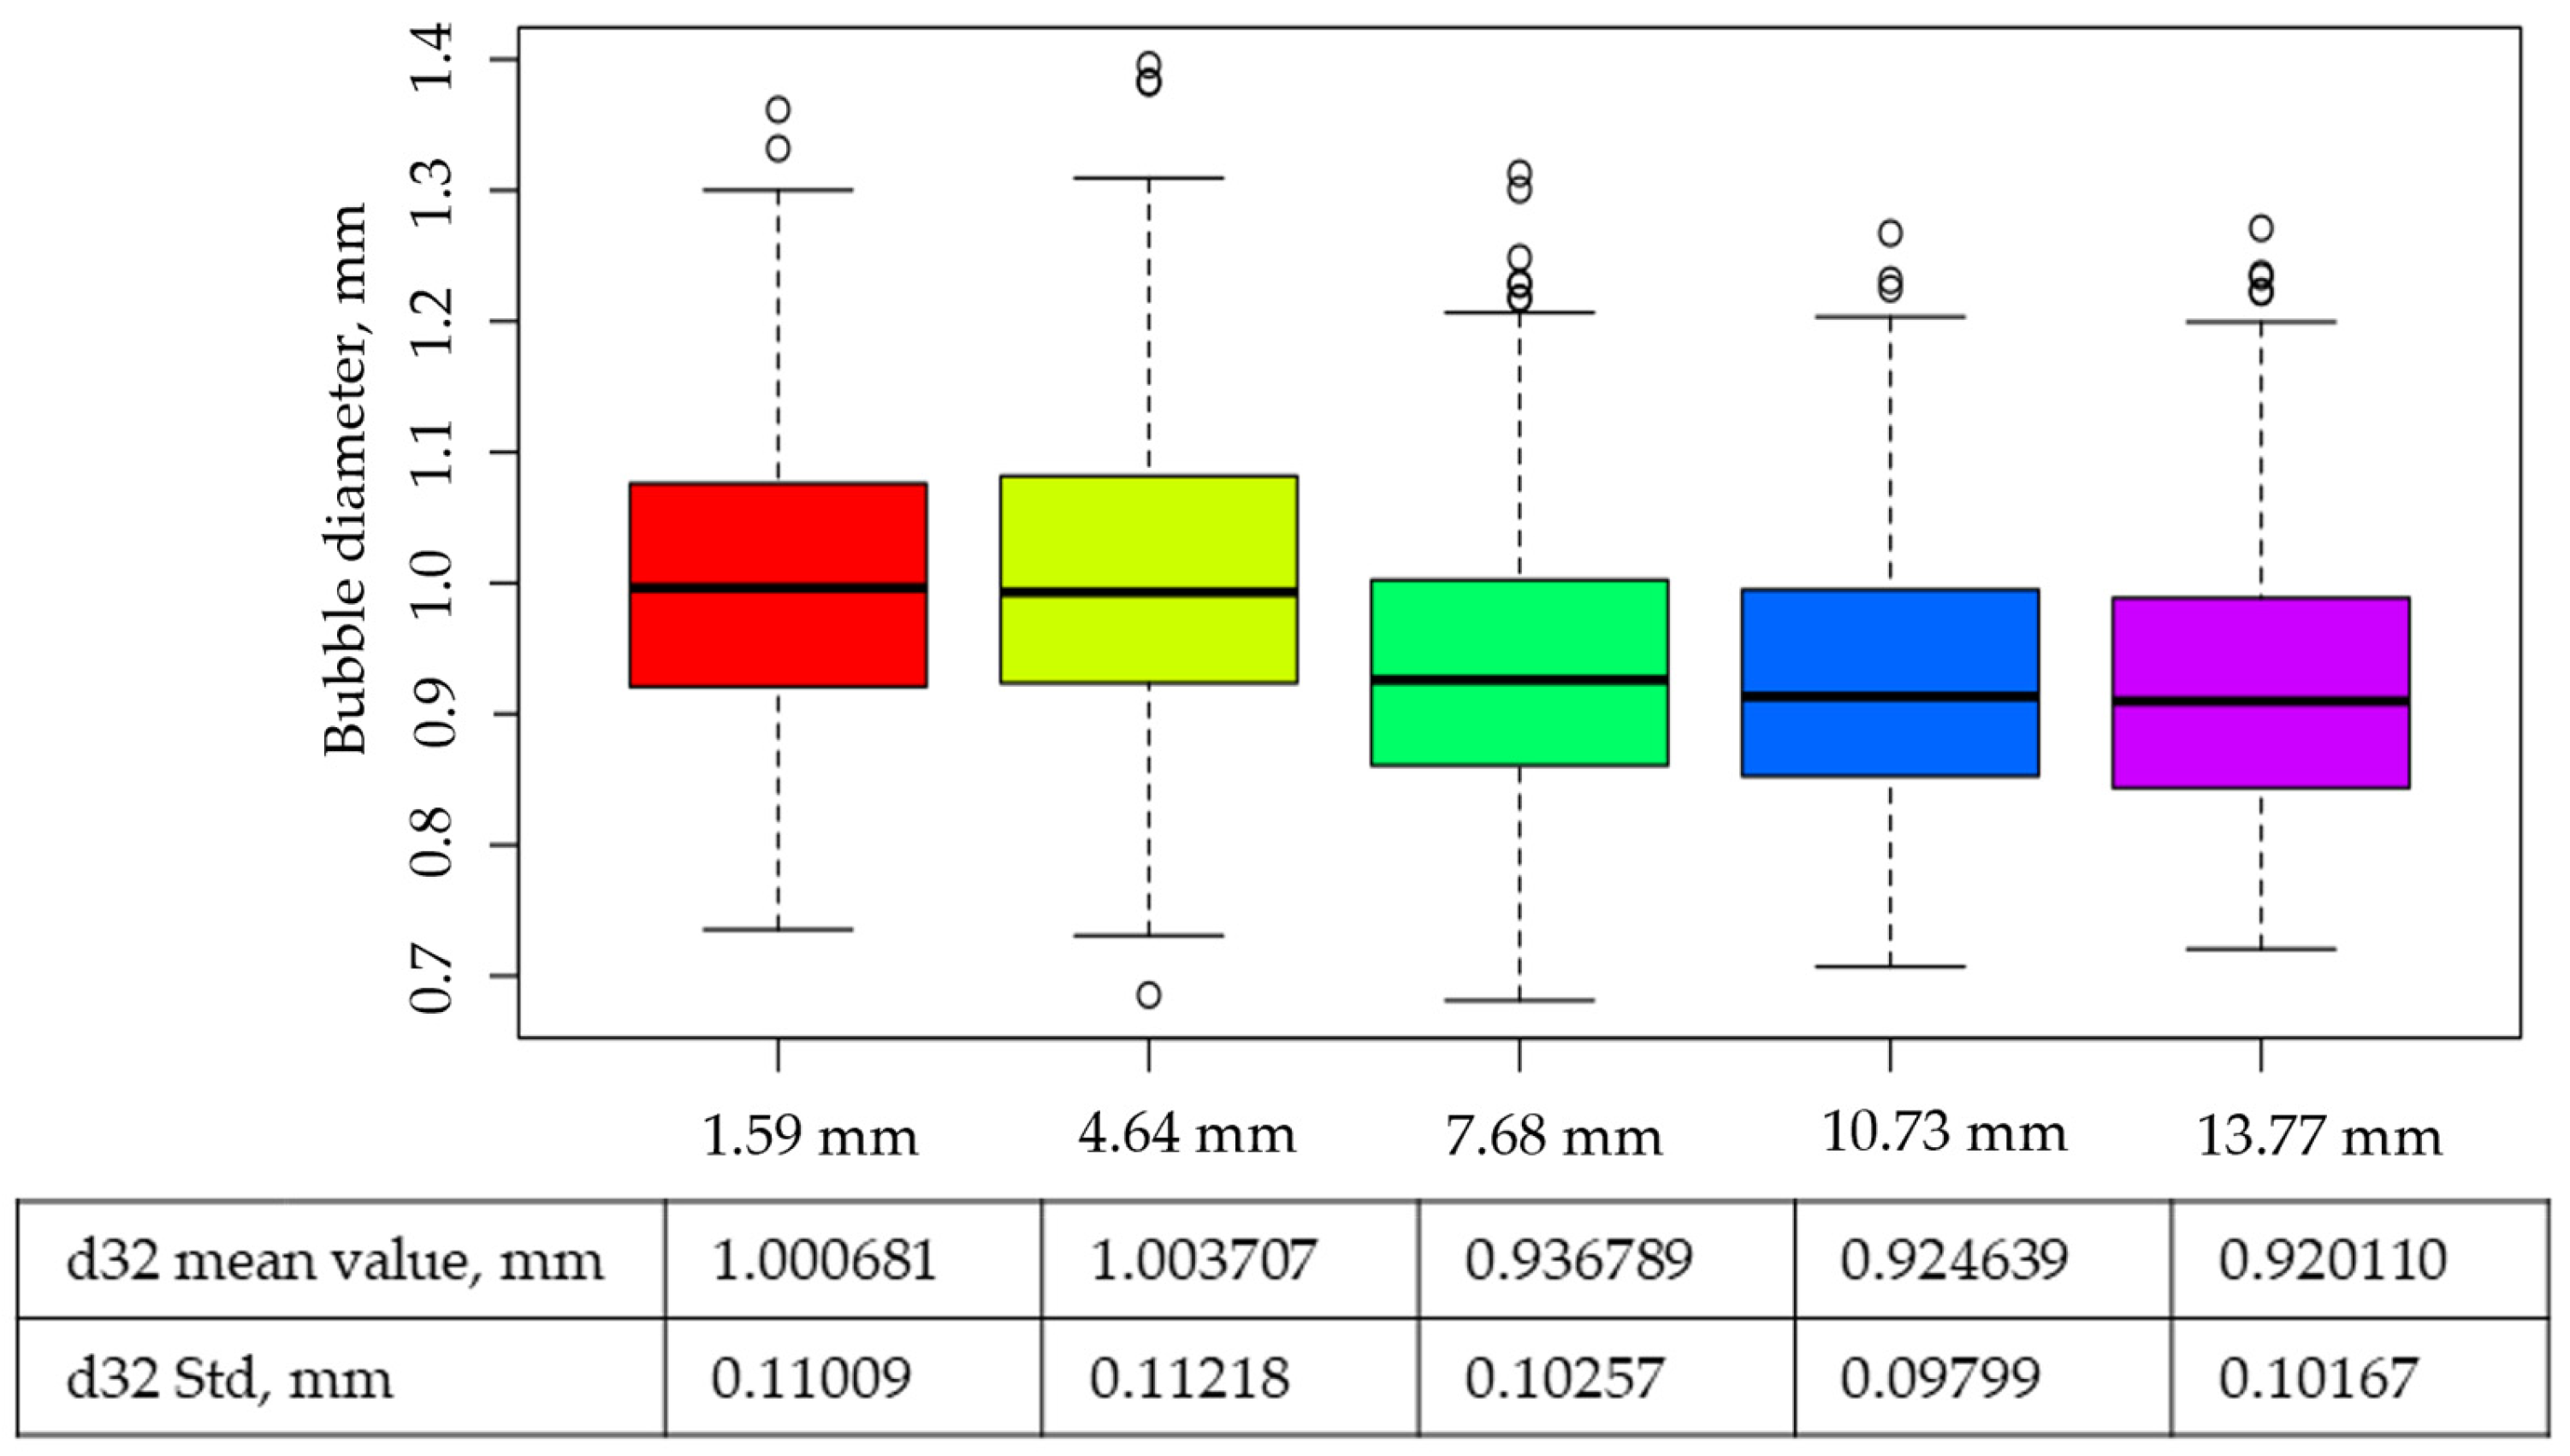
The obtained values of instantaneous bubble size distributions were used to construct time series of the d 32 parameter. The time series were built over an interval from 0 to 150 s. Figure 11 and Figure 12 present the main statistical parameters of the resulting time series.
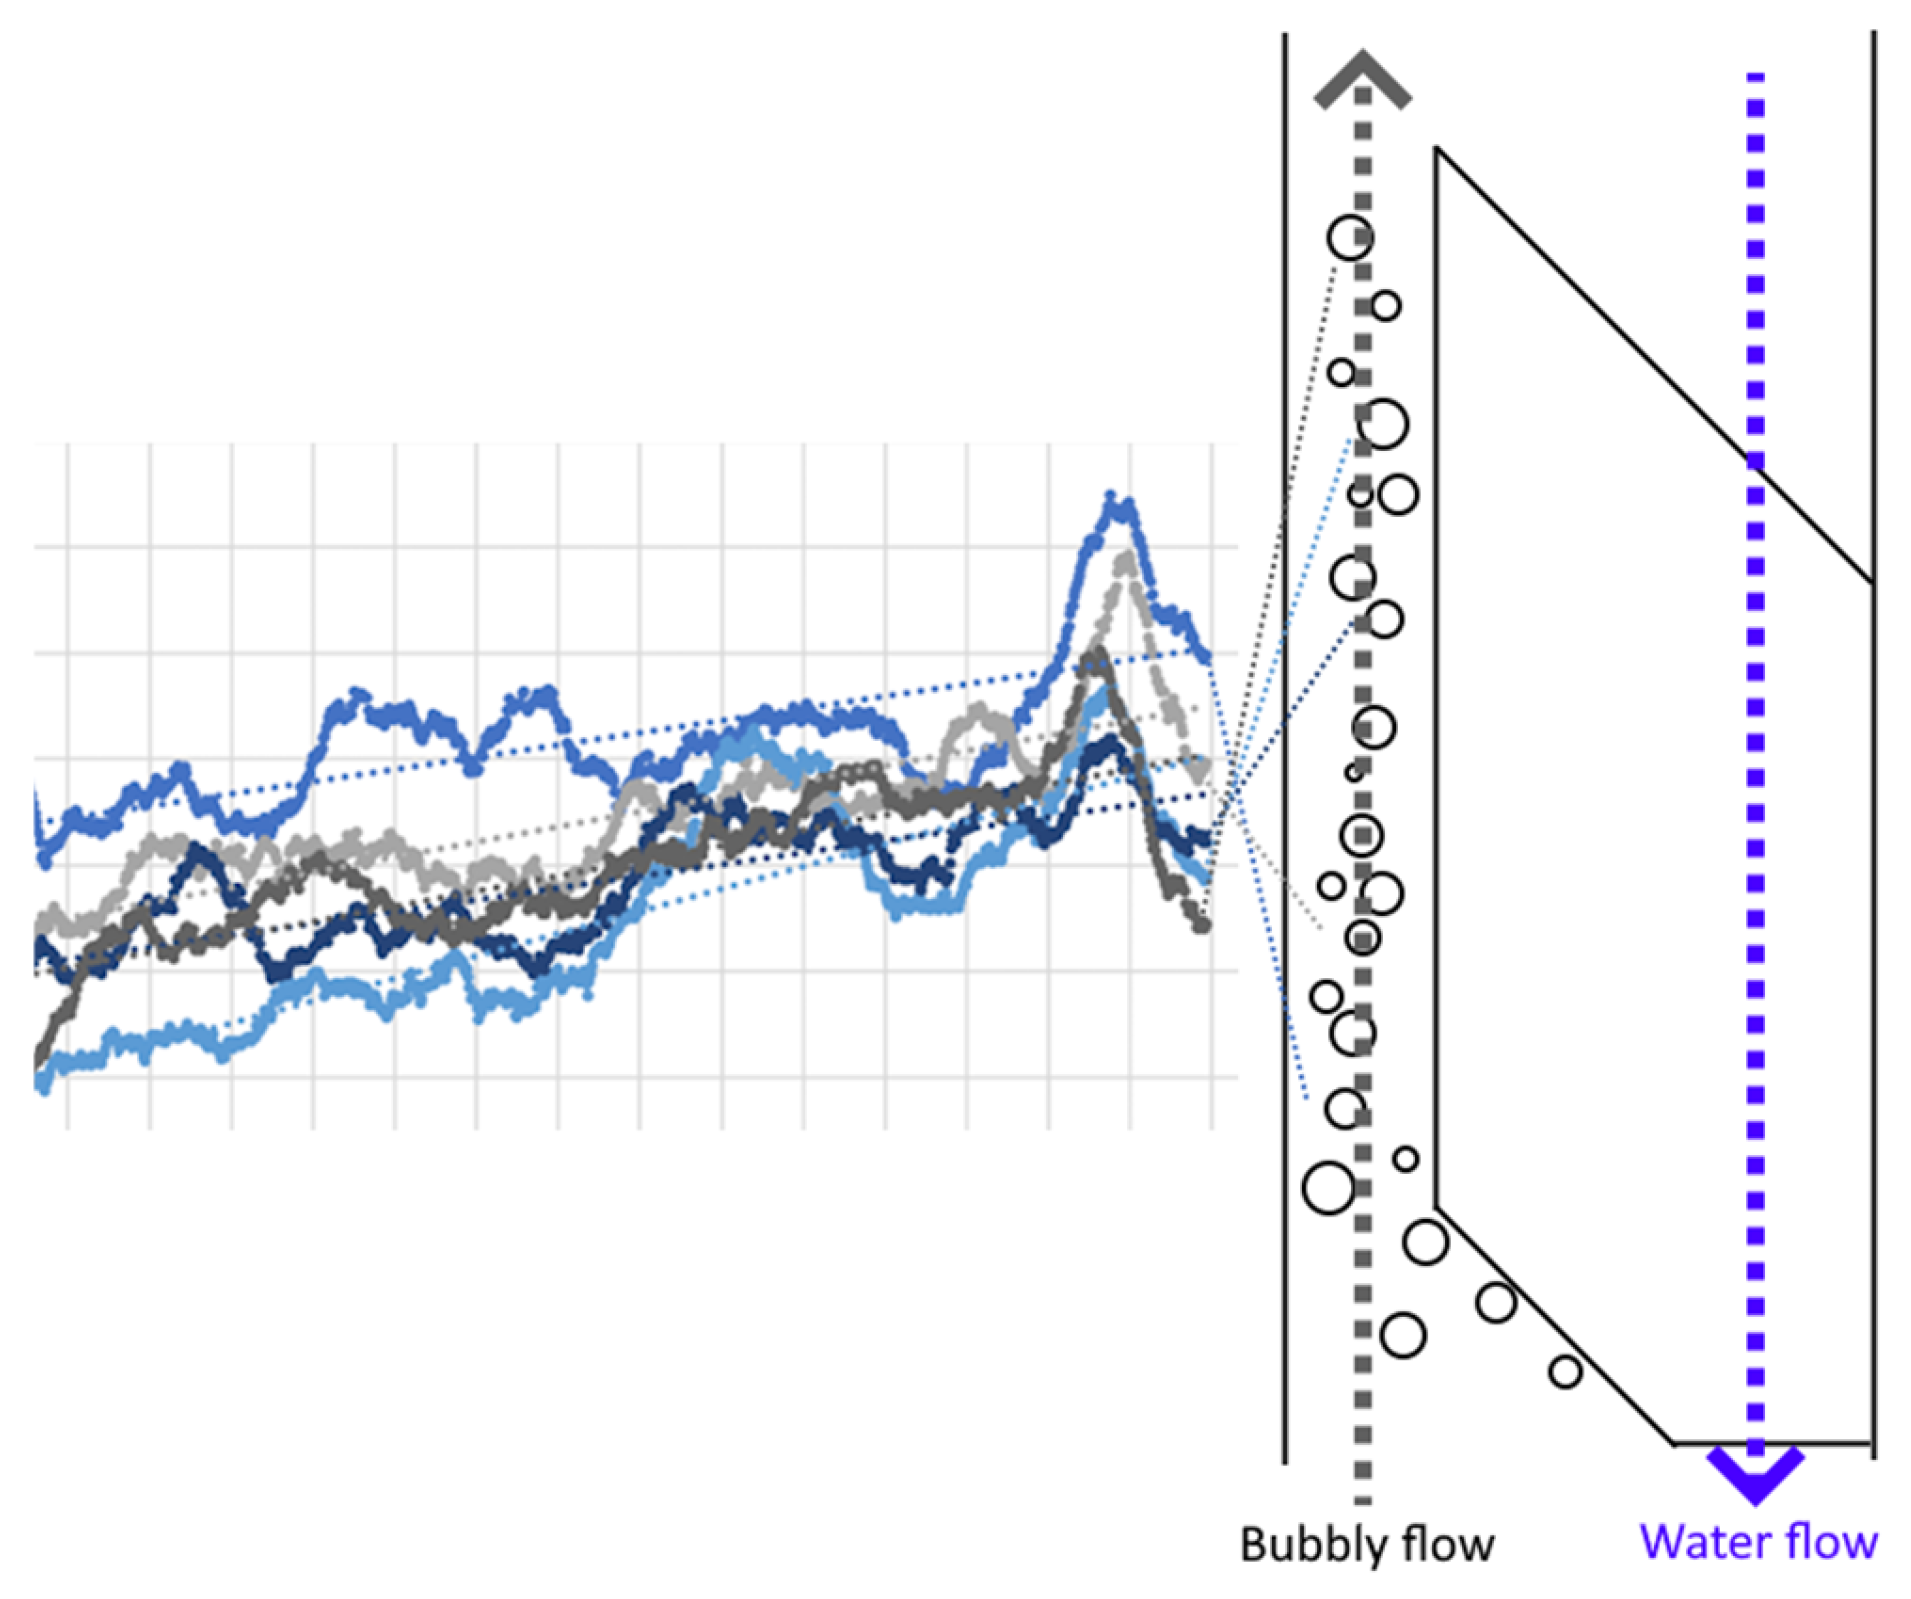
Based on the obtained data, a decrease in mean d32 values was observed with increasing measurement height. This phenomenon may be attributed to the specific characteristics of bubble measurement within the tube. To isolate the background and minimize perspective distortion effects, the tube incorporates an element that separates the ascending bubble flow from the descending flow of displaced water. In the lower portion of the frame, bubbles may be positioned closer to the wall due to trajectory deflection caused by this separating element, with subsequent transition to a steady-state trajectory and convergence of values at upper measurement levels. This interpretation is consistent with the similarity of graph values obtained from the upper measurement zones. The described process is schematically represented in Figure 13.
However, the variation in values across different elevation levels remains within the range of dispersion; therefore, it does not exert a critical effect on the determination of the d32 parameter.
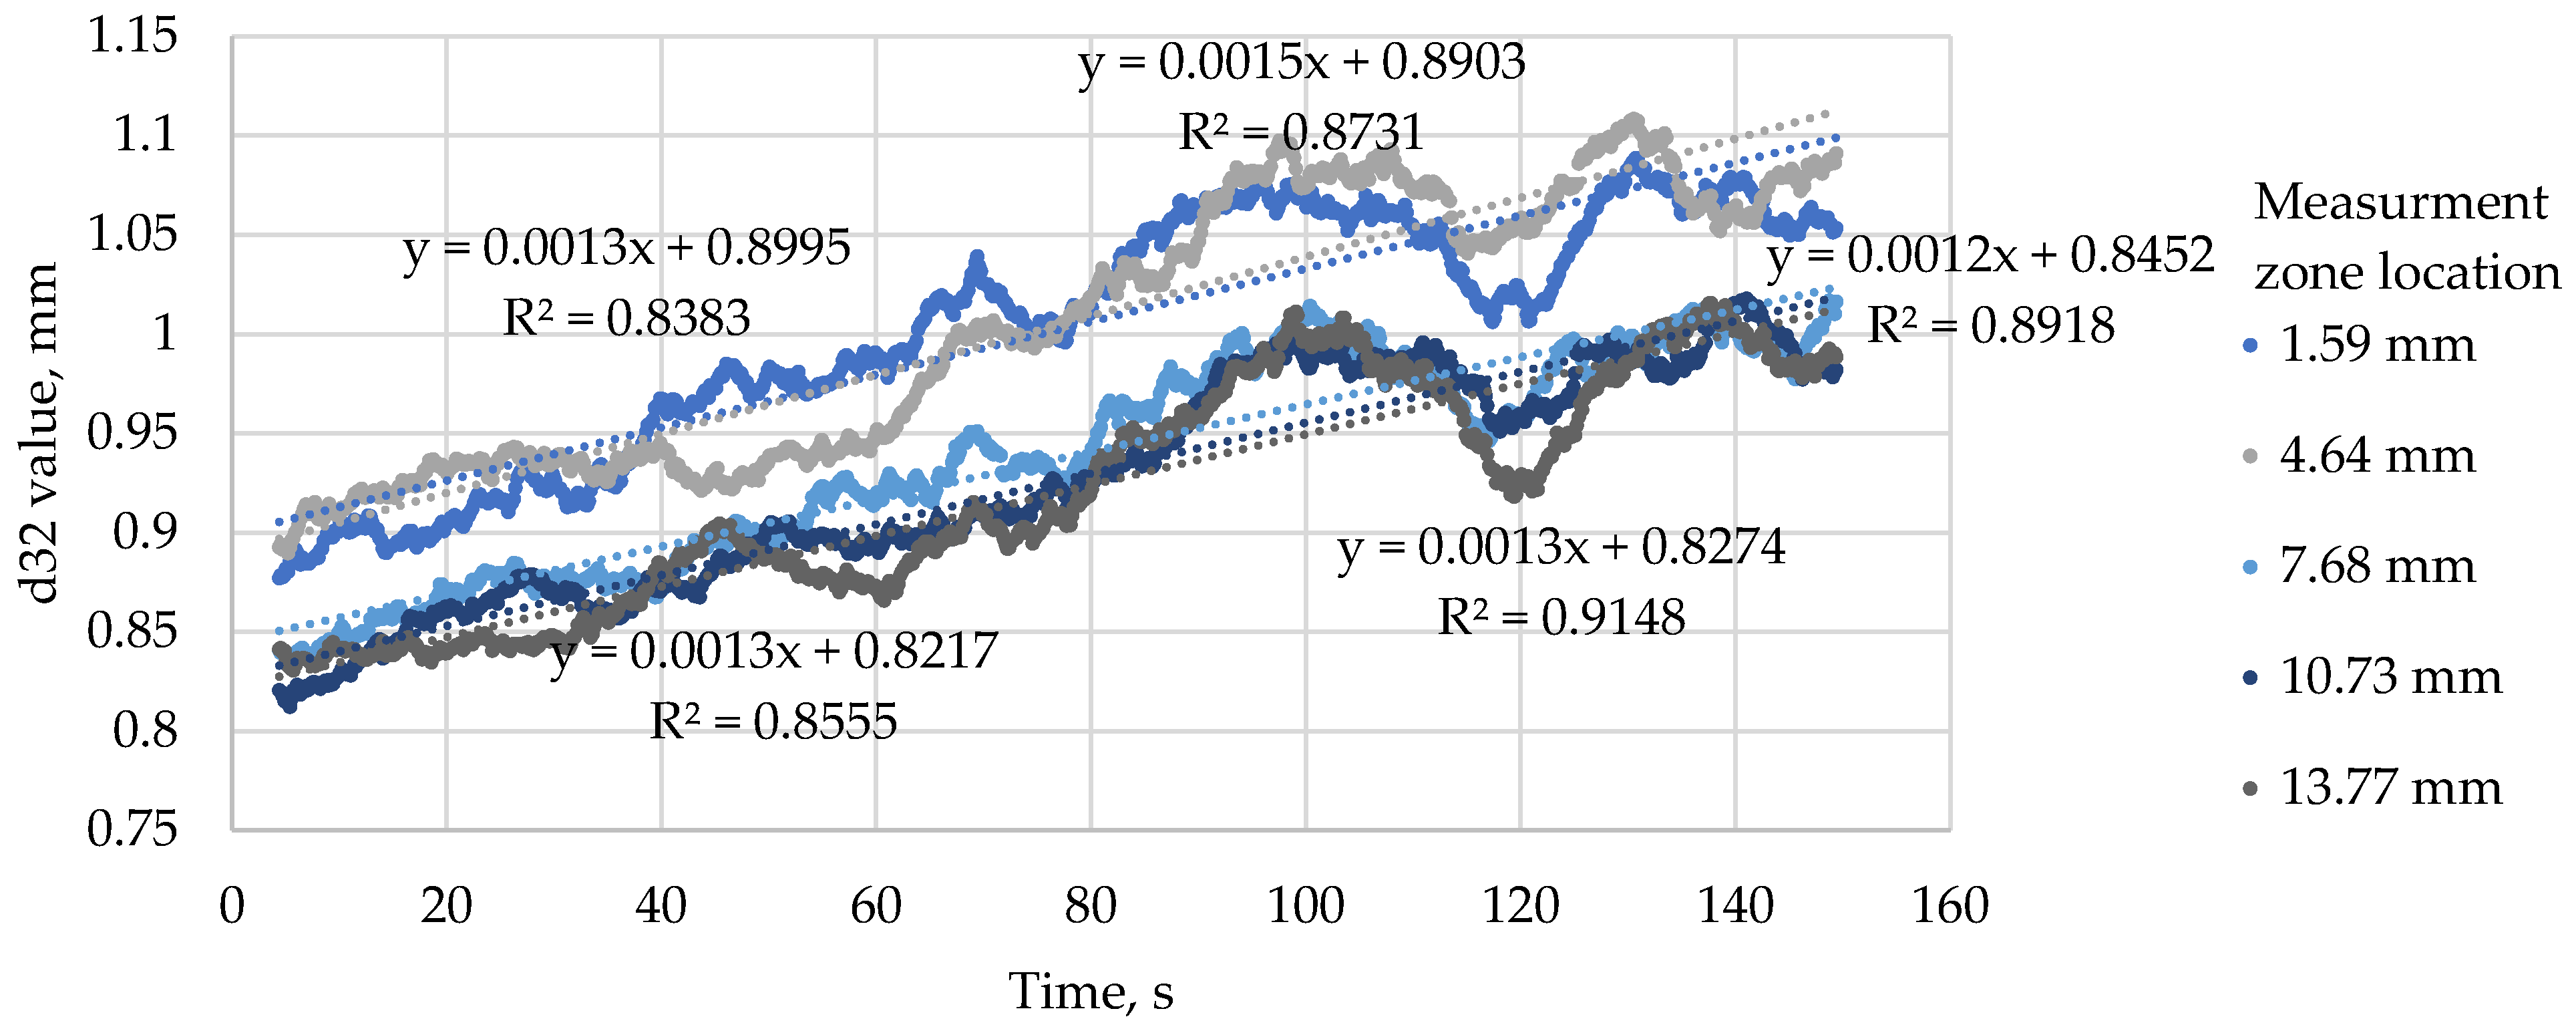
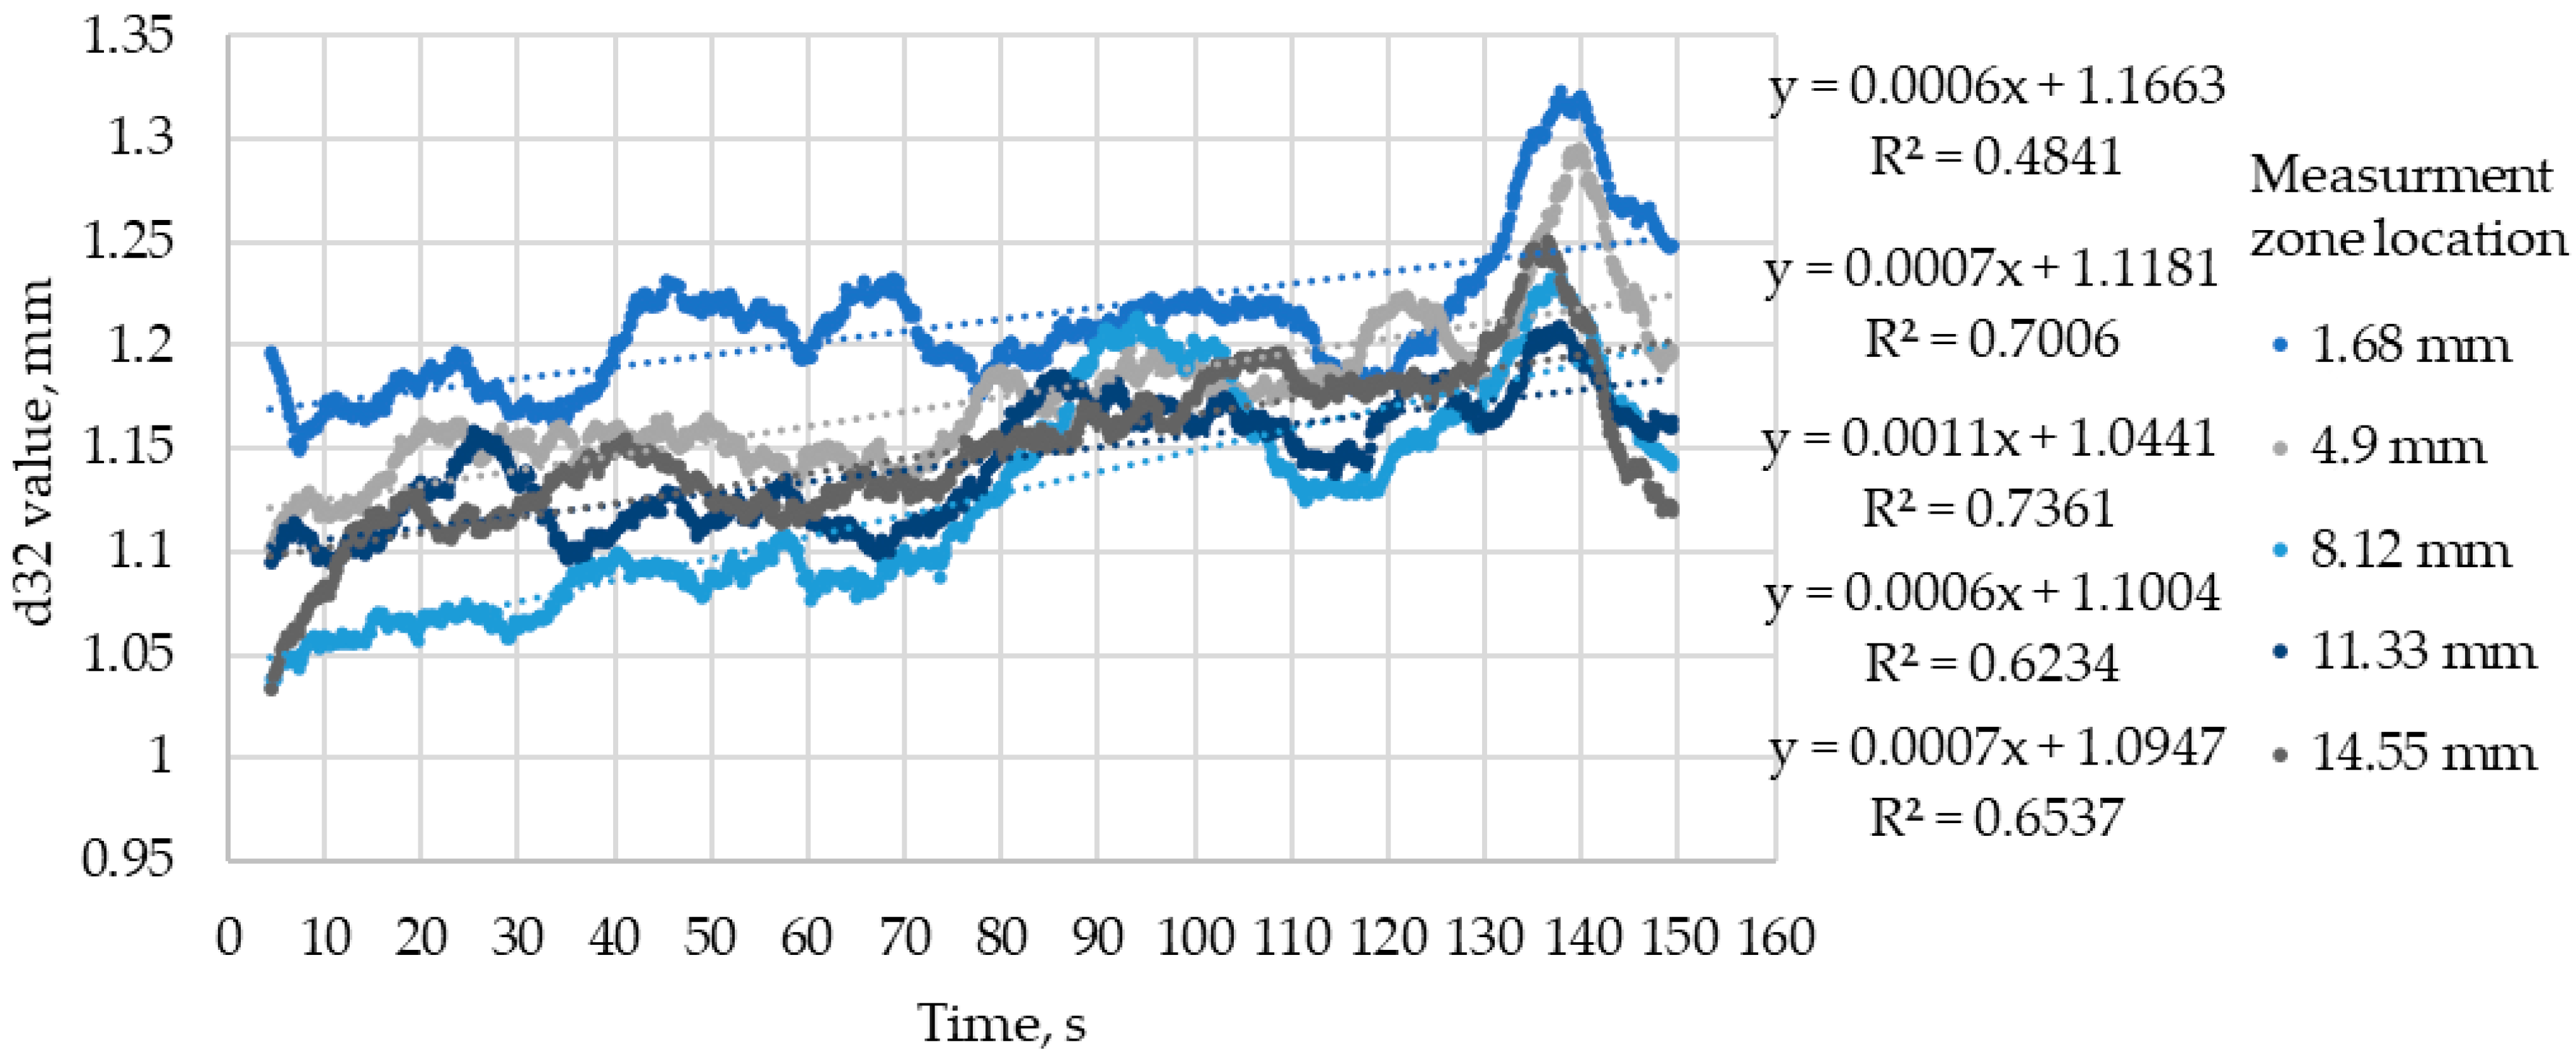
Figure 14 and Figure 15 show the results of applying the moving average method to the obtained time series, using a window size of 50 data points for the convolution of the original function.
The measurement time range was limited by the characteristics of the measuring tube, specifically its capacity. The incoming gas gradually displaced the solution up to the fixation level, making further measurements impossible. All subsequent measurements and calculations were therefore conducted within this defined, limited time range.
The smoothed time series, exhibiting relatively high coefficients of determination, can be described by linear interpolation equations over the specified time interval. The slope coefficients of the linear interpolation curves average around 0.13% of the mean d 32 value across the height. This observed trend is likely associated with the gradual depletion of frother from the system and is expected to continue until a certain bubble size is reached—one that falls outside the measurable range. Upon reaching this threshold, further changes should stabilize at a stationary value determined by the air dispersion parameters in the water.

3.2. Determination of Froth Layer Height Using Neural Network and Identification of Froth Removal Points, Froth Height Time-Series Post-Processing

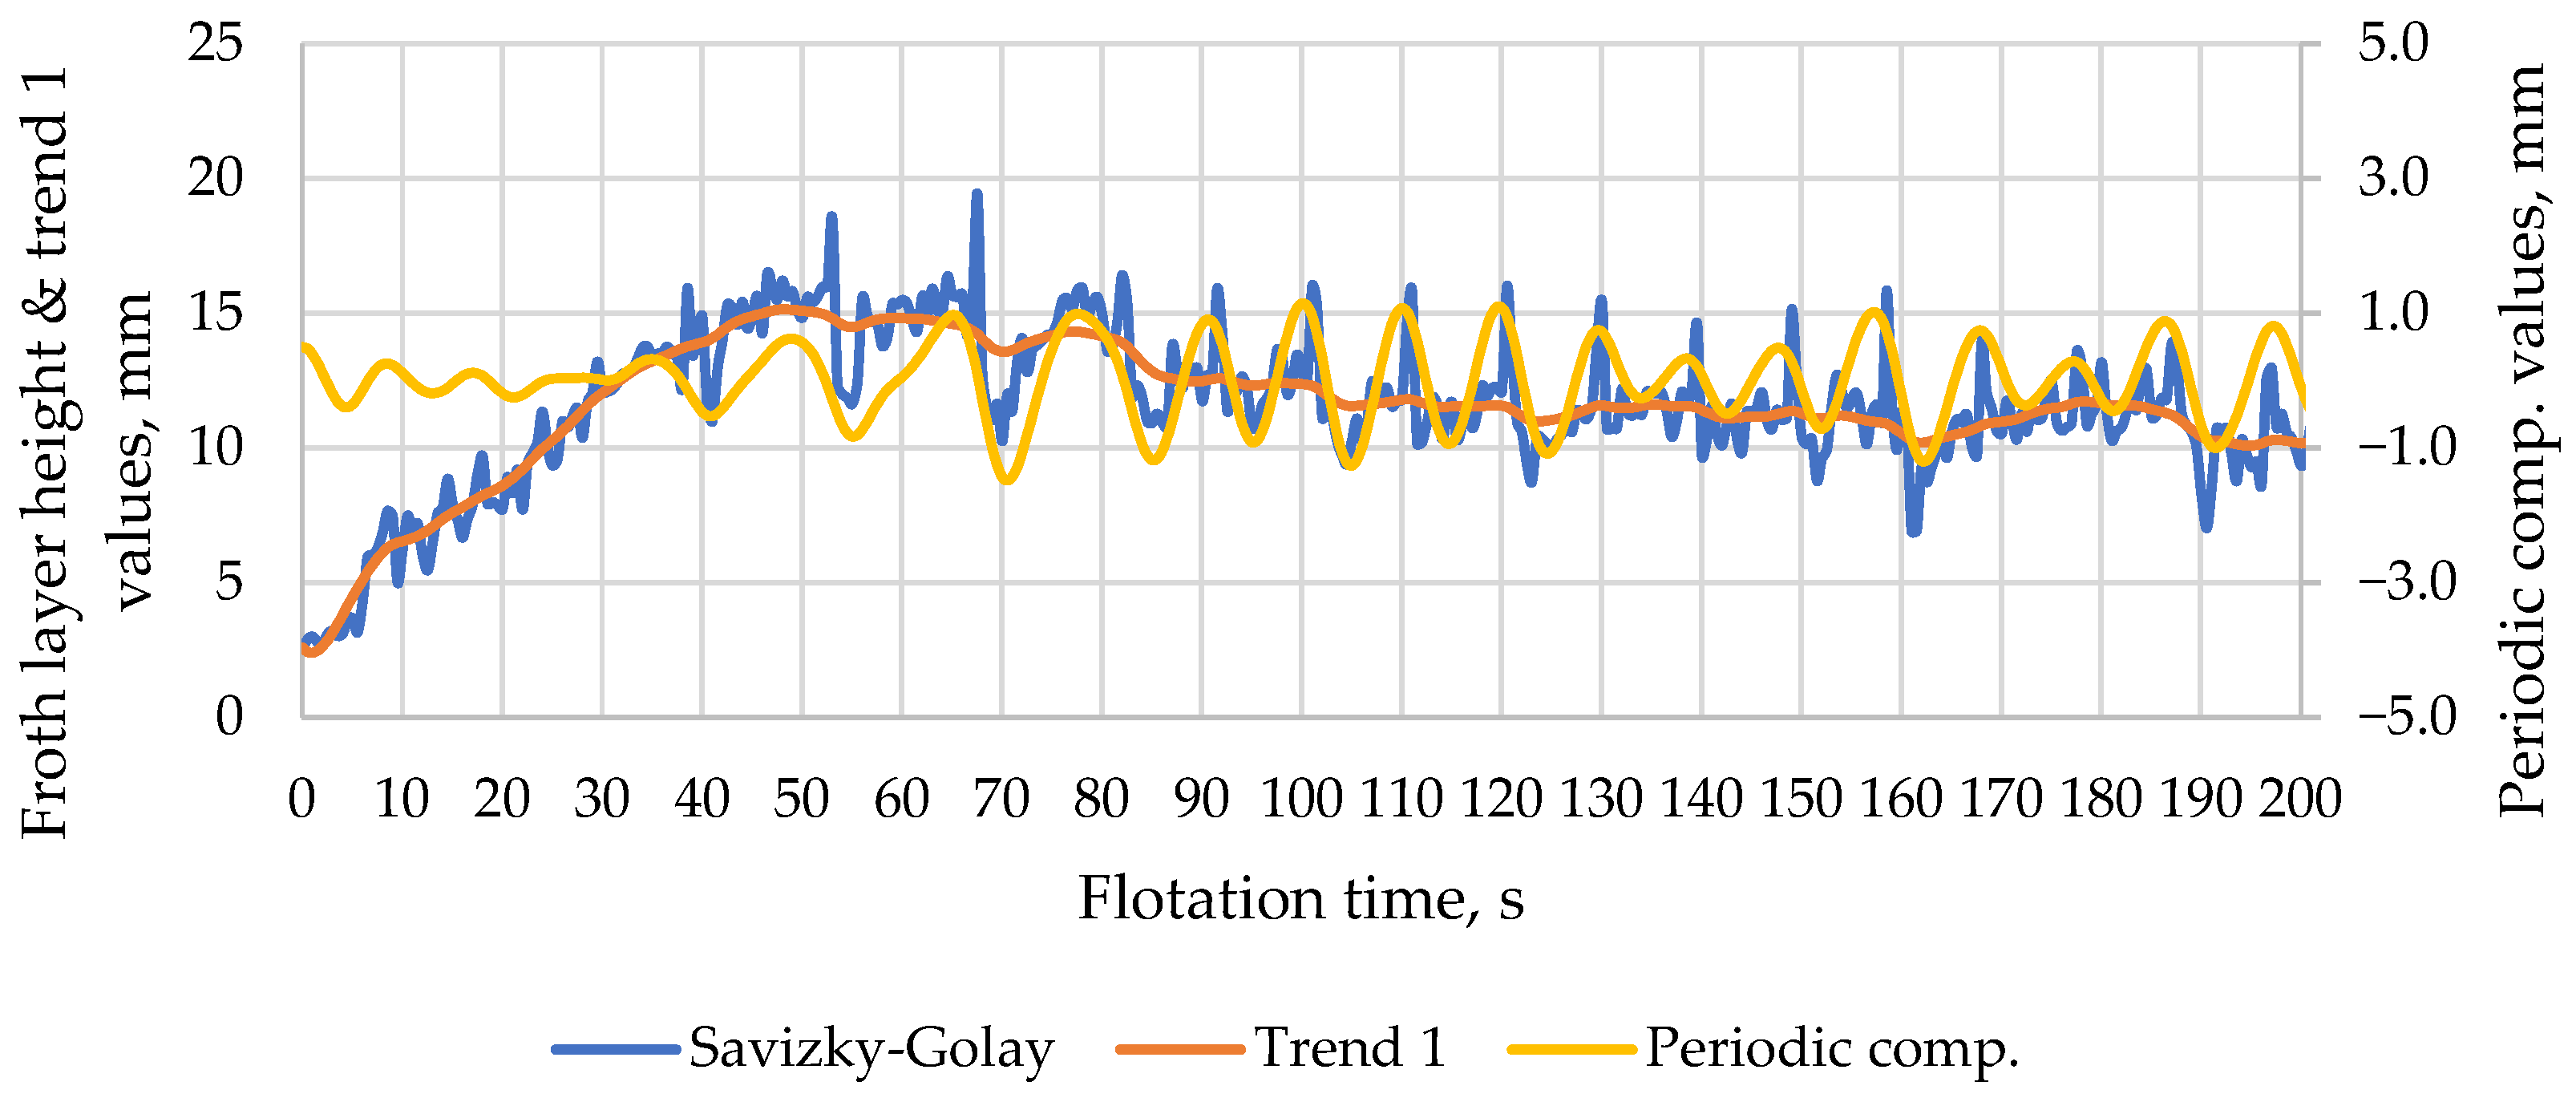
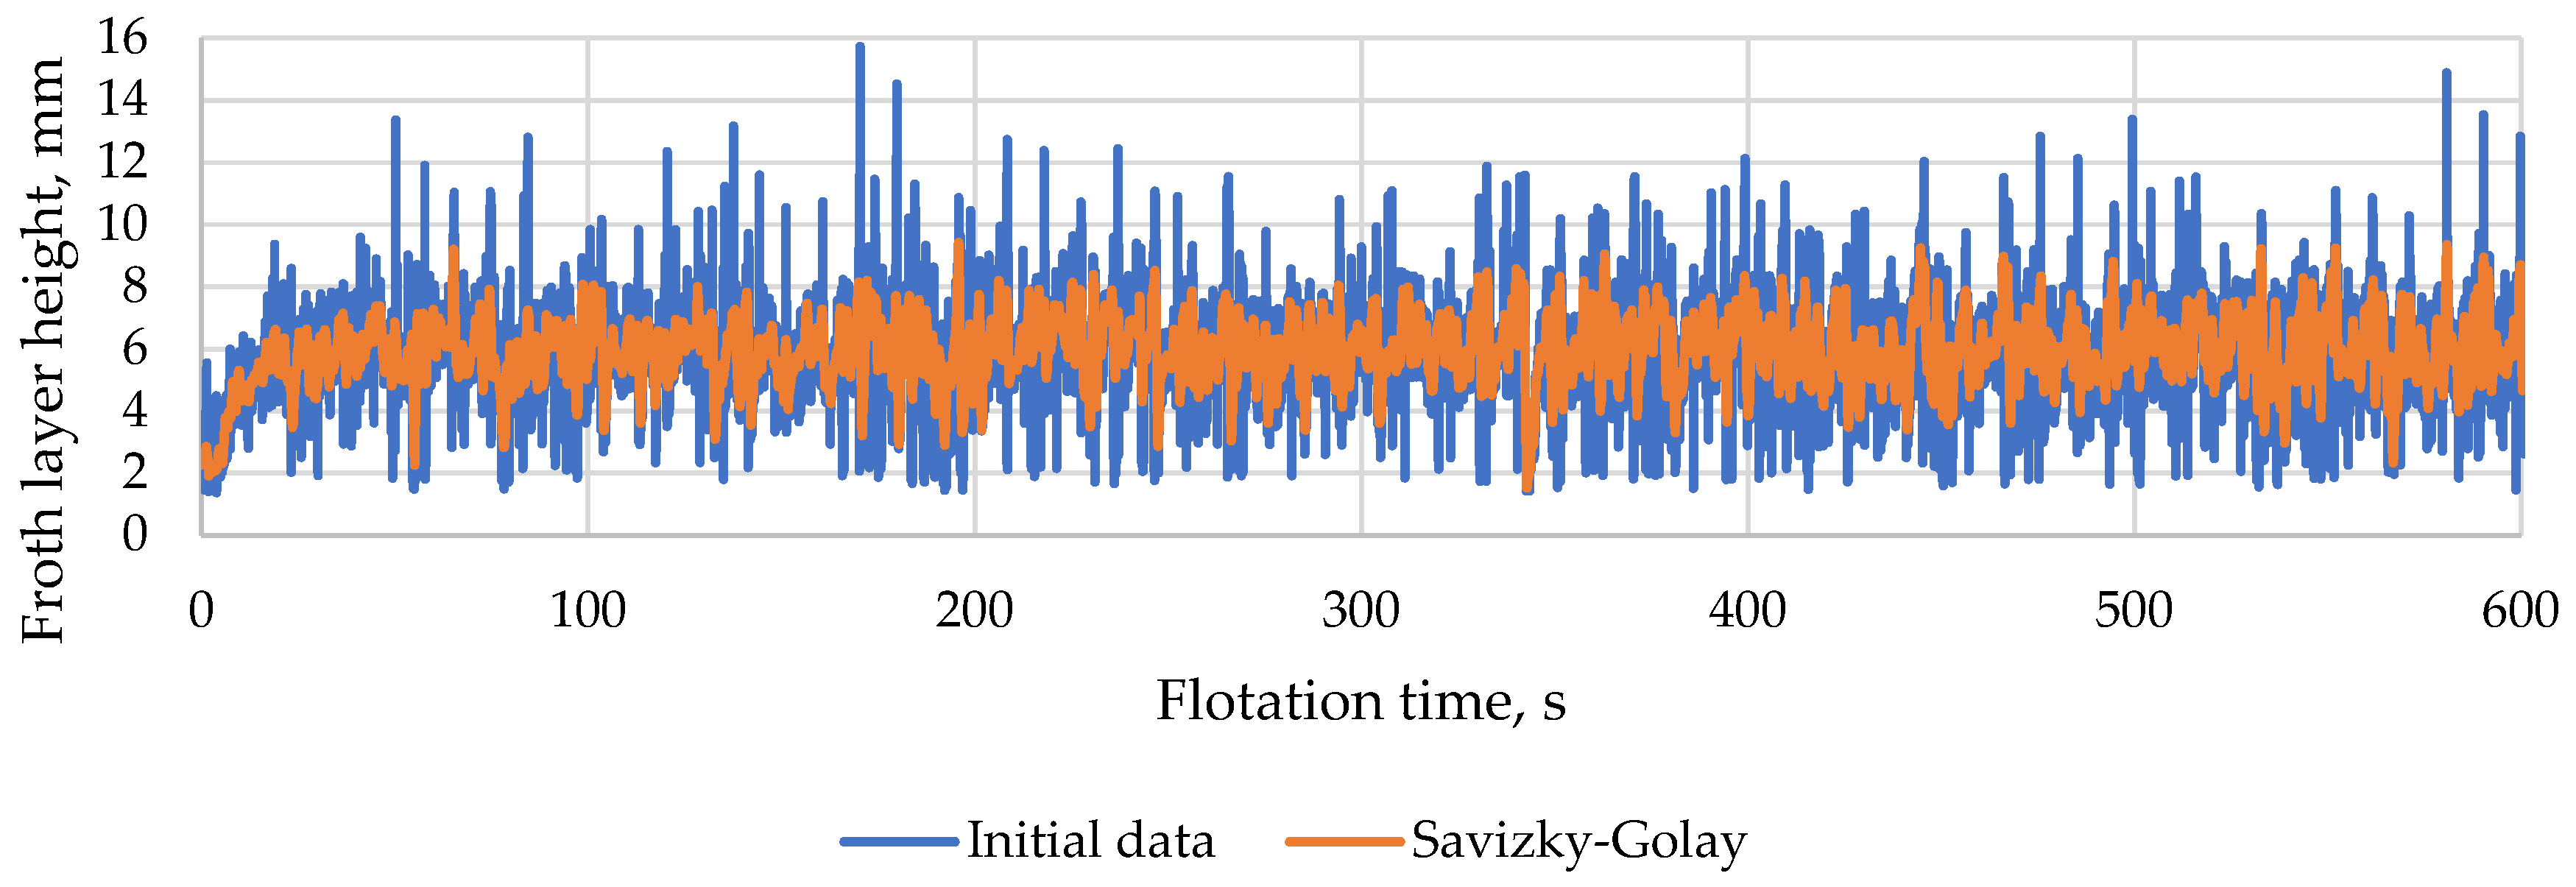
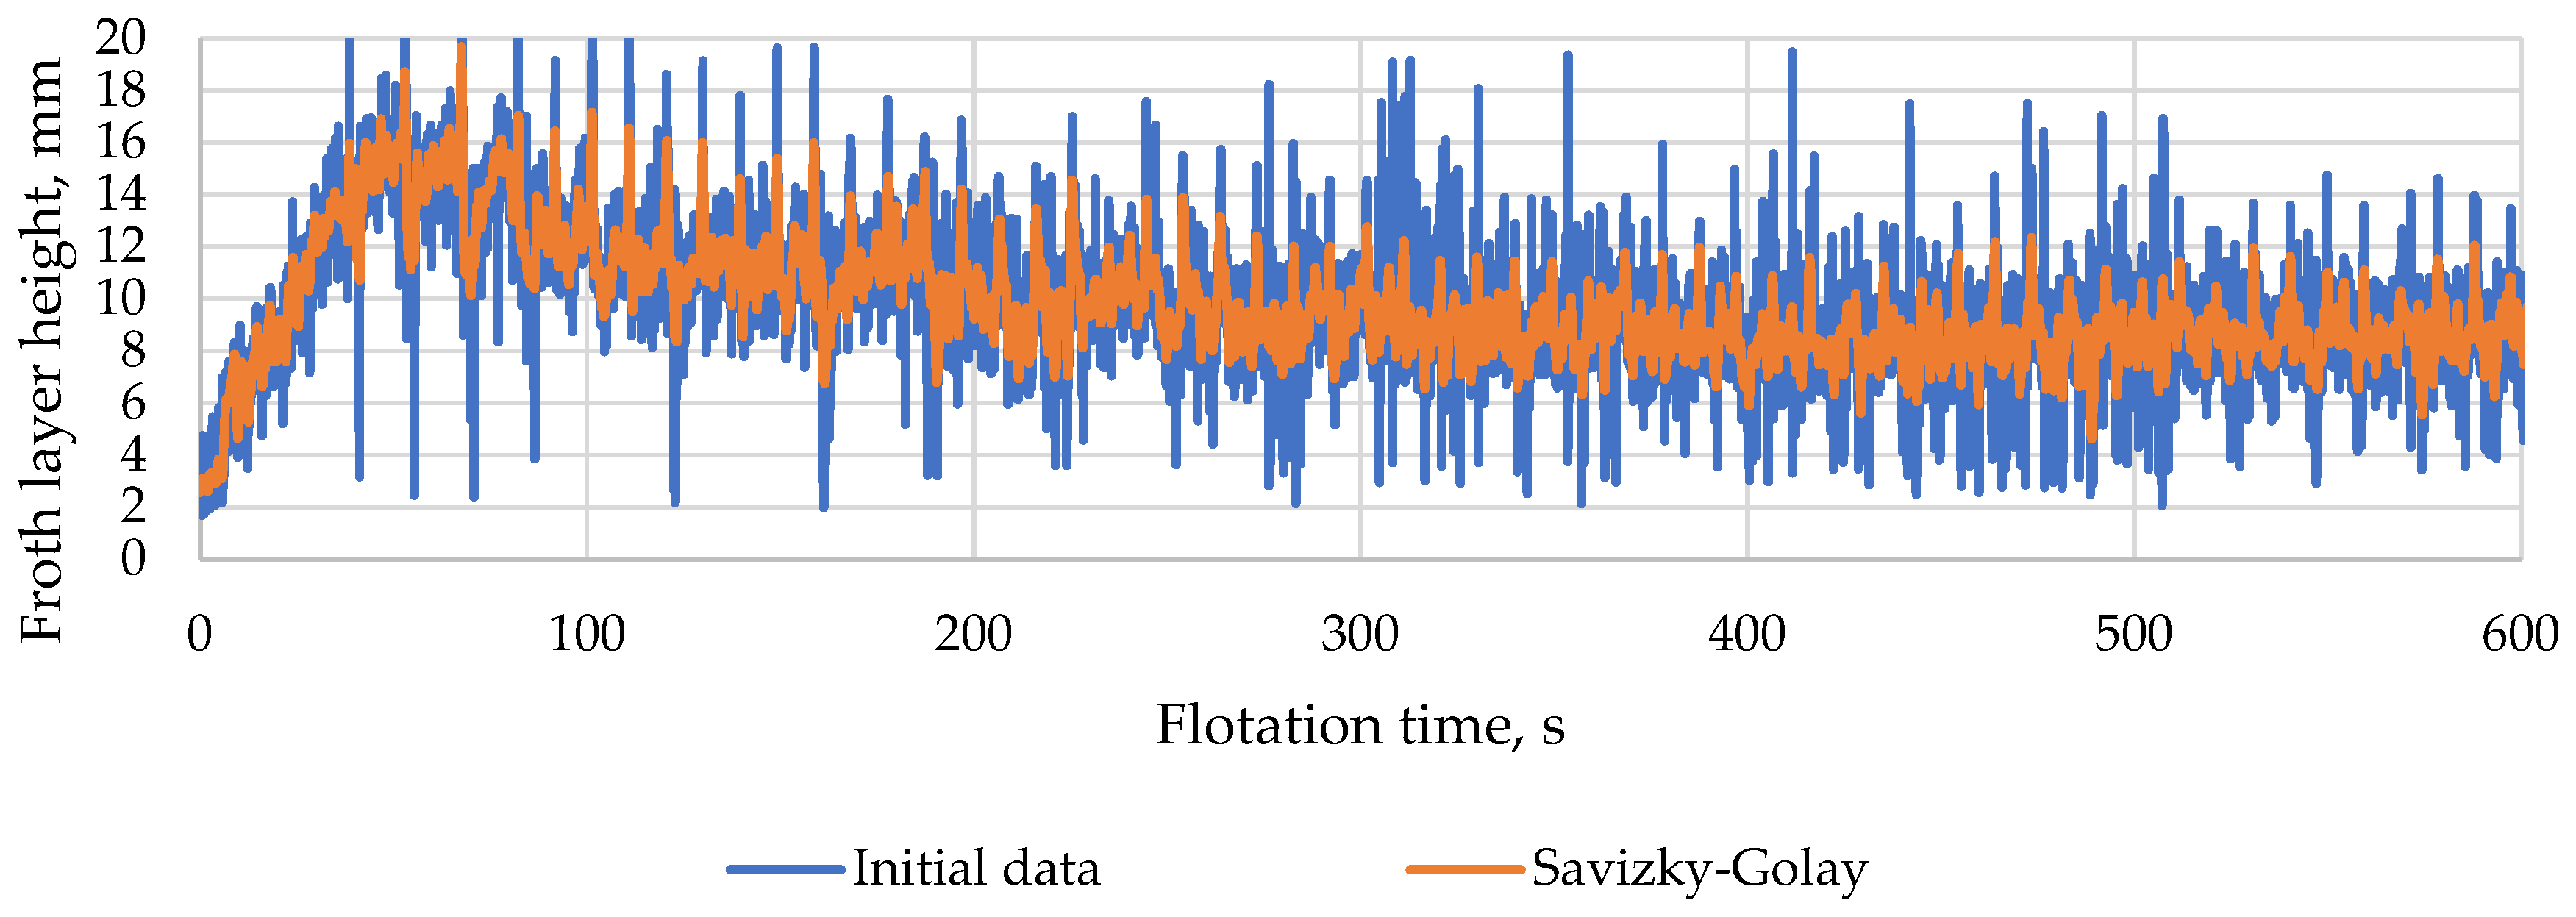
The neural network trained for froth layer recognition demonstrated a recognition accuracy of 98% and was subsequently employed to process video recordings of the froth layer. The results of froth layer height determination utilizing machine vision technology and noise reduction through the Savitzky–Golay filter are presented in Figure 16 and Figure 17. Data filtration enabled the reduction in value dispersion while preserving oscillations associated with the froth removal process by the scrapper.
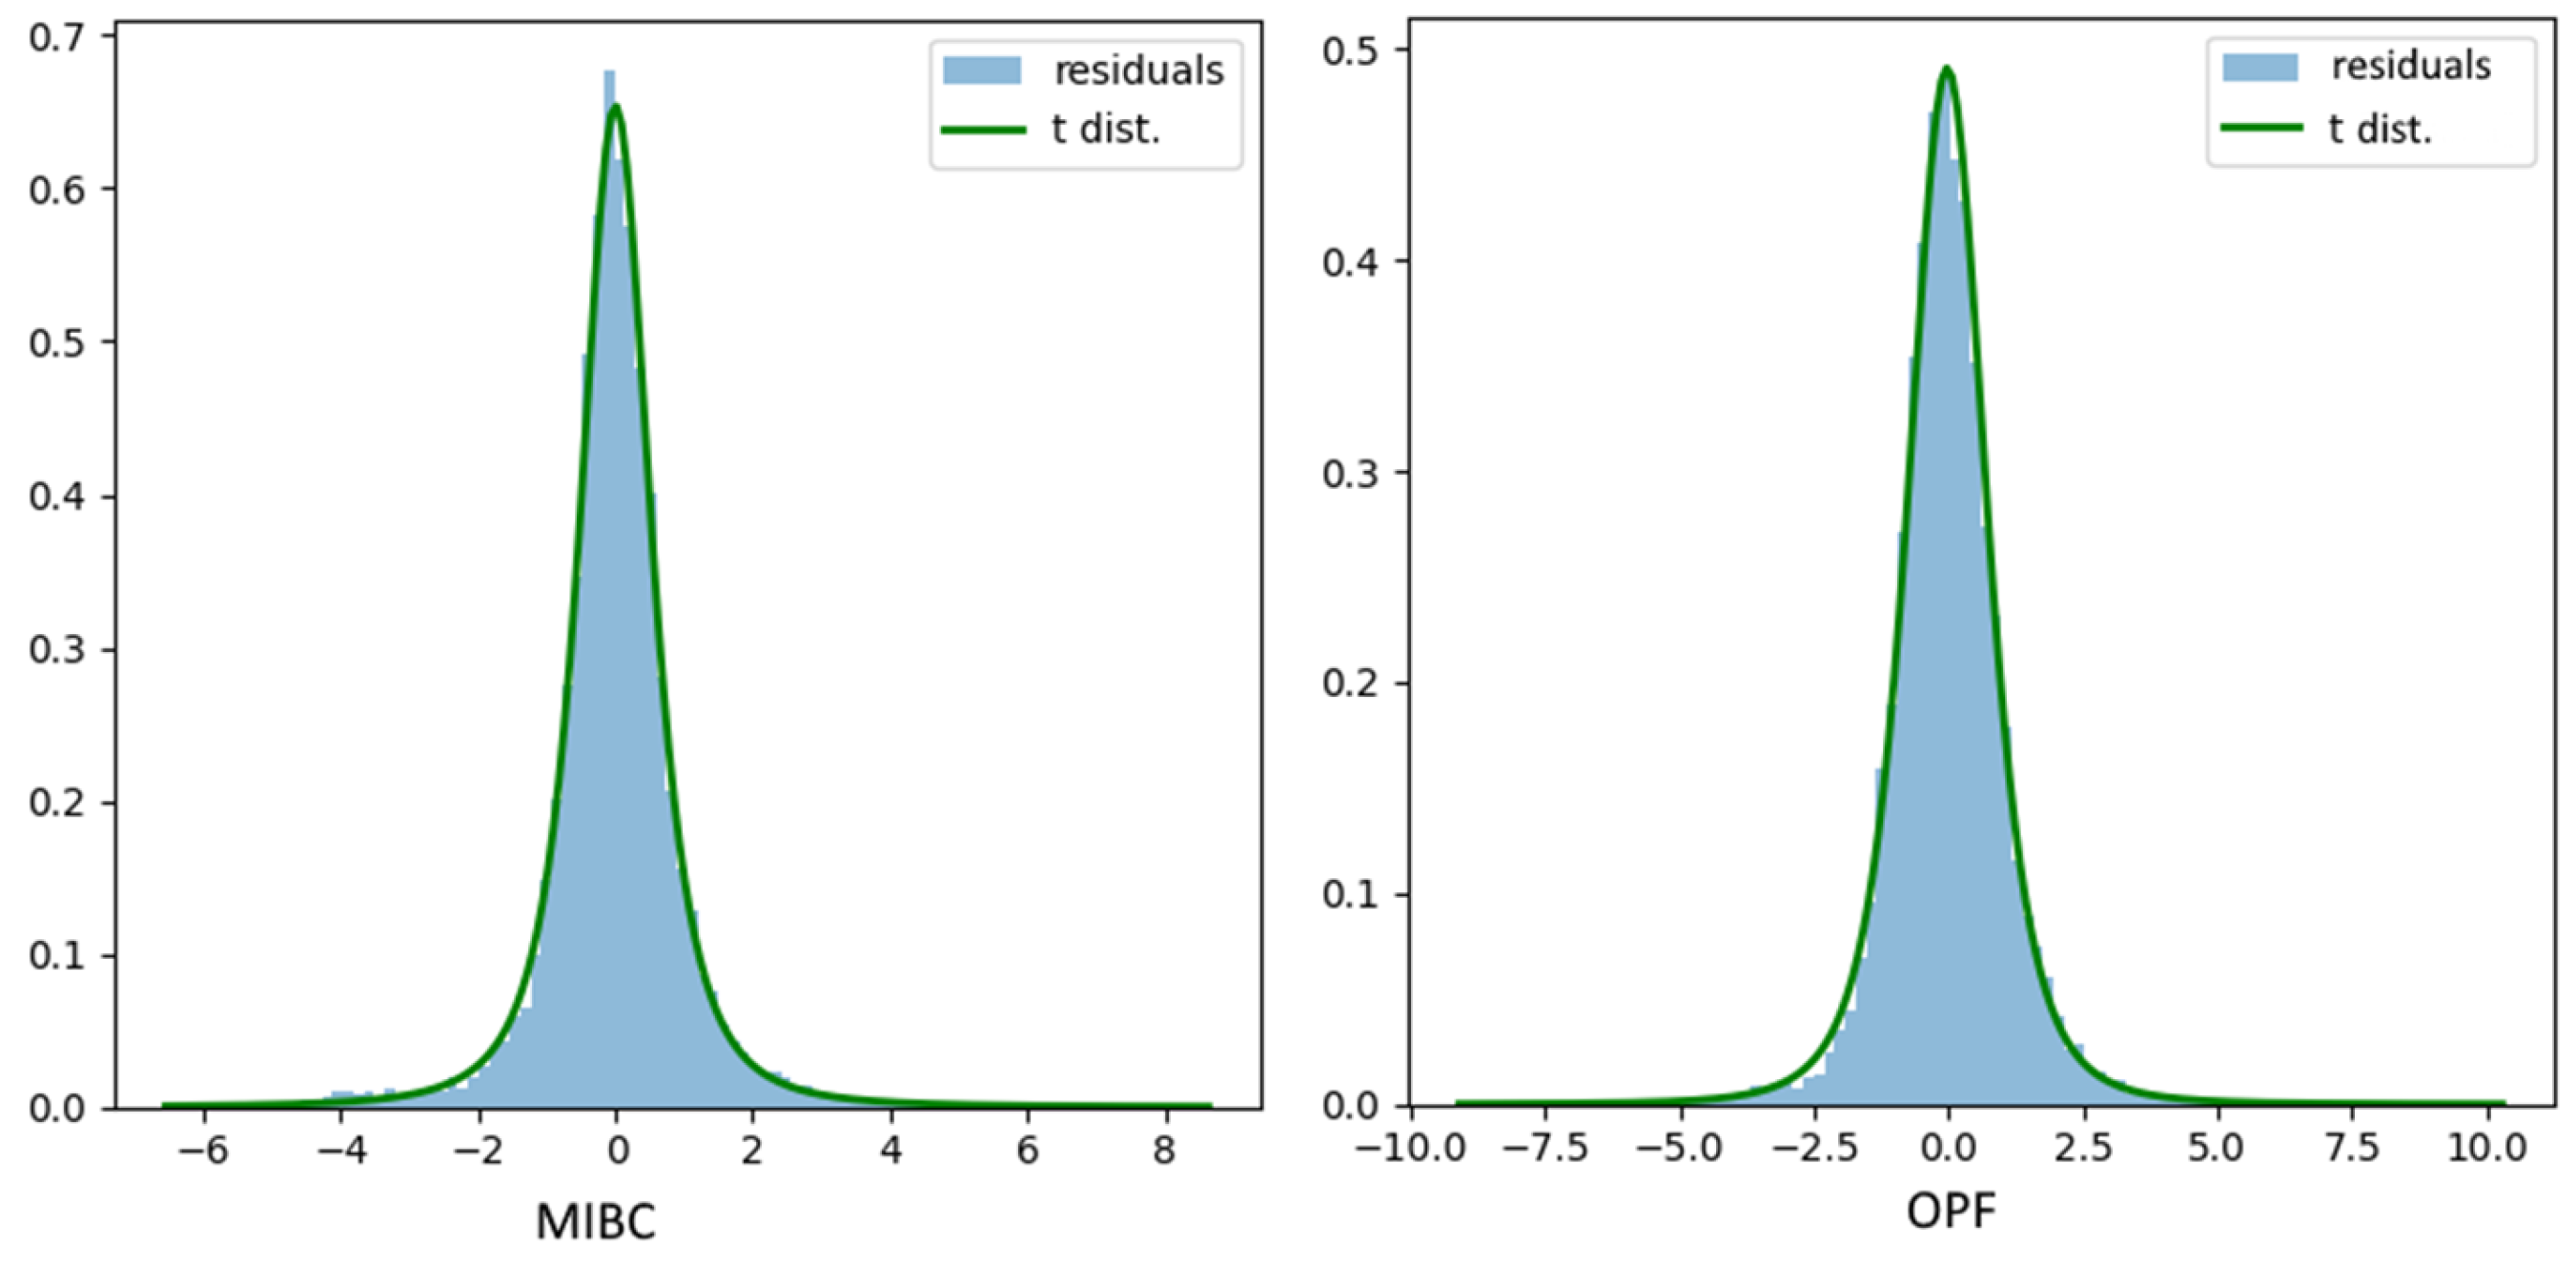
Statistical analysis of the residuals revealed that for both frothers, the mean value was equal to zero, with skewness coefficients of −0.24 for MIBC and 0.18 for PGF. Furthermore, statistical analysis demonstrated that the residual distributions conform to Student’s t-distribution, as established through the Kolmogorov–Smirnov test with p-values of 0.44 and 0.32 for MIBC and PGF, respectively. The mean value of zero, coupled with the distribution type, indicates that white noise was successfully removed by the filter. Student’s t-distribution is substantiated by the presence of heavy tails caused by peaks associated with froth removal, which is further corroborated by the correspondence between the number of intervals exhibiting high residual values and the number of froth removal events. The described distributions are presented in Figure 18.
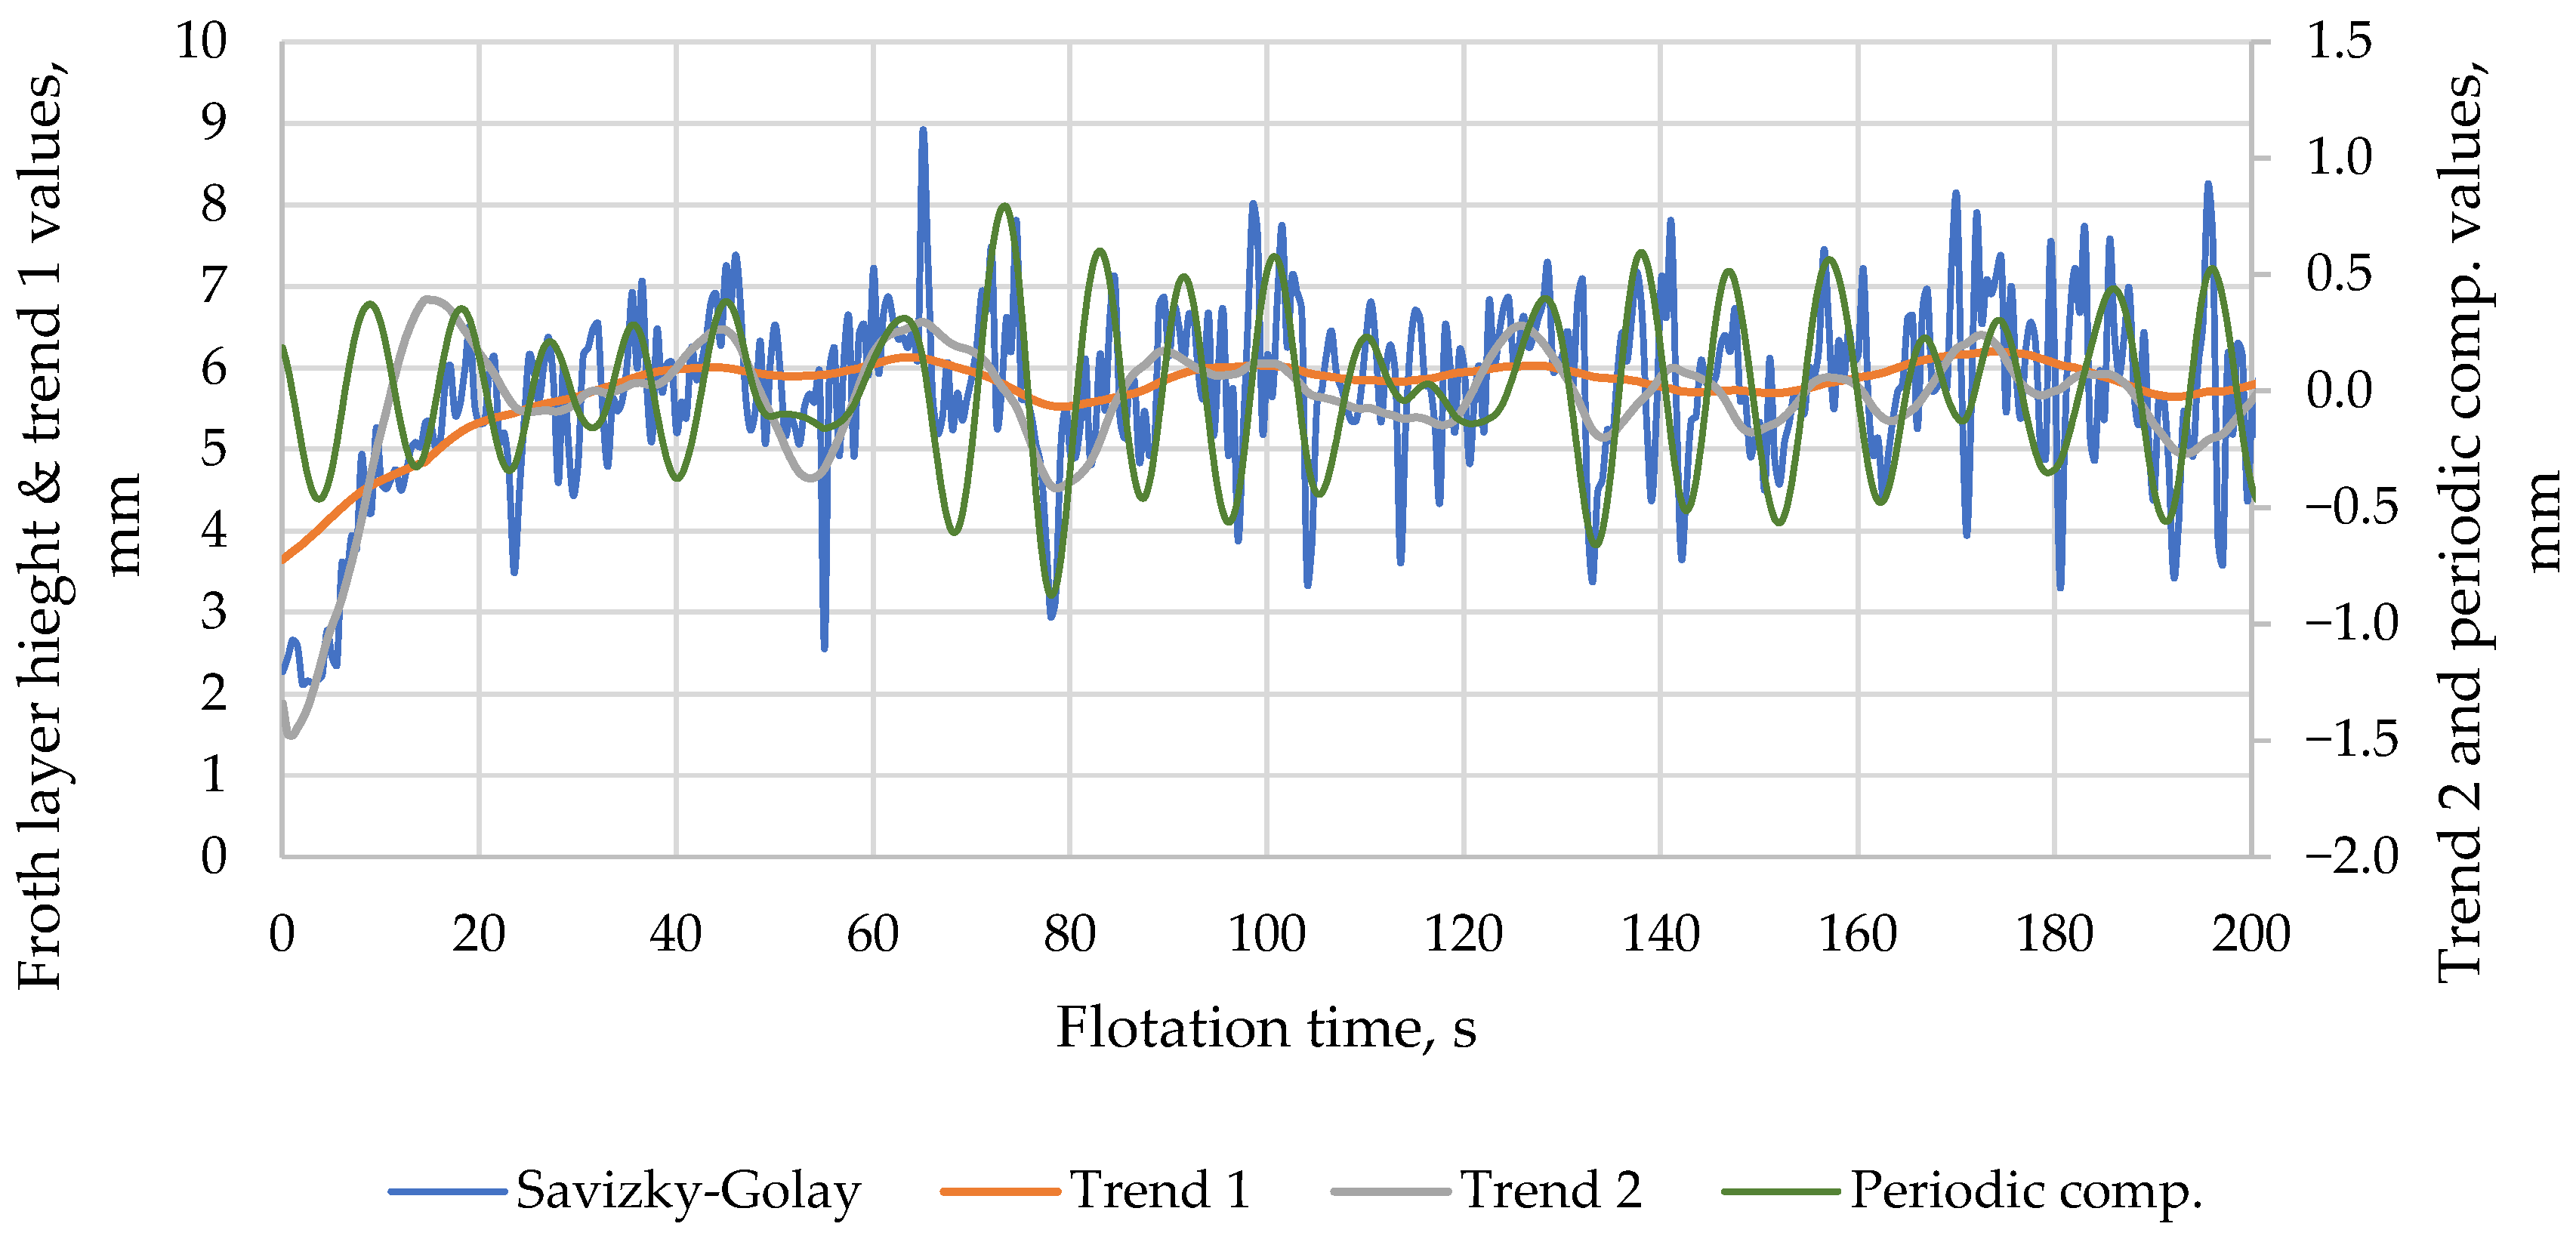
The SSA decomposition operation enabled the extraction of trends from the time series, characterizing the overall dynamics of froth layer height variation. The periodic component is associated with the froth removal process by the scrappers, which is corroborated by comparison of the decomposition results with experimental video recordings, as well as by the observation that the oscillation periods of the components exhibit similar values when different frothers are employed.
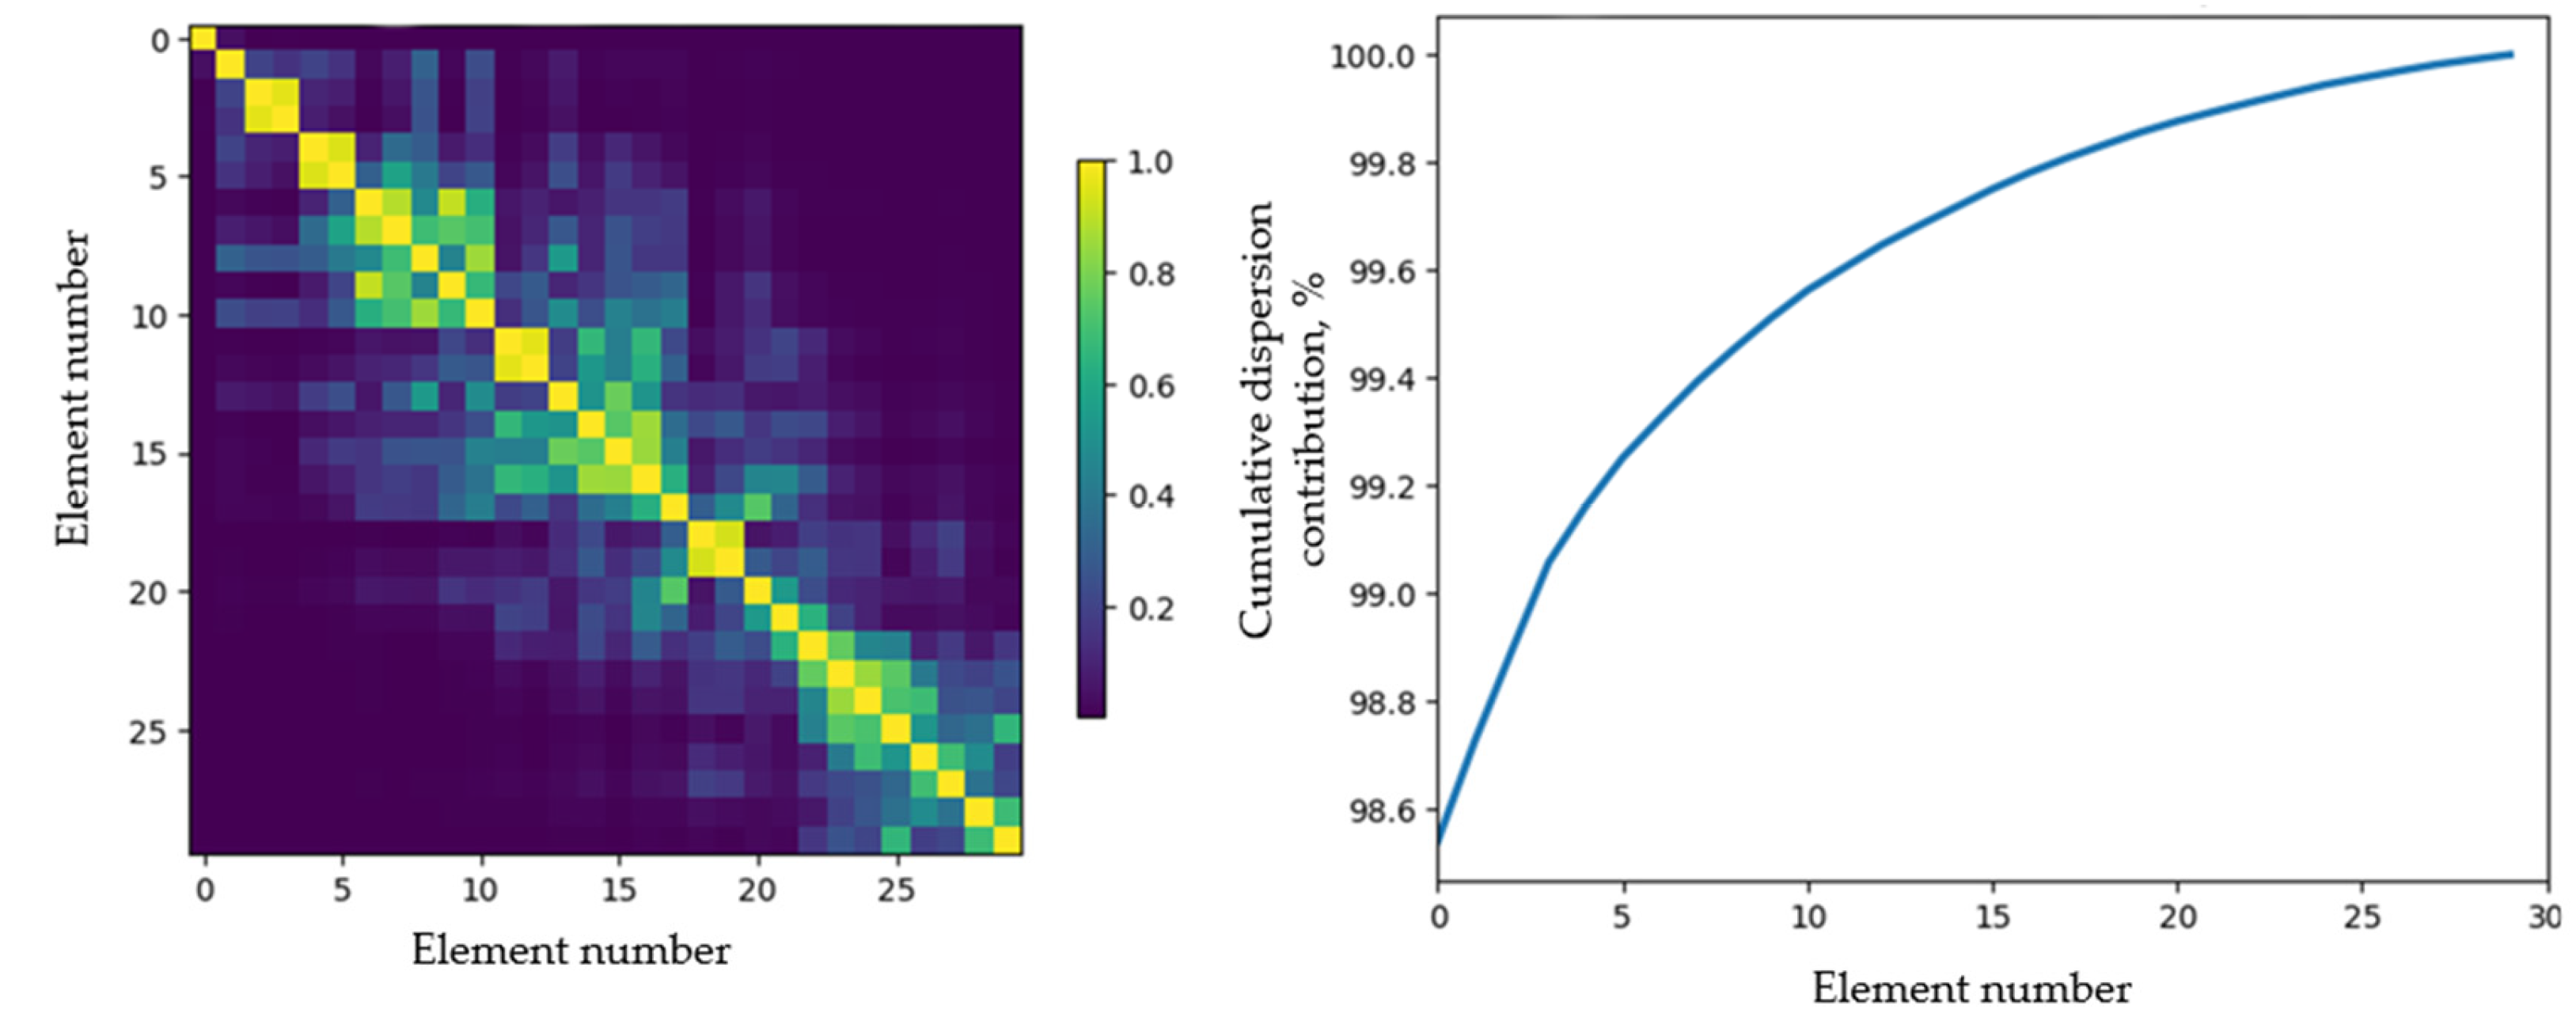
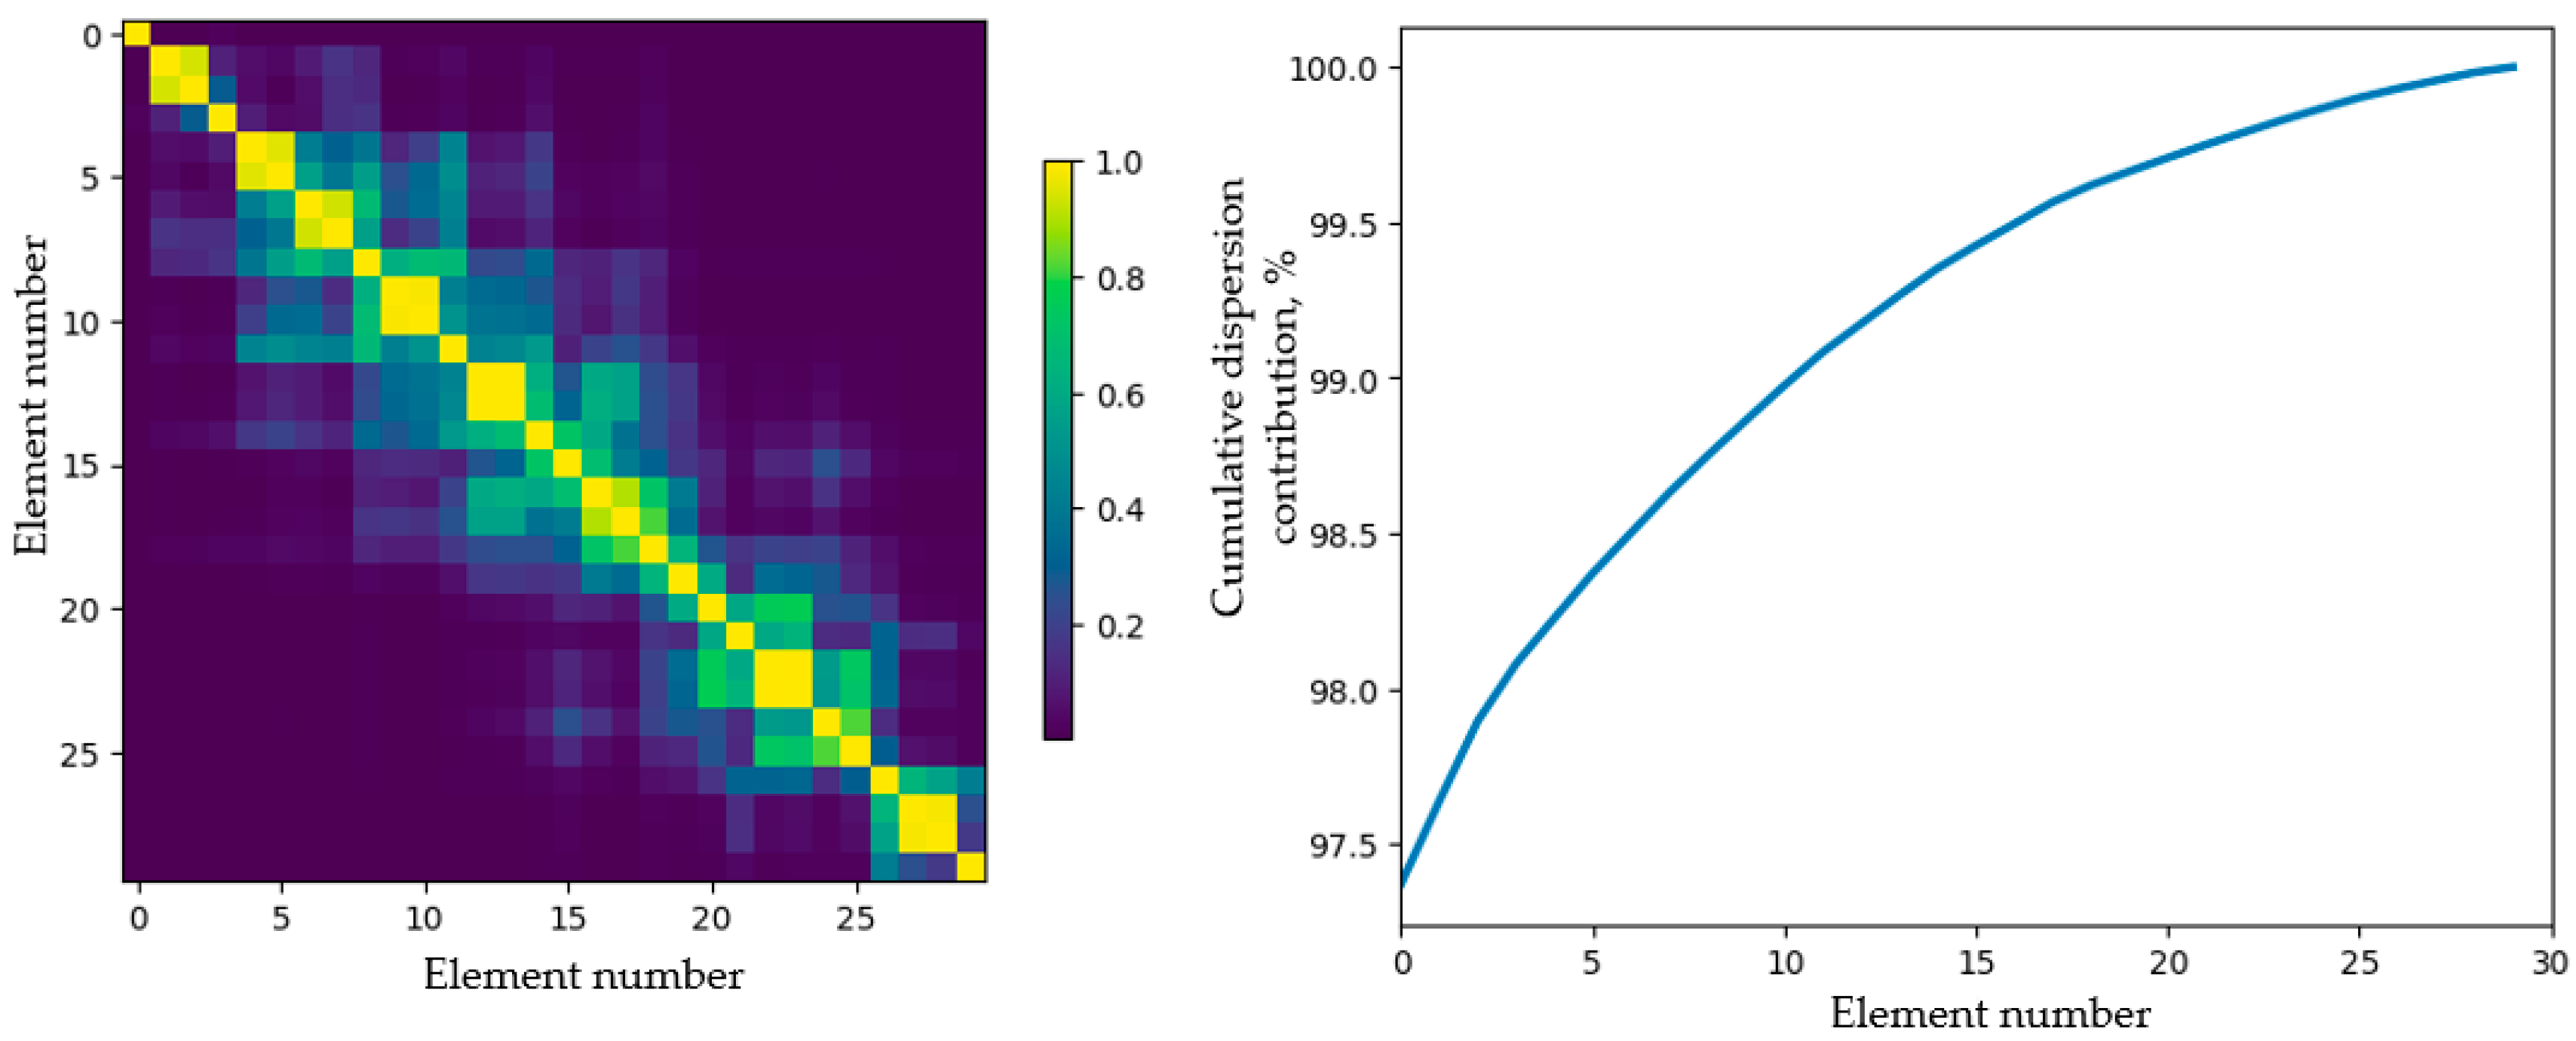
The selection of components for subsequent analysis was performed based on examination of the cumulative contribution plot of each component to the time series variance, as well as through correlation matrix analysis, which facilitated the determination of which components could be consolidated into a single time series element. The contribution of the obtained components to the approximation of the original dependencies exceeds 98% for both experiments. This assessment was conducted by calculating the proportion of variances of the selected components relative to the sum of variances of all extracted components, where noise components can be distinguished from informative components by the characteristic transition from linear to nonlinear dependence. The correlation matrices and cumulative contribution curves of the elements are presented in Figure 19 and Figure 20.
As it can be seen from the curve presented in Figure 19, the first three elements are informative, where the first element represents the trend, while elements 2 and 3, according to the correlation matrix, can be united and constitute the periodic component. According to Figure 20, the first four elements are informative, among which the first two represent trend elements, while elements 3 and 4 can be combined into a single periodic component. The obtained time series components for both frothers are presented in Figure 21 and Figure 22.
The decomposition operation made it possible to extract trends from the time series that characterize the overall dynamics of froth layer height changes. The periodic component is associated with the froth removal process by the froth scraper and the subsequent regrowth of the froth, which is confirmed by comparing the decomposition results with video recordings of the experiment. It is also supported by the observation that the oscillation periods of the components are similar when using different frothers.
The contribution of the extracted components to the approximation of the original dependencies exceeds 98% for both experiments. This assessment was made by calculating the share of the variances of the selected components relative to the total variance of all identified components.
In the analysis of dependencies obtained from experiments using MIBC, two distinct trends were identified. The first trend is characterized by an initial increase, reaching a maximum value, followed by a plateau. This trend defines the baseline froth layer heights around which fluctuations occur, as described by the subsequent extracted components.
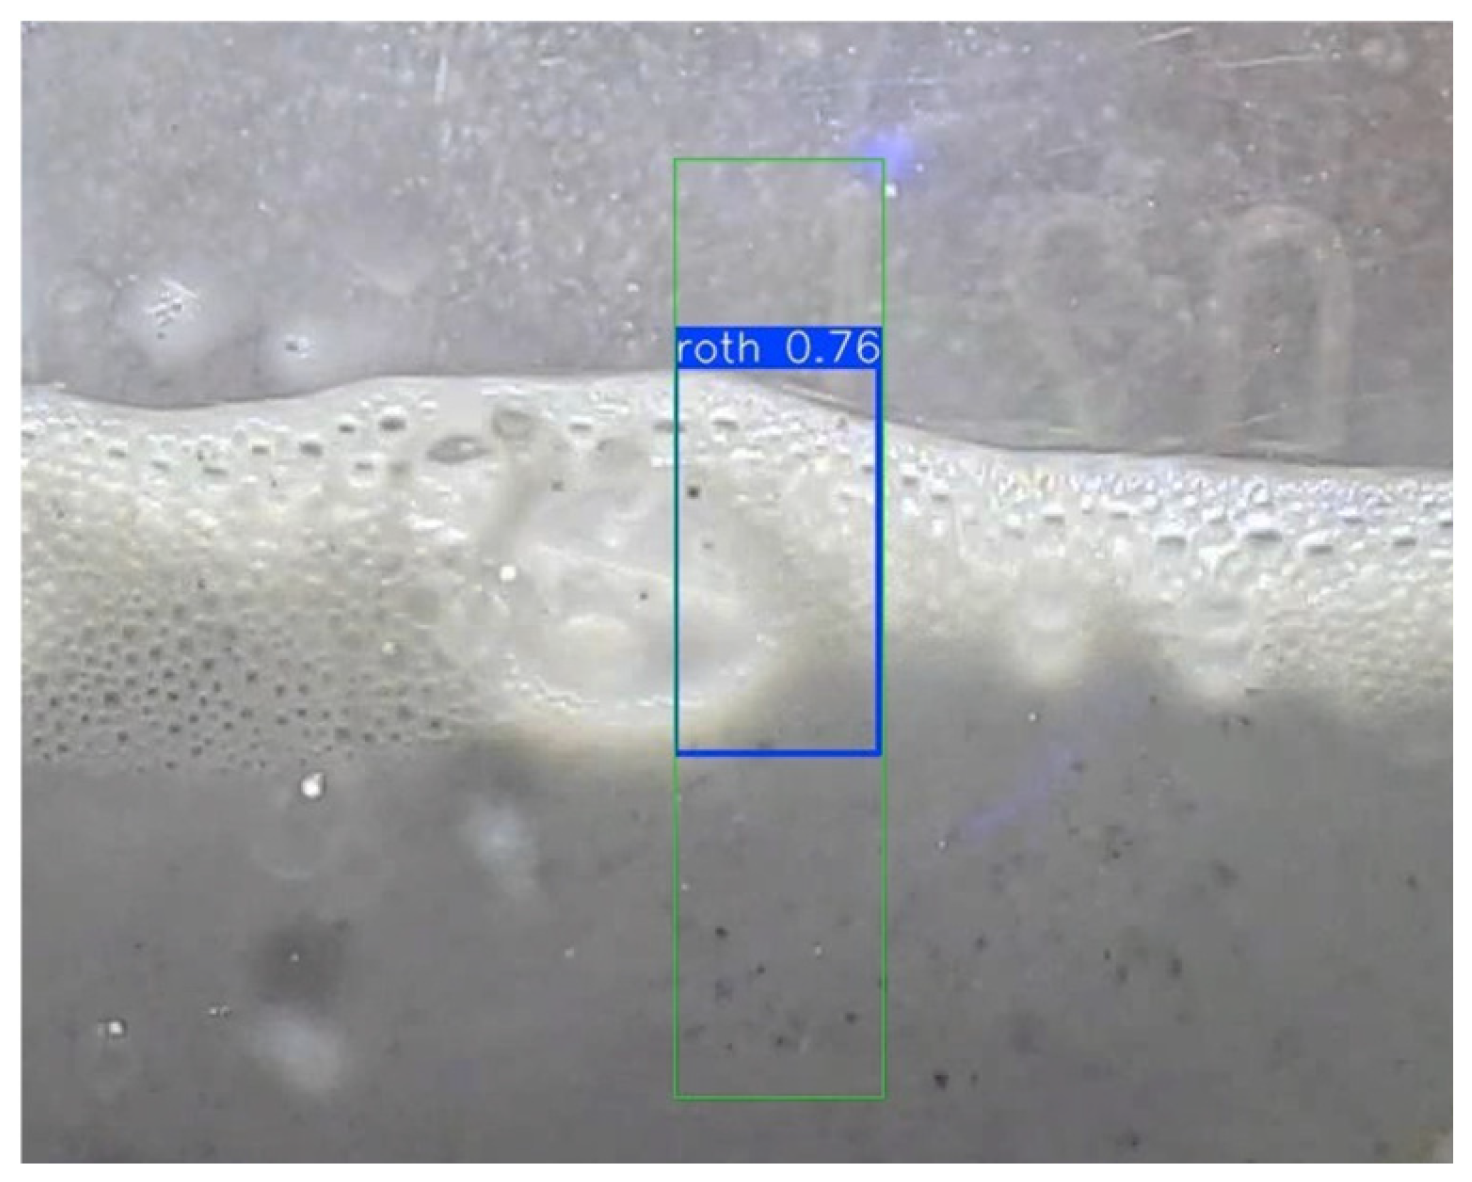
Comparison of the second trend with the experiment video recordings revealed that this component reflects sharp fluctuations in the froth layer height caused by turbulence within the flotation cell, as well as abrupt but short-term height changes resulting from the coalescence of large bubbles within the froth layer, as illustrated in Figure 23.
The operation of the computer vision system based on the neural network model made it possible to determine the maximum froth height value, which was H max 6.35 mm when using MIBC.
Considering the graphical dependencies obtained using OPF, it can be concluded that the dynamics have an extreme character. During the experiment, the froth height value reaches its maximum, then gradually decreases to a steady state. The decomposition of the time series allowed the identification of one trend and one periodic component.
For the time series obtained using OPF, the maximum froth height value is H max 15.79 mm, and the steady-state value is 8.44 mm. The periodic component is similar to the one obtained with MIBK. Fourier transform analysis established that the oscillation periods for the components are 9.52 s−1 and 9.63 s−1 for OPF and MIBK, respectively. The periodic components can be used to determine the moments of froth removal, which allows establishing a connection between the parameters of the extracted froth and the value of J g . The moment of froth removal was defined as the point where the derivative changes sign in the periodic sequence.

3.3. Establishment of Relationships Between Aeration Parameters and Froth Layer Characteristics, Flotation Selectivity Criterion

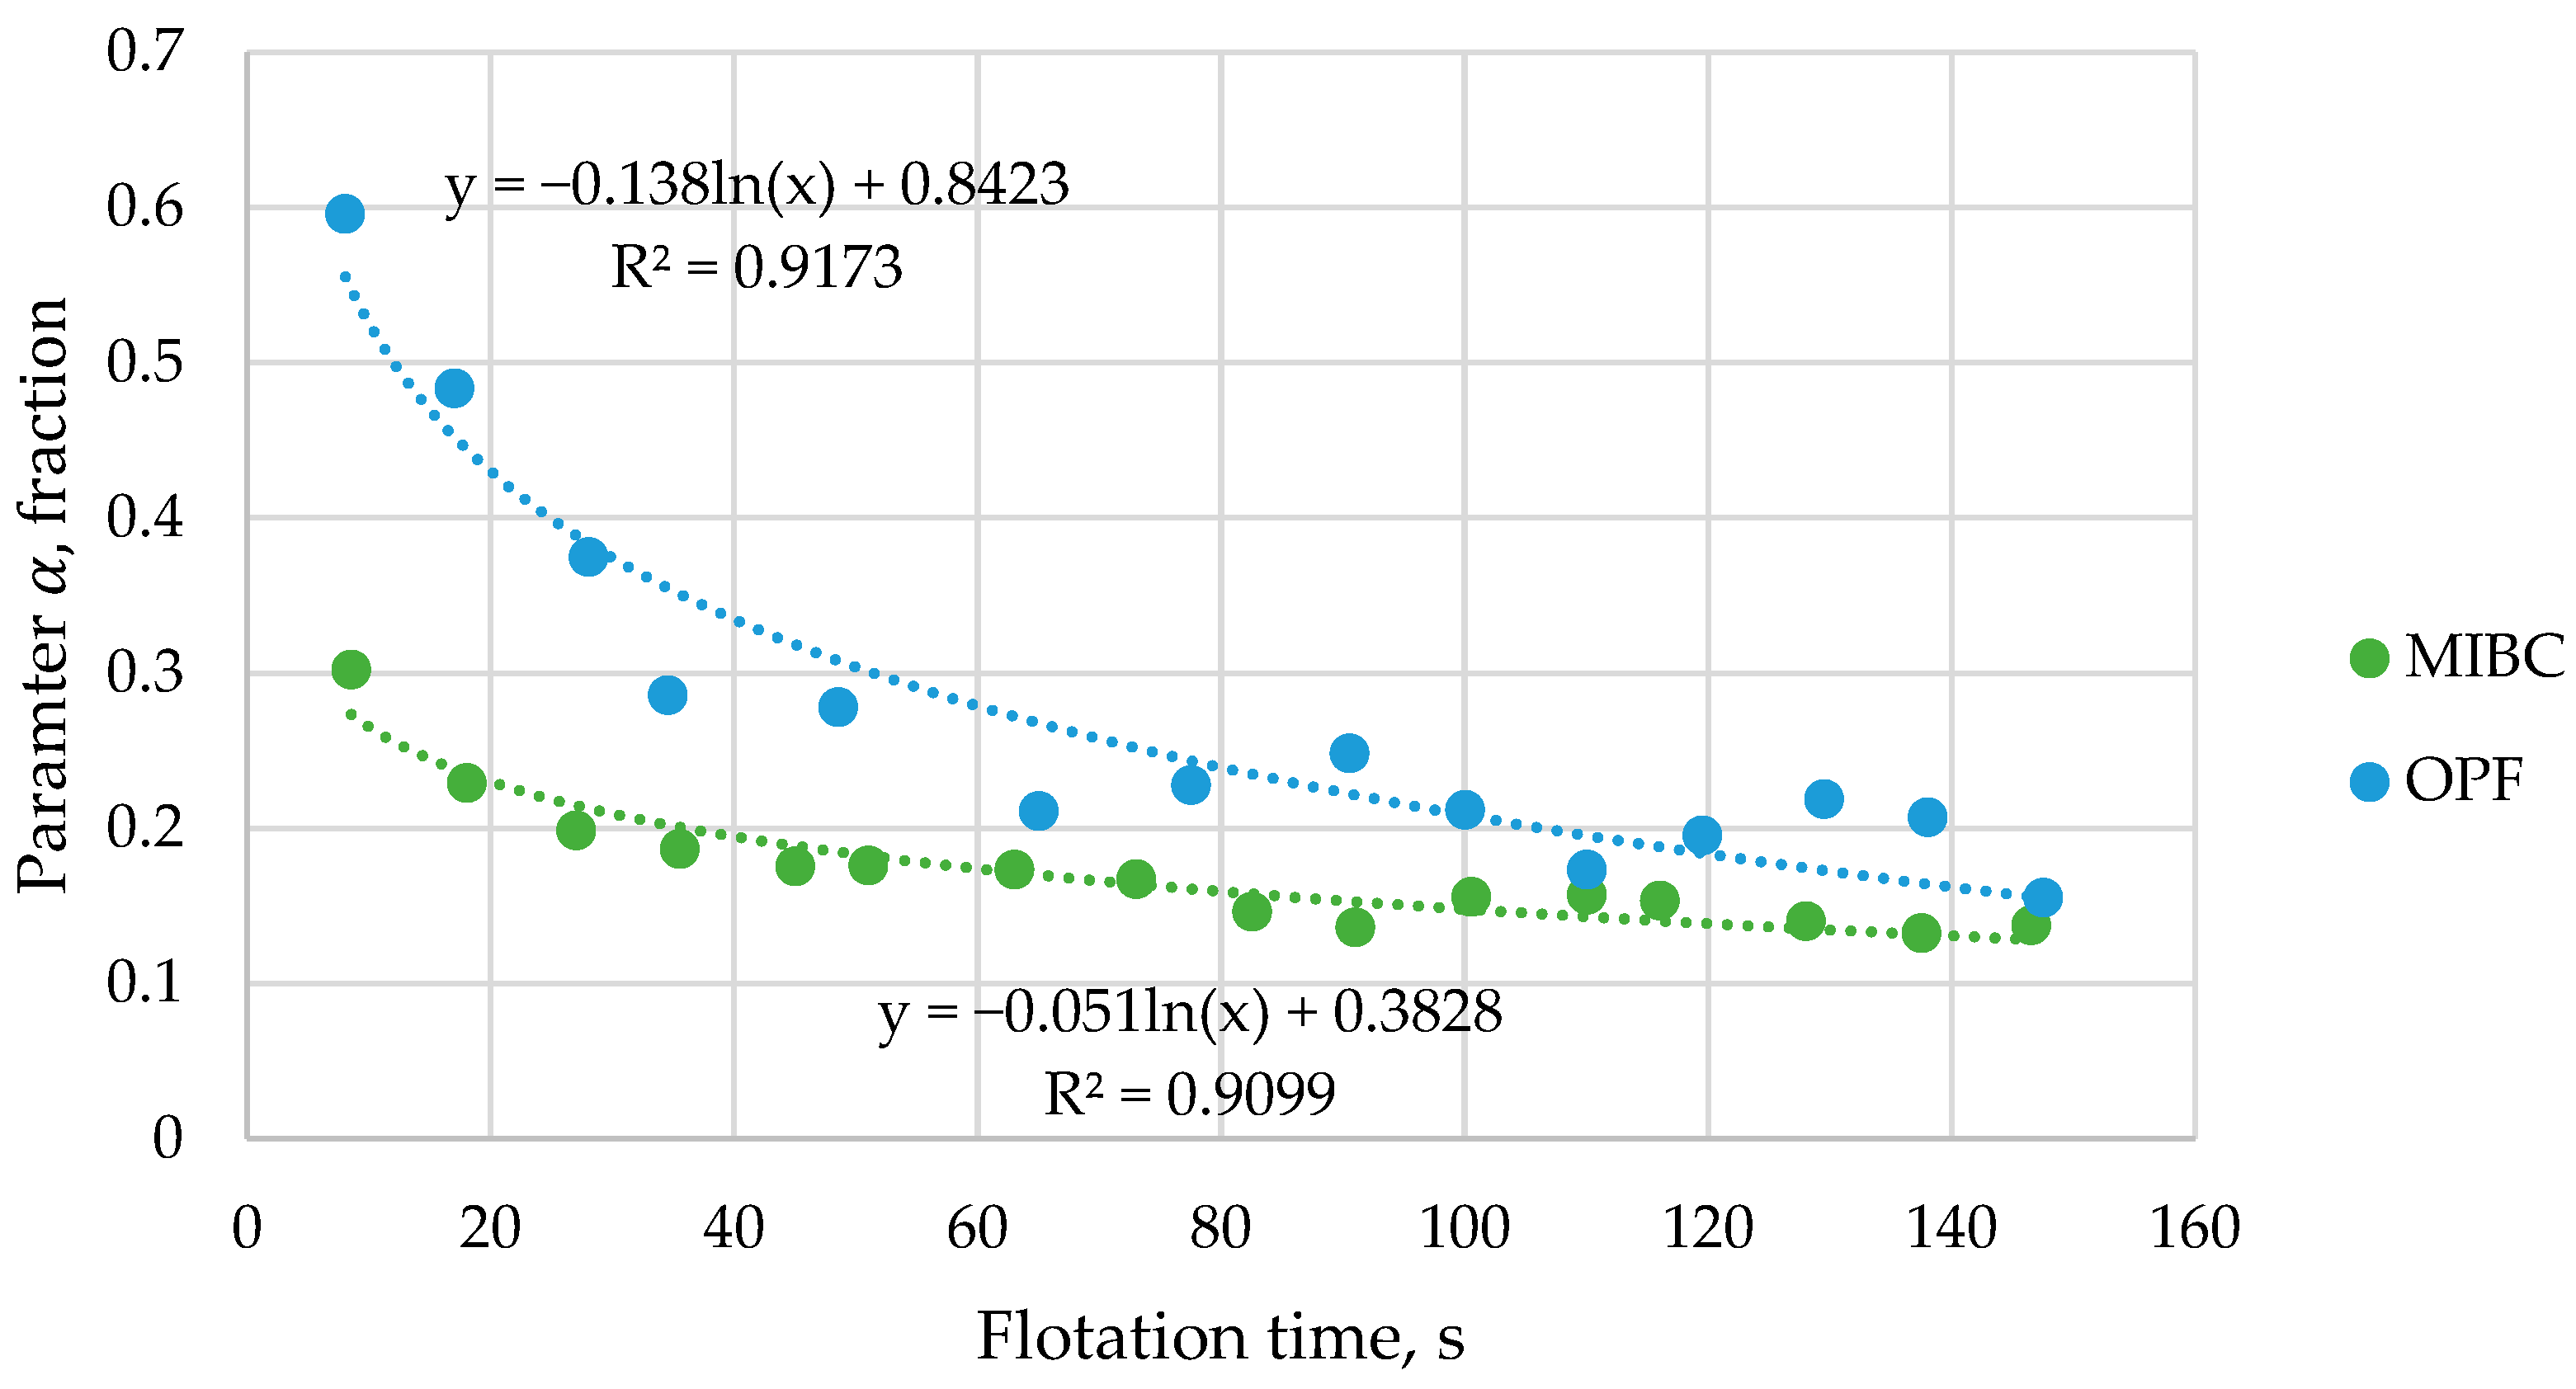
Based on the obtained time series of the froth layer height, the dependence of the α parameter on the flotation time in the form of a natural logarithmic regression relationship was established. A graphical interpretation of the obtained dependencies is shown in Figure 24.
The coefficients of determination for the dependencies characterizing parameter α were 0.9099 and 0.9173 for MIBC and OPF, respectively. The nature of the parameter change when using both reagents is characterized by a monotonous decrease, which is due to the process transition into a stationary mode and a stable foam level. Based on the interpretation of the obtained dependences of the α parameters on the flotation time and the time series of d32 values, the resulting dependences of the two studied aeration parameters on each other in the form of natural logarithmic equations were obtained.
For the MIBC:
α = 0.614 l n ( d 32 ) + 0.1459
For the OPF:
α = 0.138 l n ( d 32 ) + 0.8423
The inverse correlation between froth stability and bubble size in the pulp is consistent with findings reported in other investigations [26,51]. This relationship may be attributed to the intensification of coalescence within the froth as bubble diameter increases, which can be substantiated by the corresponding increase in water drainage rate within the froth. The narrower Plateau borders formed by small-diameter bubbles impede liquid drainage processes.
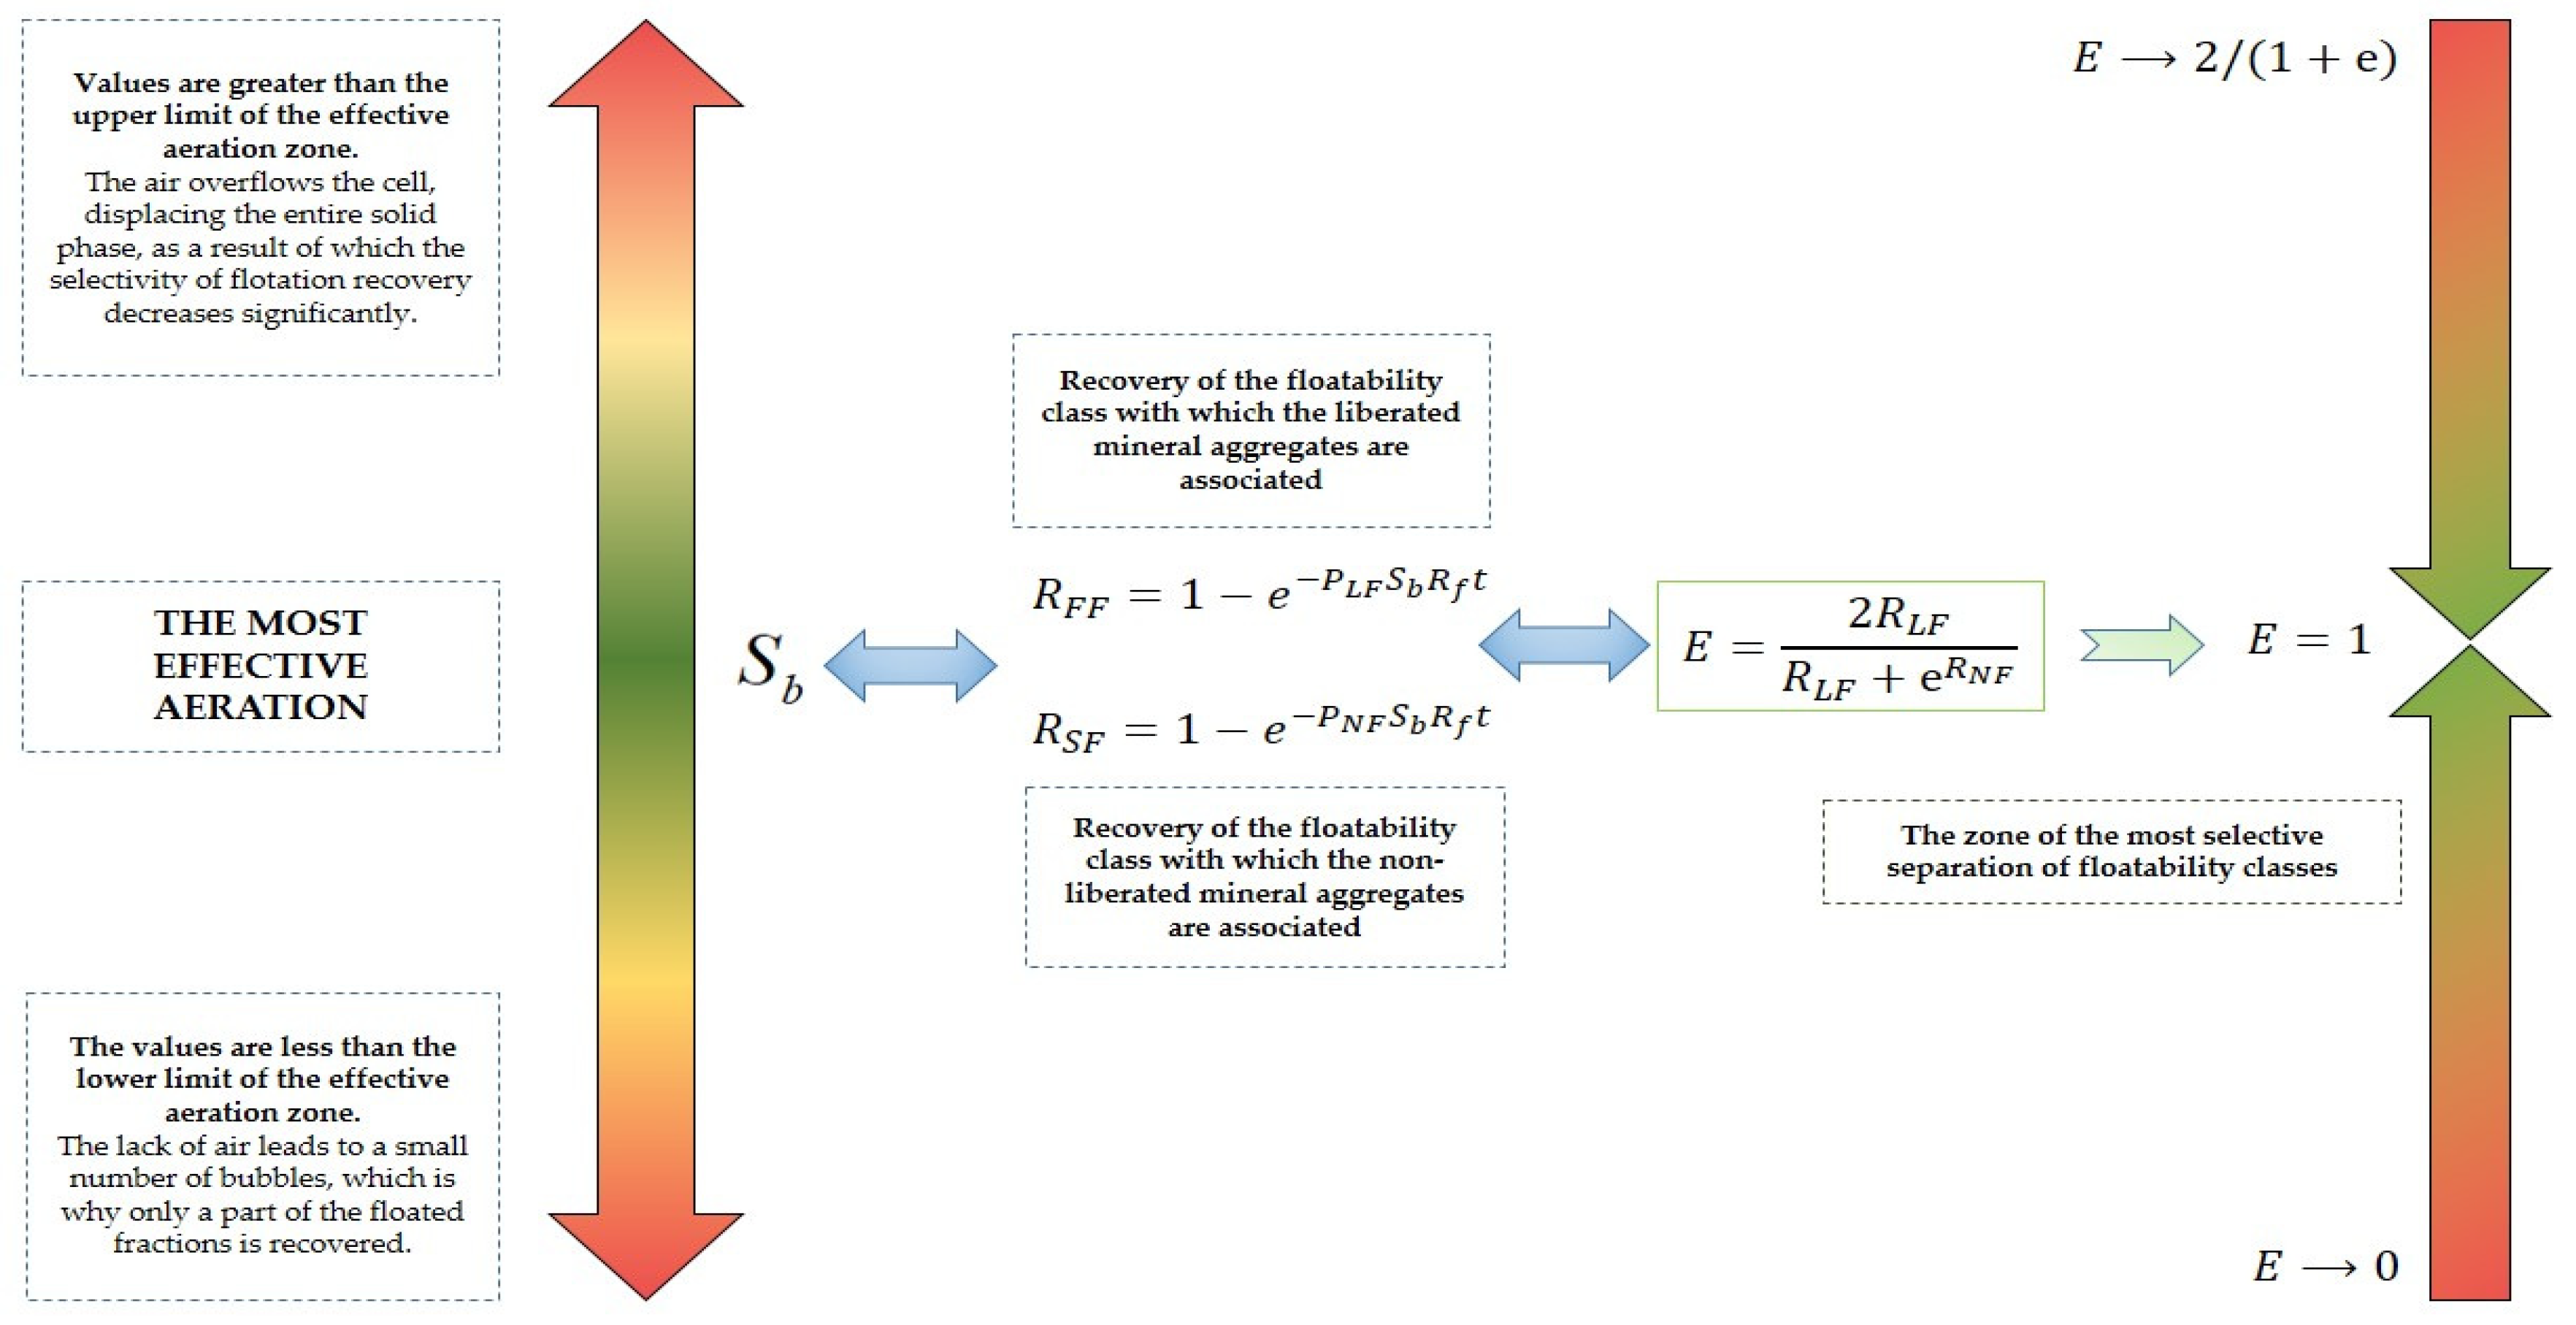
To assess the influence of aeration parameters on the flotation performance, criterion (E) was proposed, that was used for the selectivity of separation of various classes of floatability evaluation. The floatability class refers to a narrow fraction of a material with similar flotation properties. The amount of recovery of this class into the froth can be set based on Equations (1) and (2). This class will be characterized by a certain value of P. The recovery of each floatability class will increase proportionally with increasing parameter Sb. With insufficient aeration intensity, the amount of air bubbles and their sizes will be insufficient to form stable contact with mineral aggregates, as well as to create a stable foam layer. In this case, only a narrow fraction of the fast-flotation aggregates will be transported into the foam. Otherwise, with excessive aeration, the air, overflowing the chamber will displace the entire solid phrase, which will lead to the recovery of not only the exposed aggregates of ore minerals, but also lead to the release of aggregates of rock minerals into the concentrate.
To determine the range of parameter values that ensure aeration with the highest selectivity of the flotation process, the criterion E is formulated as follows:
E = 2 R L F R L F + e R N F
where R L F —recovery of the high flotability fraction of material, unit frac; R N F —recovery of the floatability class with which the non-liberated mineral aggregates, unit frac.
Based on Equation (1), the recovery dependencies for narrow floatability fractions can be described as follows: R L F = 1 e P L F S b R f t represents the recovery of the floatability class associated with liberated particles, where the boundary value of the flotation rate constant for these middlings equals P L F ; R N F = 1 e P N F S b R f t represents the recovery of the floatability class associated with unliberated middlings, where the maximum value of the flotation rate constant for these middlings equals P N F . The recovery of floatability class R L F is associated with liberated particles of the valuable component, characterized by high valuable mineral content and exhibiting high hydrophobicity resulting from the application of collector reagents. Recovery of this class ensures the production of concentrate with elevated valuable component content. Conversely, recovery of class R N F containing inadequately liberated grains results in concentrate contamination with a fraction characterized by low valuable component content. Such approach for the selectivity of the floatability classes recovery is based on the following works [52,53].
In case of insufficient values of the parameter Sb, the criterion will take values close to 0, since the values of RLF and RNF will tend to zero.
In the case of excessive values of the parameter Sb, the criterion will take values close to 2/(1 + e), since the values of RLF and RNF will tend to 1.
In the case of parameter Sb values characterizing the most effective aeration, the criterion will take values close to 1, since the value of RLF will tend to 1, and RNF will tend to zero.
This criterion accounts for true flotation processes, whereas the mechanical entrainment process, which is likewise dependent on the aeration regime, can exert substantial influence on concentrate grade. This represents a limitation of the present criterion.
Thus, with known values of parameter Sb, criterion E can be used to numerically compare the effectiveness of various frothers. A graphical interpretation of the proposed criterion is shown in Figure 25.
To compare the effectiveness of the investigated frothers, simulations were performed to model variations in Sauter mean bubble diameter and bubble size in the froth. Bubble size in the froth was evaluated as the ratio of froth bubble radius to the d32 value D x = r / d 32 . The radius of bubbles entering the froth layer can be determined by deriving it from Equation (5), with the parameter α values computed based on previously established dependencies on Sauter mean bubble diameter, specifically Equations (7) and (8) for MIBC and OPF, respectively.

3.4. Application of the Selectivity Criterion for Determination of Optimal Aeration Regime

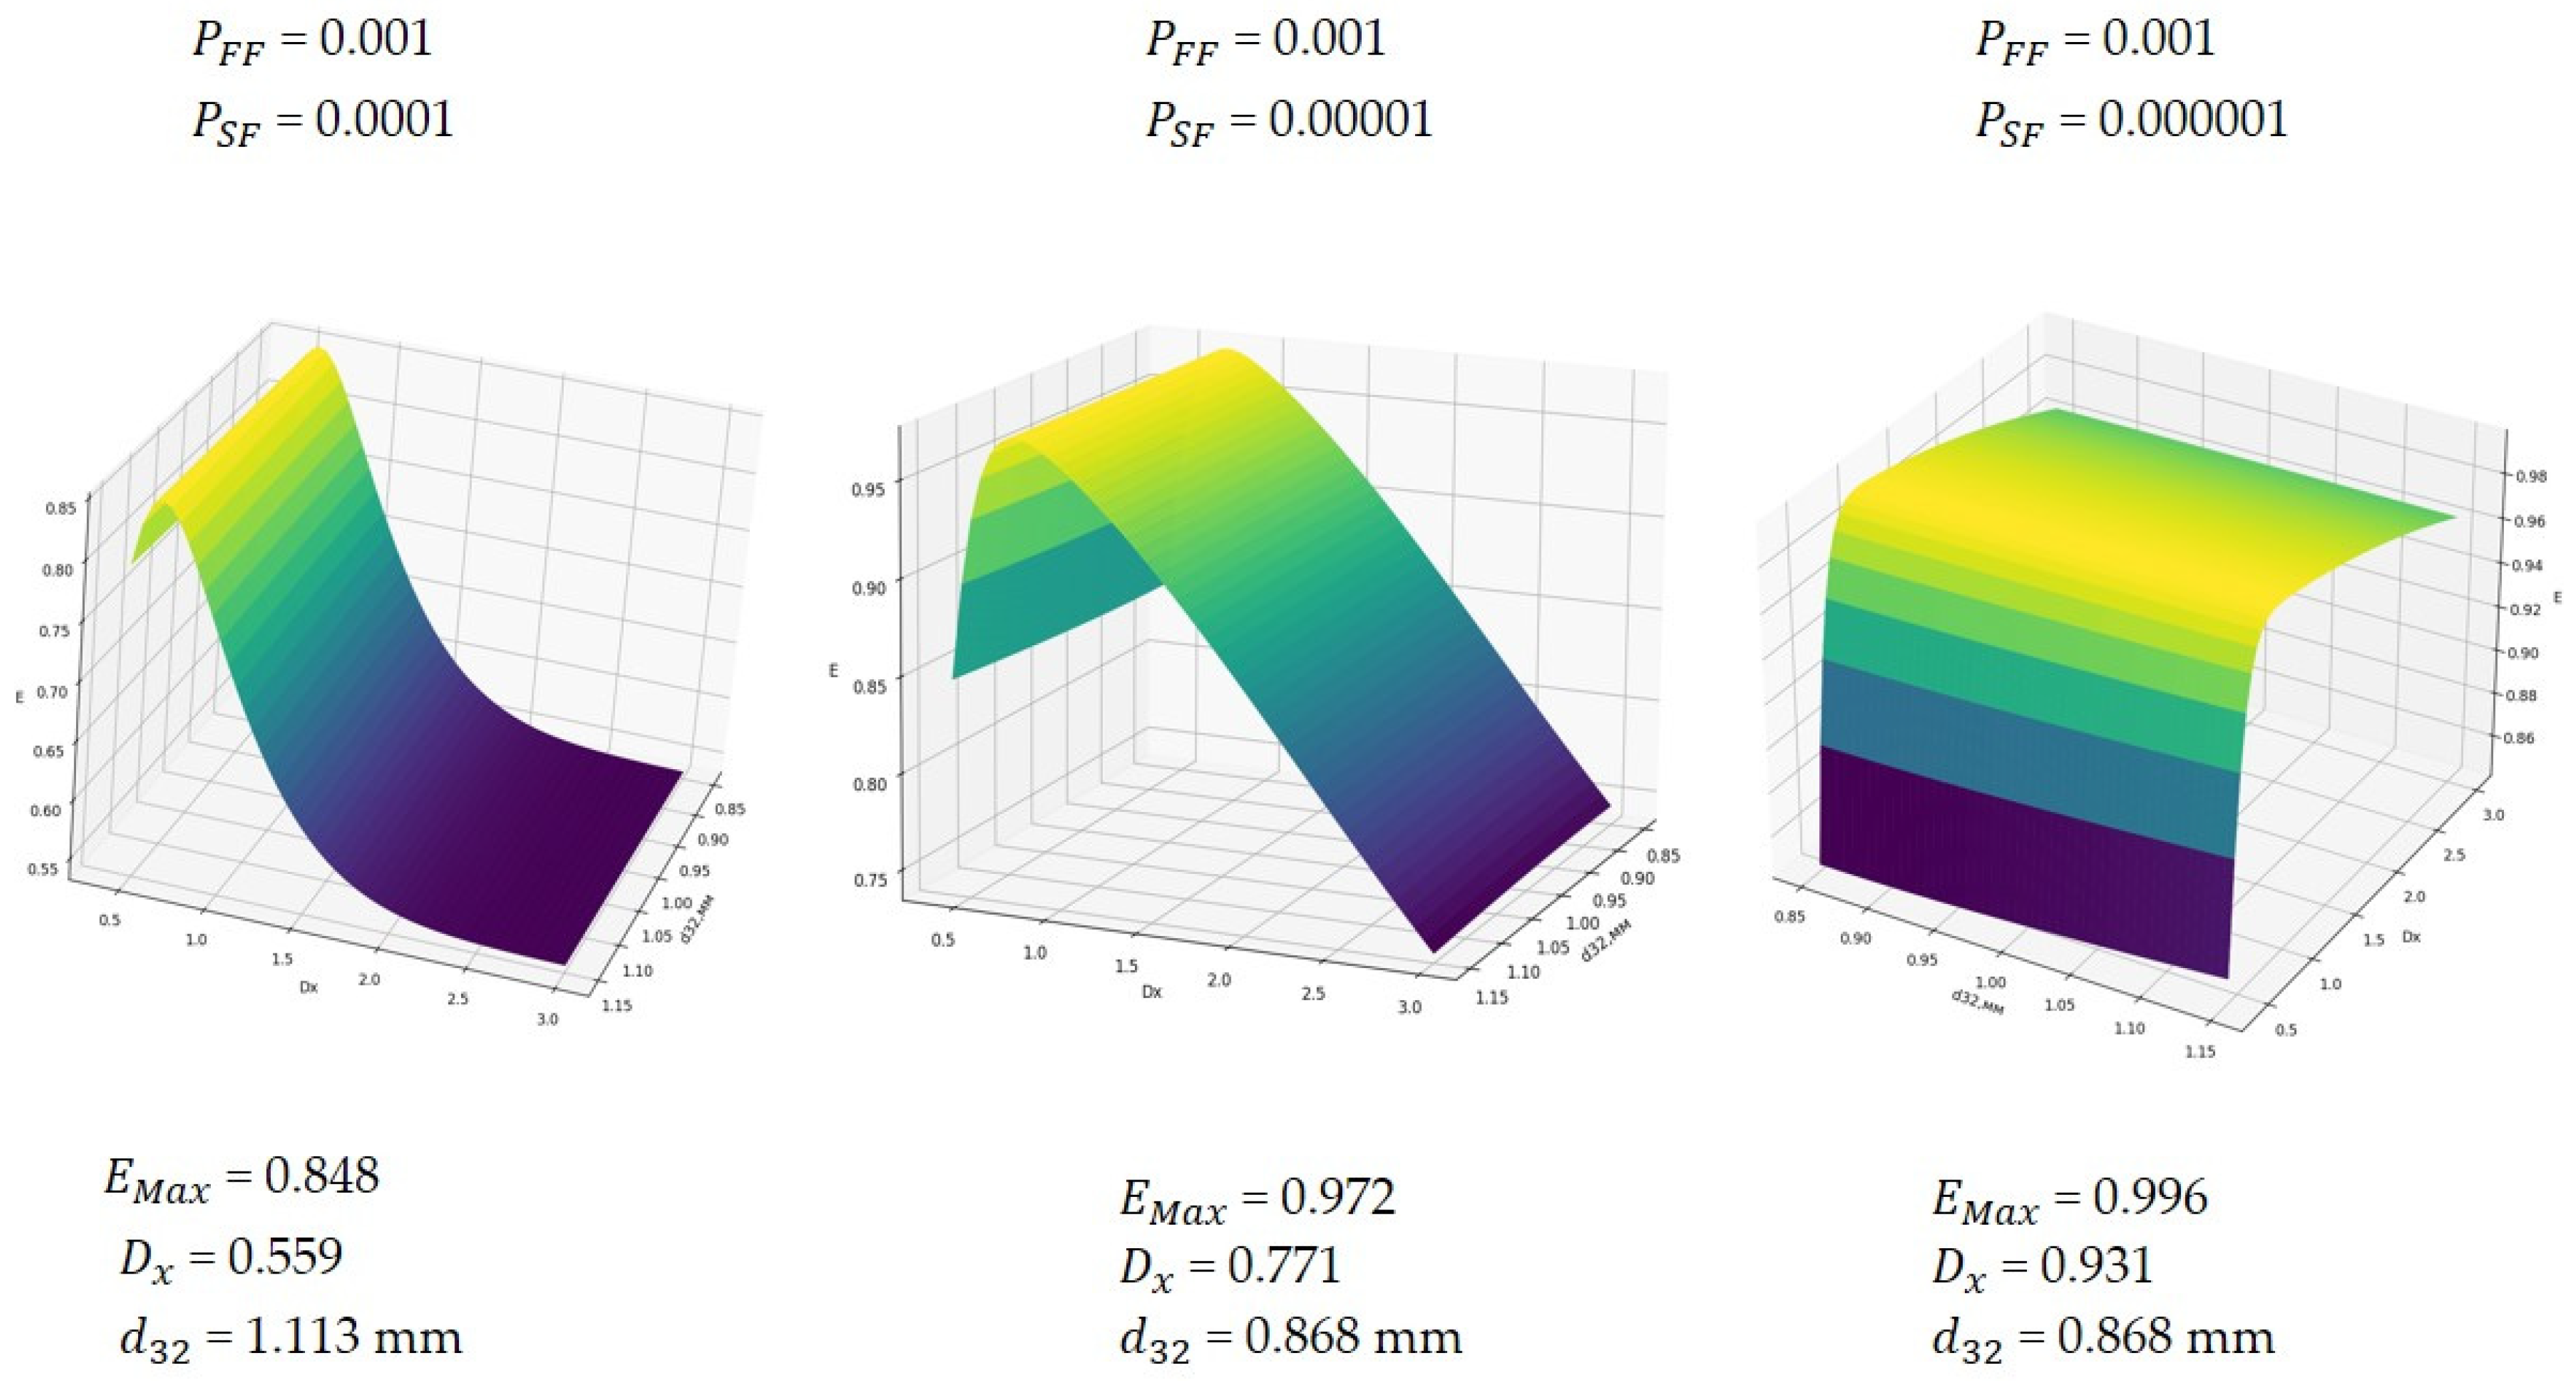
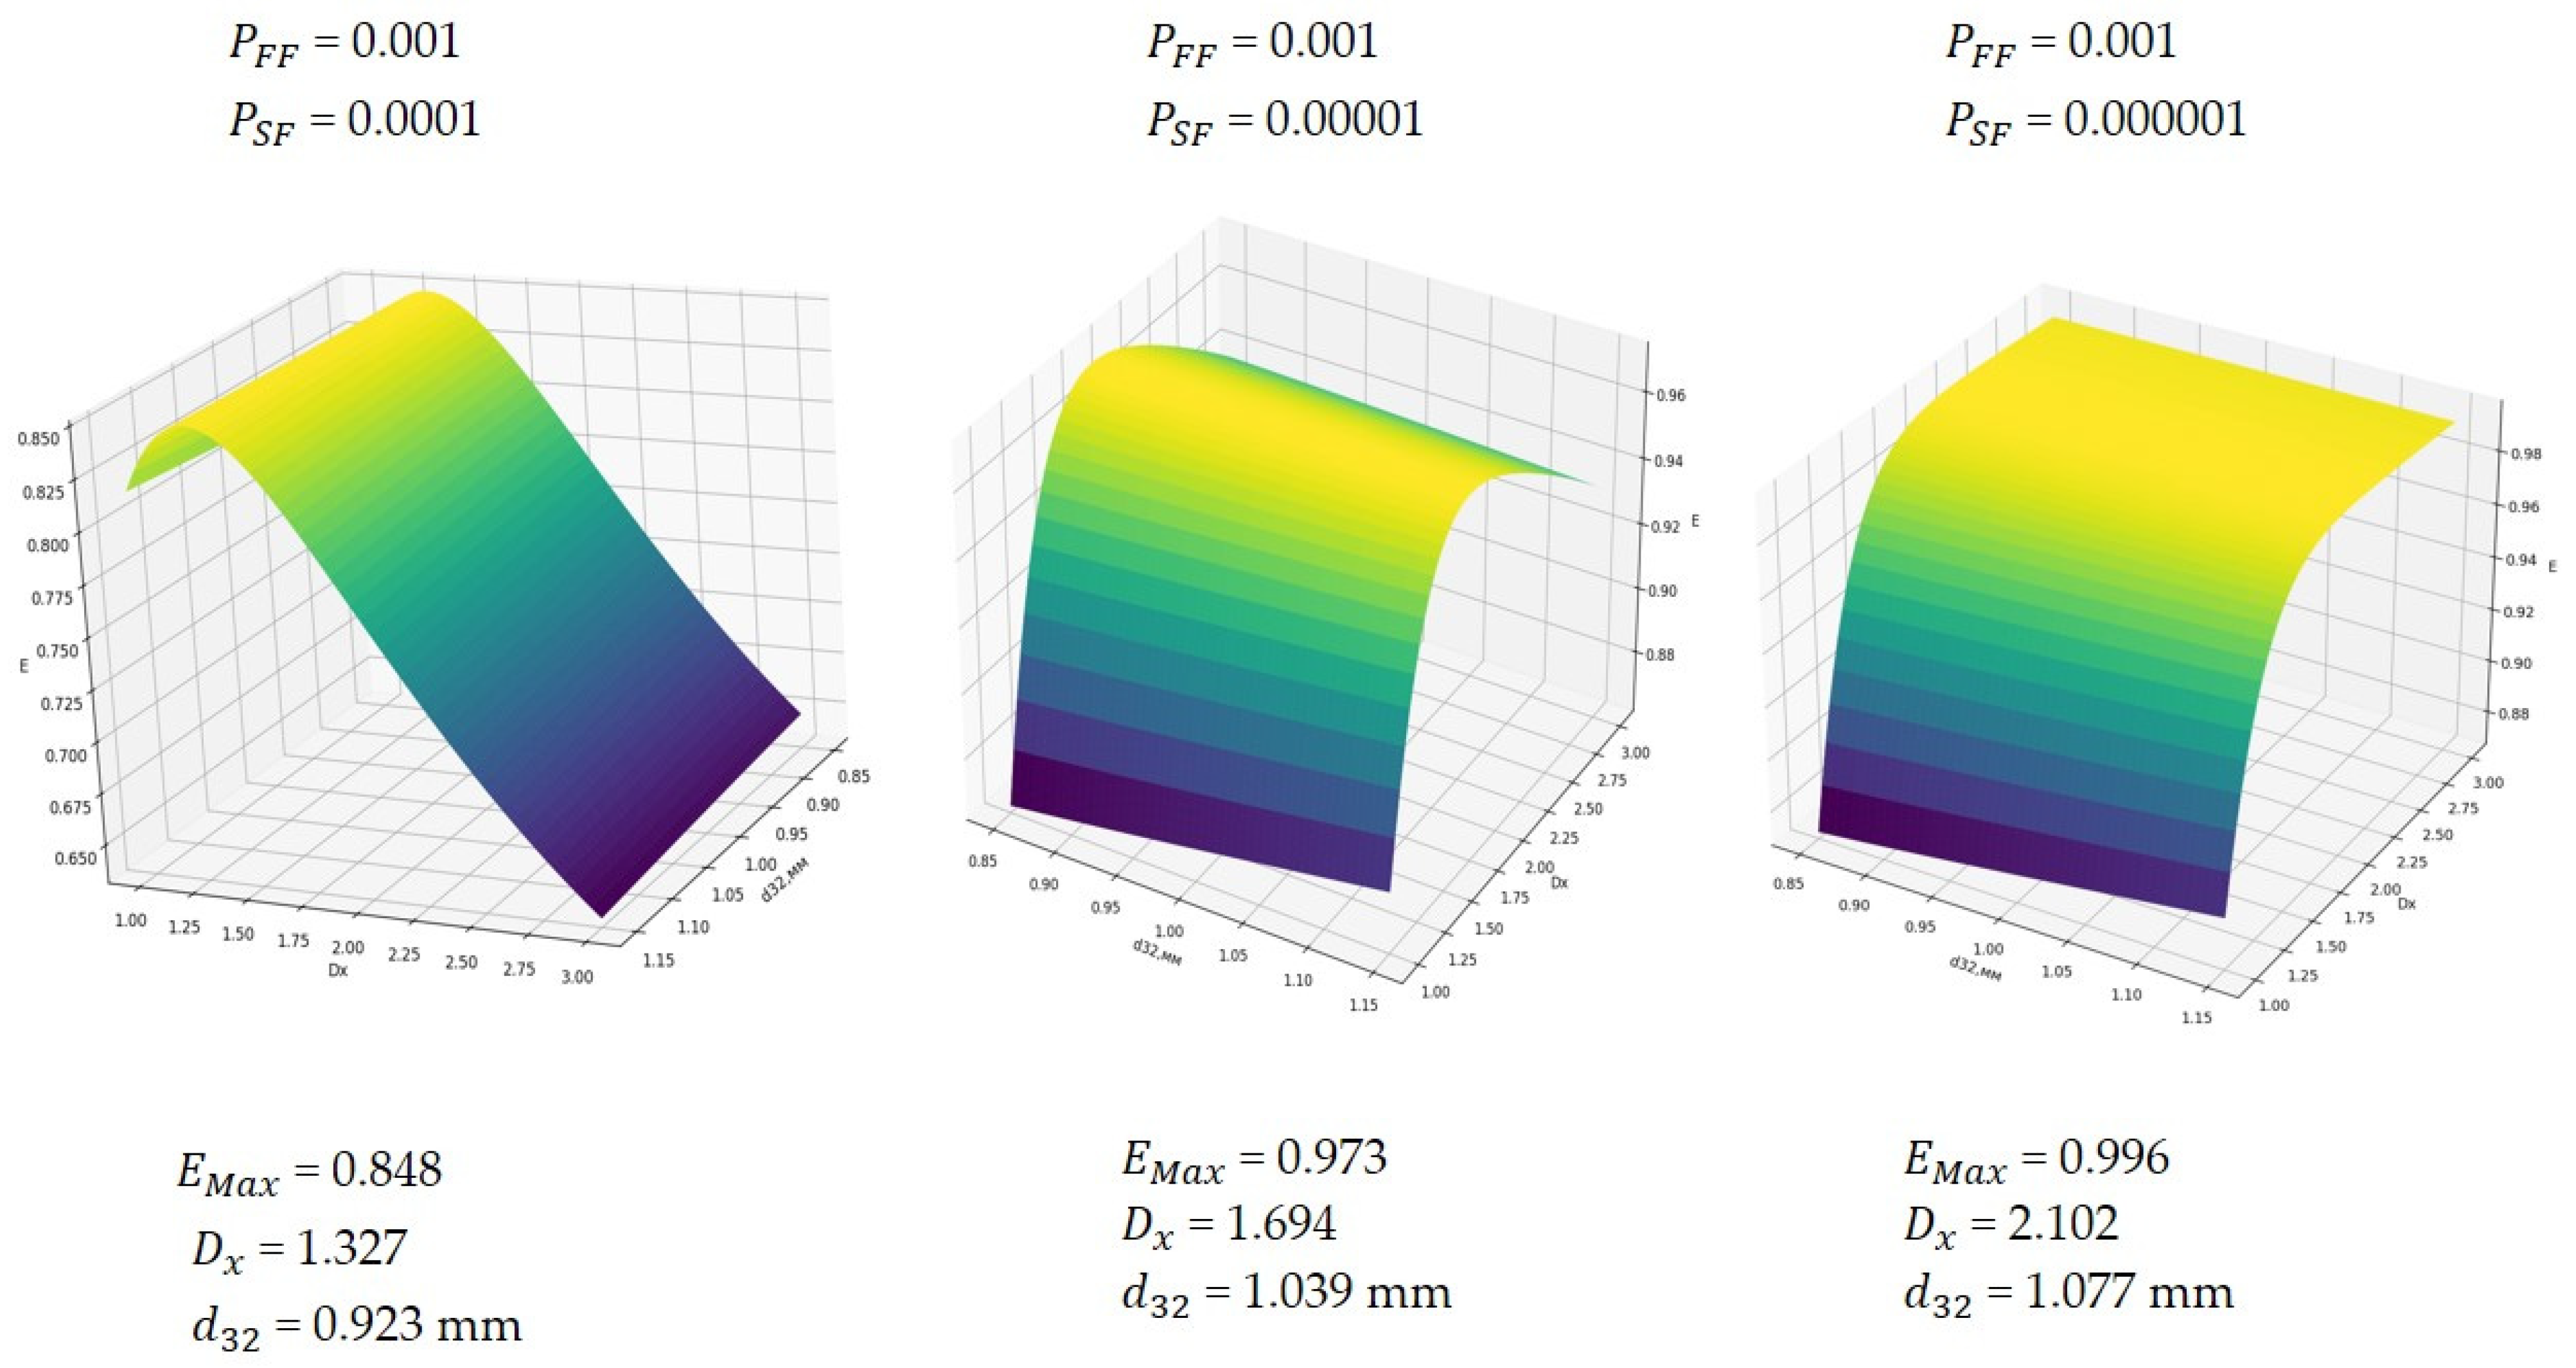
The results of numerical determination of the value of criterion E with variations in the values of d32 and Dx, for different values of the boundaries of the floatability classes, using the MIBC are shown in Figure 26.
Numerical analysis of the data in Figure 25 showed that the dependences of criterion E on the given factors have obvious extreme values. The lower the value of the floatability index of the class of non-liberated fraction of mineral aggregates, the higher the value of criterion E can be achieved. Thus, with a decrease in the PNF index, larger bubbles are able to ensure the selectivity of the separation of mineral aggregates. An increase in the value of Dx, at which the maximum value of E is reached, is due to a greater probability of coalescence of bubbles in the foam and an increase in their size. The closer the values of the boundaries of the separated floatability classes are, the smaller the size of the bubbles should be.
The results of numerical determination of the value of criterion E with variations in the values of d32 and Dx, for different values of the boundaries of the floatability classes, when using OPF are shown in Figure 27.
Numerical analysis of the data in Figure 26 showed that the dependences of criterion E on the given factors have obvious extremes. The lower the value of the floatability index of the class of non-liberated mineral aggregates, the higher the value of criterion E can be achieved. However, in the case of the use of OPF, with a decrease in the PNF index, smaller bubbles ensure the selectivity of the separation of mineral aggregates. An increase in the value of Dx, at which the maximum value of E is reached, is due to a greater probability of coalescence of bubbles in the foam and an increase in their size. In the case of OPF application, the closer the values of the boundaries of the separated floatability classes are, the larger the size of the bubbles may be. The inverse dependence of criterion E on parameter d32 is a feature of the action of OPF during the formation of a foam layer. OPF, unlike MIBC, forms a more finely dispersed foam, which is confirmed by the values of the Dx factor. For OPF, compared with MIBC, Dx values are 2.32 times higher, 2.23 times higher, and 2.25 times higher for PNF values = 0.0001; 0.00001; 0.000001, respectively. Thus, in order to achieve the highest flotation performance when using OPF, a frother concentration must be selected that ensures the required dispersion of air bubbles in the foam, which is clearly lower than when using MIBC.
Thus, the proposed set of approaches for interpreting data on the geometric dimensions of bubbles and the height of the foam layer can be used to model the conditions of the most effective aeration to achieve the required selectivity of separation of mineral aggregates, as well as to improve control systems and automation of flotation processes based on adjusting the size of air bubbles in the foam layer.
The approaches examined herein can be implemented in both laboratory investigations and industrial or pilot-scale installations, as all equipment types can be described through kinetic modeling by selecting an appropriate equipment model and introducing relevant scaling corrections [54]. Existing methodologies for determining bubble size, in conjunction with the model trained in this work for bubble recognition, as well as approaches to measuring froth layer height, can similarly enable the establishment of relationships between froth stability and bubble size [55,56].
The varying properties of feed material are implicitly accounted for in the developed approach through modification of the floatability parameter P values [57,58] and the dependency of α on Sauter mean diameter [51]. In cases where feed properties or the reagents employed and their dosage regimes change, kinetic investigations must be conducted to determine floatability values. Correspondingly, when the aeration regime is altered, experiments are required to determine the d32 parameter and froth layer height, followed by establishment of the relationship between d32 and α values.

4. Conclusions

This work presents a comprehensive set of methods for measuring aeration parameters using neural networks. For determining the statistical parameters of bubble size distribution, an instance segmentation method was applied. To capture bubble sizes, measurements were proposed in the ascending flow within a decompression tube. Based on the obtained data, no statistically significant differences were found in the recorded bubble sizes at different heights within the tube. The measurement of the froth layer height was implemented using a convolutional neural network. The fixation results can be conveniently represented for interpretation through the decomposition of the time series into singular spectra, which are subsequently used for calculations. The values of the froth layer height, as well as bubble diameters determined during flotation using a combination of neural network models, allow establishing the values of the S b parameter, which may enable simulation modeling of flotation processes in both steady-state and dynamic modes.
To select the values of the parameter S b at which the most effective dispersion of the air phase in the flotation cell will be achieved, a criterion based on evaluating the selectivity of the separation of floatability classes was proposed. Using known dependencies, the possibility of analyzing the effects of various frothers was substantiated in order to substantiate the directions for improving reagent regimes. The established interrelationships of aeration parameters and the size of bubbles in the foam layer with the proposed criterion for the flotation performance make it possible to create adequate models of flotation processes for the development of control systems and automation of technological flotation processes.
Based on modeling of aeration conditions using the proposed selectivity criterion, it was established that the optimal range of bubble diameters for MIBC is constrained to d32 values ranging from 1.058 to 1.089 mm, with the ratio of froth bubble radius to d32 ranging from 1.302 to 2.098, depending on the floatability ratios of the narrow fractions. When employing PGF, the optimal Sauter mean diameter values fall within the interval of 0.868 to 1.113 mm, while the Dₓ parameter ranges from 0.559 to 0.931.
A further area of research lies in establishing the effective numerical ratio of the size of floated mineral particles and the size of air bubbles for various types of raw materials under different aeration regimes based on the interpretation of the dependence of the numerical selectivity criterion for the separation of floatability classes, followed by subsequent transition to bubble mineralization for the investigation of processes within the froth layer.

Author Contributions

Conceptualization, T.A.; validation, T.A.; writing—original draft preparation, B.G. and V.K.; writing—review and editing, T.A.; visualization, V.K. and B.G.; formal analysis, S.N., V.K. and B.G.; supervision, T.A. All authors have read and agreed to the published version of the manuscript.

Funding

This article was prepared as part of State Assignment FSRW-2024-0008 “Investigation of the Earth’s thermodynamic processes from the perspective of hydrocarbon genesis at great depths”.

Data Availability Statement

The original contributions presented in this study are included in the article. Further inquiries can be directed to the corresponding authors.

Conflicts of Interest

The authors declare no conflicts of interest.

Abbreviations

The following abbreviations are used in this manuscript:
MIBC4-Methyl-2pentanol
OPFMixture of alcohols, aldehydes, ethers, polyglycols and polyethyleneglycol
SSASingular Spectrum Analysis

References

  1. Fedotov, P.K.; Senchenko, A.E.; Fedotov, K.V.; Burdonov, A.E. Studies to Assess the Possibility of Joint Processing of Various Types of Ores. Obogashchenie Rud 2022, 2022, 10–16. [Google Scholar] [CrossRef]
  2. Chanturiya, V.A.; Vaysberg, L.A.; Kozlov, A.P. Promising Trends in Investigations Aimed at All5round Utilization of Mineral Raw Materials. Obogashchenie Rud 2014, 2, 3–9. [Google Scholar] [CrossRef]
  3. Efimov, D.A.; Gospodarikov, A.P. Technical and Technological Aspects of the Use of Reuleaux Triangular Profile Rolls in Crushing Units in the Ore Processing Plant. Min. Inf. Anal. Bull. 2022, 10, 117–126. [Google Scholar] [CrossRef]
  4. Yan, H.; Song, S.; Wang, F.; He, D.; Zhao, J. Operational Adjustment Modeling Approach Based on Bayesian Network Transfer Learning for New Flotation Process under Scarce Data. J. Process Control 2023, 128, 103000. [Google Scholar] [CrossRef]
  5. Yianatos, J.; Vallejos, P.; Grau, R.; Yañez, A. New Approach for Flotation Process Modelling and Simulation. Miner. Eng. 2020, 156, 106482. [Google Scholar] [CrossRef]
  6. Prischepa, O.M.; Sinitsa, N.V. Prospects for Oil and Gas Bearing Potential of Paleozoic Basement of West Siberian Sedimentary Basin. Int. J. Eng. 2025, 38, 1098–1107. [Google Scholar] [CrossRef]
  7. Aleksandrova, T.N.; Kuznetsov, V.V.; Nikolaeva, N.V. Potential Trace Element Markers of Naphthogenesis Processes: Modeling and Experimentation. J. Min. Inst. 2024, 269, 687–699. Available online: https://pmi.spmi.ru/pmi/article/view/16488 (accessed on 1 January 2026).
  8. Kuskov, V.B.; Ilin, E.S.; Nikolaeva, N.V. Usage of extrusion technologies for agglomeration of raw materials of various types. Chernye Met. 2025, 6. [Google Scholar] [CrossRef]
  9. Yungmeyster, D.A.; Urazbakhtin, R.Y.; Nguyen, K.L.; Timofeev, M.I. Tunneling complex for the construction of especially hazardous waste storage facilities: Justification of the design and parameters. Obogashchenie Rud 2023, 6, 47–50. [Google Scholar] [CrossRef]
  10. Manca, P.P.; Massacci, G.; Pintus, D.; Sogos, G. The Flotation of Sphalerite Mine Tailings as a Remediation Method. Miner. Eng. 2021, 165, 106862. [Google Scholar] [CrossRef]
  11. Mitrofanova, G.V.; Chernousenko, E.V.; Kompanchenko, A.A.; Kalugin, A.I. Specific Action of Collector from Phosphoric Acid Alkyl Esters Class in Flotation of Apatite-Nepheline Ores. J. Min. Inst. 2024, 268, 637–645. Available online: https://pmi.spmi.ru/pmi/article/view/16264?setLocale=en_US (accessed on 1 January 2026).
  12. Kondratev, S.A.; Khamzina, T.A. Assessment of Collecting Activity of Physically Sorbed Reagents on the Example of Easily Floatable Coking Coal Sludge. J. Min. Inst. 2022, 256, 549–559. [Google Scholar] [CrossRef]
  13. Afanasova, A.V.; Aburova, V.A.; Prokhorova, E.O.; Lushina, E.A. Investigation of the Influence of Depressors on Flotation-Active Rock-Forming Minerals in Sulphide Gold-Bearing Ore Flotation. Min. Inf. Anal. Bull. 2022, 6, 161–174. [Google Scholar] [CrossRef]
  14. Matveeva, T.N.; Gromova, N.K.; Lantsova, L.B. Promising Reagents for the Extraction of Strategic Metals from Difficult-to-Enrich Mineral Raw Materials. J. Min. Inst. 2024, 269, 757–764. Available online: https://pmi.spmi.ru/pmi/article/view/16451 (accessed on 1 January 2026).
  15. Wang, X.; Li, H.; Liu, X.; Tang, Y.; Ni, C. Advances in Flotation Reagents for Cassiterite Separation: Challenges and Sustainable Solutions. Molecules 2025, 30, 2380. [Google Scholar] [CrossRef]
  16. Song, Z.; Wen, S.; Han, G.; Feng, Q. Recent Progress on Chelating Reagents in Flotation of Zinc Oxide Ores: A Review. Minerals 2023, 13, 1278. [Google Scholar] [CrossRef]
  17. Jameson, G.J.; Emer, C. Effect of Bubble Loading on the Recovery of Coarse Mineral Particles by Flotation. Miner. Eng. 2024, 215, 108788. [Google Scholar] [CrossRef]
  18. Zhao, L.; Zhang, Q. A Significant Review of Froth Stability in Mineral Flotation. Chem. Eng. Sci. 2025, 302, 120738. [Google Scholar] [CrossRef]
  19. Zhu, H.; Zhu, J.; López Valdivieso, A.; Min, F.; Song, S.; Wang, H. Effect of Frother Addition Mode on Gas Dispersion and Coal Flotation in a Downflow Flotation Column. Fuel 2020, 273, 117715. [Google Scholar] [CrossRef]
  20. Alam, H.S.; Sutikno, P.; Fauzi Soelaiman, T.A.; Sugiarto, A.T. CFD-PBM Coupled Modeling of Bubble Size Distribution in a Swirling-Flow Nanobubble Generator. Eng. Appl. Comput. Fluid Mech. 2022, 16, 677–693. [Google Scholar] [CrossRef]
  21. Jávor, Z.; Schreithofer, N.; Heiskanen, K. Kernel Functions to Flotation Bubble Size Distributions. Miner. Eng. 2018, 125, 200–205. [Google Scholar] [CrossRef]
  22. Wang, Y.; Wei, D.; Wen, S.; Lin, Q.; Song, Z.; Luo, X. Enhanced Pyrite Depression through Nitrogen-Aerated Flotation under Low Alkalinity Conditions. Adv. Powder Technol. 2024, 35, 104424. [Google Scholar] [CrossRef]
  23. Evdokimov, S.I.; Gerasimenko, T.E. Determination of Rational Steam Consumption in Steam-Air Mixture Flotation of Apatite-Nepheline Ores. J. Min. Inst. 2022, 256, 567–578. [Google Scholar] [CrossRef]
  24. Yang, S.; Ma, W.; Chai, W.; Cao, Y. Hydrodynamics Intensification and Interface Control in the Flotation Conditioning Process Using Fractal Impellers. Sep. Purif. Technol. 2024, 328, 125043. [Google Scholar] [CrossRef]
  25. Gao, S.; Meng, L.; Wei, D.; Zhao, Q.; Wang, X.; Hou, D. Influence of the Impeller Diameter and Off-Bottom Clearance on the Flow Velocity Distribution Characteristics Near the Bottom inside a Flotation Machine. Minerals 2020, 11, 31. [Google Scholar] [CrossRef]
  26. Mesa, D.; Morrison, A.J.; Brito-Parada, P.R. The Effect of Impeller-Stator Design on Bubble Size: Implications for Froth Stability and Flotation Performance. Miner. Eng. 2020, 157, 106533. [Google Scholar] [CrossRef]
  27. Litvinenko, V.S. Digital Economy as a Factor in the Technological Development of the Mineral Sector. Nat. Resour. Res. 2020, 29, 1521–1541. [Google Scholar] [CrossRef]
  28. Makhovikov, A.B.; Filyasova, Y.A. Information Technologies for Solid Mineral Extraction in the Arctic. Sustain. Dev. Mt. Territ. 2024, 16, 1110–1117. [Google Scholar] [CrossRef]
  29. Zhang, W.; Liu, D.; Wang, C.; Liu, R.; Wang, D.; Yu, L.; Wen, S. An Improved Python-Based Image Processing Algorithm for Flotation Foam Analysis. Minerals 2022, 12, 1126. [Google Scholar] [CrossRef]
  30. Aldrich, C.; Avelar, E.; Liu, X. Recent Advances in Flotation Froth Image Analysis. Miner. Eng. 2022, 188, 107823. [Google Scholar] [CrossRef]
  31. Yianatos, J.B.; Moys, M.H.; Contreras, F.; Villanueva, A. Froth Recovery of Industrial Flotation Cells. Miner. Eng. 2008, 21, 817–825. [Google Scholar] [CrossRef]
  32. Neethling, S.J.; Mesa, D.; Brito-Parada, P.R. An Improved Model for Predicting Froth Recovery. Miner. Eng. 2024, 205, 108479. [Google Scholar] [CrossRef]
  33. Yianatos, J.; Vallejos, P. Challenges in Flotation Scale-up: The Impact of Flotation Kinetics and Froth Transport. Miner. Eng. 2024, 207, 108541. [Google Scholar] [CrossRef]
  34. Aleksandrova, T.N.; Kuznetsov, V.V. A New Approach to Determining Aeration Intensity in Flotation. J. Min. Sci. 2022, 58, 812–822. [Google Scholar] [CrossRef]
  35. Zheng, X.; Franzidis, J.P.; Johnson, N.W. An Evaluation of Different Models of Water Recovery in Flotation. Miner. Eng. 2006, 19, 871–882. [Google Scholar] [CrossRef]
  36. Aldrich, C.; Marais, C.; Shean, B.J.; Cilliers, J.J. Online Monitoring and Control of Froth Flotation Systems with Machine Vision: A Review. Int. J. Miner. Process. 2010, 96, 1–13. [Google Scholar] [CrossRef]
  37. Ata, S. Phenomena in the Froth Phase of Flotation—A Review. Int. J. Miner. Process. 2012, 102–103, 1–12. [Google Scholar] [CrossRef]
  38. Ata, S. Coalescence of Bubbles Covered by Particles. Langmuir 2008, 24, 6085–6091. [Google Scholar] [CrossRef]
  39. Zhang, H.; Tang, Z.; Xie, Y.; Gao, X.; Chen, Q. A Watershed Segmentation Algorithm Based on an Optimal Marker for Bubble Size Measurement. Measurement 2019, 138, 182–193. [Google Scholar] [CrossRef]
  40. Mesa, D.; Quintanilla, P.; Reyes, F. Bubble Analyser—An Open-Source Software for Bubble Size Measurement Using Image Analysis. Miner. Eng. 2022, 180, 107497. [Google Scholar] [CrossRef]
  41. Kim, Y.; Park, H. Deep Learning-Based Automated and Universal Bubble Detection and Mask Extraction in Complex Two-Phase Flows. Sci. Rep. 2021, 11, 8940. [Google Scholar] [CrossRef] [PubMed]
  42. Nizovtseva, I.; Mikushin, P.; Starodumov, I.; Makhaeva, K.; Kraev, S.; Chernushkin, D. Bubble Detection in Multiphase Flows Through Computer Vision and Deep Learning for Applied Modeling. Mathematics 2024, 12, 3864. [Google Scholar] [CrossRef]
  43. Nikouei, M.; Baroutian, B.; Nabavi, S.; Taraghi, F.; Aghaei, A.; Sajedi, A.; Moghaddam, M.E. Small Object Detection: A Comprehensive Survey on Challenges, Techniques and Real-World Applications. Intell. Syst. Appl. 2025, 27, 200561. [Google Scholar] [CrossRef]
  44. Chu, X.; Zheng, A.; Zhang, X.; Sun, J. Detection in Crowded Scenes: One Proposal, Multiple Predictions. In Proceedings of the 2020 IEEE/CVF Conference on Computer Vision and Pattern Recognition (CVPR), Seattle, WA, USA, 13–19 June 2020; pp. 12211–12220. [Google Scholar] [CrossRef]
  45. Sharma, R.; Saqib, M.; Lin, C.T.; Blumenstein, M. A Survey on Object Instance Segmentation. SN Comput. Sci. 2022, 3, 499. [Google Scholar] [CrossRef]
  46. Wen, Z.; Zhou, M.; Mišković, S.; Zhou, C. An Instance Mask Representation for Bubble Size Distribution in Two-Phase Bubble Flotation Column Based on Deep Learning Model. Flow Meas. Instrum. 2025, 104, 102892. [Google Scholar] [CrossRef]
  47. Nanni, L.; Paci, M.; Brahnam, S.; Lumini, A. Comparison of Different Image Data Augmentation Approaches. J. Imaging 2021, 7, 254. [Google Scholar] [CrossRef]
  48. Amini, E.; Bradshaw, D.J.; Finch, J.A.; Brennan, M. Influence of Turbulence Kinetic Energy on Bubble Size in Different Scale Flotation Cells. Miner. Eng. 2013, 45, 146–150. [Google Scholar] [CrossRef]
  49. Hernandez-Aguilar, J.R.; Coleman, R.G.; Gomez, C.O.; Finch, J.A. A Comparison between Capillary and Imaging Techniques for Sizing Bubbles in Flotation Systems. Miner. Eng. 2004, 17, 53–61. [Google Scholar] [CrossRef]
  50. Zhukovskiy, Y.; Buldysko, A.; Revin, I. Induction Motor Bearing Fault Diagnosis Based on Singular Value Decomposition of the Stator Current. Energies 2023, 16, 3303. [Google Scholar] [CrossRef]
  51. Geldenhuys, S.; McFadzean, B. The Effect of Pulp Bubble Size on the Dynamic Froth Stability Measurement. Miner. Eng. 2019, 131, 164–169. [Google Scholar] [CrossRef]
  52. Alexander, D.; Runge, K.C.; Franzidis, J.; Manlapig, E. The Application of Multi-Component Floatability Models to Full-Scale Flotation Circuits. In Proceedings of the Seventh Mill Operators’ Conference, Kalgoorlie, Australia, 12–14 October 2000; Volume 6, pp. 167–177. [Google Scholar]
  53. Alexander, D.J.; Morrison, R.D. Rapid Estimation of Floatability Components in Industrial Flotation Plants. Miner. Eng. 1998, 11, 133–143. [Google Scholar] [CrossRef]
  54. Mesa, D.; Brito-Parada, P.R. Scale-up in Froth Flotation: A State-of-the-Art Review. Sep. Purif. Technol. 2019, 210, 950–962. [Google Scholar] [CrossRef]
  55. Richter, T.; Heitkam, S.; Odenbach, S.; Eckert, K. Detection of the Pulp-Froth Interface Using the Ultrasound Transit Time Technique. Miner. Eng. 2021, 160, 106679. [Google Scholar] [CrossRef]
  56. Leiva, C.; Acuña, C.; Bergh, L.; Luukkanen, S.; Da Silva, C. Online Superficial Gas Velocity, Holdup, and Froth Depth Sensor for Flotation Cells. J. Sens. 2022, 2022, 7221294. [Google Scholar] [CrossRef]
  57. Sokolovic, J.; Miskovic, S. The Effect of Particle Size on Coal Flotation Kinetics: A Review. Physicochem. Probl. Miner. Process. 2018, 54, 1172–1190. Available online: https://www.journalssystem.com/ppmp/The-effect-of-particle-size-on-coal-flotation-kinetics-A-review,93549,0,2.html (accessed on 1 January 2026).
  58. Xia, W. Role of Particle Shape in the Floatability of Mineral Particle: An Overview of Recent Advances. Powder Technol. 2017, 317, 104–116. [Google Scholar] [CrossRef]
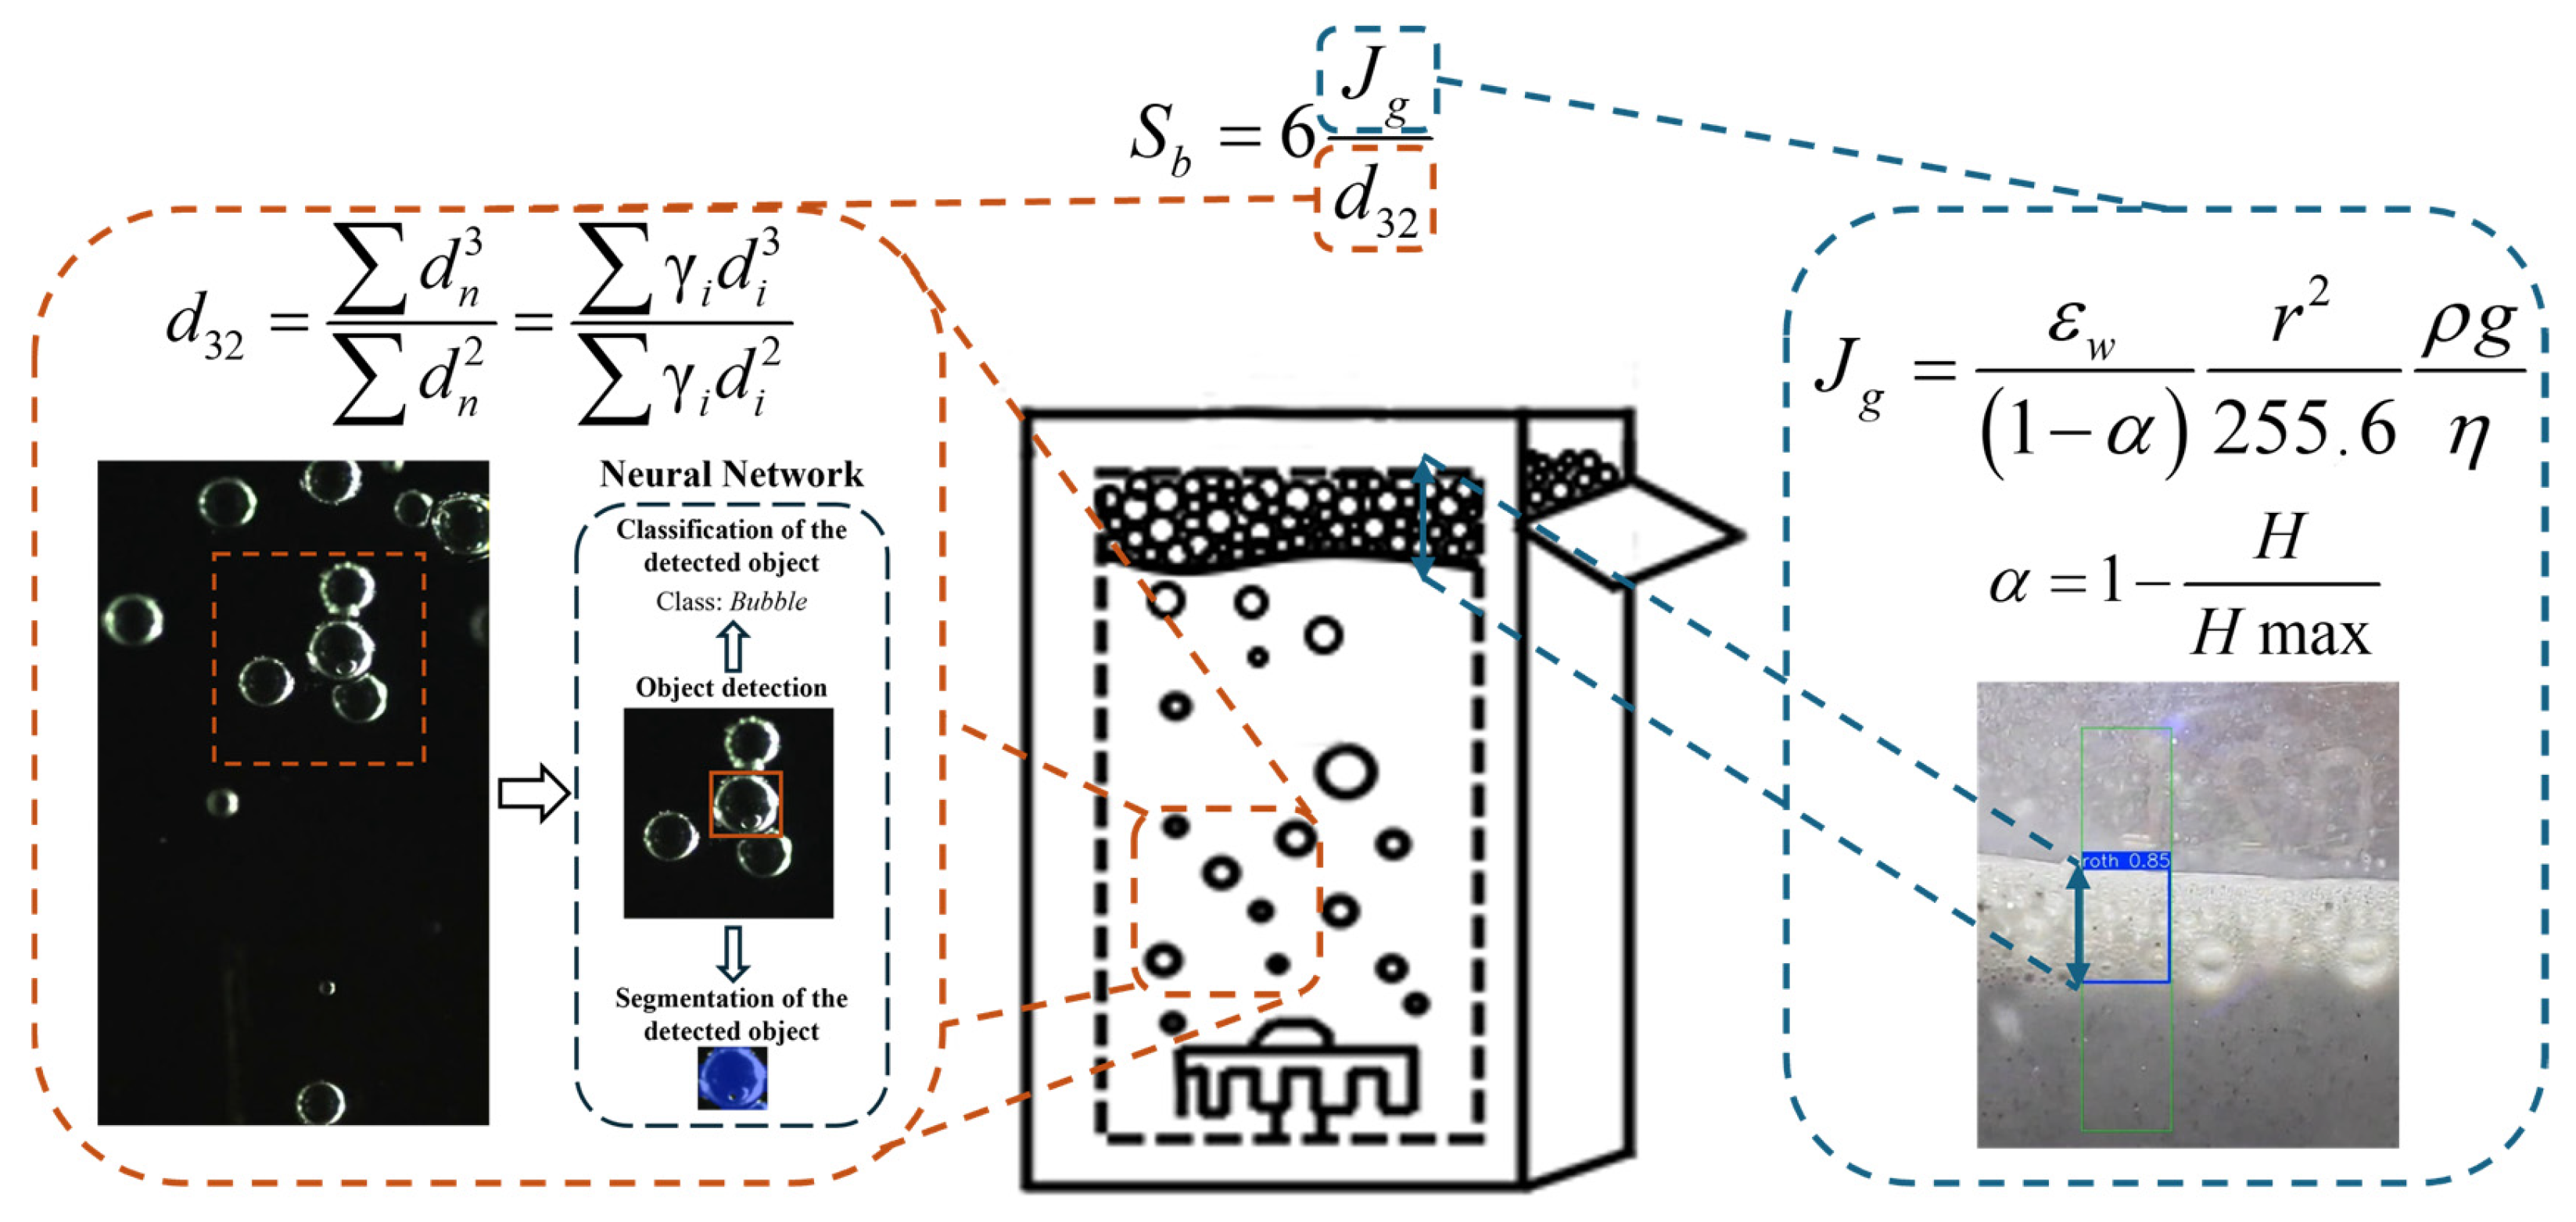
Figure 1. Methodology for Sb parameter determining.
Processes 14 00728 g001
Figure 2. Labelled image examples from the dataset.
Processes 14 00728 g002
Figure 3. The principal diagram of the experimental setup used to obtain d32 value.
Processes 14 00728 g003
Figure 4. Convolutional neural network model for instant froth layer height values evaluation.
Processes 14 00728 g004
Figure 5. Annotated image for froth detection neural network.
Processes 14 00728 g005
Figure 6. Instance segmentation algorithm.
Processes 14 00728 g006
Figure 7. Annotated image from the test dataset and the corresponding neural network processing results. Red color represents manually labelled objects, while blue color is dedicated to the neural network segmentation results.
Processes 14 00728 g007
Figure 8. Comparison of bubble size distribution histograms for manual annotation and neural network detection.
Processes 14 00728 g008
Figure 9. Combined averaged bubble size distribution curves depending on fixation height using MIBC.
Processes 14 00728 g009
Figure 10. Combined averaged bubble size distribution curves depending on fixation height using OPF.
Processes 14 00728 g010
Figure 11. Statistical parameters of the time series of the d32 parameter using MIBC.
Processes 14 00728 g011
Figure 12. Statistical parameters of the time series of the d32 parameter using OPF.
Processes 14 00728 g012
Figure 13. Explanation of deviations in measured values.
Processes 14 00728 g013
Figure 14. Smoothed time series of the d32 parameter using MIBC.
Processes 14 00728 g014
Figure 15. Smoothed time series of the d32 parameter using OPF.
Processes 14 00728 g015
Figure 16. Processing of froth height determination results obtained via machine vision using MIBC.
Processes 14 00728 g016
Figure 17. Processing of froth height determination results obtained via machine vision using OPF.
Processes 14 00728 g017
Figure 18. Residual distributions following Savitzky–Golay filtration.
Processes 14 00728 g018
Figure 19. Correlation matrix and variance curve for MIBC.
Processes 14 00728 g019
Figure 20. Correlation matrix and variance curve for PGF.
Processes 14 00728 g020
Figure 21. Singular spectrum components of froth height time series using MIBC.
Processes 14 00728 g021
Figure 22. Singular spectrum components of froth height time series using OPF.
Processes 14 00728 g022
Figure 23. Froth height detection using neural network. Green rectangle represents on of several measurment zones, while the blue one represents boundaries of the detected froth layer.
Processes 14 00728 g023
Figure 24. Time dependence of parameter α for different frothers.
Processes 14 00728 g024
Figure 25. A criterion for evaluating the effectiveness of the frothers application based on the selectivity of the floatability classes separation assessment.
Processes 14 00728 g025
Figure 26. Results of numerical determination of criterion E for variation in aeration parameters in case of application of MIBC.
Processes 14 00728 g026
Figure 27. Results of numerical determination of criterion E for variation in aeration parameters in case of application of OPF.
Processes 14 00728 g027
Disclaimer/Publisher’s Note: The statements, opinions and data contained in all publications are solely those of the individual author(s) and contributor(s) and not of MDPI and/or the editor(s). MDPI and/or the editor(s) disclaim responsibility for any injury to people or property resulting from any ideas, methods, instructions or products referred to in the content.