Article

Techno-Economic and Environmental Performance Assessment of a 1 MW Grid-Connected Photovoltaic System Under Subtropical Monsoon Conditions

by
Muhammad Usman Saleem
1,
Abdul Samad
2,
Saif Ur Rahman
3 and
Muhammad Zeeshan Babar
4,*
1
Works Directorate, Government College Women University, Sialkot 51310, Pakistan
2
Department of Electrical Engineering, University of Sialkot, Sialkot 51310, Pakistan
3
School of Advanced Technology, Xi’an Jiaotong-Liverpool University, Suzhou 215123, China
4
School of Engineering and Physical Sciences, Heriot-Watt University, Edinburgh EH14 4AS, UK
*
Author to whom correspondence should be addressed.
Processes 2026, 14(4), 616; https://doi.org/10.3390/pr14040616
Submission received: 30 December 2025 / Revised: 30 January 2026 / Accepted: 7 February 2026 / Published: 10 February 2026
(This article belongs to the Special Issue Advances in Renewable Energy Systems (2nd Edition))

Abstract

The high expansion rate of industrial-scale photovoltaic (PV) systems in emerging economies requires proper performance prediction models that consider particular climatic variabilities. Although the theoretical potential of solar energy in South Asia is well documented, there still exists a gap in the validation of simulation models to operational data over long periods in subtropical monsoon climates. Unlike prior studies, this work combines multi-year operational data with dynamic TRNSYS simulations to quantify both technical and environmental performance of a 1 MW PV system under subtropical monsoon conditions. This paper provides a detailed performance evaluation of a 1 MW grid-connected PV system located in Punjab, Pakistan. The actual performance of the system is compared with a dynamic simulation model that is created in the Transient System Simulation Tool (TRNSYS) using three years of operational data. Four different scenarios are analyzed: (1) Ideal Theoretical Operation, (2) Actual Field Data, (3) Simulated Operation with Maximum Power Point Tracking (MPPT), and (4) Simulated Operation without MPPT. The results reveal that the real system produced an average of 1342 MWh/year, whereas the MPPT-enabled simulation predicted 1664 MWh/year, indicating a performance difference of 19.3%. Statistical validation revealed a strong correlation ( R 2 = 0.84 ) between the model and reality, yet identified a normalized Root Mean Square Error (nRMSE) of 26.8%. This deviation represents a performance gap which is deconvoluted into agricultural soiling losses and grid curtailment. The research work quantifies the technical effect of MPPT where a 27% operational advantage is realized in comparison to fixed-voltage cases, proving its necessity in climates with high diffuse radiation during monsoon seasons. Economic analysis demonstrates a Levelized Cost of Energy (LCOE) of $0.0378/kWh of the existing system, and a Simple Payback Time (SPBT) of 4.74 years at the current industrial tariffs. Sensitivity analysis also indicates that in case of an increase in grid tariffs to 50 PKR/kWh, Internal Rate of Return (IRR) increases to 18.8%. Environmental analysis confirms a carbon emission reduction of 765 tons/year. These results validate the techno-economic feasibility of large-scale PV in the area and provide an important understanding of the critical yield losses in monsoon seasons, which offers an effective robust benchmark for future industrial energy policy in developing economies.

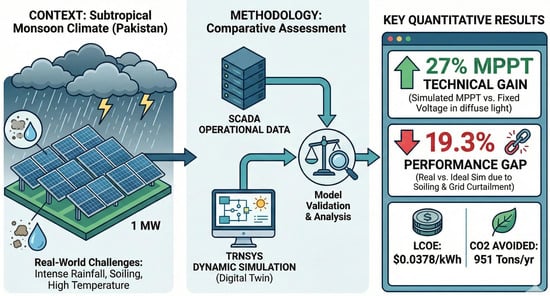
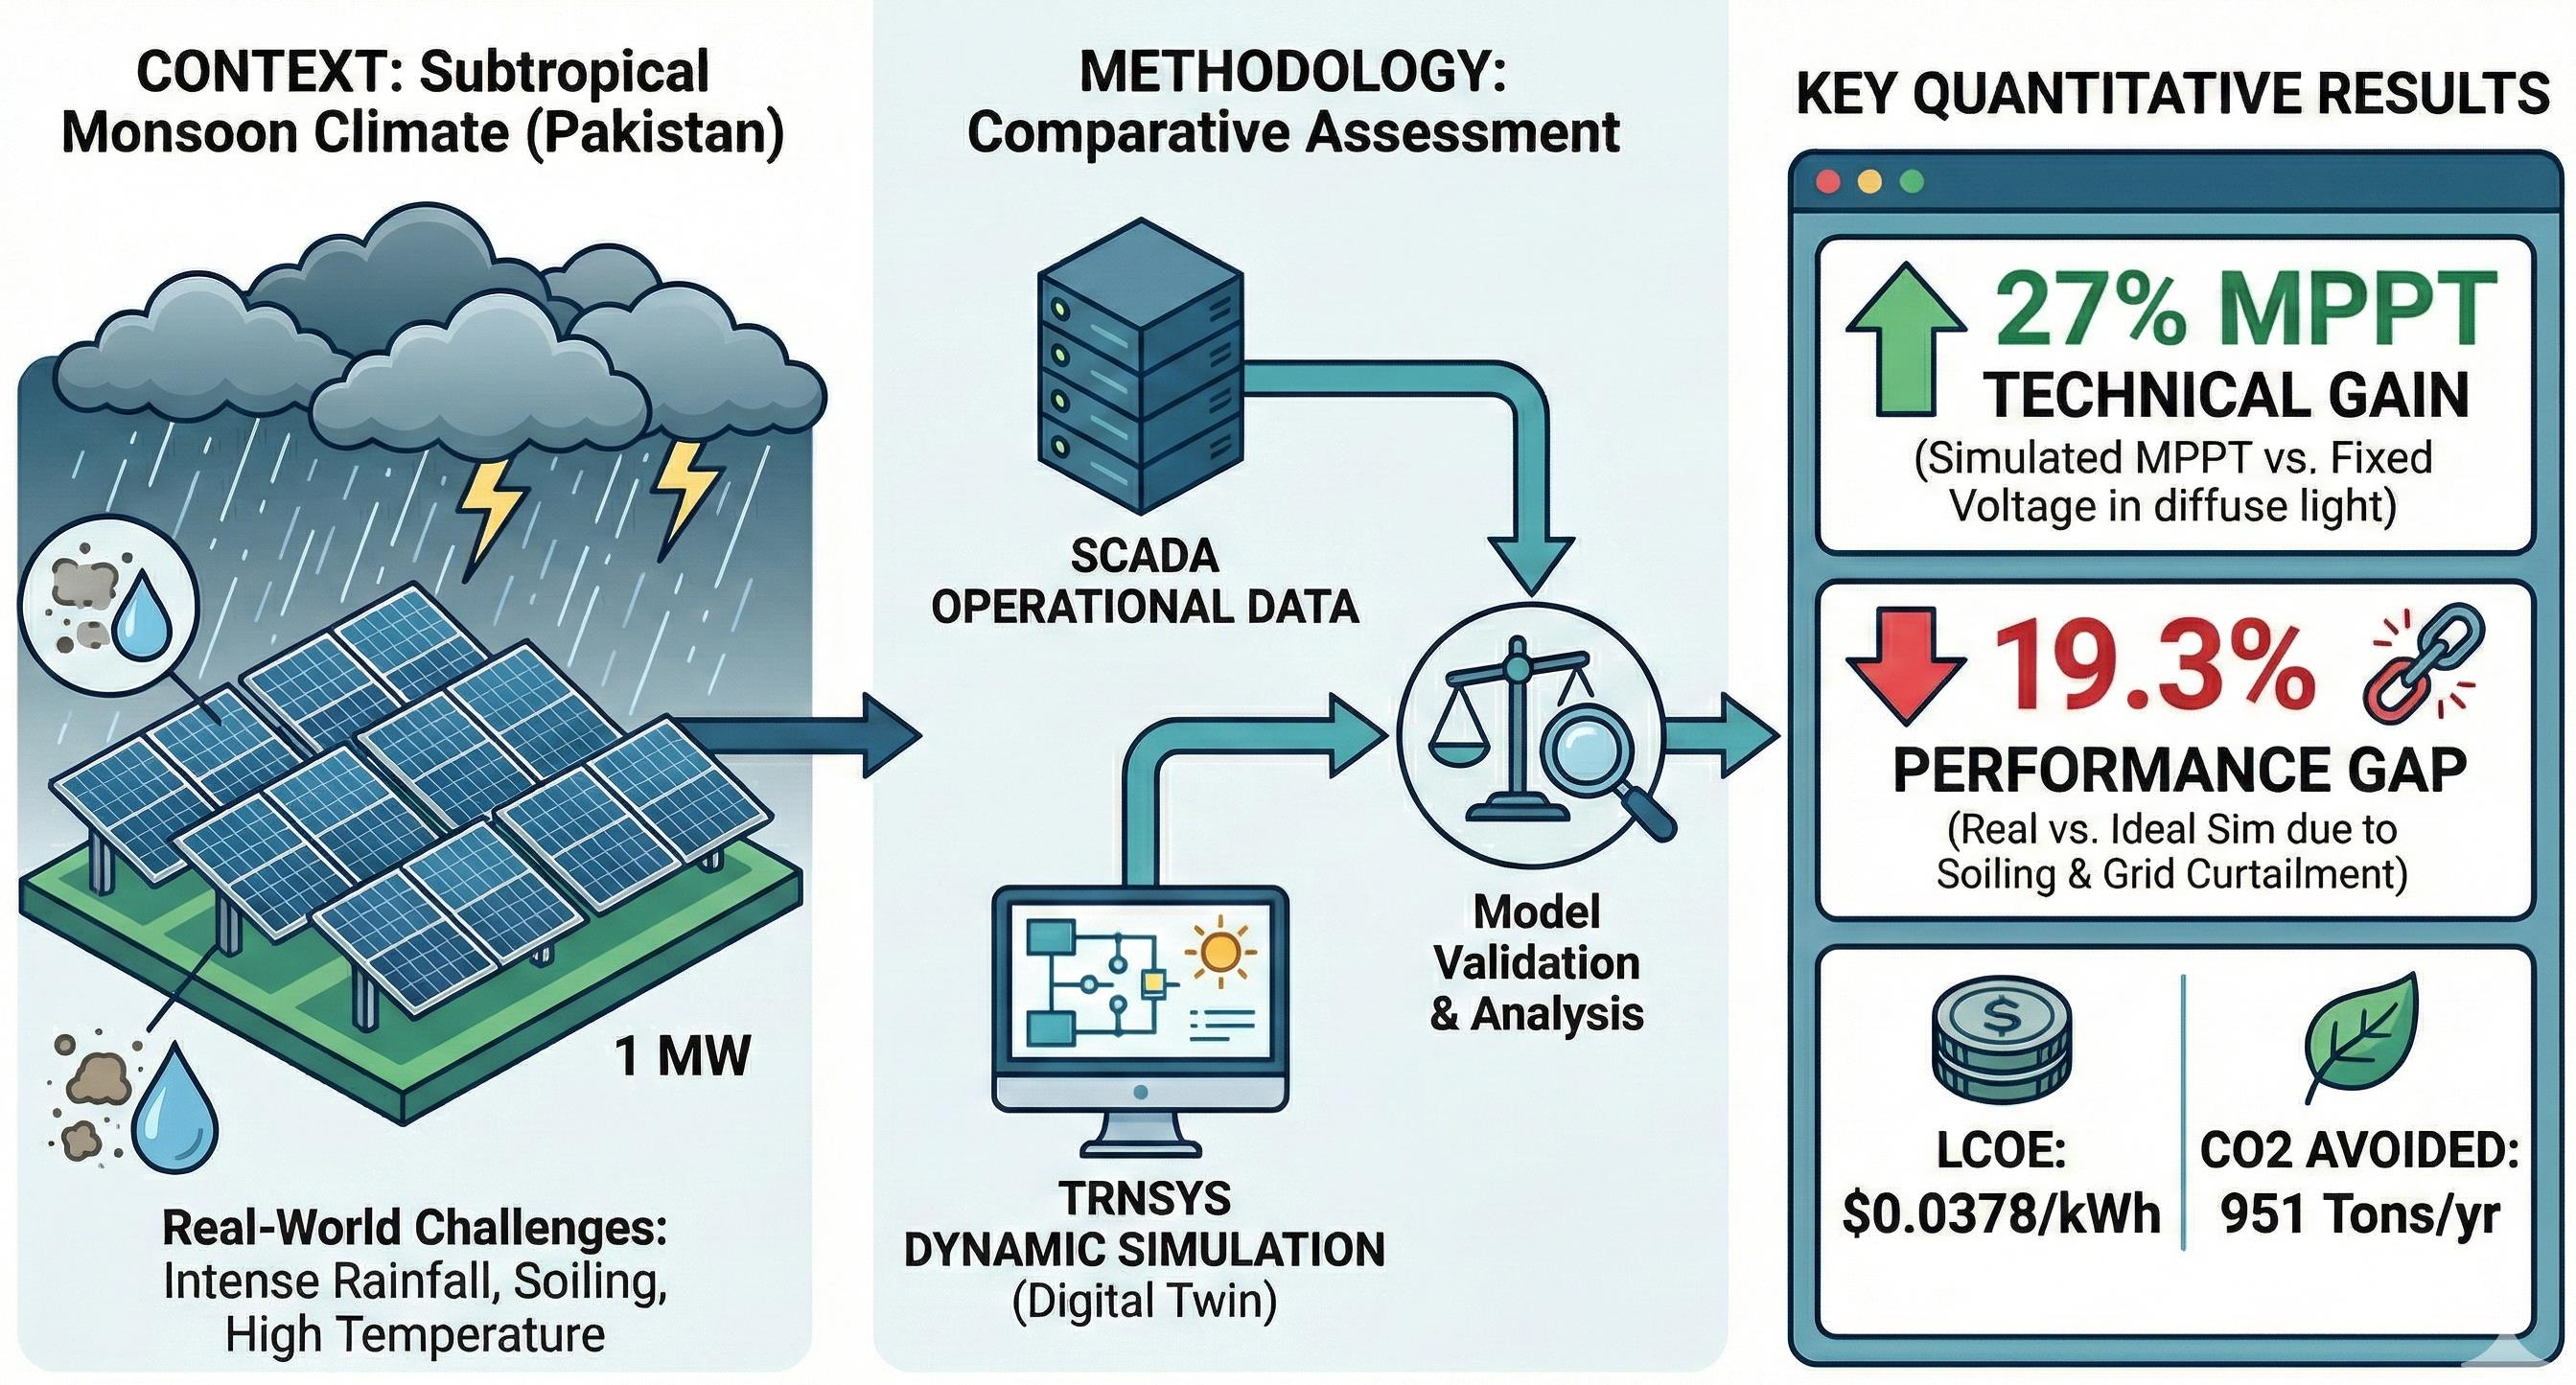
Graphical Abstract

1. Introduction

The world’s energy landscape is now experiencing a radical paradigm shift, which is determined by the acute need to reduce anthropogenic climate change and guarantee energy security in the long run. The increasing accumulation of greenhouse gases (GHGs) in the atmosphere, which is mainly carbon dioxide (CO2), has triggered a global consensus on the issue of decarbonization. Conventional power production, which is largely based on fossil fuels, is becoming unsustainable as the reserves of hydrocarbons are limited and directly related to global warming, ozone depletion, and the destabilization of the atmospheric patterns [1].
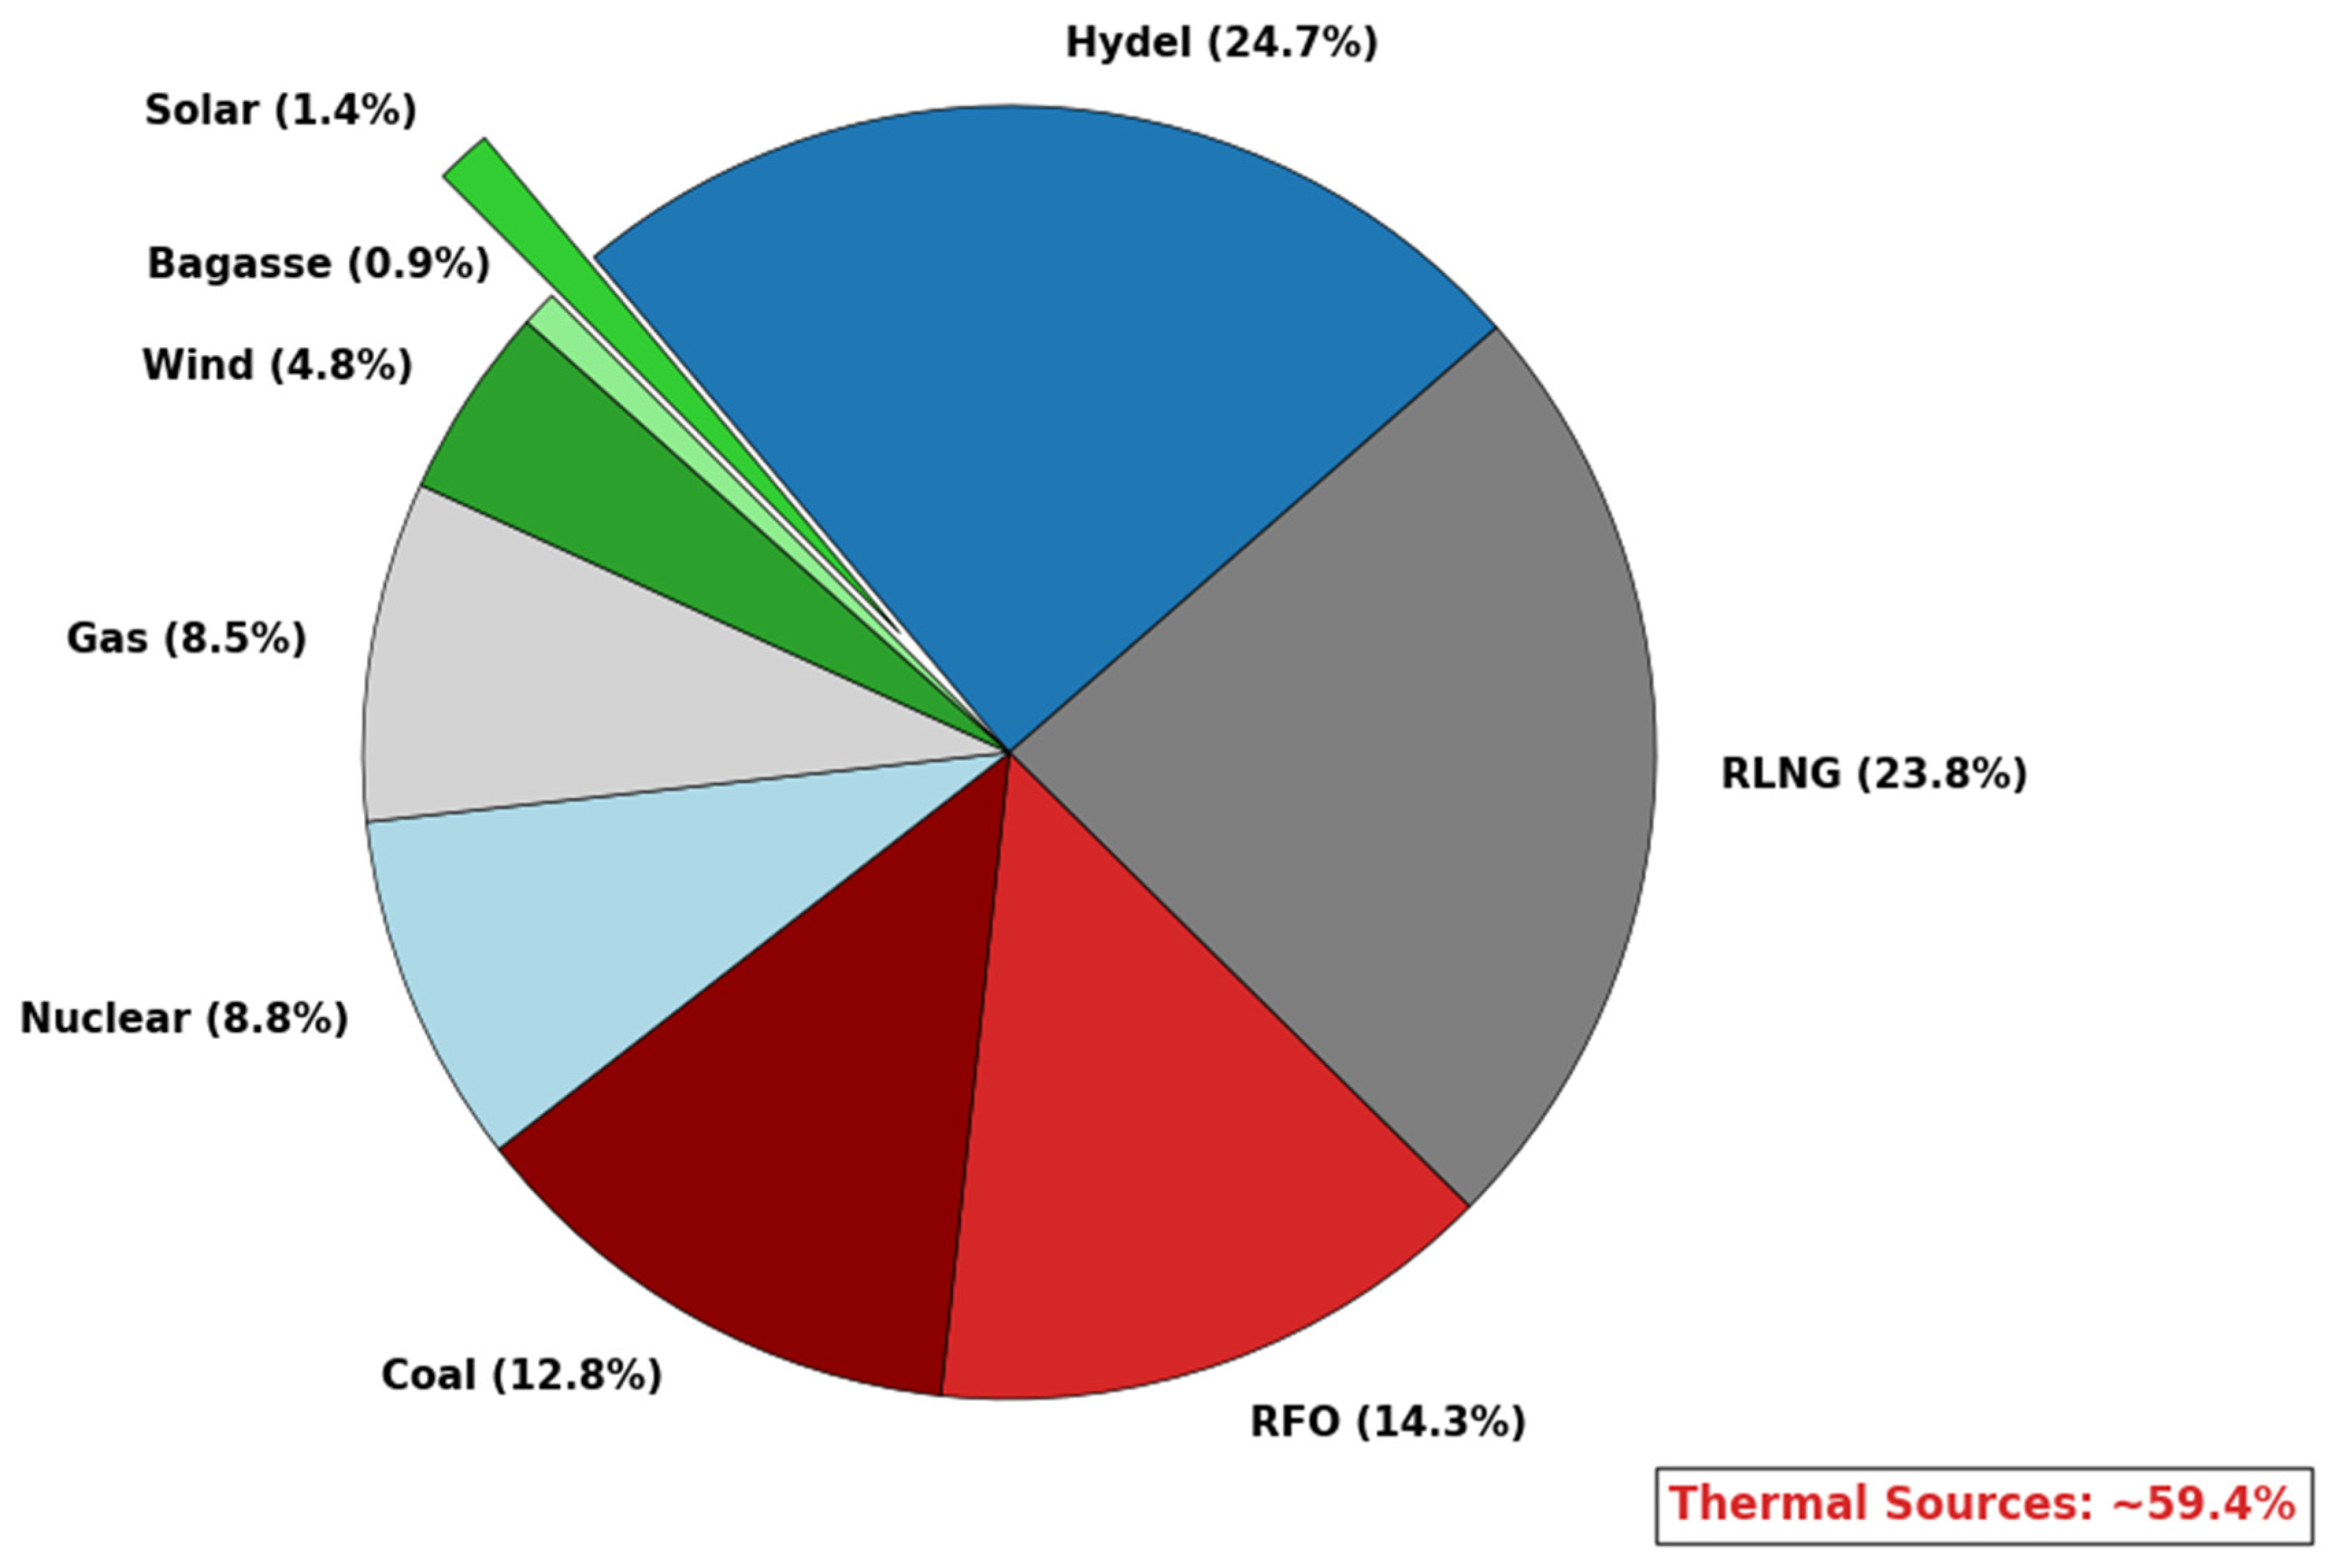
Pakistan is currently dealing with a critical energy crisis that is being marked by a growing gap between the demand and generation capacity of electricity [2]. The current energy mix is highly biased towards thermal sources as shown in Figure 1 and they make up about 59.4% of the total installed capacity [3]. This has led to the national economy being vulnerable to fluctuating foreign oil prices and supply chain disruptions. The cost of oil imports surged to USD 17.03 billion in FY2022, aggravating the trade deficit and destabilizing the local currency, while the import bill for petroleum products alone increased by 121.15% in value, driven by global market fluctuations [4]. Furthermore, this fossil-fuel-centric generation portfolio has led to a steady increase in environmental degradation, with the country’s CO2 emissions rising by 8.78% in 2021 to reach 219.79 megatons, where the power sector accounts for more than 90% of these emissions [5].
To address these energy bankruptcy issues, the Government of Pakistan has revised its renewable energy policy, setting an ambitious target to derive 60% of its energy from renewable sources, including hydropower, by 2030 [6]. Despite strong policy-level support, the actual integration of solar energy in Pakistan remains well below its technical potential. The country possesses an estimated solar capacity of approximately 2.9 million MW and receives high levels of solar irradiance across most regions; nevertheless, solar energy currently contributes only about 1.4% to the national energy mix [7]. This disparity reflects a persistent disconnect between policy ambitions and on-ground implementation, which is particularly evident in the industrial sector, where rising electricity tariffs increasingly threaten operational viability [8].
In response to escalating grid tariffs and growing concerns over energy security, Pakistan has experienced a rapid expansion of distributed generation, emerging as one of the world’s major importers of photovoltaic (PV) modules during the 2023–2024 fiscal period [9]. This trend mirrors global asset-management priorities, where maximizing specific yield (kWh/kWp) has become a central performance objective. In practice, however, system performance frequently deviates from design-stage estimates. As observed by authors in [10], performance gaps in subtropical climates persist, driven by environmental and operational stressors that are insufficiently represented in static feasibility and planning models.
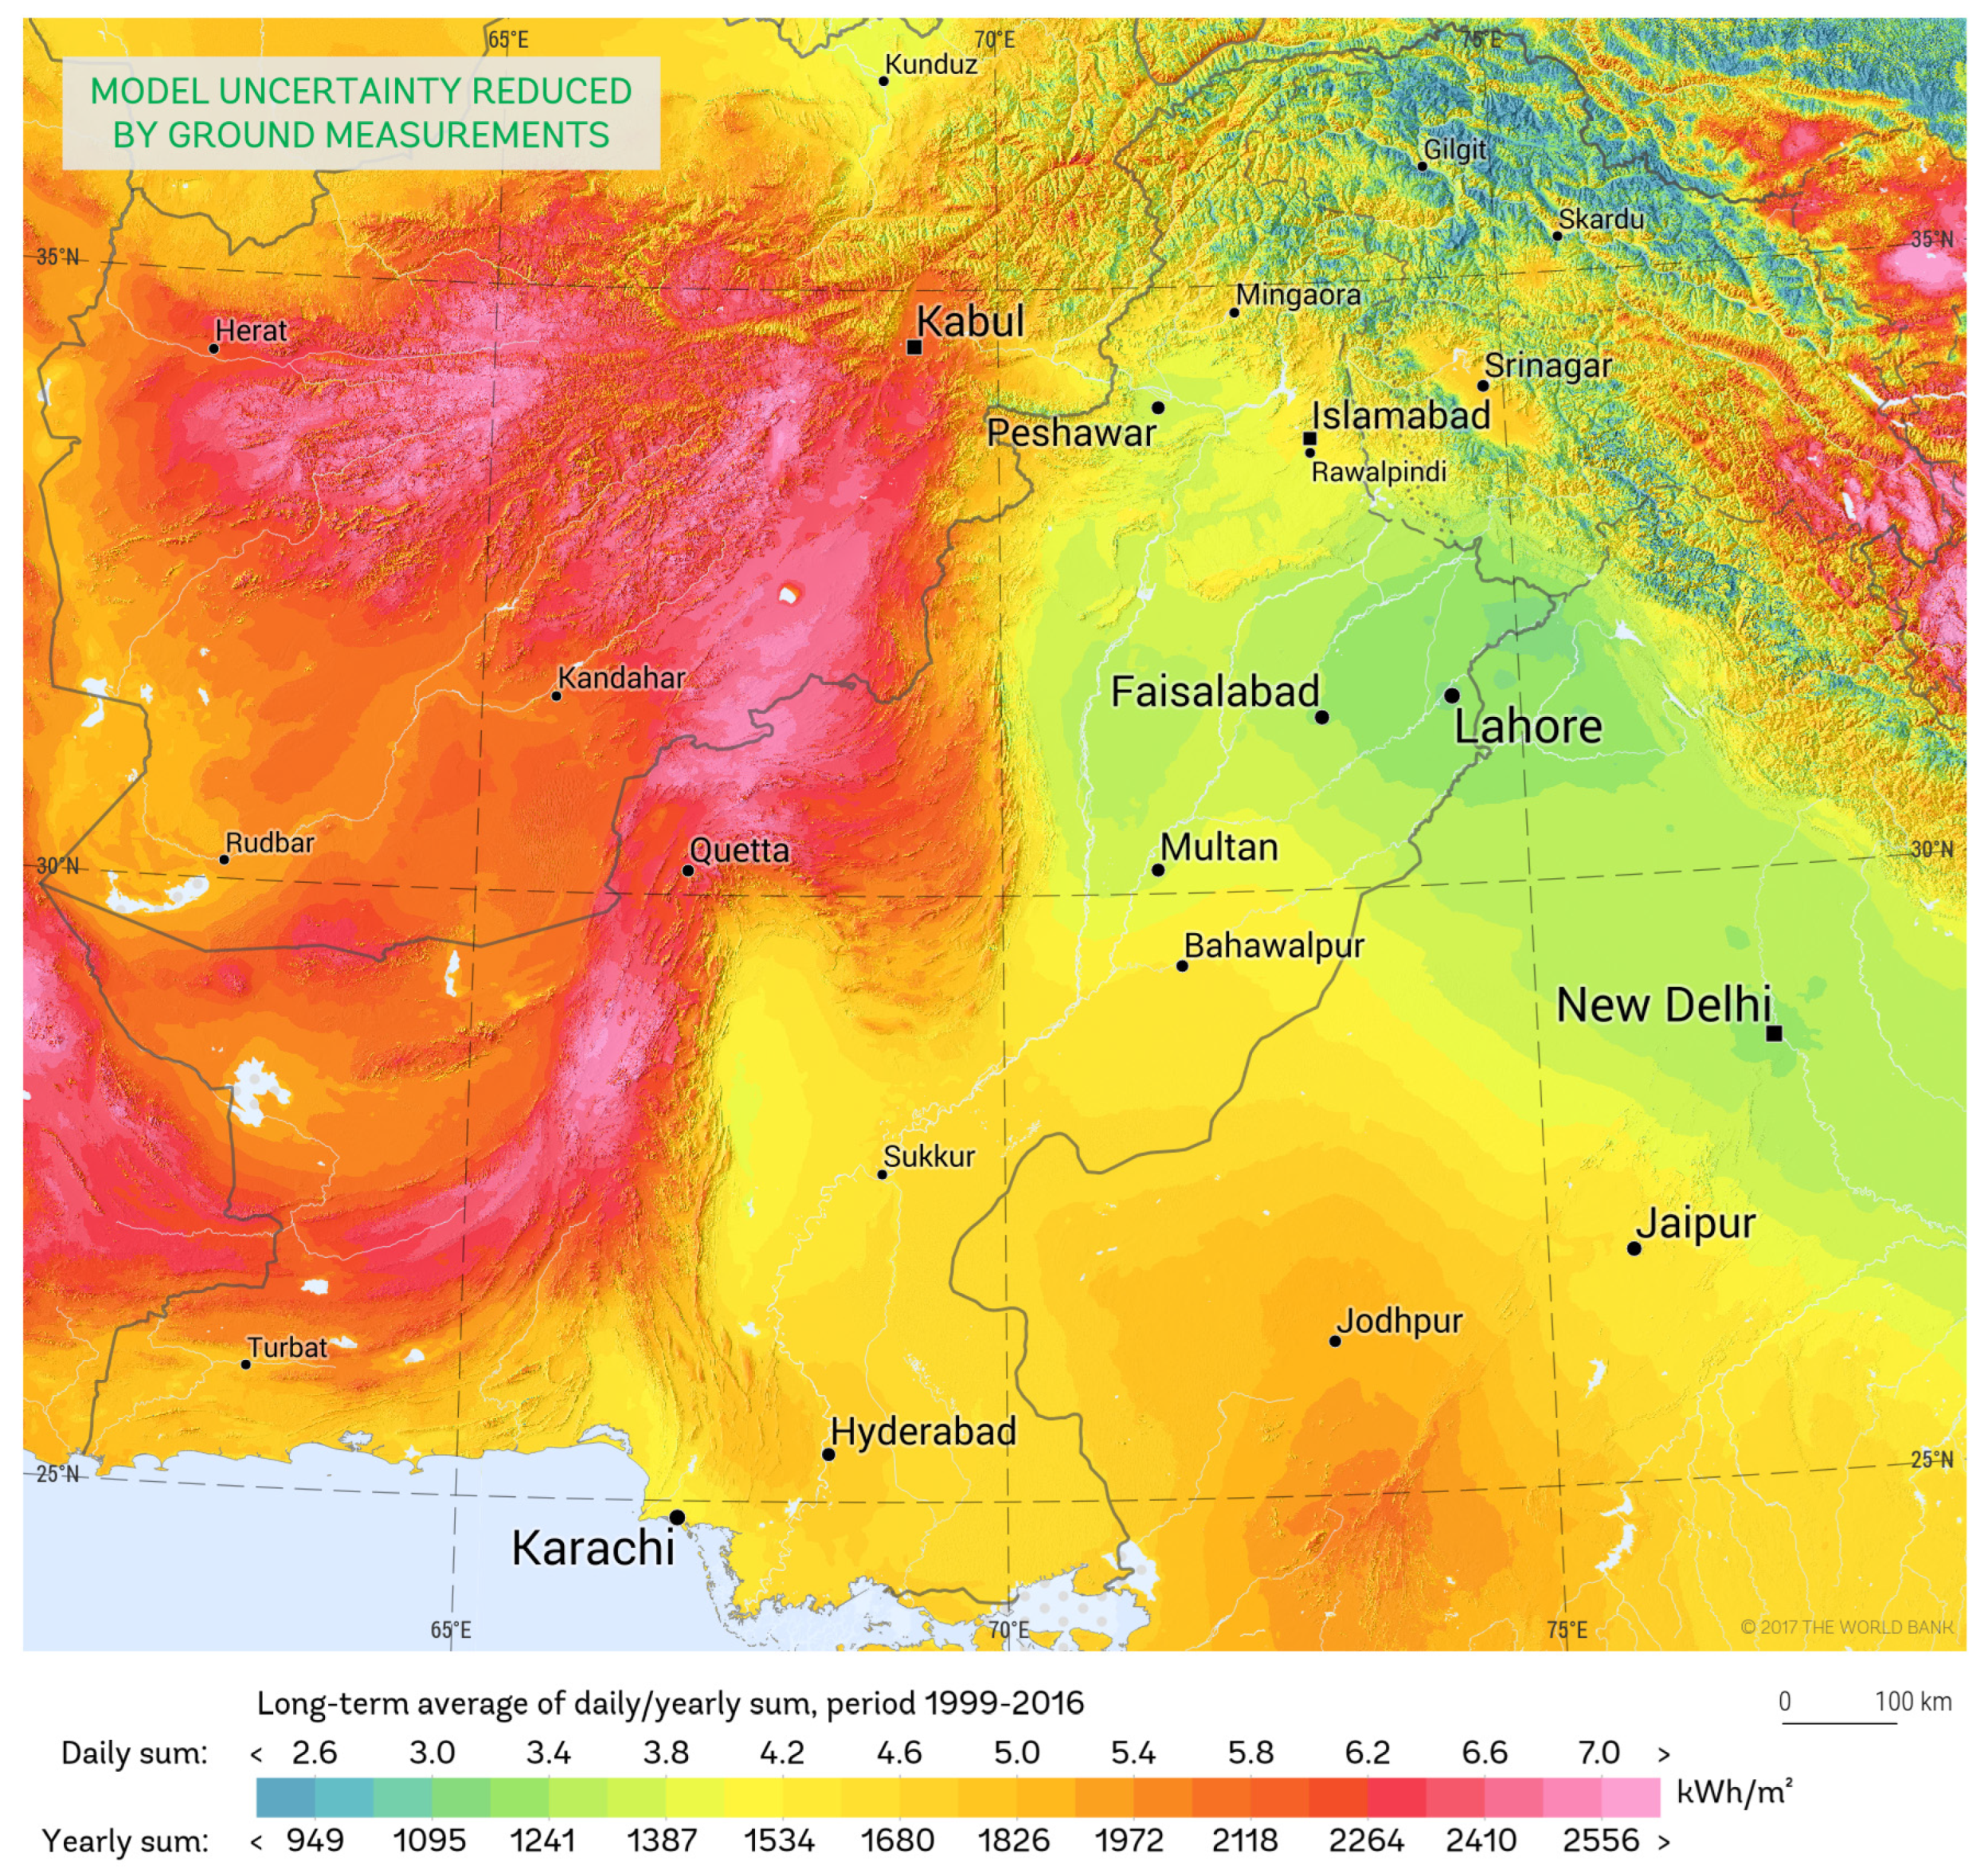
The output of PV systems is fundamentally associated with the local weather conditions. The Gujranwala division, an industrial center in Punjab province, receives an average Direct Normal Irradiance (DNI) of 3.0–3.4 kWh/m2/day as shown in Figure 2 [11].
The research facility is located in the Daska–Gujranwala industrial corridor, geographically situated within the Rice Belt of Punjab [12], a sub-region of northeastern Punjab dominated by the rice–wheat cropping system, where rice cultivation is the principal agricultural activity due to fertile alluvial soils and extensive canal-based irrigation. In Pakistan’s agro-ecological zoning framework, the rice–wheat zone encompasses districts such as Gujranwala, Sialkot, Sheikhupura, Gujrat, Narowal, Mandi Bahauddin, Hafizabad, Lahore, and Kasur, which collectively account for a substantial share of the province’s rice production and underpin the area’s designation as a primary rice-growing belt. This region is characterized by high humidity (>60% annual average) and intense agricultural activity, specifically the seasonal burning of crop residue (biomass) during October–November, which generates dense smog and elevated particulate matter concentrations that significantly reduce atmospheric clarity and adversely impact solar irradiance [12].
One common issue with solar engineering is the lack of correspondence between the performance on the field and the yield simulated, commonly known as the performance gap. Simulation models usually use Typical Meteorological Year (TMY) data which represents averages of historic weather patterns. Nevertheless, the reality on the ground presents unforeseeable conditions like heavy monsoon rains and cloud cover, dust buildup (soiling), and ambient temperatures more than 40 °C [13,14]. In the Gujranwala region, the monsoon season (July–August) brings a great level of uncertainty, where rainfall may have an average of 102.3 mm in July, significantly impacting solar yield [15]. Simple simulation models do not usually capture the intensity of such seasonal dips in generation, causing excessively optimistic financial forecasts of industrial investors.
Although there is an increase in the use of solar technology in Pakistan, there is a dearth of literature to prove the simulation models with real-life data of a megawatt-scale industrial system. The majority of the available literature is based on small residential systems or is entirely based on the theoretical analysis of feasibility without ex-post validation. In particular, the problem considered in this research is two-fold:
  • Technical Uncertainty: There exists no empirical evidence to measure the degradation of PV yield during the subtropical monsoon season, and thus, the system is sized incorrectly and system reliability is not properly evaluated.
  • Economic Ambiguity: Industrial stakeholders lack verified financial models such as Levelized Cost of Energy (LCOE), Simple Payback Time (SPBT), and Internal Rate of Return (IRR) that account for local tariff design and real losses associated with generation.
The gap between theory and practice needs to be filled with more sophisticated simulating environments. TRNSYS is known for its capability of modeling the dynamic behavior of transient systems and generating a digital twin of the physical system [16]. Maximum Power Point Tracking (MPPT) is a critical technological factor of modern PV systems. Although the theoretical advantages of MPPT are well-known, the measurement of its effect on yield in the unpredictable weather patterns of the monsoon belt of Pakistan is a relatively unexplored research field [17].
The primary motivation of this study, grounded in the analysis of a 1 MW grid-tied power plant installed at Silver Star Enterprises, Daska, is to bridge the critical disconnect between theoretical simulation models and operational realities in subtropical climates, where static tools frequently fail to capture dynamic seasonal variability. Addressing this gap, the research validates a dynamic TRNSYS model against three years of field generation data, successfully quantifying the magnitude of the performance gap with a Coefficient of Determination (R2 = 0.84) and isolating the Monsoon Anomaly via an nRMSE of 26.8%. Further motivated by the need to optimize system topology under diffuse irradiance conditions, the work establishes the operational necessity of MPPT, demonstrating a 27% yield advantage through active voltage regulation compared to fixed systems. Additionally, the study integrates site-specific rainfall and temperature datasets to resolve the distinct yield deviations observed in July and August. Finally, to validate economic feasibility during periods of financial instability, the research provides a financial appraisal, confirming the project’s viability with a LCOE of $0.0378/kWh (7.75 PKR/kWh), a SPBT of 4.5 years, and an IRR of 22.0%.

2. Literature Review

The performance of PV systems is fundamentally governed by the semiconductor architecture of the modules. Crystalline silicon (C-Si) is used in industrial applications and is further subdivided into mono-crystalline (Mono-Si) and poly-crystalline (Poly-Si). Mono-Si modules with a single-crystal lattice typically achieve efficiencies between 15% and 20% while recent advancements in Passivated Emitter and Rear Cell (PERC) technology further enhance efficiencies to 25%, which employ a dielectric passivation layer that reflects unabsorbed photons back into the cell [18,19].
Nevertheless, the theoretical efficiency of these modules is greatly affected in high ambient temperature environments, which are common in Punjab. Cell temperature ( T c ) has an inverse relationship with the electrical output of a PV cell, and the open-circuit voltage ( V o c ) at any temperature drops linearly (with an increase in temperature above the Standard Test Conditions (STCs: 25 °C) with a power degradation coefficient of −0.258% to −0.45%/°C [20]).
In Pakistan, where ambient temperature exceeds 40 °C, the thermal effects may lower output by 10–25%. Despite the fact that Poly-Si modules, such as the JA Solar modules that are discussed in the presented work, are currently less efficient (13–16%) compared to Mono-Si modules, their lower manufacturing complexity and capital cost often make them preferred for large-scale industrial deployments [21].
Variability of solar irradiance (G) and spectral distribution plays a critical role in PV performance. Shading is the non-linear effect that reduces the current through a series of connected cells [15]. Physical barriers in shading are not as predominant in subtropical areas like Gujranwala; instead, atmospheric transients, like the heavy cloud cover and precipitation during the monsoon, play a more significant role. The averaged solar data is normally used in the standard yield prediction models to even out such extremities. However, it has been demonstrated through empirical studies that spectral mismatch during cloudy conditions can considerably diminish energy conversion efficiency.
Resistive barriers are formed by dust and other particulate soiling, which are frequent in agricultural belts and dampen irradiance. Standard estimates of soiling losses are between 1.5 and 2% [22], but according to local studies, such losses can be greater during dry seasons and less in wet seasons, leading to oscillating yield curves not seen in standstill simulations. Alshareef et al. [23] pointed out that a non-linear degradation of dust cementation occurs in subtropical climates due to high humidity. Ullah et al. [24] measured the accumulation of dust in Lahore to reach up to a 0.8% efficiency loss per day on dry spells. Rashid et al. [25] showed that spectral shifts are caused by regional dust compositions, while Borah et al. [26] conducted a review of mitigation measures and concluded that the lack of automated cleaning causes constant deviations in performance. Taken together, these studies show that climatic and soiling effects are significant and region-specific, but most techno-economic studies do not combine these factors with their operational validation at an industrial level.
Dynamic regulation of operating points is necessary because of the non-linear nature of the I V characteristics of PV arrays. The Incremental Conductance (IC) and Perturb and Observe (P&O) MPPT algorithms maintain the load impedance through constant changes in an attempt to maximize energy harvest [27,28]. MPPT becomes especially important when the irradiance changes rapidly (e.g., broken cloud cover in pre-monsoon and monsoon seasons). Although the theoretical models propose that MPPT will increase yield relative to fixed-voltage systems, little quantification has been empirically done on megawatt-scale industrial plants in Pakistan. The majority of previous works are based on residential scales or are based on static simulation, and the magnitude of MPPT gains obtained under subtropical monsoon conditions has not been verified.
Accurate performance prediction is essential for the development of financially viable projects. PVsyst and the System Advisor Model (SAM) are typical industry-standard tools that rely on Typical Meteorological Year (TMY) datasets that are constructed from long-term historical averages and therefore fail to adequately represent recent climatic anomalies [29,30]. HOMER is effective for microgrid sizing and economic optimization, yet it lacks the high-resolution thermal modeling capabilities necessary to capture the transient behavior of PV cells [31].
In contrast, TRNSYS offers a dynamically simulating time-step-based, time-decoupled, modular environment that can simulate both thermal and electrical interactions. Ayadi et al. [32] applied TRNSYS to a 15 MW plant in Jordan and obtained high accuracy in estimating IRR = 32%. Wang et al. [33] validated TRNSYS simulations for a 120 kWp BIPV system in China, correlating simulated and actual yields to calculate SPBT = 15 years. TRNSYS’s versatility is reaffirmed in recent studies. Zhan et al. [34] validated TRNSYS for transient solar thermal systems, and Rasheed et al. [35] demonstrated TRNSYS’s ability to optimize energy saving screens in agricultural greenhouses. These studies show TRNSYS’s capability for transient modeling, though prior validations rarely focus on monsoon-induced electrical yield variations at industrial scales.
In Pakistan, despite the availability of extensive research on PV techno-economics, the literature remains fragmented and insufficiently synthesized. Ahmad et al. [36] evaluated SME-scale PV installations using RETScreen, but their dependence on static monthly averages fails to capture dynamic monsoon variability. Mumtaz et al. [37] optimized hybrid diesel–PV energy systems but did not assess performance losses in fully grid-tied scenarios. Kazmi et al. [38] examined off-grid telecom tower applications, providing no direct insight into industrial grid-connected PV performance.
Techno-economic studies on the industrial scale show vast discrepancies. Ahmed et al. [39] designed a 2.5 MW system with the PVsyst model with CF = 16.7–20.3% and LCOE = 0.026–0.032 $/kWh under optimal assumptions of maintenance with no grid curtailment considered. Abas et al. [40] modeled 100 MW of PV-SOL with a projection of SPBT = 11.89 years, whereas Arif et al. [41] modeled 220 kW of HOMER at SPBT = 2.53 years. Isolated rural research, such as that performed by Shah et al. [42], indicates LCOE = 7.98 PKR/kWh compared to a grid cost of 20.79 PKR/kWh, which cannot be extrapolated to the industrial environment of Punjab because of variations in land costs, load characteristics, and tariffs. These inconsistencies underscore the uncertainties and inability of techno-economic estimates to remain reliable over a long period of operation.
From the above literature, three major gaps emerge:
  • Operational Validation Deficit: Most studies use static simulations (PVsyst, HOMER, RETScreen) without validating dynamic models against operational data.
  • Monsoon Anomaly: Intense July–August monsoon conditions induce yield reductions not captured in annualized models.
  • Empirical MPPT Gain: While MPPT benefits are theoretically known, quantification in industrial monsoon conditions remains scarce.
This work addresses these gaps using a 1 MW industrial, grid-connected plant in Gujranwala, combining TRNSYS simulations with three years of operational data to quantify performance deviations and isolate MPPT gain. It is worth noting that, in this work, the validation is performed using three years of operational generation data rather than minute-resolution time-series data. Table 1 summarizes recent techno-economic and validation studies, including recent TRNSYS-based works, and highlights the specific research gaps addressed by this study.

3. Research Methodology and System Modeling

3.1. Methodological Frameworks

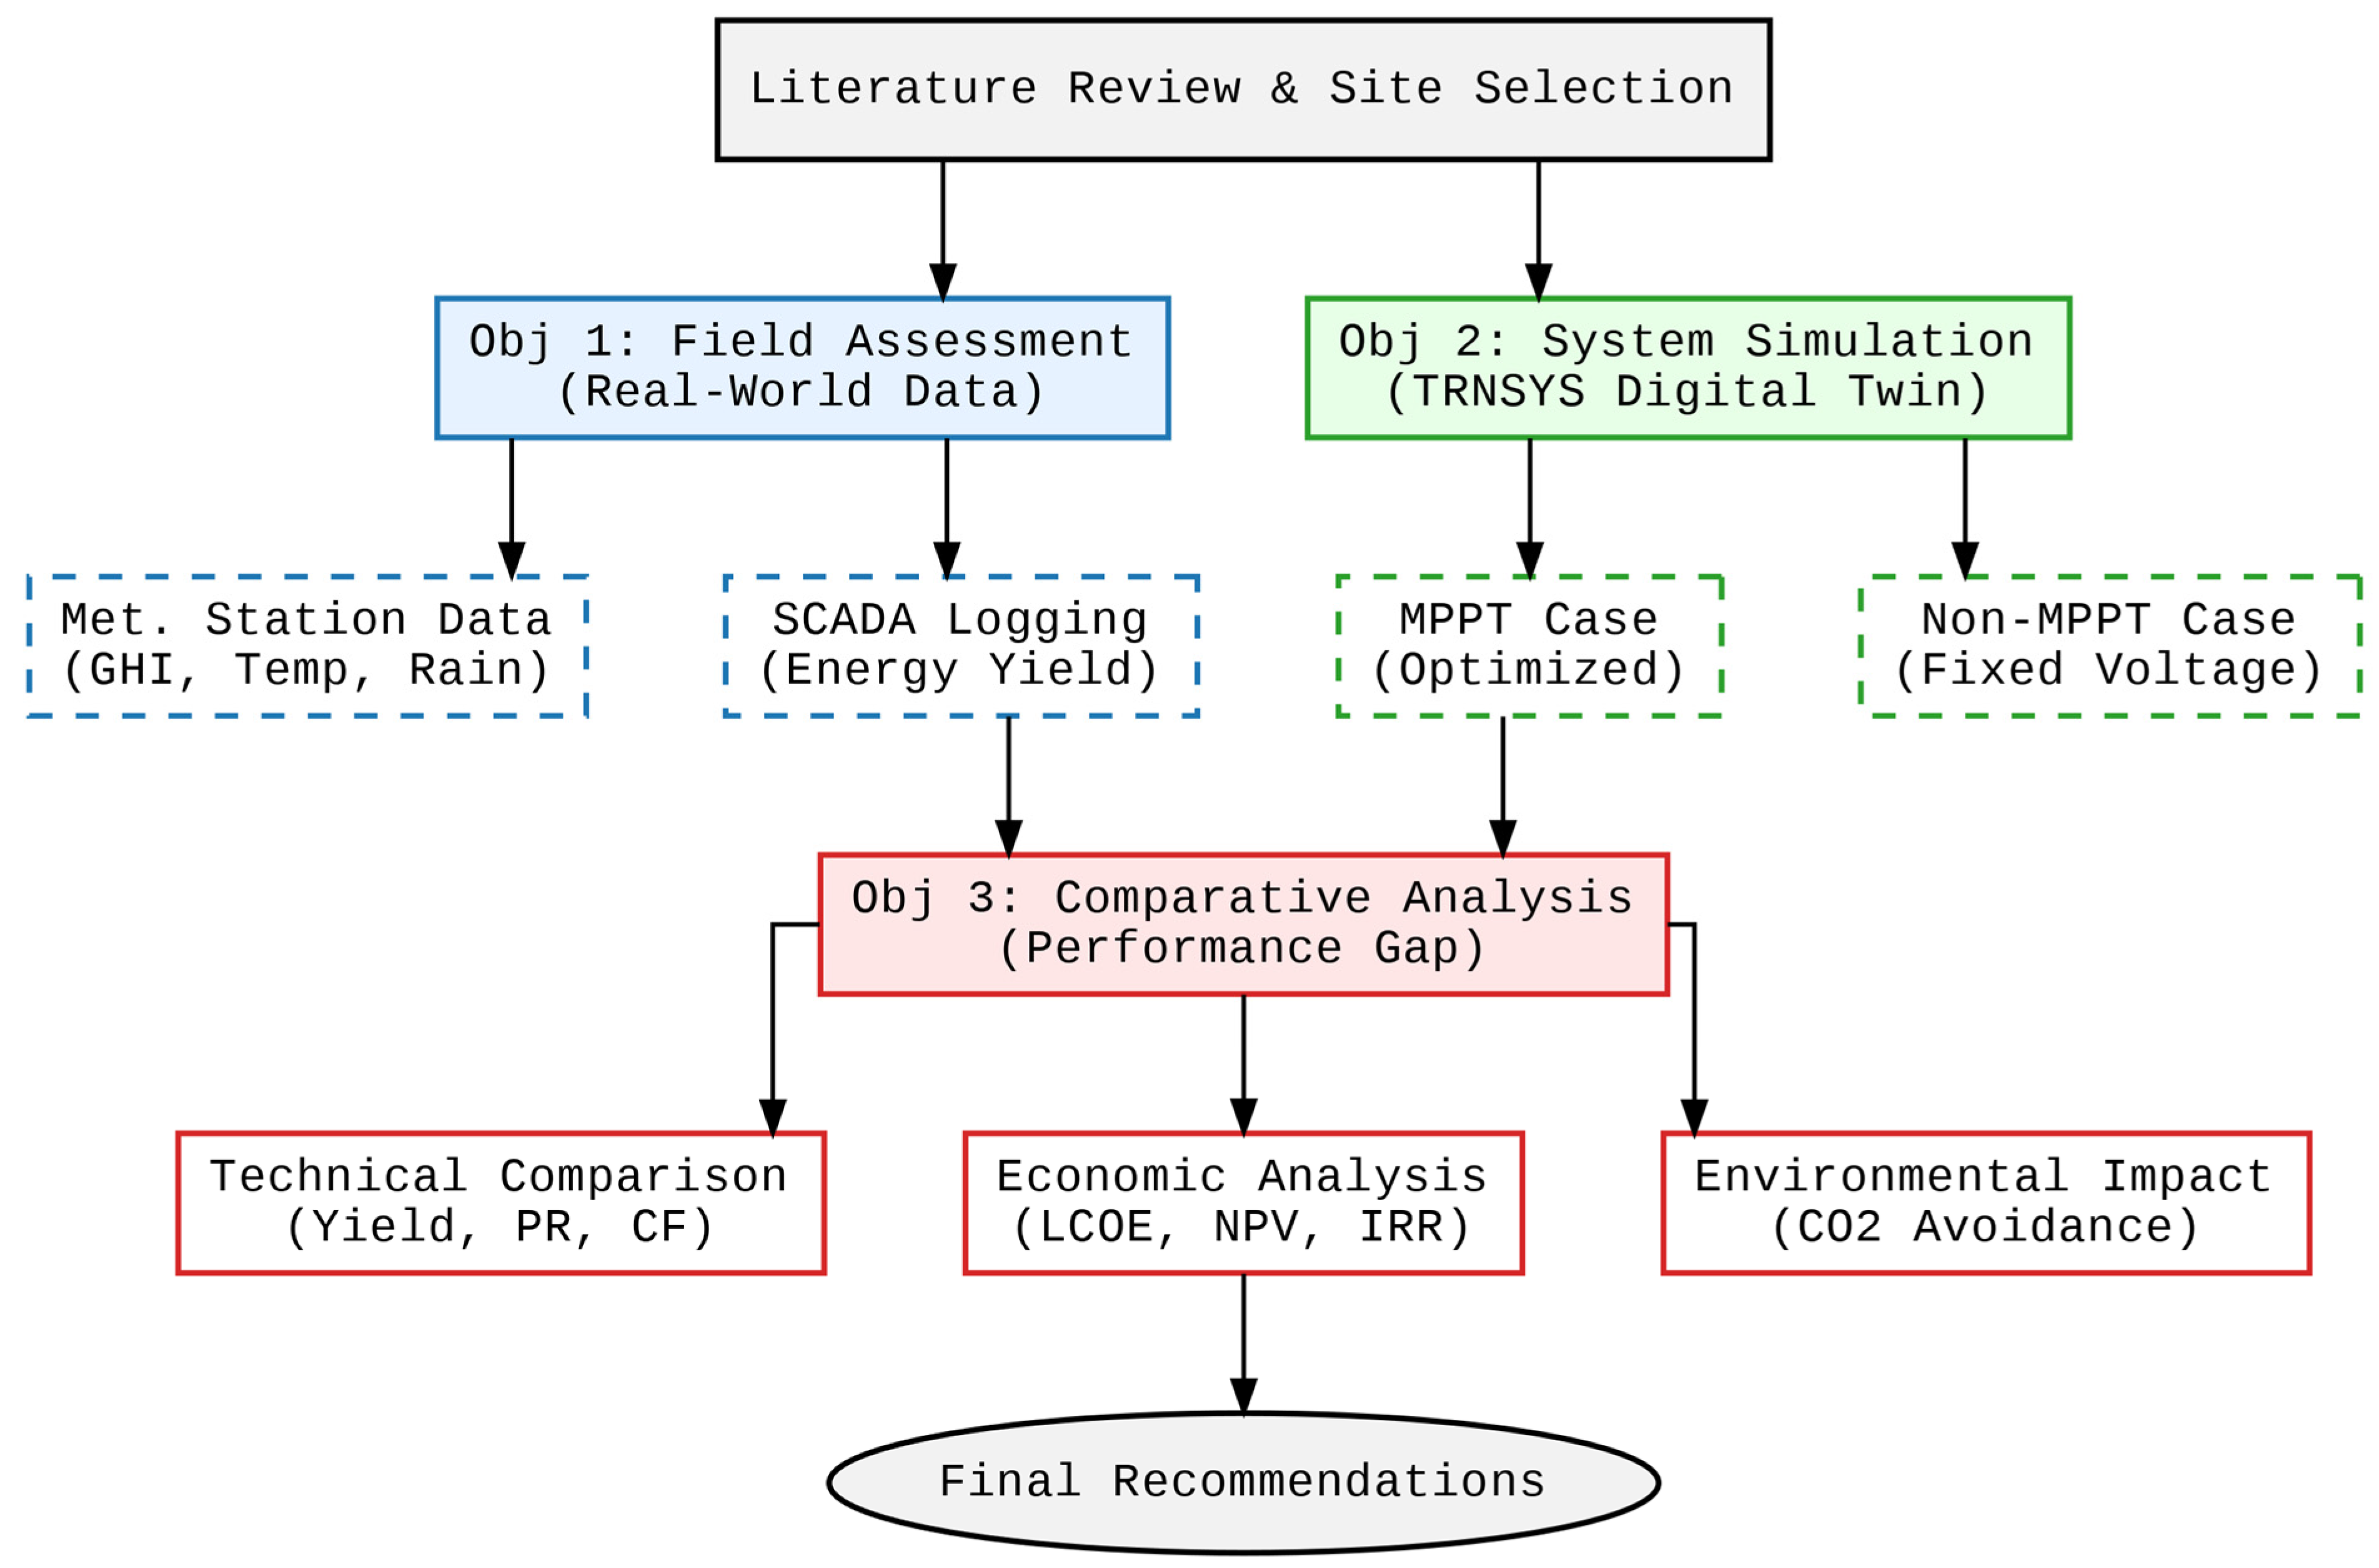
This work uses quantitative and comparative research design to assess the techno-economic performance of PV systems on an industrial scale in subtropical monsoon climates. The methodological framework, which is shown in Figure 3, is organized to overcome the epistemic gap between deterministic simulation models and stochastic operational realities. The process has been described in three stages:
  • Empirical Data Acquisition: Collection of actual time operational data from 1 MW operational plant of Silver Star Enterprises. This covers the logs of AC power output, inverter efficiency and grid export parameters.
  • Dynamic System Modeling: Implementation of a digital twin of the physical plant with Transient System Simulation Tool (TRNSYS 18). This phase involves the parametrization of specific components (PV arrays, inverters, weather data readers) to replicate the physical attributes of the installed system.
  • Validation and Comparative Analysis: A stakeholder rigorous benchmarking exercise where the empirical data (Case 2) is compared to three simulated scenarios, Ideal Theoretical Benchmark (Case 1), simulation with MPPT enabled (Case 3) and the simulation with MPPT disabled (Case 4). This triangulation enables very imprecise losses of yield to environmental factors and technical limitations to be isolated.

3.2. Site Characterization and System Specifications

The research site is in Daska, Sialkot (32.32° N, 74.35° E), in Punjab province in Pakistan. This region belongs to a subtropical semi-arid climate (according to Koppen-Geiger classification BSh) with sweltering summers and high humidity and a well-defined monsoon season between July and September. The site has an average annual Global Horizontal Irradiance (GHI) value of about 5.3 kWh/m2/day, which is very suitable in the Solar Belt [8]. However, the high ambient turbidity and agricultural dust are common in the Rice Belt facing significant soiling issues.
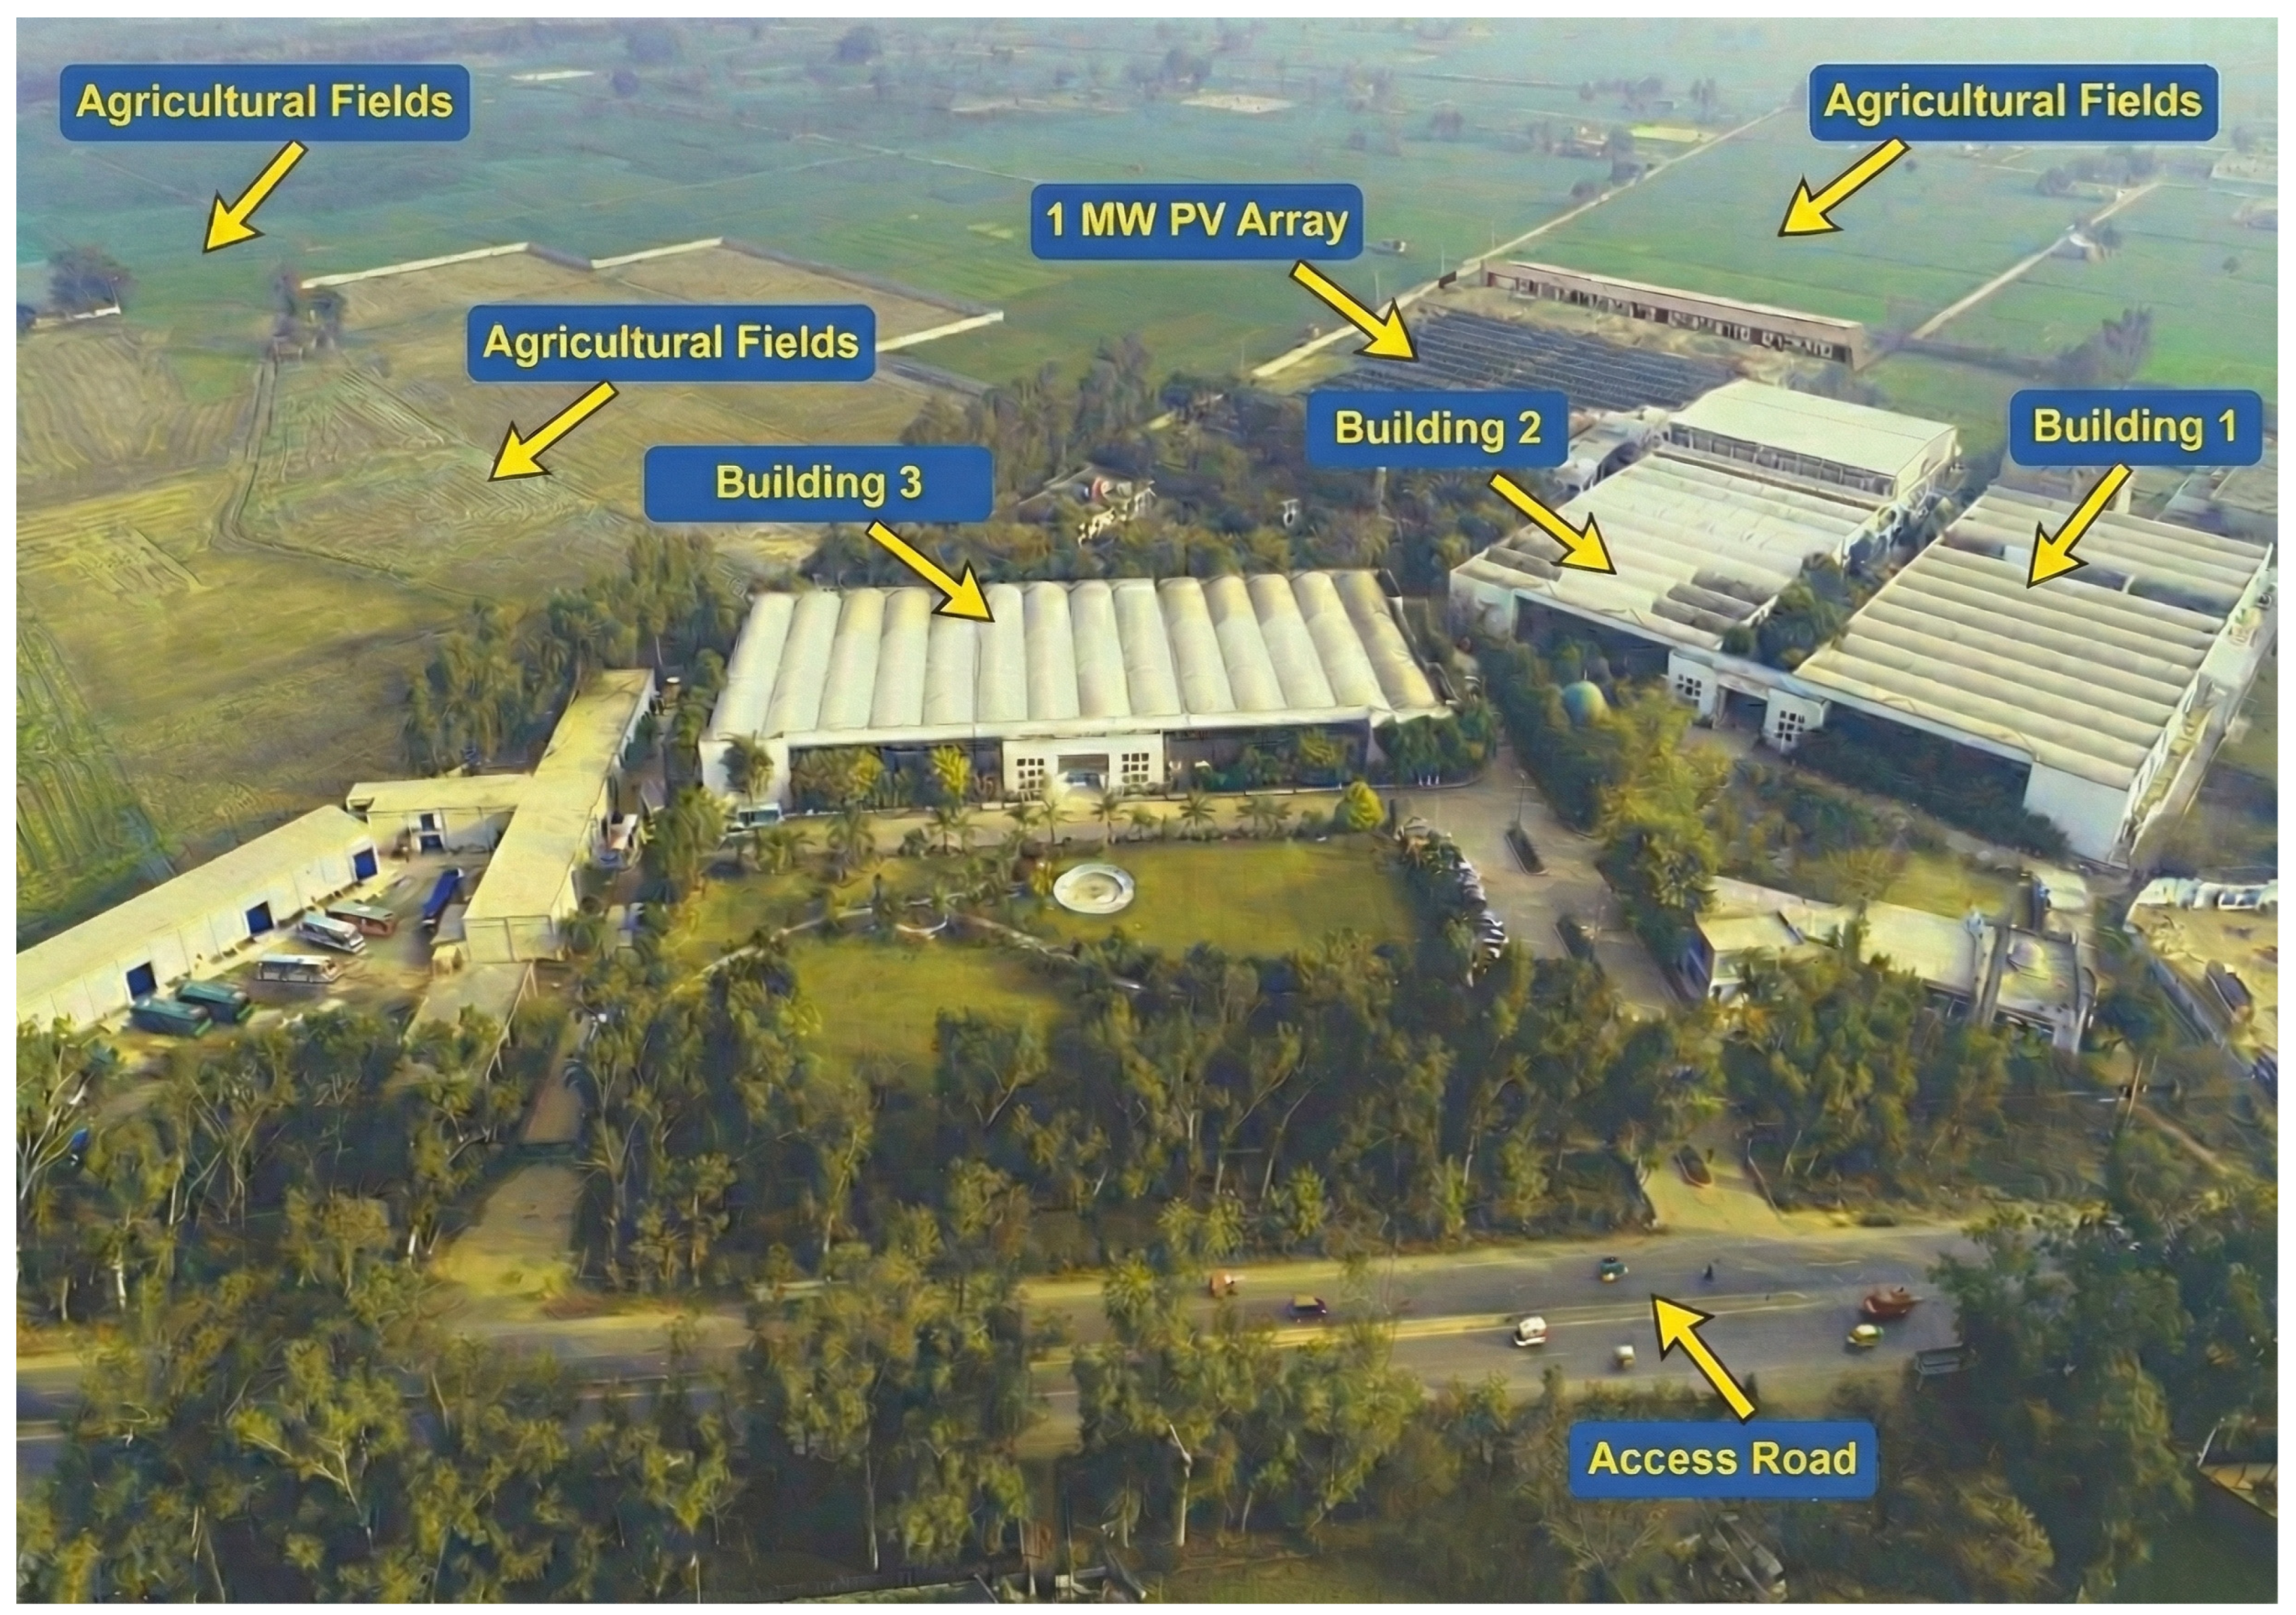
The study focuses on a 1 MW capacity grid-tied solar PV system installed at a prominent industrial facility in Daska, Pakistan, situated within the region’s intensive agricultural zone (Rice Belt). The installed system consists of 2982 polycrystalline photovoltaic modules, each rated at 335 Wp. An annotated aerial view of the site is shown in Figure 4, highlighting the placement of the PV array in close proximity to the primary load centers (Buildings 1, 2, and 3). Further, this visualization establishes the environmental context for the study, i.e., the PV array is directly bordered by active agricultural fields that create a specific microclimate characterized by high exposure to organic dust (crop residue).
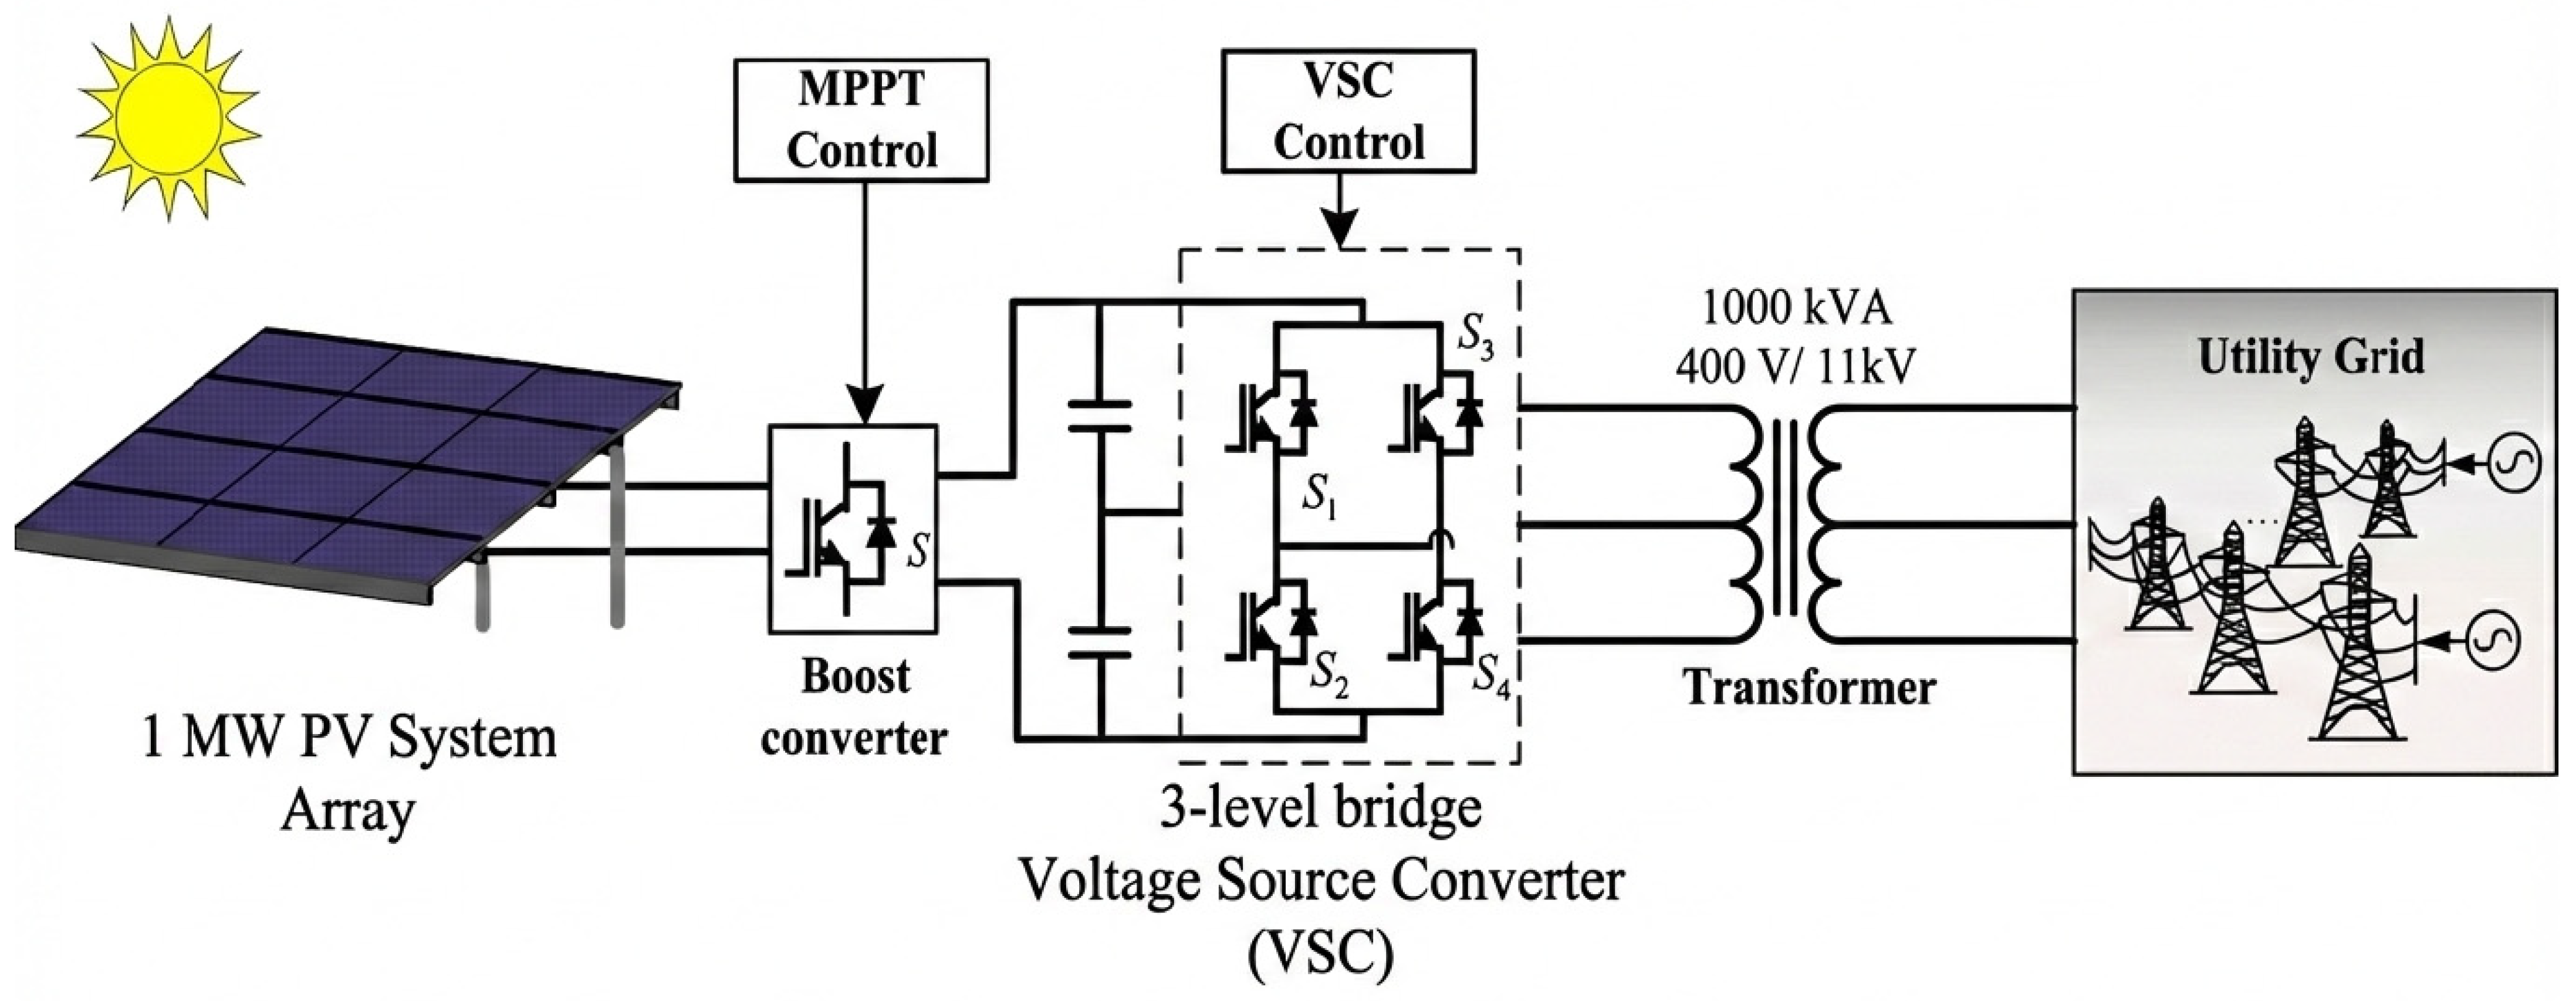
A single-line schematic diagram of the 1 MW grid-connected PV system is shown in Figure 5. The topology highlights the primary power conversion stages, including the MPPT-controlled Boost Converter for DC optimization, the three-level Voltage Source Converter (VSC) for grid synchronization, and the 1000 kVA step-down transformer (400 V/11 kV).
The structure of the detailed technical specifications is as follows:
  • Photovoltaic Generators: The array is made of 2982 modules of polycrystalline silicon (Model: JA Solar JAP72S01-335/SC, JA Solar Technology Co., Ltd., Beijing, China). Each module has a series of 72 cells, a rated maximum power ( P m a x ) of 335 Wp, an open-circuit voltage ( V o c ) of 46.77 V, and a module efficiency of 17.2% at Standard Test Conditions (STCs: 1000 W/m2, 25 °C). The polycrystalline technology was used with a lower temperature coefficient as compared to the monocrystalline generation at the start, due to its optimized performance under high thermal stress [43].
  • Inverter Configuration: The power conversion is handled by 14 string inverters (Model: Huawei SUN2000-100KTL-H1, Huawei Technologies Co., Ltd., Shenzhen, China). Each unit has a rated AC output of 100 kW and contains a multi-MPPT architecture (6 independent inputs) that is very important to reduce mismatch losses by the effects of differential soiling or partial shading. The inverters have a maximum efficiency rate of 98.6% and are capable of grid synchronization, 400 V, 3-phase, 50 Hz [44].
  • Balance of System (BOS): The system incorporates advanced protection switchgear, DC combiner boxes and a transformer (1000 kVA, 400 V/11 kV) in the interconnection with the 11 kV industrial feeder. The entire setup comes under the aegis of the National Electric Power Regulatory Authority (NEPRA) regulations on Net Metering.

3.3. Dynamic Simulation Setup in TRNSYS

In order to correctly predict the transient behavior of the system, a simulation model was made using TRNSYS 18. Unlike static tools (e.g., PVsyst), TRNSYS solves the algebraic and the differential equations of the system at discrete time steps (0.125 h) and makes it possible to analyze in detail the thermal lag and MPPT dynamic response. The TRNSYS simulation is employed to present the theoretical maximum performance potential of the system. To this end, several idealized assumptions were adopted. First, the electrical grid is modeled as an infinite bus with 100% availability, thereby deliberately excluding load shedding in order to quantify the system’s unregistered generation potential. Second, the PV array is assumed to operate under clean-surface conditions which enables subsequent analyses to isolate the specific impact of dust deposition from the Rice Belt region by comparing the idealized model outputs with soiled field measurements. Third, a standard linear annual degradation rate of 0.5% is incorporated, in accordance with the manufacturer’s warranty specifications, although it is acknowledged that real-world degradation may be more rapid due to phenomena such as potential induced degradation under high-humidity operating conditions.
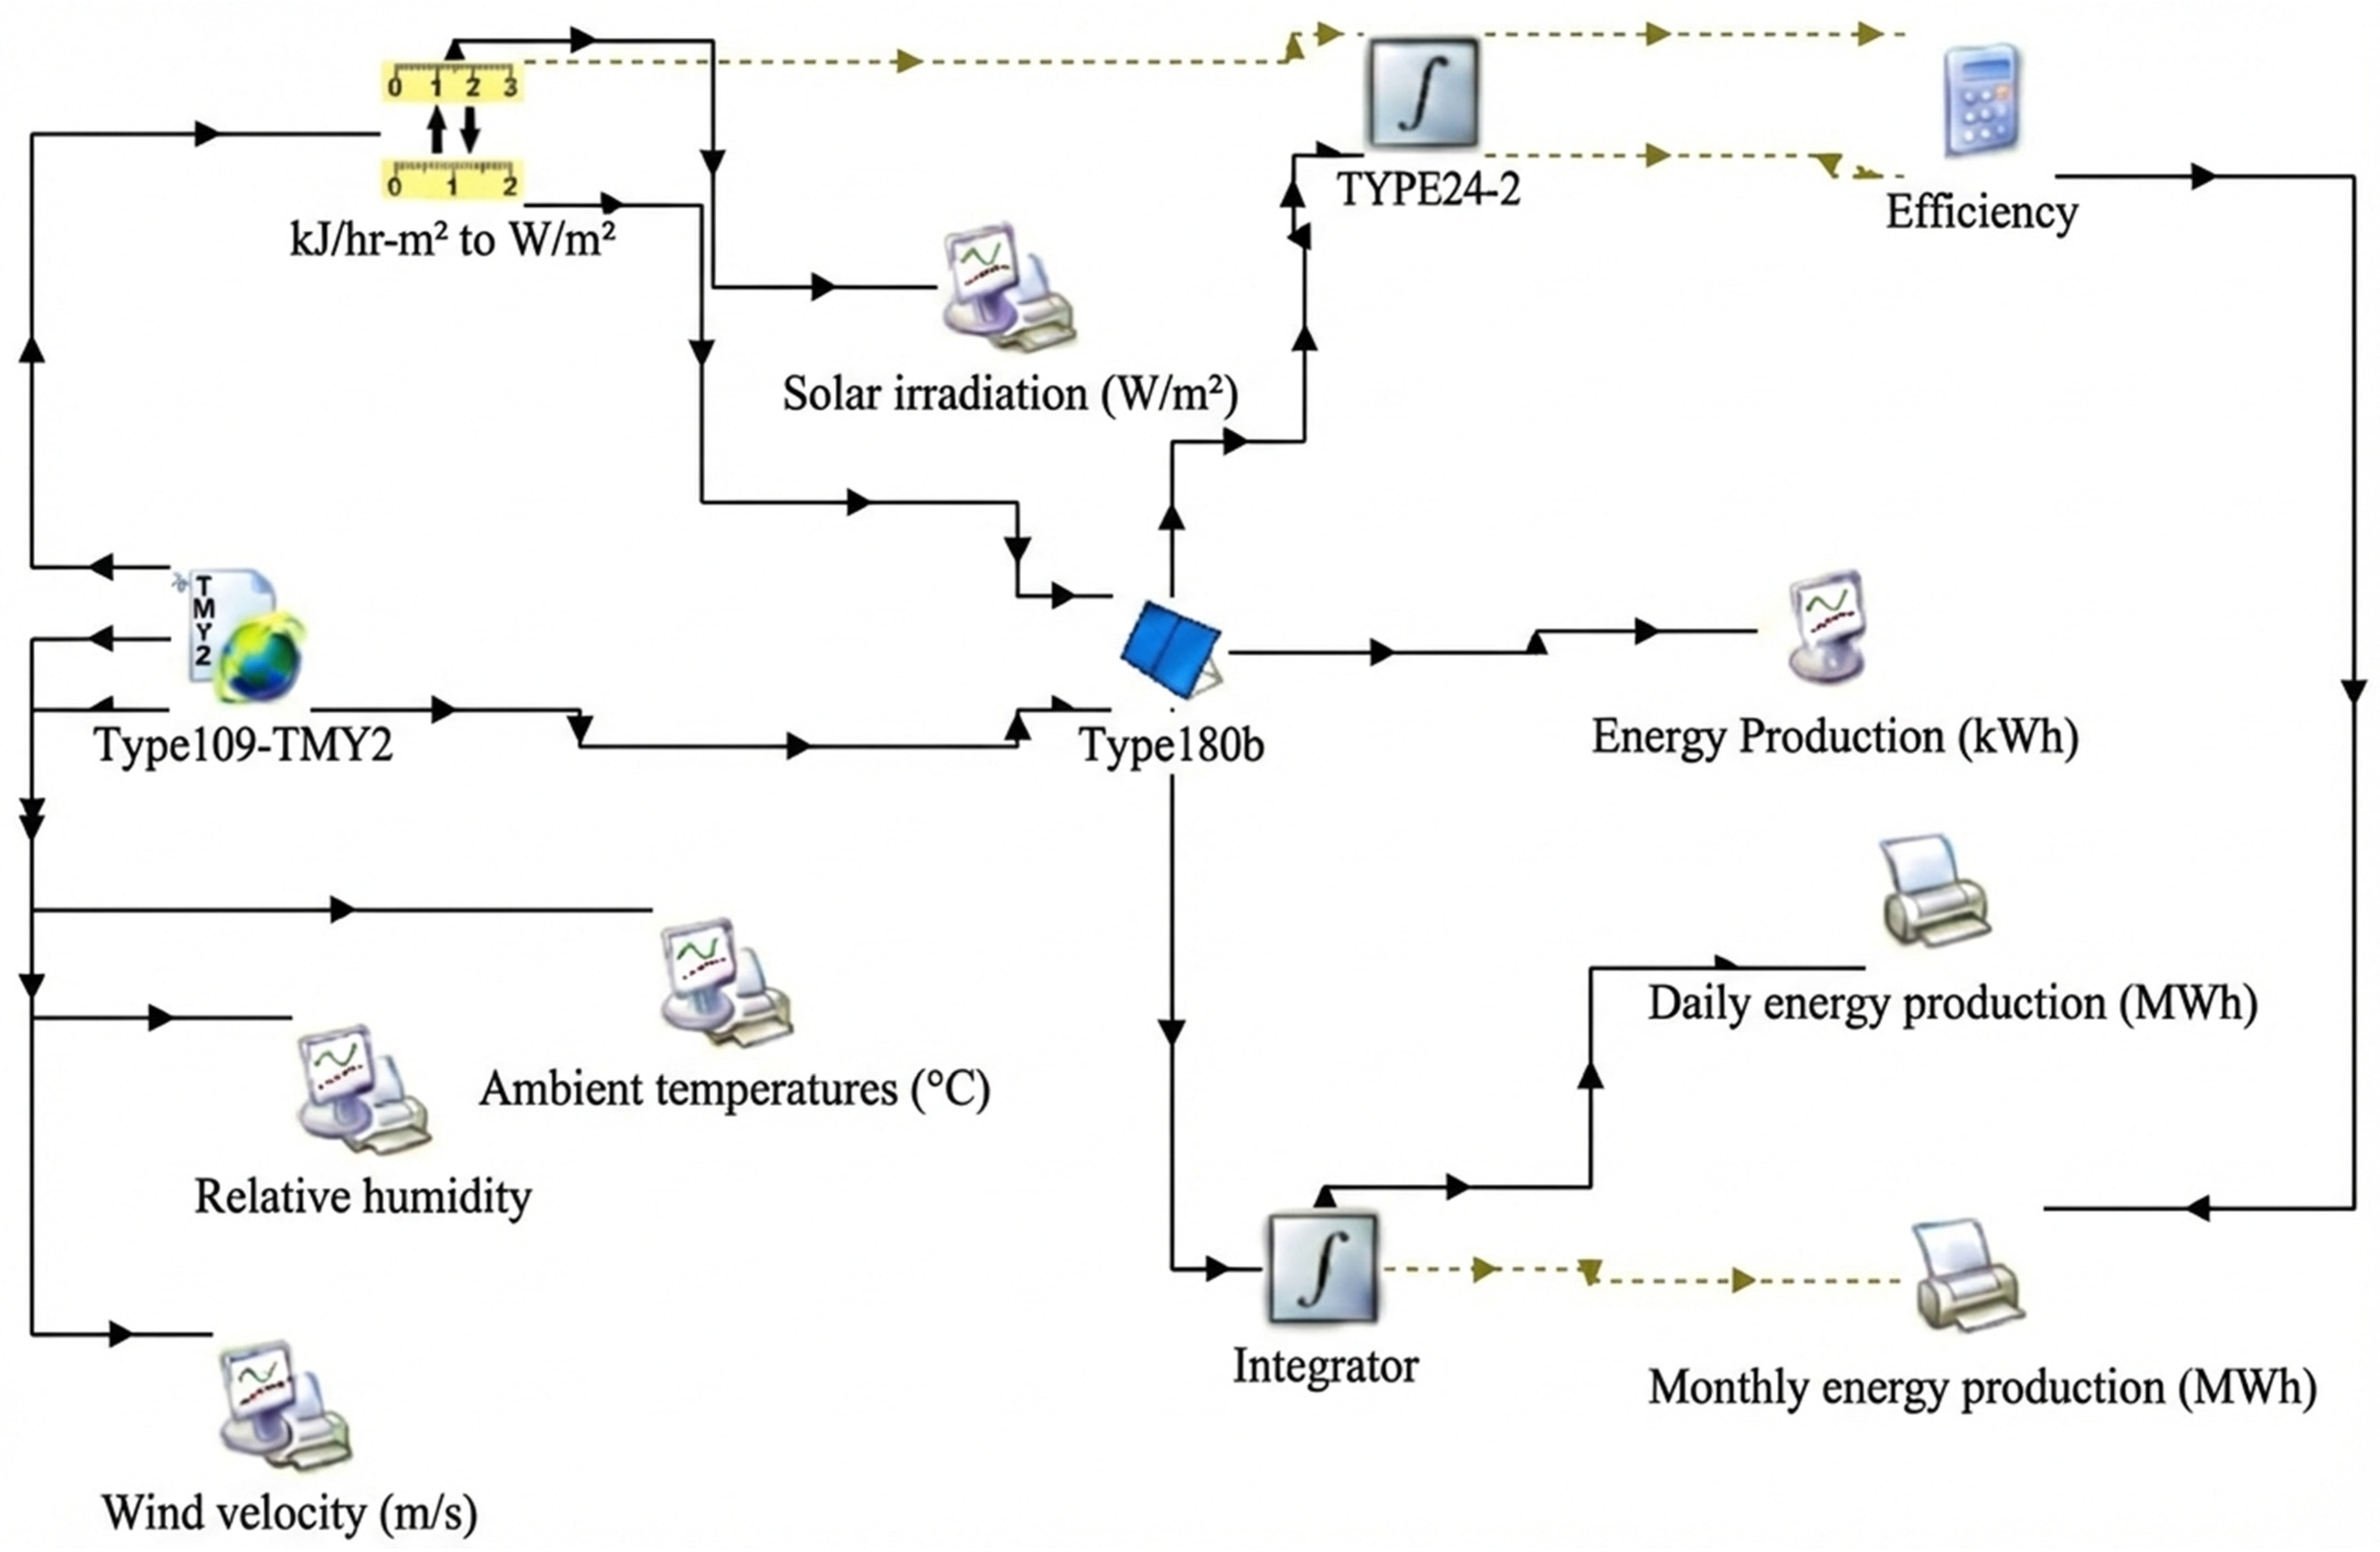
The simulation circuit, as shown in Figure 6, combines the following mathematical element models.

3.3.1. Meteorological Data Processing (Type 109)

The Type 109 component is the forcing function of the simulation that reads the standard-type TMY weather files. Notably, the component calculates important variables such as DNI ( I b ) DHI ( I d ), ambient temperature ( T a m b ) and wind speed ( V w ). A sky temperature correlation was used to estimate long wave radiation exchange, which is important to properly model module temperatures [45].

3.3.2. Mathematical Modeling of PV Array (Type 180)

The performance of the PV array was simulated by Type 180, which is inclusive of the De Soto 5-parameter equivalent circuit model. This model is superior to simple efficiency correlations in that it is a physical representation of the diode characteristics of the PN junction. The current (I)–voltage (V) relationship is described by the following transcendental equation as derived by Cubas et al. [46]:
I = I L I 0 exp q V + I R s n k T c 1 V + I R s R s h
where
I L : Sunlight photocurrent, which is linearly dependent on incident irradiance.
I 0 : Diode reverse saturation current, representing the leakage current in the absence of light, heavily influenced by temperature.
q : Electron charge = 1.602 × 10 19 C .
k : Boltzmann constant = 1.381 × 10 23 J K .
T c : Temperature of the cell (Kelvin).
n : Ideality factor of the diode (typically 1–2), reflecting the recombination mechanisms within the semiconductor.
R s : Series resistance, representing internal losses due to solder bonds and contact resistance.
R s h : Shunt parallel resistance, representing leakage currents across the p-n junction.
To separate out the particular yield improvements that can be attributed to the use of tracking technology, two different Type 180 setups were simulated:
  • Type 180a (MPPT Mode): Simulating an ideal MPPT controller in which the array voltage is continuously adjusted to that at maximum power point voltage V m p p given by the I-V curve derivative (dP/dV = 0) [14]. While advanced algorithms such as Incremental Conductance (IncCond) or Artificial Neural Networks (ANN)s offer marginally faster tracking speeds under rapidly changing irradiance, the P&O algorithm is selected for this study. P&O remains the industrial standard for commercial string inverters (including the installed Huawei SUN2000 series) due to its simplicity, robustness, and lower computational load, making it the most representative baseline for techno-economic validation.
    The inverter model implements P&O logic to emulate dynamic MPPT. Algorithmically, the controller iteratively adjusts the DC operating voltage ( V d c ) by a small step size ( Δ V ) and measures the corresponding change in power ( Δ P ). If Δ P > 0 , the voltage perturbation continues in the same direction. If Δ P < 0 , the perturbation direction is reversed. The control logic seeks the condition d P d V = 0 , ensuring that the PV array operates at the global maximum power point, even under partial shading or fluctuating irradiance conditions.
  • Type 180b (Fixed Voltage Mode): Mimics the array to operate at a fixed reference voltage to serve as a reference to compare the utility system’s efficiency penalty of non-tracking systems.

3.3.3. Thermal Loss Modeling

In view of high ambient temperatures prevalent in Punjab, thermal modeling is crucial and needs to be done correctly. The operating cell temperature ( T C ) was dynamically calculated on a time step basis by an energy balance approach, taking into account the Overall Heat Loss Coefficient ( U L ) and another calculated parameter, absorptance-times-transmittance ( τ α ), as described by Kalogirou [47]:
T c = T a m b + G T τ α U L 1 η r e f
where G T   is the total incident radiation on the tilted surface and the term 1 η r e f is a correction factor that accounts for the energy conversion process. It represents the fraction of absorbed solar radiation that is not converted into electricity and is instead dissipated as heat, thereby increasing ( T C ). The model assumes a U L , which depends on the wind speed, which incorporates the convective cooling effect and reduces the losses in efficiency on windy monsoon days.

3.4. Economic and Performance Assessment Metrics

The system’s performance was evaluated using standard IEC 61724 (https://webstore.iec.ch/en/publication/33622 (accessed on 28 January 2026)) metrics to ensure global comparability.
Yield Factor ( Y F ) is defined as the net AC energy output ( E A C ) divided by the rated DC peak power ( P S T C ) of the installed array. It indicates the effective full-load hours of operation [32].
Y F = E A C k W h P S T C k W p k W h k W p y e a r
Capacity Factor ( C F ) represents the ratio of actual energy generated to the theoretical maximum output if the plant operated at nominal capacity 24/7 [22].
C F = E A C P S T C × 8760 × 100
E A C   is the actual energy produced in one year, i.e., what the plant really generated; P S T C   is the rated (nominal) power at Standard Test Conditions, meaning the plant’s maximum power; 8760 is the total number of hours in a year (24 × 365), meaning the total possible operating time.
The LCOE is a critical metric for industrial feasibility, LCOE represents the average cost per unit of electricity generated over the system’s lifetime. It is calculated utilizing the discount method [47].
L C O E = t = 1 N I t + M t 1 r ) t       t = 1 N E t 1 r ) t
where I t   is the initial investment, M t   is the Operation and Maintenance (O&M) cost, E t   is energy generation in year t , N   is the project lifetime (25 years), and r   is the real discount rate (adjusted for inflation).
The SPBT is the time required to recover capital investment through savings from avoided grid electricity purchases [32].
S P B T = C c a p i t a l Annual   Energy × Grid   Tariff C O & M
To calculate the LCOE and SPBT, specific financial parameters reflecting the volatility of Pakistan’s economic environment were utilized. The key economic inputs are summarized in Table 2.
While standard sensitivity analyses often vary capital expenditure (CAPEX), this work focuses on grid electricity tariff volatility as the primary sensitivity variable. Since the system is already commissioned, the capital cost constitutes a fixed sunk cost and is not subject to future market fluctuation. In contrast, the grid tariff represents the active economic variable governing financial viability under Pakistan’s current macroeconomic conditions and energy pricing instability.

4. Results and Discussion

4.1. Meteorological Resource Assessment

The first phase of the analysis focused on characterizing the solar resource availability and climatic constraints of the Daska region. The analyzed processed meteorological data shows a high potential but difficult environment for PV generation.
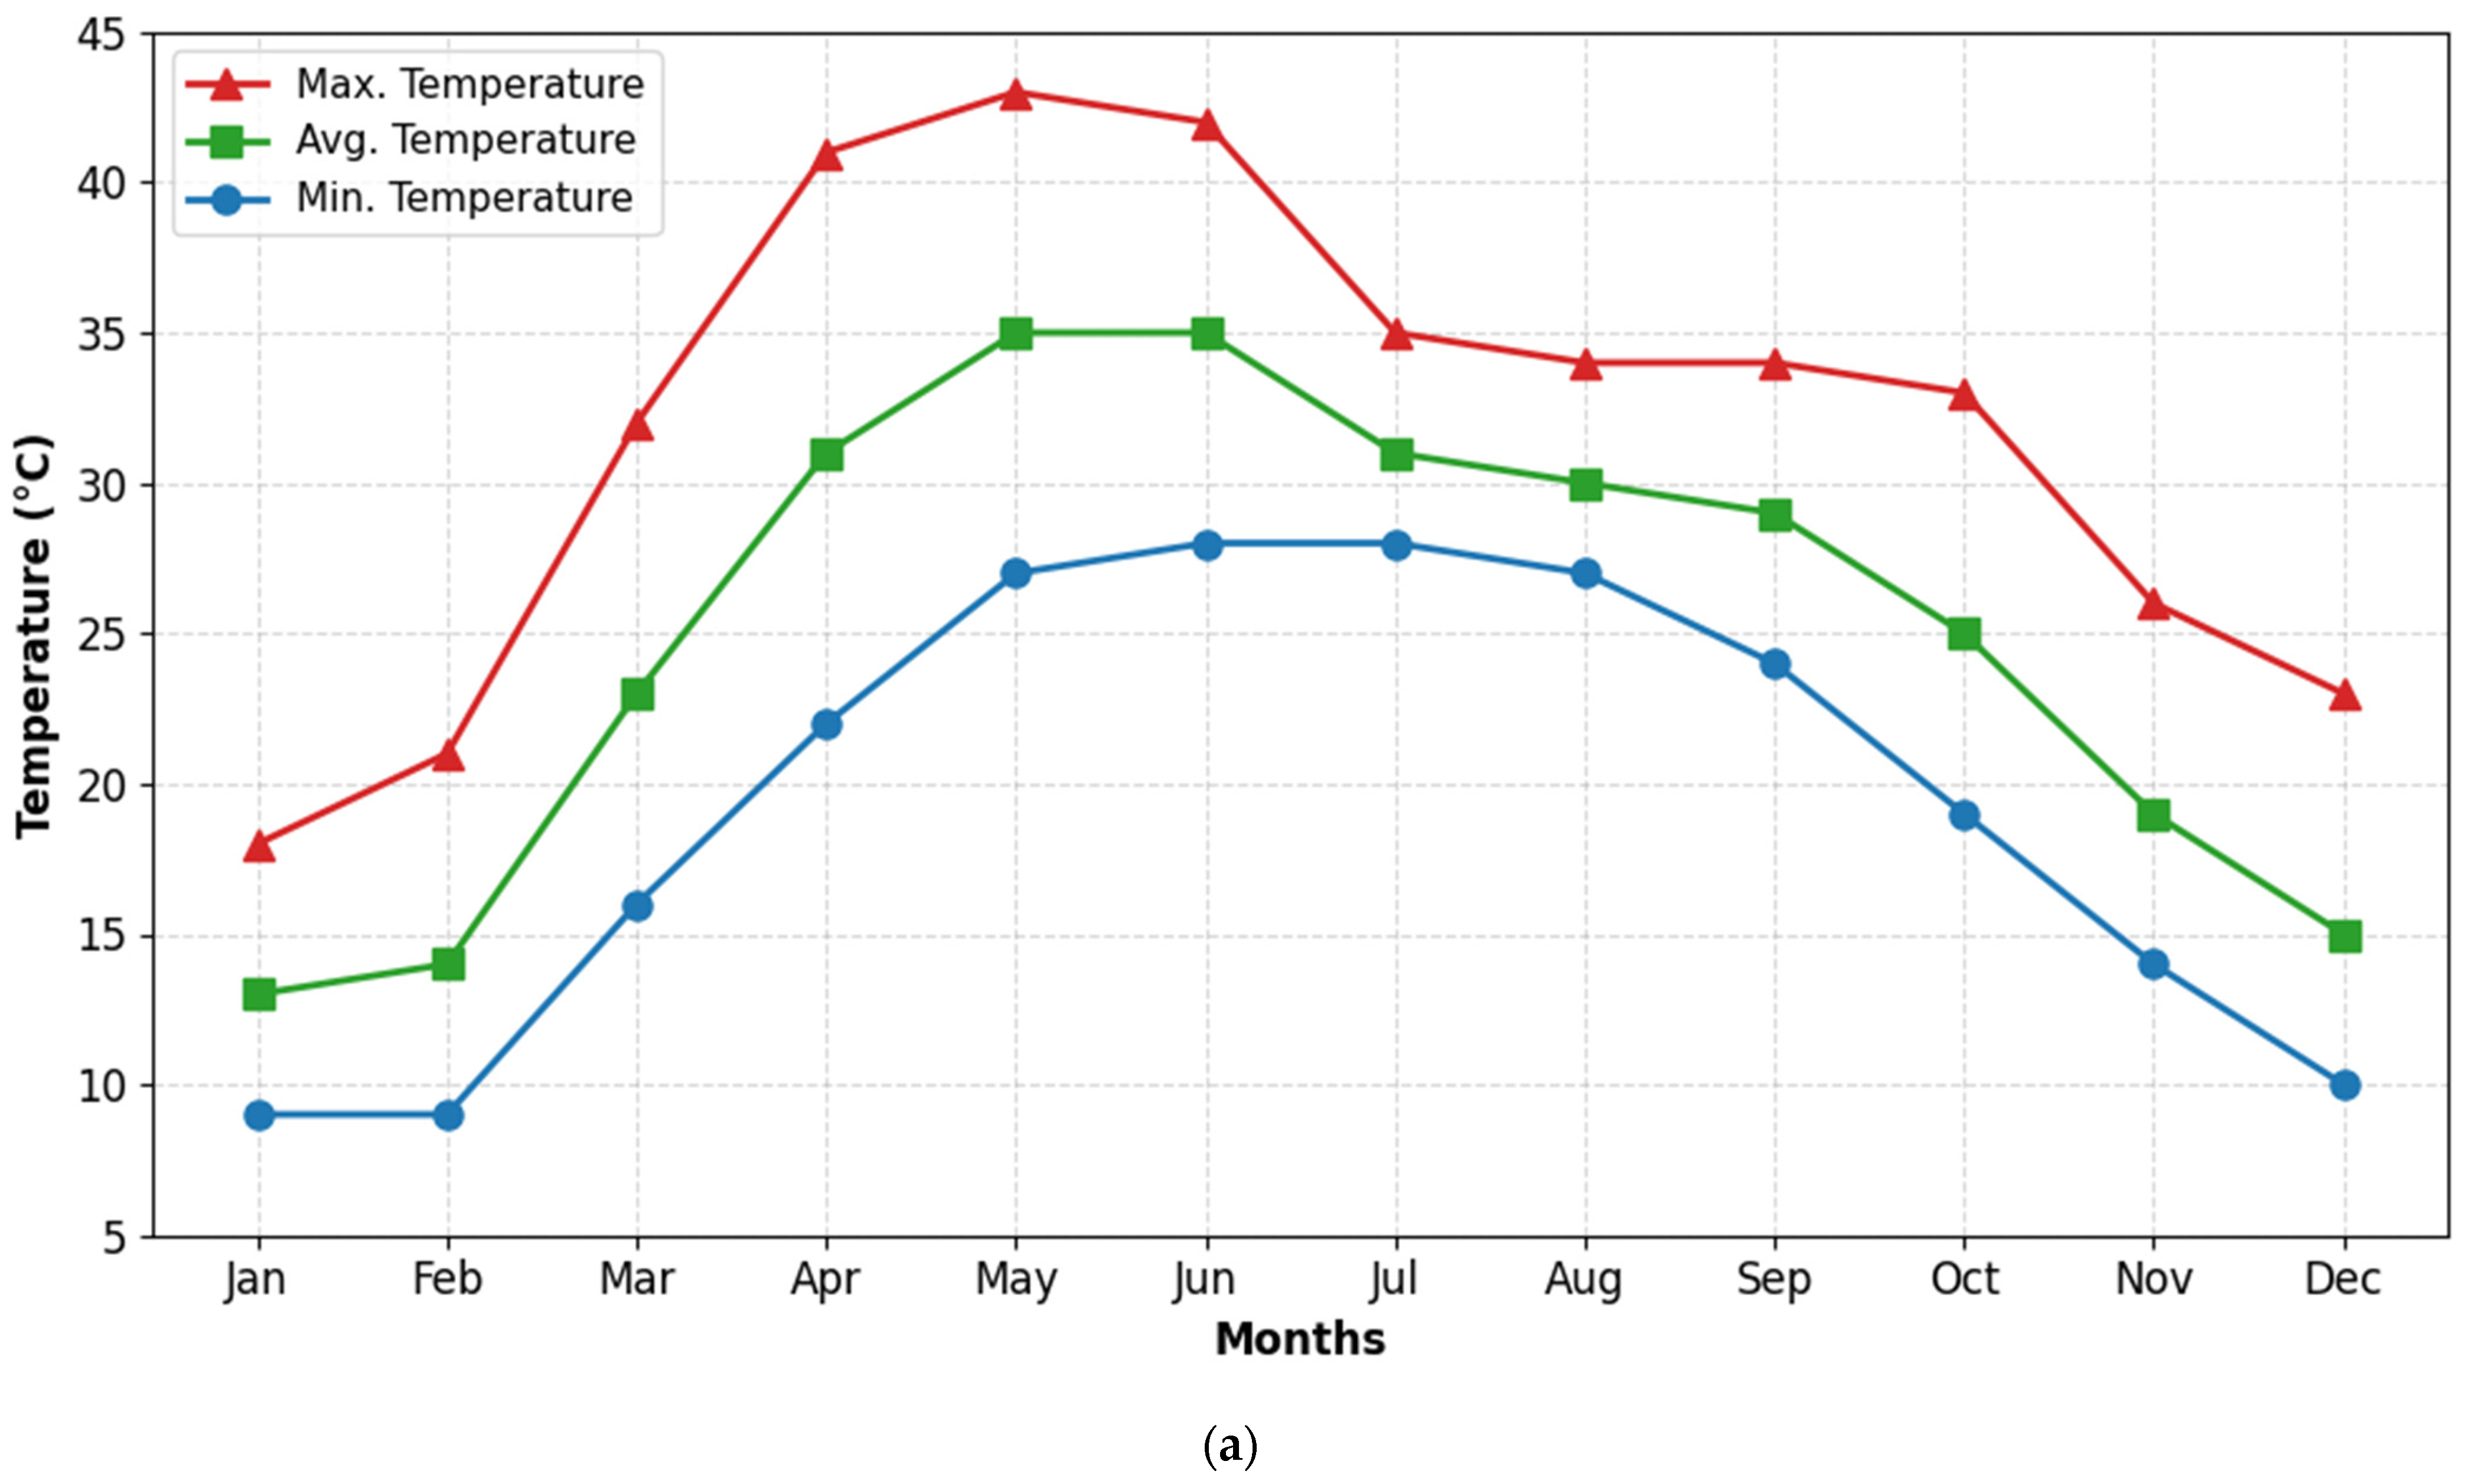
The finding that the system operates under extreme thermal stress for a considerable portion of the year is confirmed by the ambient temperature profile in Figure 7a. From May to September, daytime ambient temperature is consistently between 35 °C and 43 °C. When combined with solar heat gain, the module cell temperature ( T c ) can rise over 65 °C. Given the power temperature coefficient of −41%/°C for the installed polycrystalline modules, the thermal elevation results in an instantaneous power derating of approximately 16–20% compared to STC ratings. In this case, this thermal loss is a major factor causing the difference between the theoretical potential and the actual yield.
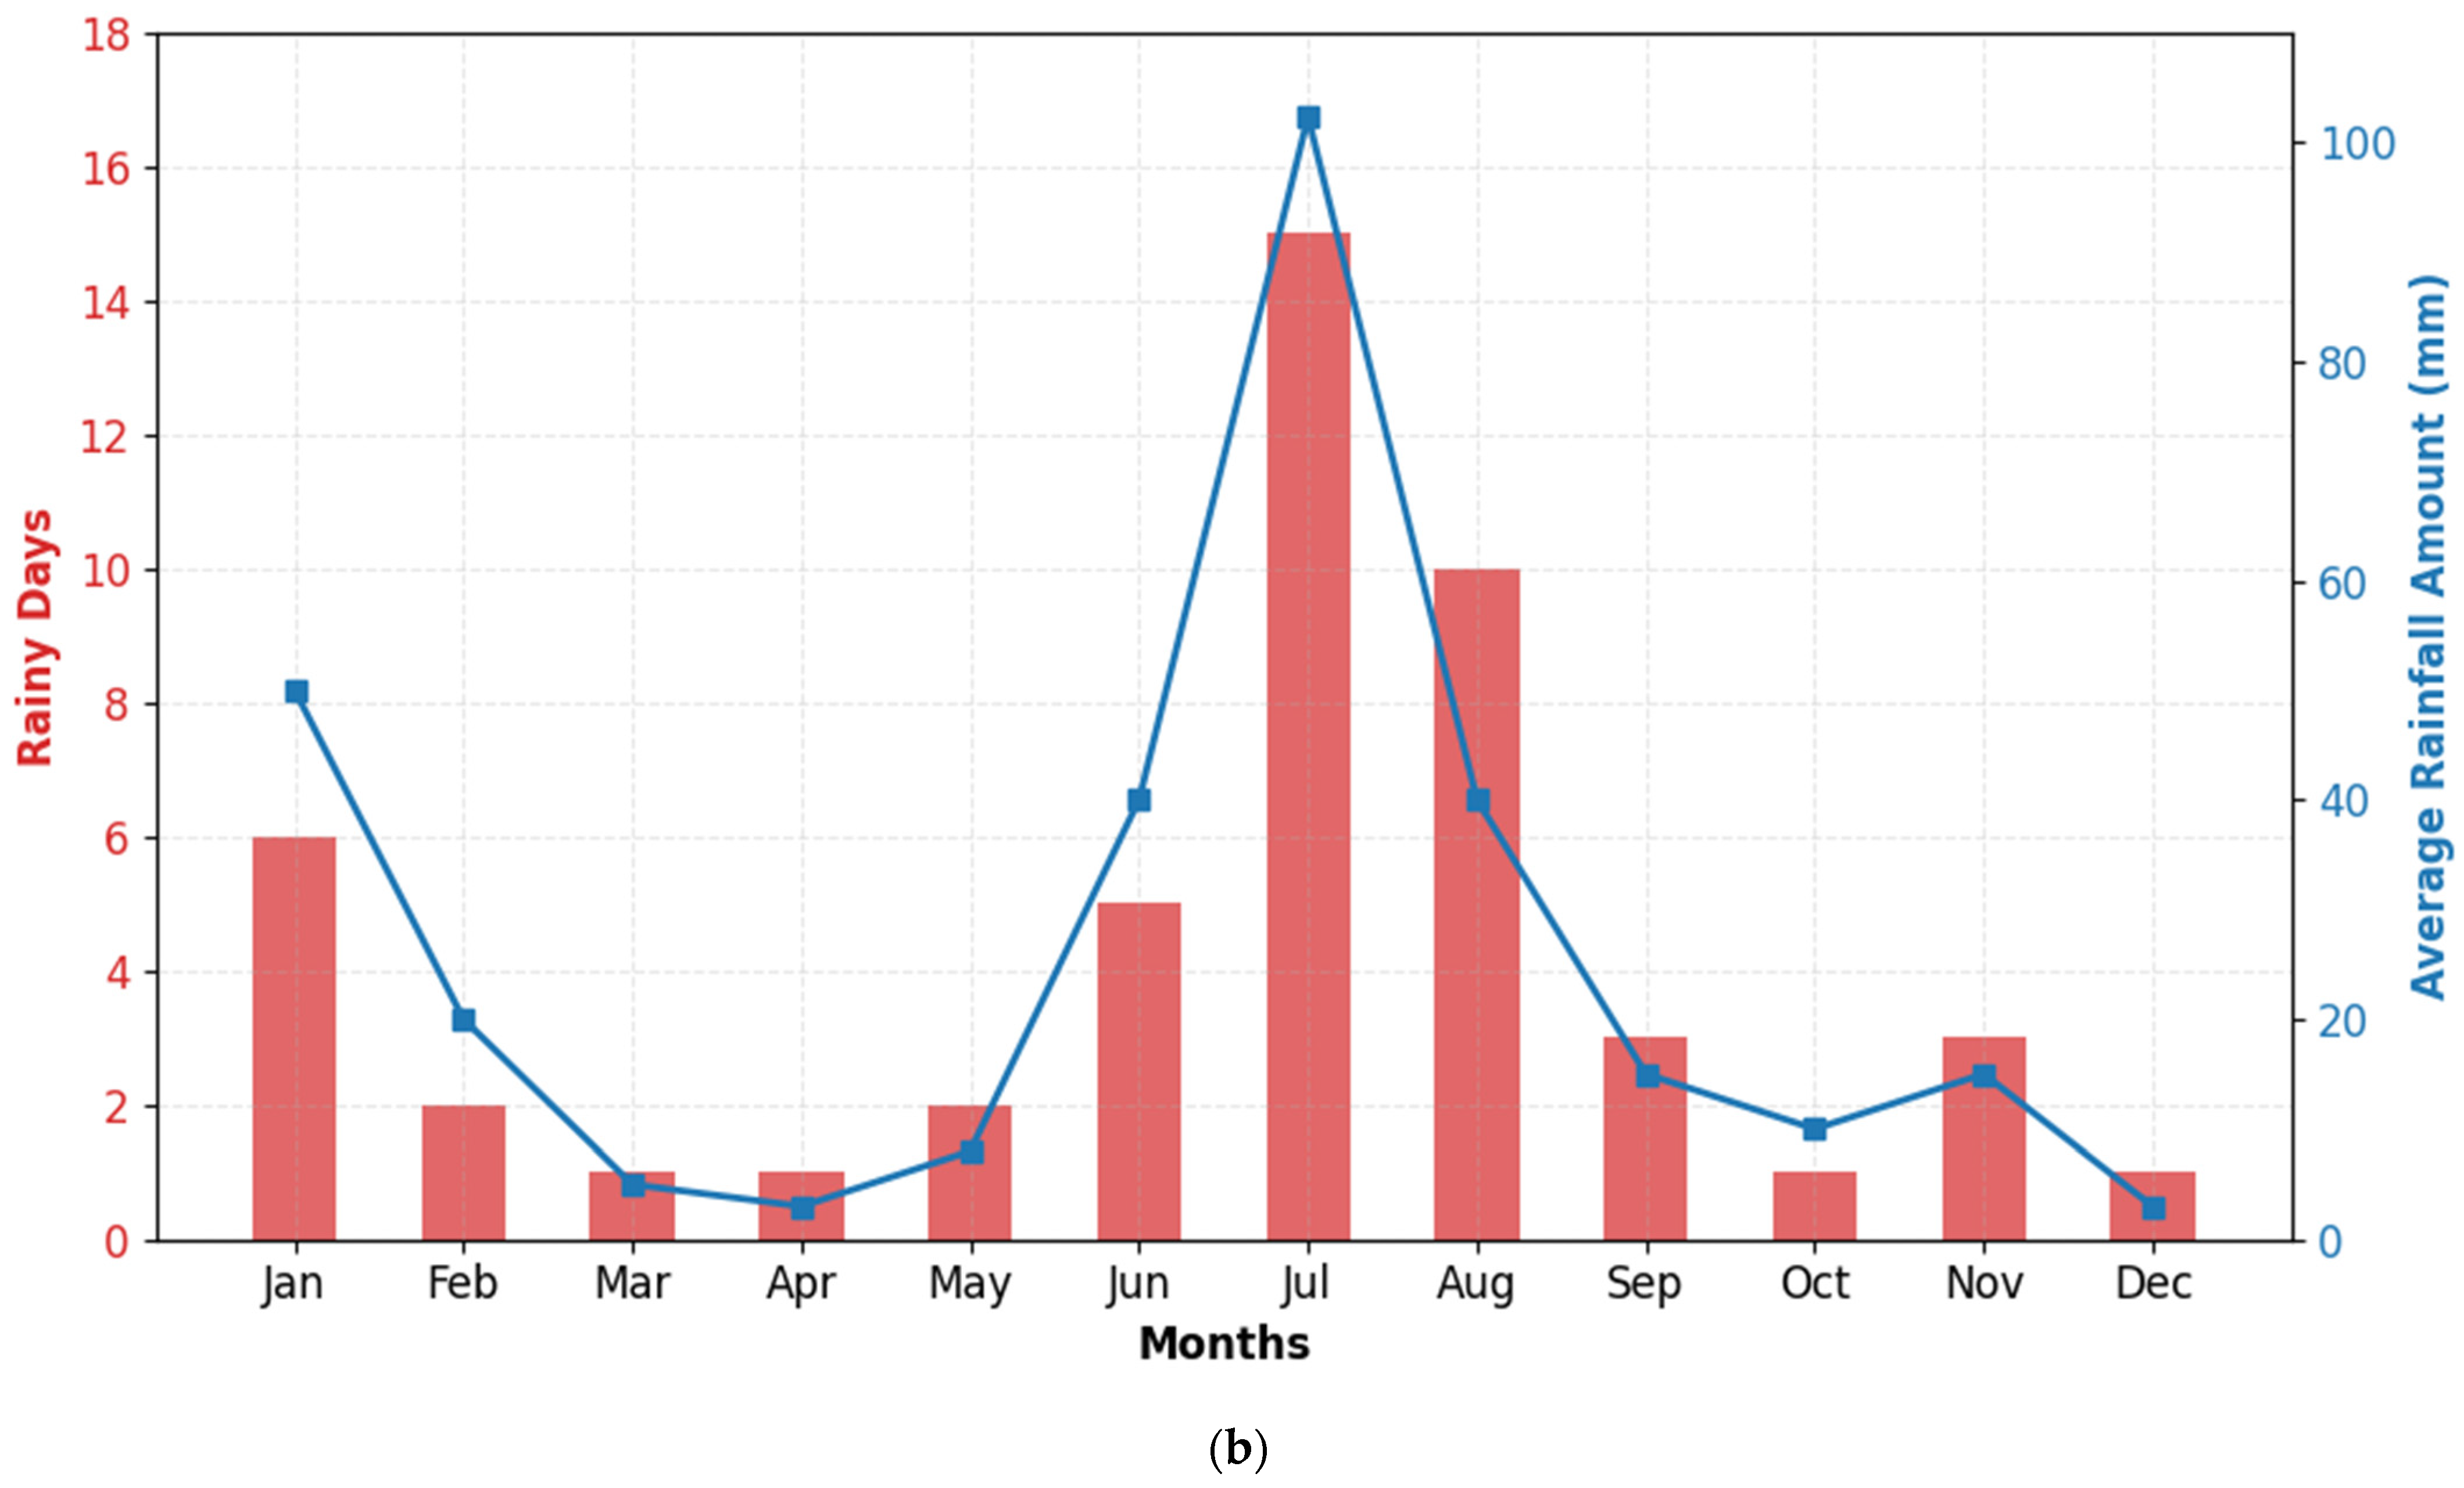
A critical climatic feature (Monsoon Anomaly) that is identified is the intense monsoon season (July–August). The rainfall analysis shown in Figure 7b shows a direct correlation with the periods of lowest irradiance. In July 2022 alone there was 102.3 mm of rain and only 8 clear sunny days experienced on the site. This prolonged amount of cloud cover not only restricts the direct portion of solar radiation but also changes the spectral distribution at that end of the spectrum to the blue region (diffuse radiation), which is less well converted by standard silicon cells [34].
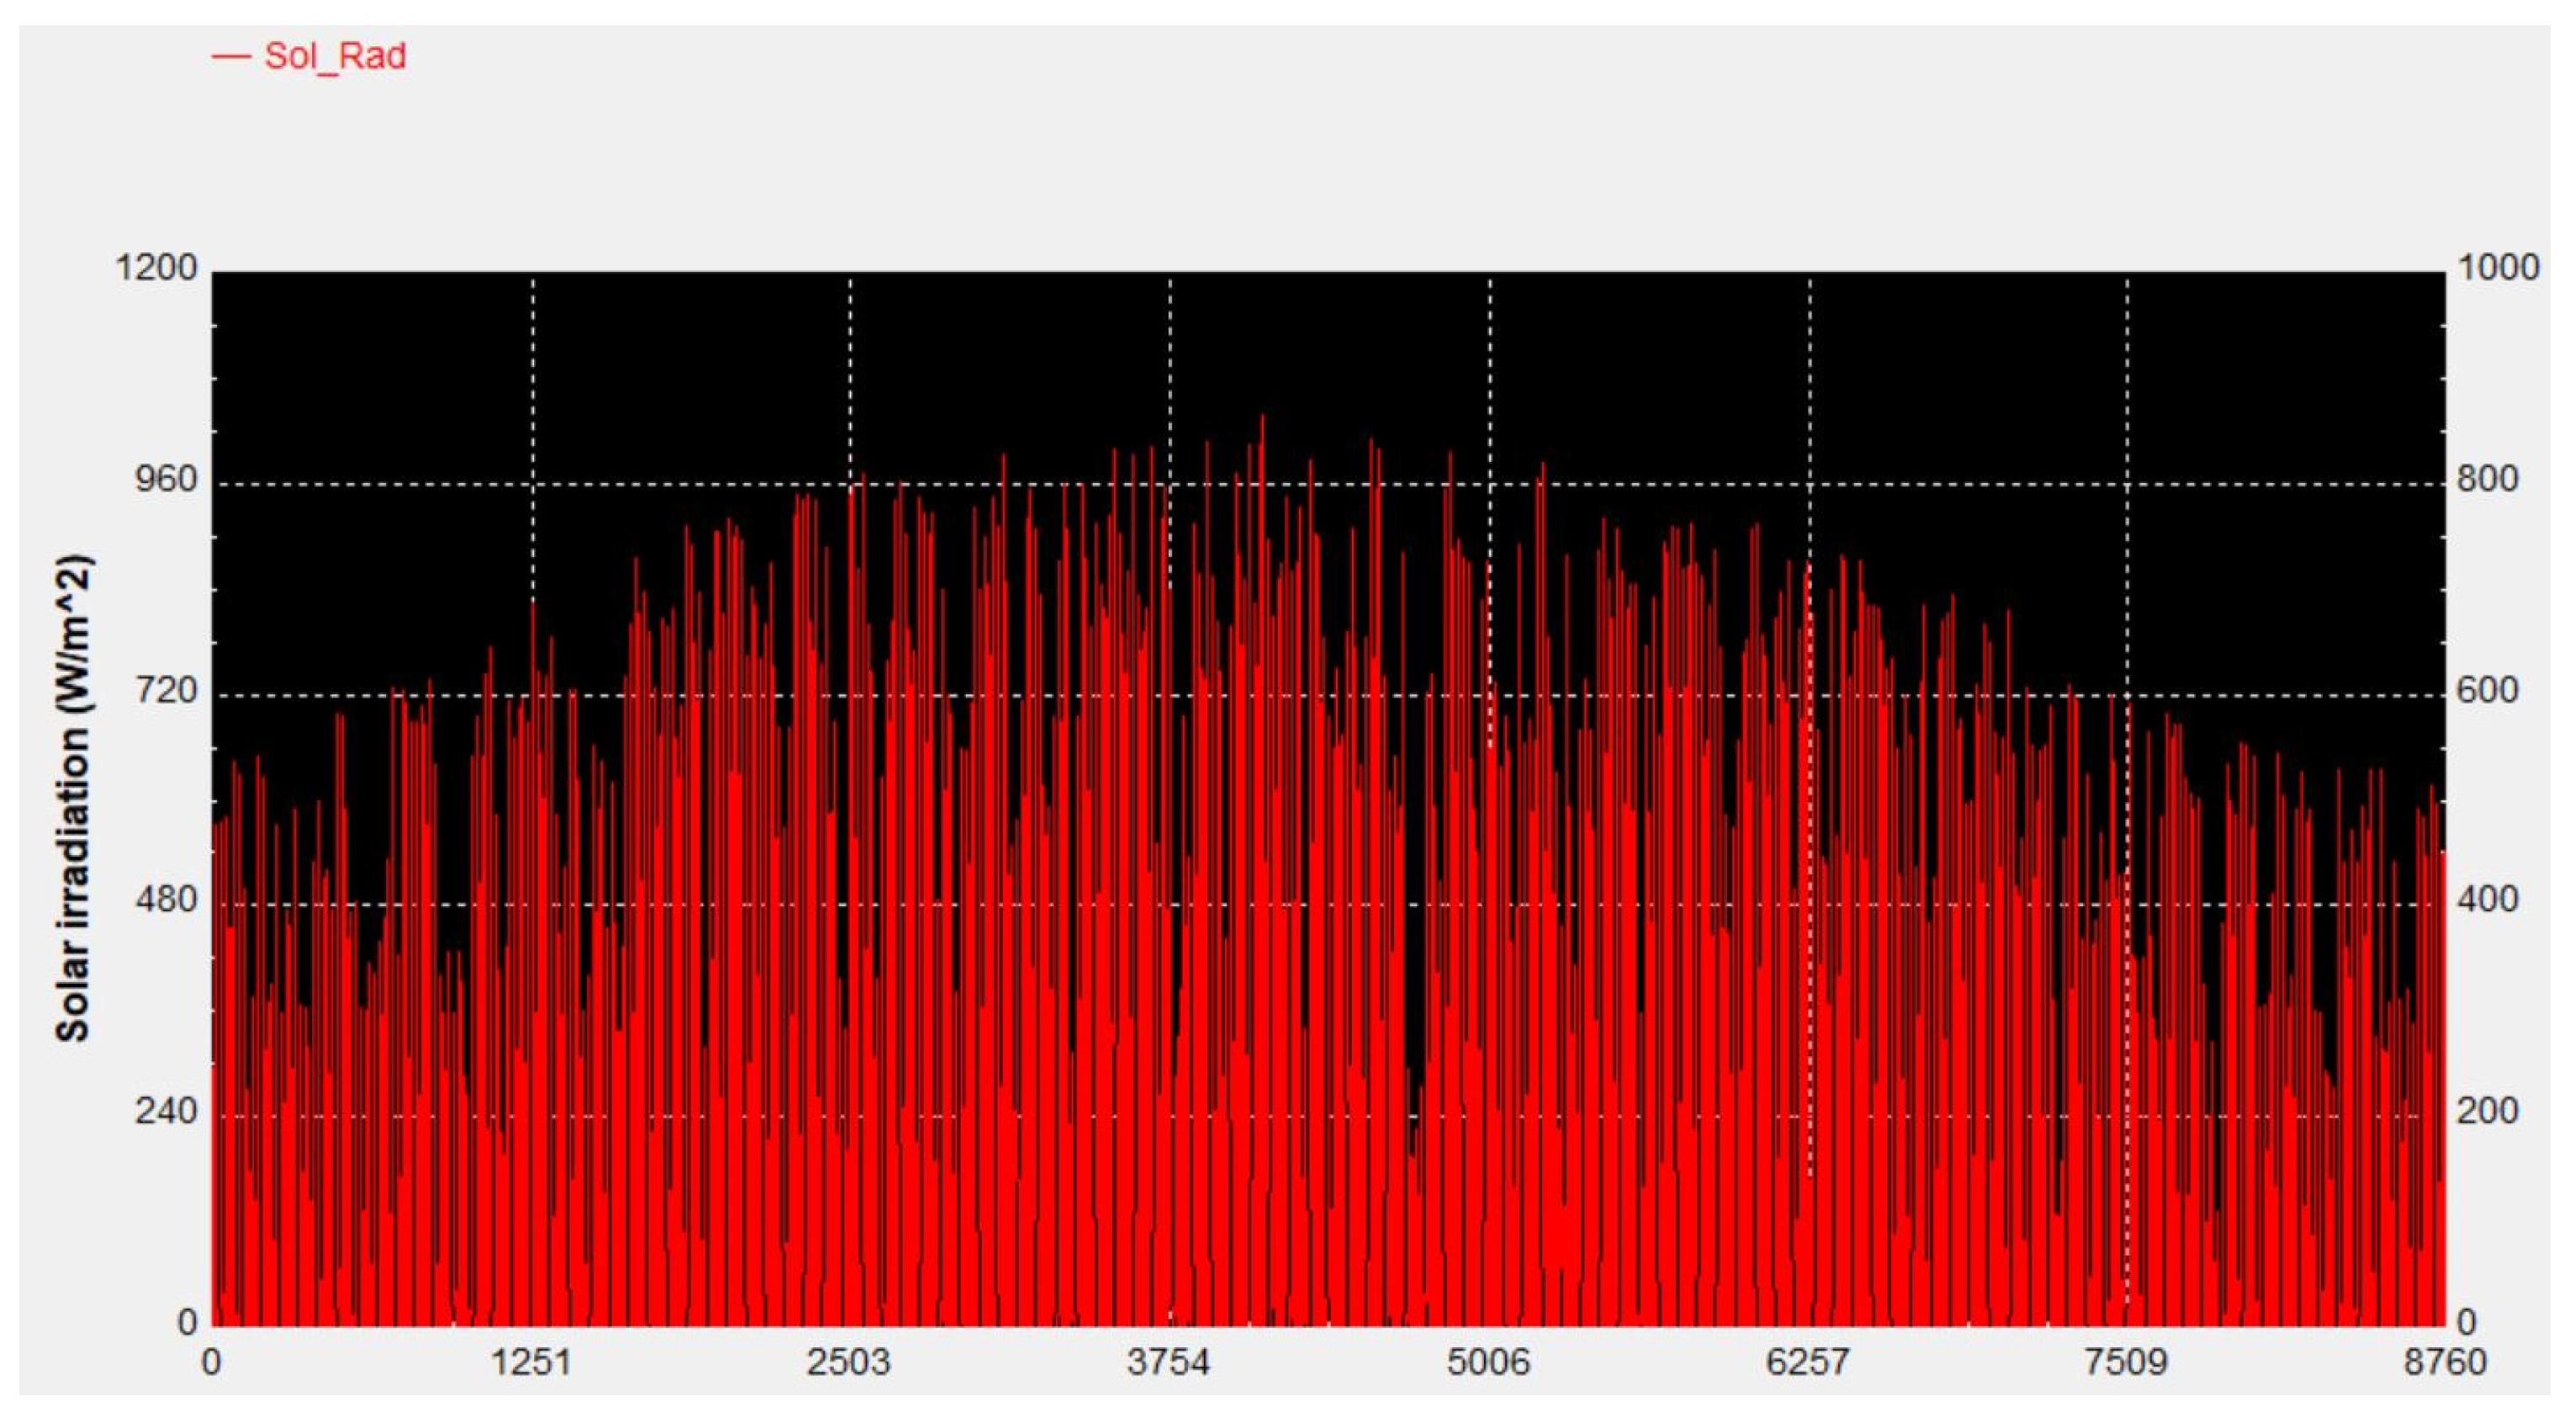
The solar irradiance profile is presented in Figure 8. It shows great diurnal and seasonal changes. The insolation levels of the region are high in pre-monsoon summer (April–June) and the peak irradiance often exceeds 950   W / m 2 . However, the data also reveals the intermittency caused by cloud hospitalization, especially in the afternoon hours, requiring the rapid response time of the MPPT algorithm to avoid generation dropouts.
The TRNSYS simulation utilized standard TMY2 meteorological files to represent the long-term typical generation potential of the site, serving as a baseline for investment-grade feasibility. However, it is critical to note that the operational monitoring period coincided with climatic deviations characteristic of the intensifying South Asian monsoon. Specifically, the observed rainfall in July 2022 (102.3 mm) significantly exceeded the historical averages embedded in the TMY dataset, leading to a distinct disparity in irradiance and temperature distributions.
While the TMY dataset models a smoothed diurnal profile, the measured data exhibited high-frequency fluctuations (intermittency) due to rapid cloud passage and lower ambient temperatures during precipitation events. Regarding the systematic influence on the analysis, this deviation implies that the simulation results are conservative. Since MPPT algorithms provide the greatest efficiency gains during periods of partial shading and rapid irradiance changes, the actual operational benefit of MPPT under these volatile monsoon conditions is likely higher than predicted by the stable TMY baseline. Therefore, the identified performance gap primarily reflects the stochasticity of the Rice Belt microclimate rather than a deficiency in the system’s electrical topology.
Consequently, the TMY-based simulation predicts average year irradiance, whereas the actual system operated under wet year conditions. This systematic deviation suggests that a portion of the identified performance gap is not a system failure, but a reflection of the increasing stochasticity of monsoon patterns in the Rice Belt, which standard TMY files may underrepresent. To address the inter-annual climatic variability, the work compares the site’s historical baseline against the specific operational conditions. While the TMY dataset represents the averaged typical climate of the last decade, the operational year exhibited a distinct Monsoon Anomaly, particularly in July, where rainfall intensity was 15% higher than the historical norm (Figure 7b).

4.2. Energy Yield Analysis: Simulation vs. Reality

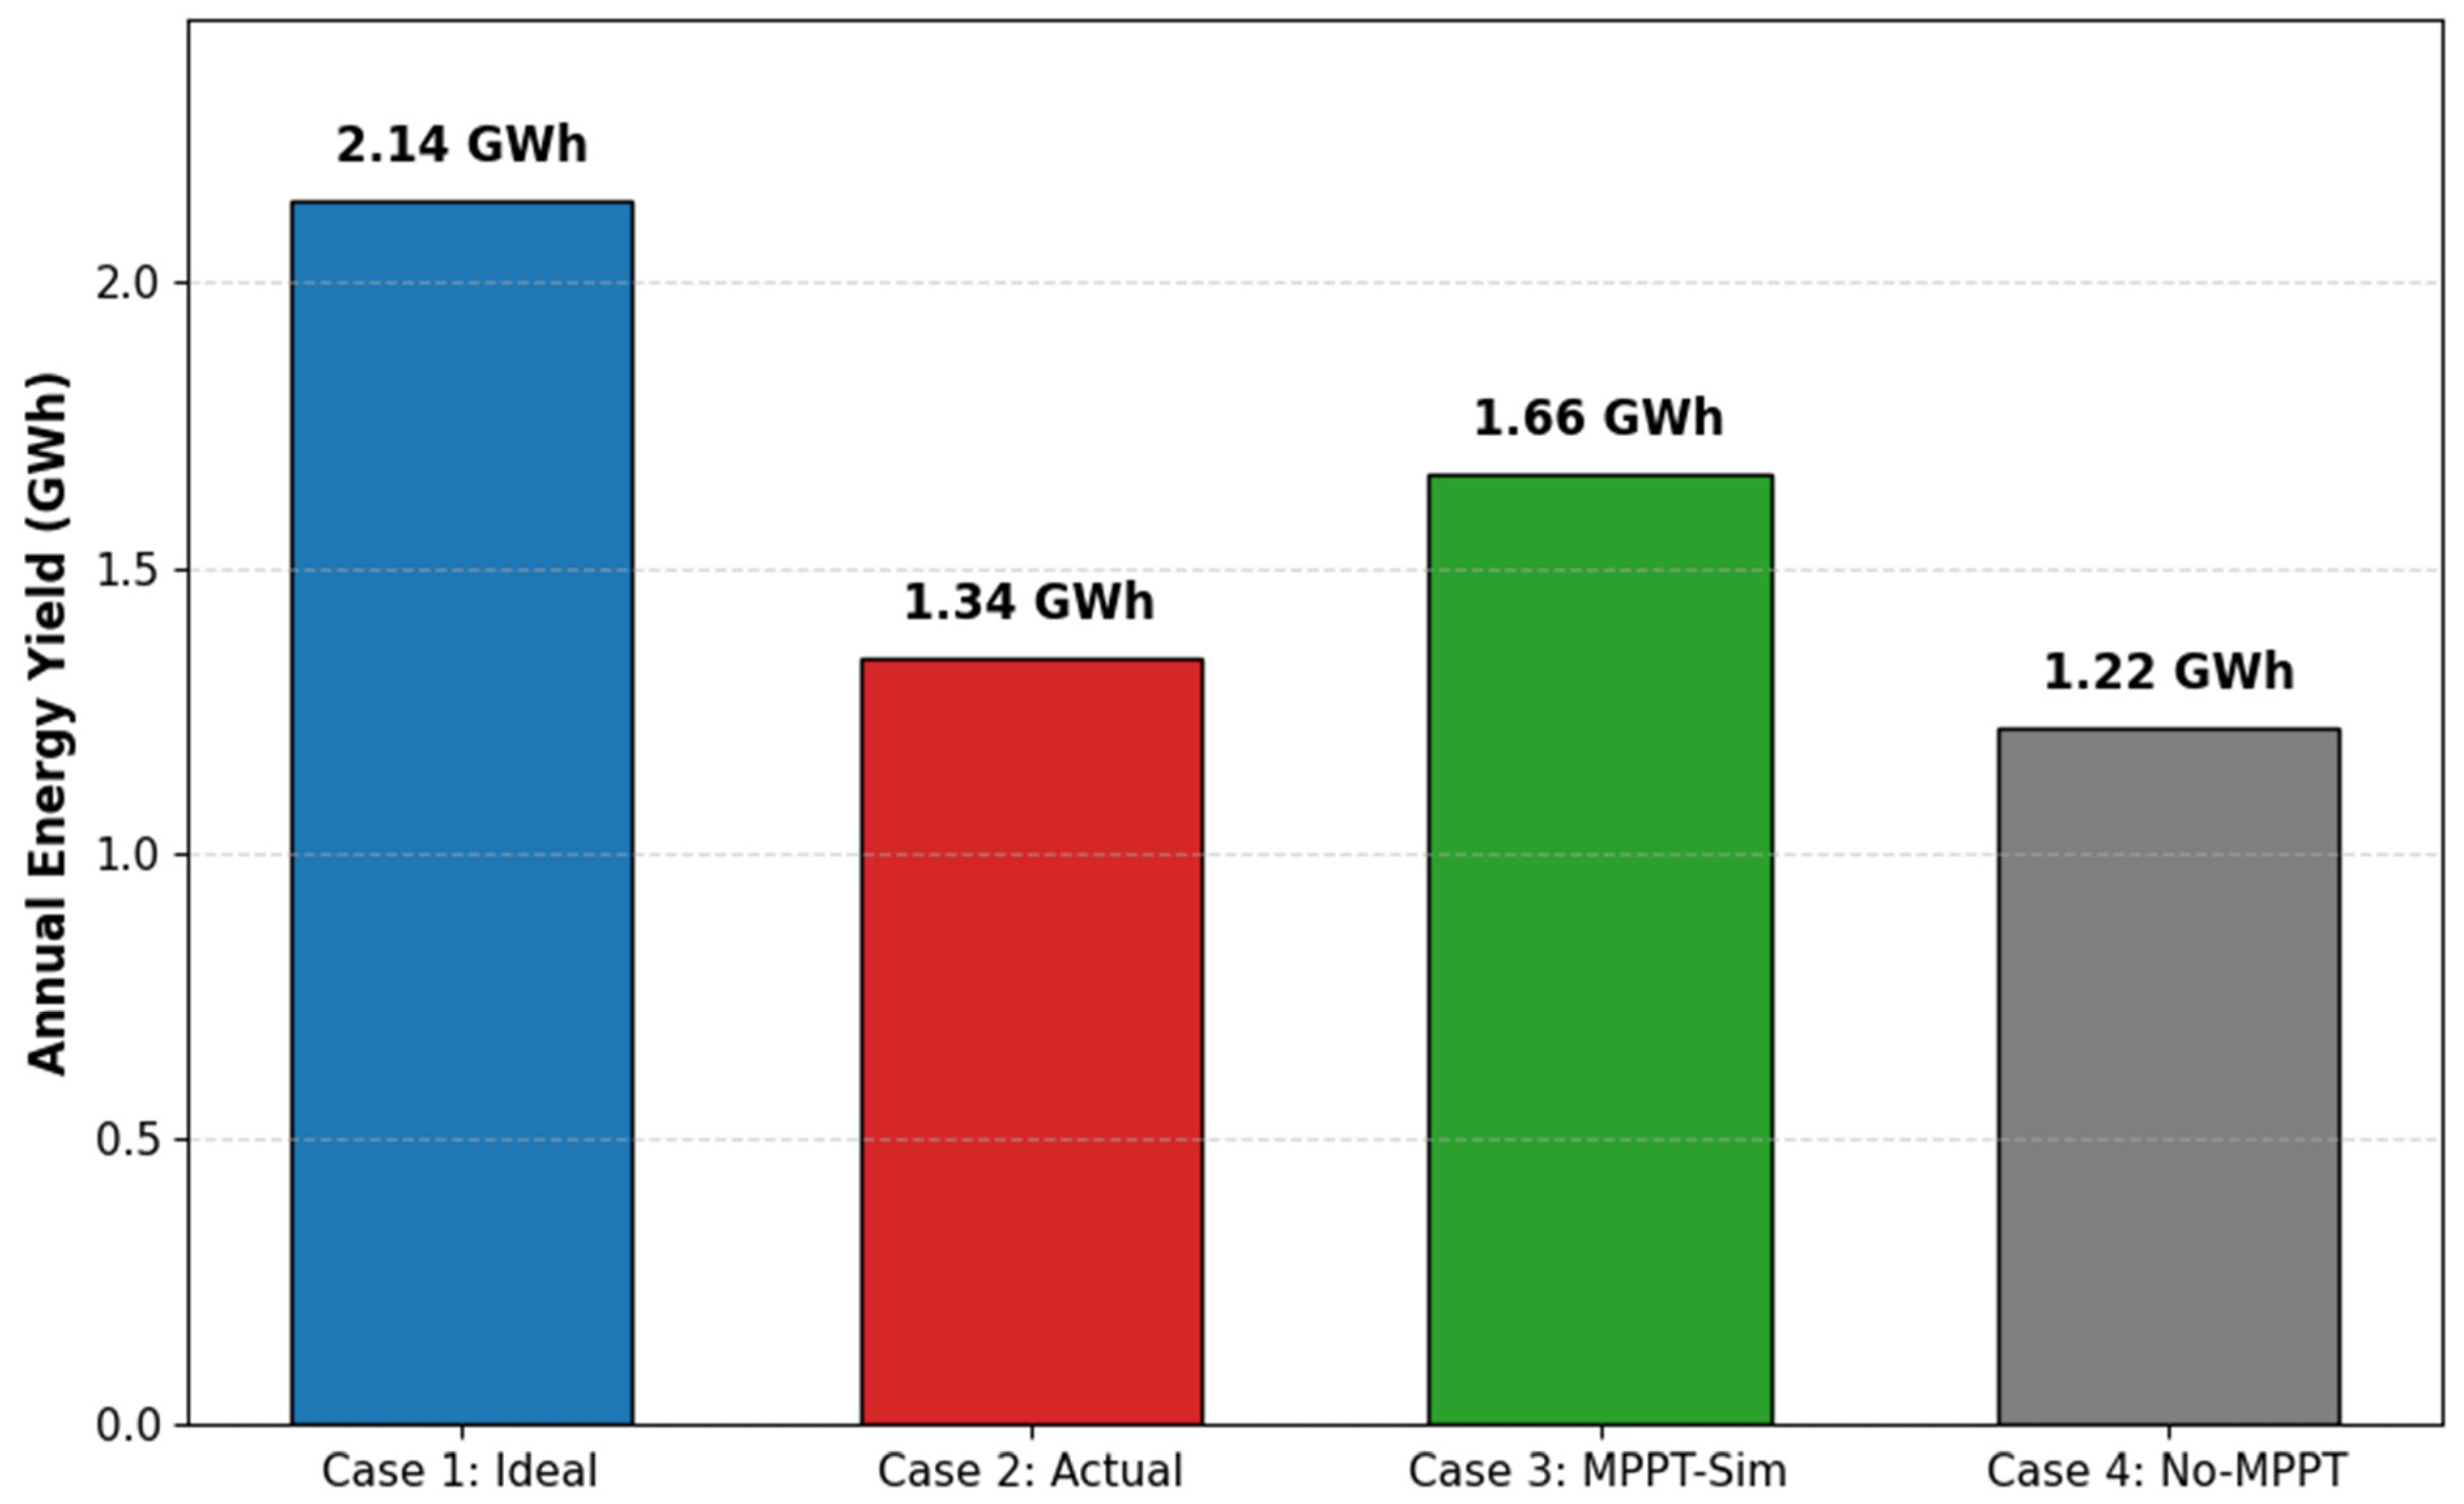
A detailed analysis of the annual energy generation has been done to assess the performance of the PV system under different operating and simulated conditions. Four different cases were considered for this comparison. Case 1 is the theoretical ideal scenario, and it assumes perfect operation without any losses for an estimation of 2,141,321 kWh/year. This case is used as the benchmark and has shown the maximum generation of potential energy that can be produced under the ideal conditions.
Case 2 includes the actual operational data built from actual recorded data from the system with an annual energy production value of 1,342,624 kWh/year. This is 37% less than the theoretical ideal, pointing out the real-world effects reducing the performance of these systems, from thermal losses, shading, the inefficiencies of the inverters and other operational constraints.
Case 3 is the result of a TRNSYS simulation with MPPT present, which gave an estimated result of 1,664,736 kWh/year. Compared to the ideal scenario, this is a reduction of 22%, but it is about 24% more than actual operation. This shows the improvement that is possible to achieve through the optimization of MPPT; it almost eradicates some of the performance gaps that are caused by real-world inefficiencies.
Finally, Case 4, which is a TRNSYS simulation without MPPT, resulted in an annual energy output of 1,220,593 kWh/year, that is a 43% reduction compared to the theoretical ideal and is about 9% smaller than the real operational data. This clearly reveals the great impact that MPPT has on maximizing the energy captured along with other environmental and system constraints, which nevertheless limit the performance even in simulations.
The comparative results visualized in Figure 9 provide a clear representation of the differences among the four scenarios. The analysis highlights that while simulations with MPPT significantly enhance predicted energy yield, there remains a noticeable gap between theoretical potential and actual operational performance. Quantifying these differences allows for a better understanding of system limitations and provides guidance for future design improvements and operational strategies.

4.2.1. The Performance Gap

The resulting actual system (Case 2) produced just 1342 MWh on average and was markedly lower than the Ideal Case (2141 MWh) and the MPPT-assigned simulation (1664 MWh). This deviation of 19.3% between the MPPT Simulation and Actual Data is an indication of the performance gap. This gap has been attributed to loss mechanisms in the real world that are often underestimated in standard simulations.
Deconvolution of Yield Losses: Soiling vs. Grid Curtailment
While the simulation identified a net performance gap of 19.3%, establishing the precise causality requires deconvoluting the contributions of soiling and grid instability. Although real-time (RT) dust sensors were not installed, the specific location in the Rice Belt of Punjab allows estimation based on regional literature.
Soiling Contribution: Standard simulation models typically assume a global soiling loss of 1.5–2% [22]. However, empirical studies in the Punjab agricultural zone indicate significantly higher degradation rates. Ullah et al. reported that soiling losses in Lahore can range from 13.5% to 40% depending on tilt angle and exposure duration [52]. Furthermore, daily degradation rates during dry spells have been measured at 0.8% per day for 30° tilted panels [24]. Given the local harvesting seasons (May–June) and winter smog, a conservative soiling loss of 10–12% is applied for the performance gap analysis.
Grid Curtailment: The remaining discrepancy is attributed to grid availability and voltage instability. The system is connected to a rural 11 kV feeder (Rajoke) prone to load shedding and voltage fluctuations. During these events, the grid-tied inverters (Huawei SUN2000, Huawei Technologies Co., Ltd., Shenzhen, China) enter protection mode or curtail output to match the limited load, resulting in unregistered generation potential, confirming that a significant portion of the yield loss is infrastructural rather than meteorological.
Wiring and Mismatch Losses: The simulation assumes idealized cabling. In actual scenarios, additional yield reductions arise from DC-side string losses (ohmic losses), AC home-run losses, and mismatch losses resulting from unequal aging of the 2982 modules.

4.2.2. Seasonal Volatility and Inter-Annual Variability

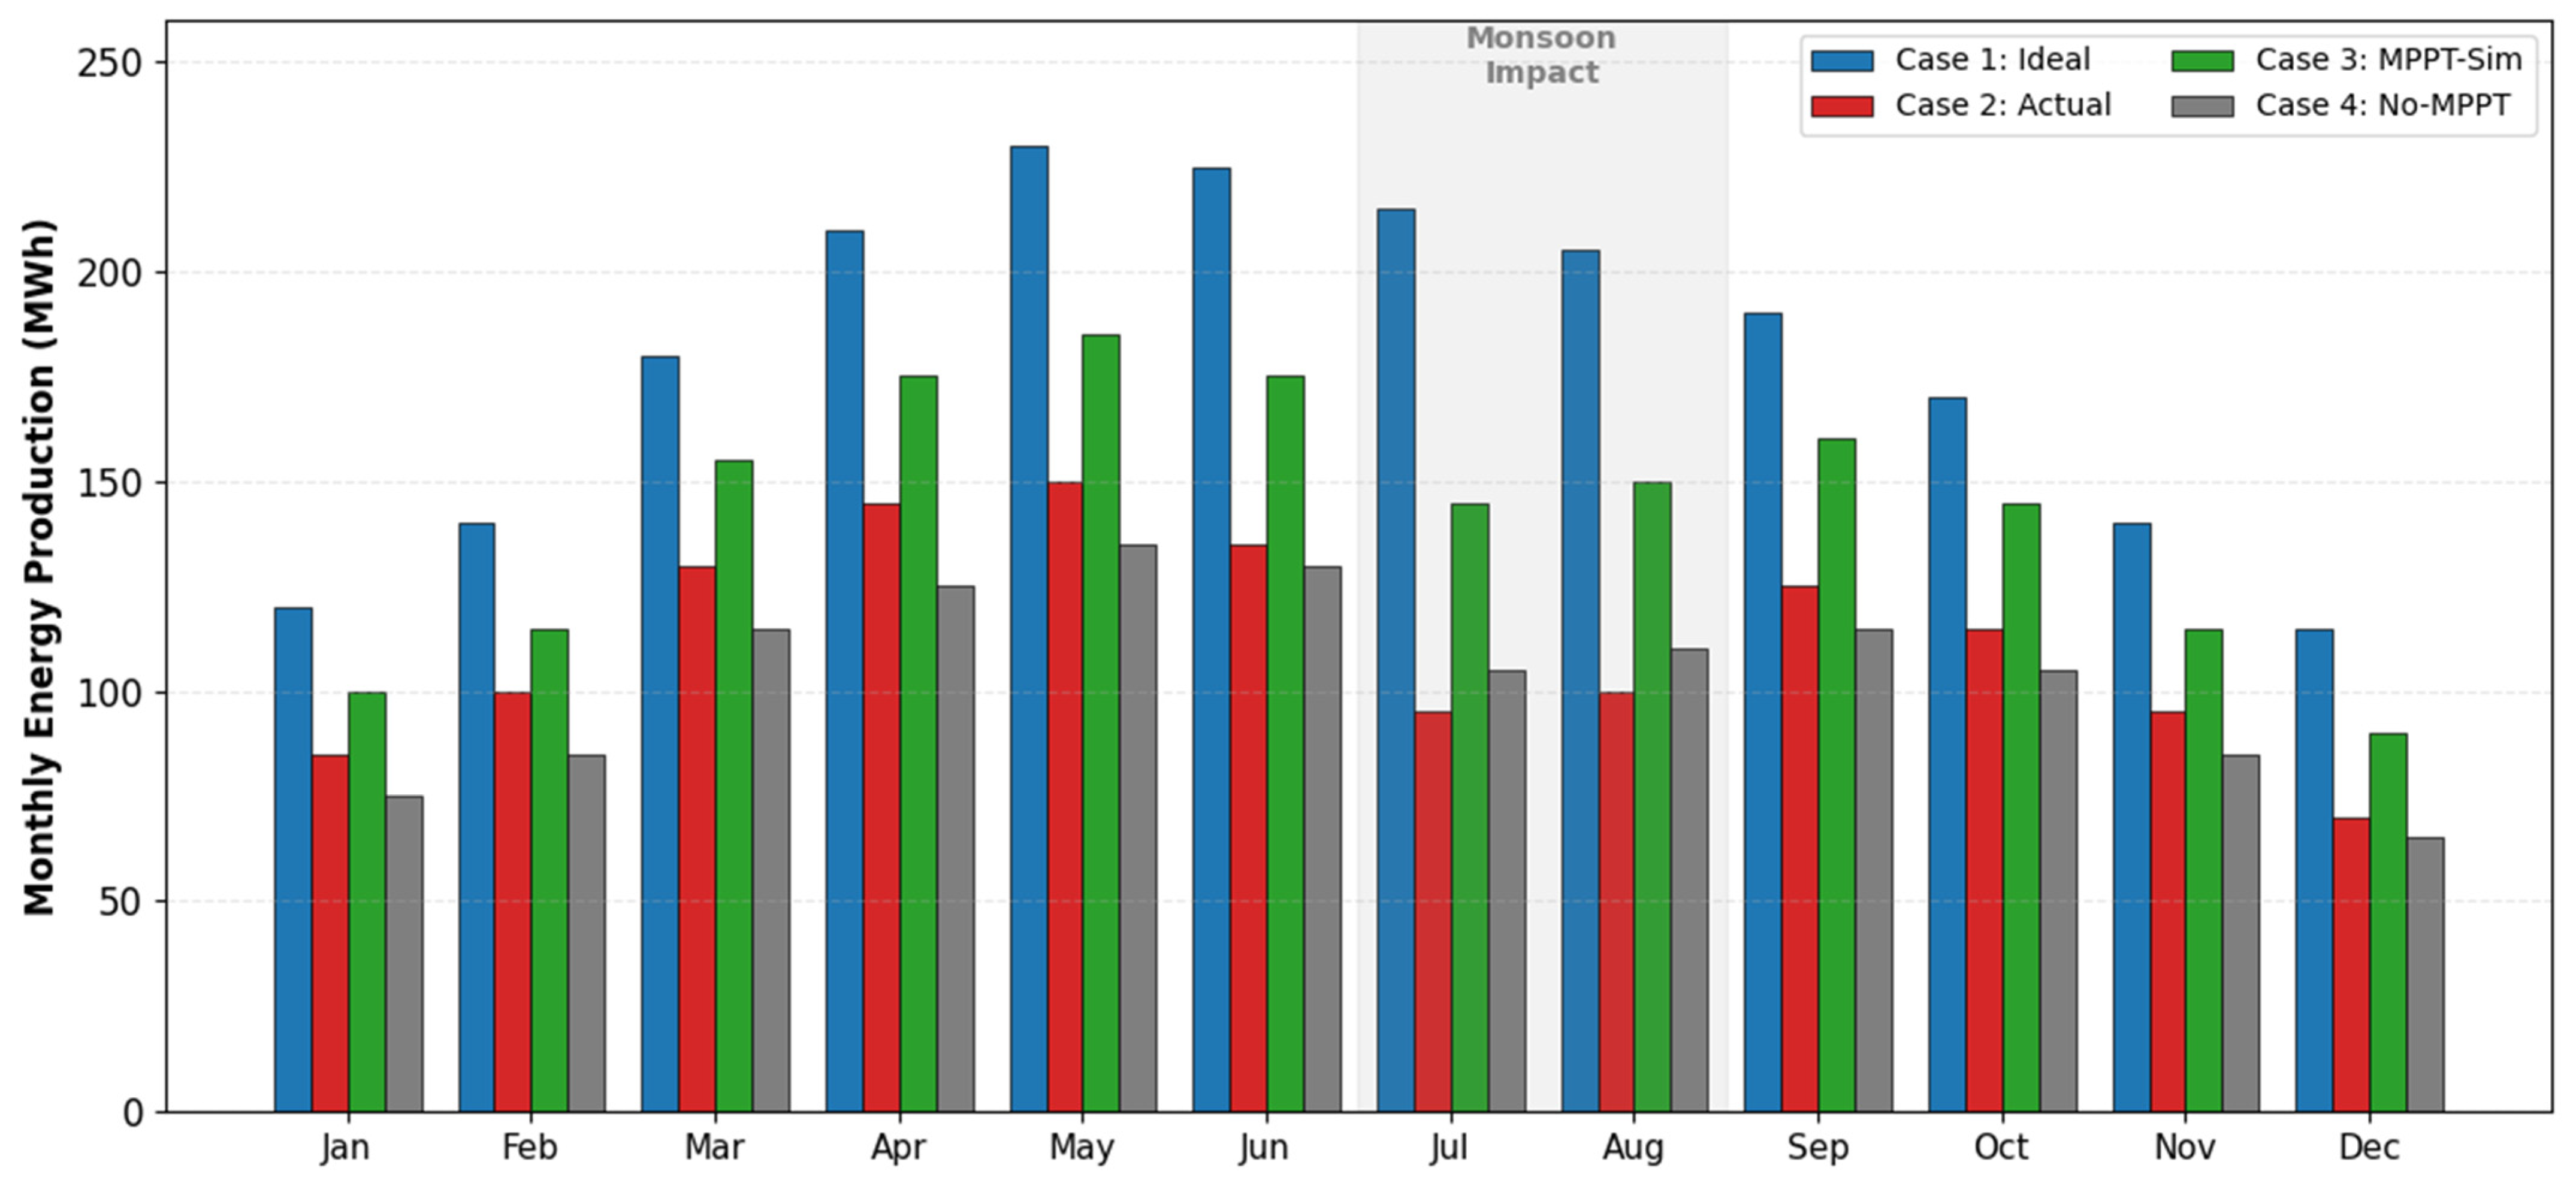
The monthly generation profile presented in Figure 10 emphasizes the impact of seasonal weather patterns. While generation was at its peak in May (142.2 MWh), in July 2022, generation fell to 89.3 MWh, an immense 37% decline. This dip is far deeper than that predicted by TMY-based simulations, and again the unpredictability of the monsoon. The variability is confirmed by the fact that the Standard Deviation ( S D   =   28,160   k W h ) of generation during the month of July over a three-year period is high, showing that monsoon intensity is the one of the biggest variables impacting financial predictability.
However, to determine if this seasonal volatility compromises long-term reliability, the inter-annual variability was analyzed across three complete years of operation. The total annual AC energy generation was recorded as 1343.46 MWh (Year 1), 1409.11 MWh (Year 2), and 1275.30 MWh (Year 3). Despite the extreme monthly fluctuations observed during the monsoon, the aggregate year-to-year variation remained remarkably low, with a coefficient of variation (CV) of just 4.98%. This indicates a distinct dichotomy in system performance; while the seasonal profile is highly volatile due to local weather events, the annual energy yield remains stable and predictable, aligning well with long-term financial projections.

4.2.3. Statistical Validation of the TRNSYS Model

To quantify the accuracy of the simulation against the operational data, statistical metrics were calculated based on the monthly energy generation profiles (Figure 10). The validation compares the MPPT-enabled simulation (Case 3) against the Actual Field Data (Case 2). The Coefficient of Determination ( R 2 ) was calculated to be 0.84, indicating a strong correlation between the simulated seasonal trends and the actual system performance. This confirms that the TRNSYS model accurately captures the climatic dynamics of the site. However, a quantitative deviation exists, represented by a normalized Root Mean Square Error (nRMSE) of 26.8%. These metrics statistically confirm the performance gap identified in this study. The positive correlation R 2 > 0.8   validates the physics of the model, while the high nRMSE quantifies the magnitude of yield losses attributable to external factors that do not present in the simulation, specifically the heavy agricultural soiling of the Rice Belt and frequent grid curtailment events during the monitoring period.
Ideally, PV simulation models typically achieve an nRMSE below 10% in stable, clean environments. However, the observed nRMSE of 26.8% and performance gap of 19.3% in this study are deliberate indicators of operational anomalies rather than modeling inaccuracies. The System was designed to simulate the theoretical maximum potential of the site (clean modules, 100% grid availability). Consequently, the deviation between the model and the measured data effectively quantifies the external losses (Grid Curtailment and Soiling Impact).

4.3. Technical Impact of MPPT

A major contribution to this work is the quantification of MPPT efficiency in a subtropical climate. Comparing the results of the simulation, the system with MPPT (Case 3) generated 1.66 GWh and the system without MPPT (Case 4) generated 1.22 GWh. This is a significant rise of 27% in operational advantage over the fixed voltage case.
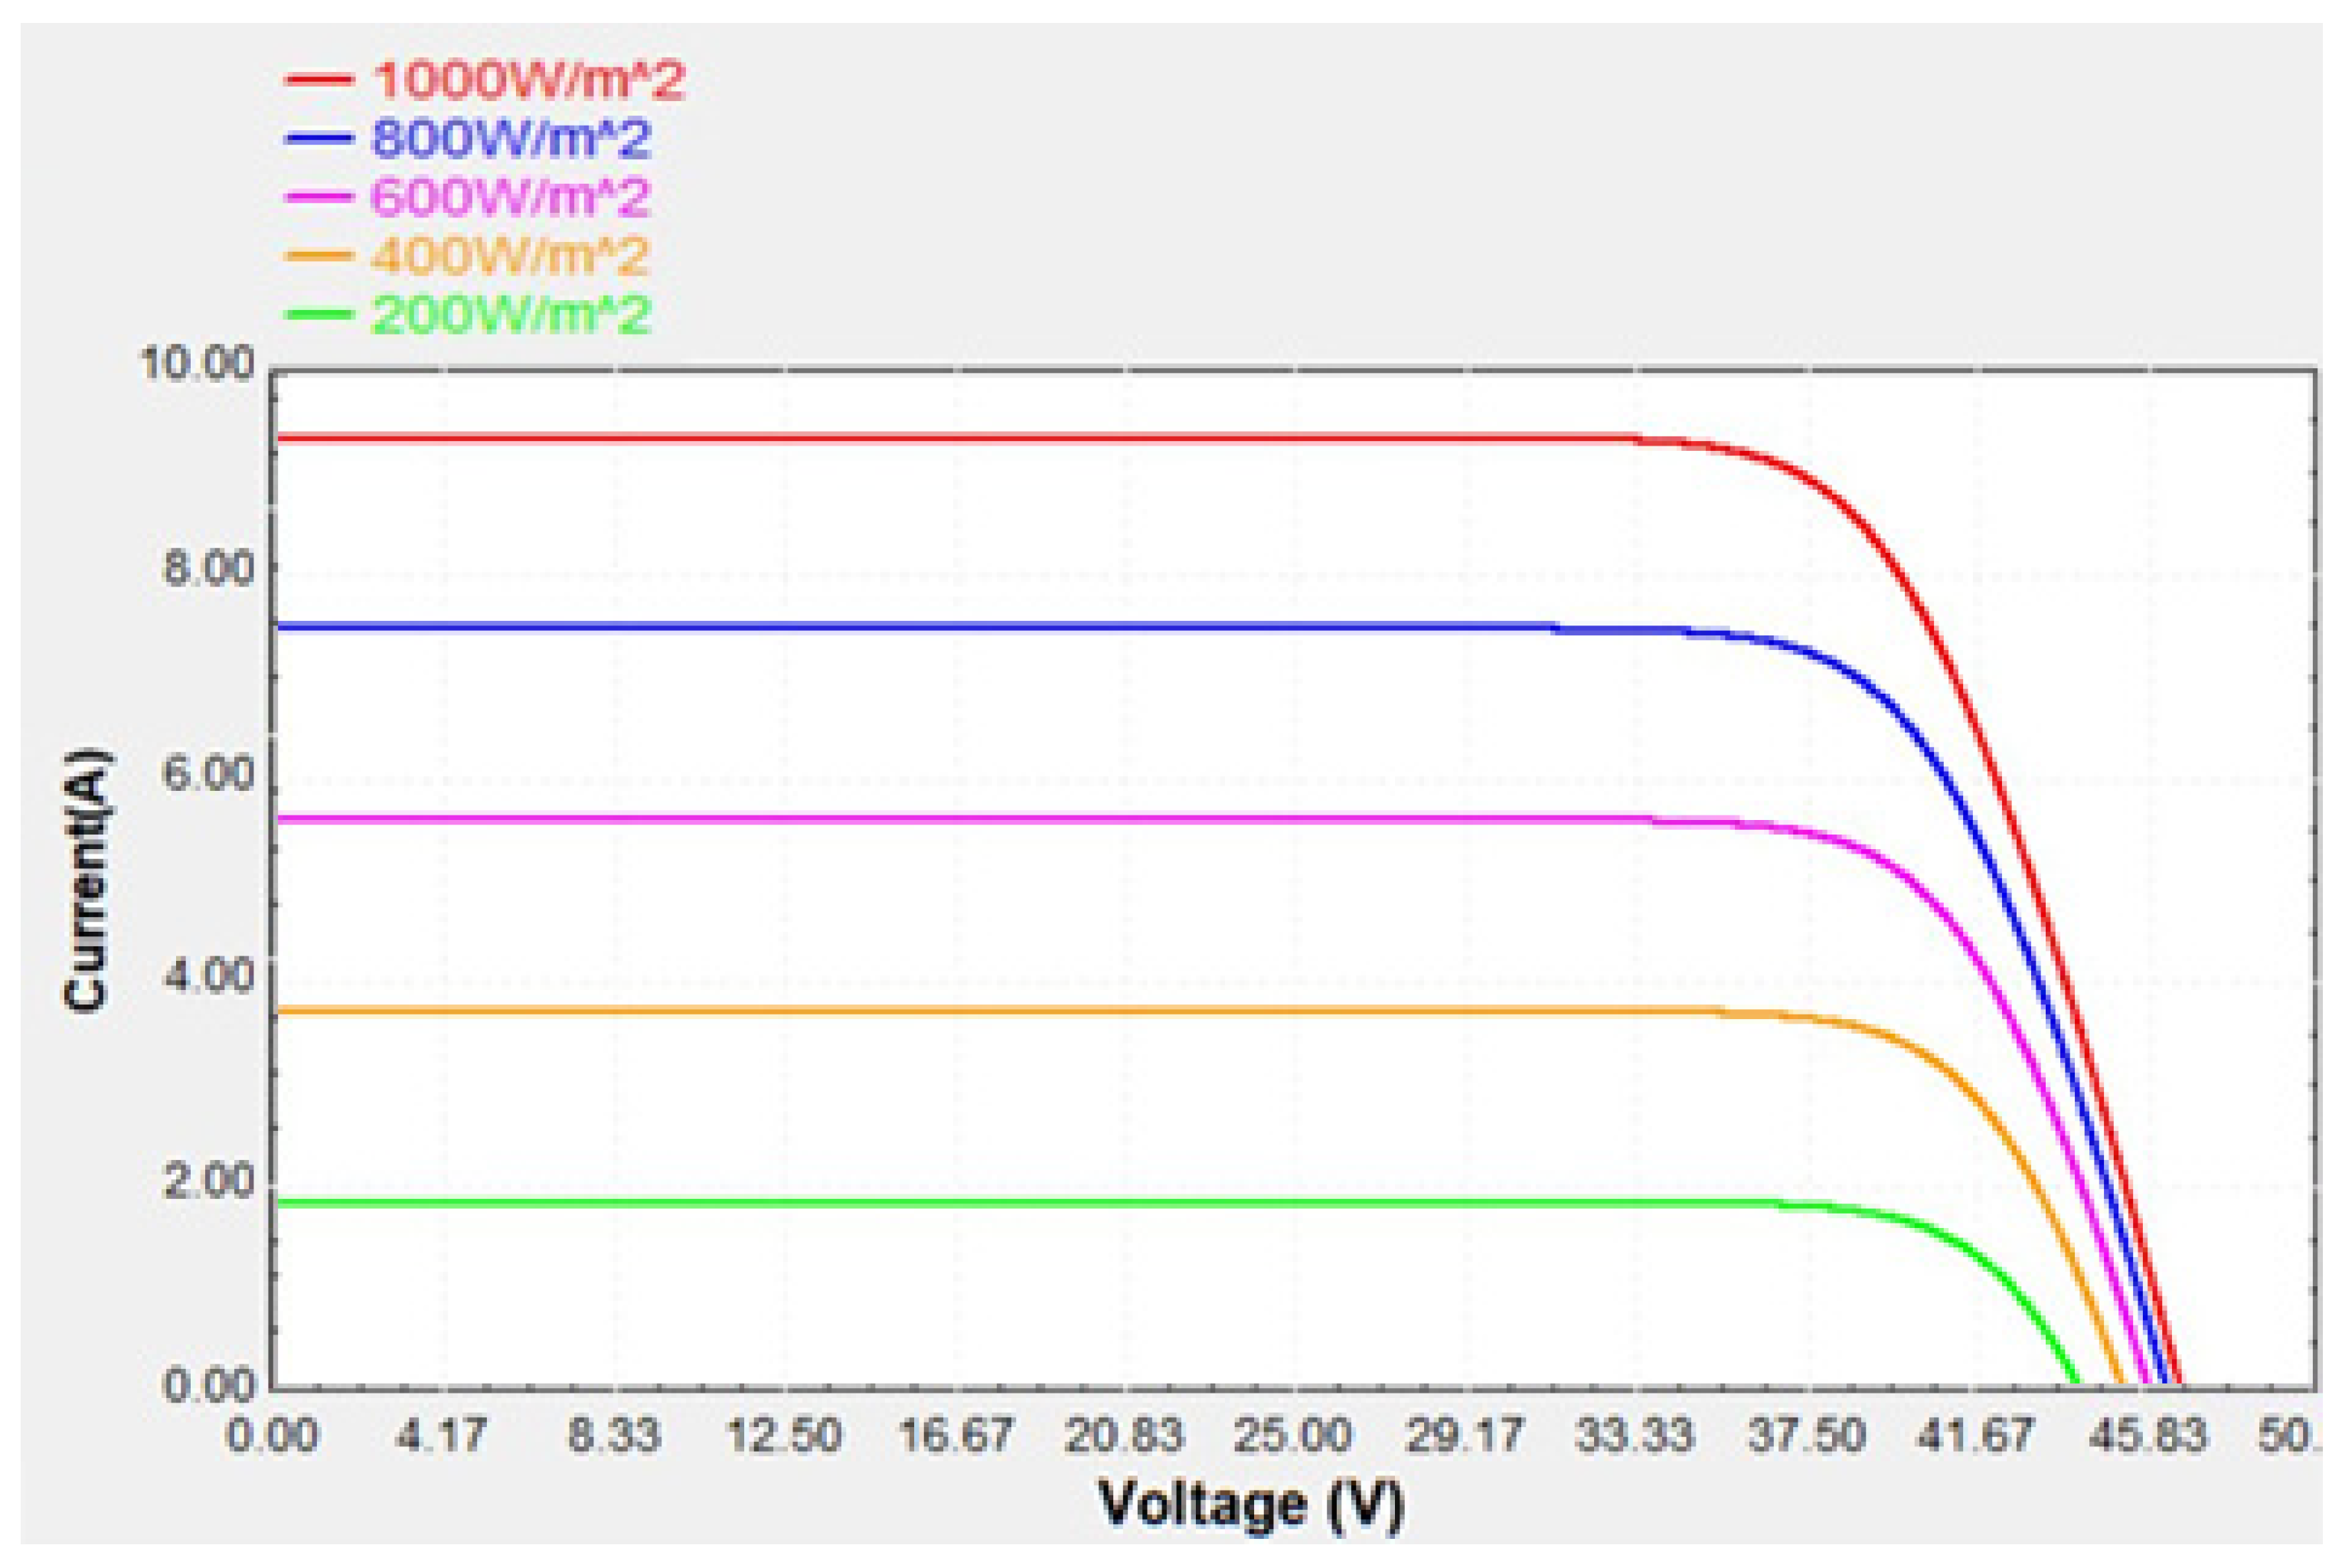
The physics of this gain is explained with the help of I V characteristic curves generated in the simulation as shown in Figure 11. During the monsoon season, irradiance often waivers between 200 and 600 W/m2. Under these conditions of low light, the V m p p is significantly shifted. A fixed-voltage system does not accommodate this shift and when it happens, the power fails to operate anywhere close to the ‘knee’ in the curve, which is a waste of power. The MPPT algorithm adjusts the input impedance at the inverter to the resistance, which is constantly changing on the array side, and this obtains the amount of energy that the inverter would dissipate as heat. This is another proof that advanced tracking inverters are a non-negotiable requirement for financial viability in places where the diffuse components of solar radiation are high.

4.4. Techno-Economic and Environmental Evaluation

The analysis of the economic feasibility was performed in the backdrop of the rising energy tariff and inflation in Pakistan.
Yield and Capacity Factors: The real assessment of the system reached a   Y F of 1344 kWh/kWp/year and C F of 15.34%. While lower than the simulated potential (19.02%), these metrics still fall within the viable range for the industrial investments in South Asia. C F and Y F are calculated using Equations (3) and (4).
Table 3 summarizes the annual energy yield, C F , and Y F , for the four operational cases: (1) Ideal Theoretical Operation with ideal MPPT, (2) Actual Field Data with MPPT enabled under real (unstable) grid conditions, (3) Simulated Operation with MPPT (digital twin), and (4) Simulated Operation without MPPT using fixed voltage (baseline/legacy system).
LCOE Analysis: The LCOE for the actual system was calculated to be $0.0378/kWh. This is significantly lower than the prevailing grid tariff for industrial consumers ( $ $ 0.10 $ 0.14 k W h ) and the cost of captive diesel generation > 0.25 / k W h and confirms the strong economic fundamentals of the project.
Payback Sensitivity Analysis:
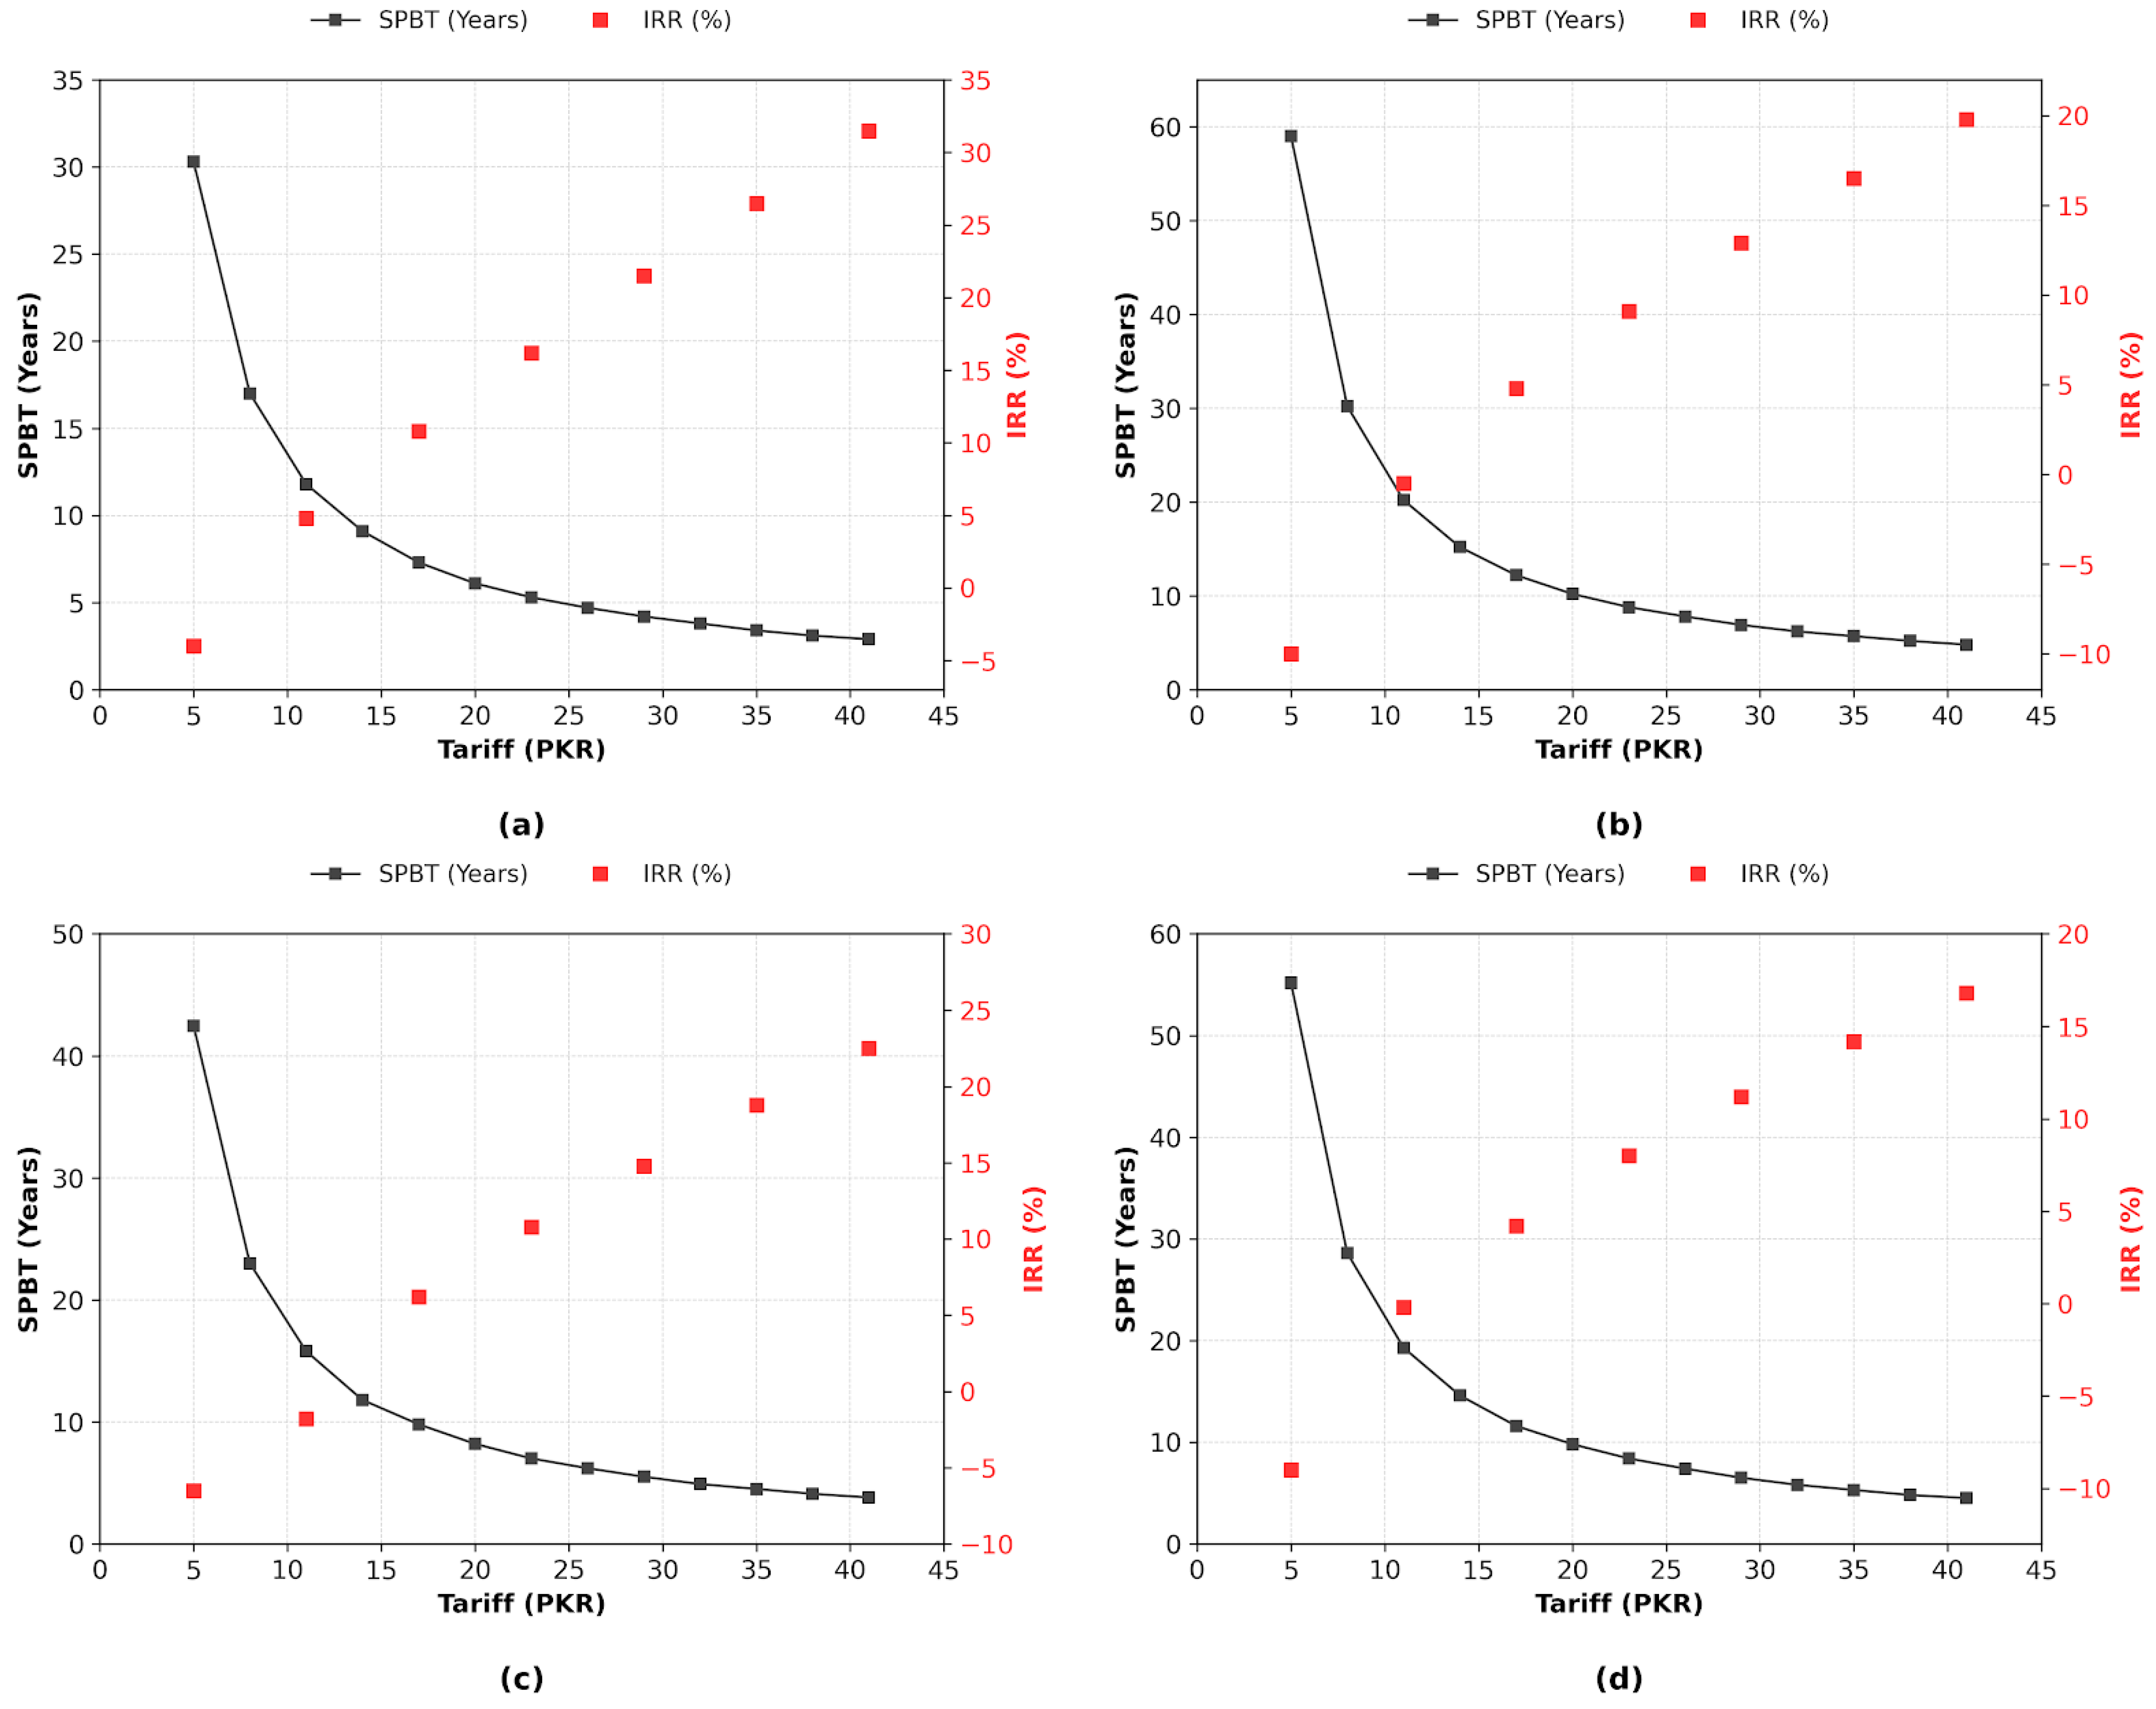
At the current electricity tariff of 41 PKR/kWh, all four configurations of the system show good economic performance. The sensitivity analysis shown in Figure 12 confirms the existence of a clear non-linear relationship between electricity tariff, SPBT, and IRR and indicates the growing financial attractiveness of PV systems under rising tariff conditions.
For Case 1 (ideal system, as shown in Figure 12a), the maximum economic performance of the system is achieved at the existing tariff of 41 PKR/kWh, an SPBT of 2.92 years, and an IRR of 32.99%. When this tariff is further increased to 50 PKR/kWh, the SPBT becomes more favorable with 2.38 years, which is an additional 18.5% improvement on the payback period, suggesting some exceptional fast capital recovery in high tariff conditions.
For Case 2 (existing operational system, as shown in Figure 12b), the SPBT at the current tariff of 41 PKR/kWh is 4.74 years with an IRR of 19.51%. Since the tariff was raised to 50 PKR/kWh, the SPBT is further improved to 3.85 years with a payback performance improvement of 18.8%, suggesting that the operational system will be a good financial hedge on electricity prices in the future.
For Case 3 (TRNSYS simulation with MPPT as shown in Figure 12c), excellent performance is retained compared to all practical relevant configurations. At 41 PKR/kWh, the system gives an SPBT of 3.79 years with a maximum return on investment (IRR) of about 25%. At the higher tariff of 50 PKR/kWh, the SPBT decreases even more to 3.08 years with a change of about 18.7%, which demonstrates the benefit of economic performance of MPPT-based optimization.
For Case 4 (system without MPPT as shown in Figure 12d), though the capital cost is reduced, the reduced energy generation affects its financial performance. At the current tariff of 41 PKR/kWh, the SPBT is 4.53 years with a max. IRR of 17.79%. With a tariff of 50 PKR/kWh, the SPBT is improved at 3.69 years and a further reduction in the payback period by 18.5%.
The comparative sensitivity analysis has shown that by raising the electricity tariff from 41 PKR/kWh to 50 PKR/kWh, there is an average enhancement in SPBT of about 18.6% in all cases. This clearly proves that tariff escalation dramatically improves the project’s viability, and it can be seen that MPPT-based configurations (particularly Case 3) are consistently shown to be better in both economic aspects and faster capital recovery for both current and elevated tariff situations.
While Figure 12 primarily illustrates the sensitivity of SPBT and IRR to increasing electricity tariffs, the economic conclusions are not solely dependent on a high-tariff regime. The calculated LCOE of the system (7.75 PKR/kWh, equivalent to $0.0378/kWh) is substantially lower than the prevailing industrial grid tariff, indicating a wide economic margin. Consequently, even under scenarios involving reduced grid tariffs or alternative grid-connection policies, the system remains economically viable as long as the tariff exceeds the LCOE. Importantly, although absolute payback periods would increase under lower tariff conditions, the relative economic advantage of MPPT-based configurations remains unchanged, preserving the validity of the comparative conclusions.
Environmental Dividends:
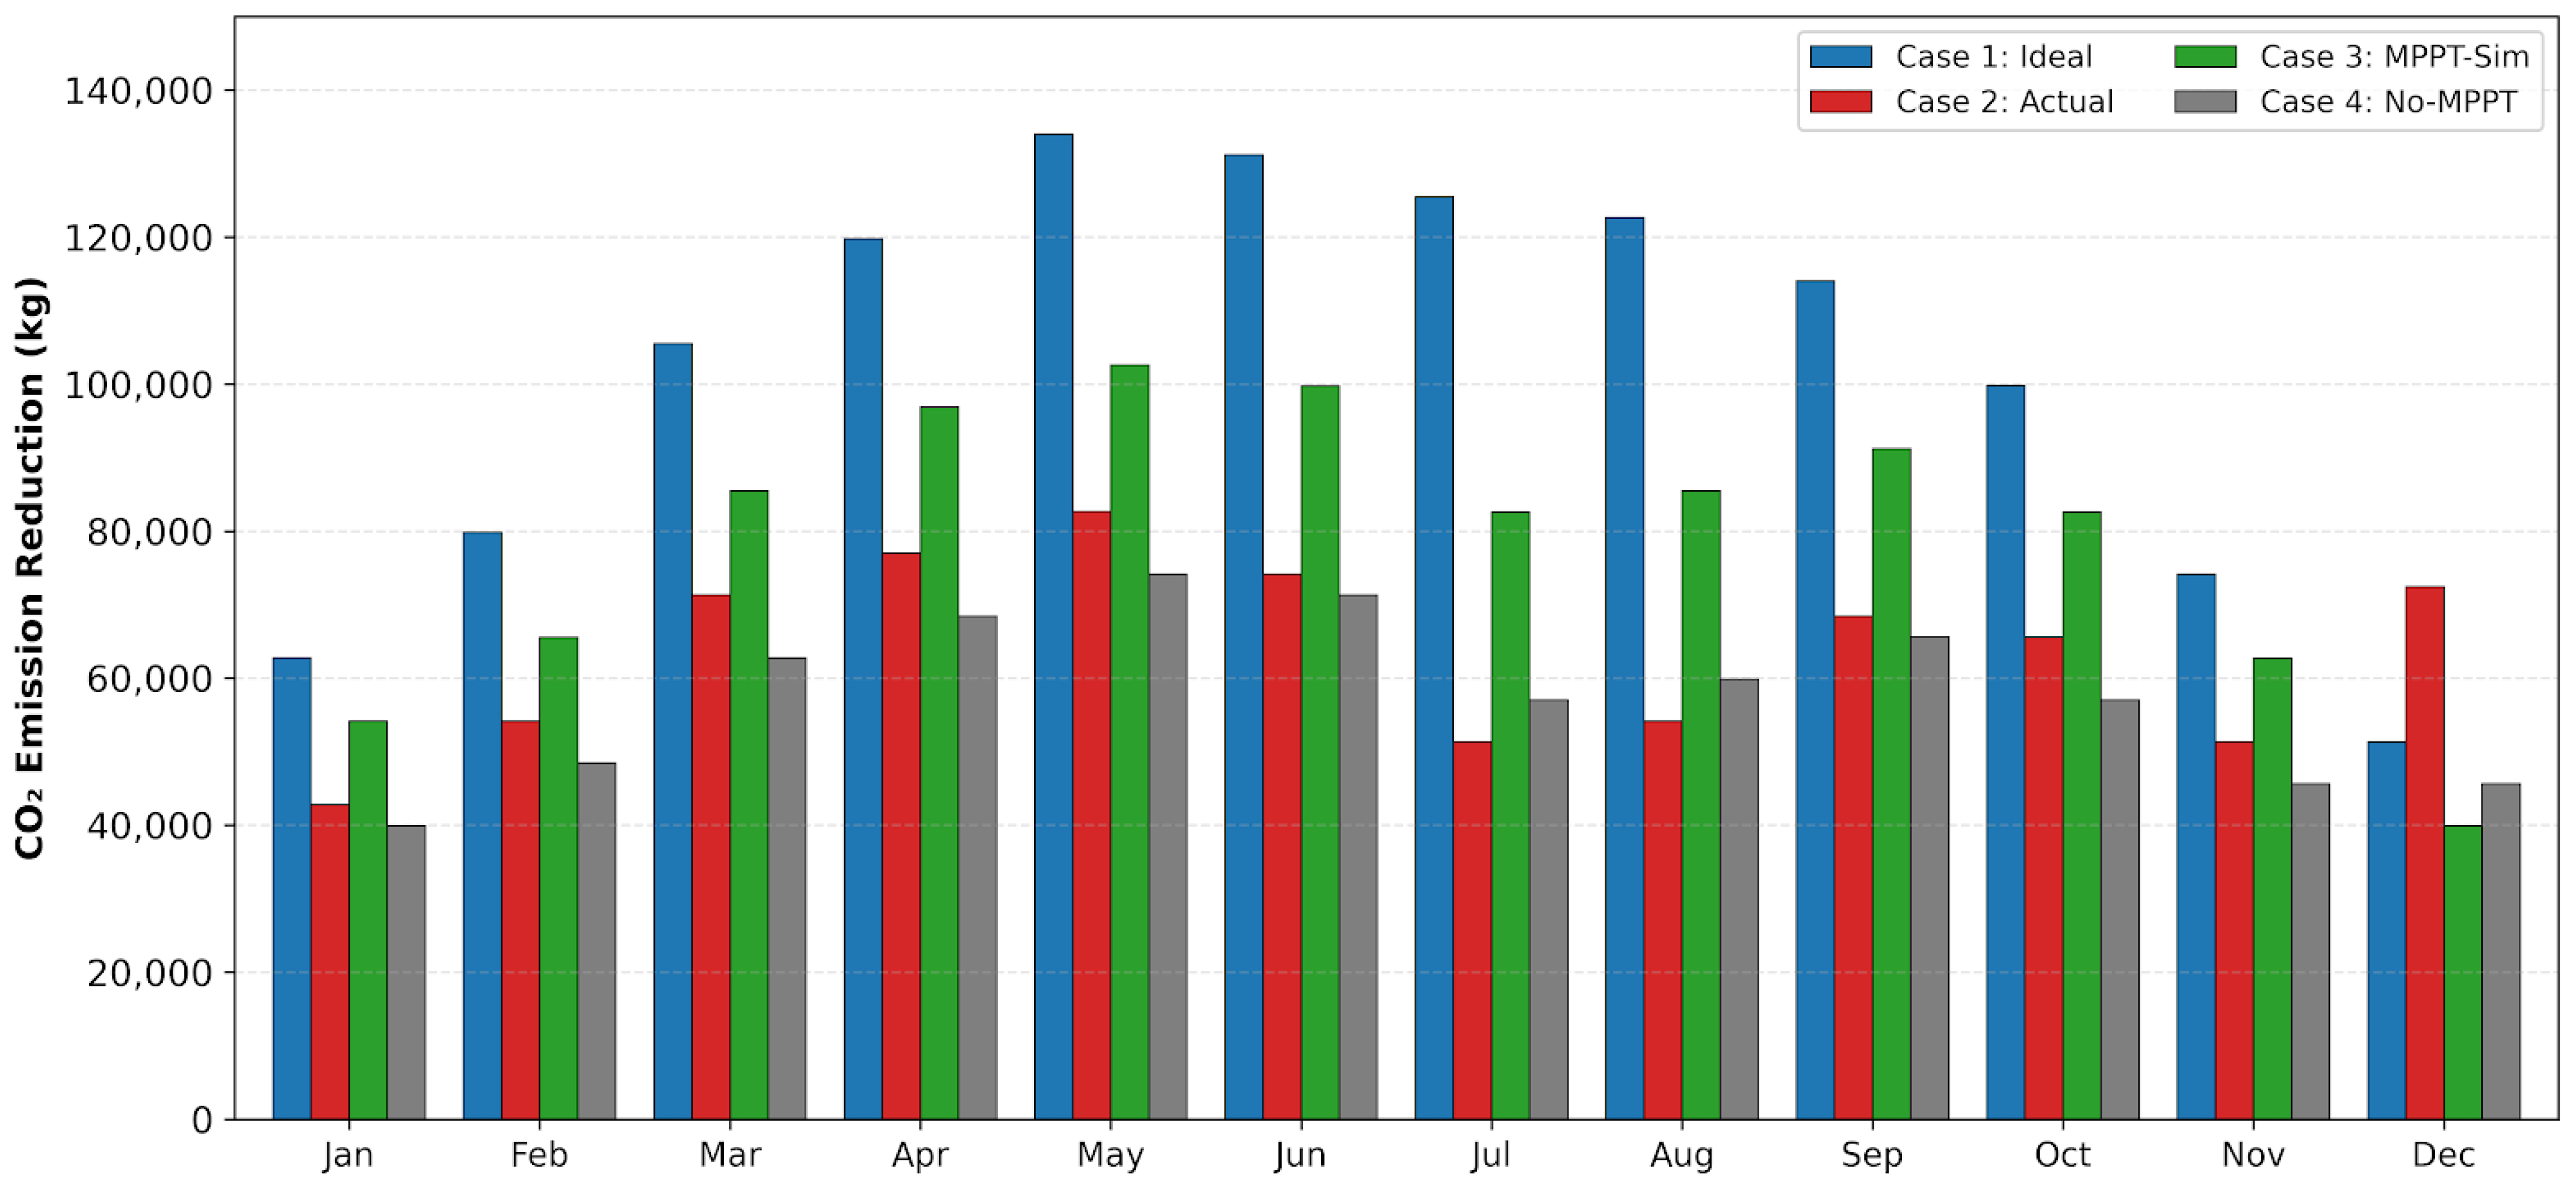
The environmental mitigation potential of the system was quantified using a Grid Emission Factor (GEF) of 0.57 kg CO2/kWh [53], which represents the weighted average carbon intensity of the National Transmission and Dispatch Company (NTDC) grid. The annual avoided carbon emissions were computed using C a v o i d e d = E a n n u a l × G E F × 10 3 , where E a n n u a l denotes the measured annual energy yield of 1,342,624 kWh and G E F is the emission factor. Based on these operational parameters, the 1 MW PV system is estimated to mitigate approximately 765.3 metric tons of CO2 equivalent per year. The cumulative carbon offset of approximately 19,132.5 tons is estimated over the 25-year operational lifespan of the project, thereby contributing directly to Pakistan’s Nationally Determined Contributions (NDCs) under the Paris Agreement [6]. The monthly CO2 mitigation profile is shown in Figure 13, which illustrates the seasonality of the carbon offset in relation to variations in solar irradiance availability. These results confirm that periods of higher electricity generation are directly associated with maximized environmental benefits [54].

5. Conclusions and Policy Implications

5.1. Conclusions

This work undertook a comprehensive techno-economic and environmental performance assessment of a 1 MW grid-connected PV system in the subtropical monsoon climate of Gujranwala, Pakistan. By triangulating three years of operational data with dynamic TRNSYS simulations, the research has quantified the performance gap between theoretical potential and industrial reality.
The operational system generated an average of 1342 MWh annually, underperforming the MPPT-enabled TRNSYS prediction (1664 MWh) by 19.3%. This deviation isolates the impact of real-world loss mechanisms, specifically heavy soiling during dry periods and grid curtailment, that are often omitted in standard TMY-based feasibility studies. Climatic variability significantly dictates yield. The intense monsoon season (July–August) introduced a drastic volatility, with generation in July 2022 plummeting by 37% compared to the annual peak. This confirms that static simulations fail to capture the stochastic nature of cloud cover in the Rice Belt, leading to potential overestimation of revenue during summer months. The study quantifies the operational necessity of MPPT in variable subtropical climates. The simulation results demonstrate a 27% performance differential between the MPPT-enabled system (1.66 GWh) and the fixed-voltage baseline (1.22 GWh). This confirms that active voltage regulation is not merely an optimization but a critical requirement for recovering significant energy yield that would otherwise be lost during monsoon-driven irradiance fluctuations. Despite the environmental challenges, the system is financially robust. With a LCOE of $0.0378/kWh and a SPBT of 4.74 years at current industrial tariffs, the work offers a hedge against rising energy inflation. Sensitivity analysis indicates that if grid tariffs rise to 50 PKR/kWh, the IRR becomes highly attractive at 18.8%. The system successfully offsets approximately 765 tons of CO2 annually, validating solar PV as a critical tool for meeting Pakistan’s NDCs for decarbonization.

5.2. Policy Implications and Industrial Recommendations

Based on these findings, several recommendations are proposed for stakeholders in developing economies with similar climatic profiles. Given the significant soiling losses identified, industrial policymakers should incentivize the adoption of automated cleaning systems. A reduction in import duties for such maintenance technologies could bridge the 19% performance gap identified in this work. The grid curtailment losses suggest a need for smarter grid infrastructure [55,56]. Distribution companies (DISCOs) must upgrade rural feeders to handle the bi-directional power flows from MW-scale prosumers without tripping, ensuring that generated green energy is not wasted [57]. Standards bodies should mandate high-efficiency MPPT inverters with wide voltage windows for all industrial installations to maximize harvest during the low-irradiance monsoon season.
While this study focuses on Pakistan’s Rice Belt, the findings have broader implications for solar deployment in the Global South, particularly in the agricultural zones of India, Bangladesh, and Vietnam. The identified 19.3% performance gap highlights that standard feasibility models systematically overestimate yield in subtropical monsoon climates. Policy frameworks in these regions must therefore mandate the integration of Climatic Derating Factors specifically for soiling and grid instability into the LCOE calculations.

5.3. Limitations and Future Directions

Future research should focus on the following: investigating the yield gain of bifacial modules which can capture albedo reflection, potentially offsetting losses during cloudy monsoon days; simulating the economic trade-off of mechanical tracking systems to maximize winter generation when solar altitude is low; and conducting a spectral analysis of the specific agricultural dust in the region to develop optimized cleaning schedules. Furthermore, focus should also be placed on (1) integrating automated robotic dry-cleaning systems to recover the estimated 10–12% soiling loss; (2) simulating a Hybrid PV-Battery Energy Storage System (BESS) of 250 kWh capacity to capture the 7–9% energy lost during grid curtailment events; and (3) developing a localized ‘Soiling Map’ for the Punjab province using IoT-based dust sensors.

Author Contributions

Conceptualization: M.U.S. and A.S.; Methodology: M.U.S. and A.S.; Software: M.U.S. and A.S.; Validation: M.U.S., A.S. and S.U.R.; Formal analysis: M.U.S.; Investigation: M.U.S.; Resources: M.U.S.; Data curation: M.U.S.; Writing—original draft preparation: M.U.S.; Writing—review and editing: M.U.S., A.S., S.U.R. and M.Z.B.; Visualization: M.U.S.; Supervision: M.Z.B.; Project administration: M.Z.B.; Funding acquisition: M.Z.B. All authors have read and agreed to the published version of the manuscript.

Funding

The authors would like to thank Heriot-Watt University and UKRI for the research support under UKRI grant (ERC-RES922610).

Data Availability Statement

The data supporting the findings of this study are available within the article. Additional data are available from the corresponding author upon reasonable request.

Conflicts of Interest

The authors declare no conflicts of interest.

References

  1. Gielen, D.; Boshell, F.; Saygin, D.; Bazilian, M.D.; Wagner, N.; Gorini, R. The role of renewable energy in the global energy transformation. Energy Strateg. Rev. 2019, 24, 38–50. [Google Scholar] [CrossRef] [Scilit]
  2. Saleem, M.U.; Bajwa, M.H.T.; Rahman, S.U.; Wen, H.; Khan, M.A. An IoT-based real-time smart metering deployment for grid optimization: A case study of GEPCO, Pakistan. PLoS ONE 2025, 20, e0338389. [Google Scholar] [CrossRef] [Scilit]
  3. NTDC. Power System Statistics 47th Edition. 2022. Available online: https://www.nepra.org.pk/publications/State of Industry Reports/State of Industry Report 2022.pdf (accessed on 28 January 2026).
  4. Pakistan Economic Survey: Ministry of Finance, Government of Pakistan. Available online: https://www.finance.gov.pk/survey/chapter_22/PES14-ENERGY.pdf (accessed on 28 January 2026).
  5. (CREA). CO2 Emissions from Pakistan’s Energy Sector. Available online: https://energyandcleanair.org/wp/wp-content/uploads/2021/07/CO2-Emissions-from-Pakistans-Energy-sector_30_07_2021.pdf (accessed on 28 January 2026).
  6. Ministry of Climate Change and Environmental Coordination. Pakistan Nationally Determined Contributions. Available online: https://unfccc.int/sites/default/files/NDC/2022-06/Pakistan Updated NDC 2021.pdf (accessed on 28 January 2026).
  7. Hussain, F.; Maeng, S.-J.; Cheema, M.J.M.; Anjum, M.N.; Afzal, A.; Azam, M.; Wu, R.-S.; Noor, R.S.; Umair, M.; Iqbal, T. Solar Irrigation Potential, Key Issues and Challenges in Pakistan. Water 2023, 15, 1727. [Google Scholar] [CrossRef] [Scilit]
  8. Saleem, M.U.; Usman, M.R.; Shakir, M. Design, Implementation, and Deployment of an IoT Based Smart Energy Management System. IEEE Access 2021, 9, 59649–59664. [Google Scholar] [CrossRef] [Scilit]
  9. The Independent. How Pakistan Quietly Became World’s Biggest Solar Importer. Available online: https://www.independent.co.uk/climate-change/news/pakistan-solar-energy-panels-imports-china-b2732711.html (accessed on 28 January 2026).
  10. Rehman, T.; Qaisrani, M.A.; Shafiq, M.B.; Baba, Y.F.; Aslfattahi, N.; Shahsavar, A.; Cheema, T.A.; Park, C.W. Global perspectives on advancing photovoltaic system performance—A state-of-the-art review. Renew. Sustain. Energy Rev. 2025, 207, 114889. [Google Scholar] [CrossRef] [Scilit]
  11. Global Solar Atlas: Direct Normal Irradiation of Pakistan. Available online: https://globalsolaratlas.info/download/pakistan (accessed on 28 January 2026).
  12. Khaliq, T.; Gaydon, D.S.; Ahmad, M.-D.; Cheema, M.J.M.; Gull, U. Analyzing crop yield gaps and their causes using cropping systems modelling–A case study of the Punjab rice-wheat system, Pakistan. F. Crop. Res. 2019, 232, 119–130. [Google Scholar] [CrossRef] [Scilit]
  13. Stökler, S.; Schillings, C.; Kraas, B. Solar resource assessment study for Pakistan. Renew. Sustain. Energy Rev. 2016, 58, 1184–1188. [Google Scholar] [CrossRef] [Scilit]
  14. Häberlin, H. Photovoltaics: System Design and Practice, 1st ed.; John Wiley & Sons: Hoboken, NJ, USA, 2012; Available online: https://www.wiley.com/en-us/Photovoltaics%3A+System+Design+and+Practice-p-9781119978381 (accessed on 28 January 2026).
  15. Climate-data.org. Gujranwala Climate (Pakistan). Available online: https://en.climate-data.org/asia/pakistan/punjab/gujranwala-1077/ (accessed on 28 January 2026).
  16. Solar Energy Laboratory. TRNSYS: Transient System Simulation Tool. Available online: https://www.trnsys.com/ (accessed on 28 January 2026).
  17. de Brito, M.A.G.; Galotto, L.; Sampaio, L.P.; de Azevedo e Melo, G.; Canesin, C.A. Evaluation of the Main MPPT Techniques for Photovoltaic Applications. IEEE Trans. Ind. Electron. 2013, 60, 1156–1167. [Google Scholar] [CrossRef] [Scilit]
  18. Kumari, N.; Singh, S.K.; Kumar, S.; Jadoun, V.K. Performance Investigation of Monocrystalline and Polycrystalline PV Modules Under Real Conditions. IEEE Access 2024, 12, 169869–169878. [Google Scholar] [CrossRef] [Scilit]
  19. Rehman, A.U.; Nadeem, M.; Usman, M. Passivated Emitter and Rear Totally Diffused: PERT Solar Cell-An Overview. Silicon 2023, 15, 639–649. [Google Scholar] [CrossRef] [Scilit]
  20. Kumari, P.A.; Geethanjali, P. Parameter estimation for photovoltaic system under normal and partial shading conditions: A survey. Renew. Sustain. Energy Rev. 2018, 84, 1–11. [Google Scholar] [CrossRef] [Scilit]
  21. Vunnam, S.; VanithaSri, M.; RamaKoteswaraRao, A. Performance analysis of mono crystalline, poly crystalline and thin film material based 6 × 6 T-C-T PV array under different partial shading situations. Optik 2021, 248, 168055. [Google Scholar] [CrossRef] [Scilit]
  22. Solas, Á.F.; Riedel-Lyngskær, N.; Hanrieder, N.; Santos, F.N.; Wilbert, S.; Riise, H.N.; Polo, J.; Fernández, E.F.; Almonacid, F.; Talavera, D.L.; et al. Photovoltaic soiling loss in Europe: Geographical distribution and cleaning recommendations. Renew. Energy 2025, 239, 122086. [Google Scholar] [CrossRef] [Scilit]
  23. Alshareef, M.J. A Comprehensive Review of the Soiling Effects on PV Module Performance. IEEE Access 2023, 11, 134623–134651. [Google Scholar] [CrossRef] [Scilit]
  24. Ullah, A.; Amin, A.; Haider, T.; Saleem, M.; Butt, N.Z. Investigation of soiling effects, dust chemistry and optimum cleaning schedule for PV modules in Lahore, Pakistan. Renew. Energy 2020, 150, 456–468. [Google Scholar] [CrossRef] [Scilit]
  25. Rashid, M.; Yousif, M.; Rashid, Z.; Muhammad, A.; Altaf, M.; Mustafa, A. Effect of dust accumulation on the performance of photovoltaic modules for different climate regions. Heliyon 2023, 9, e23069. [Google Scholar] [CrossRef] [Scilit]
  26. Borah, P.; Micheli, L.; Sarmah, N. Analysis of Soiling Loss in Photovoltaic Modules: A Review of the Impact of Atmospheric Parameters, Soil Properties, and Mitigation Approaches. Sustainability 2023, 15, 16669. [Google Scholar] [CrossRef] [Scilit]
  27. Değermenci, M.; Yalman, Y.; Olcay, K. MPPT algorithms for grid-connected solar systems including deep learning approaches. Sci. Rep. 2026. [Google Scholar] [CrossRef] [Scilit] [PubMed]
  28. Ismail, M.; Marei, M.I.; Mokhtar, M. Adaptive Hybrid MPPT for Photovoltaic Systems: Performance Enhancement Under Dynamic Conditions. Sustainability 2025, 18, 80. [Google Scholar] [CrossRef] [Scilit]
  29. Elnagar, E.; Arteconi, A.; Heiselberg, P.; Lemort, V. Integration of resilient cooling technologies in building stock: Impact on thermal comfort, final energy consumption, and GHG emissions. Build. Environ. 2024, 261, 111666. [Google Scholar] [CrossRef] [Scilit]
  30. Pater, S.; Szczotka, K. Comparison of Typical Meteorological Years for Assessment and Simulation of Renewable Energy Systems. Energies 2025, 18, 6063. [Google Scholar] [CrossRef] [Scilit]
  31. Sadek, M.S.; Mustafa, A.; Mostafa, N.A.; di Bitonto, L.; Mustafa, M.; Pastore, C. Clean production of isopropyl myristate: A cutting-edge enzymatic approach with a holistic techno-economic evaluation. Sustain. Energy Technol. Assess. 2024, 64, 103721. [Google Scholar] [CrossRef] [Scilit]
  32. Ayadi, O.; Al-Assad, R.; Al Asfar, J. Techno-economic assessment of a grid connected photovoltaic system for the University of Jordan. Sustain. Cities Soc. 2018, 39, 93–98. [Google Scholar] [CrossRef] [Scilit]
  33. Wang, Y.; Li, M.; Hassanien, R.H.E.; Ma, X.; Li, G. Grid-Connected Semitransparent Building-Integrated Photovoltaic System: The Comprehensive Case Study of the 120 kWp Plant in Kunming, China. Int. J. Photoenergy 2018, 2018, 6510487. [Google Scholar] [CrossRef] [Scilit]
  34. Zhan, C.; Xu, Y.; Fan, J.; Gao, M.; Kong, W.; Wu, J.; Wang, D.; Tian, Z. Validation and optimization of a solar heating plant with a large-scale heat pump. Energy 2025, 319, 134898. [Google Scholar] [CrossRef] [Scilit]
  35. Sareen, K.; Panigrahi, B.K.; Shikhola, T.; Chawla, A. A robust De-Noising Autoencoder imputation and VMD algorithm based deep learning technique for short-term wind speed prediction ensuring cyber resilience. Energy 2023, 283, 129080. [Google Scholar] [CrossRef] [Scilit]
  36. Ahmad, M.; Khattak, A.; Janjua, A.K.; Alahmadi, A.A.; Khan, M.S.; Ullah, N. Techno-economic feasibility analyses of grid- connected solar photovoltaic power plants for small scale industries of Punjab, Pakistan. Front. Energy Res. 2022, 10, 1028310. [Google Scholar] [CrossRef] [Scilit]
  37. Mumtaz, M.A.; Rehman, A.U.; Ayub, M.; Muhammad, F.; Raza, M.W.; Iqbal, S.; Elbarbary, Z.M.S.; Alsenani, T.R. Techno-economic and environmental analysis of hybrid energy system for industrial sector of Pakistan. Sci. Rep. 2024, 14, 23736. [Google Scholar] [CrossRef] [Scilit]
  38. Ali, M.B.; Kazmi, S.A.A.; Altamimi, A.; Khan, Z.A.; Alghassab, M.A. Decarbonizing Telecommunication Sector: Techno-Economic Assessment and Optimization of PV Integration in Base Transceiver Stations in Telecom Sector Spreading across Various Geographically Regions. Energies 2023, 16, 3800. [Google Scholar] [CrossRef] [Scilit]
  39. Ahmed, N.; Khan, A.N.; Ahmed, N.; Aslam, A.; Imran, K.; Sajid, M.B.; Waqas, A. Techno-economic potential assessment of mega scale grid-connected PV power plant in five climate zones of Pakistan. Energy Convers. Manag. 2021, 237, 114097. [Google Scholar] [CrossRef] [Scilit]
  40. Abas, N.; Rauf, S.; Saleem, M.S.; Irfan, M.; Hameed, S.A. Techno-Economic Feasibility Analysis of 100 MW Solar Photovoltaic Power Plant in Pakistan. Technol. Econ. Smart Grids Sustain. Energy 2022, 7, 16. [Google Scholar] [CrossRef] [Scilit]
  41. Arif, S.; Taweekun, J.; Ali, H.M.; Theppaya, T. Techno Economic Evaluation and Feasibility Analysis of a Hybrid Net Zero Energy Building in Pakistan: A Case Study of Hospital. Front. Energy Res. 2021, 9, 668908. [Google Scholar] [CrossRef] [Scilit]
  42. Shah, S.A.A.; Valasai, G.D.; Memon, A.A.; Laghari, A.N.; Jalbani, N.B.; Strait, J.L. Techno-Economic Analysis of Solar PV Electricity Supply to Rural Areas of Balochistan, Pakistan. Energies 2018, 11, 1777. [Google Scholar] [CrossRef] [Scilit]
  43. Solar, J. JA Solar JAP72S01 315-335/SC Series Specifications. Available online: https://www.jasolar.com/uploadfile/2019/0203/20190203094558411.pdf (accessed on 28 January 2026).
  44. Huawei. SUN2000-(100KTL, 105KTL) Series Technical Specifications. Available online: https://support.huawei.com/enterprise/en/doc/EDOC1100020646/5de5c663/sun2000-100ktl-105ktl-series-technical-specifications (accessed on 28 January 2026).
  45. Solar Energy Laboratory. TRNSYS Primary Weather Data. Available online: https://sel.me.wisc.edu/trnsys/weather/weather.htm (accessed on 28 January 2026).
  46. Cubas, J.; Pindado, S.; De Manuel, C. Explicit Expressions for Solar Panel Equivalent Circuit Parameters Based on Analytical Formulation and the Lambert W-Function. Energies 2014, 7, 4098–4115. [Google Scholar] [CrossRef] [Scilit]
  47. Kalogirou, S.A. Solar Energy Engineering; Elsevier: Amsterdam, The Netherlands, 2014. [Google Scholar] [CrossRef] [Scilit]
  48. State Bank of Pakistan: Policy Rate History 1992–2025. Available online: https://www.ceicdata.com/en/indicator/pakistan/policy-rate (accessed on 28 January 2026).
  49. SBP. Pakistan Bureau of Statistics: Monthly Review on Price Indices (Inflation). Available online: https://www.pbs.gov.pk/sites/default/files/price_statistics/monthly_price_indices/2023/7_Inflation.pdf (accessed on 28 January 2026).
  50. MOF. Government of Pakistan: Ministry of Finance, Pakistan Economic Survey: Inflation and Energy. Available online: https://www.finance.gov.pk/survey/chapter_25/7_Inflation.pdf (accessed on 28 January 2026).
  51. NEPRA O&M Determination. Available online: https://nepra.org.pk/tariff/Tariff/K-Electric Generation/TRF-596 K-Electric Determination for Power Generation Plants 22-10-2024 15878-82.pdf (accessed on 28 January 2026).
  52. Ullah, A.; Imran, H.; Maqsood, Z.; Butt, N.Z. Investigation of optimal tilt angles and effects of soiling on PV energy production in Pakistan. Renew. Energy 2019, 139, 830–843. [Google Scholar] [CrossRef] [Scilit]
  53. Umer, M.; Abas, N.; Rauf, S.; Saleem, M.S.; Dilshad, S. GHG emissions estimation and assessment of Pakistan’s power sector: A roadmap towards low carbon future. Results Eng. 2024, 22, 102354. [Google Scholar] [CrossRef] [Scilit]
  54. US EPA. U.S. Environmental Protection Agency: Greenhouse Gas Equivalencies Calculator. Available online: https://www.epa.gov/energy/greenhouse-gas-equivalencies-calculator (accessed on 28 January 2026).
  55. Saleem, M.U.; Shakir, M.; Usman, M.R.; Bajwa, M.H.T.; Shabbir, N.; Shams Ghahfarokhi, P.; Daniel, K. Integrating Smart Energy Management System with Internet of Things and Cloud Computing for Efficient Demand Side Management in Smart Grids. Energies 2023, 16, 4835. [Google Scholar] [CrossRef] [Scilit]
  56. Saleem, M.U.; Usman, M.R.; Yaqub, M.A.; Liotta, A.; Asim, A. Smarter Grid in the 5G Era: Integrating the Internet of Things with a Cyber-Physical System. IEEE Access 2024, 12, 34002–34018. [Google Scholar] [CrossRef] [Scilit]
  57. Saleem, M.U.; Usman, M.R.; Usman, M.A.; Politis, C. Design, Deployment and Performance Evaluation of an IoT Based Smart Energy Management System for Demand Side Management in Smart Grid. IEEE Access 2022, 10, 15261–15278. [Google Scholar] [CrossRef] [Scilit]
Figure 1. The energy generation mix of Pakistan with the prevalence of thermal sources and the insignificant role of solar energy [4].
Processes 14 00616 g001
Figure 2. Solar Direct Normal Irradiance (DNI) map of Pakistan showing the high-potential zones in Punjab [11].
Processes 14 00616 g002
Figure 3. Schematic of the proposed research methodology illustrating the dual-approach framework: field assessment (Objective 1) and TRNSYS-based digital twin simulation (Objective 2), converging into a comparative analysis (Objective 3) to quantify the PV performance gap.
Processes 14 00616 g003
Figure 4. Annotated aerial view of the experimental site in an intensively cultivated agricultural region (Rice Belt), showing the proximity of the 1 MW photovoltaic (PV) array to surrounding active fields and the associated soiling exposure environment.
Processes 14 00616 g004
Figure 5. Single-line schematic diagram of the 1 MW grid-connected PV system.
Processes 14 00616 g005
Figure 6. TRNSYS simulation model circuit illustrating the interconnection of Type 109 (Weather), Type 180 (PV Array), and Integrators.
Processes 14 00616 g006
Figure 7. Meteorological profile of the site showing (a) monthly average ambient temperatures and (b) rainfall distribution.
Processes 14 00616 g007aProcesses 14 00616 g007b
Figure 8. Solar irradiation profile (W/m2) throughout the year used in the TRNSYS simulation.
Processes 14 00616 g008
Figure 9. Comparative annual electricity production (kWh/year) between Ideal, Actual, MPPT-Simulated and Non-MPPT-Simulated cases.
Processes 14 00616 g009
Figure 10. Comparative monthly electricity production: The simulation (Case 3) consistently exceeds the actual yield (Case 2), with the largest deviations observed during the peak monsoon months (July–Aug) due to soiling and grid curtailment.
Processes 14 00616 g010
Figure 11. Simulated I V characteristic curves of the PV module at different solar irradiances (200–1000 W/m2).
Processes 14 00616 g011
Figure 12. Sensitivity analysis of Simple Payback Time (SPBT) and Internal Rate of Return (IRR): (a) Ideal, (b) Actual, (c) MPPT-Simulated and (d) Non-MPPT Simulated cases.
Processes 14 00616 g012
Figure 13. Monthly CO2 emission reduction for the four PV system cases, highlighting seasonal variations in carbon mitigation.
Processes 14 00616 g013
Table 1. Comparative summary of related techno-economic studies on PV systems and identified research gaps.
ReferenceYearRegion/FocusSystem/ScaleMethodologyKey Limitation/Research Gap Addressed
Ahmad et al. [36]2023Punjab (Industrial)SME ScaleRETScreenFeasibility study only; relies on static monthly averages and misses dynamic monsoon intermittency.
Mumtaz et al. [37]2024Pakistan (Industrial)Hybrid HESHOMER ProFocuses on multi-source hybrid optimization (Diesel/PV) rather than validating losses in pure grid-tied setups.
Zhan et al. [34]2025Denmark (Cold Climate)Utility Scale (Solar Thermal)TRNSYSValidates TRNSYS for solar thermal applications; does not address electrical PV yield under monsoon soiling constraints.
Ullah et al. [24]2024Lahore (Rice Belt)Experimental (Soiling Study)Field DataExcellent quantification of dust/soiling rates but lacks system-level techno-economic modeling (LCOE).
Kazmi et al. [38]2023Pakistan (Telecom)Decentralized (Telecom Towers)SimulationFocuses on off-grid telecom reliability, not industrial grid-export performance or power quality.
This Work2025Pakistan (Monsoon)1 MW (Industrial Grid-Connected)TRNSYS + Field DataValidates dynamic simulation against long-term data, specifically isolating Monsoon Anomaly and MPPT gain.
Table 2. Economic parameters and assumptions used for financial analysis.
ParameterSymbolValueSource/Basis
Nominal Discount Ratei0.15State Bank of Pakistan (SBP) Policy Rate [48]
Inflation Ratef0.199Pakistan Bureau of Statistics [49]
Real Discount Rater~0% *Adjusted for Hyper-Inflation Environment r 1 + i 1 + f 1
Grid Electricity TariffTgrid41.0 PKR/kWhIndustrial Tariff (Peak/Off-Peak Avg) [50]
Project LifetimeN25 YearsStandard PV Lifecycle
O&M Cost (Fixed)Mt0.39 PKR/kWhPower Sector Fixed O&M [51]
Exchange RateXR205 PKR/USDAverage Interbank Rate
CAPEXCCapital1206/kW USDCAPEX of the Project
System Yield (Actual)YF1344 kWh/kWpMeasured Operational Data (Case 2)
* Note: Due to the inflationary trends where the inflation rate (19.9%) exceeded the policy rate (15%), the Real Discount Rate r approaches zero. This economic anomaly significantly lowers the effective LCOE, as the real value of future debt obligations diminishes relative to energy savings.
Table 3. Definition of simulation and operational test cases with corresponding performance metrics.
CaseDescriptionTracking ModeGrid StatusData SourceAnnual Energy Output (kWh/Year)Capacity Factor (%)Specific Yield (kWh/kWp)
1Ideal Theoretical OperationIdeal MPPTInfinite GridTRNSYS (TMY2)2,141,32124.452141
2Actual Field DataMPPT EnabledReal (Unstable)Field1,342,62415.341344
3Simulated Operation with MPPT (Digital Twin)MPPT EnabledInfinite GridTRNSYS (TMY2)1,664,73619.021665
4Simulated Operation without MPPT (Baseline/Legacy)Fixed VoltageInfinite GridTRNSYS (TMY2)1,220,59313.931221
Disclaimer/Publisher’s Note: The statements, opinions and data contained in all publications are solely those of the individual author(s) and contributor(s) and not of MDPI and/or the editor(s). MDPI and/or the editor(s) disclaim responsibility for any injury to people or property resulting from any ideas, methods, instructions or products referred to in the content.