Article

Mechanisms of Fines Migration and Pore-Structure Evolution Under Seepage Flow: Insights from LF-NMR and CFD–DEM

1
College of Civil Engineering, Shaoxing University, Shaoxing 312000, China
2
School of Civil Engineering, Chungbuk National University, Cheongju 28644, Republic of Korea
3
School of Urban Construction, Changzhou University, Changzhou 213000, China
*
Author to whom correspondence should be addressed.
Processes 2026, 14(4), 615; https://doi.org/10.3390/pr14040615
Submission received: 22 January 2026 / Revised: 3 February 2026 / Accepted: 6 February 2026 / Published: 10 February 2026
(This article belongs to the Section Process Control, Modeling and Optimization)

Abstract

Particle migration is a pore-scale process that fundamentally controls pore-structure evolution and seepage behavior in granular porous media. This study investigates fine particles migration in coarse-grained sediments and its effects on pore structure and permeability by combining low-field nuclear magnetic resonance (LF-NMR) experiments with coupled CFD–DEM simulations. The evolution of fine particles migration rate, porosity variation, and permeability was analyzed under different fluid injection velocities and fines concentrations. Higher injection velocities accelerate fines initiation and early-stage migration by increasing hydrodynamic drag forces, whereas their influence diminishes at later stages due to pore-structure confinement and localized particle retention. At a constant injection velocity, increasing fines concentration suppresses early fines mobilization owing to enhanced interparticle interactions and pore throat blockage. As seepage continues, progressive fines release and export enlarge pore space and enhance permeability. Spatial analyses reveal that fines migration is governed by localized retention and rearrangement within pore throats. Within the investigated parameter ranges and timescales, system evolution is dominated by internal erosion and pore unclogging rather than sustained macroscopic clogging. These results provide mechanistic experimental–numerical insight into fines migration and seepage stability in granular porous media, with direct relevance to hydrate-bearing sediments and other fine-sensitive geological systems.

1. Introduction

Particle migration and pore clogging are normal pore-scale processes in porous media and are encountered across a wide range of subsurface engineering applications, including geotechnical, petroleum, and geothermal engineering [1,2,3]. In the context of geological carbon dioxide (CO2) sequestration, these processes can substantially alter reservoir permeability, thereby directly affecting sequestration efficiency and fluid transport behavior [4,5]. With the global pursuit of carbon neutrality, carbon dioxide hydrates have attracted increasing attention as a promising CO2 sequestration medium and have become a focal point of research in carbon storage technologies [6,7]. Under subsurface conditions, CO2 hydrates can stably immobilize large quantities of CO2, offering high storage density and favorable thermodynamic stability [8,9]. However, hydrate dissociation induced by exploitation or external disturbance often leads to pore-structure reconstruction, which in turn triggers particle migration and pore clogging, ultimately impacting reservoir permeability, fluid flow capacity, and sequestration performance [10,11,12].
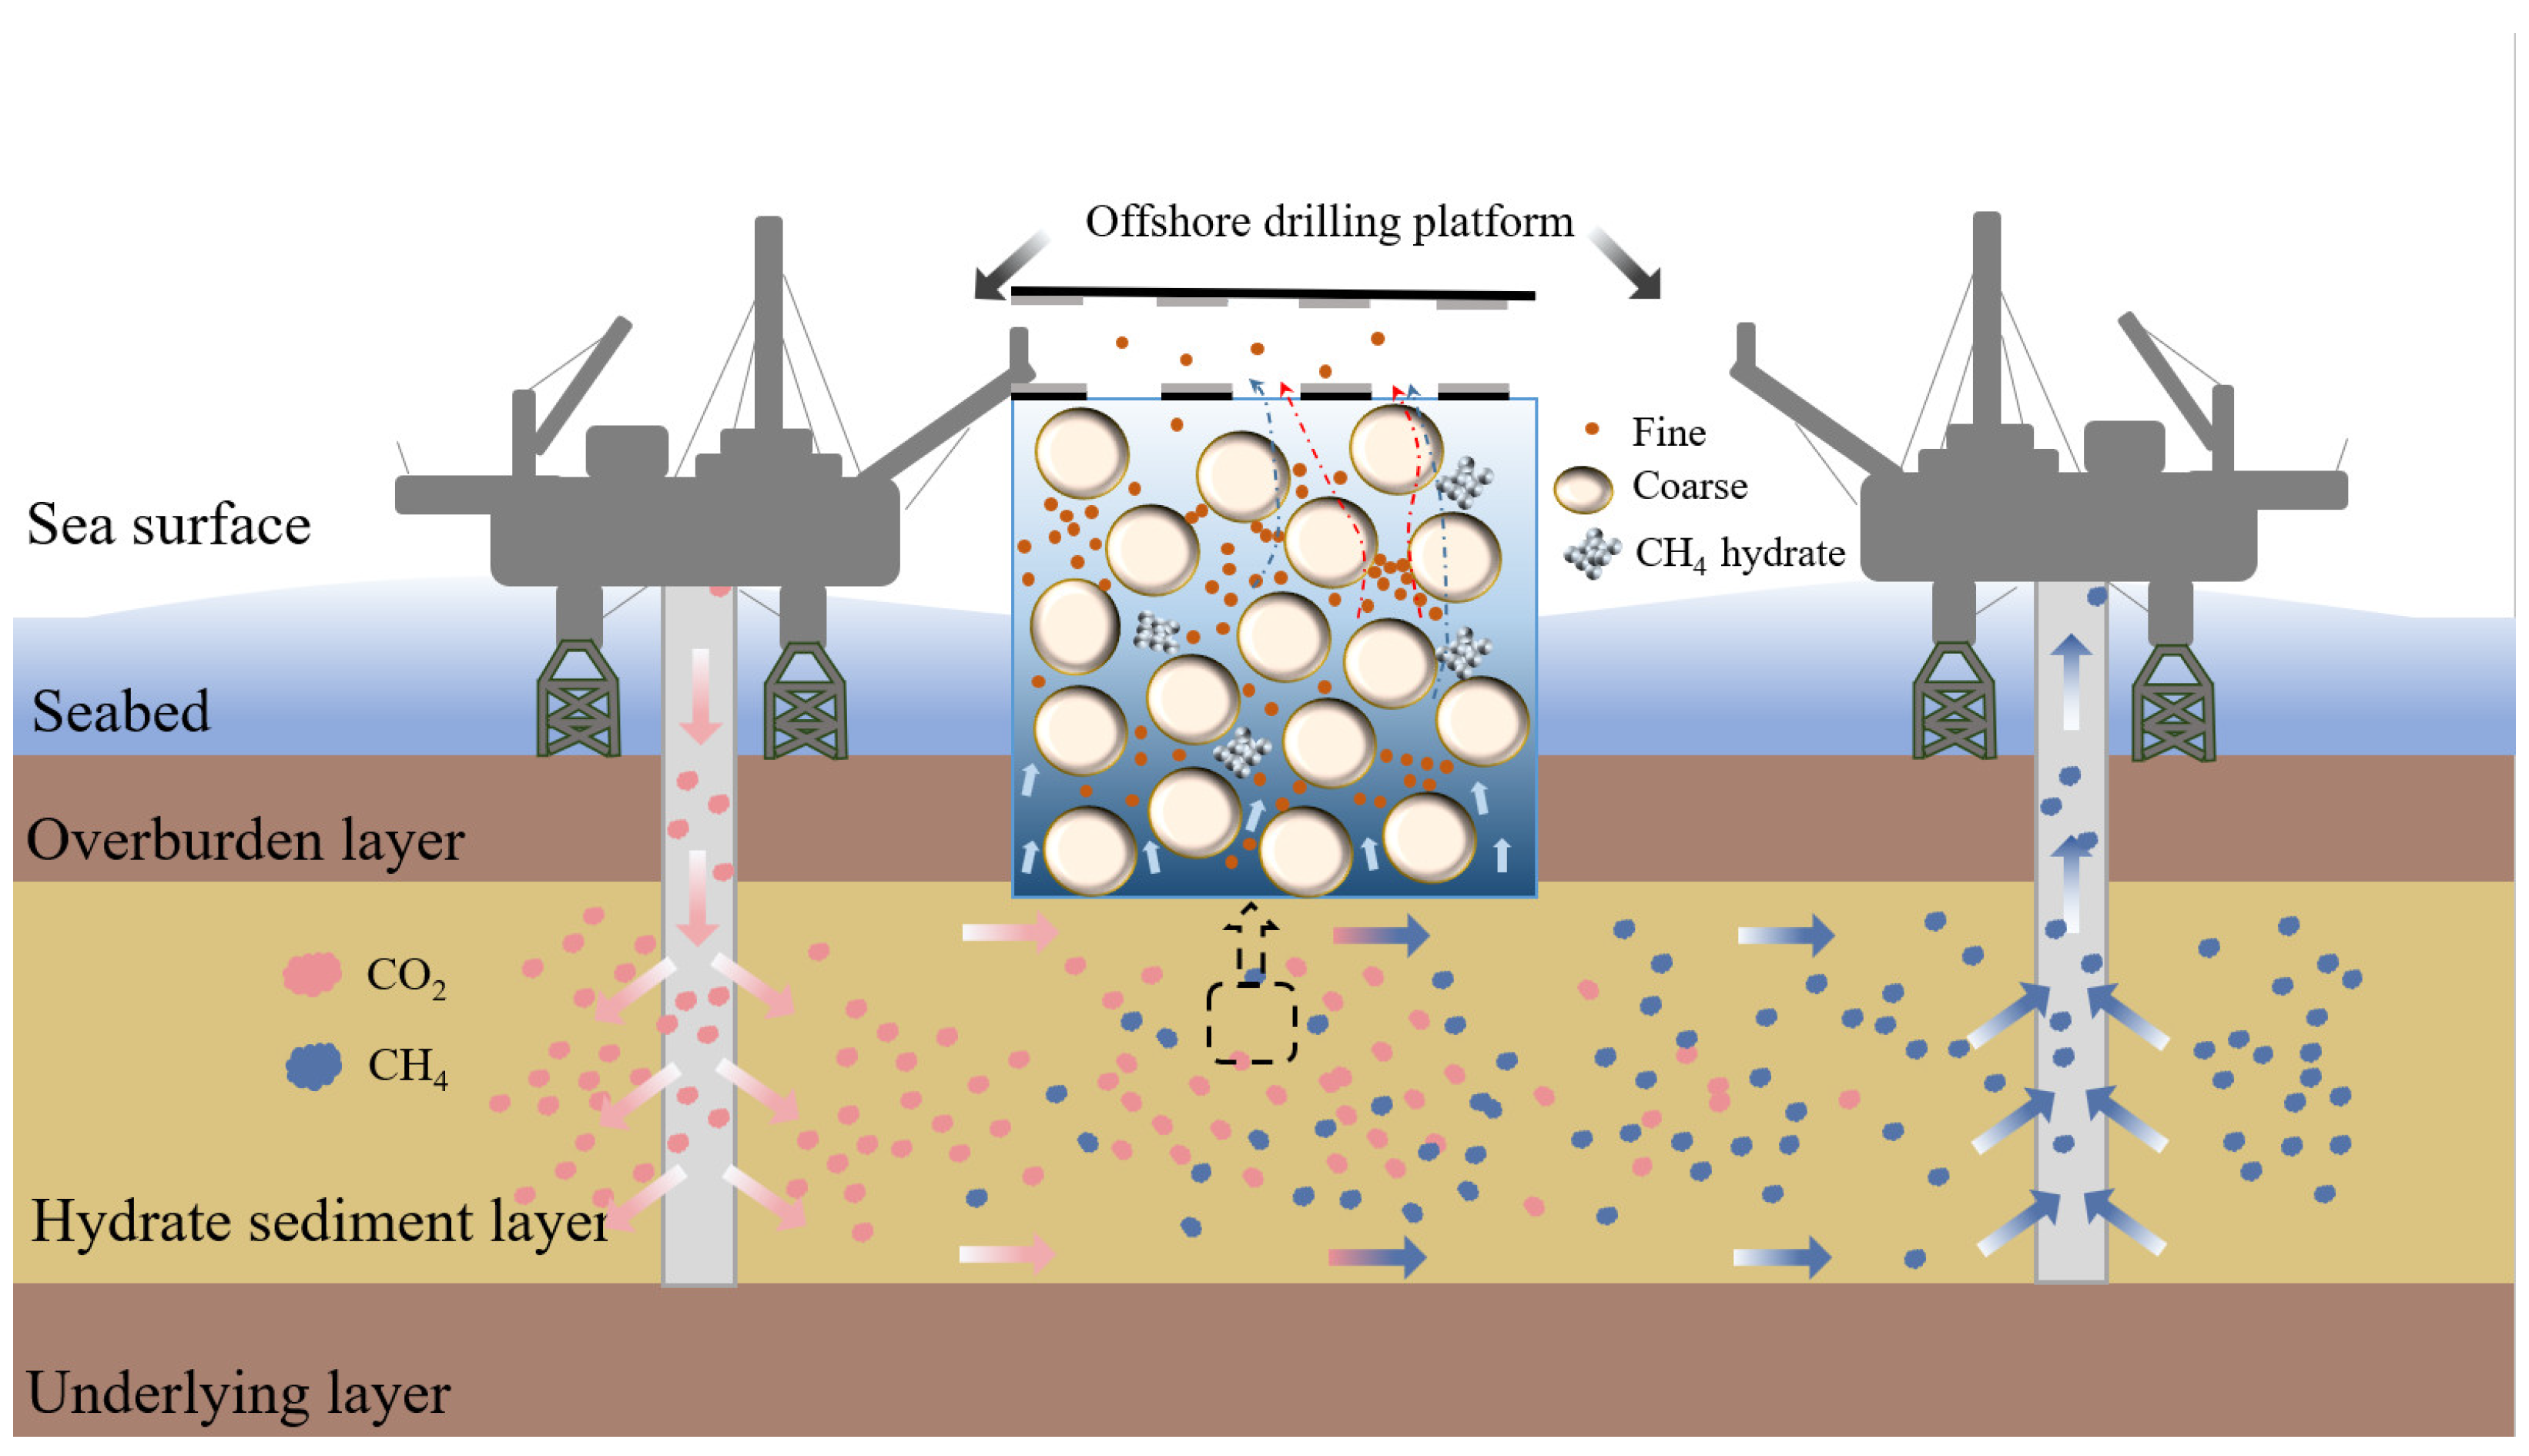
Particle migration in porous media is governed by the coupled effects of hydrodynamic drag, interparticle contact forces, and interactions between particles and the pore skeleton [13,14]. Particle migration not only reshapes preferential flow pathways but also promotes localized pore blockage, resulting in pronounced changes in pore structure and flow behavior. With the progress of CO2 injection or hydrate decomposition, particles usually move along the dominant flow channel [15]. As CO2 injection or hydrate dissociation progresses, particles tend to migrate along dominant flow channels, whereas in low-velocity regions, particle accumulation and deposition become prevalent, ultimately leading to pore-structure changes. Such a procedure alters flow pathways and reduces effective permeability, thereby limiting CO2 injection efficiency and long-term sequestration stability [16,17,18]. Consequently, particle migration and pore-structure changing play a decisive role in controlling reservoir storage performance and fluid transport behavior (Figure 1).
From a pore-scale perspective, particle migration is inherently nonuniform and exhibits distinct stages, including initiation, transport, retention, and rearrangement [19,20]. Particle mobilization occurs when fluid-induced shear forces exceed the critical threshold required for entrainment. Once mobilized, particles preferentially migrate through highly connected pore networks with elevated flow velocities [13,21]. However, when particle sizes approach or exceed pore-throat dimensions, particle motion becomes strongly constrained by pore geometry, leading to retention or bridging at pore constrictions and the formation of localized clogging. Notably, particle migration is not strictly irreversible; retained particles may be remobilized through rearrangement, force redistribution, or flow perturbations, resulting in a dynamic migration–clogging process characterized by alternating retention and release [22]. This complex behavior, controlled by pore-structure heterogeneity, particle size effects, and hydrodynamic conditions, provides the fundamental physical basis for permeability evolution and flow instability in porous media [23,24].
Particle migration and pore-structure evolution are therefore critical to both hydrate exploitation and CO2 sequestration processes [25]. Hydrate dissociation significantly modifies sediment pore structures and connectivity, thereby exerting a strong influence on particle migration behavior [26,27,28]. The governing mechanisms of particle migration are primarily determined by particle surface properties (e.g., size distribution and surface charge), interparticle forces (including van der Waals and electrostatic interactions), and frictional interactions between particles and the pore skeleton. Particle migration and aggregation can induce localized pore clogging, alter gas flow pathways, and ultimately compromise sequestration efficiency [29]. In this study, a coupled computational fluid dynamics–discrete element method (CFD–DEM) approach is adopted to investigate particle migration and pore clogging at the pore scale. CFD–DEM has been widely applied to characterize fluid–particle interactions in multiphase systems. To contextualize the numerical framework employed in this work, Table 1 summarizes representative CFD–DEM coupling strategies, corresponding software platforms, and typical application scenarios, thereby providing guidance for method selection and clarifying the technical foundation of the present study.
This study introduces a robust experimental–numerical approach by integrating low-field nuclear magnetic resonance (LF-NMR) measurements with a computational fluid dynamics–discrete element method (CFD–DEM) model. This framework enables a comprehensive investigation into the migration of fine particles amidst the presence of hydrate and their impact on pore structure and permeability. LF-NMR provides real-time, non-invasive observations of pore-structure changes and fluid behavior, offering insights that traditional experimental methods often cannot achieve. By combining the macro-scale pore-structure data from LF-NMR with the micro-scale particle dynamics from CFD–DEM, this integrated approach enhances the accuracy of particle migration predictions, particularly in complex pore structures. The combination of these methods deepens our understanding of particle migration and pore clogging processes, providing a more nuanced perspective on the dynamic evolution of pore structure and overcoming some limitations of purely experimental or numerical approaches. This approach contributes valuable insights for improving carbon dioxide hydrate storage and enhancing the efficiency and stability of geological carbon sequestration.

2. Materials and Methods

2.1. Experimental Methods

The experimental sample is composed of quartz sand and fine clay (montmorillonite, purity 96.2%, from Guzhang Shanlin Shiyu Mineral Products Co., Ltd., Guzhang, Hunan, China). As shown in Table 2, the purity of quartz sand is 100%, and the particle size ranges from 1.18 to 2.36 mm, while the purity of montmorillonite is 96.2%, and the average particle size is 10.72 m. Deionized water is used as a saturated fluid, and high-purity nitrogen (N, 99.999%, provided by Huayang Gas Co., Ltd., Changzhou, Jiangsu, China.) is used as the gas phase. The experimental model tube is made of PEEK (Suzhou Newmag Analytical Instrument Co., Ltd., Suzhou, Jiangsu, China), with an inner diameter of 20 mm and a height of 43.5 mm. This custom-designed pipe has detachable threaded plugs at both ends, and each threaded plug has a hole for connecting the inlet and the outlet. Threaded end caps are installed at both ends of the pipeline, including permeable openings to prevent the migration of coarse sand and allow gas to flow. In order to eliminate the radial gap and ensure a reliable seal with the core holder, the model tube is wrapped with a heat-shrinkable tube to provide stable and clear boundary conditions.
The vacuum saturation system consists of a vacuum saturation chamber equipped with an inlet valve and a vacuum pump (Suzhou Newmag Analytical Instruments Company, Suzhou, Jiangsu, China, model: MESOMR12-060H-I), which can achieve a maximum vacuum of at least −90 kPa. The NMR instrument is equipped with a confining pressure system, including a pressure intensifier (0–10 MPa) and a high-precision pressure sensor (Hangzhou Meikong Automation Technology Co., Ltd., Hangzhou, Zhejiang, China, model: SUP-P300). The measuring range is 0–10 MPa, and the accuracy is better than ±0.25% FS. The system provides sealing pressure around the sample during gas injection to prevent leakage and ensure that the sample remains mechanically stable and not deformed. Fluorinated liquid (FC-40, 3M, St. Paul, MN, USA) is used as the pressure transmission medium, not to directly apply confining pressure to the sample but to prevent the sample from being displaced or damaged during injection and to allow real-time pressure monitoring. The injection pressure and flow rate are carefully controlled by a two-stage decompression system, which includes a pressure-stabilizing valve and a needle valve. The injection system is equipped with an injection pump (KD Scientific Inc., Holliston, MA, USA, model: KDS Model 200 Series), a steel syringe (5–20 mL capacity), and a low-friction piston, which can run stably at three flow rates (5, 10, and 21 μL·min−1). The fluid circulation loop is composed of high-pressure stainless steel pipes (pressure grade ≥10 MPa) that are connected by metal LIC conical fittings to ensure sealing integrity and pressure resistance. A low-field nuclear magnetic resonance (LF-NMR) system (Suzhou Niumag Analytical Instrument Corporation, Suzhou, Jiangsu, China, model: MesoMR12-060H-I) was used to acquire T1–T2 correlation maps and T2 relaxation spectra for characterizing pore structure and fluid distribution.
The experimental platform is equipped with a low-field nuclear magnetic resonance (LF-NMR) system (MESOMR12-060H-I, Niumag Instruments, Suzhou, China), which can operate at a maximum pressure of 25 MPa. Its echo interval is 0.2 ms, the echo is 15,000, and the sampling rate is 333.333 kHz. The gas supply cylinder is connected with the system through the injection pump, which can accurately adjust the injection flow to ensure the stable operation of the particle migration experiment. The digital system (upper computer 34970A and 34901A data acquisition module) and SUP-P300 pressure sensor of Hangzhou Miken Automation Technology Co., Ltd., Hangzhou, Zhejiang, China are used for data acquisition to ensure accurate pressure measurement.
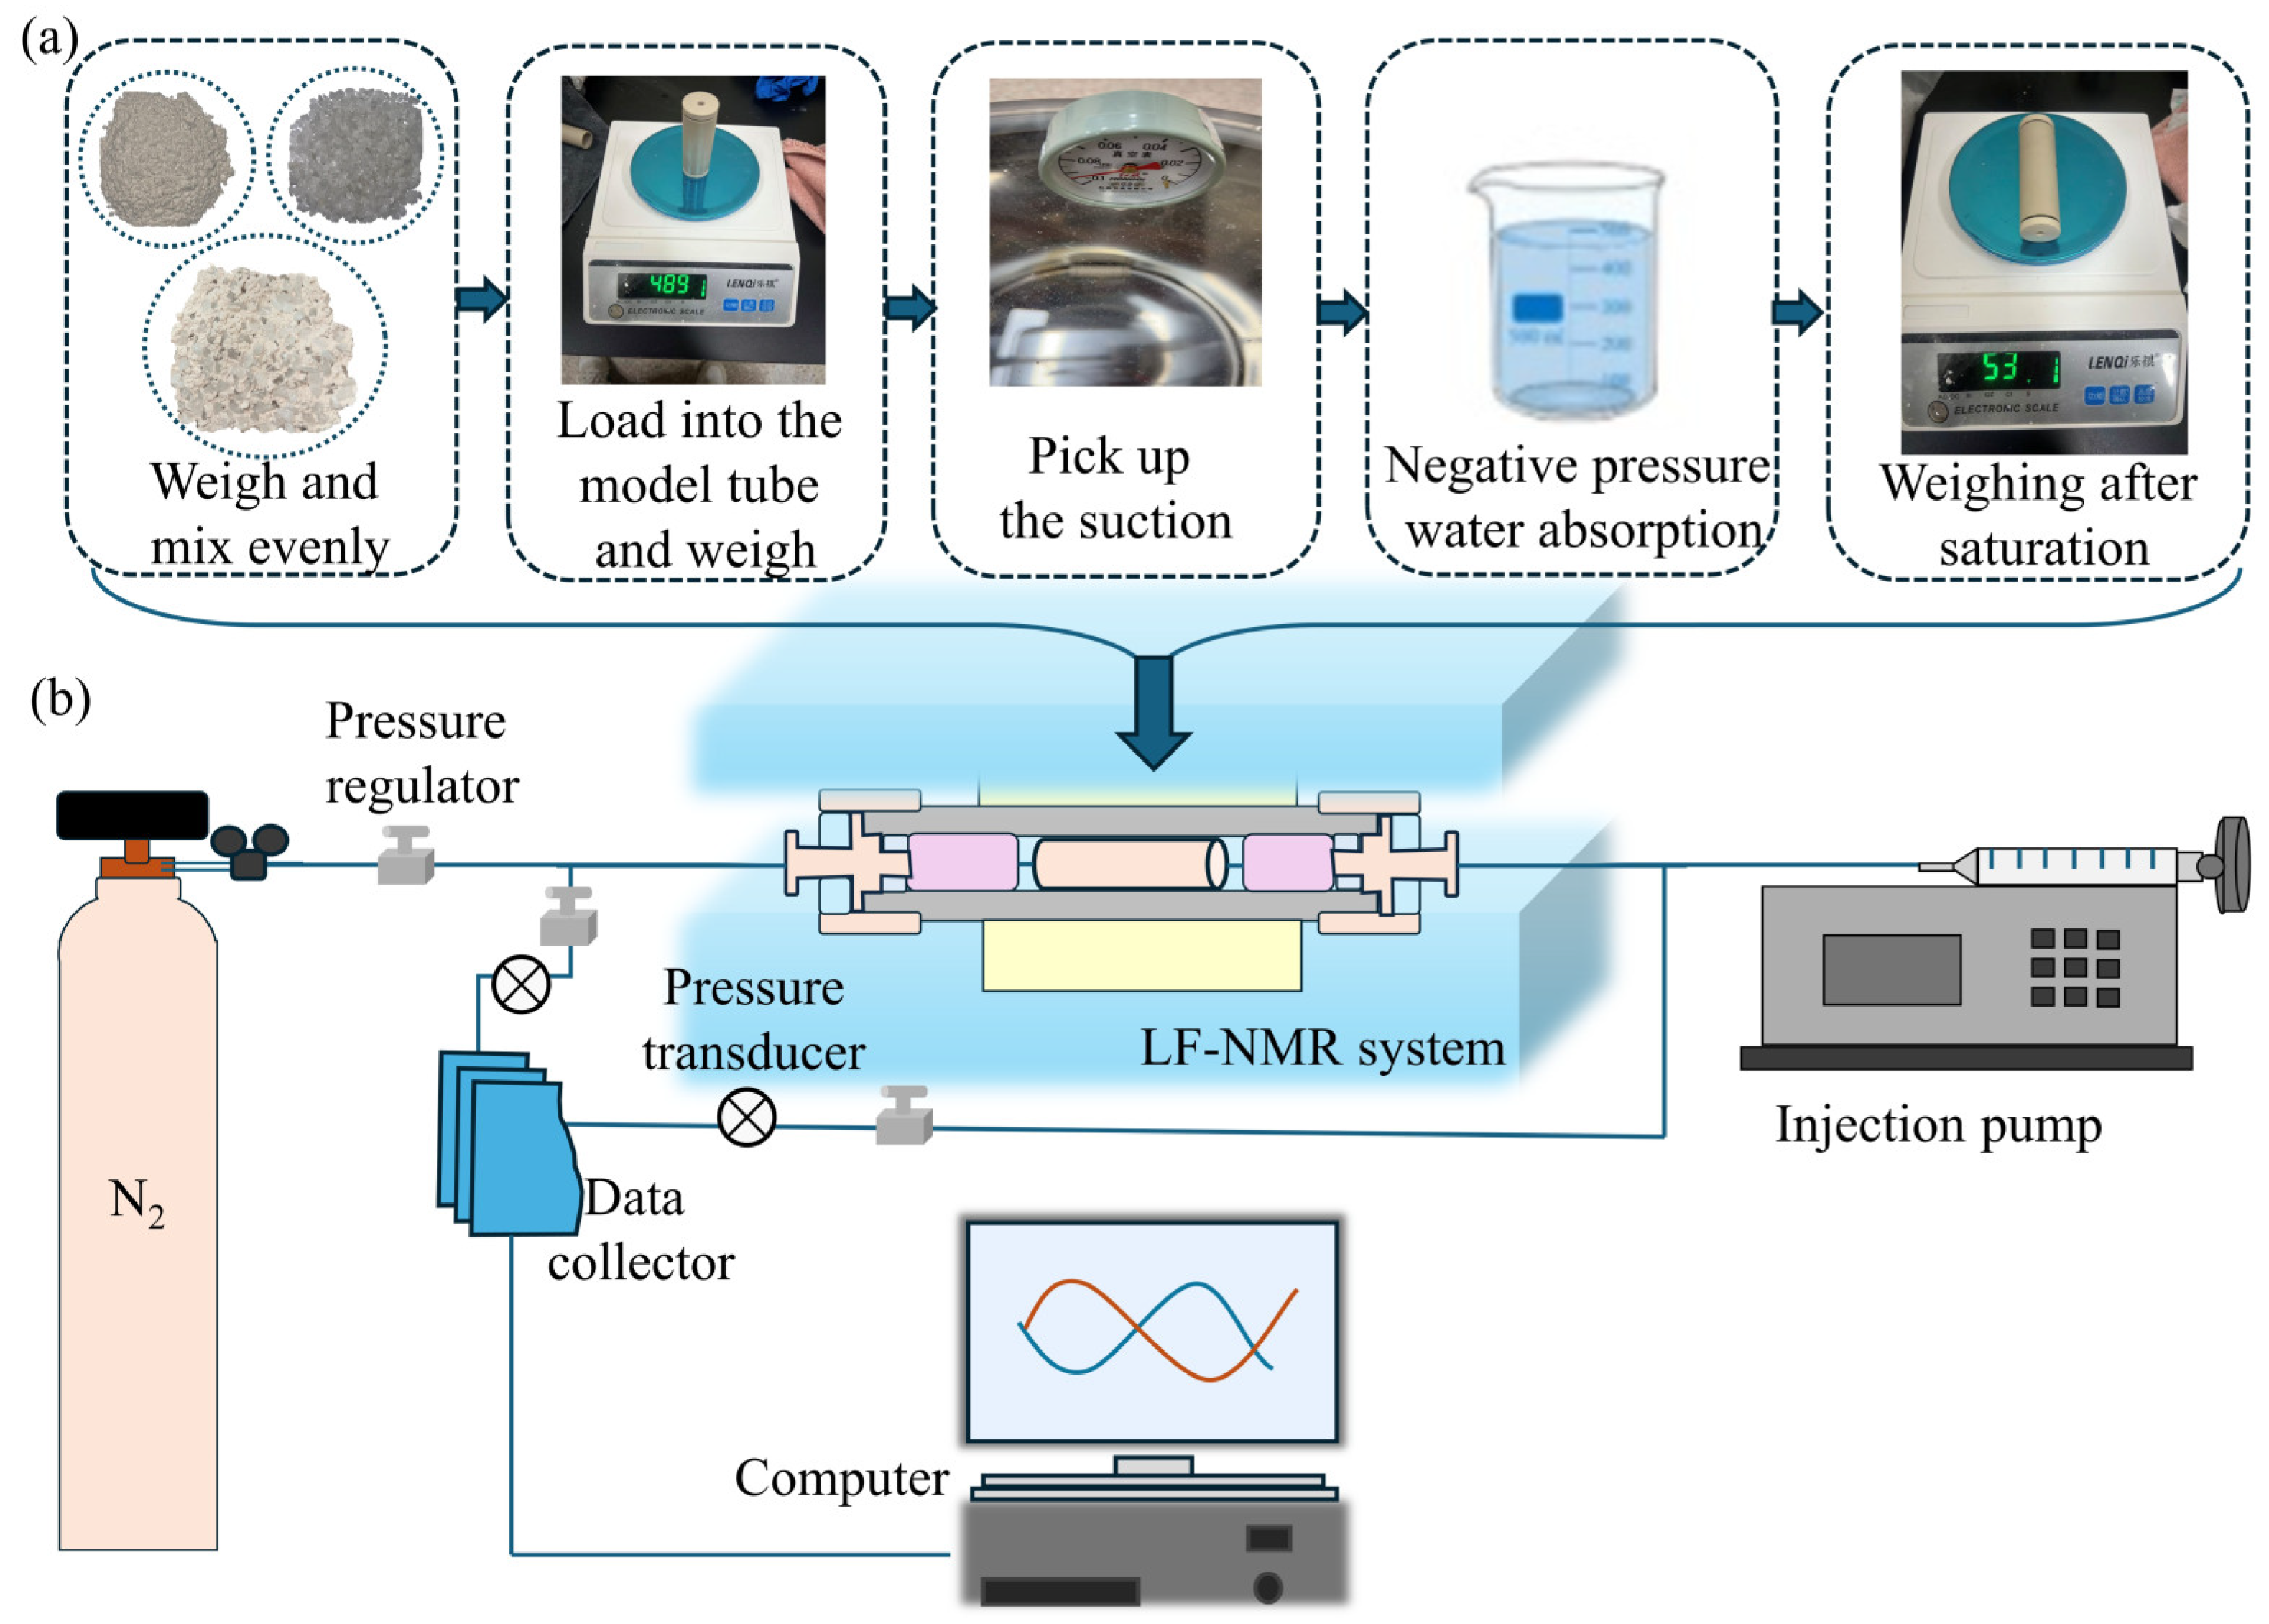
The sample underwent preparation via the vacuum saturation technique. Initially, dried montmorillonite and quartz sand were precisely weighed in a set mass ratio, totaling 13.7 g, which corresponded to a model tube volume of 13.7 cm3. To guarantee uniformity, the particles were thoroughly mixed prior to being carefully loaded into the model tube. Next, the assembled sample was placed inside a vacuum saturation chamber, where a vacuum pump was used to evacuate the air trapped within the pores. This vacuum state was maintained for 30 to 40 min to achieve a stable condition. Subsequently, deionized water was gradually introduced into the sample through an inlet valve. As depicted in Figure 2a, once atmospheric pressure was restored, the sample was left to soak for an additional four hours, ensuring complete saturation of the pore space. Finally, the total saturated mass of the sample was recorded, enabling the calculation of both water content and porosity.
After saturation, fix the sample with a heat-shrinkable tube and put it into the core holder. Then it is connected to the fluid circuit, nitrogen is flushed through the left side to remove impurities, and deionized water flows through the right side to ensure that bubbles are eliminated before use. Low-field nuclear magnetic resonance (LF-NMR) measurements were performed to obtain a T1–T2 correlation diagram, which was used to evaluate the pore structure and water absorption behavior. Before gas injection, a fluorinated liquid is used to apply liquid confining pressure to maintain the stability of the sample and prevent deformation. The nitrogen pressure gradually increased to 4 MPa, while the confining pressure remained 2 MPa higher than the gas pressure. Under these conditions, porosity and corresponding T1–T2 spectrum were measured to characterize the pore structure under high pressure.
During the experiments, the syringe pump operated at constant injection flow rates of 5, 10, and 21 μL·min−1. When scaled to represent typical field volumes, the chosen flow rates correspond to low-to-moderate-pressure drawdown rates. These rates conceptually align with the “low” (0.5–2.0 MPa/min) and “medium” (0.1–0.5 MPa/min) drawdown ranges observed in large-scale reservoir simulations. Published studies often simulate extraction in the laboratory using three pressure reduction rates: high (0.01–0.1 MPa/min), medium (0.1–0.5 MPa/min), and low (0.5–2.0 MPa/min) [44,45]. Meanwhile, pressure variations at both the inlet and outlet of the specimen were continuously monitored using a digital data acquisition system. T1–T2 correlation maps and T2 relaxation spectra were acquired under the different flow-rate conditions using the Niumag NMR Analysis Software provided with the MesoMR12-060H-I system, enabling a quantitative analysis of the evolution of pore distribution and porosity. The experiments were conducted at room temperature to ensure the reliability of the results while avoiding the complications introduced by low-temperature conditions. The experimental platform consisted of four main functional modules: the low-field nuclear magnetic resonance system, the gas supply and pressurization unit, the data acquisition and pressure monitoring unit, and the syringe pump circulation loop, as shown in Figure 2b. All experimental data were recorded and monitored in real time via the digital data acquisition system to ensure stable operation and maintain data integrity.

2.2. CFD–DEM Simulation

The Particle Flow Code (PFC6.0) software suite comprises two-dimensional (PFC2D) and three-dimensional (PFC3D) modules and represents a discrete element method (DEM)-based numerical framework with high extensibility and flexibility. The code can be redeveloped and recompiled to accommodate diverse research requirements. Derived from molecular dynamics theory, the PFC approach discretizes the simulated domain into assemblies of interacting spherical particles or particle clumps. Distinct material behaviors are represented by assigning appropriate particle properties and contact constitutive models. Because of its discontinuous, particle-based formula, PFC is not limited by the assumption of small deformation inherent in the method based on continuous medium, so it is very suitable for large deformation and discontinuous processes, such as particle rearrangement, separation, and fracture.
The coupled DEM–CFD approach was originally proposed by Tsuji et al. [46], and has since been extensively developed and widely applied to the investigation of multiphase flow systems involving gas–solid and liquid–solid systems. In this framework, the fluid phase is discretized into computational cells, and the governing equations of fluid motion are solved to describe the continuum behavior [47,48]. In this study, the CFD module embedded within the PFC package is employed to perform fluid–solid coupling, with FiPy3.1 (National Institute of Standards and Technology, Gaithersburg, Maryland, USA) adopted as the CFD solver [49]. FiPy is an open-source partial differential equation solver based on the finite volume method, offering high extensibility and computational flexibility. By interfacing FiPy with the PFC–CFD module, bidirectional exchange between the DEM and CFD components is achieved, enabling fully coupled DEM–CFD simulations of fluid–particle interactions.

2.2.1. Governing Equations for the Particle Phase

In the discrete element method (DEM), solid materials are represented as a collection of discrete particles, and the particle motion is described in the Lagrangian framework, strictly following Newton’s laws of motion [50]. In the PFC3D6.0 software, the motion control equations of a single particle can be expressed as follows:
d u p i d t = f m e c h + f f l u i d m + g
d ω p i d t = M I
where u p i represents the velocity vector of the i particle and t represents time; f m e c h is the resultant mechanical force acting on particles, including the contact force between particles and gravity; f f l u i d represents the fluid force exerted on the i particle; m is the mass of the i particle; g is the acceleration of gravity; ω p i represents the angular velocity vector of the i particle; M represents the resultant torque acting on the particle; I is the moment of inertia.

2.2.2. Governing Equations for the Fluid Phase

In this study, the continuous fluid phase is described within the Eulerian framework, and the fluid domain is discretized into finite volume units. Fluid motion is controlled by the local average Navier–Stokes equation, assuming that the fluid only occupies the pore space of porous media [51]. The governing equations of the fluid phase consist of the momentum conservation equation (Navier–Stokes equation) and the mass conservation equation (continuity equation), and are expressed as follows:
ρ f ε u t + ρ f ε u = ε u F p f + ε τ + ρ f ε g
ε t + ε u = 0
where ρ f denotes the fluid density, u is the fluid velocity vector, τ represents the viscous stress tensor of the fluid, and ε denotes the porosity of the fluid cell. The variable t corresponds to the mechanical computation time, and g is the gravitational acceleration vector. Fluid–particle interactions are incorporated into the fluid momentum equation in the form of a volume-averaged body force. Specifically, the drag force acting on a fluid cell is determined by summing the drag forces exerted by all particles within the cell and dividing the total force by the cell volume, which can be expressed as:
F b = Σ i = 1 N f d r a g i V c e l l
where F b denotes the volume-averaged body force exerted by the particle phase on the fluid cell, representing the contribution of particle–fluid interactions to the fluid momentum equation; f d r a g i is the drag force acting on the iii-th particle; and V c e l l denotes the volume of the corresponding fluid computational cell.

2.2.3. Particle–Fluid Interaction

The f f l u i d is the fluid–particle interaction force, which is made up of the drag force f d r a g and another part from the fluid pressure. The part of the fluid pressure consists of the buoyancy force f b and the pressure gradient force f p .
Therefore, the f f l u i d can be defined as follows:
f f l u i d = f d r a g + f b + f g
Since particles can intersect with more than one fluid unit, the drag forces exerted by fluid on particles are distributed based on the partial overlap between particles and fluid units. It should be noted that the fluid forces act on the center of mass of the particles, but the rotating torque is not applied to the particles. The drag force f d r a g can be calculated and expressed by the following formula:
f d r a g = 1 2 C d ρ f π r 2 u v u v ε
where C d denotes the drag coefficient; v is the particle velocity vector, and u represents the fluid velocity vector; ρ f is the fluid density; r denotes the particle radius; and is a correction factor accounting for the effects of the porous environment and local flow conditions on the drag force. In addition, the drag coefficient C d is strongly dependent on the particle Reynolds number and can be evaluated using the following empirical correlations:
C d = 0.63 + 4.8 R e p
where R e p denotes the particle Reynolds number, which characterizes the motion regime of particles in the fluid and is defined as follows:
R e p = 2 ρ f r n u v u f ε
The porosity correction factor , appearing in the drag correction term ε , is introduced to account for the influence of the porous medium on particle–fluid interactions, and its formulation is given below.
= 3.7 0.63 e x p 1.5 log 10 R e p 2 2
In addition to the drag force, particles are also subjected to the fluid pressure gradient force, which can be calculated using the following expression:
f g = 4 3 π r 3 p
Meanwhile, the buoyancy force acting on particles immersed in the fluid is determined according to Archimedes’ principle as expressed below:
f b = 4 3 π ρ f r 3 g
By considering all the aforementioned fluid-induced forces, the total fluid–particle interaction force f f l u i d acting on a particle can be expressed as the sum of these individual force components.
f f l u i d = f d r a g + 4 3 π ρ f r 3 g 4 3 π r 3 p = f d r a g + 4 3 π r 3 ( ρ f g p )
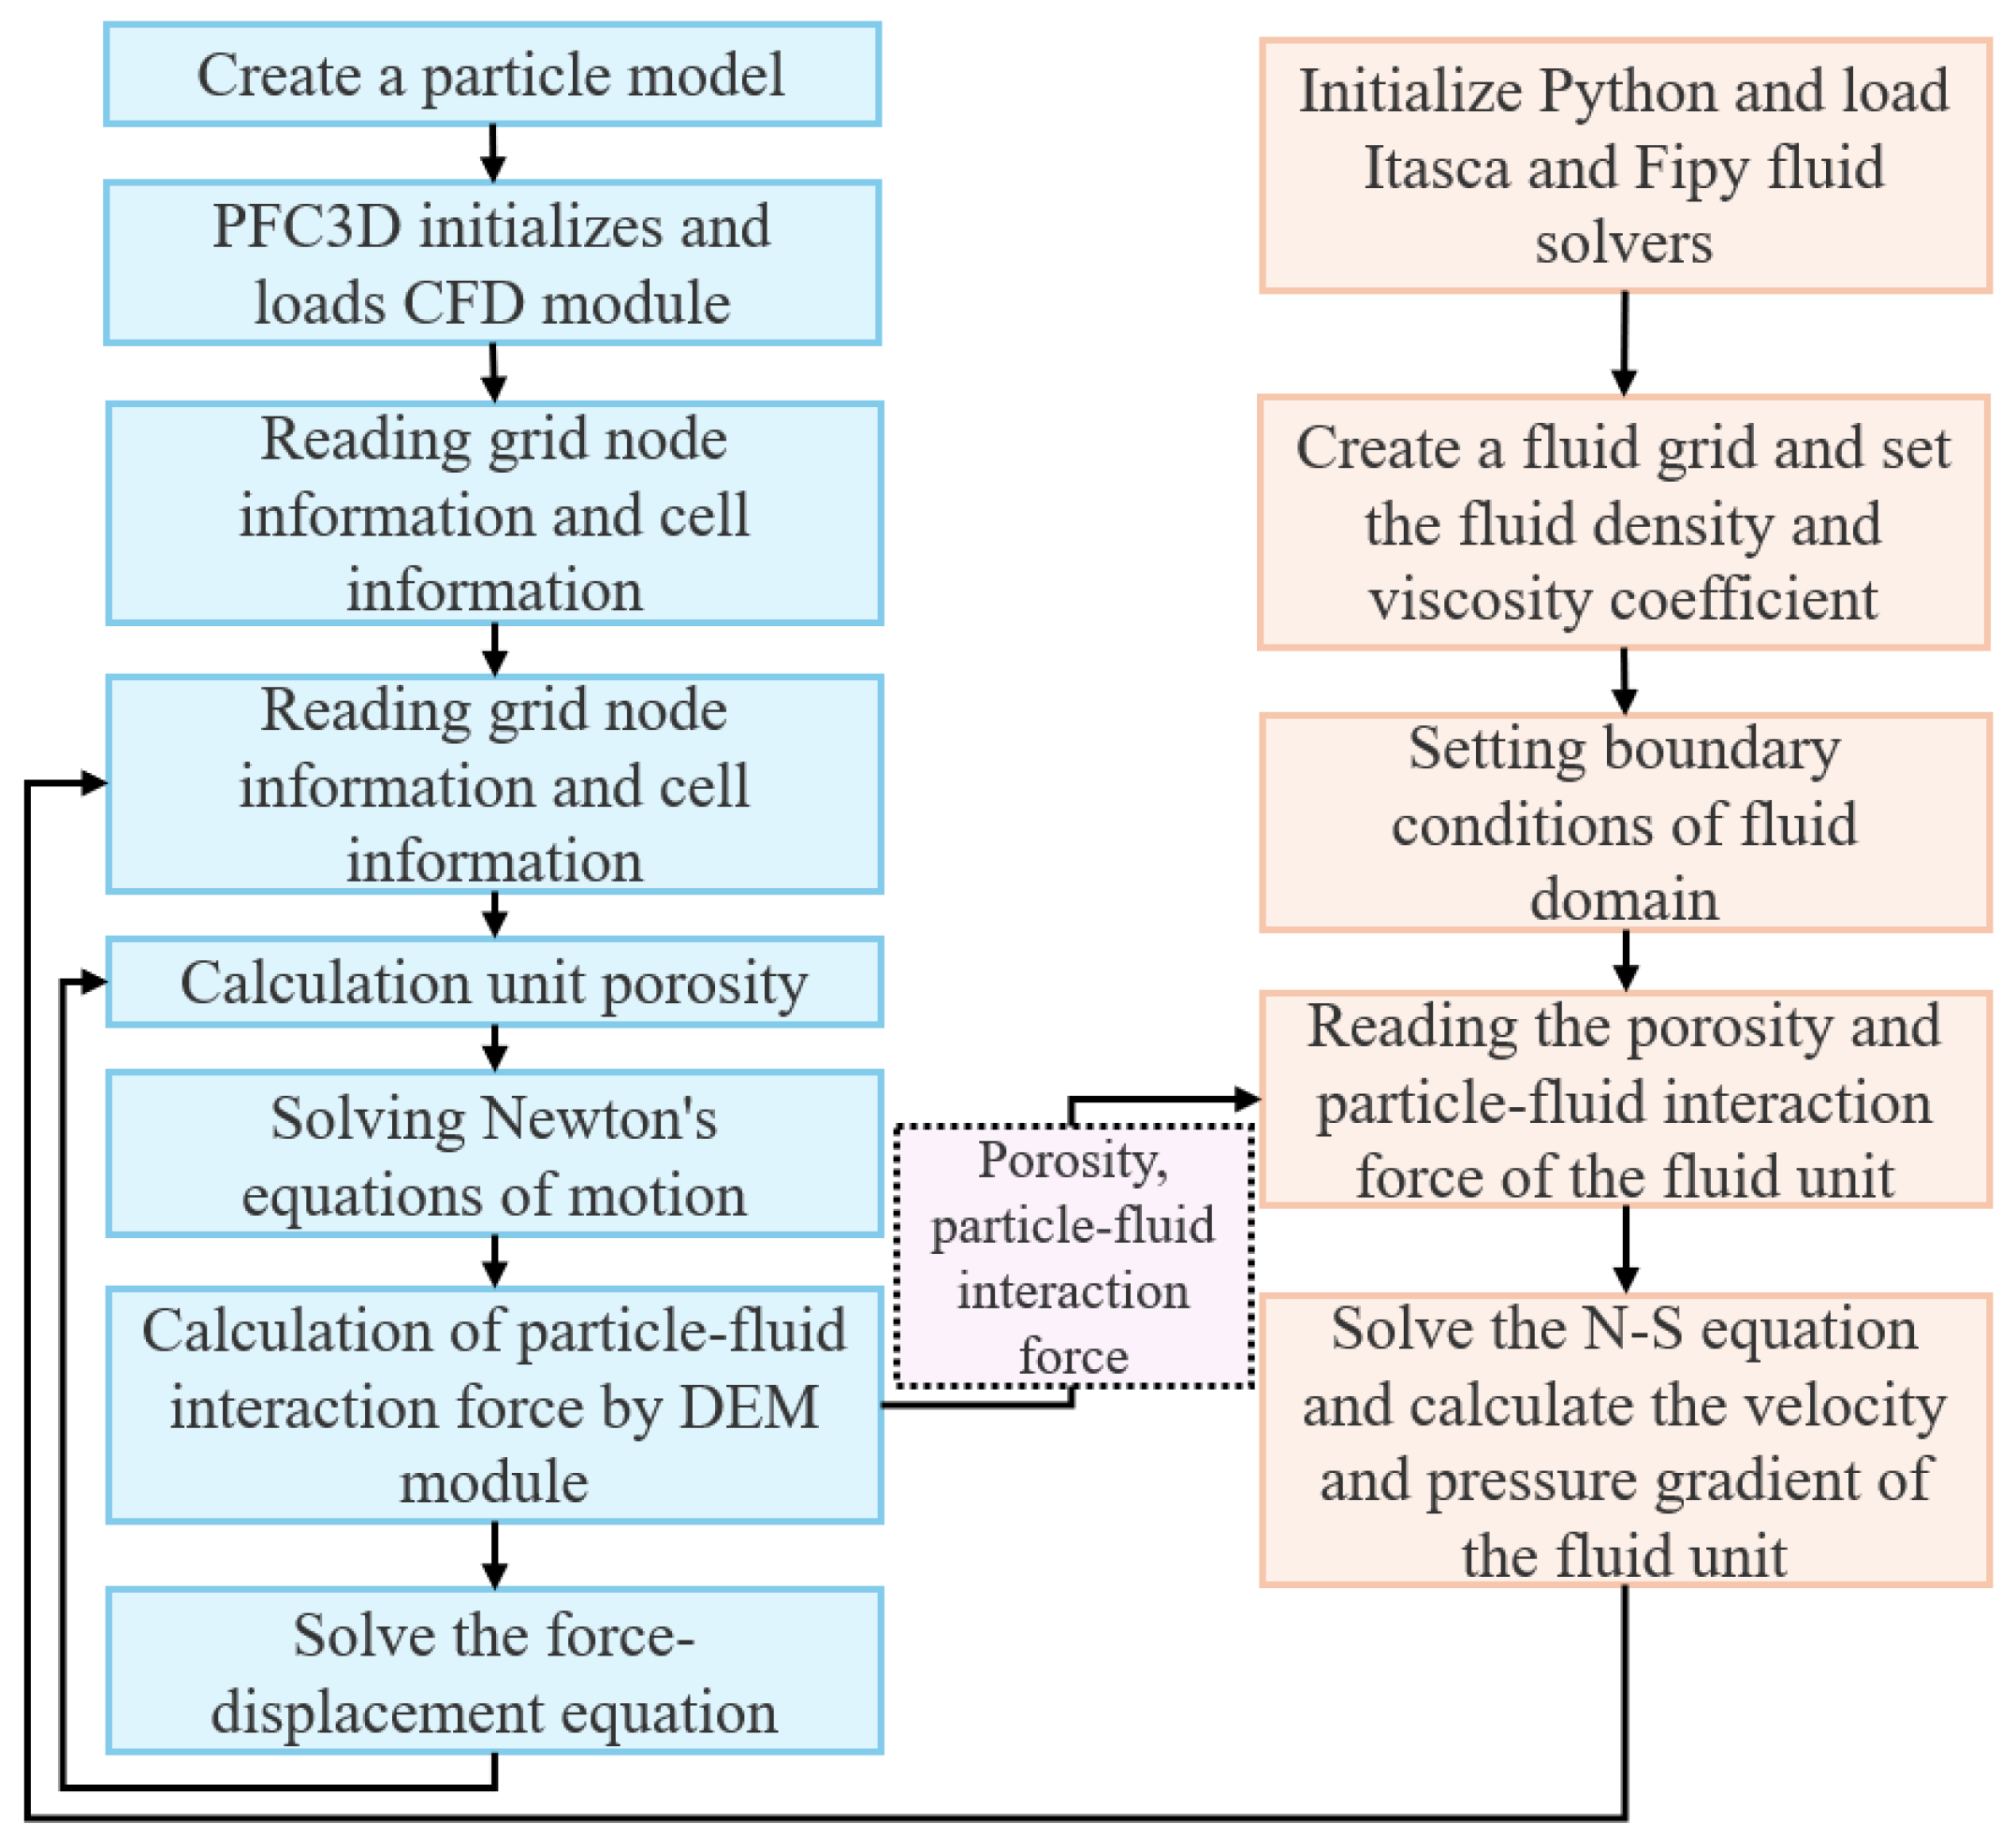
In this study, a two-way coupled CFD–DEM approach is employed to simulate particle–fluid interaction processes, as schematically illustrated in Figure 3. During the initialization stage, the DEM module constructs the particle assembly and defines the computational domain, while simultaneously reading the fluid mesh information and calculating the local porosity of each fluid cell. Within each coupling time step, the DEM module solves the particle motion by updating particle forces and displacements based on their dynamic states and computes the particle–fluid interaction forces, which are then transferred to the CFD module. After receiving the porosity field and interphase interaction forces, the CFD module solves the governing equations of the fluid phase to obtain the velocity field and pressure gradient within each fluid cell, and subsequently feeds the updated fluid forces back to the DEM module. Through this iterative information exchange, a fully two-way coupled solution of particle motion and fluid flow is achieved.

2.2.4. DEM–CFD Coupling Model

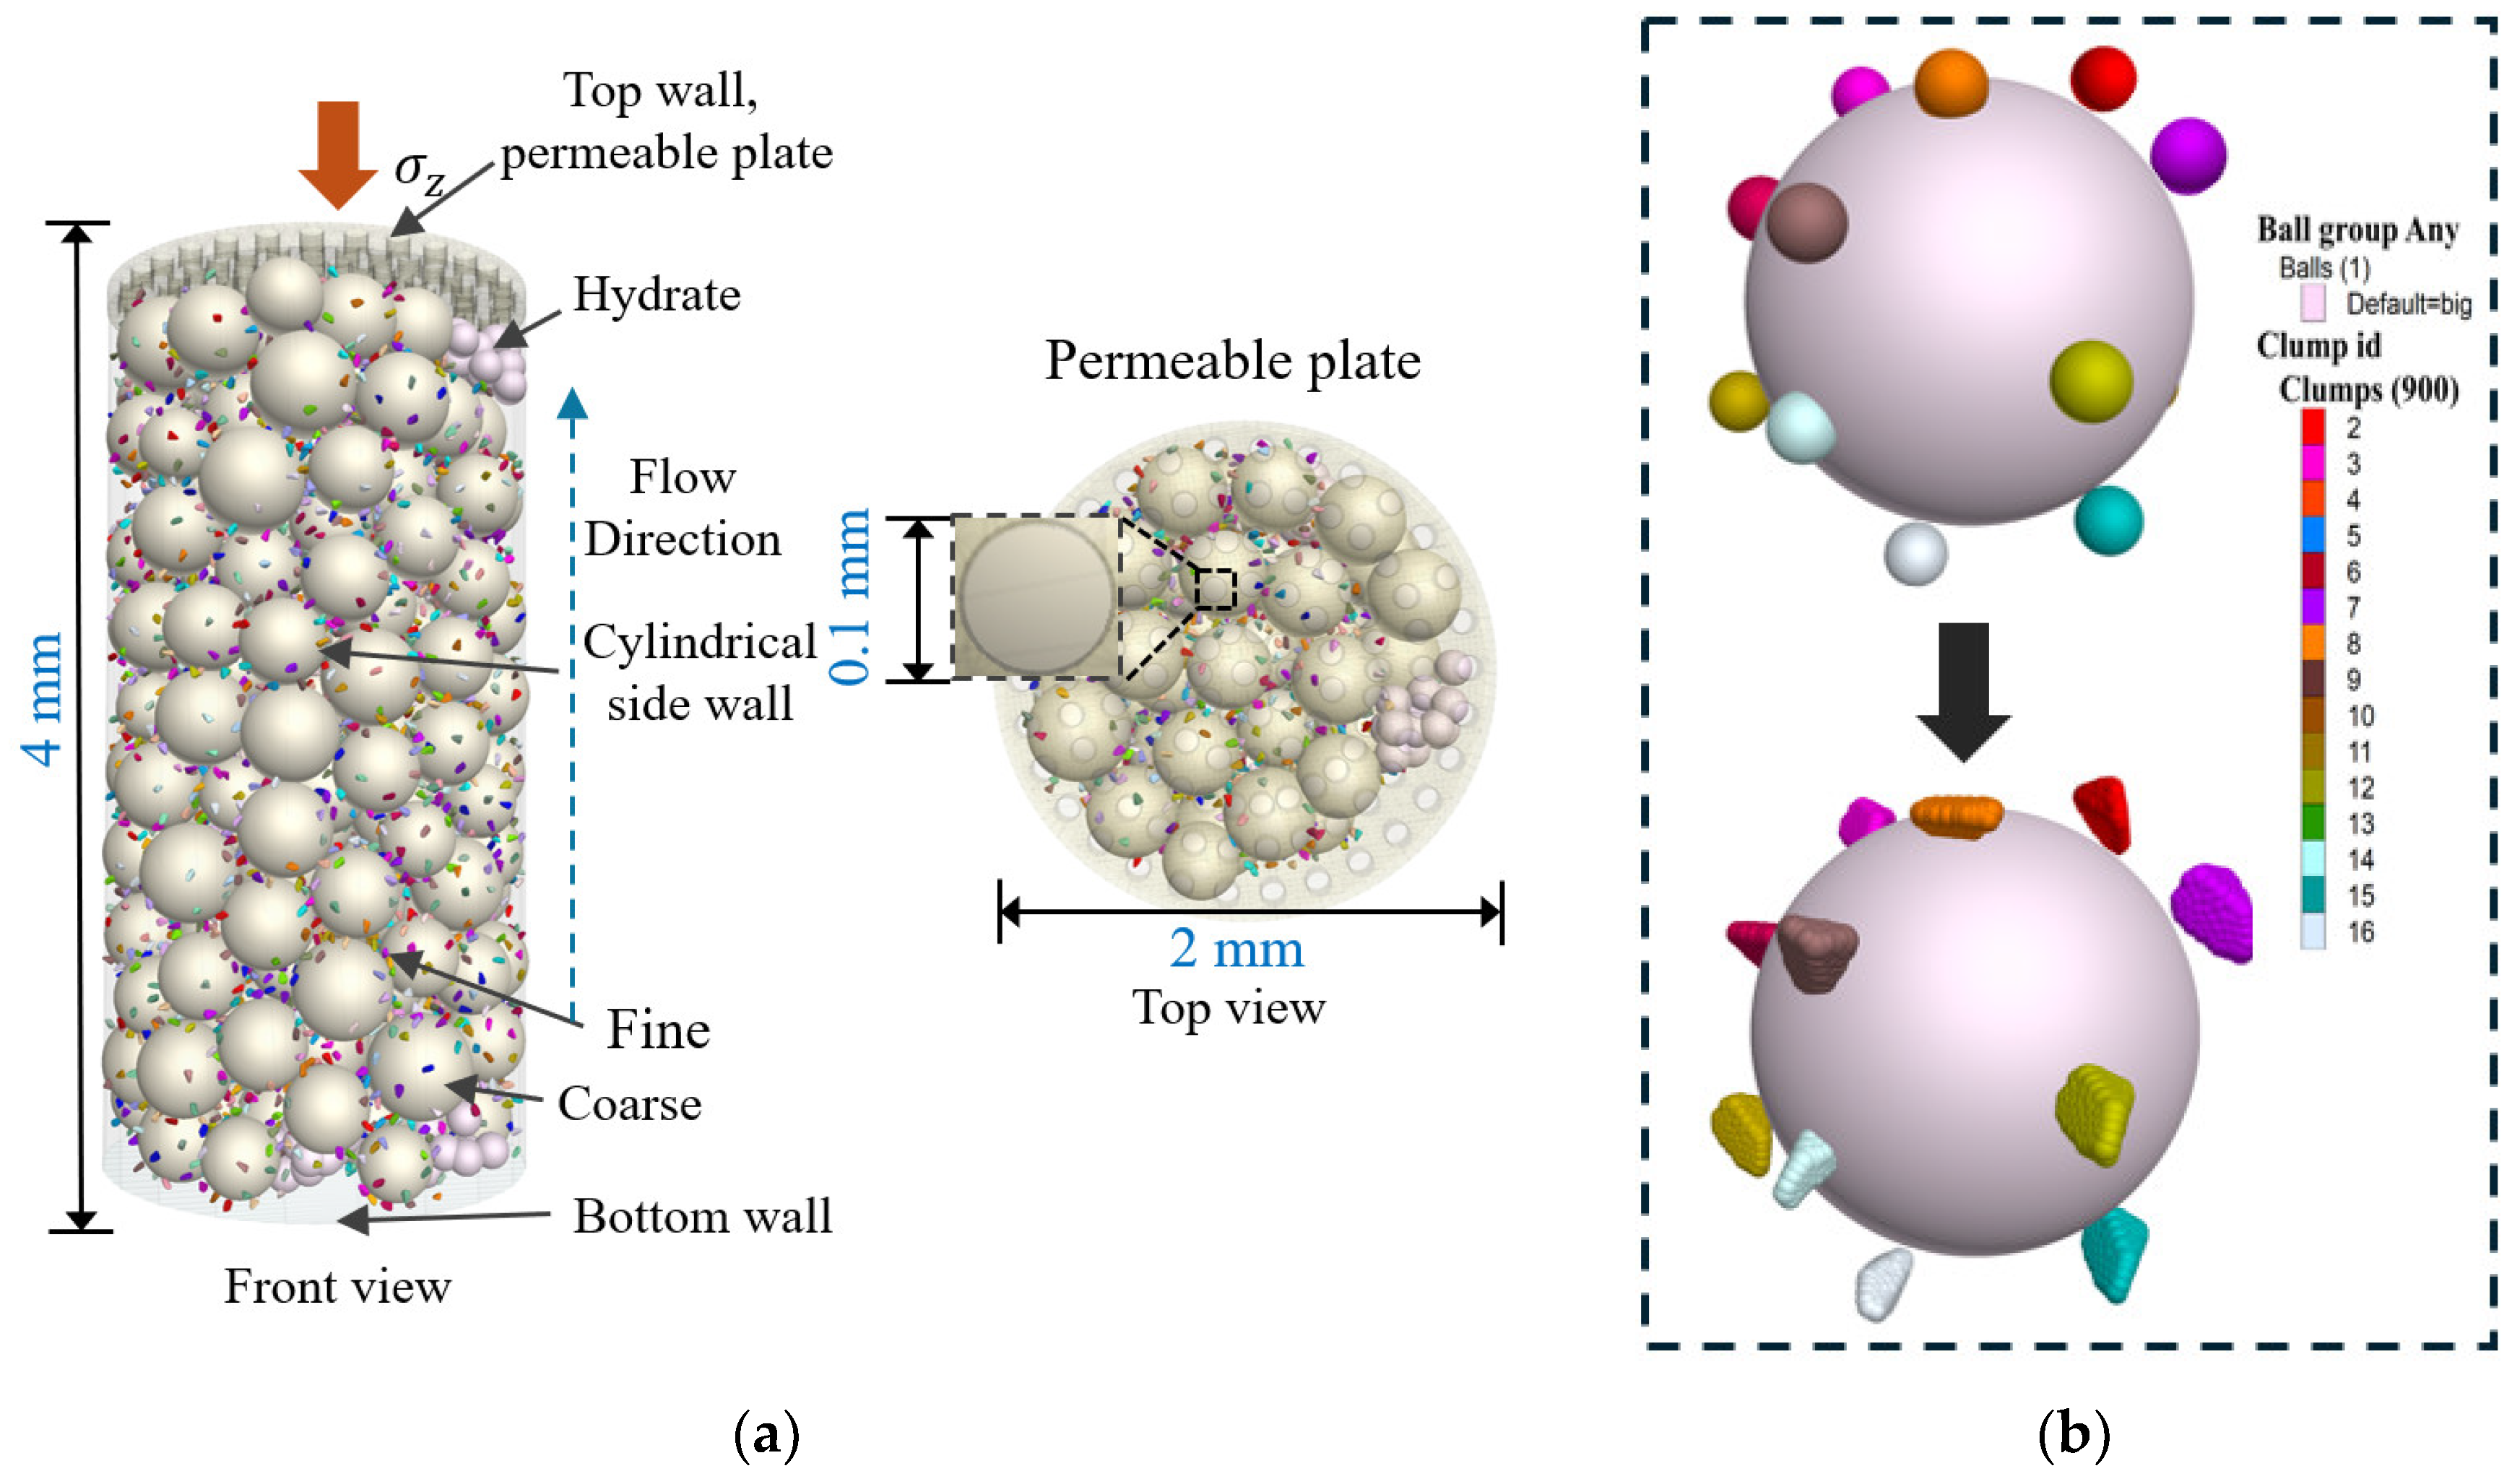
In this study, the discrete element method (DEM) is used to construct a pore-scale sand–montmorillonite two-phase particle model, which captures the structural characteristics of porous media under the condition of fine-particle attachment, as shown in Figure 4a. The calculation model consisted of a cylindrical specimen with a height of 4 mm and a diameter of 2 mm, which was proportionally scaled to improve pore-scale resolution and allow clearer observation of fine-particle migration and particle–fluid interactions within a representative elementary volume (REV). This scaling ensures that the key mechanisms governing fines transport and pore evolution remain consistent with those observed in the experiments. The sample is laterally confined by a rigid cylindrical wall with a fixed boundary at the bottom and a permeable plate at the top. The permeable plate contained holes with a diameter of 0.1 mm, which provides mechanical restriction for coarse particles and allows fluid and fine particles to pass freely, thus simulating the boundary conditions involved in simultaneous loading and seepage in the experiments. The seepage direction is aligned with the axial direction of the sample to ensure that the particle skeleton has mainly one-dimensional flow behavior.
The DEM solid phase comprised a multi-particle system including coarse and fine particles. Coarse particles had a uniform radius of 0.20 mm, while fine particles had a radius of 0.02 mm. Initially, sand particles (denoted as big1) and hydrate particles (denoted as big2) were generated within the computational domain according to a prescribed porosity to form the primary load-bearing skeleton. Particle generation was performed using a porosity-controlled packing algorithm, followed by dynamic relaxation and static equilibrium procedures to obtain a mechanically stable granular assembly with a uniform pore structure. To account for the non-spherical morphology of hydrate particles, the initially generated spherical hydrate particles (big2) were further replaced using the rblock method. Each spherical particle was substituted by a rigid block constructed from predefined geometric templates. While conserving particle mass and spatial distribution, random orientations were assigned to these rigid blocks to reproduce the complex geometric characteristics of hydrate particles, thereby enabling a more realistic representation of hydrate morphology within the DEM framework.
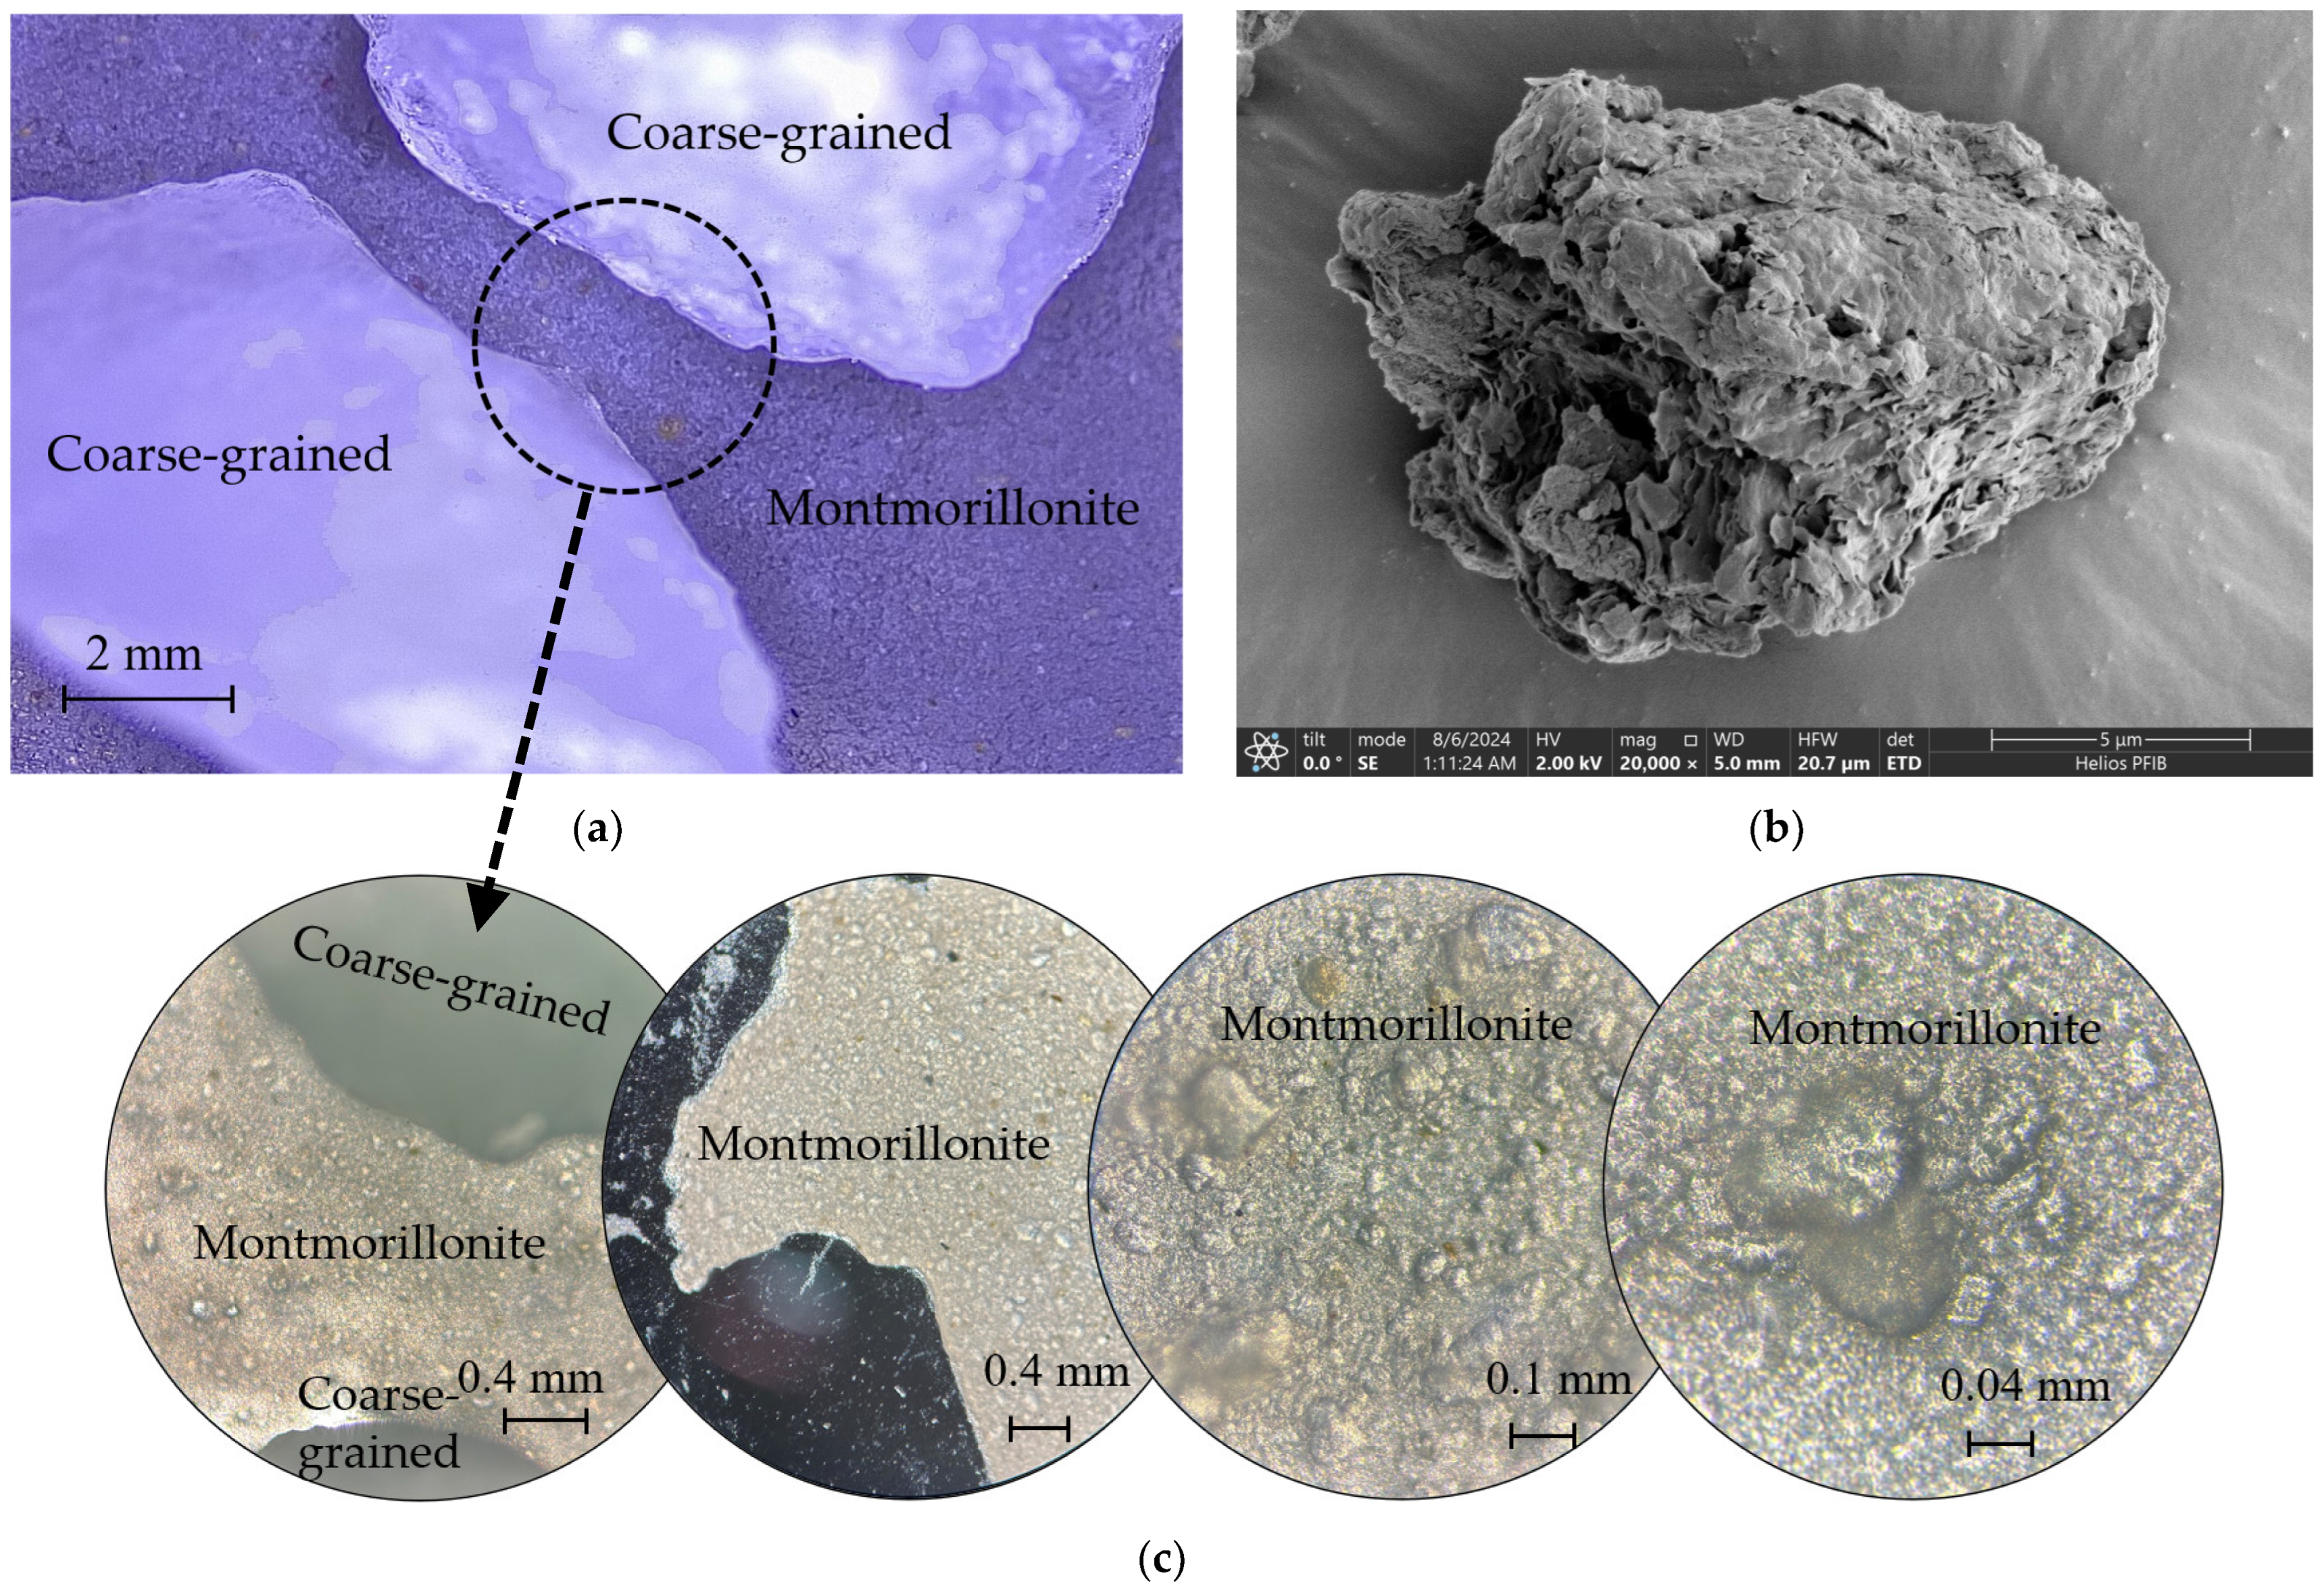
After the sand–hydrate skeleton reached mechanical equilibrium, montmorillonite fine particles (denoted as small) were introduced into the model. Based on microscopic observations (Figure 5), montmorillonite particles in aqueous environments are assumed to be predominantly distributed in an attached state on the surfaces of sand grains rather than occupying pore spaces as free particles. Based on this, the attachment configuration of montmorillonite particles on the surface of sand particles is constructed in the DEM model. The surface wrapping distribution method based on quasi-uniform spherical sampling is adopted. For each grain of sand (big1), 24 directional vectors are generated on the unit sphere centered on the particle centroid, and these vectors are approximately evenly distributed. Then, fine particles (small) are placed at a specified distance outside the surface of the sand particles in these directions, so that a uniform attachment configuration is obtained around the sand particles.
The sampling direction is generated using a strategy similar to the Fibonacci sphere method, in which the azimuth increases with a constant golden angle, and the polar coordinates are distributed in a hierarchical manner. Compared with the random distribution method, this method not only improves the spatial uniformity and reproducibility but also effectively avoids the artificial aggregation of fine particles in local areas. In terms of geometric positioning, the distance between the centers of fine particles and sand particles is defined as Rbig1 + Rsmall + gap, where gap represents a small predefined gap introduced to reduce initial particle overlap and excessive contact force. In addition, a small random disturbance (jitter) is superimposed on the basic distance to better approximate the irregular surface coverage in the real system and alleviate the artificial structure effect caused by the over-regular particle arrangement.
Furthermore, considering the pronounced irregular morphology of montmorillonite particles, representing them as ideal spheres is insufficient to capture their realistic geometric and mechanical behavior, as illustrated in Figure 4b. Therefore, after establishing the attachment configuration, the spherical montmorillonite particles were equivalently replaced by clump structures composed of multiple sub-spheres. While preserving the equivalent particle size, density, and spatial position, this replacement introduces non-spherical geometric characteristics. This treatment enables a more realistic representation of rotational constraints, geometric interlocking, and local pore-blocking effects associated with montmorillonite particles. The resulting sand–hydrate–montmorillonite granular assembly was subsequently adopted as the initial particle configuration for the coupled DEM–CFD simulations.
The main model parameters used in CFD–DEM simulations are summarized in Table 3. The contact model within the framework of the discrete element method is used to describe the contact behavior between particles. For the interaction between sand (big1) and montmorillonite particles (small), a linear contact model (linear) is adopted, that is, the linear relationship between contact force and relative particle displacement. Specifically, the contact force is represented by normal and tangential spring components, and the elastic deformation and friction effect between particles are calculated. Because of its similarity and high computational efficiency, this model is very suitable for capturing the interesting contact interaction in the sand montmorillonite particle system. For hydrate particles (big2), the linear parallel-bond contact model is adopted for their irregular geometry and potential fracture behavior. The model extends the conventional linear contact formula to express the bonding strength and fracture behavior between particles by adding parallel bonds. In this framework, hydrate particles interact through linear elastic contact force, and the bonding elements between particles impose additional mechanical constraints, which can simulate the deformation, bonding fracture, and structural failure of hydrate particles under seepage and stress conditions. In turn, the model is very suitable to represent the mechanical response and degradation mechanism of hydrate particles in the coupled liquid–solid interaction environment.

2.2.5. Numerical Implementation Procedure

In order to systematically and quantitatively study the influence of fine-particle content and inlet flow velocity on seepage–particle interaction behavior in sand–montmorillonite systems, a series of CFD–DEM simulation cases is designed, and the detailed configuration is summarized in Table 4. All simulation cases adopt the same initial particle configuration and boundary conditions but differ only in two key control parameters: the mass fraction of fine particles and the inlet flow rate. In order to better represent the actual geological conditions, the initial simulation state is set as fluid pressure p = 12 MPa and effective stress σ = 2 MPa in overlying strata [55]. The simulations were conducted at room temperature to minimize uncertainties related to thermal effects and to focus on the primary behavior of particle migration and seepage. The total simulation duration in each case is kept at 10 s, after which the simulation automatically pauses, and results are obtained.
In this study, the concentration of fine particles is indirectly controlled by the pre-described particle volume fraction relationship. Specifically, the relative proportion of coarse particles and fine particles is first determined based on a predetermined volume fraction ratio. After coarse particles are generated and the total number is determined, the number of fine particles attached to the surface of coarse particles is adjusted accordingly, so as to construct initial particle aggregates with different fine-particle contents. The obtained fine-particle concentration is then converted into equivalent mass fraction, so that quantitative comparison can be made between different simulation situations.
Based on this approach, two representative fine-particle concentration levels were considered, namely 0.02 wt% and 0.2 wt%, corresponding to low and relatively low fine-particle contents, respectively. This selection was intended to highlight the lower-bound influence of naturally occurring fines, where even relatively small contents can still induce measurable migration, localized retention, and pore-structure adjustment under seepage flow. The inlet flow velocities were set to 0.05 m/s, 0.5 m/s, and 1 m/s to cover low-, intermediate-, and high-velocity seepage conditions. Among these cases, Cases 1–3 varied the inlet flow velocity under low fine-particle concentration conditions to examine the influence of seepage intensity on system response, whereas Case 4 increased the fine-particle concentration at a fixed inlet flow velocity to investigate the effects of fine-particle content on seepage behavior and particle evolution characteristics.

3. Results and Discussions

3.1. Sediment Morphology and Index Properties

To better characterize the morphology and microstructural features of fine particles, multiscale observations were conducted using scanning electron microscopy (SEM) and optical microscopy. Dried samples were examined using a scanning electron microscope (SEM, Tescan MIRA4, Suzhou Zhongyan Technology Co., Ltd., Suzhou, China) at a magnification of 20,000×. In addition, samples from the micromodel were observed under an inverted metallurgical microscope (IE200M, Sunny Optical Technology, Yuyao, China) at magnifications of 5×, 10×, and 50×, and the images were captured using a digital camera (Touptek U3CMOS, 10 MP; ToupTek Photonics Co., Ltd., Hangzhou, Zhejiang, China). The obtained images are presented in Figure 5.
The images clearly reveal the morphological characteristics and spatial distribution of montmorillonite particles. As shown in Figure 5b, under dry conditions, montmorillonite particles exhibit a typical clustered morphology, consisting of aggregates formed by stacked platy units with relatively smooth surfaces. As a representative clay mineral, montmorillonite is characterized by a pronounced layered crystal structure and plate-like stacking, which endows it with a high specific surface area and strong surface adsorption capacity. Consequently, montmorillonite particles can interact strongly with water molecules and surrounding particles.
These microstructural characteristics lead to high flow resistance of montmorillonite in porous media and promote the formation of narrow and tortuous channels, which have an important impact on the evolution of pore structure and the formation and stability of hydrate. In addition, the strong intergranular bonding of montmorillonite can significantly change the mechanical behavior of sediments. This effect becomes particularly significant in the process of hydrate formation and decomposition, in which particle migration may be inhibited, and pore connectivity may be further reduced. Generally speaking, the influence of montmorillonite on seepage behavior and structural evolution in porous media is mainly attributed to its remarkable viscous properties and unique microstructure characteristics.

3.2. Effects of Flow Velocity on Pore Structure and Particle Migration Characteristics

The behavior of fine particles in coarse-grained sediments plays an important role in the evolution of pore structure and particle migration characteristics. In this paper, the influence of montmorillonite on pore-structure stability and particle-migration behavior under different flow rates was systematically studied. Montmorillonite, as a typical clay mineral, has strong surface adsorption capacity and remarkable swelling behavior, which is beneficial to its participation in pore-structure reconstruction during seepage.
Low-field nuclear magnetic resonance (LF-NMR) T2 relaxation spectra were acquired under different flow velocities, and characteristic parameters, including peak width, peak-area proportion, peak relaxation time, and total spectral area, were analyzed to quantitatively evaluate the influence of montmorillonite on water migration behavior and pore-structure stability. According to the principles of LF-NMR measurements, the T2 relaxation of pore fluids in porous media is governed by three independent mechanisms: bulk relaxation, surface relaxation, and diffusion relaxation. However, in sedimentary systems dominated by small pores and characterized by gas–water coexistence, the contributions of bulk relaxation and diffusion relaxation can be neglected [56,57]. Consequently, the T2 relaxation time in this study is primarily controlled by surface relaxation and can be expressed as follows:
1 T 2 = κ S V = F s κ r
where S represents the pore surface area; V represents pore volume; F s is a geometric factor, which shows the influence of pore geometry on the surface relaxation process. For spherical pores, F s = 3 , and for cylindrical pores, F s = 2 . Parameter κ represents the transverse surface relaxation coefficient of porous media, which reflects the interaction strength between pore surfaces and pore fluid.
For the sand–montmorillonite mixed porous medium employed in this study, considering the heterogeneity of pore structures and the complexity of mineral composition, the T2 relaxation relationship under surface-relaxation-dominated conditions can be further expressed as follows [58]:
κ = κ c l a y × V c l a y + κ q t z × V q t z
where κ c l a y represents the lateral surface relaxation rate of montmorillonite, and V c l a y represents the volume fraction of montmorillonite in the model; κ q t z represents the transverse surface relaxation coefficient of quartz sand; and V q t z represents the volume fraction of sand particles in the model. These parameters are used to quantify the weighted contribution of different mineral components to the overall surface relaxation behavior of sand-montmorillonite mixed porous media.
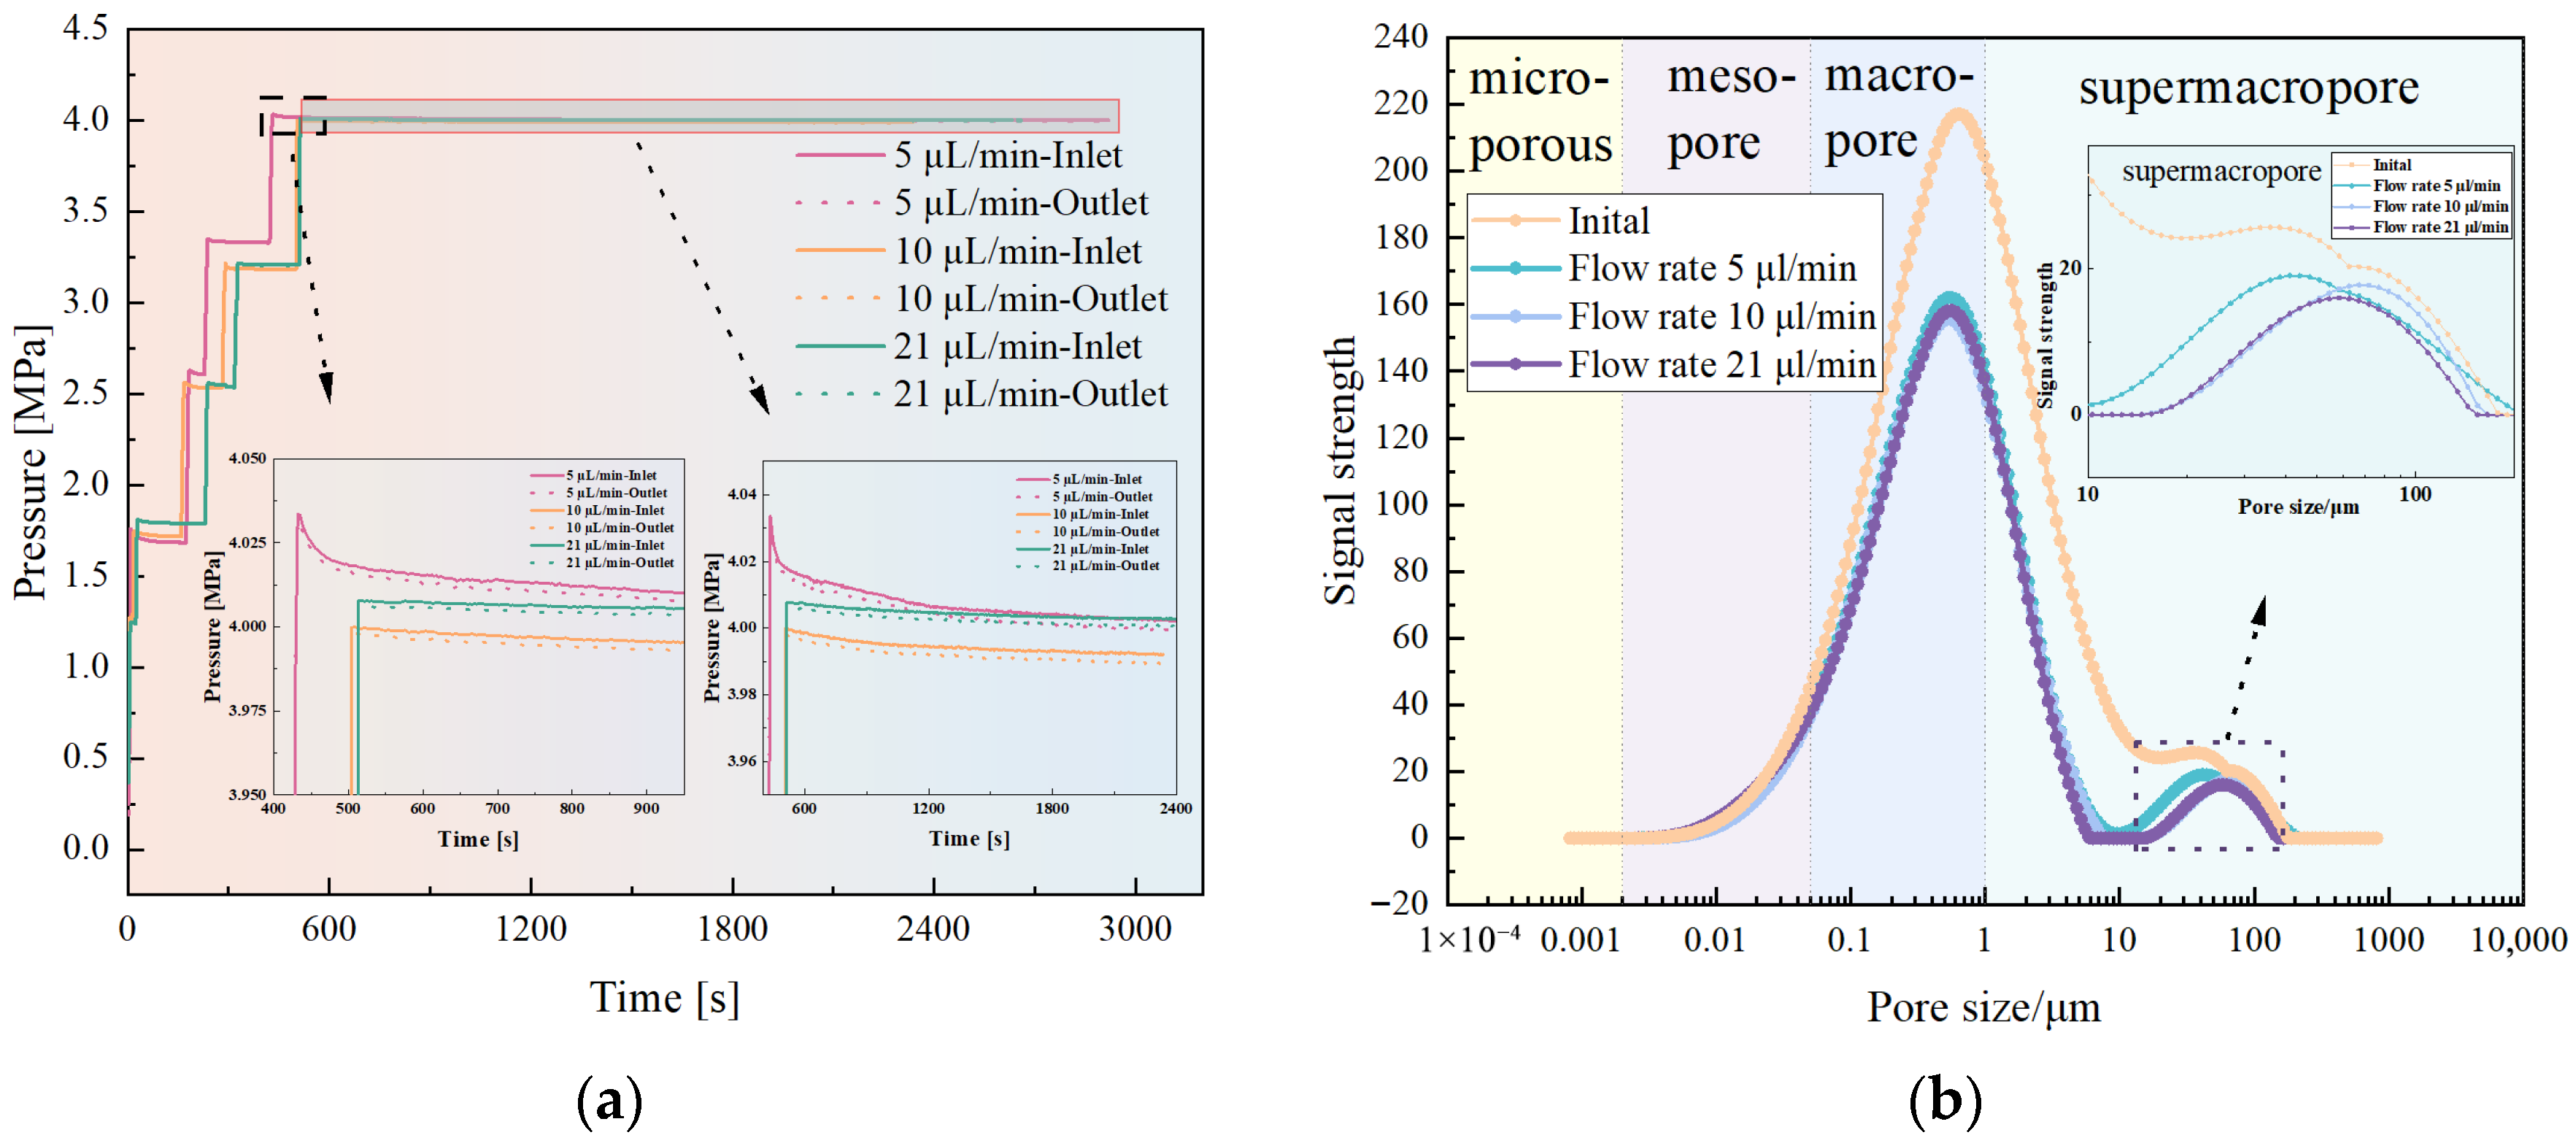
During the experiment, the digital data acquisition system was used to continuously monitor the evolution of fluid pressure to verify whether the target pore pressure was successfully established by nitrogen injection. As shown in Figure 6a, the fluid pressure gradually increased from the initial state close to atmospheric pressure, reached a stable value of 4 MPa at about 600 s, and then remained basically unchanged. This result confirms that the target fluid pressure of 4 MPa was successfully applied and maintained throughout the experiment. At different fluid injection rates (5 μL·min−1, 10 μL·min−1, and 21 μL·min−1), the evolution of fluid pressure shows a consistent increasing trend and similar stable behavior. Once the target pressure is reached, no obvious fluctuations are observed under any flow condition, which indicates that the influence of injection flow rate on pressure stability can be within the research scope. In addition, the pressure curve shows that there is a slight difference between the inlet and outlet pressures, although the difference is small and consistent with the expected pressure loss caused by internal flow resistance of the sample. In brief, these results show that nitrogen is successfully injected and maintained at the target pore pressure of 4 MPa, which provides a reliable experimental basis for the subsequent analysis of pore-structure evolution and water-absorption behavior.
As shown in Figure 6b, the NMR signal intensity varies markedly with pore size, indirectly reflecting the distribution of water across different pore scales. Based on the T2 spectral characteristics, the pore system can be classified into four categories: micropore (bound water) region, mesopore region, macropore region, and supermacropore region. Specifically, micropores correspond to pore sizes smaller than 0.002 µm, mesopores to 0.002–0.05 µm, macropores to 0.05–1 µm, and supermacropores to pores larger than 1 µm [59]. T2 data obtained under four conditions were analyzed, including the initial state and seepage conditions with flow rates of 5, 10, and 21 μL·min−1. Owing to the strong water-absorption and swelling characteristics of montmorillonite, the distribution and migration of pore water were significantly altered, particularly under low-flow conditions where the influence of clay minerals is more pronounced. In the macropore region, the maximum signal intensity in the initial state was 217.18, corresponding to an equivalent pore size of approximately 0.64 µm. With increasing flow velocity, the signal intensity in this region exhibited an overall decreasing trend. At a flow rate of 5 μL·min−1, the signal intensity decreased to 162.12, with the corresponding pore size reduced to 0.56 µm, representing a reduction of approximately 25.86% relative to the initial state. When the flow rate increased to 10 μL·min−1, the signal intensity further declined to 155.63, corresponding to a pore size of 0.52 µm. At the highest flow rate of 21 μL·min−1, the signal intensity slightly increased to 158.22 but remained significantly lower than the initial value, indicating that increasing flow velocity stabilizes water distribution in macropores while enhancing the contribution of smaller pores.
In the supermacropore region, the initial signal intensity is 25.66, and the corresponding equivalent pore radius is about 35.88 µm. With the increase in flow rate, a more obvious attenuation of signal intensity was observed. At 5 μL·min−1, the signal intensity decreased to 19.03, while the corresponding pore size increased to 44.19 µm. At 10 μL·min−1, the signal intensity further decreased to 17.75, with a pore size of 67.03 µm. At 21 μL·min−1, the signal intensity was 15.97. Although a slight rebound was observed, it was still far below the initial level. Generally speaking, the coupling effect of flow velocity and pore structure has a significant influence on T2 signal intensity. With the increased flow velocity, the signal intensity in the macropore and supermacropore areas usually decreased, and more significant attenuation is observed in the supermacropore areas, especially under the conditions of medium and high flow rate. These results show that higher flow velocity promotes the redistribution of pore water, leads to more uniform fluid distribution on the pore scale, and reduces the advantage of macropores in the whole NMR response.
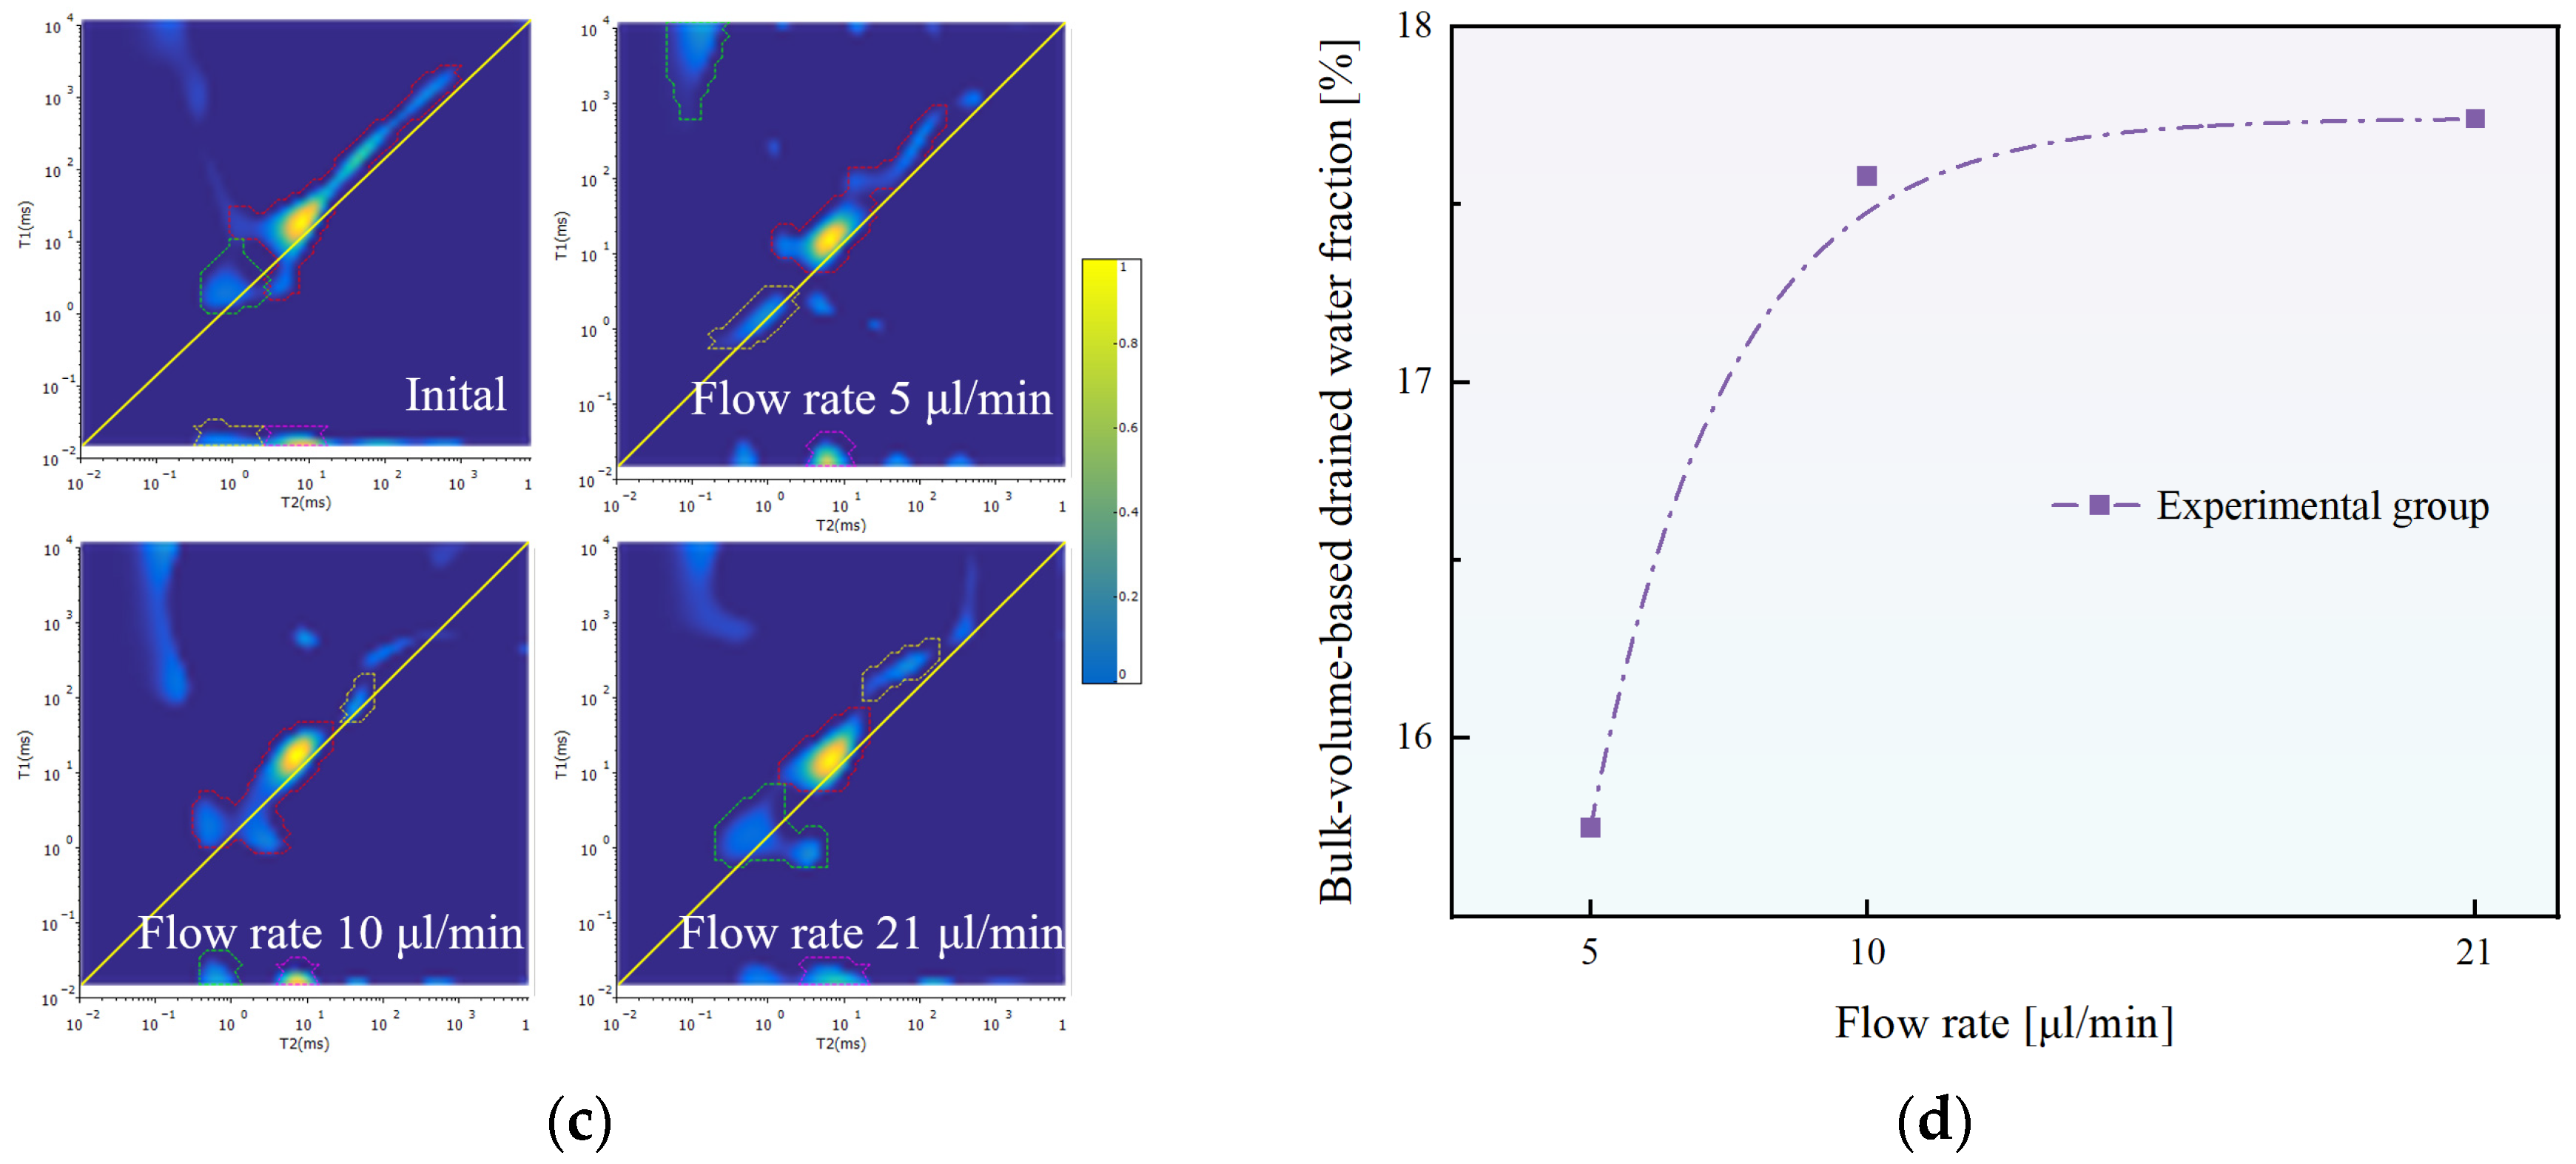
As shown in Figure 6c, comparison of the T1–T2 correlation maps obtained under four different flow conditions (initial state, 5 μL·min−1, 10 μL·min−1, and 21 μL·min−1) reveals pronounced changes in both signal intensity and distribution patterns with increasing flow velocity. In the initial state, the T1–T2 signals are mainly concentrated in regions with relatively low T1 and T2 values, exhibiting high intensity and a compact distribution. This indicates a relatively uniform distribution of pore water, with water molecules residing in stable relaxation environments. When the flow velocity increases to 5 μL·min−1, the signal distribution begins to slightly expand while the overall signal intensity decreases, suggesting enhanced fluid mobility within the pore space. Under this condition, the residence time of a portion of pore water is reduced, leading to weakened NMR signal responses. As the flow velocity further increases to 10 μL·min−1, the signal distribution on the T1–T2 plane expands more noticeably, accompanied by a significant reduction in signal intensity compared with lower flow conditions. This behavior indicates intensified pore-scale fluid dynamics and increasingly dispersed relaxation behavior of water molecules. At the highest flow velocity of 21 μL·min−1, the signals extend over a much broader region of the T1–T2 plane, while the overall intensity remains at a relatively low level. This reflects markedly enhanced fluid mobility under high-flow conditions, resulting in a more uniform distribution of water molecules across different pore scales and a more dispersed spectral response. Overall, increasing flow velocity leads to a gradual attenuation of T1–T2 signal intensity and a concurrent expansion of signal distribution, demonstrating that seepage intensity exerts a strong influence on pore-water distribution and molecular dynamic behavior.
Figure 6d shows the change in drainage volume fraction η(k), normalized by the total sample volume under different injection flow conditions. This parameter is introduced to quantitatively characterize the ratio of pore water discharged from the core to the total core volume, so as to provide a measurement of drainage efficiency under different seepage intensities. The calculation of η k refers to the low-field nuclear magnetic resonance (LF-NMR) T2 spectrum obtained under the condition of complete saturation, which is used as the calibration baseline. By comparing T2 signal intensity in different seepage stages with T2 signal intensity in the fully saturated state, the degree of pore-water drainage can be quantitatively evaluated. The drainage volume fraction is defined as follows:
η k = φ 0 K M k
where M k represents the integrated area of the T2 spectrum under the condition of k injection flow, φ 0 represents the porosity under the initial state of complete saturation, K = φ 0 / M ( 0 ) is the calibration coefficient, and M ( 0 ) is the integrated area of the T2 spectrum under the condition of complete saturation. This definition enables the NMR signal change to be directly converted into the drainage volume fraction normalized by the total core volume, thus avoiding the scale uncertainty associated with characterizing displacement efficiency only based on the relative signal change.
As shown in Figure 6d, the drainage volume fraction η k increases markedly as the flow rate rises from 5 to 10 μL·min−1, indicating that higher flow velocities effectively enhance pore-scale drainage and promote the displacement and removal of a larger volume of pore water. When the flow rate is further increased to 21 μL·min−1, the growth of η k becomes significantly attenuated and gradually approaches a plateau. This trend suggests that within the low-to-intermediate flow-rate regime, increasing flow velocity is the dominant factor governing pore-water drainage. In contrast, under high-flow conditions, the volume of removable water becomes increasingly constrained by pore-structure characteristics, the distribution of bound water, and the attachment state of fine particles. Consequently, further increases in flow velocity exert a diminishing influence on the drainage volume fraction.
Through a comprehensive analysis of the T1–T2 correlation diagram and T2 relaxation data, we can fully understand the role of fine particles in water and gas migration in the sand-montmorillonite system. The results show that under the condition of increasing pore pressure, the control of supermacropore area on fluid migration becomes more important. Specifically, at a higher flow rate, the preferential flow path shifts from smaller and medium pores to larger supermacropores, which reflects the reconfiguration of the flow-induced pore-scale migration path. These findings also highlight the influence of fine particles, which can significantly change permeability and flow behavior by changing pore structure. In addition, the mechanism determined in this paper is related to the gas hydrate system, because the change in water content during hydrate formation and decomposition also affects the behavior of fine particles, thus affecting the structure and transmission characteristics of porous media. These comprehensive observations provide valuable insights into the coupling between pore structure, fine particles, and fluid dynamics, which is very important for understanding the natural and engineering systems related to hydrate formation and decomposition.

3.3. Numerical Results

3.3.1. Fine-Particle Migration and Clogging Processes

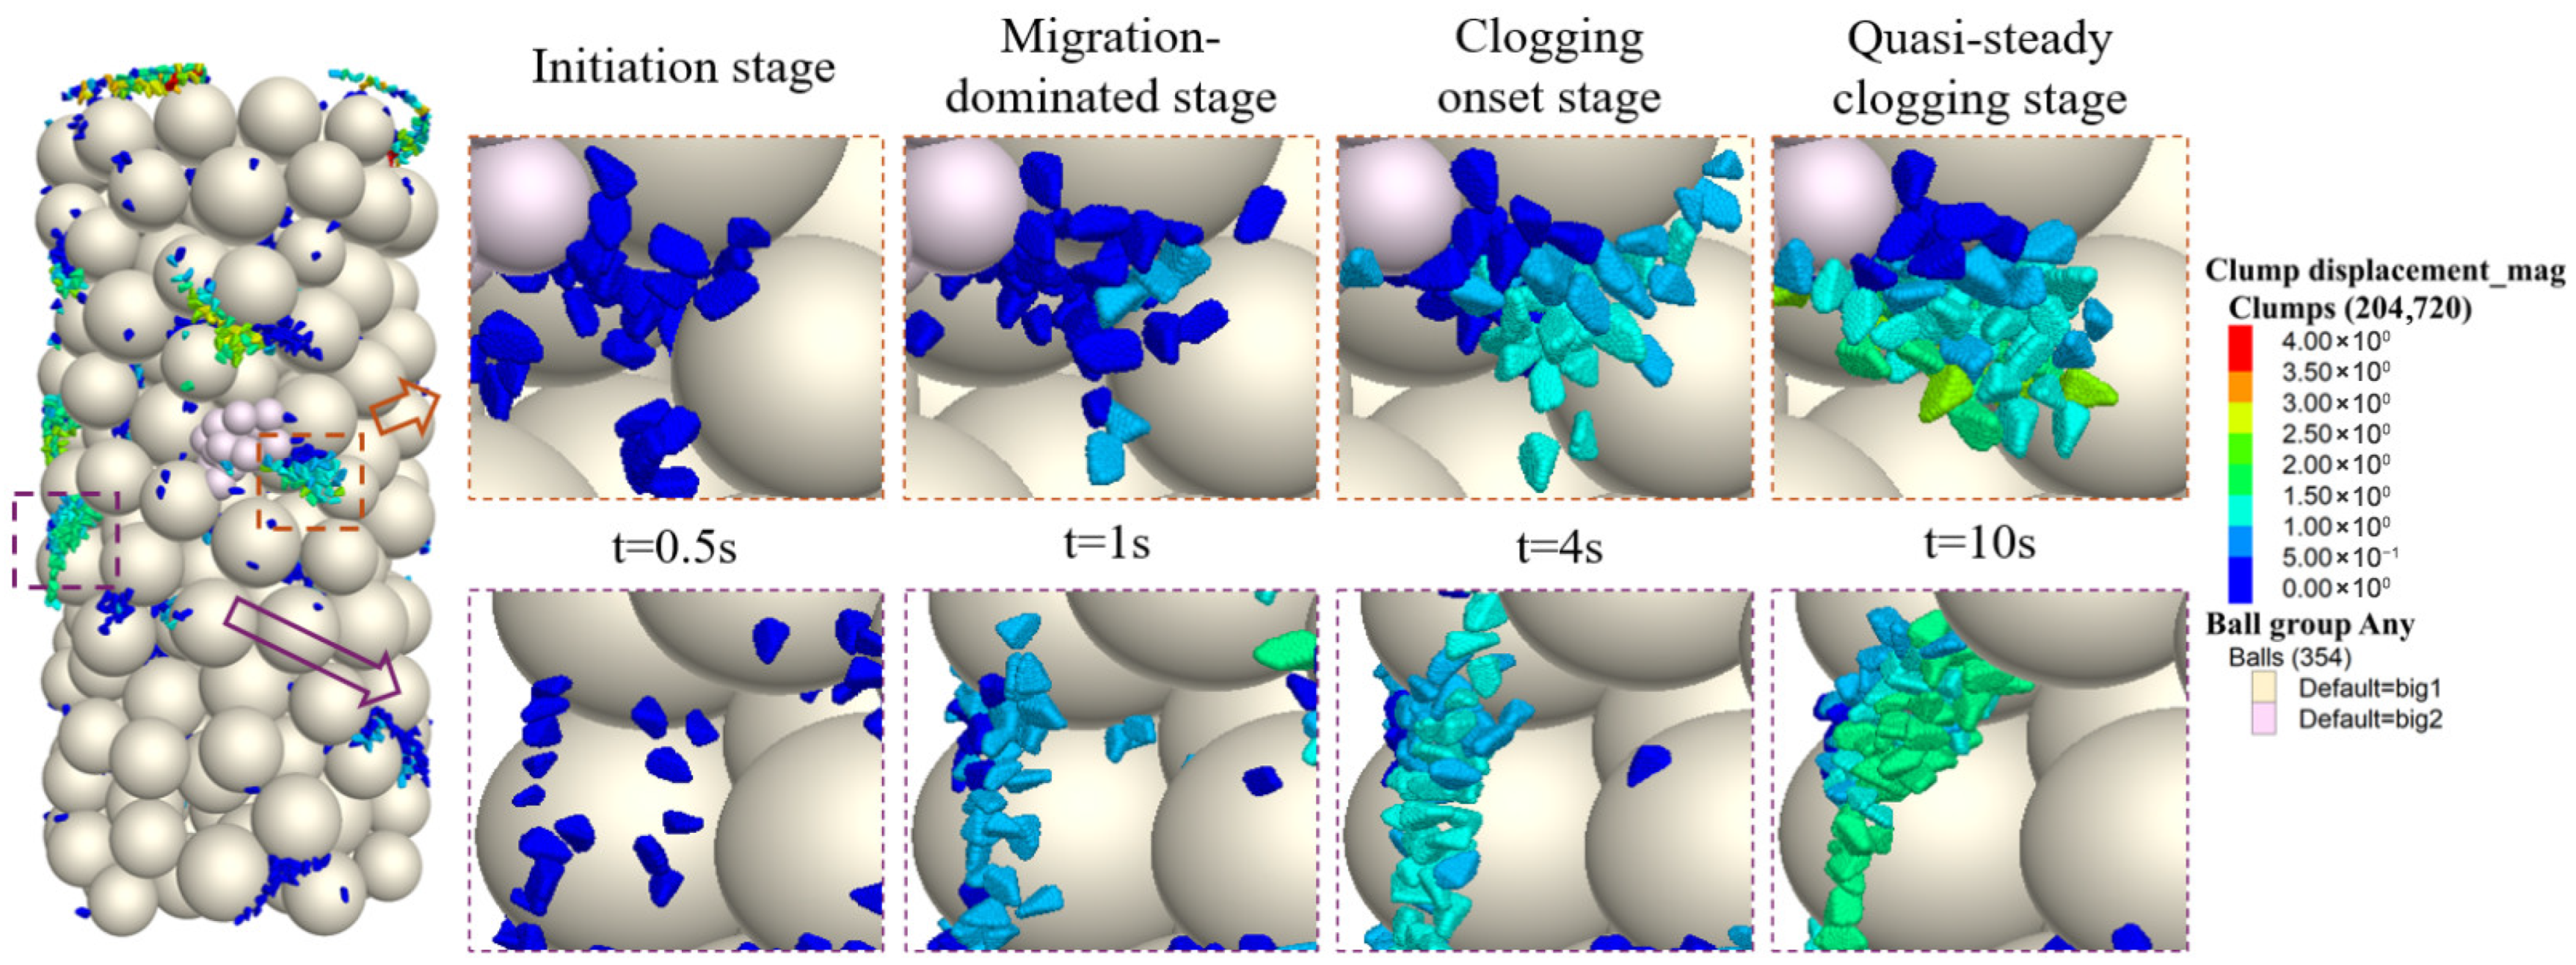
The migration and clogging behavior of fine particles within the pore structure formed by the coarse particle framework can be divided into four distinct stages, as illustrated in Figure 7. During the initiation stage (t = 0–1 s), fine particles are approximately uniformly dispersed within the pore space between coarse particles. The pore structure remains relatively open, and no pronounced particle accumulation, deposition, or clogging is observed. Consequently, pore connectivity and flow capacity remain largely unchanged. As the system enters the migration-dominated stage (t ≈ 1 s), fine particles are mobilized by fluid drag forces and migrate directionally along pore channels toward deeper regions of the porous medium. Localized enrichment of fine particles occurs near pore walls and pore throats; however, stable deposits or bridging structures have not yet formed, and the effective pore cross-section and overall permeability remain nearly constant. Subsequently, during the clogging onset stage (t ≈ 4 s), inter-particle contacts and mechanical interactions among fine particles are significantly intensified. Flocculated aggregates or particle-bridging structures gradually develop within localized pore spaces, resulting in a reduction in the effective flow cross-section of certain pore channels and a noticeable restriction of fluid flow. Finally, in the steady clogging stage (t = 5–10 s), continuous accumulation of fine particles leads to the formation of stable clogging bodies in localized regions. Partial or near-complete blockage of pore channels occurs, causing a marked decline in pore connectivity and exerting a sustained inhibitory effect on subsequent fluid seepage.
To quantitatively characterize the migration capability of fine particles within porous media, the migration rate is introduced as an evaluation metric. A higher migration rate indicates a greater transport efficiency of fine particles through the pore structure and a lower likelihood of particle retention, aggregation, or clogging. Conversely, restricted migration promotes local accumulation of fine particles, which may ultimately lead to the development of aggregation or clogging structures. The numerical model adopts a cylindrical computational domain with an axial length of four dimensionless units. At the initial stage, fine particles are uniformly distributed throughout the model. Under fluid-driven advection, fine particles migrate upward along the axial direction. When the axial position of a fine particle exceeds the upper boundary of the model (z > 4), it is considered to have successfully migrated out of the computational domain. The migration rate is defined as the ratio of the number of fine particles that exit the model per unit time to the total number of fine particles initially present, thereby providing a quantitative measure of the overall migration efficiency of fine particles.

3.3.2. Influence of Flow Rate on Fine-Particle Migration

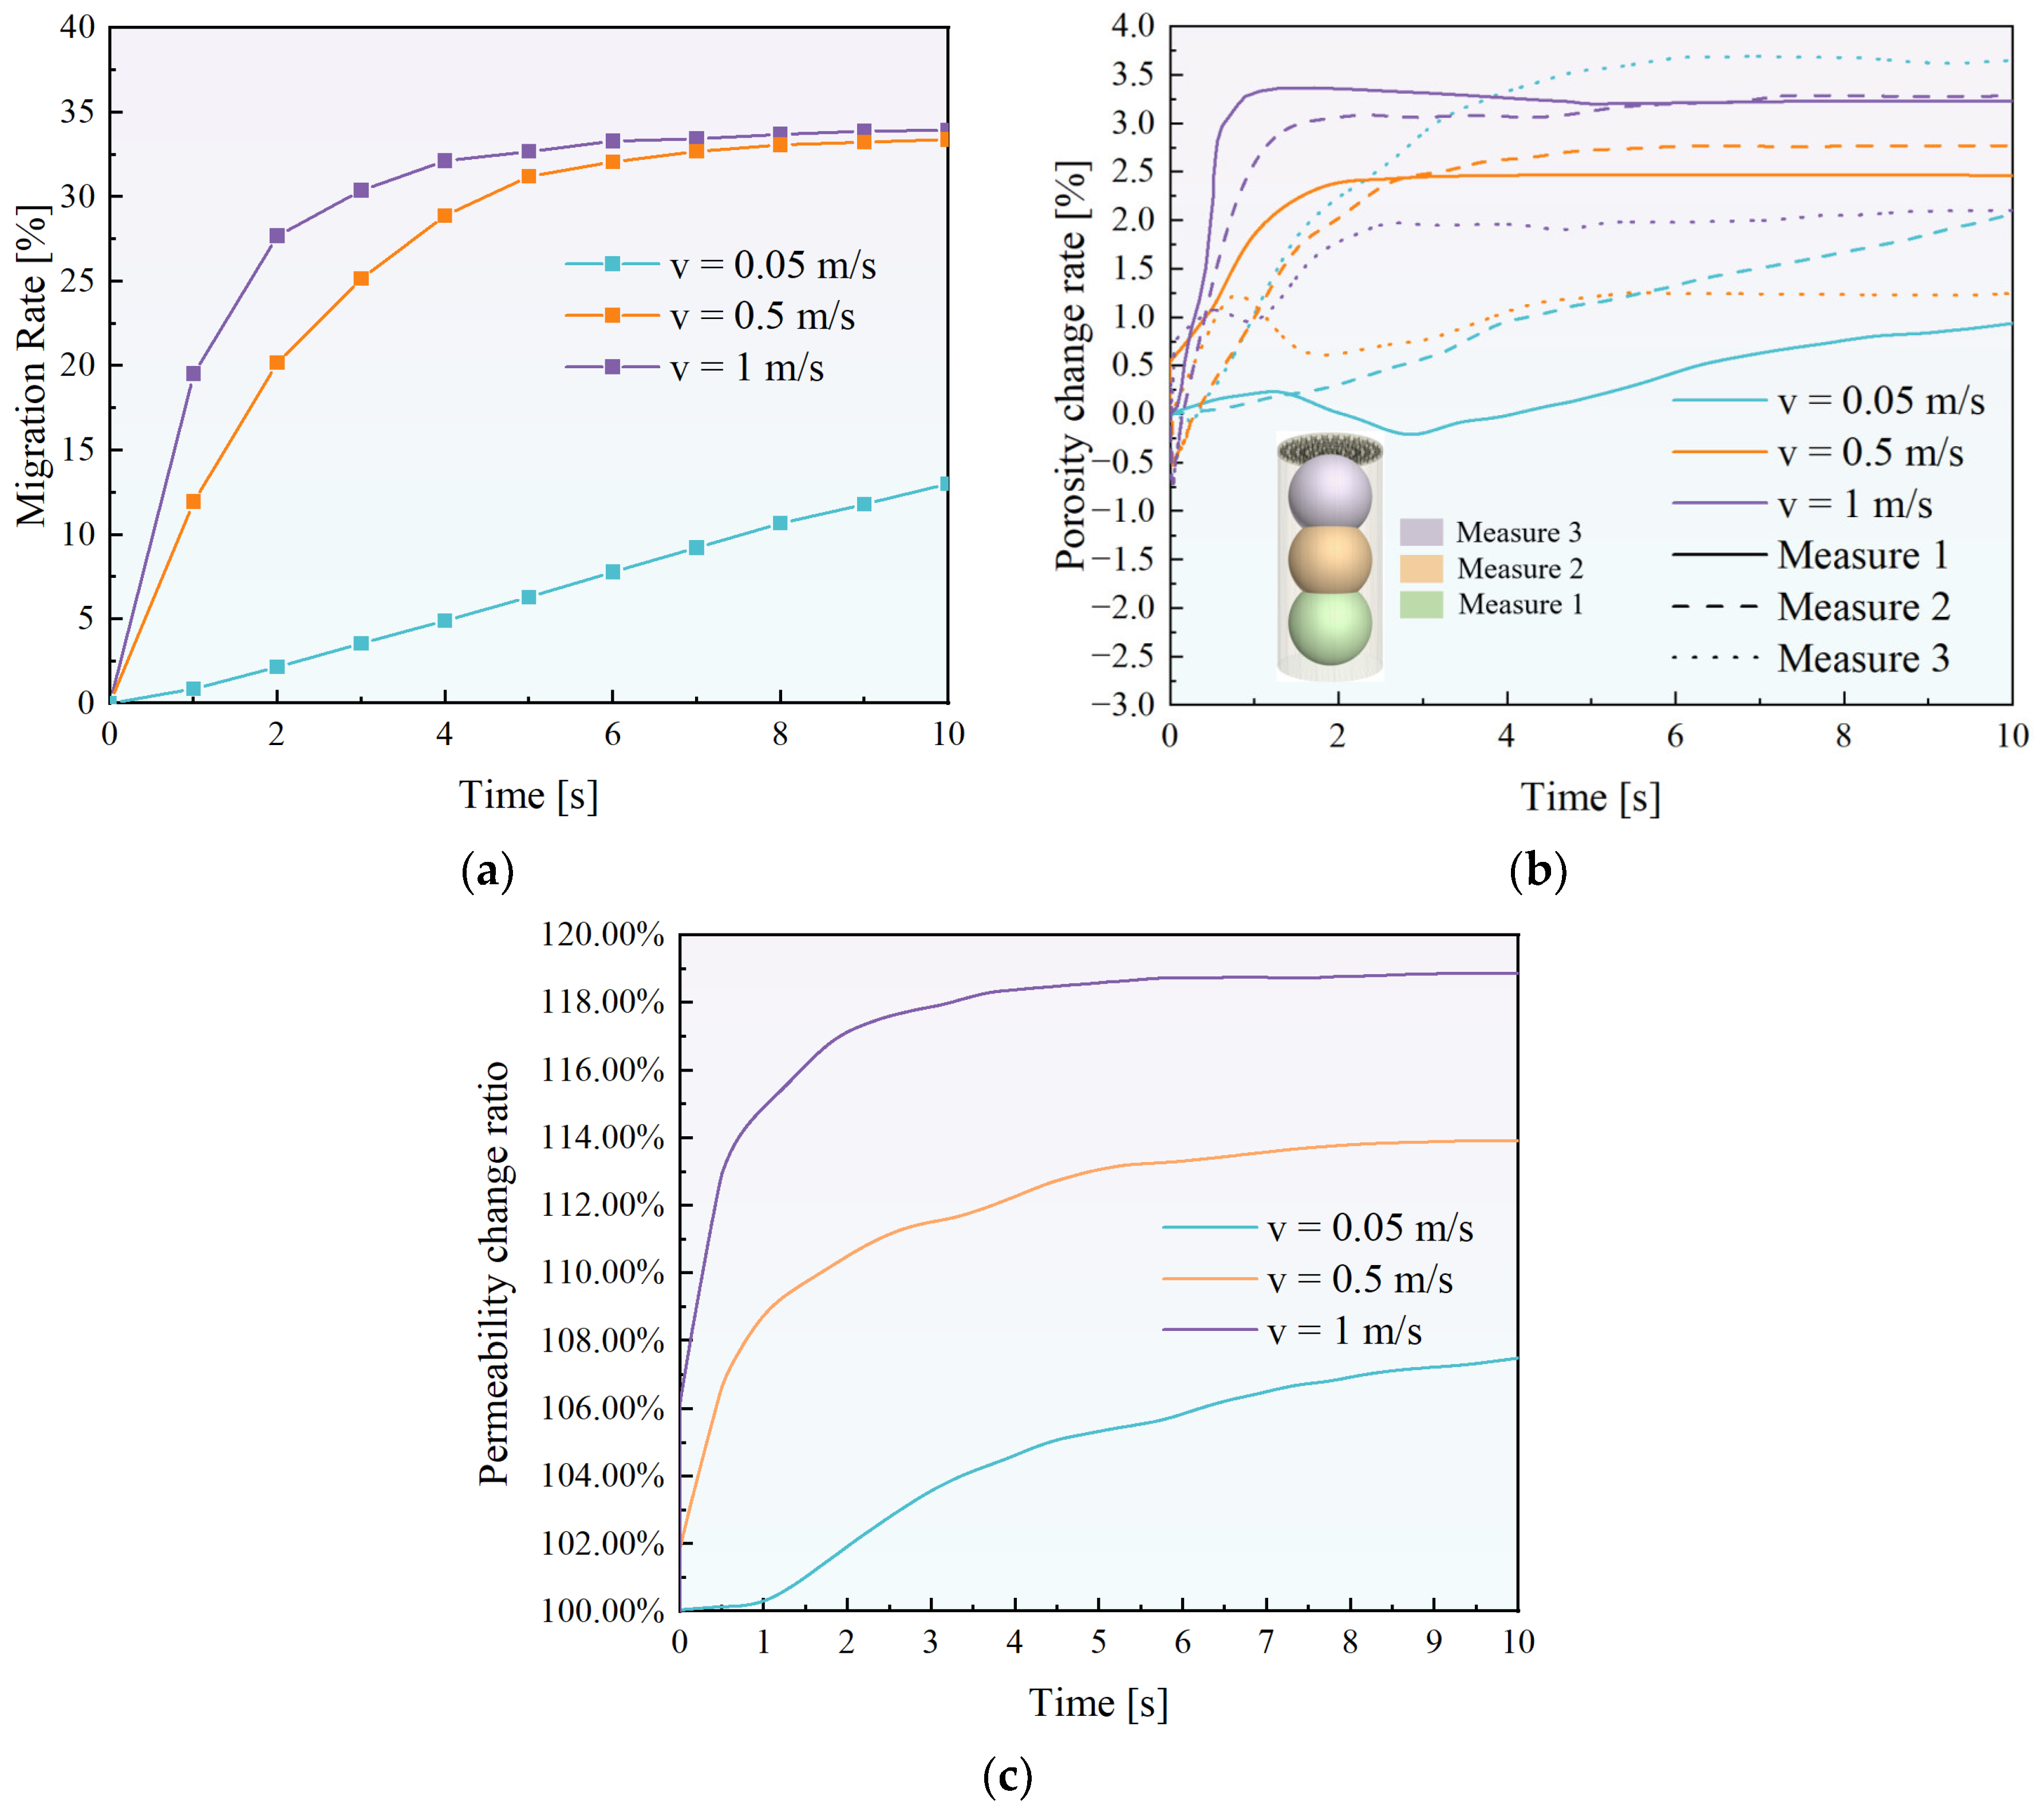
Under the same initial fine-particle concentrations, the effects of different flow rates (v = 0.05 m·s−1, 0.5 m·s−1, and 1 m·s−1) on fine-particle migration behavior, pore-structure evolution, and seepage characteristics were systematically studied. The corresponding results are shown in Figure 8a–c.
As shown in Figure 8a, the temporal evolution of the fine-particle migration rate exhibits pronounced differences under different flow velocities. At the low flow velocity (v = 0.05 m·s−1), the migration rate increases slowly with time and follows an approximately linear trend, indicating relatively low migration efficiency. This suggests that under weak hydrodynamic conditions, fine-particle migration is primarily constrained by pore geometry and inter-particle contacts, allowing only a limited number of particles to continuously pass through pore channels and exit the model. When the flow velocity increases to 0.5 m·s−1 and 1 m·s−1, the migration rate rises rapidly during the early stage of injection. This behavior indicates that enhanced hydrodynamic drag and shear forces effectively overcome the resistance at pore throats, enabling a large number of fine particles to migrate out of the system within a short time. However, during the later stages of migration, the migration-rate curves for the two higher flow velocities gradually level off, and the difference between them becomes markedly reduced. This trend implies that as migration proceeds, fine-particle transport becomes increasingly constrained by pore-structure evolution and local clogging effects, resulting in a diminishing enhancement of migration efficiency with further increases in flow velocity.
As shown in Figure 8b, the temporal evolution of the pore-change rate at the inlet, middle, and outlet measurement locations exhibits pronounced differences under different flow velocities. Overall, the porosity change rate at the inlet increases rapidly during the early stage of injection for all cases, indicating significant migration and rearrangement of fine particles immediately after entering the model, which leads to the release of local pore space. Under low flow velocity conditions, the porosity change rates at the three measurement locations remain relatively small and show limited spatial variation, suggesting restricted fine-particle migration and weak disturbance to the pore structure. In contrast, under higher flow velocities, the porosity change rate at the inlet becomes significantly larger than that at the middle and outlet locations, and the pore responses at downstream positions display a distinct time lag. This behavior reflects the progressive downstream migration of fine particles driven by seepage, accompanied by temporary accumulation and rearrangement at downstream pore throats. These results indicate that while higher flow velocities enhance fine-particle mobility, they also intensify the spatial heterogeneity of pore-structure evolution. With continued migration and redistribution, the porosity change rates at all measurement locations gradually stabilize, implying that the pore structure approaches a new dynamic equilibrium.
The evolution of the permeability ratio shown in Figure 8c is consistent with the trends observed in the fine-particle migration rate and porosity change rate. At low flow velocities, the permeability ratio increases slowly over time, reflecting limited fine-particle migration and only minor improvement in flow pathways. At higher flow velocities, the permeability change ratio rises rapidly during the early stage, indicating effective removal of fine particles from critical pore throats and a substantial enhancement in pore connectivity and effective flow cross-sectional area. However, during the later stage, the growth of the permeability change ratio gradually slows down, suggesting that increasing fine-particle retention, rearrangement, and localized clogging in downstream pores constrain further improvements in pore structure.
In summary, the results in Figure 8a–c demonstrate that under low fine-particle concentration conditions, increasing flow velocity markedly promotes fine-particle migration, enlarges pore space, and enhances permeability. Nevertheless, once the flow velocity exceeds a certain threshold, fine-particle migration becomes increasingly constrained by pore-structure evolution and local retention effects, leading to diminishing gains in both migration efficiency and permeability. This indicates that fine-particle migration is jointly governed by hydrodynamic forcing and pore-structure constraints.

3.3.3. Effect of Fines Contents on Pore Structure

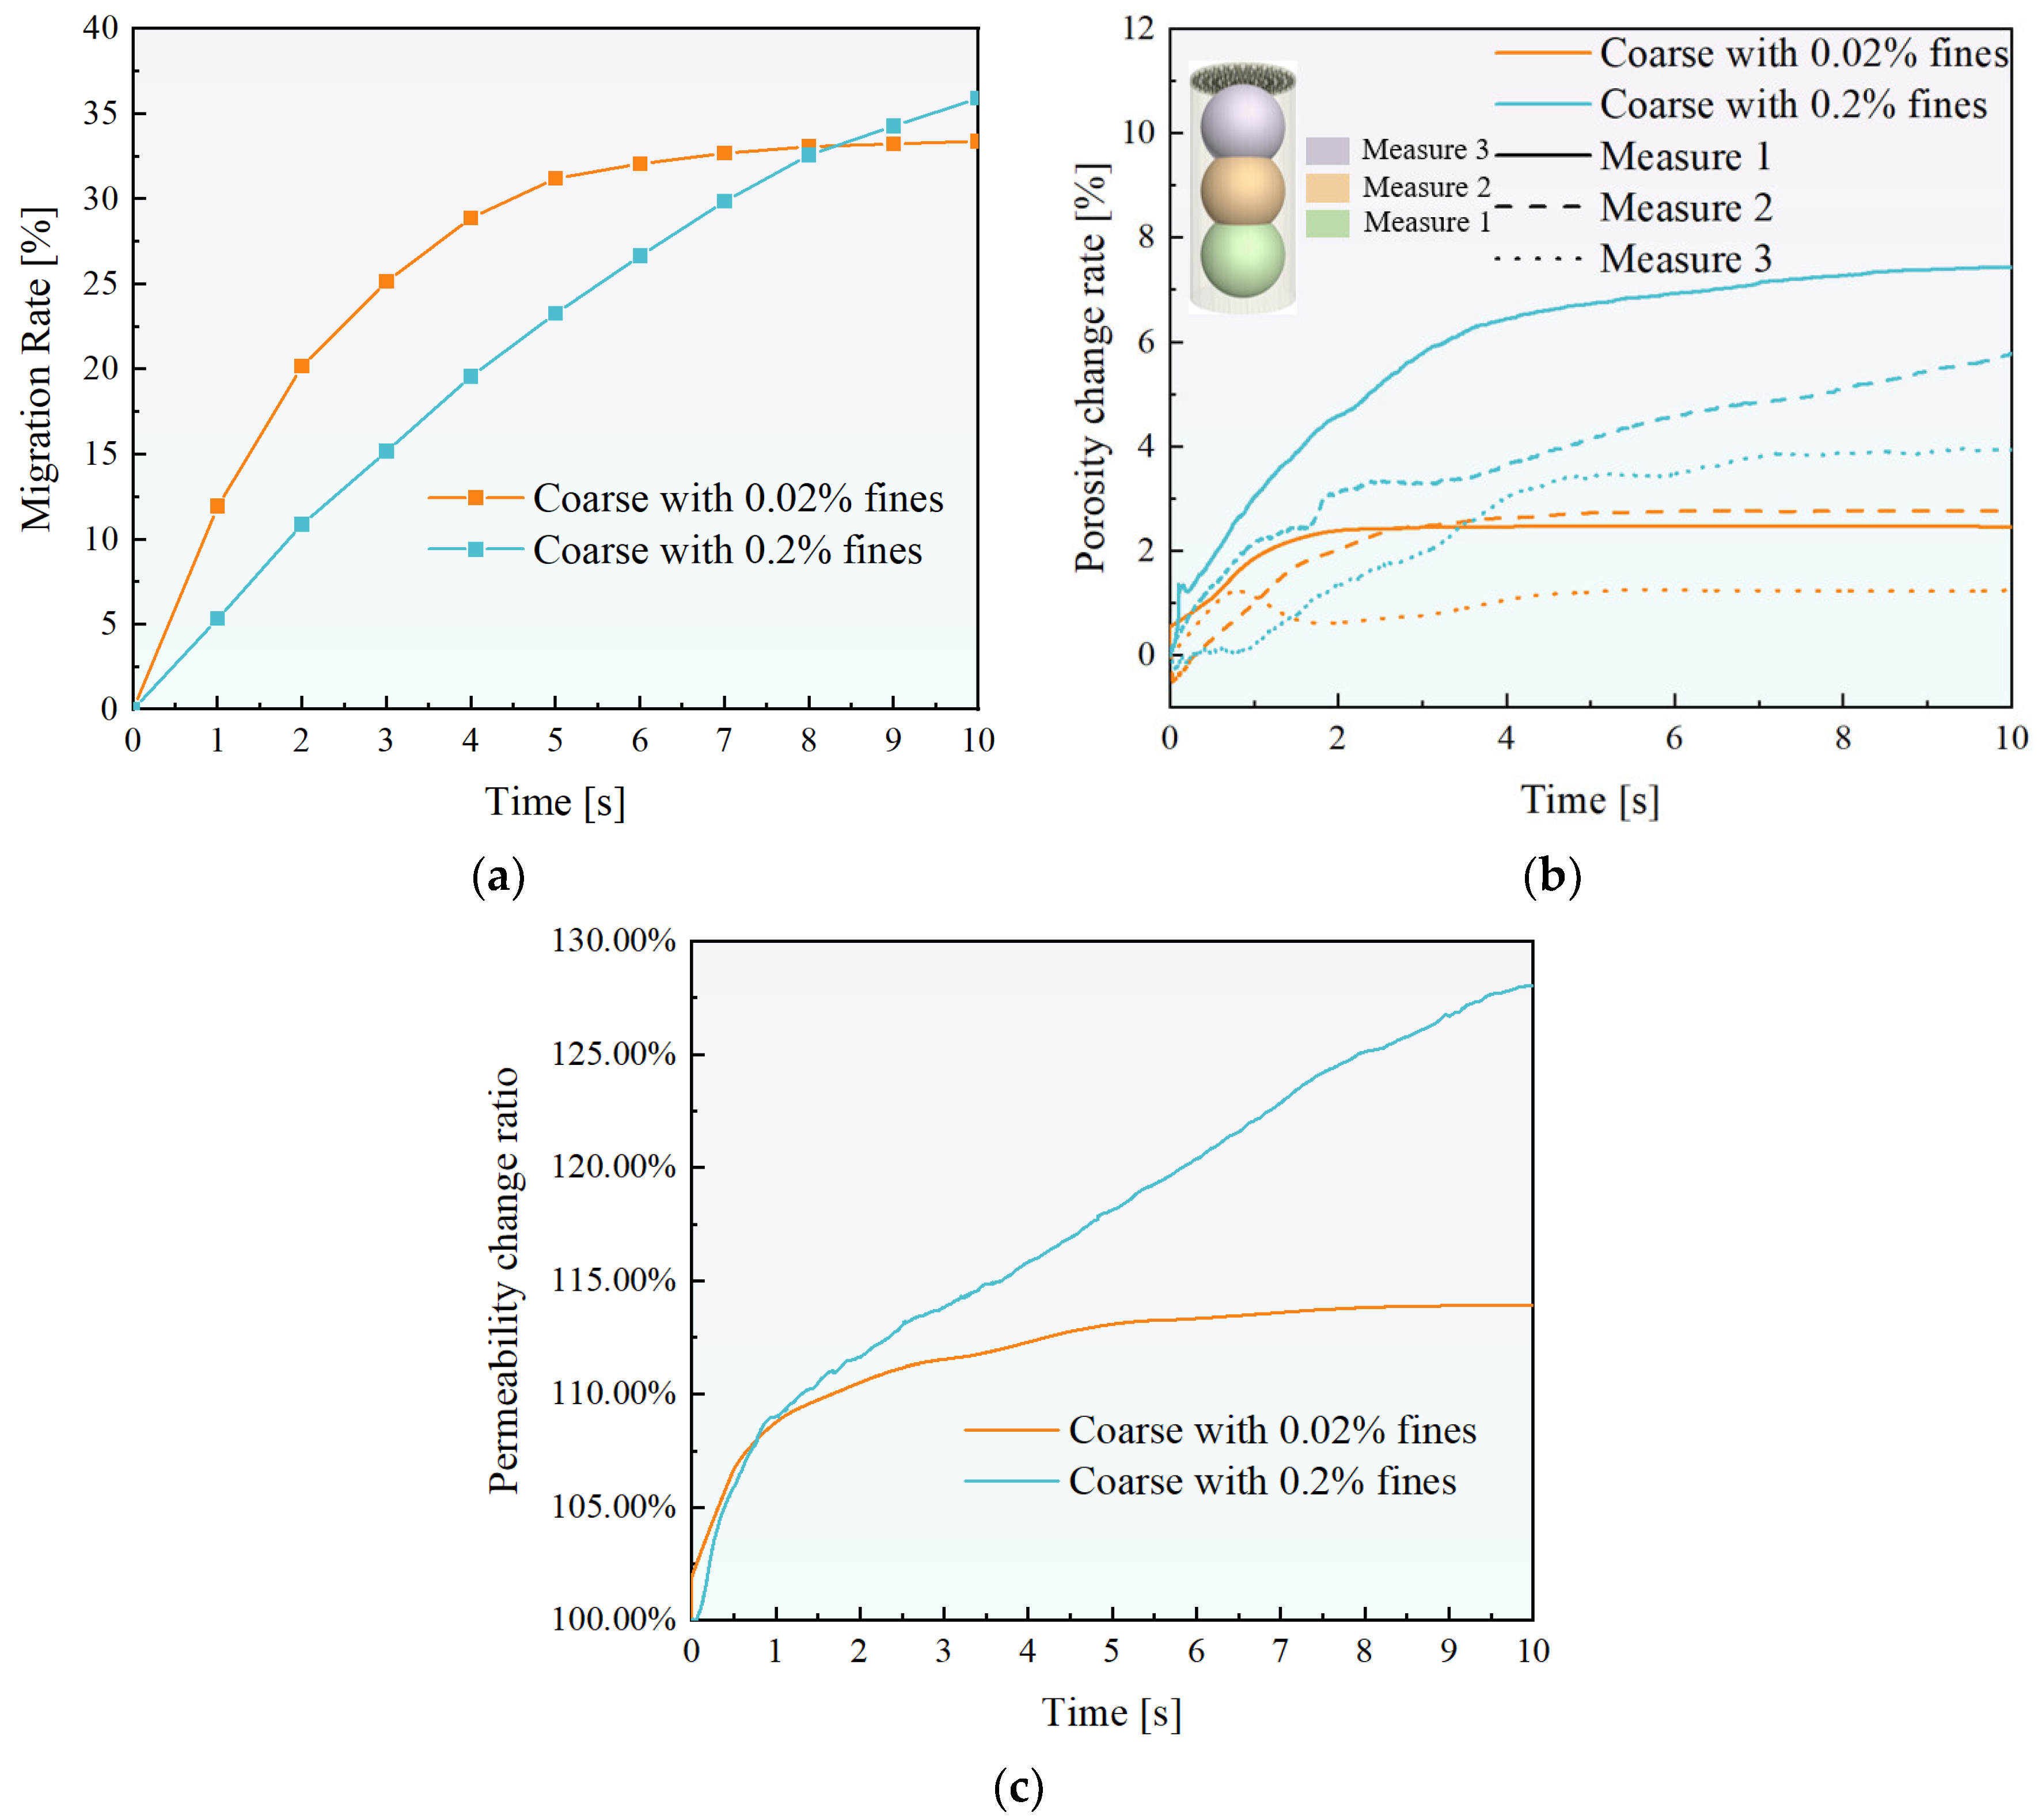
Considering two kinds of fine-particle concentrations (0.02% and 0.2%), the effects of fine-particle content on migration behavior, pore-structure evolution, and seepage characteristics were compared and studied at a fixed flow rate of v = 0.5 m·s−1. The corresponding results are shown in Figure 9a–c. The fine-particle concentration of 0.02% corresponds to the medium injection rate discussed in the previous section.
As shown in Figure 9a, the temporal evolution of the fine-particle migration rate differs markedly between the two concentration levels. Under the low fine-particle concentration condition (0.02%), the migration rate increases rapidly during the early stage of injection and reaches a plateau relatively quickly, indicating that fine particles can migrate smoothly through pore channels with limited resistance under this concentration level. When the fine-particle concentration increases to 0.2%, the initial growth of the migration rate is noticeably delayed. This behavior reflects intensified inter-particle interactions and mutual interference within pore channels due to the simultaneous mobilization of a large number of fine particles, which suppresses migration during the initiation stage. As flow continues, the migration rate under the high-concentration condition increases steadily and eventually exceeds that of the low-concentration case, indicating that a larger number of fine particles are progressively mobilized and successfully transported out of the model, resulting in a higher cumulative migration amount.
Figure 9b shows the time evolution of the porosity change rate at the inlet, middle, and outlet measurement positions under different fine-particle concentrations.
Under the condition of low concentration, the change rate of porosity at all measuring positions remains relatively small, and shows limited spatial change along the flow direction, indicating that the fine-particle migration has a weak disturbance to the pore structure. On the contrary, under the condition of high fine-particle concentration (0.2%), the porosity change rate of the three positions increased significantly and showed obvious spatial heterogeneity. The change rate of porosity at the inlet increased rapidly in the early stage, reflecting the removal of a large number of fine particles in the upstream area.
At the same time, the increase in porosity change rate in the middle and outlet positions shows an obvious time lag, indicating the continuous transportation, rearrangement, and local retention of fine particles migrating downstream. The response of porosity change along the flow direction shows that the evolution of pore structure has a significant cumulative effect under the condition of high particle concentration.
As shown in Figure 9c, the permeability change ratio exhibits pronounced temporal differences under different fine-particle concentration conditions. Under the low fine-particle concentration condition, the permeability change ratio increases rapidly during the early stage of injection and then gradually approaches a stable level, indicating that the improvement of flow pathways induced by fine-particle migration reaches a dynamic equilibrium at an early stage. In contrast, under the high fine-particle concentration condition (0.2%), the permeability ratio continues to increase markedly throughout the entire simulation period and ultimately reaches a level significantly higher than that of the low-concentration case. This result indicates that, within the time scale and structural conditions considered in this study, a higher fine-particle concentration does not lead to a reduction in overall permeability. Instead, sustained fine-particle migration and pore-space release progressively enhance pore connectivity and effective flow capacity.
Overall, Figure 9a–c demonstrates that at a constant flow velocity, increasing the fine-particle concentration suppresses the initiation of fine-particle migration during the early stage. However, as flow proceeds, an increasing number of fine particles are progressively mobilized and transported out of the model, resulting in more pronounced pore-space release and permeability enhancement. Within the parameter range investigated, fine-particle migration is dominated by internal erosion and pore-unblocking effects, and no macroscopic clogging characterized by a substantial permeability reduction is observed.

3.3.4. Pore Evolution and Influencing Factors

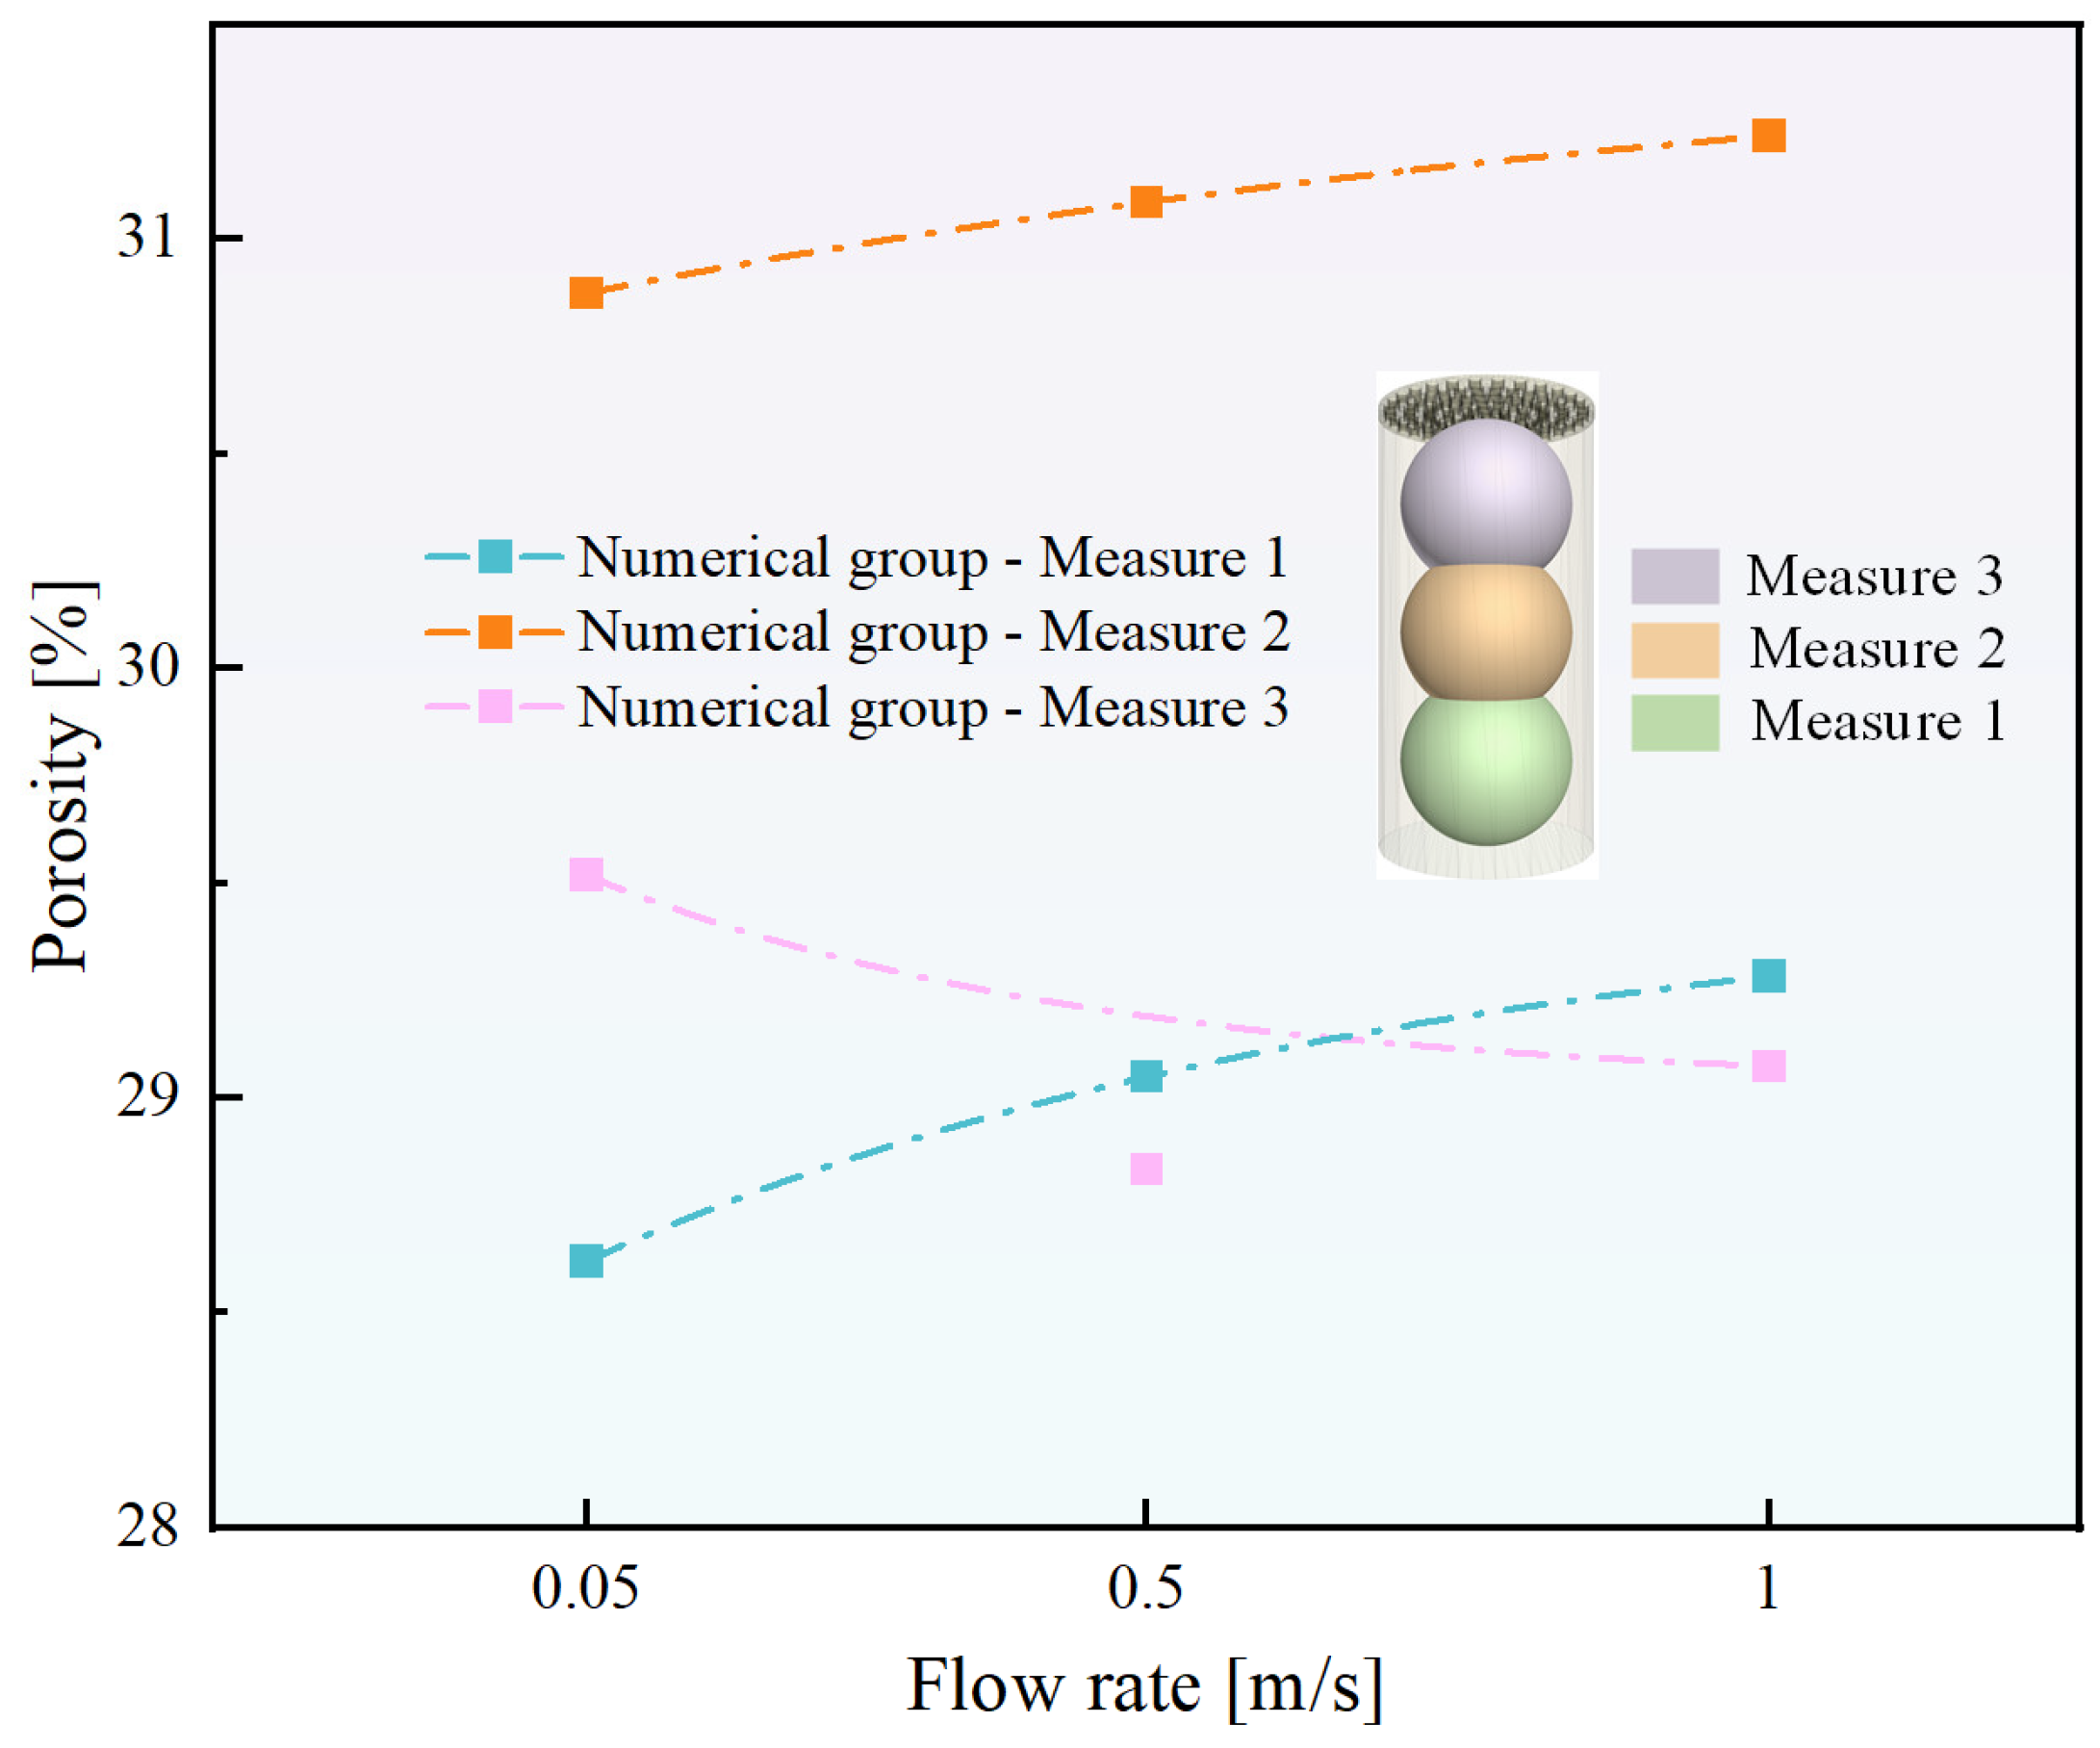
Figure 10 compares the final pore distribution and porosity obtained by numerical simulations at different flow rates. Generally speaking, with the increase in flow velocity, the pore structure shows a gradual unblocking behavior, accompanied by the overall increase in porosity. This trend is especially obvious in the area near the inlet, which indicates that the strong hydrodynamic force can promote the migration and rearrangement of fine particles more effectively at a higher flow rate. As a result, the previously occupied or constrained pore space is released, resulting in enhanced local pore connectivity.
In the numerical model, the fine-particle migration rate increases with the flow velocity, which reflects the enhanced transport of particles through the pore structure at higher seepage rates. From a spatial perspective, the final porosity at the inlet and middle measurement locations shows greater sensitivity to changes in flow rate, whereas the porosity variation at the outlet remains relatively limited. This spatial heterogeneity reflects the non-uniform evolution of pore structure along the seepage direction, suggesting that pore-structure adjustment and fine-particle migration preferentially occur in upstream regions where fluid forcing is stronger, and subsequently propagate downstream under seepage-driven transport. Notably, the overall trend of porosity variation with flow rate observed in the numerical simulations is in good agreement with the variation in the drainage volume fraction derived from NMR experiments based on total-volume calibration. Similarly, the experimental data show that the drainage volume fraction also increases as the flow velocity increases (Figure 6d and Figure 8a). Experimental results indicate that the volume of displaced pore water increases with increasing flow rate and gradually approaches a stable level under high-flow conditions. Correspondingly, the simulated porosity also exhibits a diminishing growth rate at higher flow rates. This trend-level consistency demonstrates that although the experimental and numerical approaches characterize different physical quantities, both capture the dominant role of flow rate in governing macroscopic structural responses through pore-scale processes, including fine-particle migration, rearrangement, and pore unblocking.
Both the numerical simulations and the experimental results exhibit the same trend: higher flow velocities promote greater particle migration and more significant displacement of pore water. Therefore, the numerical results shown in Figure 10 provide an independent structural-level validation for the drainage behavior and pore-structure evolution observed in NMR experiments. This consistency further enhances the reliability of the experimental conclusions and proves that the developed numerical model can reasonably reproduce the key physical mechanisms controlling the evolution of pore structure under different flow rates.

4. Conclusions and Limitations

In this study, the low-field nuclear magnetic resonance (LF-NMR) experiment and CFD-DEM numerical simulation were combined to systematically and quantitatively study the migration behavior of fine particles in coarse-grained sediments and their influence on pore-structure evolution and seepage characteristics. The migration rate of fine particles, porosity change rate, and permeability ratio under different injection rates and fine-particle concentrations are comprehensively analyzed. The main conclusions are as follows:
(1)
The injection velocity significantly affects the migration of fine particles, but the marginal effect diminishes with increased flow rate. Higher injection speeds enhance hydrodynamic drag and shear force, promoting early migration and improving migration efficiency. However, as migration progresses, pore-structure limitations and particle retention gradually increase, leading to diminishing returns from further increases in injection speed in terms of migration efficiency and permeability enhancement.
(2)
The concentration of fine particles strongly influences the migration process. At a constant injection speed, an increase in fine-particle concentration delays the onset of migration due to enhanced particle interactions and clogging of pore throats. However, with continuous seepage, more fine particles are gradually mobilized and migrate out of the system, resulting in increased cumulative migration at higher concentrations.
(3)
The evolution of pore structure exhibits notable spatial heterogeneity. During fine-particle migration, pore changes predominantly occur near the entrance, then propagate downstream to the middle and exit areas under seepage-driven transport. Higher injection rates or fine-particle concentrations enlarge the spatial variability and amplitude of pore changes, reflecting the complex coupling between particle migration, pore-structure rearrangement, and pore clogging.
(4)
Both local particle retention and internal erosion occur simultaneously, influencing the overall seepage response. The spatial distribution of the porosity change rate indicates that fine particles temporarily bridge local pore throats, suggesting localized clogging. However, the overall evolution of migration rate and permeability shows that under continuous hydrodynamic action, fine particles are gradually displaced from the system, leading to increased pore connectivity and overall permeability enhancement.
(5)
Within the parameters and timescales considered in this study, particle migration is primarily driven by internal erosion and pore unclogging mechanisms. While local congestion may occur, it does not always evolve into large-scale clogging. Whether permeability decreases depends on the interaction between fine particle supply intensity, hydrodynamic conditions, and pore-structure adjustments.
In summary, fine particle migration is a dynamic, multi-scale process influenced by various factors, leading to seepage behaviors that cannot be explained by local clogging alone. This study provides a robust framework for understanding fine particle migration in granular porous media and evaluating seepage stability, with implications for the safe extraction and long-term stability of hydrate-bearing sediments. Future research should extend this work by incorporating longer simulation times to capture more complex migration patterns, exploring higher fine particle concentrations, and investigating the coupled chemical effects between fines and pore fluids. Although the experiments were conducted at room temperature, future studies should consider the impact of temperature variations on particle migration and pore-structure evolution to better simulate subsurface conditions. Understanding the role of temperature will be crucial for extending this research to real-world operational environments. Despite scale differences, both LF-NMR experiments and CFD-DEM simulations are interpreted at the particle/REV scale, ensuring comparability through normalization of pore volume and water content. This study reveals key migration mechanisms, such as particle mobilization, arching effects, and pore throat trapping, at the microscale. However, applying these findings directly to real reservoir predictions requires caution, as macro-scale heterogeneity, geostress, and multi-field coupling must be considered. Future research should focus on scaling up these mechanisms to account for the complexities of field-scale conditions, with an emphasis on real-world subsurface environments.

Author Contributions

X.L.: writing—original draft preparation, supervision, funding acquisition; M.C.: writing—original draft preparation, writing—review and editing, methodology, investigation; J.J.: methodology, investigation, supervision; S.C.C.: writing—review and editing, methodology, supervision, funding acquisition. All authors have read and agreed to the published version of the manuscript.

Funding

This work was supported by the Science and Technology Projects of Yunnan Province (Grant No. 202407AC110019), the National Natural Science Foundation of China Youth Project (No. 42306234), the Jiangsu Basic Research Program Natural Science Foundation Youth Fund (No. SBK2023044900), and the General Projects of the National Natural Science Foundation of China (No. 42477142).

Data Availability Statement

The original contributions presented in this study are included in the article. Further inquiries can be directed to the first author and the corresponding author.

Acknowledgments

Acknowledgments extended to the School of Petroleum and Gas Engineering at Changzhou University. We thank Hui Du and Yanli Yuan for technical support with LF-NMR technical consultation.

Conflicts of Interest

The authors declare no conflicts of interest.

Abbreviations

The following abbreviations are used in this manuscript:
LF-NMR:Low-Field Nuclear Magnetic Resonance
CFD-DEMComputational Fluid Dynamics—Discrete Element Method
PFCParticle Flow Code
SEMScanning Electron Microscope
MPaMegapascal
DWDeionized Water
FiPyFinite Volume Method for Solving Partial Differential Equations (software)
PFC2DParticle Flow Code—2D
PFC3DParticle Flow Code—3D
EDEMEngineering Discrete Element Modeling (software)
LIGGGHTSLattice–Boltzmann-Based Open-Source DEM Solver
T1Longitudinal Relaxation Time (also known as spin–lattice relaxation time)
T2Transverse Relaxation Time (also known as spin–spin relaxation time)
FC-40Fluorinated Liquid Used for Pressure Transmission (brand: 3M, USA)

References

  1. Dou, X.F.; Liu, Z.C.; Yang, D.H.; Zhao, Y.J.; Li, Y.L.; Gao, D.L.; Ning, F.L. 3D CFD-DEM modeling of sand production and reservoir compaction in gas hydrate-bearing sediments with gravel packing well completion. Comput. Geotech. 2025, 177, 106870. [Google Scholar] [CrossRef] [Scilit]
  2. Zhang, T.; Liu, J.; Yang, X.G.; Sun, S.Y. Advances in the microscopic and mesoscopic simulation technologies developed for subsurface gas storage. Adv. Geo-Energy Res. 2024, 14, 1–3. [Google Scholar] [CrossRef] [Scilit]
  3. Han, G.; Kwon, T.-H.; Lee, J.Y.; Jung, J.W. Fines migration and pore clogging induced by single- and two-phase fluid flows in porous media: From the perspectives of particle detachment and particle-level forces. Geomech. Energy Environ. 2020, 23, 100131. [Google Scholar] [CrossRef] [Scilit]
  4. Cao, S.C.; Yuan, Y.L.; Jung, J.W.; Du, H.; Lv, X.F.; Li, X.S. Effects of end-member sediments on CO2 hydrate formation: Implications for geological carbon storage. Adv. Geo-Energy Res. 2024, 14, 224–237. [Google Scholar] [CrossRef] [Scilit]
  5. Wang, T.; Fan, Z.Y.; Sun, L.J.; Yang, L.; Zhao, J.F.; Song, Y.C.; Zhang, L.X. Pore-scale behaviors of CO2 hydrate formation and dissociation in the presence of swelling clay: Implication for geologic carbon sequestration. Energy 2024, 308, 132678. [Google Scholar] [CrossRef] [Scilit]
  6. Liu, Y.W.; Fu, M.L.; Wang, C.Q.; Xu, S.J.; Meng, F.K.; Shen, Y.L. The Damage Caused by Particle Migration to Low-Permeability Reservoirs and Its Effect on the Seepage Capacity after CO2 Flooding. Processes 2023, 11, 3279. [Google Scholar] [CrossRef] [Scilit]
  7. Luo, T.T.; Li, Y.H.; Madhusudhan, B.N.; Zhao, J.F.; Song, Y.C. Comparative analysis of the consolidation and shear behaviors of CH4 and CO2 hydrate-bearing silty sediments. J. Nat. Gas Sci. Eng. 2020, 75, 103157. [Google Scholar] [CrossRef] [Scilit]
  8. Wang, T.; Li, M.L. Particle migration and pore clogging in porous media during supercritical carbon dioxide sequestration. Comput. Geotech. 2025, 185, 107316. [Google Scholar] [CrossRef] [Scilit]
  9. Liu, Y.J.; Wang, L.Z.; Hong, Y.; Yin, Z.Y. Coupled thermo-hydro-mechanical-chemical modeling of fines migration in hydrate-bearing sediments with CFD-DEM. Can. Geotech. J. 2023, 60, 701–717. [Google Scholar] [CrossRef] [Scilit]
  10. Cao, S.C.; Jang, J.; Jung, J.; Waite, W.F.; Collett, T.S.; Kumar, P. 2D micromodel study of clogging behavior of fine-grained particles associated with gas hydrate production in NGHP-02 gas hydrate reservoir sediments. Mar. Pet. Geol. 2019, 108, 714–730. [Google Scholar] [CrossRef] [Scilit]
  11. Liu, Q.; Zhao, B.; Santamarina, J.C. Particle Migration and Clogging in Porous Media: A Convergent Flow Microfluidics Study. J. Geophys. Res. Solid Earth 2019, 124, 9495–9504. [Google Scholar] [CrossRef] [Scilit]
  12. Yang, Y.L.; Yuan, W.F.; Hou, J.R.; You, Z.J. Review on physical and chemical factors affecting fines migration in porous media. Water Res. 2022, 214, 118172. [Google Scholar] [CrossRef] [Scilit] [PubMed]
  13. Jung, J.W.; Cao, S.C.; Shin, Y.-H.; Al-Raoush, R.I.; Alshibli, K.; Choi, J.-W. A microfluidic pore model to study the migration of fine particles in single-phase and multi-phase flows in porous media. Microsyst. Technol. 2017, 24, 1071–1080. [Google Scholar] [CrossRef] [Scilit]
  14. Guan, D.W.; Qu, A.X.; Wang, Z.F.; Lv, X.; Li, Q.P.; Leng, S.D.; Xiao, B.; Zhang, L.X.; Zhao, J.F.; Yang, L.; et al. Fluid flow-induced fine particle migration and its effects on gas and water production behavior from gas hydrate reservoir. Appl. Energy 2023, 331, 120327. [Google Scholar] [CrossRef] [Scilit]
  15. Yang, Y.F.; Wang, J.L.; Wang, J.Z.; Zhang, Q.; Yao, J. Pore-scale numerical simulation of supercritical CO2-brine two-phase flow based on VOF method. Nat. Gas Ind. B 2023, 10, 466–475. [Google Scholar] [CrossRef] [Scilit]
  16. Ren, J.J.; Zeng, S.Y.; Chen, D.Y.; Yang, M.J.; Linga, P.; Yin, Z.Y. Roles of montmorillonite clay on the kinetics and morphology of CO2 hydrate in hydrate-based CO2 sequestration. Appl. Energy 2023, 340, 120997. [Google Scholar] [CrossRef] [Scilit]
  17. Grifka, J.; Nehler, M.; Licha, T.; Heinze, T. Fines migration poses challenge for reservoir-wide chemical stimulation of geothermal carbonate reservoirs. Renew. Energy 2023, 219, 118172. [Google Scholar] [CrossRef] [Scilit]
  18. Valdes, J.R.; Santamarina, J.C. Clogging: Bridge formation and vibration-based destabilization. Can. Geotech. J. 2008, 45, 177–184. [Google Scholar] [CrossRef] [Scilit]
  19. Jang, J.; Cao, S.C.; Stern, L.A.; Jung, J.; Waite, W.F. Impact of Pore Fluid Chemistry on Fine-Grained Sediment Fabric and Compressibility. J. Geophys. Res. Solid Earth 2018, 123, 5495–5514. [Google Scholar] [CrossRef] [Scilit]
  20. Cheng, Y.F.; Xue, M.Y.; Shi, J.H.; Li, Y.; Yan, C.L.; Han, Z.Y.; Yang, J.C. Numerical Simulating the Influences of Hydrate Decomposition on Wellhead Stability. Processes 2023, 11, 1586. [Google Scholar] [CrossRef] [Scilit]
  21. Tang, H.X.; Jia, C.S.; Wang, Z.Y.; Lu, H.; Wang, Z.; Tang, H.M.; Zhu, B.Y. Evolution of pore structure during fines migration in sand pack: NMR experimental and numerical investigations. Front. Energy Res. 2024, 12, 1399477. [Google Scholar] [CrossRef] [Scilit]
  22. Rosenbrand, E.; Kjøller, C.; Riis, J.F.; Kets, F.; Fabricius, I.L. Different effects of temperature and salinity on permeability reduction by fines migration in Berea sandstone. Geothermics 2015, 53, 225–235. [Google Scholar] [CrossRef] [Scilit]
  23. Lei, J.; Wang, Y.; Guo, W. Fines migration characteristics of illite in clayey silt sediments induced by pore water under the depressurization of natural gas hydrate. Fuel 2024, 365, 131236. [Google Scholar] [CrossRef] [Scilit]
  24. Sun, X.; Luo, H.; Soga, K.C. Deformation Coupled Effective Permeability Change in Hydrate-Bearing Sediment during Depressurization. Processes 2022, 10, 2210. [Google Scholar] [CrossRef] [Scilit]
  25. Niu, Q.H.; Wang, X.Y.; Chang, J.F.; Wang, W.; Liu, X.D.; Wang, Q.Z. Influencing mechanisms of multi-scale pore-fracture responses of coals on their macro/micromechanical behaviors under ScCO2 injection. Adv. Geo-Energy Res. 2024, 14, 64–80. [Google Scholar] [CrossRef] [Scilit]
  26. Li, H.; Hu, Q.H.; Zhu, R.K.; Liu, B.; Mishra, A.; Ansah, E.O. Reactive transport modeling of water-CO2-rock interactions in clay-coated sandstones and implications for CO2 storage. Adv. Geo-Energy Res. 2025, 17, 121–134. [Google Scholar] [CrossRef] [Scilit]
  27. Li, Y.L.; Wu, N.Y.; Ning, F.L.; Hu, G.W.; Liu, C.L.; Dong, C.Y.; Lu, J.A. A sand-production control system for gas production from clayey silt hydrate reservoirs. China Geol. 2019, 2, 121–132. [Google Scholar] [CrossRef] [Scilit]
  28. Wang, L.; Song, Z.K.; Huang, X.; Xu, W.J.; Chen, Z.B. Study on the Influence of Pressure Reduction and Chemical Injection on Hydrate Decomposition. Processes 2022, 10, 2543. [Google Scholar] [CrossRef] [Scilit]
  29. Li, L.J.; Li, X.S.; Wang, Y.; Huang, X.L.; Qi, Z.L.; Chen, Z. Study on the Settlement Characteristics of Hydrate Bearing Sediment Caused by Gas Production with the Depressurization Method. Energy Fuels 2024, 38, 5810–5821. [Google Scholar] [CrossRef] [Scilit]
  30. Jung, J.W.; Santamarina, J.C.; Soga, K. Stress-strain response of hydrate-bearing sands: Numerical study using discrete element method simulations. J. Geophys. Res. Solid Earth 2012, 117, B04202. [Google Scholar] [CrossRef] [Scilit]
  31. Tang, C.; Kim, Y.-J. CFD-DEM Simulation for the Distribution and Motion Feature of Solid Particles in Single-Channel Pump. Energies 2020, 13, 4988. [Google Scholar] [CrossRef] [Scilit]
  32. Li, R.R.; Han, Z.H.; Zhang, L.Q.; Zhou, J.; Wang, S.; Huang, F.Y. Numerical Determination of Anisotropic Permeability for Unconsolidated Hydrate Reservoir: A DEM–CFD Coupling Method. J. Mar. Sci. Eng. 2024, 12, 1447. [Google Scholar] [CrossRef] [Scilit]
  33. Zhang, F.S.; Wang, T.; Liu, F.; Peng, M.; Bate, B.; Wang, P. Hydro-mechanical coupled analysis of near-wellbore fines migration from unconsolidated reservoirs. Acta Geotech. 2022, 17, 3535–3551. [Google Scholar] [CrossRef] [Scilit]
  34. Duan, X.; Shi, B.H.; Wang, J.N.; Song, S.F.; Liu, H.T.; Li, X.T.; Chen, Y.C.; Liao, Q.Y.; Gong, J.; Chen, S.H.; et al. Simulation of the hydrate blockage process in a water-dominated system via the CFD-DEM method. J. Nat. Gas Sci. Eng. 2021, 96, 104241. [Google Scholar] [CrossRef] [Scilit]
  35. Suikkanen, H.; Rintala, V.; Kyrki-Rajamäki, R. Development of a Coupled Multi-Physics Code System for Pebble Bed Reactor Core Modeling. In Proceedings of the HTR 2014, Wuhan, China, 27–31 October 2014. [Google Scholar]
  36. Zhang, A.; Jiang, M.J.; Wang, D.; Li, Q.P. Three-dimensional DEM investigation of mechanical behaviors of grain-cementing type methane hydrate-bearing sediment. Acta Geotech. 2023, 18, 6371–6394. [Google Scholar] [CrossRef] [Scilit]
  37. Zhou, H.T.; Wang, G.H.; Jia, C.Q.; Li, C. A Novel, Coupled CFD-DEM Model for the Flow Characteristics of Particles Inside a Pipe. Water 2019, 11, 2381. [Google Scholar] [CrossRef] [Scilit]
  38. Al-Arkawazi, S.; Marie, C.; Benhabib, K.; Coorevits, P. Modeling the hydrodynamic forces between fluid–granular medium by coupling DEM–CFD. Chem. Eng. Res. Des. 2017, 117, 439–447. [Google Scholar] [CrossRef] [Scilit]
  39. Wang, T.; Chen, S.H.; Li, M.L.; An, M.K. A resolved CFD-DEM investigation of near-wellbore fine sand migration and production during methane hydrate extraction. Geomech. Energy Environ. 2024, 38, 100561. [Google Scholar] [CrossRef] [Scilit]
  40. Shen, Z.H.; Wang, G.; Huang, D.R.; Jin, F. A resolved CFD-DEM coupling model for modeling two-phase fluids interaction with irregularly shaped particles. J. Comput. Phys. 2022, 448, 110695. [Google Scholar] [CrossRef] [Scilit]
  41. Natsui, S.; Ueda, S.; Nogami, H.; Kano, J.; Inoue, R.; Ariyama, T. Gas–solid flow simulation of fines clogging a packed bed using DEM–CFD. Chem. Eng. Sci. 2012, 71, 274–282. [Google Scholar] [CrossRef] [Scilit]
  42. Wu, L. Simulation of Liquid-Solid Two-Phase Flow with Coarse Particles in Pipes. Master’s Thesis, Hangzhou Dianzi University, Hangzhou, China, 2010. [Google Scholar]
  43. Li, P.C. Studies on Mechanism of Hydraulic Hoist of Coarse Particle in Vertical Pipe. Doctoral Dissertation, Tsinghua University, Beijing, China, 2007. [Google Scholar]
  44. Tao, L.; Sen, L.X.; Yang, C.Z.; Duo, S.; Yu, Z.; Feng, Y.K.; Jing, C. Experimental Investigation on the Production Behaviors of Methane Hydrate in Sandy Sediments by Different Depressurization Strategies. Energy Technol. 2018, 6, 2501–2511. [Google Scholar] [CrossRef] [Scilit]
  45. Peng, Y.; Jing, J.Y.; Zhuang, M.X.; Jie, L.H.; Lin, S.Q.; Yu, D.X.; Bin, C.H.; Qiang, C.Y.; Peng, L.X. Influences of depressurization rate on natural gas hydrate production characteristics in stepwise depressurization: Two-dimensional experimental study. Phys. Fluids 2024, 36, 126622. [Google Scholar] [CrossRef] [Scilit]
  46. Tsuji, Y.; Kawaguchi, T.; Tanaka, T. Discrete particle simulation of two-dimensional fluidized bed. Powder Technol. 1993, 77, 79–87. [Google Scholar] [CrossRef] [Scilit]
  47. Signa, Y.; Oyeneyin, M.S.; Peden, J.M. Investigation of Pore-Blocking Mechanism in Gravel Packs in the Management and Control of Fines Migration. In Proceedings of the SPE Formation Damage Control Symposium, Lafayette, LA, USA, 7–10 February 1994. [Google Scholar]
  48. Muecke, T.W. Formation Fines and Factors Controlling Their Movement in Porous Media. J. Pet. Technol. 1979, 31, 144–150. [Google Scholar] [CrossRef] [Scilit]
  49. Guyer, J.E.; Wheeler, D.; Warren, J.A. FiPy: Partial Differential Equations with Python. Comput. Sci. Eng. 2009, 11, 6–15. [Google Scholar] [CrossRef] [Scilit]
  50. Zhu, H.P.; Zhou, Z.Y.; Yang, R.Y.; Yu, A.B. Discrete particle simulation of particulate systems: Theoretical developments. Chem. Eng. Sci. 2007, 62, 3378–3396. [Google Scholar] [CrossRef] [Scilit]
  51. Anderson, B.J.; Kurihara, M.; White, M.D.; Moridis, G.J.; Wilson, S.J.; Pooladi-Darvish, M.; Gaddipati, M.; Masuda, Y.; Collett, T.S.; Hunter, R.B.; et al. Regional long-term production modeling from a single well test, Mount Elbert Gas Hydrate Stratigraphic Test Well, Alaska North Slope. Mar. Pet. Geol. 2011, 28, 493–501. [Google Scholar] [CrossRef] [Scilit]
  52. Shi, D.D.; Zheng, L.; Xue, J.F.; Sun, J. DEM Modeling of Particle Breakage in Silica Sands under One-Dimensional Compression. Acta Mech. Solida Sin. 2016, 29, 78–94. [Google Scholar] [CrossRef] [Scilit]
  53. Khabazian, M.; Mirghasemi, A.A.; Bayesteh, H. Compressibility of montmorillonite/kaolinite mixtures in consolidation testing using discrete element method. Comput. Geotech. 2018, 104, 271–280. [Google Scholar] [CrossRef] [Scilit]
  54. Moore, D.E.; Lockner, D.A. Interpreting the frictional behavior of the smectite clay montmorillonite. EOS Trans. 2004, 85, 47. [Google Scholar]
  55. Yamamoto, K.; Terao, Y.; Fujii, T.; Ikawa, T.; Seki, M.; Matsuzawa, M.; Kanno, T. Operational overview of the first offshore production test of methane hydrates in the Eastern Nankai Trough. In Proceedings of the Offshore Technology Conference, Houston, TX, USA, 5–8 May 2014; p. D031S034R004. [Google Scholar]
  56. Slijkerman, W.F.J.; Hofman, J.P.; Looyestijn, W.J.; Volokitin, Y. A Practical Approach To Obtain Primary Drainage Capillary Pressure Curves From Nmr Core And Log Data. Petrophysics SPWLA J. 2001, 42, 334–343. [Google Scholar]
  57. Zhang, Y.J.; Ji, Y.K.; Qi, M.H.; Dong, L.; Zhang, S.H.; Li, Y.L. Integrated detection of micro-pore structures and macro-mechanical responses for hydrate-bearing sediments. Adv. Geo-Energy Res. 2025, 17, 184–195. [Google Scholar] [CrossRef] [Scilit]
  58. Kleinberg, R.L.; Kenyon, W.E.; Mitra, P.P. Mechanism of NMR Relaxation of Fluids in Rock. J. Magn. Reson. Ser. A 1994, 108, 206–214. [Google Scholar] [CrossRef] [Scilit]
  59. Wang, T.; Fan, Z.Y.; Sun, L.J.; Yang, L.; Zhao, J.F.; Zhang, L.X.; Song, Y.C. Evaluation of stratigraphic adaptability for hydrate-based CO2 sequestration in marine clay-containing reservoirs. Chem. Eng. J. 2024, 501, 157711. [Google Scholar] [CrossRef] [Scilit]
Figure 1. Schematic diagram of the engineering application for enhancing CO2-CH4 replacement and storage in the hydrate via particle migration. Arrows indicate CO2 injection and migration, CH4 release and production, as well as the migration of fine particles and the associated gas–particle transport pathways within the sediment.
Processes 14 00615 g001
Figure 2. LF-NMR experimental setup: (a) schematic of the sample preparation procedure; (b) schematic diagram of the experimental apparatus.
Processes 14 00615 g002
Figure 3. Flow chart of implementing the coupled CFD-DEM model.
Processes 14 00615 g003
Figure 4. Particle–fluid interaction model: (a) geometry and boundary conditions of the column containing hydrate particles (front view and top view); (b) comparison of fine particles before and after replacement.
Processes 14 00615 g004
Figure 5. Morphology and microstructure of montmorillonite: (a) optical microscopic images of morphology characteristics of montmorillonite and sand in deionized water; (b) scanning electron microscope (SEM) images in a dry state; (c) optical microscopic images with different magnifications (5×, 20×, and 50×) in deionized water.
Processes 14 00615 g005
Figure 6. LF-NMR experimental analysis of pore structure and signal intensity changes under different flow rates: (a) evolution of pore pressure during injection; (b) NMR T2 spectra at different flow rates; (c) T1–T2 signal distribution diagram under different flow rates; (d) change in drainage volume fraction normalized by total volume at different injection speeds.
Processes 14 00615 g006aProcesses 14 00615 g006b
Figure 7. Evolution of fine-particle migration and clogging within coarse-grained frameworks.
Processes 14 00615 g007
Figure 8. Influence of flow velocity on fine-particle migration, pore-structure evolution, and permeability in coarse-grained sediments: (a) migration rate vs. time; (b) porosity change rate at different locations; (c) permeability change ratio vs. time.
Processes 14 00615 g008
Figure 9. Influence of fine-particle concentration on fine-particle migration, pore-structure evolution, and permeability: (a) migration rate vs. time; (b) porosity change rate at different locations; (c) permeability change ratio vs. time.
Processes 14 00615 g009
Figure 10. Final porosity obtained from numerical simulations under different flow rates.
Processes 14 00615 g010
Table 1. Software implementations of different coupled CFD–DEM models.
TypeSpecific Implementation SoftwarePractical Application
One commercial codePFC5.0, 6.0
STAR-CCM+
[1,21,30,31]
Commercial CFD + Commercial DEMCOMSOL5.6 + PFC5.0
Ansys Fluent + EDEM
[32,33,34]
Commercial CFD + Open-source DEMANSYS Fluent15.0 + LIGGGHTS[35]
Open source CFD + Commercial DEMOpenfoam + PFC5.0
Code Saturne + SIGRAME
[36,37,38]
Open source CFD + Open-source DEMMFiX (an open-source simulation platform integrating CFD and DEM)
Openfoam + LIGGGHTS
[8,9,39,40]
Programming languageC++
Fortran 90/95
[41,42,43]
Table 2. Physical and index properties of fine particles and pore fluid used in the LF-NMR experiments.
PropertiesSpecific Gravity (a)Median Particle Size [µm] (b)Density of Particle [g/cm3] (b)Fluid TypeFluid Density [g/cm3]
Montmorillonite (fine)2.5310.722.53Deionized water (DW)1.0
Quartz Sand (coarse)2.651770.002.65
(a) Density analysis by gas pycnometer, (b) data from manufacturer.
Table 3. Parameters used in the coupled CFD-DEM model.
Computation ModulesParametersMontmorilloniteCoarse Grained [52]
DEMDensity [kg/m3]2.3 × 1032.65 × 103
Normal-to-shear stiffness ratio2.5 [53]1
Friction coefficient0.2 [54]0.7
Particle number (clump)5122 (307,320)221 (-)
Hydrate [1]
Density [kg/m3]0.9 × 103
Effective modulus [Pa]7 × 10⁸
Normal-to-shear stiffness ratio1.8
Friction coefficient0.8
Parallel-bond effective modulus [Pa]2 × 10⁹
Parallel-bond normal-to-shear stiffness ratio1.8
Parallel-bond tensile strength [Pa]4.5 × 10⁷
Parallel-bond cohesion strength [Pa]1.4 × 10⁷
Internal friction angle [°]30
Particle number (rblock)9 (133)
CFDFluid density [kg/m3]1000
Fluid dynamic viscosity [Pa⋅s]0.001
Table 4. Simulation cases of fine-particle migration in a coarse pack.
CaseFine Concentration [Weight %]Inlet Flow Rate [m/s]
10.020.05
20.020.5
30.021
40.20.5
Disclaimer/Publisher’s Note: The statements, opinions and data contained in all publications are solely those of the individual author(s) and contributor(s) and not of MDPI and/or the editor(s). MDPI and/or the editor(s) disclaim responsibility for any injury to people or property resulting from any ideas, methods, instructions or products referred to in the content.