


Abstract
The rapid integration of renewable energy into power systems has made voltage oscillations caused by the intermittency of wind and solar power a critical operational challenge. To mitigate these issues, this paper proposes a multi-mode coordinated reactive power control strategy to enhance voltage stability in renewable energy clusters. The approach integrates two key indicators: voltage sensitivity for steady-state regulation and an improved multi-renewable energy station short circuit ratio (MRSCR) that accounts for dynamic power interactions. Validation is conducted using a hardware-in-the-loop (HIL) platform combining real-time RMS-based simulation with physical controllers. Case studies on an offshore wind cluster demonstrate that the proposed method reduces voltage fluctuation amplitude more effectively than conventional automatic voltage control (AVC), successfully suppressing oscillations. The results confirm that the strategy exhibits stronger adaptability to varying grid conditions and offers a scalable solution for oscillation mitigation in large-scale renewable energy integration.
1. Introduction
Wind and photovoltaic power have rapidly developed into dominant renewable energy sources in recent years. Large-scale renewable energy clusters are being deployed across Northwest, North, and Northeast China, typically utilizing a centralized development model with long-distance transmission via ultra-high voltage direct current (UHVDC) lines. Concurrently, offshore wind power along the eastern coast is expanding at a rapid pace. However, the inherent variability of wind and solar resources frequently leads to voltage fluctuations within these clusters. For example, in 2022, a collection station in Jiangsu serving eight wind farms experienced voltage oscillations. In 2024, a photovoltaic station in Tianjin encountered severe inter-station reactive power imbalance, repeated high-voltage ride-through events, and inverter power oscillations, primarily due to inadequate AVC settings and blocking strategies. Furthermore, historical blackout events, such as those in Spain and Portugal, have demonstrated that large-scale renewable integration can significantly exacerbate voltage stability challenges [1].
Enhancing the reactive power and voltage regulation capability of renewable energy clusters necessitates targeted research on coordinated transient-stability AVC strategies and their simulation validation. Such work must be grounded in actual grid scenarios involving abnormal voltage fluctuations, while comprehensively considering renewable generation characteristics, local grid architecture, and operational constraints. The existing literature provides a substantial foundation across several domains. Advanced optimal power flow (OPF) techniques, including those incorporating artificial intelligence, have been surveyed to establish a methodological foundation for control strategy design [2]. In transmission system voltage control, research emphasizes wide-area coordination, featuring proposals for decentralized secondary control based on phasor measurement units [3], enhancements to conventional methods through grid structural analysis [4], and the automation of tertiary voltage control reflecting the trend toward full system automation [5]. For distribution networks with high penetration of distributed energy resources (DERs), active research areas include distributed coordination strategies for DERs and tap changers using model predictive control [6], multi-objective hierarchical volt/var control frameworks for active distribution networks [7,8], multi-timescale reactive power optimization methods [9], and innovative control modes such as “Volt-PF” for feeder management [10]. Research in distributed control has explored the coordination of multiple inverter droop functions to optimize local performance [11], while hierarchical strategies integrating distributed and local control have been designed specifically for photovoltaic clusters [12]. To address PV uncertainty, adaptive control methods utilizing measurement-strategy mapping matrices [13], control schemes designed for large-scale PV plants [14], and robust control frameworks that operate without centralized computation [15,16] have been developed. From a planning perspective, studies have also investigated the optimal placement of reactive power compensation devices [17].
The integration of offshore wind power presents distinct challenges, prompting research into collection system topology optimization [18], fault ride-through and voltage support capabilities of grid-forming turbines in MMC-HVDC systems [19], and double-layer reactive power optimization using improved heuristic algorithms [20]. The coordinated utilization of wind farm reactive power capability has also been assessed [21]. Regarding analytical tools and validation platforms, classical approaches employing sensitivity analysis and Q-V curves [22] coexist with data-driven methods for identifying Q-V characteristics [23]. Decentralized reactive power control for PV systems using the IEC 61,850 GOOSE protocol has also been implemented [24]. As power electronic devices proliferate, system strength assessment has become increasingly critical, leading to the proposal of refined metrics such as the Generalized Operational Short-Circuit Ratio and the Complex Short-Circuit Ratio [25,26]. Furthermore, real-time hardware-in-the-loop (HIL) testbeds for developing coordinated control systems have been reported [27].
While considerable research has focused on voltage control in transmission systems, distribution networks, and individual renewable plants, studies specifically addressing voltage oscillations in large-scale renewable energy clusters remain limited. Few strategies have been proposed that integrate composite indices—such as voltage sensitivity and a dynamic short-circuit ratio—to ensure both steady-state and dynamic performance. Dedicated verification methods for such cluster-level strategies are also scarce. A technical comparison is provided in Table 1.
Table 1.
Technical comparative analysis.
Accordingly, the paper investigates voltage oscillations encountered in practical grid operation. A representative case is developed to reproduce such phenomena. We propose a hierarchical multi-mode coordinated reactive-voltage control strategy for renewable energy clusters, along with an associated verification methodology. The main contributions are summarized as follows.
- We enhance the conventional voltage control framework by introducing a coordinated reactive power and voltage control layer. The control roles of different renewable plants within the cluster are defined. Dynamic adjustment guidelines for control modes—including constant voltage, constant reactive power, and constant power factor—are also provided.
- A designed renewable energy cluster scenario is analyzed. Sensitivity variations under different grid operating modes are characterized. An improved short-circuit ratio (SCR) is formulated and incorporated as an optimization constraint. The integration enhances both voltage quality and system strength, ensuring stable grid integration.
- A multi-agent verification framework is established. We introduce a renewable energy simulation model suitable for large-system studies. Using a combined hardware-in-the-loop and digital simulation platform, voltage oscillations under high renewable penetration are replicated. The adoption of RMS-based simulation offers a computationally efficient and cost-effective validation approach for the category of control problems.
The remainder of this paper is organized as follows. Section 2 analyzes the key indicators influencing voltage fluctuation, focusing on voltage sensitivity and an improved short-circuit ratio. Section 3 proposes a hierarchical, multi-mode coordinated voltage control strategy tailored for renewable energy clusters. Section 4 details the validation method, introducing a hardware-in-the-loop platform for closed-loop testing of reactive power control. Section 5 presents a case study based on an offshore wind cluster to demonstrate the effectiveness of the proposed strategy. Finally, Section 6 concludes the paper and suggests directions for future work.
2. Analysis of Key Indicators Affecting Voltage Fluctuation
2.1. Voltage Sensitivity Analysis of Renewable Energy Clusters
Sensitivity analysis constitutes an essential analytical approach in reactive power and voltage control by capturing, through a linearized system model derived at a steady-state operating point, the sensitivity of bus voltages to variations in reactive power injection or absorption. The interaction is commonly represented by the sensitivity matrix ∂V/∂Q, a critical component for designing effective control actions to support voltage profiles and improve system stability. In contemporary power grids, particularly with renewable energy clusters, V-Q sensitivity analysis aids in evaluating grid strength, locating vulnerable buses, and optimizing the dispatch of reactive power resources. The adaptive implementation of the method enhances estimation accuracy across diverse operating states, thereby enabling more responsive and dependable voltage regulation in real-time operational frameworks. By solving the power flow equations, the widely adopted Newton–Raphson technique provides a high-fidelity numerical basis for sensitivity computation, with quadratic convergence making it particularly effective for analyzing large-scale AC networks.
Let the voltage magnitude be Vm and the phase angle be θ. The complex node voltage is expressed as
where Vm,i is the voltage magnitude (p.u.) at node i. θi is the voltage phase angle (in radians) at node i.
The voltage vector for all nodes is
The node admittance matrix and power injection are given by
where Ybus is the node admittance matrix and ∗ denotes the complex conjugate.
The Jacobian matrix is composed of partial derivatives of power with respect to voltage:
where P is the active power vector, and the value is Re(S). Q is the reactive power vector, the value of which is Im(S).
The voltage magnitudes of slack and PV nodes are fixed, and the phase angle of the slack node is fixed. After removing the rows and columns corresponding to fixed variables, the retained variables are the phase angles and voltage magnitudes of PQ nodes:
The reduced Jacobian matrix is
where PQ is the set of PQ nodes.
A unit reactive power perturbation is applied at each PQ node k by employing the following equation:
where the k-th element is 1.
Solve the linear system as follows:
where ΔQPQ,k is the part of ΔQk corresponding to PQ nodes.
The solution yields
Combining the sensitivities for all PQ nodes yields
The columns corresponding to non-PQ nodes are zero. Sensitivities between PQ nodes are given by the corresponding submatrix of inv(Jred).
For renewable energy clusters, QV curves can be derived at various steady-state points. These curves serve as a widely used tool for voltage instability assessment, demonstrating the reactive power injection or absorption required to maintain voltage stability under varying loads. A key insight from the QV curve is its slope, dQ/dV: a positive slope indicates voltage stability at that operating point, whereas a zero or negative slope signals proximity to or breach of the stability limit. Thus, the slope directly expresses local voltage sensitivity. QV curves help pinpoint the most vulnerable buses for targeted compensation. Industry standards such as the WECC voltage stability criteria (1999) formalize the use of QV-based metrics. By setting appropriate dQ/dV thresholds and comparing them with real-time measurements, system operators can continuously evaluate voltage stability and initiate preventive controls when necessary.
2.2. Short-Circuit Ratio Reflecting Grid Strength
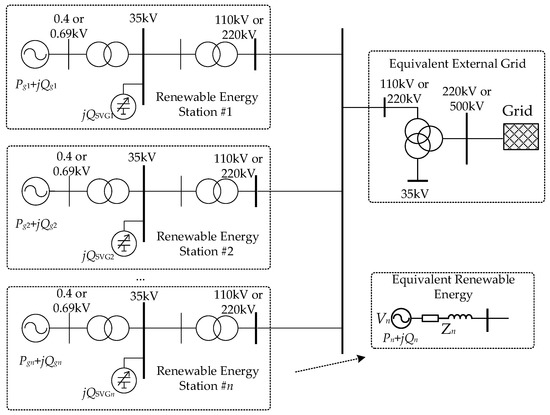
Figure 1 shows a typical renewable energy cluster, whose voltage stability is closely linked to the short-circuit ratio at the grid connection point. The short-circuit ratio is a key indicator for assessing the grid voltage’s susceptibility to oscillation, complementing the voltage sensitivity approach discussed in Section 2 for enhancing grid strength and stability.
Figure 1.
A typical renewable energy cluster. The cluster comprises aggregated wind farms, where the voltage is stepped up through transformers (35kV/110kV/220kV/500kV) for grid connection. Each station is represented by a Thévenin equivalent circuit: a voltage source (Vn) in series with an impedance (Zn).
The CIGRE Working Group B4.62 has conducted a systematic review of prevalent methodologies for weak grid assessment in power systems engineering and has developed a dedicated framework for evaluating the grid interconnection strength of individual wind farms. The report details several established short-circuit ratio (SCR) calculation techniques, including the Composite Short-Circuit Ratio (CSCR), the Weighted Short-Circuit Ratio (WSCR), and the Equivalent Short-Circuit Ratio (ESCR). These methods rely exclusively on network parameters while intentionally omitting the characteristics of specific power electronic converter devices, thereby ensuring high practicality for engineering applications [25,26].
Among these, the WSCR serves as a key metric for quantifying the aggregate grid strength of a renewable energy cluster. The WSCR has been applied in operational practice, notably within the Texas power system, to support the determination of power transfer limits for inverter-based resources across critical transmission interfaces. The WSCR is expressed as follows:
where Ski is the short-circuit capacity of the renewable energy power station i; Pi is the active output of the renewable energy power station i; and n is the number of renewable energy power stations.
The fundamental principle of the Composite Short-Circuit Ratio (CSCR) involves modeling the entire generation cluster as a single equivalent source connected to a virtual common coupling point. The CSCR is defined as the ratio of the short-circuit capacity (Sk) at the point to the total active power output of the cluster, as given by the following formula:
where Sk,eq is the short-circuit capacity of the renewable energy cluster aggregation equivalent system at the virtual public grid connection point.
The calculation methodology for the Equivalent Short-Circuit Ratio (ESCR) is derived from the concept of the Multi-Infeed Short-Circuit Ratio employed in multi-terminal HVDC systems. Its key advancement lies in the consideration of mutual voltage interactions between distinct stations when assessing the aggregate grid strength. The ESCR is expressed by the following Equation (13):
where rji is the voltage interaction coefficient between the renewable energy power station at node j and the renewable energy power station at node i. rji is expressed as shown in Equation (14):
where Zii is the self-impedance of the renewable energy power station i; Zji is the mutual impedance between the renewable energy power station at node j and the renewable energy power station at node i.
In practical systems, nearly all wind and PV plants deploy SVCs or SVGs to compensate for reactive losses. Moreover, most inverters are current-source-controlled grid-connected devices and are also susceptible to stability issues under weak grid conditions, making their point-of-connection strength a relevant concern, one not adequately captured by existing ESCR or CSCR methods. An improved approach uses a complex interaction factor that accounts for both impedance angles and initial phase differences between units. The method incorporates reactive output Q by replacing active power P with apparent power S = P + jQ in the calculation, resulting in the refined multi-renewable energy station short circuit ratio (MRSCR), expressed as follows:
where Zcr is the threshold of mutual impedance.
The mutual impedance Zji reflects the relationship between the current fluctuation at renewable energy station j and the resulting node voltage fluctuation at renewable energy station i. The mutual impedance is therefore suitable as an indicator for measuring electrical proximity. When the mutual impedance is less than 0.5% (0.005 p.u.), a change in the power output of station j will not result in any measurable voltage fluctuation at station i. Consequently, the control system of station i will not respond, meaning that station i remains unaffected by station j. Therefore, a mutual impedance threshold Zcr of 0.005 p.u. can be set to define the computational scope, only renewable energy stations with a mutual impedance not less than 0.005 p.u. need to be considered.
An SVG is a power electronic source controlled as a current source and should be treated as an independent source in the MRSCR calculation. Its output comprises only the imaginary part (reactive power). The approach fully accounts for the impact of SVG output on the stability of renewable energy units and the grid strength at the SVG’s own point of connection. Consequently, the number of current sources considered in the MRSCR calculation increases. If reactive power compensation is achieved using the capacity of the renewable energy units themselves, the number of current sources in the MRSCR calculation remains unchanged. The output of each current source includes both the real part (active power) and the imaginary part (reactive power).
3. Improved Voltage Coordinated Control Strategy for Renewable Energy Clusters
3.1. Conventional Secondary Control AVC Method
The objective function of the conventional secondary control optimization model is formulated as follows [1,2]:
where α is the gain coefficient; ΔQg is the optimization variable, representing the reactive power output of each renewable energy plant. The term Wp is the weight assigned to the voltage deviation component, ΔVp is the voltage deviation at the pilot bus and Cg is the voltage sensitivity matrix. The term Wq is the weight for the balancing component of the adjustable remaining reactive power capacity at each plant, and Qg, Qg.max, and Qg.min refer to the current reactive output, upper limit, and lower limit of the renewable energy plant, respectively.
Once the optimal reactive outputs are determined by the secondary control, they are converted into voltage commands via the matrix Cg for distribution to the substations. Cg satisfies the following relation:
The equality constraints of the secondary control optimization model are given by the power balance equations for all nodes in the region:
where PGi and QGi are the active and reactive power outputs of the generator at node i, respectively; PLi and QLi are the active and reactive power demands of the load at node i, respectively; and Gij and Bij are the real and imaginary parts of the admittance matrix element Yij.
The inequality constraints include limits on the single-step adjustment amount, voltage limits, and substation reactive power limits, expressed as
where Up, Up.max, and Up.min denote the current voltage, upper limit, and lower limit at the pilot point, respectively; UH, UH.max, UH.min, and ΔUH represent the current voltage, upper limit, lower limit, and maximum permissible single-step adjustment for each renewable energy plant, respectively. Cvg is the reactive power–voltage sensitivity matrix for each plant, which satisfies
In the above expression, UH indicates the current voltage at the high-voltage side bus of the generator.
3.2. Multi-Level AVC Architecture for Renewable Energy Clusters
In strongly coupled AVC substations, such as those in renewable energy clusters, an issue can arise when the weight of the voltage deviation component (Wp) is high relative to the weight of the remaining reactive power balancing component (Wq). Specifically, after a voltage deviation is corrected, reactive power balance and fairness are typically pursued by increasing the output of plants with lower reactive loading rates and decreasing that of plants with higher rates. However, the combined adjustments from multiple generators may yield a required adjustment at the plant’s high-voltage bus that is very small, even smaller than the control dead band. Consequently, reactive power balance and rational power flow cannot be achieved. The problem is especially prominent in regional grids following large-scale integration of renewable energy clusters.
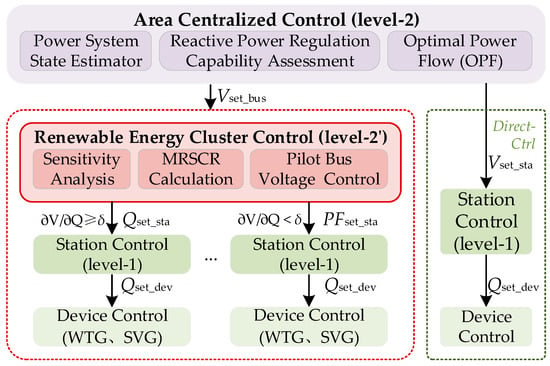
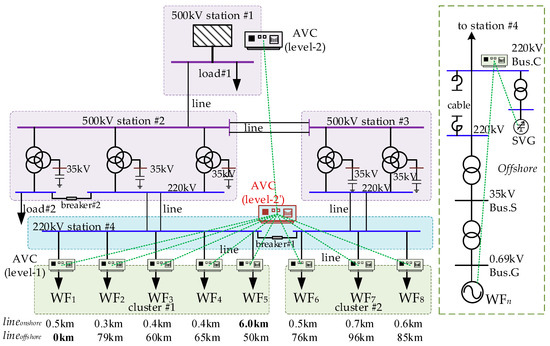
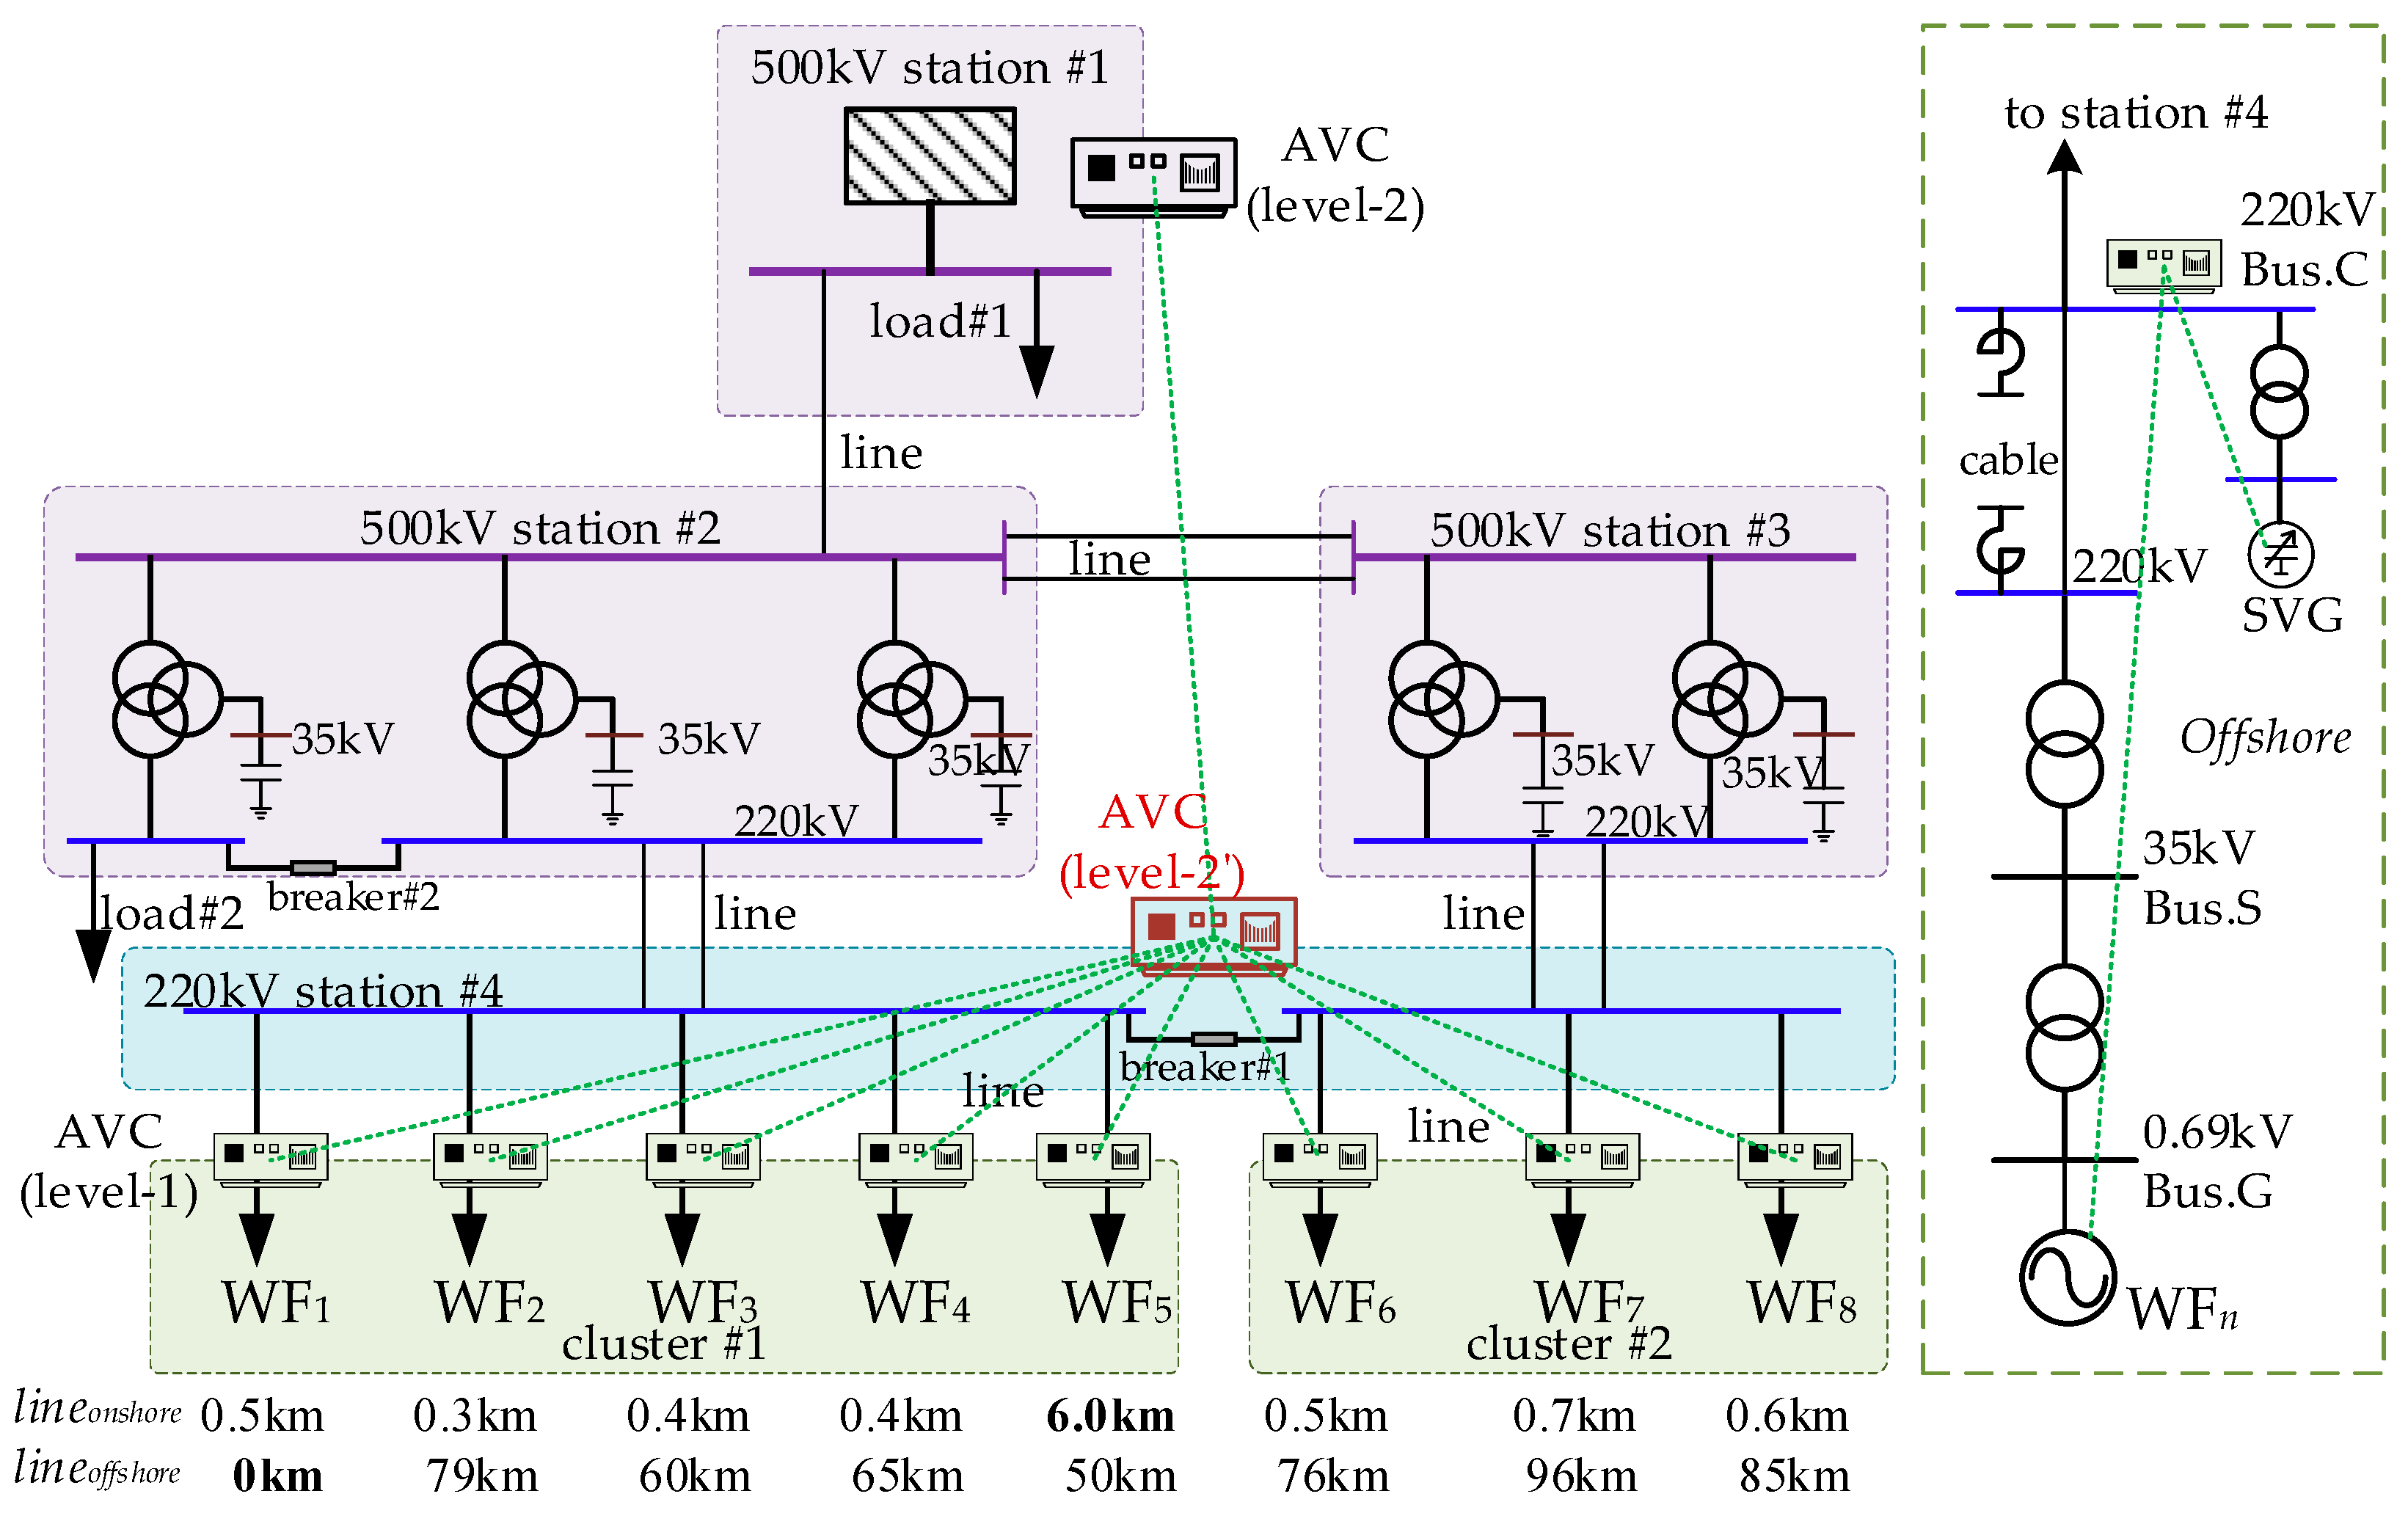
Therefore, the paper proposes a reactive power voltage control strategy that incorporates an AVC coordination station (level-2’). A substation or switch-station node where multiple power plants (primarily renewable) aggregate is designated as the AVC coordination station. Positioned between the AVC Master Station and the renewable-energy AVC Substations, the AVC coordination station operates at the local secondary control level, facilitating reactive power–voltage interaction.
The subordinate AVC Substations (level-1) report their remaining adjustable reactive power capacity to the coordination station (level-2’). The AVC Master Station (level-2) performs secondary voltage control optimization for the grid area and issues adjustment commands to each conventional substation and the coordination station. Based on the topology and real-time reactive outputs of its subordinate substations, the coordination station calculates the total required reactive power adjustment. The AVC coordination station then determines and dispatches specific adjustment commands to each subordinate substation for the current control cycle, which are subsequently executed. The framework of the improved control strategy is shown in Figure 2.
Figure 2.
Framework of the integrated control strategy.
The main control modes for the plant-side AVC substations are defined as follows:
- (1)
- Constant voltage control mode
The PCC voltage is taken as the control objective. The total reactive power required from the plant is calculated based on the voltage target. The total reactive power is allocated to each controlled renewable generation unit or adjustable reactive device (SVG) according to a predefined dispatch strategy, driving the PCC bus voltage to its target value and enabling the realization of automatic voltage and reactive power control for the entire plant.
- (2)
- Constant reactive power control mode
The total reactive power at the PCC is taken as the control objective. The target is allocated to each participating unit or device per the dispatch strategy, ensuring that the total station reactive power meets the setpoint. Automatic voltage and reactive power control is thus realized.
- (3)
- Constant power factor control mode
The power factor at the PCC is taken as the control objective. The required adjustment is allocated to each participating unit or device according to the dispatch strategy so that the total station power factor reaches the target value.
For the plant-side AVC Substations (level-1) under the AVC coordination station (level-2’), two categories are defined based on voltage sensitivity: those with high sensitivity are switched to constant reactive power control mode, while those with low sensitivity are set to constant power factor control mode. The specific thresholds δ can be determined according to the actual grid. AVC substations not under the AVC coordination station’s jurisdiction remain in constant voltage control mode.
Furthermore, multi-renewable energy station short-circuit ratio (MRSCR) constraints are incorporated. An improved objective function is adopted for the AVC coordination station as shown below. By setting the weight of the MRSCR balancing indicator, the short-circuit ratios of the renewable plants under the AVC coordination station are guided toward a more balanced state.
where Wp is the weight of the voltage deviation component for these substations; Wq is the weight for the balancing component of their adjustable remaining reactive power capacity; β is the gain coefficient; Wscr is the weight of the MRSCR deviation component for these substations; and Cmg is the reactive power–MRSCR matrix for each plant.
According to Equation (15), the variation in the variable MRSCRg is influenced by multiple factors. Precisely calculating ΔMRSCRg demands considerable computational resources and relies on the full-network impedance matrix. A more practical engineering alternative is to derive the typical engineering coefficient matrix Cmg related to reactive power through extensive offline computations, thereby accelerating the solution process. As illustrated in the case study in Section 5.3, Cmg exhibits an approximately linear relationship within local operating regions.
The optimization is solved using the interior-point algorithm, chosen for its proven robustness and efficiency in handling smooth, nonlinear constrained problems like ours. This algorithm is available in widely used solvers such as IPOPT or within the optimization toolbox of MATLAB R2012a or later. To manage computational demand for large clusters, the core sensitivity matrix is computed offline. This transforms the online problem into a tractable quadratic program with linear constraints, which ensures both solution speed and scalability.
4. Validation Method for Reactive Power Closed-Loop Control Strategy
4.1. Closed-Loop Verification Platform for Cluster-Level Control Strategies
While commercial simulation tools (e.g., RTDS, ADPSS, RT-LAB) are widely adopted for electromagnetic-transient analysis of individual renewable energy devices, they exhibit limitations when applied to the study of large-scale, multi-layer reactive power and voltage control strategies. Such cluster-level control operates on a slower timescale (seconds to minutes), uses RMS-based electrical quantities as control objectives, and requires extensive and bidirectional data exchange with numerous AVC controllers via industrial communication protocols such as IEC 60870-5-104. To address the gap, the paper develops a dedicated real-time RMS-simulation platform for verifying reactive power and voltage control strategies in renewable energy clusters. The platform simulates the dynamic behavior of the power system and the voltage regulation capability of renewable plant primary equipment. By integrating actual AVC hardware through a simulated communication network, the platform enables closed-loop, hardware-in-the-loop (HIL) testing, where physical controllers interact with digital simulation models in real time. The architecture of the closed-loop verification platform is shown in Figure 3.
Figure 3.
Closed-loop verification platform architecture.
The simulation platform is developed based on C++ at each simulation time step (10 milliseconds). The communication process is decoupled from the simulation process, enabling data exchange with the external environment. Furthermore, the platform architecture decouples the communication front-end process from the real-time simulation process via shared memory. The front end operates in multi-threaded mode, with each IEC 60870-5-104 communication link handled by a separate thread identified by its IP-port pair. Communication stress tests confirm that a single PC can support the simulation of large-scale clusters. Each renewable plant can be modeled either as an equivalent aggregated unit or as a detailed representation of its internal generation units. Control strategies may be implemented using actual controller hardware—capturing true discrete control behavior—or as digital models, which allow flexible parameter tuning and comparative analysis.
4.2. Dynamic Model Reflecting Control Characteristics
For electromechanical transient studies, a renewable energy plant’s grid interface can be abstracted into key functional modules: power–electronic interface, active power control, reactive power control and fault-handling blocks. The reactive power and voltage control strategy can be reconfigured as needed by switching the cflg. The generalized power–electronic interface model is shown in Figure 4.
Figure 4.
Generalized power–electronic interface model. The diagram arranges the control modules vertically: voltage, power factor, reactive power, and active power. Corresponding to these are the blue setpoint variables (Vset, Qset, PFset, Pset) and the mode-switching flag cflg. The module in the lower-right corner is the current source interface, where X″ represents the equivalent parallel impedance, Vterm the terminal voltage, and Is the injected current. The enable flag vflg controls the voltage regulation module, which is designed to stabilize and improve the terminal voltage.
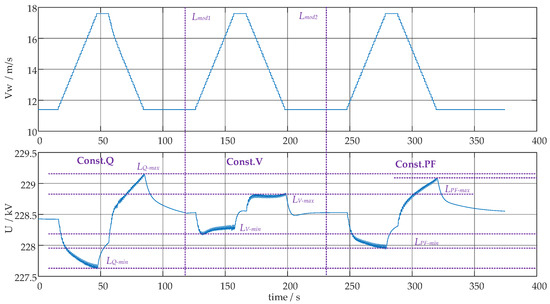
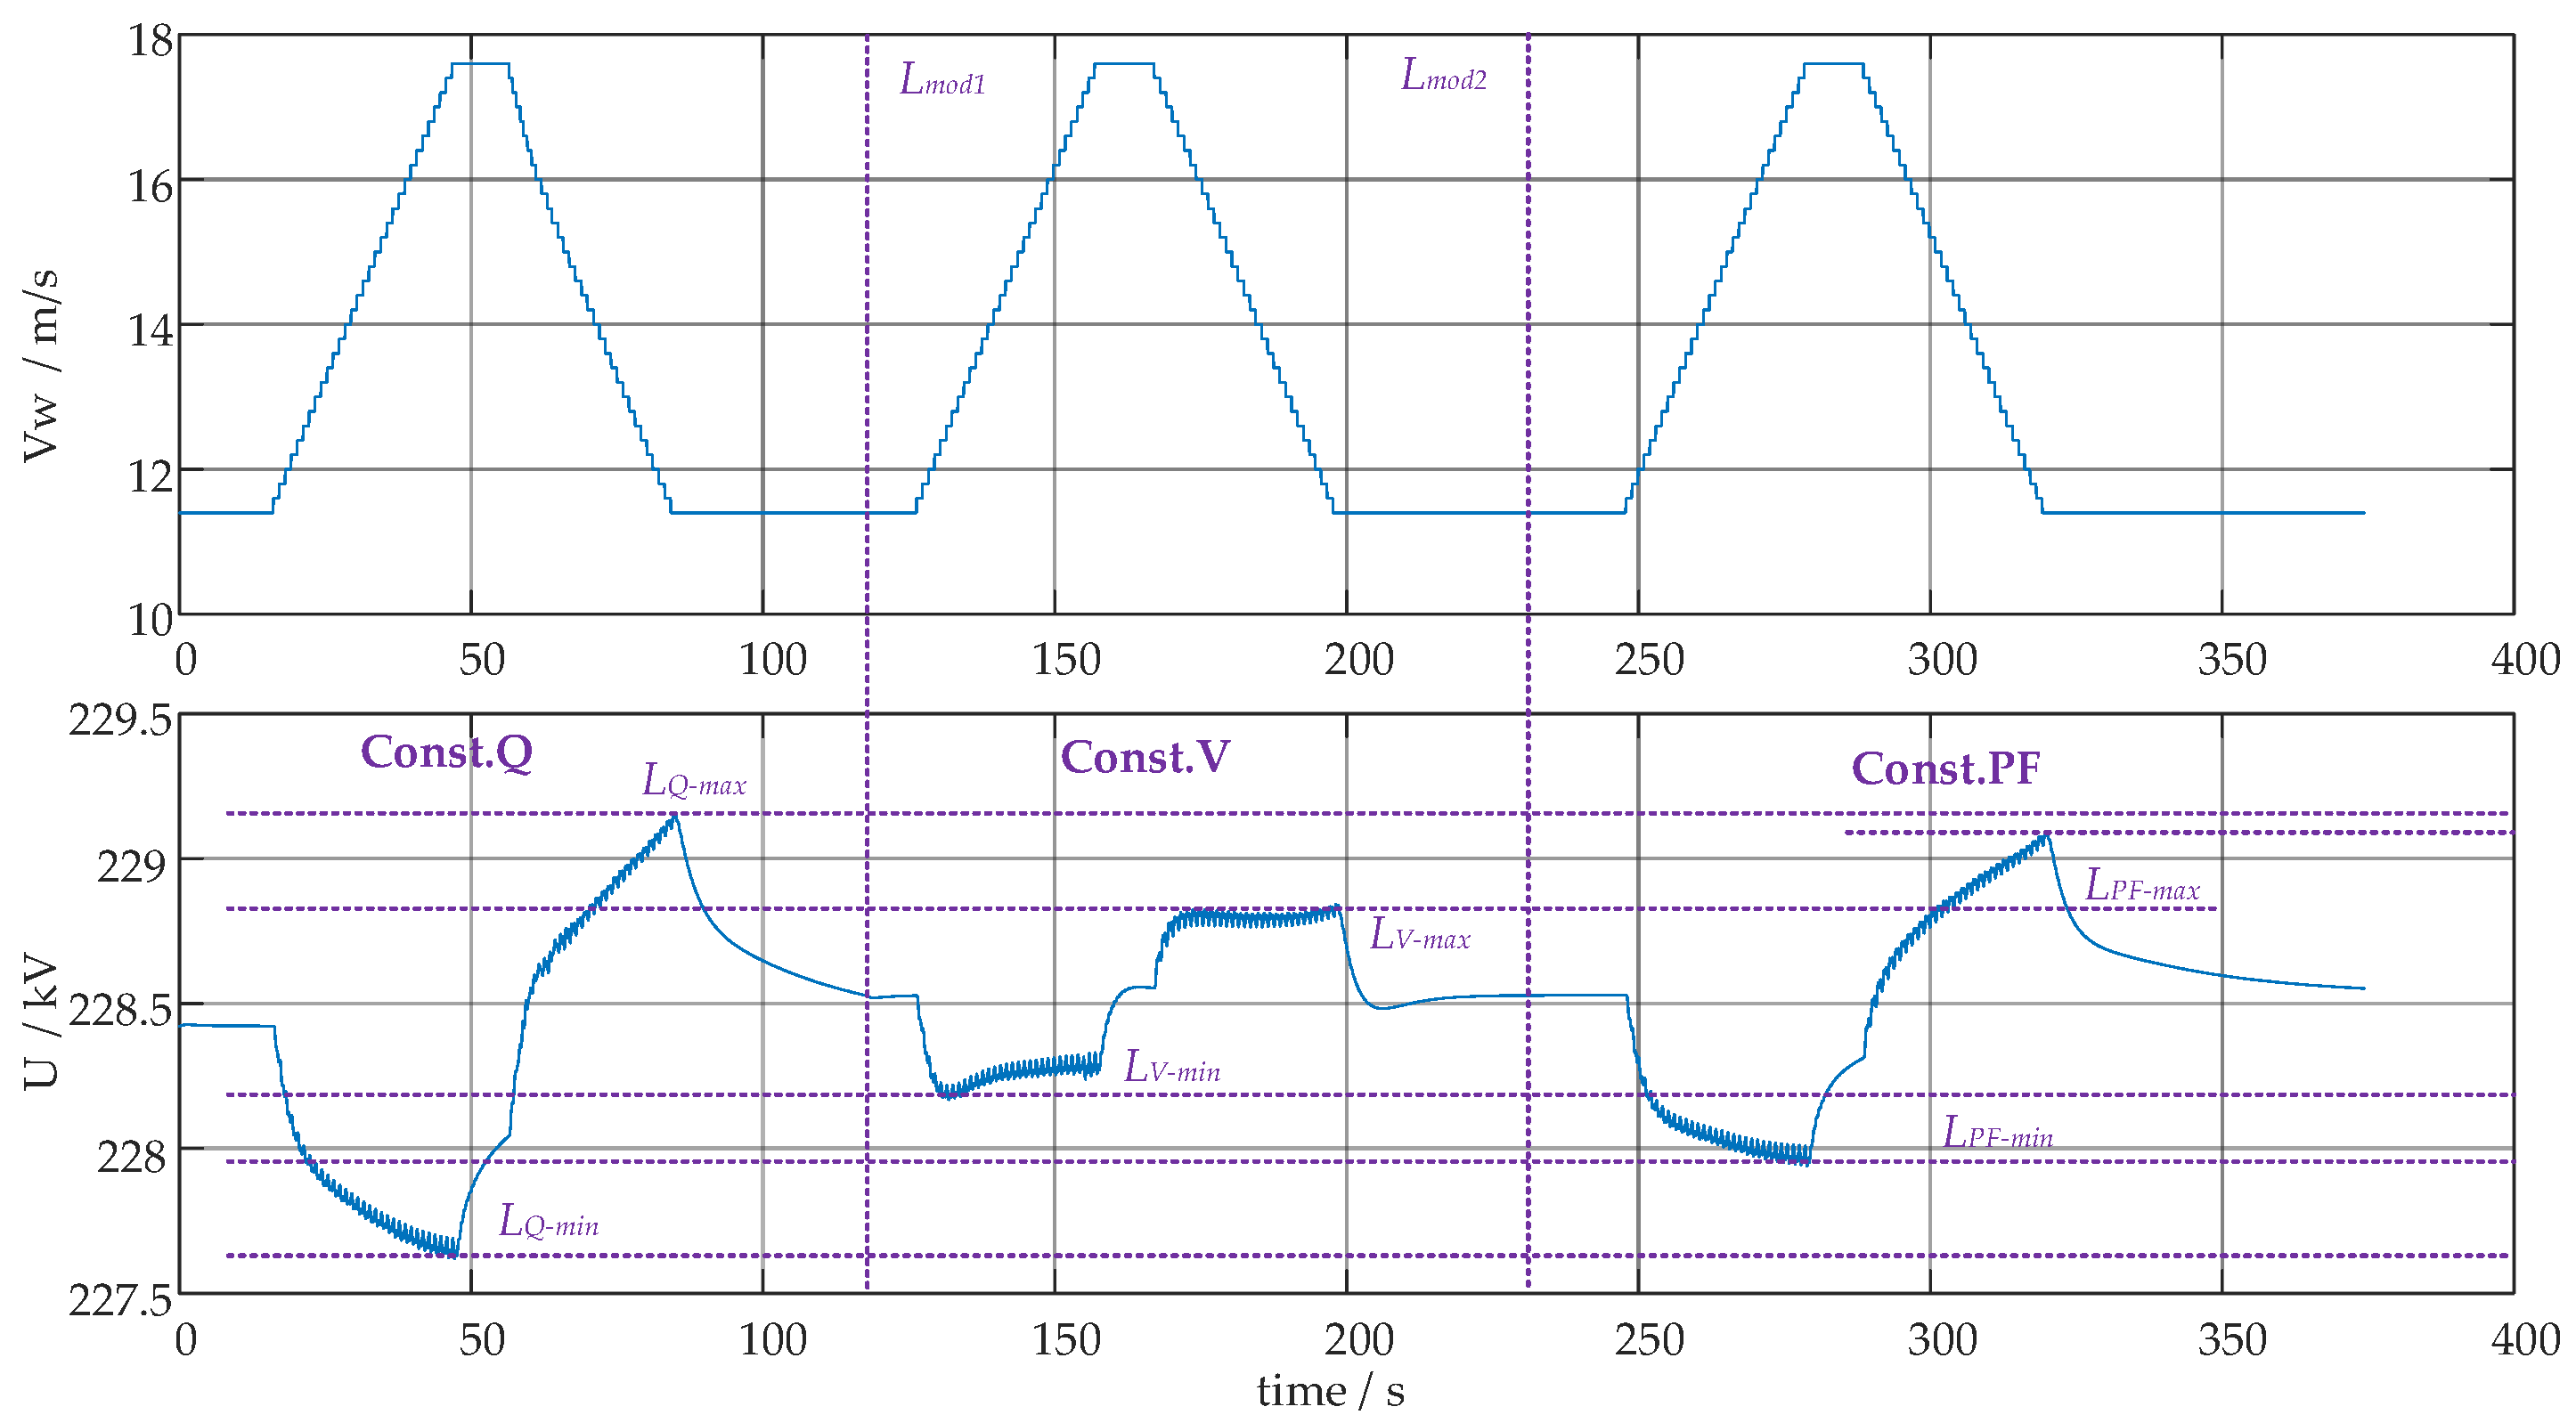
Based on different control strategies and their corresponding constant voltage, constant reactive power, and constant power factor control commands such as Vset, Qset and PFset, the required active current and reactive current components to be injected into the grid are calculated. When wind speed changes rapidly, different control modes exhibit varying effects in suppressing voltage fluctuations at the grid connection point of the wind farm. For instance, a time-domain simulation analysis of a single wind farm shows that the constant voltage mode results in the smallest voltage fluctuation amplitude, the constant reactive power mode leads to the largest voltage fluctuation amplitude, and the constant power factor mode falls between the two. Figure 5 below compares the suppression effects of voltage fluctuations under different control strategies.
Figure 5.
Comparison of the effects of different control strategies under wind speed fluctuations. The curves are divided into three sections by Lmod1 and Lmod2: the constant reactive power control (Const.Q) zone, the constant voltage control (Const.V) zone, and the constant power factor control (Const.PF) zone. The lines LQ-max, LQ-min, LV-max, LV-min, LPF-max, and LPF-min demarcate the local voltage maxima and minima within these respective control zones.
5. Case Study
5.1. A Study System with Multiple Wind Farms
A study case was constructed based on offshore wind power clusters connected via a 500 kV grid along the southeastern coast of China, as illustrated in Figure 6. Using the developed closed-loop verification platform, tests were performed with multiple physical AVC controllers. The setup enabled detailed analysis of reactive power and voltage oscillation phenomena. Through iterative testing and control strategy refinement, the proposed approach demonstrated effective mitigation of such oscillations, leading to improved voltage stability in the regional grid.
Figure 6.
Configuration of the studied system. The system comprises multiple stations. Stations #1, #2 and #3 are rated at 500 kV; Switching station #4 is rated at 220 kV. Station #4 supplies one onshore and seven offshore wind farms; the latter are connected via 50–100 km long submarine cables. Secondary AVC controllers (level-2) are configured at station #1, while station #4 is equipped with a controller (level-2’). A primary AVC controller (level-1) is installed on the 220 kV bus of each wind farm.
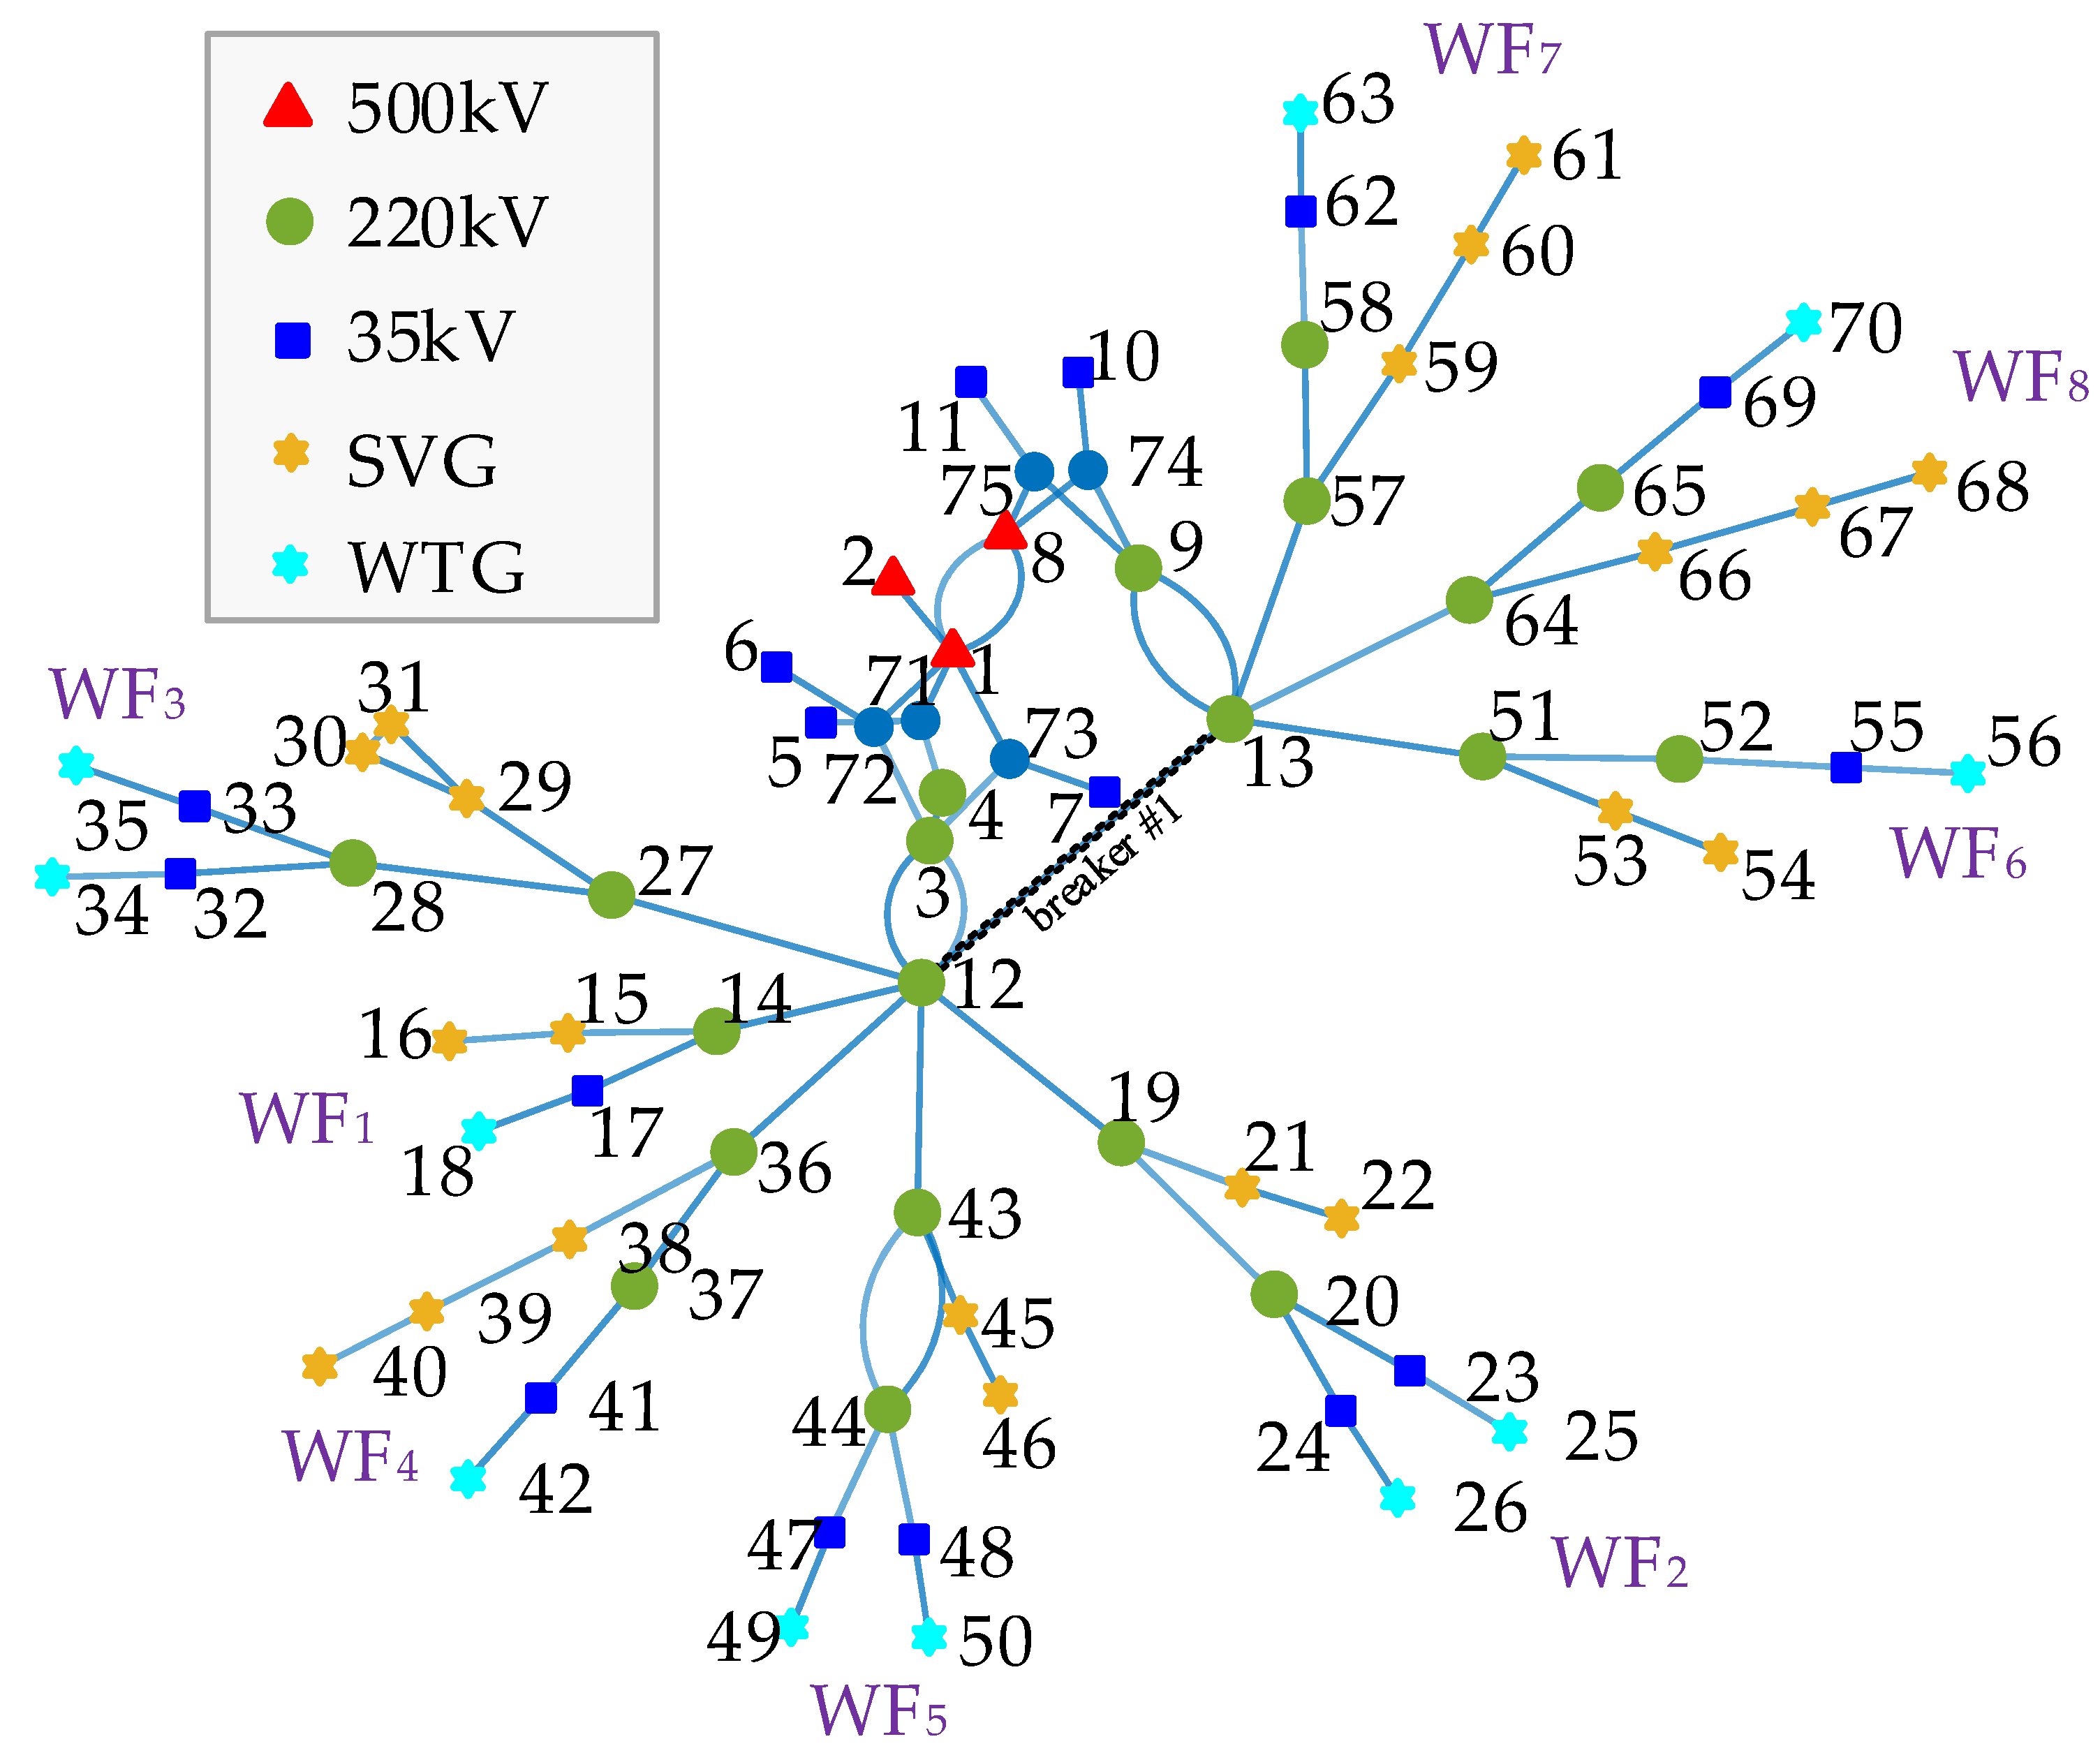
The case includes eight wind farms, with Wind Farm 1 being onshore and the remaining seven being offshore. A cluster voltage coordinated controller is configured at the 220 kV station (#4), and each wind farm is equipped with its own AVC plant controller. Figure 7 depicts the topological connection relationships between different electrical nodes within the renewable energy clusters. Different colors are used to distinguish the installation locations of the SVG and the wind farms.
Figure 7.
Topological relationships of renewable energy clusters. Node colors denote bus voltage levels and device connections: red (500 kV), green (220 kV), blue (35 kV), orange (SVG connection), and cyan (wind turbine connection). Bus 12 and Bus 13 are linked by a circuit breaker #1. Wind farms are labeled WF1 to WF8.
5.2. Voltage Sensitivity Analysis
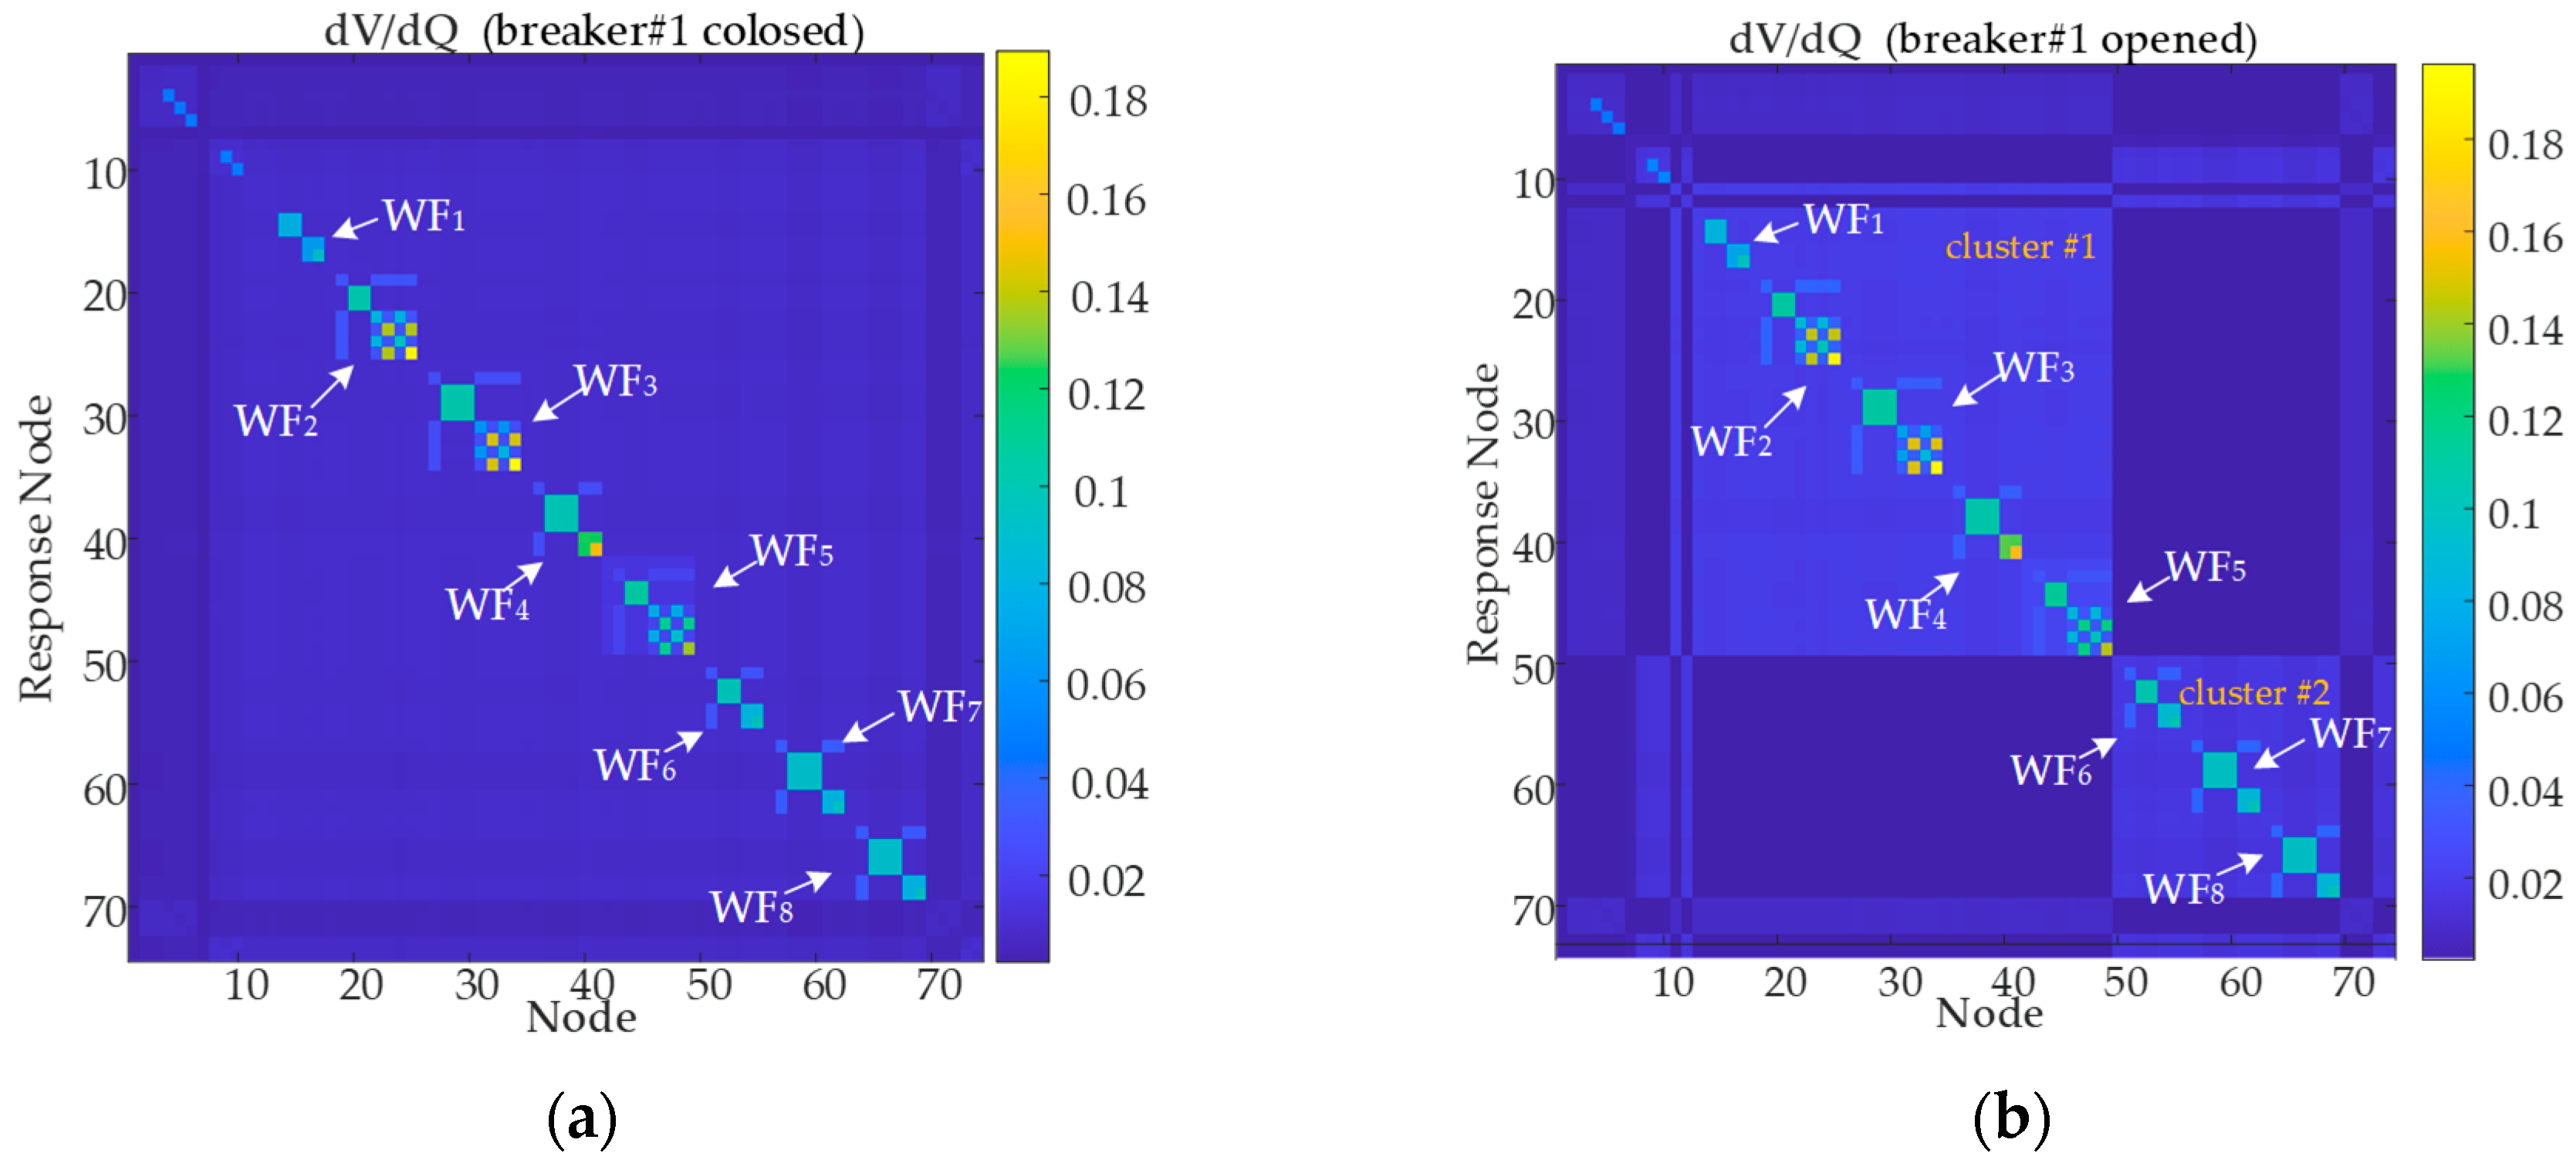
When breaker #1 is closed or opened, the renewable energy clusters will present two different grid configurations, and the corresponding voltage sensitivity matrix and short-circuit ratio will both change. A certain coupling relationship among multiple renewable energy stations connected to the same 220 kV bus is identified through visual analysis of the voltage sensitivity matrix.
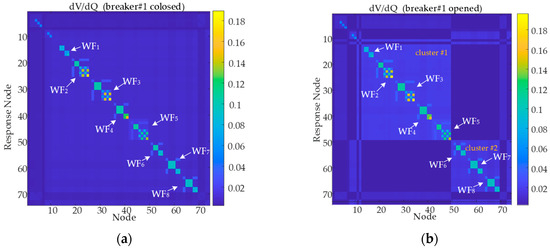
As shown in Figure 8, the sensitivity matrix clearly splits into two parts after circuit breaker #1 opens. Table 2 shows that the voltage sensitivity (dV/dQ) at Bus 43 for WF5 increases from 0.0137 to 0.0201 when breaker #1 opens, representing an increase of nearly 1.5 times. The rise in sensitivity is attributed to weakened electrical connections and a lower concentration of paralleled new energy stations.
Figure 8.
Voltage sensitivity matrix when breaker #1 closes and opens. (a) Sensitivity distribution with breaker #1 closed. (b) Sensitivity distribution with breaker #1 opened. Colors indicates sensitivity level: yellow (higher) to blue (lower). High-sensitivity buses from different wind farms, arranged sequentially, are distributed along the diagonal. Opening breaker #1 causes the sensitivity to separate into two distinct clusters (#1 and #2), partitioning the wind farms into two groups.
Table 2.
Voltage sensitivity when breaker #1 closes and opens.
The voltage sensitivity matrix can only reflect small disturbances around a specific operating point. To observe the voltage variation patterns under different reactive power outputs, the Q-V curve can be further calculated.
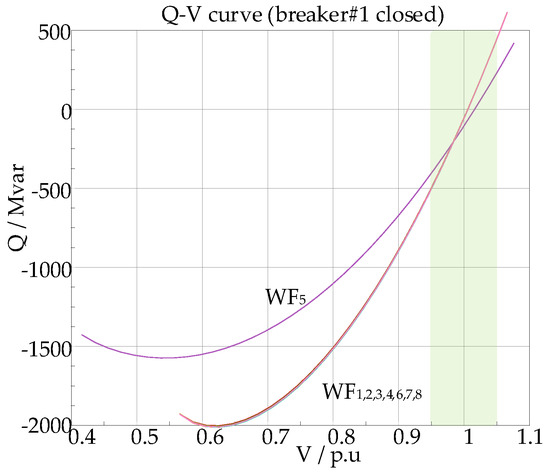
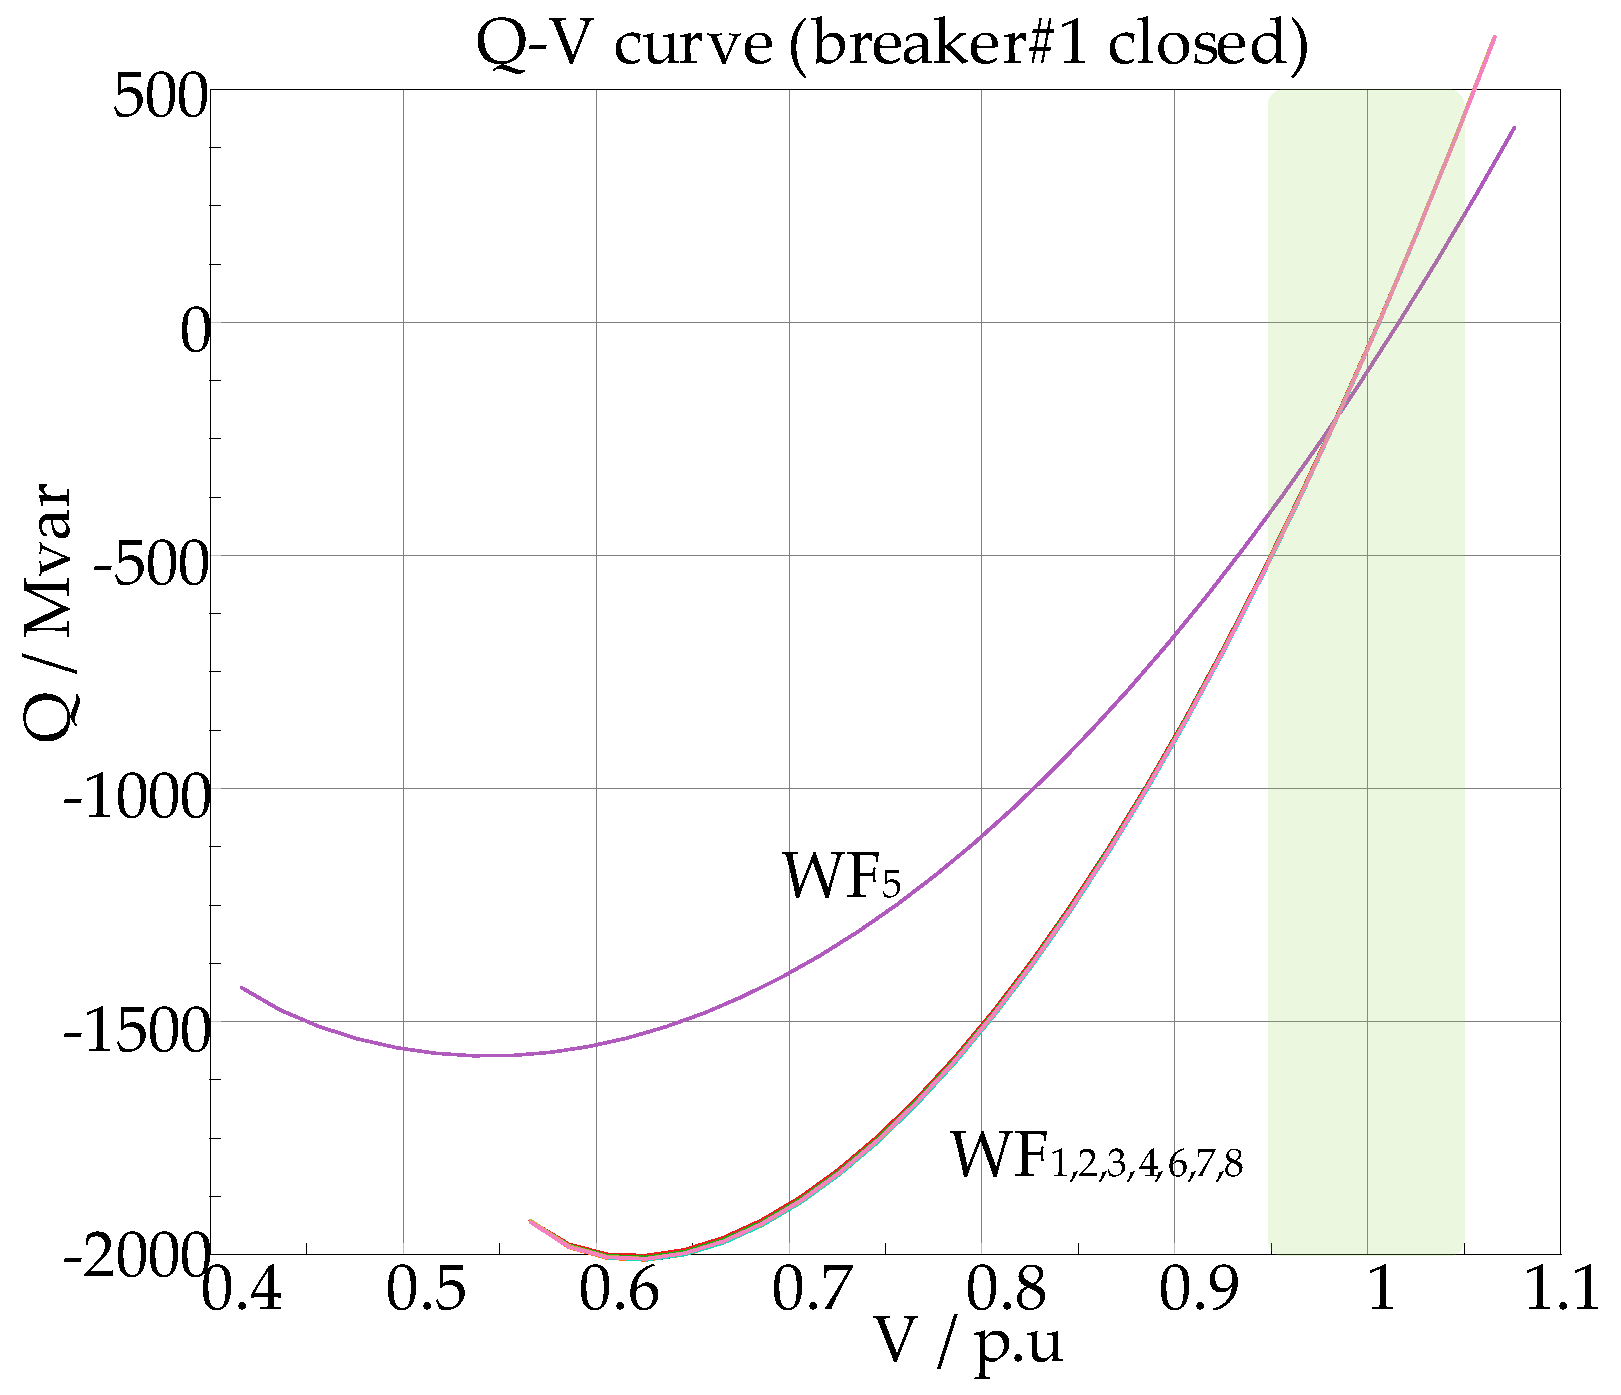
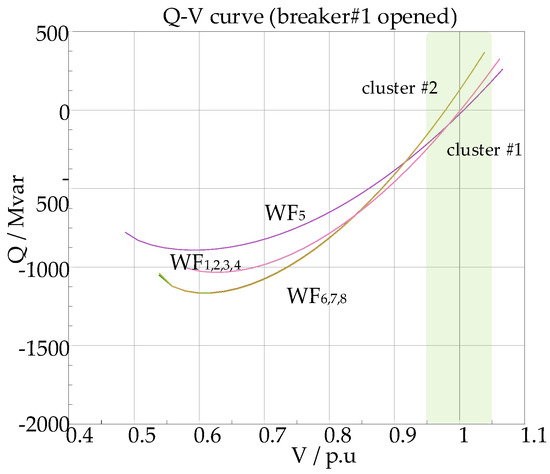
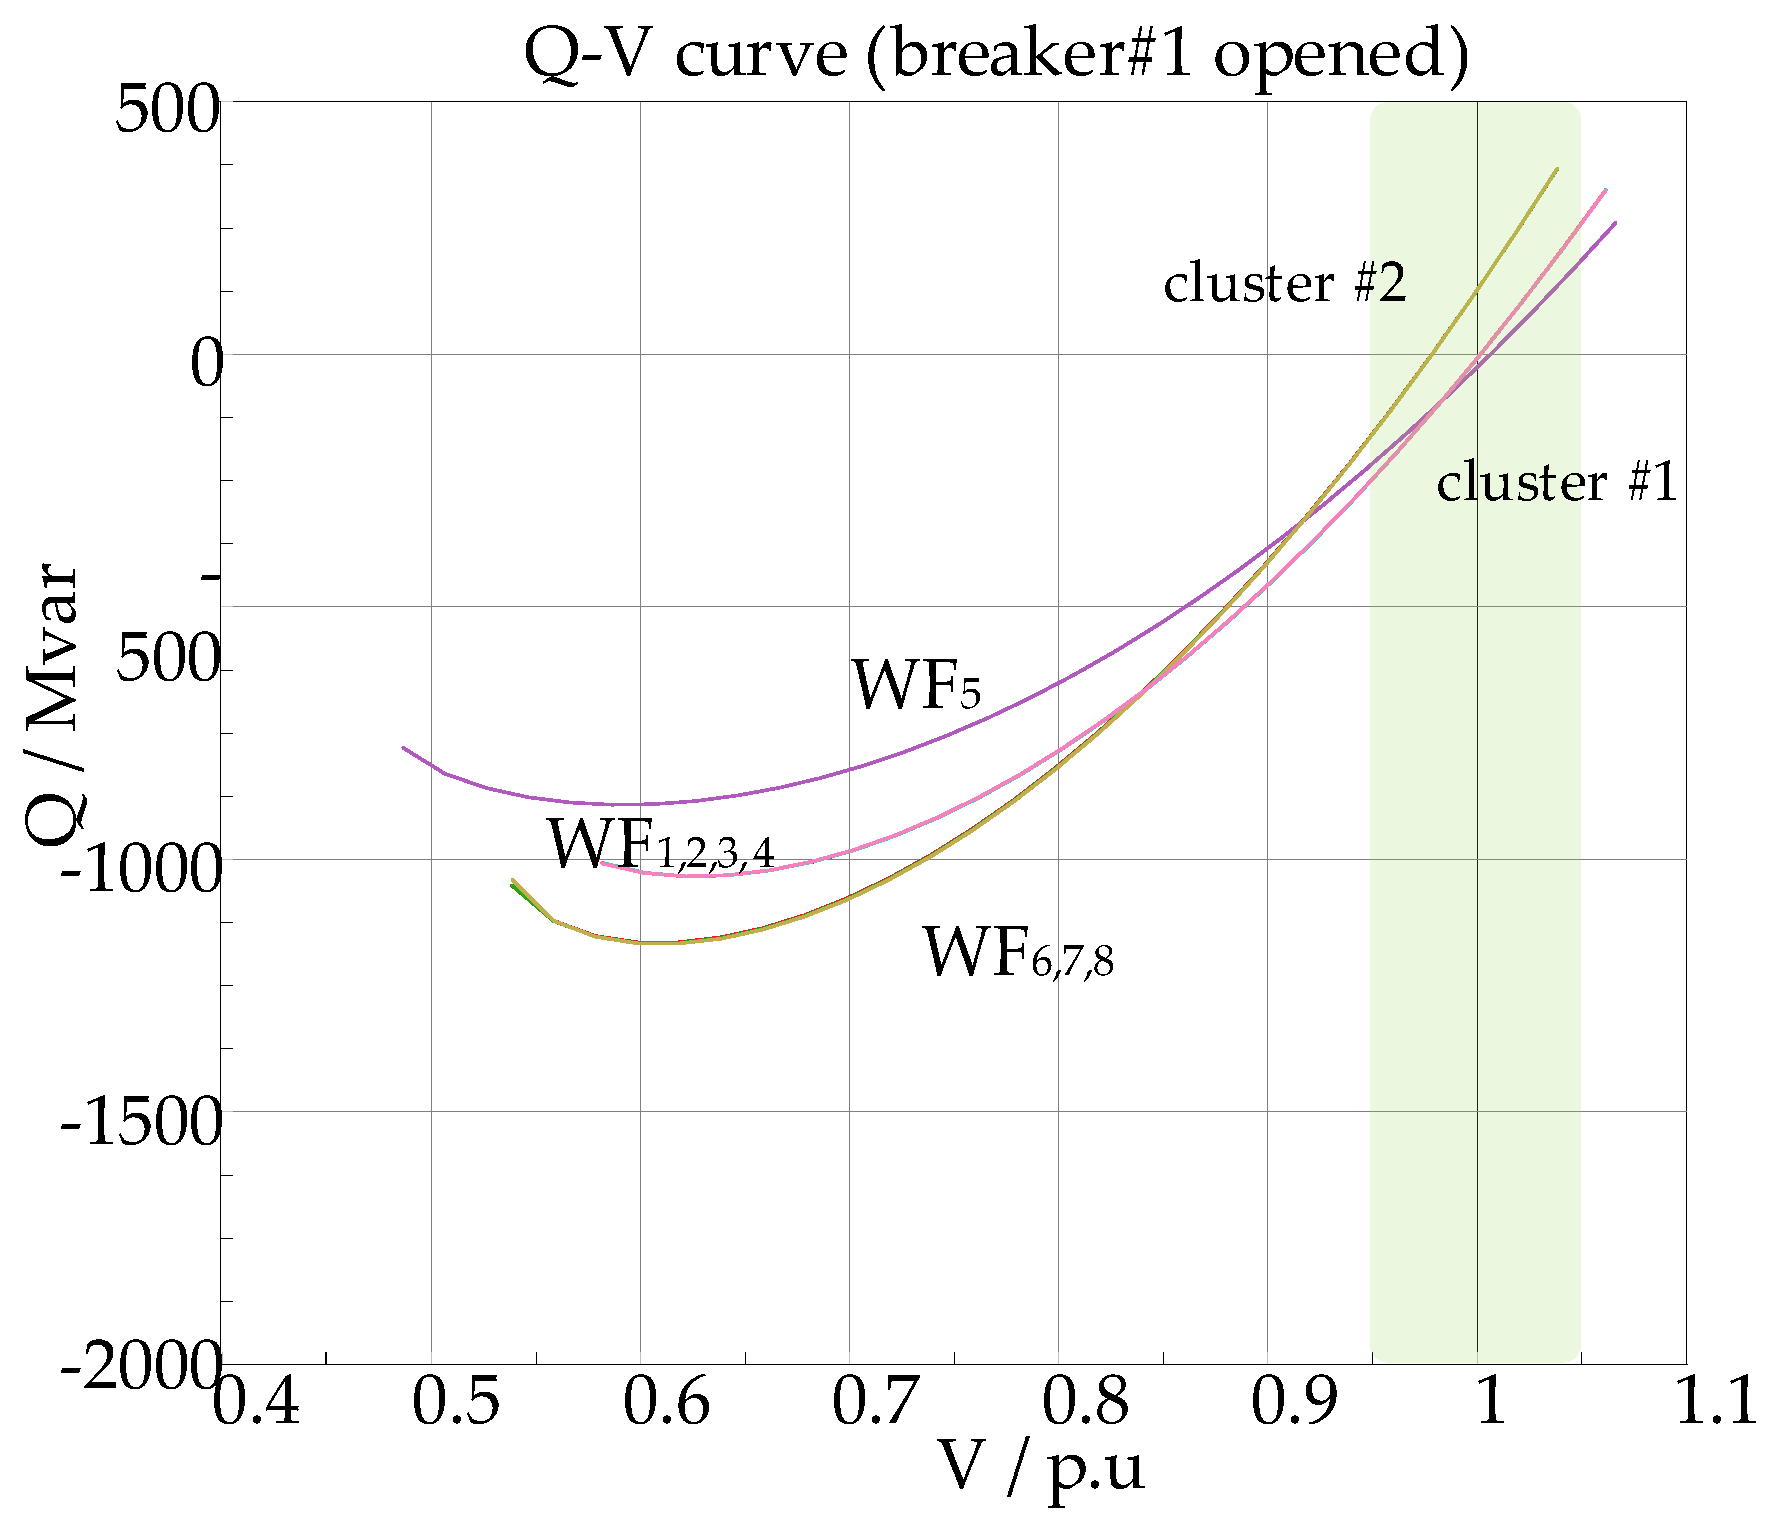
As shown in Figure 9 and Figure 10, near the rated voltage (1.0 p.u.), the slope of the Q-V curve remains largely constant, indicating that the voltage sensitivity is essentially stable. However, the slope of the curve varies significantly under different grid topologies when the status of breaker #1 changes. Therefore, the enhanced control strategy needs to dynamically calculate the voltage sensitivity matrix based on grid topology changes, with the sensitivity matrix serving as the basis for reactive power allocation.
Figure 9.
Q-V curve when breaker #1 closed. The curves for Wind Farms 1, 2, 3, 4, 6, 7, and 8 form one group, and the curve for Wind Farm 5 remains relatively separate. The green area (0.95–1.05) indicates the primary voltage fluctuation range.
Figure 10.
Q-V curve when breaker #1 opened. The curves for Wind Farms 1, 2, 3, and 4 form one group, those for Wind Farms 6, 7, and 8 form another, and the curve for Wind Farm 5 remains relatively separate.
5.3. Short-Circuit Ratio Analysis
In addition to being influenced by changes in the grid topology, the short-circuit ratio of renewable energy stations is primarily affected by variations in their power output. During periods of high renewable energy output, the short-circuit ratio decreases significantly. Therefore, the improved control strategy should not only maintain voltage around the target value but also optimize reactive power at renewable energy stations with low short-circuit ratios to avoid the presence of weak nodes.
Through extensive offline calculations, an approximately linear relationship between reactive power and MRSCR can be established for each renewable energy station to meet engineering requirements. This forms the basis for constructing a reactive power–MRSCR sensitivity matrix Cmg, which serves as a primary reference for control optimization in the coordinated controller station.
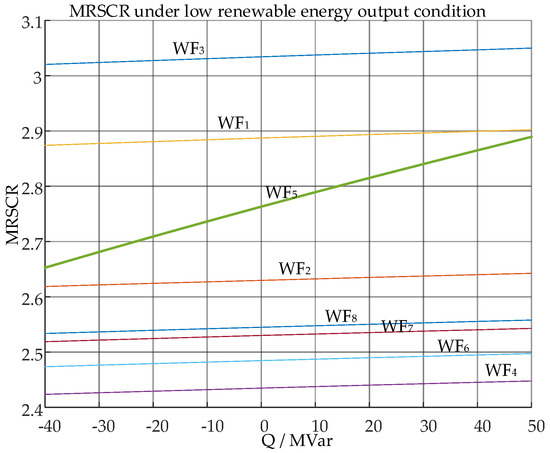
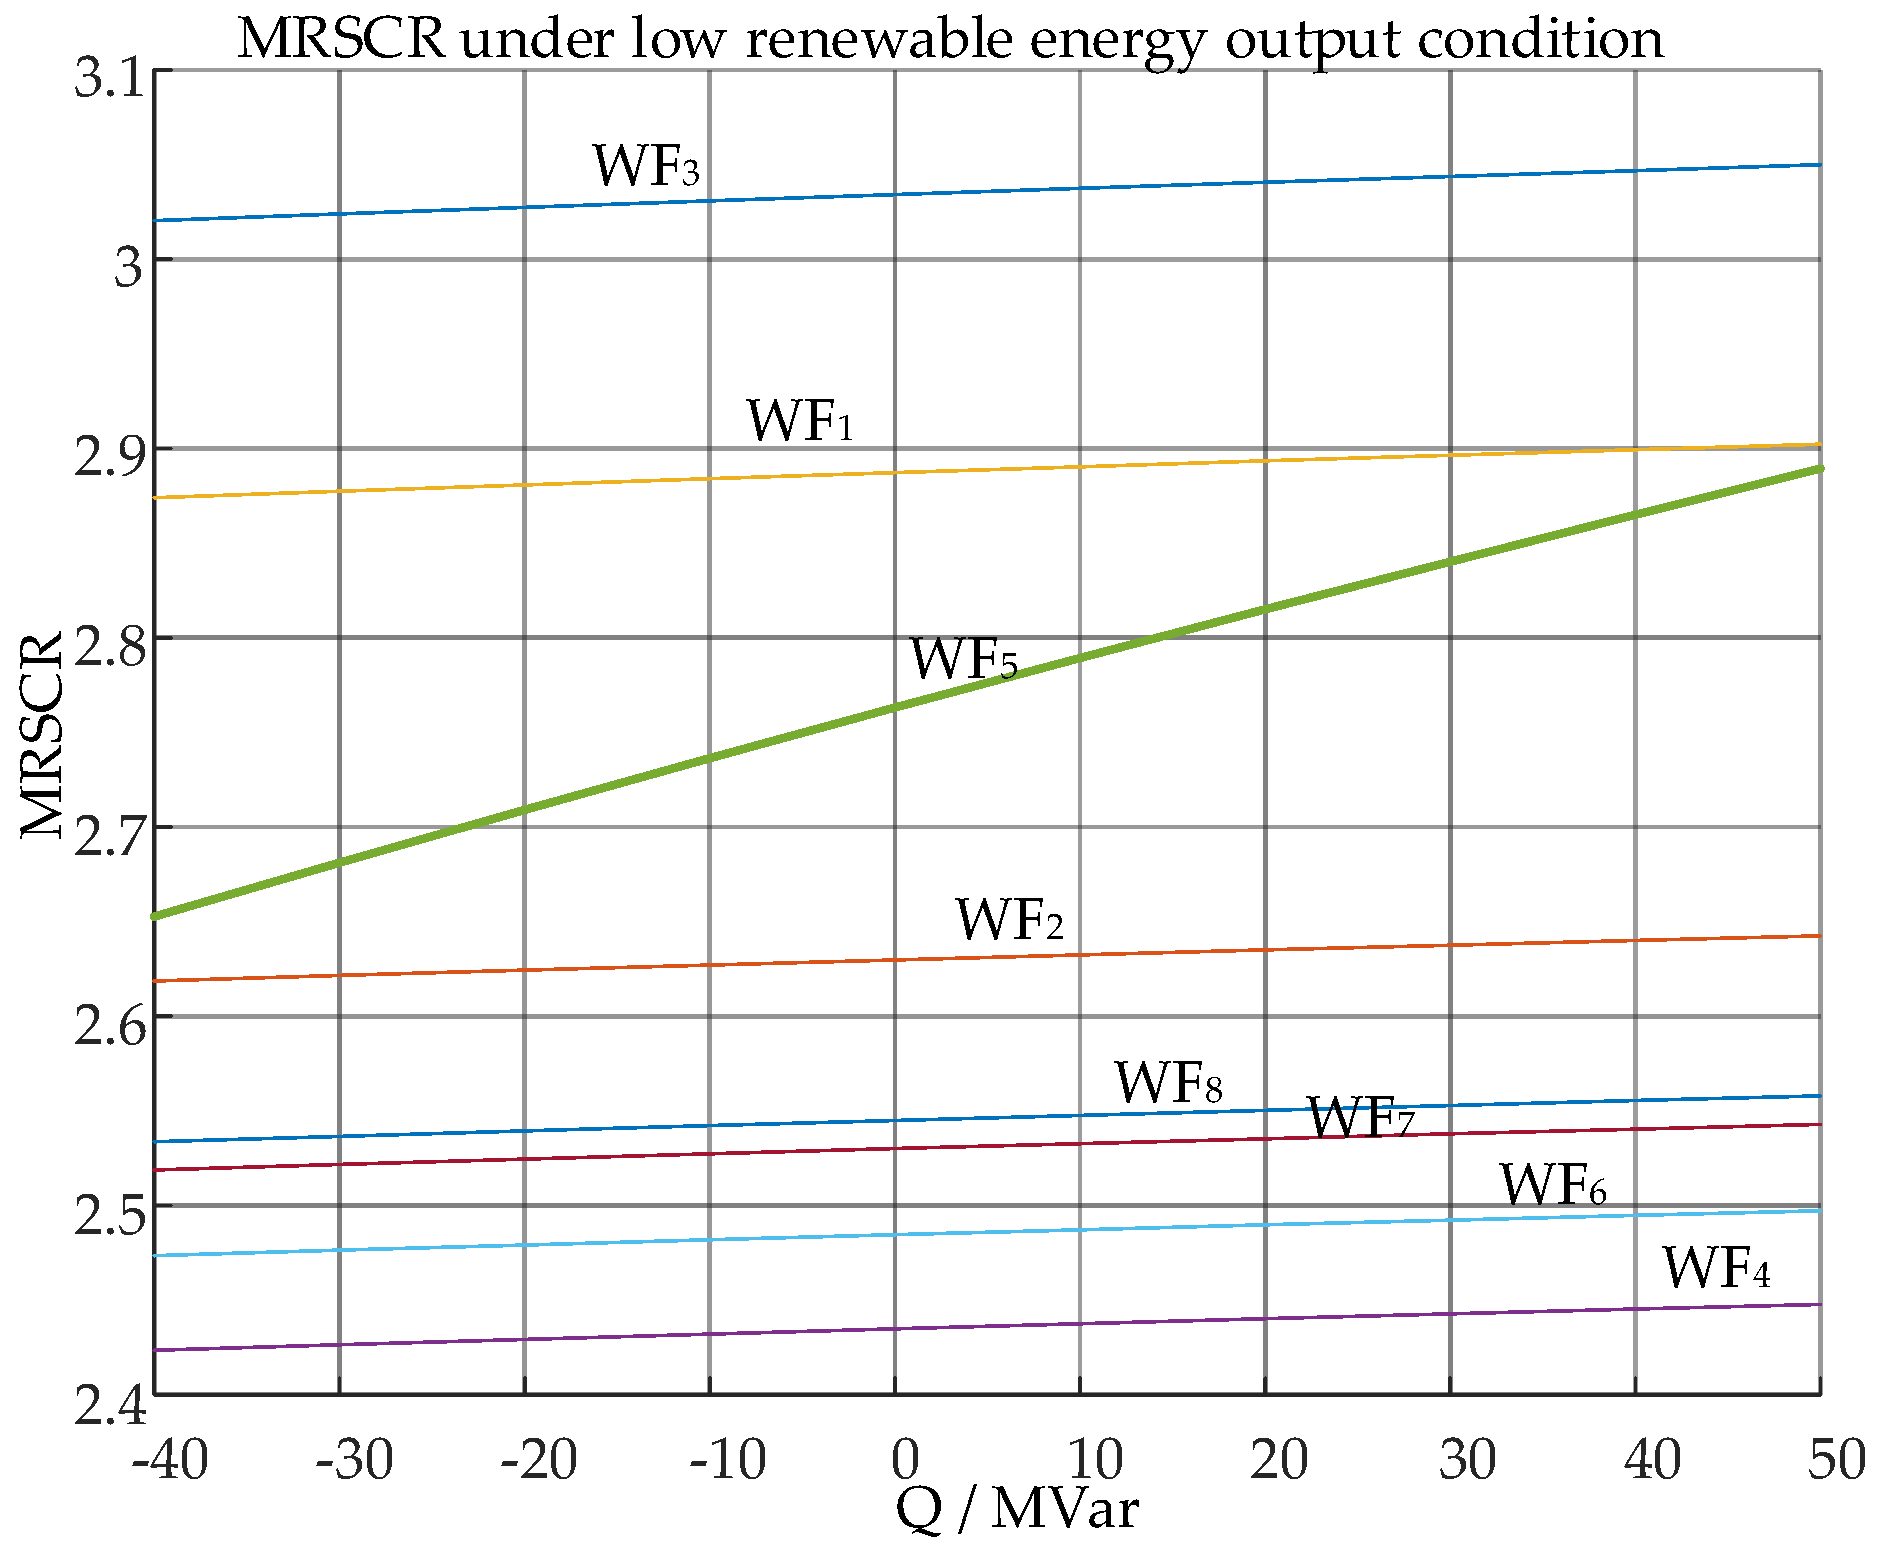
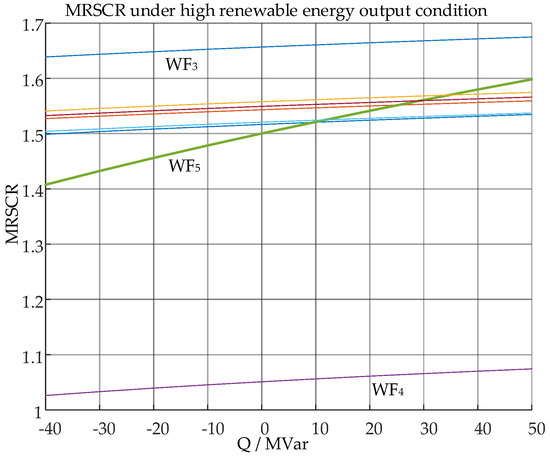
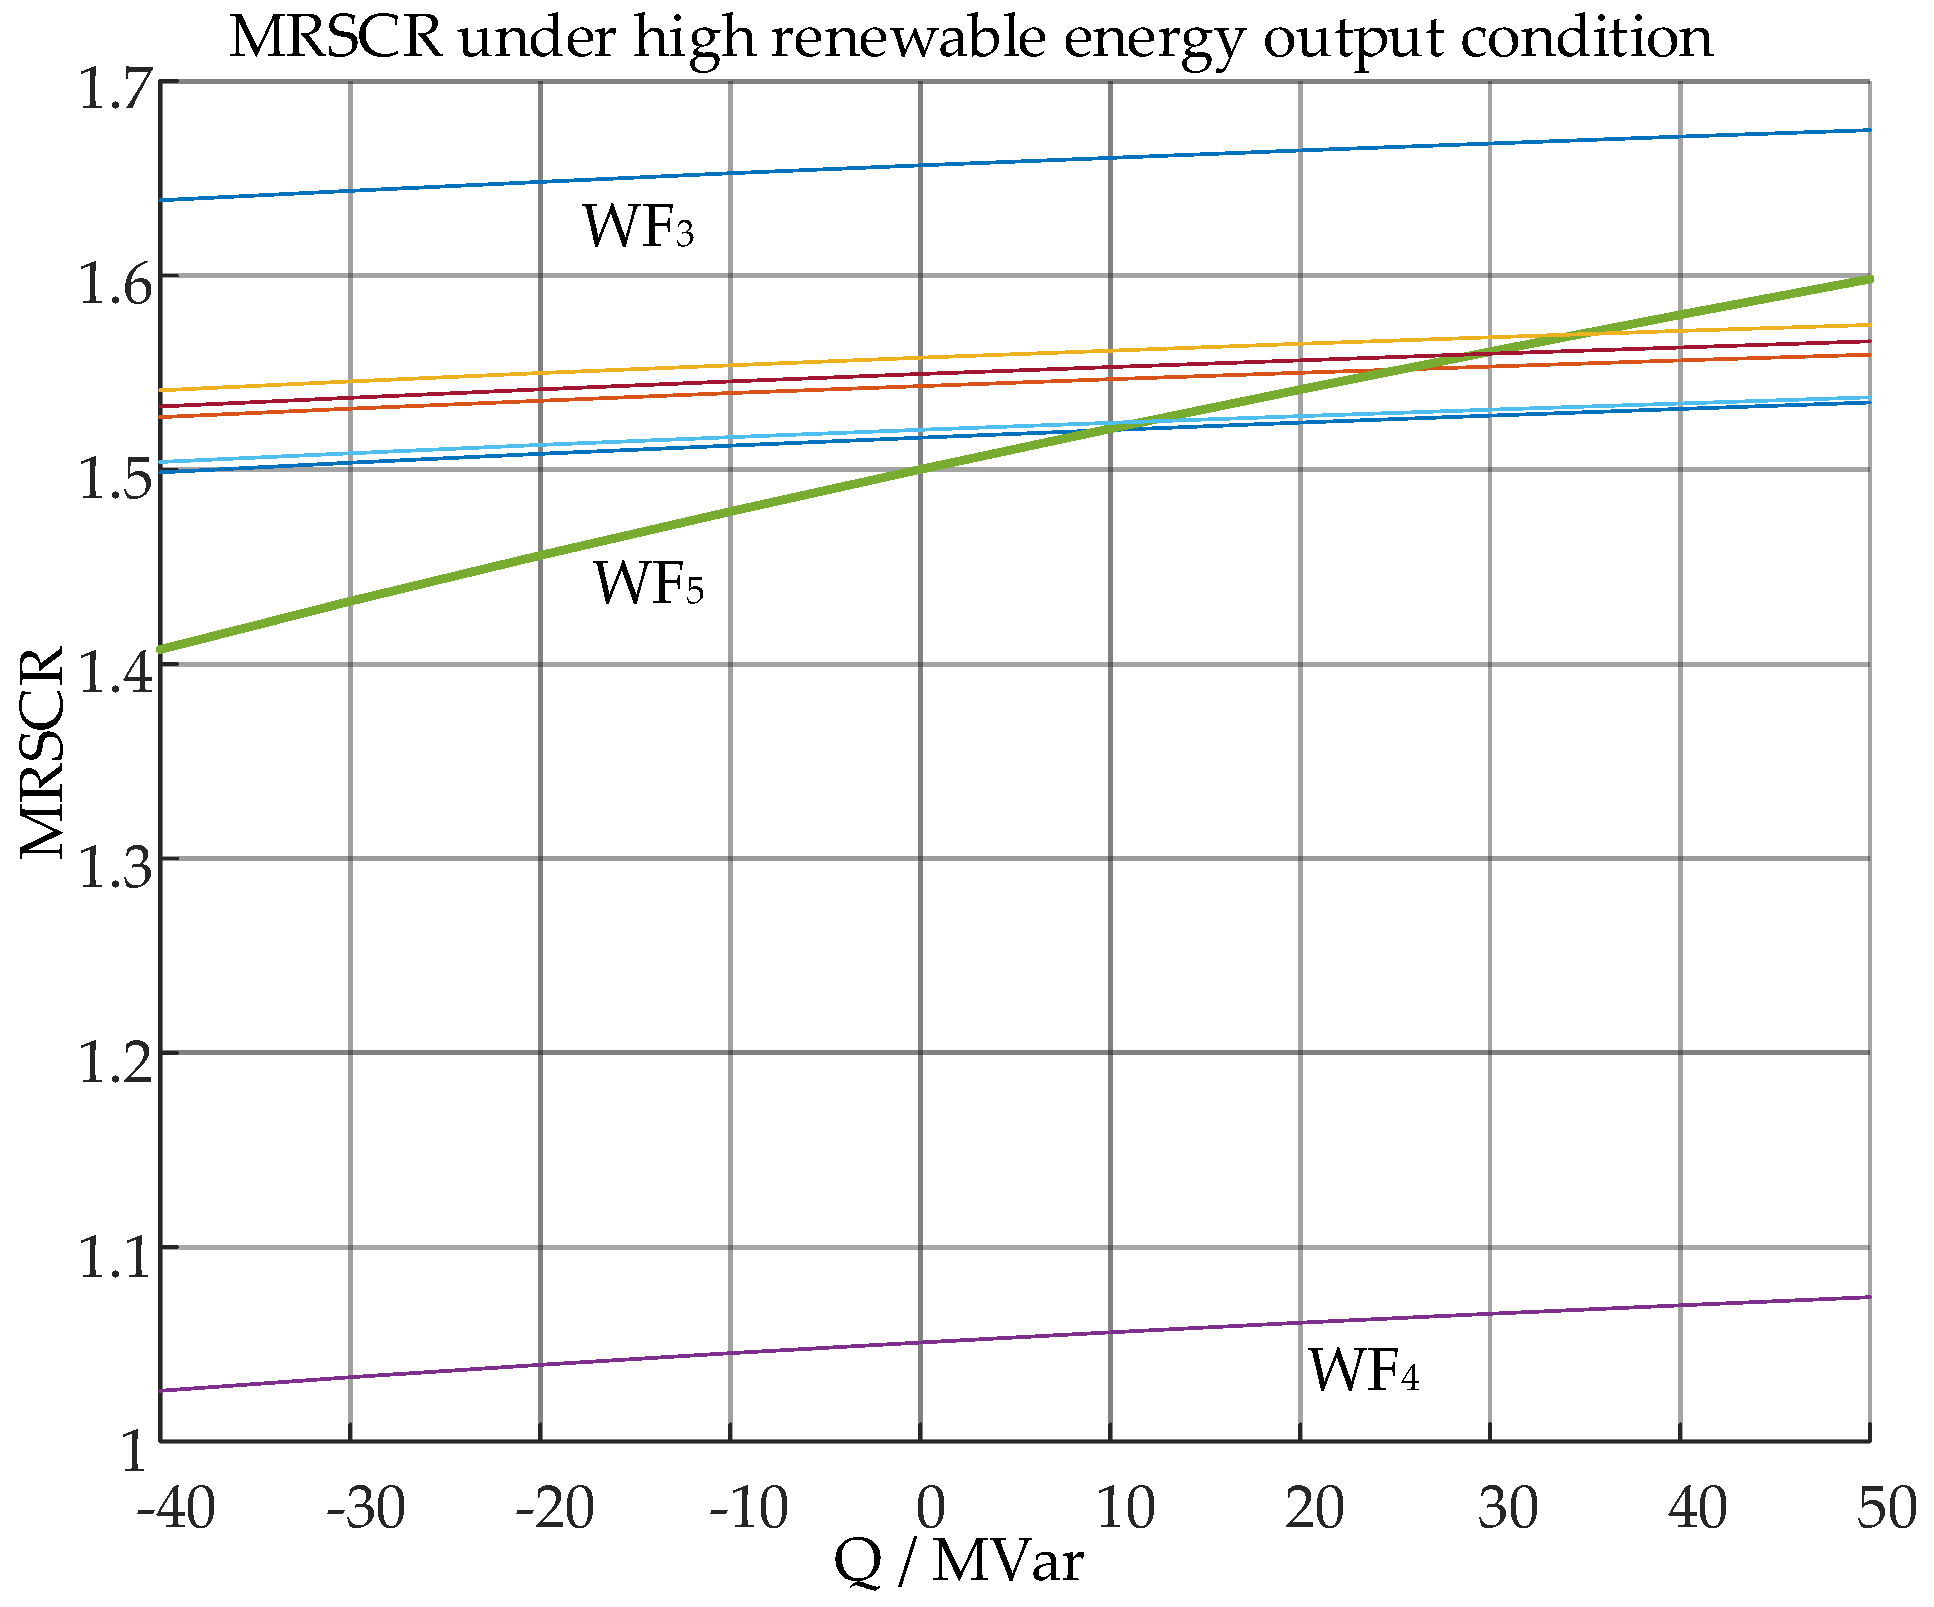
Taking Wind Farm 5 as an example, by varying its reactive power output between 40 MVar and 50 MVar, the trends in the MRSCR changes for all stations can be observed. When the output reactive power is inductive (negative values), a larger inductive reactive power results in a lower short-circuit ratio. Therefore, for wind farms with a low short-circuit ratio, such as those below 1.5, the capacitive reactive power output of these wind farms should be adjusted as much as possible to enhance the overall grid strength of the renewable energy clusters. The trends of MRSCR with reactive power variation are shown in Table 3 and Figure 11 for low power output and in Table 4 and Figure 12 for high power output.
Table 3.
Short circuit ratio under low renewable energy output condition.
Figure 11.
MRSCR trends when reactive power changes under low power output, with curves color-coded as follows: green for WF5, blue for WF3, and the other colors for WF1, WF2, WF4, WF6, WF7, and WF8.
Table 4.
Short circuit ratio under high renewable energy output condition.
Figure 12.
MRSCR trends when reactive power changes under high power output, with curves color-coded as follows: green for WF5, blue for WF3, and the other colors for WF1, WF2, WF4, WF6, WF7, and WF8.
5.4. Hardware-in-the-Loop Experiment
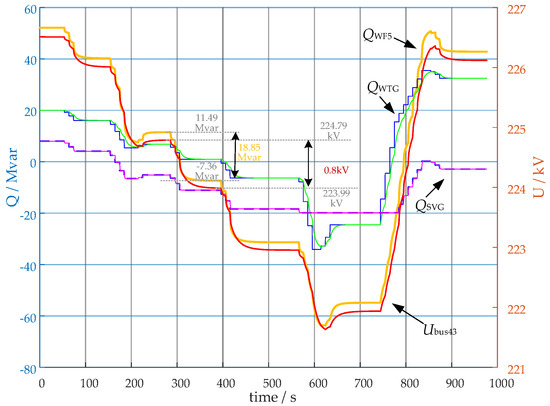
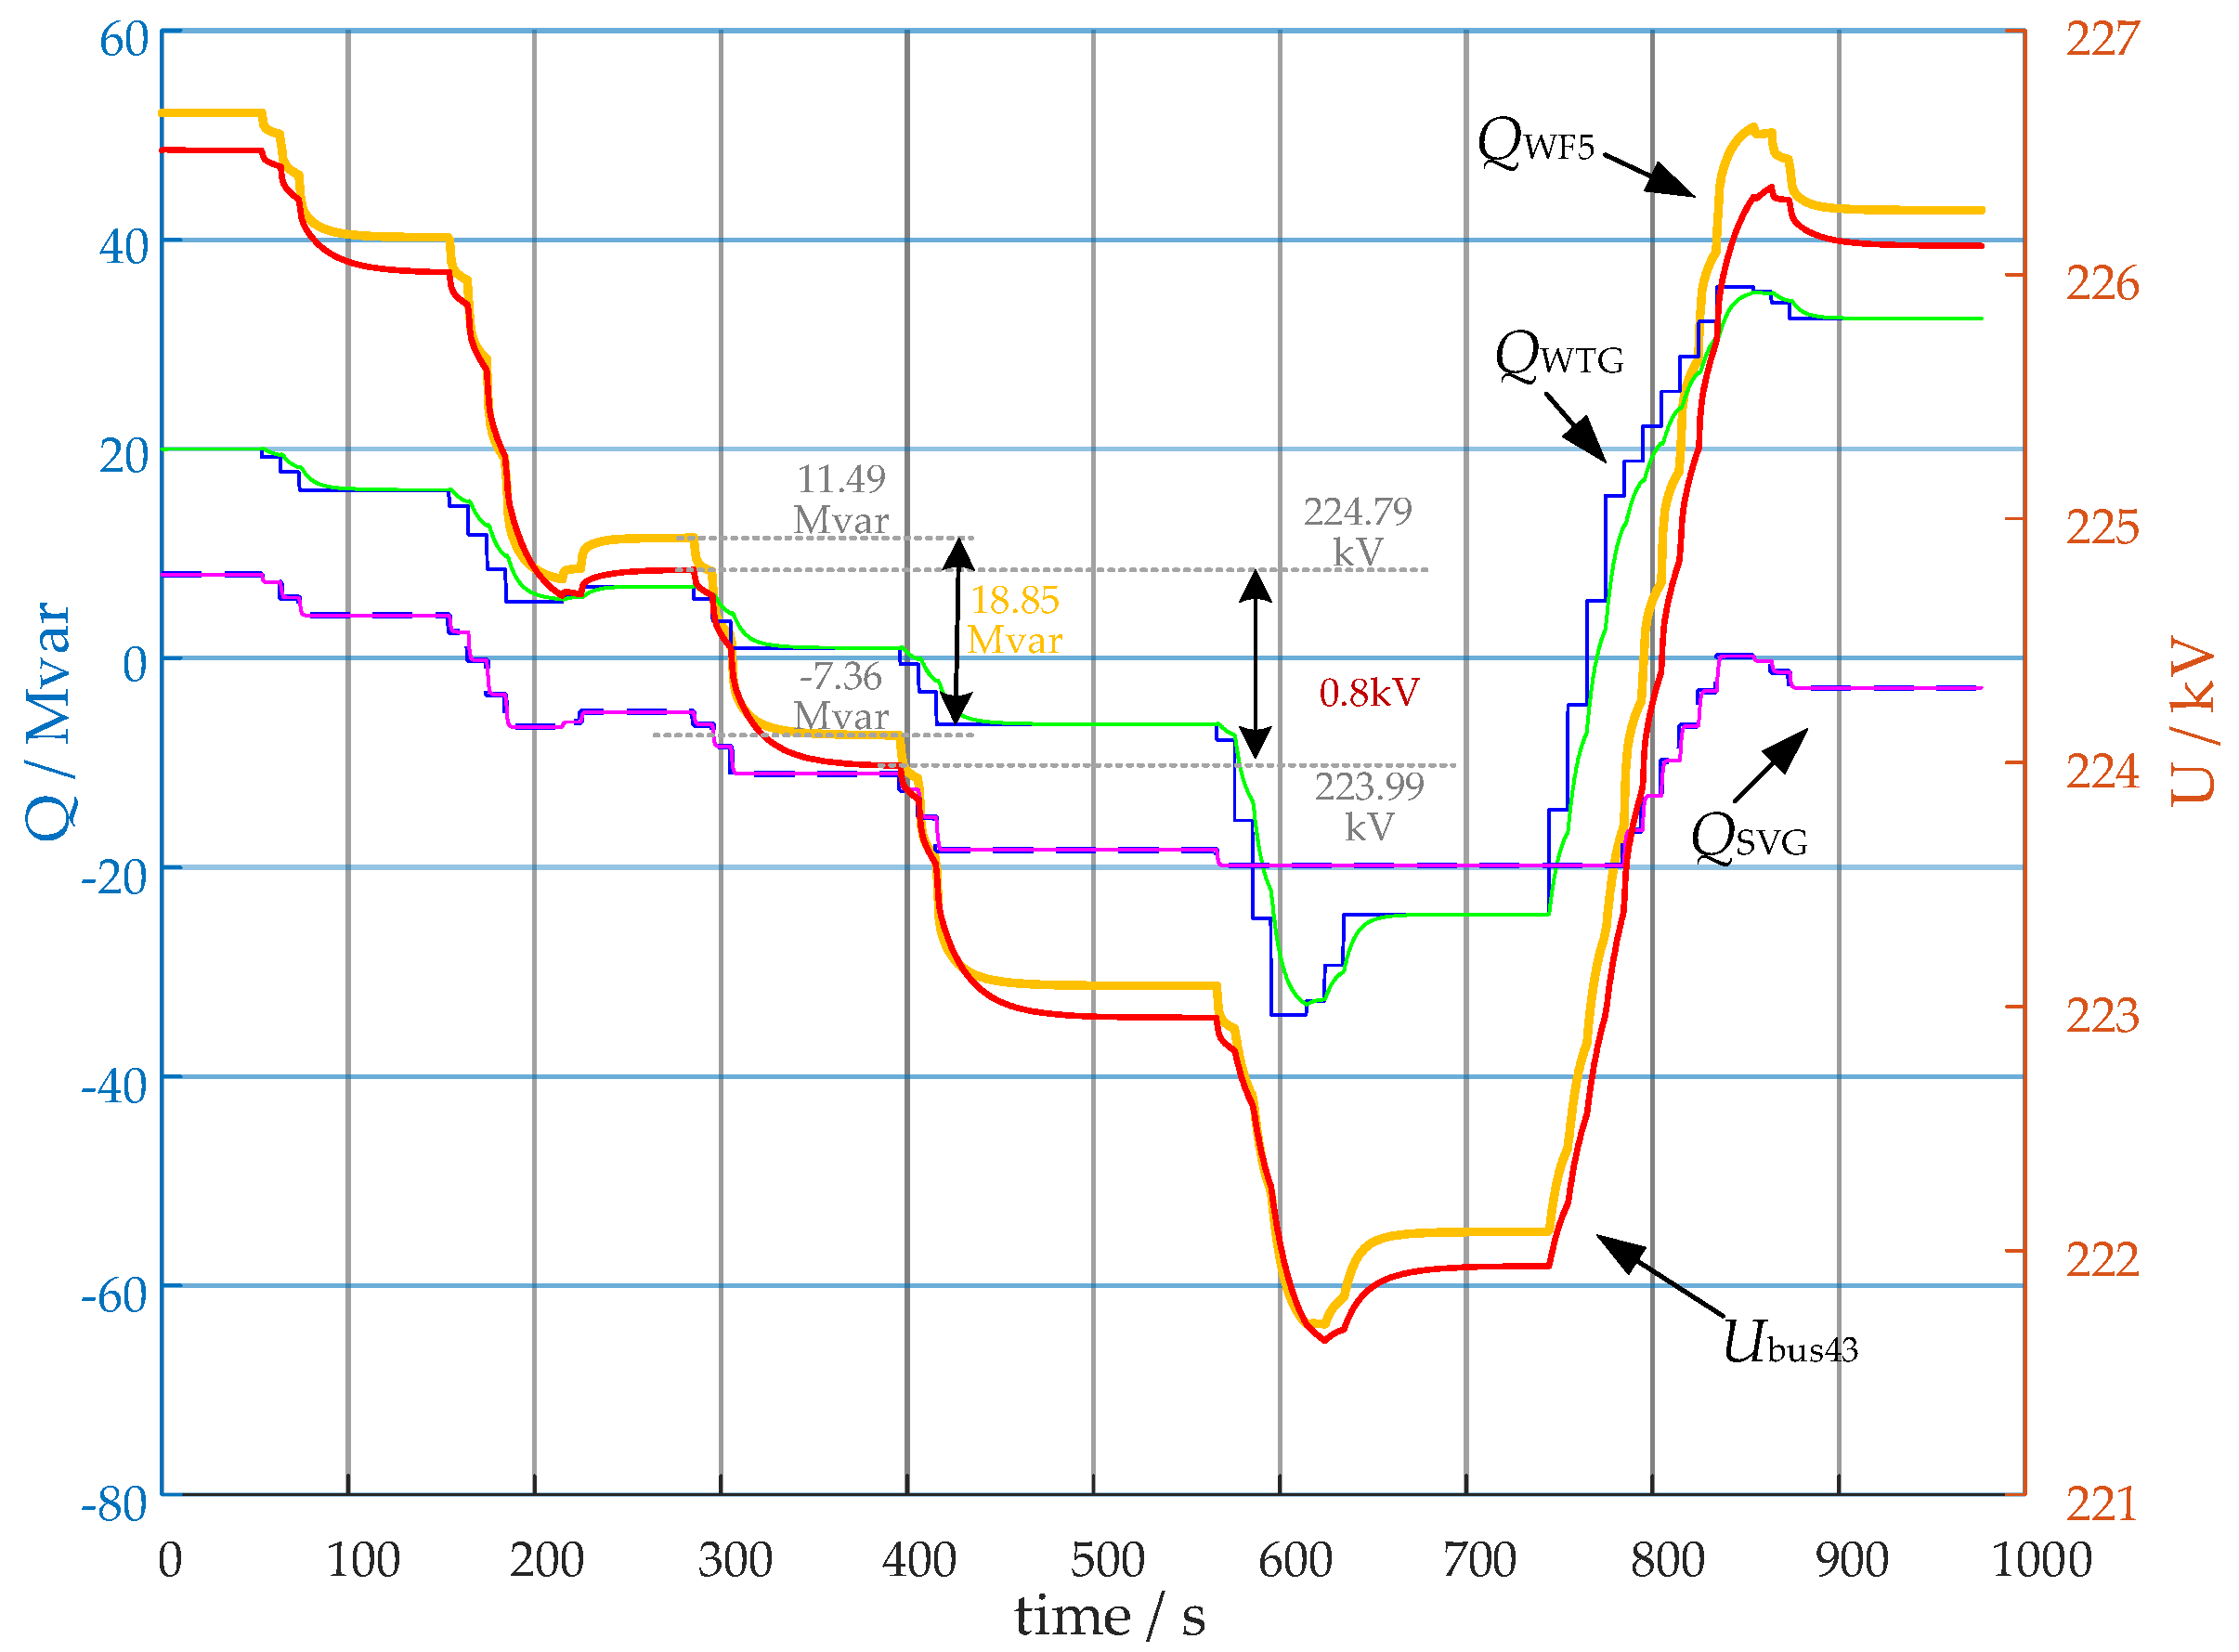
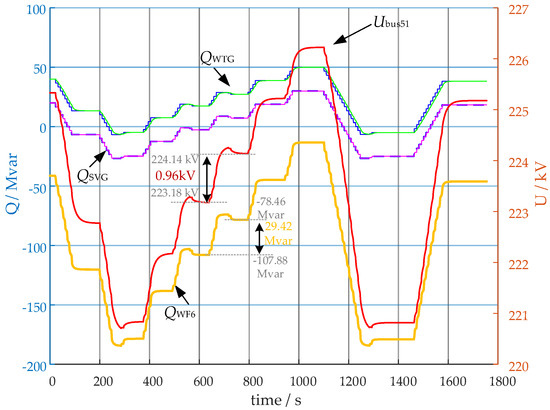
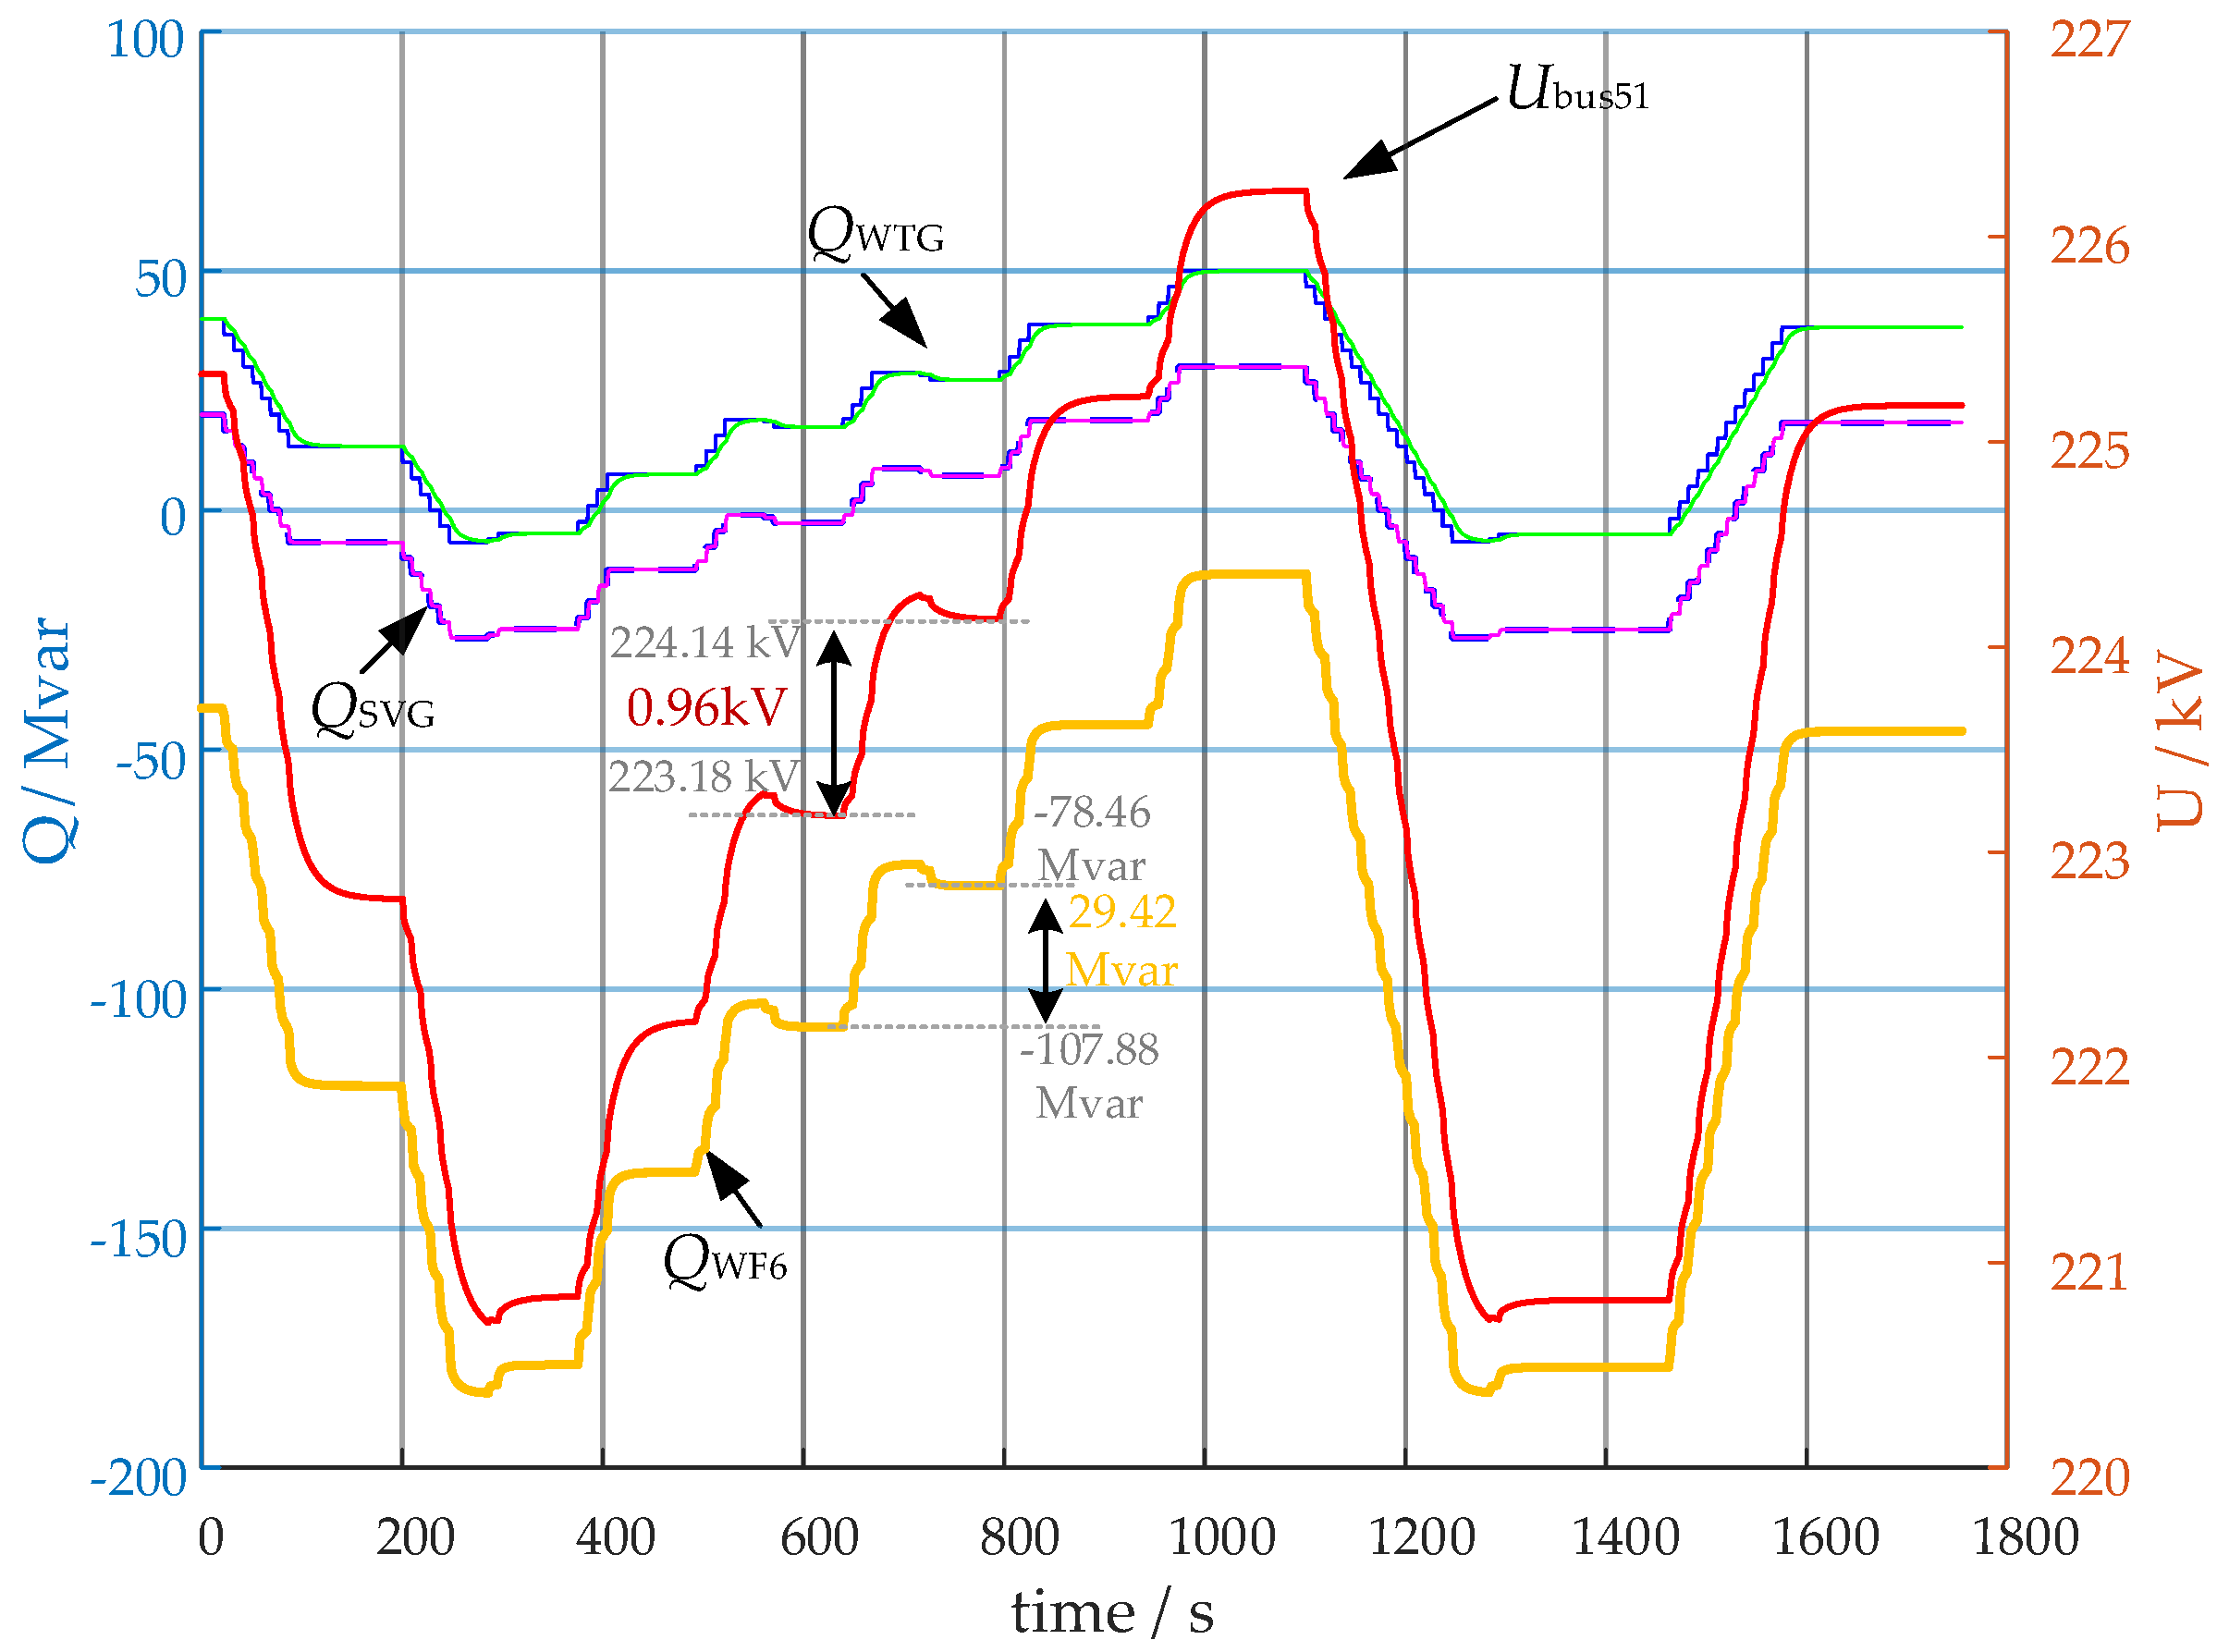
Case 1: A constant voltage control characteristic test was conducted for a single wind farm using the strategy verification platform. Through the implementation of continuous voltage step control, the relationship between voltage and reactive power was analyzed. The single-station voltage step control performance tests for Wind Farms #5 and #6 are shown in Figure 13 and Figure 14, respectively.
Figure 13.
Single station #5 voltage step control performance test.
Figure 14.
Single station #6 voltage step control performance test.
For Wind Farm #5, the voltage sensitivity (dV/dQ) is 0.0186, which corresponds to an actual value of
Analysis of the dynamic regulation process yielded an estimated value of
which is essentially consistent with the result derived from voltage sensitivity.
For Wind Farm #6, the voltage sensitivity (dV/dQ) is 0.0137, corresponding to an actual value of
Analysis of the dynamic regulation process gave an estimated value of
which is also in close agreement with the estimation made based on voltage sensitivity.
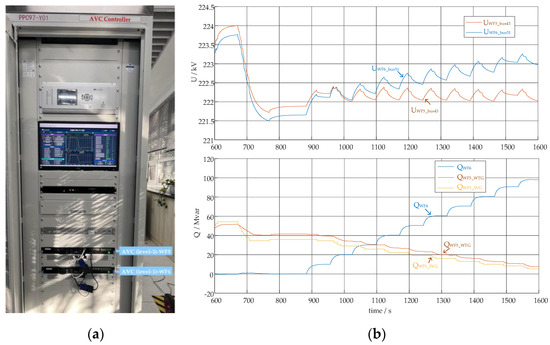
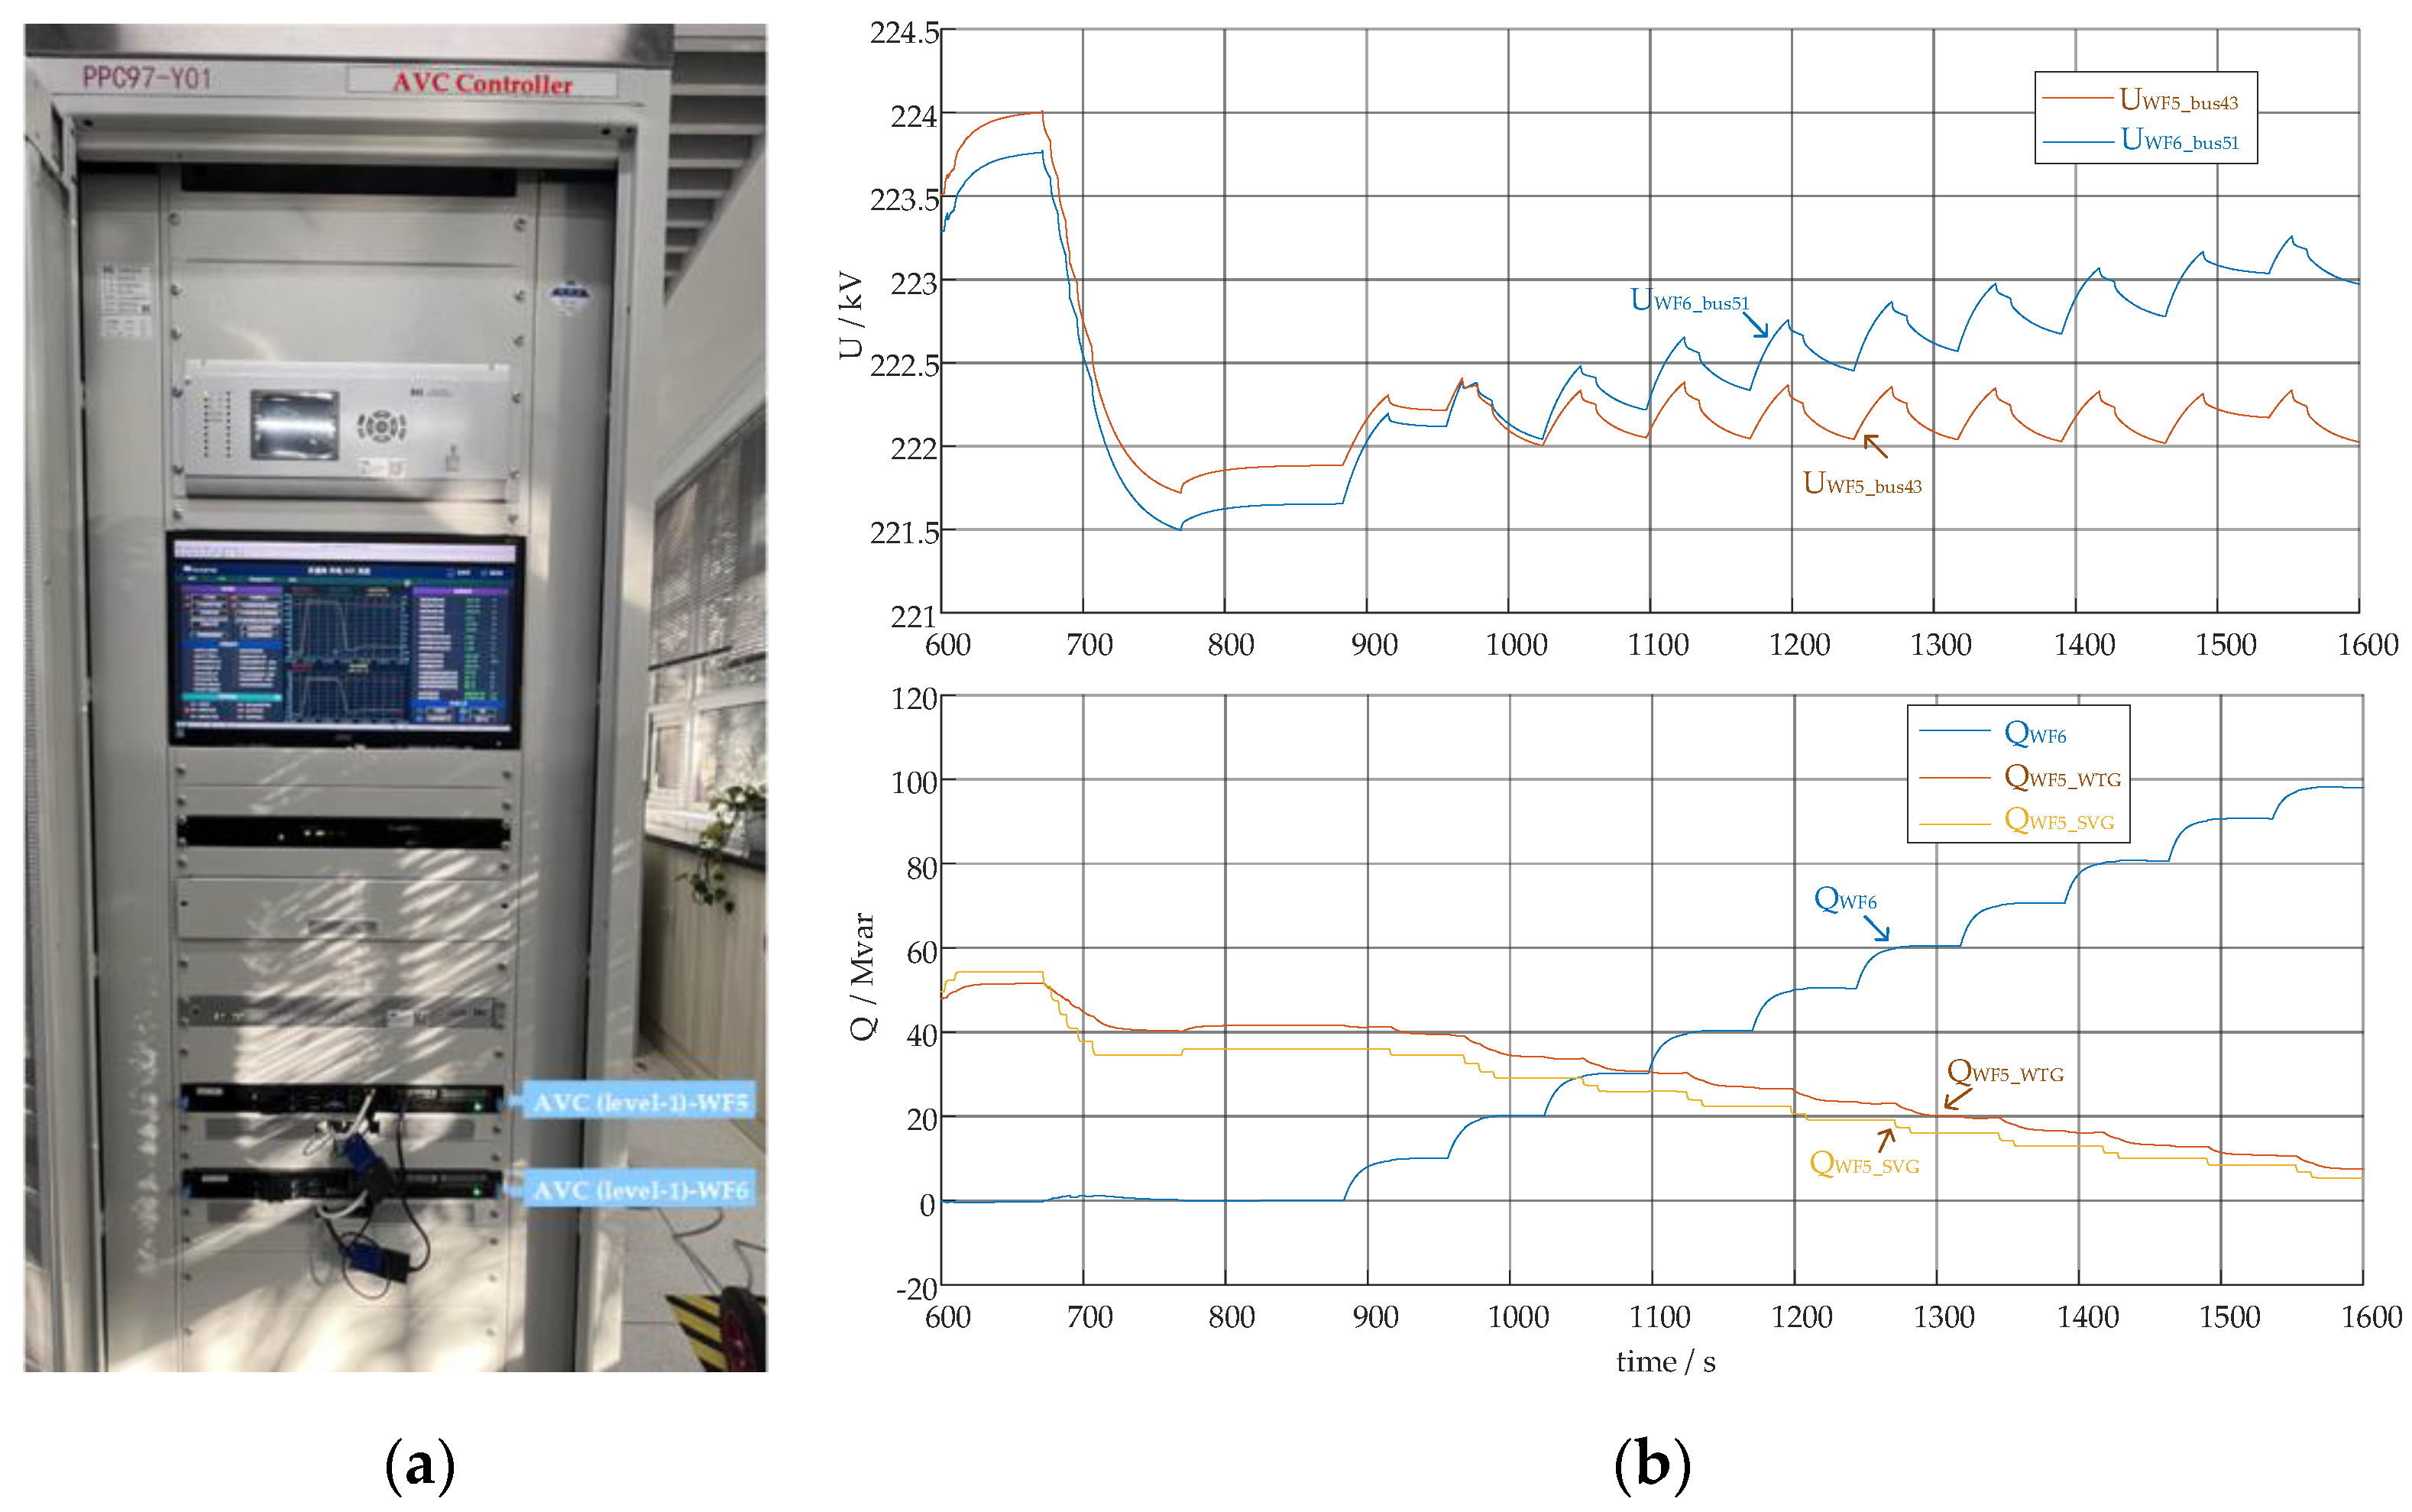
Case 2: A hardware-in-the-loop (HIL) platform based on RMS simulation was set up in a laboratory environment, where two actual AVC controllers (level-1) were used to implement constant voltage control for Wind Farm #5 and Wind Farm #6. The results of the closed-loop HIL experiment, including the observed oscillation waveforms, are presented in Figure 15. When the constant voltage command was set unreasonably, voltage oscillation phenomena were triggered. The reactive power outputs of the two wind farms gradually decreased and increased, respectively, leading to instability in the renewable energy cluster. The voltage fluctuation has a period of approximately 60 s with an amplitude of about 0.4 kV.
Figure 15.
Closed-loop and hardware-in-the-loop experiments. (a) The actual experimental setup; (b) The voltage and reactive power oscillation waveforms of wind farms 5 and 6.
To suppress the potential voltage oscillation phenomenon, a feasible improvement strategy is to introduce a coordinated controller (level-2’). The coordinated controller calculates the reactive power adjustment for each wind farm based on the current voltage sensitivity and short-circuit ratio levels. The control mode of each wind farm is then switched from constant voltage to constant reactive power control. For stations with lower voltage sensitivity, a constant power factor control mode can be adopted to reduce the number of stations involved in regulation and improve the speed of adjustment.
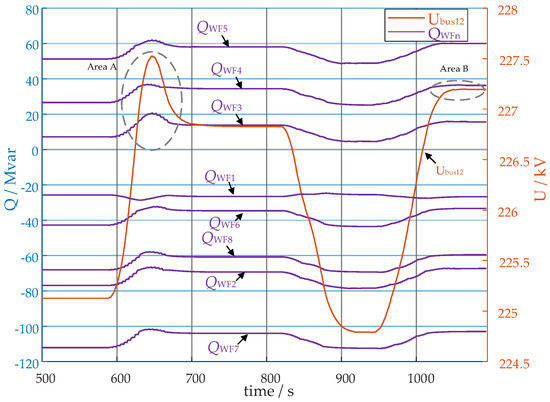
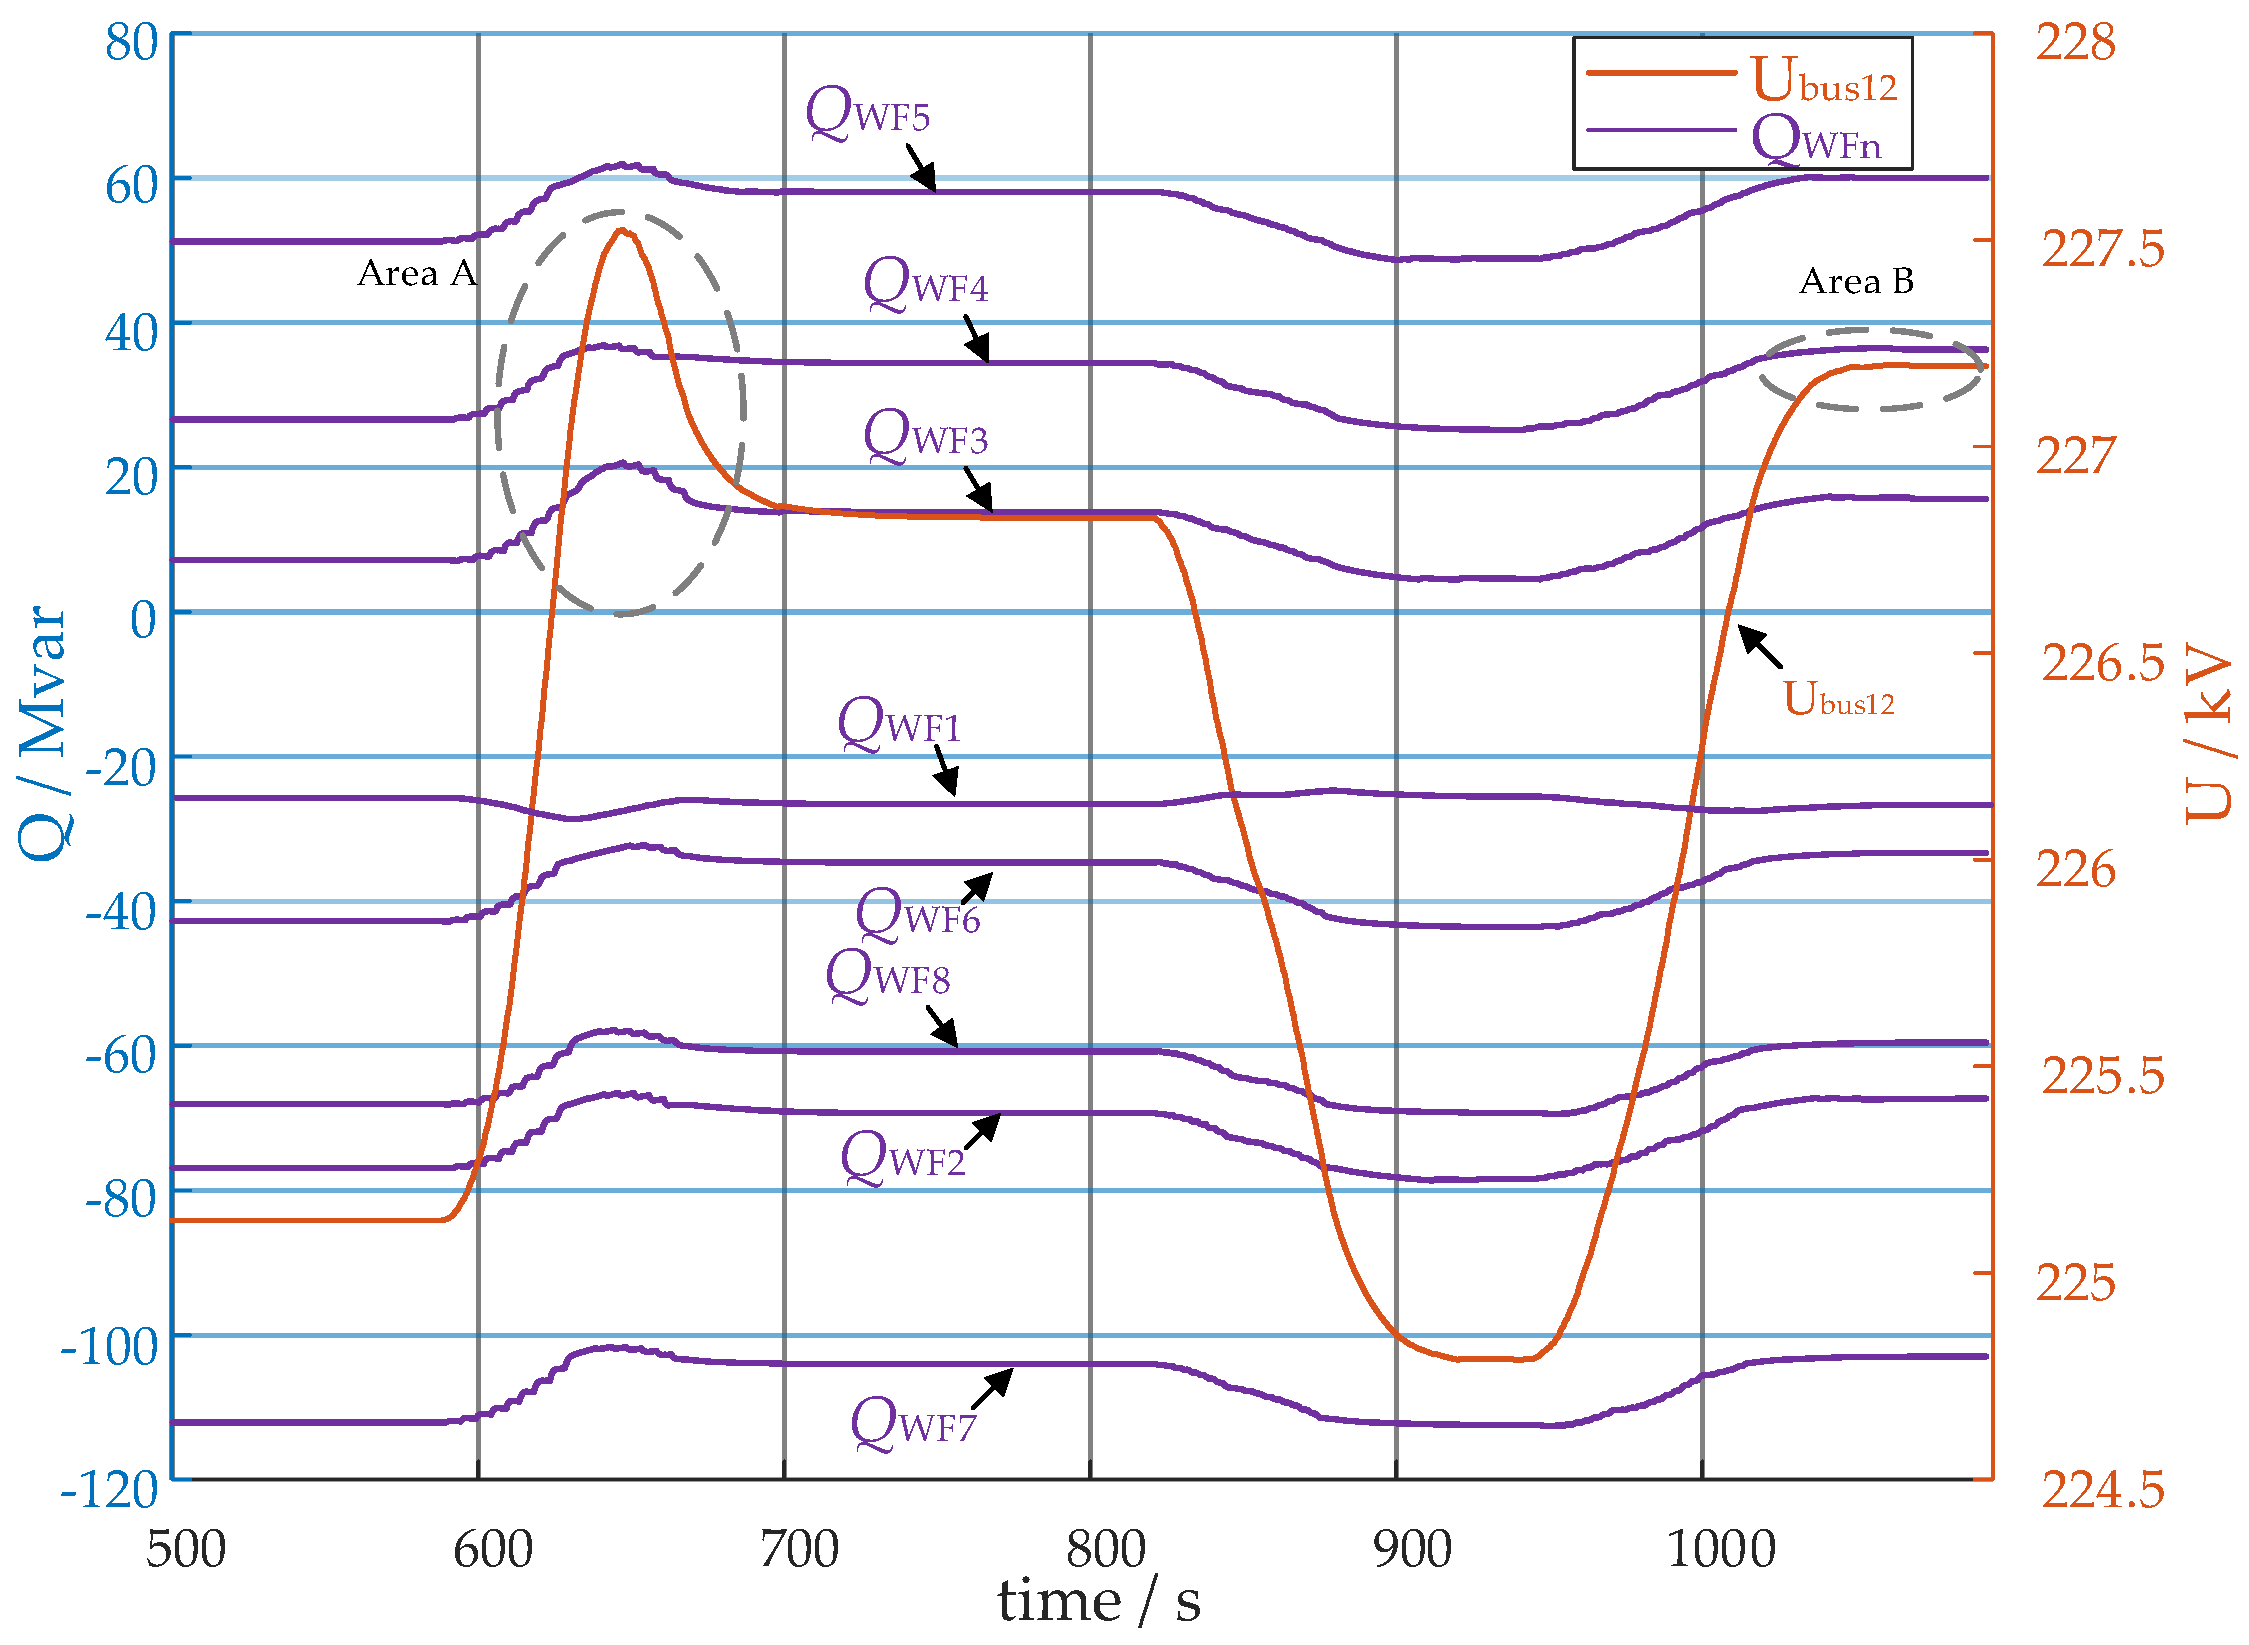
The appropriate configuration of PID control parameters and time cycles for both control levels is critical. Experimental results show that using identical PID parameters with both control cycles set to 10 s tends to induce control overshoot, as illustrated in area A of Figure 16. In contrast, when the level-1 control cycle is reduced to 5 s while the level-2’ control cycle remains at 10 s, no overshoot occurs (area B). Therefore, it is recommended that the level-1 control cycle is shorter than that of the level-2’ control cycle.
Figure 16.
Renewable energy cluster secondary coordinated control performance test. QWF1–QWF8 represent the reactive power transmitted by the wind farm feeders, and Ubus12 is the voltage at bus 12. Area A indicates the overshoot during the initial control cycle, whereas Area B shows the response after control parameters were optimized, with no overshoot.
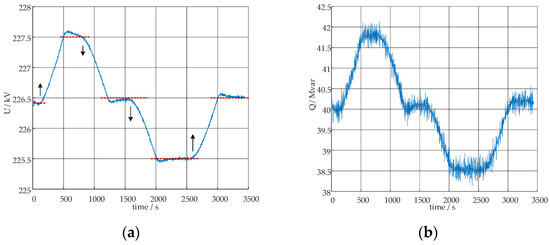
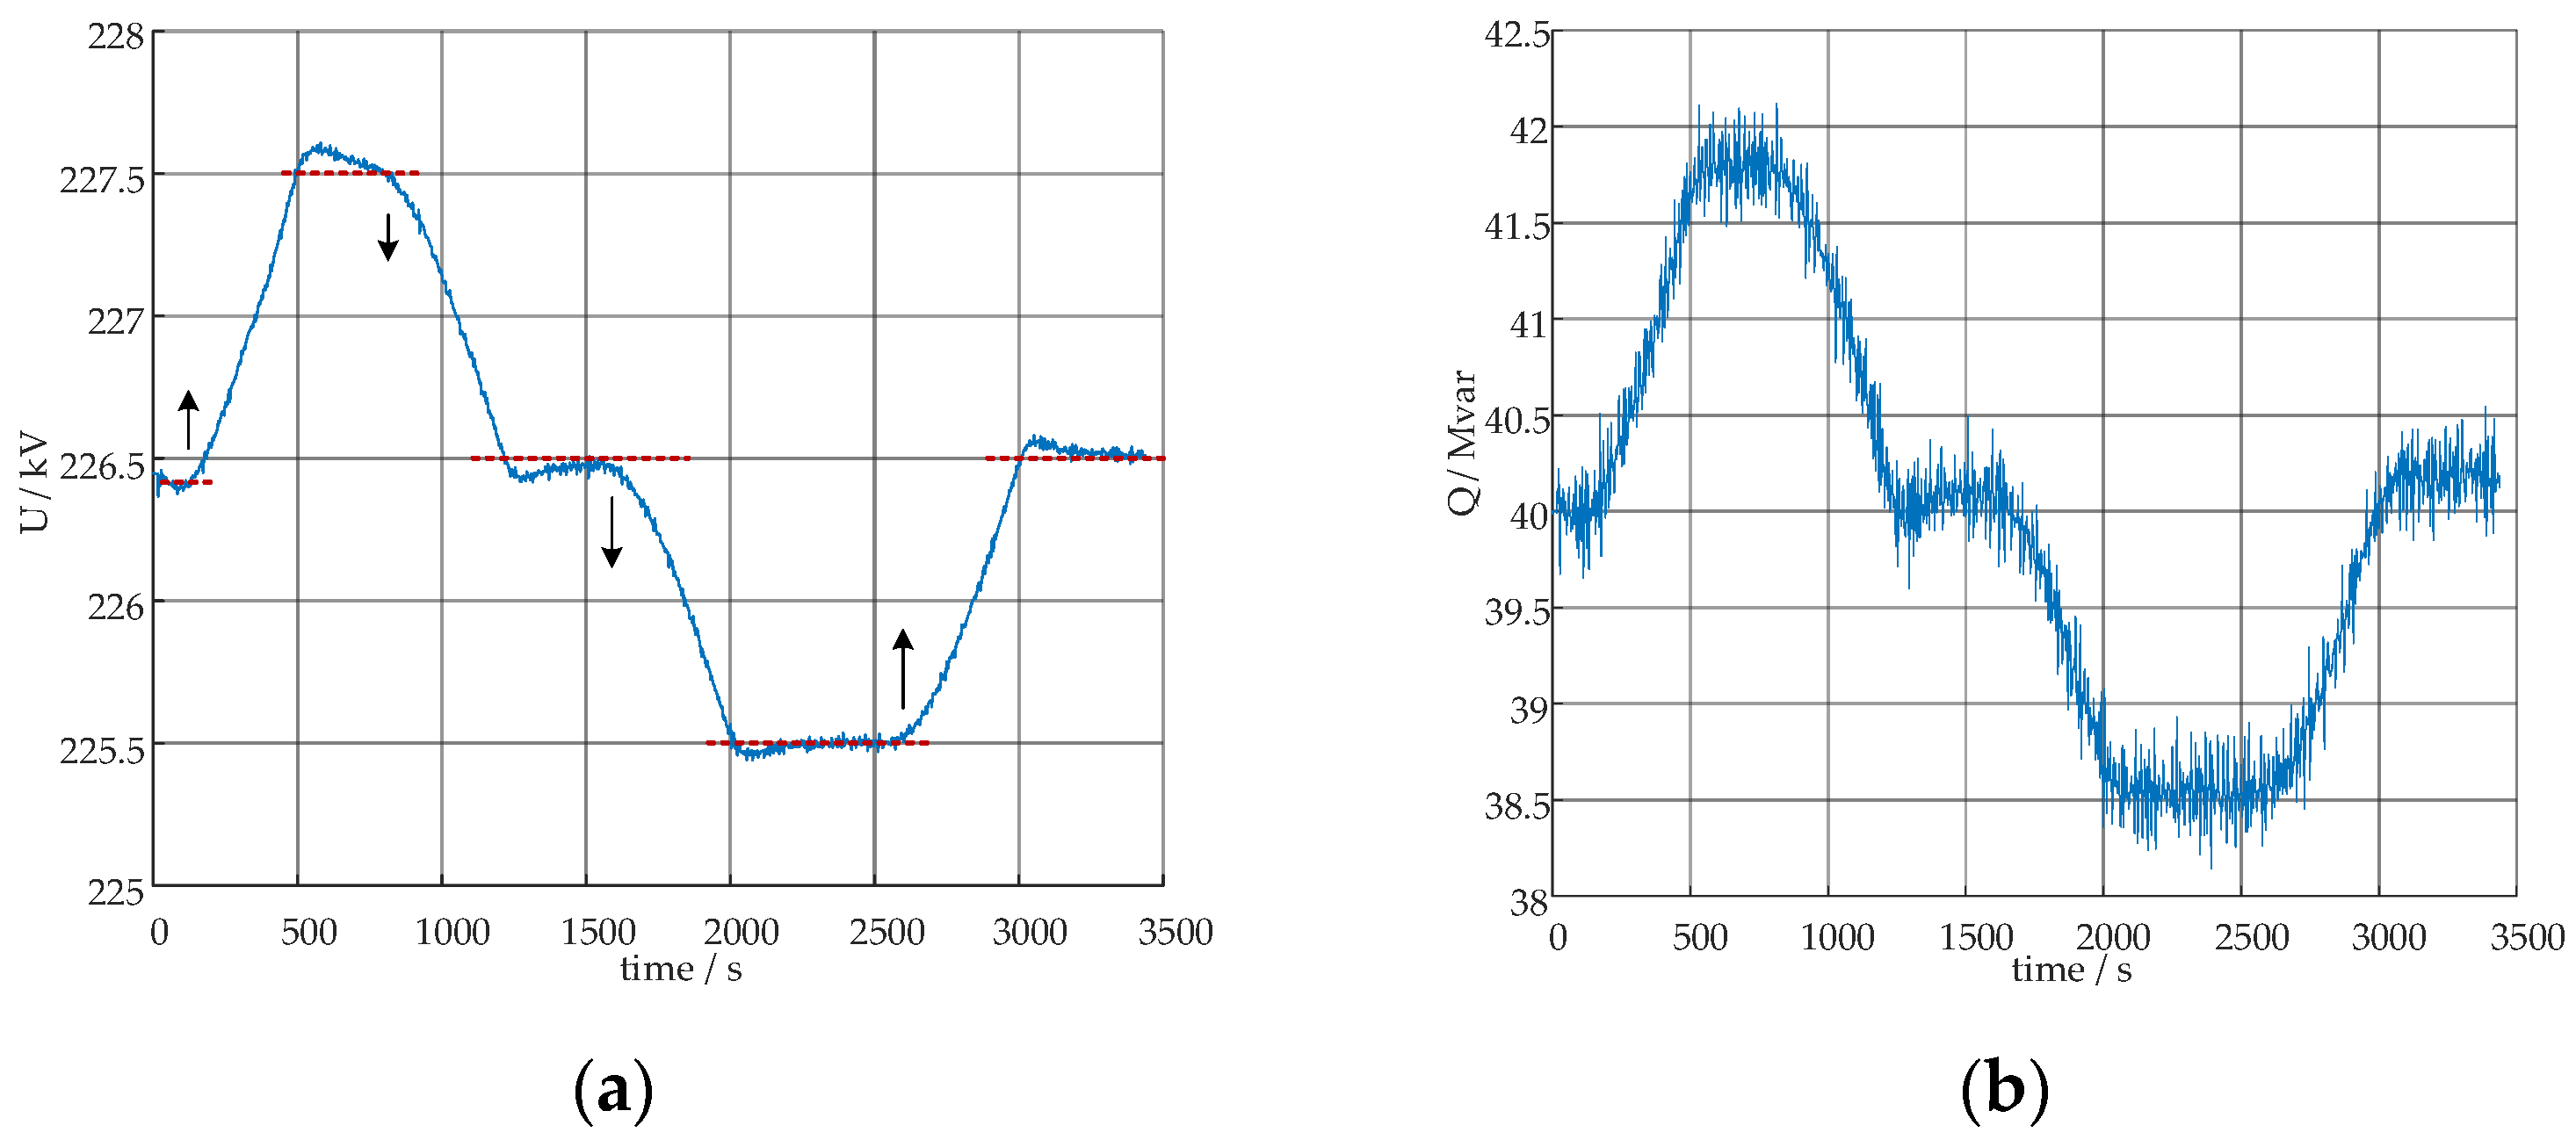
To evaluate the robustness of the control strategy, random wind speed disturbances were introduced to each wind farm during the test. The control performance remained satisfactory despite these disturbances. Constant voltage commands were sent to the coordinated controller (level-2′), and the voltage was adjusted from 226.4 kV to 227.5 kV. It was then lowered to 226.5 kV, further reduced to 225.5 kV, and finally restored to 226.5 kV. The results of the collaborative control strategy experiments are presented in Figure 17.
Figure 17.
Robustness testing under wind speed disturbance conditions. (a) The voltage of the bus12; (b) The reactive power output of wind turbines in Wind Farm 5 fluctuates in response to random variations in wind speed.
6. Conclusions
This study presents a hierarchical, multi-mode coordinated reactive power control strategy and an efficient verification scheme to suppress oscillations in power systems with clustered renewable energy sources. The proposed strategy is validated through case studies based on an actual power system, with results demonstrating a significant reduction in voltage fluctuations compared to conventional automatic voltage control (AVC) methods. The strategy systematically integrates two key indices: a voltage sensitivity index for steady-state regulation and an improved multi-plant short-circuit ratio (MRSCR) index for robustness against large disturbances. This integrated framework supports the rational and dynamic adjustment of control modes—constant voltage, constant reactive power, and constant power factor—thereby ensuring both maximum utilization of renewable generation and enhanced overall system reliability.
The main contributions of this work are summarized as follows: (1) An enhanced AVC architecture is introduced by adding a coordination control layer at the collecting station level, clarifying the operational applicability of different control modes. (2) Through this coordination layer, new optimization metrics—including the MRSCR—are incorporated to strengthen grid robustness during voltage regulation. (3) A real-time RMS-based hardware-in-the-loop (HIL) simulation method is proposed, employing physical controllers to replicate and mitigate oscillation phenomena.
Future work should focus on extending the proposed strategy to complex regional grids that incorporate multiple types of reactive power sources, including grid-forming energy storage systems, to achieve coordinated steady-state and transient voltage support. To improve real-time performance, future work should focus on refining the SCR calculation methodology, developing adaptive sensitivity estimation techniques that utilize neighboring node information, and integrating predictive models for anticipatory control. The application of the algorithm to larger-scale systems, such as major renewable energy bases, coupled with enhanced information exchange mechanisms between provincial dispatch centers and improved substation communication capabilities through the mitigation of coordination delays, would contribute to the further advancement of regional voltage quality.
Author Contributions
Conceptualization, Y.L.; methodology, Y.L.; software, Y.L. and L.Z.; validation, Y.L., M.Q. and C.J.; formal analysis, Y.L.; investigation, Y.L.; resources, Y.L.; data curation, Y.L., M.Q. and C.J.; project administration, Y.L. All authors have read and agreed to the published version of the manuscript.
Funding
This work is supported by the Science and Technology Program of the SGCC: “Research on interactive voltage stability mechanisms and coordinated control verification techniques for renewable energy clusters connected to the power grid” (5100-202355753A-3-4-SY).
Data Availability Statement
The original contributions presented in this study are included in the article. Further inquiries can be directed to the corresponding author.
Acknowledgments
We would like to express our gratitude to all the reviewers and editors for providing valuable advice.
Conflicts of Interest
Authors Yanzhang Liu, Lingzhi Zhu and Minhui Qian were employed by the China Electric Power Research Institute. Author Chen Jia was employed by the State Grid Liaoning Electric Power Research Institute. The remaining authors declare that the research was conducted in the absence of any commercial or financial relationships that could be construed as a potential conflict of interest.
Abbreviations
The following abbreviations are used in the manuscript:
| SCR | Short-circuit ratio |
| CSCR | Critical short-circuit ratio |
| WSCR | Weighted short-circuit ratio |
| ESCR | Equivalent short-circuit ratio |
| MRSCR | Multi-renewable energy station short-circuit ratio |
| AVC | Automatic voltage control |
| OPF | Optimal power flow |
| Kpv | Proportional coefficient of the PI module in voltage control |
| Kiv | Integral coefficient of the PI module in voltage control |
| Tr | The time constant that reflects the communication delay |
| Tv | The time constant that reflects the measurement lag |
| Zc | Compensation impedance |
| Qmax, Qmin | Maximum and minimum reactive power limits |
| KQi | Proportional coefficient of the PI module in reactive power control |
| KVi | Integral coefficient of the PI module in reactive power control |
| Vterm | Terminal voltage of renewable energy station |
| V*max, V*min | Maximum and minimum voltage limit |
| Tp | The time constant that reflects the converter action |
| vflg | Enable closed-loop regulation of Vterm when the flag vflg is set to 1 |
| cflg | Control mode switch, 0-const.Q, 1-const.V; 2-const.PF |
| Vset | Voltage setpoint |
| PFset | Power factor setpoint |
| Qset | Reactive power setpoint |
| Pset | Active power setpoint |
| Vreg | The voltage of regulate remote bus |
| Pg | Active output of renewable energy stations |
| Qg | Reactive output of renewable energy stations |
References
- Sun, H.; Guo, Q.; Qi, J.; Ajjarapu, V.; Bravo, R.; Chow, J.; Li, Z.; Moghe, R.; Nasr-Azadani, E.; Tamrakar, U.; et al. Review of challenges and research opportunities for voltage control in smart grids. IEEE Trans. Power Syst. 2019, 34, 2790. [Google Scholar] [CrossRef] [Scilit]
- Babiker, A.; Ahmad, S.S.; Ahmed, I.; Khalid, M.; Abido, M.A.; Al-Ismail, F.S. Optimal power flow: A review of state-of-the-art techniques and future perspectives. IEEE Access 2025, 13, 60012–60039. [Google Scholar] [CrossRef] [Scilit]
- Pierrou, G.; Lai, H.; Hug, G.; Wang, X.A. Decentralized wide-area voltage control scheme for coordinated secondary voltage regulation using PMUs. IEEE Trans. Power Syst. 2024, 39, 7153. [Google Scholar] [CrossRef] [Scilit]
- Bouzid, A.E.M.; Marinescu, B.; Denis, G. Structural Analysis and Improved Reactive Power Alignment for Secondary Voltage Control; PowerTech: Milan, Italy, 2019; pp. 1–6. [Google Scholar] [CrossRef] [Scilit]
- Rubeša, R.; Rekić, M.; Bunčec, Z.; Stupić, T.; Peharda, D.; Raič, M.N. Automated Tertiary Voltage Control in Transmission System; Innovative Smart Grid Technologies (ISGT): Grenoble, France, 2023; pp. 1–6. [Google Scholar] [CrossRef] [Scilit]
- Jiao, W.; Chen, J.; Wu, Q.; Li, C.; Zhou, B.; Huang, S. Distributed coordinated voltage control for distribution networks with DG and OLTC based on MPC and gradient projection. IEEE Trans. Power Syst. 2022, 37, 680–690. [Google Scholar] [CrossRef] [Scilit]
- Xu, R.; Zhang, C.; Xu, Y.; Dong, Z.; Zhang, R. Multi-objective hierarchically-coordinated Volt/Var control for active distribution networks with droop-controlled PV inverters. IEEE Trans. Smart Grid 2022, 13, 998–1011. [Google Scholar] [CrossRef] [Scilit]
- Liu, M.; Chiang, H.D.; Li, T. Three-timescale hierarchical multi-objective Volt/Var control in active distribution network with inverters droop control. IEEE Access 2024, 12, 197602–197615. [Google Scholar] [CrossRef] [Scilit]
- Zhou, H.; Liang, J.; Du, X.; Wu, M. Multi-timescale reactive power optimization and regulation method for distribution networks under a multi-source interaction environment. Processes 2024, 12, 2254. [Google Scholar] [CrossRef] [Scilit]
- Sondharangalla, M.; Moldovan, D.; Ayyanar, R. Volt-PF control mode for distribution feeder voltage management under high penetration of distributed energy resources. IEEE Access 2025, 13, 14949–14960. [Google Scholar] [CrossRef] [Scilit]
- Zhang, C.; Xu, R.; Yang, L. Optimization of local voltage control with coordinating droop functions under high PV penetration. IEEE Trans. Power Syst. 2024, 39, 6776–6779. [Google Scholar] [CrossRef] [Scilit]
- Liu, Z.; Wang, Z.; Chen, Y.; Ren, Q.; Zhao, J.; Qiu, S.; Zhao, Y.; Zhang, H. A hierarchical distributed and local voltage control strategy for photovoltaic clusters in distribution networks. Processes 2025, 13, 1633. [Google Scholar] [CrossRef] [Scilit]
- Zhang, Z.; Li, P.; Ji, H.; Yu, H.; Zhao, J.; Xi, W.; Wu, J. Adaptive voltage control of inverter-based DG in active distribution networks with measurement-strategy mapping matrix. IEEE Trans. Sustain. Energy 2025, 16, 1238–1252. [Google Scholar] [CrossRef] [Scilit]
- Karbouj, H.; Rather, Z.H.; Pal, B.C. Adaptive voltage control for large scale solar PV power plant considering real life factors. IEEE Trans. Sustain. Energy 2021, 12, 990–998. [Google Scholar] [CrossRef] [Scilit]
- Afshari, A.; Davari, M.; Karrari, M.; Gao, W.; Blaabjerg, F. A multivariable, adaptive, robust, primary control enforcing predetermined dynamics of interest in islanded microgrids based on Grid-Forming inverter-Based Resources. IEEE Trans. Autom. Sci. Eng. 2024, 21, 494–2506. [Google Scholar] [CrossRef] [Scilit]
- Nazir, F.U.; Pal, B.C.; Jabr, R.A. Affinely adjustable robust volt/var control without centralized computations. IEEE Trans. Power Syst. 2022, 38, 656–667. [Google Scholar] [CrossRef] [Scilit]
- Feng, N.; Niu, T.; Yan, J.; Zhang, Y.; Feng, Y.; Lei, Y. Optimal placement and sizing of reactive power compensation devices in power grids with high penetration of distributed generation. Processes 2025, 13, 2953. [Google Scholar] [CrossRef] [Scilit]
- Fu, Y.; Liu, Y.; Huang, L.-L.; Ying, F.; Li, F. Collection system topology for deep-sea offshore wind farms considering wind characteristics. IEEE Trans. Energy Convers. 2022, 37, 631–642. [Google Scholar] [CrossRef] [Scilit]
- Raza, M.W.; Raza, M.; Badia, J.G.; Prieto-Araujo, E.; Gomis-Bellmunt, O. Fault handling capabilities of grid-forming wind turbines in offshore wind farms connected with MMC HVDC system. IEEE Access 2024, 12, 36404–36414. [Google Scholar] [CrossRef] [Scilit]
- Li, Y.; Wang, J.; Zhang, F.; Wang, F. Double-layer reactive power optimal configuration method for large-scale offshore wind farms based on an adaptively improved gravitational search algorithm. Processes 2025, 13, 3408. [Google Scholar] [CrossRef] [Scilit]
- Meegahapola, L.; Durairaj, S.; Flynn, D.; Fox, B. Coordinated utilisation of wind farm reactive power capability for system loss optimisation. Eur. Trans. Electr. Power 2011, 21, 40–51. [Google Scholar] [CrossRef] [Scilit]
- Ruiz-Tipán, F.; Barrera-Singaña, C.; Valenzuela, A. Reactive Power Compensation Using Power Flow Sensitivity Analysis and QV Curves; ANDESCON: Quito, Ecuador, 2020; pp. 1–6. [Google Scholar] [CrossRef] [Scilit]
- Andalib-Bin-Karim, C.; Liang, X.; Khan, N.; Zhang, H. Determine Q–V characteristics of grid-connected wind farms for voltage control using a data-driven analytics approach. IEEE Trans. Ind. Appl. 2017, 53, 4162–4175. [Google Scholar] [CrossRef] [Scilit]
- Tsai, Z.L.; Lin, H.Y.; Teng, J.H. Decentralized q Control for Photovoltaic Generation Systems in Distribution Systems Using IEC61850 GOOSE; Industry Applications Society (IAS): New Taipei City, Taiwan, 2025; pp. 1–6. [Google Scholar] [CrossRef] [Scilit]
- Liu, C.; Xin, H.; Wu, D.; Gao, H.; Yuan, H.; Zhou, Y. Generalized operational short-circuit ratio for grid strength assessment in power systems with high renewable penetration. IEEE Trans. Power Syst. 2024, 39, 5479–5494. [Google Scholar] [CrossRef] [Scilit]
- Lee, S.H.; Choi, D.; Baek, S.M. Complex short circuit ratio to evaluate grid robustness for inverter integration. IEEE Access 2025, 13, 132693–132702. [Google Scholar] [CrossRef] [Scilit]
- Saadun, N.; Abdullah, S.K.S.; Nizam, M.K.; Azmi, M.T.; Omar, Z.B.; Turiman, M.S. Real-time power system simulation hardware-in-the-loop testbed for coordinated voltage control system. In Proceedings of the 2022 IEEE International Conference on Power and Energy (PECon), Langkawi, Kedah, Malaysia, 5–6 December 2022; pp. 368–373. [Google Scholar] [CrossRef] [Scilit]

Disclaimer/Publisher’s Note: The statements, opinions and data contained in all publications are solely those of the individual author(s) and contributor(s) and not of MDPI and/or the editor(s). MDPI and/or the editor(s) disclaim responsibility for any injury to people or property resulting from any ideas, methods, instructions or products referred to in the content. |
© 2026 by the authors. Licensee MDPI, Basel, Switzerland. This article is an open access article distributed under the terms and conditions of the Creative Commons Attribution (CC BY) license.