


Abstract
This study conducts a comprehensive geochemical analysis of natural gas, crude oil, and mudstone to investigate the origin and alteration of recently obtained deep heavy oil from the Dongying Depression, Bohai Bay Basin. High contents of β-carotene, gammacerane (gammacerane index = 4.41), and dibenzothiophene (71.22%) and the low value of pristane/phytane (0.32) suggest that the deep heavy oil is mainly generated from in situ source rocks that formed in saline and reducing environments. According to the molecular maturity indicators, the deep heavy oil is at a low maturity level (%Ro ≈ 0.58). The occurrence of complete series n-alkanes and the absence of 25-norhopanes, normal C7 ratio K1 (1.0), high ααα(20R)-C29 sterane (8394.22 μg/g) and low (3- + 4-) methyldiamantane (41.81 μg/g) concentrations, along with the high values of toluene/nC7 (2.73) and diamantine/adamantane (16.6) in the deep heavy oil, suggest that the reservoir did not undergo noticeable biodegradation, TSR, or thermal cracking, but suffered from phase fractionation, respectively. The formation of the deep heavy oil is associated with its low maturity, which is further thickened by phase fractionation due to the recharge of excessive gas. The moderate reservoir temperature (90–150 °C) after charging performs an essential function in the preservation of the deep heavy oil by inhibiting both biodegradation and thermal cracking.
1. Introduction
The Bohai Bay Basin is one of China’s most important petroliferous basins [1,2]. After nearly 60 years of exploration, petroleum exploration has shifted to deeper parts with burial depths greater than 4000 m [3,4,5]. The Dongying Depression is one of the abundant structural units of oil and gas in this basin [6,7]. In this depression, oil and gas are primarily found in the strata above the 4th member of the Shahejie Formation (Es4), and numerous volatile and condensate oils were discovered in the lower part of Es4 in the previous deep exploration [2]. The Paleozoic Kongdian Formation (Ek) is below the Es4 and has received little attention and limited research. In recent years, a new set of deep source rocks has been discovered through numerous wells in the 2nd member of Ek (Ek2) [8,9]. Specifically, the newly drilled LSX2 well obtained 0.21 m3/d of heavy oil and 2529 m3/d of gas at a depth of 4182.6 m to 4188.7 m in the Ek2, where mudstone and gypsiferous mudstone also developed, with a total organic carbon (TOC) of up to 2.20% [9]. This result proves that the Ek2 can be used not only as a set of deep source rocks but also as a hydrocarbon accumulation site, thus opening up a new exploration field. Consequently, the Ek2 formation has emerged as a new target for deep exploration within this depression and is attracting growing attention. However, the Ek2 member is buried at depths exceeding 4000 m across the main basin area, with maximum burial depths surpassing 8000 m [8,9]. Its advanced thermal maturity limits the geochemical information available and constrains understanding of its resource potential. Although the recent oil and gas discovery in the Ek2 member at the LSX2 well provides a valuable sample for investigating the hydrocarbon generation and accumulation mechanisms of this unit, systematic research has not yet been conducted due to the newness of the discovery.
Additionally, crude oil produced from the LSX2 well is unique with a density and viscosity of 0.93 g/cm3 and 261 mPa·s. The presence of light, volatile, or condensate oils in deep reservoirs is common and has been reported in previous studies [2,4,10,11,12,13,14,15]. Chen et al. [2] have shown that the reservoirs under 4000 m in the Dongying depression yield volatile oil, condensate oil, and gas. Therefore, the presence of LSX2 deep heavy oil is inconsistent with the petroleum phases in the Paleozoic petroleum system of the Dongying Depression [2]. In other words, the EK2 oil is unusual and may have a special accumulation mechanism. The accumulation of deep heavy oil has been one of the hot spots of research. Previous studies (e.g., [13,14,15]) have demonstrated that the deep heavy oil is related to source facies such as thermal maturity, depositional environment, and organic matter input, and secondary alterations such as biodegradation, thermal sulfate reduction (TSR), phase fractionation, and thermal cracking. For example, phase differentiation has led to the simultaneous occurrence of condensate, normal oil, and heavy oil at depth in the LG 7 block of the Tarim Basin [13]. The deep heavy oil from the TD2 well in the marine petroleum system of the Tarim Basin has received wide attention and is believed to result from a combination of biodegradation, phase fractionation, and thermal cracking [14]. Therefore, the heavy oil in the LSX2 well provides unique conditions for the study of the geochemistry and origin of deep heavy oil in the lacustrine basin.
Molecular markers (e.g., light hydrocarbons, diamondoids, biomarkers, and aromatics) record valuable information about organic facies of source rocks and secondary alteration of petroleum, etc. [16,17,18]. In this study, molecular markers in natural gas, oil, and black mudstone from the Ek were tested using gas chromatography (GC) and gas chromatography-mass spectrometry (GC–MS) to investigate the origin and accumulation of deep natural gas and heavy oil from the Dongying depression. Specifically, geochemical characteristics such as thermal maturity, depositional environment, organic matter input, source rocks of gas and crude oil, and secondary alterations such as TSR, biodegradation, thermal cracking, and phase fractionation of the petroleum reservoir were systematically investigated. In addition, the generation, preservation, and accumulation processes of deep lacustrine heavy oil in the LSX2 well were analyzed in combination with burial, thermal, and hydrocarbon generation history simulations. The results of this study not only provide a reference for deep oil and gas exploration in this area and other areas with similar backgrounds, but also enrich the deep petroleum accumulation theory, especially for lacustrine basins.
2. Geological Background
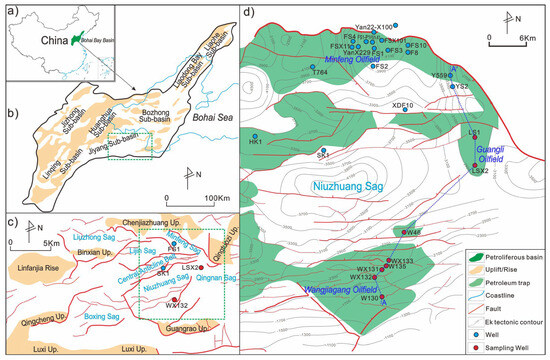
The Bohai Bay Basin is a lacustrine basin located in eastern China with an area of 15 × 105 km2 (Figure 1a). The Dongying Depression is located in the southern part of the Jiyang sub-basin (Figure 1b), one of the major petroleum-rich units in the Bohai Bay Basin.
Figure 1.
Maps showing the location of the Bohai Bay Basin (a), the location of the Dongying Depression (b), the structural division of the Dongying Depression (c), and the location of drilled wells of the Dongying Depression (d).
The Paleogene strata of the Dongying Depression show the tectonic feature of “southern overlap and northern rift depression”. It is divided into seven tectonic units, including the northern steep slope, Minfeng Sag, Lijin Sag, Central Anticline Belt, Niuzhuang Sag, Boxing Sag, and Southern Slope (Figure 1c). The tectonic evolution of the Dongying Depression is categorized into three stages. The first stage is the basement development stage, which occurred from the Tertiary to the Early and Middle Proterozoic periods, when the basement was mainly metamorphic miscellaneous rocks. The second stage is the development stage of a stable platform overburden, which occurred from the Late Proterozoic to the Paleozoic periods, when the sedimentary cover of the depression formed in the Jixian Movement. The third stage is the development stage of platform activation and rift basins in the Mesozoic and Cenozoic periods. During this stage, the Tertiary system experienced initial rifting, deep sinking, and rifting regression periods, with the thickest deposits >7000 m.
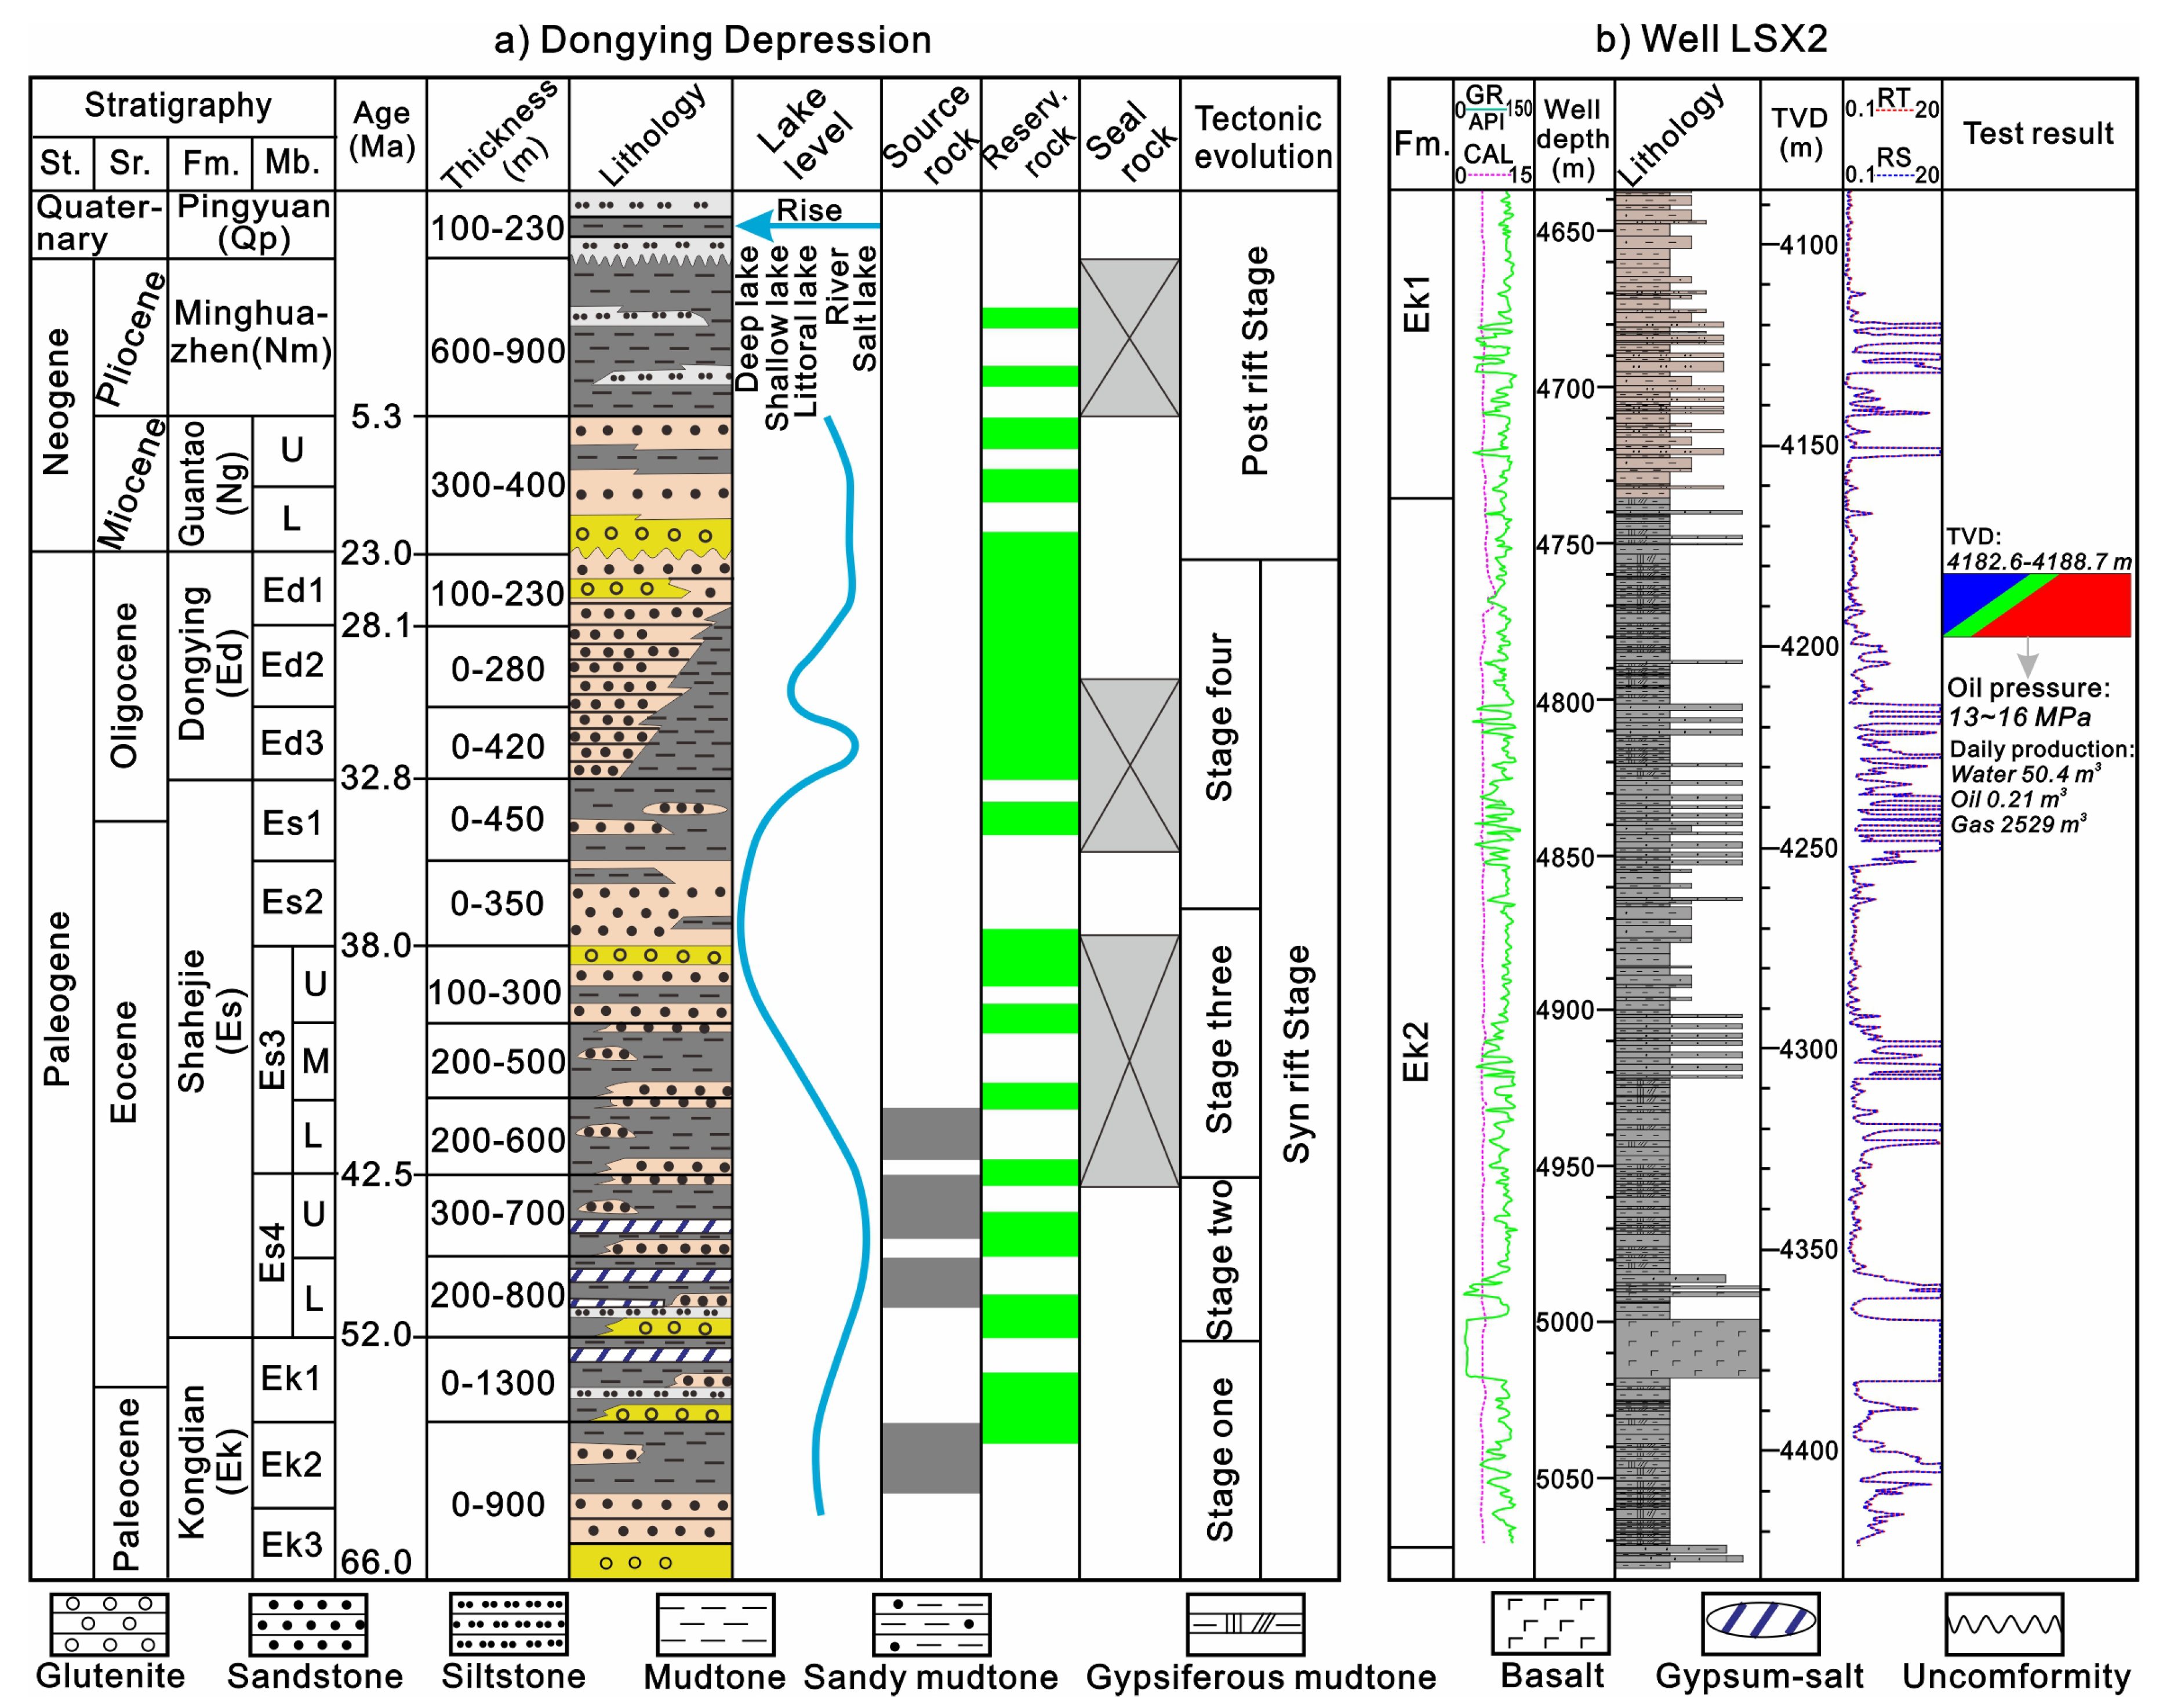
The Tertiary system is divided into the Kongdian (Ek), Shahejie (Es), Dongying (Ed), Guantao (Ng), and Minghuazhen (Nm) formations from the bottom to the top (Figure 2a). The Es is subdivided into four members, and the dark mudstone mainly developed in the 3rd (Es3) and 4th (Es4) sections and has been proven to be the main source rock in this depression (Figure 2a). The dark mudstone in the 2nd member of the Ek (Ek2) has also been shown to have hydrocarbon generation capacity [19]. The Ek2 dark mudstones are present in a large range, with a thickness of >550 m at the depositional center. Several wells were drilled into this set of mudstones, with TOC in the W46, SK1, and LSX2 wells in the ranges of 0.06–0.99%, 0.07–0.94%, and 0.40–2.20% [8,9]. As a breakthrough in hydrocarbon exploration in the Ek2, the LSX2 well is the main object of this study. Tertiary strata are well developed in the LSX2 well, and the total thickness of the Ek2 is 261 m. The lithology in the Ek2 is dominated by mudstone, gypsiferous mudstone, and sandy mudstone, accounting for 51%, 25%, and 6%, respectively (Figure 2b).
Figure 2.
(a) Generalized Cenozoic stratigraphy of the Dongying Depression, modified from [2,4]; (b) Stratigraphic section of the Kongdian Formation at LSX2 well, where TVD is true vertical depth.
3. Samples and Methods
3.1. Samples
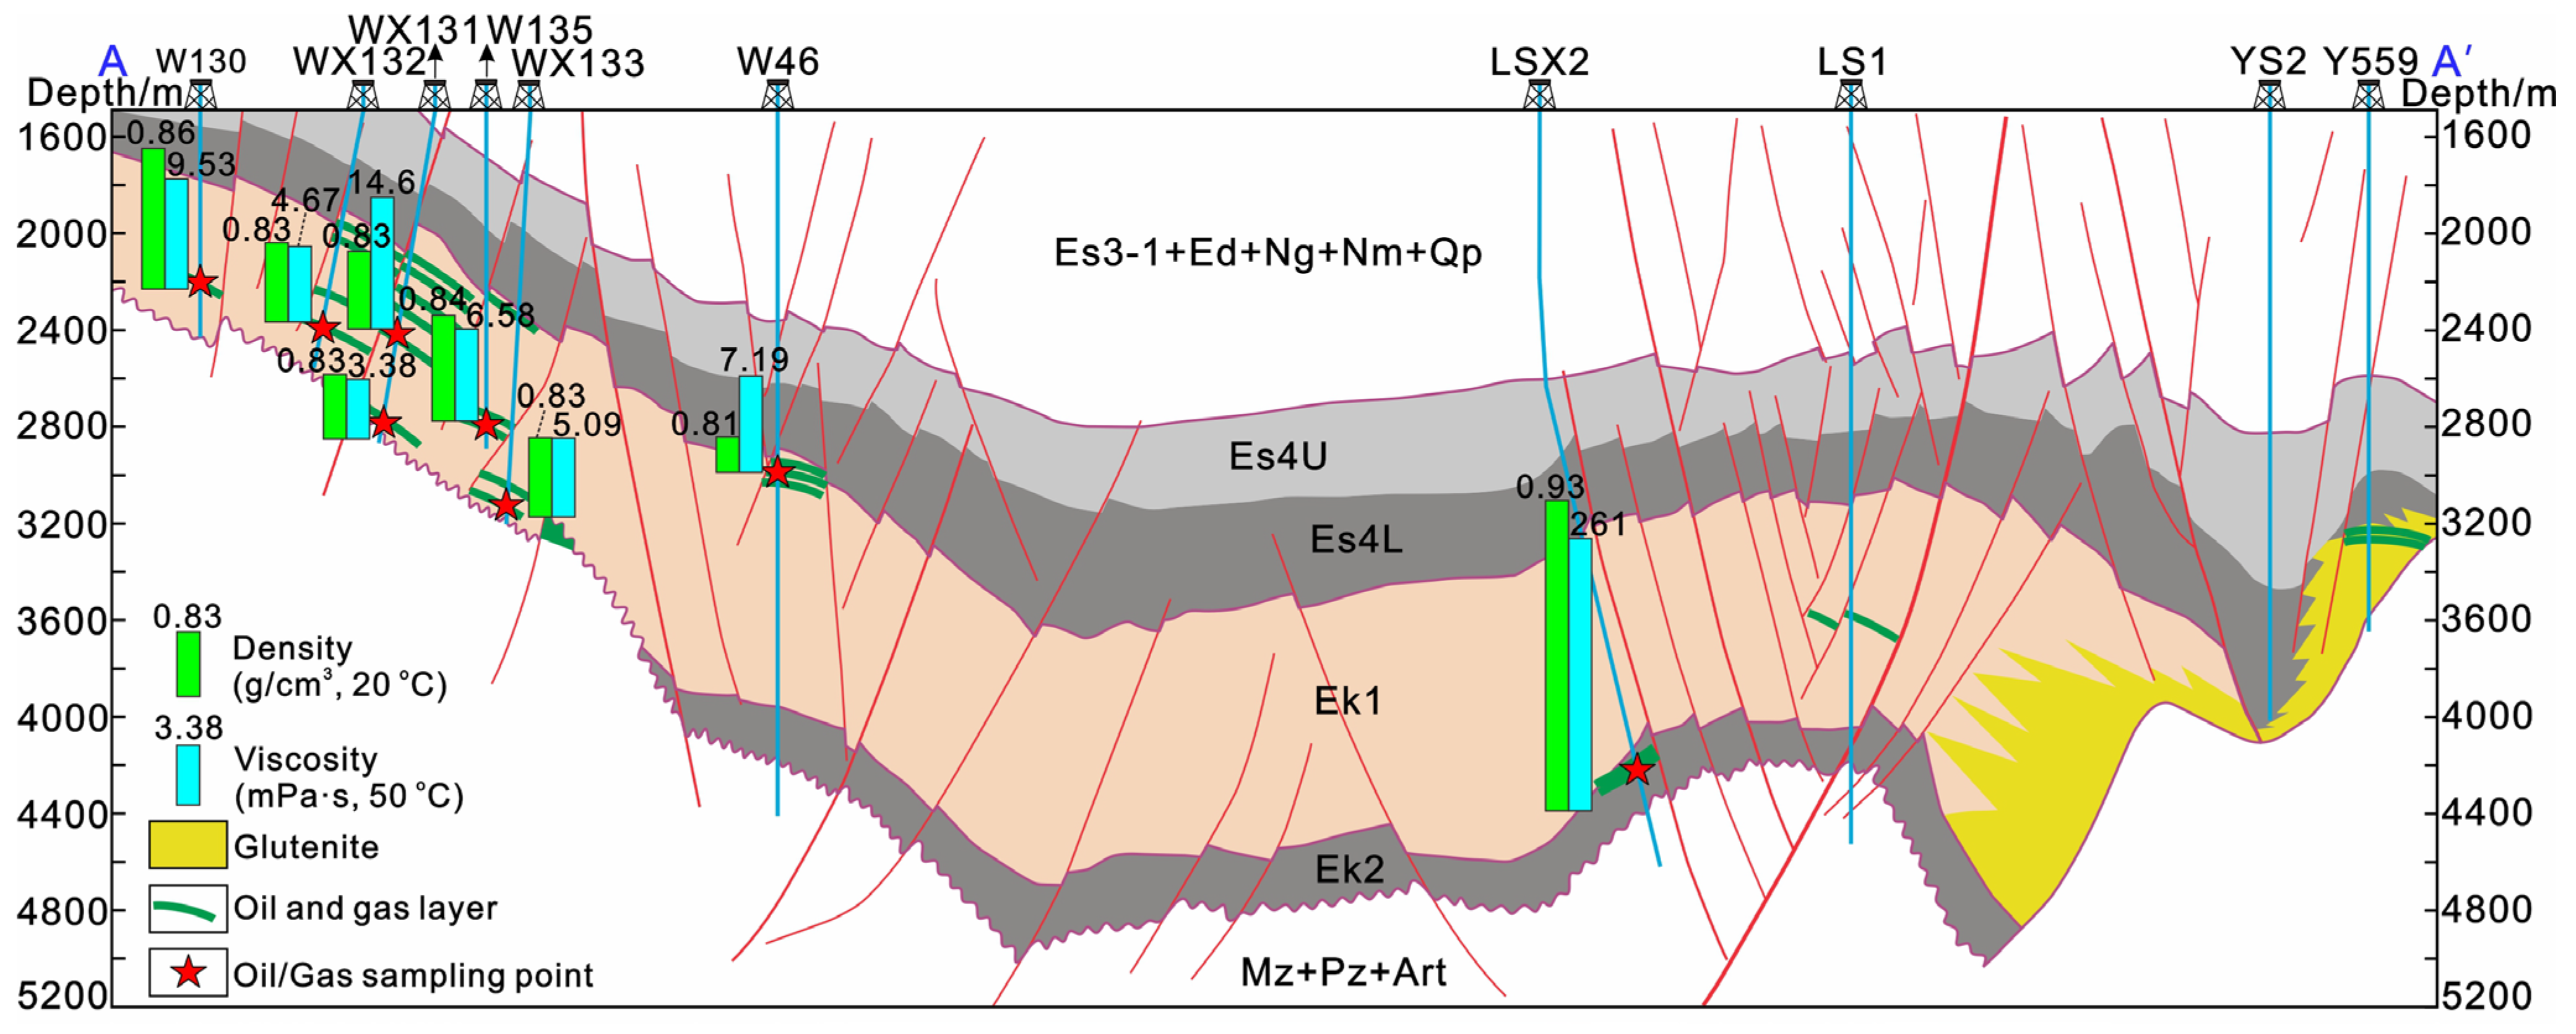
Three gases and eight crude oils produced from the Ek Formation in the Dongying Depression were covered. Among them, one natural gas and one crude oil were sampled from the LSX2 well in the Guangli oilfield, and the remaining seven crude oils were sampled from the Wangjiagang oilfield (WJG) (Figure 1d). Details of the samples, such as well depth and physical properties, are shown in Table 1 and Figure 3. For geochemical comparison, mudstone samples were collected from LSX2, LS1, W46, W130, and SK1 wells and then selected for microscopic observation, rock mineral analysis, Rock-Eval pyrolysis, vitrinite reflectance (%Ro) measurement, and soluble bitumen extraction.
Table 1.
Basic information, physical property, and bulk composition of the studied oil samples.
3.2. Natural Gas Analysis
The compositions of natural gas were determined by an Agilent 7890A GC (manufacturer is Agilent Technologies, located in Santa Clara, CA, USA) using a HP-PLOT AL203 column (50 m × 0.15 mm × 0.53 μm). The column temperature is set at 60 °C and then continuously increased to 150 °C.
The light hydrocarbons of gas were determined by an Agilent 7890A GC using a HP-1 column (60 m × 0.25 mm × 0.5 μm). The column temperature is set at 40 °C, constant for 10 min, and then increased to 100 °C at 5 °C/min.
3.3. Crude Oil Analysis
The light hydrocarbons in crude oil were tested by an Agilent 7890A GC using a HP-PONA column (50 m × 0.20 mm × 0.5 μm). The GC was held at the starting temperature of 35 °C for 5 min, increased to 70 °C at 3 °C/min, to 300 °C at 4.5 °C/min, and finally to 300 °C for 35 min. Whole crude oil was diluted with dichloromethane and injected directly into the GC.
Diamondoids in crude oil were tested by Agilent 7890A GC/5975C MS (manufacturer is Agilent Technologies, located in California, USA). The GC was fitted with a DB5-MS column (60 m × 0.25 mm × 0.25 μm). The GC was initiated at 40 °C, ramped up to 300 °C with 4 °C/min, and held at 300 °C for 30 min. Whole oil was diluted with dichloromethane and injected into the GC. Prior to injection, a known concentration of d16-adamantane was mixed into the samples as an internal standard to quantify the diamondoid concentrations.
The separation of saturated, aromatic, non-hydrocarbon, and asphaltene fractions from crude oil was performed by silica gel-alumina column chromatography with the same separation procedure as Chai et al. [11]. The saturated fraction and the aromatic fraction were diluted with dichloromethane and injected into an Agilent 8860 GC/5977B MS (manufacturer is Agilent Technologies, located in California, USA) for biomarkers and aromatic compounds, respectively. The GC was fitted with a HP5-MS column (50 m × 0.20 mm × 0.5 μm). The GC started at 50 °C for 1 min, ramped up to 250 °C at 3 °C/min, ramped up to 310 °C at 20 °C/min, and was maintained at 310 °C for 30 min. The known concentration of d4-ααα(20R)-C29 regular sterane was mixed into the saturated fraction as an internal standard prior to injection to quantify the sterane concentration.
3.4. Source Rock Analysis
The microscopic observation, vitrinite reflectance (Ro), and soluble bitumen extraction of source rocks are consistent with those of [2]. The separation of saturated fractions from soluble bitumen and the GC–MS detection of saturated fractions are consistent with the methods used for crude oil samples.
4. Results
4.1. Natural Gas
4.1.1. Gas Compositions
The hydrocarbon components of LSX2 gas primarily consist of CH4 (C1), C2H6 (C2), and C3H8 (C3), with molar contents of 49.9%, 0.1%, and 0.01%, respectively. Other hydrocarbon components are very few, including only 0.01% isobutane (iC4), 0.01% isopentane (iC5), and 0.01% n-pentane (nC5). The abundances of N2, CO2, and H2 are 28.16%, 20.23%, and 1.50%, respectively. In addition, no CO or H2S was detected.
4.1.2. Light Hydrocarbons
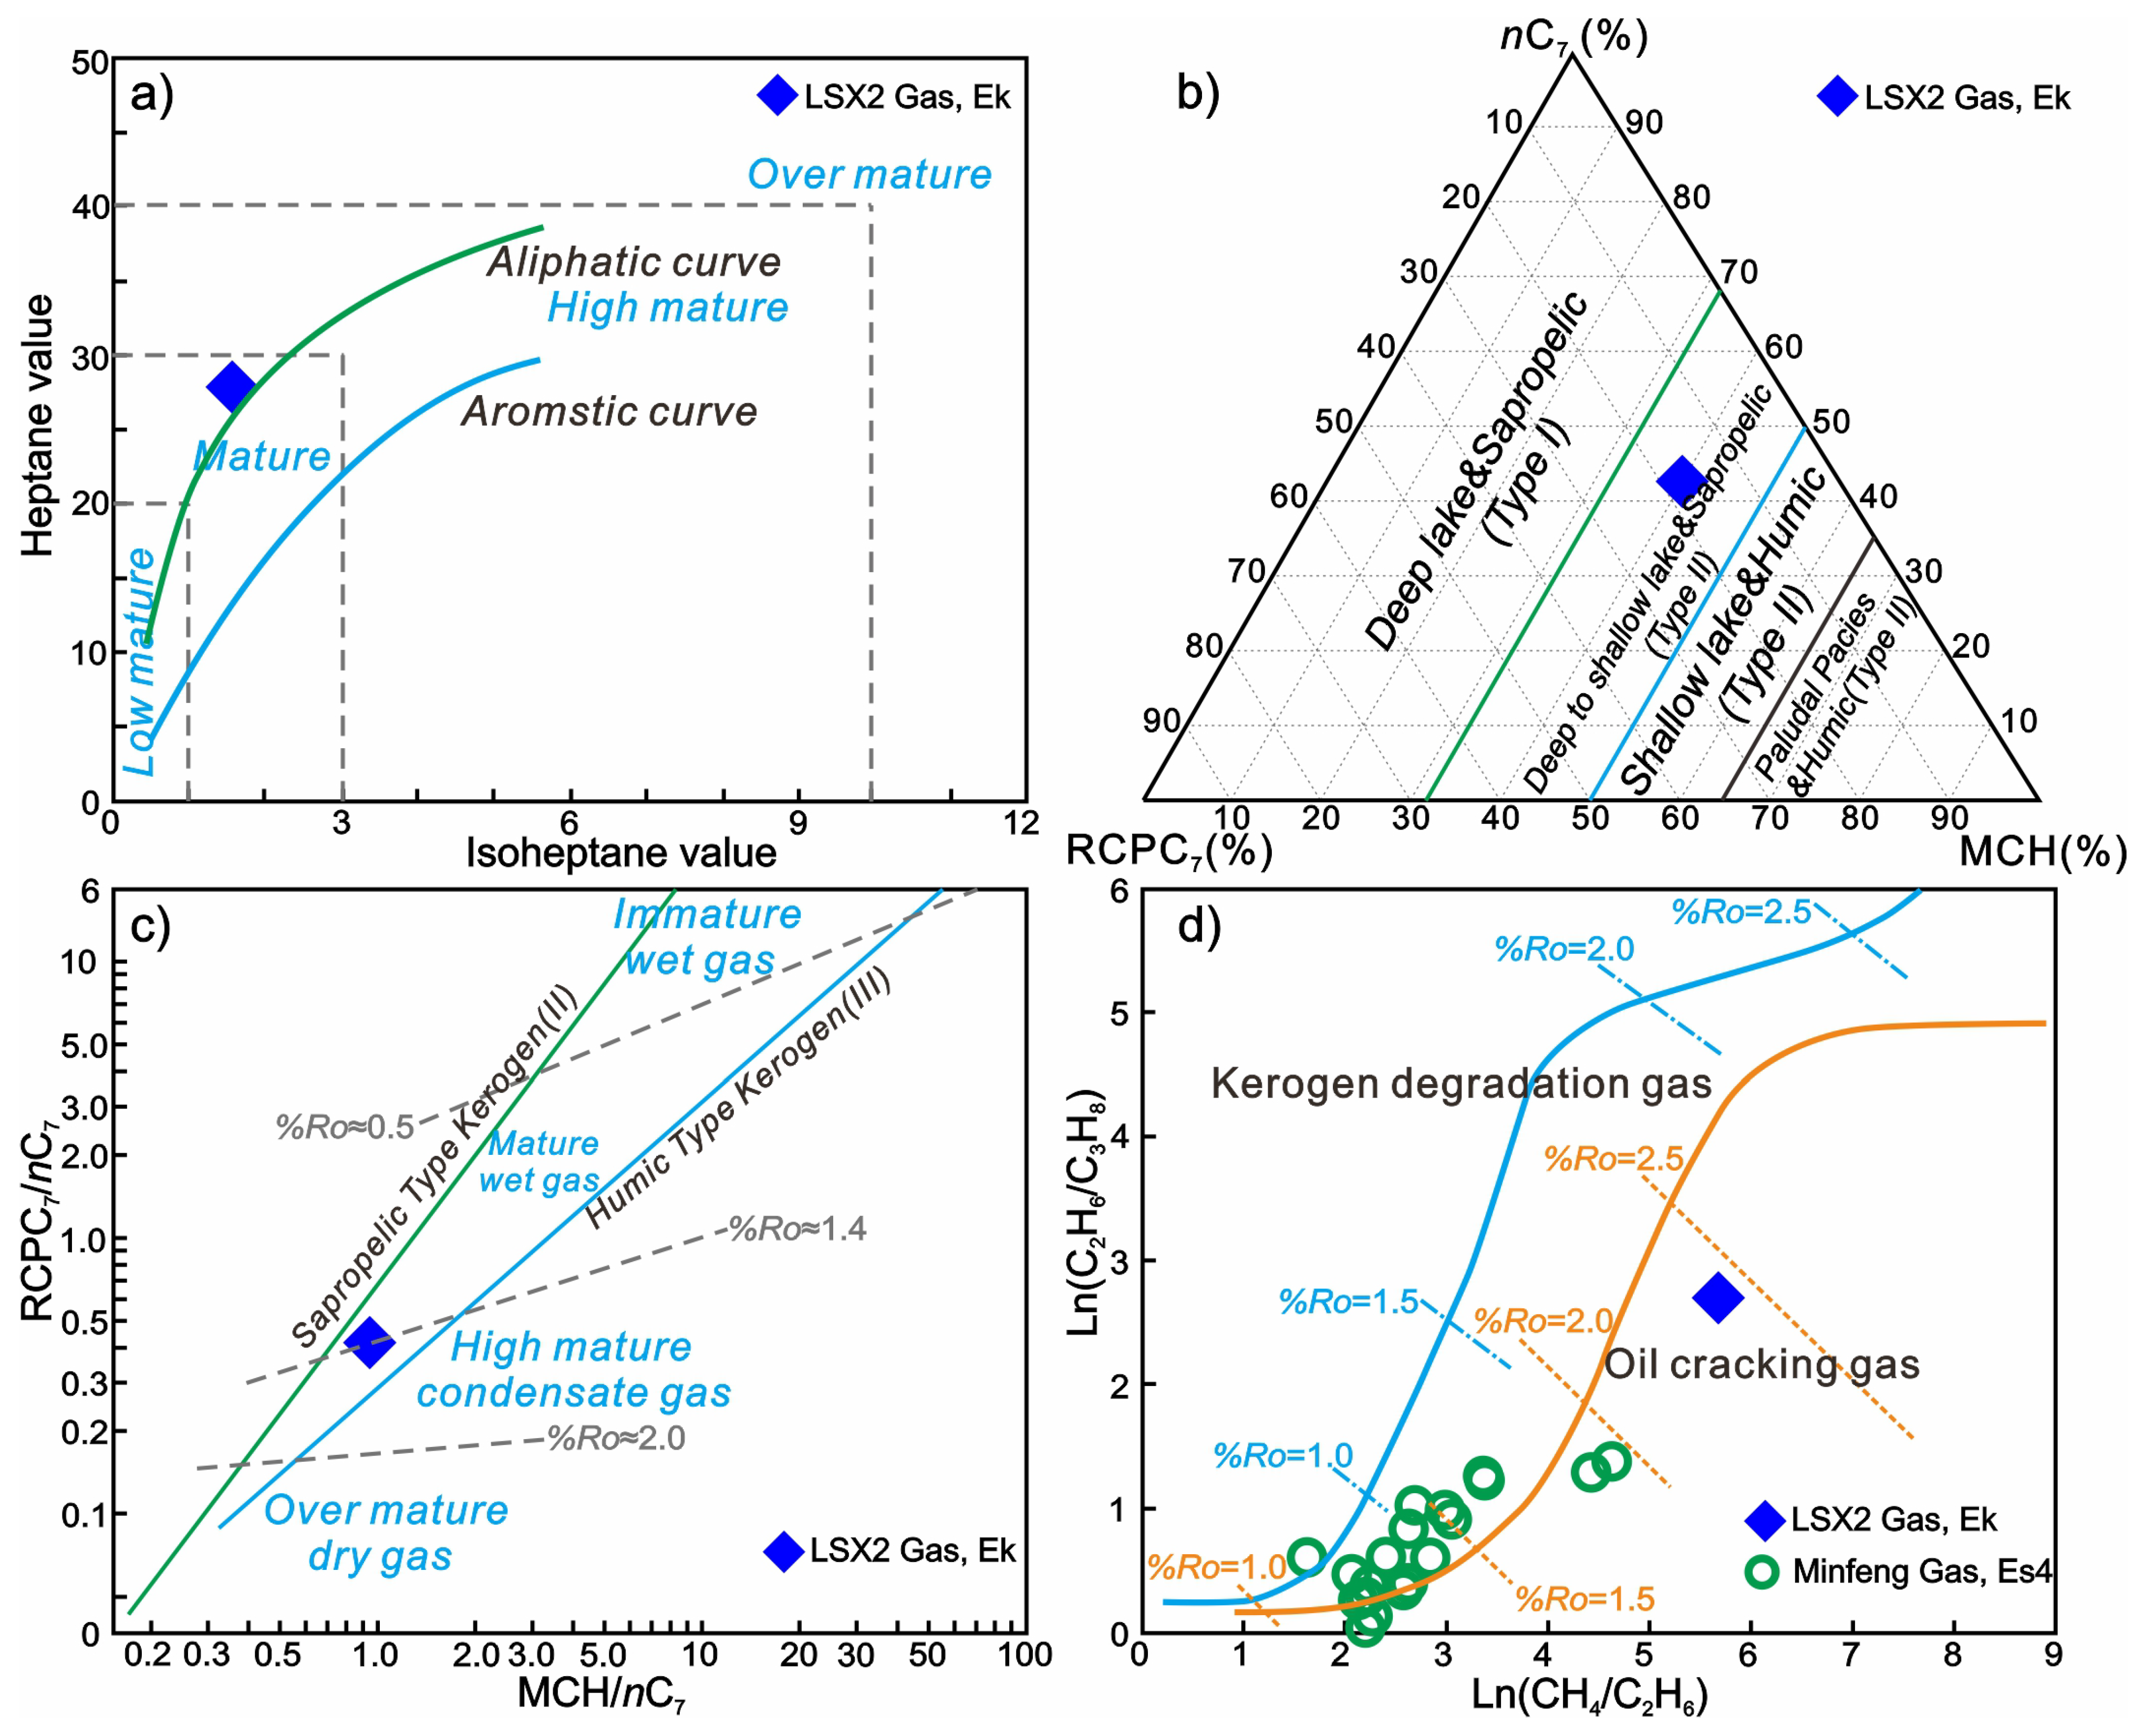
The relative content of the C7 components in LSX2 gas is 0.25%. Among the C7 hydrocarbons, the relative percentages of n-heptane (nC7), dimethylcyclopentane (RCPC7), and methylcyclohexane (MCH) are 42.86%, 17.46%, and 39.68%, respectively, while the ratios of RCPC7/nC7 and MCH/nC7 are 0.41 and 0.93. The heptane value and isoheptane value, as defined by Thompson [20], are 27.84 and 1.57, respectively.
4.2. Crude Oil
4.2.1. Bulk Properties
4.2.2. Light Hydrocarbons and Diamondoids
The whole oil GC identified light hydrocarbons such as n-heptane (nC7), n-octane (nC8), methylcyclohexane (MCH), p-xylene (p-Xyl), and m-xylene (m-Xyl) in crude oil samples. The ratios of nC7/MCH, Tol/nC7, and (m + p)-Xyl/nC8 constructed by these compounds are in the ranges of 0.72–4.45, 0.21–2.73, and 0.13–1.11, respectively (Table 2).
Table 2.
Geochemical parameters based on light hydrocarbons, diamondoids, biomarkers, and aromatic compounds of the studied oil samples.
The quantitative results of whole oil GC–MS show that the concentration of diamantanes in most oil samples exceeded adamantanes. The respective concentrations of adamantane (A) and (1 + 2)-methyladamantane (MA) range within 1.27–6.34 and 11.85–95.85 μg/g, while the concentrations of diamantane (D) and (3 + 4)-methyldiamantane (MD) are 0.78–21.16 and 3.49–41.81 μg/g. The values of D/A and (3 + 4)-MD/(1 + 2)-MA are 0.43–16.60 and 0.28–3.53 (Table 2).
4.2.3. n-Alkanes and Isoprenoids
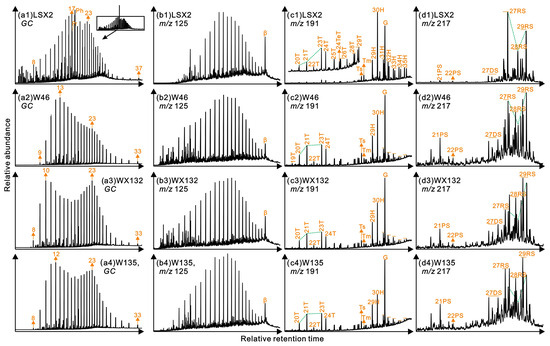
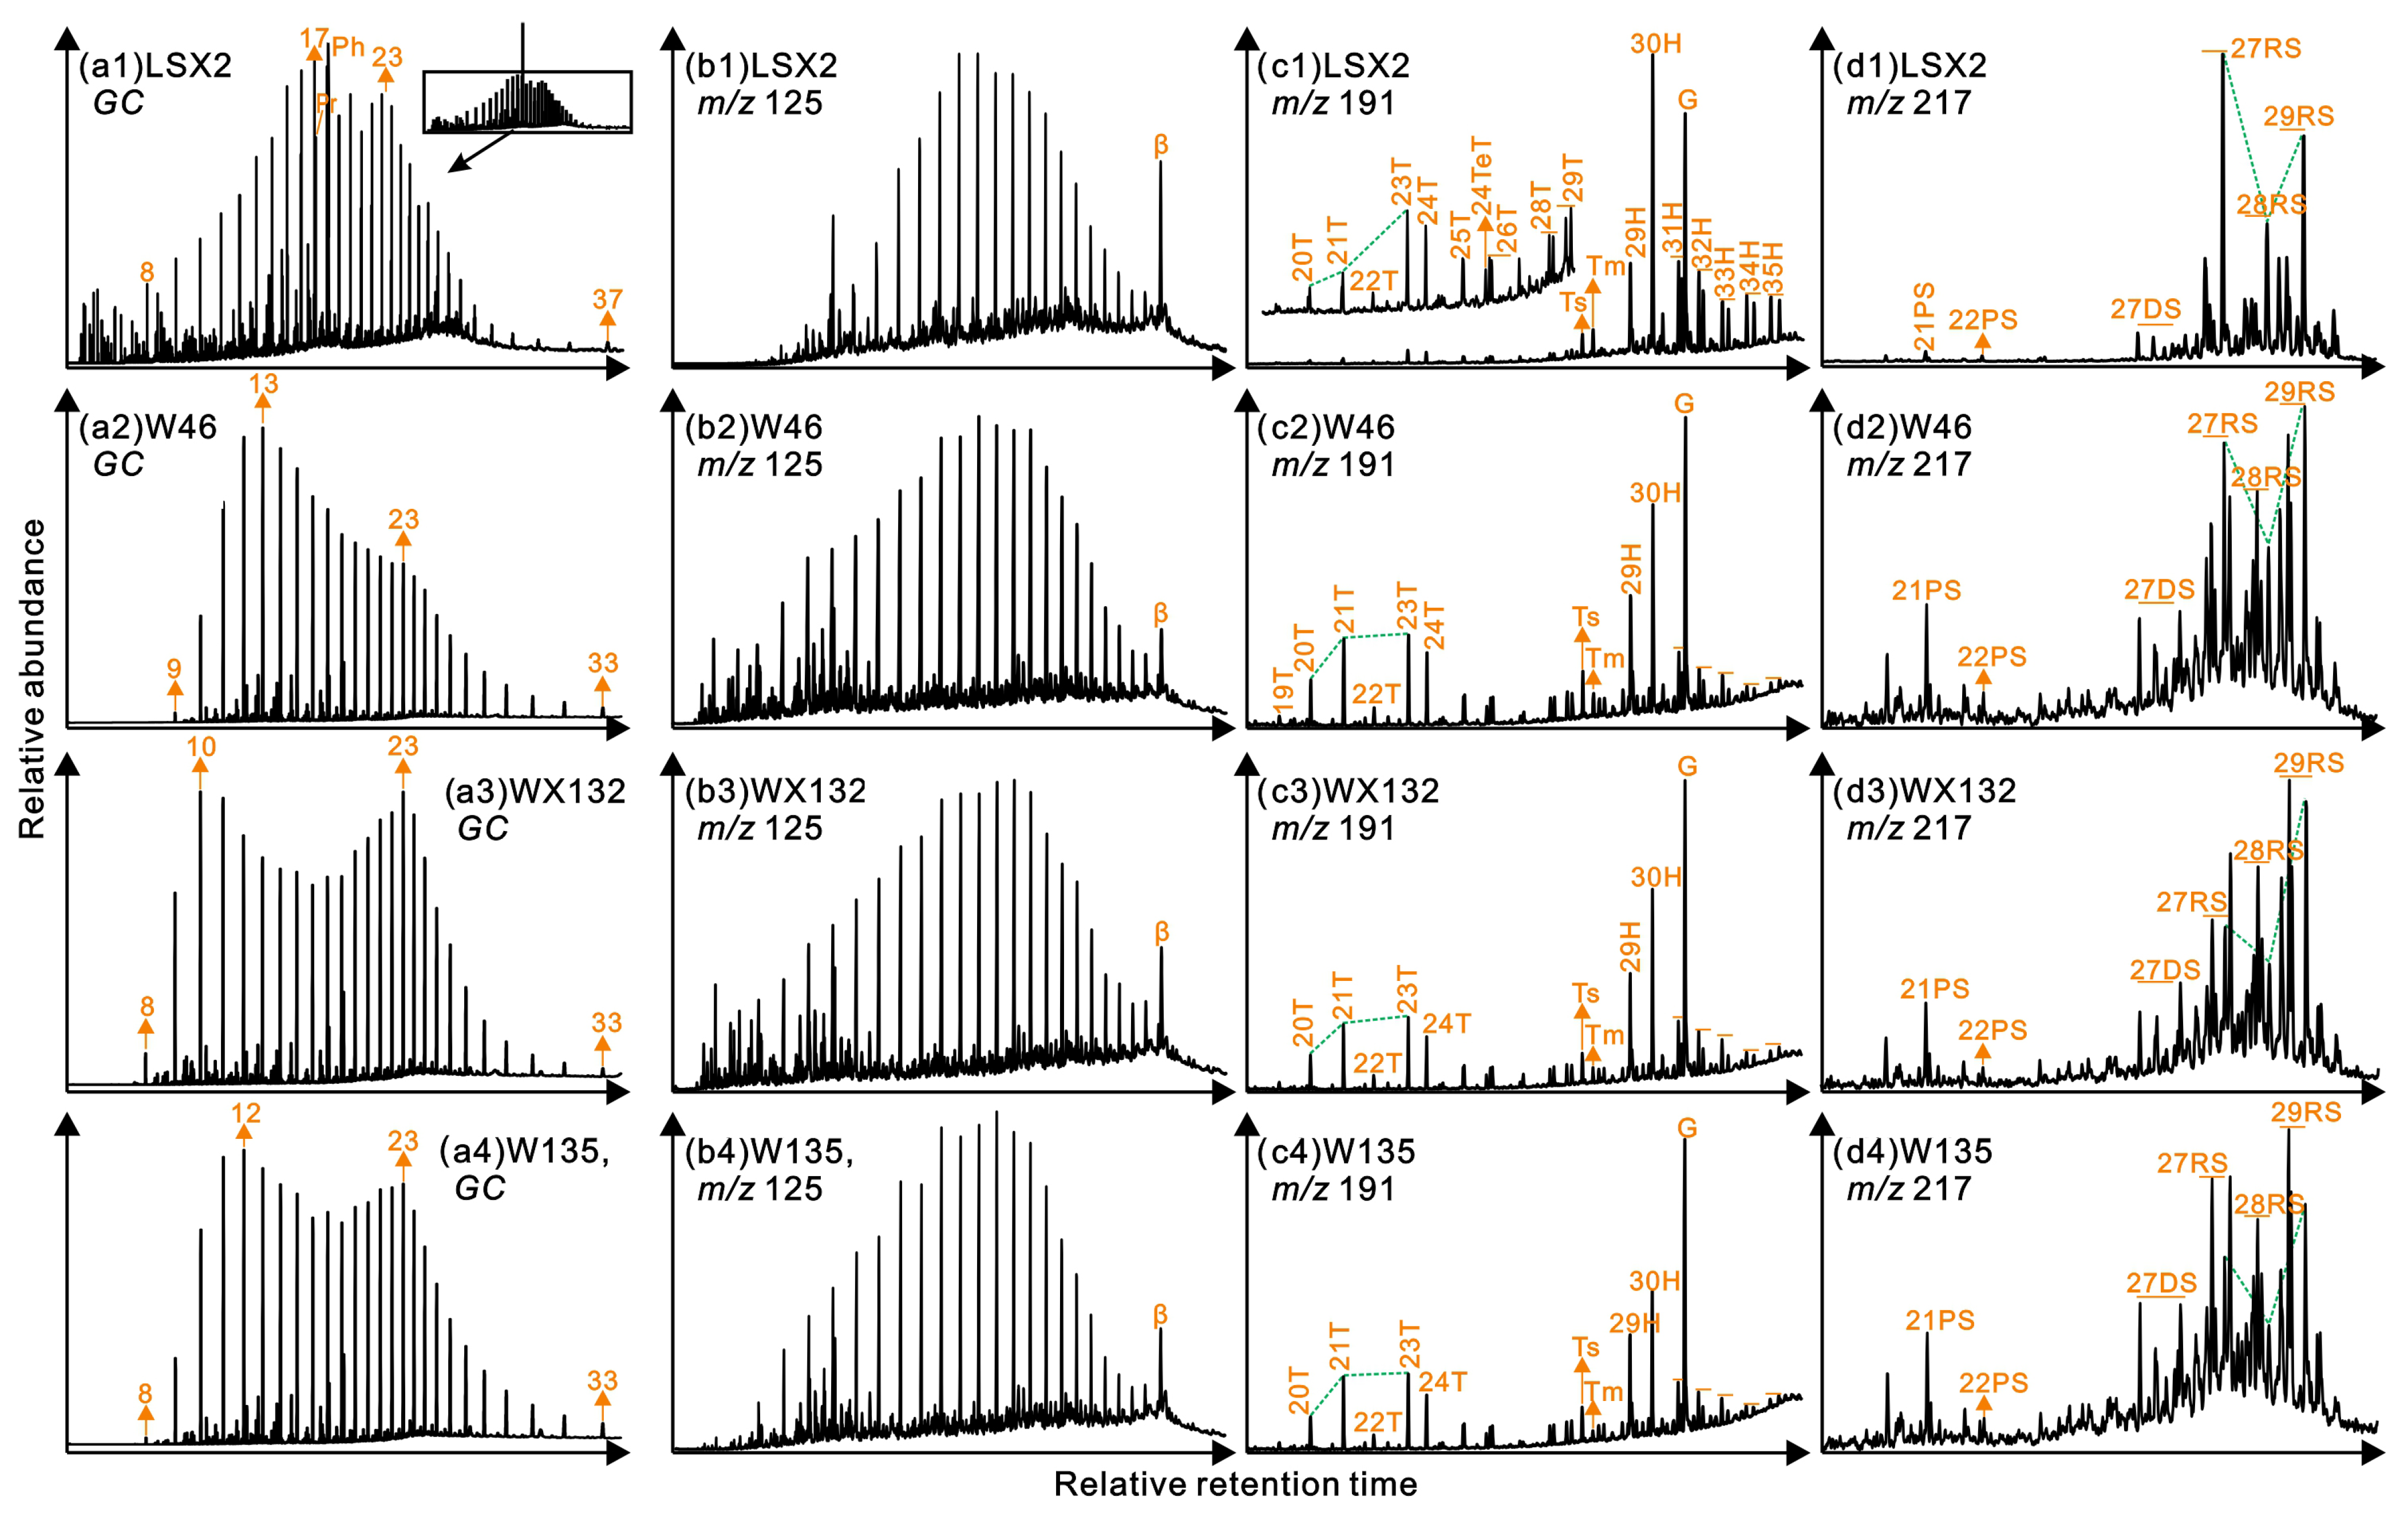
The GC baselines of the crude oils are stable, with a complete series of n-alkane distributions from at least C8 to C37, presenting a bimodal distribution (Figure 4a1–a4). The nC21+22/nC28+29 and nC21-/nC22+ parameters, representing the value of long- to short-chain n-alkanes, range within 1.09–2.98 and 0.88–3.23, respectively (Table 2).
Figure 4.
Chromatograms showing the distributions of n-alkanes and isoprenoids (a1–a4), β-carotene (b1–b4), terpanes (c1–c4), and steranes (d1–d4) in the oil samples. The numbers above the peak mean the carbon number. Pr: pristane; Ph: phytane; β: β-carotene; T: tricyclic terpane; TeT: tetracyclic terpane; Ts: 18α(H)-trisnorneohopane; Tm: 17α(H)-trisnorhopane; H: hopane; G: gammacerane; PS: pregnane; DS: diasterane; RS: regular sterane.
The peaks of pristane (Pr) and phytane (Ph) in the LSX2 crude oil are unusually high, and the peak of Ph significantly exceeded the peak of n-alkanes (Figure 4a1), with the values of Pr/nC17, Ph/nC18, and Pr/Ph being 0.80, 2.46, and 0.32 (Table 2). In contrast, the WJG crude oil samples contain lower abundances of Pr and Ph, and none of them exceed the adjacent n-alkanes (Figure 4a2–a4), with the Pr/nC17, Ph/nC18, and Pr/Ph values being 0.20–0.38, 0.31–0.67, and 0.56–0.72 (Table 2).
4.2.4. Terpanes and Steranes
Abundant terpanes were detected in the oil samples (Figure 4c1–c4), with tricyclic terpanes (TT) distributed from C19 to C29 and hopanes (H) from C27 to C35. It is noteworthy that the LSX2 oil sample shows a “valley” distribution of C20, C21, and C23TT, while the WJG crude oil samples show a “peak” distribution (Figure 4c1–c4). In addition, C24 tetracyclic terpane (C24TeT) and gammacerane (G) were clearly detected in all samples. The gammacerane index (GI, 10 × G/(G + C30H)) is distributed in the range of 3.61–7.95 (Table 2). However, compared with the WJG crude oil samples, the LSX2 crude oil sample has a higher C23TT content with a C23/C21TT of 2.30, a higher C24TeT content with a C24TeT/C23TT of 0.42, and a higher C35H content with a homohopane index (HHI, C35/C31–35H) of 0.18 (Table 2). Correspondingly, the C23/C21TT, C24TeT/C23TT, and HHI values of the WJG oils are 0.94–1.12, 0.18–0.23, and 0.07–0.10 (Table 2). In contrast, the TT of the WJG crude oil samples is higher than that of the LSX2 oil sample, with the TT/H values of the WJG and the LSX2 oils being 0.36–0.87 and 0.10 (Table 2).
Steranes in the crude oil samples are most abundant in C27–C29 regular steranes (RS) (Figure 4d1–d4). In the LSX2 crude oil sample, the ααα-20R type of C27–C29RS presents an “L” distribution, characterized by C27 > C28 < C29 (Table 2). The contents of pregnanes (PS) and diasteranes (DS) in this sample are low (Figure 4d1), and the values of PS/RS and DS/RS are 0.01 and 0.11, respectively (Table 2). In the WJG oil samples, the ααα-20R type of C27–C29RS presents a “V” or “anti-L” distribution, also characterized by C27 > C28 < C29 (Figure 4d2–d4). The contents of PS and DS in these samples are higher than those of LSX2 crude oil, and the values of PS/RS and DS/RS are 0.04–0.06 and 0.15–0.28, respectively (Table 2).
4.2.5. Aromatic Compounds
Aromatic hydrocarbon compounds such as naphthalene (N), phenanthrene (P), dibenzothiophene (DBT), dibenzofuran (DBF), fluorene (FL), triaromatic sterane (TAS), and their alkylated isomers were identified by GC–MS. The relative contents of DBT, DBF, and FL in these oil samples are 71.22–97.27%, 2.40–18.08%, and 0.34–18.7%, respectively (Table 2). The TAS compounds are dominated by C26–C28 compounds (II), and the contents of C20–C21 compounds are low, with the values of TAS(I)/TAS(I + II) ranging from 0.07 to 0.22 (Table 2).
5. Discussion
5.1. Origin of Natural Gas
Light hydrocarbons in gas are rich in geological and geochemical information [20,21,22]. For example, Thompson [20] found that the degree of alkylation of light hydrocarbons increases with thermal maturity and developed a plot of heptane value (H) vs. isoheptane value (I) to characterize the organic matter type and thermal maturity (Figure 5a). Here, LSX2 natural gas is close to the aliphatic curve and falls in the transition stage from mature to highly mature (Figure 5a), indicating that it is sourced from sapropelic kerogen and is in a mature stage. In addition, Hu et al. [21] and Dai [22] have found that among the C7 range of light hydrocarbons, the relative contents of n-heptane (nC7), dimethylcyclopentane (RCPC7), and methylcyclohexane (MCH) are regulated by the organic matter type and thermal evolution. Based on 112 source rocks and 108 gas samples from the Sichuan Basin, North China, and East China, Hu et al. [21] constructed the nC7–RCPC7–MCH triangle and MCH/nC7 vs. RCPC7/nC7 cross-plot to identify the organic matter type and thermal maturity. Here, both plates suggest that LSX2 gas is derived from sapropelic kerogen (Figure 5b,c). In addition, the ratios of MCH/nC7 and RCPC7/nC7 also indicate that the LSX2 gas is in the transition stage between mature and highly mature, with an inferred %Ro close to 1.4% (Figure 5c).
Figure 5.
Diagrams inferring the thermal maturity, organic matter type, and origin of the LSX2 gas. (a) Heptane value vs. Isoheptane value [20]; (b) triangle diagram of MCH–RCPC7–nC7 [21]; (c) MCH/nC7 vs. RCPC7/nC7 [21]; (d) Ln (CH4/C2H6) vs. Ln (C2H6/C3H8) [23,24], and the comparative data of Mingfeng gas after [5,7].
Numerous studies have shown that deep gas in the Dongying Depression can be produced by kerogen degradation, thermal cracking, or both (e.g., [5,6,7]). Xie et al. [23] and Li et al. [24] defined a plate, as shown in Figure 5d, to clarify the evolution of Ln (C1/C2) and Ln (C2/C3) during kerogen degradation gas and oil cracking gas. Here, these two ratios of the LSX2 gas sample are 5.67 and 2.71 (Figure 5d), which are higher than those of kerogen thermal degradation gas or oil cracking gas in the Minfeng area [5,7]. This result indicates that this gas is mainly derived from oil cracking, which corresponds to its high dryness index (100C1/C1–5) of 99.57%. Considering that the LSX2 crude oil has not been thermally cracked, the cracking gas in the present reservoir originates from the invasion of ex situ oil cracking.
In addition, the Ln (C1/C2) and Ln (C2/C3) values indicate that the LSX2 gas is at an over-mature stage, with an inferred %Ro close to 2.4% (Figure 5d). This result greatly exceeds the range of maturity obtained from the C7 hydrocarbon parameters. Great differences in the maturity ranges derived from various classes of compounds have been observed in oil and are thought to be the result of oil mixing [11,25]. The chemical composition of crude oil produced at various maturity stages of source rocks varies greatly, with light hydrocarbons and diamondoids being produced later than biomarkers and most aromatics [25]. Different compound classes reflect differences in oil maturity that have undergone multi-stage charging and mixing. Among them, biomarkers and aromatic hydrocarbons tend to reflect early-charging oil maturity, whereas light hydrocarbons and diamondoids tend to reflect late-charging oil maturity [11,12,25].
Similarly, C7 light hydrocarbons are predominantly generated during the condensate/wet gas window associated with kerogen degradation at moderate maturity (%Ro ~1.0–1.5%) [2,6,26]. In contrast, the C1–3 fraction becomes increasingly dominant during the high to over-mature stage (%Ro > 2.0%), resulting from both advanced kerogen cracking and secondary oil-to-gas conversion [2,6,26]. Thus, when the natural gas is a mixture produced from these two stages, the C7 fraction tends to reflect the properties of the natural gas generated from the former stage, while the C1–3 fraction tends to reflect the characteristics of the gas produced in the latter stage.
For the LSX2 reservoir, this model is strongly supported by local geology. The in situ Ek2 mudstones are within the mature oil window, capable of generating C7-rich wet gas via kerogen degradation. However, the extremely high dryness index of the LSX2 gas (99.57%) indicates a dominant contribution from an external, over-mature dry gas charge, likely sourced from deeper, oil-cracking derived gas. Consequently, the C7 signature in the mixed gas largely preserves the maturity signal of the earlier, in situ kerogen-derived charge, while the C1–3 composition overwhelmingly reflects the later, high-maturity cracking gas.
5.2. Origin of Crude Oil
5.2.1. Thermal Maturity
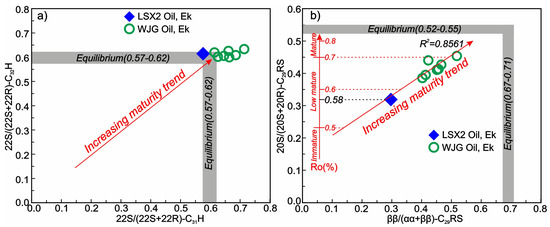
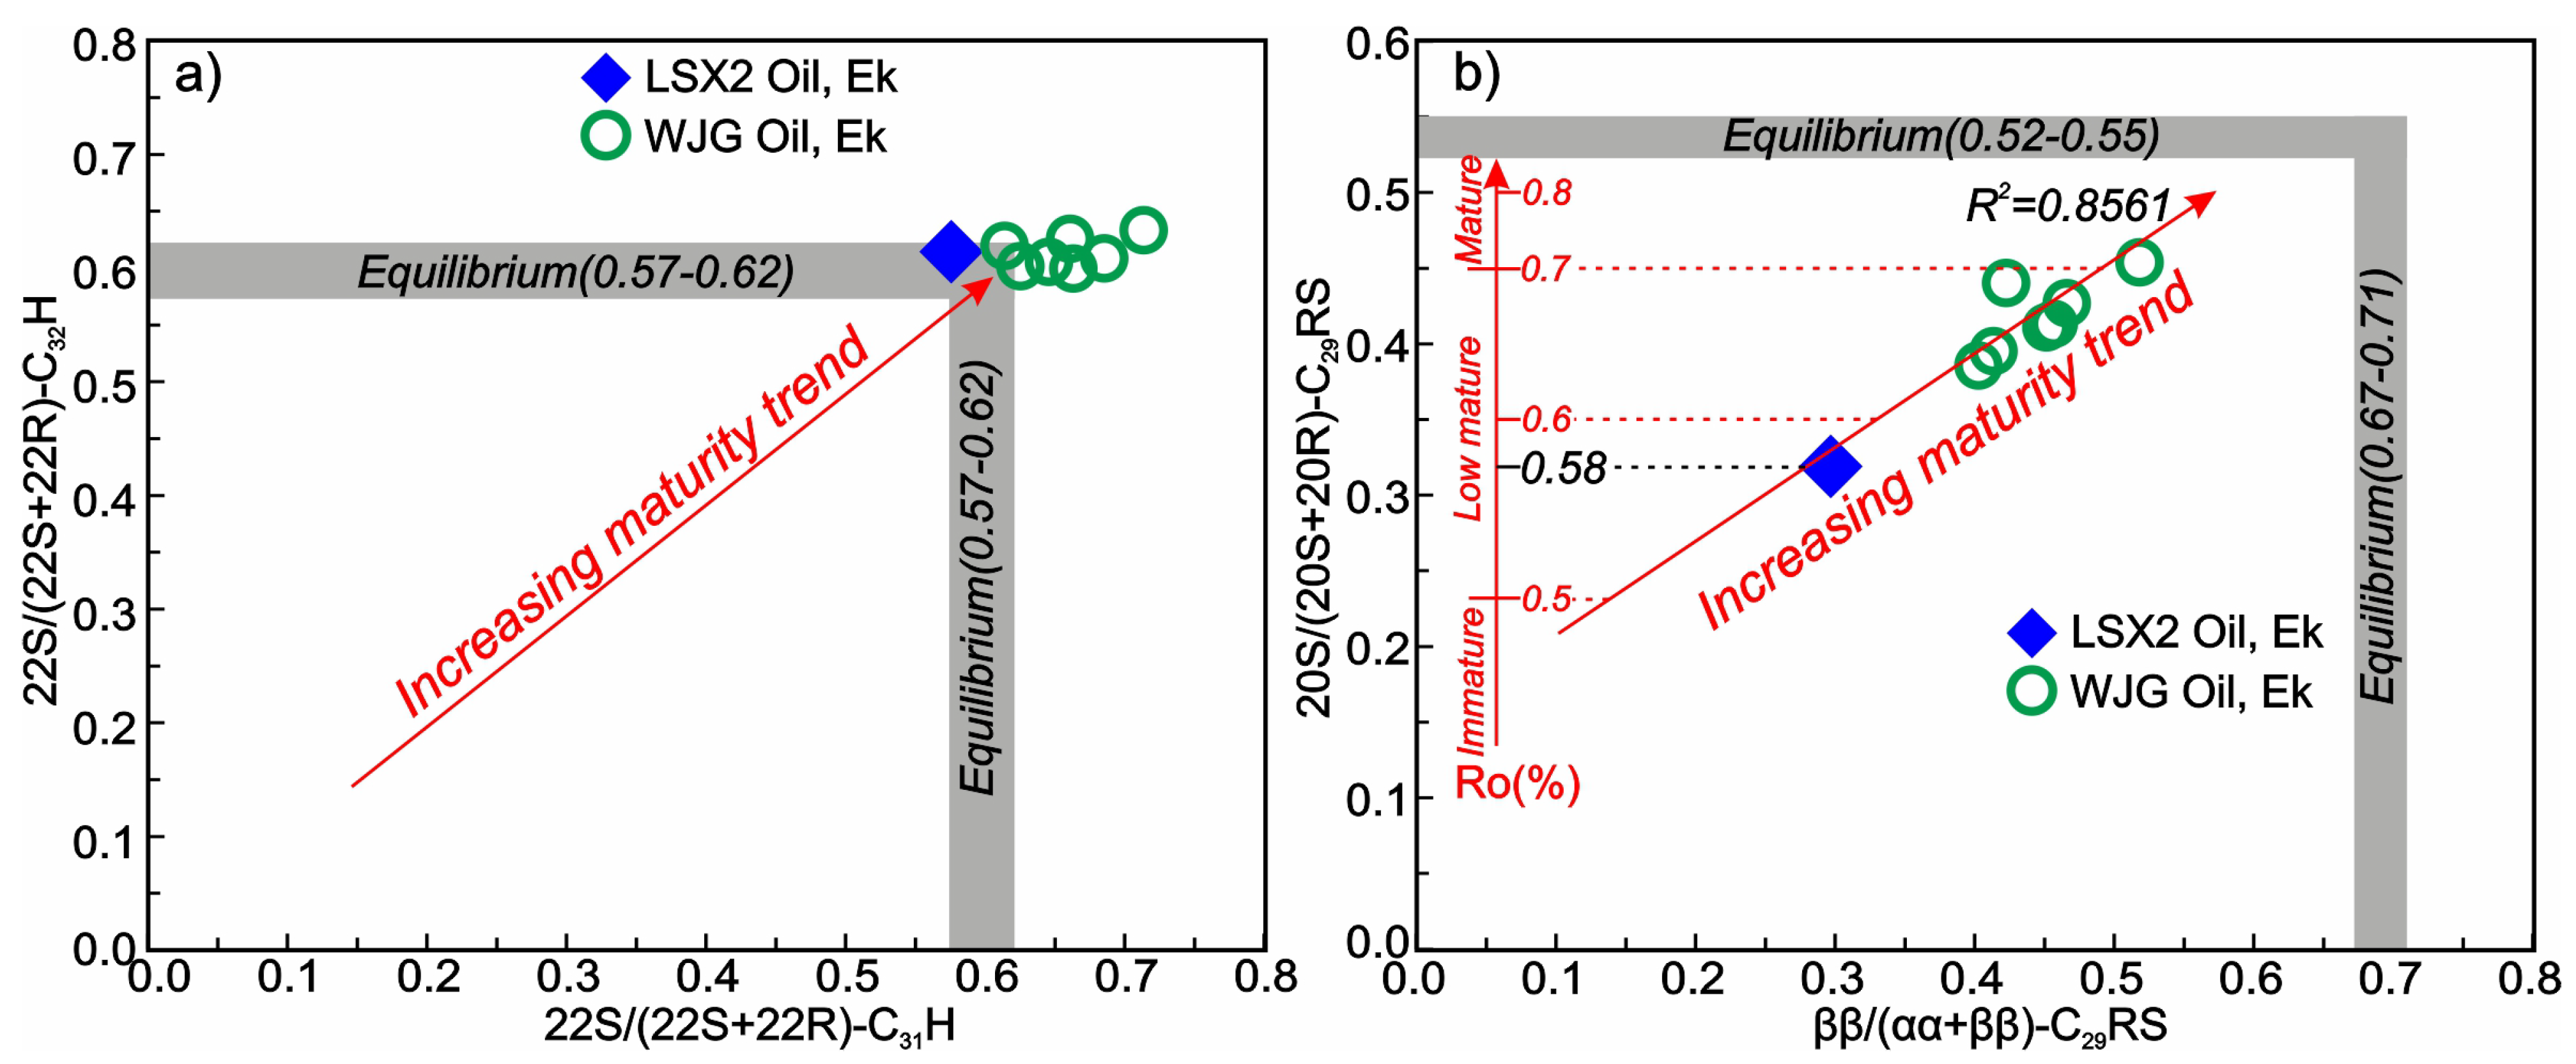
Since the biogenic precursor 22R isomer of C31–C35 hopanes is progressively converted to the 22S isomers during the thermal evolution of the source rock, a series of 22S/(22S + 22R) ratios constructed from C31–C35 hopanes is valuable for evaluating thermal maturity [27,28]. In general, the 22S/(22S + 22R) can be increased from 0 to an equilibrium value (0.57–0.62) in the early stage of oil and gas generation [28]. Here, the 22S/(22S + 22R) values calculated from C31 and C32 are 0.58–0.71 and 0.60–0.63, respectively, which reached the equilibrium value (Table 2; Figure 6a). The LSX2 oil sample is just at the equilibrium values of these parameters, which reflects that the LSX2 oil is the product of early oil generation and has a low level of maturity.
Figure 6.
Cross-plots inferring the thermal maturity of the studied oil samples. (a) 22S/(22S + 22R)-C31H vs. 22S/(22S + 22R)-C32H [28]; (b) ββ/(ββ + αα)-C29RS vs. 20S/(20S + 20R)-C29RS (reconstructed from [16,29,30].
Similar to C31–C35 hopanes, the ββ/(ββ + αα) and 20S/(20S + 20R) derived from different isomers of C29 regular steranes can also indicate thermal maturity and have the advantage of being less sensitive to changes in source rock facies [29,30]. Typically, both parameters increase with thermal maturity and reach equilibrium values (0.67–0.71 and 0.52–0.55, respectively) at the peak of oil generation (%Ro close to 0.9 [29]). As shown in Table 2 and Figure 6b, the ββ/(ββ + αα) and 20S/(20S + 20R) of studied oils are 0.30–0.52 and 0.32–0.45, neither of which has reached the equilibrium values, indicating a low thermal maturity. Moreover, 20S/(20S + 20R) and %Ro are positively correlated when the %Ro is less than 0.8, and the fit tends to be consistent for samples from different regions or basins (Figure 6b). According to this correlation, it can be inferred that the LSX2 oil sample corresponds to a %Ro of 0.58, while the %Ro of WJG oils is 0.62 to 0.72 (Figure 6b).
5.2.2. Sedimentary Environment
Carotenoids are mainly produced by photosynthetic organisms and include a variety of highly unsaturated C40 compounds. Due to their unsaturation, carotenoids are susceptible to rapid oxidative degradation under oxidizing conditions and are rarely found in sediments [31]; however, under strongly reducing conditions, the carotenoid carbon skeleton can be preserved in the sediment, forming fully saturated compounds such as β-carotene [32,33,34]. Its abundant presence in crude oil or sediment often suggests reducing, saline, constrained marine environments [35,36]. As shown in Figure 4b1–b4, abundant β-carotene was detected in all the studied oil samples. Considering that the Bohai Bay basin is a typical lacustrine basin, this result suggests a reducing and saline environment.
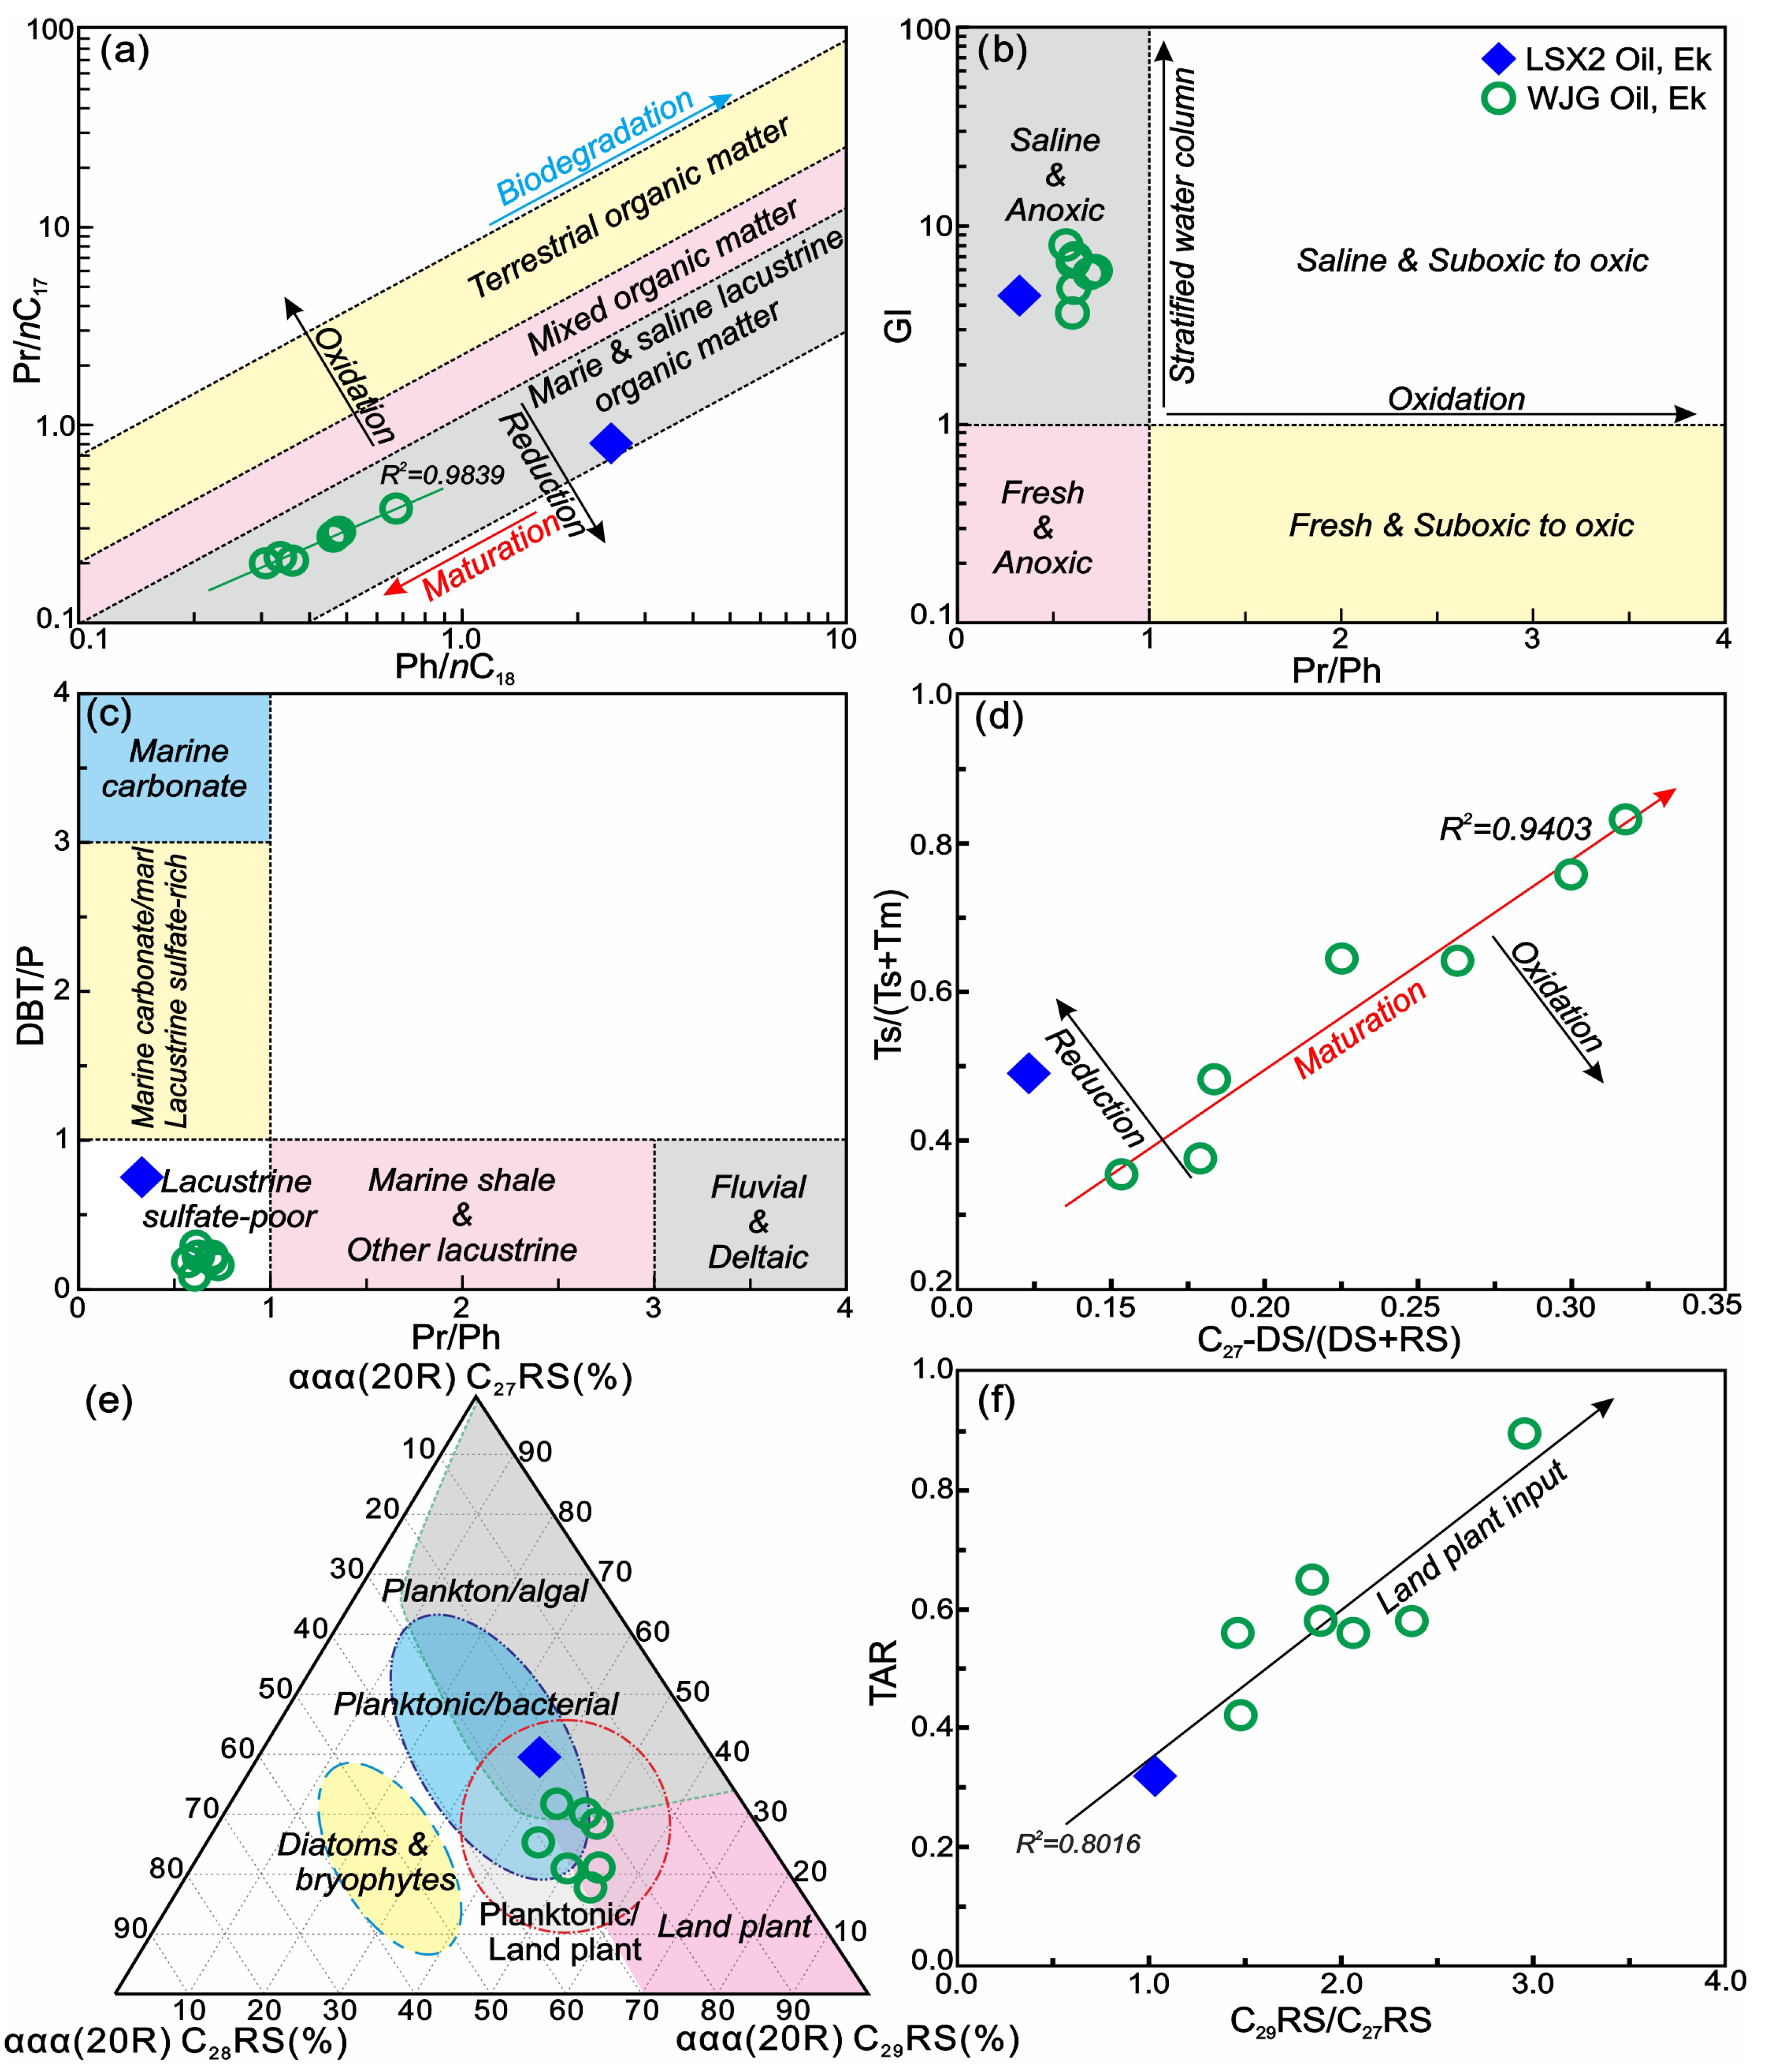
There is a common use of the cross-plot constructed by Pr/nC17 and Ph/nC18 to distinguish the pelo-environment and organic matter types, although maturity and biodegradation affect both [37]. Here, the oils are situated in the reduction/saline lacustrine organic matter zone (Figure 7a). In general, Pr/Ph > 1.0 indicates a suboxic to oxic environment, <1.0 indicates an anoxic environment, and < 0.8 reflects an intense anoxic condition, usually hypersaline or carbonate environments [38]. This ratio of the studied oils is 0.56–0.72 (Table 2; Figure 7b,c), which also suggests an anoxic and hypersaline environment.
Gammacerane (G) is commonly used to identify the depositional environment, with high levels indicating a reducing and high-salinity environment during deposition [39,40]. For instance, the gammacerane index (GI, 10 × G/(G + C30hopane)) of Angolan crude oil demonstrates an increase, while the Pr/Ph ratio shows a decrease in response to heightened water reduction and salinity during the deposition of source rock [16]. Here, abundance G has been found in the studied oils (Figure 4c1–c4), showing GI values greater than 1.0 (Table 2; Figure 7b), indicating a strongly reducing and salinity setting. The C31–C35 hopane distributions confirm this finding. Typically, the abundance of C31–C35 hopanes in crude oil or organic matter decreases sequentially as the carbon number increases. However, under strongly reducing and high salinity conditions, C35 hopane is preferentially preserved, characterized by elevated content and a high homohopane index (HHI) [41]. Here, elevated C35 homohapanes were observed in all studied samples (Figure 4c1–c4), with high HHI values (Table 2).
FL, DBF, and DBT are a category of heterocyclic aromatic compounds that contain depositional environmental information. They and their alkyl substituents all have a five-membered ring as their basic skeleton and are probably derived from the same precursor [42,43,44]. Typically, organic matter formed in weakly oxidizing to weakly reducing shallow lacustrine and swamp coal-forming environments has a high DBF abundance, while organic matter formed in reducing freshwater to barely saline, deeper lacustrine environments is dominated by FL, and organic matter formed in strongly reducing brackish to saline lacustrine environments is dominated by DBT [43,44]. For the studied oil samples, they are all dominated by DBT, with the relative contents of FL, DBF, and DBT ranging in 0.34~8.7%, 2.40~8.08%, and 71.22~97.27%, respectively (Table 2), suggesting a strongly reducing environment.
Moreover, an intersection plot generated from the combination of DBT/P and Pr/Ph ratios is frequently utilized for the differentiation of source rock facies [42]. Here, oil samples in the intersection plot indicate a lacustrine depositional environment characterized by low sulfur content (Figure 7c). Compared to the WJG oil samples, the LSX2 oil sample reflects relatively high reducing, salinity, and sulfur conditions of the source rocks, as evidenced by its higher abundance of β-carotene (Figure 4b1–b4), higher DBT/P values (Figure 7c), lower Pr/Ph values (Figure 7b,c), higher HHI values (Table 2), and the deviations in the plots of Pr/nC17 versus Ph/nC18 (Figure 7a) and Ts/(Ts + Tm) versus C27-DS/(DS + RS) (Figure 7d).
Figure 7.
Diagrams inferring the sedimentary environments and organic matter input of the studied oil samples. (a) Pr/nC17 vs. Ph/nC18 [37]; (b) Pr/Ph vs. GI; (c) Pr/Ph vs. DBT/P [42]; (d) C27-DS/(DS + RS) vs. Ts/(Ts + Tm) [16]; (e) triangle diagram of αααα(20R)-C27, C28 and C29 RS [45]; (f) TAR vs. C29/C27 RS.
5.2.3. Oil-Source Rock Correlation
The LSX2 reservoir is developed inside the Ek2, WJG reservoirs are distributed at the bottom of the Ek1, and the upper part of these reservoirs is covered by the thick Ek1 strata (Figure 3). Thereby, the oil and gas in these reservoirs can only come from the Ek2 source rock.
Precursors of C27 RS in organic matter are reported to be primarily generated from phytoplankton and some algae, whereas precursors of C28 RS and C29 RS are primarily derived from phytoplankton (e.g., diatoms and red algae) and land plants, respectively [16,45]. Huang and Meinschein [45] constructed a triangular diagram using αααα(20R)-C27, C28, and C29 RS to recognize the organic matter input. In this study, oil samples are distributed within a mixed region of plankton/bacteria and land plants in the triangular diagram (Figure 7e), indicating a joint contribution of plankton/bacteria and land plants. However, the LSX2 oil sample exhibits higher amounts of C27 RS and a lower value of C29/C27 RS than the WJG oil samples (Figure 7f), suggesting that the LSX2 oil sample has less land plant input. This finding is supported by the distribution of terrestrial to aquatic ratios (TAR, (nC27 + nC29 + nC31)/(nC15 + nC17 + nC19)). In general, nC27, nC29, and nC31 are mainly derived from land plants, while nC15, nC17, and nC19 are mainly sourced from aquatic organisms such as plankton, bacteria, and algae [16,46]. As a result, the greater the terrestrial plant input, the greater the TAR rate. Here, the TAR value of the LSX2 oil (0.32) is lower than that of the WJG oil samples (0.42–0.90) (Figure 7f), also indicating a lesser contribution of the land plants.
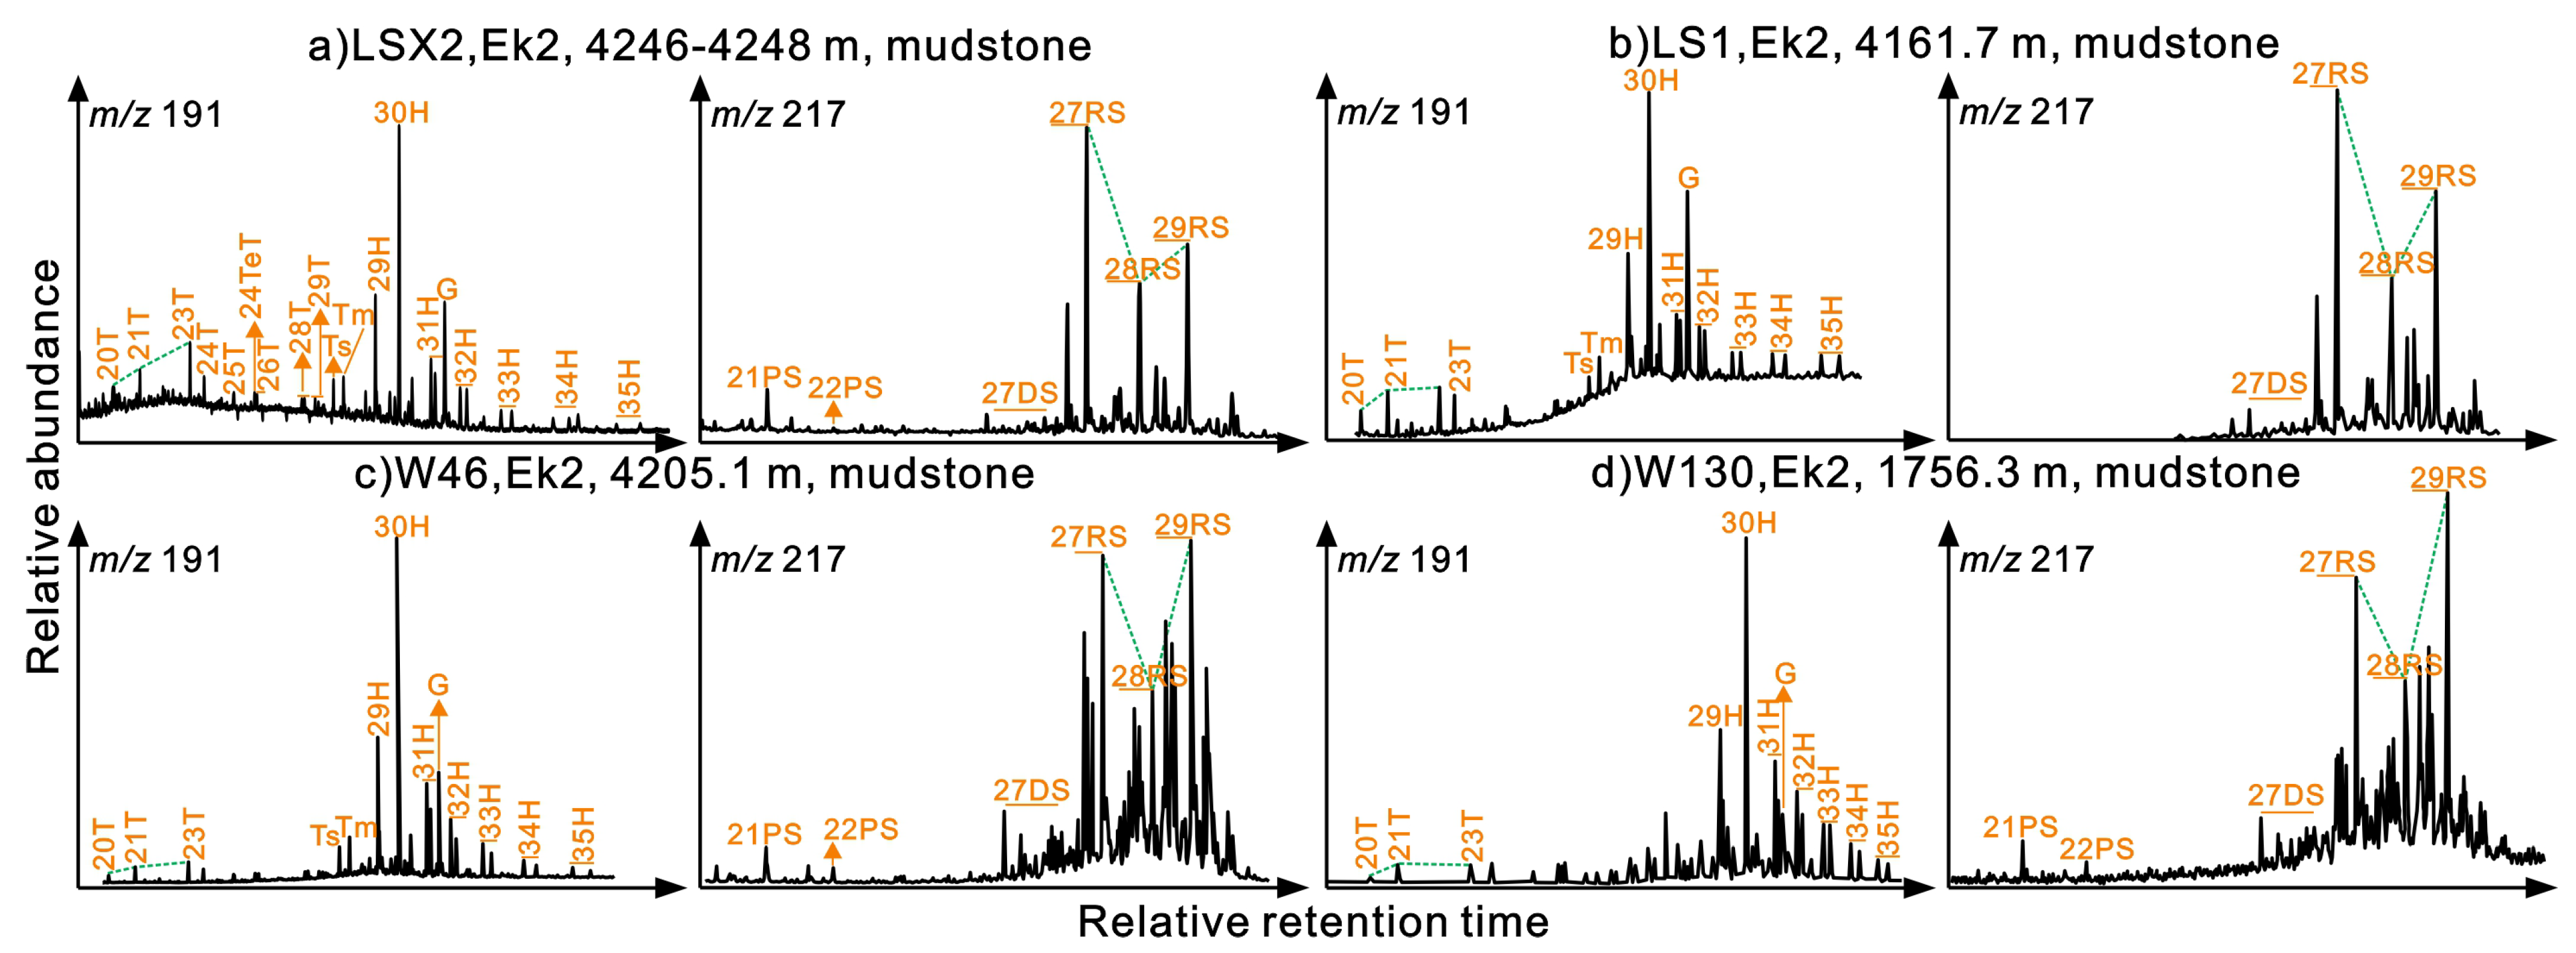
Therefore, from the perspective of geochemical characteristics, the LSX2 oil reflects a more reductive and higher sulfur setting compared to the WJG oils, and it has a relatively low percentage of land plant input, suggesting that there are differences in the source rock facies of the LSX2 and WJG oil samples. This phenomenon is caused by the inhomogeneity of the Ek2 source rocks. As shown in Figure 4 and Figure 8, the WJG oil samples and their in situ Ek2 source rocks (e.g., wells W46 and W130) are well correlated, with both regular steranes dominated by C29 regular steranes; the biomarker of the LSX2 oil sample is correlated to its in situ Ek2 source rocks (e.g., LSX2 and LS1 wells), with the regular steranes being both dominated by C27 regular steranes, but differ from the WJG oil samples and mudstone samples. Moreover, the wide distribution of pyrite, gypsum, and oil bitumen in the Ek2 mudstone of this well indicates its highly reducing, salinity, and sulfur-bearing environment and its capacity to produce oil. In conclusion, LSX2 deep heavy oil originated primarily from in situ Ek2 source rocks.
Figure 8.
Chromatograms showing the distributions of terpanes (m/z 191) and steranes (m/z 217) in the Ek2 source rocks. The name for the peaks is consistent with Figure 4.
5.3. Alteration of Petroleum Reservoirs
5.3.1. Biodegradation and TSR
Biodegradation is the most important and common factor that thickens crude oil [47,48]. Previous studies (e.g., [49,50,51]) have shown that the damage to molecular markers in oil by biodegradation is a quasi-stepwise sequence in which n-alkanes are degraded first, leading to a rise in the whole-oil GC baseline and the presence of an unresolved complex mixture (UCM). As shown in Figure 4a1–a4, the GC of crude oil samples generally shows a stable baseline and no noticeable “UCM”, indicating that they have not been subjected to biodegradation.
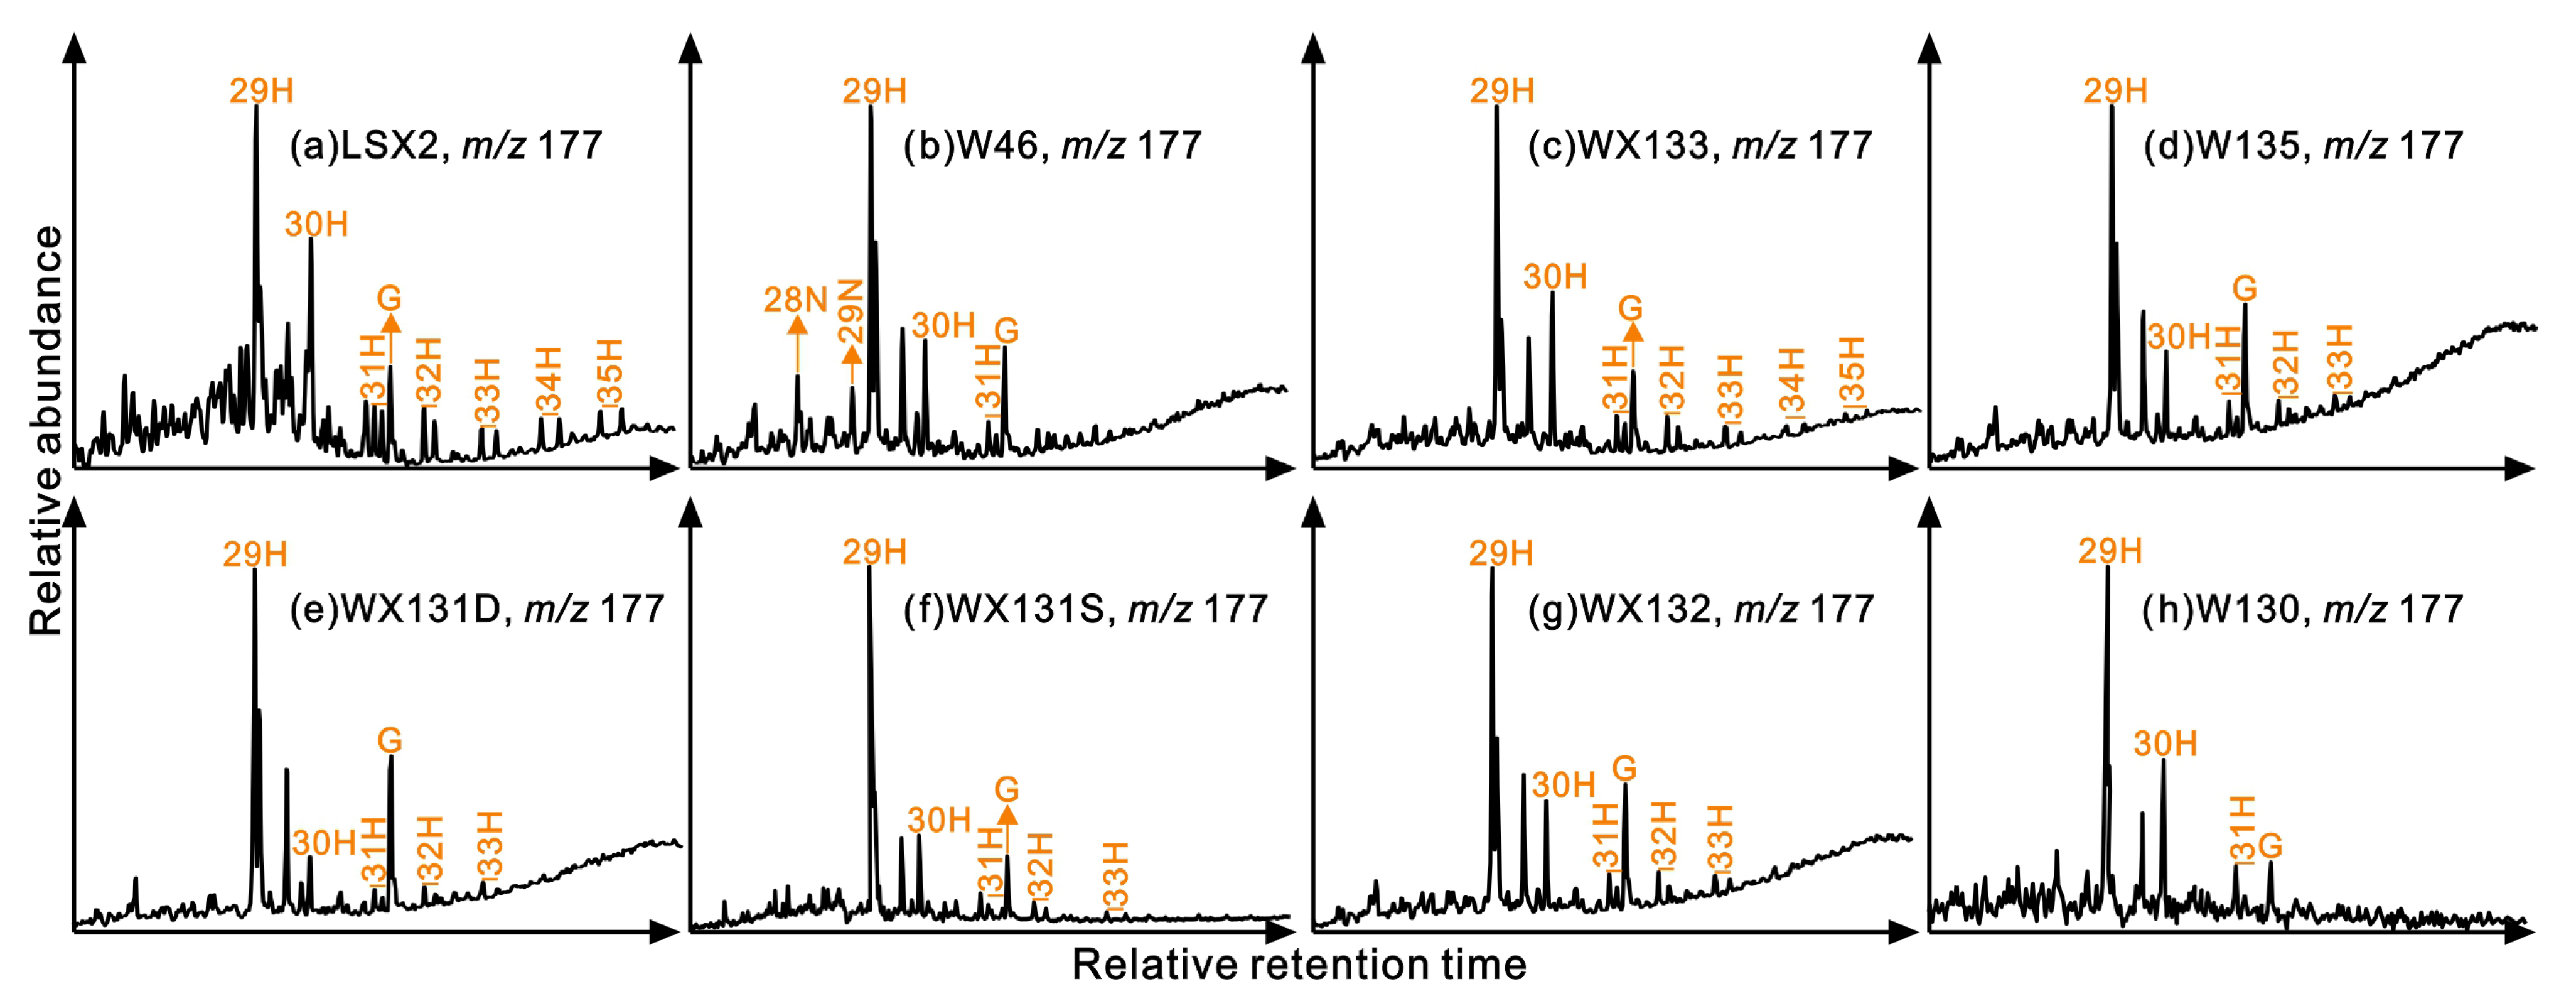
The 25-norhopanes are considered biodegradation signatures [49]. In general, undegraded and slightly degraded crude oils have no 25-norhopane compounds, while severely biodegraded crude oils have a complete series of 25-norhopane compounds from C26–34 [39]. Here, with the exception of the W46 oil, no 25-norhopane compounds were detected in other studied oils (Figure 9), indicating that these samples were generally not subjected to biodegradation. The 25-norhopanes occur after the complete destruction of n-alkanes [16]; however, both 25-norhopanes and n-alkanes were detected in the W46 well oil sample. This phenomenon was considered to be a result of the mixing of later-charged fresh oil with early-charged biodegraded oil [11,52,53]. Specifically, for the heavy crude oil from the LSX2 well, the whole-oil GC shows a stable baseline (Figure 4a1). The most biodegradable low-carbon-number n-alkanes are widely present, and no 25-norhopanes are detectable in the m/z 177 mass chromatogram (Figure 9a). These lines of evidence collectively indicate that the oil has not undergone significant biodegradation during its geological history.
Figure 9.
Mass chromatograms showing the distributions of 25-norhopanes (NH) in the oil samples.
Thermal sulfate reduction (TSR) occurs when hydrocarbons react with inorganic sulfate minerals at high temperatures. This action can alter the chemical composition of hydrocarbons and produce the toxic gas H2S [54,55,56,57]. Mango [58] defined a light hydrocarbon parameter K1 (see Table 2 for definition) and found a K1 value close to 1.0 based on measurements of around 2000 oil samples. However, TSR can significantly increase the K1 values [59,60], with examples of oils from the WCSB Brazeau River [59] and Tazhong-4 oils in the Tarim Basin [60]. Here, the K1 values for the studied oils are close to 1.0 (0.98–1.05) (Table 2), indicating that these crude oils have not been subjected to TSR. The fact that no H2S was detected in the LSX2 gas supports this understanding.
5.3.2. Phase Fractionation
Phase fractionation is a complex process of separating the gaseous and liquid phases in reservoirs, which often occurs during reservoir uplift, fault movement, or substantial gas recharging [61,62,63,64,65,66,67]. When this action occurs, the easily soluble light components of the liquid can escape from the reservoir with the gas and dissipate or re-accumulate into a shallower layer; thus, the original oil becomes heavier due to the loss of light components [63,65,67].
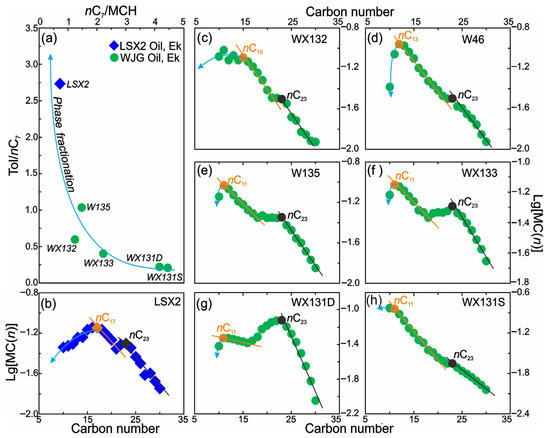
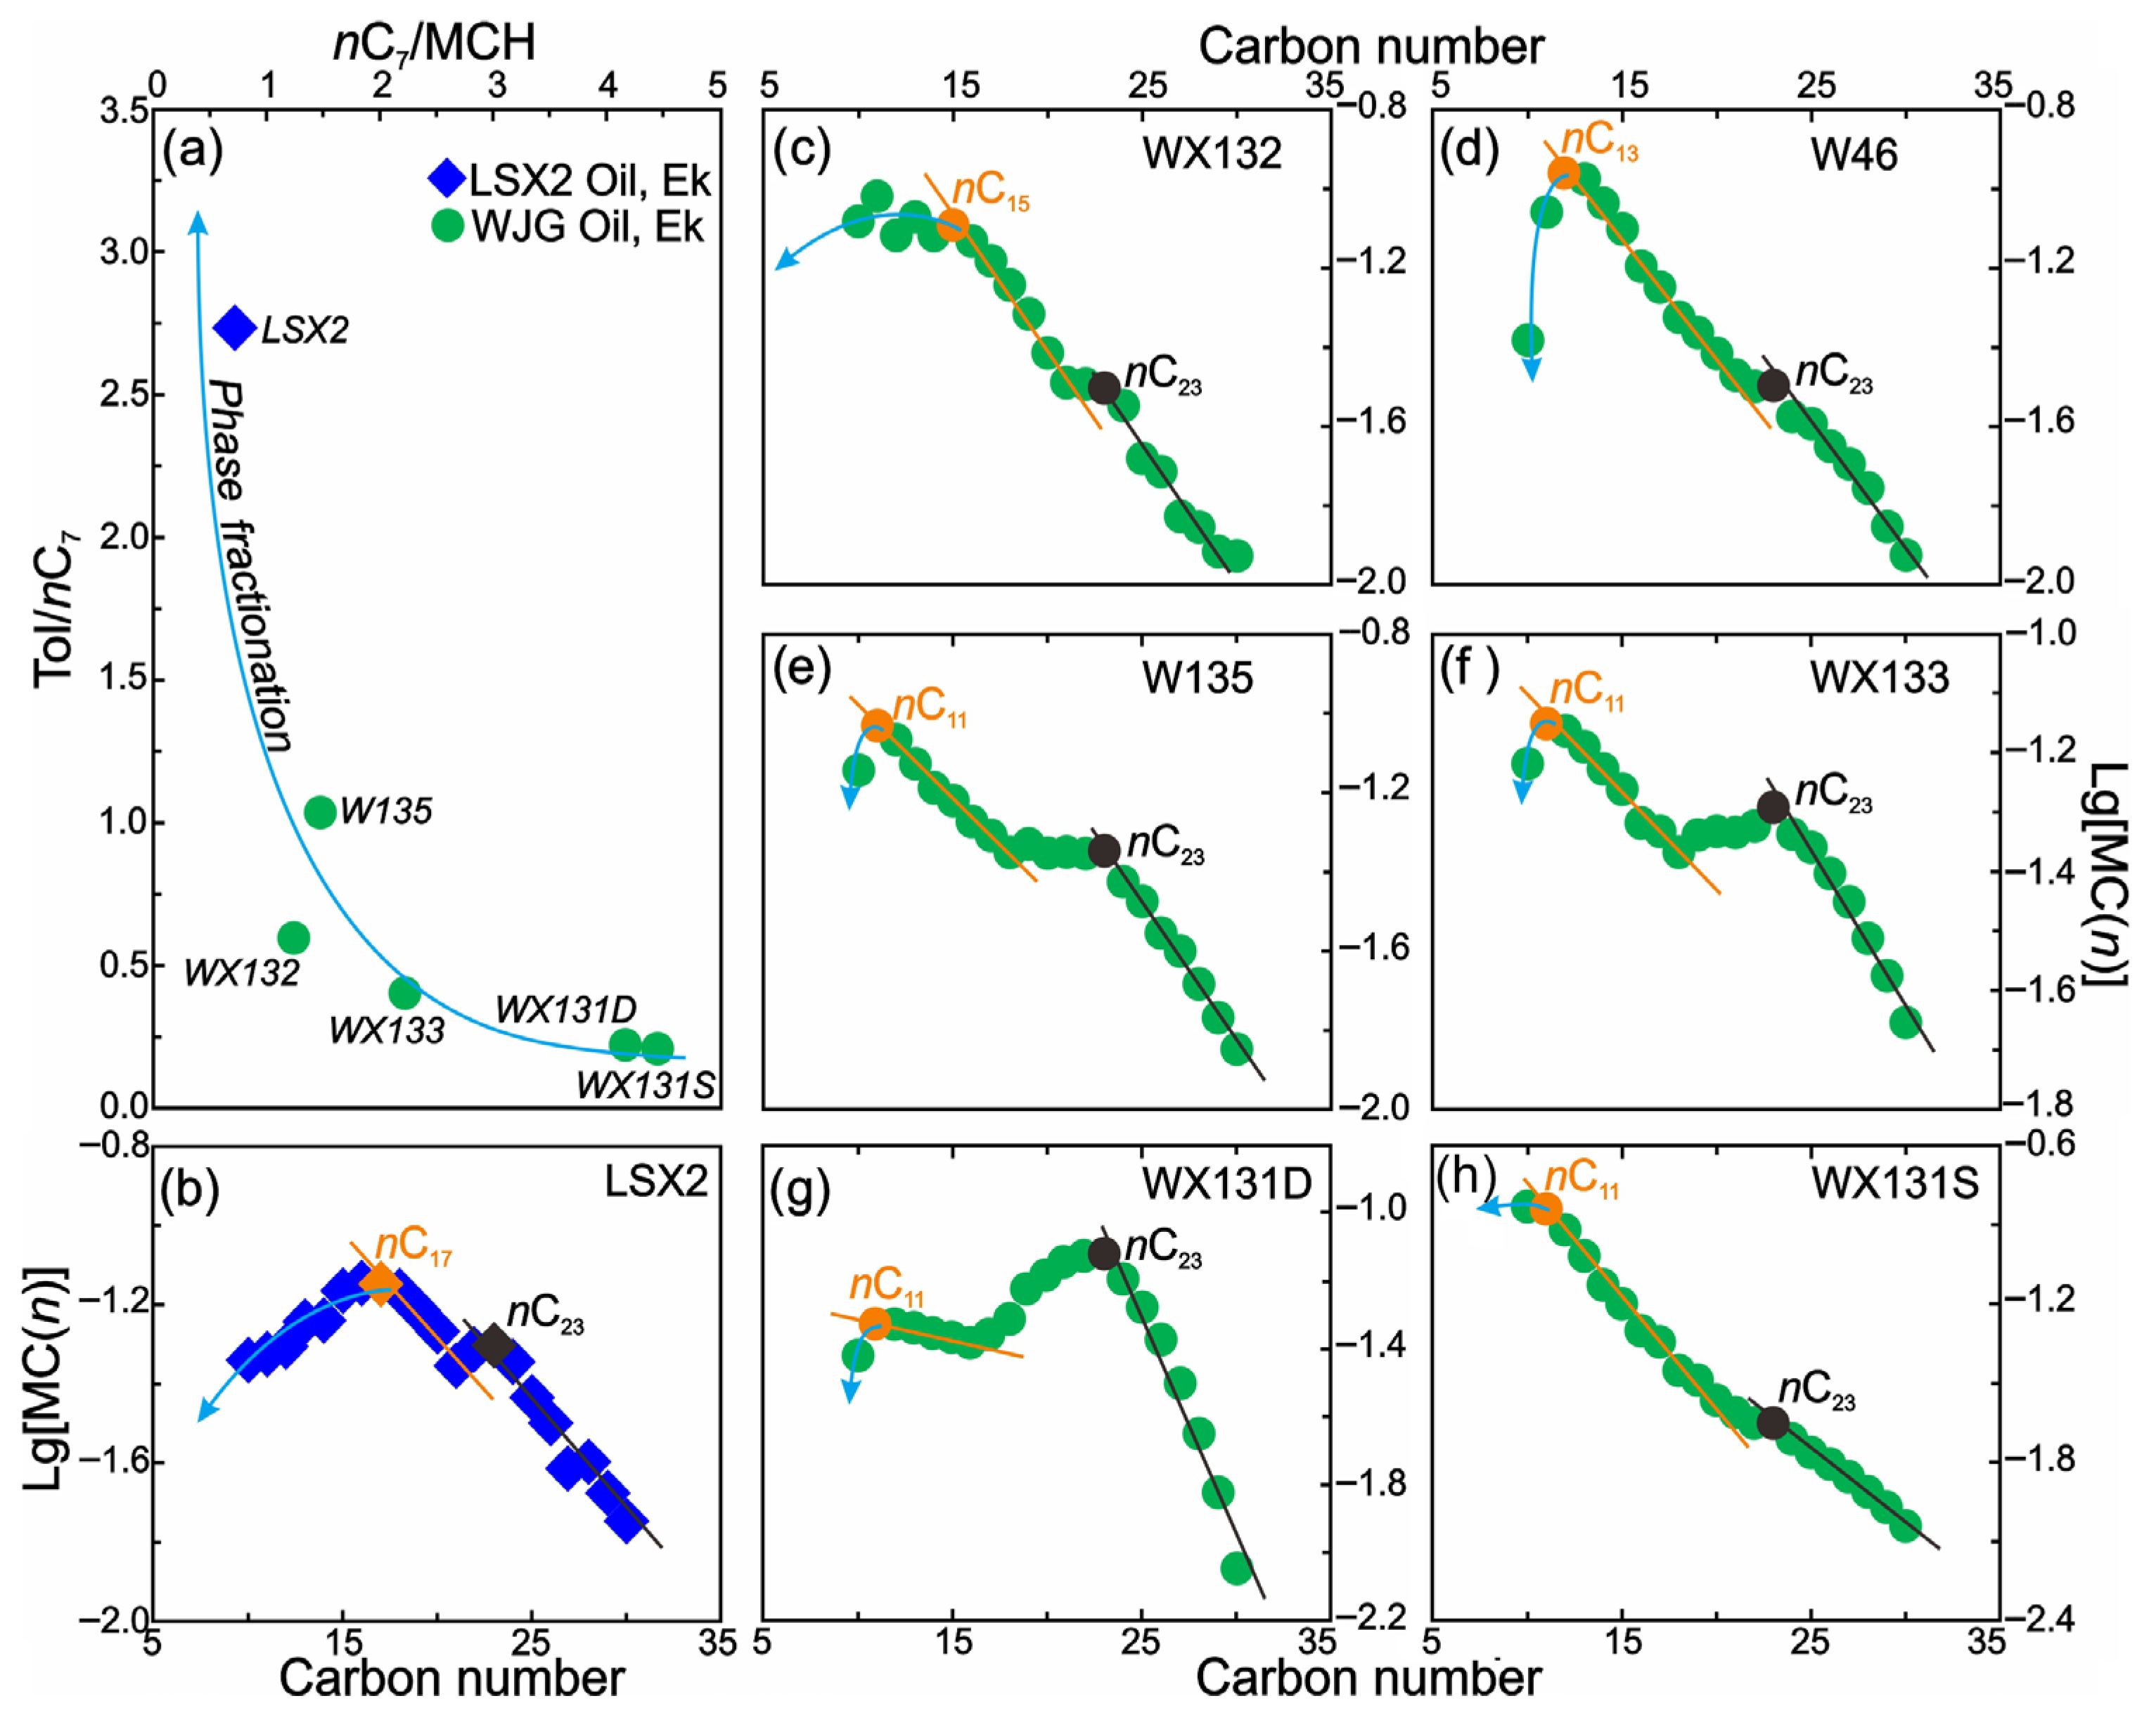
Previous studies have shown that phase fractionation affects n-alkanes in light hydrocarbons to a greater extent than aromatics and cycloalkanes [61]. As the degree of phase fractionation increases, the light hydrocarbon parameters n-heptane/methylcyclohexane (nC7/MCH) decrease, while toluene/n-heptane (Tol/nC7) and (m + p)-xylene/n-octane ((m + p)-Xyl/nC7) increase [61]. As shown in Figure 10a, the crossplot of nC7/MCH and Tol/nC7 in the crude oil samples indicates that they suffered from different degrees of phase fractionation. Moreover, the Tol/nC7 and (m + p)-Xyl/nC7 values of the LSX2 oil sample are much higher than those of other samples, indicating that it suffered from serious phase fractionation, while other oils only suffered mild or limited effects of phase fractionation.
Figure 10.
Diagrams showing the differential phase fractionation of the oil samples. (a) nC7/MCH vs. Tol/nC7 [61]; (b–h) log of molar concentration of n-alkanes vs. carbon numbers.
The distribution patterns of n-alkane molar concentrations also indicate that they are affected by differential phase fractionation. Typically, an unaltered crude oil’s log of n-alkane molar concentration (Lg [MC(n)]) is linearly related to its carbon number [68]. However, crude oils that undergo phase fractionation suffer a loss of light n-alkanes, causing their Lg [MC(n)] to deviate from the typical linear correlation [67]. Here, the Lg [MC(n)] in the studied oils show different deviations at low carbon numbers and are most significant for the LSX2 oil sample, indicating that they were altered by phase fractionation (Figure 10b–h). Unusually, the Lg [MC(n)] of the oil samples also shows deviations at medium carbon numbers, with deviations all occurring at nC23 (Figure 10b–h). This phenomenon may be related to the double organic matter input of planktonic and land plants, given that it corresponds to the bimodal distribution of n-alkanes (Figure 4a1–a4).
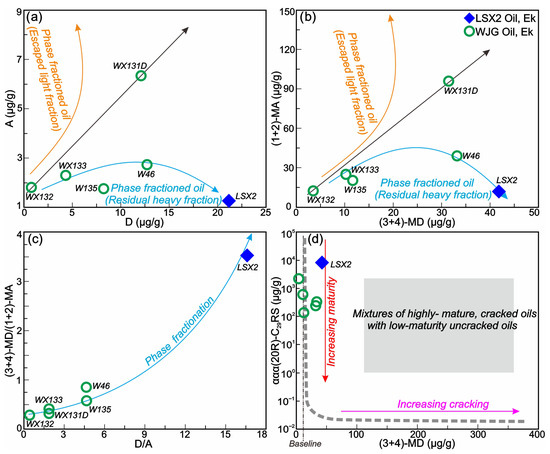
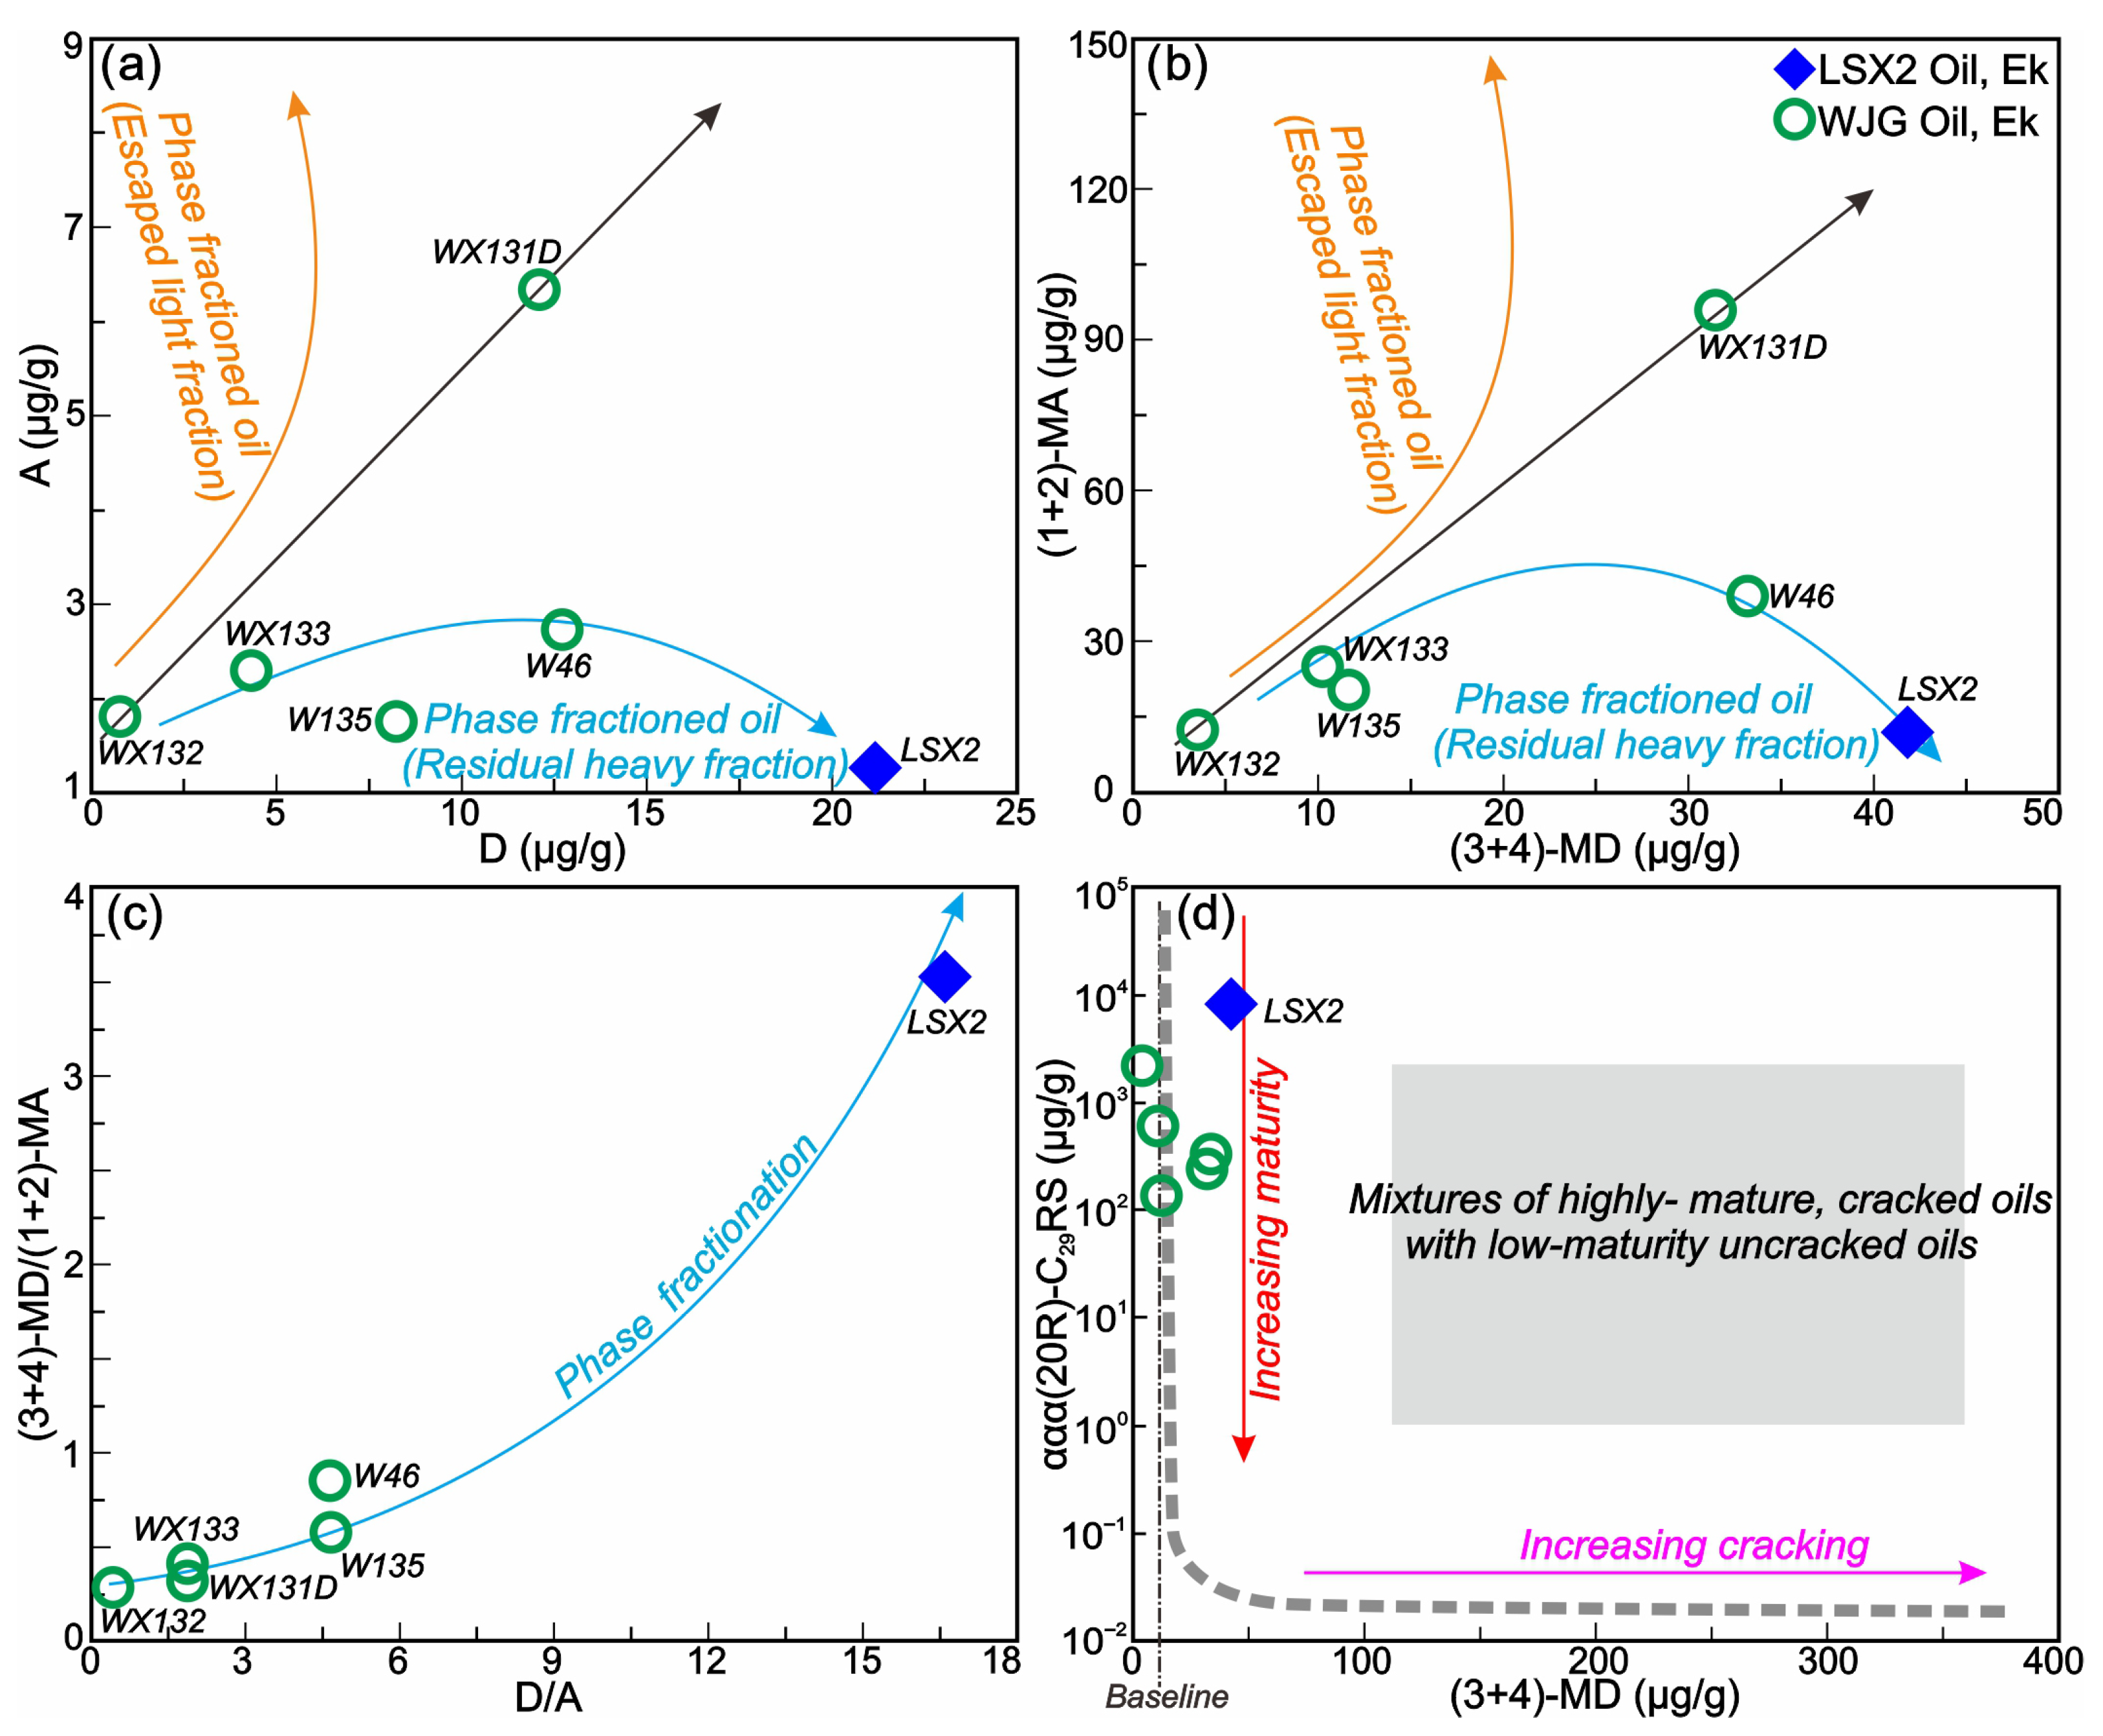
Moreover, several recent studies have shown that phase fractionation affects the components of diamondoids [69,70,71,72,73]. Generally, adamantane (A) and methyladamantane (MA) with carbon numbers of 10 and 11 are sensitive to phase fractionation because of their small molecular weight and easy solubility in gases; on the contrary, diadamantane (D) and methyladamantane (MD) are resistant to phase fractionation due to their large molecules with carbon numbers of 14 and 15. For examples, Moldowan et al. [74] observed that the residual fraction after phase fractionation is enriched in (3 + 4)-MD, while the escaping light fraction is relatively enriched in (1 + 2)-MA; based on the PVT experiments of petroleum fluid, Chakhmakhchev et al. [75] found that smaller molecules (e.g., A and MA) tend to be enriched in the gas phase, while heavier molecules (e.g., D and MD) tend to be enriched in the liquid phase. Here, some of the oil samples are enriched in heavier D and (3 + 4)-MD with high values of D/A and (3 + 4)-MD/(1 + 2)-MA (Figure 11a–c), indicating that they suffer from phase fractionation, which is more intense in the LSX2 oil sample.
Figure 11.
Two cross-plots based on diamondoid parameters indicate the differential phase fractionation but no thermal cracking of the studied oil samples. (a) A concentration vs. D concentration; (b) (1 + 2)-MA concentration vs. (3 + 4)-MD concentration [74]; (c) D/A vs. (3 + 4)-MD/(1 + 2)-MA; (d) (3 + 4)-MD concentration vs. ααα(20R)-C29 RS concentration [76].
5.3.3. Thermal Cracking
Thermal cracking is a process in which high reservoir temperatures cause the conversion of large molecules to small molecules in hydrocarbons, finally producing gas and solid bitumen [76,77,78]. Generally, crude oil that has experienced thermal cracking loses large molecular components. For example, hopanes and steranes are missing in large amounts in slightly cracked oil in the Shunbei and Minfeng oilfields [5,18,72]. Here, the oil samples contain a full series of n-alkanes, hopane, and sterane compounds, and even the high carbon number of C31–C35 hopane was clearly detected (Figure 4), indicating that they are not remarkably subjected to thermal cracking.
Unlike most other hydrocarbons, diamondoids are highly stable and resistant to thermal stress, so they are widely employed to define the level of thermal cracking [72,74,76]. Based on thermal simulation experiments and oil sample observations, Dahl et al. [76] found that the contents of ααα(20R)-C29 RS gradually decreased with increasing thermal maturity and could even approach 0 μg/g during the intense thermal cracking stage; in contrast, the concentration of (3 + 4)-MD was basically constant with increasing thermal maturity and increased during the thermal cracking stage (Figure 11d). Here, the ααα(20R)-C29 RS and (3 + 4)-MD concentrations in these oils are 138.81–8394.22 μg/g and 3.49–41.81 (Table 2; Figure 11d). In addition, the (3 + 4)-MD in most oil samples has been increased by phase fractionation (Figure 11b), whereas the original concentration of these oils is even lower. Thus, the high ααα(20R)-C29 RS concentration and low original (3 + 4)-MD concentrations suggest that these oil samples are not subjected to thermal cracking.
5.4. Preservation of the Deep Heavy Oil
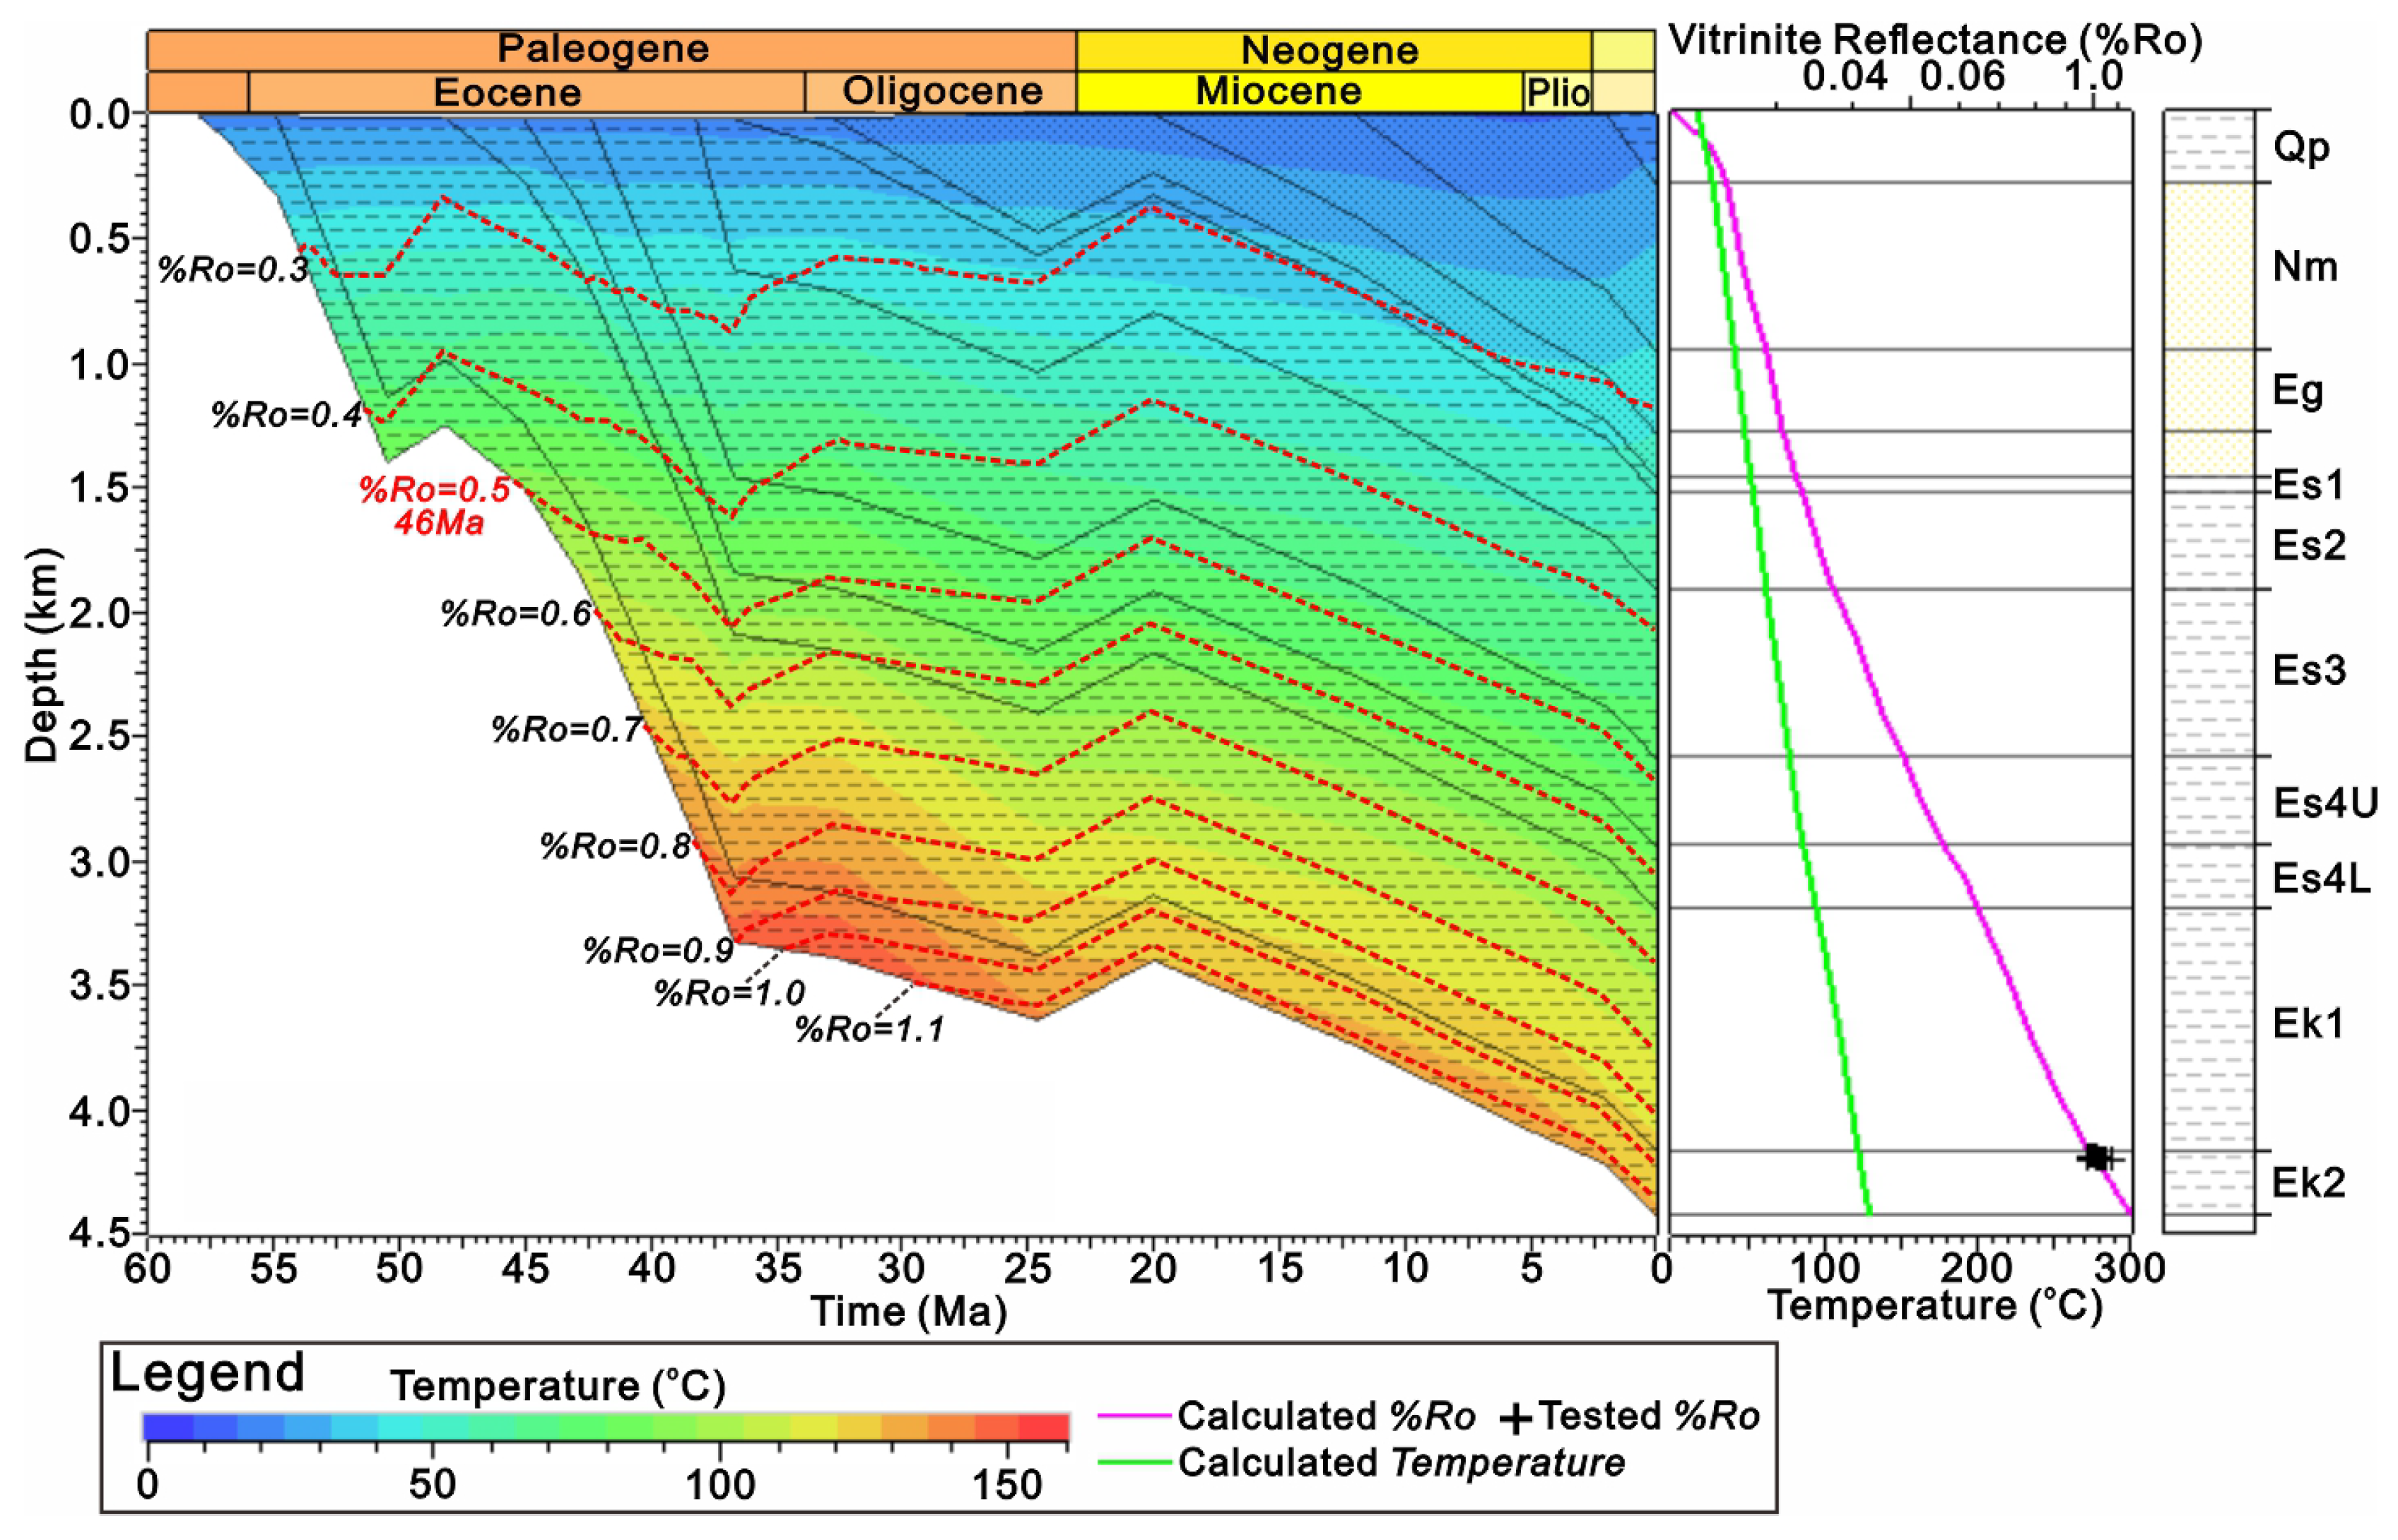
The burial and thermal history of well LSX2 was simulated using BasinMod 2016, constrained by the measured Ro. The paleo water depth, paleo surface temperature, and paleo thermal flow refer to Wu et al. [79] and Wang et al. [80]. As shown in Figure 12, the burial and thermal history simulation results show that the in situ Ek2 source rocks have reached the hydrocarbon generation thresholds (%Ro close to 0.5) in 46 Ma. Given that the hydrocarbon accumulation period is consistent with or later than the generation period, the hydrocarbon accumulation period of LSX2 low-maturity oil is not earlier than 46 Ma. In addition, it can be found that the temperature of EK2 formation in the LSX2 well was 90–150 °C during 46~0 Ma (Figure 12). This temperature is above the upper limit for microbial activity (<80 °C, [15,16,49,50,51]), but below the lower limit of thermal cracking (>160 °C, [5,10,11,12,18,81,82]). Therefore, the LSX2 reservoir does not have a suitable temperature for biodegradation and thermal cracking.
Figure 12.
Simulated burial and thermal history of well LSX2 using PetroMod 2016.2 constrained by the measured Ro. Calculated %Ro and Temperature: Vitrinite reflectance (%Ro) and temperature values simulated using PetroMod 2016.2; Tested %Ro: Measured %Ro data from shale samples.
In contrast, the temperature of the Ek2 formation closer to the center of Niuzhuang sag is higher, which in the SK1 well can be up to 220 °C with a %Ro of about 4.1 [9] This high temperature enables the thermal cracking of crude oil to produce massive amounts of natural gas, which is the source of crude oil cracking gases in the LSX2 reservoir. On the other hand, the recharging of these ex situ thermal cracking gases disrupted the phase balance of the original reservoir, and some excessive gases escaped to carry away the light components of crude oil, leading to phase fractionation and further thickening of the original low-maturity crude oil.
6. Conclusions
(1) The LSX2 deep gas is derived from sapropelic-type kerogen and is a mixture of mature kerogen degradation gas and over-mature oil cracking gas, but primarily ex situ oil cracking gas. The components of gas generated at different thermal evolution stages are varied, and the great difference in maturity inferred from C7 and C1–3 hydrocarbons can be used as evidence of gas mixing.
(2) The LSX2 deep heavy oil is primarily generated from the in situ Ek2 source rocks at a low maturity stage (%Ro close to 0.58). The source rocks of the oil are formed in a saline, reducing, and sulfate-poor environment, and their organic matter is from plankton/bacterial and land plants.
(3) The LSX2 deep oil and gas reservoir was not subjected to TSR, biodegradation, or thermal cracking, but it was altered by phase fractionation. The phase fractionation of the reservoir is caused by the late charging of ex situ oil cracking gas.
(4) The formation of LSX2 deep heavy oil is associated with its low maturity and is further thickened at a later stage due to phase differentiation. The moderate reservoir temperature (90–150 °C) after charging performs a key role in the preservation of LSX2 deep heavy oil by inhibiting both biodegradation and thermal cracking.
Notably, this study integrated available samples of natural gas, crude oil, and source rock to systematically analyze bulk composition, light hydrocarbons, adamantanes, biomarkers, and aromatic compounds. These multi-parameter data collectively elucidate the heterogeneous depositional environment and organic matter input of the Ek2 formation, clarify the origin of the heavy oil, and offer practical insights for further exploration. It should be noted, however, that current sampling is limited by the small number of wells penetrating the Ek2 interval. Future work will require additional samples from new drillings to further test and validate these findings.
Author Contributions
Conceptualization, Z.C. (Zhonghong Chen); methodology, Y.Z.; software, W.M.; validation, L.W., S.F. and Z.C. (Zhi Chai); formal analysis, Z.C. (Zhonghong Chen); investigation, L.W.; resources, Z.C. (Zhi Chai); data curation, Y.Z.; writing—original draft preparation, L.W.; writing—review and editing, Y.Z. and Z.C. (Zhi Chai); visualization, L.W.; supervision, Z.C. (Zhi Chai); project administration, Z.C. (Zhonghong Chen); funding acquisition, Z.C. (Zhonghong Chen). All authors have read and agreed to the published version of the manuscript.
Funding
This work was funded by the National Natural Science Foundations of China (Grant No. 42430808).
Data Availability Statement
The data presented in this study are available on request from the corresponding author.
Acknowledgments
The authors greatly appreciate the editors and reviewers for their constructive comments.
Conflicts of Interest
Authors Yuchen Zhang, Wenzhong Ma, Shengbin Feng were employed by the company Research Institute of Exploration and Development, Petrochina Changqing Oilfield Company. The remaining authors declare that the research was conducted in the absence of any commercial or financial relationships that could be construed as a potential conflict of interes.
References
- Cui, L.; Jian, S.; Zhang, B.; Xie, X.; Li, L. Distribution of Mid-deeply Buried Sand-bodies and their Hydrocarbon Significance at Basin Margins: Case Study of the Paleogene in the Eastern Liuzan Area of the Nanpu Sag, Bohai Bay Basin, China. Acta Geol. Sin.-Engl. Ed. 2021, 95, 1279–1294. [Google Scholar] [CrossRef] [Scilit]
- Chen, Z.; Qiao, R.; Li, C.; Wang, D.; Gao, Y. Hydrocarbon generation potential and model of the deep lacustrine source rocks in the Dongying Depression, Bohai Bay Basin. Mar. Petrol. Geol. 2022, 140, 105656. [Google Scholar] [CrossRef] [Scilit]
- Xu, C.; Yu, H.; Wang, J.; Liu, X. Formation conditions and accumulation characteristics of Bozhong 19-6 large condensate gas field in offshore Bohai Bay Basin. Petrol. Explor. Dev. 2019, 46, 27–40. [Google Scholar] [CrossRef] [Scilit]
- Feng, W.; Wang, F.; Jiang, T.; Zhao, X.; Guan, J.; Ma, X.; Wang, Y.; Yan, H.; Deng, L. Origin and accumulation of petroleum in deep precambrian reservoir in Baxian Sag, Bohai Bay Basin, China. Mar. Petrol. Geol. 2020, 120, 104541. [Google Scholar] [CrossRef] [Scilit]
- Qiao, R.; Chen, Z.; Li, C.; Wang, D.; Gao, Y.; Zhao, L.; Li, Y.; Liu, J. Geochemistry and accumulation of petroleum in deep lacustrine reservoirs: A case study of Dongying Depression, Bohai Bay Basin. J. Petrol. Sci. Eng. 2022, 213, 110433. [Google Scholar] [CrossRef] [Scilit]
- Qiao, R.; Chen, Z. Petroleum phase evolution at high temperature: A combined study of oil cracking experiment and deep oil in Dongying Depression, eastern China. Fuel 2022, 326, 124978. [Google Scholar] [CrossRef] [Scilit]
- Ping, H.; Chen, H.; Jia, G. Petroleum accumulation in the deeply buried reservoirs in the northern Dongying Depression, Bohai Bay Basin, China: New insights from fluid inclusions, natural gas geochemistry, and 1-D basin modeling. Mar. Petrol. Geol. 2017, 80, 70–93. [Google Scholar] [CrossRef] [Scilit]
- Wang, Y.; Liu, H.; Jiao, H.; Wang, X.; Lu, Z.; Zhao, H.; Liu, J.; Chen, H. Hydrocarbon generation and expulsion potential of Ek2 source rocks in the southern slope of Dongying Sag, Bohai Bay Basin. Geol. Rev. 2022, 68, 2175–2187, (In Chinese with English abstract). [Google Scholar] [CrossRef]
- Yang, H.; Zhang, P.; Qiu, Y.; Gong, J.; Han, T. Deep self-source type hydrocarbon accumulation pattern and exploration practice in Dongying Sag. China Petrol. Explor. 2023, 25, 92–101, (In Chinese with English abstract). [Google Scholar] [CrossRef]
- Chai, Z.; Chen, Z.; Liu, H.; Cao, Z.; Cheng, B.; Wu, Z.; Qu, J. Light hydrocarbons and diamondoids of light oils in deep reservoirs of Shuntuoguole Low Uplift, Tarim Basin: Implication for the evaluation on thermal maturity, secondary alteration and source characteristics. Mar. Petrol. Geol. 2020, 117, 104388. [Google Scholar] [CrossRef] [Scilit]
- Chai, Z.; Chen, Z.; Patience, R.; Wen, Z.; Tang, Y.; Cheng, B.; Li, M.; Luemba, M.; Wu, Z. Light hydrocarbons and diamondoids in deep oil from Tabei of Tarim Basin: Implications on petroleum alteration and mixing. Mar. Petrol. Geol. 2022, 138, 105565. [Google Scholar] [CrossRef] [Scilit]
- Chai, Z.; Chen, Z. Biomarkers, light hydrocarbons, and diamondoids of petroleum in deep reservoirs of the southeast Tabei Uplift, Tarim Basin: Implication for its origin, alteration, and charging direction. Mar. Petrol. Geol. 2023, 147, 106019. [Google Scholar] [CrossRef] [Scilit]
- Zhang, Z.; Wang, H.; Zhu, G.; Sun, C.; Ge, X.; Chi, L. Phase fractionation and oil mixing as contributors to complex petroleum phase in deep strata: A case study from LG7 block in the Tarim Basin, China. Mar. Petrol. Geol. 2022, 140, 105660. [Google Scholar] [CrossRef] [Scilit]
- Zhang, Z.; Zhu, G.; Han, J.; Jiang, S.; Li, J.; Chi, L. Tectono-thermal impacts on the formation of a heavy oil in the eastern Tarim Basin (China): Implications for oil and gas potential. J. Petrol. Sci. Eng. 2022, 208, 109353. [Google Scholar] [CrossRef] [Scilit]
- Zhu, G.; Zhang, Z.; Zhou, X.; Li, T.; Han, J.; Sun, C. The complexity, secondary geochemical process, genetic mechanism and distribution prediction of deep marine oil and gas in the Tarim Basin, China. Earth Sci. Rev. 2019, 198, 102930. [Google Scholar] [CrossRef] [Scilit]
- Peters, K.E.; Walters, C.C.; Moldowan, J.M. The Biomarker Guide; Cambridge University Press: Cambridge, UK, 2005. [Google Scholar] [CrossRef] [Scilit]
- Zhu, G.; Zhang, Z.; Milkov, A.; Zhou, X.; Yang, H.; Han, J. Diamondoids as tracers of late gas charge in oil reservoirs: Example from the Tazhong area, Tarim Basin, China. Fuel 2019, 253, 998–1017. [Google Scholar] [CrossRef] [Scilit]
- Chen, Z.; Chai, Z.; Cheng, B.; Liu, H.; Cao, Y.; Cao, Z.; Qu, J. Geochemistry of highmaturity crude oil and gas from deep reservoirs and their geological significance: A case study on Shuntuoguole low uplift, Tarim Basin, western China. AAPG (Am. Assoc. Pet. Geol.) Bull. 2021, 105, 65–107. [Google Scholar] [CrossRef] [Scilit]
- Song, M.; Wang, Y.; Hao, X.; An, T. Petroleum systems and exploration potential in deep Paleogene of the Dongying Sag, Bohai Bay Basin. Oil Gas Geol. 2021, 42, 1243–1254, (In Chinese with English abstract). [Google Scholar] [CrossRef]
- Thompson, K.F. Classification and thermal history of petroleum based on light hydrocarbons. Geochim. Cosmochim. Acta 1983, 47, 303–316. [Google Scholar] [CrossRef] [Scilit]
- Hu, T.; Ge, B.; Zhang, Y.; Liu, B. The development and application of fingerprint parameters for hydrocarbons absorbed by source rocks and light hydrocarbons in natural gas. Petrol. Geol. Exp. 1990, 12, 375–393, (In Chinese with English abstract). [Google Scholar] [CrossRef]
- Dai, J.; Pei, X.; Qi, H. Natural Gas Geology of China; Petroleum Industry Press: Beijing, China, 1992; pp. 1–280. (In Chinese) [Google Scholar]
- Xie, Z.; Li, Z.; Wei, G.; Li, J.; Wang, D.; Wang, Z.; Dong, C. Experimental research on the potential of sapropelic kerogen degradation gas and discrimination of oil cracking gas. J. Nat. Gas Geosci. 2016, 6, 471–479. [Google Scholar] [CrossRef] [Scilit]
- Li, J.; Li, Z.; Wang, X.; Wang, D.; Xie, Z.; Li, J.; Wang, Y.; Han, Z.; Ma, C.; Wang, Z.; et al. New indexes and charts for genesis identification of multiple natural gases. Petrol. Explor. Dev. 2017, 44, 503–512. [Google Scholar] [CrossRef] [Scilit]
- Wilhelms, A.; Larter, S. Shaken but not always stirred. Impact of petroleum charge mixing on reservoir geochemistry. Geol. Soc. 2004, 237, 27–35. [Google Scholar] [CrossRef] [Scilit]
- Tissot, B.P.; Welte, D.H. Petroleum Formation and Occurrence; Spring: Berlin/Heidelberg, Germany, 1984. [Google Scholar] [CrossRef] [Scilit]
- Ten Haven, H.L.; De Leeuw, J.W.; Peakman, T.M.; Maxwell, J.R. Anomalies in steroid and hopanoid maturity indices. Geochim. Cosmochim. Acta 1986, 50, 853–855. [Google Scholar] [CrossRef] [Scilit]
- Seifert, W.K.; Moldowan, J.M. The effect of thermal stress on source-rock quality as measured by hopane stereochemistry. Phys. Chem. Earth 1980, 12, 229–237. [Google Scholar] [CrossRef] [Scilit]
- Seifert, W.K.; Moldowan, J.M. Use of biological markers in petroleum exploration. In Methods in Geochemistry and Geophysics; Johns, R.B., Ed.; Elsevier: Amsterdam, The Netherlands, 1986; pp. 261–290. [Google Scholar]
- Waples, D.W.; Machihara, T. Application of sterane and triterpane biomarkers in petroleum exploration. Bull. Can. Pet. Geol. 1990, 38, 357–380. [Google Scholar]
- Repeta, D.J. Carotenoid diagenesis in recent marine sediments: II. Degradation of fucoxanthin to loliolide. Geochim. Cosmochim. Acta 1989, 53, 699–707. [Google Scholar] [CrossRef] [Scilit]
- Murphy, S.M.T.J.; McCormick, A.; Eglinton, G. Perhydro-b-carotene in the Green River Shale. Science 1967, 157, 1040–1042. [Google Scholar] [CrossRef] [Scilit] [PubMed]
- Peters, K.E.; Moldowan, J.M.; Driscole, A.R.; Demaison, G.J. Origin of Beatrice oil by co-sourcing from Devonian and Middle Jurassic source rocks, Inner Moray Firth, United Kingdom. AAPG Bull. 1989, 73, 454–471. [Google Scholar] [CrossRef] [Scilit]
- Ding, X.; Gao, C.; Zha, M.; Chen, H.; Su, Y. Depositional environment and factors controlling β-carotane accumulation: A case study from the Jimsar Sag, Junggar Basin, northwestern China. Palaeogeogr. Palaeoclimatol. Palaeoecol. 2017, 485, 833–842. [Google Scholar] [CrossRef] [Scilit]
- Moldowan, J.M.; Seifert, W.K.; Gallegos, E.J. Relationship between petroleum composition and depositional environment of petroleum source rocks. AAPG Bull. 1985, 69, 1255–1268. [Google Scholar] [CrossRef] [Scilit]
- Requejo, A.G.; Allan, J.; Creaney, S.; Gray, N.R.; Cole, K.S. Aryl isoprenoids and diaromatic carotenoids in Paleozoic source rocks and oils from the Western Canada and Williston Basins. Org. Geochem. 1992, 19, 245–264. [Google Scholar] [CrossRef] [Scilit]
- Shanmungam, G. Significance of coniferous rain forests and related organic matter in generating commercial quantities of oil, Gippsland Basin, Australia. AAPG (Am. Assoc. Pet. Geol.) Bull. 1985, 69, 1241–1254. [Google Scholar] [CrossRef] [Scilit]
- Didyk, B.M.; Simoneit, B.R.T.; Brassell, S.T.; Eglinton, G. Organic geochemical indicators of palaeoenvironmental conditions of sedimentation. Nature 1978, 272, 216–222. [Google Scholar] [CrossRef] [Scilit]
- Moldowan, J.M.; McCaffrey, M.A. A novel microbial hydrocarbon degradation pathway revealed by hopane demethylation in a petroleum reservoir. Geochem. Cosmochim. Acta 1995, 59, 1891–1894. [Google Scholar] [CrossRef] [Scilit]
- Fu, J.; Sheng, G.; Peng, P.; Brassell, S.C.; Eglinton, G.; Jiang, J. Peculiarities of salt lake sediments as potential source rocks in China. Org. Geochem. 1986, 10, 119–126. [Google Scholar] [CrossRef] [Scilit]
- Peters, K.E.; Clark, M.E.; Das Gupta, U.; McCaffrey, M.A.; Lee, C.Y. Recognition of an Infracambrian source rock based on biomarkers in the Baghewala-1 oil, India. AAPG Bull. 1995, 79, 1481–1493. [Google Scholar] [CrossRef] [Scilit]
- Hughes, W.B.; Holba, A.G.; Dzou, L.I.P. The ratios of dibenzothiophene to phenanthrene and pristane to phytane as indicators of depositional environment and lithology of petroleum source rocks. Geochim. Cosmochim. Acta 1995, 59, 3581–3598. [Google Scholar] [CrossRef] [Scilit]
- Huang, W.Y.; Meinschein, W.G. Sterols as ecological indicators. Geochim. Cosmochim. Acta 1979, 43, 739–745. [Google Scholar] [CrossRef] [Scilit]
- Asif, M.; Wenger, L.M. Heterocyclic aromatic hydrocarbon distributions in petroleum: A source facies assessment tool. Org. Geochem. 2019, 137, 103896. [Google Scholar] [CrossRef] [Scilit]
- Li, M.; Wang, T.; Zhong, N.; Zhang, W.; Sadik, A.; Li, H. Ternary Diagram of Fluorenes, Dibenzothiophenes and Dibenzofurans: Indicating Depositional Environment of Crude Oil Source Rocks. Energy Explor. Exploit. 2013, 31, 569–588. [Google Scholar] [CrossRef] [Scilit]
- Eglinton, G.; Hamilton, R.J. Leaf Epicuticular Waxes: The waxy outer surfaces of most plants display a wide diversity of fine structure and chemical constituents. Science 1967, 156, 1322–1335. [Google Scholar] [CrossRef] [Scilit] [PubMed]
- Connan, J. Biodegradation of crude oils in reservoirs. In Advances in Petroleum Geochemistry; Brooks, J., Welte, D.H., Eds.; Academic Press: London, UK, 1984; pp. 298–335. [Google Scholar] [CrossRef] [Scilit]
- Rueter, P.; Rabus, R.; Wilkes, H.; Aeckersberg, F.; Rainey, F.A.; Jannasch, H.W.; Widdel, F. Anaerobic oxidation of hydrocarbons in crude oil by new types of sulphate-reducing bacteria. Nature 1994, 372, 455–458. [Google Scholar] [CrossRef] [Scilit] [PubMed]
- Wenger, L.M.; Davis, C.L.; Isaksen, G.H. Multiple controls on petroleum biodegradation and impact on oil quality. SPE Res. Eval. Eng. 2002, 5, 375–383. [Google Scholar] [CrossRef] [Scilit]
- Head, I.M.; Jones, D.M.; Larter, S.R. Biological activity in the deep subsurface and the origin of heavy oil. Nature 2003, 426, 344–352. [Google Scholar] [CrossRef] [Scilit]
- Larter, S.; Huang, H.; Adams, J.; Bennett, B.; Snowdon, L.R. A practical biodegradation scale for use in reservoir geochemical studies of biodegraded oils. Org. Geochem. 2012, 45, 66–76. [Google Scholar] [CrossRef] [Scilit]
- Zhang, S.; Huang, H.; Su, J.; Zhu, G.; Wang, X.; Larter, S.R. Geochemistry of Paleozoic marine oils from the Tarim Basin, NW China. Part 4: Paleobiodegradation and oil charge mixing. Org. Geochem. 2014, 67, 41–57. [Google Scholar] [CrossRef] [Scilit]
- Niu, J.; Huang, H.; Jiang, W. Geochemical characteristics and correlation of continuous charge mixing and biodegradation of heavy oil in southeastern Dongying Sag, Bohai Bay basin, China. J. Petrol. Sci. Eng. 2018, 166, 1–12. [Google Scholar] [CrossRef] [Scilit]
- Krouse, H.R.; Viau, C.A.; Eliuk, L.S.; Ueda, A.; Halas, S. Chemical and isotopic evidence of thermochemical sulphate reduction by light hydrocarbon gases in deep carbonate reservoirs. Nature 1988, 333, 415–419. [Google Scholar] [CrossRef] [Scilit]
- Worden, R.H.; Smalley, P.C.; Cross, M.M. The influence of rock fabric and mineralogy on thermochemical sulfate reduction: Khuff formation, Abu Dhabi. J. Sedment. Res. 2000, 70, 1210–1221. [Google Scholar] [CrossRef] [Scilit]
- Cai, C.F.; Li, K.K.; Zhu, Y.M.; Xiang, L.; Jiang, L.; Tenger Cai, X.Y.; Cai, L.L. TSR origin of sulfur in Permian and Triassic reservoir bitumen in East Sichuan Basin, China. Org. Geochem. 2010, 41, 871–878. [Google Scholar] [CrossRef] [Scilit]
- Cai, C.F.; Tang, Y.J.; Li, K.K.; Jiang, K.X.; Jiang, C.Q.; Xiao, Q.L. Relative reactivity of saturated hydrocarbons during thermochemical sulfate reduction. Fuel 2019, 253, 106–113. [Google Scholar] [CrossRef] [Scilit]
- Mango, F.D. An invariance in the isoheptanes of petroleum. Science 1987, 237, 514–517. [Google Scholar] [CrossRef] [Scilit]
- Cai, C.F.; Li, H.; Li, K.K.; Wang, D.W. Thermochemical sulfate reduction in sedimentary basins and beyond: A review. Chem. Geol. 2022, 607, 121018. [Google Scholar] [CrossRef] [Scilit]
- Song, D.; Zhang, C.; Li, S.; Wang, T.; Li, M. Elevated Mango’s K1 Values Resulting from Thermochemical Sulfate Reduction within the Tazhong Oils, Tarim Basin. Energy Fuels 2017, 31, 1250–1258. [Google Scholar] [CrossRef] [Scilit]
- Thompson, K.F.M. Fractionated aromatic petroleums and the generation of gascondensates. Org. Geochem. 1987, 11, 573–590. [Google Scholar] [CrossRef] [Scilit]
- Thompson, K.F.M. Gas-condensate migration and oil fractionation in deltaic systems. Mar. Petrol. Geol. 1988, 5, 237–246. [Google Scholar] [CrossRef] [Scilit]
- Thompson, K.F.M. Aspects of petroleum basin evolution due to gas advection and evaporative fractionation. Org. Geochem. 2010, 41, 370–385. [Google Scholar] [CrossRef] [Scilit]
- Losh, S.; Cathles, L.; Meulbroek, P. Gas washing of oil along a regional transect, offshore Louisiana. Org. Geochem. 2002, 33, 655–663. [Google Scholar] [CrossRef] [Scilit]
- Losh, S.; Cathles, L. Phase fractionation and oil-condensate mass balance in the South Marsh IslandBlock 208–239 area, offshore Louisiana. Mar. Petrol. Geol. 2010, 27, 467–475. [Google Scholar] [CrossRef] [Scilit]
- Meulbroek, P. Equations of state in exploration. Org. Geochem. 2002, 22, 613–634. [Google Scholar] [CrossRef] [Scilit]
- Meulbroek, P.; Cathles, L., III; Whelan, J. Phase fractionation at south eugene island block 330. Org. Geochem. 1998, 29, 223–239. [Google Scholar] [CrossRef] [Scilit]
- Kissin, Y.V. Catagenesis and composition of petroleum: Origin of n-alkanes and isoalkanes in petroleum crudes. Geochem. Cosmochim. Acta 1987, 51, 2445–2457. [Google Scholar] [CrossRef] [Scilit]
- Zhang, Z.; Zhang, Y.; Zhu, G.; Han, J.; Chi, L. Variations of diamondoids distributions in petroleum fluids during migration induced phase fractionation: A case study from the Tazhong area, NW China. J. Petrol. Sci. Eng. 2019, 179, 1012–1022. [Google Scholar] [CrossRef] [Scilit]
- Zhou, C.; Yu, S.; Huang, W.; Zhang, H.; Xiao, Z.; Zeng, L.; Haung, W.; Pan, C. Oil maturities, mixing and charging episodes in the cratonic regions of the Tarim Basin, NW China: Insight from biomarker and diamondoid concentrations and oil bulk properties. Mar. Petrol. Geol. 2021, 126, 104903. [Google Scholar] [CrossRef] [Scilit]
- Zhu, G.; Milkov, A.V.; Li, J.; Xue, N.; Chen, Y.; Hu, J.; Li, T.; Zhang, Z.; Chen, Z. Deepest oil in Asia: Characteristics of petroleum system in the Tarim basin, China. J. Petrol. Sci. Eng. 2021, 199, 108246. [Google Scholar] [CrossRef] [Scilit]
- Qi, Y.; Sun, P.; Cai, C.; Wang, D.; Peng, Y. Phase fractionation controlling regional distribution of diamondoids: A case study from the Halahatang oil field, Tarim Basin, China. Mar. Petrol. Geol. 2022, 140, 105674. [Google Scholar] [CrossRef] [Scilit]
- Huang, W.; Yu, S.; Zhang, H.; Xiao, Z.; Liu, D. Diamondoid fractionation and implications for the Kekeya condensate feld in the southwestern depression of the Tarim Basin, NW China. Mar. Petrol. Geol. 2022, 138, 105551. [Google Scholar] [CrossRef] [Scilit]
- Moldowan, J.M.; Dahl, J.; David, Z.; Barbanti, S.M. Underutilized advanced geochemical technologies for oil and gas exploration and production-1. The diamondoids. J. Petrol. Sci. Eng. 2015, 126, 87–96. [Google Scholar] [CrossRef] [Scilit]
- Chakhmakhchev, A.; Sanderson, J.; Pearson, C.; Davidson, N. Compositional changes of diamondoid distributions caused by simulated evaporative fractionation. Org. Geochem. 2017, 113, 224–228. [Google Scholar] [CrossRef] [Scilit]
- Dahl, J.E.; Moldowan, J.M.; Peters, K.E.; Claypool, G.E.; Rooney, M.A.; Michael, G.E.; Mello, M.R.; Kohnen, M.L. Diamondoid hydrocarbons as indicators of natural oil cracking. Nature 1999, 399, 54–57. [Google Scholar] [CrossRef] [Scilit]
- Maimaiti, A.; Wang, Q.; Hao, F.; Yang, X.; Zhang, H.; Tian, J. Oil pyrolysis with carbonate minerals: Implications for the thermal stability of deep crude oil. Mar. Petrol. Geol. 2022, 146, 105929. [Google Scholar] [CrossRef] [Scilit]
- Qi, Y.; Cai, C.; Sun, P.; Wang, D.; Zhu, H. Crude oil cracking in deep reservoirs: A review of the controlling factors and estimation methods. Pet. Sci. 2023, 20, 1978–1997. [Google Scholar] [CrossRef] [Scilit]
- Wu, W. Simulation study of hydrocarbon generation from Paleogene source rock in Boxing sag. Spec. Oil Gas Reserv. 2010, 17, 55–59, (In Chinese with English abstract). [Google Scholar] [CrossRef]
- Wang, B.; Luo, S.; Chen, Y.; Wu, W. Numerical simulation of hydrocarbon generation, migration and accumulation in the Boxing sag, Dongying Depression, Jiyang Subbasin. Oil Gas Geol. 2012, 33, 675–685, (In Chinese with English abstract). [Google Scholar] [CrossRef]
- Horsfield, B.; Schenk, H.J.; Mills, N.; Welte, D.H. An investigation of the in-reservoir conversion of oil to gas: Compositional and kinetic findings from closed system programmed-temperature pyrolysis. Org. Geochem. 1992, 19, 191–204. [Google Scholar] [CrossRef] [Scilit]
- Wang, D.; Cai, C.; Yun, L.; Liu, J.; Sun, P.; Jiang, Z.; Peng, Y.; Zhang, H.; Wei, T.; Pei, B. Controls on petroleum stability in deep and hot reservoirs: A case study from the Tarim Basin. Mar. Petrol. Geol. 2023, 147, 106014. [Google Scholar] [CrossRef] [Scilit]

Disclaimer/Publisher’s Note: The statements, opinions and data contained in all publications are solely those of the individual author(s) and contributor(s) and not of MDPI and/or the editor(s). MDPI and/or the editor(s) disclaim responsibility for any injury to people or property resulting from any ideas, methods, instructions or products referred to in the content. |
© 2026 by the authors. Licensee MDPI, Basel, Switzerland. This article is an open access article distributed under the terms and conditions of the Creative Commons Attribution (CC BY) license.