


Abstract
The success of acid stimulation in tight carbonate reservoirs relies on the formation of non-uniform etching on fracture walls. However, existing research on the influence of the fracture surface morphology on non-uniform etching and fracture conductivity predominantly employed non-replicable tensile fracture surfaces. Previous studies were unable to use identical fracture surfaces to conduct single-factor analysis and clarify the impact of roughness. This study utilized digital engraving technology to fabricate multiple artificial carbonate rock samples with a homogeneous lithology and completely consistent fracture surface morphology. Using the Triangular Prism Method (TPM), the initial fracture roughness of the rock samples was decomposed into large-scale waviness and small-scale unevenness. Through controlled injection parameters, single-factor acid etching experiments were conducted. For the first time, the effects of large-scale waviness and small-scale unevenness on acid etching were investigated, along with the influences of the acid injection rate and injection time. The existence of an optimal injection rate and an optimal injection time was clarified. The results demonstrate that the engraved carbonate samples’ surfaces exhibit good consistency with the original natural fracture surfaces. The acid solution acts to shave the “peaks” and deepen the “valleys” of rough fractures. The large-scale waviness characteristics of the initial rough surfaces determine the overall post-etching morphology, leading to poor surface contact within the fracture. This is the primary reason for the high fluid flow capacity of acid-etched fractures under low closure stresses. However, the small-scale unevenness characteristics of the initial rough surfaces determine the formation and the distribution of small protruding support points on the post-etching surface. This is the primary reason for the retention of high conductivity in acid-etched fractures under high closure stresses. An increase in the acid injection rate or acid injection time does not lead to a linear decrease in linear roughness, surface mismatch, or fracture aperture. A critical acid injection rate or critical acid injection time exists. Optimizing the injection rate or time can achieve an ideal etching morphology—the protrusions formed by punctate etching enable the fractures to maintain a certain level of conductivity even under a high closure stress of 55.2 MPa, while channel etching can increase the conductivity under high closure stress by 20–25%, providing a key direction for optimizing acid etching effects.
1. Introduction
Globally, carbonate rocks serve as a significant type of reservoir for oil and gas, ensuring substantial hydrocarbon resource supply [1]. With progress in petroleum exploration and technology, the development of carbonate oil and gas reservoirs has been increasing in recent years, accounting for 60% of the world’s total oil and gas production [2]. Most carbonate oil fields tend to be quite profitable [3].
Acid fracturing is an indispensable technology for enhancing production in carbonate reservoirs. This method consists of two stages: creating fractures in the rock and etching the fracture surfaces through acidization [4]. The length of the acid-etched fractures and their conductivity are key factors that determine the effectiveness of the acid fracturing treatment. The acid-etched fracture conductivity is influenced by many factors, such as the rock strength [5,6], type of acid [7], acid–rock contact time [8], injection rate [9], temperature [6,10], and closure pressure [11]. Accurately evaluating the flow capacity of acid-etched fractures has an important impact on the carbonate acid fracturing design and post-frac production forecasts.
The conductivity of acid-etched fractures is mainly determined by the properties of the reservoir rock and the etching morphology of the fracture surface. Currently, the conductivity of acid-etched fractures is mainly evaluated through lab experiments [12]. Standard lab practices employ smooth core samples or outcrop rocks from identical layers to obtain natural fractures for etching and flow testing under various acid conditions, assessing the dominant factors for etching and flow capacity [2]. Mirza, et al. [13] highlighted that deep channels along fracture faces yield exceptional conductivity under substantial closure stress. Melendez, et al. [14] examined acid fracture conductivity and influencing factors through repeated experiments. The results indicated that fracture surface etching significantly impacts conductivity, enabling conductivity maintenance after fracture closure if channels were created. Antelo, et al. [15] presented 65 experimental results for different types of rock and acid injection conditions. They provided the variables and controlling parameters relating fracture surface roughness to fracture conductivity measurements. Lu, et al. [16] introduced parameters to quantify roughness and channels on etched fracture surfaces, showing that these factors substantially affect the initial conductivity and its rate of change with closure pressure. In the actual acid fracturing process, acid etching creates a heterogeneous surface with different sizes of micro-protrusions and sharp peaks, increasing the fracture wall’s roughness and narrowing the width [17]. However, traditional flat-plate experiments cannot precisely quantify the flow capacity of acid-etched fractures in carbonate reservoirs. This discrepancy leads to significant errors in predicting fracture flow and inaccurate forecasting of post-acid-fracturing productivity and impacts the practical application of the technology.
Other experimental studies focused on the influence of fracture surface characterizations on acid etching behavior [13,18,19]. Neumann, et al. [20] employed tensile fracture simulations to mimic the hydraulic fracture’s natural geometry, comparing it with original carbonate samples. They observed the tensile etching patterns and noted that, after acid treatment, the linear roughness of these fractures could increase, remain the same, or even decrease, with the surface mismatches driving acid fracture conductivity. Nino-Penaloza, et al. [21] examined how etching mechanisms on rough surfaces differ from those on smooth ones, finding that conductivity on rough surfaces is primarily influenced by the deepening of pre-existing channels rather than the creation of new channels through etching. Asadollahpour, et al. [4] investigated the impact of acidizing at varying times on the roughness evolution and conductivity of fractures with rough surfaces through experiments and numerical simulations. Their findings indicate that the growing mismatch between fracture surfaces significantly influences acid fracture conductivity. Fractures with a longer acidizing time exhibit greater normal deformations under normal stress. Gou, et al. [22] considered the impacts of the initial fracture morphology and temperature during an alternating multi-stage acid fracturing experiment. The results showed that the acid-etched fracture morphology is the integrated result of the initial rough fracture topography and reaction temperature. Although previous studies have noted the substantial positive effect of heterogeneous fracture etching on the acid fracturing efficiency, systematic quantitative analysis has usually been ignored [23,24]. Specifically, the interplay between the initial surface roughness and acid flow rate and their impact on dissolution within acidized fractures have not been thoroughly examined. As a result, the correlation between etching patterns and subsequent fracture conductivity remains unclear.
In this study, we attempted to employ digital engraving techniques to prepare carbonate rock samples with a uniform lithology and homogeneous roughness morphology [25,26,27], followed by acid etching and conductivity experiments. In the study, 40 natural fracture morphologies were obtained from split rock samples; after decomposing and partitioning the roughness via the Triangular Prism Method (TPM) and characterizing it using area tortuosity, three representative morphologies were selected for engraving, yielding carbonate rock samples with consistent roughness profiles. On this basis, a series of experiments were conducted to investigate the acid etching behavior of fracture surfaces and the evolution of fracture conductivity under varying initial roughness morphologies, acid injection rates, and acid injection durations.
The innovations of this study are mainly reflected in the following two aspects:
- (a)
- In previous studies, the smooth-cut rock slabs used in experiments failed to reflect actual fracture morphologies, while the rough rock slabs obtained via core splitting exhibited heterogeneous morphologies, leading to significant discrepancies in acid etching experimental results. To address these challenges, this study proposes for the first time a method for preparing a large number of replicate rock samples with a uniform lithology and consistent surface morphology using digital engraving techniques, based on carbonate rock samples with a single-mineral composition and extremely high purity.
- (b)
- Most previous experimental studies on the influence of roughness on acid etching were conducted using split rough rock slabs with heterogeneous morphologies, and the characterization of fracture surface roughness mostly relied on single parameters such as the Joint Roughness Coefficient (JRC) and fractal dimension. In contrast, this study decomposes the overall fracture roughness into primary roughness (i.e., large-scale waviness, defined as the dominant large-scale unevenness of the wave surface) and secondary roughness (i.e., small-scale unevenness, defined as randomly distributed small-scale asperities superimposed on the primary wavy surfaces) via the Triangular Prism Method (TPM) for the first time and characterizes them in combination with area tortuosity, achieving a two-parameter characterization of roughness. This enables a more comprehensive qualitative and quantitative evaluation of the roughness of rock surfaces (e.g., joints or faults).
2. Experimental Method
2.1. Sample Preparation
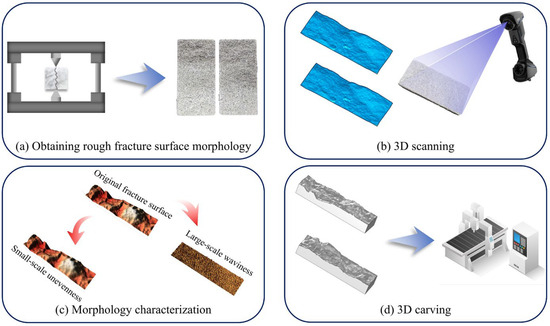
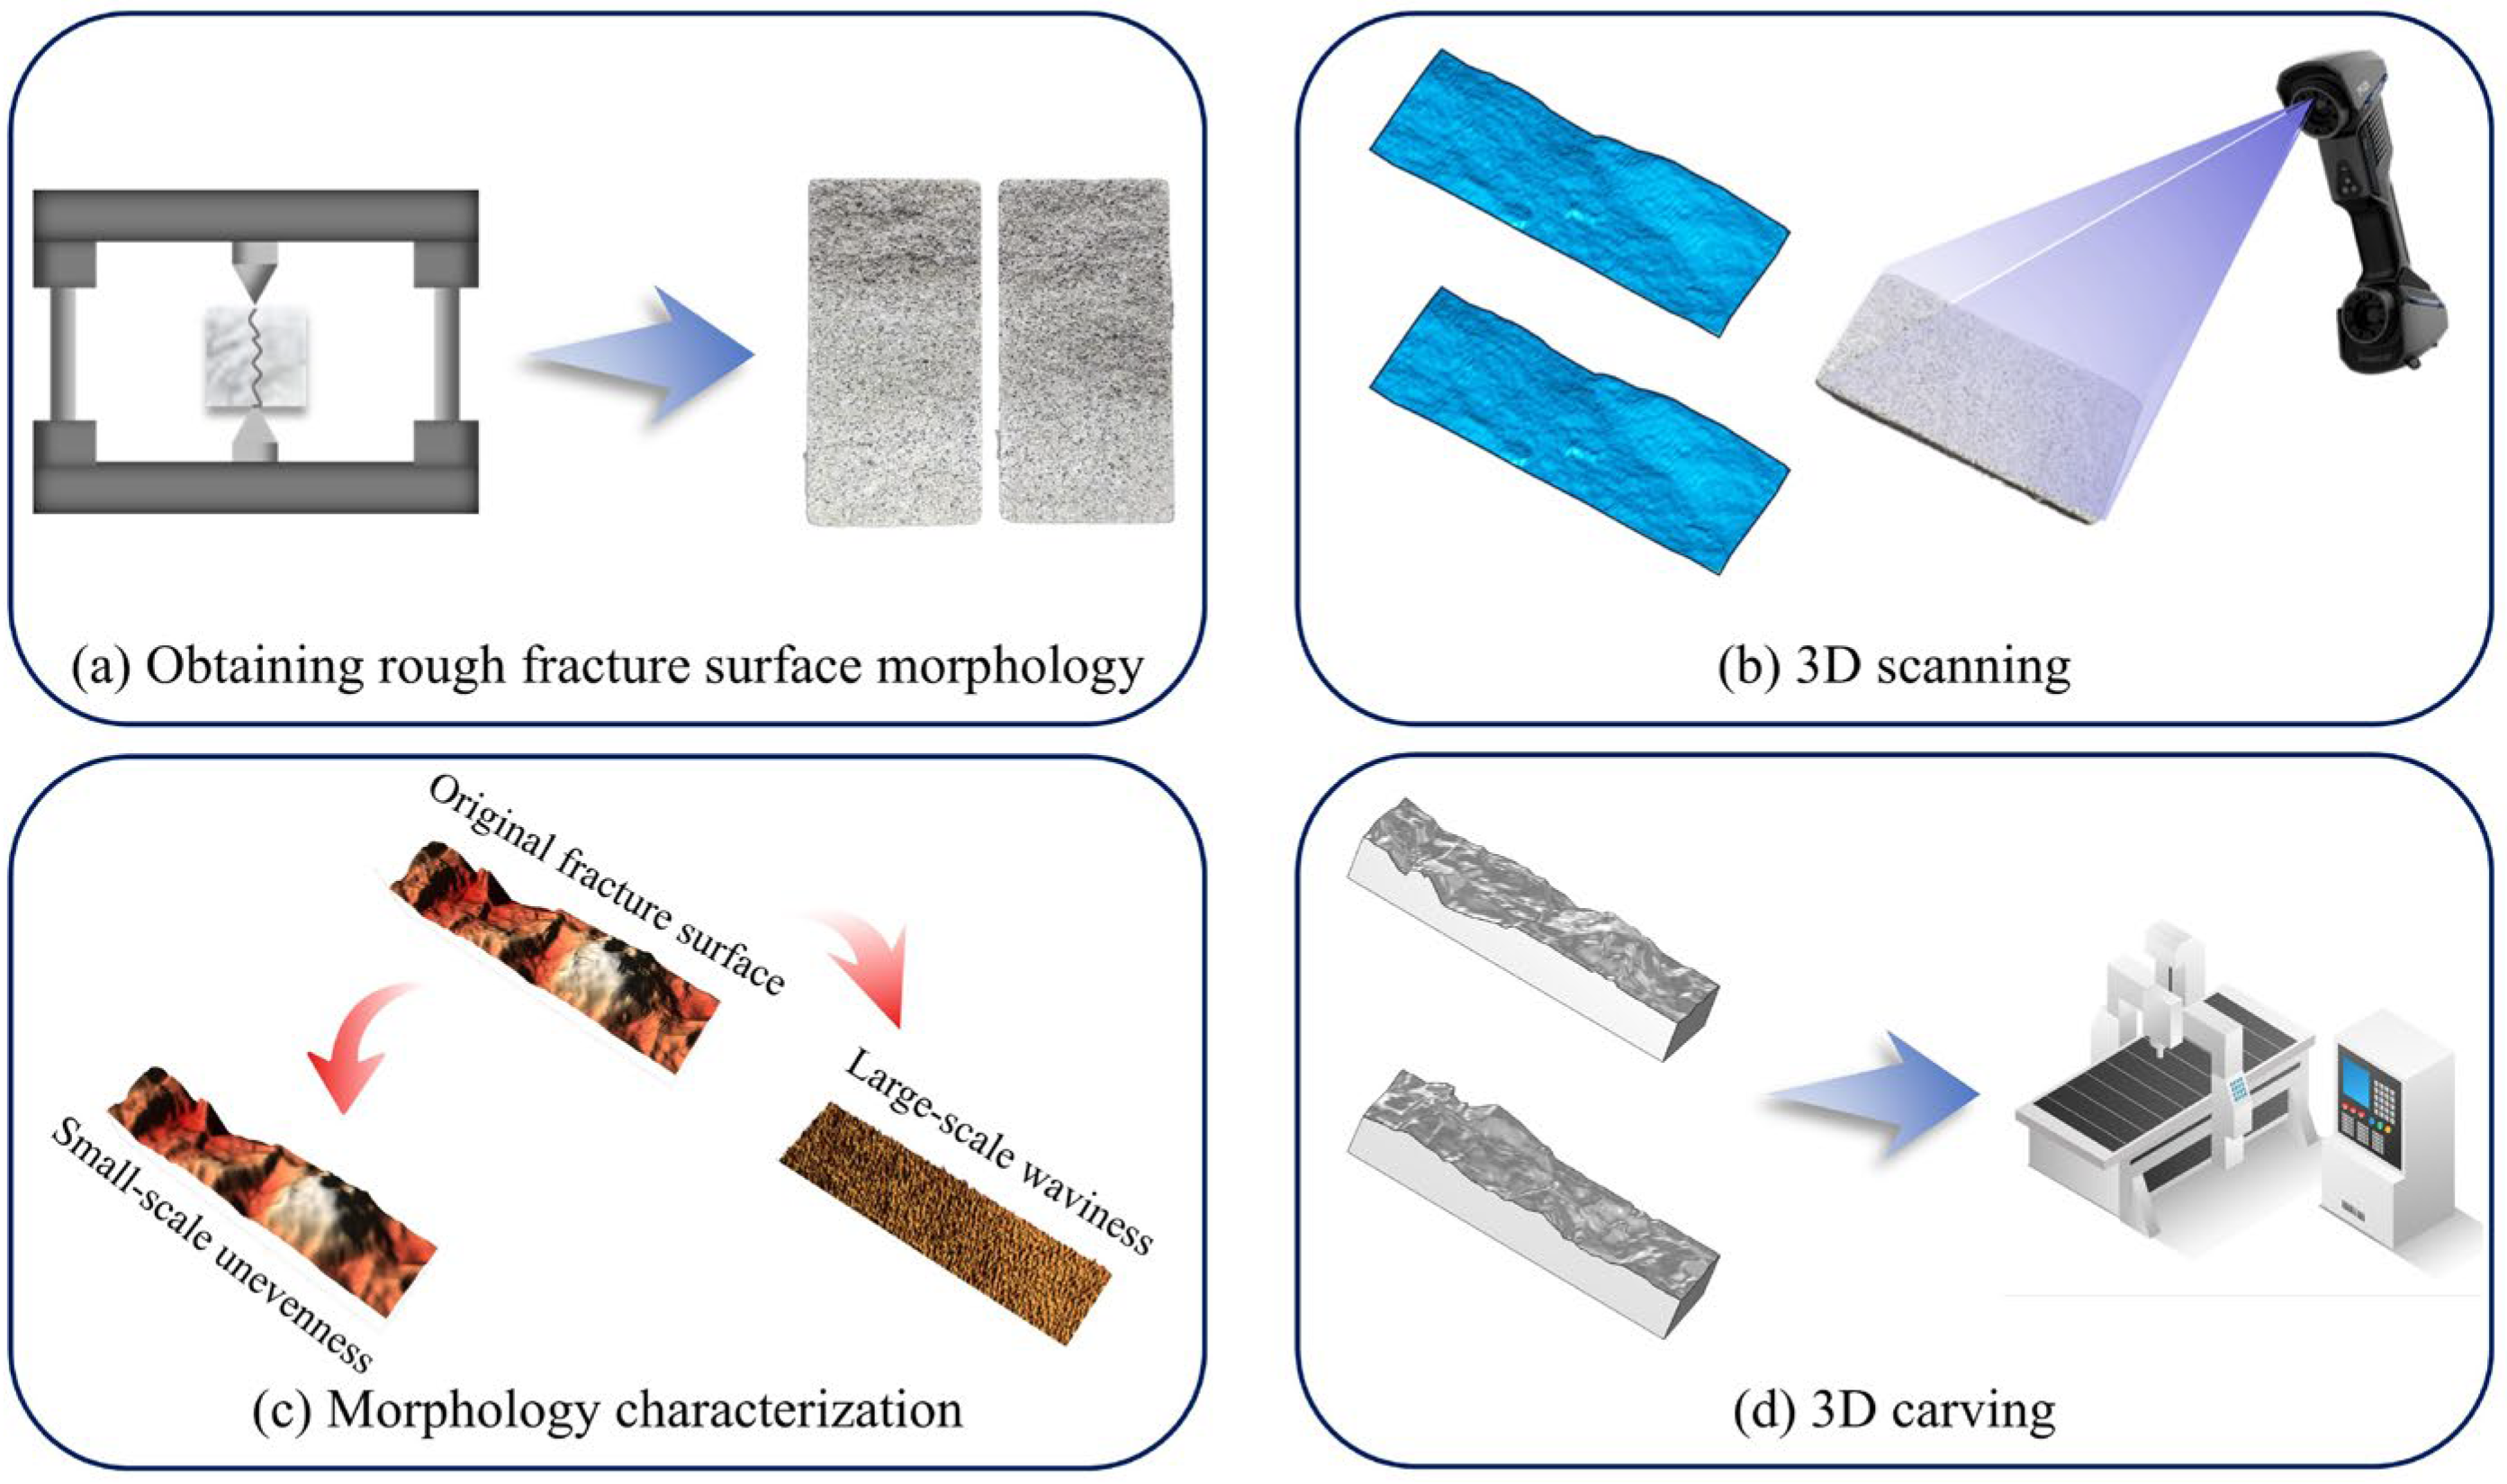
This study is based on a method combining 3D scanning and 3D engraving technology to reproduce rock fracture surfaces [26,27]. The method is used to create rough fracture surfaces with a consistent morphology for acid etching experiments and flow capacity tests. As shown in Figure 1, the process generally involves collecting carbonate rock samples from natural outcrops, followed by splitting to obtain a rough fracture surface morphology. Next, a 3D laser scanner is used to capture the surface data of the fracture. The surface features are then quantitatively characterized, and typical rough morphologies are selected. Finally, the selected fracture surface morphology data is imported into a 3D engraving machine for engraving, producing multiple samples with an identical morphology. This method allows for the preparation of a large number of samples with a surface morphology similar to the original fracture surface. These samples can be used for further research on the mechanisms and factors related to acid etching and fracture conductivity.
Figure 1.
Rock sample preparation procedure.
2.1.1. Acquisition of Rough Fracture Surface Morphology
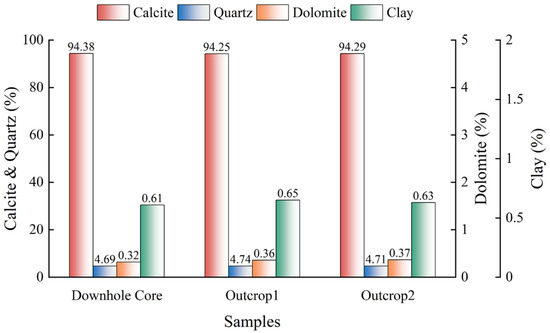
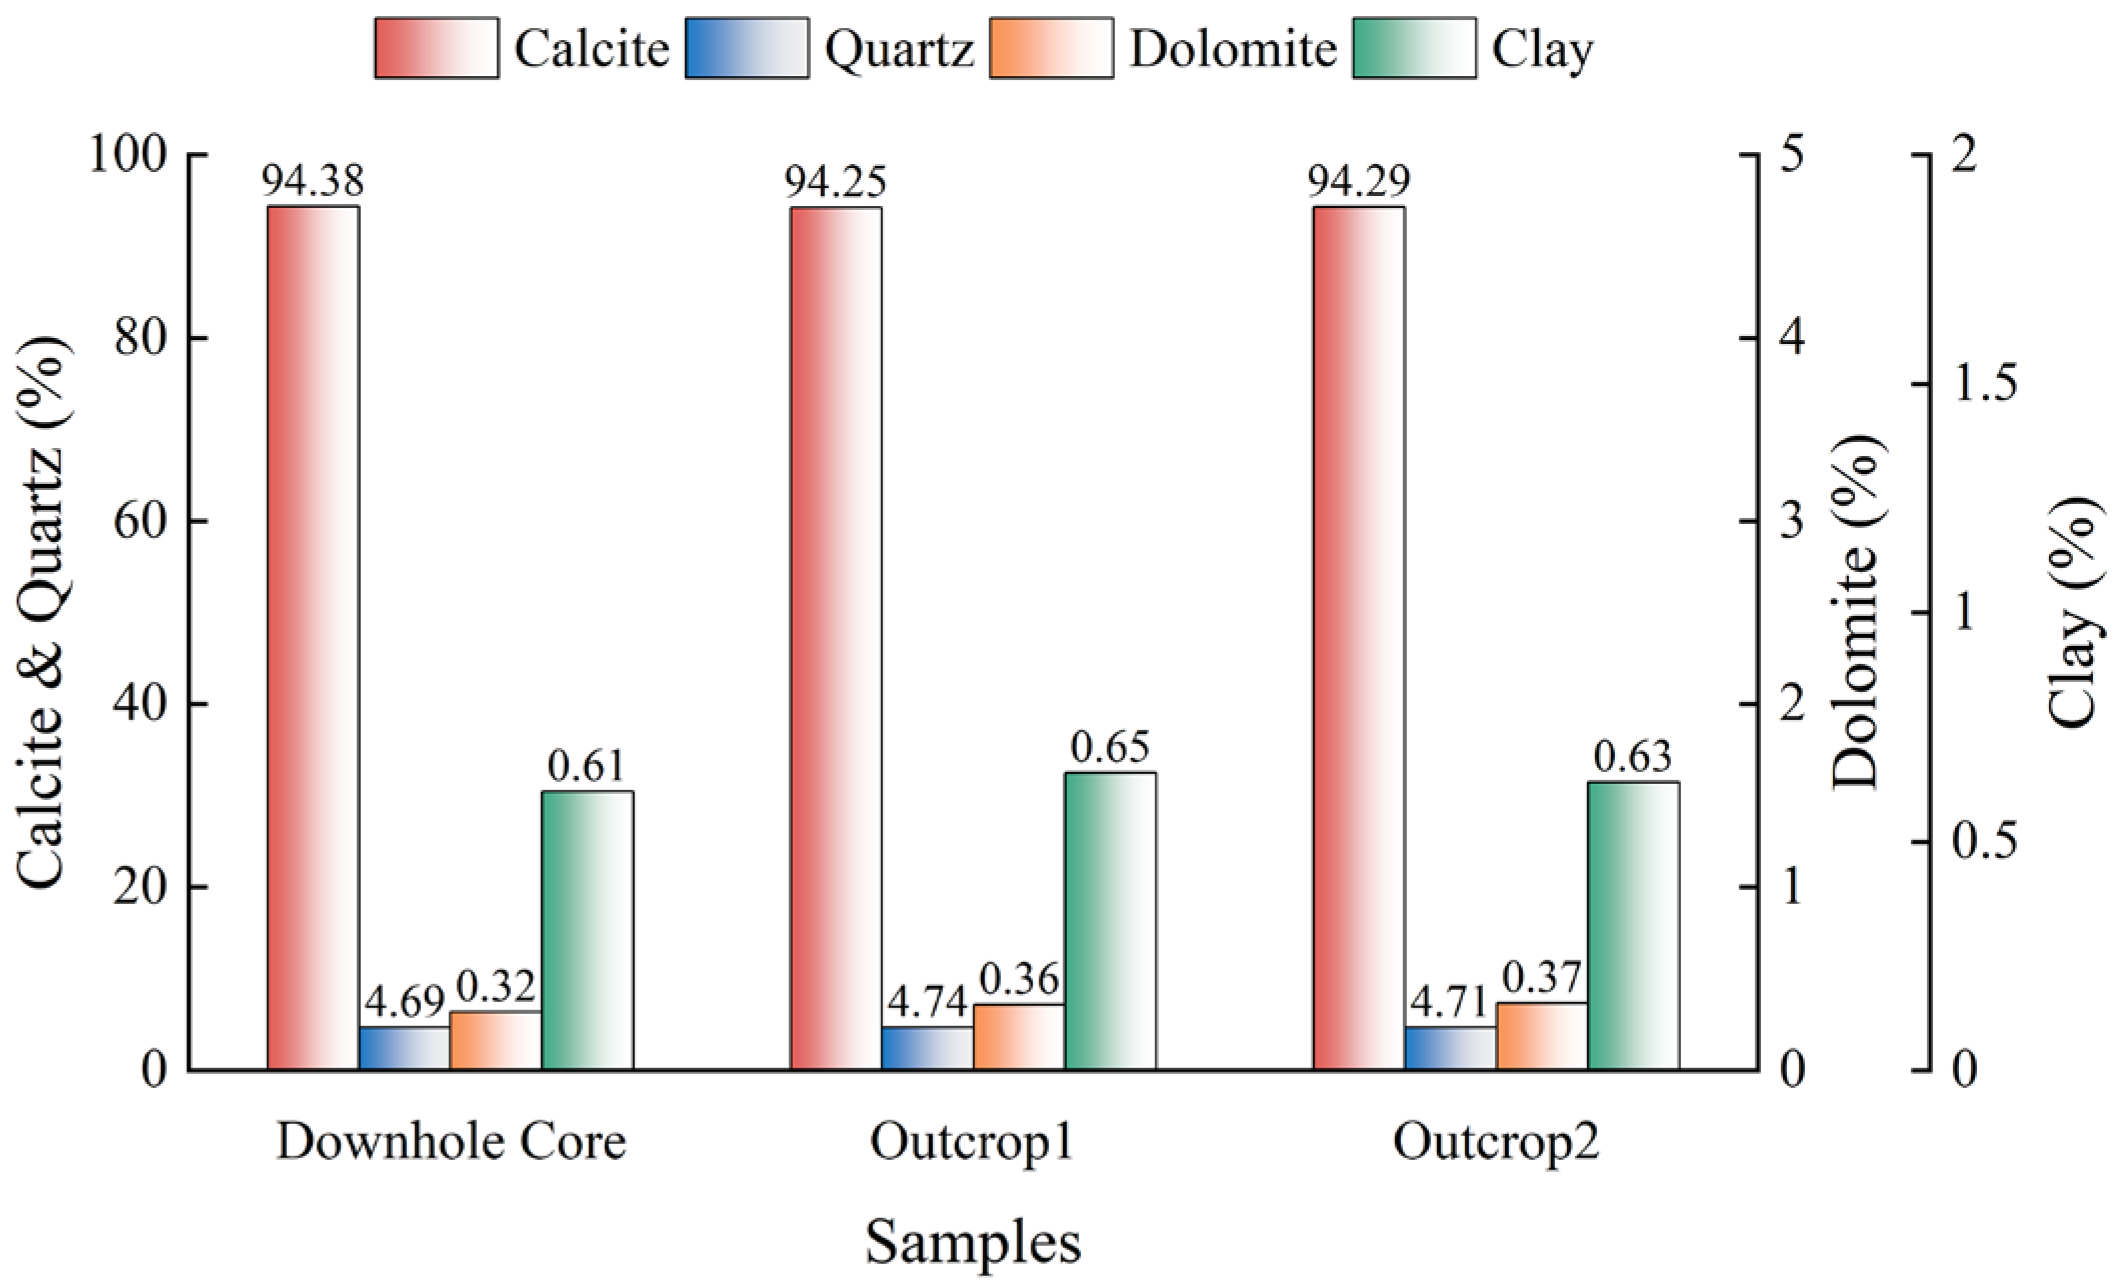
Rock samples were collected from Yunnan Province, China. X-ray diffraction analysis of outcrop samples revealed that the rock is predominantly calcite and contains minor amounts of dolomite, quartz, and clay minerals (Figure 2). Their average mass percentages are 94.31%, 0.35%, 4.71%, and 0.63%, respectively. This indicates that the mineral composition is fairly simple and matches well with core samples taken from the subsurface. Previous studies [22,28] employed rock samples with complex mineral compositions. The different reaction rates of various minerals with acid solutions led to inconsistent experimental results, complicating the investigation of single-factor influences such as roughness and time on acid etching and conductivity.
Figure 2.
Mineral composition of carbonate rock outcrops and the downhole core.
In accordance with API standards, the samples were cut into rectangular blocks with dimensions of 180 mm × 36 mm × 50 mm (Figure 1a). Due to challenges in obtaining deep subsurface cores from the formation, outcrop samples from the formation were selected as experimental materials, with guidance provided by geological experts. To replicate the natural fracture morphology, the Brazilian splitting test was utilized. The rectangular blocks were placed in a splitting apparatus, with the splitting wedge aligned along the central axis of the sample’s width. Longitudinal pressure was subsequently applied to induce coarse tensile fractures. In total, 40 carbonate rock blocks were split to acquire representative fracture surface morphologies for further analysis.
2.1.2. Characterization of Fracture Surface Morphology
- (1)
- Surface roughness decomposition
A 3D laser scanner (Figure 1b) was employed to capture the surface crack morphology of the rock slab before and after acid etching [11,16,29].
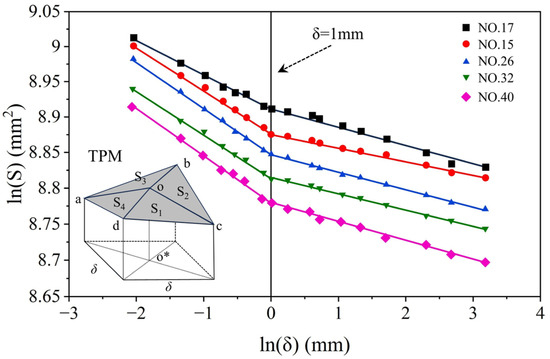
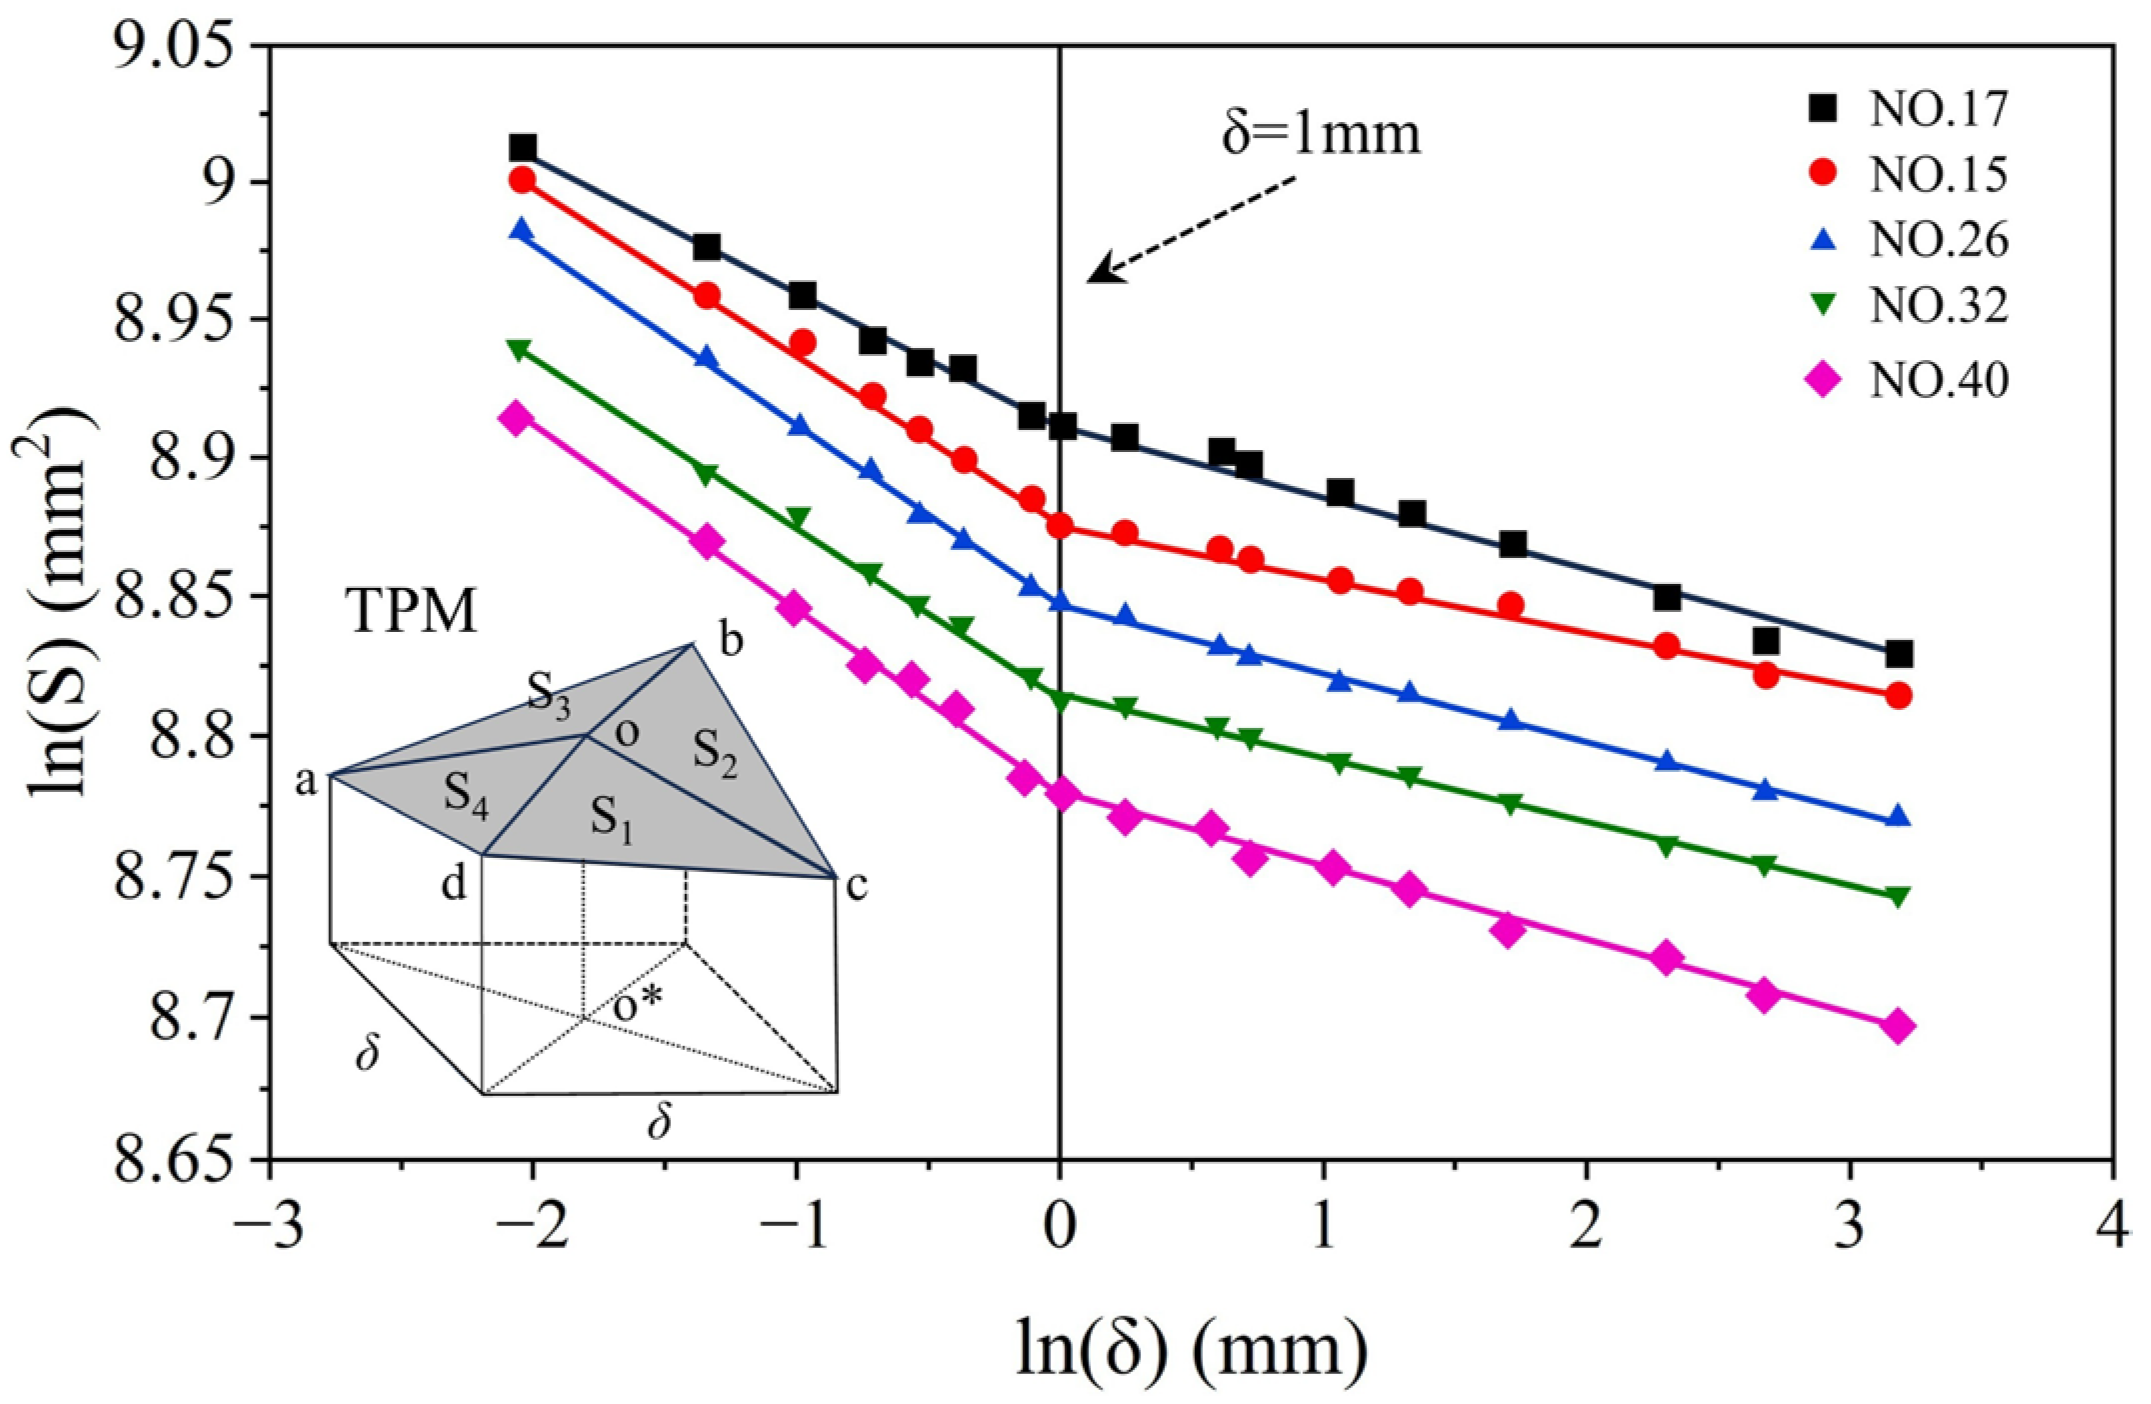
The fracture surface exhibits multi-scale roughness characteristics. As shown in Figure 1c, its topography can be viewed as a superposition of large-scale waviness representing primary non-steady roughness and small-scale unevenness representing secondary static roughness. Using the Triangular Prism Method (TPM), the fracture surface is discretized into square cells with a side length of δ. The four vertices of each square are connected to the average surface height, forming four triangles; the area of each triangle is calculated, and the sum of the four areas provides an approximation of the rough surface area for that cell. Summing the approximate areas for all cells yields the total rough surface area S(δ). As δ decreases, S(δ) begins to capture the influence of small-scale unevenness and shows a rapid increase. Based on the sample dimensions in this experiment, the maximum value of δ is half the width of the rock sample, i.e., 18 mm, and the minimum value is consistently 0.1 mm [26]. As shown in Figure 3, when lnδ approaches 0 (corresponding to δ close to 1 mm), the slope of the fitted line changes significantly. This grid size (δ ≈ 1 mm) is the critical scale that distinguishes large-scale waviness from small-scale unevenness on the fracture surface.
Figure 3.
TPM determines the relationship between surface area and grid size δ. (* denotes that this point is the projection of point o on the plane.)
- (2)
- Roughness characterization
Quantitative characterization of surface roughness employs area tortuosity metrics (original tortuosity εa of the crack surface, tortuosity εa1 of large-scale waviness, and tortuosity εa2 of small-scale unevenness), as per the following equation group:
where S(δ) denotes the actual area of the rough crack surface; S(δ)1 represents the macro-scale crack surface area of the rough surface, calculated from point cloud data at a step size of 1 mm; S(δ)n denotes the projected area of the rough surface; and S(δ)2 denotes the micro-scale crack surface area of the rough surface, calculated from point cloud data at a step size of 0.1 mm.
This study utilized the aforementioned method to quantify the fracture morphology of 40 pairs of cleaved rock specimens. The detailed results are presented in Table 1.
Table 1.
Calculation results of the original, large-scale waviness, and small-scale unevenness area tortuosity for 40 pairs of split rock samples.
2.1.3. Selection of Typical Morphology
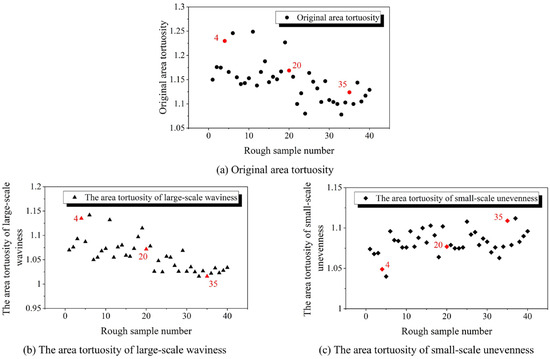
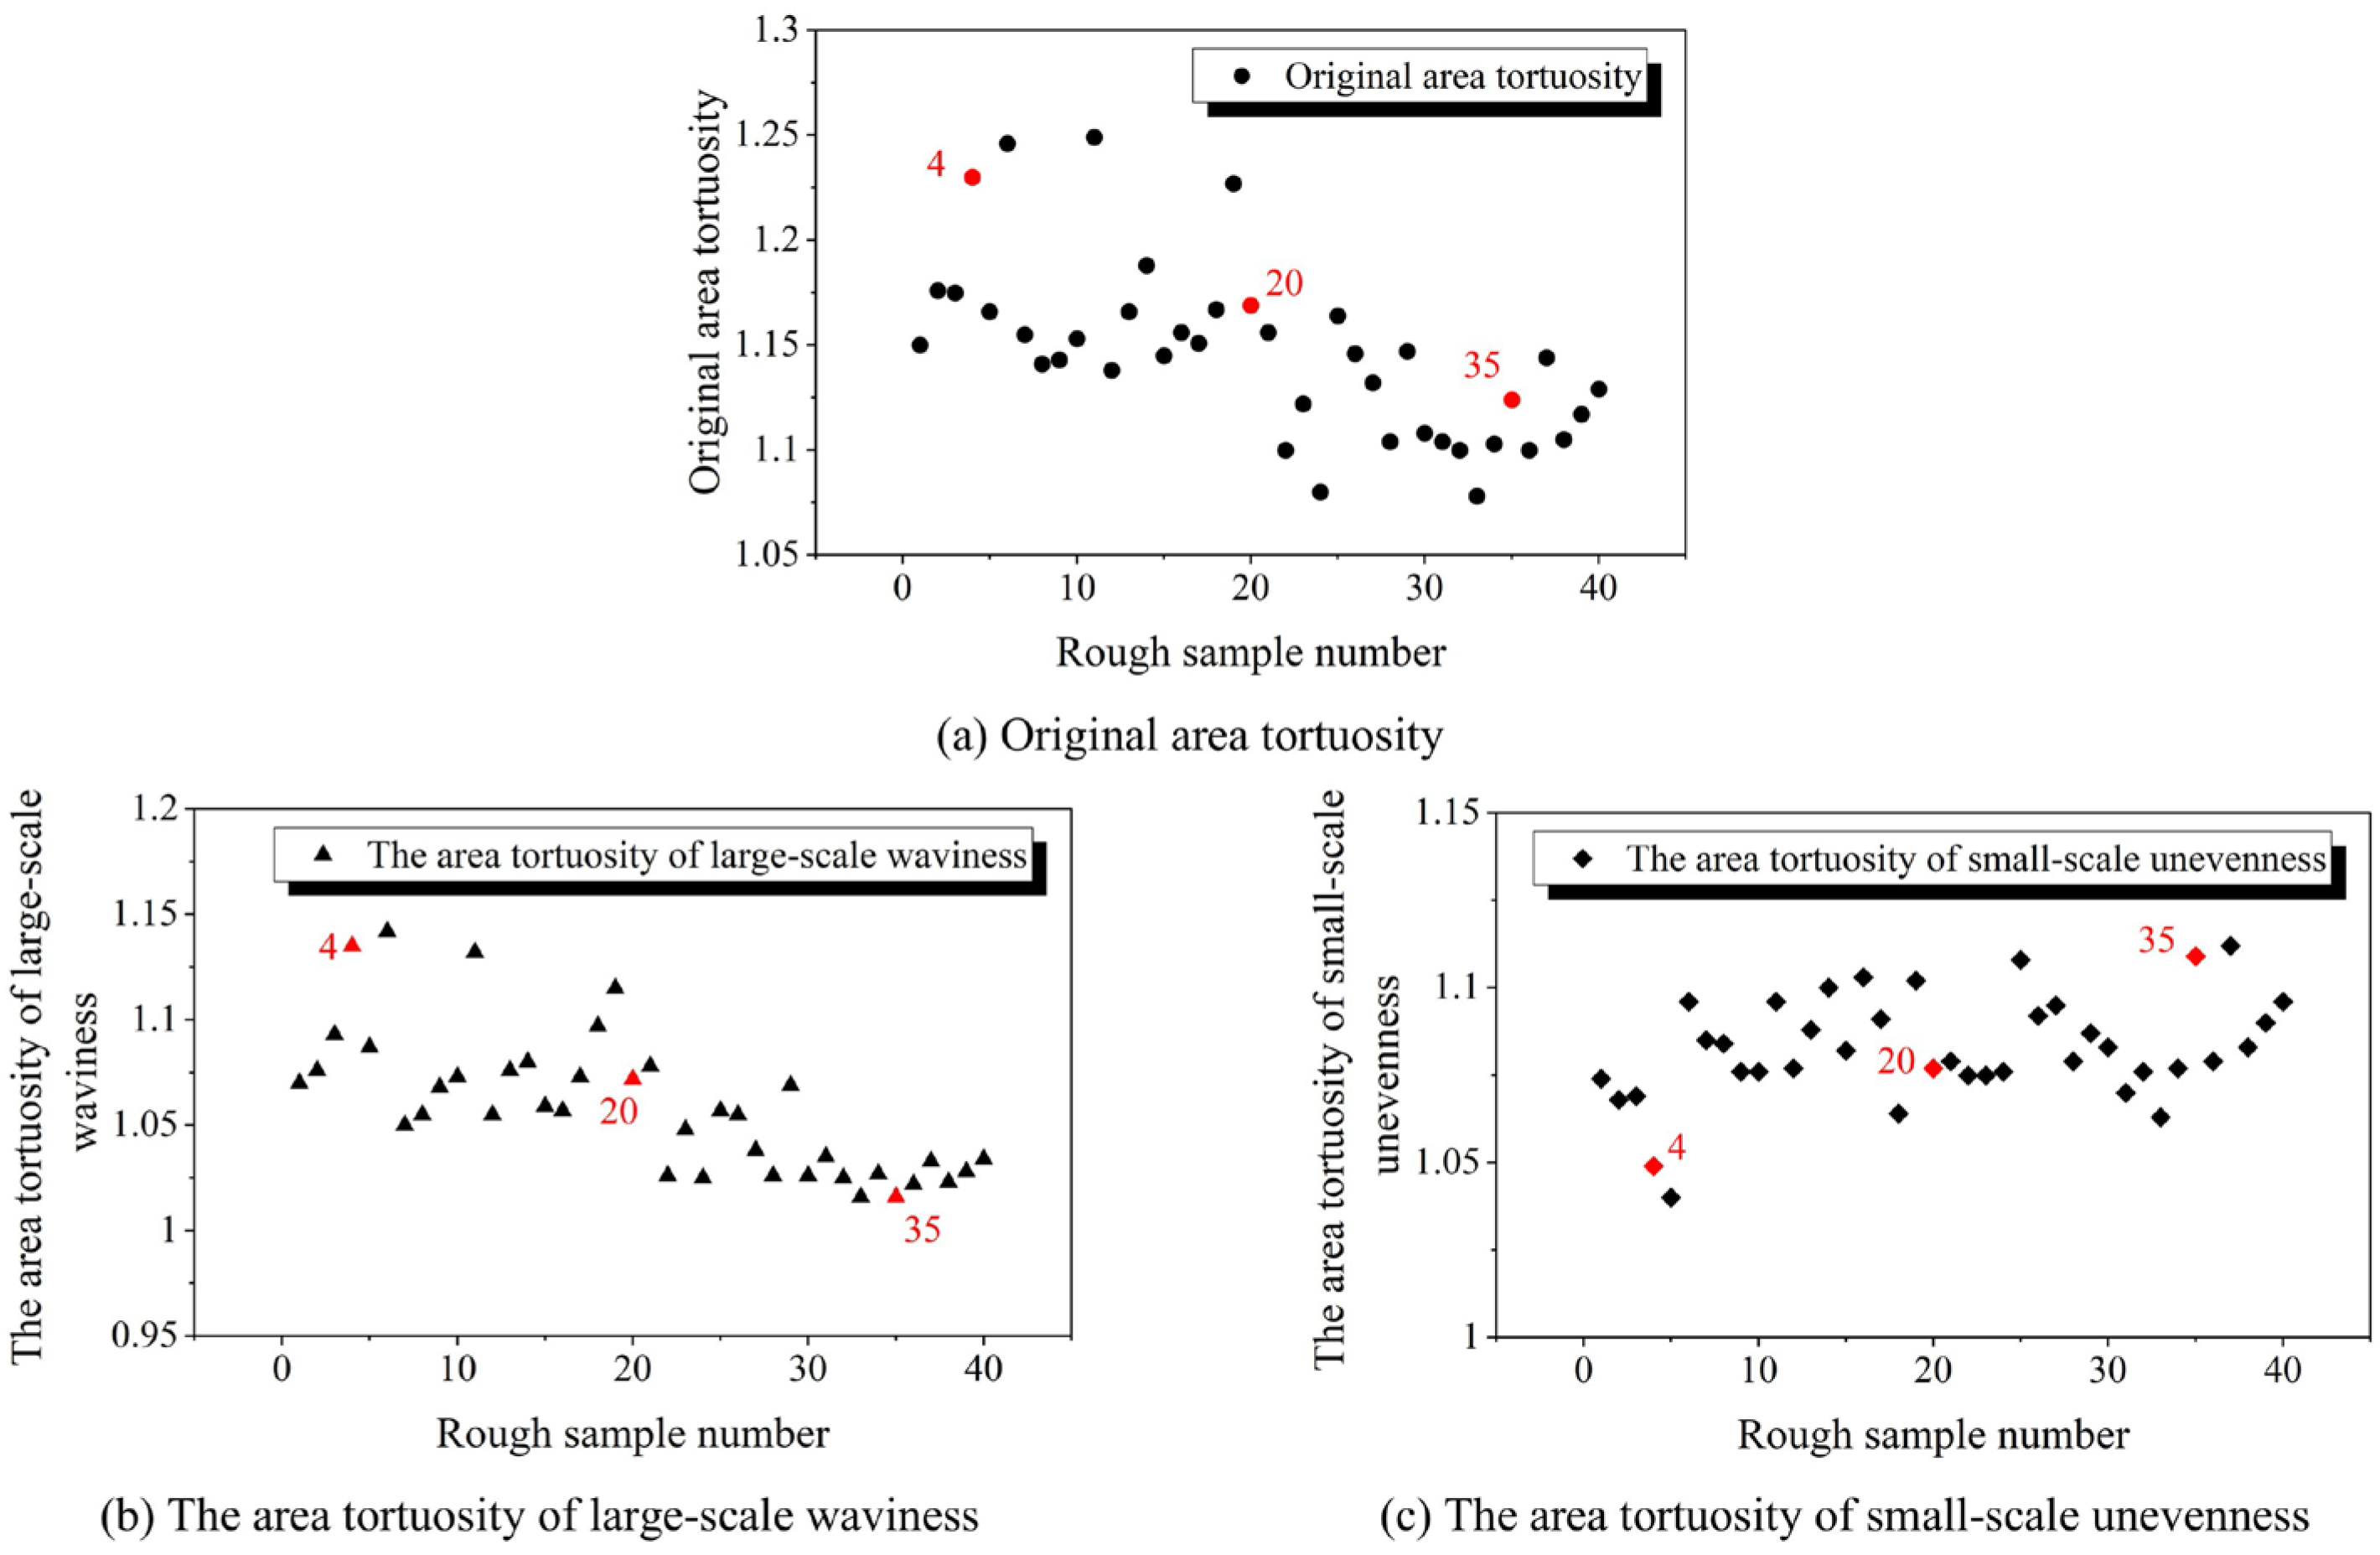
The selection results are presented in Figure 4 and Table 2, highlighting significant variations in the original area tortuosity of carbonate rock fractures. To examine the influence of fracture morphology with varying roughness on acid etching and fracture conductivity, three representative rock samples were selected. Sample No. 4, representing the coarsest morphology, was designated as Type A; Sample No. 20, representing a morphology with median area tortuosity, was designated as Type B; and Sample No. 35, representing the smoothest morphology, was designated as Type C. Among these, Type B exhibited nearly equivalent values for both large-scale waviness and small-scale unevenness tortuosity. In contrast, Type A and Type C displayed notable differences in the tortuosity of their large-scale waviness and small-scale unevenness. Specifically, Type A showed a higher curvature for the large-scale waviness area compared to its small-scale unevenness area, whereas Type C exhibited the opposite relationship.
Figure 4.
Calculation and statistical results of area tortuosity. (Red represents the three types of rough rock samples selected for the experiment.).
Table 2.
Results of rough crack surface selection.
2.1.4. Surface Reconstruction of Fracture
As shown in Figure 1d, the processed point cloud data of the rough fracture surface undergoes polygonal surface processing and NURBS surface fitting operations. Subsequently, a three-dimensional rough fracture solid model consistent with the original rough fracture surface is constructed.
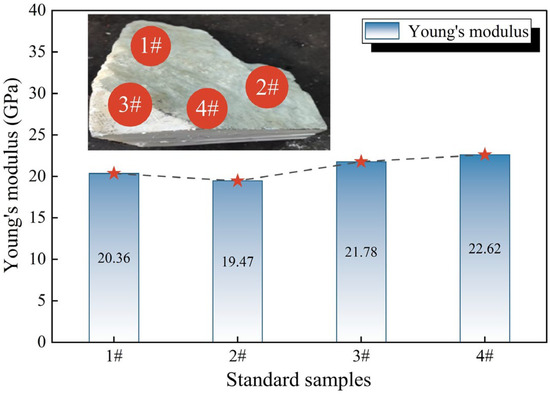
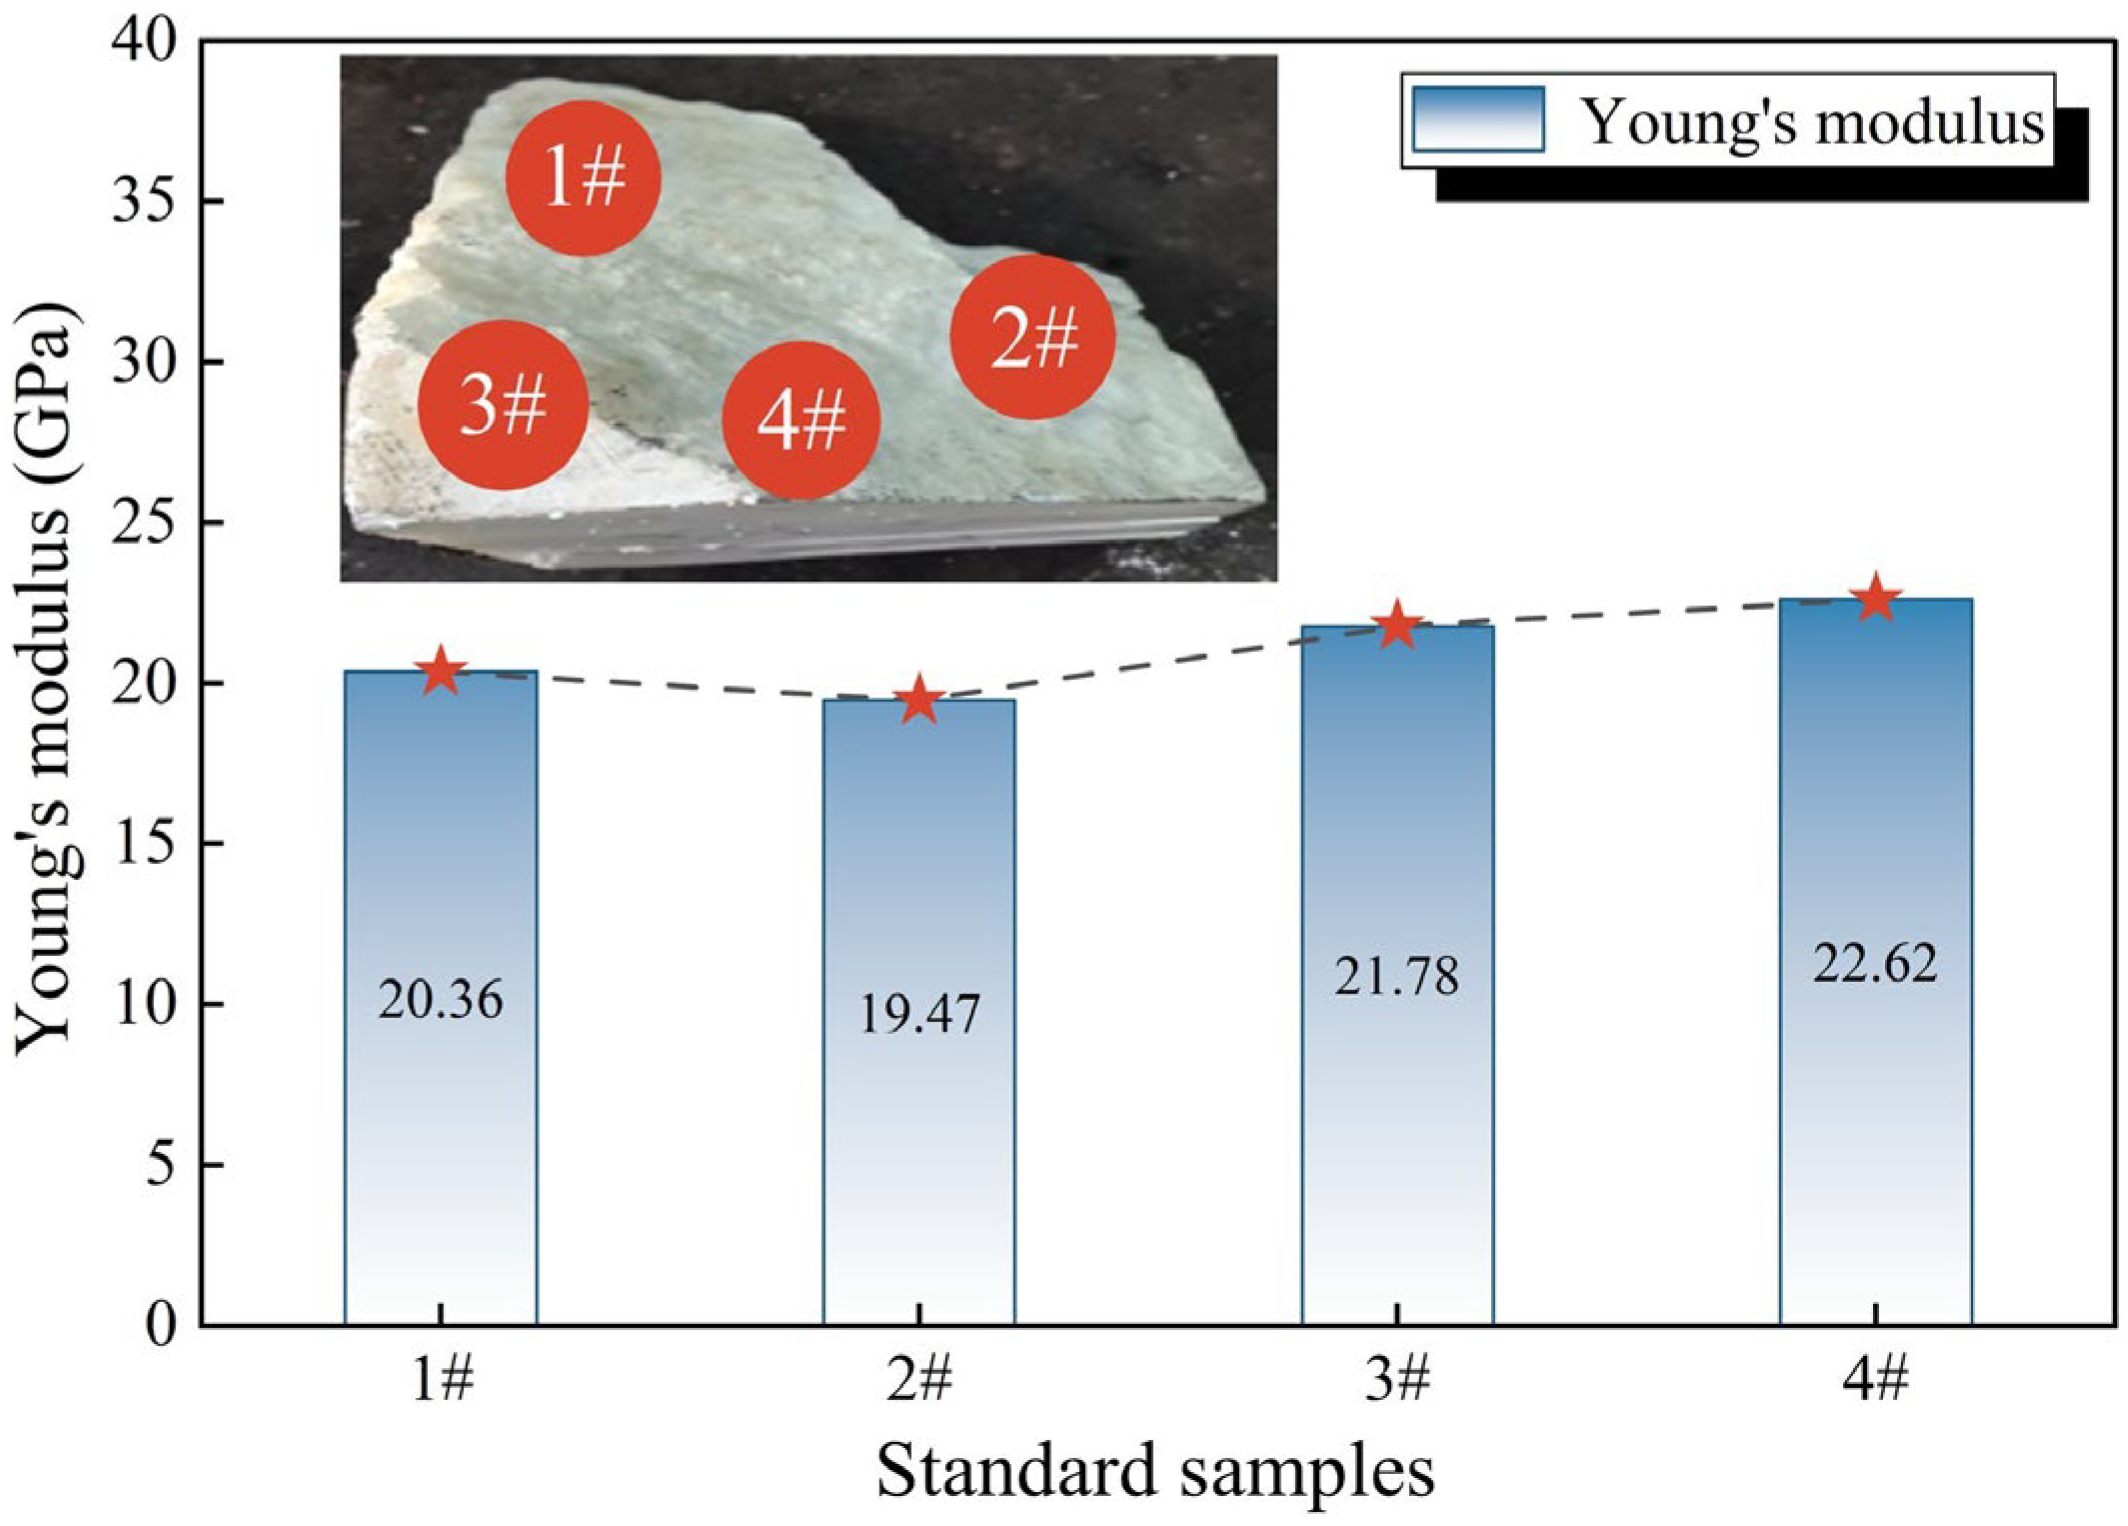
Before commencing carving, mechanical testing was conducted on freshly collected carbonate rock samples. Standard samples (5.0 cm in length and 2.54 cm in diameter) were drilled from the four corners of the carbonate rock outcrop. Static uniaxial compressive strength tests were conducted at room temperature. Young’s modulus values for the outcrop samples range from 19.47 GPa to 22.62 GPa (Figure 5), indicating that the samples are suitable for sample preparation via an engraving machine.
Figure 5.
Uniaxial rock mechanics test results.
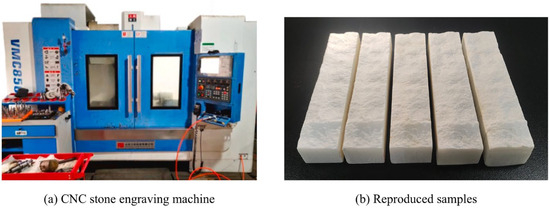
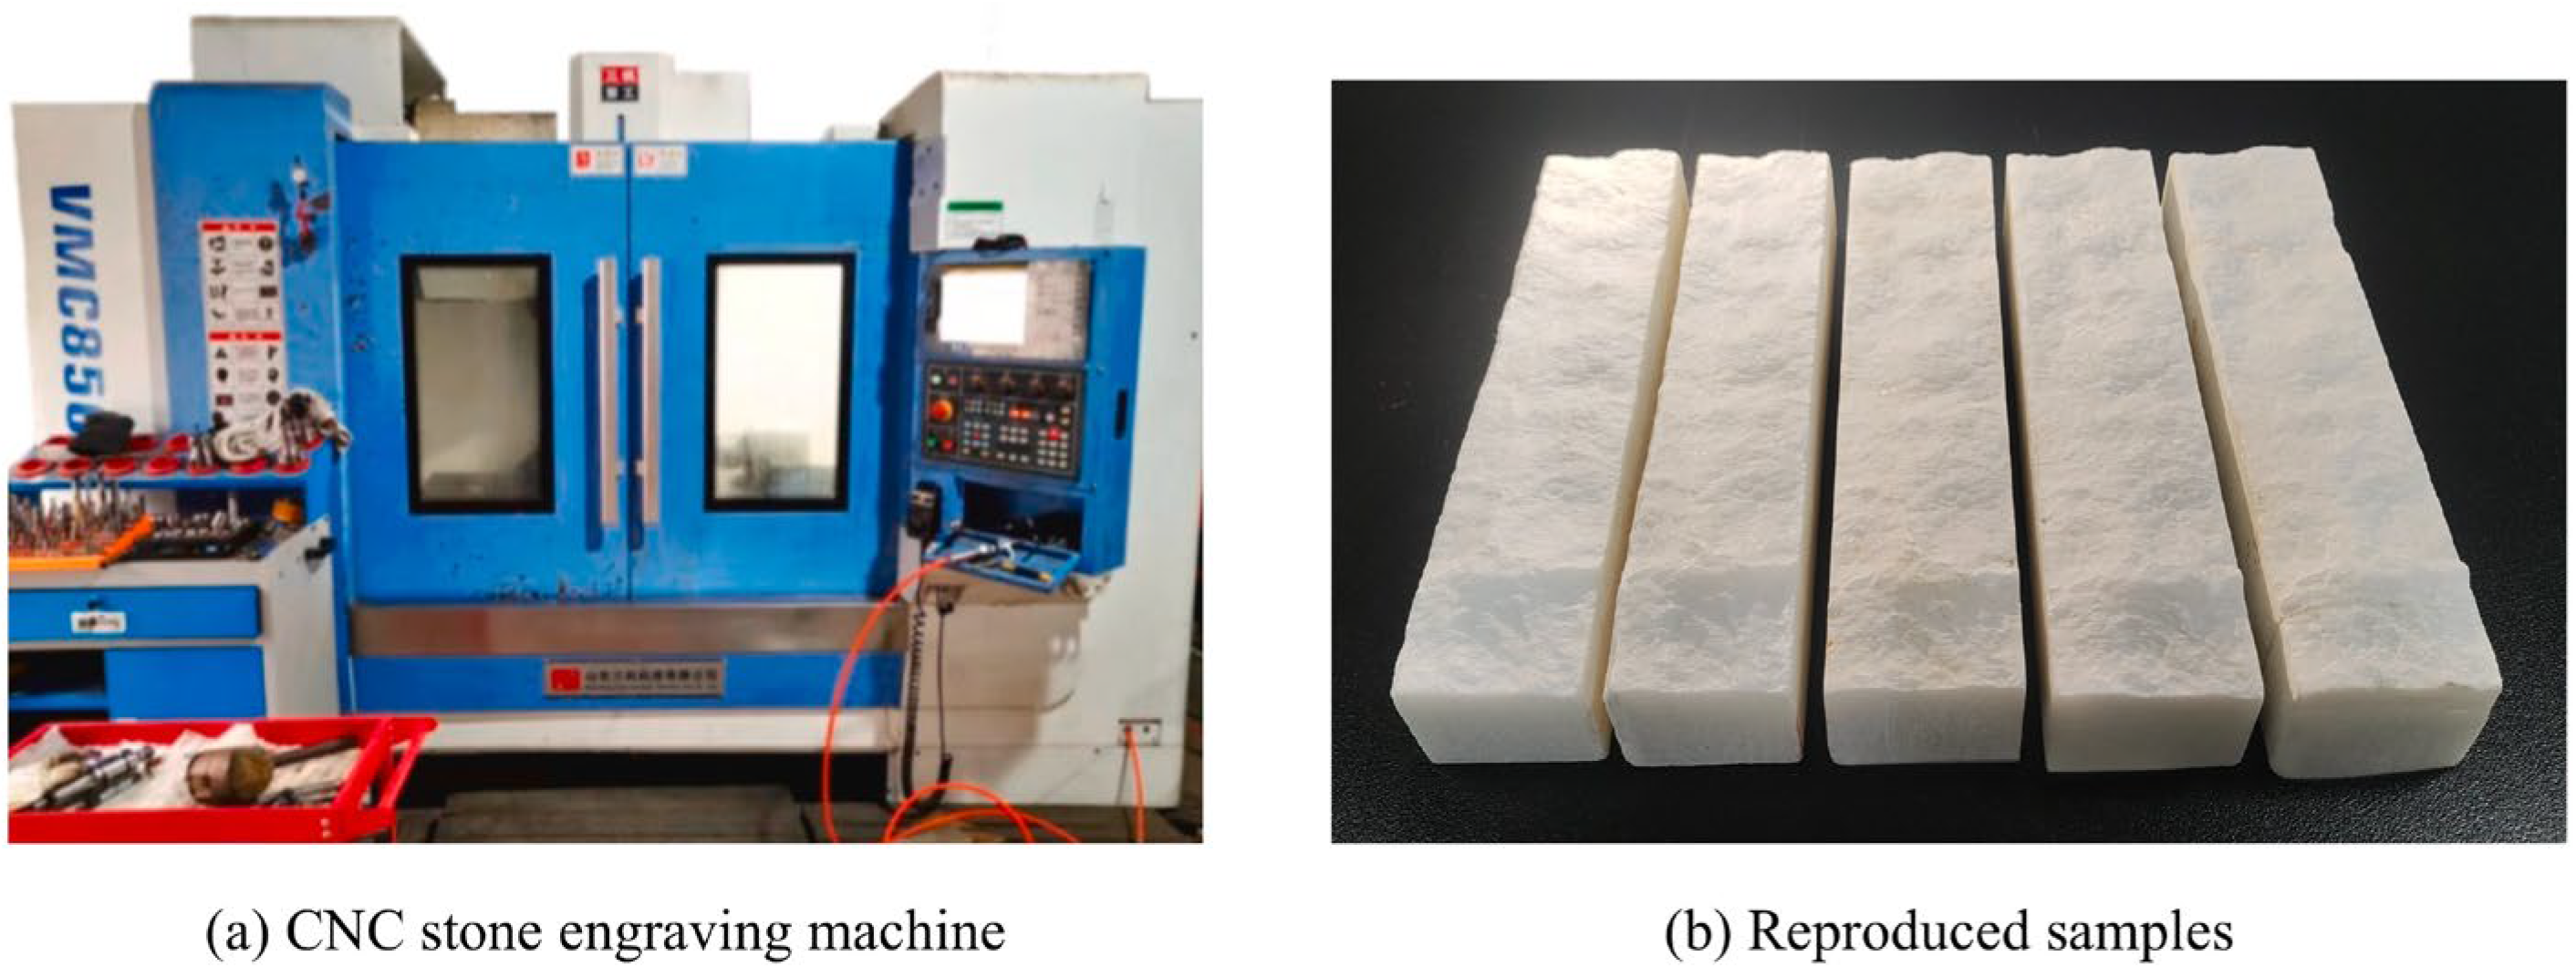
The finished product, after processing by a CNC (Computer Numerical Control) stone carving machine, is shown in Figure 6. Close comparison reveals that the fracture surface of the carved rock samples bears a striking resemblance to the surface morphology of the original rock sample.
Figure 6.
Engraving machine and the engraved reproductions.
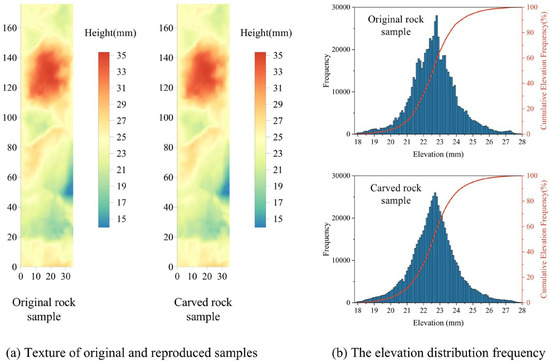
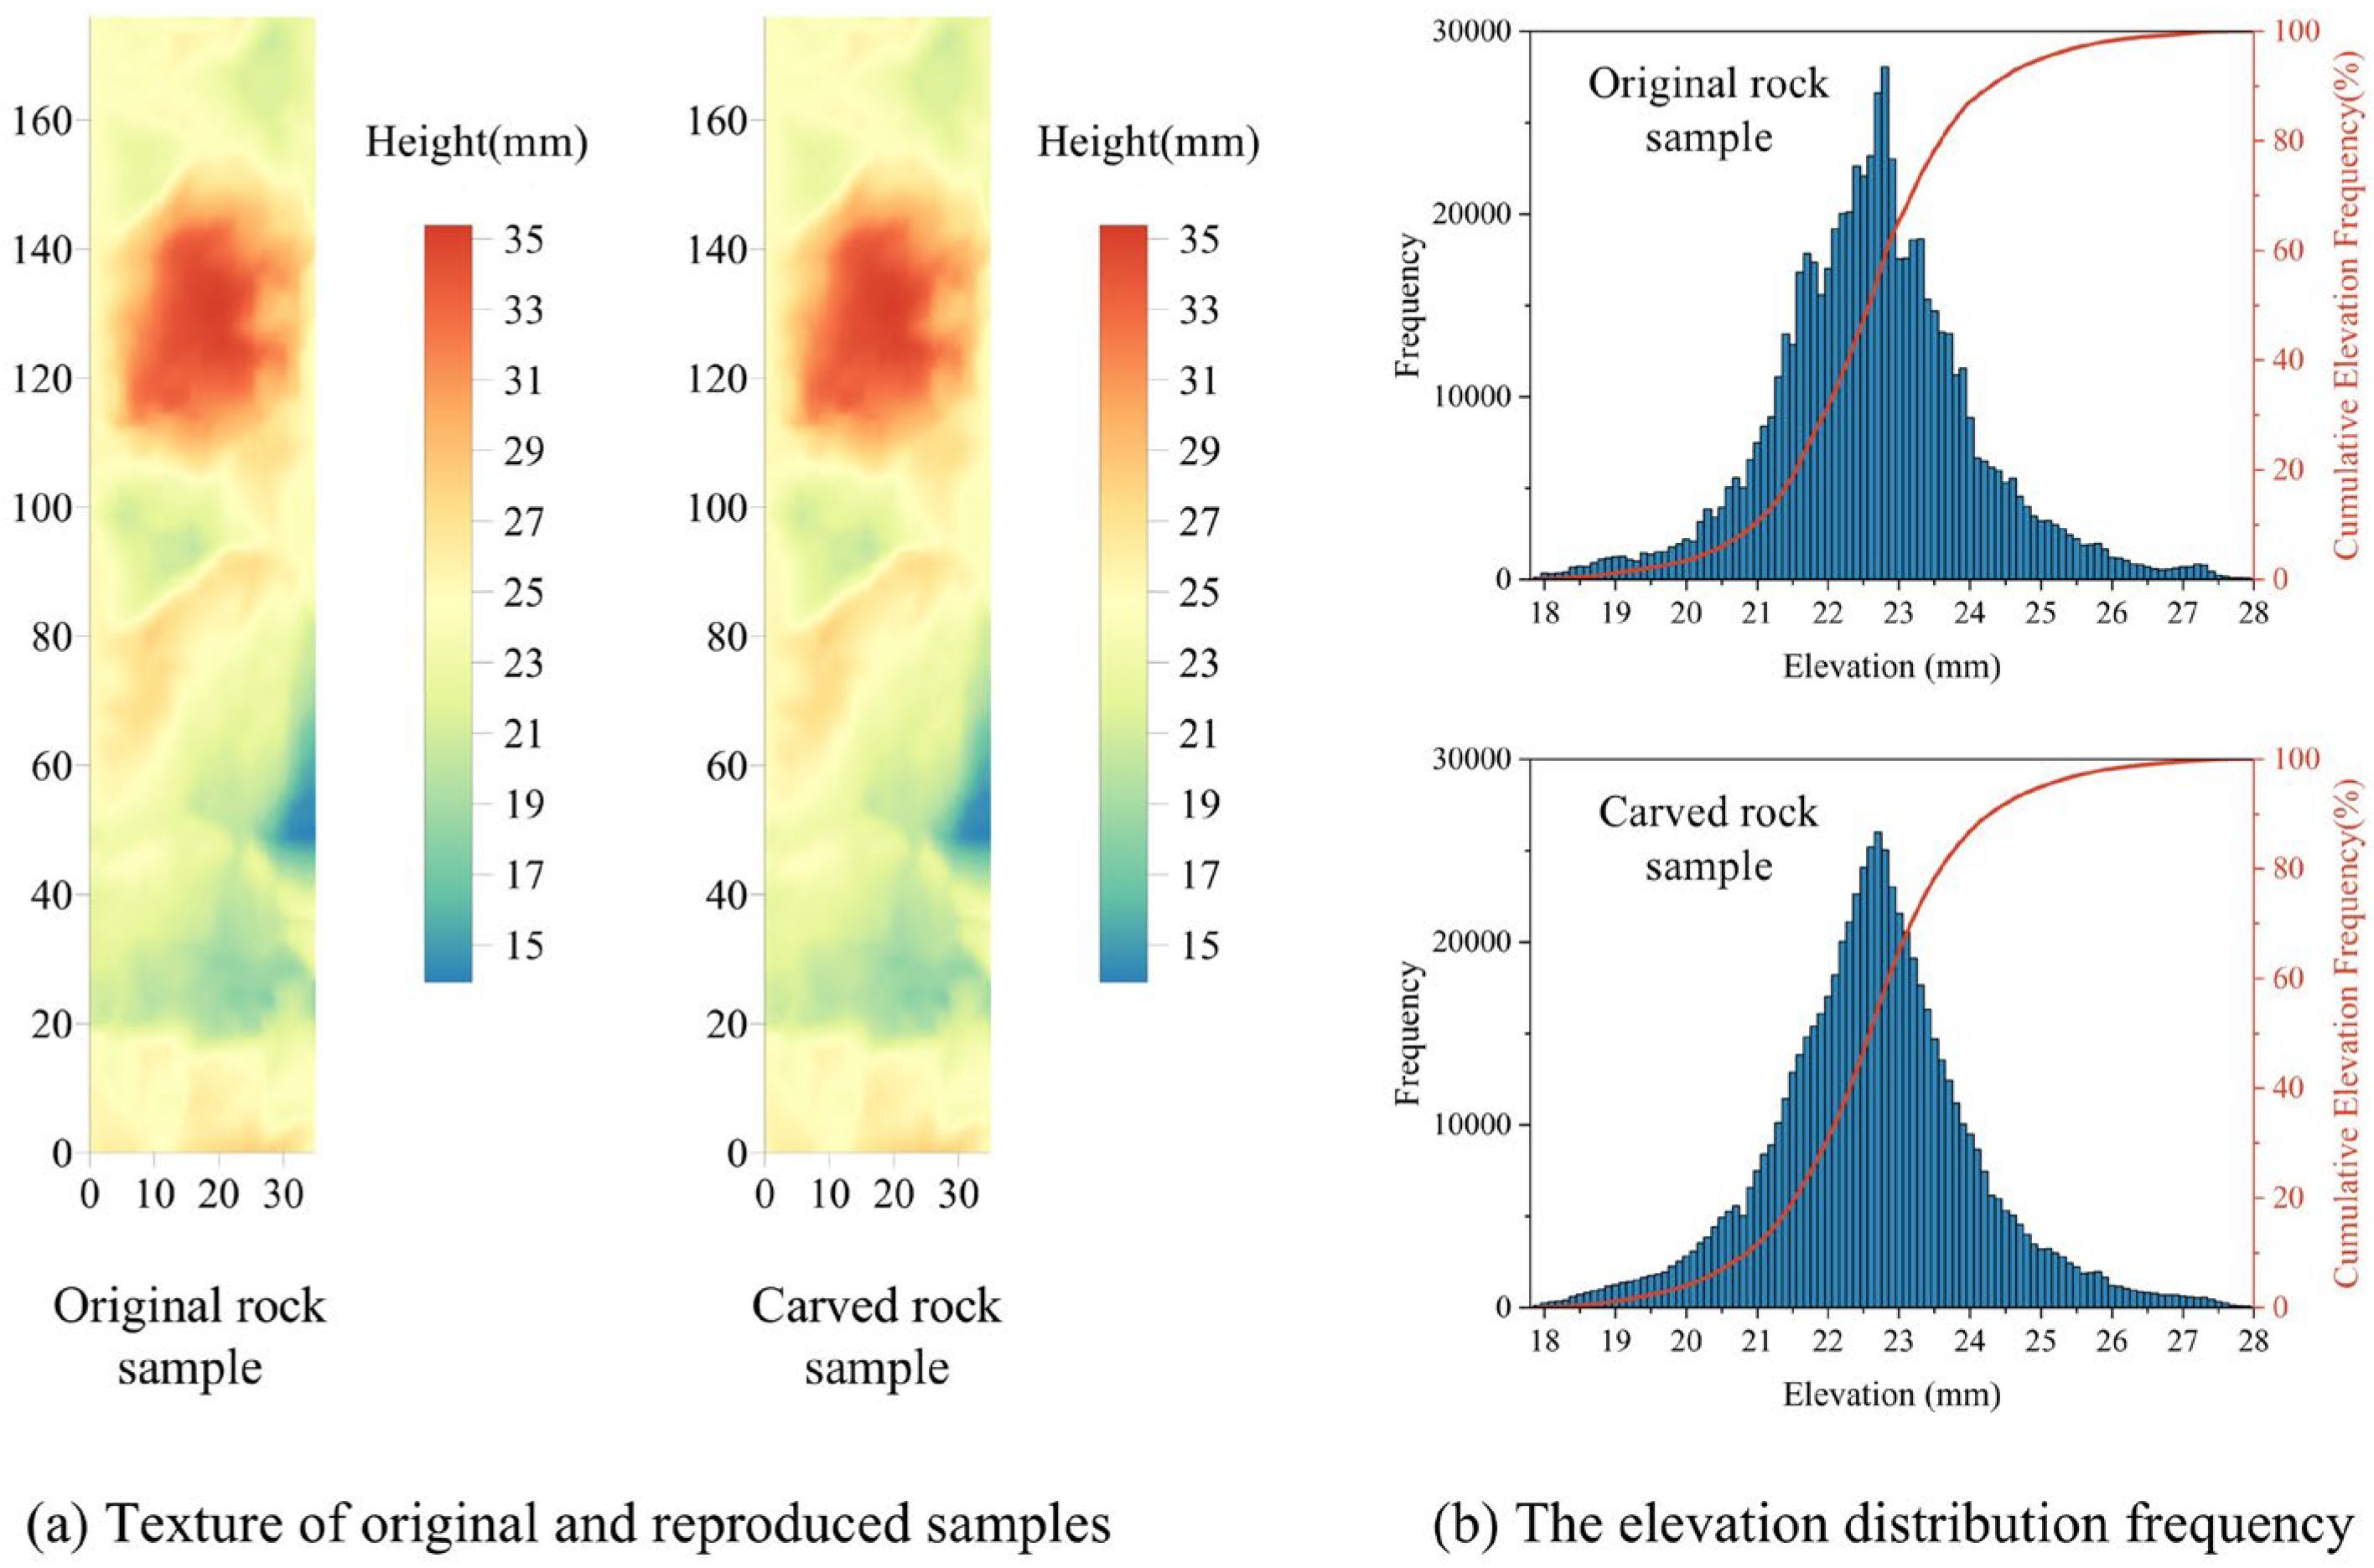
To further quantify and validate the similarity in fracture morphology between the original natural fracture rock samples and the engraved fracture rock samples, both types of specimens were scanned. Their area curvature indices were computed separately (see Figure 7). The results show a negligible difference in area curvature between the natural fracture surface and the engraved surface, with a deviation of approximately 0.25%. Additionally, a comparison of the elevation distribution frequencies of the natural and engraved fracture surfaces revealed that the morphology and elevation distribution of the engraved rock specimen closely approximated the overall trend of the natural fracture specimen. These findings confirm that the engraved specimens meet the requirements for acid etching experiments.
Figure 7.
Comparison between the original and reproduced (Type A) fracture morphology. (The red line represents the cumulative elevation distribution frequency percentage.)
2.2. Acid Fluid
The experimental study employed a gelled acid system, which serves as the primary acid fluid system for acid fracturing. A gelling agent, usually polyacrylamide, was added to hydrochloric acid to increase the viscosity of the acid and slow down the acid–rock reaction rate. However, it was mainly used to etch open fractures and create conductivity. The formula of the gelled acid used in this experiment is listed in Table 3.
Table 3.
Formula of acid fluid used in the experiment.
2.3. Experimental Scheme
2.3.1. Experimental Scheme Design
The experiment was conducted at 60 °C, consistent with reservoir temperatures. Employing the Reynolds number similarity criterion, the acid injection rate was scaled down from the field scale (m3/min) to the laboratory scale (mL/min) via the following equation [22]:
where ql denotes the acid injection rate at the laboratory scale; qf denotes the acid injection rate at the field scale; hl denotes the rock slab width; wf denotes the formation fracture width; hf denotes the formation fracture height; n denotes the power-law exponent, determined from acid rheology test data, n = 0.159; and wl denotes the fracture width of the experimental specimen. As shown in Table 4, the corresponding results for acid injection rates were calculated by scaling down the field-scale rates to laboratory-scale rates using Equation (2).
Table 4.
Results of acid injection rate scaled down from field scale to experiment scale.
Flow is an important driving force for mass transfer, determining the rate, pathway, and efficiency of mass transfer, and there is a clear correlation between the two. In this experiment, the Reynolds number similarity criterion was adopted to scale down the acid injection rate from the field scale (m3/min) to the laboratory scale (mL/min) to maintain consistent hydrodynamic conditions. Based on this correlation, the mass transfer effects at the laboratory and field scales are implicitly scaled similarly.
Acid–rock reactions belong to the category of reactive solute transport problems and are commonly studied using dimensionless numbers such as the Reynolds number (Re), Péclet number (Pe), and Damköhler number (Da). As shown in Table 5, Dijk and Berkowitz [30] classified Pe and Da into three basic levels, low, medium, and high, and further identified four typical scenarios. The first two scenarios are advection-dominated, while the latter two are chemical-reaction-dominated; at the field scale, the calcite–HCl reaction is diffusion–mass-transfer-dominated [29], corresponding to the medium-Pe and low-Da scenario. Based on the experimental test data in this study, the reaction rate constant k1 = 6.623 × 10⁻⁵ s−1, fracture aperture = 2 mm, rock sample density = 1200 kg·m−3, viscosity = 0.02 Pa·s, and H+ diffusion coefficient = 6.5 × 10⁻⁹ m2·s−1. Using Equations (3)–(7), the initial effective Péclet number (Peeff,0) and initial effective Damköhler number (Daeff,0) are calculated to be 0.987 and 1.112 × 10⁻⁴, respectively. These values fall under the medium-Pe and low-Da condition, which is consistent with field-scale observations.
where Dm is the solute diffusion coefficient; umax is the local maximum transverse velocity; is the local hydraulic head gradient along the fracture direction; μ is the dynamic fluid viscosity; ρs is the density of the solid wall; ρ is the density of the solution; csat is the solute concentration of the saturated fluid; b is the fracture aperture; k1 is the first-order kinetic reaction constant; Pe (Péclet number) characterizes the relative importance of convection compared to diffusion in solute transport; and Da (Damköhler number) characterizes the relative importance of acid–rock chemical reactions compared to mass transport.
Table 5.
Parameter values of rough fracture in different cases.
Based on the established experimental injection rate and temperature, experiments were conducted to investigate the influence of the initial fracture morphology and acid injection rate on the acid-etched fracture morphology and conductivity. As shown in Table 6, nine sets of experiments were performed. The morphological characteristics and conductivity of acid-etched fractures were investigated under varying initial morphologies (Type A, B, and C), acid injection rates (250, 350, and 450 mL/min), and acid injection times (30, 40, and 50 min).
Table 6.
Experimental scheme of acid etching. (# denotes the experimental number.)
2.3.2. Experimental Procedure
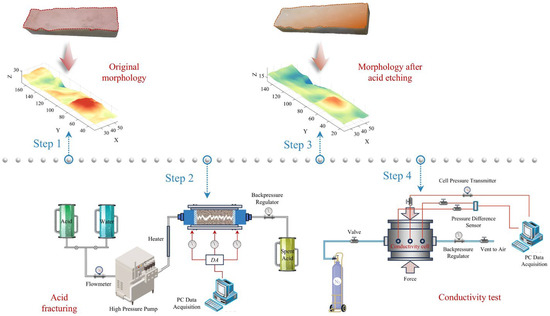
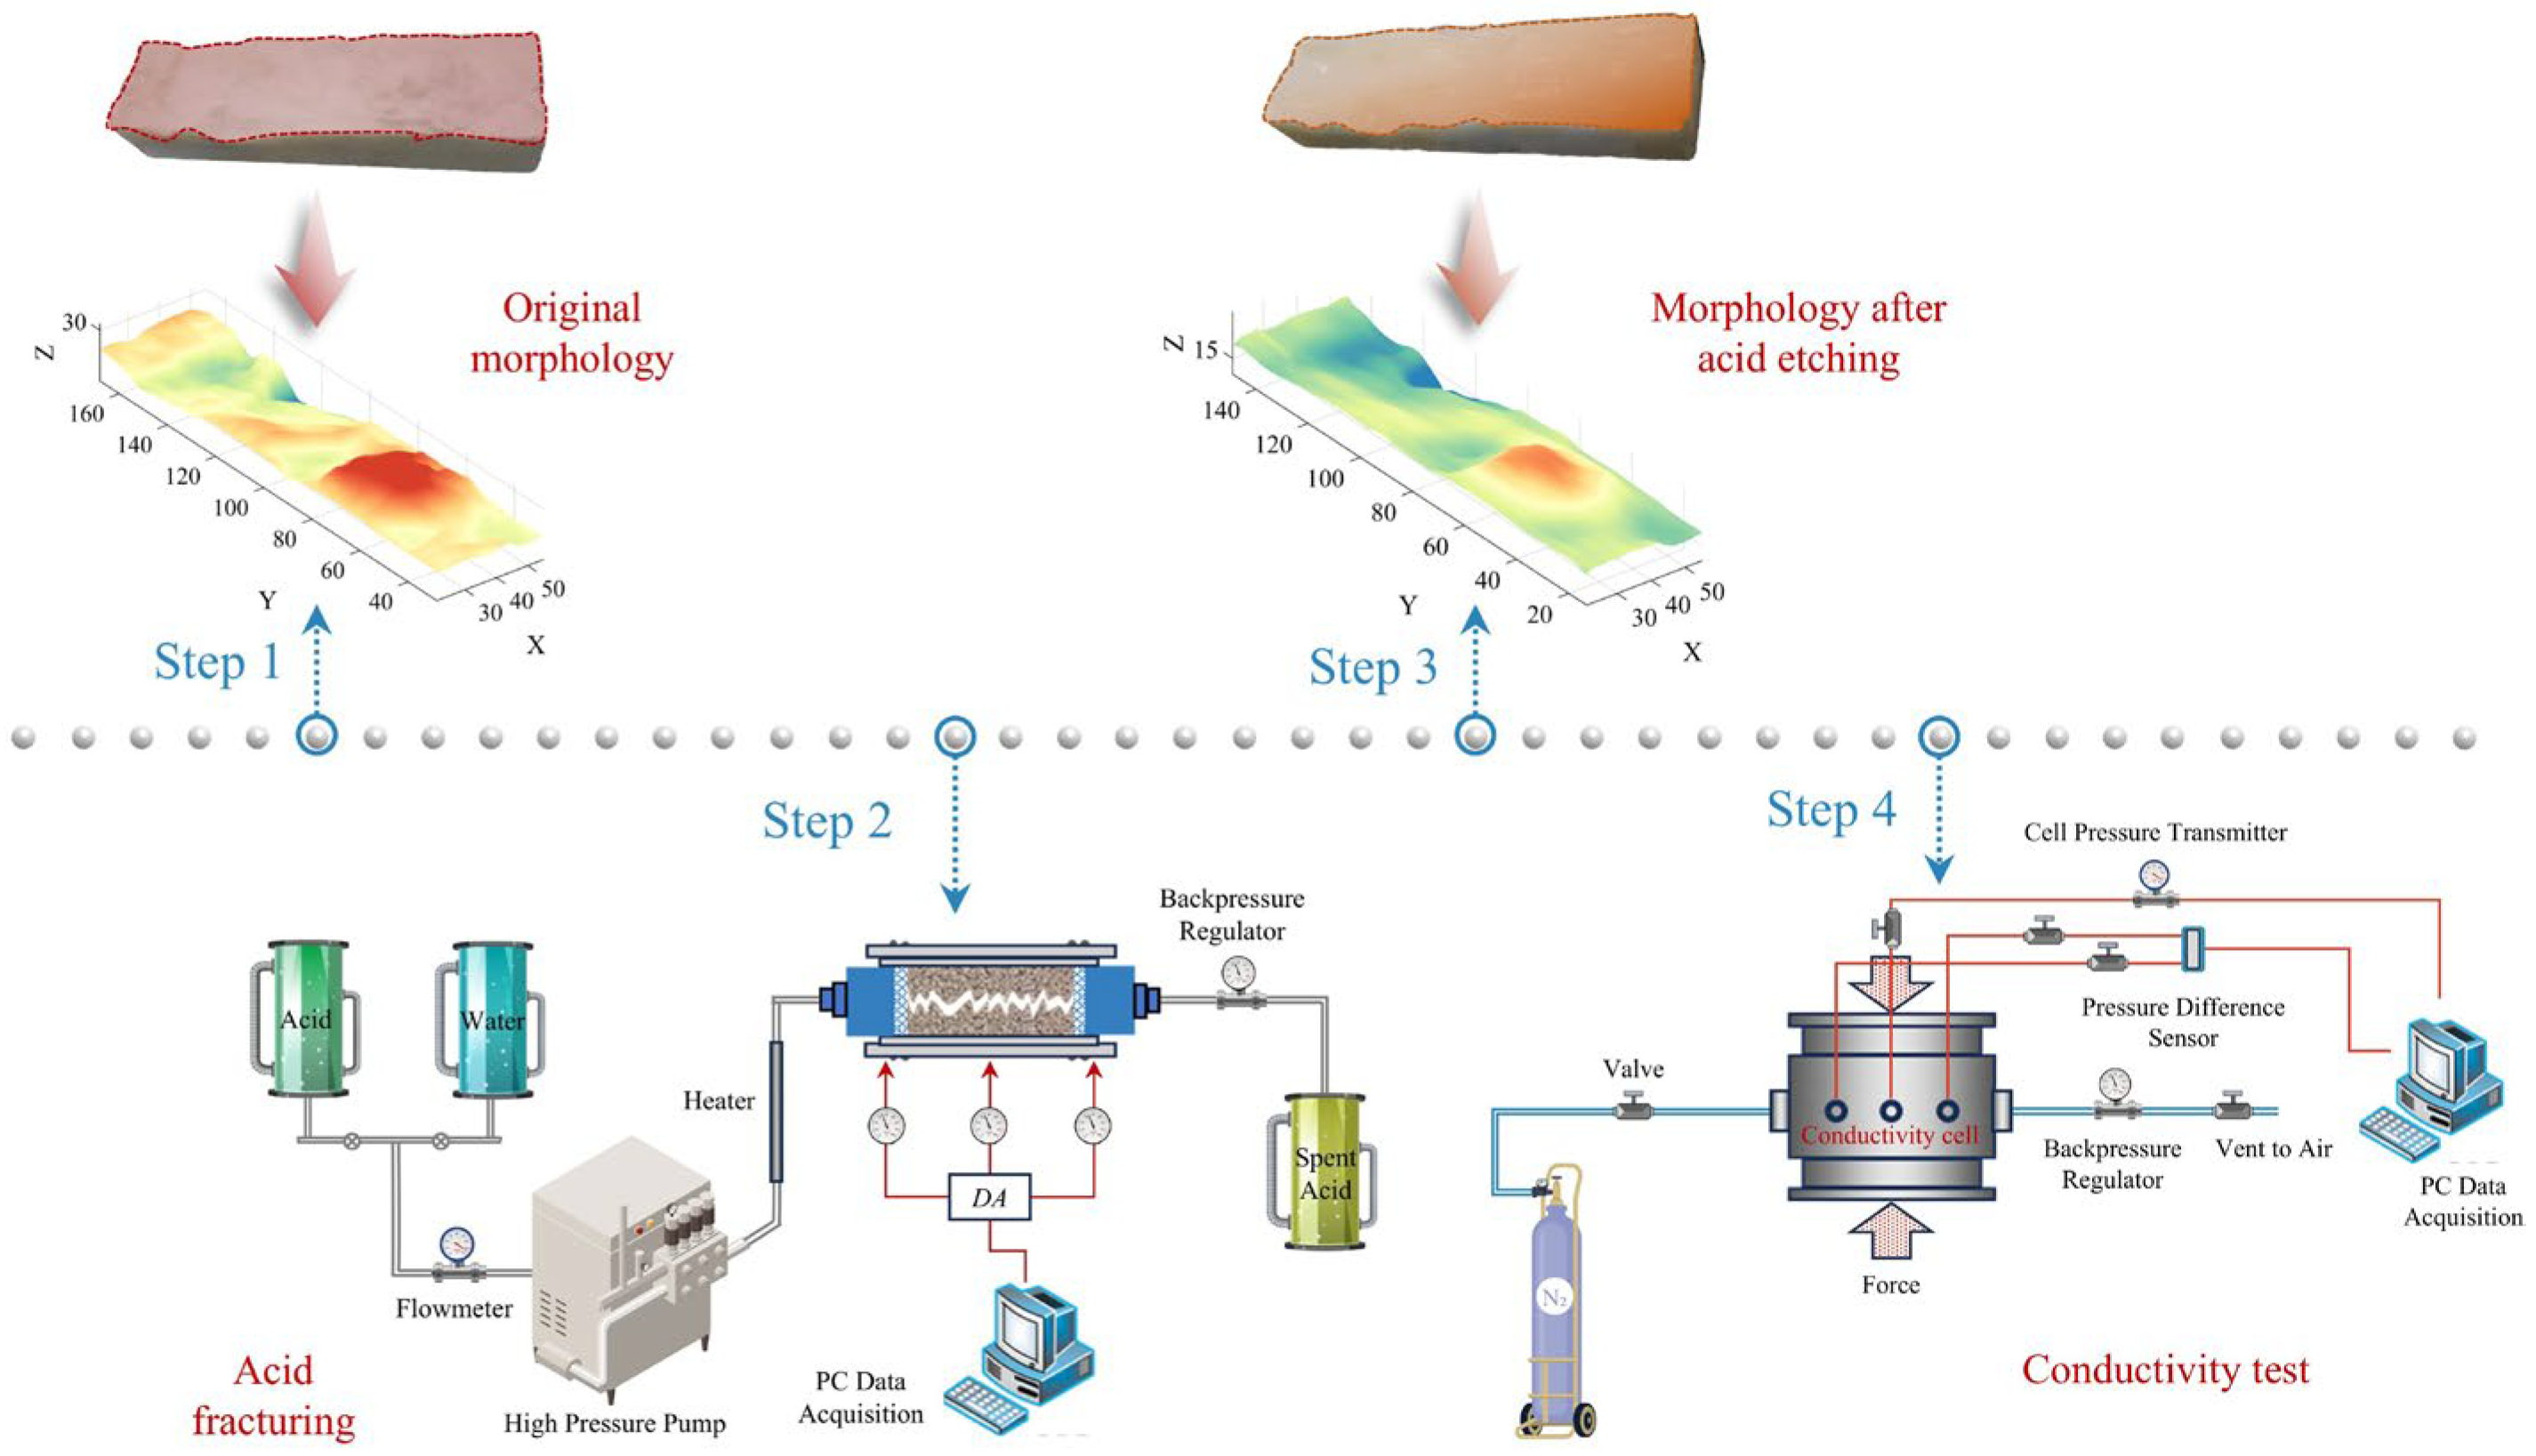
The primary sequence of the entire experimental process is as follows (Figure 8):
Figure 8.
Experimental procedure.
- (1)
- Step 1: Each slab’s initial rough fracture surface was scanned using a 3D laser scanning device. This step was crucial in assessing the alterations in the fracture morphology.
- (2)
- Step 2: A pair of rough slabs was positioned within the reaction cell of the acid etching apparatus. Upon attaining the predetermined temperature for a specific acid system, the appropriate acid formulations were sequentially pumped into the fracture according to the experimental design.
- (3)
- Step 3: Once removed from the acid etching device, the slabs were scanned by the 3D laser scanning device to capture the post-acid-etching surface characteristics.
- (4)
- Step 4: Lastly, the acid-etched fracture conductivity was measured by the conductivity test device.
3. Results and Discussion
3.1. Effect of Initial Fracture Surfaces
3.1.1. Characteristics of Acid-Etched Fracture Surfaces
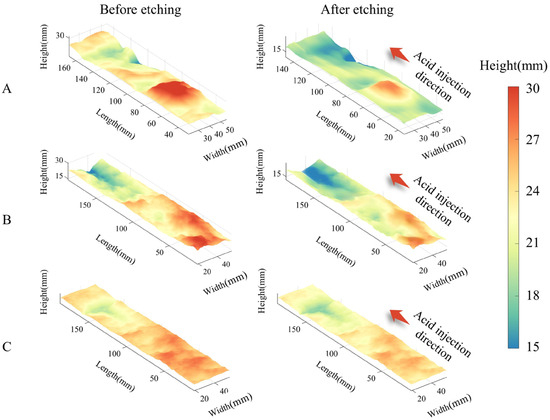
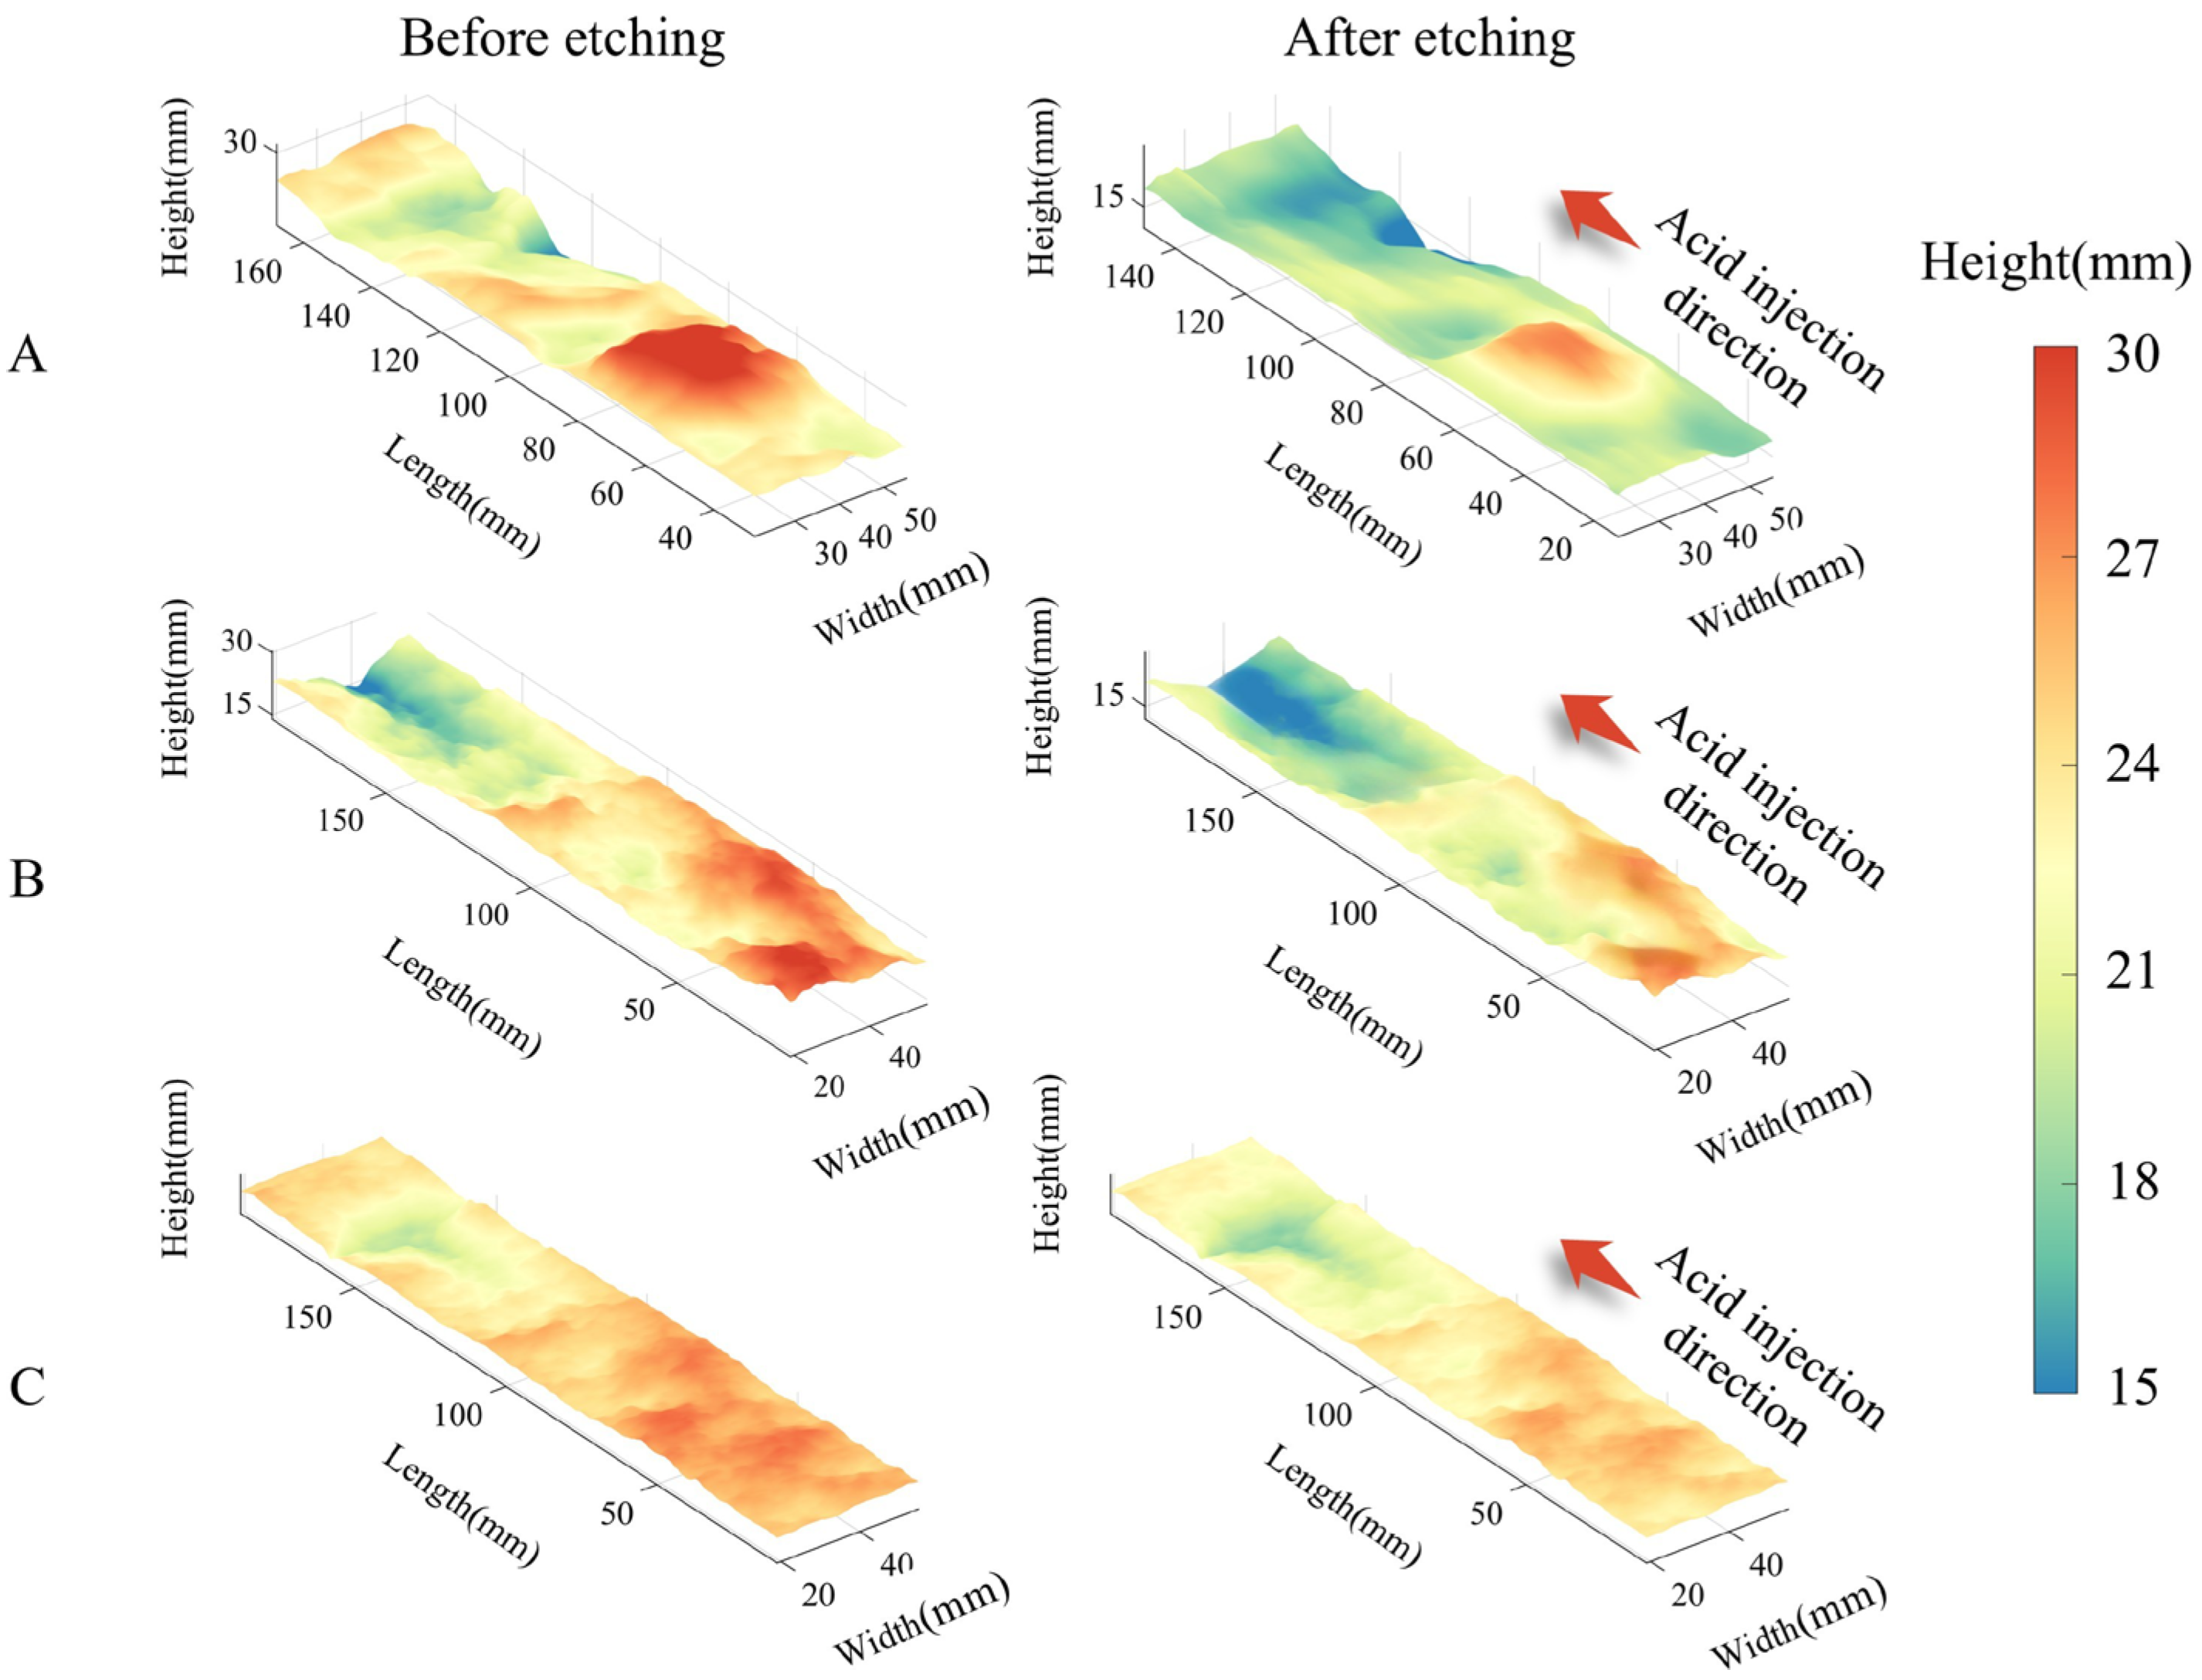
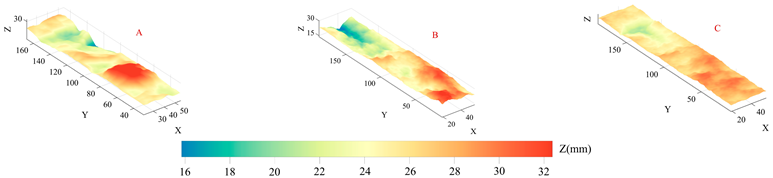
Surface scanning was performed on each rock slab before and after acid treatment to evaluate the acid etching pattern [31,32], with color bars indicating the relief height of the fracture surfaces (Figure 9).
Figure 9.
Etched profiles of rough fracture surfaces before and after injection of gelling acid at 350 mL/min injection rate. (A) Type A fracture surface; (B) Type A fracture surface; (C) Type C fracture surface.
Figure 9 illustrates the morphological changes before and after acid etching for different initial fracture surfaces under identical acid injection rates. The acid solution markedly dissolves the rough fracture surfaces. Prior to acid etching, the rough rock surface exhibited pronounced undulations. After acid etching, the number of red-colored peaks diminished, with a reduction in protrusions. Conversely, numerous valleys darkened in color, transitioning from light green to deep green, while the depth of these areas became more pronounced. This etching phenomenon is reasonable compared with previous experimental findings [15,21,23].
To further quantitatively analyze the influence of the initial crack morphology on acid etching behavior, three parameters were selected for the quantitative characterization and analysis of the crack surface before and after acid etching: the elevation frequency distribution of the rock surface, the tortuosity of the fracture surface, and the initial aperture formed by contact at zero closure pressure.
3.1.2. Frequency Distribution of Fracture Surface Elevations
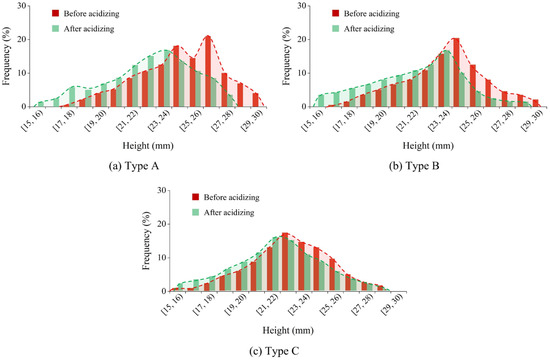
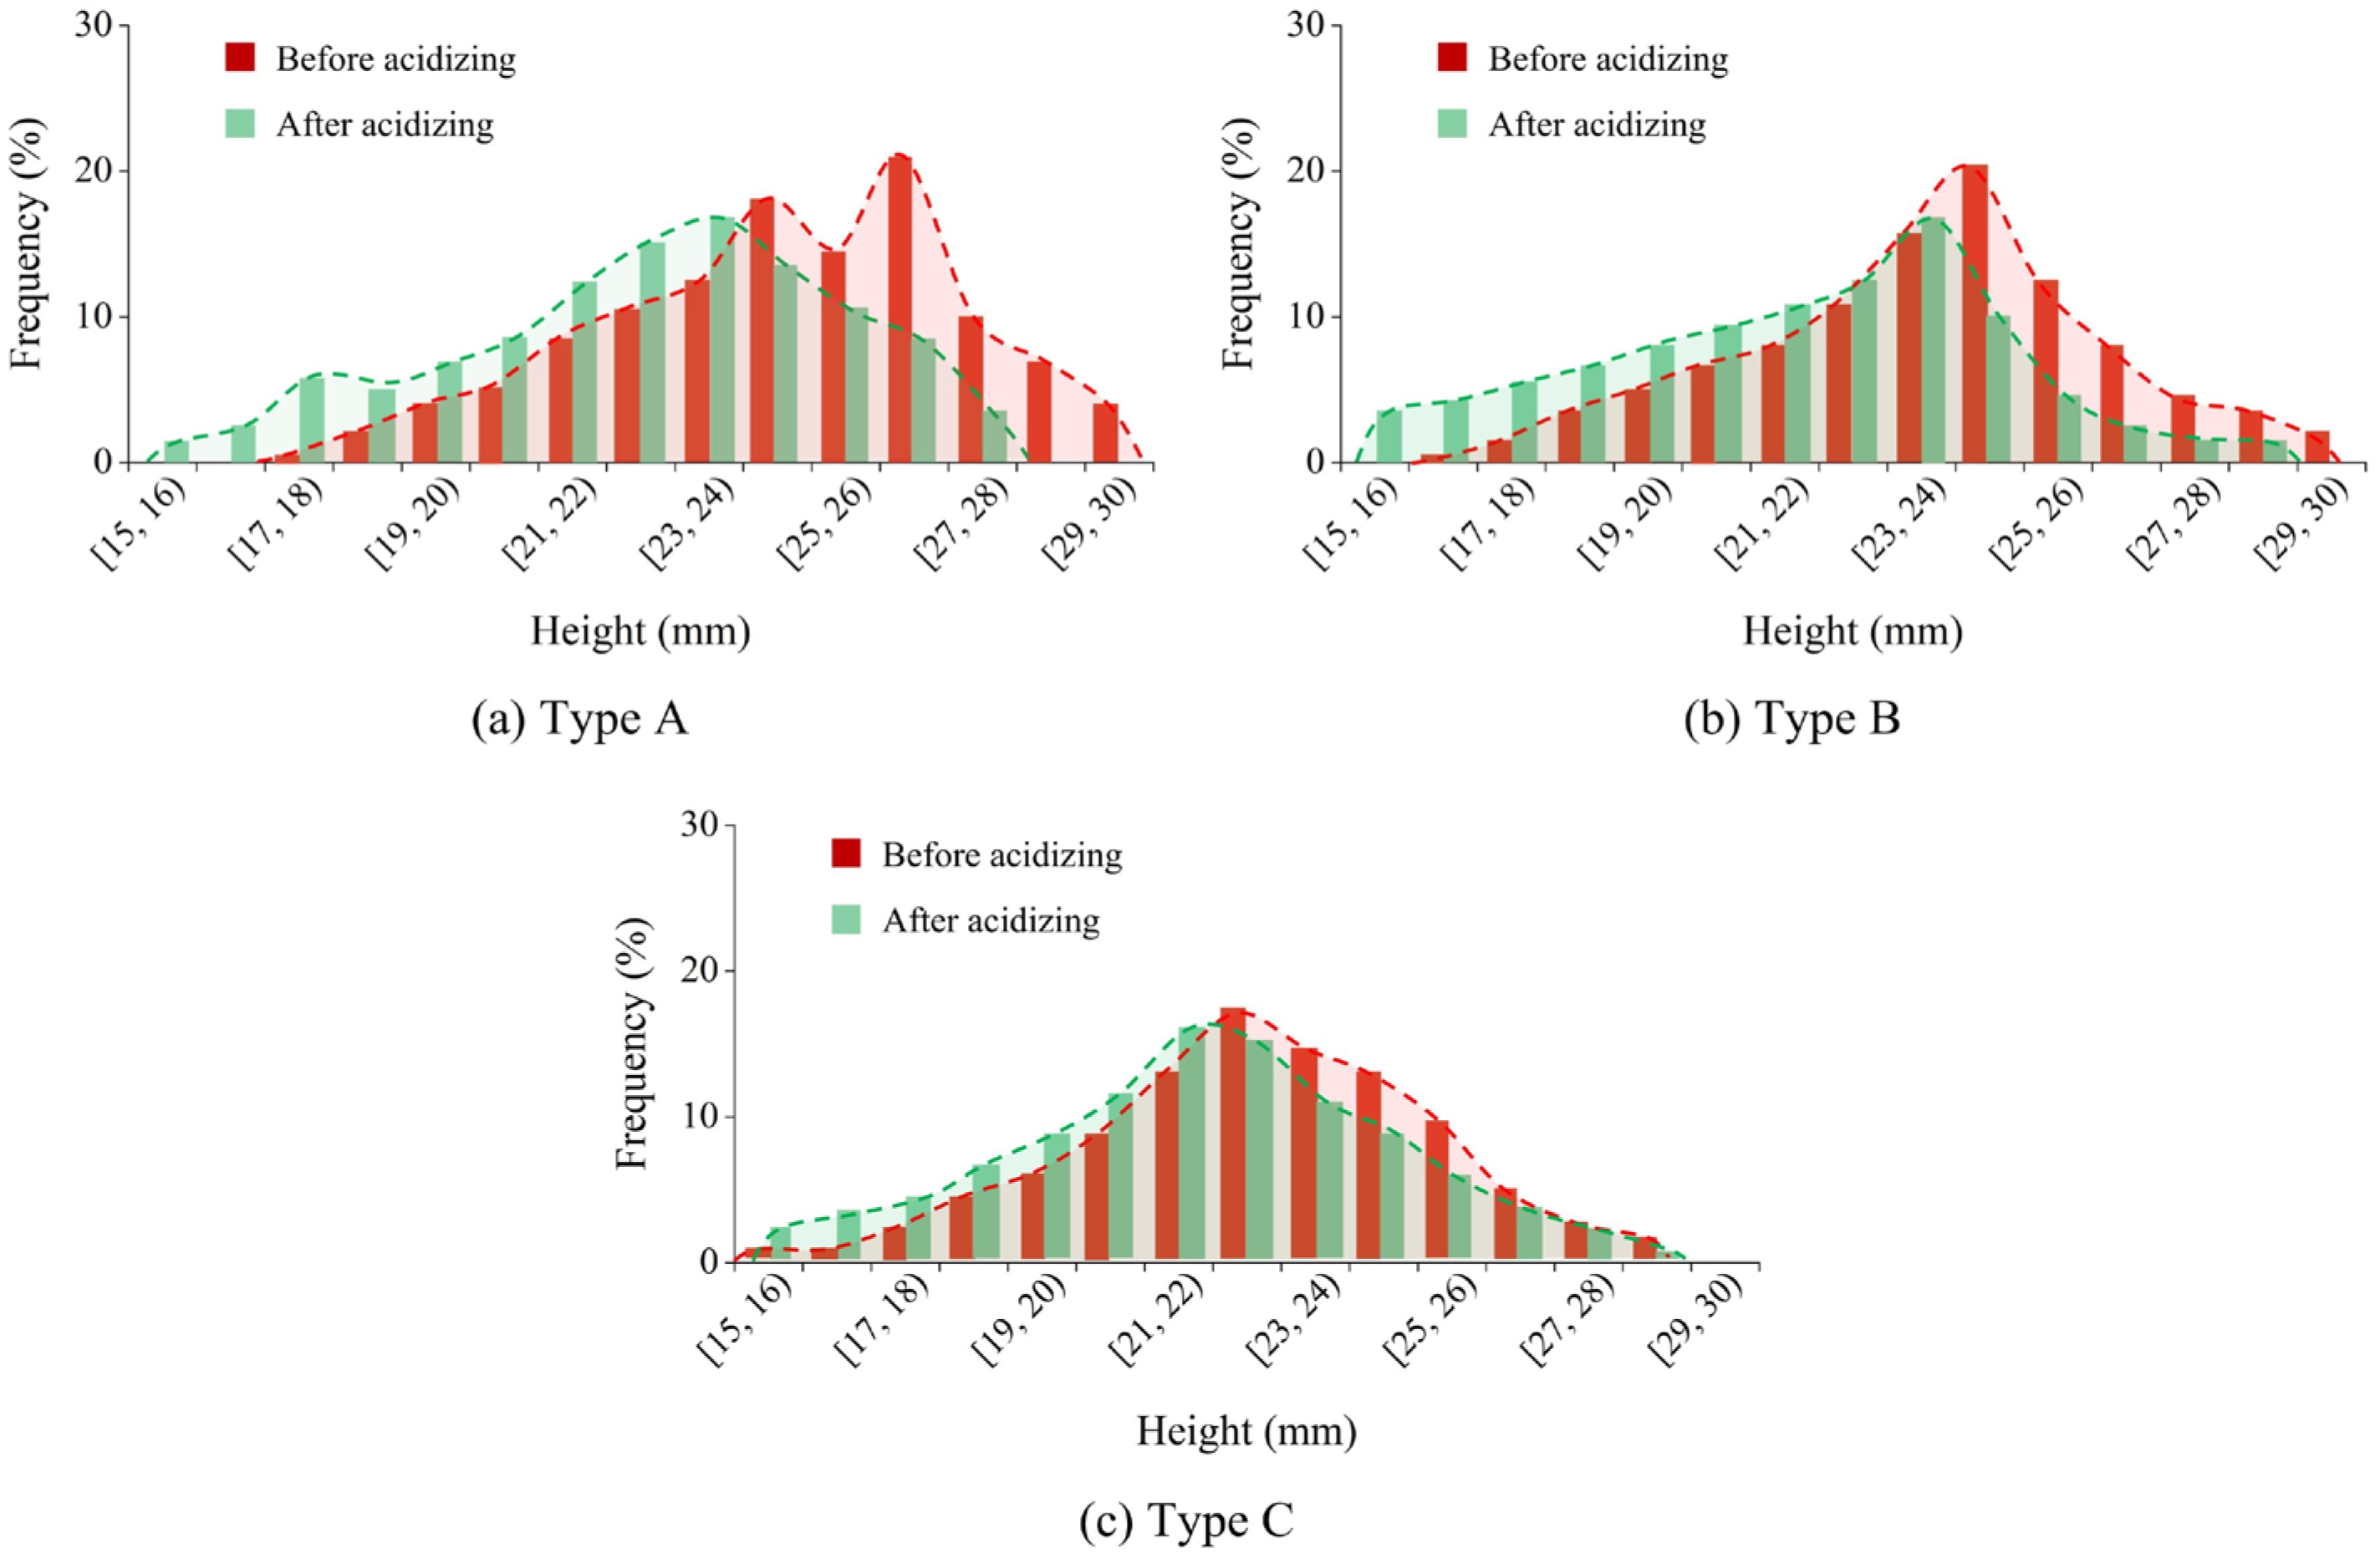
The elevation frequency distribution denotes the frequency with which surface points of a rock specimen occur within a specified height range. The elevation frequency distribution histogram and its corresponding curve provide a visual representation of the specimen’s surface roughness. Based on the elevation of fracture surfaces on rough rock plates ranging from 15 mm to 35 mm before and after acid etching (Figure 9), the elevation was divided into 15 intervals with a step size of 1 mm (Figure 10).
Figure 10.
Effect of initial fracture morphology on elevation frequency distribution of rough rock slabs before and after acid etching.
Figure 10 displays the elevation frequency distribution of rock samples with varying initial fracture morphologies before and after acid etching. It can be observed that prior to acid etching, the fracture surfaces of the rough rock slab exhibited a broad elevation distribution following a normal distribution. However, the elevation distribution ranges differed between fracture morphologies: higher roughness morphologies (Type A) exhibited higher elevation peaks, while lower roughness morphologies (Type B) exhibited lower elevation peaks. The elevation distribution after acid etching exhibits a “left shift” phenomenon. The frequency of high points decreases, while that of low points increases. The higher the roughness, the more pronounced the “left shift” in the elevation distribution of the etched morphology. This indicates that acid possesses the capacity to smooth high points and enlarge valleys or deeper regions on the fractured surfaces of a rough fracture [22,28]. This effect becomes more evident as roughness increases. This may be attributable to the turbulent effects generated when acid flows through rough fractures, where the irregular topography causes streamlines to become tortuous and the flow field undergoes severe disturbance [10].
3.1.3. Change in Fracture Surface Area Tortuosity
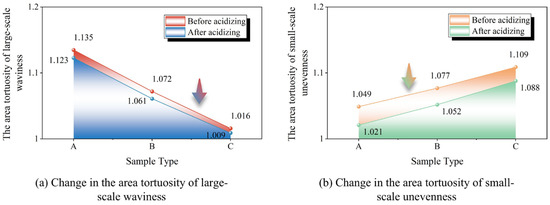
The area tortuosity of acid-etched samples with varying roughness was calculated using Equation (1) based on the post-etching crack surface area. This was quantitatively compared with pre-etching values (Table 7 and Figure 11). Tortuosity denotes the ratio of the actual fluid flow distance to the apparent flow distance, reflecting the complexity of the fracture surface. The original area tortuosity εa of all three rough rock samples decreased after acid etching, indicating a relative reduction in roughness. For each fracture surface, both the large-scale waviness area tortuosity εa1 and the small-scale unevenness area tortuosity εa2 decreased after acid etching. After acid etching, the large-scale waviness area tortuosity of the Type A fracture surface remained higher than that of the other two types of fracture, although exhibiting the lowest small-scale unevenness area tortuosity. Conversely, the Type C fracture surface displayed the highest small-scale unevenness area tortuosity and the lowest large-scale waviness area tortuosity.
Table 7.
Change in slabs’ surface area and tortuosity. (# denotes the experimental number.)
Figure 11.
Change in the area tortuosity of large-scale waviness and small-scale unevenness of each fracture surface. (The arrows indicate a decrease in the data value).
3.1.4. Initial Aperture
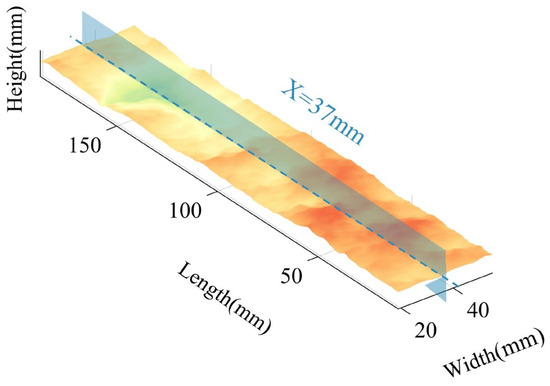
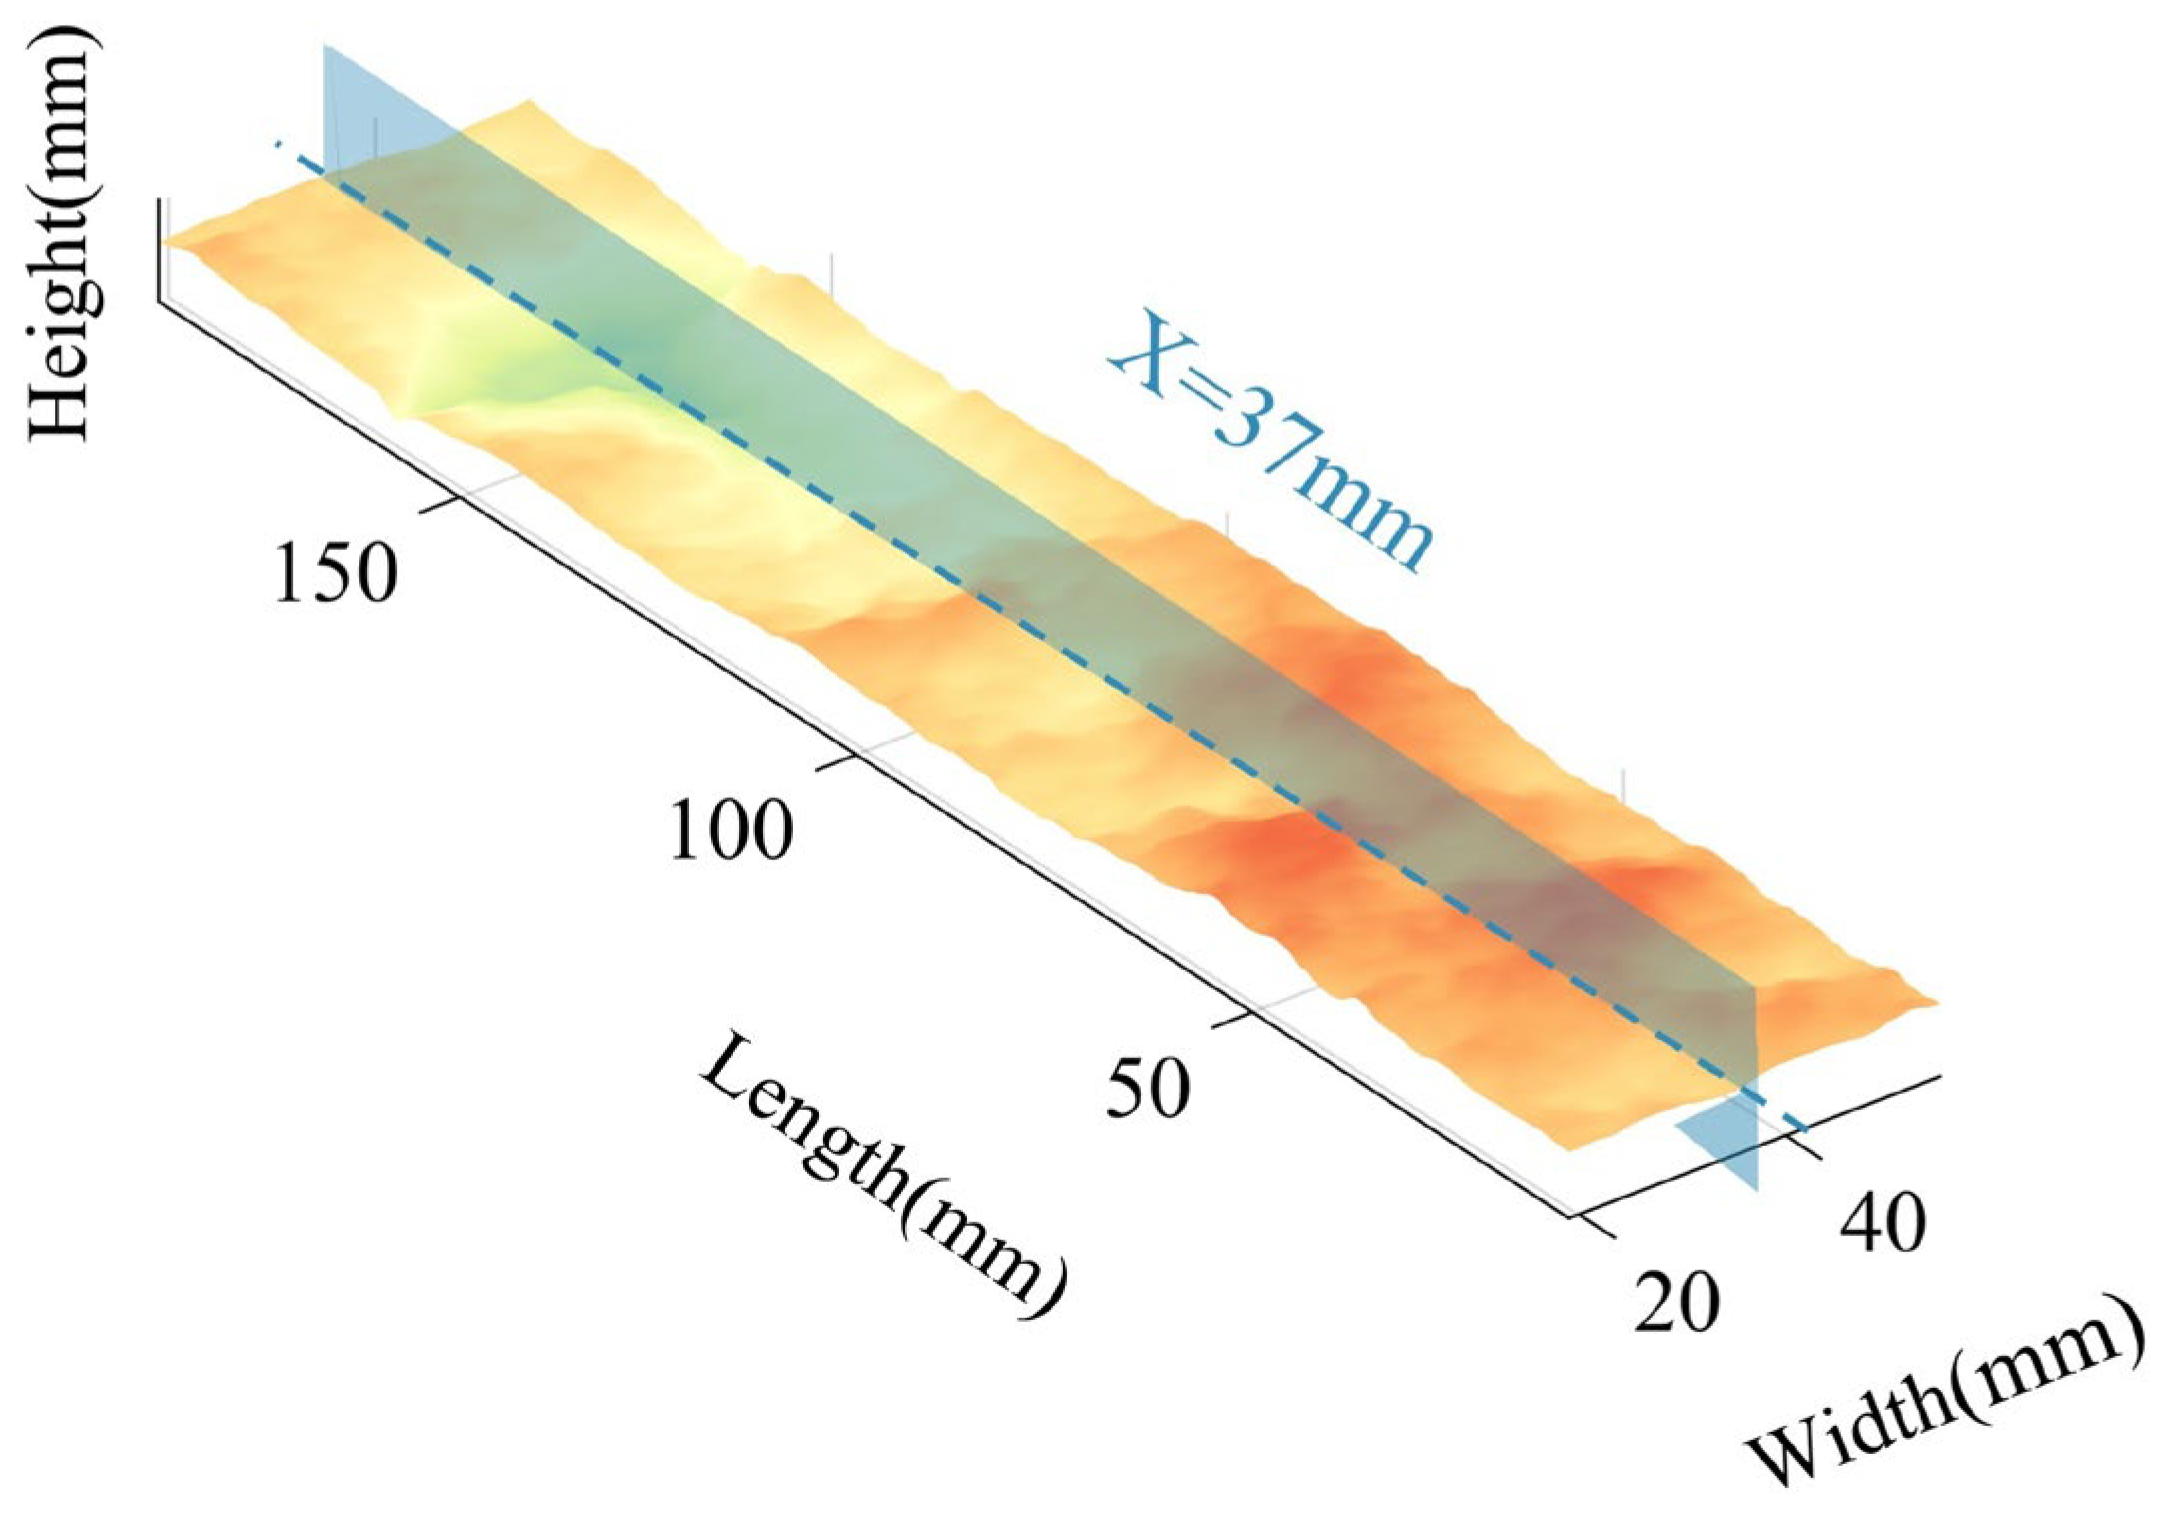
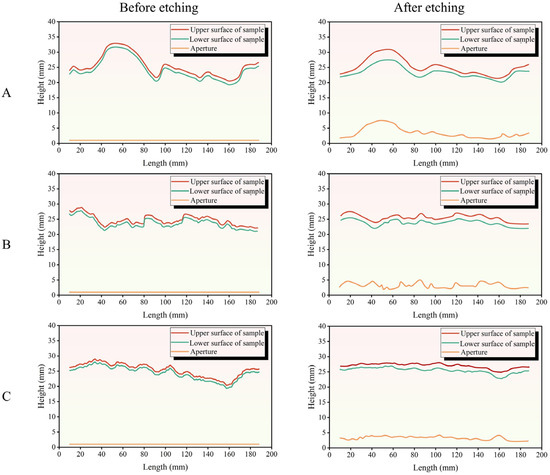
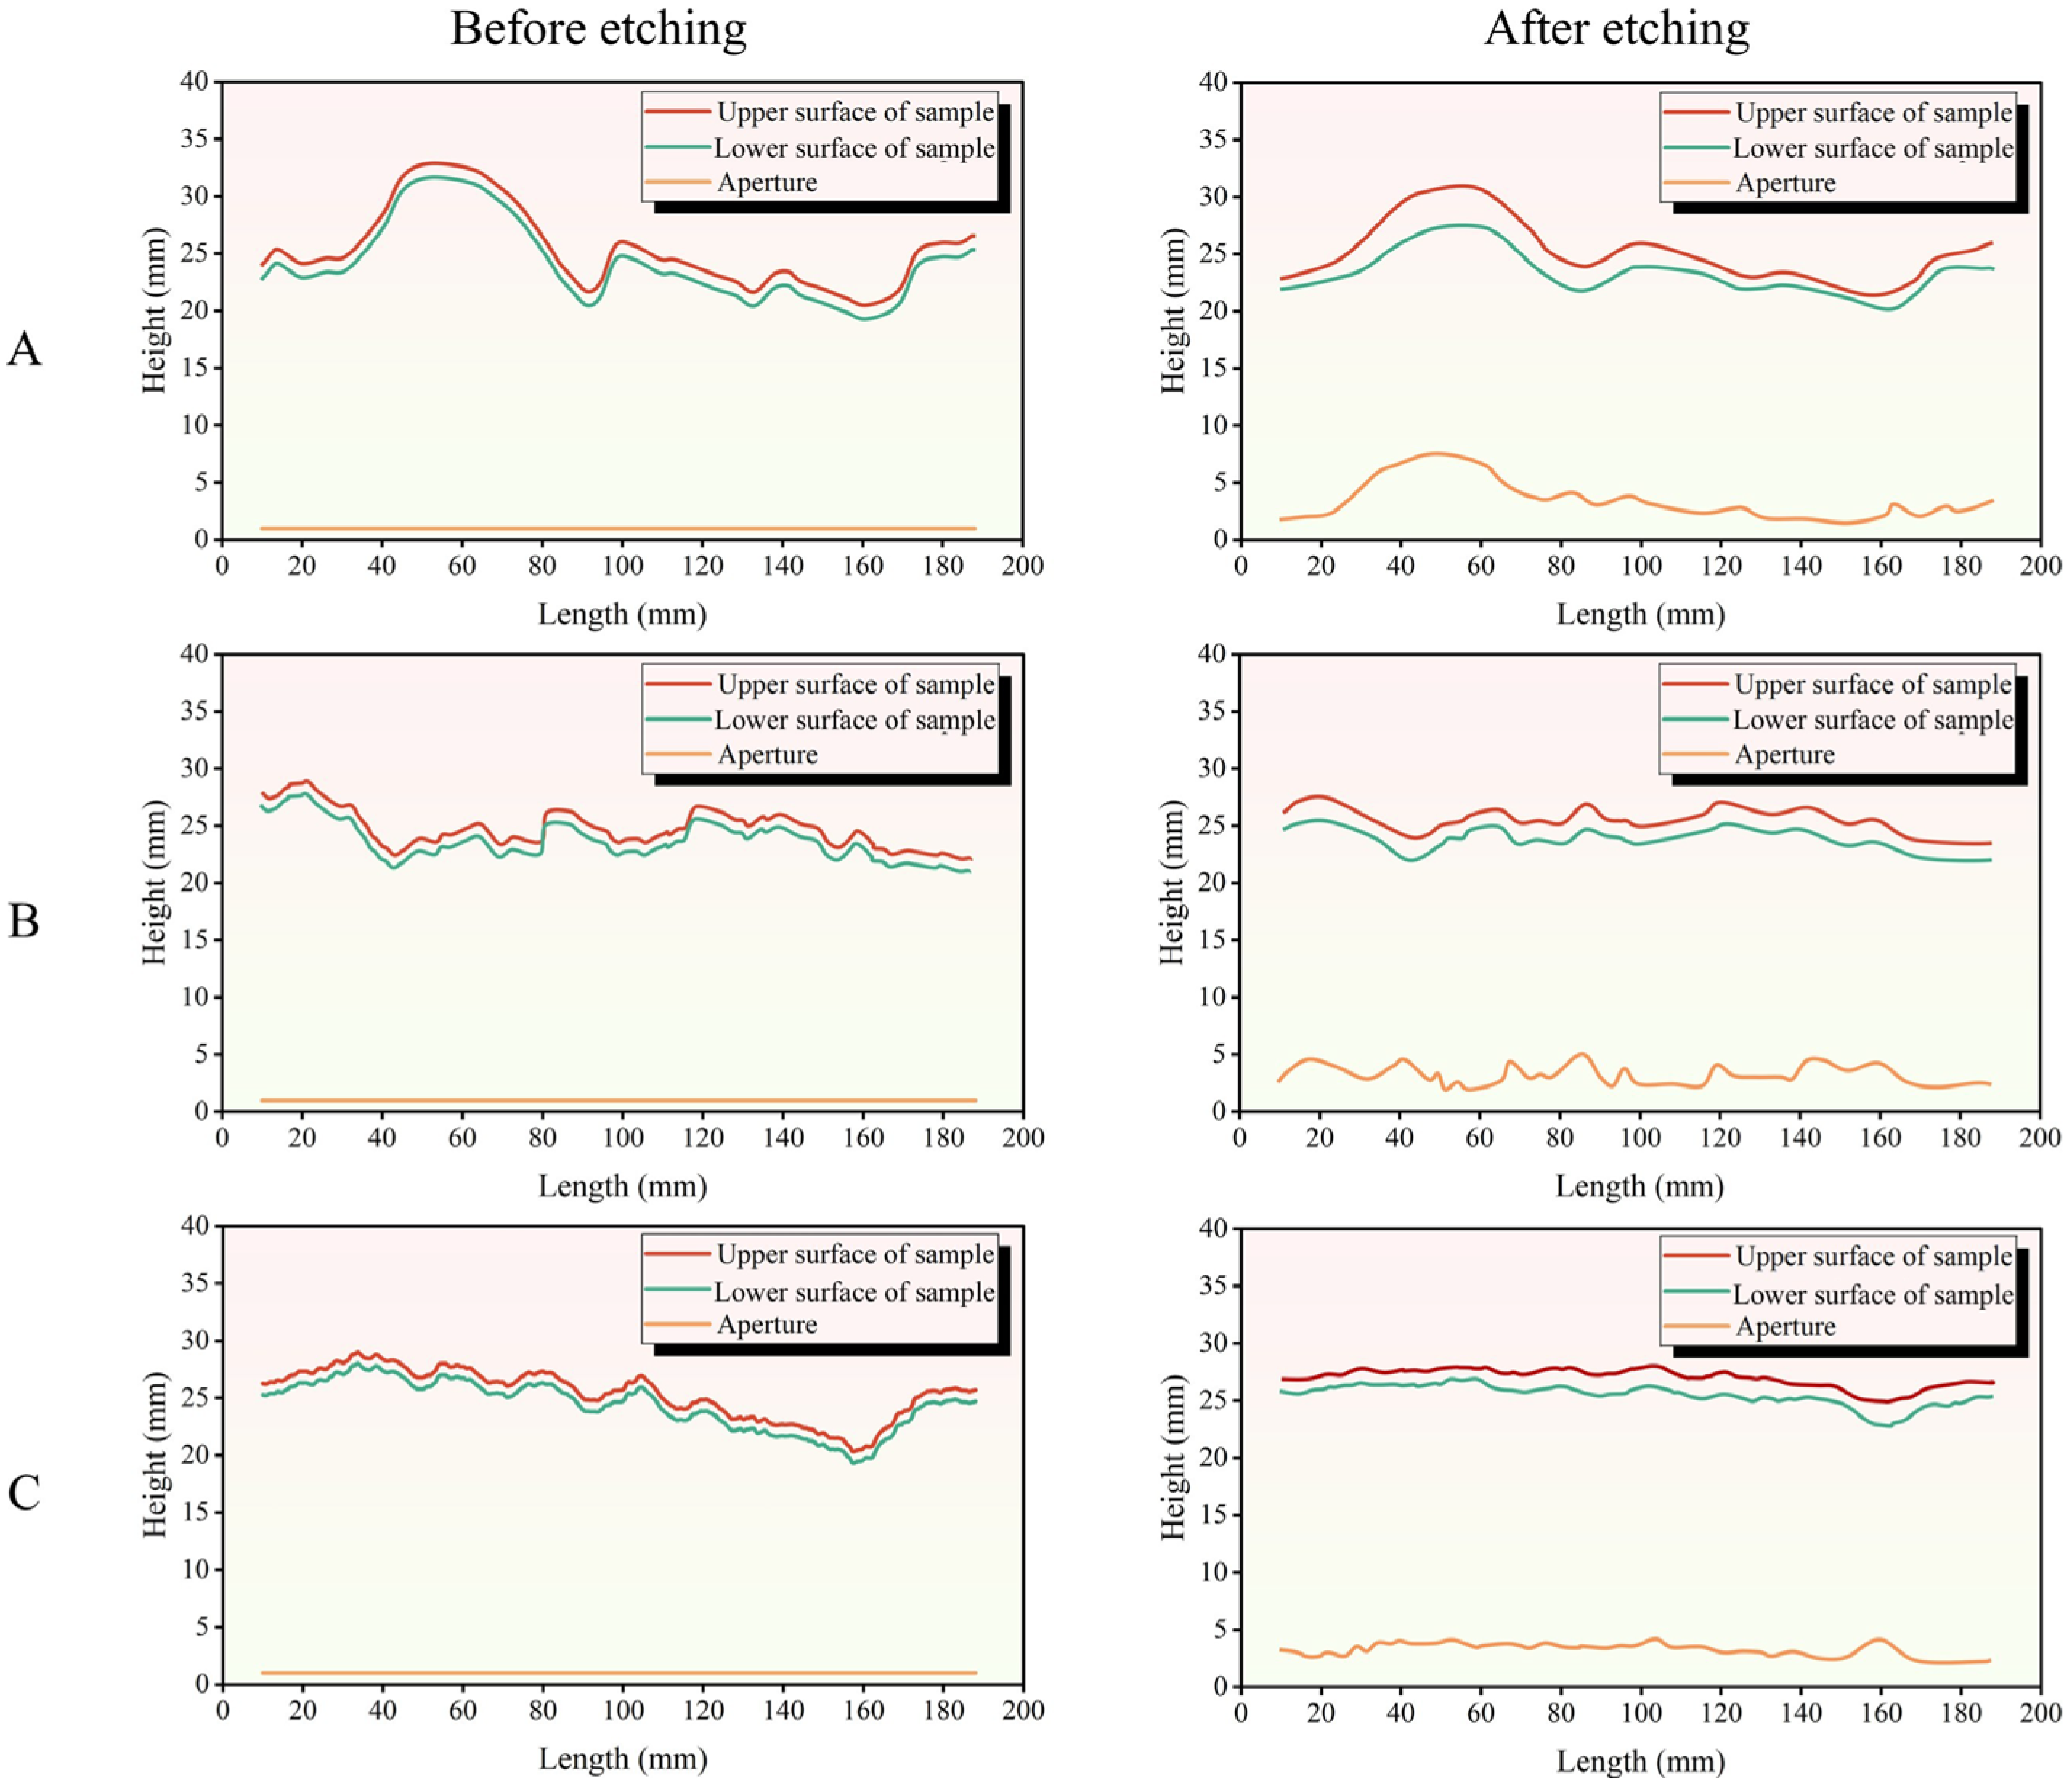
The initial fracture width refers to the width of the fracture formed when the rock surfaces come into contact under zero closure pressure after acid etching. The initial average fracture width and maximum fracture width wmax are closely related to the conductivity of acid-etched fractures [21,33]. Figure 12 and Figure 13 illustrate the evolution of fracture profiles (x = 37 mm) and gap widths on rough rock panels before and after acid etching. The pre-etching fracture profiles exhibit tortuous contours, whereas the post-etching profiles are smoother, indicating the acid solution’s effect of flattening “peaks” and deepening “valleys” in the rock surface. Type A fracture surfaces primarily exhibit large-scale waviness, characterized by prominent ridges and depressions. After acid etching, large-scale waviness remains predominant. In contrast, the roughness of the Type C fracture surface predominantly exhibited small-scale unevenness, characterized by small protrusions and depressions. The etching process primarily affected this small-scale unevenness and also reduced the large-scale waviness. Consequently, the etched fracture surface retained some small-scale unevenness characteristics. This finding is in accordance with previous experimental results (Table 7 and Figure 11).
Figure 12.
Surface profile of the acid-etched fracture (x = 37 mm).
Figure 13.
Comparison of fracture profiles before and after acid etching of different fracture surfaces (x = 37 mm). (A) Type A fracture surface; (B) Type A fracture surface; (C) Type C fracture surface.
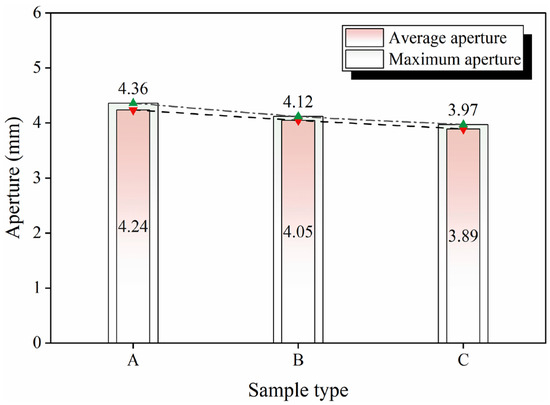
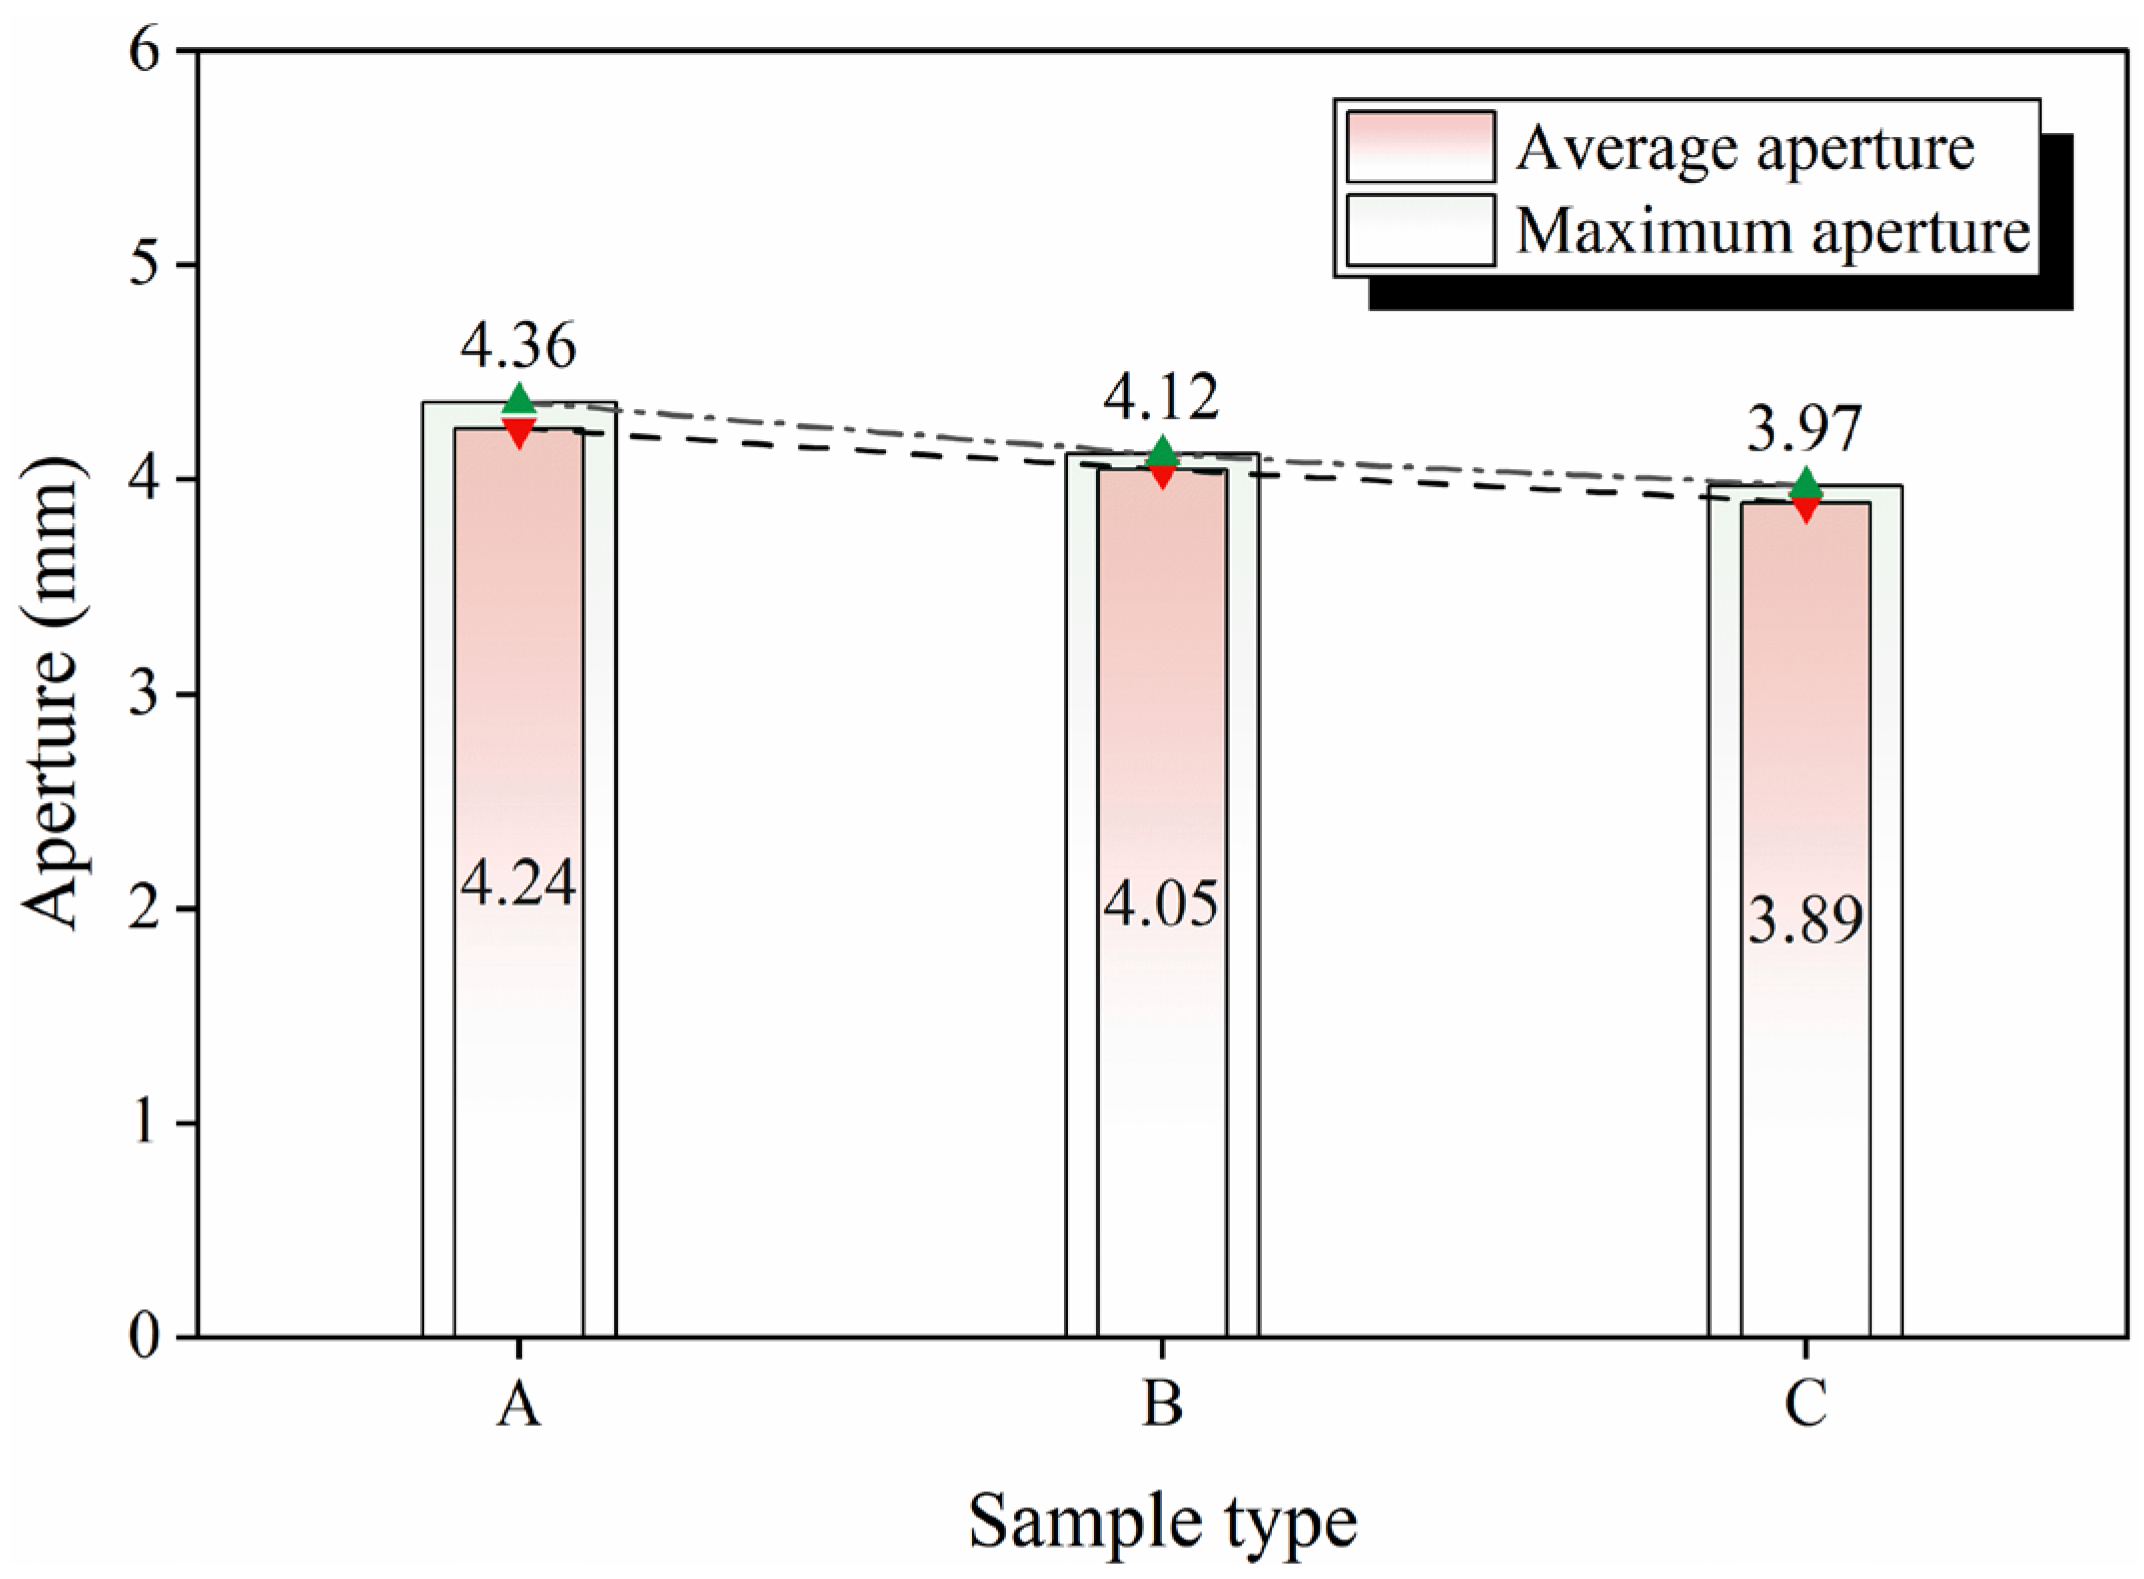
As illustrated in Figure 13 and Figure 14, the etching of Type C fractures exhibits uniformity, with the lowest initial areal tortuosity of 1.124. This results in the high matching accuracy of the upper and lower fracture contours and relatively consistent variation in the fracture width along the fracture length. With the increase in the initial areal tortuosity, the mismatching of the upper and lower fracture surface contours after etching becomes more pronounced for Type A fractures (initial areal tortuosity: 1.230) and Type B fractures (initial areal tortuosity: 1.169), accompanied by an expansion of both maximum and average fracture widths. Aperture fluctuations along the fracture length lead to more complex etching conditions and a higher degree of mismatching. Under such circumstances, the fracture surfaces lose their matching state after acid injection, thereby inducing the conductivity of acid-etched fractures due to the mismatching of the upper and lower fracture surfaces [28,34]. Thus, heterogeneous etching induced by initial roughness, which gives rise to fracture surface mismatching, is the primary factor contributing to variations in conductivity.
Figure 14.
Statistics of fracture aperture after acid etching.
3.2. Effect of Acid Injection Rate
3.2.1. Characteristics of Acid-Etched Fracture Surfaces
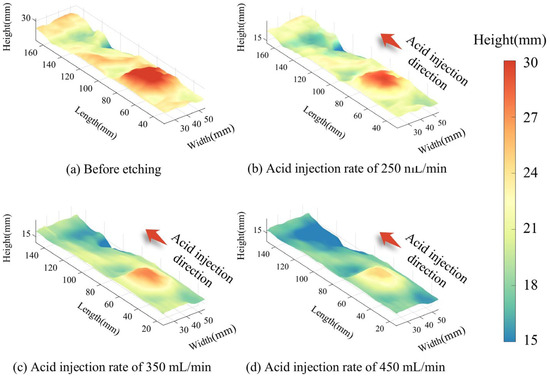
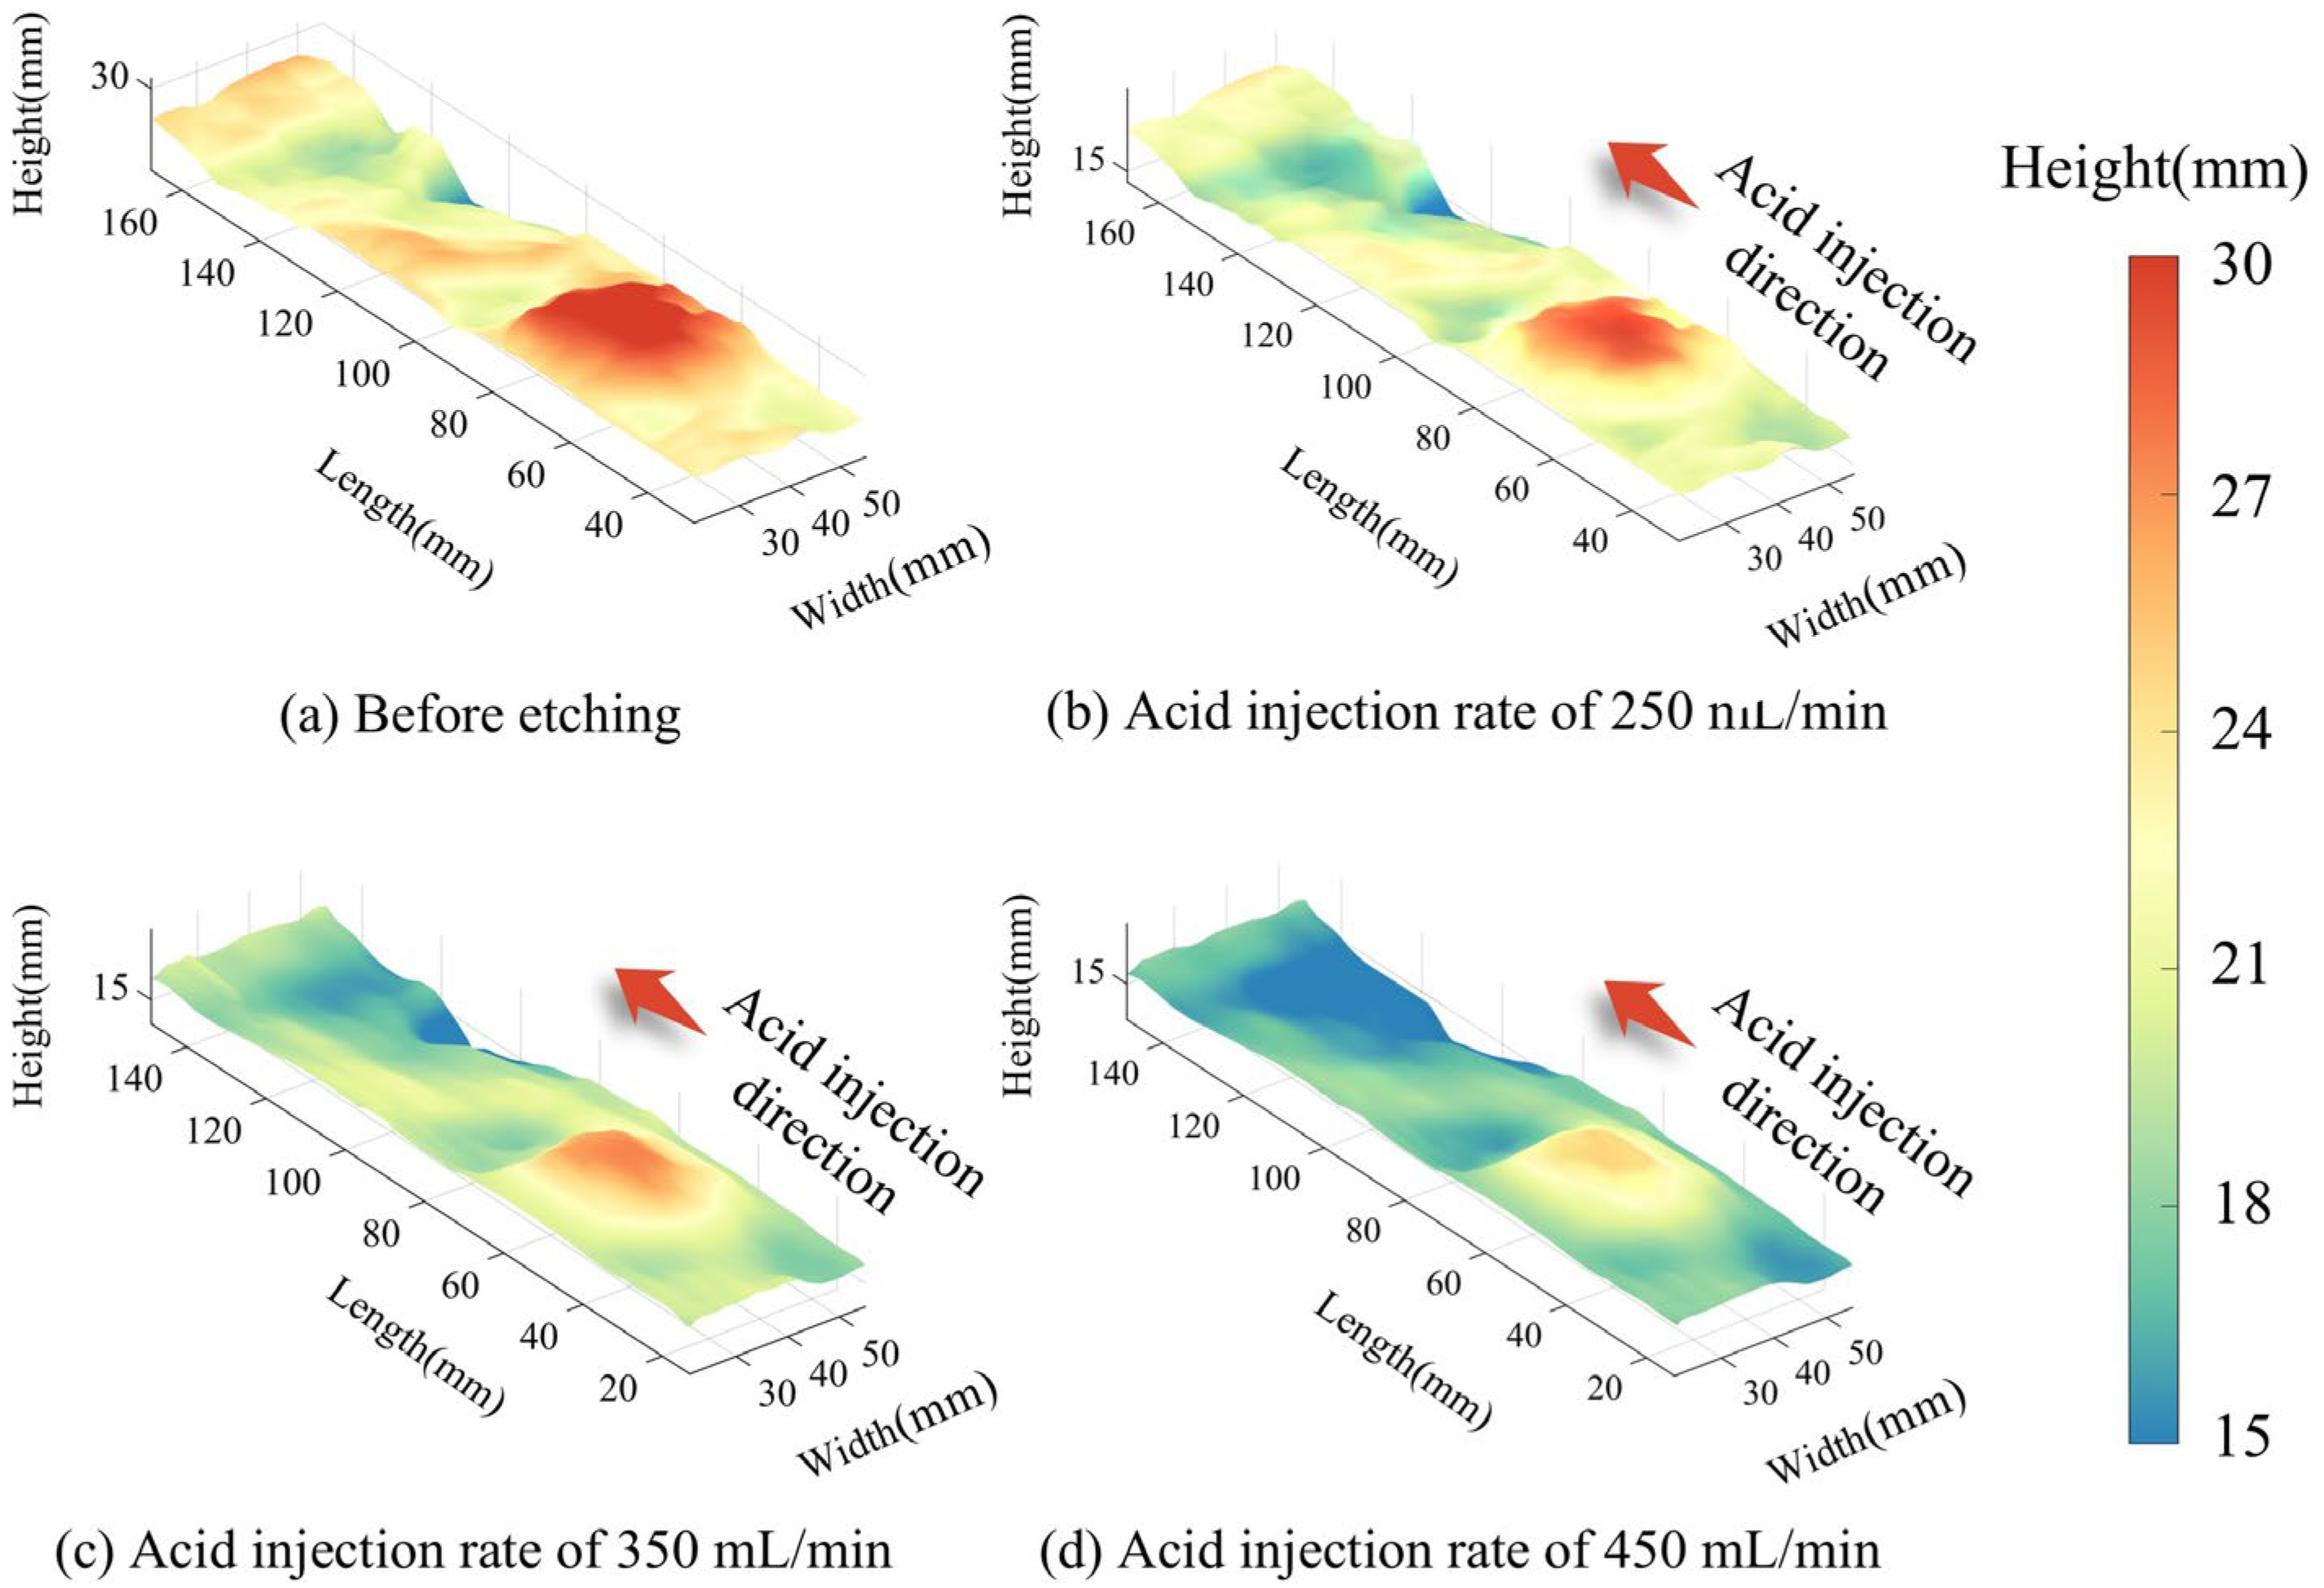
The experiment involved etching a uniformly rough fractured surface (Type A) at acid injection rates of 250 mL/min, 350 mL/min, and 450 mL/min. As illustrated in Figure 15, increasing acid injection rates markedly enhanced dissolution. Overall, as the injection rates rose, the red peaks on the fracture surface gradually diminished, while the valleys were deepened, resulting in a smoother fracture surface. For the Type A fracture surface with high roughness, at a certain acid injection rate (e.g., 350 mL/min), etching channels tend to form on the fracture surface, endowing it with high conductivity.
Figure 15.
Etched profiles of rough fracture surfaces at different injection rates.
3.2.2. Frequency Distribution of Fracture Surface Elevation
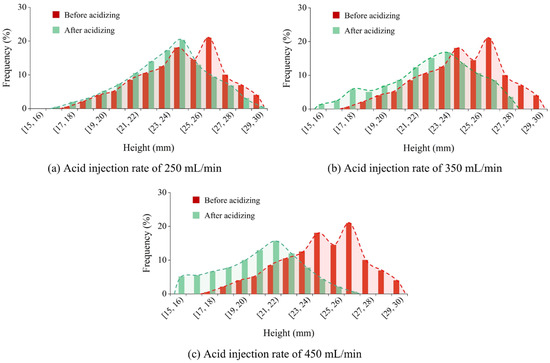
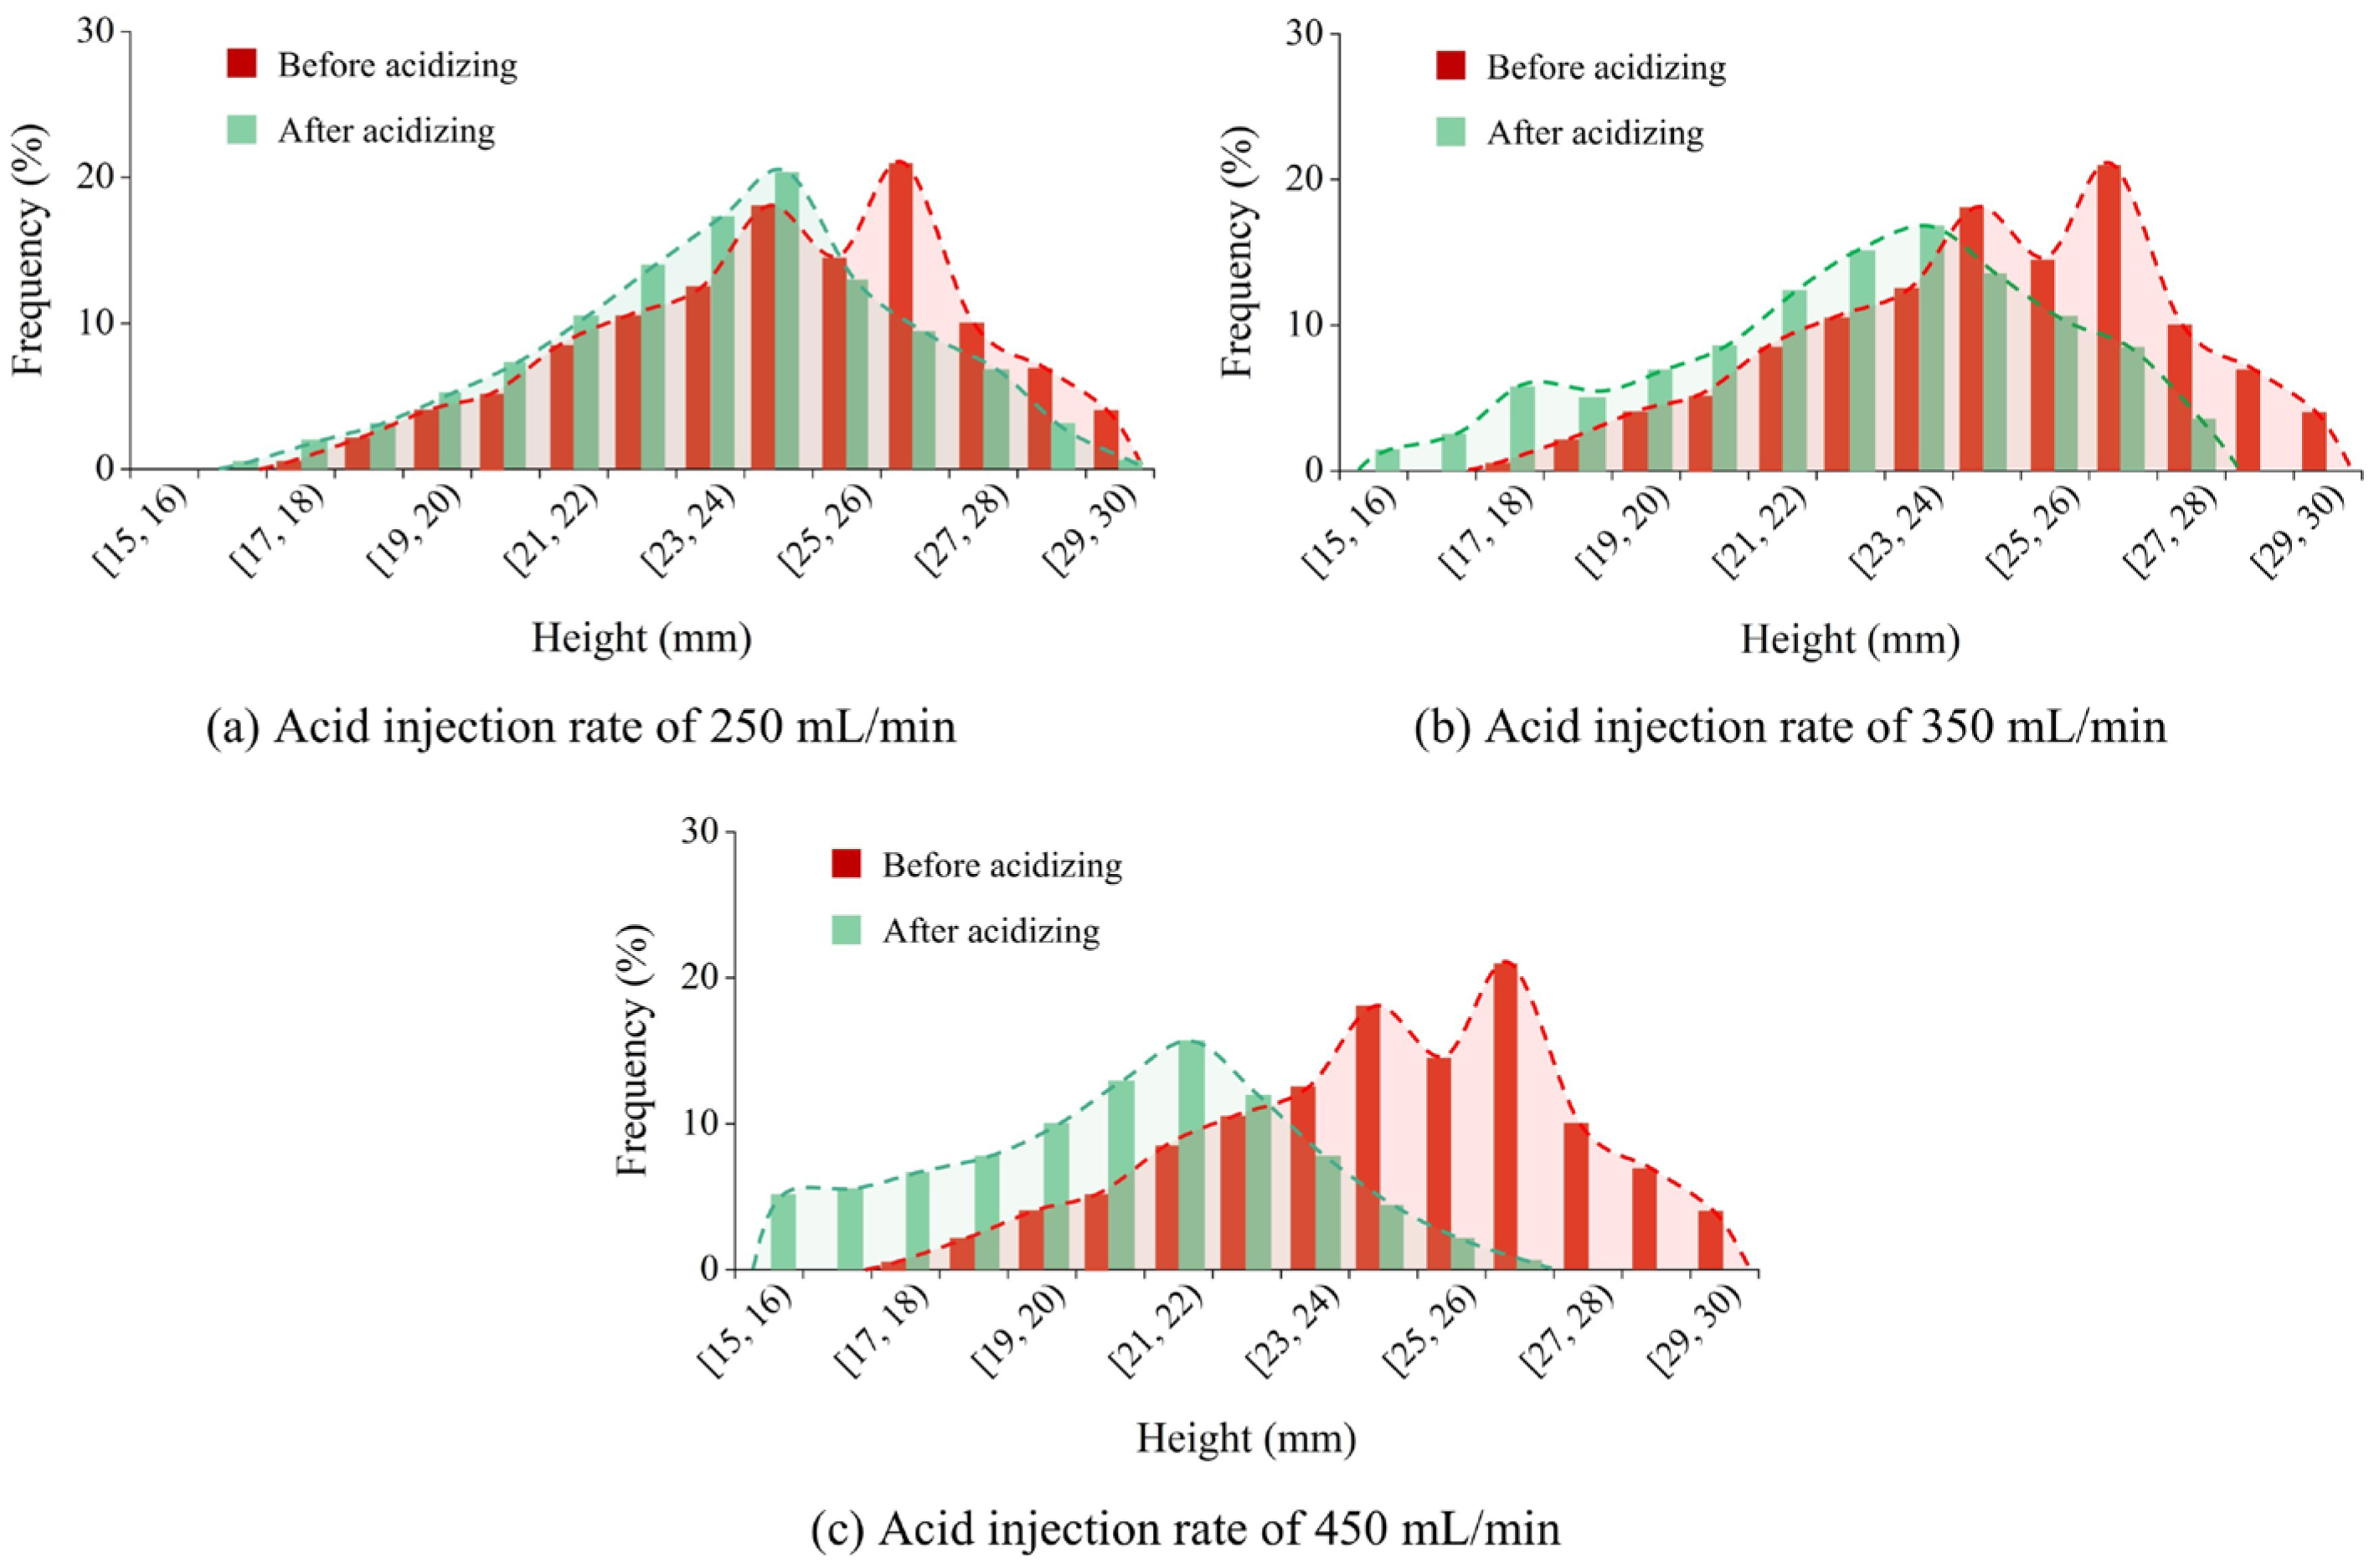
Figure 16 illustrates the effect of varying acid injection rates on the elevation distribution of rough rock slabs before and after acid etching. It is evident that prior to acid etching, the elevation distribution across the fractured surface of the rough rock slab was extensive and exhibited a normal distribution. After acid etching, the elevation distribution demonstrated a “left shift” phenomenon. Here, the frequency of high points decreased, while that of low points increased. As the acid injection rate increases, the degree of the “left shift” phenomenon in the post-etching morphology elevation distribution becomes more pronounced, accompanied by a reduction in elevation peaks. This indicates that acid can smooth elevated points on the rough fracture surface and broaden valleys or deeper regions [35]. Furthermore, the higher the acid injection rate, the more evident this effect becomes. This may be attributed to the increased flow velocity of acid within fractured zones as injection rates rise. This accelerated mass transfer of H+ ions enhances acid–rock reaction rates, leading to improved etching efficiency [36].
Figure 16.
Effect of acid injection rate on elevation frequency distribution of rough rock slabs before and after acid etching.
3.2.3. Change in Fracture Surface Area Tortuosity
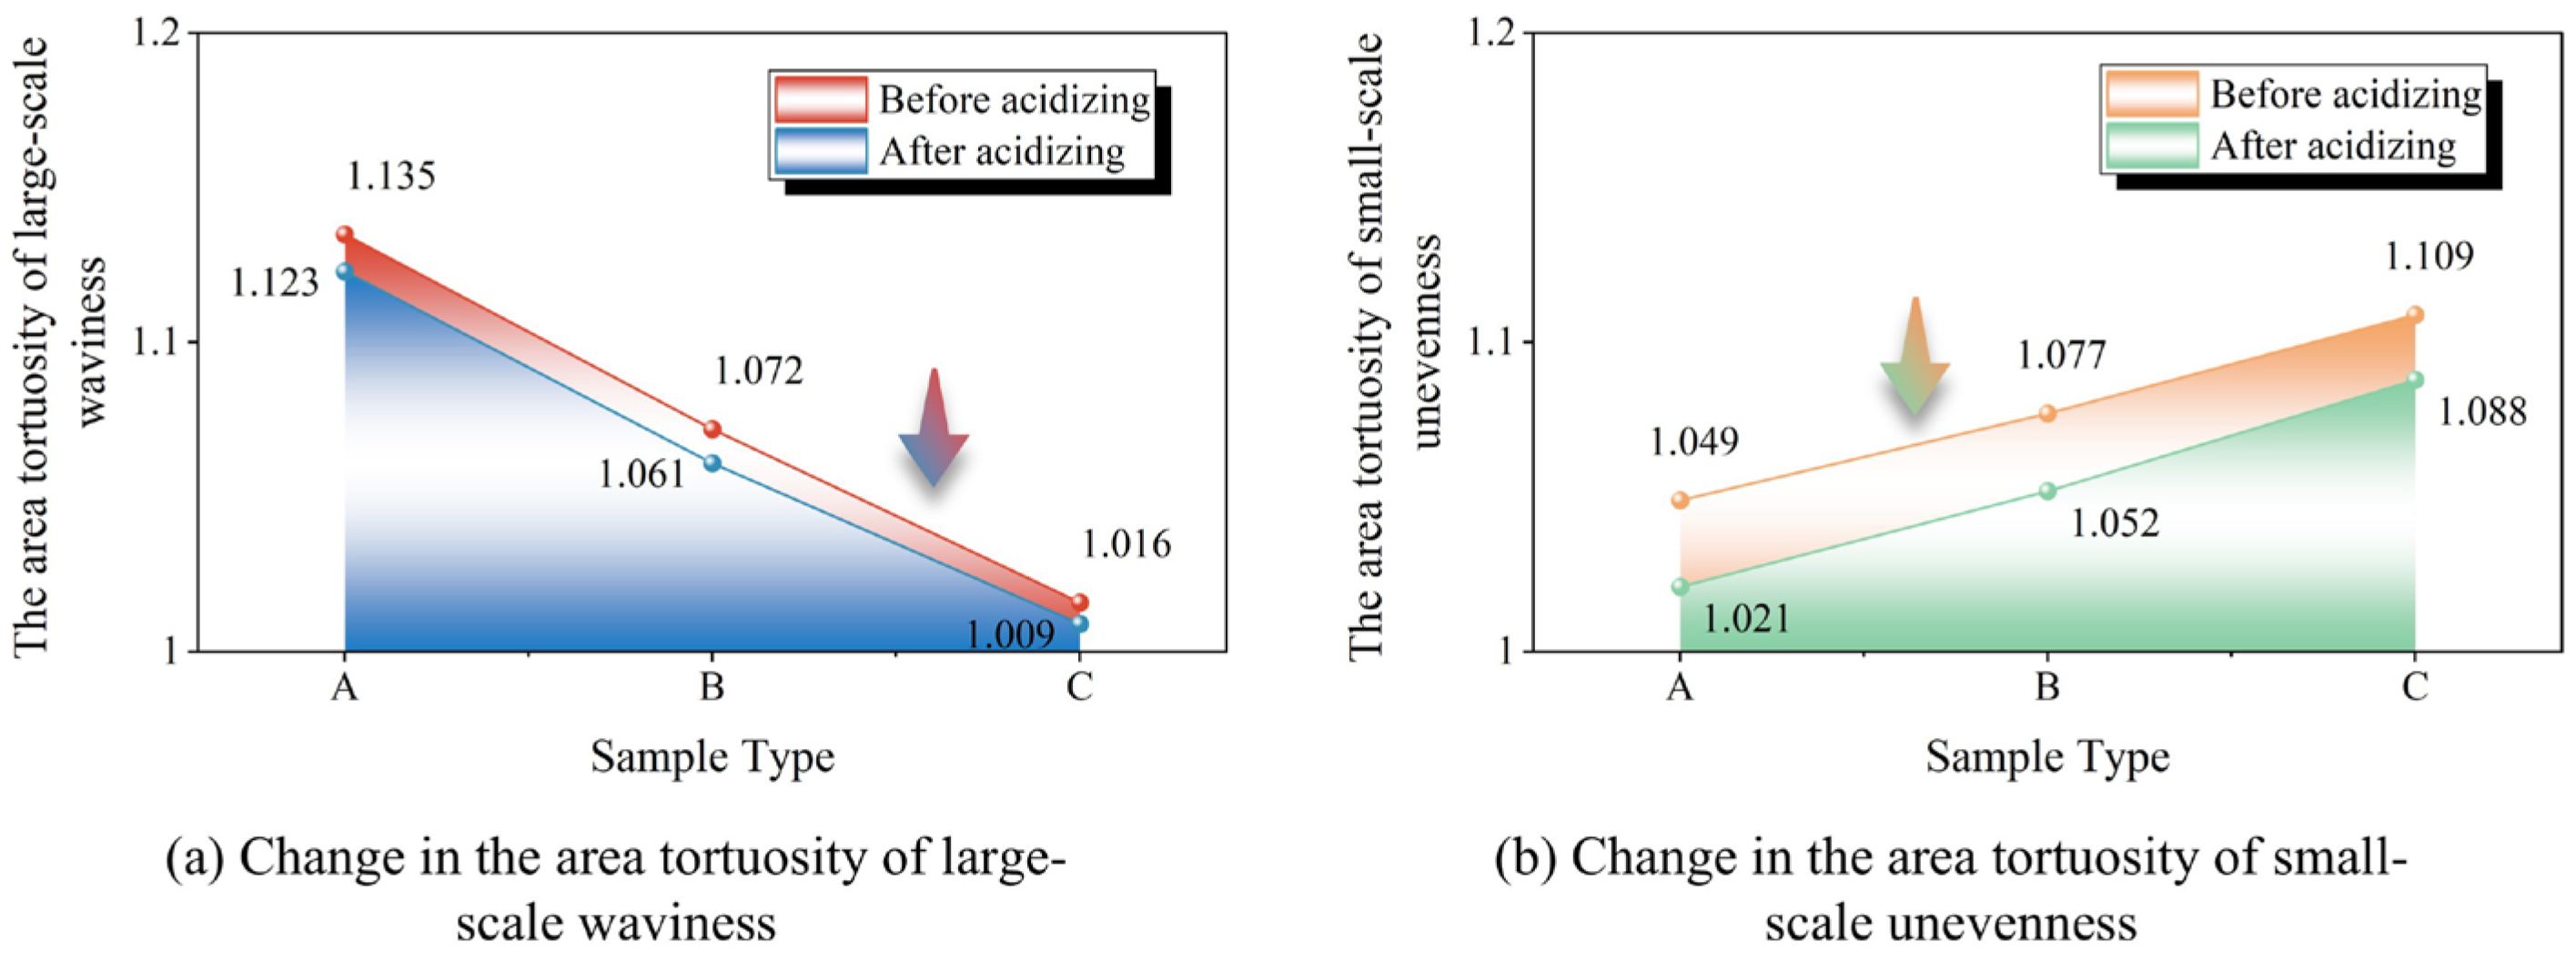
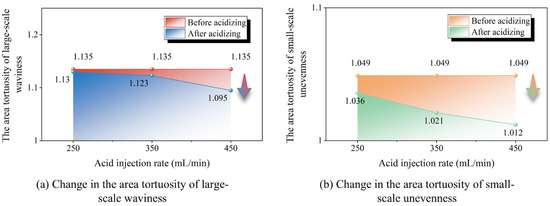
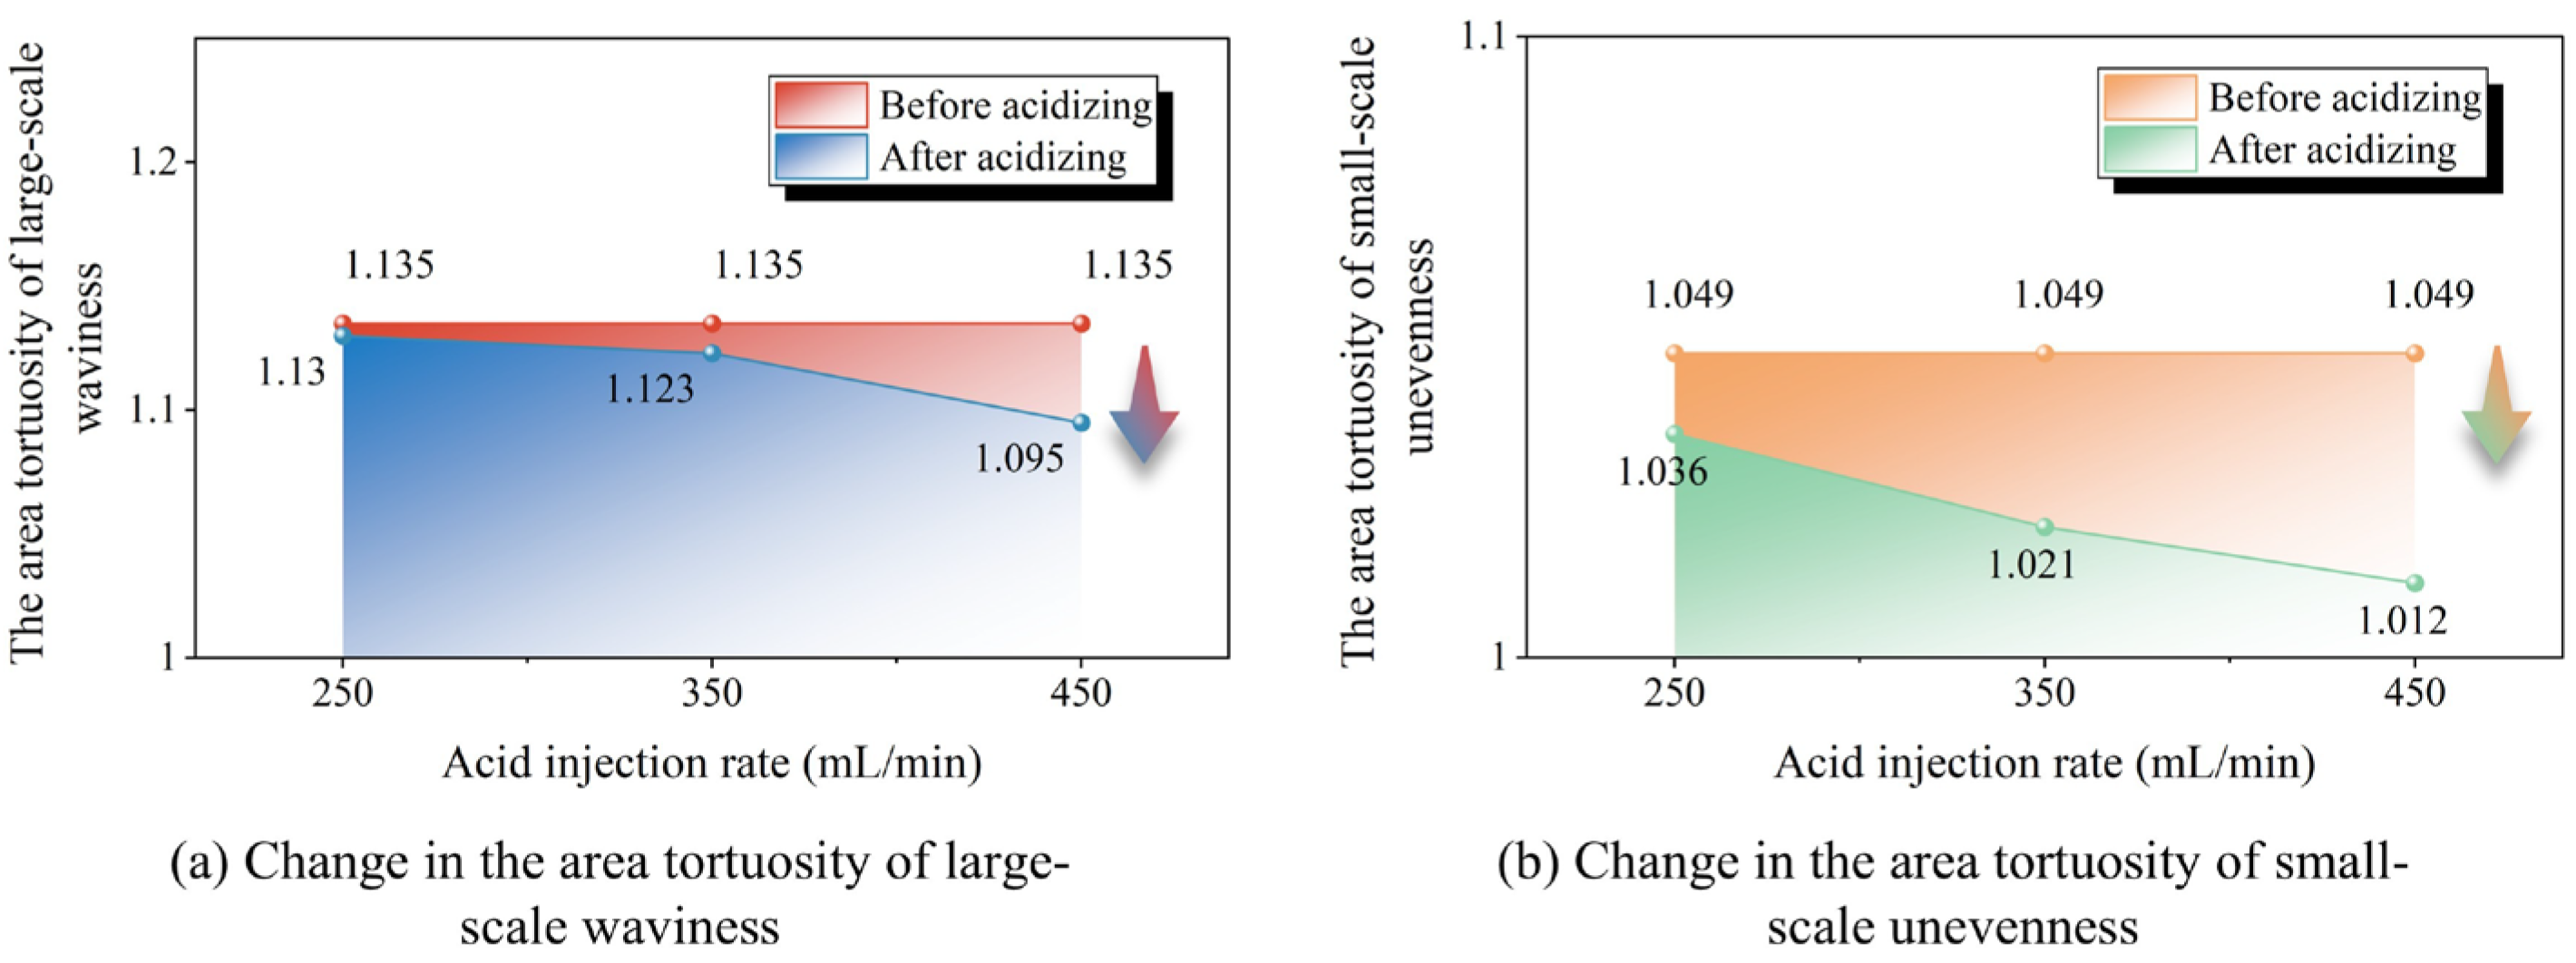
As shown in Table 8 and Figure 17, with increasing acid injection volume, the original surface area tortuosity εa, large-scale waviness area tortuosity εa1, and small-scale unevenness area tortuosity εa2 of the fracture surface gradually decrease. The relative roughness after acid etching diminishes, resulting in a smoother morphology. After etching, the reduction in the area tortuosity of small-scale unevenness εa2 is greater than that of the area tortuosity of large-scale waviness εa2. This indicates that during the etching process, the small-scale unevenness features are smoothed out first.
Table 8.
Change in slabs’ surface area and tortuosity. (# denotes the experimental number.)
Figure 17.
Change in the area tortuosity of large-scale waviness and small-scale unevenness of each fracture surface. (The arrows indicate a decrease in the data value).
3.2.4. Initial Aperture
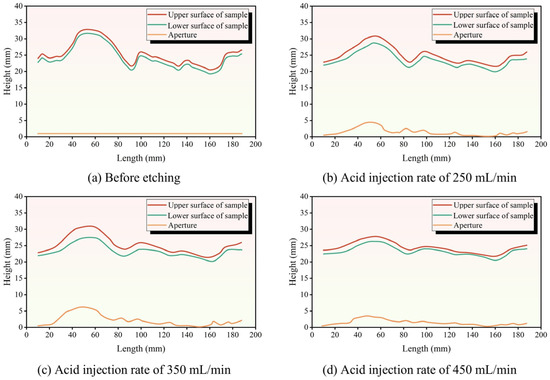
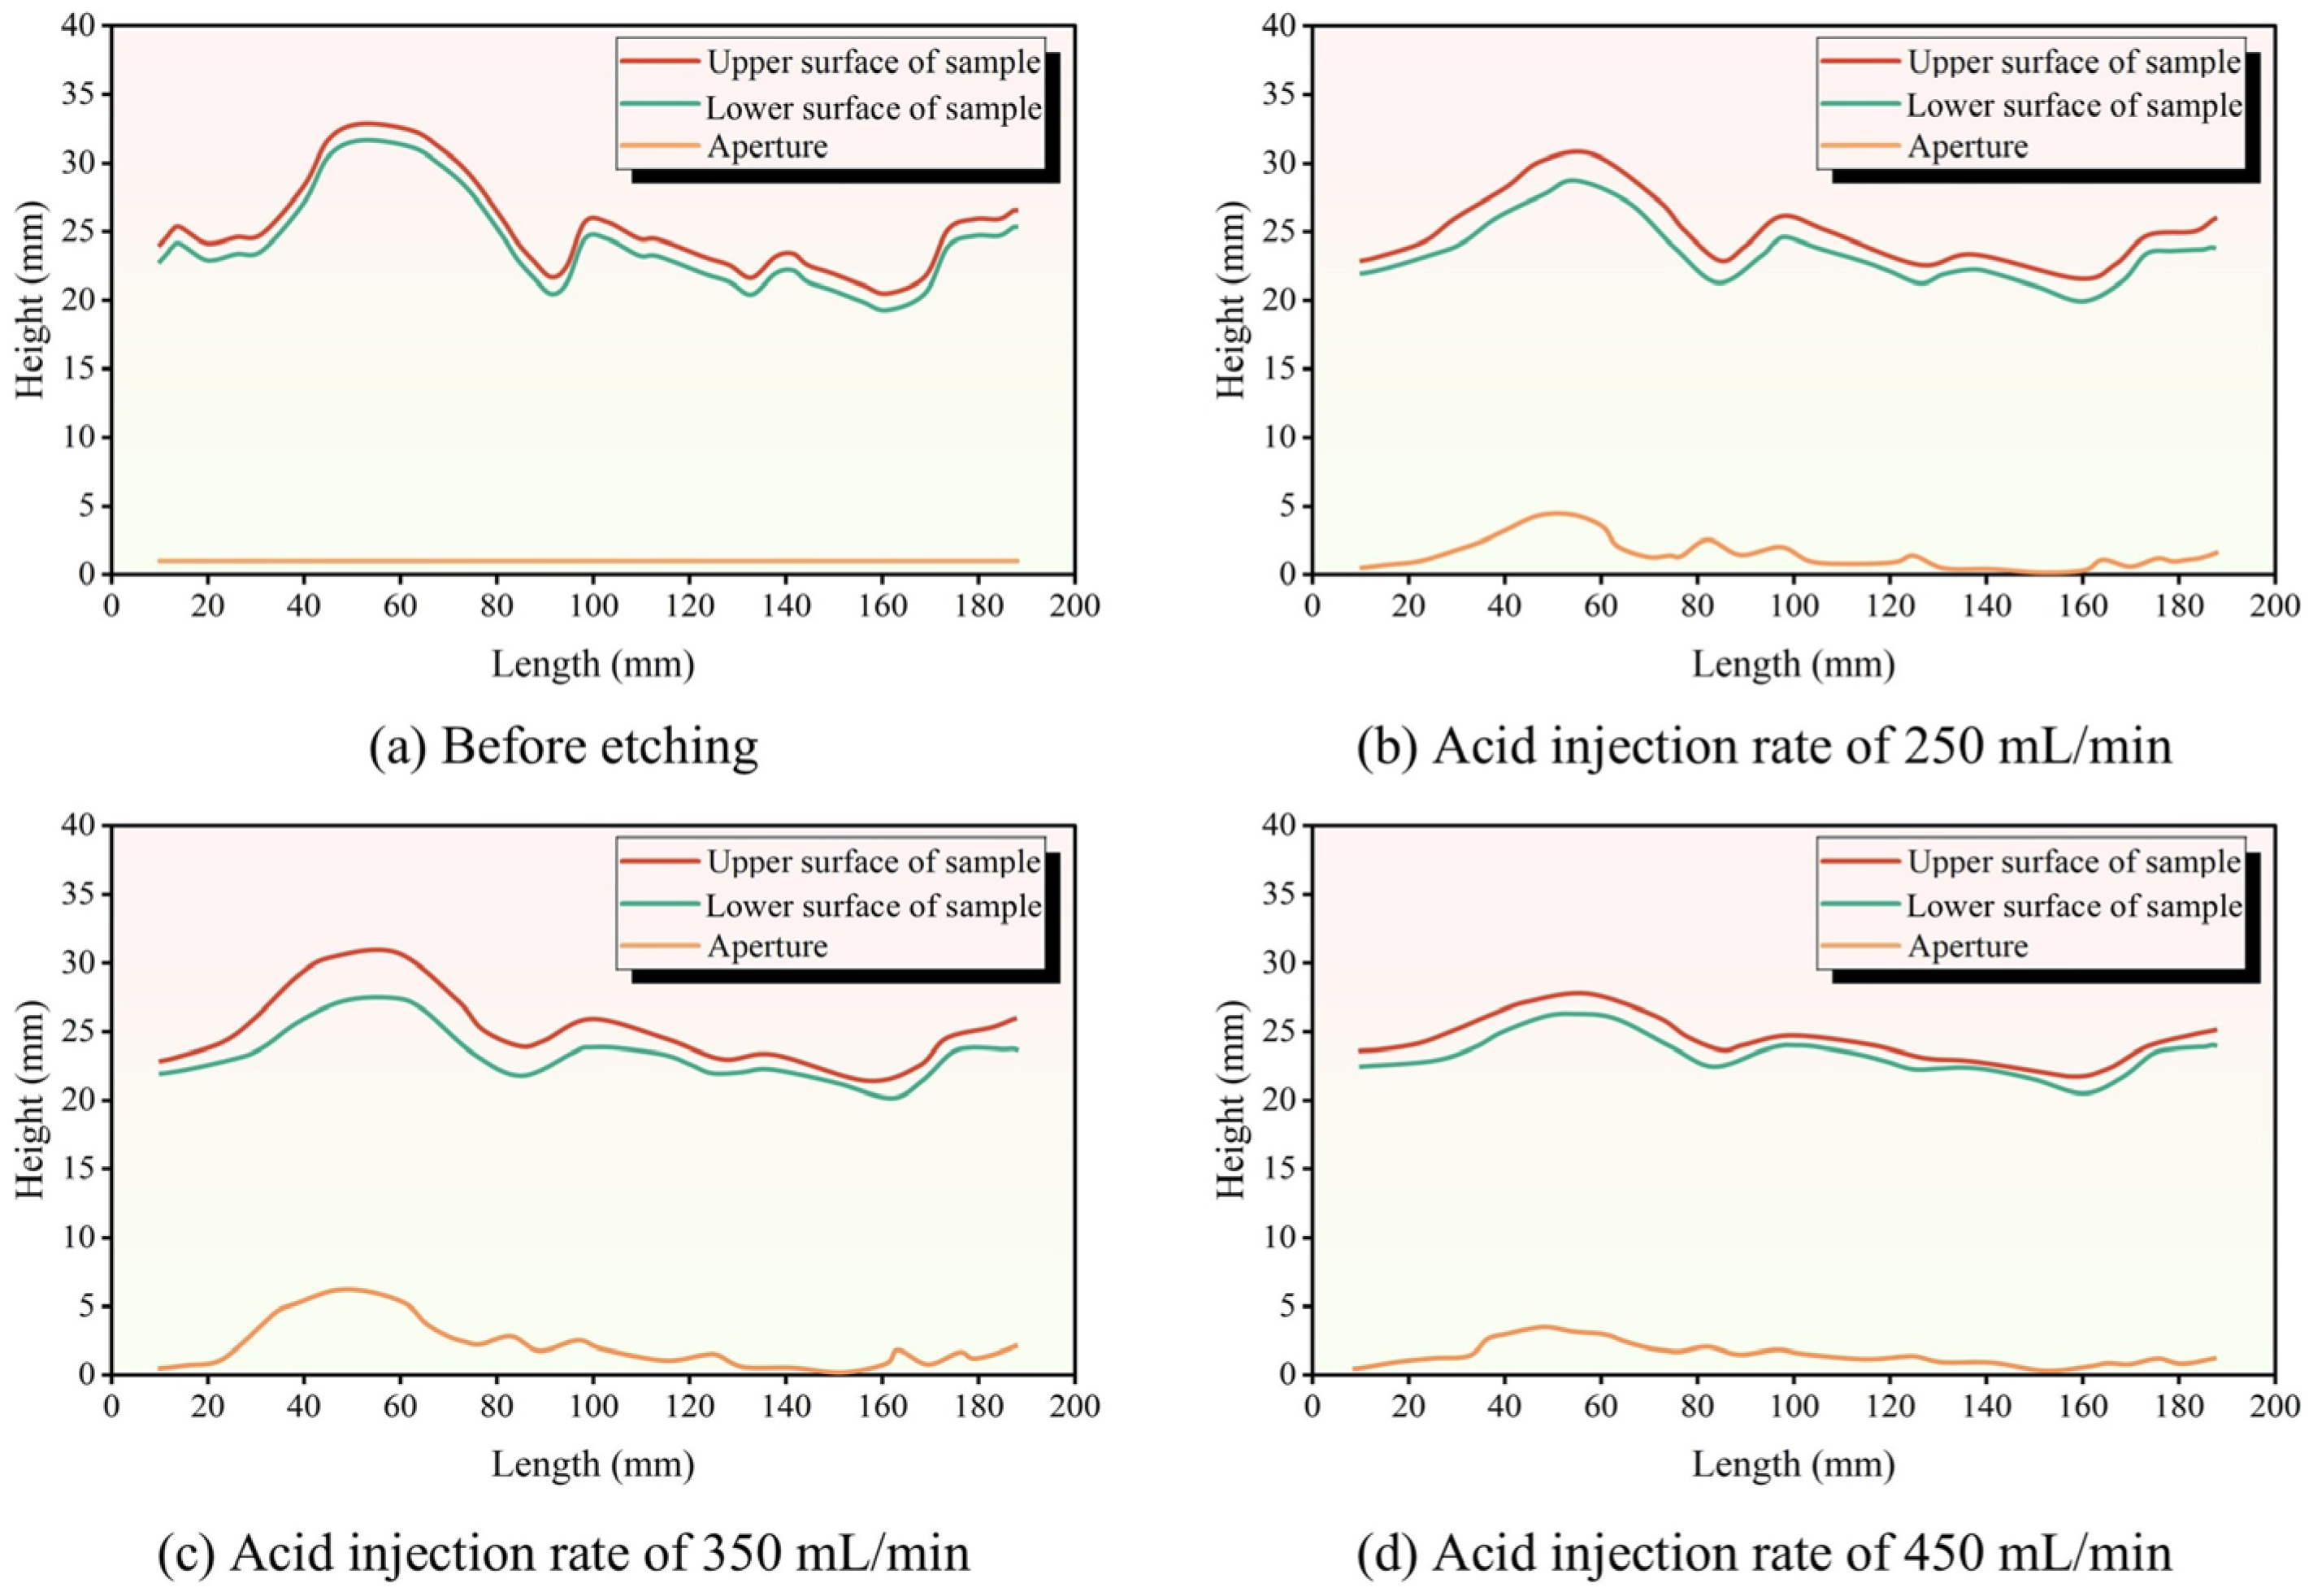
Under different acid injection rate conditions, the fracture contour (at x = 37 mm) of rough rock plates prior to acidizing treatment exhibits a distinctly tortuous morphology (Figure 18). With the gradual increase in the acid injection rate, however, the fracture contour after acidizing becomes increasingly smooth. During the acid–rock interaction process, the acid fluid can not only etch away the protruding “peaks” on the rock surface but also further etch the recessed “valleys”. Notably, the etch-induced topographic change in the “peaks” is more significant than that in the “valleys”, ultimately reshaping the rough surface morphology of the rock plates into a smooth state.
Figure 18.
Comparison of fracture profiles before and after acid etching at different acid injection rates (x = 37 mm).
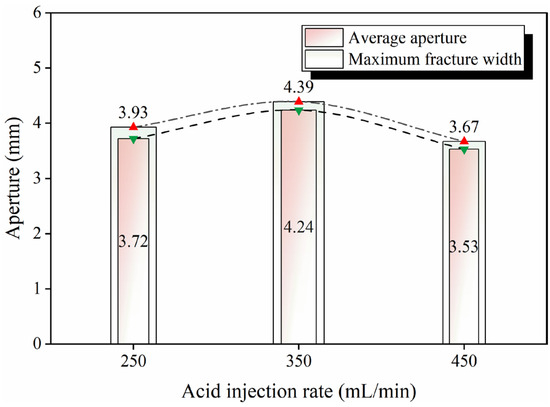
At a low acid injection rate (e.g., 250 mL/min), the large-scale waviness area tortuosity decreases from 1.135 to 1.13, with minimal overall morphological change (Figure 17). The fracture surface exhibits a low and relatively uniform etching intensity, and the upper and lower fracture contours show high congruence, accompanied by a small aperture (Figure 19). With the increase in the acid injection rate, the large-scale waviness area tortuosity declines to 1.123, the mismatch levels of the upper and lower fracture surface contours intensify, and both the maximum aperture and average aperture increase. Further increasing the acid injection rate reveals a critical injection rate (for this experiment, ranging between 250 mL/min and 450 mL/min). Exceeding this threshold leads to a gradual smoothing of the etched fracture surface, a significant overall reduction in roughness, improved contour congruence, and a decrease in both the maximum and average apertures (Figure 17 and Figure 19). Under such conditions, the fracture surfaces remain congruent with a low aperture after acid injection, thereby reducing the conductivity of the acid-etched fractures. Therefore, reasonably determining the acid injection rate to induce heterogeneous etching is crucial for enhancing the conductivity of acid-etched fractures.
Figure 19.
Statistics of aperture after acid etching.
3.3. Effect of Acid Injection Time
3.3.1. Characteristics of Acid-Etched Fracture Surfaces
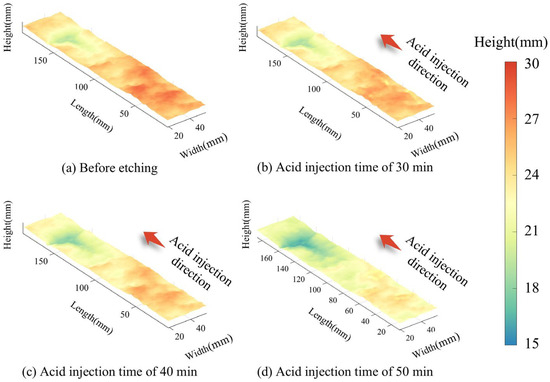
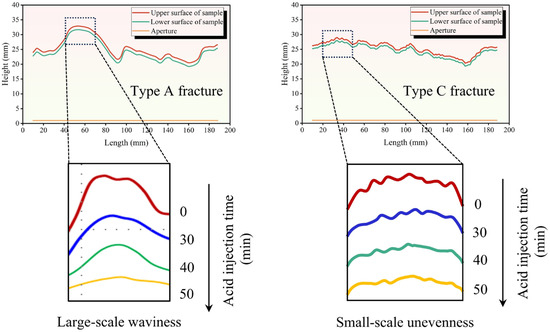
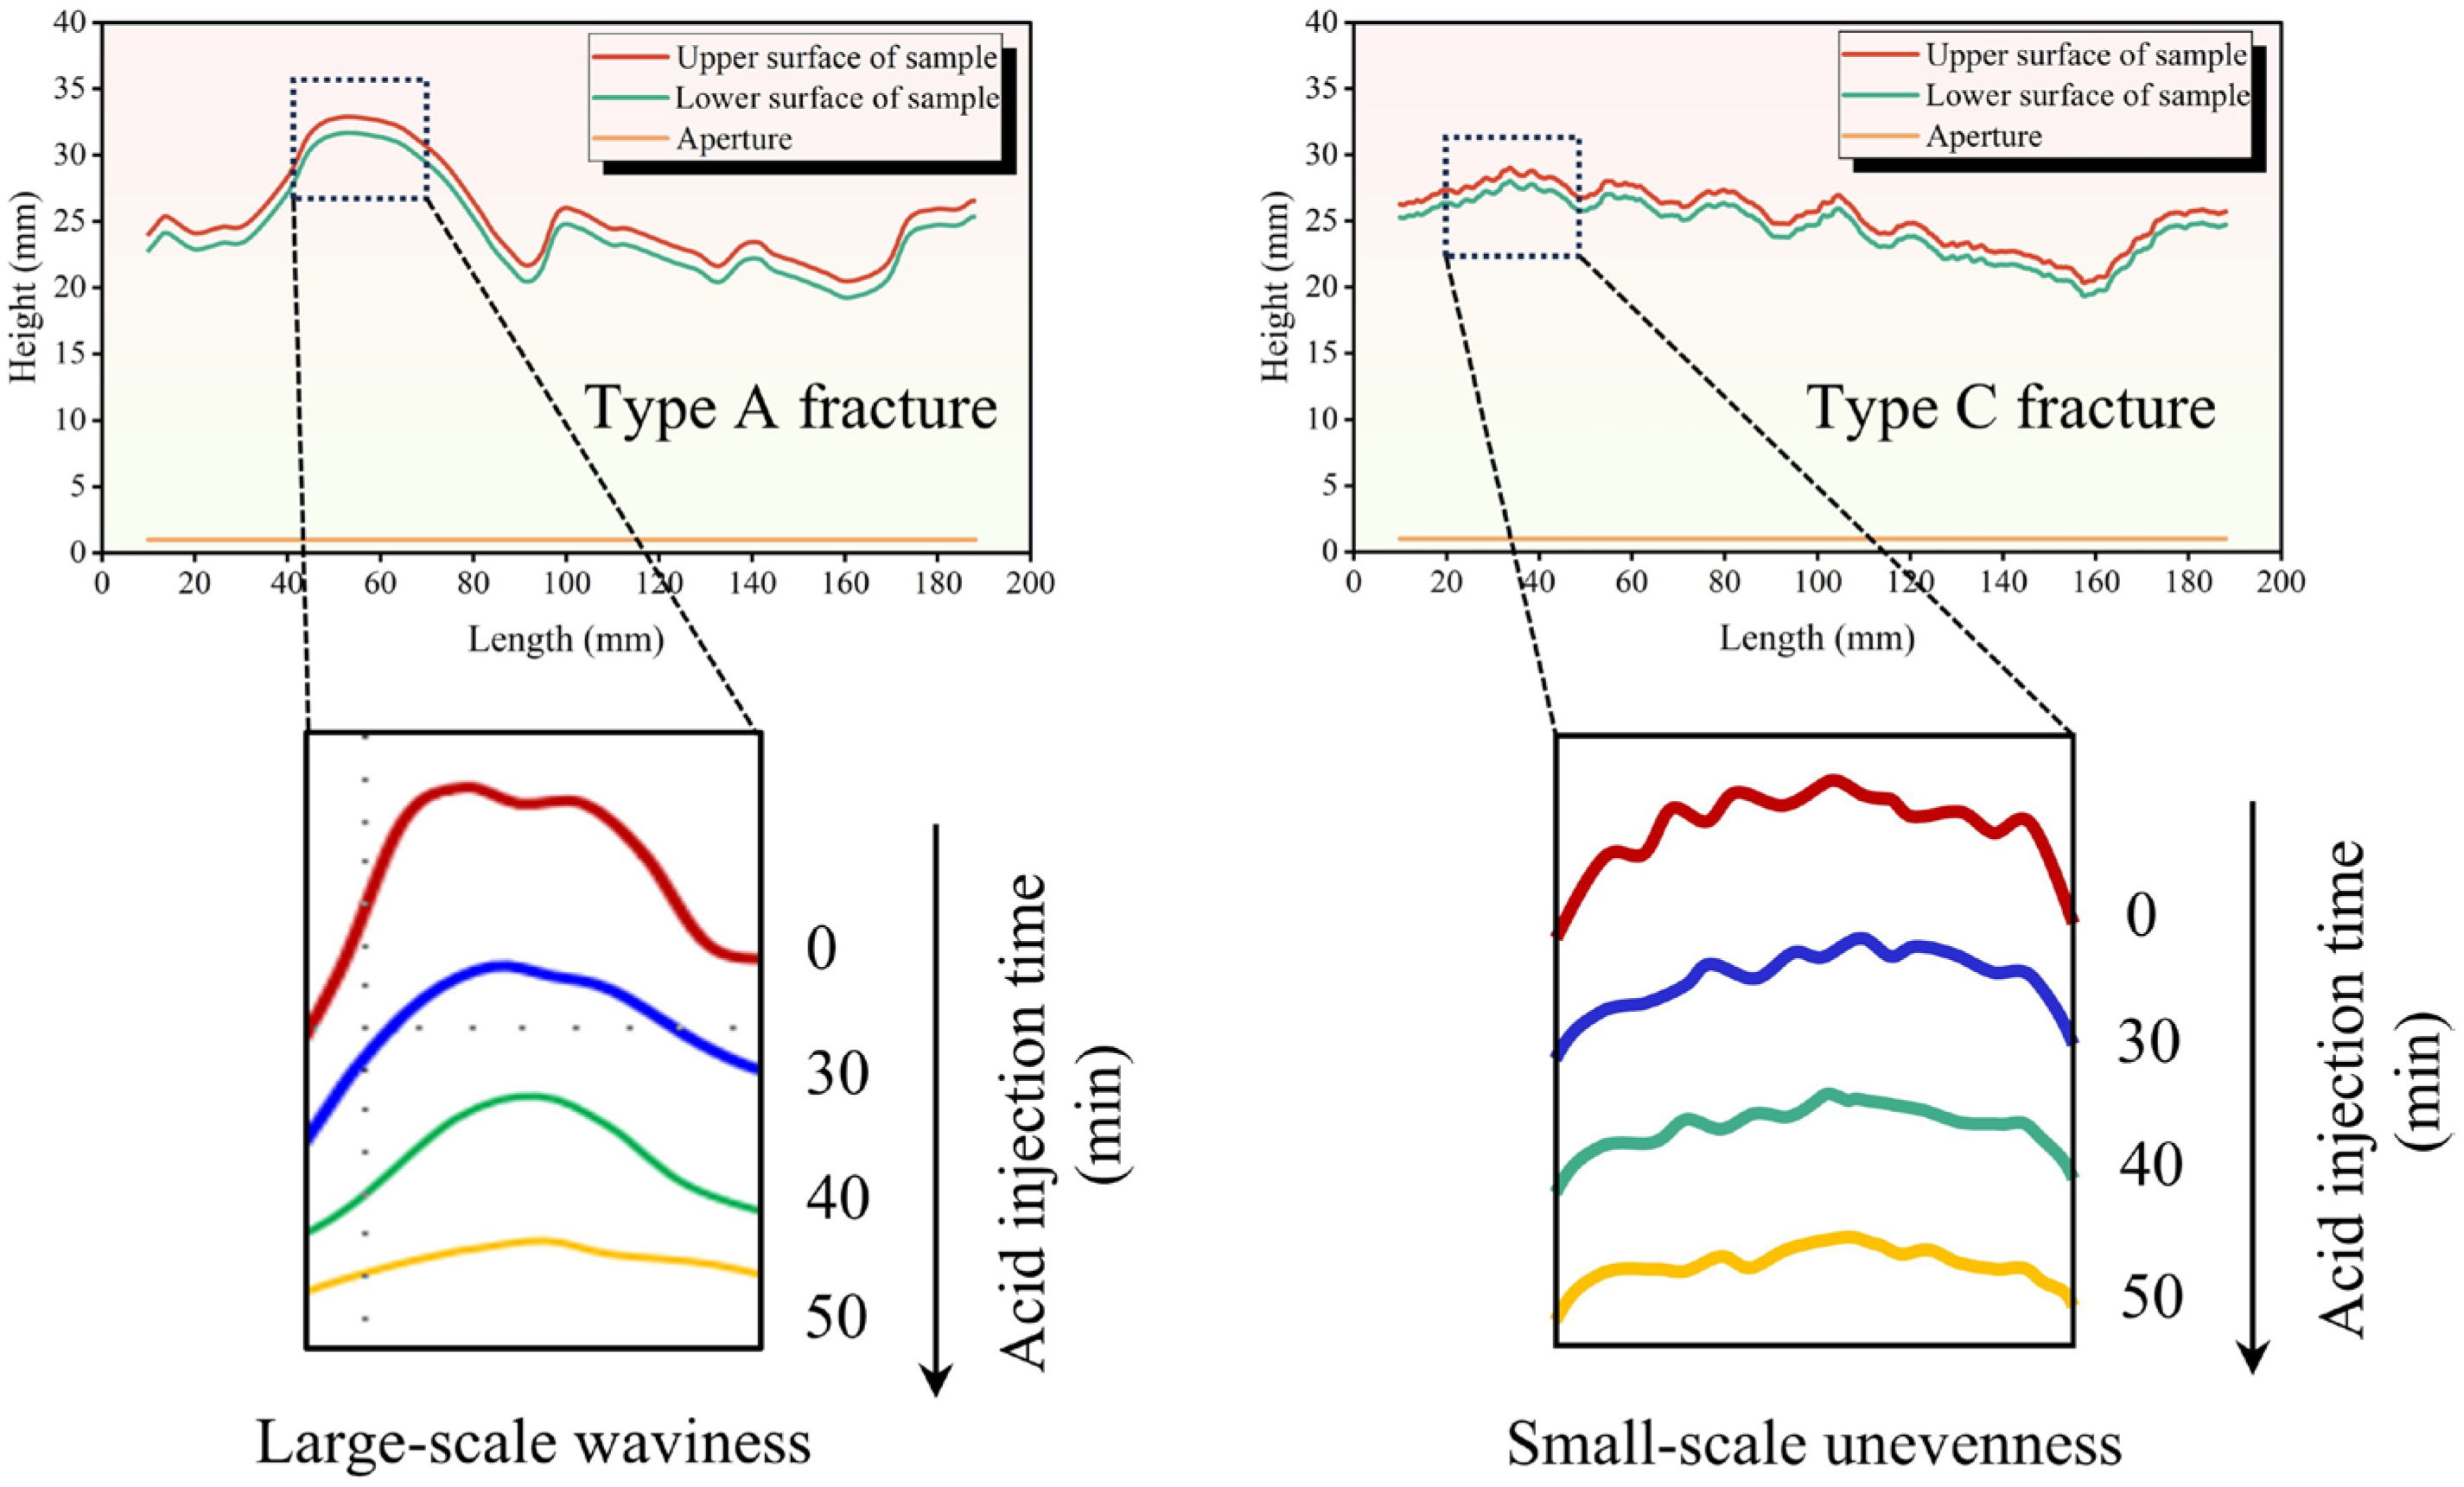
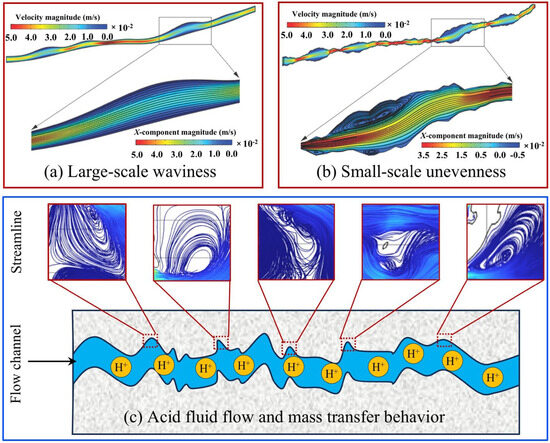
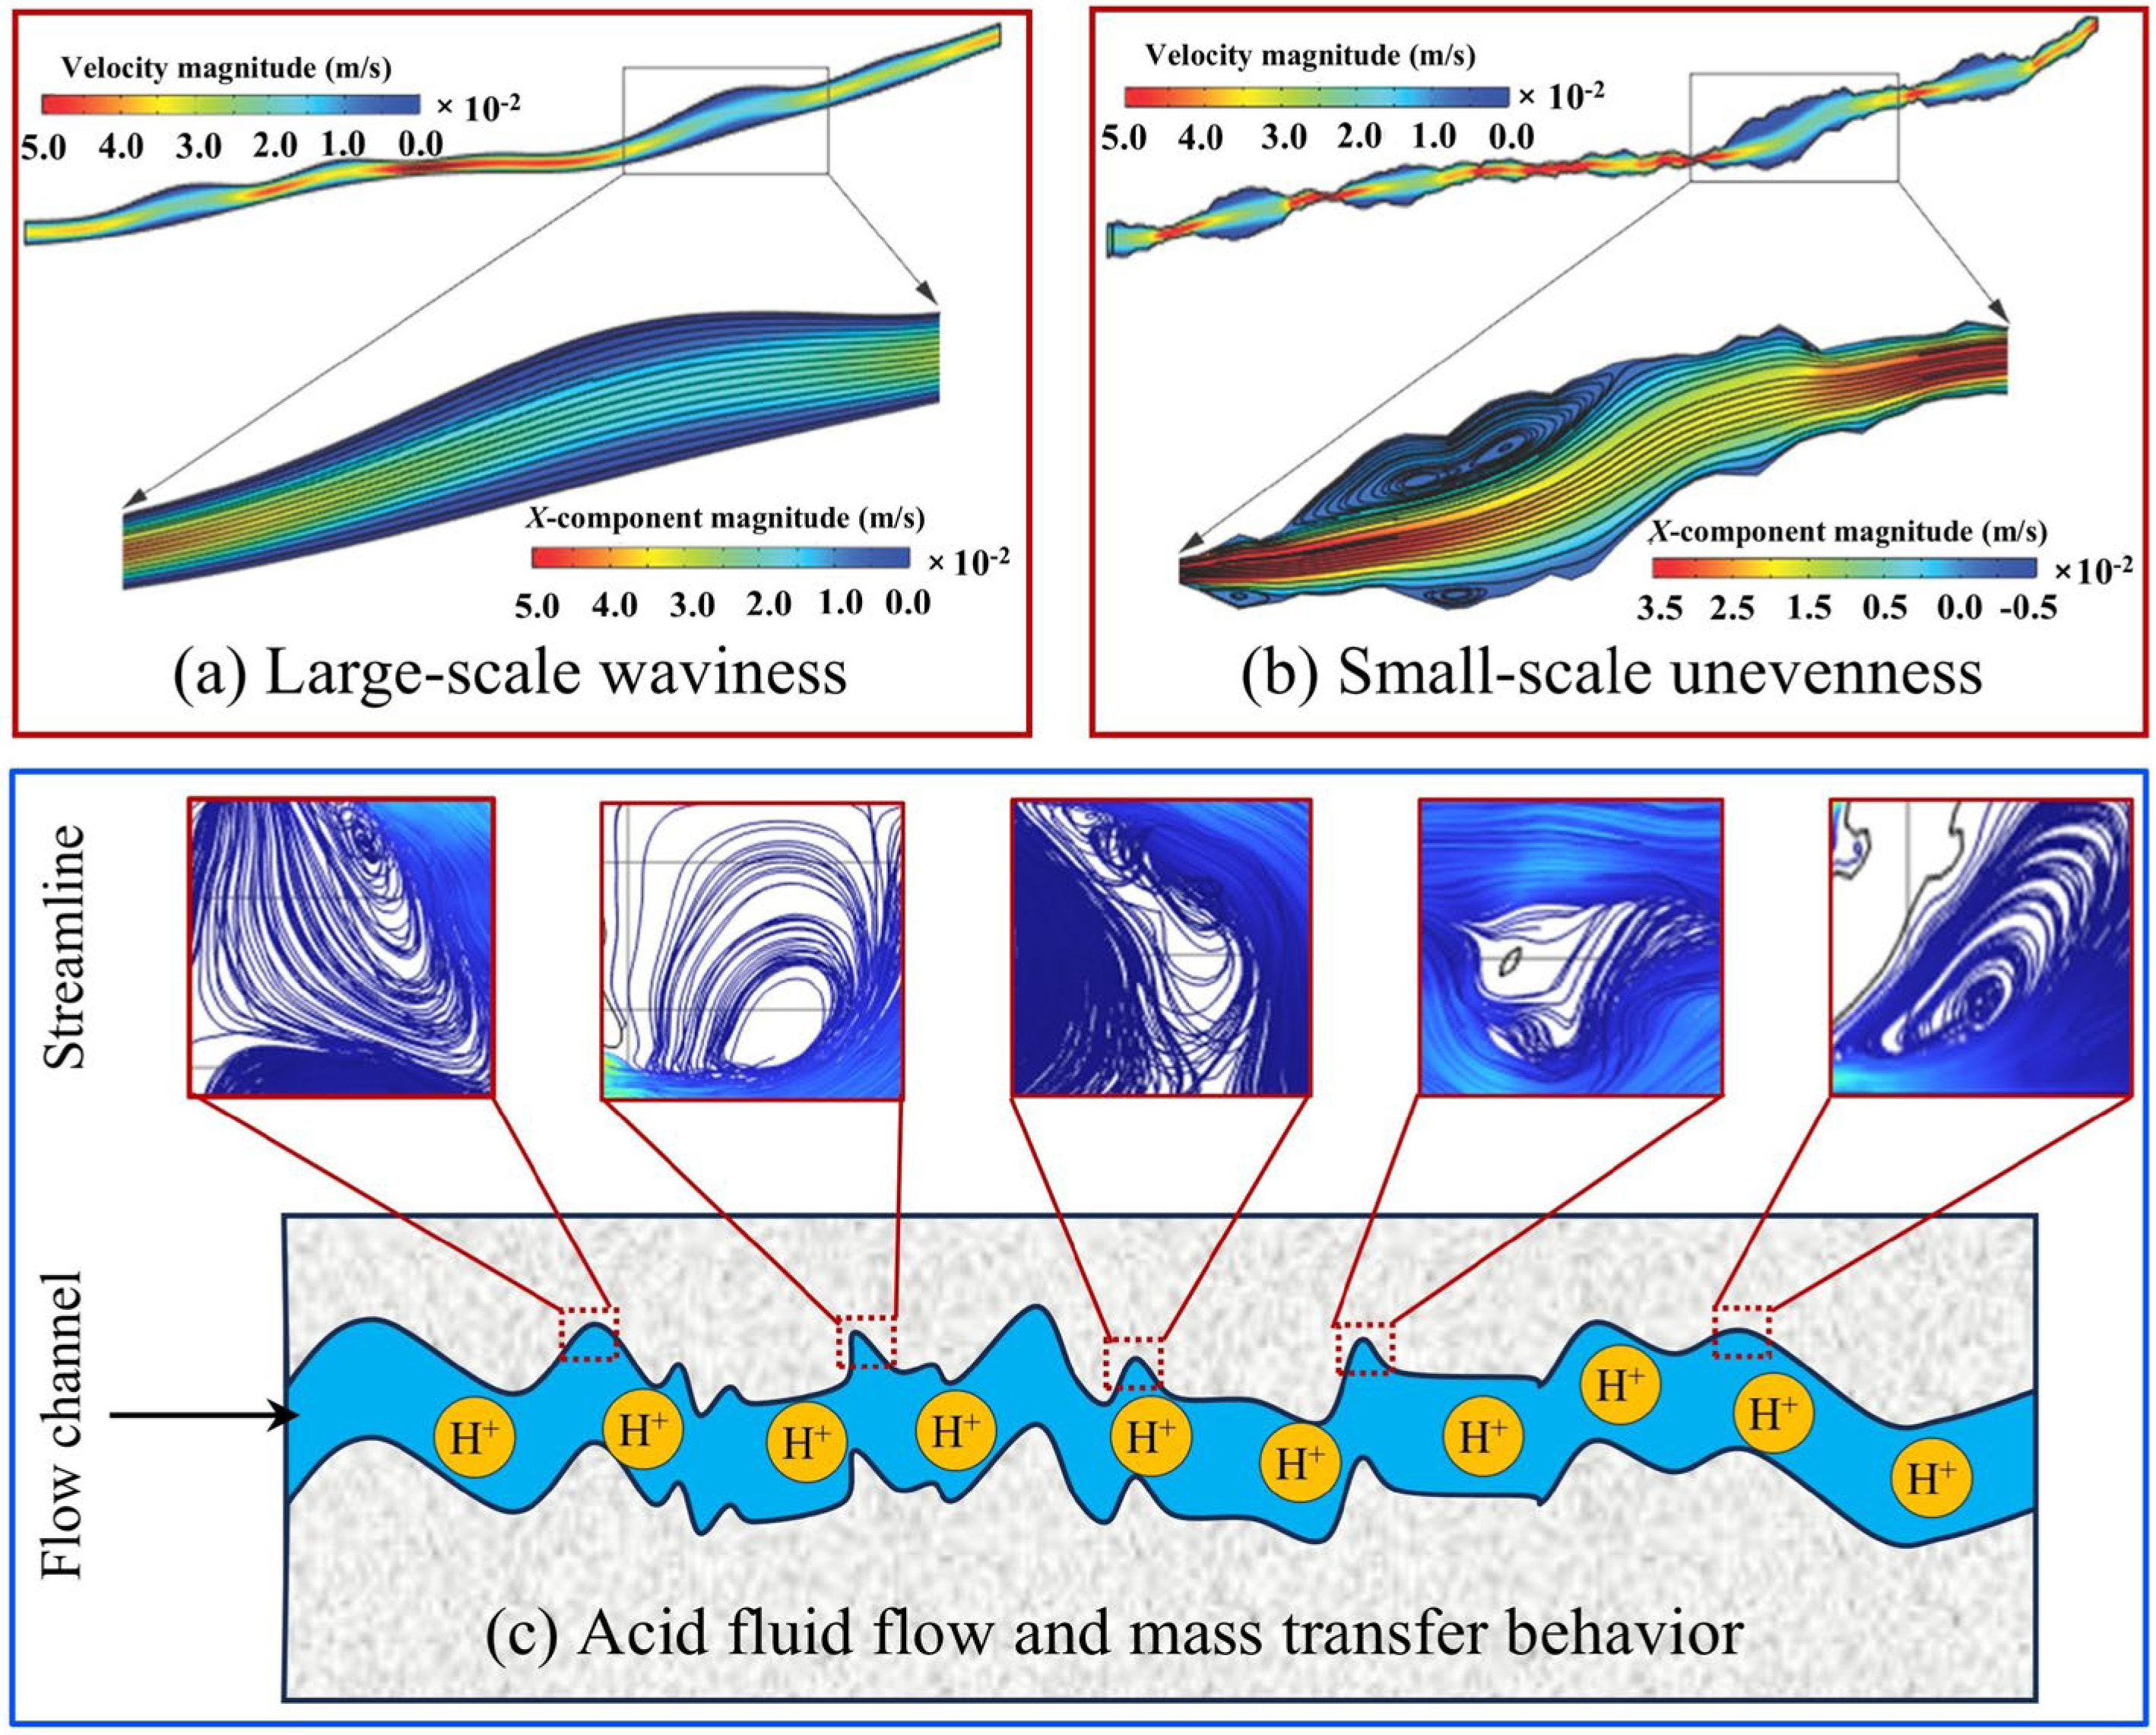
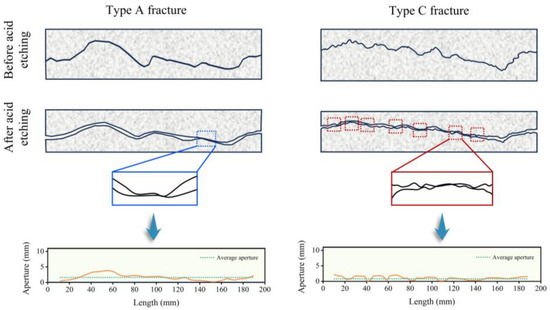
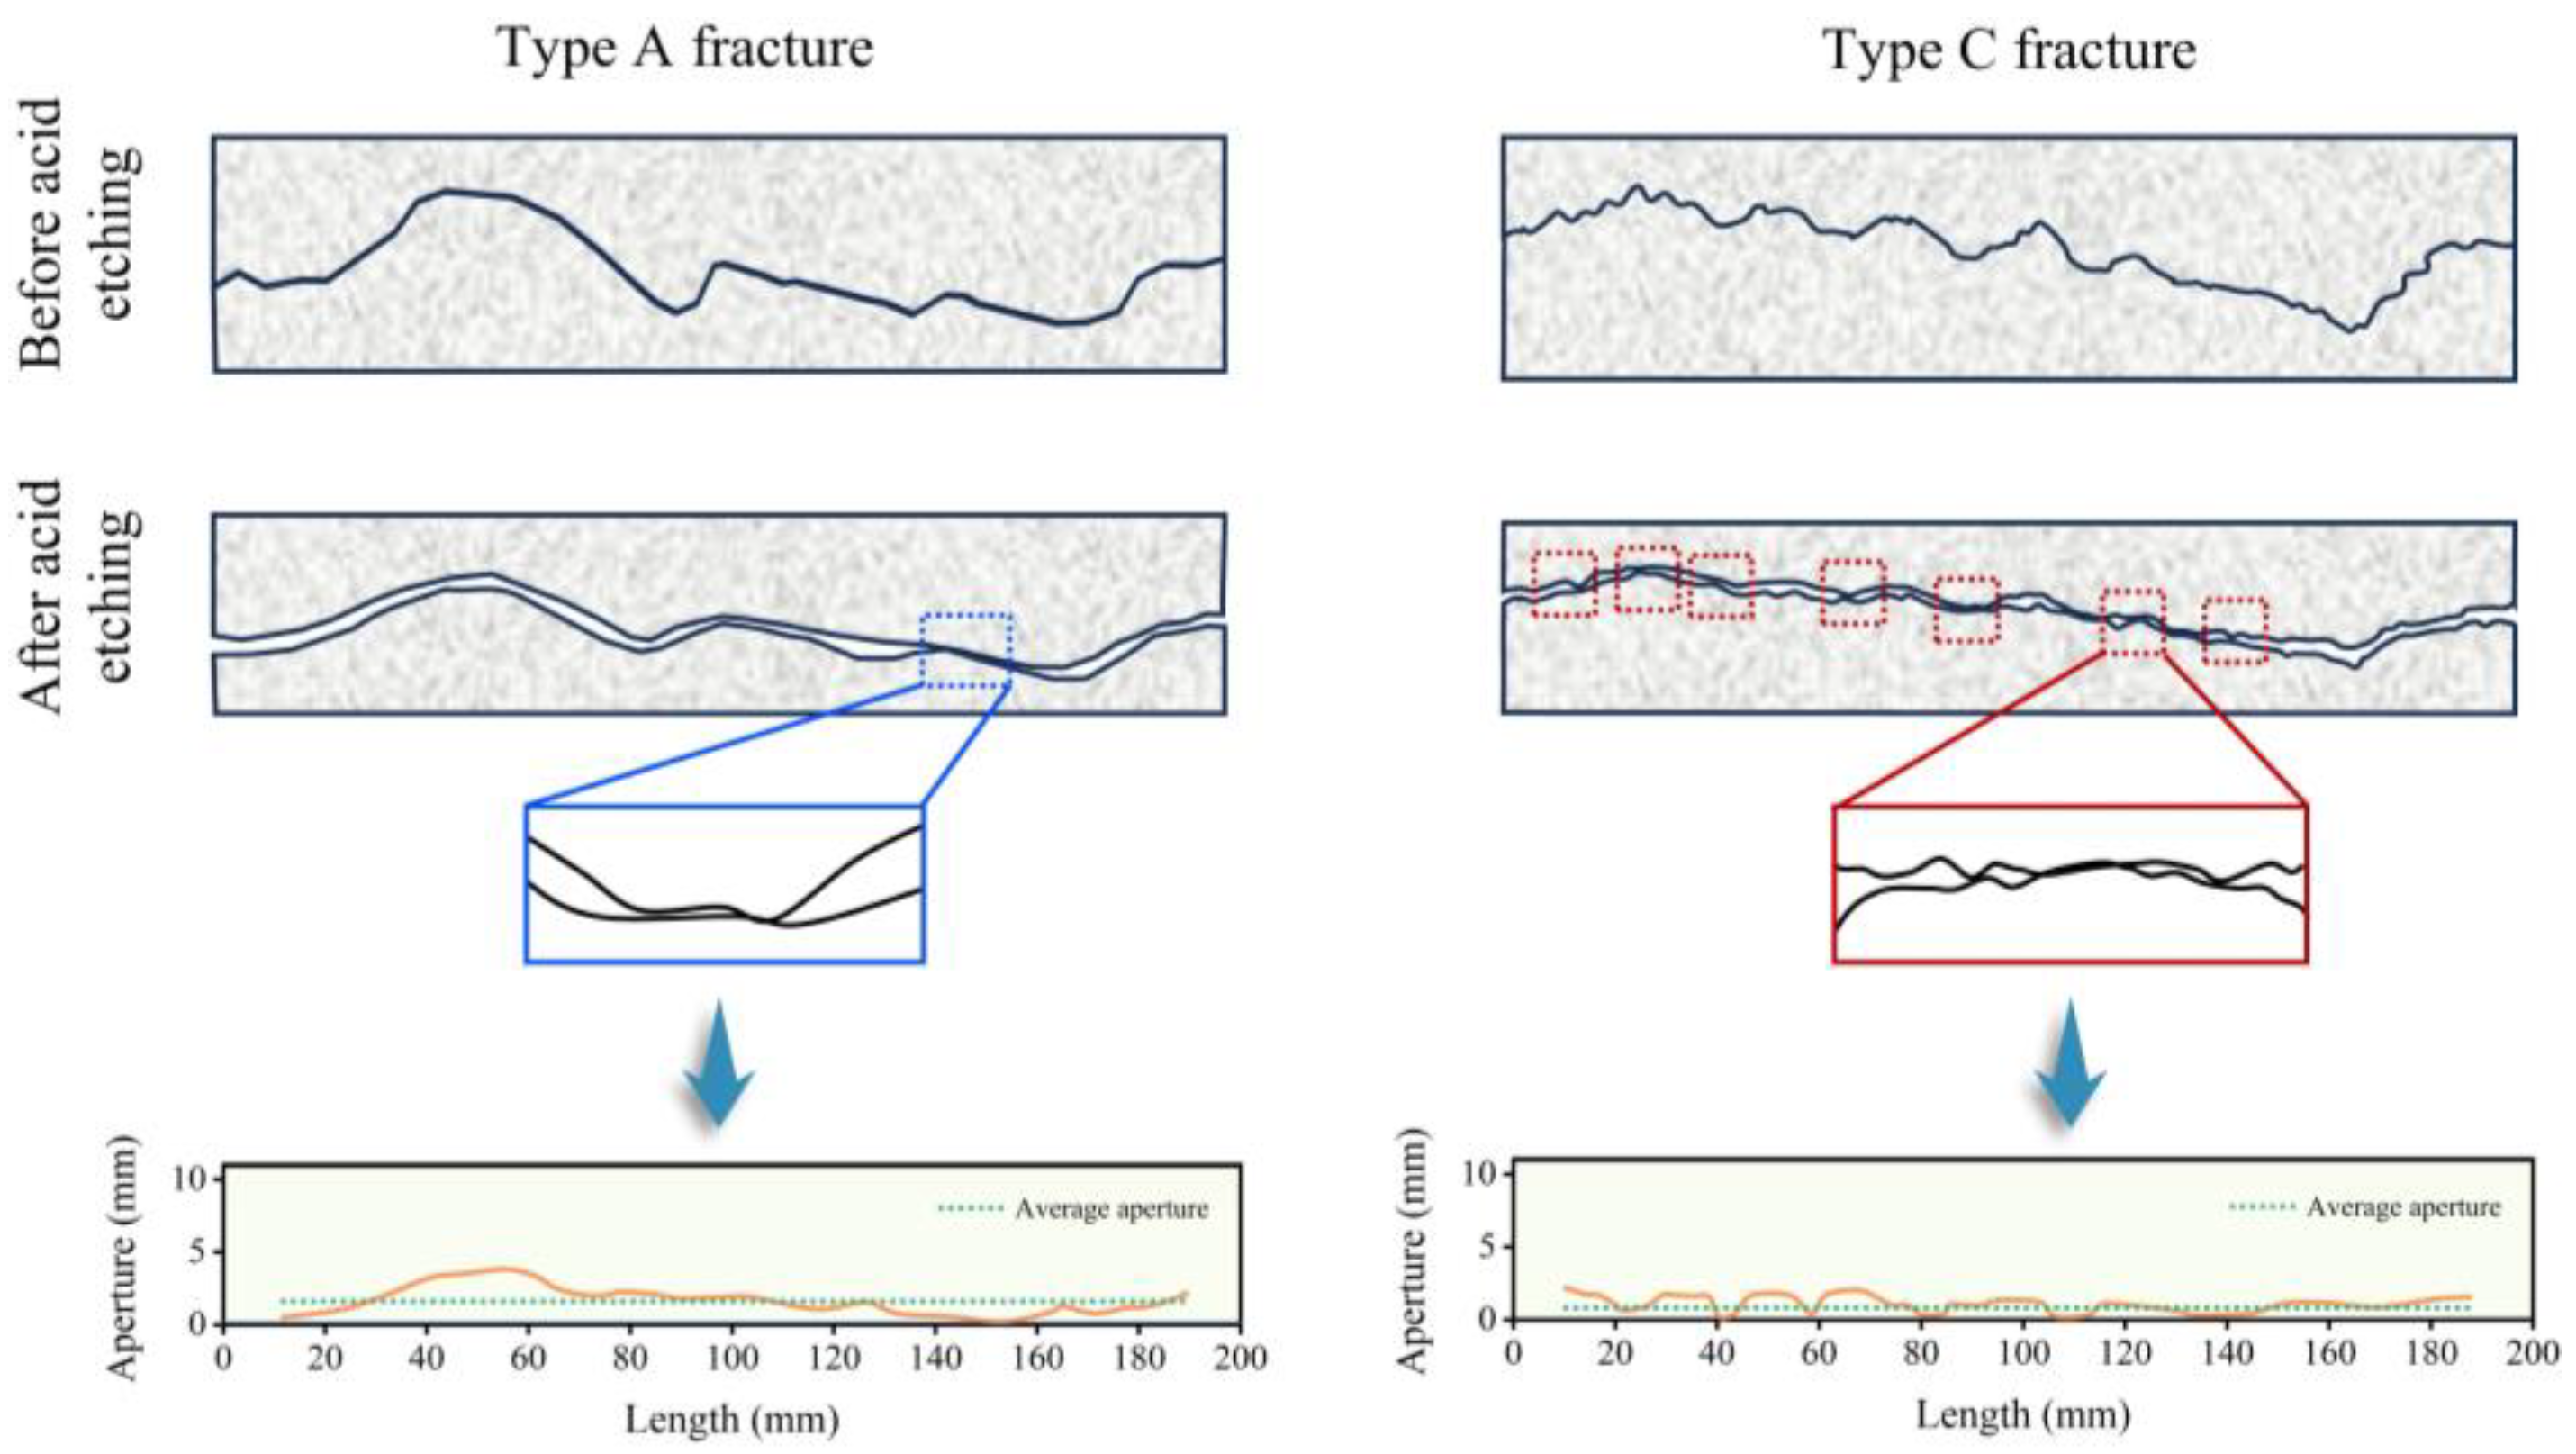
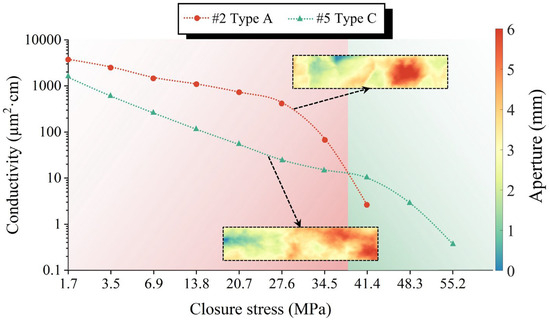
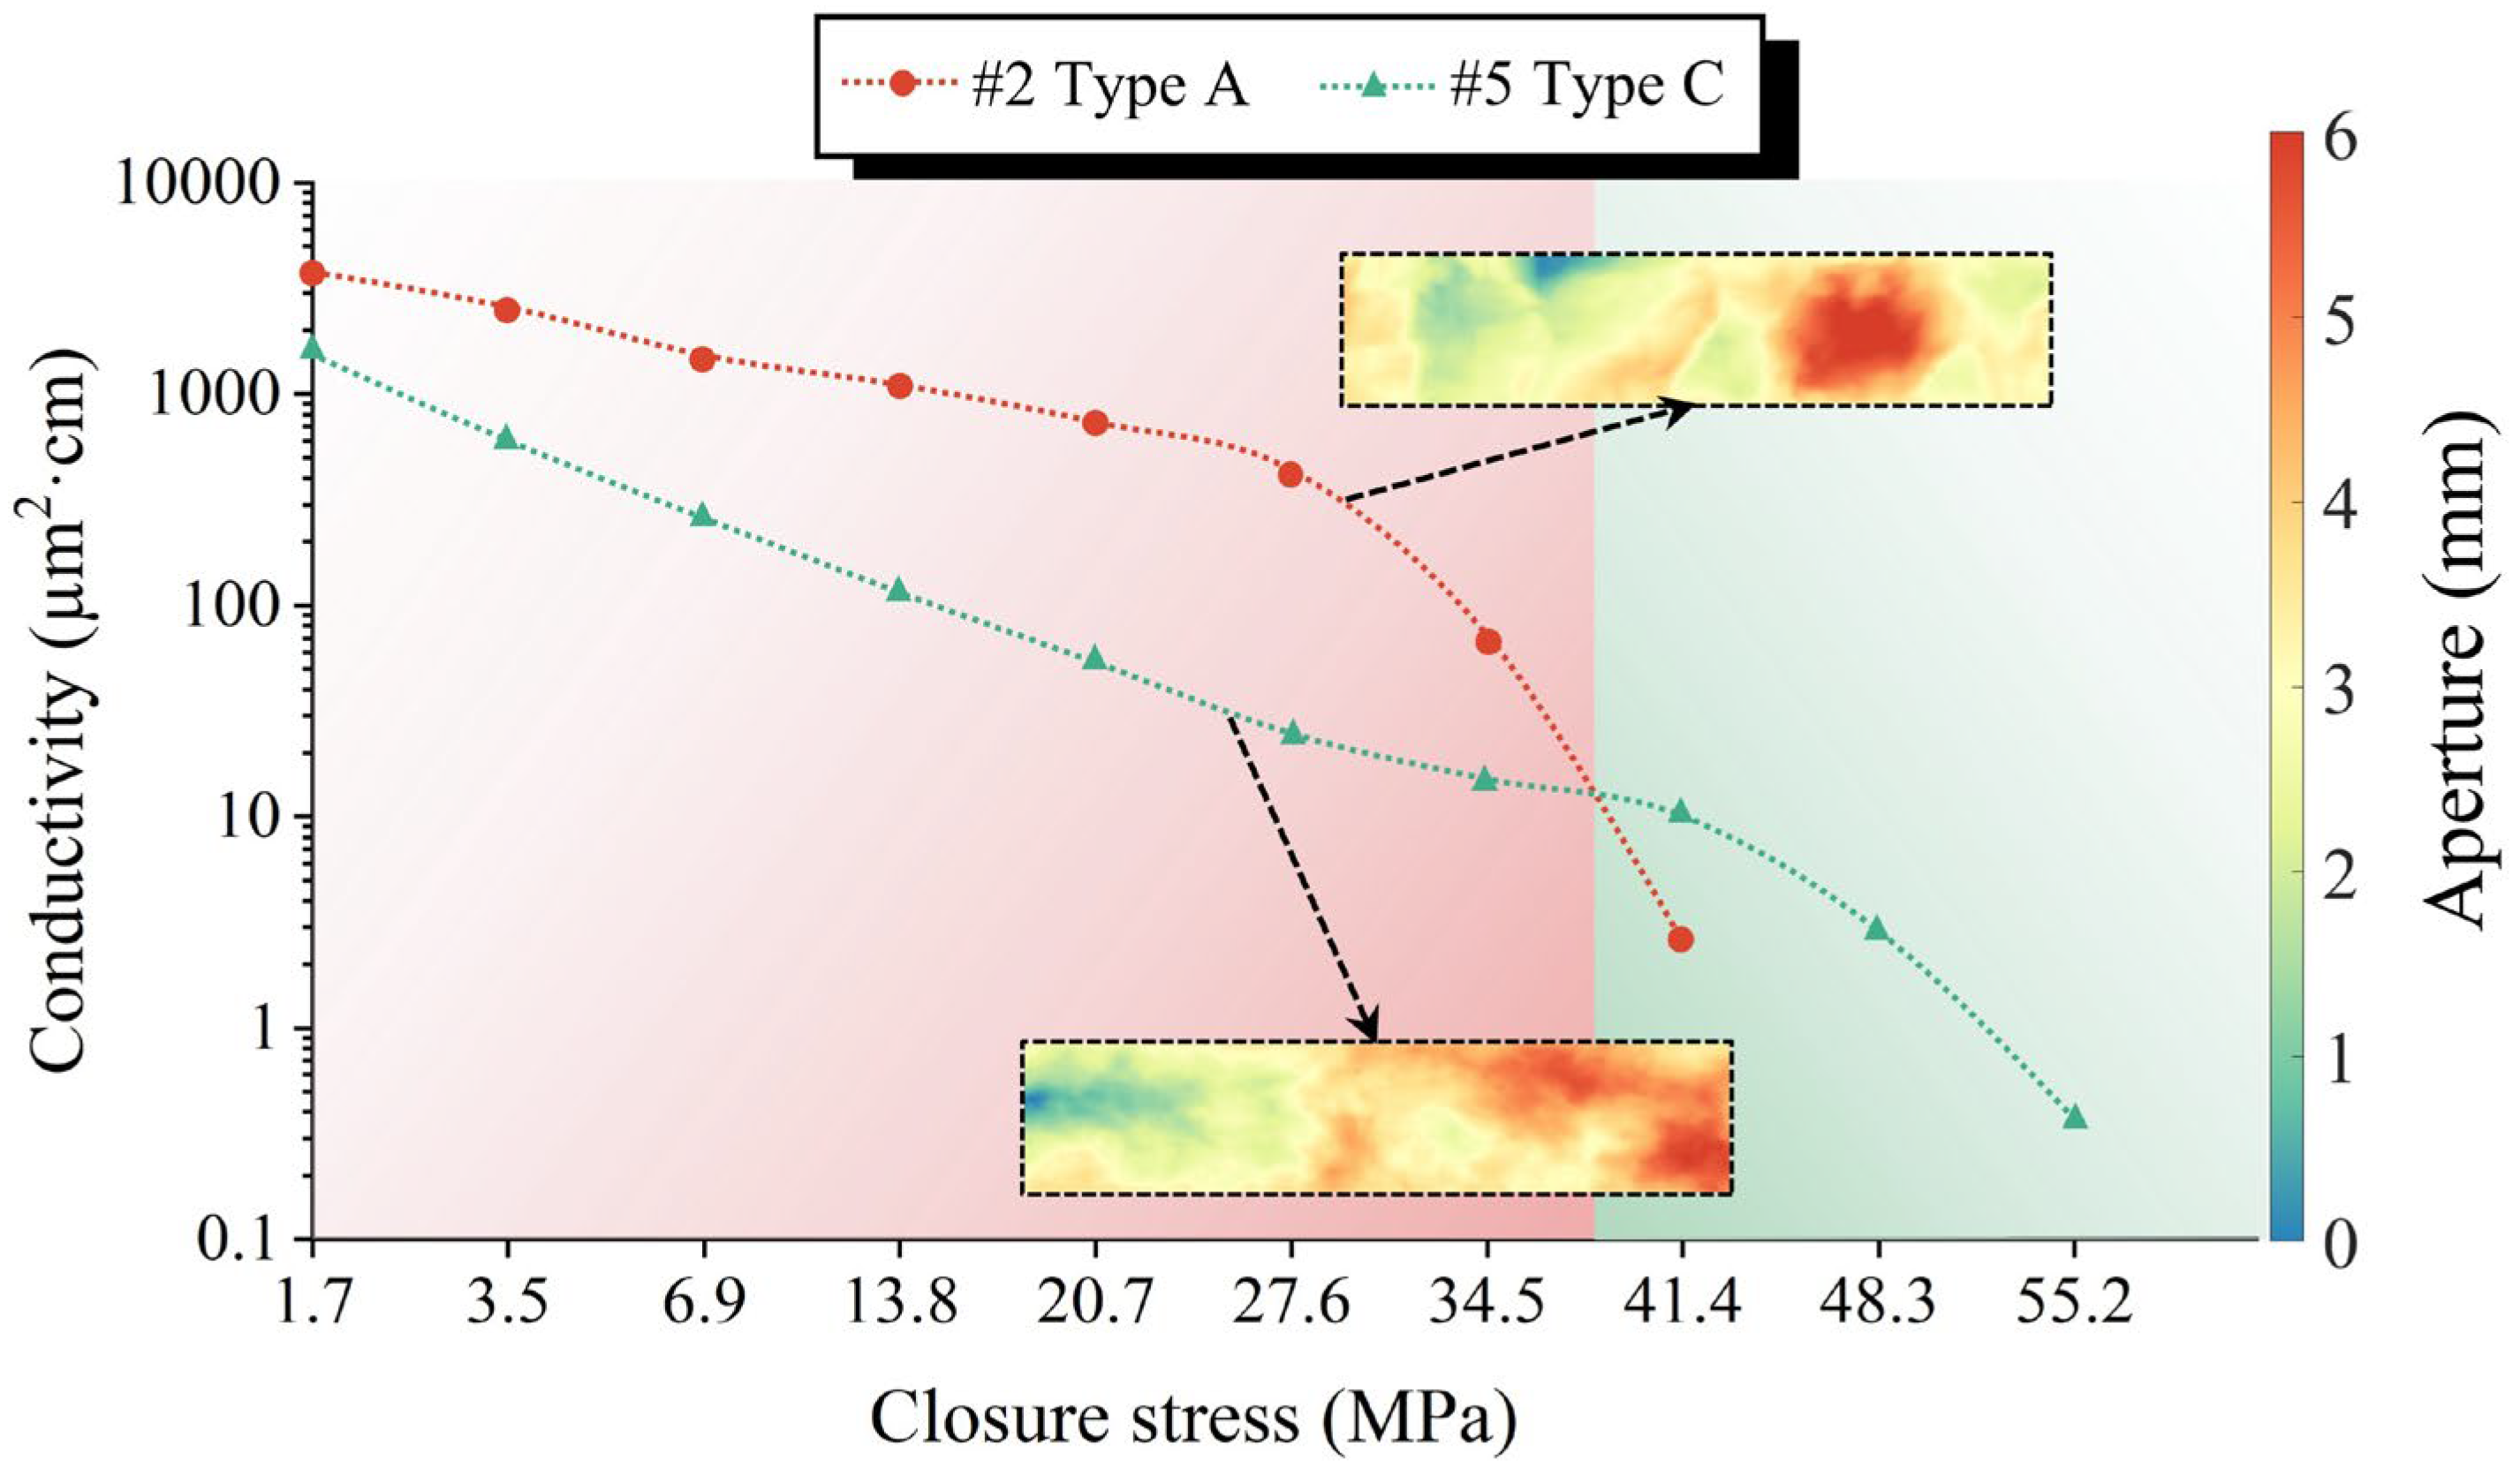
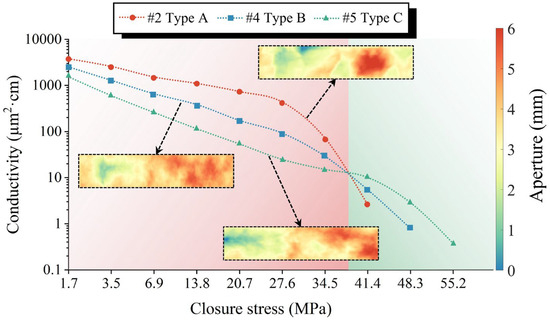
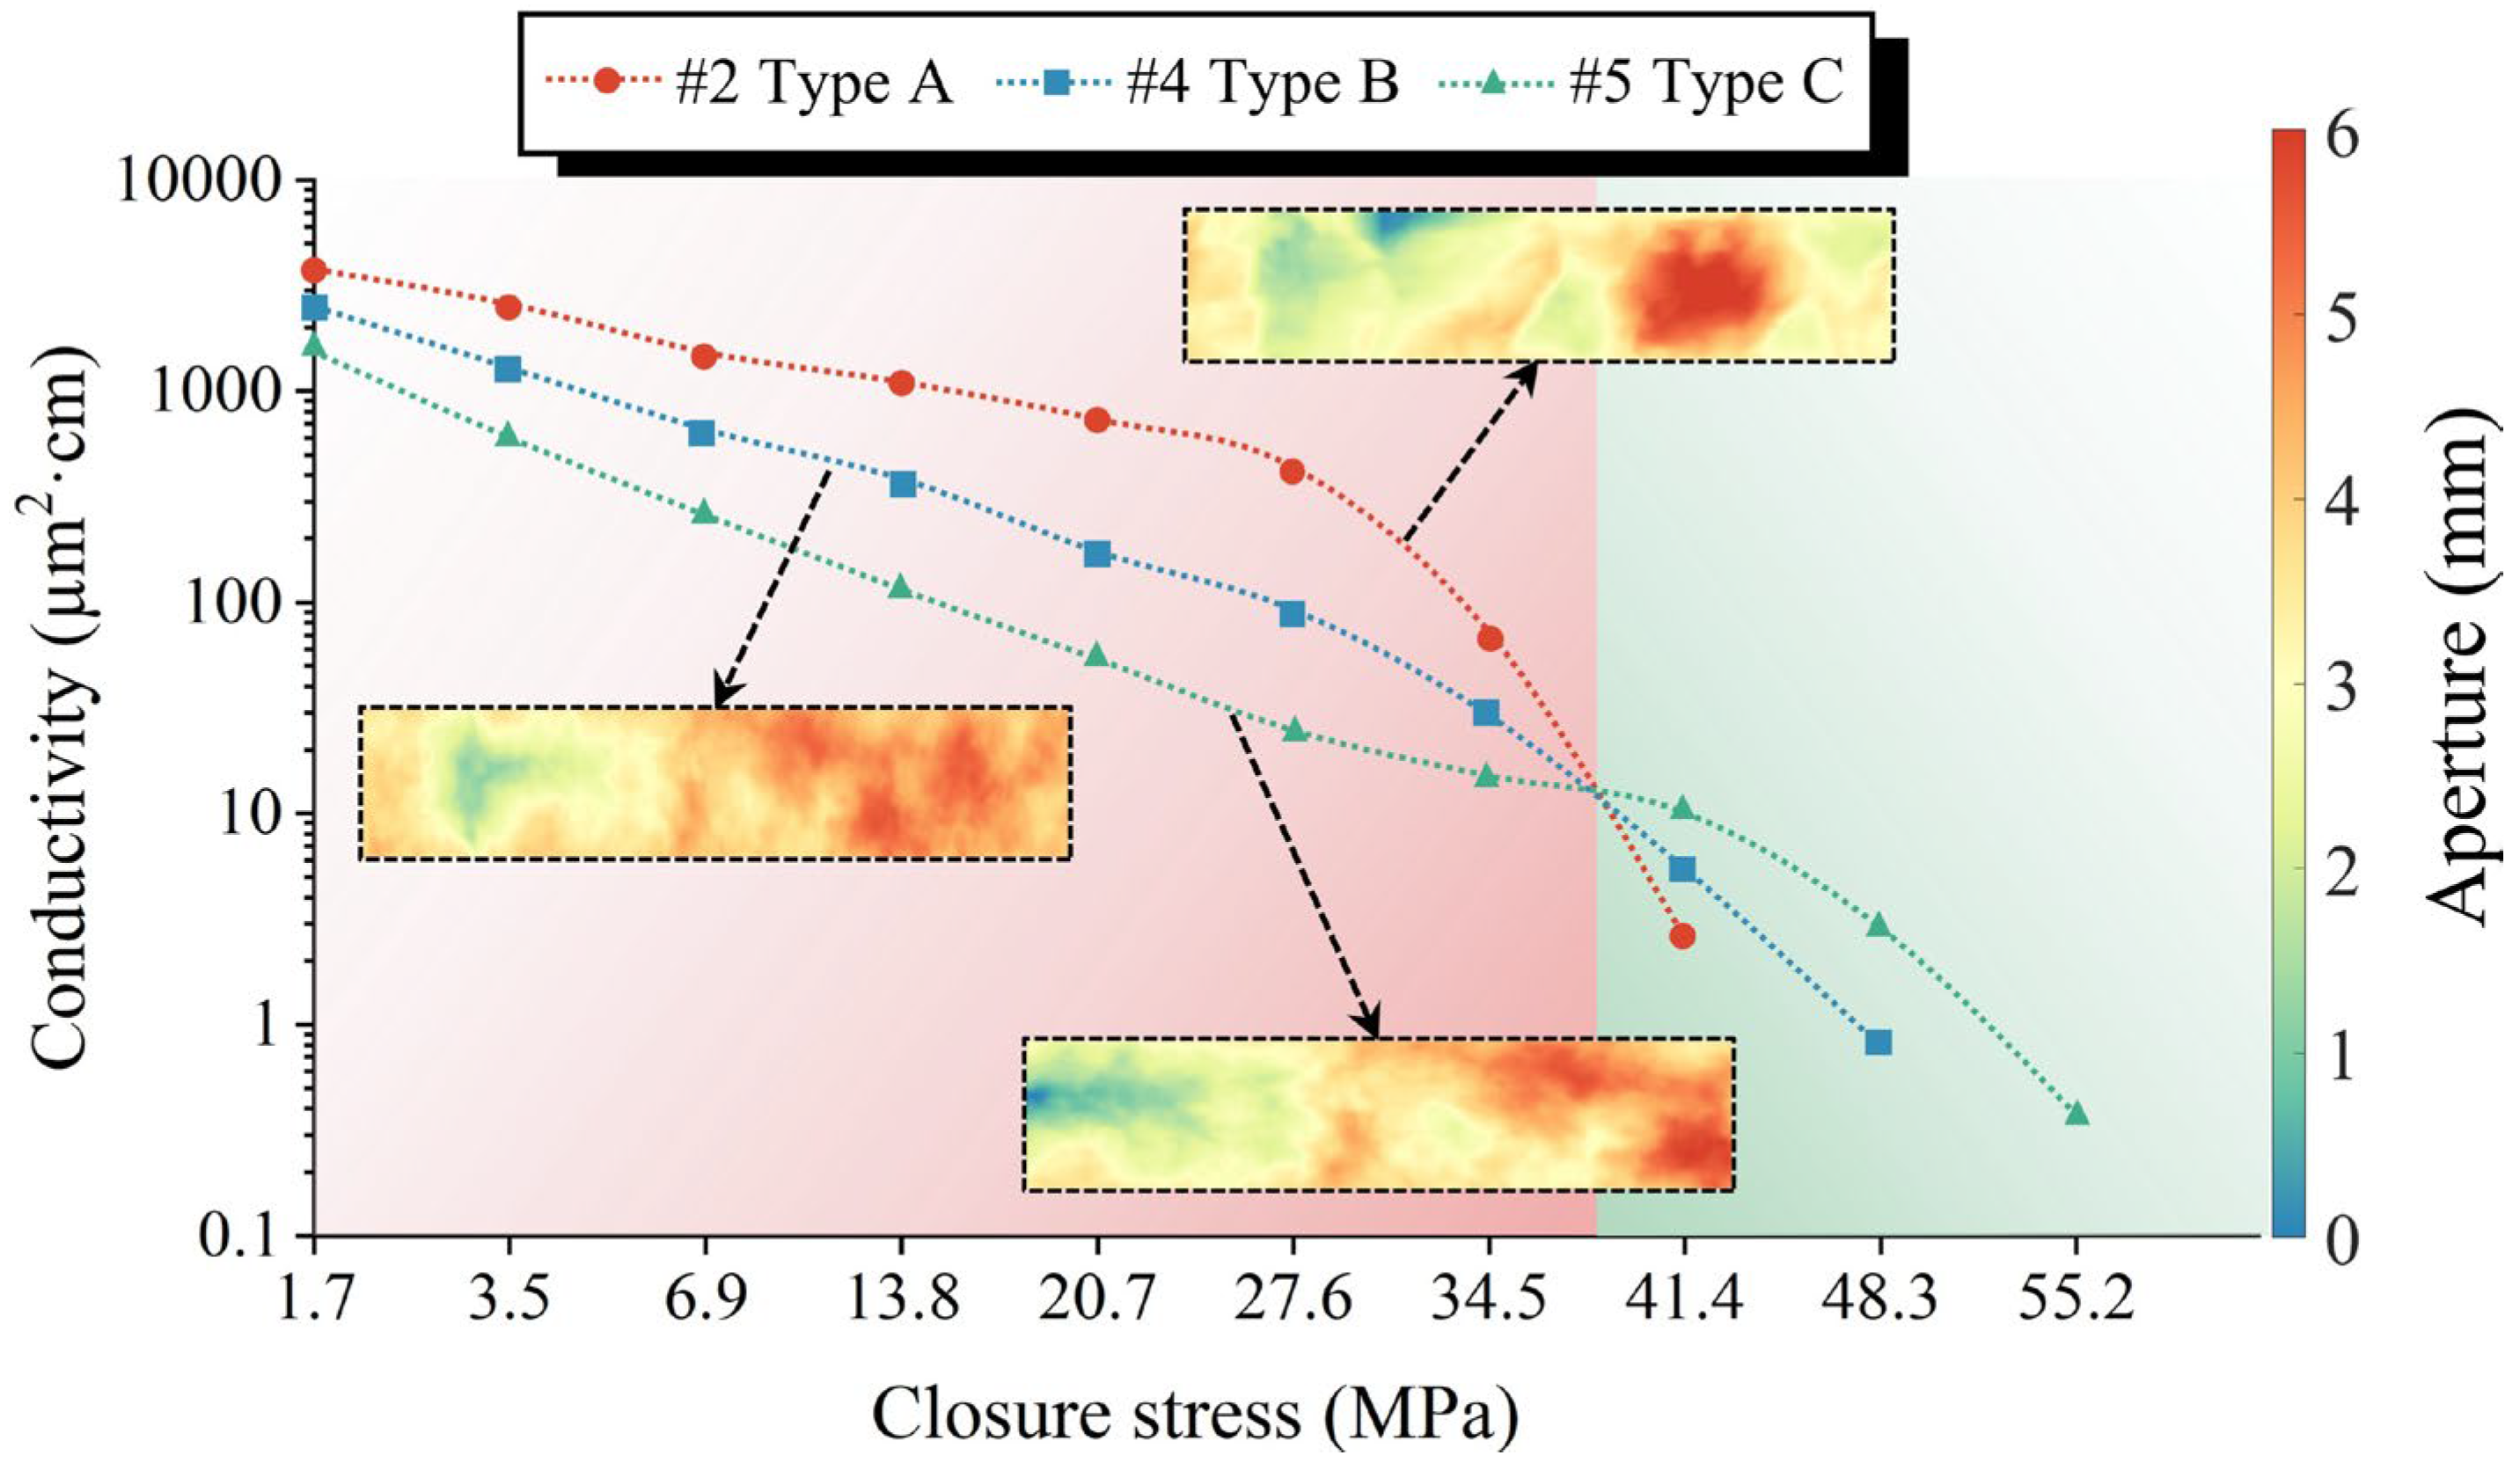
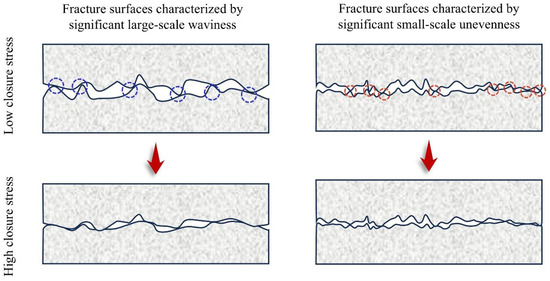
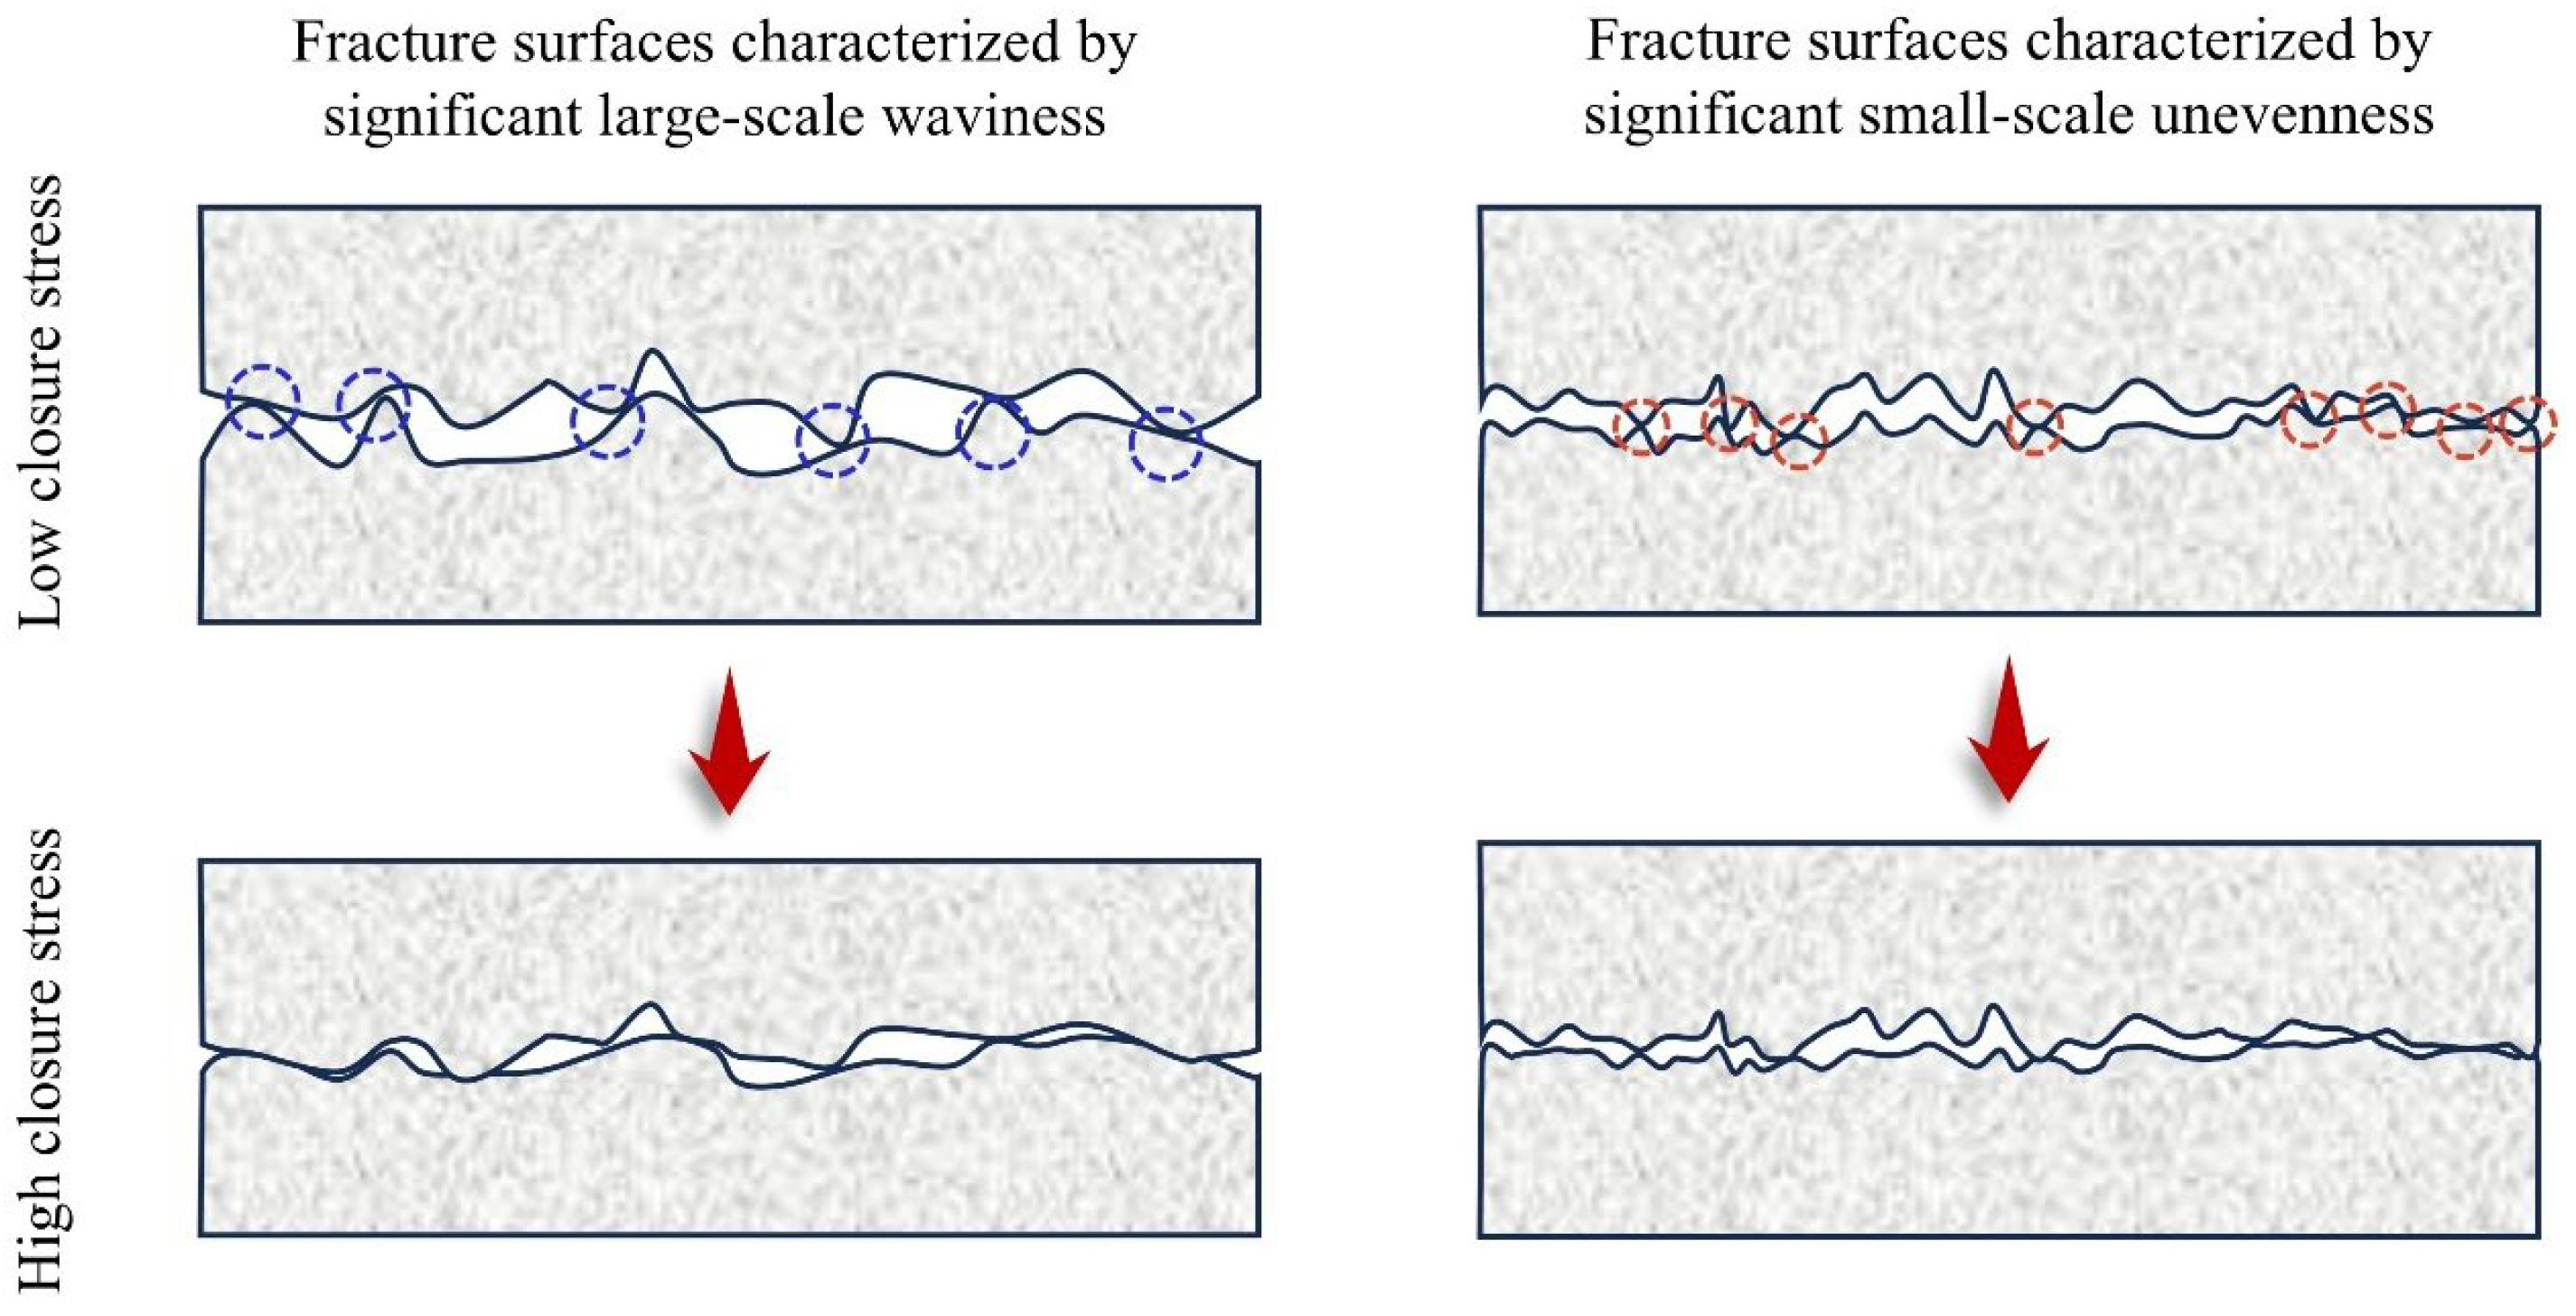
In this experiment, acid injection etching was performed on uniformly rough fracture surfaces (Type C) for durations of 30, 40, and 50 min. As shown in Figure 20, increasing the acid injection time significantly enhanced the dissolution effect. Overall, with a prolonged injection time, the red-colored peaks on the fracture surface gradually diminished, the valleys deepened continuously, and the fracture surface became smoother, indicating that the acid fluid effectively dissolved the rough fracture surface [29,37]. Although Type C fracture surfaces have a relatively low overall roughness, they exhibit pronounced small-scale unevenness characterized by numerous micro-asperities distributed on the surface. In contrast, Type A fracture surfaces have a higher overall roughness but feature prominent large-scale waviness with a small number of large asperities. Figure 21 presents the variations in the profile lines of Type A and Type C fracture surfaces with the acid injection time. As illustrated, both local large-scale waviness regions and local small-scale unevenness regions tend to flatten with increasing etching time. However, the contour surfaces of the local small-scale unevenness regions still retain numerous small asperities after etching. The main reason for the above phenomenon is that the flow field in local large-scale waviness regions is stable, with uniform distributions of streamlines and flow boundary layers (Figure 22a). In contrast, Figure 22b shows that due to the presence of numerous micro-asperities in local small-scale unevenness regions, flow field disturbances are induced [38,39,40,41], leading to disordered streamlines, non-uniform distribution of the flow boundary layer, and even flow boundary layer separation, which further generates vortices on the fracture surface. As shown in Figure 22c, the distribution of the flow boundary layer affects the local H+ mass transfer rate. For a uniformly distributed flow boundary layer, the spatial variation in the H+ mass transfer rate is small, resulting in similar dissolution rates and uniform etching. Conversely, for a non-uniformly distributed flow boundary layer, the spatial variation in the H+ mass transfer rate is large, leading to differences in dissolution rates between asperities and depressions. The dissolution amount at asperities is higher than that at depressions, forming non-uniform etching. Therefore, after etching, fracture surfaces with significant small-scale unevenness become macroscopically smooth overall but retain a large number of micro-asperities due to differential dissolution. When the upper and lower fracture surfaces close, some of these micro-asperities become supporting points that determine the formation of flow channels. As shown in Figure 23, Type A fracture surfaces with prominent large-scale waviness have a small number of large asperities. After uniform etching, the matching degree between the upper and lower fracture surfaces is high, and the few supporting points prop open the fracture surfaces to form large flow channels with a large average fracture width. In contrast, Type C fracture surfaces characterized by significant small-scale unevenness have numerous micro-asperities. After non-uniform etching, the matching degree between the upper and lower fracture surfaces is low, leading to the formation of small flow channels with a large number of supporting points and a small average fracture width. Consequently, as shown in Figure 24, under low closure stress, Type A fracture surfaces exhibit high fracture conductivity due to their large flow channels, while Type C fracture surfaces have low fracture conductivity because of their small flow channels. Under high closure stress, due to the low matching degree and abundant supporting points, Type C fracture surfaces exhibit better and more sustained fracture conductivity. In contrast, Type A fracture surfaces have a high matching degree but few supporting points, resulting in low fracture conductivity and rapid attenuation. The small-scale waviness characteristics of fracture surfaces are of great significance for maintaining conductivity under high closure stress.
Figure 20.
Etched profiles of rough fracture surfaces at different injection times.
Figure 21.
Temporal variations in the contour lines at the large-scale waviness and small-scale unevenness regions on the fracture surface. (The colored lines represent the contour lines of fracture surfaces: red for the initial contour, blue for the contour after 30 min of etching, green for the contour after 40 min of etching, and yellow for the contour after 50 min of etching).
Figure 22.
Acid fluid flow and H+ mass transfer in multi-scale rough fractures (adapted from [41]).
Figure 23.
Fracture surface matching degree and aperture distribution before and after acid etching.
Figure 24.
Conductivity of Type A/C Fracture Morphologies under Varying Closure Stresses.
3.3.2. Frequency Distribution of Fracture Surface Elevation
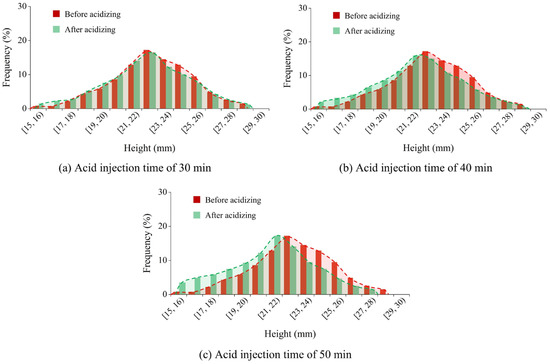
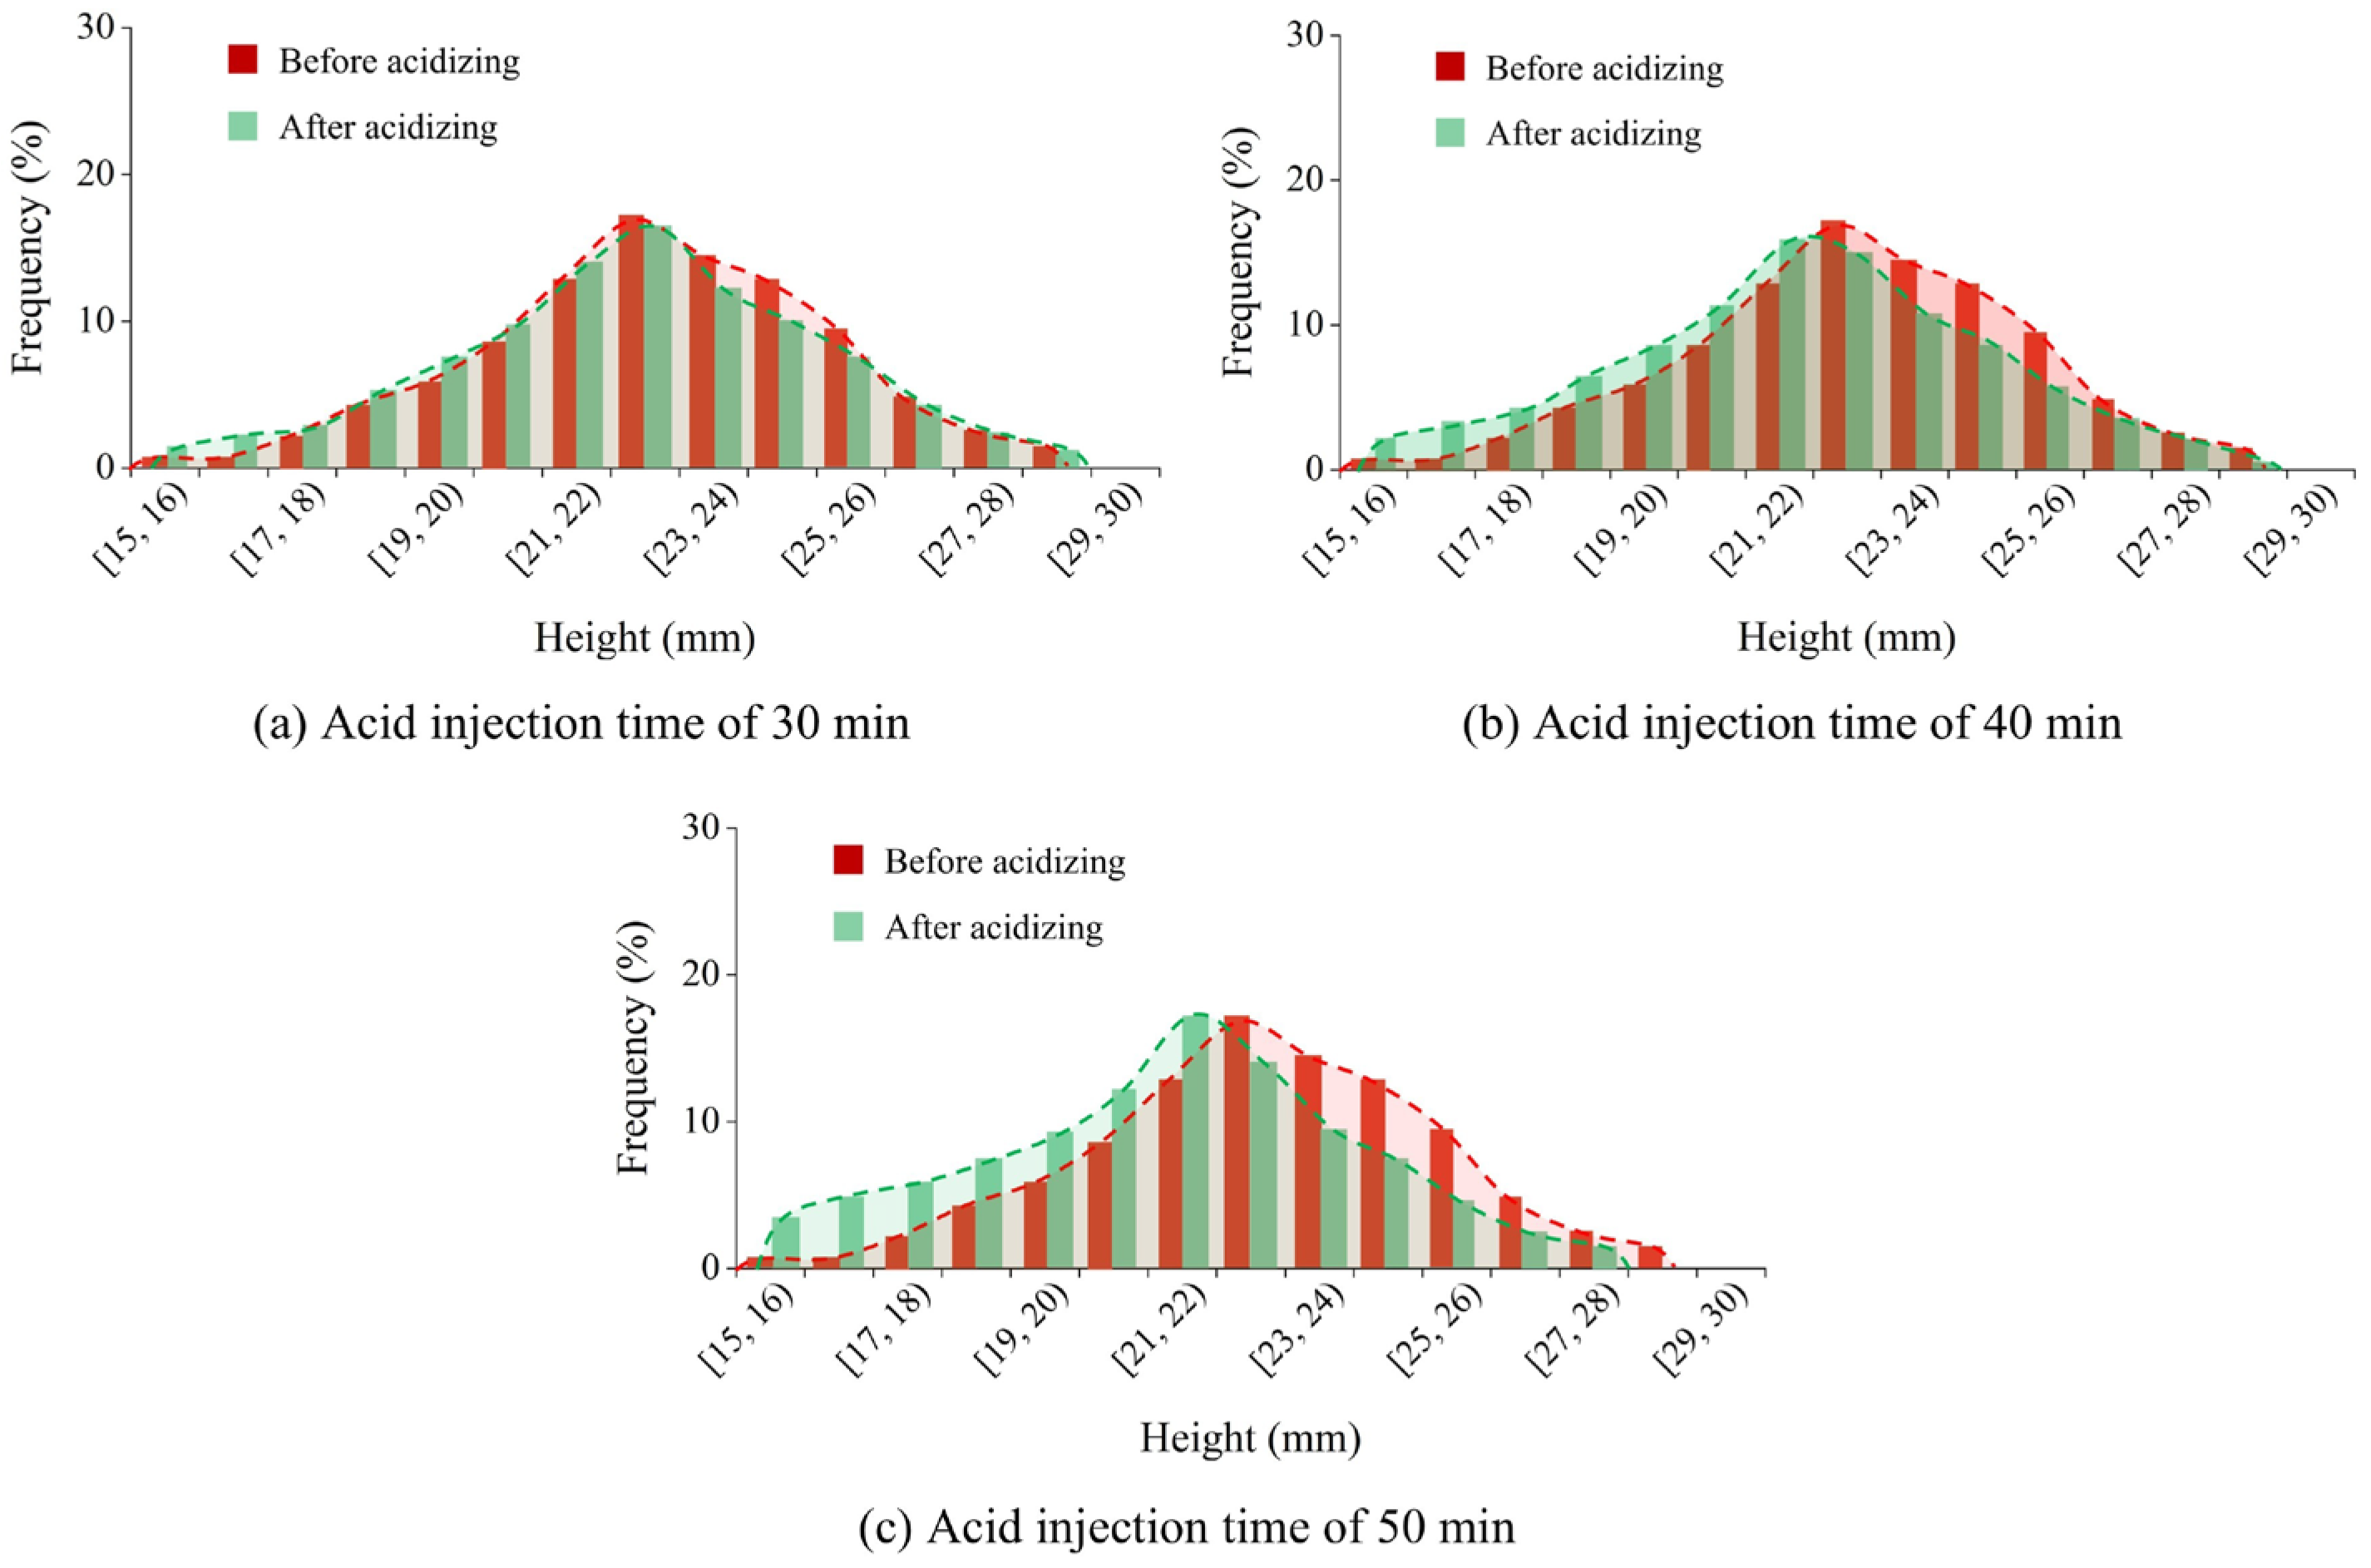
As shown in Figure 25, the elevation of the rough rock slab’s fracture surface follows a normal distribution prior to acid etching. After acid etching, with the extension of the acid injection time, the elevation distribution gradually shifts leftward, and the elevation peaks diminish—this phenomenon can be attributed to the prolonged acid–rock reaction duration and increased etching intensity induced by the longer injection time. However, for such Type C fracture surfaces with low roughness, the overall shift of the elevation distribution before and after etching is relatively slight, with the distribution ranges overlapping considerably.
Figure 25.
Effect of acid injection time on elevation frequency distribution of rough rock slabs before and after acid etching.
3.3.3. Change in Fracture Surface Area Tortuosity
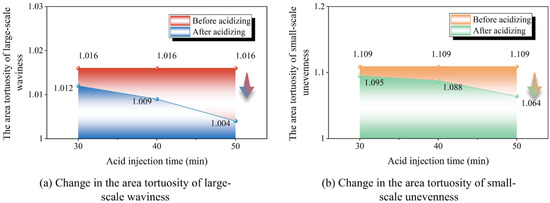
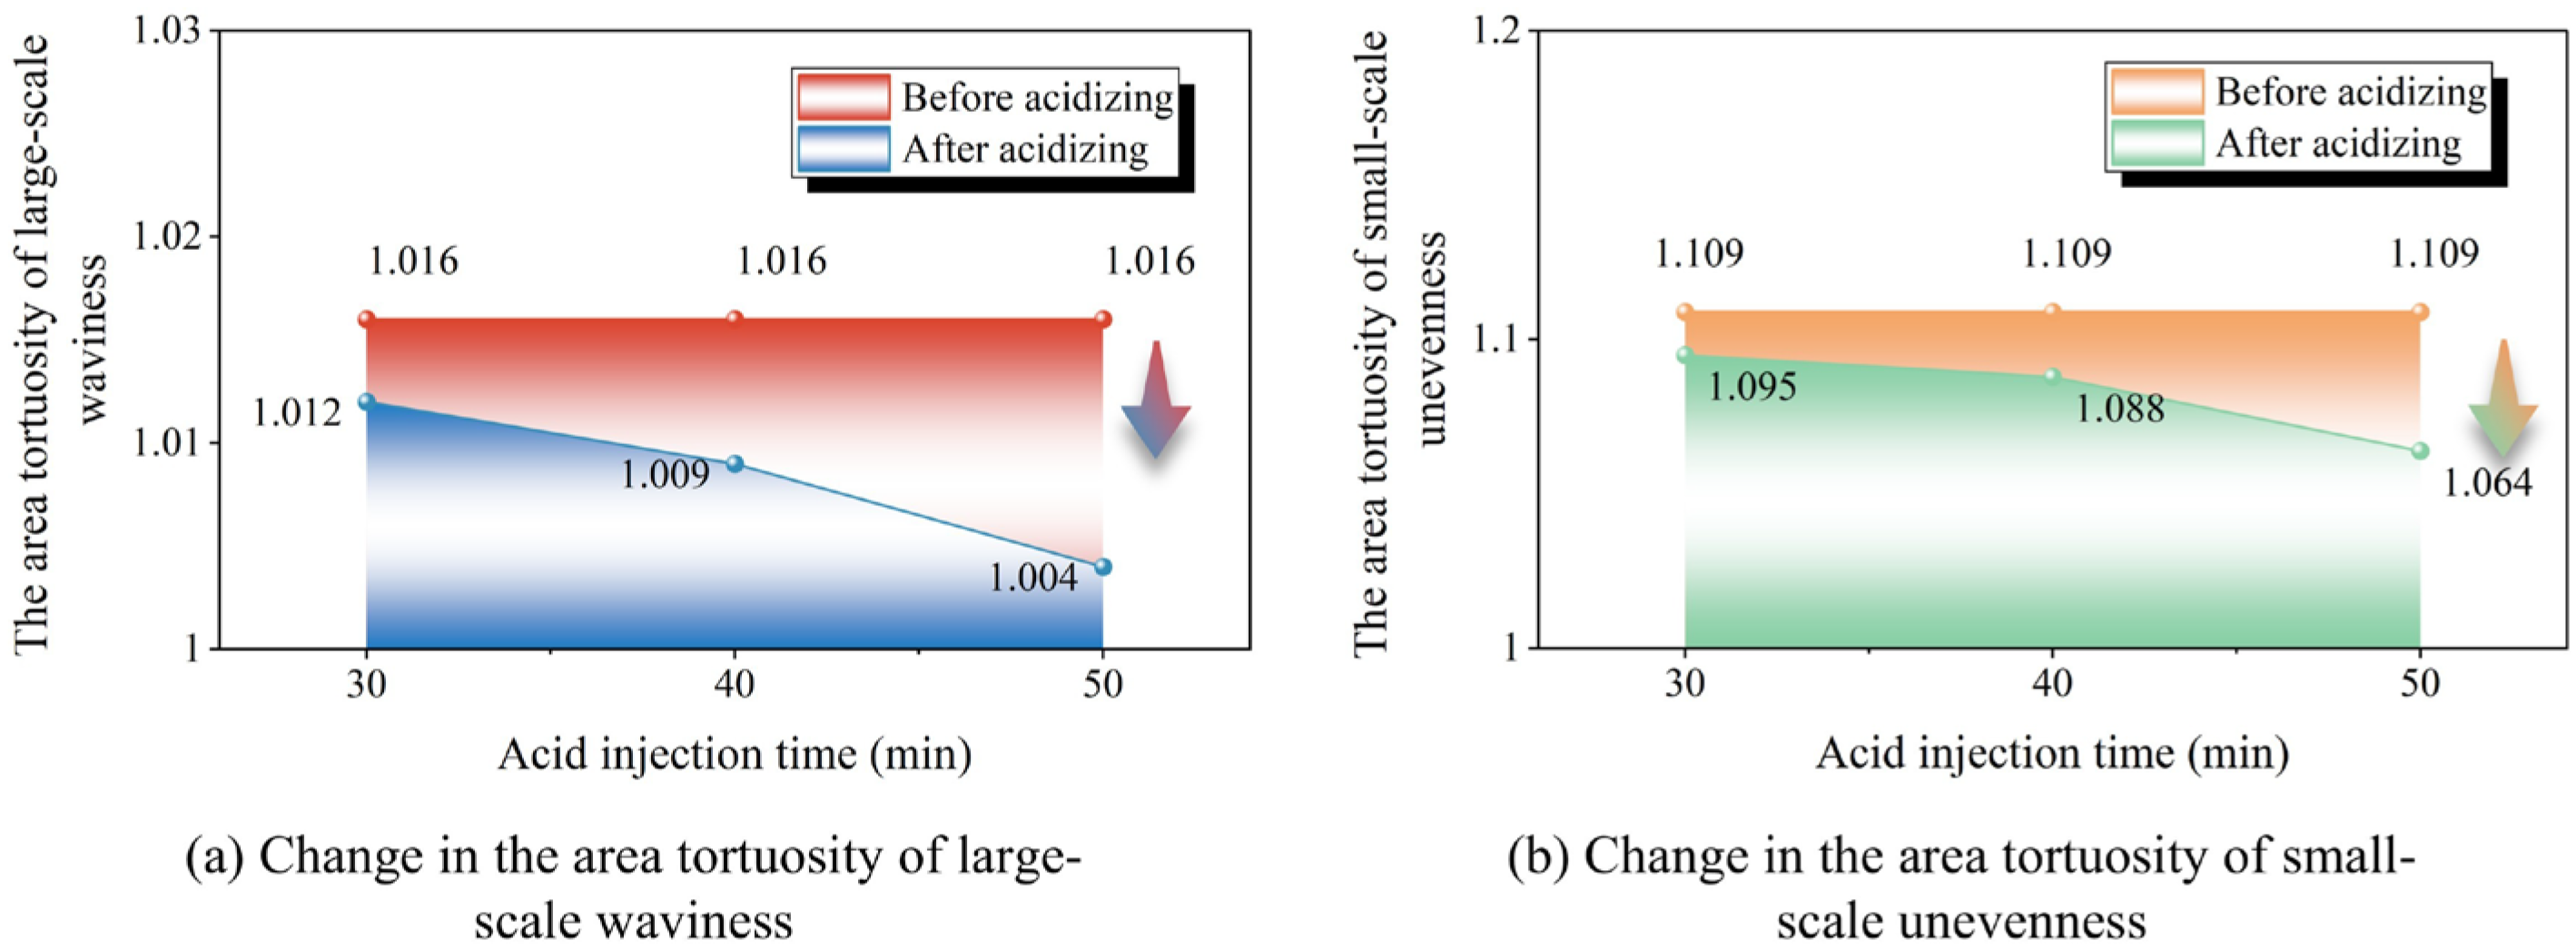
Table 9 and Figure 26 illustrate that the original surface area tortuosity εa, large-scale waviness area tortuosity εa1, and small-scale unevenness area tortuosity εa2 of the fracture surface gradually decrease with the extension of the acid injection time. After acid etching, the magnitude of the decrease in εa2 (decreasing from 1.109 to 1.064) is greater than that in εa1 (decreasing from 1.016 to 1.004). This indicates that during the etching process, the small-scale unevenness features of the fracture morphology are smoothed first.
Table 9.
Change in slabs’ surface area and tortuosity. (# denotes the experimental number.)
Figure 26.
Change in the area tortuosity of large-scale waviness and small-scale unevenness of each fracture surface. (The arrows indicate a decrease in the data value).
3.3.4. Initial Aperture
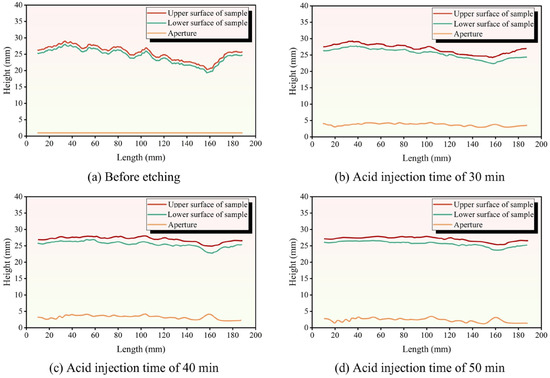
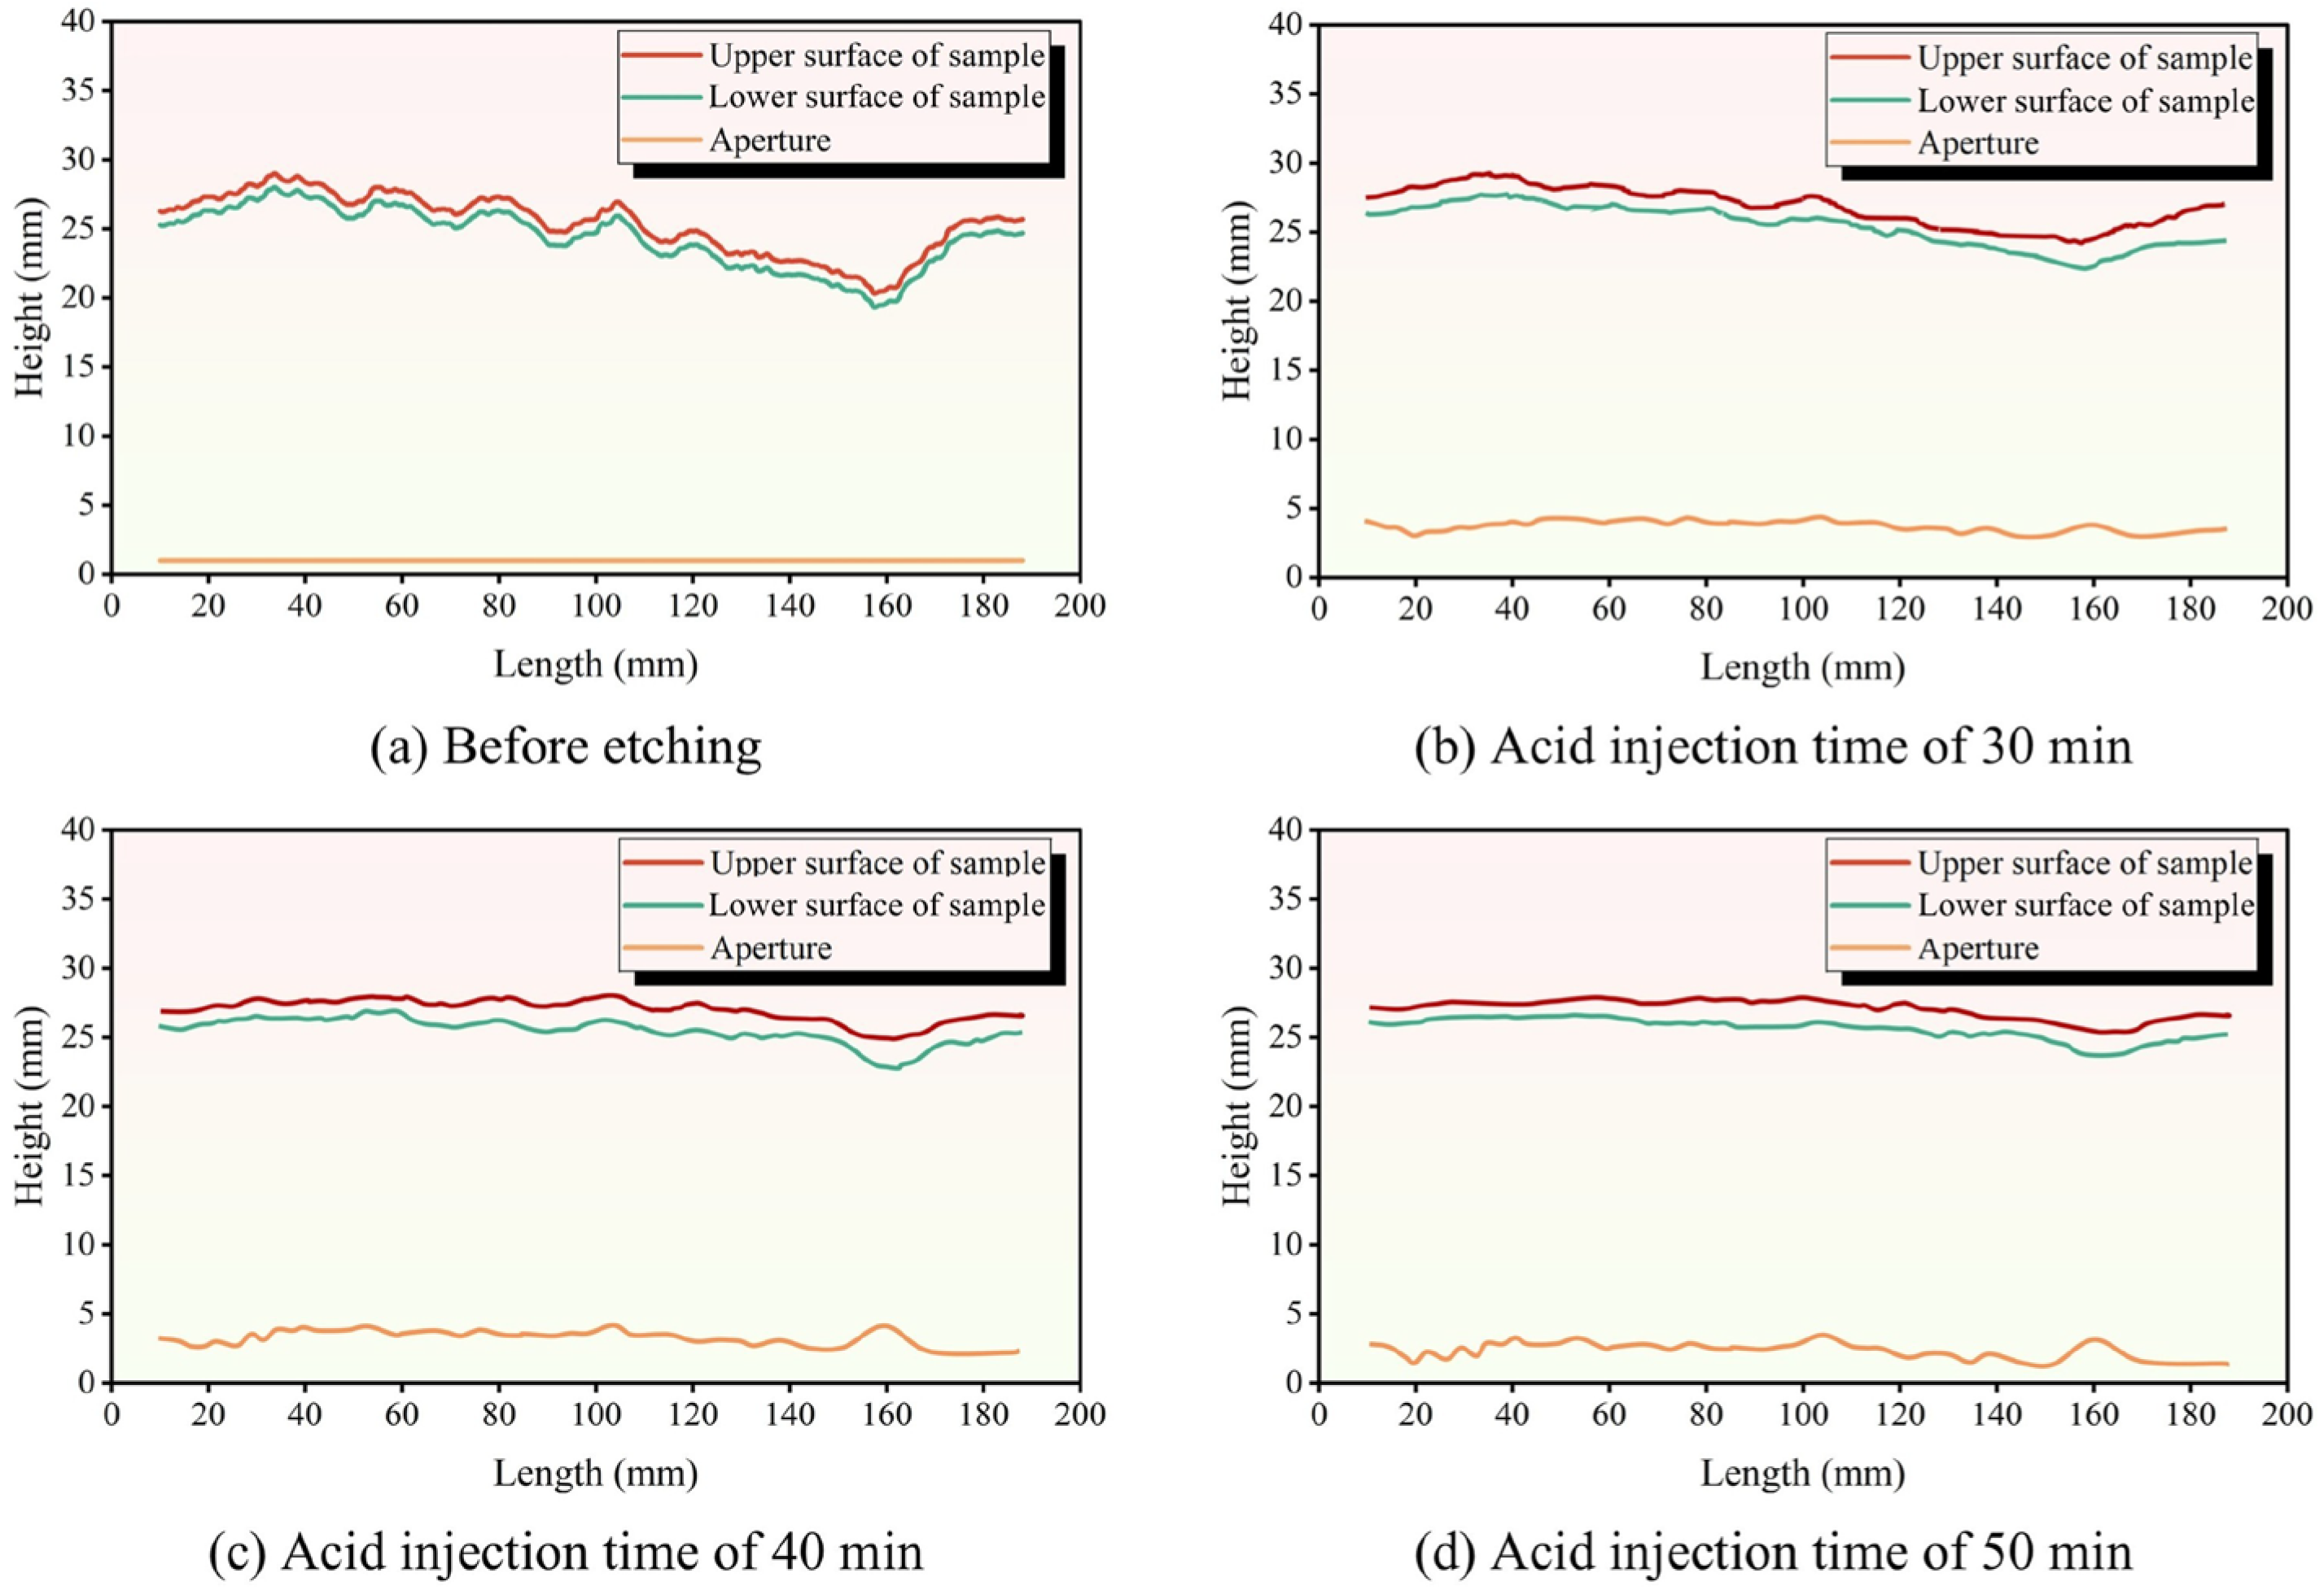
As illustrated in Figure 27, with the extension of the acid injection time, the tortuous contour of the fracture profile becomes smoother after acid etching. However, due to the high small-scale unevenness of the fracture surface—characterized by numerous small protrusions on the original fracture surface—the post-etching contour still retains a certain number of such small protrusions. Under closure stress, these small protrusions act as support points to form flow channels with a certain level of conductivity.
Figure 27.
Comparison of fracture profiles before and after acid etching at different acid injection times (x = 37 mm).
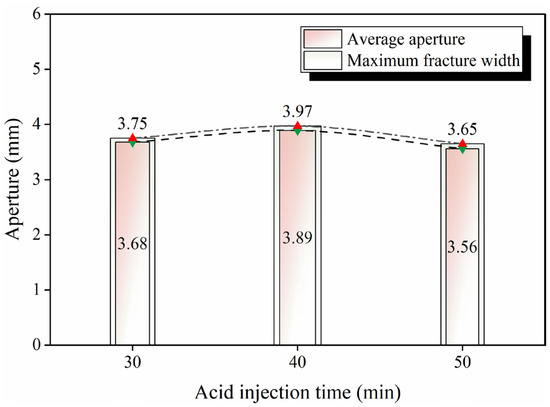
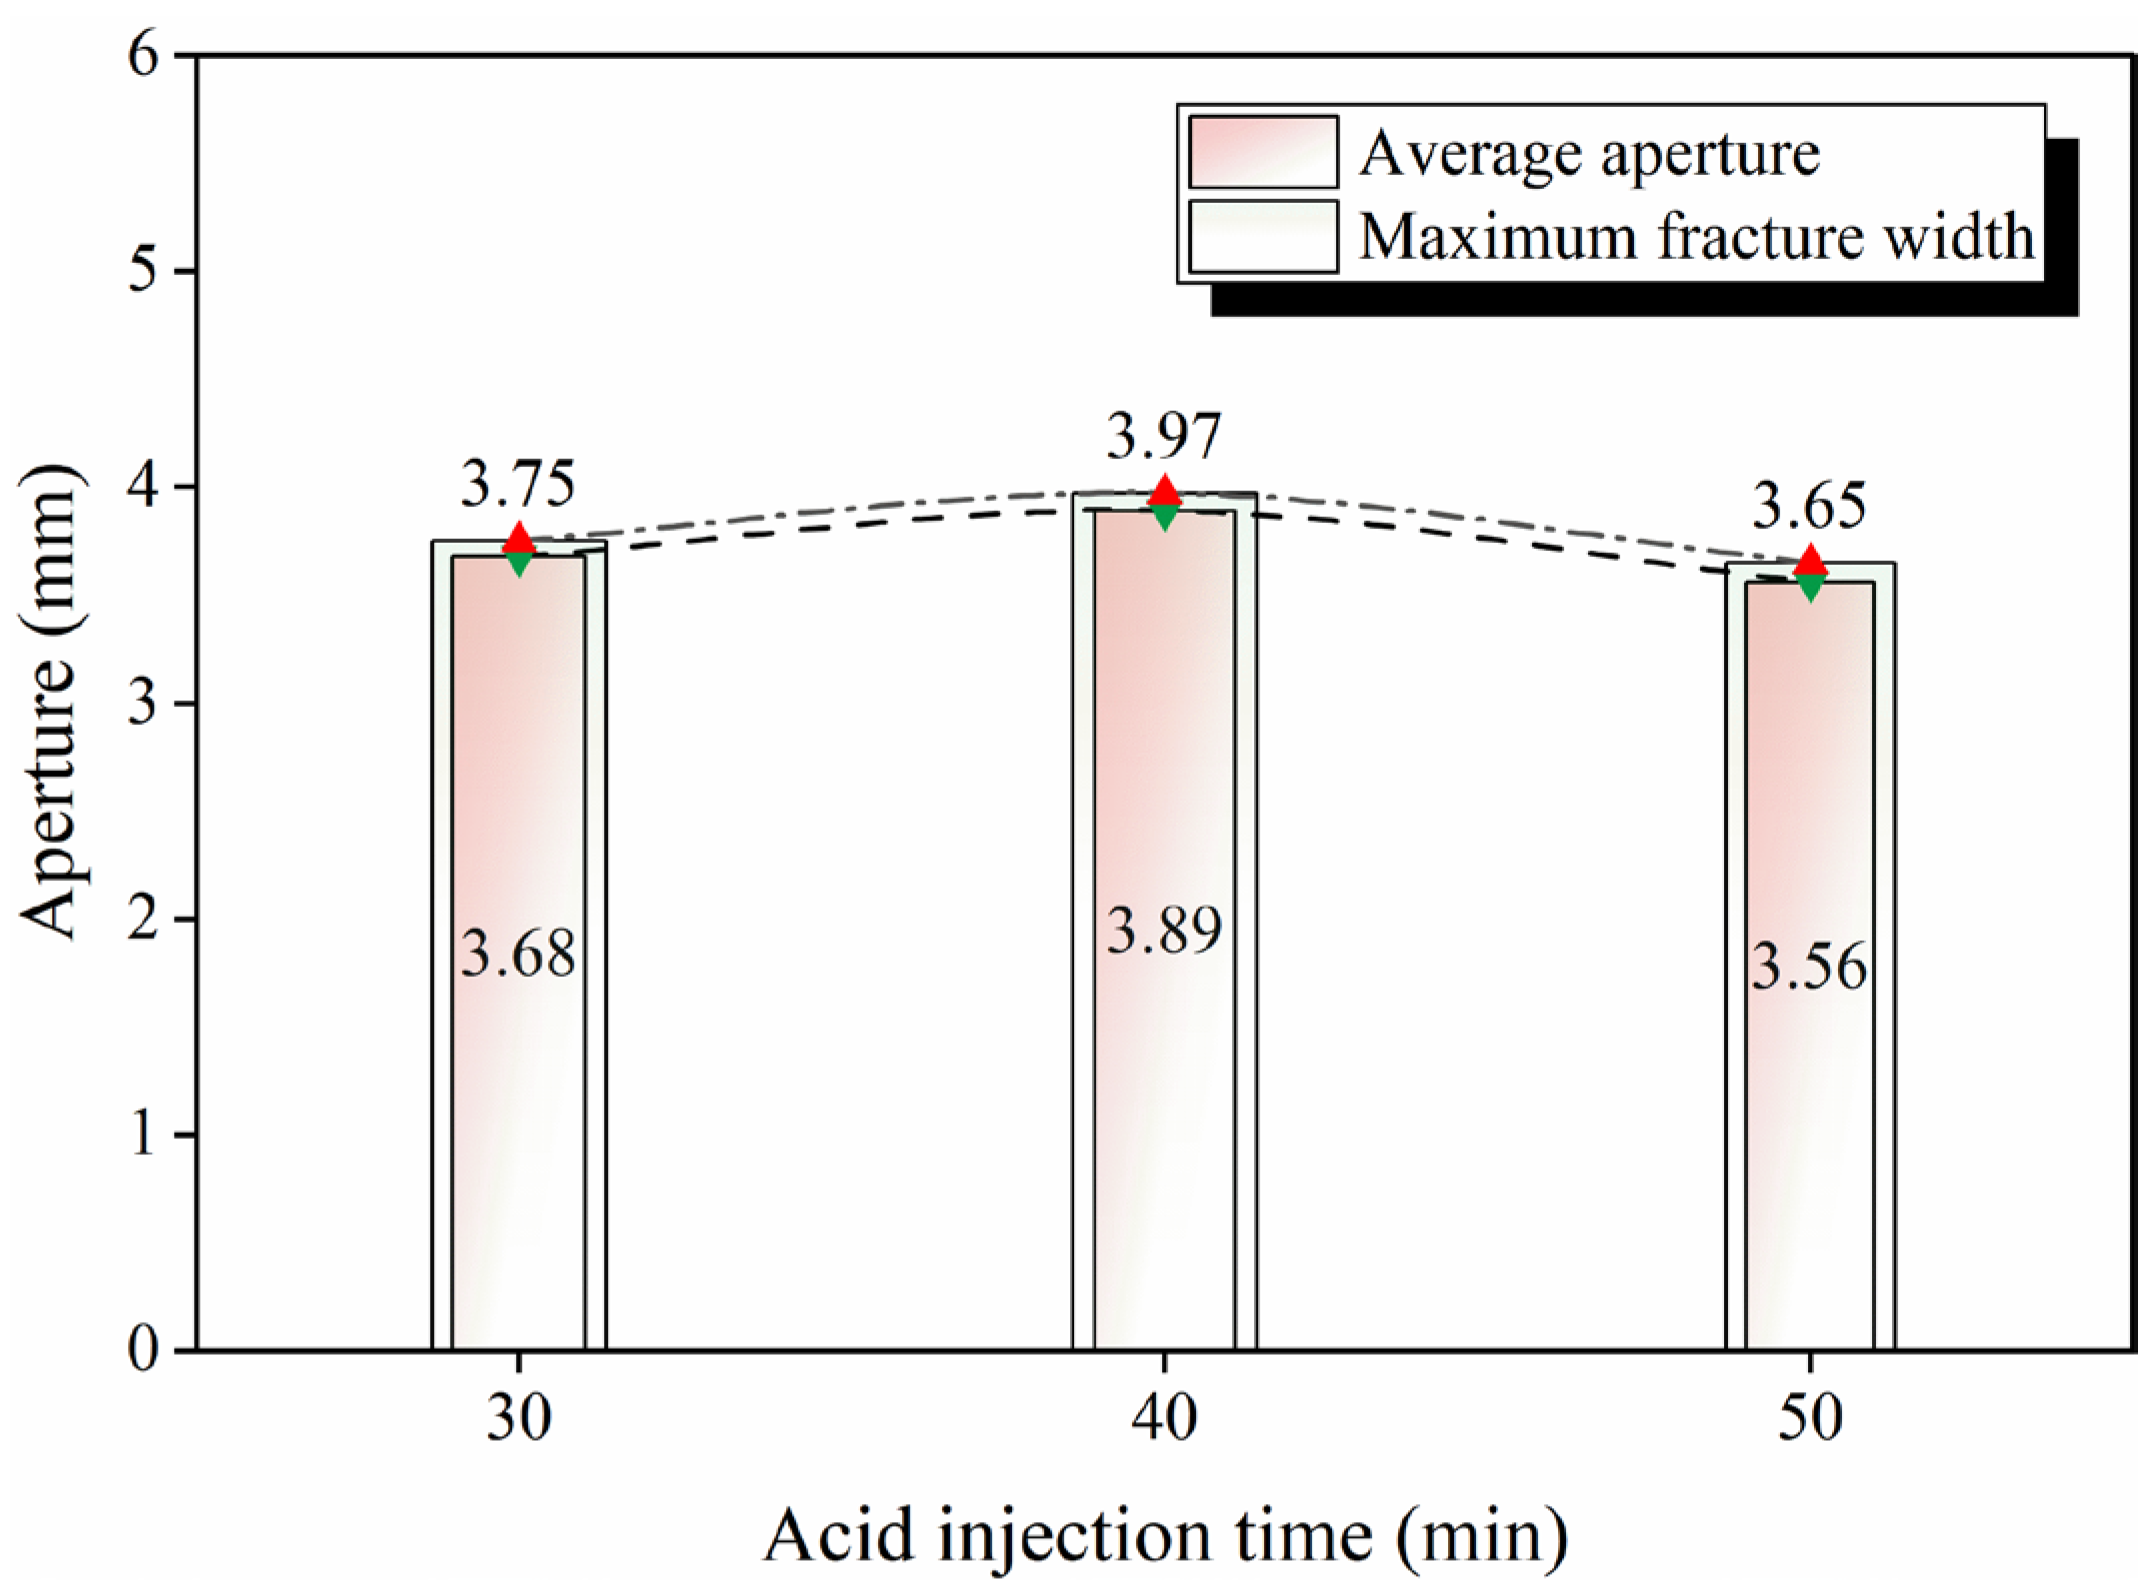
Figure 27 and Figure 28 illustrate that at a relatively short acid injection time (e.g., 30 min), the tortuosity of large-scale waviness—a key factor determining fracture surface undulation—decreases slightly from 1.016 to 1.012. Under this condition, the upper and lower fracture contours exhibit high matching accuracy, with a small fracture aperture. With the extension of the injection time, the degree of heterogeneous etching on the upper and lower fracture surfaces increases, leading to a gradual rise in contour mismatching, as well as an increase in both the maximum and average fracture apertures. Upon further increasing the acid injection time, a critical injection time is reached (ranging between 30 min and 50 min in this experiment). Exceeding this threshold results in an increasingly smooth etched fracture surface (with the tortuosity of large-scale waviness decreasing to 1.004), which is close to a smooth plane. Consequently, the contour matching accuracy improves, and both the maximum and average apertures decrease [4,27,35]. For Type C fracture surfaces with low roughness, distinct small-scale unevenness characteristics are observed, featuring numerous small protrusions on the fracture surface. After 50 min of etching, the tortuosity of small-scale unevenness decreases from 1.109 to 1.064, yet the fracture surface still retains a considerable number of small protrusions. Once the overall undulation (large-scale waviness) of the fracture surface is planarized, the existence of these small protrusions determines the formation of flow channels. Therefore, compared with those after 30 min of etching, the maximum and average apertures decrease to a lesser extent after 50 min of etching.
Figure 28.
Statistics of aperture after acid etching.
3.4. Fracture Conductivity Characteristics
As shown in Figure 29, fracture roughness significantly influences the conductivity of acid-etched fractures. At low closure stress levels, the highly roughened rock sample (Type A) exhibits larger conductivity. This arises because of acid etching. The coarser sample possesses poorly matched upper and lower fracture surfaces, resulting in larger maximum and average apertures (Figure 14). At this stage, the heightened complexity of the fracture surface creates internal “flow channels”, enabling sufficient conductivity with minimal support points. As the closure stress increases, the conductivity values of acid-etched fractures in all samples exhibit an exponential decline. Among these, the rock sample with the highest initial roughness experiences the most rapid decrease in conductivity. This occurs because the morphology of Type A rock samples is primarily characterized by large-scale waviness, with less small-scale unevenness and fewer support points. When these are destroyed, it leads to the rapid closure of flow channels (Figure 30). Conversely, Type C rock samples exhibit predominantly small-scale unevenness with minimal large-scale waviness, offering numerous support points. Under high-closure-stress conditions, their conductivity remains higher than that of the other two morphologies and demonstrates greater longevity [42,43]. Previous research defines the stress corresponding to the point where conductivity becomes unmeasurable as the critical closure stress (CCS) [22]. The CCS values for the three rock types were 41.4 MPa, 48.3 MPa, and 55.2 MPa. Higher CCS indicates greater conductivity retention. In summary, the large-scale waviness of the acid-etched fracture morphology determines the initial conductivity, while small-scale unevenness governs sufficient conductivity retention.
Figure 29.
Conductivity with different roughness under different closure stresses.
Figure 30.
Variation in supporting points on fracture surfaces of different scales under different stress conditions.
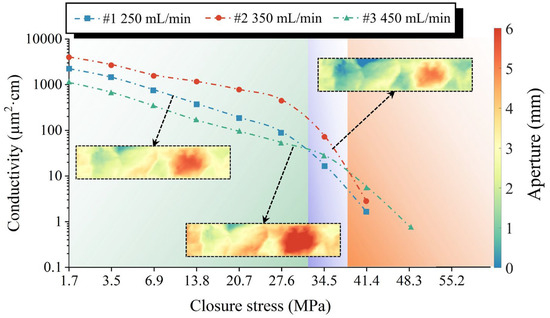
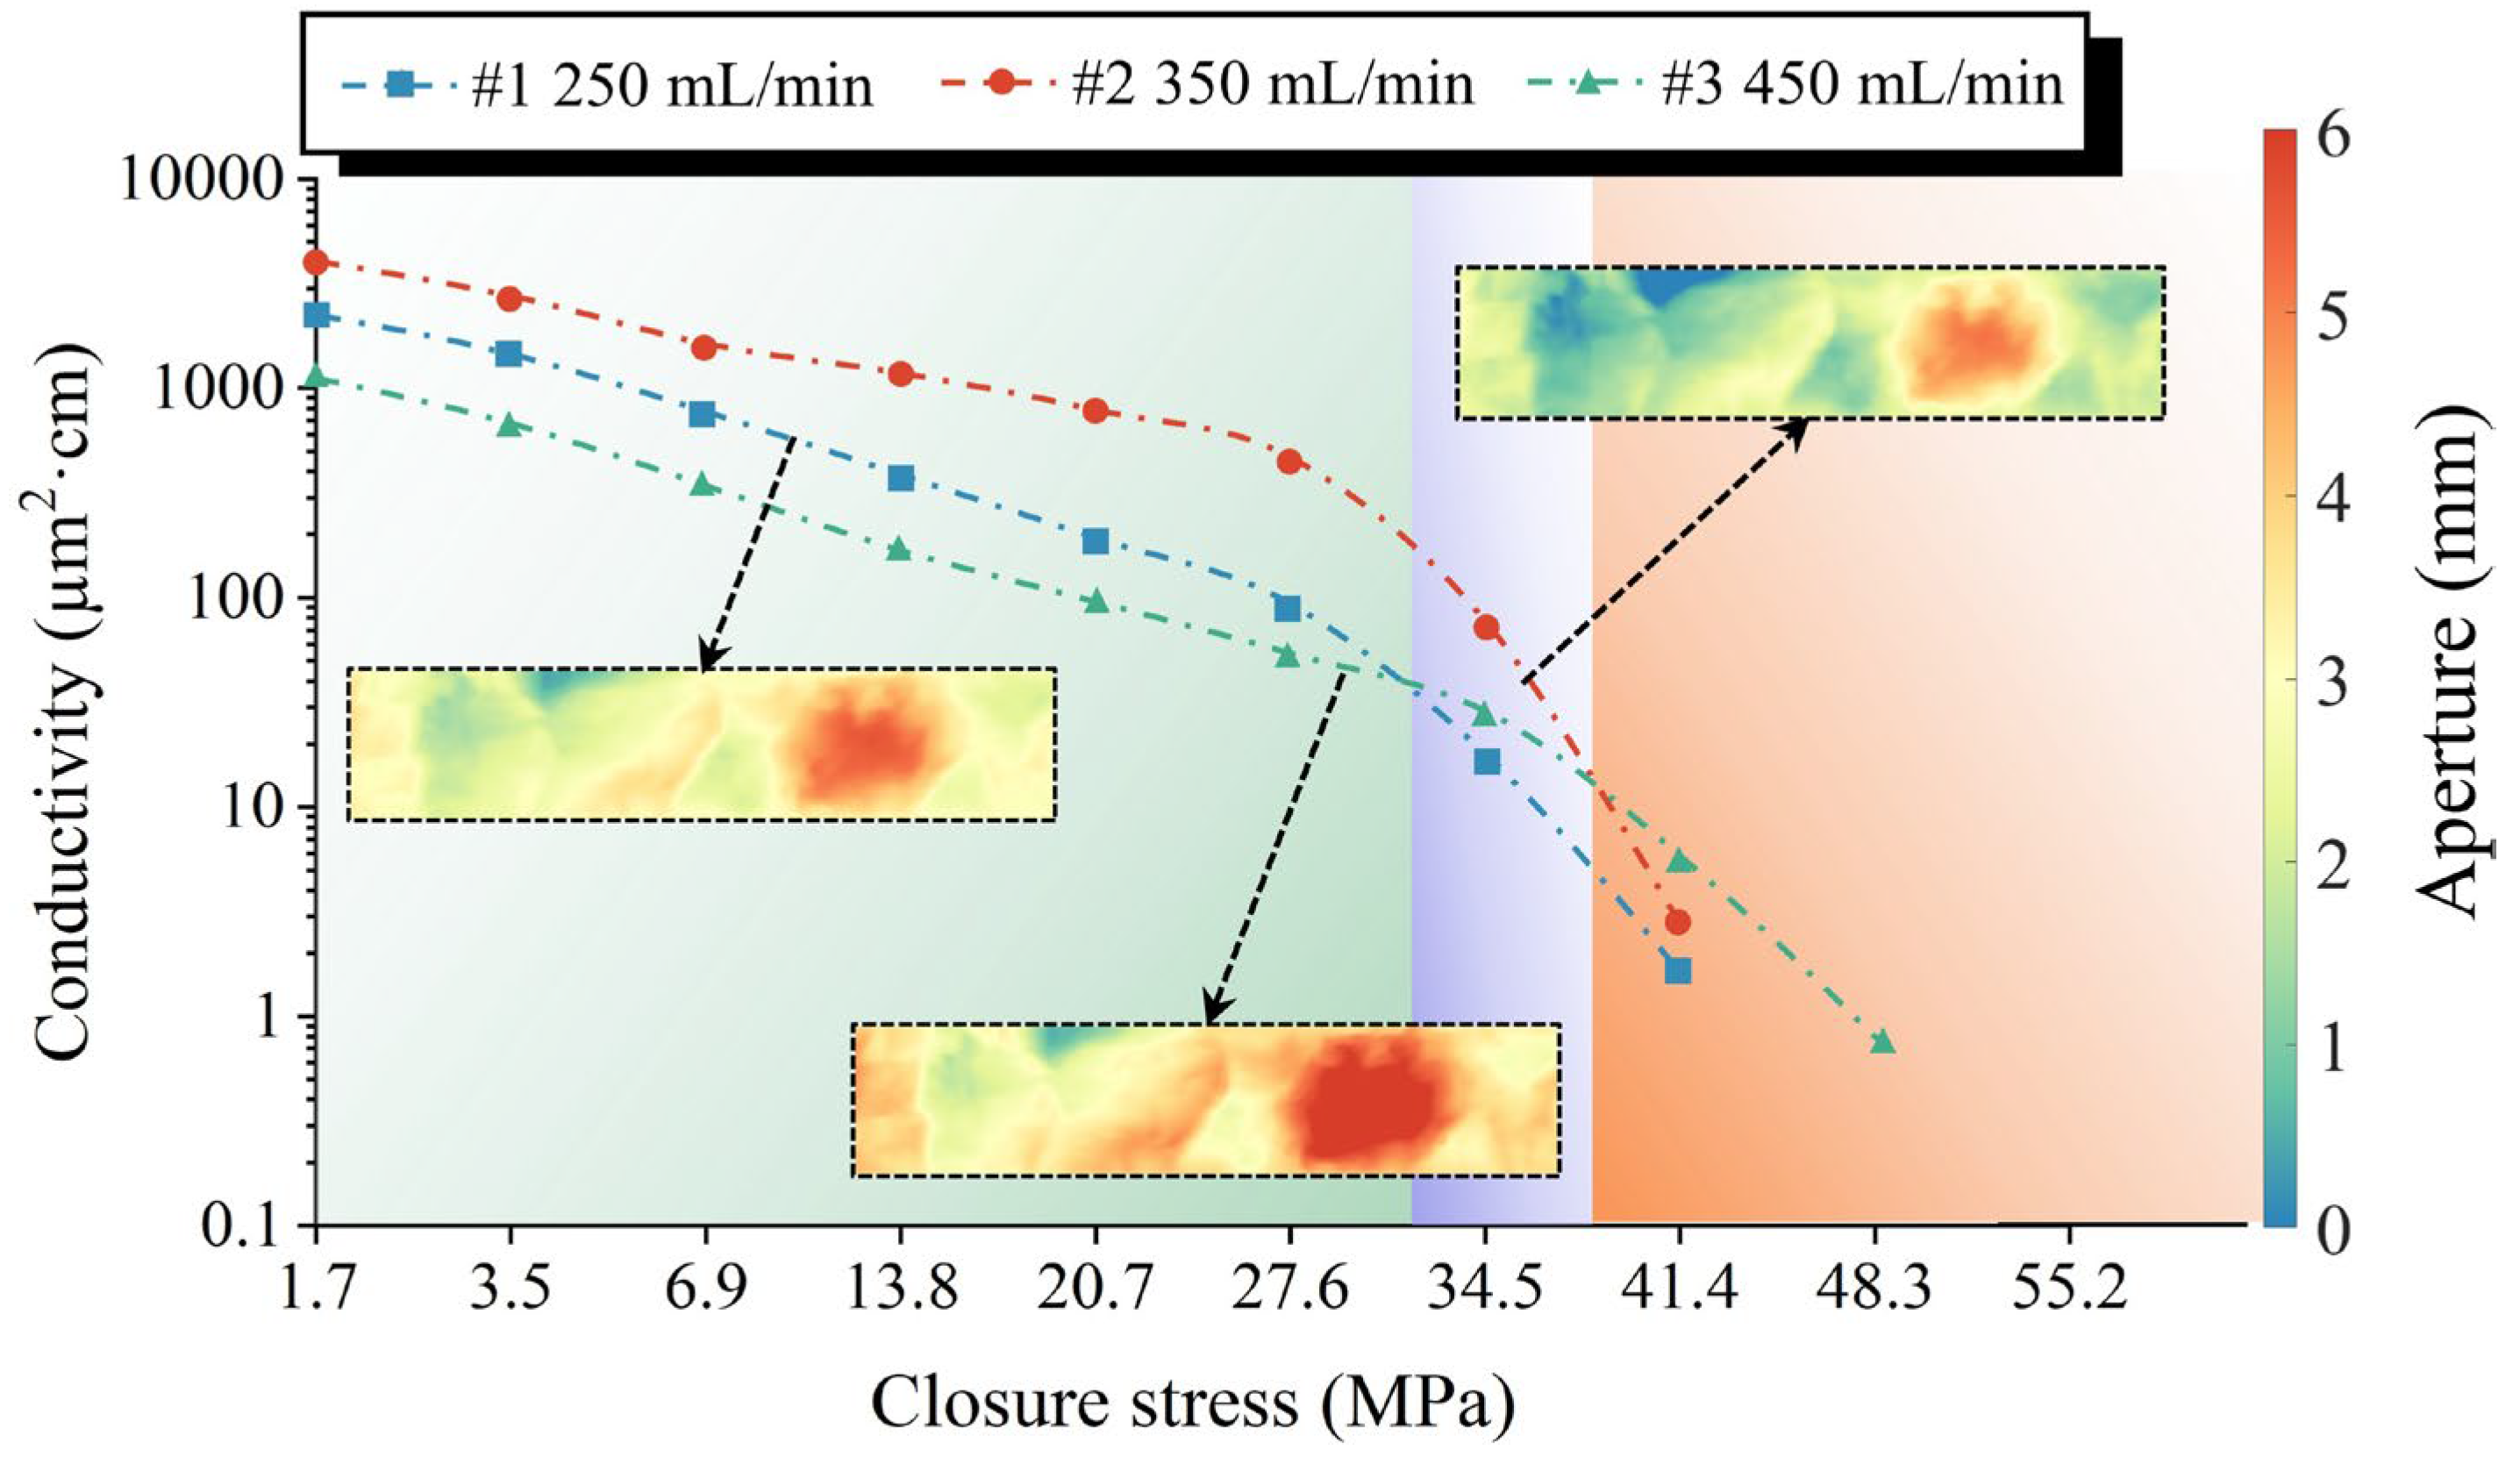
Figure 31 illustrates the conductivity of acid-etched fractures at different injection rates. Under an initial closure stress of 1.7 MPa, the acid injection rate of 350 mL/min exhibited the highest initial conductivity, whereas the high injection rate of 450 mL/min demonstrated the lowest initial conductivity. This occurs because, below the critical injection rate, increasing the injection rate enhances non-uniform etching. Consequently, the profile contours of the upper and lower fracture surfaces become increasingly mismatched, leading to larger maximum and average apertures. At low closure stresses, the supporting points provide sufficient conductivity [24,27]. Conversely, at high injection rates (exceeding the critical rate), extensive etching results in better matching between upper and lower fracture surfaces, yielding smaller maximum and average apertures (Figure 19). Support points provide lower conductivity under reduced closure stress. The conductivity values for acid-etched fractures decline rapidly across all samples as the closure stress increases. The most probable cause of this phenomenon is the progressive compaction and complete destruction of contact points. Notably, the CCS at high acid injection rates (55.2 MPa) exceeded that at low (250 mL/min) and medium (350 mL/min) rates, exhibiting the best conductivity retention. Beyond 41.4 MPa, conductivity at high injection rates remained the highest. This is because when the acid injection rate is increased to 450 mL/min, dissolution channels are formed on the fracture surfaces (Figure 16). These channels enable the rock samples to maintain certain flow pathways even under high closure stress, resulting in a 20–25% effective increase in the conductivity of acid-etched fractures compared with other injection rates. Therefore, determining the critical acid injection rate range and reasonably optimizing the injection parameters can yield a favorable etching morphology and conductivity under specific closure stress conditions.
Figure 31.
Conductivity with different injection rates under closure stress.
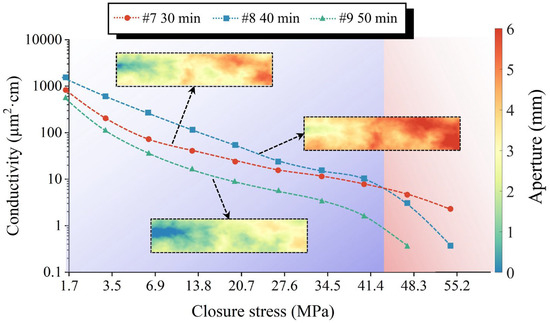
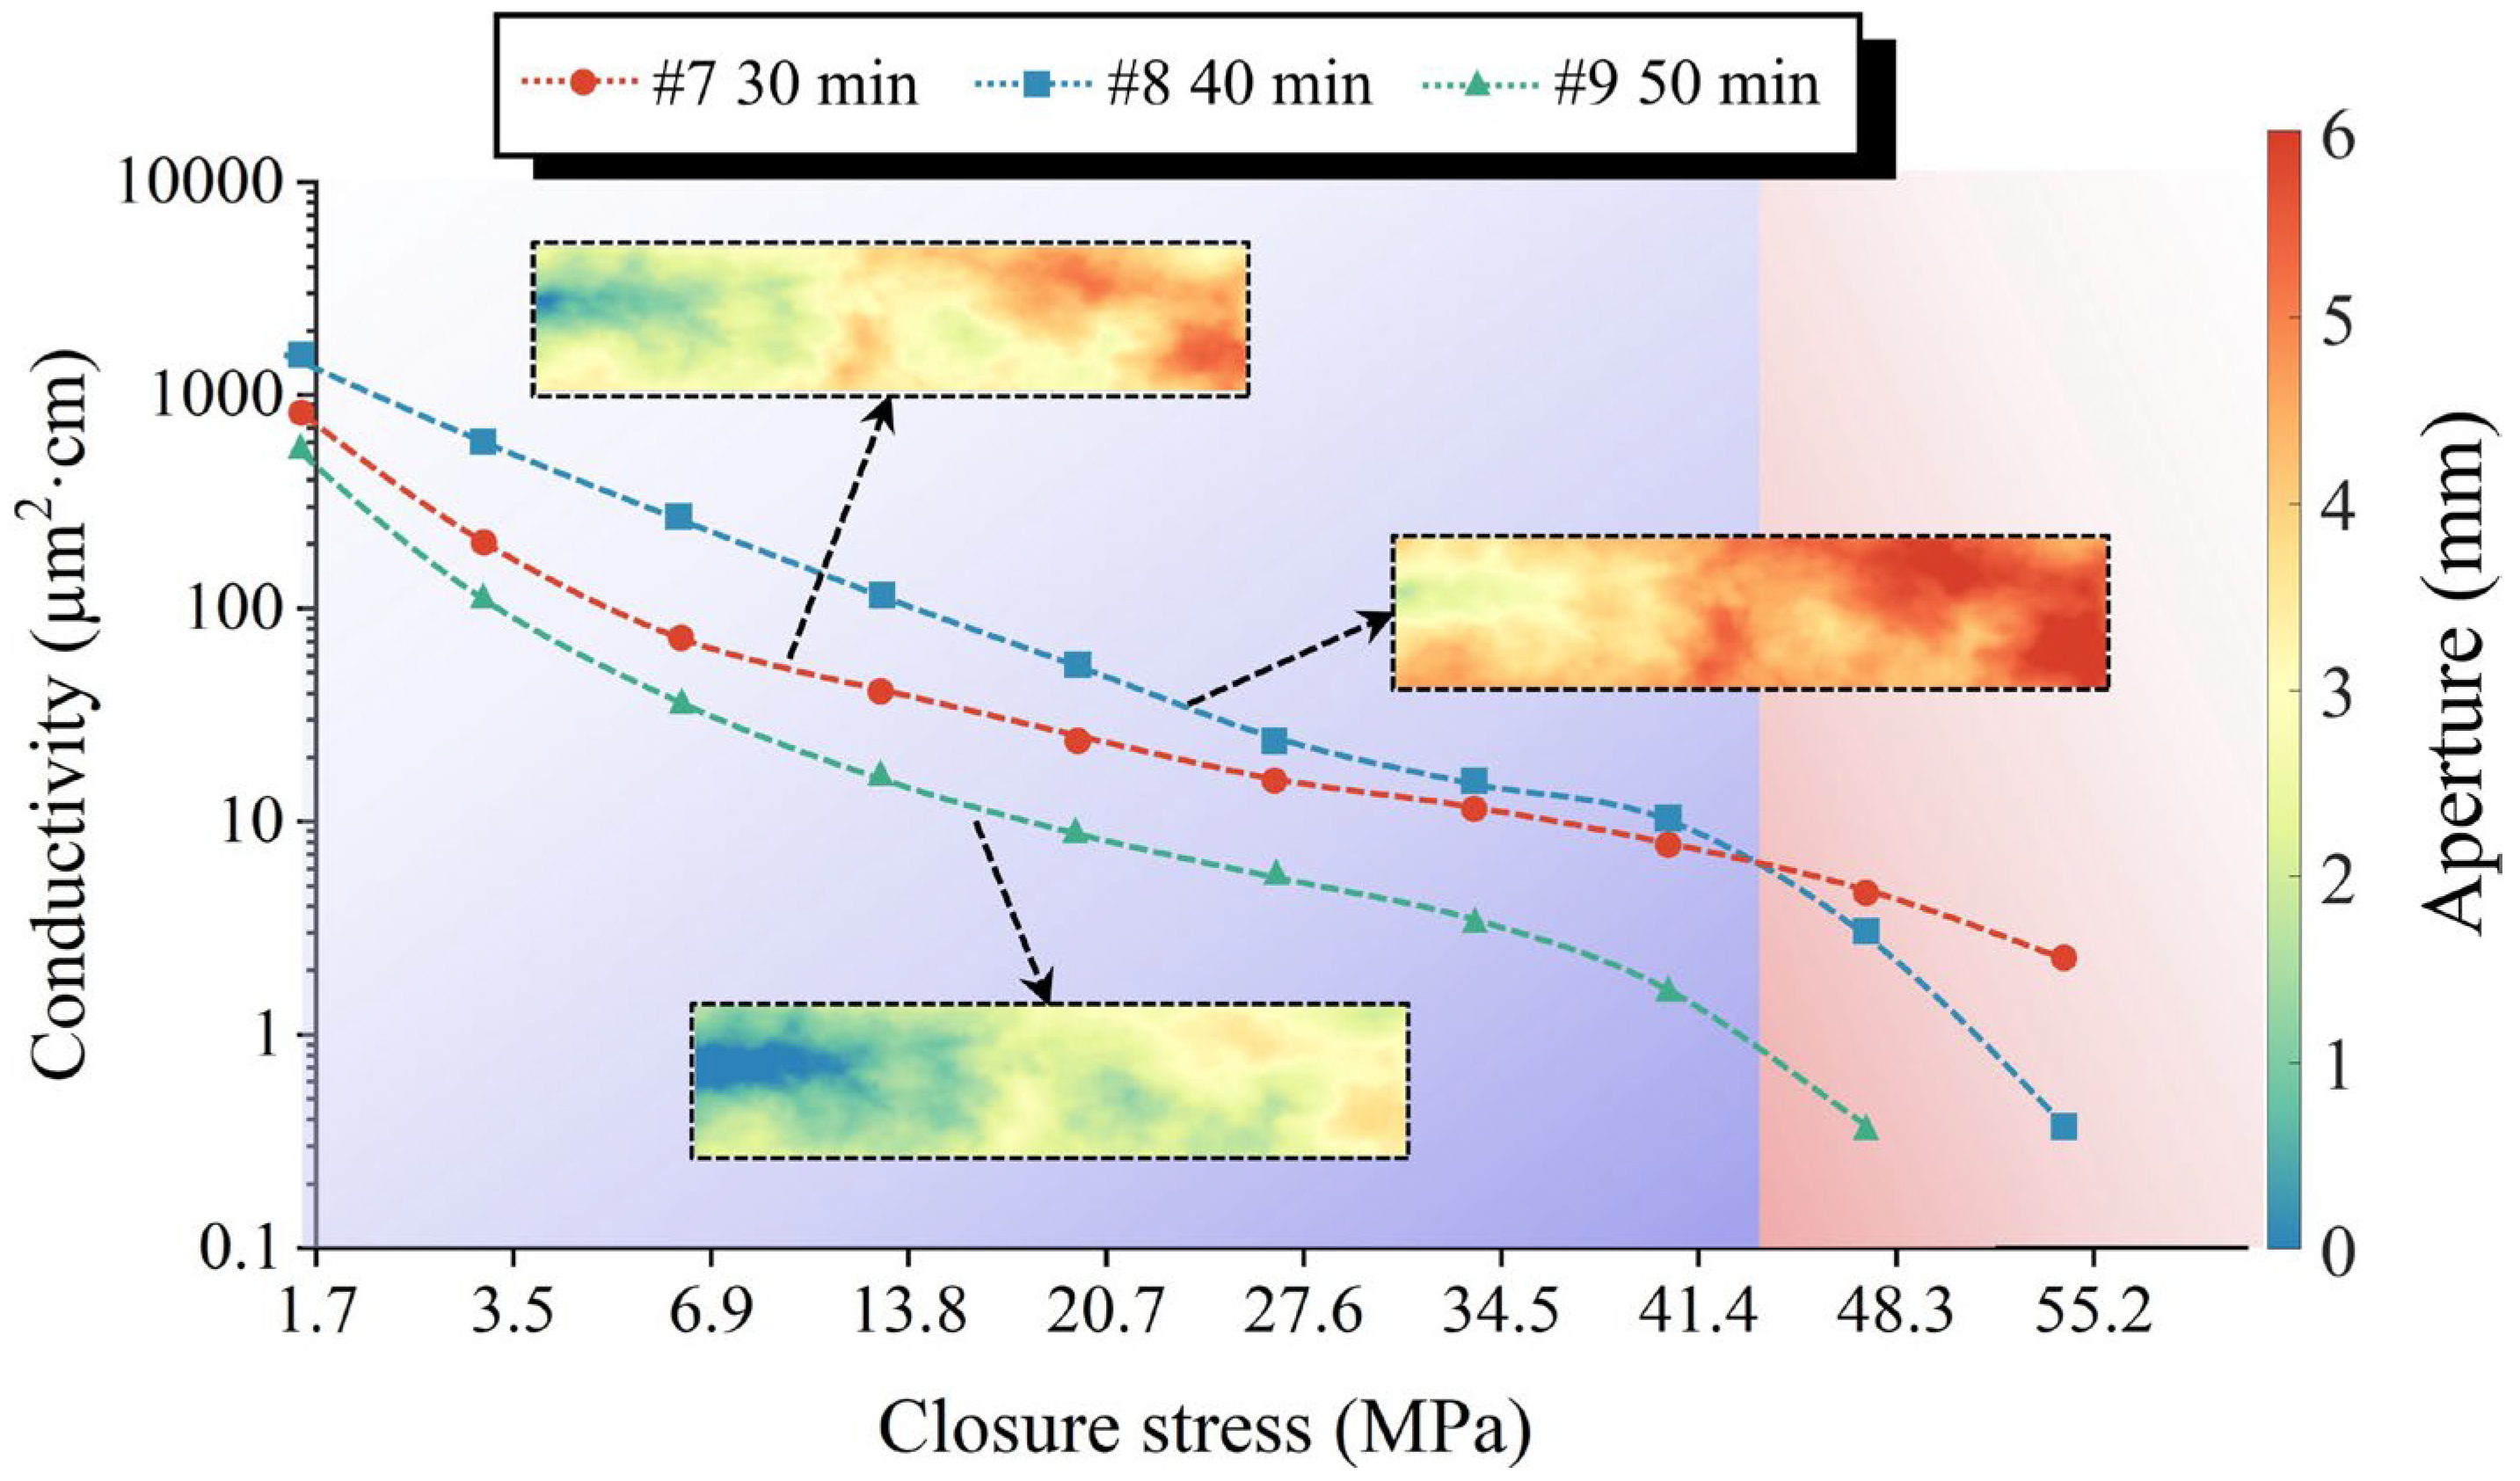
The conductivity characteristics of acid-etched fractures across different injection times are illustrated in Figure 32. Under an initial closure stress of 1.7 MPa, the medium injection time (40 min) corresponds to the highest initial conductivity, while the long injection time (50 min) results in the lowest initial conductivity. With the extension of the injection time, etching non-uniformity first increases; however, when the injection time exceeds the critical acid injection time, the rock samples undergo further sufficient etching, leading to a decrease in etching non-uniformity [21,33]. Consequently, the fracture surface tends to be smooth, and the upper and lower fracture surfaces exhibit good contour matching. At this stage, the small protrusions—characteristic of small-scale unevenness on the fracture surface—act as support points to form flow channels, although both the maximum and average fracture apertures are relatively small. Under low-closure-stress conditions, the conductivity provided by these small protrusion support points is relatively weak. As closure stress increases, the conductivity of acid-etched fractures under all injection times decreases rapidly due to the progressive compaction and complete failure of the support points. Notably, longer acid injection times correlate with lower CCS and poorer conductivity retention. Beyond 48.3 MPa, conductivity remains the highest at a low injection time. This occurs because, at a low acid injection time, the micro-scale heterogeneity of the fracture surface is pronounced (Figure 28), providing more support points. As the injection time increases, this micro-scale heterogeneity diminishes, reducing the number of support points on the fracture surface. Consequently, it is difficult for rock samples to maintain sufficient flow pathways under high closure stresses, impairing conductivity. Therefore, determining the critical acid injection time range and optimizing the injection time can yield a favorable etching morphology and conductivity under specified confining stresses.
Figure 32.
Conductivity with different injection times under closure stress.
4. Conclusions
Previous acid etching experiments suffer from two major problems: smooth-cut rock slabs fail to reflect real fracture morphologies, while split rock slabs exhibit heterogeneous morphologies, leading to large discrepancies in experimental results; moreover, roughness is mostly characterized by a single parameter, ignoring its dual-scale characteristics. For the first time, this study uses high-purity single-mineral carbonate rocks and digital engraving technology to prepare a large number of repeated rock samples with a uniform lithology and consistent morphologies, enabling batch replication of natural fracture morphologies. Furthermore, it decomposes roughness into large-scale waviness and small-scale unevenness via the Triangular Prism Method (TPM) and achieves dual-parameter characterization combined with area tortuosity, enabling a comprehensive qualitative and quantitative evaluation of natural fracture roughness. The improved experimental and characterization methods allow this study to reveal the influence of multi-scale roughness on acid-etched fracture conductivity and the nonlinear effects of optimal acid injection parameters, enabling more precise optimization of acid etching design parameters and schemes and effectively enhancing the productivity of tight carbonate reservoirs. According to the analysis results, the following conclusions can be drawn:
- (1)
- The area tortuosity deviation between the carved carbonate rock samples and the original natural fracture surfaces is only 0.25%, with a high coincidence degree of elevation distribution trends, exhibiting excellent consistency. The uniform lithology ensures the accuracy of experimental results, making these samples suitable for testing acid etching efficiency and acid-etched fracture conductivity under single-factor controlled conditions.
- (2)
- The experimental results confirm that fracture surface roughness influences the acid etching morphology. The acid fluid exhibits peak-trimming and valley-deepening characteristics on fracture surfaces: it preferentially dissolves protruding parts and deepens concave regions, ultimately reducing fracture roughness. Different from previous studies, this research reveals that the large-scale waviness characteristics of initial roughness determine the overall undulation of the post-etching morphology. Moreover, preferential etching channels tend to form during the etching process, resulting in poor fracture surface matching—this is the primary reason for the high conductivity of acid-etched fractures under low closure stress. In contrast, the small-scale unevenness characteristics of the initial roughness determine the formation and distribution of small protruding support points on the post-etching surface morphology. This serves as the main reason for the sustained conductivity of acid-etched fractures under high closure stress and determines the magnitude of the critical closure stress (CCS).
- (3)
- With the increase in the acid injection rate, the fracture surface roughness decreases continuously, while the fracture surface matching degree and aperture exhibit a peak-like variation trend of increasing first and then decreasing. Under specific conditions, this peak corresponds to the critical acid injection rate, under which a higher initial fracture conductivity can be achieved. By reasonably optimizing the acid injection rate to the critical value, an ideal fracture etching morphology can be obtained. At high injection rates, dissolution channels form on fracture surfaces, which enable the maintenance of flow pathways even under high closure stress, resulting in an effective increase of 20–25% in the conductivity of acid-etched fractures compared with other injection rates.
- (4)
- At low acid injection times, the micro-scale heterogeneity of fracture surfaces is pronounced with a greater number of support points. In contrast, the extension of the injection time diminishes this heterogeneity and reduces the number of support points, resulting in the rock samples being unable to maintain sufficient flow pathways under high closure stress and thus lowering the conductivity. Therefore, determining the critical acid injection time range and optimizing the parameters can yield an ideal fracture etching morphology and conductivity under specific confining stress conditions.
Author Contributions
C.C.: writing—original draft, visualization, and investigation. X.T.: writing—review and editing, supervision, project administration, investigation, funding acquisition, and conceptualization. J.G.: formal analysis and funding acquisition. J.Z.: formal analysis, review and editing. H.Z.: methodology and writing—review and editing. K.L.: methodology and formal analysis. S.W.: methodology and formal analysis. All authors have read and agreed to the published version of the manuscript.
Funding
This work was financially supported by the National Natural Science Foundation of China (Grant No. 52374044) and Sichuan Province Science and Technology Planning Projects (Grant No. 2023JDRC0008).
Data Availability Statement
Data will be made available on request.
Acknowledgments
This article was prepared under the auspices of the National Key Laboratory of Oil and Gas Reservoir Geology and Exploitation at Southwest Petroleum University and supported by the National Natural Science Foundation of China (52374044), Sichuan Province Science and Technology Planning Projects (2023JDRC0008), and the CAST Young Talent Support Program, Doctoral Student Special Project.
Conflicts of Interest
The authors declare that they have no known competing financial interests or personal relationships that could have appeared to influence the work reported in this paper.
References
- Burchette, T.P. Carbonate rocks and petroleum reservoirs: A geological perspective from the industry. Geol. Soc. Lond. Spec. Publ. 2012, 370, 17–37. [Google Scholar] [CrossRef] [Scilit]
- Aljawad, M.S.; Aboluhom, H.; Schwalbert, M.P.; Al-Mubarak, A.; Alafnan, S.; Mahmoud, M. Temperature impact on linear and radial wormhole propagation in limestone, dolomite, and mixed mineralogy. J. Nat. Gas Sci. Eng. 2021, 93, 104031. [Google Scholar] [CrossRef] [Scilit]
- Alhubail, M.M.; Misra, A.; Maulianda, B.; Barati, R. Application of finite element discretization with weak formulation for simulation of acid fracturing in tight carbonate reservoirs. J. Pet. Sci. Eng. 2020, 190, 107047. [Google Scholar] [CrossRef] [Scilit]
- Asadollahpour, E.; Baghbanan, A.; Hashemolhosseini, H.; Mohtarami, E. The etching and hydraulic conductivity of acidized rough fractures. J. Pet. Sci. Eng. 2018, 166, 704–717. [Google Scholar] [CrossRef] [Scilit]
- Pournik, M.; Zou, C.; Nieto, M.; Melendez, M.; Zhu, D.; Weng, X. Small-scale fracture conductivity created by modern acid-fracture fluids. In Proceedings of the SPE Hydraulic Fracturing Technology Conference and Exhibition, College Station, TX, USA, 29–31 January 2007; SPE: Richardson, TX, USA, 2007; pp. SPE–106272-MS. [Google Scholar]
- Nasr-El-Din, H.A.; Al-Driweesh, S.M.; Metcalf, A.S.; Chesson, J. Fracture acidizing: What role does formation softening play in production response? SPE Prod. Oper. 2008, 23, 184–191. [Google Scholar] [CrossRef] [Scilit]
- Pournik, M.; Li, L.; Smith, B.; Nasr-El-Din, H.A. Effect of acid spending on etching and acid-fracture conductivity. SPE Prod. Oper. 2013, 28, 46–54. [Google Scholar] [CrossRef] [Scilit]
- Van Domelen, M. Optimizing Fracture Acidizing Treatment Design by Integrating Core Testing, Fieid Testing, and Computer Simulation. In Proceedings of the SPE International Oil and Gas Conference and Exhibition in China, Beijing, China, 24–27 March 1992; SPE: Richardson, TX, USA, 1992; p. SPE–22393-MS. [Google Scholar] [CrossRef]
- Li, N.; Dai, J.; Liu, P.; Luo, Z.; Zhao, L. Experimental study on influencing factors of acid-fracturing effect for carbonate reservoirs. Petroleum 2015, 1, 146–153. [Google Scholar] [CrossRef] [Scilit]
- Wang, Y.; Zhou, F.; Zhang, Y.; Wang, Y.; Su, H.; Dong, R.; Wang, Q.; Bai, H. Numerical studies and analysis on reaction characteristics of limestone and dolomite in carbonate matrix acidizing. Geoenergy Sci. Eng. 2023, 222, 211452. [Google Scholar] [CrossRef] [Scilit]
- Zhang, H.; Zhong, Y.; Zhang, J.; Zhang, Y.; Kuang, J.; Yang, B. Experimental research on deterioration of mechanical properties of carbonate rocks under acidified conditions. J. Pet. Sci. Eng. 2020, 185, 106612. [Google Scholar] [CrossRef] [Scilit]
- Kong, X.; Shi, X.; Xie, G. Numerical characterization of acid fracture wall etching morphology and experimental investigation on sensitivity factors in carbonate reservoirs. Geoenergy Sci. Eng. 2024, 237, 212762. [Google Scholar] [CrossRef] [Scilit]
- Mirza, S.; Kunak, O.; Gong, M.; Zhu, D.; Hill, A. A systematic experimental study of acid fracture conductivity. SPE Prod. Fac. 1996, 13, 267–271. [Google Scholar] [CrossRef]
- Melendez, M.G.; Pournik, M.; Zhu, D.; Hill, A. The effects of acid contact time and the resulting weakening of the rock surfaces on acid-fracture conductivity. In Proceedings of the SPE European Formation Damage Conference and Exhibition, Scheveningen, The Netherlands, 30 May–1 June 2007; SPE: Richardson, TX, USA, 2007; p. SPE–107772-MS. [Google Scholar] [CrossRef] [Scilit]
- Antelo, L.F.; Pournik, M.; Zhu, D.; Hill, A. Surface etching pattern and its effect on fracture conductivity in acid fracturing. In Proceedings of the SPE Hydraulic Fracturing Technology Conference and Exhibition, Woodlands, TX, USA, 19–21 January 2009; SPE: Richardson, TX, USA, 2009; p. SPE–119743-MS. [Google Scholar] [CrossRef] [Scilit]
- Lu, C.; Bai, X.; Luo, Y.; Guo, J. New study of etching patterns of acid-fracture surfaces and relevant conductivity. J. Pet. Sci. Eng. 2017, 159, 135–147. [Google Scholar] [CrossRef] [Scilit]
- Zhang, R.; Hou, B.; Zhou, B.; Liu, Y.; Xiao, Y.; Zhang, K. Effect of acid fracturing on carbonate formation in southwest China based on experimental investigations. J. Nat. Gas Sci. Eng. 2020, 73, 103057. [Google Scholar] [CrossRef] [Scilit]
- Ruffet, C.S.; Féry, J.J.; Onaisi, A. Acid-fracturing treatment: A surface-topography analysis of acid-etched fractures to determine residual conductivity. SPE J. 1998, 3, 155–162. [Google Scholar] [CrossRef] [Scilit]
- Pournik, M.; Gomaa, A.; Nasr-El-Din, H. Influence of acid-fracture fluid properties on acid-etched surfaces and resulting fracture conductivity. In Proceedings of the SPE International Conference and Exhibition on Formation Damage Control, Lafayette, LA, USA, 10–12 February 2010; SPE: Richardson, TX, USA, 2010; p. SPE–128070-MS. [Google Scholar] [CrossRef] [Scilit]
- Neumann, L.F.; de Oliveira e Sousa, J.; Brandao, E.M.; Oliveira, T. Acid fracturing: New insigths on acid etching patterns from experimental investigation. In Proceedings of the SPE Hydraulic Fracturing Technology Conference and Exhibition, Woodlands, TX, USA, 6–8 February 2012; SPE: Richardson, TX, USA, 2012; p. SPE–152179-MS. [Google Scholar] [CrossRef] [Scilit]
- Nino-Penaloza, A.; Al-Momin, A.; Zhu, D.; Hill, A. New insights about acid fracture conductivity at laboratory scale. In Proceedings of the SPE Annual Technical Conference and Exhibition? Houston, TX, USA, 28–30 September 2015; SPE: Richardson, TX, USA, 2015; p. D021S015R006. [Google Scholar] [CrossRef] [Scilit]
- Gou, B.; Guan, C.; Li, X.; Ren, J.; Zeng, J.; Wu, L.; Guo, J. Acid-etching fracture morphology and conductivity for alternate stages of self-generating acid and gelled acid during acid-fracturing. J. Pet. Sci. Eng. 2021, 200, 108358. [Google Scholar] [CrossRef] [Scilit]
- Liu, P.; Hu, H.; Chen, X.; Du, J.; Liu, J.; Liu, F.; Chen, W.; Jia, Y. The influencing parameters and improve methods of acid-etched fracture conductivity: A review. Geoenergy Sci. Eng. 2024, 238, 212844. [Google Scholar] [CrossRef] [Scilit]
- Chen, Y.; Mao, H.; Ma, G. A phase transition model for acid dissolution along a rough-walled carbonate fracture. Int. J. Rock Mech. Min. Sci. 2024, 179, 105782. [Google Scholar] [CrossRef] [Scilit]
- Jiang, Q.; Yang, B.; Yan, F.; Liu, C.; Shi, Y.; Li, L. New Method for Characterizing the Shear Damage of Natural Rock Joint Based on 3D Engraving and 3D Scanning. Int. J. Geomech. 2020, 20, 06019022. [Google Scholar] [CrossRef] [Scilit]
- Chen, C.; Wang, S.; Lu, C.; Liu, Y.; Guo, J.; Lai, J.; Tao, L.; Wu, K.; Wen, D. Experimental study on the effectiveness of using 3D scanning and 3D engraving technology to accurately assess shale fracture conductivity. J. Pet. Sci. Eng. 2022, 208, 109493. [Google Scholar] [CrossRef] [Scilit]
- Chen, C.; Wang, S.; Lu, C.; Wang, K.; Lai, J.; Liu, Y.; Liu, T.; Liu, D. The impact of surface roughness and injection rate on acid-fracture conductivity. In Proceedings of the ARMA US Rock Mechanics/Geomechanics Symposium, Virtual, 18–25 June 2021; ARMA. Available online: https://onepetro.org/ARMAUSRMS/proceedings/ARMA21/ARMA21/ARMA-2021-1326/468246 (accessed on 31 January 2026).
- Gou, B.; Xu, K.; Zhang, J.; Liu, Z.; Lei, M.; Guo, J. Acid-etched fracture morphology and conductivity of acid fracturing in carbonate rock using novel isolation membrane acid. Geoenergy Sci. Eng. 2024, 240, 213003. [Google Scholar] [CrossRef] [Scilit]
- Gou, B.; Liu, Z.; Zhou, J.; Xu, K.; Xiao, B.; Pu, K.; Guo, J. Experimental and modeling study on the acid-etching and conductivity of hydraulic fractures in carbonate rocks: A critical review. Geoenergy Sci. Eng. 2025, 245, 213517. [Google Scholar] [CrossRef] [Scilit]
- Dijk, P.; Berkowitz, B. Precipitation and dissolution of reactive solutes in fractures. Water Resour. Res. 1998, 34, 457–470. [Google Scholar] [CrossRef] [Scilit]
- Mou, J.; Xia, X.; Gao, B.; Zhang, S.; Ma, X.; Wang, F. Effect of Mixed Mineralogy on Etching Profile and Conductivity in Acid Fracturing in Naturally Fractured Carbonate Reservoirs. In Proceedings of the International Petroleum Technology Conference, Dhahran, Saudi Arabia, 12–14 February 2024. [Google Scholar] [CrossRef] [Scilit]
- Zhang, N.; Chen, X.; Luo, Z.; Yan, B.; Jia, Y.; Lv, M.; Li, J.; He, T. Experimental study of fracture conductivity in dolomite reservoirs treated with different acid fracturing technologies. Geoenergy Sci. Eng. 2023, 227, 211914. [Google Scholar] [CrossRef] [Scilit]
- Wang, Y.; Yang, J.; Wang, T.; Hu, Q.; Lv, Z.; He, T. Visualization experiment of multi-stage alternating injection acid fracturing. Energy Rep. 2022, 8, 9094–9103. [Google Scholar] [CrossRef] [Scilit]
- Gou, B.; Zhang, J.; Wang, K.; Xu, K.; Xiao, B.; Zeng, J.; Guo, J. Effect of acid viscosity on conductivity during online acid-fracturing in ultra-deep carbonate reservoir. Geoenergy Sci. Eng. 2024, 243, 213381. [Google Scholar] [CrossRef] [Scilit]
- Chen, X.; Hu, H.; Liu, P.; Du, J.; Wang, M.; Tang, H.; Deng, Z.; Wang, G.; Liu, F. Enhancing fracture conductivity in carbonate formations through mineral alteration. Int. J. Rock Mech. Min. Sci. 2025, 186, 106027. [Google Scholar] [CrossRef] [Scilit]
- Du, J.; Guo, G.; Liu, P.; Xiong, G.; Chen, P.; Liu, J.; Chen, X. Experimental study on the autogenic acid fluid system of a high-temperature carbonate reservoir by acid fracturing. ACS Omega 2022, 7, 12066–12075. [Google Scholar] [CrossRef] [Scilit]
- Wang, Y.; Fan, Y.; Zhou, C.; Luo, Z.; Chen, W.; He, T.; Fang, H.; Fu, Y. Research and application of segmented acid fracturing by temporary plugging in ultradeep carbonate reservoirs. ACS Omega 2021, 6, 28620–28629. [Google Scholar] [CrossRef] [Scilit]
- Wang, M.; Guo, P.; Fang, C.; Bu, M.; He, M. Impact of angle patterns at fracture intersections on nonlinear flow behavior and local flow field: A visualization experiment. Hydrogeol. J. 2024, 32, 2087–2104. [Google Scholar] [CrossRef] [Scilit]
- Briggs, S.; Karney, B.W.; Sleep, B.E. Numerical modelling of flow and transport in rough fractures. J. Rock Mech. Geotech. Eng. 2014, 6, 535–545. [Google Scholar] [CrossRef] [Scilit]
- Guo, P.; Wang, M.; Gao, K.; He, M.; Wang, Y. Influence of fracture surface roughness on local flow pattern: Visualization using a microfluidic field experiment. Hydrogeol. J. 2020, 28, 2373–2385. [Google Scholar] [CrossRef] [Scilit]
- Dou, Z.; Sleep, B.; Zhan, H.; Zhou, Z.; Wang, J. Multiscale roughness influence on conservative solute transport in self-affine fractures. Int. J. Heat Mass Transf. 2019, 133, 606–618. [Google Scholar] [CrossRef] [Scilit]
- Sun, Z.; Elsworth, D.; Cui, G.; Li, Y.; Zhu, A.; Chen, T. Impacts of rate of change in effective stress and inertial effects on fault slip behavior: New insights into injection-induced earthquakes. J. Geophys. Res. Solid Earth 2024, 129, e2023JB027126. [Google Scholar] [CrossRef] [Scilit]
- Cheng, W.; Cui, G.; Tan, Y.; Elsworth, D.; Wang, C.; Yang, C.; Chen, T.; Jiang, C. A multi-layer nanocased model to explain the U-shaped evolution of shale gas permeability at constant confining pressure. Fuel 2024, 359, 130478. [Google Scholar] [CrossRef] [Scilit]

Disclaimer/Publisher’s Note: The statements, opinions and data contained in all publications are solely those of the individual author(s) and contributor(s) and not of MDPI and/or the editor(s). MDPI and/or the editor(s) disclaim responsibility for any injury to people or property resulting from any ideas, methods, instructions or products referred to in the content. |
© 2026 by the authors. Licensee MDPI, Basel, Switzerland. This article is an open access article distributed under the terms and conditions of the Creative Commons Attribution (CC BY) license.