


Abstract
The integration of a user-side energy storage system (ESS) faces notable economic challenges, including high upfront investment, uncertainty in quantifying battery degradation, and fragmented ancillary service revenue streams, which hinder large-scale deployment. Conventional configuration studies often handle capacity planning and operational scheduling at different stages, complicating consistent life-cycle valuation under degradation and multi-service participation. This paper proposes a life-cycle multi-service co-optimization model (LC-MSCOM) to jointly determine ESS power–energy ratings and operating strategies. A unified revenue framework quantifies stacked revenues from time-of-use arbitrage, demand charge management, demand response, and renewable energy accommodation, while depth of discharge (DoD)-related lifetime loss is converted into an equivalent degradation cost and embedded in the optimization. The model is validated on a modified IEEE benchmark system using real generation and load data. Results show that LC-MSCOM increases net present value (NPV) by 26.8% and reduces discounted payback period (DPP) by 12.7% relative to conventional benchmarks, and sensitivity analyses confirm robustness under discount-rate, inflation-rate, and tariff uncertainties. By coordinating ESS dispatch with distribution network operating limits (nodal power balance, voltage bounds, and branch ampacity constraints), the framework provides practical, investment-oriented decision support for user-side ESS deployment.
1. Introduction
As a flexible and dispatchable resource, the ESS has developed rapidly in recent years and has become an important component of modern power systems. With the steady increase in wind and photovoltaic (PV) installations behind the meter, user-side deployment has attracted growing attention from both researchers and industry practitioners [1]. This interest is driven by the ability of the ESS to participate in multiple ancillary services, including time-of-use arbitrage, demand response, and renewable accommodation. However, the commercialization of a user-side ESS is still mainly constrained by high costs and unclear economic returns. Therefore, research on rational configuration and operating strategies oriented toward value capture is of great practical significance for large-scale deployment and improved economic benefits of user-side ESS.
Existing user-side ESSs are dominated by electrochemical technologies [2]. Battery life can be evaluated by modeling the battery degradation process, which enables the prediction of life-cycle operating duration for the user-side ESS. Ref. [3] proposed a staged degradation model and used early observable indicators to predict battery life. Ref. [4] investigated how charge and discharge states affect degradation rates and developed an empirical life evaluation model. By quantifying the impact of operating state-of-charge (SOC) on the lifetime curve, Ref. [5] established a mechanism coupled model of capacity fade that can be directly used for lifetime prediction over operating periods. Considering accelerated aging induced by cycle depth, Ref. [6] developed a life prediction model for an electrochemical ESS that incorporates both linear and nonlinear constraints. Ref. [7] proposed a multilayer long short-term memory-based life prediction model and used early cycle data to forecast the full life degradation trajectory. Combining degradation mode identification with transfer learning, Ref. [8] developed a life prediction approach suitable for multiple operating scenarios. Although these studies predict battery life from different perspectives, their results are generally obtained under the assumption of a given storage capacity. In practical projects, storage configuration is often coupled with battery life considerations, which limits the direct applicability of the above evaluation methods.
Given the influence of battery lifetime, sizing a user-side ESS must account for the operating cycle. Ref. [9] used the rainflow counting method to convert battery lifetime loss into a degradation cost, and optimized the operating strategy by minimizing total cost. Ref. [10] considered the impact of capacity retention variation on system lifetime and economic performance, and proposed a capacity configuration model based on the firefly algorithm. Ref. [11] quantified lifetime cost based on depth of discharge (DoD), and proposed a bilevel capacity optimization model for a bundled wind, PV, and storage export system. Ref. [12] proposed a battery loss model considering real-time SOC stress and dynamic cycle efficiency, and derived the optimal sizing strategy using McCormick relaxation. Ref. [13] established the relationship between DoD and battery life through piecewise linearization, and developed a planning model with total cost minimization to incorporate lifetime impacts. Overall, the above studies consider the economic effects of both storage configuration and battery degradation, thereby providing guidance for the planning and operation of user-side ESSs. However, most of them optimize lifetime-related costs mainly from the charge–discharge perspective and do not fully account for the impact of ancillary service participation on battery life. As a result, the obtained configurations and operating strategies are less aligned with practical scenarios.
User-side ESS participation in ancillary services is a key pathway for commercialization [14]. Existing studies have analyzed operating scenarios after storage configuration. Ref. [15], based on relevant policies of the China Southern Power Grid electricity market, established a charge–discharge strategy model for commercial and industrial ESSs participating in frequency regulation. Ref. [16] conducted statistical analysis of extreme fluctuation points. It then proposed an energy constraint strategy with a limited time window to further exploit the potential of the ESS for peak shaving and valley filling. Ref. [17] considered user-side ESS planning and operation under two-part tariffs. It proposed a life-cycle optimization method for power and energy configuration in demand charge management scenarios. Ref. [18] constructed a price elasticity matrix based on time-of-use tariffs and proposed a coordinated optimization model considering the demand response of the ESS. Ref. [19] developed a strategy framework based on game theory and proposed a dynamic strategy optimization model for ESSs participating in demand response. Ref. [20] aimed to enhance renewable accommodation. It proposed a coordinated planning method for centralized and distributed battery ESSs based on an improved analytical target cascading approach. Ref. [21] used evolutionary game theory to systematically analyze the benefits of coordinated operation of user-side renewables and ESSs. Ref. [22] combined evolutionary game theory with deep reinforcement learning. It proposed an adaptive optimization model for real-time operating strategies in the user-side ancillary service market. Overall, the above studies model and analyze various ancillary service participation scenarios and provide approaches to identify operating revenues of user-side ESSs. However, most of them evaluate revenues under a single ancillary service scenario. They do not consider situations in which the ESS participates in multi-service simultaneously. In addition, battery degradation is not integrated into the optimization of operating strategies. Therefore, the resulting configurations and operating strategies do not simultaneously address dispatch economics and battery lifetime, and they cannot ensure optimal economic performance over the full life-cycle.
To clarify the differences between representative studies and this work, Table 1 compares prior user-side ESS models in terms of multi-service consideration, lifetime cost embedding, joint planning and operation, and their solution methods.
Table 1.
Feature comparison of representative user-side ESS studies and this work.
As shown in Table 1, existing user-side ESS studies typically address only a subset of multi-service participation, lifetime-cost embedding, and joint planning and operation decision-making. Recent studies have investigated planning and operation co-optimization, multi-service value stacking, or degradation-aware modeling, while the modeling scope and feasibility considerations vary across formulations. To bridge these gaps, LC-MSCOM determines ESS power and energy ratings and a degradation-aware operating strategy within a unified feasibility set, enabling a consistent trade-off between stacked service revenues and lifetime loss. Beyond the high-level features in Table 1, LC-MSCOM represents service operating constraints and settlement rules for multi-service participation, and enforces network implementability using DistFlow operating limits with SOCP relaxation. Computational tractability is maintained through reformulation using logical and piecewise linearization, McCormick envelopes, and second-order cone relaxations. Configuration schemes are assessed using full life-cycle cash flows and economic indicators to support investment and operational decisions.
The main contributions of this paper are as follows:
- (1)
- A unified and rule-explicit multi-service modeling and valuation framework is developed for a user-side ESS. It integrates time-of-use arbitrage, demand charge management, demand response, and renewable accommodation under consistent operating and settlement constraints, enabling coherent accounting of life-cycle benefits under multi-service participation.
- (2)
- DoD-based lifetime loss is embedded as an internalized degradation cost and coupled with SOC-driven operating decisions. The resulting nonconvexities are reformulated into a tractable form through convexification and linearization techniques, including McCormick envelopes, thereby enabling degradation-aware operation with accurate life-cycle cost accounting.
- (3)
- A tractable co-optimization formulation is proposed to jointly determine user-side ESS power and energy ratings together with operating strategies within a unified feasibility set. Distribution network operating limits are incorporated through DistFlow constraints with SOCP relaxation; combined with life-cycle cash flow evaluation and sensitivity analyses, the proposed framework provides quantitative support for robust investment and operational decision-making.
The remainder of this paper is organized as follows. Section 2 presents a life-cycle analysis of a user-side ESS. Section 3 formulates an LC-MSCOM for a user-side ESS configuration. Section 4 describes the implementation environment, modeling steps, and solution workflow. Section 5 presents simulations, analysis, and discussion of a modified IEEE 14-bus system using real generation–load data. Finally, Section 6 concludes the paper. For ease of reference, the meanings and units of all symbols and variables in the proposed model are summarized in Table A1 in the Appendix A.
2. Life-Cycle Analysis of a User-Side Energy Storage System
2.1. Life-Cycle Framework for a User-Side Energy Storage System
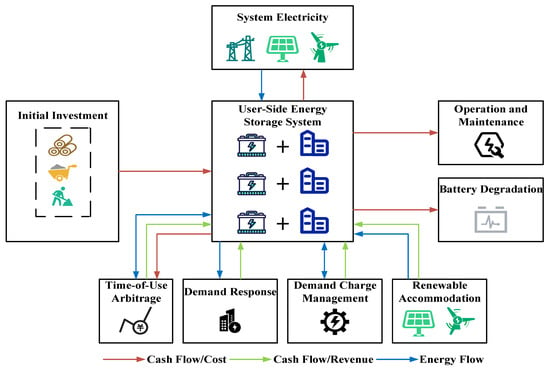
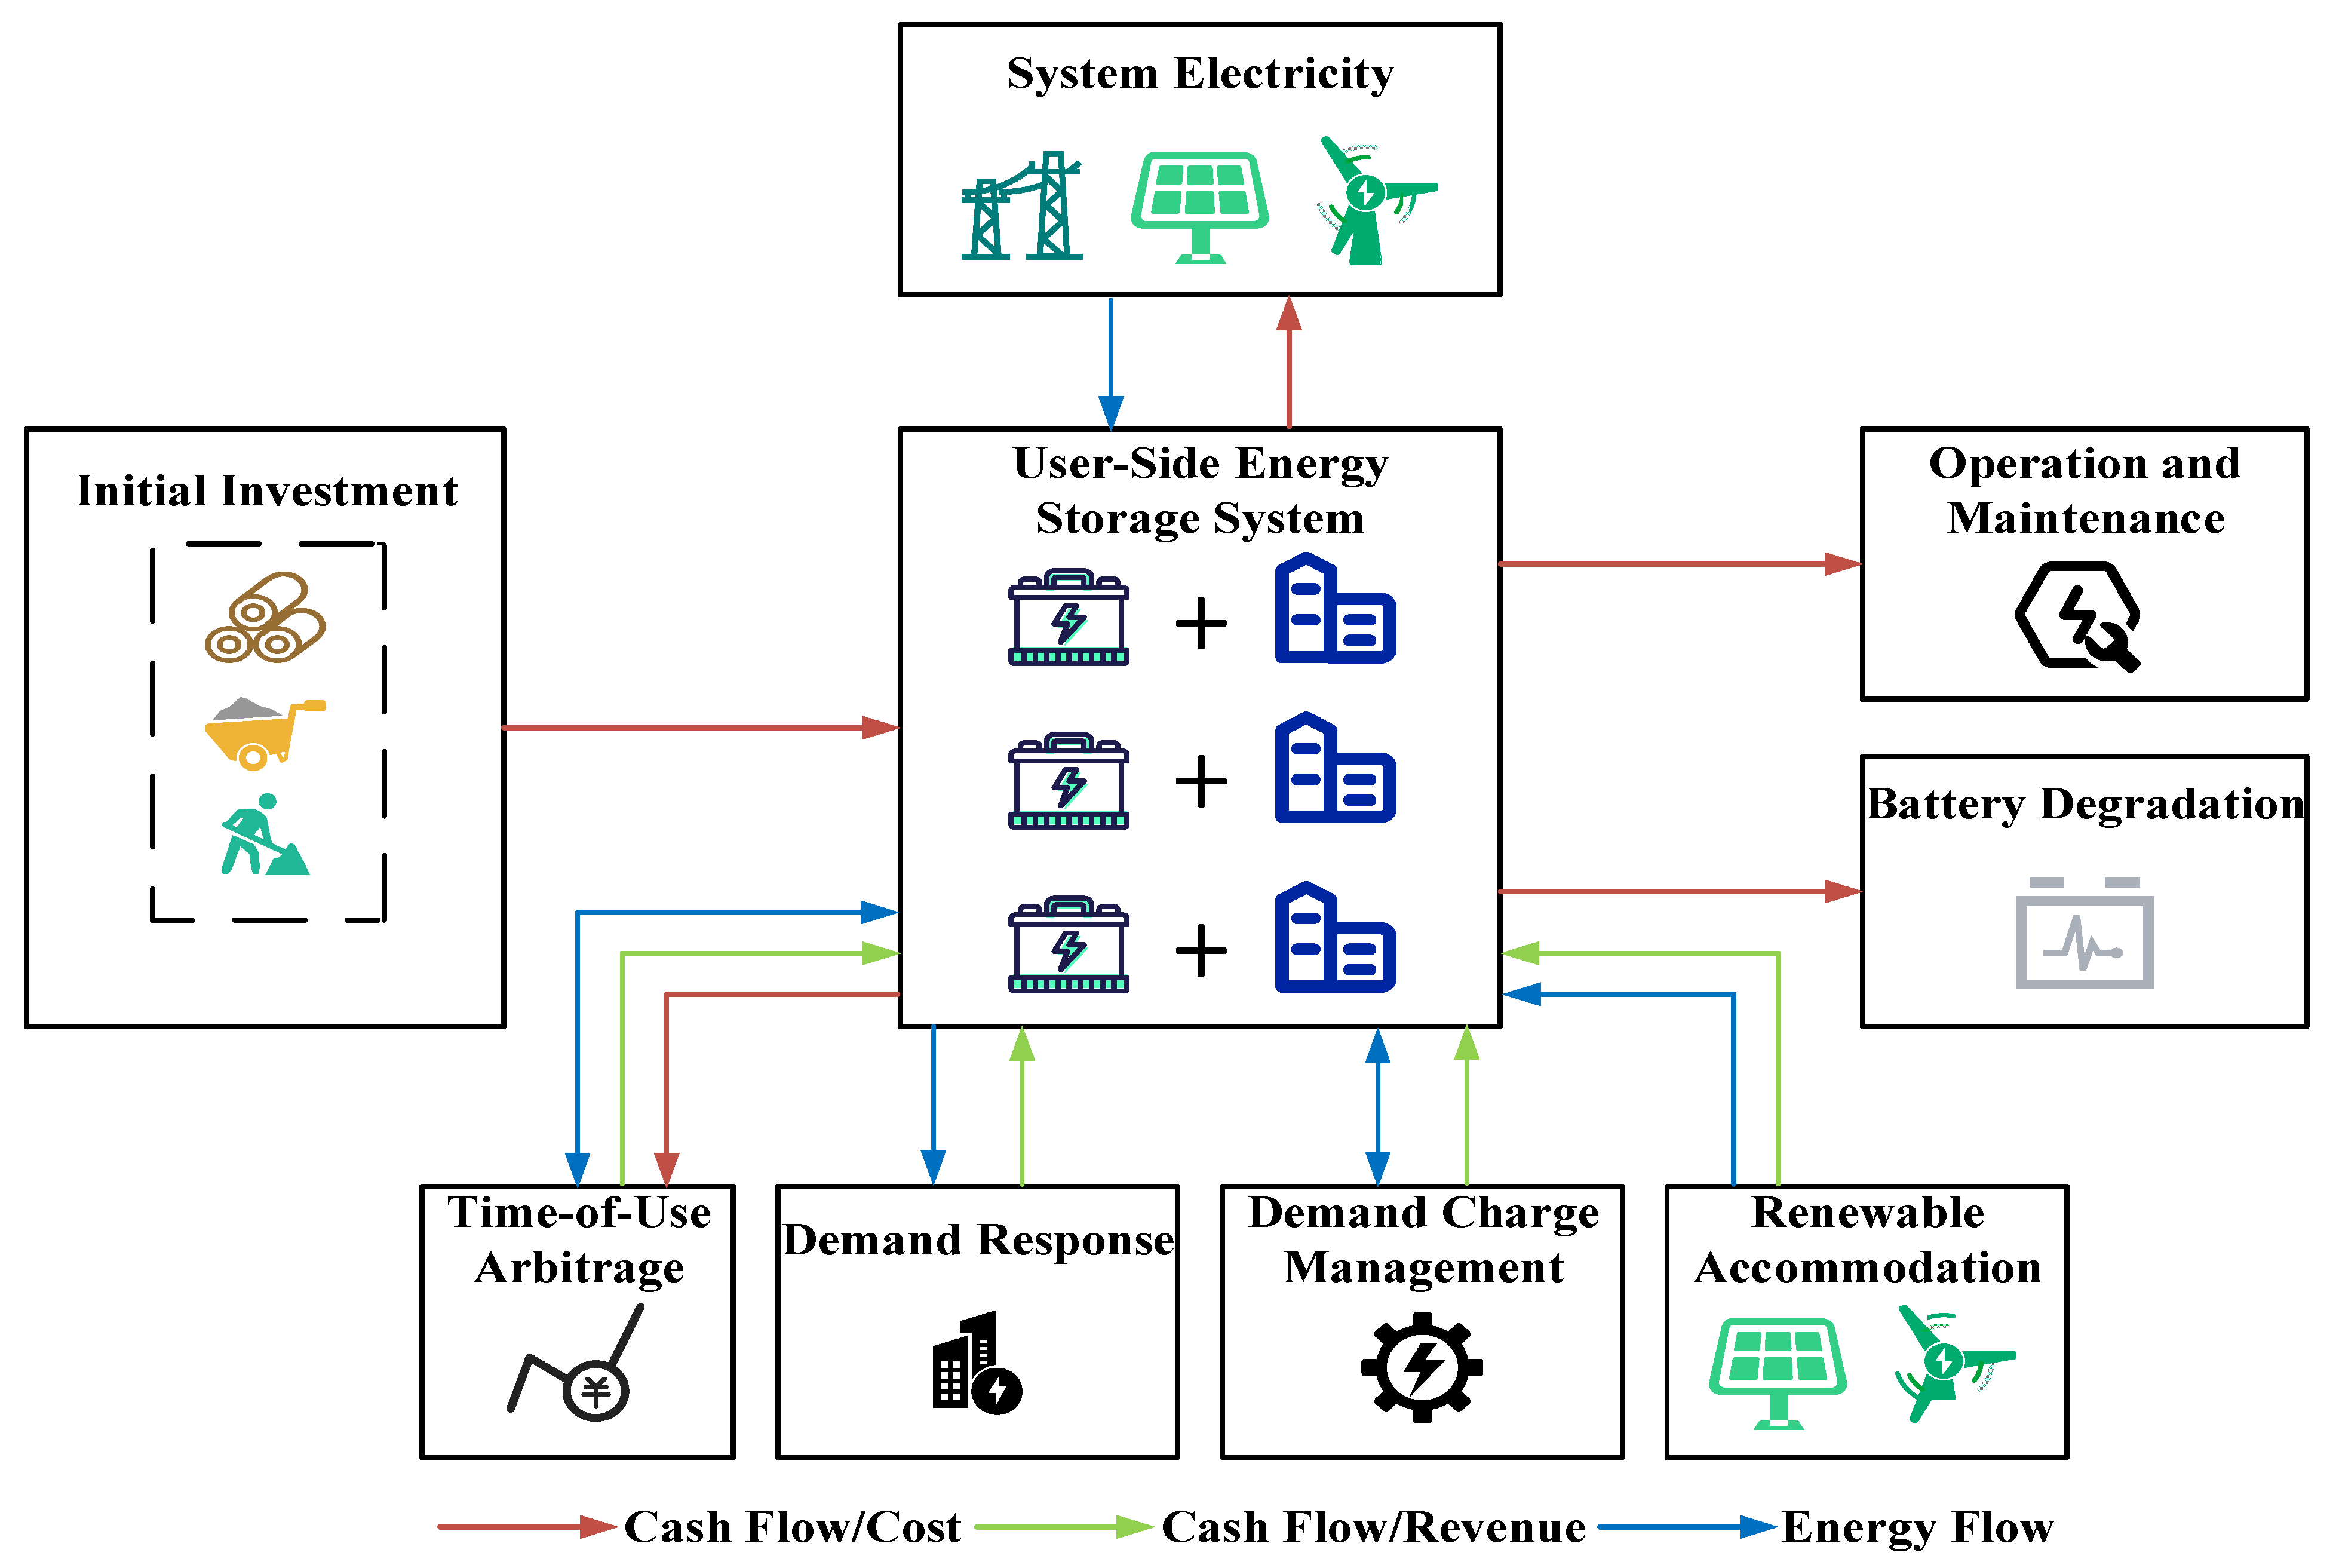
The life-cycle analysis framework for a user-side ESS is shown in Figure 1.
Figure 1.
Life-cycle framework for a user-side energy storage system.
A project starts with deploying a user-side ESS through initial investment. During the operation stage, the ESS obtains revenues from time-of-use arbitrage, demand response, demand charge management, and renewable accommodation, while incurring system electricity and operation and maintenance (O&M) costs. As the battery ages, the ESS is retired according to its degradation level.
Based on the cash flows and energy flows generated over the life-cycle of the user-side ESS, this paper analyzes economic benefits and battery lifetime. The cash flows arising during the operating period are discounted. Battery retirement and replacement are converted and allocated to battery degradation cost. The corresponding evaluation coefficients are introduced in Section 2.2.
2.2. Life-Cycle Evaluation Coefficient
A life-cycle discount coefficient is introduced to analyze the costs and revenues generated during each operating period [10,17,23]. The coefficient is calculated as follows:
where kr is the life-cycle discount coefficient, Tn is the planning horizon, tr is the inflation rate, and dr is the discount rate.
Based on the discounting framework defined in Equation (1), three commonly used economic evaluation indicators—net present value (NPV), internal rate of return (IRR), and discounted payback period (DPP)—are adopted to assess the feasibility of the proposed configuration schemes [24]. The expressions are given in Equations (2)–(4):
where kNPV, kIRR, and kDPP denote the values of NPV, IRR, and DPP, respectively, and Fy denotes the net cash flow of the project in year y.
2.3. Cost Analysis
The life-cycle cost of the ESS includes initial investment, O&M, battery degradation, and system electricity costs. These cost components are calculated as follows:
- (1)
- Initial Investment Cost
- (2)
- Operation and Maintenance Cost
- (3)
- Battery Degradation Cost
The calculation of and for unit m in period t is given as follows [25]:
where denotes the SOC of unit m in period t and is a fitting parameter.
- (4)
- System Electricity Cost
2.4. Revenue Analysis
The ESS can earn revenues by participating in multiple ancillary services. The corresponding revenue components are calculated as follows:
- (1)
- Time-of-Use Arbitrage Revenue
The ESS can charge during valley periods and discharge during peak periods, thereby earning revenue from time-of-use price differences. This revenue is computed as follows:
where F1 denotes the time-of-use arbitrage revenue; and are the unit discharge and charge prices, respectively, for transactions between the ESS and the park in period t; is the grid retail price in period t; , , and denote the power transferred from ESS to the park, from the park to ESS, and from ESS to the grid, respectively; and and are binary variables indicating whether the ESS unit m is discharging or charging in period t (0 = not operated, 1 = operated).
- (2)
- Demand Charge Management Revenue
With the ESS installed, the system can discharge during peak user load to reduce the maximum demand and thus lower the demand charge. The demand charge management revenue arises from the monthly basic capacity fee saved by reducing the reported demand value [26]. It is calculated as follows:
where F2 denotes the demand charge management revenue; is the unit price of the monthly basic capacity charge; Pmd is the maximum demand before ESS installation; and Pd is the reported maximum demand after ESS installation.
- (3)
- Demand Response Revenue
Demand response refers to the use of price-based policies to incentivize users to adjust or shift electricity usage according to grid operating conditions, thereby alleviating structural power shortages and enhancing system balancing capability [27].
Based on the market-based demand response implementation rules of Guangdong Province [28], the user-side demand response revenue is analyzed in this paper. This revenue, denoted F3, consists of the clearing payment Fresp obtained for the effective response capacity after winning the bid and the performance penalty Fpen assessed for underperformance. The revenue is calculated as follows:
where H denotes the set of time periods participating in demand response; and denote the effective response capacity and the cleared demand response price in period t, respectively; and and denote the penalty unit price and the penalized quantity in period t, respectively.
- (4)
- Renewable Accommodation Revenue
In new power systems with high penetration of wind and PV generation, curtailment can seriously undermine system reliability. Therefore, curtailment penalty costs are incorporated into dispatch to enhance system stability [29].
After the ESS is integrated, the variability of wind and PV generation can be effectively mitigated. By absorbing renewable power, the ESS reduces curtailment penalty costs and thus yields renewable accommodation revenue. This revenue is calculated as follows:
where F4 denotes the renewable accommodation revenue; and denote the PV power and wind power absorbed by ESS unit m in period t, respectively; and and denote the penalty costs for PV curtailment and wind curtailment, respectively.
3. User-Side Energy Storage System Configuration Model
The proposed model maximizes the life-cycle net benefit by jointly optimizing ESS power and energy ratings and operational decisions, subject to constraints on ESS operation, battery lifetime, ancillary service participation, and network power flow.
3.1. Model Objective Function
The life-cycle net benefit is defined as the total revenues over the planning horizon minus the total costs. The objective function is expressed as follows:
where F denotes the life-cycle net benefit. The objective is to maximize F.
3.2. Model Constraints
3.2.1. Energy Storage System Operational Constraints
During operation, the energy state of the ESS is determined by the energy in the previous period and the charging and discharging powers. The constraints are given as follows:
where Em,t is the stored energy of storage unit m in period t; and are the charging and discharging efficiencies, respectively; and denote the total charging and total discharging powers of storage unit m in period t, respectively; and is the power purchased by the storage from the grid in period t.
To prevent overcharge and overdischarge, SOC is bounded as follows:
where and denote the lower and upper bounds of SOC, respectively.
The total charging and discharging powers of the storage are limited by its rated power, and charging and discharging cannot occur simultaneously in the same period. The constraints are given as follows:
3.2.2. Battery Degradation Constraints
The lifetime of a storage battery is largely influenced by cycling-related aging, in which the number of charge–discharge cycles and the DoD are key determinants. Experimental studies [30,31,32] have shown that deeper DoD accelerates battery aging and shortens the usable lifetime. Accordingly, prior studies commonly convert DoD-induced lifetime loss into an equivalent degradation cost and embed it in the objective function to preserve tractability in planning and dispatch optimization [9,33,34]. In this study, DoD is evaluated using Equation (8), and the corresponding period-specific lifetime loss is converted into the battery degradation cost via Equation (7), thereby discouraging excessively deep cycling within the optimization framework.
However, the DoD-based battery degradation cost calculation in Equations (7) and (8) involves absolute value terms, binary variables, and products of continuous variables, which introduce nonlinearities into the optimization model. To ensure tractability, this paper linearizes the DoD-based degradation model in three steps as follows:
- (1)
- Depth of Discharge Linearization Constraints
The absolute value term in Equation (8) is reformulated into the following linear constraints:
- (2)
- Equivalent Cycle Counting Linearization Constraints
To linearize the computation of the full-equivalent cycle count , a DoD partitioning preprocessing step is adopted. Here, I denotes the number of DoD segments. The DoD interval is uniformly divided into I segments, and the segment boundaries di and midpoints are defined as follows:
A binary variable gm,t,i is introduced to ensure that exactly one DoD segment is selected in each period. The corresponding DoD segment selection constraints are given as follows:
To linearize the product of gm,t,i and , an auxiliary variable is introduced. The linear envelope constraints are given in Equation (21):
With these constraints in place, DoD segmentation is completed as a preprocessing step before solving the optimization problem [30]. The fitting parameter and the segment-specific coefficient ri are calculated as in Equation (22):
where and Nk denote the representative DoD level in segment k and the corresponding cycle life, respectively. and denote the arithmetic means of and over k = 1, …, I, respectively.
With ri treated as constants, the full-equivalent cycle count can be linearly approximated as follows:
- (3)
- Battery Degradation Cost Linearization Constraints
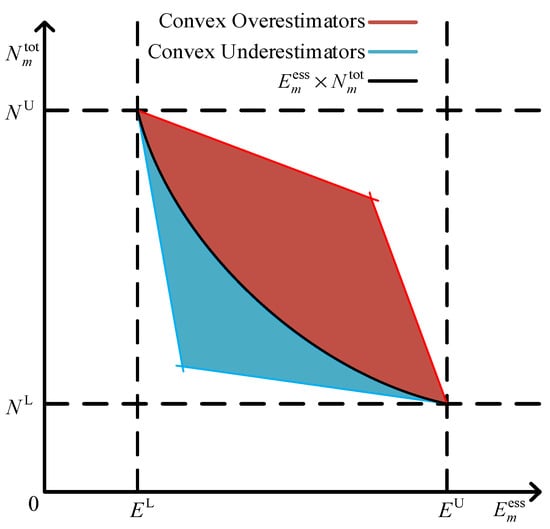
In the battery degradation cost expression in Equation (7), the bilinear term is included. This term couples ESS capacity sizing with its cycling behavior, but also introduces nonconvexity into the optimization problem. To ensure tractability, this paper introduces an auxiliary variable Zm and applies the McCormick envelope to linearize the feasible region. The auxiliary variable and the associated bounds are defined as follows:
where denotes the total full-equivalent cycle count of storage unit ; EL and EU are the lower and upper bounds of the configured storage energy capacity, respectively; and NL and NU are the lower and upper bounds of the total full-equivalent cycle count, respectively.
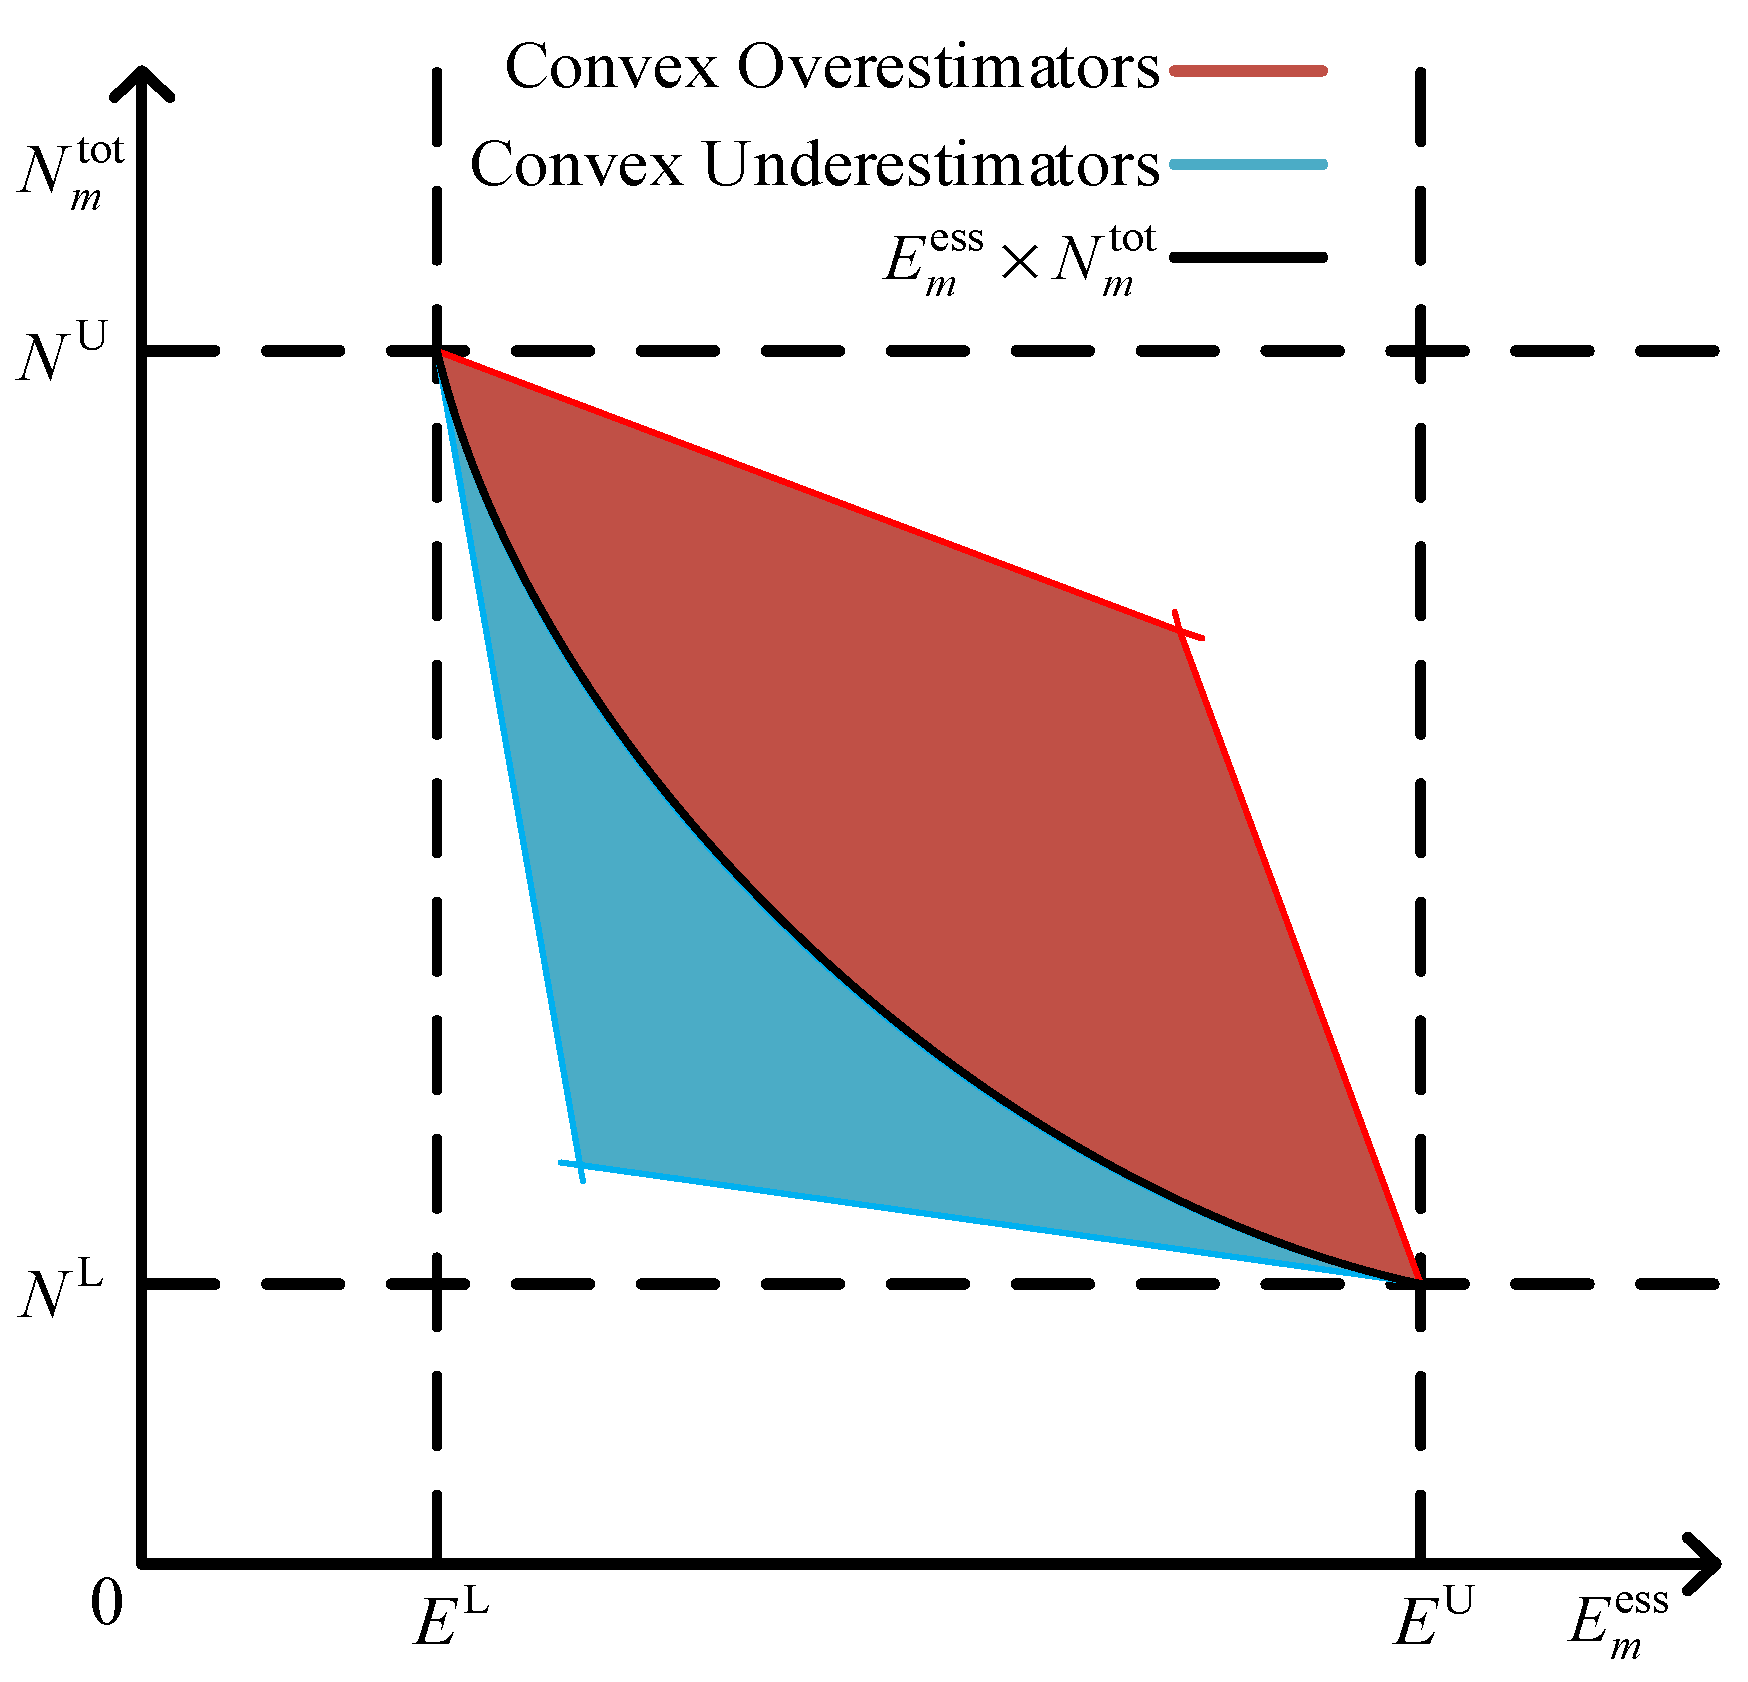
The McCormick envelope provides a convex relaxation for bilinear terms. It preserves convexity while offering sufficiently tight bounds, thereby converting a nonconvex formulation into a tractable convex approximation. This approach is widely used in power system optimization to improve solvability and numerical stability without altering the overall problem structure [35,36,37]. Figure 2 illustrates the bilinear relaxation adopted in this paper.
Figure 2.
Bilinear relaxation constraint diagram.
Accordingly, the McCormick envelope constraints for Zm are formulated as follows:
With these linear constraints, the bilinear term in Equation (7) is replaced, and the battery degradation cost can be reformulated as follows:
3.2.3. Ancillary Service Constraints
- (1)
- Demand Response Constraints
Based on the market-based demand response implementation rules of Guangdong Province [28], this paper formulates an equivalent set of demand response constraints for the proposed model. The resulting constraints are as follows:
- Participation and upper-bound constraints
A participation indicator is introduced to indicate whether the system participates in demand response in period t ( for participation and for non-participation). The corresponding participation constraints are given as follows:
where and denote the awarded bid capacity and the original response capacity before threshold assessment in period t, respectively. and denote the upper bounds of the bid capacity and the original response capacity, respectively.
- Demand response interval constraints
Demand response is partitioned into four intervals according to the response capacity ratio, including one invalid interval (0,R1) and three valid intervals (R1,R2), (R2,R3), and (R3,1.5). Here, R1, R2, and R3 are the threshold parameters, and k1–k4 are the corresponding inclusion coefficients for the four intervals. The binary interval-selection variable and the intra-interval baseline variable are introduced to provide a linear representation of the valid-interval constraints. The resulting constraints are given as follows:
where and denote the lower and upper thresholds of interval s, respectively.
- Threshold-based assessment constraints
According to the implementation rules, if the actually executable quantity fails to reach the threshold ratio R1 of the awarded bid capacity , the shortfall is counted as the assessed quantity and penalized at the specified unit price. The corresponding constraints for the demand response penalty Fpen are given as follows:
where and denote the penalty unit price and the penalized shortfall quantity in period t, respectively; Mu and denote the assessment penalty factor and the lower bound of the assessment price, respectively.
- (2)
- Renewable Accommodation Constraint
Renewable generation is prioritized to supply the load, and any surplus is absorbed by the ESS, subject to the following constraint:
where denotes the load demand power in period t.
3.2.4. Network Power Flow Constraints
The network power flow constraints are formulated based on the DistFlow model, and the quadratic terms are convexified using a second-order cone programming (SOCP) relaxation. To ensure secure network operation, this paper imposes nodal power balance constraints, nodal voltage magnitude constraints, and branch ampacity constraints, as shown in Equations (31)–(33). The SOCP relaxation is given in Equation (34).
- (1)
- Nodal Power Balance Constraints
Each node in the network must satisfy the active and reactive power balance:
where a(j) denotes the set of parent (sending end) buses of branches whose receiving end is bus j, and b(j) denotes the set of child (receiving end) buses of branches whose sending end is bus j. Pij,t and Qij,t denote the active and reactive power flows on branch ij in period t, respectively; Rij and Xij denote the resistance and reactance of branch ij, respectively; and lij,t denotes the squared magnitude of the current on branch ij in period t. Pi,t and Qi,t denote the active and reactive power injections at bus i in period t, respectively.
Specifically, , , , , , , and denote the PV, wind, storage discharging, grid exchange, load, storage charging, and demand response active power injections at bus i in period t, respectively. , , and denote the corresponding reactive power injections.
- (2)
- Nodal Voltage Magnitude Constraints
The bus voltage magnitude must remain within the prescribed lower and upper bounds:
where vi,t denotes the squared voltage magnitude at bus i in period t; zij denotes the impedance of branch ij; and Ui,min and Ui,max denote the lower and upper voltage limits at bus i, respectively.
- (3)
- Branch Ampacity Constraints
The branch current magnitude must not exceed the maximum allowable ampacity:
where Iij,max denotes the maximum ampacity of branch ij.
Under these conditions, the branch power flows can be coupled with the current magnitude through the following quadratic equality: . To maintain convexity of the model, a standard SOCP relaxation is adopted, i.e., , which can be written as:
4. LC-MSCOM Framework and Solution Procedure
4.1. LC-MSCOM Framework
LC-MSCOM is formulated as a project-level co-optimization framework that links storage sizing with multi-service dispatch under a unified life-cycle accounting structure. It jointly determines rated power and rated energy capacity, and optimizes time-coupled charging and discharging decisions and the corresponding SOC trajectory on representative operating days. Service participation is modeled through a unified revenue layer, while battery lifetime impacts are internalized via a DoD-based degradation representation directly coupled with operational decisions. Distribution network feasibility is incorporated through embedded operating constraints, so the resulting schedules remain feasible under network operating limits. By integrating these elements within the proposed optimization model, LC-MSCOM produces a consistent set of sizing results, dispatch trajectories, and itemized cost and revenue components, enabling discounted cash flow-based life-cycle economic evaluation. This formulation helps maintain consistency between long-term investment decisions and short-term operational strategies, and supports transparent interpretation of trade-offs among service revenues, degradation cost, and network feasibility in distribution-level planning and deployment.
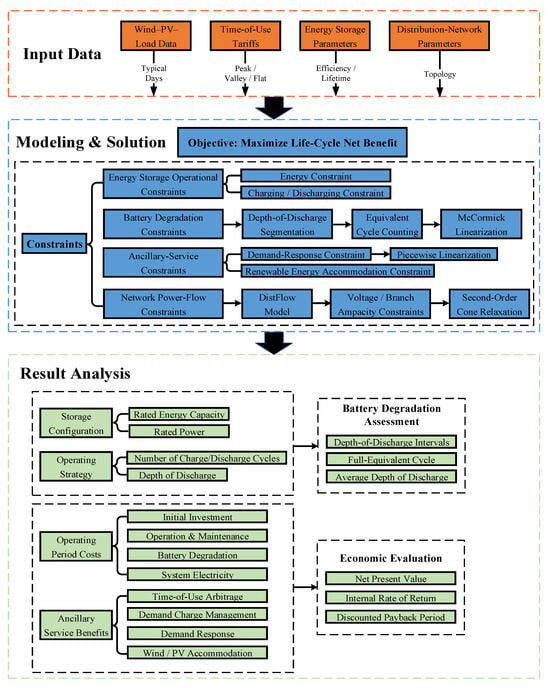
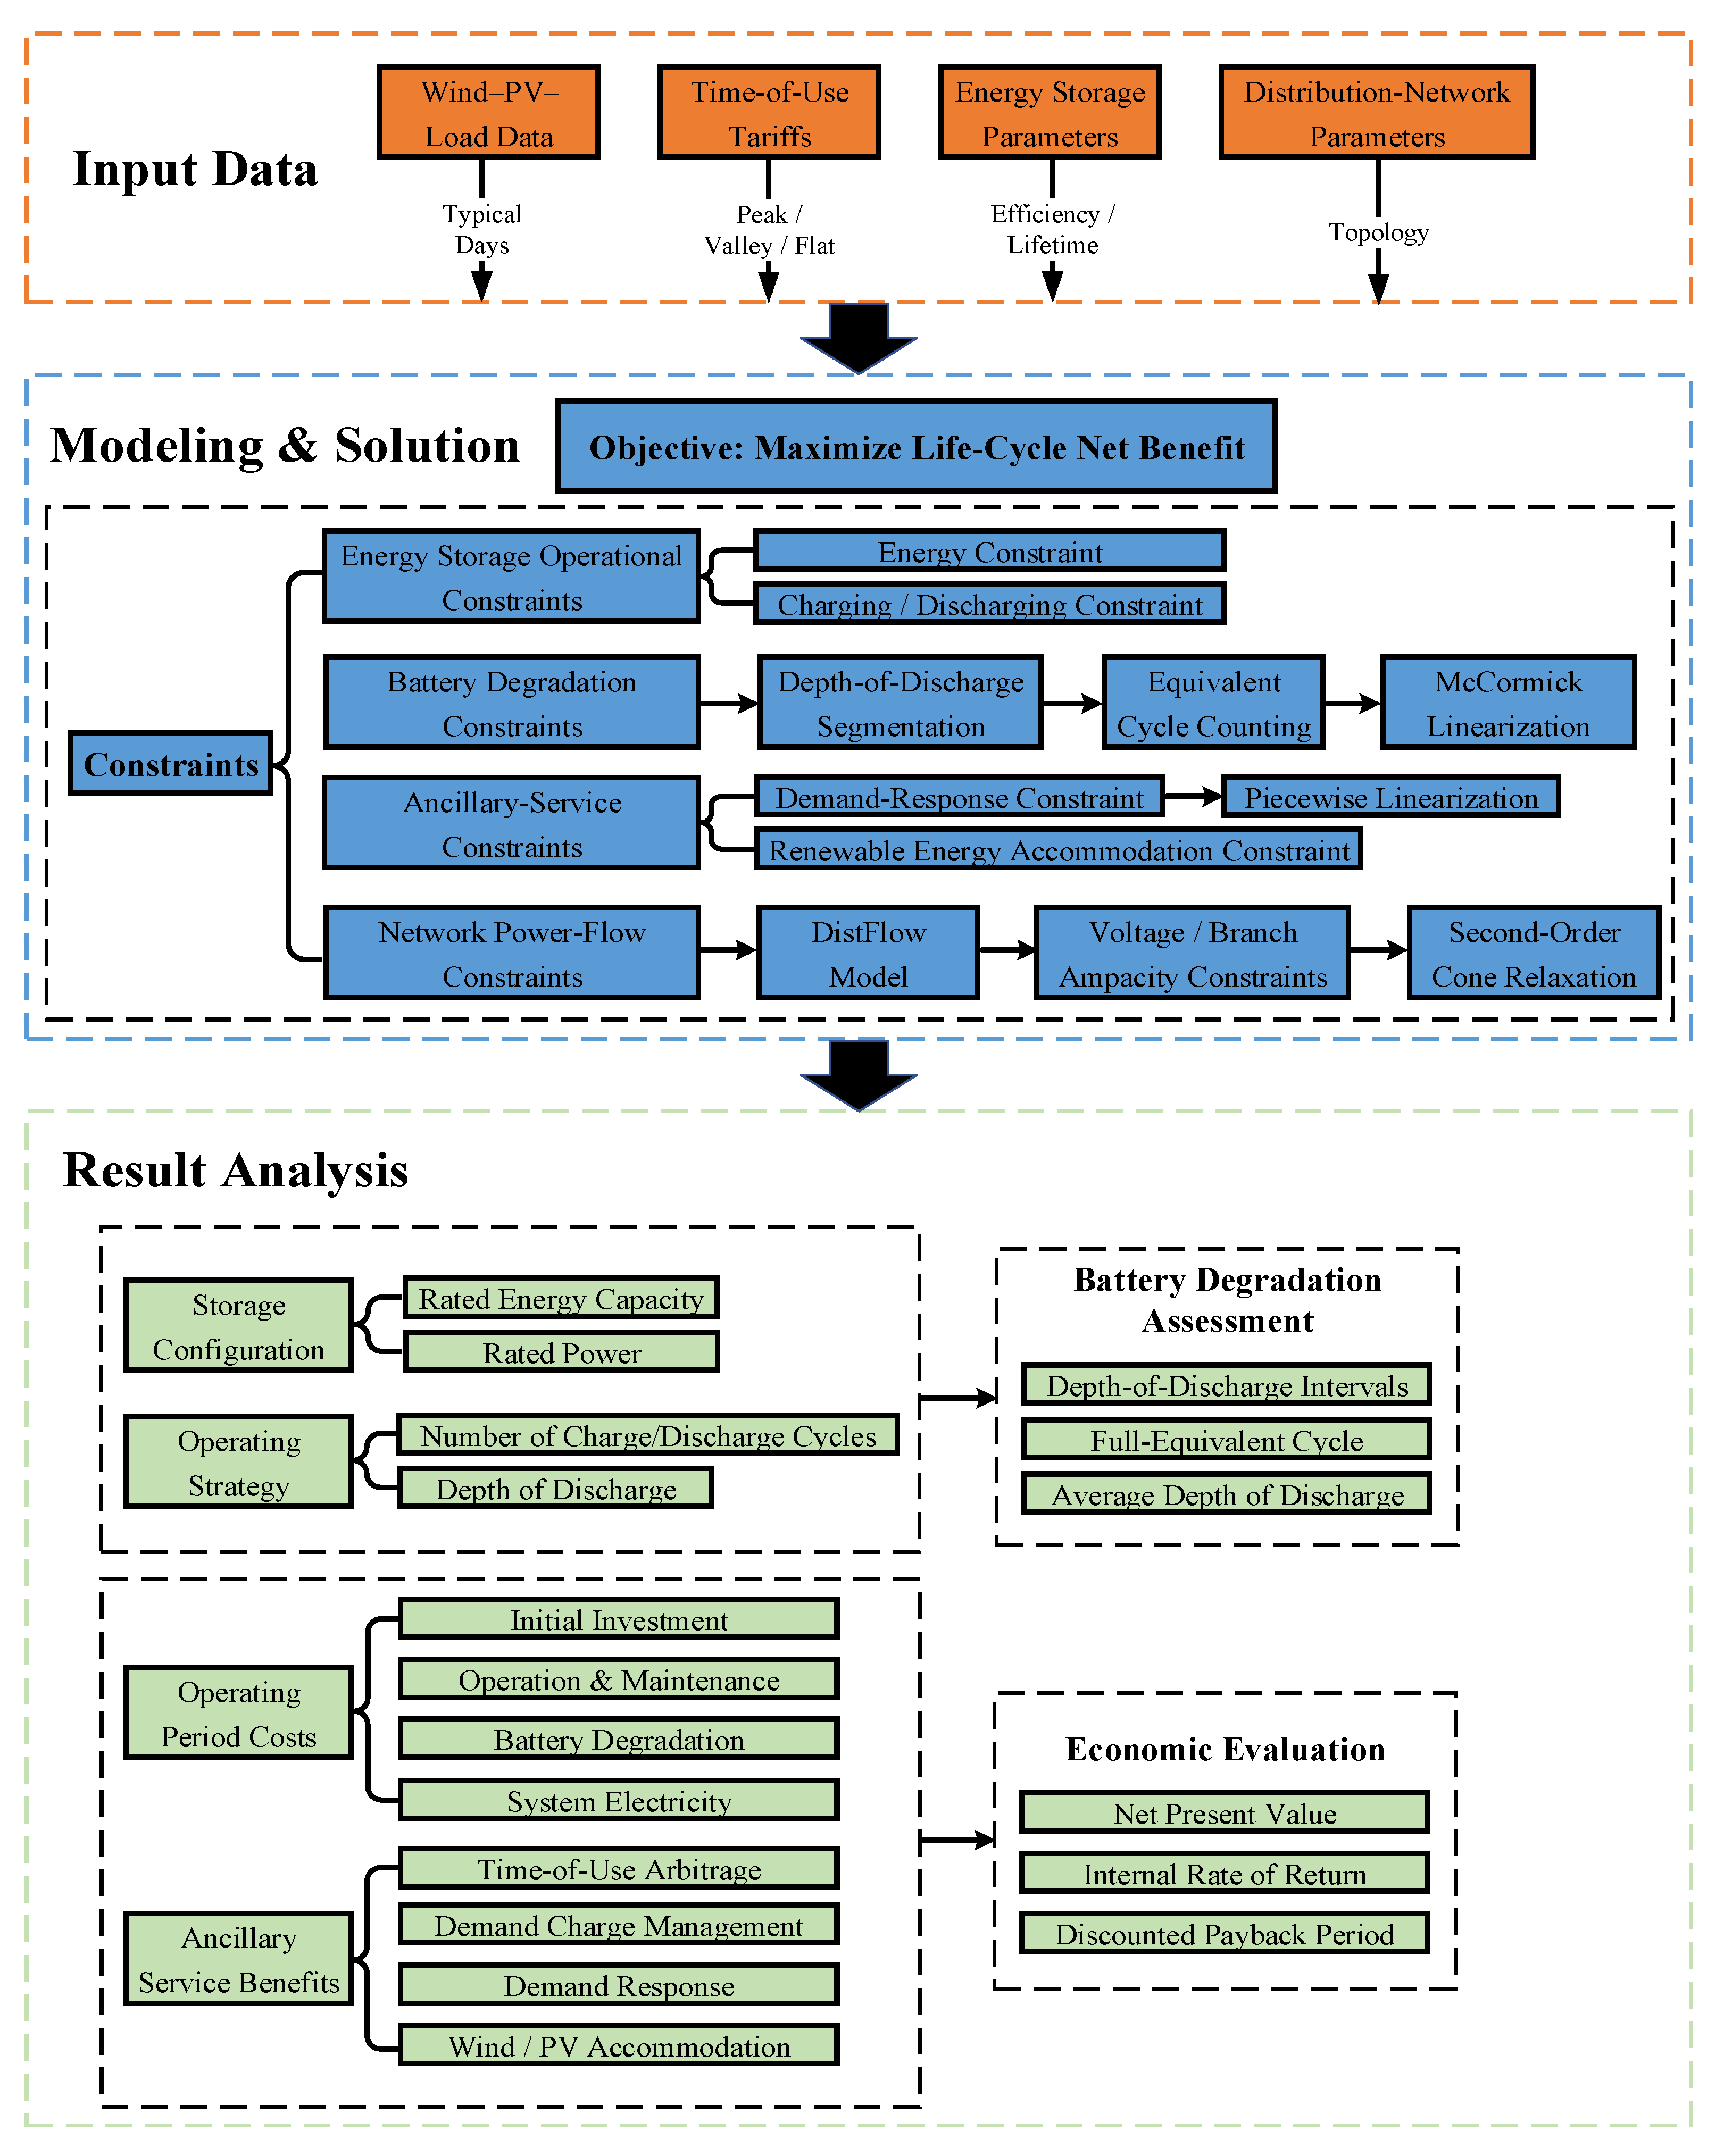
The LC-MSCOM model framework is illustrated in Figure 3.
Figure 3.
LC-MSCOM model framework.
As shown in Figure 3, the LC-MSCOM model framework includes four coupled constraint blocks that serve one objective: maximizing life-cycle net benefit. The ESS operation block imposes charging and discharging power limits and SOC dynamics, ensuring a physically feasible dispatch trajectory. The ancillary service block quantifies and constrains service provision, including time-of-use arbitrage, demand charge management, demand response, and renewable accommodation, so multi-service revenues are captured consistently. The degradation block links the dispatch profile to DoD-based lifetime loss and expresses it as an explicit degradation cost, thereby internalizing lifetime impacts in the objective. The network block embeds distribution network power flow feasibility through the DistFlow model with voltage/branch ampacity constraints, ensuring the optimal schedules remain implementable at the distribution level.
Within this framework, degradation-related bilinear couplings are handled via McCormick linearization, while program-rule logic and constraints in demand response are represented using piecewise linearization, and quadratic relations in the power flow constraints are convexified through second-order cone relaxation. After these convex and linear reformulations, the resulting maximization problem can be solved reliably by a commercial MISOCP solver, thereby avoiding reliance on heuristic tuning or locally optimal solutions.
4.2. Implementation and Solver Environment
The LC-MSCOM model is implemented in MATLAB R2022b and solved using Gurobi 11.0.2. The ESS configuration problem is formulated as a MISOCP. All simulations are executed on a workstation with a 13th Gen Intel Core i9-13900HX CPU and 16 GB RAM, running Windows 11 Home (64-bit). The key solver settings are summarized in Table 2, and all other parameters are kept at their default values.
Table 2.
Key solver parameter settings.
4.3. Solution Workflow
The solution workflow of the LC-MSCOM framework is illustrated in Figure 4.
Figure 4.
Solution workflow of the LC-MSCOM framework.
The key steps of the workflow in Figure 4 are detailed as follows:
- (1)
- Input preparation: Provide all required parameters, including wind–PV–load data, time-of-use tariffs, ESS parameters, and network parameters.
- (2)
- Model formulation: Formulate the LC-MSCOM problem with the objective of maximizing the life-cycle net benefit, subject to constraints on ESS operation, battery degradation, ancillary services, and network power flow.
- (3)
- Convex reformulations: Reformulate the nonlinear components. McCormick linearization is applied to the battery degradation constraints, piecewise linearization is used for the demand response constraints, and the power flow constraints are convexified through second-order cone relaxation.
- (4)
- Optimization: Solve the resulting MISOCP to obtain the ESS configuration, operating strategy, corresponding life-cycle costs, and ancillary service revenues.
- (5)
- Post-analysis: Evaluate battery degradation based on the optimized configuration and charge–discharge strategy, reconstruct annual cash flows from all cost and revenue components, and assess the economic performance of the configuration scheme.
5. Case Study and Analysis
5.1. Case Study Setup
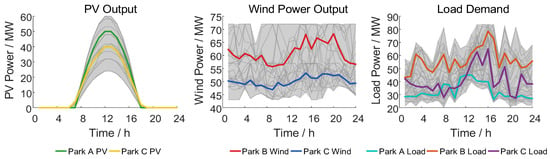
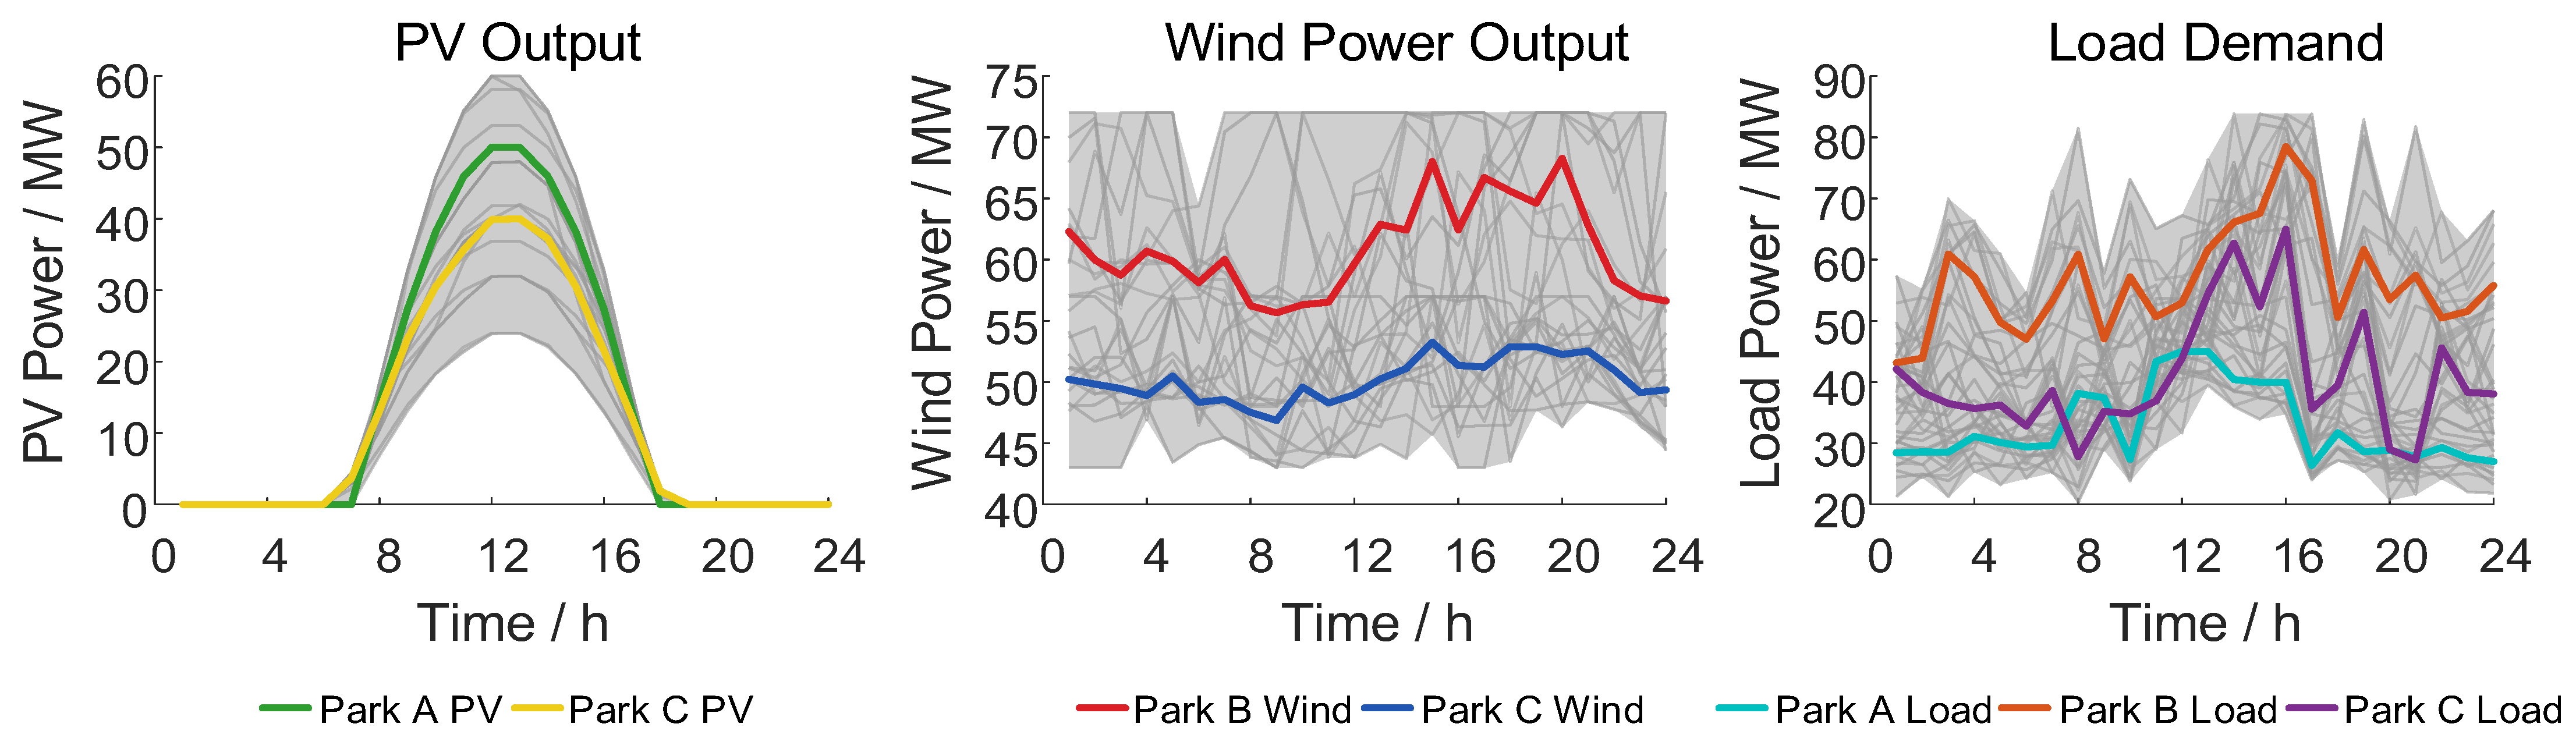
The case study is carried out using 2023 generation–load data from Danshan New Village in Panyu District, Guangzhou, Guangdong Province. The study area comprises three park zones, each equipped with different types of renewable generation units. Following previous studies on ESS configuration [13,38,39], the annual PV, wind, and load profiles of each park are processed by classical k-means clustering to obtain a set of typical-day time series, as illustrated in Figure 5, where the grey curves denote the original data and the coloured curves represent the typical-day profiles.
Figure 5.
Typical-day output data.
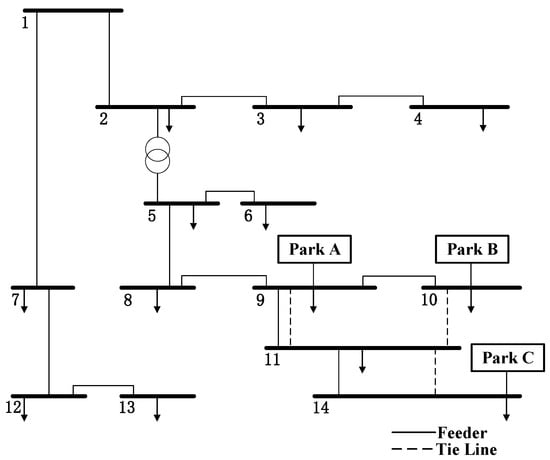
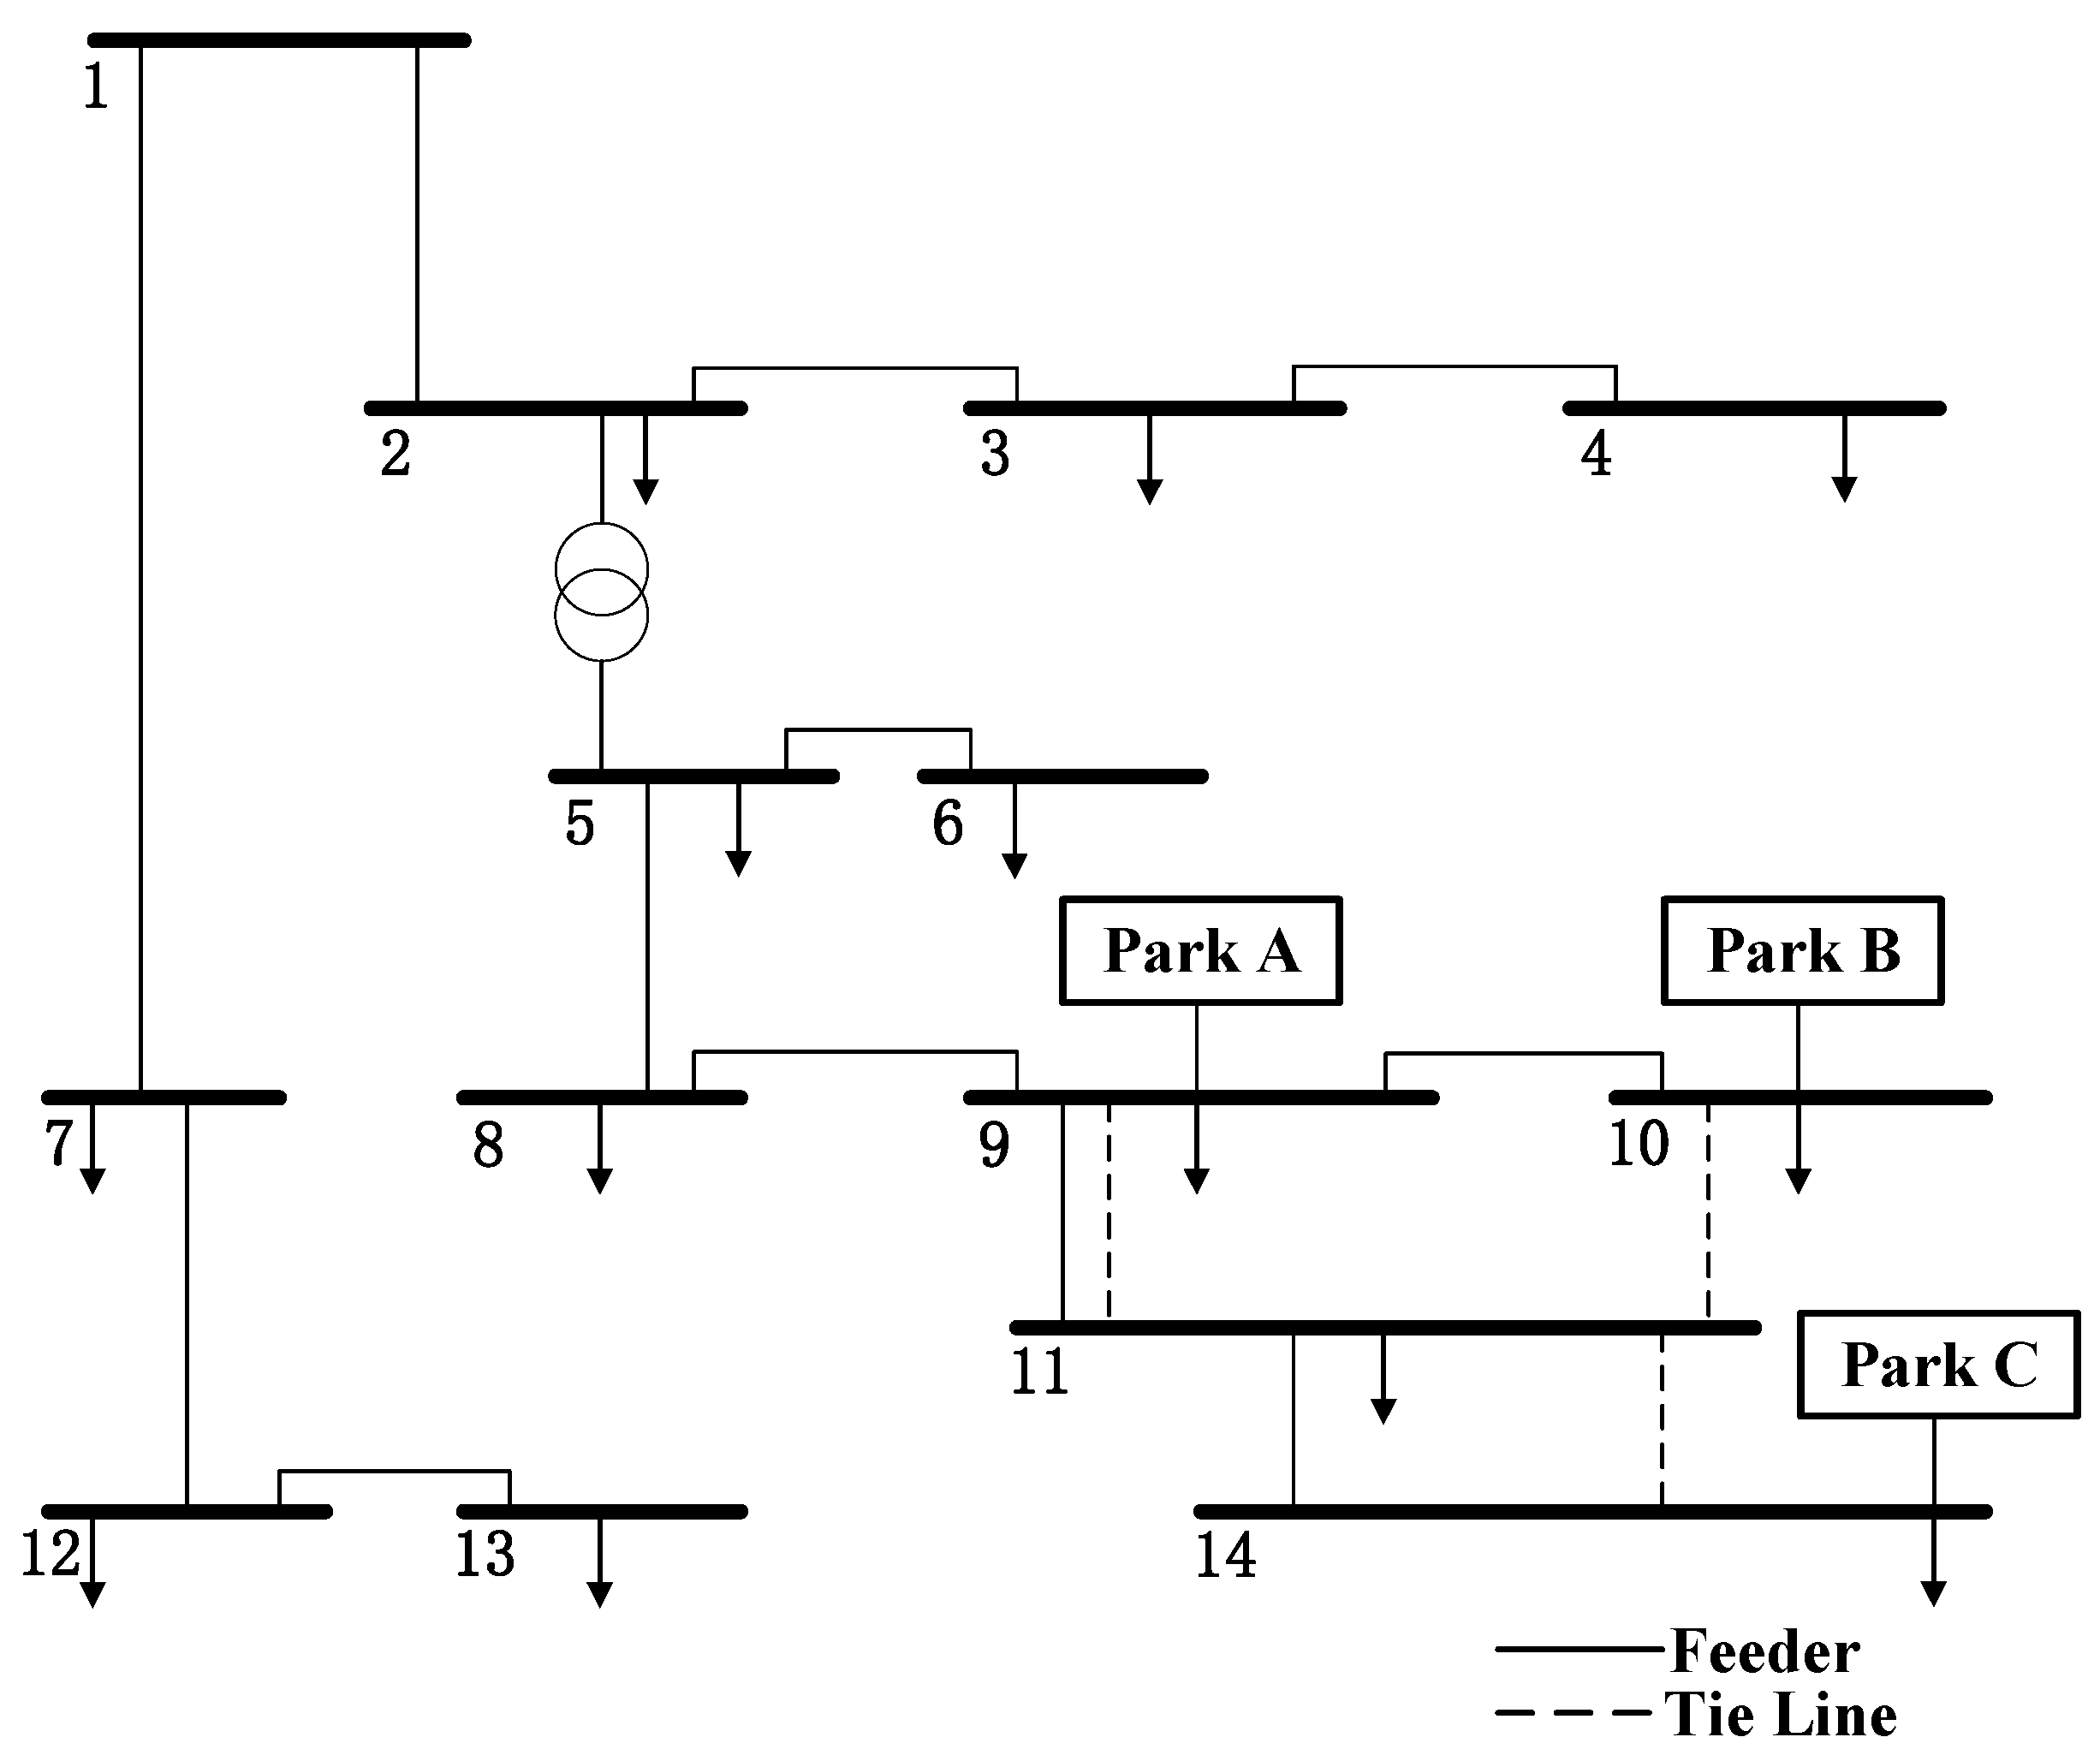
The typical-day time series are injected into a modified IEEE 14-bus system for the case study simulations. The network topology, park interconnection buses, and line parameters are adapted from Ref. [40] and further adjusted to match the actual feeders of Danshan New Village. The resulting topology is shown in Figure 6.
Figure 6.
Network topology of the power system.
The parameters of the ESS configuration model are set according to Refs. [26,41] and summarized in Table 3. The lifetime specifications of the lithium iron phosphate battery used in the model are taken from Ref. [29] and given in Table 4.
Table 3.
Model parameters for storage configuration.
Table 4.
Factory specifications of lithium iron phosphate battery lifetime.
The distribution network transaction tariffs used in the case study are taken from Ref. [40] and summarized in Table 5.
Table 5.
Distribution network transaction tariffs.
In the case study, the demand response parameters are determined on the basis of the Guangdong market-based demand response implementation rules [28] and typical engineering practice, and their values are summarized in Table 6.
Table 6.
Demand response parameters.
A 15-year planning horizon is adopted, with a discount rate of 8% and an inflation rate of 2%. The curtailment penalty for wind and PV generation is set to 500 CNY/MWh [29]. The initial SOC of the ESS is 0.5, and the DoD range is divided into 10 intervals. ESS units are installed at the interconnection buses of each park, and the following ESS configuration schemes are considered for comparative analysis:
Scheme 1: ESS participates only in time-of-use arbitrage, and the battery degradation cost is calculated using the traditional exchanged-power-based model [42].
Scheme 2: ESS participates only in time-of-use arbitrage, and the battery degradation cost is calculated using the proposed DoD-based model.
Scheme 3: ESS participates in multiple ancillary services (time-of-use arbitrage, demand charge management, demand response, renewable accommodation), and the battery degradation cost is calculated using the traditional exchanged-power-based model.
Scheme 4: ESS participates in multiple ancillary services, and the battery degradation cost is calculated using the proposed DoD-based model.
Schemes 1 and 3 are used as conventional benchmarks because they adopt the traditional exchanged-power-based degradation-cost model. All schemes use the same input data, share common physical and network constraints, and are solved with identical solver settings; differences across schemes are limited to the service portfolio and the degradation-cost modeling.
5.2. Results Analysis
5.2.1. Analysis of Energy Storage System Configuration Results
The optimal ESS configuration results are summarized in Table 7.
Table 7.
Optimal energy storage system configuration results for each scheme.
In the time-of-use-arbitrage-only case, Table 7 shows that Scheme 2 yields a smaller ESS than Scheme 1: the total energy capacity decreases from 42.67 to 41.32 MWh, and the total rated power decreases from 15.83 to 14.37 MW. This result indicates that internalizing degradation valuation through the proposed DoD-based lifetime model shifts the economically optimal operation toward less intensive cycling. As a consequence, a smaller investment scale is sufficient while feasibility is maintained.
Under multi-service participation, the optimal sizing shifts upward because the expanded operating requirements and value streams demand higher charge–discharge flexibility. Accordingly, Scheme 3 requires higher ratings than Scheme 1, reaching a total energy capacity of 48.34 MWh and a total rated power of 19.46 MW. When the DoD-based degradation cost is further incorporated into the multi-service setting, Scheme 4 reduces both ratings relative to Scheme 3: the total energy capacity decreases from 48.34 to 44.87 MWh, and the total rated power decreases from 19.46 to 17.44 MW. This reduction is driven by degradation-aware valuation, which discourages overly aggressive cycling. Overall, the contrasts in Table 7 provide direct evidence that optimal power and energy sizing shifts with changes in the operational feasibility set and degradation representation, thereby linking operational considerations to investment-scale outcomes.
5.2.2. Operational Lifetime Analysis of the Energy Storage System
- (1)
- Operating Strategy Analysis
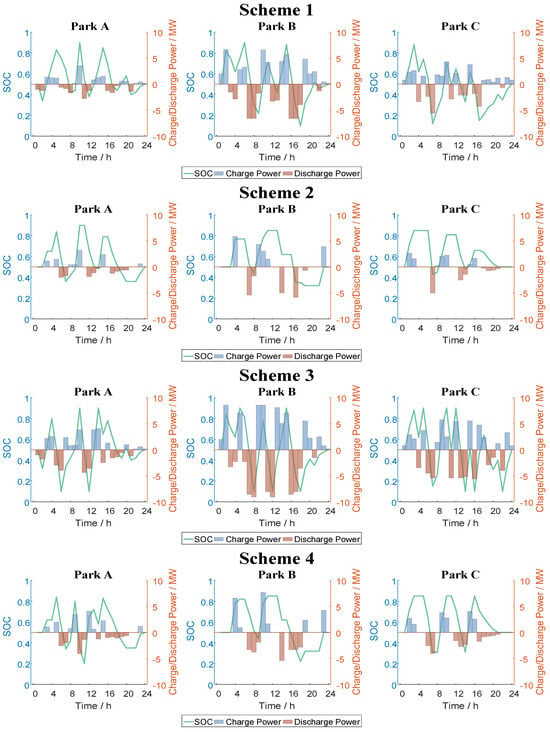
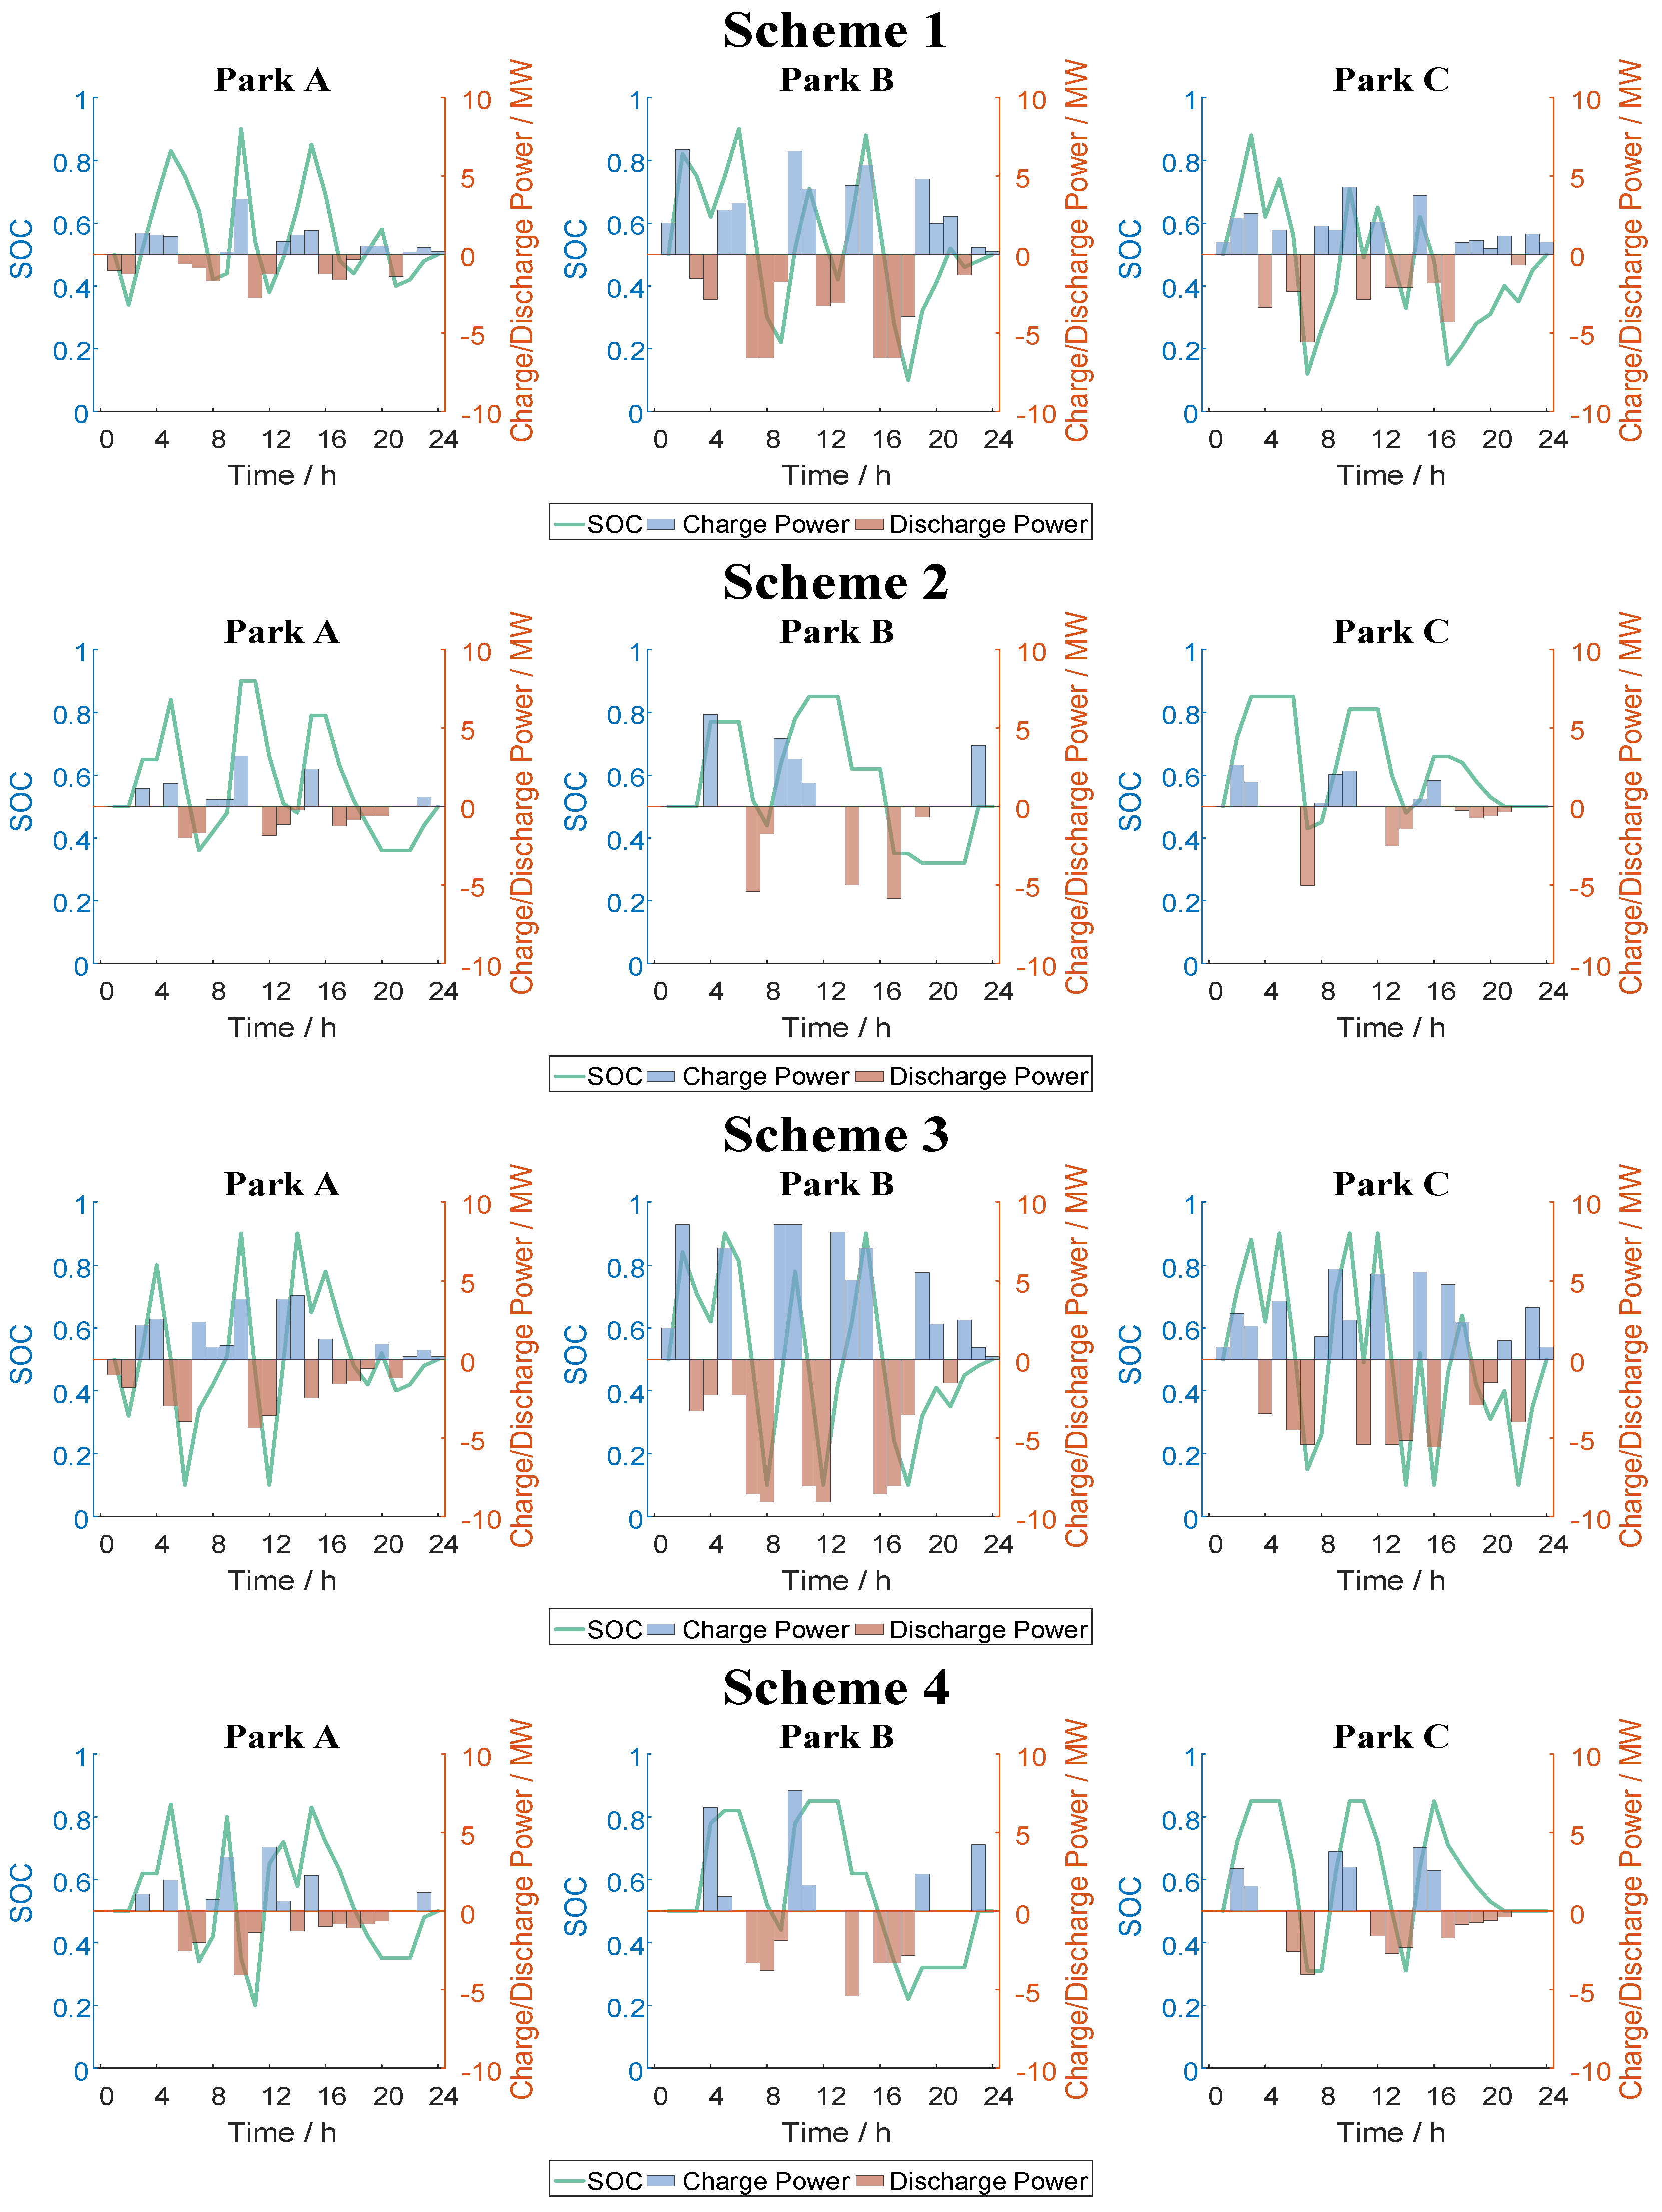
From an operational perspective, the ESS charge–discharge power and SOC trajectories under each scheme are depicted in Figure 7.
Figure 7.
Operating strategies of the energy storage system under each scheme.
As shown in Figure 7, when only time-of-use arbitrage is considered, Scheme 1 does not impose any constraint on equivalent lifetime loss. As a result, the optimizer tends to pursue maximum revenue from the price spread through frequent charge–discharge behaviors. The SOC of the ESS swings widely between the upper and lower bounds, with many cycles and deeper discharges, which accelerates battery degradation. In contrast, Scheme 2 introduces an upper bound on equivalent lifetime loss in the constraints and adds a corresponding degradation cost term to the objective function. Under this setting, frequent cycling and deep discharge are treated as high-cost behaviors. The optimal schedule sacrifices part of the arbitrage profit in favor of fewer cycles and shallower discharges. This extends battery lifetime and reduces life-cycle operating costs.
When the ESS is scheduled to participate in multiple types of ancillary services simultaneously, its dispatch becomes more flexible. In Scheme 3, the resulting SOC trajectories fluctuate frequently between the upper and lower thresholds and exhibit deep charge–discharge behaviors close to the limits. Although this operating strategy can deliver higher short-term revenues, it also significantly accelerates battery degradation and entails safety risks associated with overcharge and overdischarge. By contrast, Scheme 4 imposes battery degradation constraints under the concurrent provision of multi-service and jointly optimizes ancillary service revenues and degradation costs. Its SOC trajectories are noticeably smoother with smaller power swings; deep charge-discharge is effectively suppressed, and the corresponding equivalent lifetime loss is lower, which helps control battery degradation costs during multi-service operation.
- (2)
- Battery Lifetime Analysis
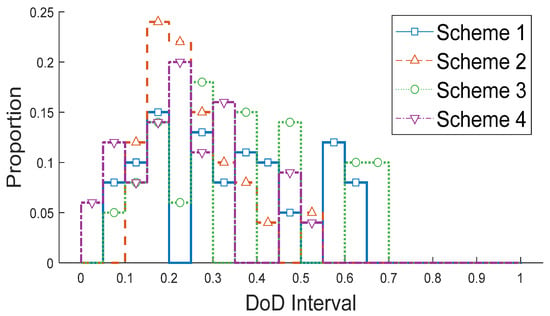
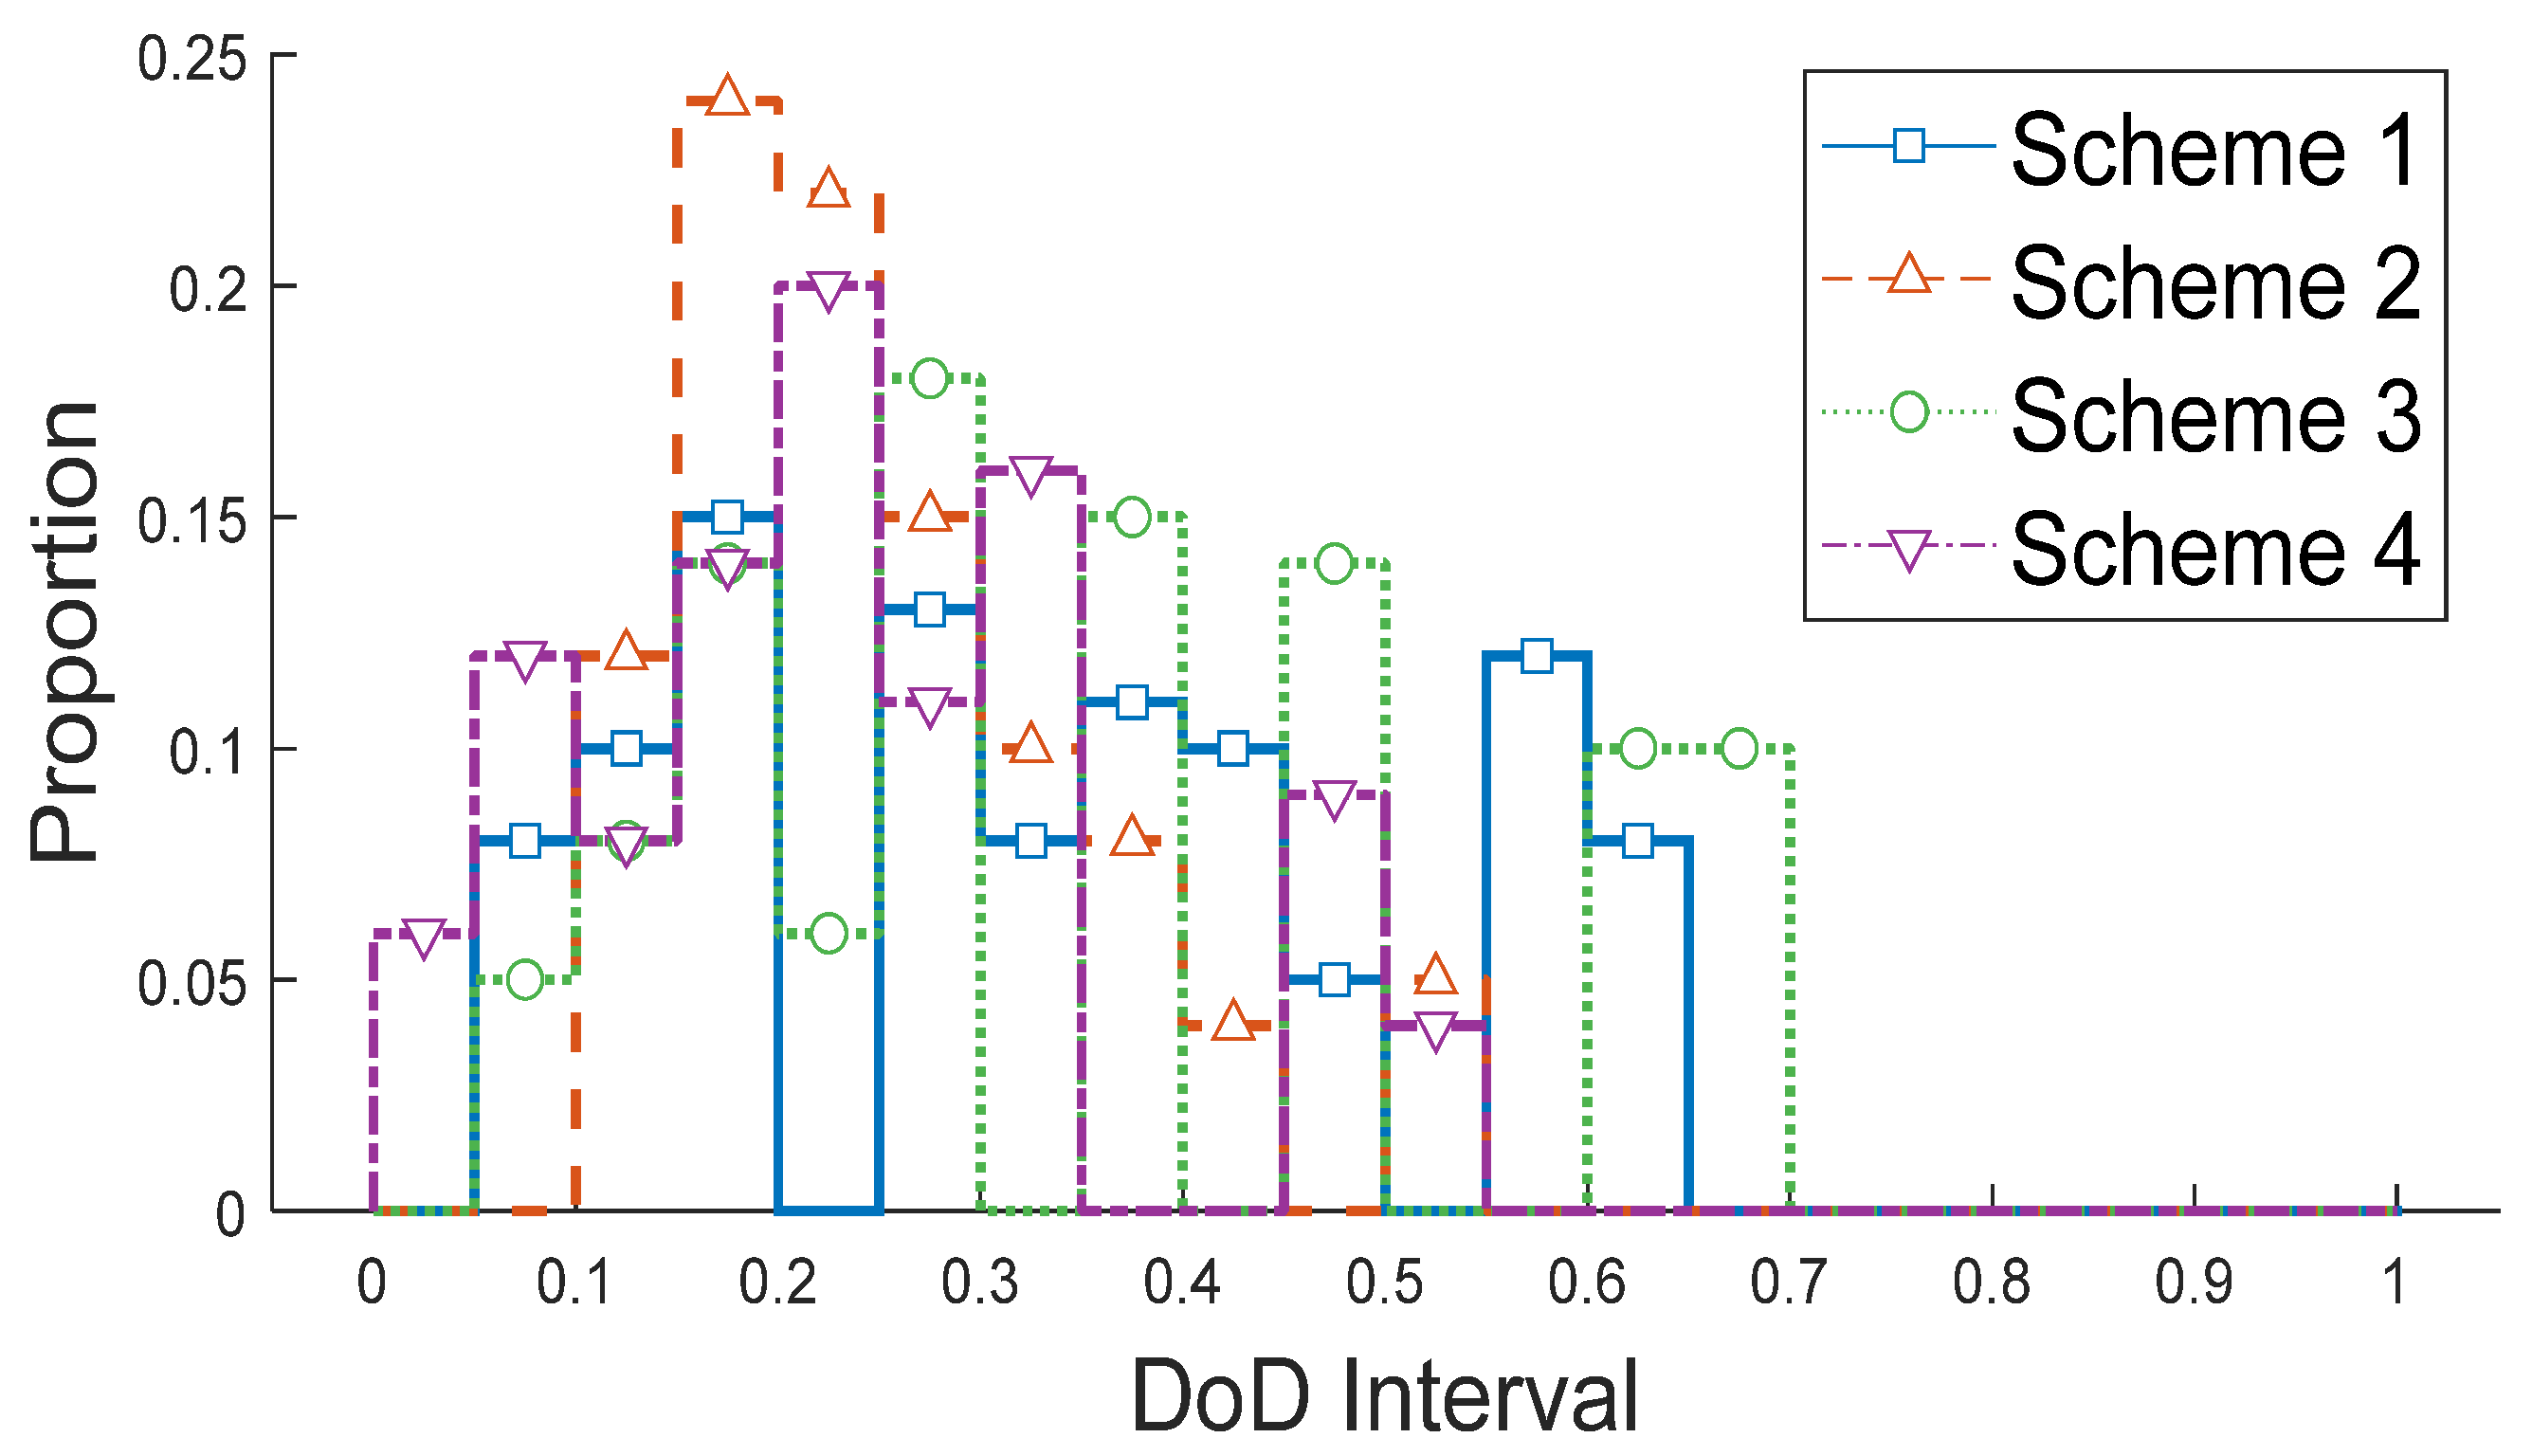
To further quantify the operational lifetime of the ESS, the distribution of daily operating DoD intervals under each scheme is statistically analyzed, as shown in Figure 8.
Figure 8.
Daily operating depth of discharge distribution.
From the daily operating DoD distribution, deep discharge intervals appear mainly in Schemes 1 and 3, whereas Schemes 2 and 4 are concentrated in the 0.1–0.5 DoD range. This distribution confirms that the proposed equivalent battery lifetime model leads to an operating strategy dominated by shallow charge–discharge cycles.
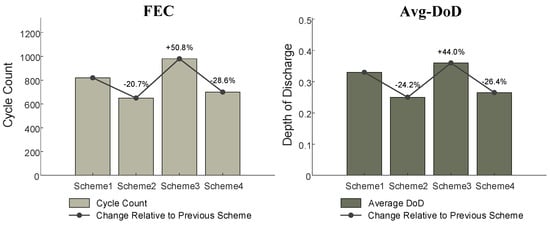
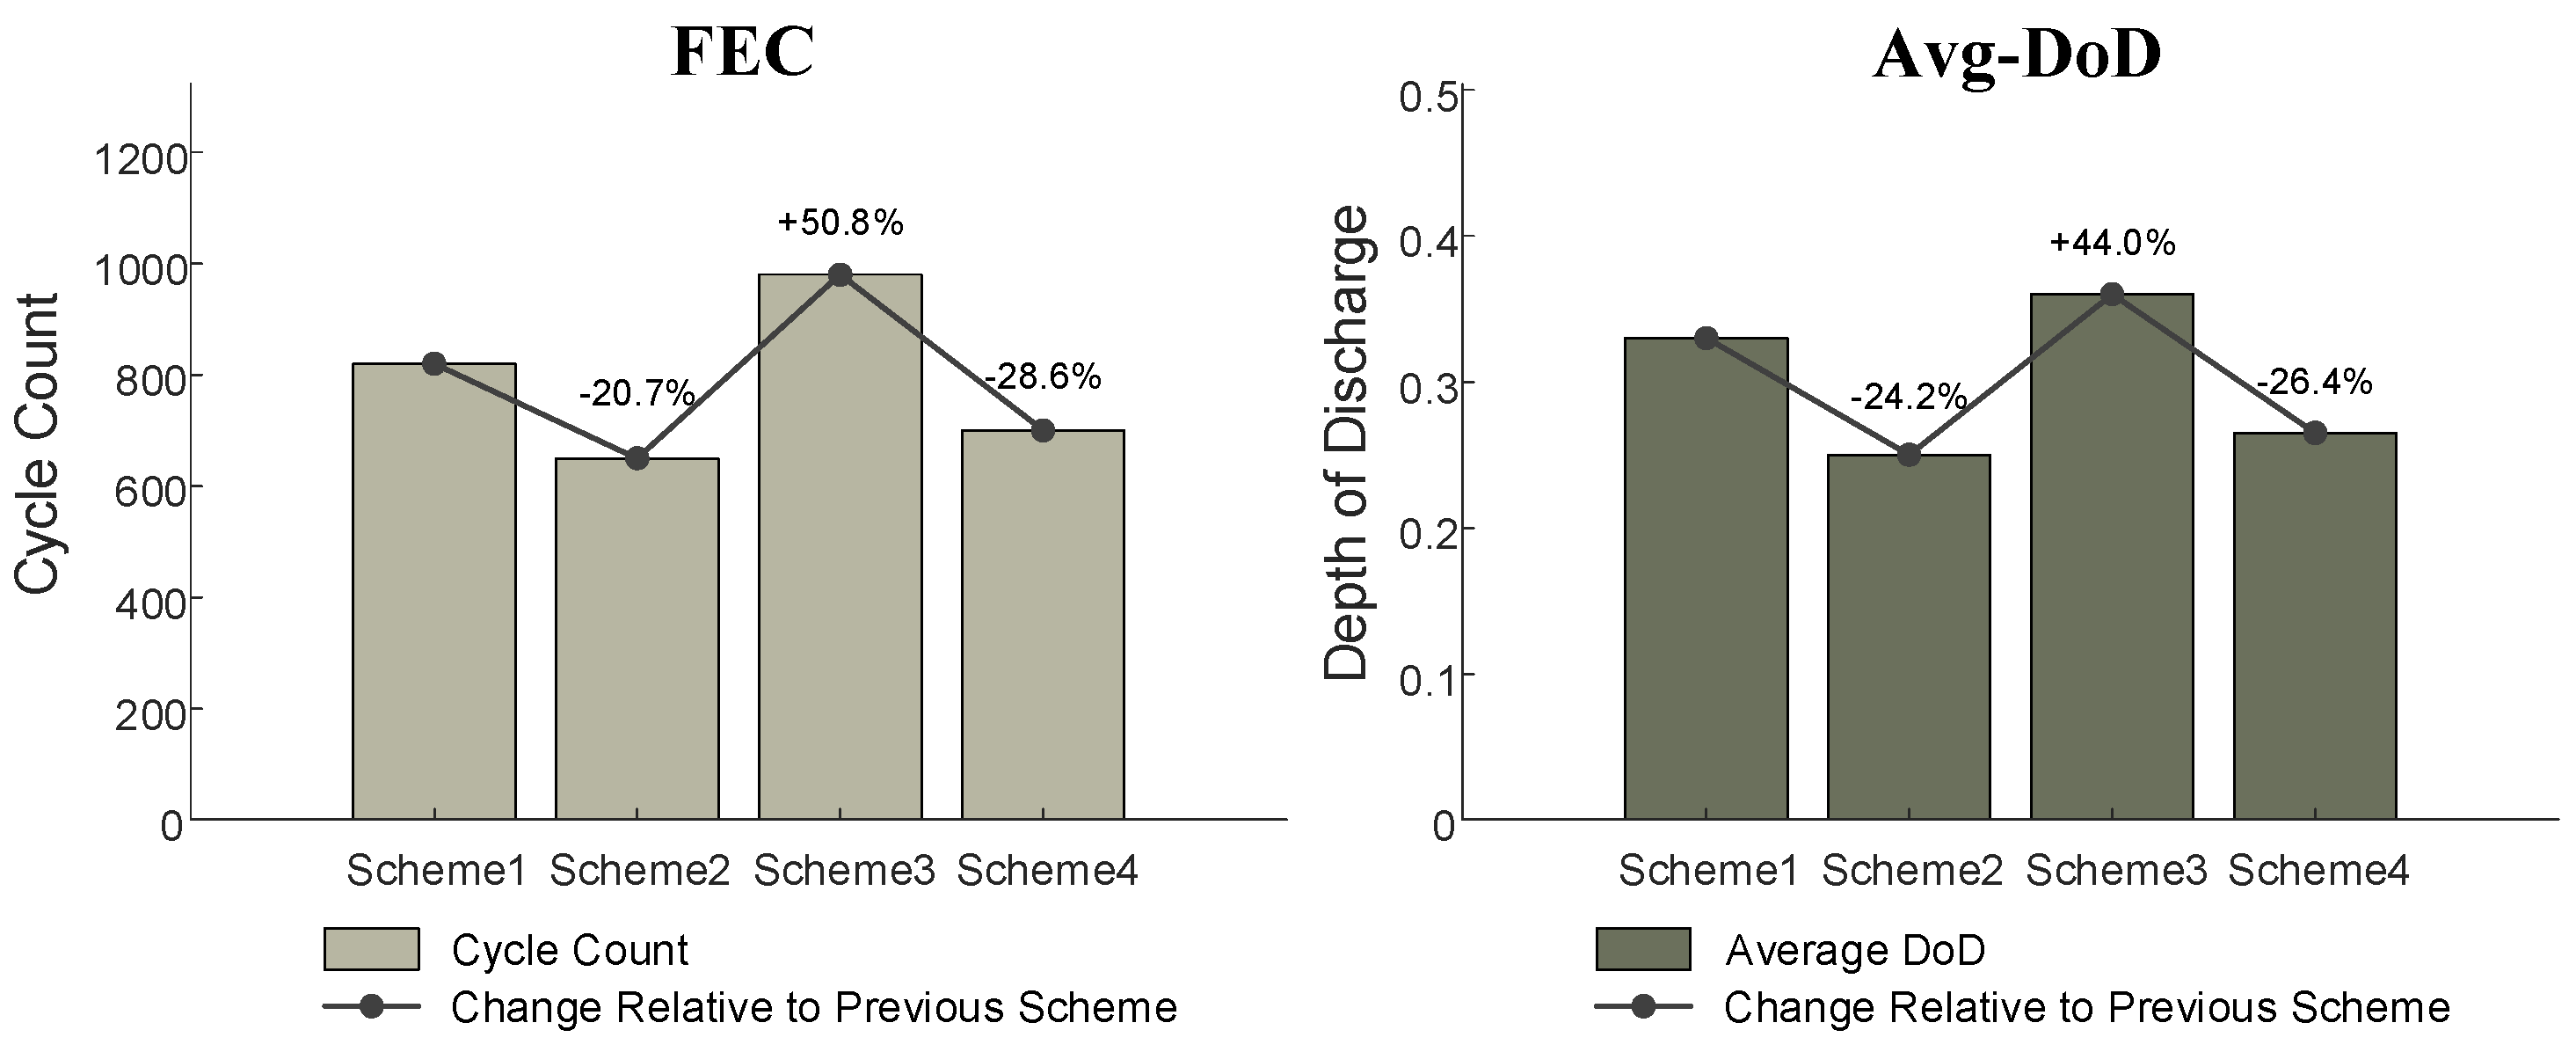
On this basis, the operational lifetime of the ESS is further evaluated using two indicators: the annual full-equivalent cycle count (FEC) and the annual average depth of discharge (Avg-DoD). The calculation formulas are given in Table 8, and the comparative results for the schemes are shown in Figure 9.
Table 8.
Annual operating lifetime evaluation indicators.
Figure 9.
Comparison of FEC and Avg-DoD in different schemes.
Figure 9 shows that, compared with Schemes 1 and 3, which ignore battery degradation, Schemes 2 and 4, which incorporate DoD-based degradation cost modeling, exhibit markedly lower values of both FEC and Avg-DoD. Specifically, relative to Scheme 1, Scheme 2 reduces FEC by 20.7% and Avg-DoD by 24.2%; relative to Scheme 3, Scheme 4 reduces FEC by 28.6% and Avg-DoD by 26.4%. Lower FEC and Avg-DoD indicate fewer battery replacements and lower depreciation expenditure over the project horizon, thereby improving life-cycle economic performance. Hence, the proposed DoD-based lifetime cost model changes the optimal dispatch strategy of the ESS and substantially improves the life-cycle economics of the ESS configuration schemes.
5.2.3. Life-Cycle Economic Analysis of Energy Storage System
- (1)
- Cost and Benefit Analysis
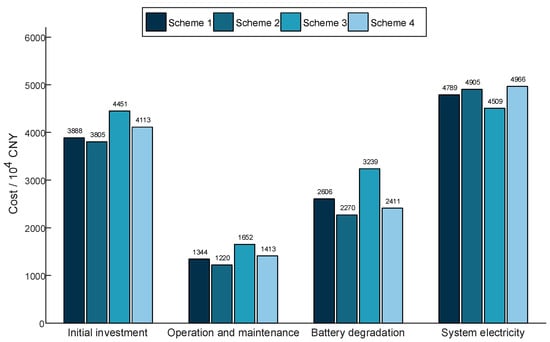
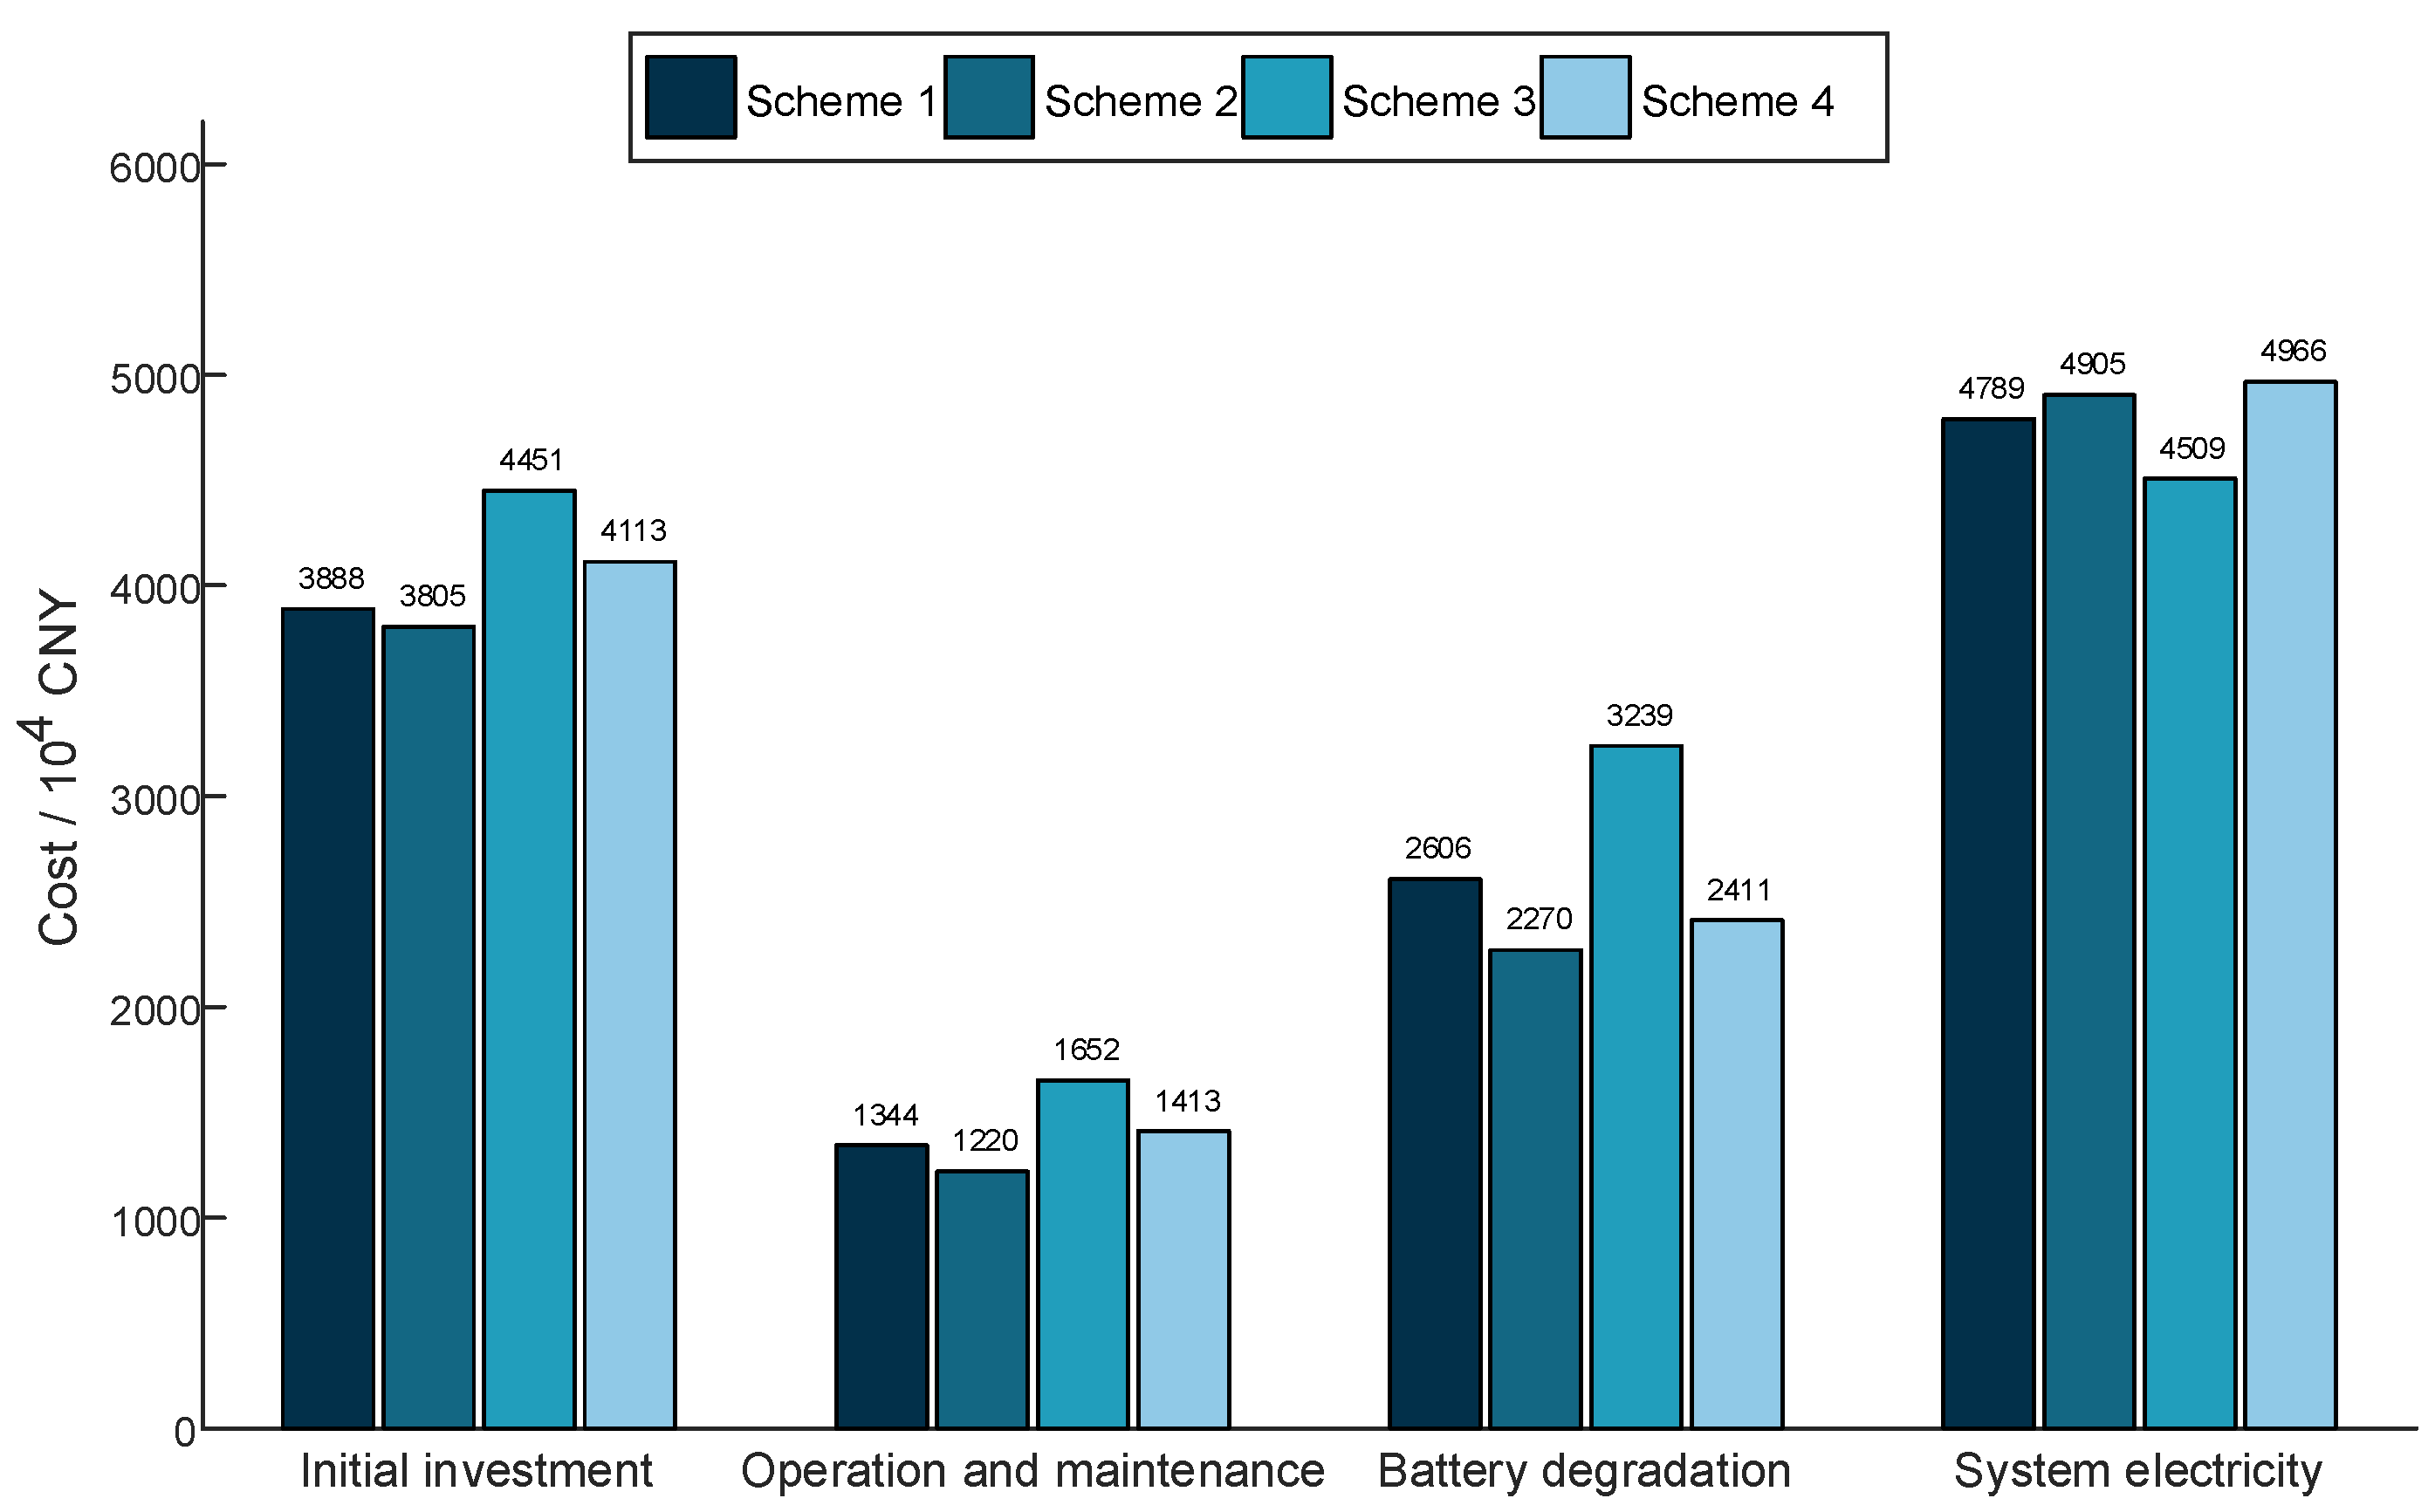
At both the planning and operational levels, this subsection evaluates the life-cycle economics of the ESS from initial sizing through retirement. The life-cycle cost components of each scheme and the corresponding ancillary service revenues are summarized in Figure 10 and Table 9, respectively.
Figure 10.
Life-cycle cost of each scheme.
Table 9.
Life-cycle ancillary services revenues of each scheme.
As shown in Figure 10, regardless of whether the ESS participates only in time-of-use arbitrage or simultaneously in multiple ancillary services, the schemes that adopt the proposed DoD-based lifetime cost model incur lower initial investment, O&M, and battery degradation costs than those based on the conventional model. This reduces the financial burden of ESS investment and operation, and enhances the life-cycle economic performance of the schemes.
According to Table 9, the total ancillary service revenue in Scheme 3 is CNY 16.34 million higher than that in Scheme 1, while Scheme 4 yields 12.28% higher total revenue than Scheme 2. These results indicate that enabling the ESS to participate in multiple ancillary services at the operational level can substantially boost operating revenue. The diversified revenue channels also improve the adaptability of the ESS under different load and renewable generation conditions.
Compared with Scheme 3, Scheme 4 adopts the proposed DoD-based lifetime cost model for multi-service operation, which discourages deep cycling. Consequently, the time-of-use arbitrage and demand charge management revenues decrease by 9.5% and 16.5%, respectively, whereas the demand response and renewable accommodation revenues increase by 7.3% and 6.8%, respectively. This shift occurs because the DoD-based cost raises the marginal penalty of deep cycles, reducing the economic attractiveness of aggressive peak–valley energy shifting and intensive peak shaving. As a result, the optimizer limits energy throughput and avoids deep charge–discharge events. It also preserves SOC headroom, improving flexibility for demand response provision and surplus renewable absorption over the day.
Overall, the proposed DoD-based lifetime cost model suppresses excessively deep charge–discharge behavior and thus helps control battery investment, O&M, and degradation-related costs over the life-cycle. On this basis, participation in multiple ancillary services further increases ancillary service revenues compared with the baseline schemes, leading to a more balanced and economically robust revenue portfolio.
- (2)
- Evaluation of Economic Indicators
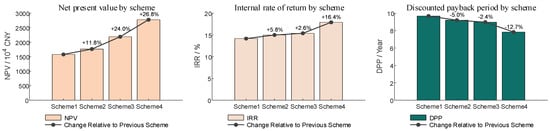
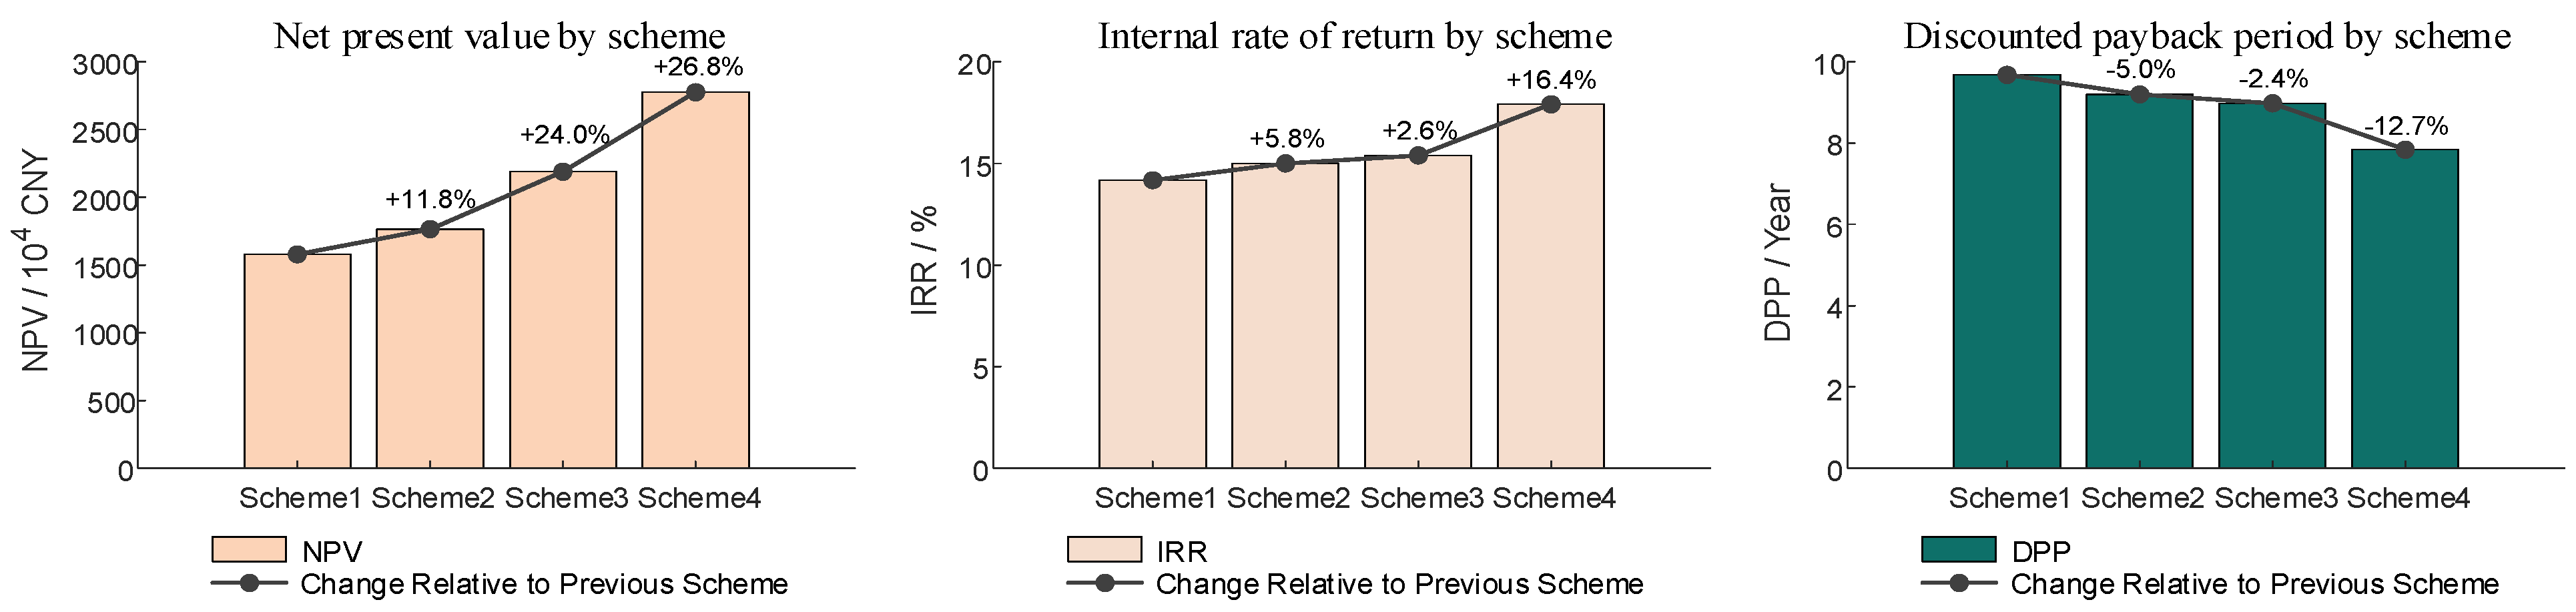
Taking all cost and revenue categories into account, the economic performance of each scheme is evaluated using the indicators defined in Table 10. The corresponding results are presented in Figure 11.
Table 10.
Economic evaluation indicators.
Figure 11.
Economic evaluation results of each scheme.
Figure 11 shows that, when the ESS participates only in time-of-use arbitrage, Scheme 2 increases NPV by 11.8% and IRR by 5.8%, and shortens DPP by 5% compared with Scheme 1. Under multi-service operation, Scheme 4 increases NPV and IRR by 26.8% and 16.4%, respectively, and shortens DPP by 12.7% relative to Scheme 3. These results indicate that combining multiple ancillary service revenues with a more refined evaluation of equivalent battery lifetime leads to ESS configurations with superior life-cycle economic performance.
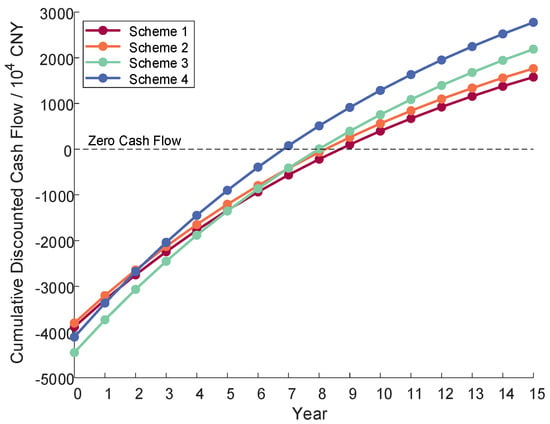
Moreover, Scheme 4 attains the shortest DPP, which indicates that the proposed configuration strikes a better balance between multiple ancillary service revenues and life-cycle costs, thereby lowering investment recovery risk. The cumulative discounted cash flows of all schemes are shown in Figure 12.
Figure 12.
Cumulative discounted cash flow of each scheme.
According to Figure 12, the discounted cash flow curve of Scheme 4 is the first to cross the zero-cash flow line, meaning that Scheme 4 achieves a positive discounted cash flow earlier than the other schemes. Thereafter, the curve of Scheme 4 maintains the steepest slope, indicating that its net cash flow grows fastest over the remaining project lifetime and ultimately yields the highest cumulative discounted cash flow. Scheme 4 therefore combines a shorter payback period in the early stage with higher returns in the later stage. These findings show that the proposed model extracts benefits from both capacity planning and operational dispatch. As a result, the obtained configuration achieves a shorter investment recovery period and a higher life-cycle net present value, which reduces project investment risk and supports the economic soundness of the scheme over the full life-cycle.
5.2.4. Computational Performance and Feasibility Analysis
The results for the model solved with the McCormick envelope relaxation and with the direct formulation are summarized in Table 11.
Table 11.
Solution results with and without relaxation.
Table 11 compares the objective value, optimality gap, and solve time of the relaxed and original formulations for each scheme. The McCormick-relaxed formulation produces objective values within 0.02% of the original formulation, indicating that the relaxation preserves the optimal solution to a high degree. Moreover, it consistently reduces solve time across all schemes. Overall, the McCormick-envelope relaxation achieves high accuracy with much lower runtime, demonstrating the numerical stability and computational efficiency of the proposed model, and supporting its practical feasibility in engineering applications. From a scalability standpoint, the computational size mainly increases with the dispatch time resolution and the number of service-specific variables and constraints, whereas the long-term planning horizon is reflected in the discounted cash flow evaluation and does not directly enlarge the optimization time grid.
5.2.5. Sensitivity and Robustness Analysis
- (1)
- Economic Parameter Sensitivity Analysis
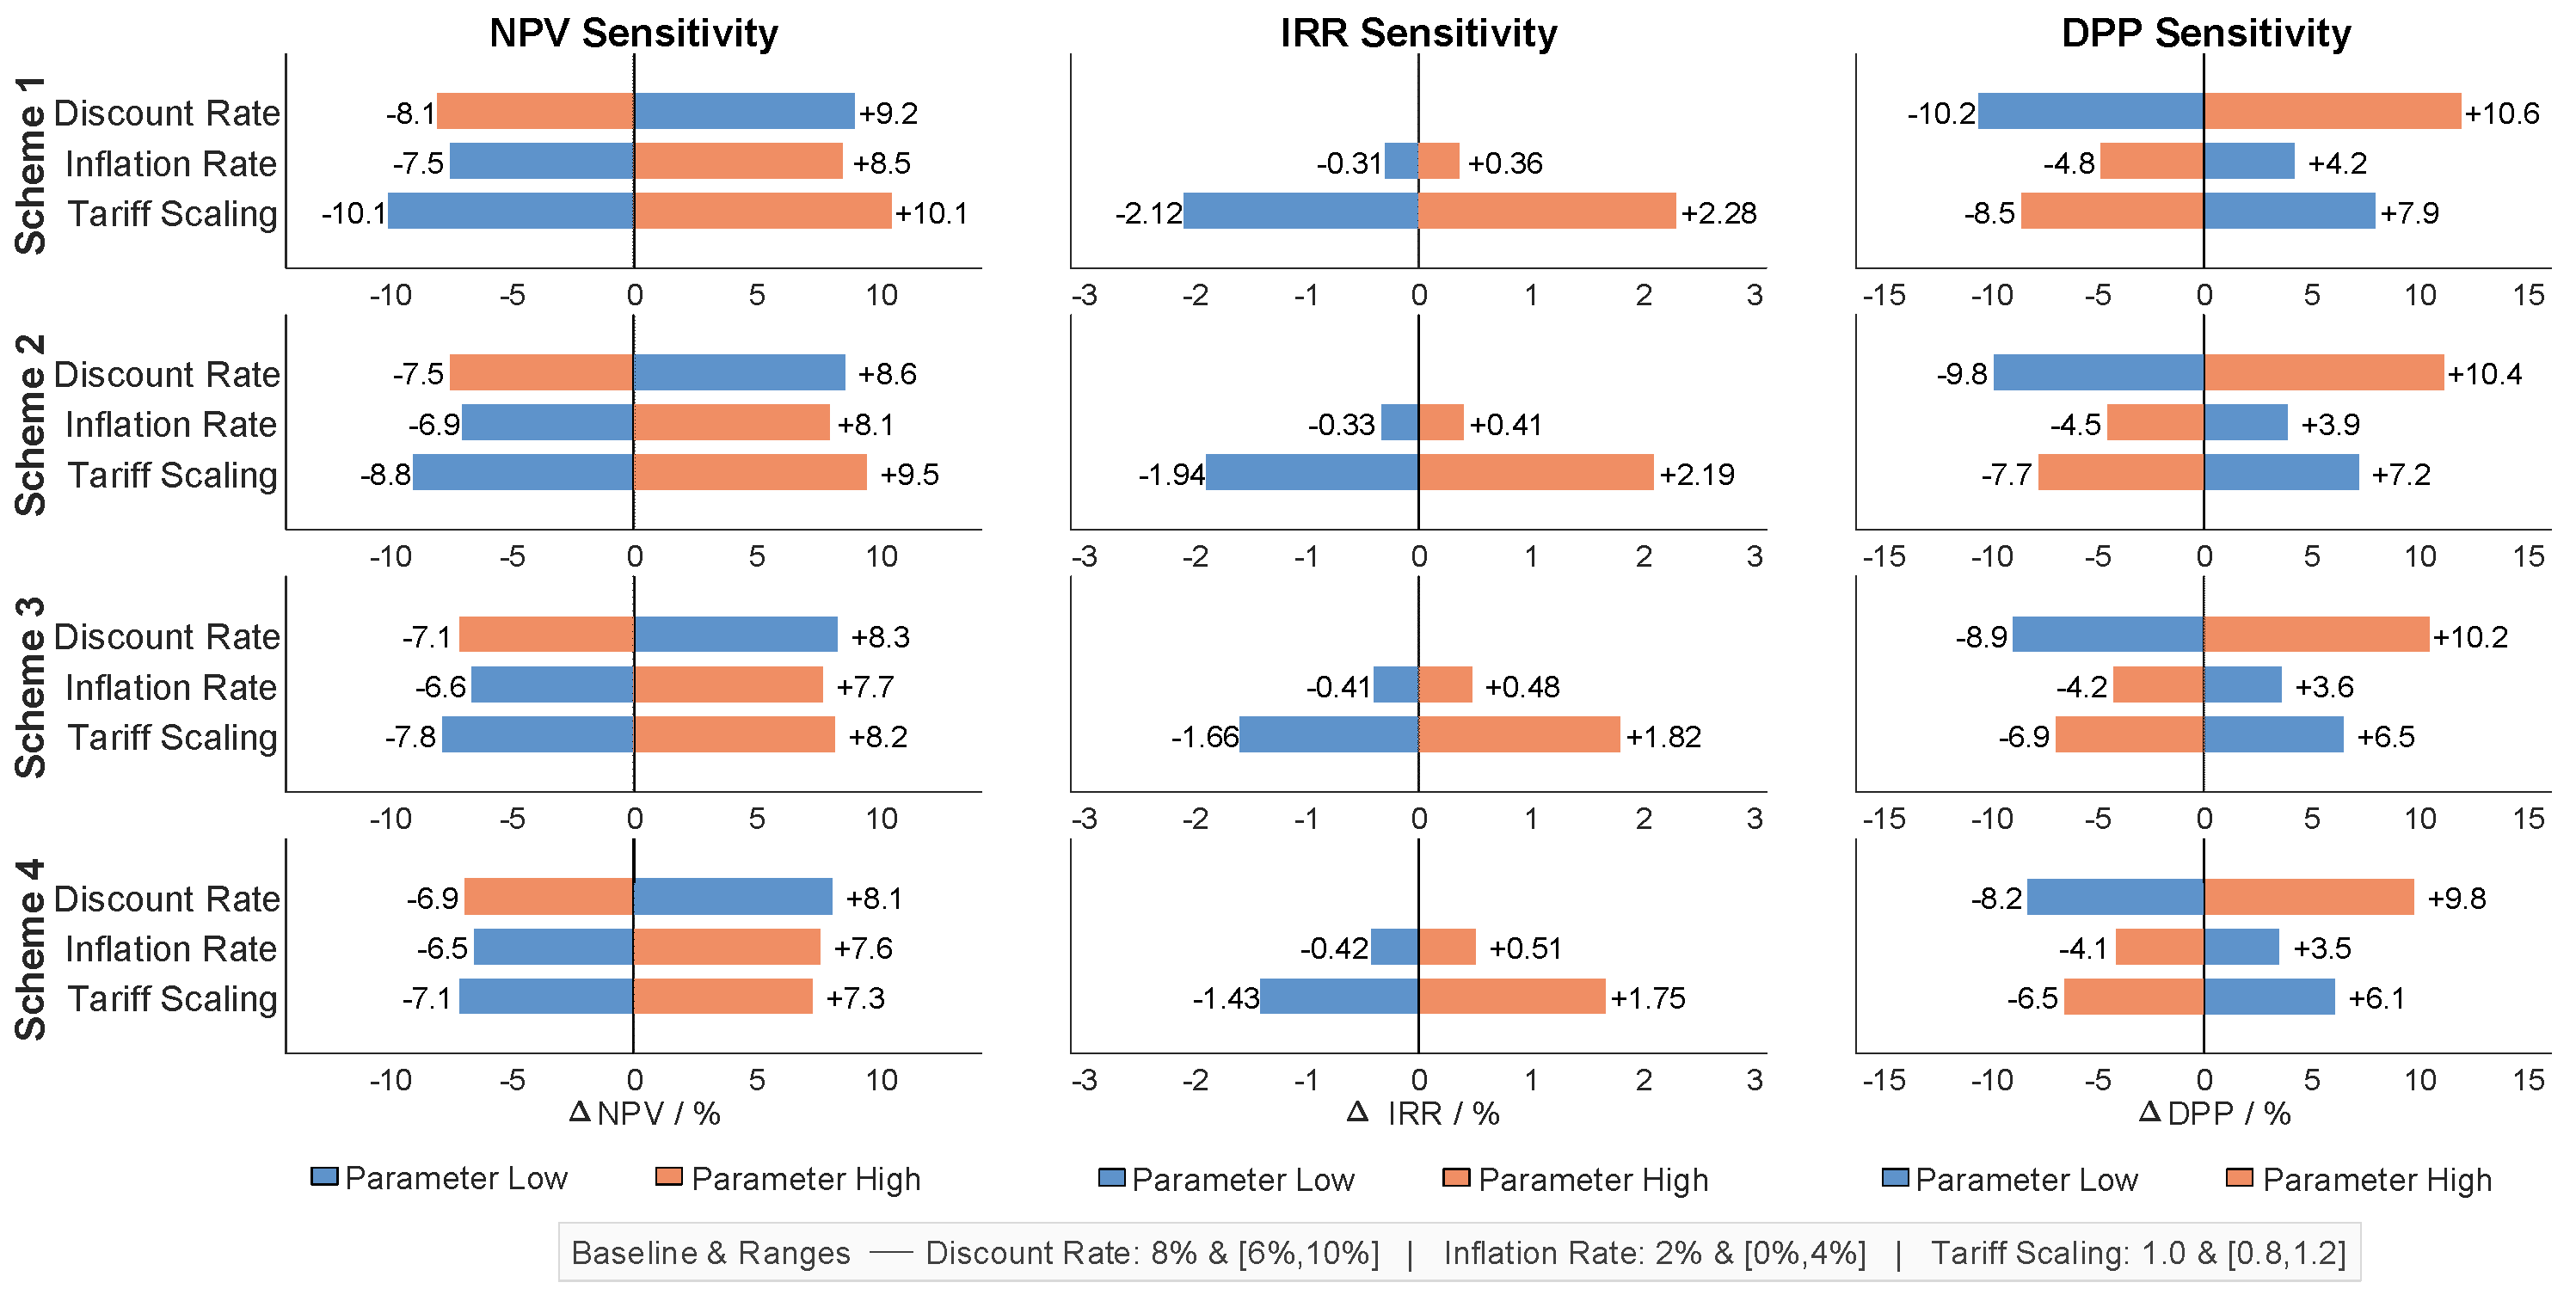
To examine the sensitivity and robustness of the proposed model to parameter variations, the optimization problem is solved under different discount rates, inflation rates, and tariff structures. Following the settings for economic assessment of ESS projects in Refs. [2,43,44], the baseline discount rate and inflation rate are set to 8% and 2%, with variation ranges of 6–10% and 0–4%, respectively. The tariff scaling factor is varied from 0.8 to 1.2 to represent fluctuations in time-of-use prices and the uncertainty associated with future tariff reforms. Sensitivity analyses are conducted for all schemes, and the results are shown in Figure 13.
Figure 13.
Economic parameter sensitivity analysis for all schemes.
Figure 13 summarizes the single-parameter sensitivities of Schemes 1–4 under the specified ranges of discount rate, inflation rate, and tariff scaling. Across all schemes, the discount rate is the primary driver of NPV and DPP. Increasing the discount rate reduces NPV and prolongs DPP, whereas decreasing it improves both metrics. The tariff scaling factor has the strongest impact on IRR, and also causes noticeable changes in NPV and DPP, reflecting the dependence of revenue stacking on time-of-use price levels. Inflation plays a secondary role. Higher inflation generally increases NPV and shortens DPP, while its effect on IRR remains limited.
Among the four schemes, Scheme 4 exhibits the smallest overall sensitivity. Its NPV variations remain within approximately ±8–10%. Its IRR changes are mainly driven by tariff scaling within about 1.4–2.3%. Its DPP variations remain within about ±10%. Overall, the co-optimized configuration maintains stable economic performance under plausible parameter fluctuations, supporting the robustness of the life-cycle conclusions.
- (2)
- Load and Renewable Parameter Sensitivity Analysis
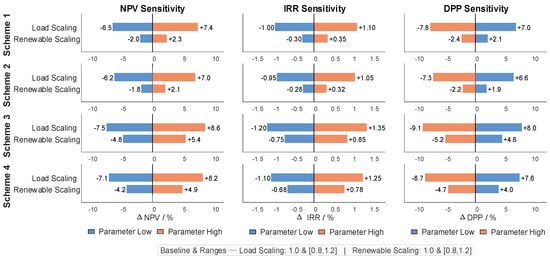
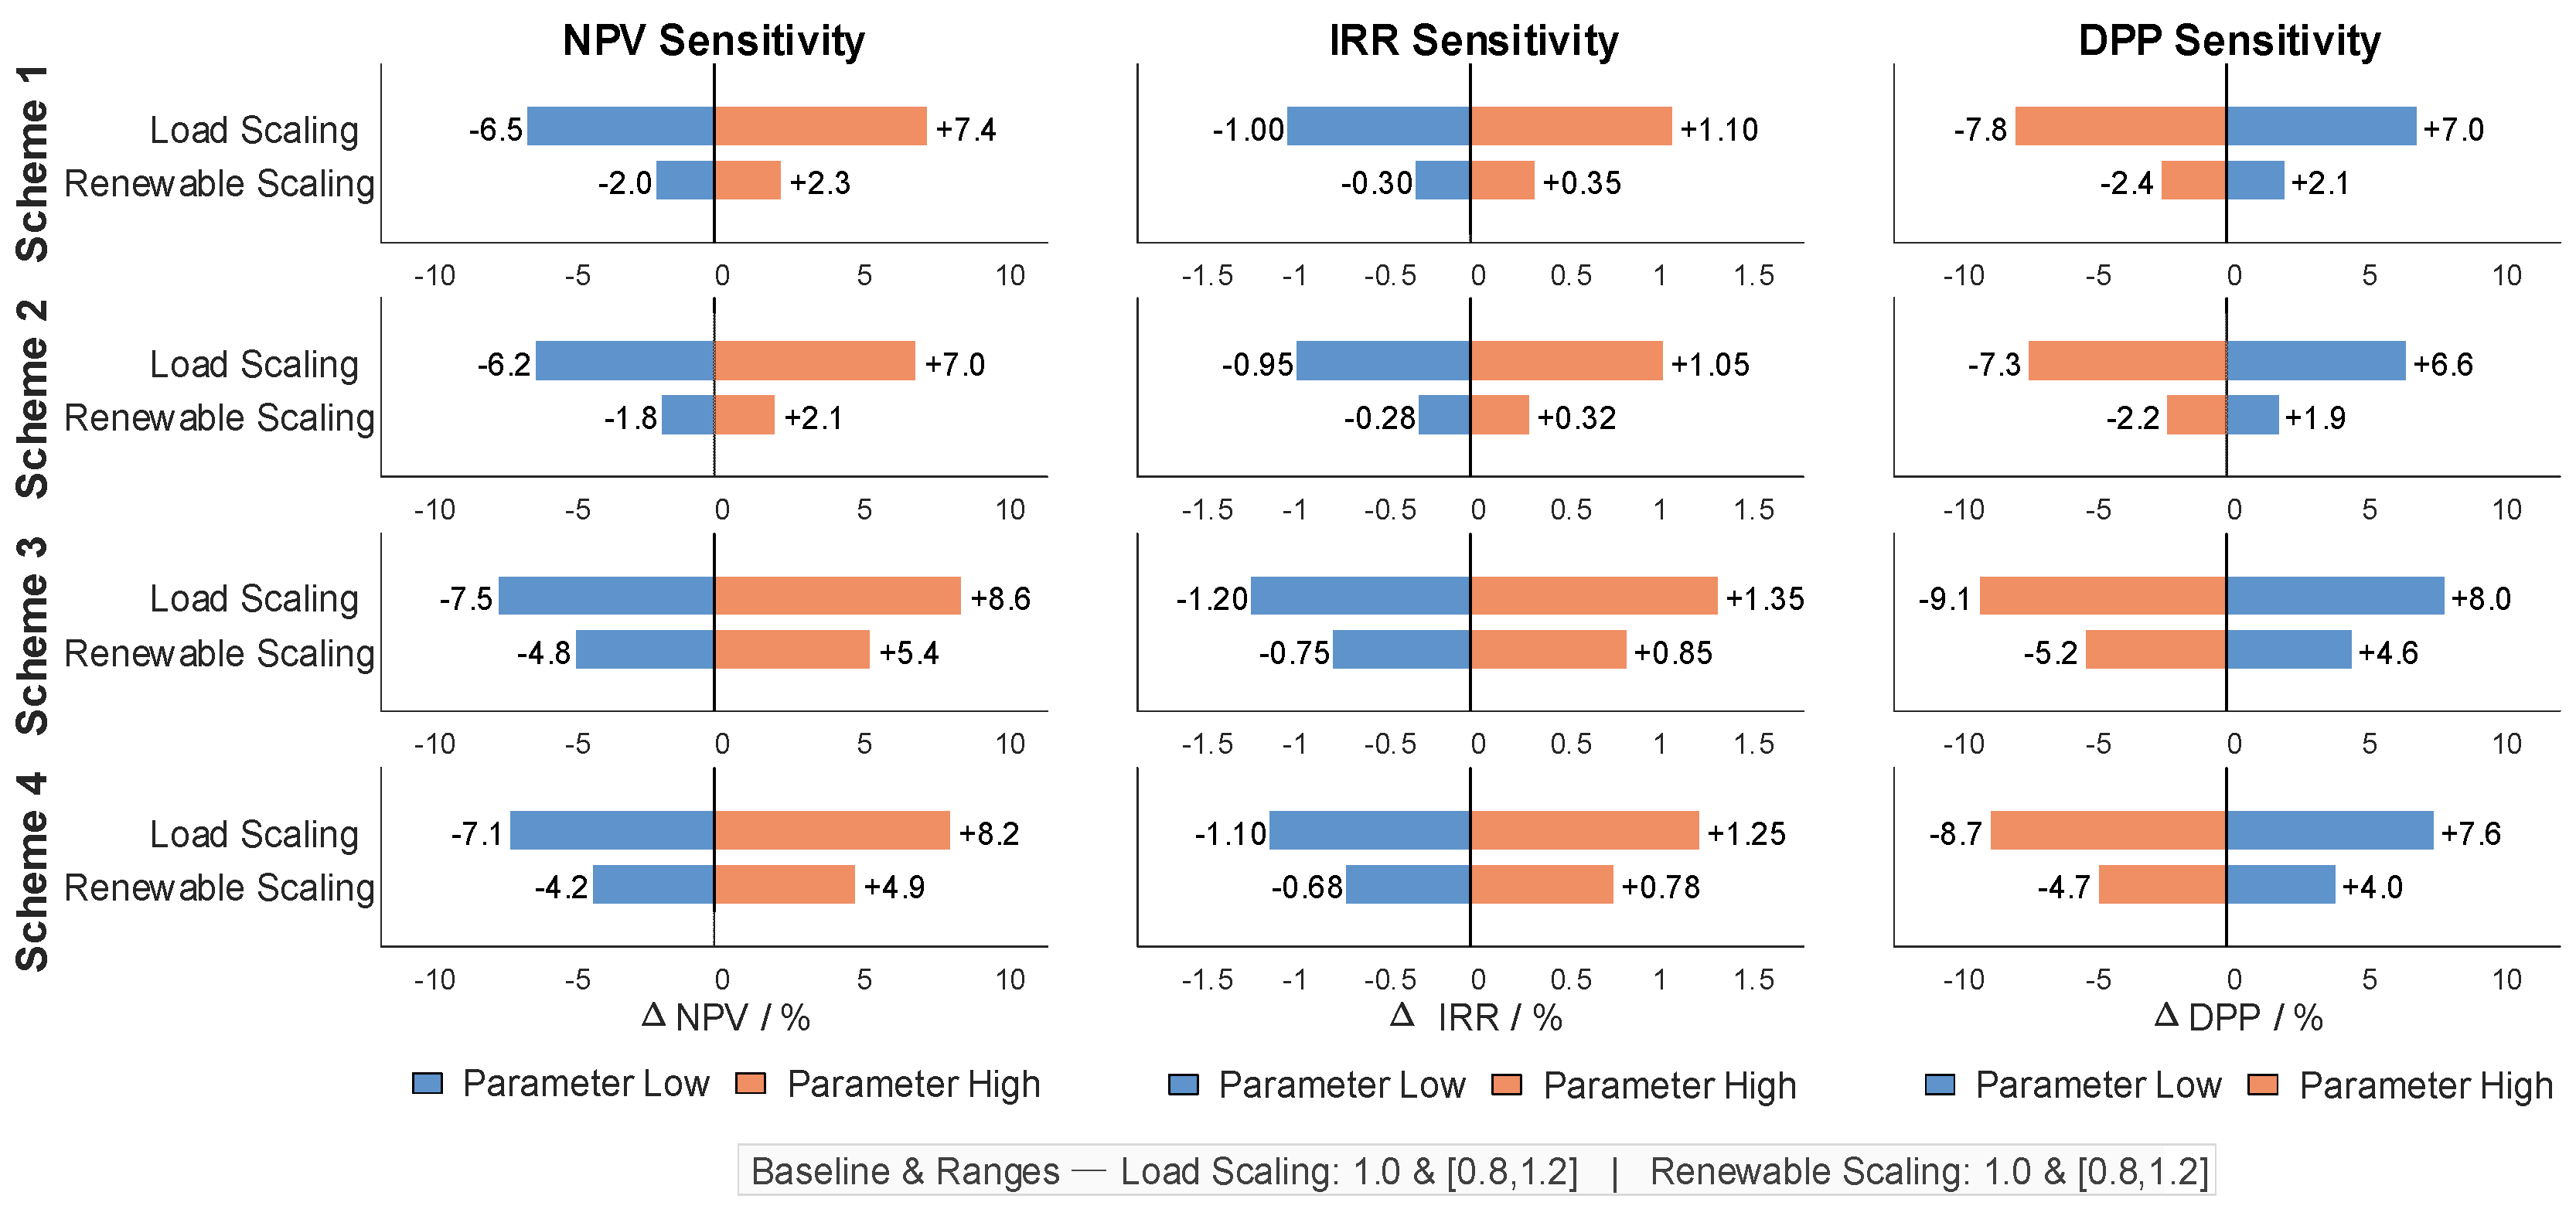
To evaluate the sensitivity of the model to operational variability, the load scaling factor and the renewable output scaling factor are varied within 0.8–1.2, and Figure 14 reports the resulting changes in NPV, IRR, and DPP for all schemes.
Figure 14.
Load and renewable parameter sensitivity analysis for all schemes.
As shown in Figure 14, within the tested scaling range of 0.8–1.2, the economic indicators of all schemes remain stable under load and renewable variability. Load variations generally lead to larger changes than renewable variations, and Scheme 4 exhibits the mildest response. Across all schemes, the changes in NPV and DPP remain within ±10%, and the deviation in IRR is within ±1.5%, indicating that the main conclusions are robust under plausible operating-condition perturbations.
- (3)
- Multi-Parameter Robustness Analysis
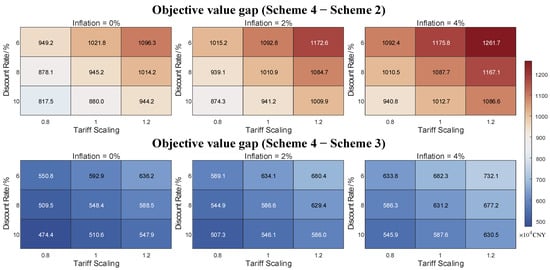
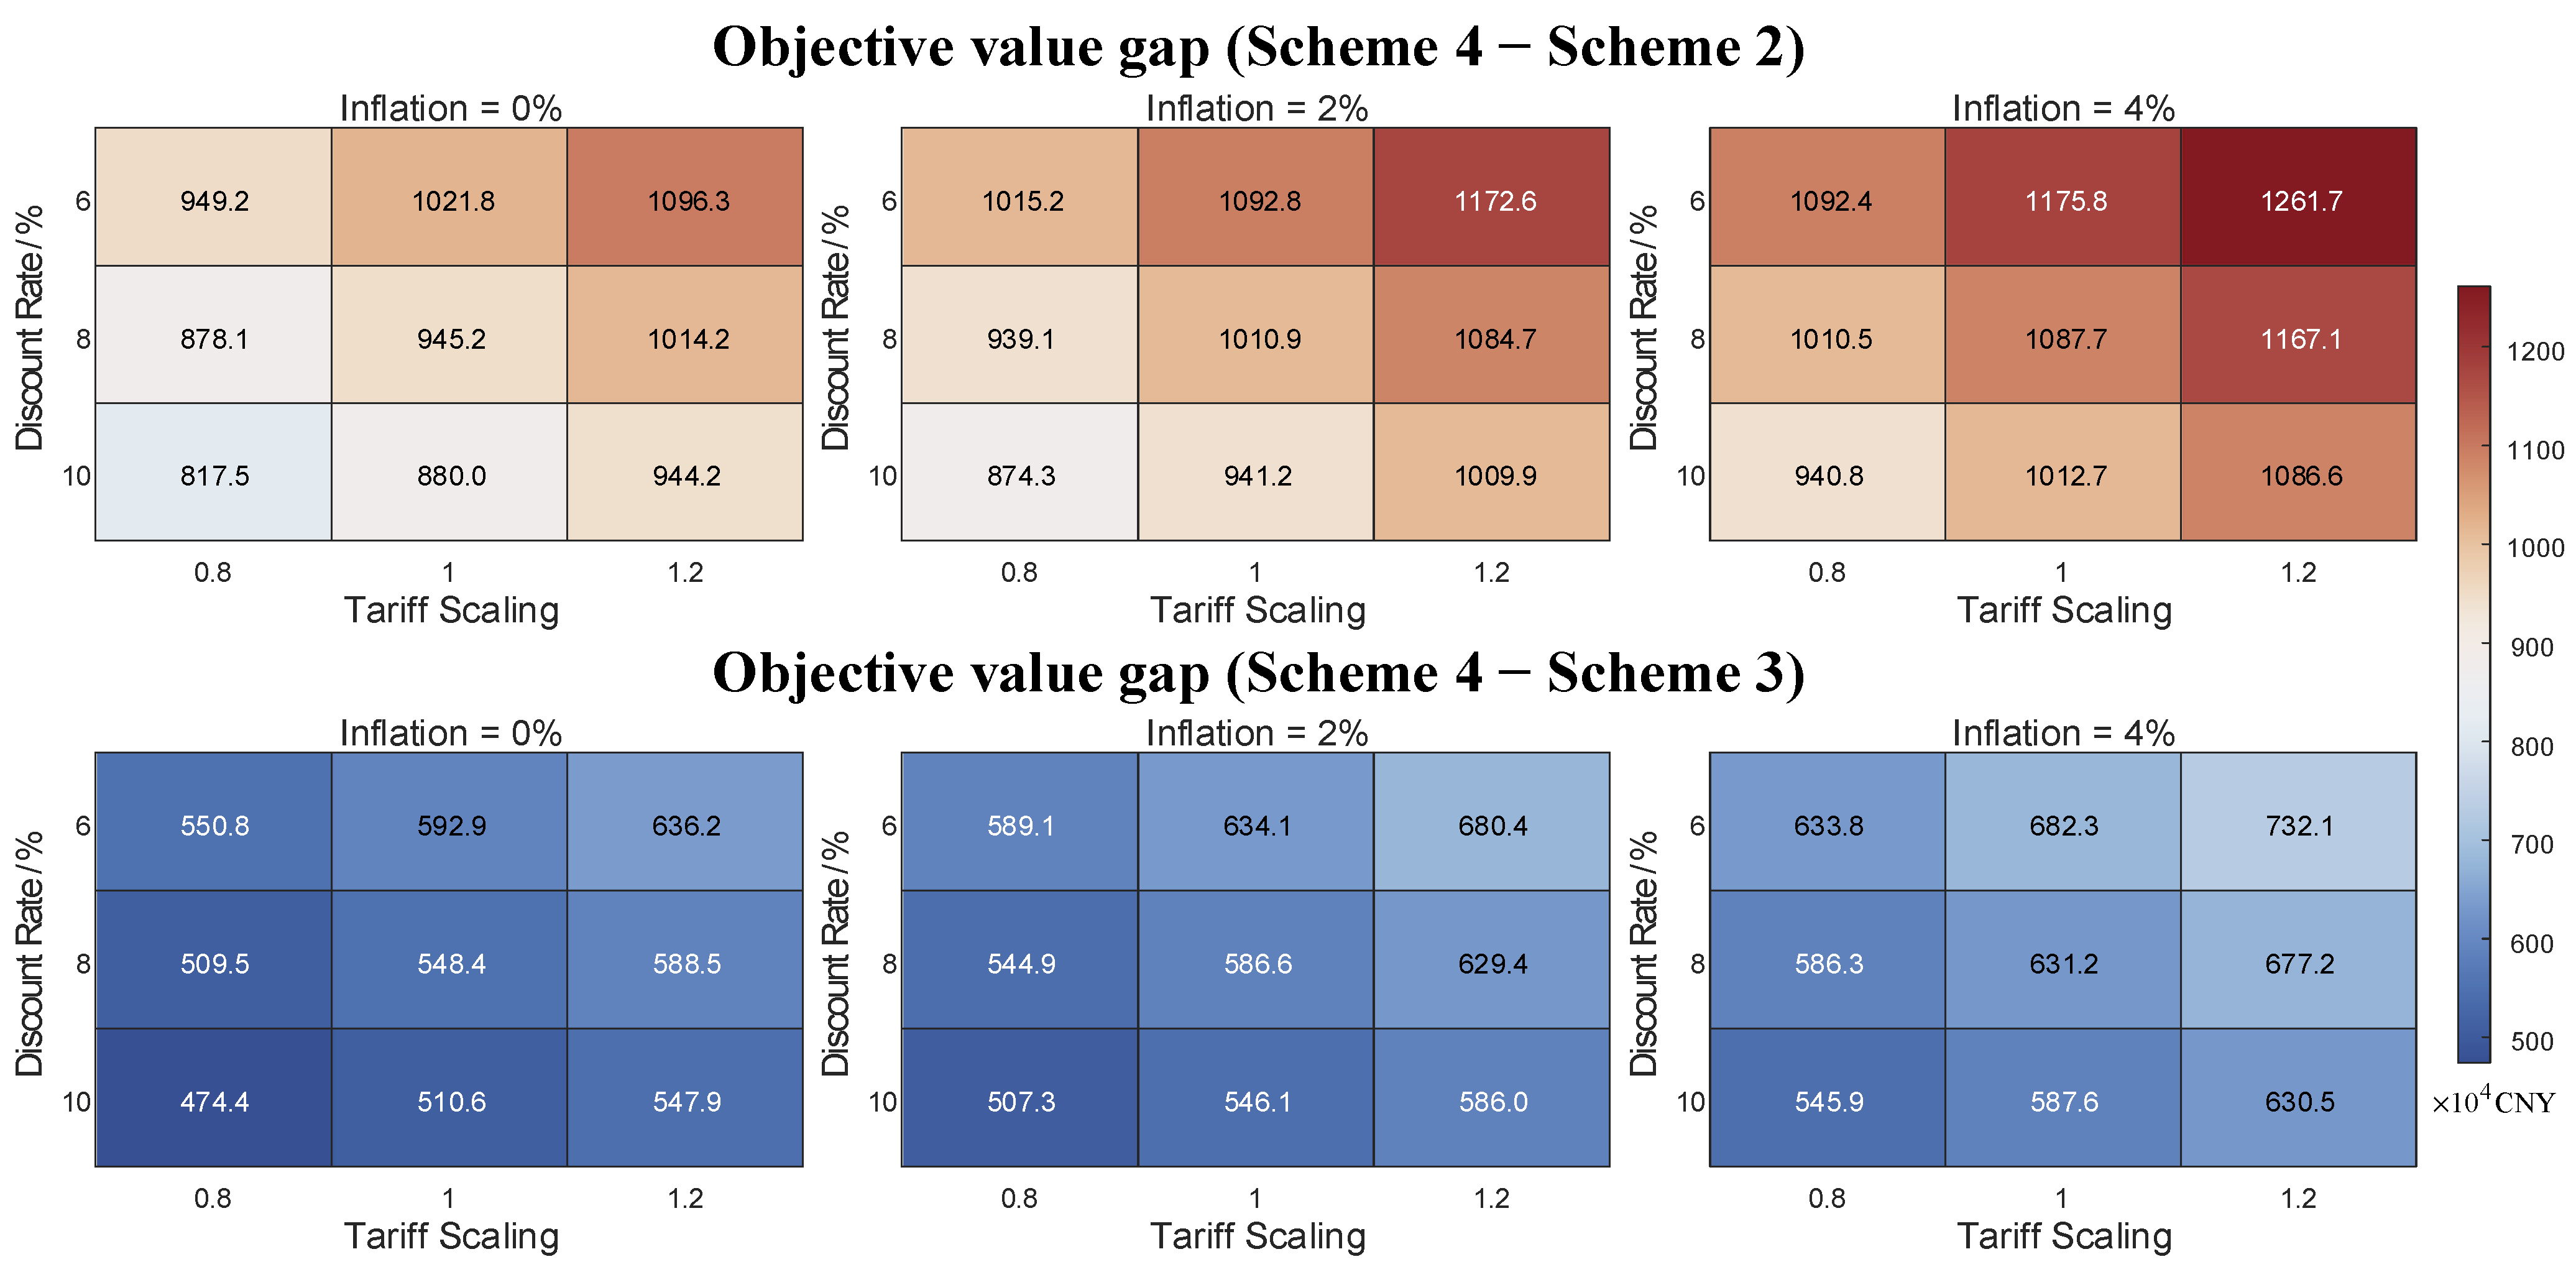
Furthermore, to evaluate robustness under simultaneous parameter variations, the objective value gaps between Scheme 4 and Schemes 2–3 are calculated across a grid of discount rates (6%, 8%, 10%), inflation rates (0%, 2%, 4%), and tariff scaling factors (0.8, 1.0, 1.2). The resulting pairwise objective gaps, defined as Scheme 4 minus Scheme 2 and Scheme 4 minus Scheme 3, are summarized in Figure 15.
Figure 15.
Multi-parameter robustness analysis.
As shown in Figure 15, the objective gaps remain positive for all 27 parameter combinations, indicating that Scheme 4 consistently outperforms Schemes 2 and 3 under joint economic-parameter perturbations. In addition, the magnitude of the gap varies systematically with the discount rate, inflation rate, and tariff level, but these changes do not alter the relative ranking of schemes. This confirms that the economic superiority of Scheme 4 is robust to simultaneous variations in key economic parameters, supporting the stability of the life-cycle conclusions.
- (4)
- Degradation-Model Uncertainty and Economic-Impact Analysis
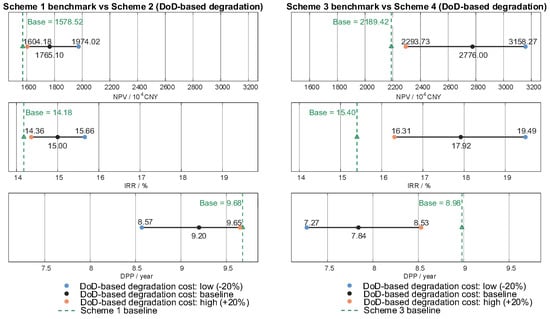
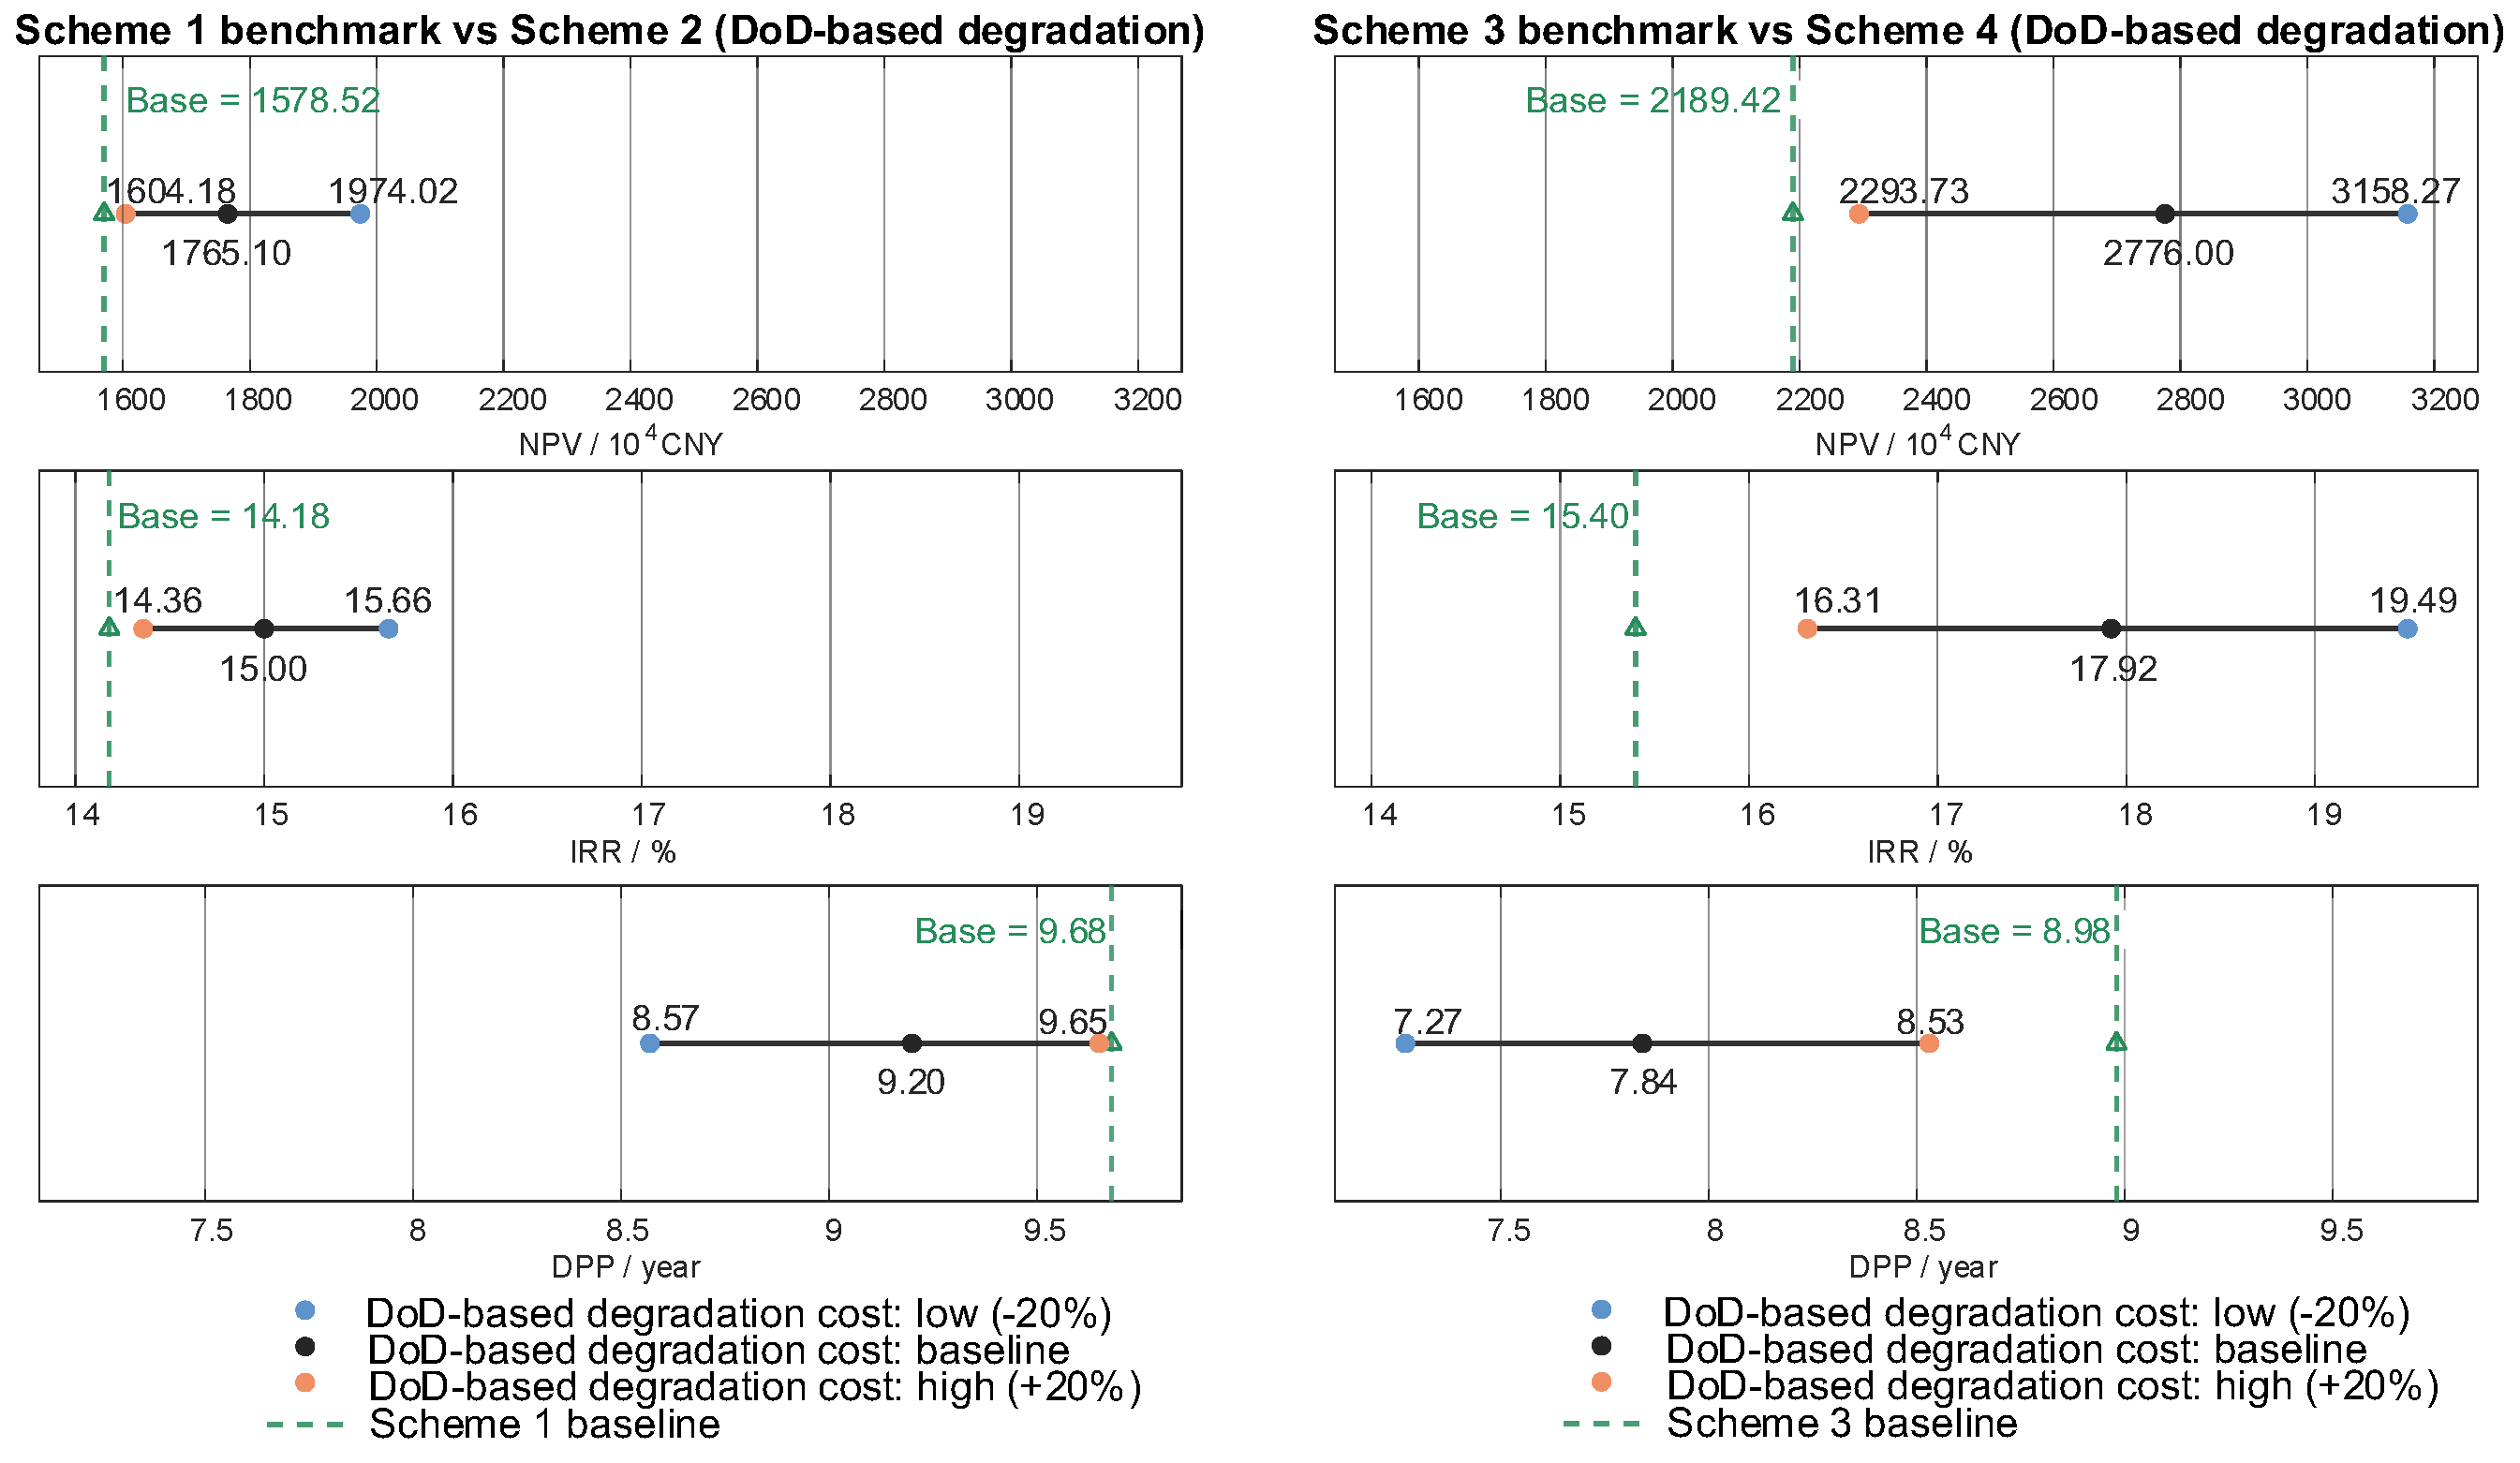
To quantify the economic impact of uncertainty in the DoD-based degradation cost term induced by the cycle-aging simplification, the degradation-cost term in the schemes adopting the DoD degradation model is scaled by factors of 0.8, 1.0, and 1.2. Figure 16 reports the resulting ranges of NPV, IRR, and DPP for Schemes 2 and 4 under different DoD-based degradation cost levels, and compares them with their corresponding benchmark schemes, namely, Scheme 1 and Scheme 3, respectively.
Figure 16.
Robustness of economic indicators to DoD-based degradation cost uncertainty.
As shown in Figure 16, the economic indicators exhibit an overall mild sensitivity to DoD-based degradation cost uncertainty. Under the three settings of DoD-based degradation cost low (−20%), baseline, and high (+20%), the relative comparison remains unchanged, and Schemes 2 and 4 consistently outperform their benchmark schemes in terms of NPV, IRR, and DPP. This indicates that the main economic conclusions are robust to reasonable uncertainty in the DoD-based degradation cost term, thereby supporting the reliability of the long-term life-cycle assessment results under this simplifying assumption.
5.2.6. Societal Relevance and Practical Implications
This subsection discusses the societal relevance of the proposed multi-service life-cycle framework from a practical deployment perspective. In particular, user-side energy storage can deliver system-level flexibility only if service stacking is operationally compatible and compliant with market rules, and if the necessary implementation conditions are satisfied.
- (1)
- Operational Compatibility and Regulatory Feasibility of Service Stacking
The proposed framework supports both single-service operation and multi-service participation, enabling the ESS to be evaluated under different market designs and participation modes. Importantly, the life-cycle assessment is conducted at the project level, while the operational layer allocates different storage units to different services according to system needs and program requirements. By coordinating service provision through unit-level dispatch decisions together with operational and physical constraints, practical compatibility is achieved at the system level, rather than relying on an unrealistic assumption that all services must be delivered simultaneously by the same unit at all times. It is acknowledged that, under a fully concurrent stacking assumption, revenue estimates can become optimistic when market restrictions related to service eligibility, settlement boundaries, and anti-double-counting requirements are not fully captured. Accordingly, the stability of the key comparative conclusions is further examined through the sensitivity and robustness analysis in Section 5.2.5.
- (2)
- Implementation Challenges and Deployment Pathway
From a deployment perspective, the proposed model is intended to support planning and operational strategy decisions by integrating service-portfolio selection, sizing, and dispatch design within a unified life-cycle evaluation. Practical implementation is primarily constrained by data accessibility and operational uncertainty. Reliable metering and historical profiles are needed to construct representative operating scenarios and to support consistent life-cycle accounting, while incomplete data in early-stage projects can constrain model calibration and parameter specification. Meanwhile, real-world operation is inevitably affected by uncertainties in market conditions and program execution, which influence both achievable revenues and service deliverability. A feasible pathway is therefore staged: start from a conservative single-service baseline using available data, progressively enable additional services as data availability improves and participation and settlement processes become established, and periodically revisit key inputs to maintain decision relevance.
6. Conclusions
This paper develops an LC-MSCOM for user-side ESS configuration. The proposed approach integrates capacity sizing with operational dispatch and explicitly considers multiple revenue streams and battery degradation costs. It provides a unified framework for life-cycle economic evaluation and optimization. The main findings are summarized as follows:
- (1)
- Under the unified life-cycle evaluation settings of a 15-year horizon with an 8% discount rate and a 2% inflation rate, coordinated multi-service participation improves economic performance. In the multi-service case, Scheme 4 increases NPV and IRR by 26.8% and 16.4%, respectively, and shortens DPP by 12.7% relative to Scheme 3. These results support the benefit of coordinated service stacking.
- (2)
- Incorporating the DoD-based degradation cost leads to a more lifetime-aware configuration and lower cycling intensity. In the multi-service case, Scheme 4 reduces the ESS energy and power ratings from 48.34 MWh/19.46 MW in Scheme 3 to 44.87 MWh/17.44 MW. It also lowers cycling stress, with FEC and Avg-DoD reduced by 28.6% and 26.4%, respectively, relative to Scheme 3. In the arbitrage-only case, Scheme 2 reduces FEC and Avg-DoD by 20.7% and 24.2%, respectively, relative to Scheme 1. This trend is consistent with shallower cycling under internalized lifetime costs.
- (3)
- The co-optimization results satisfy distribution network operating limits and remain computationally tractable for the tested cases. The relaxed formulation matches the original objective within 0.02%. It also reduces runtime, for example, from 687.3 s to 109.1 s in Scheme 4. Sensitivity analysis suggests that Scheme 4 remains robust under plausible parameter perturbations. NPV varies within approximately ±8–10%, and DPP varies by about ±10%.
Despite the above progress, three limitations motivate future work. First, renewable output uncertainty is not explicitly modeled under the deterministic typical-day setting. Future work will incorporate scenario generation together with robust or stochastic optimization, and will exploit data-driven photovoltaic forecasting and complementary grid-support functions, such as smart-inverter capabilities, to better represent uncertainty sources and operational flexibility [45,46]. Second, the tariff is represented by a fixed time-of-use structure over the project horizon, and dynamic pricing schemes, together with their forecasting uncertainty, are not explicitly modeled. Future work will investigate price forecasting and probabilistic tariff modeling to enable uncertainty-aware life-cycle optimization under time-varying prices. Third, the degradation model adopts a DoD-based proxy and does not explicitly capture temperature effects, C-rate dependence, or calendar aging. Future work will integrate electro-thermal aging models and calendar-aging terms when sufficient measurements or validated parameters are available.
Author Contributions
Conceptualization, L.L., Y.Z. and H.C.; methodology, L.L. and C.Z.; software, L.L. and X.L.; validation, L.L., C.Z. and Z.G.; formal analysis, L.L., X.L., H.C. and C.Z.; investigation, L.L., C.Z. and Z.G.; resources, Y.Z. and H.C.; data curation, L.L., X.L. and H.C.; writing—original draft preparation, L.L., X.L. and Y.Z.; writing—review and editing, Y.Z., H.C., C.Z., X.L. and X.P.; visualization, L.L. and H.C.; supervision, X.P. and H.C.; project administration, X.P.; funding acquisition, L.L. All authors have read and agreed to the published version of the manuscript.
Funding
This research was funded by the Science and Technology Project of China Southern Power Grid Co., Ltd., grant number 030100KC24070041.
Data Availability Statement
The original contributions presented in this study are included in the article. Further inquiries can be directed to the corresponding author.
Conflicts of Interest
Authors Lixiang Lin, Yuanliang Zhang, Chenxi Zhang, Xin Li and Zixuan Guo were employed by the company Guangzhou Power Supply Bureau of Guangdong Power Grid Corporation. The remaining authors declare that the research was conducted in the absence of any commercial or financial relationships that could be construed as a potential conflict of interest.
Appendix A
Table A1.
Summary of model symbols and variables.
References
- Rezaeimozafar, M.; Monaghan, R.F.D.; Barrett, E.; Duffy, M. A Review of Behind-the-Meter Energy Storage Systems in Smart Grids. Renew. Sustain. Energy Rev. 2022, 164, 112573. [Google Scholar] [CrossRef] [Scilit]
- Jin, W.; An, X.; Li, D. Investment Evaluation Analysis of Independent Electrochemical Energy Storage Power Station Based on Full Life Cycle. Guangdong Electr. Power 2025, 38, 20–27. Available online: https://kns.cnki.net/kcms2/article/abstract?v=PZRn9VlzpTbOAhTEJHzWj3dZi3RCNsg_deK51Gv0Nfx4VTlgRAazdQg4S72BFUUNv0GybNeM-qy1BTFk7H2W_AwIXDAu8_2gJYWuvcWqtTk2BtZLywAfgi1yIgKJZKHkbLyTqv7vSpxsPaXd1K2hrYyW05iQ69qv6cVz1f-pYsNXqjEoWRphQ1M3HfbebRh-OfLFv2UbWUg&uniplatform=NZKPT&captchaId=a6d4f243-6b7d-41e4-963c-87a998cb3312 (accessed on 21 January 2026).
- Attia, P.M.; Bills, A.; Brosa Planella, F.; Dechent, P.; dos Reis, G.; Dubarry, M.; Gasper, P.; Gilchrist, R.; Greenbank, S.; Howey, D.; et al. Review—“Knees” in Lithium-Ion Battery Aging Trajectories. J. Electrochem. Soc. 2022, 169, 060517. [Google Scholar] [CrossRef] [Scilit]
- Werner, D.; Paarmann, S.; Wetzel, T. Calendar Aging of Li-Ion Cells—Experimental Investigation and Empirical Correlation. Batteries 2021, 7, 28. [Google Scholar] [CrossRef] [Scilit]
- Johnen, M.; Pitzen, S.; Kamps, U.; Kateri, M.; Dechent, P.; Sauer, D.U. Modeling Long-Term Capacity Degradation of Lithium-Ion Batteries. J. Energy Storage 2021, 34, 102011. [Google Scholar] [CrossRef] [Scilit]
- Keil, J.; Jossen, A. Electrochemical Modeling of Linear and Nonlinear Aging of Lithium-Ion Cells. J. Electrochem. Soc. 2020, 167, 110535. [Google Scholar] [CrossRef] [Scilit]
- Li, W.; Sengupta, N.; Dechent, P.; Howey, D.; Annaswamy, A.; Sauer, D.U. One-Shot Battery Degradation Trajectory Prediction with Deep Learning. J. Power Sources 2021, 506, 230024. Available online: https://linkinghub.elsevier.com/retrieve/pii/S0378775321005528 (accessed on 1 January 2026). [CrossRef] [Scilit]
- Deng, Z.; Lin, X.; Cai, J.; Hu, X. Battery Health Estimation with Degradation Pattern Recognition and Transfer Learning. J. Power Sources 2022, 525, 231027. [Google Scholar] [CrossRef] [Scilit]
- Lee, J.; Kim, Y. Novel Battery Degradation Cost Formulation for Optimal Scheduling of Battery Energy Storage Systems. Int. J. Electr. Power Energy Syst. 2022, 137, 107795. [Google Scholar] [CrossRef] [Scilit]
- Zhao, W.; Yuan, X.; Zhou, Y.; Li, P.; Lei, E. Capacity Configuration Method of a Second-Use Battery Energy Storage System Considering Economic Optimization within Service Life. Power Syst. Prot. Control 2021, 49, 16–24. [Google Scholar] [CrossRef]
- Chen, Y.; Wu, C.; Jiao, Y.; Sun, Z.; Dai, S.; Zhang, P. Coordinated Optimal Operation Strategy of Thermal Power–Energy Storage Considering Demand Response and Life Model of Energy Storage. Electr. Power Autom. Equip. 2022, 42, 16–24. [Google Scholar] [CrossRef]
- Huang, Y.; Feng, Z.; Sui, Q.; Wu, C.; Xu, A.; Lin, X. Battery Loss Assessment and Energy Storage Capacity Configuration Strategy Considering Real-Time SOC and Dynamic Cycling Efficiency. Acta Energ. Sol. Sin. 2022, 43, 413–423. [Google Scholar] [CrossRef]
- Cheng, R.; Duan, Y.; Wu, Y.; Zhang, L.; Xu, Z.; Liu, Z. Energy Storage Planning of Distribution Network Considering Equivalent Cyclic Discharge Depth Constraints. South. Power Syst. Technol. 2024, 18, 54–63. [Google Scholar] [CrossRef]
- Zhang, Y.; Anvari-Moghaddam, A.; Peyghami, S.; Li, Y.; Dragičević, T.; Blaabjerg, F. Optimal Sizing of Behind-the-Meter Battery Storage for Providing Profit-Oriented Stackable Services. IEEE Trans. Smart Grid 2024, 15, 1481–1494. [Google Scholar] [CrossRef] [Scilit]
- Li, R.; Wang, L.; Yin, L.; Zeng, D.; Wang, G. Charging and Discharging Strategy for Commercial and Industrial Energy Storage Stations with Consideration of Frequency Regulation Ancillary Services Participation. Power Syst. Technol. 2025; pp. 1–18, Online ahead of print. [CrossRef]
- Wu, Y.; Bao, Y. Coordinated Day-Ahead and Intra-Day Rolling Scheduling Strategy for Electricity–Power Hybrid Energy Storage. Autom. Electr. Power Syst. 2024, 48, 77–87. [Google Scholar]
- Zhang, J.; Chen, H.; Wang, W. Research on Optimal Configuration Strategy of User-Side Energy Storage Considering Demand Management. Power Demand Side Manag. 2020, 22, 19–24, 37. [Google Scholar]
- Li, Z.; Peng, X.; Xu, Y.; Zhong, F.; Ouyang, S.; Xuan, K. A Stackelberg Game-Based Model of Distribution Network-Distributed Energy Storage Systems Considering Demand Response. Mathematics 2024, 12, 34. [Google Scholar] [CrossRef] [Scilit]
- Cheng, L.; Yu, F.; Huang, P.; Liu, G.; Zhang, M.; Sun, R. Game-Theoretic Evolution in Renewable Energy Systems: Advancing Sustainable Energy Management and Decision Optimization in Decentralized Power Markets. Renew. Sustain. Energy Rev. 2025, 217, 115776. [Google Scholar] [CrossRef] [Scilit]
- Cai, F.; Hu, Z.; Cao, M.; Cai, D.; Chen, R.; Sun, G. Coordinated Planning of Centralized and Distributed Battery Energy Storage for Improving Renewable Energy Accommodation Capability. Autom. Electr. Power Syst. 2022, 46, 23–32. [Google Scholar]
- Cheng, L.; Peng, P.; Huang, P.; Zhang, M.; Meng, X.; Lu, W. Leveraging Evolutionary Game Theory for Cleaner Production: Strategic Insights for Sustainable Energy Markets, Electric Vehicles, and Carbon Trading. J. Clean. Prod. 2025, 512, 145682. [Google Scholar] [CrossRef] [Scilit]
- Cheng, L.; Wei, X.; Li, M.; Tan, C.; Yin, M.; Shen, T.; Zou, T. Integrating Evolutionary Game-Theoretical Methods and Deep Reinforcement Learning for Adaptive Strategy Optimization in User-Side Electricity Markets: A Comprehensive Review. Mathematics 2024, 12, 3241. [Google Scholar] [CrossRef] [Scilit]
- Nyamayoka, L.; Masisi, L.; Dorrell, D.; Wang, S. Techno-Economic Feasibility and Optimal Design Approach of Grid-Connected Hybrid Power Generation Systems for Electric Vehicle Battery Swapping Station. Energies 2025, 18, 1208. [Google Scholar] [CrossRef] [Scilit]
- Camilo, F.; Santos, P. Technical-Economic Evaluation of Residential Wind and Photovoltaic Systems with Self-Consumption and Storage Systems in Portugal. Energies 2023, 16, 1805. [Google Scholar] [CrossRef] [Scilit]
- Ge, Y.; Shang, C. Energy Storage Planning Constrained by Its Life. Proc. CSEE 2020, 40, 6150–6161. [Google Scholar]
- Shang, B.; Xu, Y.; Wang, Y.; Zhang, J. Optimal Configuration and Economic Analysis of User-Side Energy Storage Participating in Auxiliary Services. Electr. Power 2023, 56, 164–170. [Google Scholar]
- Jiang, T.; Tao, J.; Li, Y.; Chu, C.; Wang, K.; Ju, P. Review of Load Response Management for Power Balance in New Power System. Electr. Power Autom. Equip. 2025, 45, 11–23. [Google Scholar]
- Guangdong Provincial Energy Administration. Implementation Rules for Market-Based Demand Response in Guangdong Province [Z/OL]. 21 November 2024. Available online: https://drc.gd.gov.cn/gdsnyj/gkmlpt/content/4/4582/post_4582746.html#4247 (accessed on 15 December 2025).
- Xu, Z.; Cui, Y.; Yue, F.; Li, J. Optimal Capacity Configuration of Grid-Side Energy Storage System Considering Equivalent Life Loss and Multi-Dimensional Benefits. J. Northeast Electr. Power Univ. 2025; pp. 1–10, Online ahead of print.
- Zhang, L.; Shi, Z.; Zhou, W.; Ma, J.; Li, K.; Yang, D.; Wan, J. Capacity Optimization Configuration of Battery, Thermal and Hydrogen Hybrid Energy Storage System Considering Battery Life. Power Syst. Technol. 2025, 49, 998–1006. [Google Scholar]
- Rahman, T.; Alharbi, T. Exploring Lithium-Ion Battery Degradation: A Concise Review of Critical Factors, Impacts, Data-Driven Degradation Estimation Techniques, and Sustainable Directions for Energy Storage Systems. Batteries 2024, 10, 220. [Google Scholar] [CrossRef] [Scilit]
- Zhang, L.; Yu, Y.; Li, B.; Qian, X.; Zhang, S.; Wang, X. Improved Cycle Aging Cost Model for Battery Energy Storage Systems Considering More Accurate Battery Life Degradation. IEEE Access 2021, 10, 297–307. [Google Scholar] [CrossRef] [Scilit]
- Preto, M.; Lucas, A.; Benedicto, P. Hybrid Energy Storage System Dispatch Optimization for Cost and Environmental Impact Analysis. Energies 2024, 17, 2987. [Google Scholar] [CrossRef] [Scilit]
- Qian, T.; Zhang, K.; Shi, D.; Zhang, L. Co-Optimization of Capacity and Operation for Battery-Hydrogen Hybrid Energy Storage Systems Based on Deep Reinforcement Learning and Mixed Integer Programming. Energies 2025, 18, 5638. [Google Scholar] [CrossRef] [Scilit]
- Chen, Y.; Zhang, S.; Long, G.; Hu, Y.; Shen, W.; Liu, D. Research on the Intraday Scheduling Optimization Strategy under the Dual-Track System of Market and Planning. Power Syst. Clean Energy 2025, 41, 50–60. [Google Scholar]
- Nezhad, A.E.; Mobtahej, M.; Javadi, M.S.; Nardelli, P.H.J.; Sahoo, S. Optimal Operation of Lithium-Ion Batteries in Microgrids Using a Semidefinite Thermal Model. Int. J. Electr. Power Energy Syst. 2024, 155, 109630. [Google Scholar] [CrossRef] [Scilit]
- Rehman, W.; Bo, R.; Mehdipourpicha, H.; Kimball, J. Sizing Battery Energy Storage and PV System in an Extreme Fast Charging Station Considering Uncertainties and Battery Degradation. Appl. Energy 2022, 313, 118745. [Google Scholar] [CrossRef] [Scilit]
- Zhang, J.; Xue, X.; Li, D.; Yan, J.; Cheng, P. Optimization of Energy Storage Allocation in Wind Energy Storage Combined System Based on Improved Sand Cat Swarm Optimization Algorithm. Mathematics 2023, 11, 3274. [Google Scholar] [CrossRef] [Scilit]
- Lv, Y.; Qin, R.; Sun, H.; Guo, Z.; Fang, F.; Niu, Y. Research on Energy Storage Allocation Strategy Considering Smoothing the Fluctuation of Renewable Energy. Front. Energy Res. 2023, 11, 1094970. [Google Scholar] [CrossRef] [Scilit]
- Qu, J.; Tang, B.; Yu, G.; Jiang, X.; Sun, H. Multi-Microgrids Power Interaction and Shared Energy Storage Planning Based on Generation-Load Matching. Mod. Electr. Power 2025, 42, 117–128. [Google Scholar]
- Huang, R.; Liu, Z.; Yu, Q.; Li, S.; Fu, Y.; Liu, Y.; Zhou, S.; Zhu, S. Primary Frequency Regulation Service Capacity and Optimization Power Configuration for Wind Farm Station Distribution Energy Storage System Considering Full Lifecycle Benefits. South. Power Syst. Technol. 2025, 19, 122–131. [Google Scholar]
- Zhu, R.; Das, K.; Sørensen, P.E.; Hansen, A.D. Optimal Participation of Co-Located Wind–Battery Plants in Sequential Electricity Markets. Energies 2023, 16, 5597. [Google Scholar] [CrossRef] [Scilit]
- Cao, Z.; Kurdkandi, N.; Mi, C. Techno-Economic and Environmental Viability of Second-Life EV Batteries in Commercial Buildings: An Analysis Using Real-World Data. Batteries 2025, 11, 412. [Google Scholar] [CrossRef] [Scilit]
- Junior, P.; Rocha, L.; Morioka, S.; Bolis, I.; Chicco, G.; Mazza, A.; Janda, K. Economic Analysis of the Investments in Battery Energy Storage Systems: Review and Current Perspectives. Energies 2021, 14, 2503. [Google Scholar] [CrossRef] [Scilit]
- Krishnamurthy, N.K.; Pandey, A.K.; Birla, S.; Manikanta, G.; Kumar, S. Smart Inverters Based Technological Advancements in Future Smart Grids for Improved Flexible Renewable Energy Penetration. Discov. Energy 2025, 5, 28. [Google Scholar] [CrossRef] [Scilit]
- Krishnamurthy, N.K.; Pandey, A.K.; Rao, S.S. Machine Learning Based Annual Solar Energy Forecasting for Enhanced Grid Integration of Photovoltaic Systems. Bull. Electr. Eng. Inform. 2025, 14, 4267–4278. [Google Scholar] [CrossRef] [Scilit]



Disclaimer/Publisher’s Note: The statements, opinions and data contained in all publications are solely those of the individual author(s) and contributor(s) and not of MDPI and/or the editor(s). MDPI and/or the editor(s) disclaim responsibility for any injury to people or property resulting from any ideas, methods, instructions or products referred to in the content. |
© 2026 by the authors. Licensee MDPI, Basel, Switzerland. This article is an open access article distributed under the terms and conditions of the Creative Commons Attribution (CC BY) license.