


Abstract
This study focuses on fabrication and comprehensive characterization of gold nanoparticles (AuNPs) stabilized with polyvinylpyrrolidone (PVP) and polyethylene glycol (PEG), correlating polymer degradation with colloidal stability and localized surface plasmon resonance (LSPR) behavior under controlled gamma doses from 5 to 125 Gy. AuNPs were synthesized via laser-assisted synthesis (LAS) in aqueous medium containing PVP or PEG as a stabilizing and capping agent. Morphology, size distribution, and surface functionalization of the resulting AuNPs@polymer-stabilized were verified through UV-Vis spectroscopy, FTIR, XRD, DLS, zeta potential, and TEM. Results show that the polymer shell effectively preserved the nanoparticles’ integrity by minimizing aggregation and maintaining LSPR features even after exposure to high gamma doses (>75 Gy). PVP demonstrated superior protection compared to PEG, due to the robustness of the solvation layer and carbonyl groups of PVP coating around the AuNPs. These findings highlight the potential of polymer-stabilized AuNPS for applications in radiation-rich environments, while demonstrating LAS as an environmentally friendly and efficient synthesis route.
1. Introduction
Gold nanoparticles, ranging from 1 to 100 nanometers, exhibit unique optical, electrical, and chemical properties that differ significantly from those of bulk gold. Their optical response is governed by LSPR, which confers upon these particles extraordinary abilities to absorb and scatter light at specific wavelengths. These characteristics make AuNPs highly versatile for biomedical applications, including photothermal therapy, targeted drug delivery, and biosensing. The stability, biocompatibility, and surface functionalization of these nanoparticles are all critical factors in their efficacy. Stabilization with hydrophilic polymers, including PVP and PEG, has proven to be an effective approach for enhancing biocompatibility, preventing aggregation, and increasing colloidal dispersion, all while reducing toxicity [1,2,3].
Laser-assisted synthesis offers a green, rapid, and controlled route for producing AuNPs with tailored morphology and LSPR-specific optical properties, avoiding toxic reagents and extreme conditions [4,5,6]. Beyond synthesis strategies, understanding polymer behavior under ionizing radiation remains largely unexplored. Previous studies have explored polymer-mediated synthesis and radiosensitization of AuNPs under various conditions. Misra et al. [7] demonstrated gamma-radiolytic synthesis in PVP for colorimetric sensing; Tajdidzadeh et al. [8] examined nonlinear optics in PEG/chitosan systems and size-dependent radiosensitization of PEG-coated AuNPs; Nurakhmetova et al. [9] addressed polymer-based stabilization, and Jeong et al. [10] studied gamma-induced polymerization in PPy/PVP hydrogels. However, none of the studies systematically analyzed polymer degradation or nanoparticle stability under gamma irradiation.
Establishing radiation-resistance mechanisms in polymer-coated AuNPs is essential for developing radiation-tolerant nanomaterials intended for biomedical environments where ionizing radiation is present; in this context nanoparticles must retain structural integrity and optical properties under therapeutic radiation doses. Typical gamma doses in biomedical research range from 25 to 50 Gy for moderate biological effects and up to 300 Gy for extensive analyses [11]. Beyond structural integrity, monitoring LSPR after gamma irradiation is critical as shifts in LSPR reflect changes in nanoparticle sizes, aggregation state, and surface chemistry. These optical variations correlate with colloidal stability, making LSPR analysis a key indicator of functional performance under ionizing radiation [12]. These insights are critical for designing AuNPs platforms capable of withstanding ionizing radiation in cancer treatment and nuclear medicine.
This work addresses these gaps by investigating how polymer backbone chemistry and molecular weight influence the structural integrity, colloidal stability, and LSPR behavior of AuNPs exposed to clinically relevant gamma radiation doses (5 to 125 Gy), encompassing therapeutic research conditions. Understanding the radiation stability of polymer-stabilized metallic nanoparticles is crucial for their successful implementation in biomedical applications, particularly in radiation therapy and diagnostic imaging. AuNPs have emerged as promising theragnostic agents due to their unique optical properties and biocompatibility, yet the stability of their organic stabilizers under gamma radiation remains poorly characterized.
2. Materials and Methods
2.1. Chemicals
All reagents, including tetrachloroauric acid (III) (HAuCl4·3H2O, 99% purity, ~49% Au content), PVP (PVP10, PVP40 analytical grade, average molecular weights approximately 10 kDa and 40 kDa, respectively), and PEG (PEG200 and PEG400, analytical grade, average molecular weights 190–210 g/mol and 380–420 g/mol, respectively), were purchased from Sigma-Aldrich (St. Lous, MO, USA) and used as received.
2.2. Polymer-Coated AuNPs Fabrication
2.2.1. Laser-Assisted Method
The polymer-coated AuNPs were fabricated with a Nd:YAG (λ = 532 nm), with pulse energy of 130 mJ, irradiation time of 5 min, and beam diameter of 5 mm (0.5 cm), corresponding to an irradiated spot area of 0.19697 cm2, following the procedure of [13,14,15]. For more details, see Supplementary Section (Figure S1). All polymer-coated AuNPs were produced from a 0.5 mM AuHCl4 solution and further stabilized with PVP10, PVP40, PEG200, and PEG400. The PVP-coated AuNPs were produced at 4:1 ratio by varying both the PVP10 and PVP40 concentration (1.0 M, 0.1 M, and 0.01 M). The PEG-coated AuNPs were produced at 4:1 ratio by varying both the PEG200 and PEG400 concentration (1.0% and 3.0%). Once all initial solutions were prepared, they were subjected to LAS process, as mentioned in this manuscript. All polymer-coated AuNPs were stored in the dark to prevent light-induced degradation or aggregation that could affect their stability and optical properties for further analysis.
2.2.2. Structural and Physicochemical Characterizations
UV-vis spectra of polymer-stabilized AuNPs solutions were registered in a 1 cm quartz cuvette employing a Perkin Elmer Lambda 45 dual beam spectrometer at a 280 nm/min scan rate in 200–1100 nm. All samples were dissolved in MilliQ water and allowed to settle for 1 h; subsequently, the supernatant was tested. The quartz cells prepared in a final volume of 1.5 mL were convenient for the absorbance registered. Fourier transform infrared spectroscopy with attenuated total reflectance (FTIR-ATR) was used to characterize the polymer-stabilized AuNPs functional groups. All measurements were conducted using a Perkin Elmer Spectrum One in the ATR mode, in a scanning range of 4000 to 650 cm−1 and with an accuracy of 4 cm−1. The structural analysis was performed by X-ray diffraction (XRD) using a Bruker D8 Advance X-ray diffractometer with CuKα radiation (1.5418 Å) with Bragg–Brentano geometry. Diffraction patterns were acquired over the 2θ range of 20–90° with a step size of 0.002°. Phase identification was performed using the ICDD 04-0784, with Au cubic phase (space group Fm3m) confirmed by matching at least four Au characteristic signals. Profile fitting was conducted using Voigt functions with Origin 2025b software (OriginLab Corporation, Northampton, MA, USA) Crystallite size was determined using the Scherrer equation with shape factor K = 0.89. Microstrain analysis was performed using the Williamson–Hall method to separate size and strain contributions to peak broadening. Hydrodynamic size distribution and zeta potential measurements were performed using a Litesizer 500 instrument equipped with a 532 nm laser (Anton Paar, Graz, Austria). Samples were diluted to a 5:1 ratio in ultrapure water. Dynamic light scattering (DLS) measurements were conducted at 25 °C with automatic attenuation and measurement position optimization. Zeta potential was determined using laser Doppler velocimetry in folded capillary cells. The selected PVP10 and PVP40-stabilized AuNPs were observed using a high-resolution transmission electron microscope (HRTEM-JEM-2010, (JEOL Ltd., Tokyo, Japan) with an LaB6 thermionic electron gun with an acceleration voltage of 200 kV. Each sample was ethanol diluted and ultrasonically homogenized for 20 min to facilitate dispersion. Gamma irradiation was performed using a Gammacell×200 Excel (GC-220E) with a 60Co source at room temperature with a dose rate of 12.1 Gy/min. Samples were irradiated in sealed vials under ambient atmosphere at 5, 25, 50, 75, 100, and 125 Gy. Spectral deconvolution and peak intensity analysis were performed using OriginLab software to quantify radiation-induced changes.
3. Results
3.1. UV-Vis Analysis
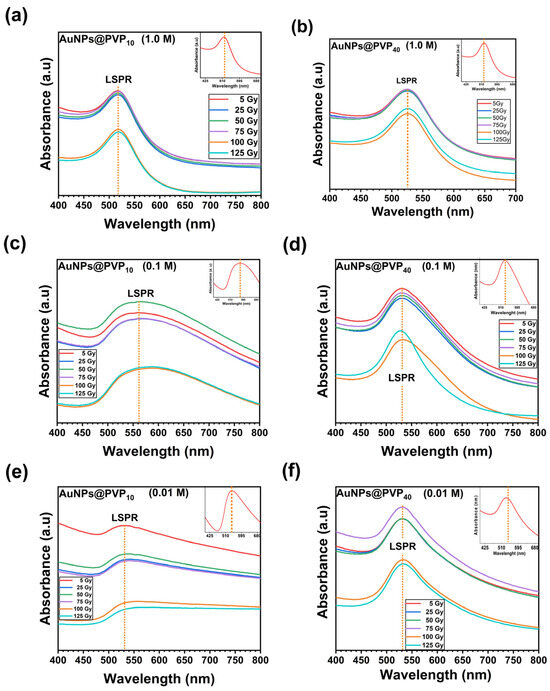
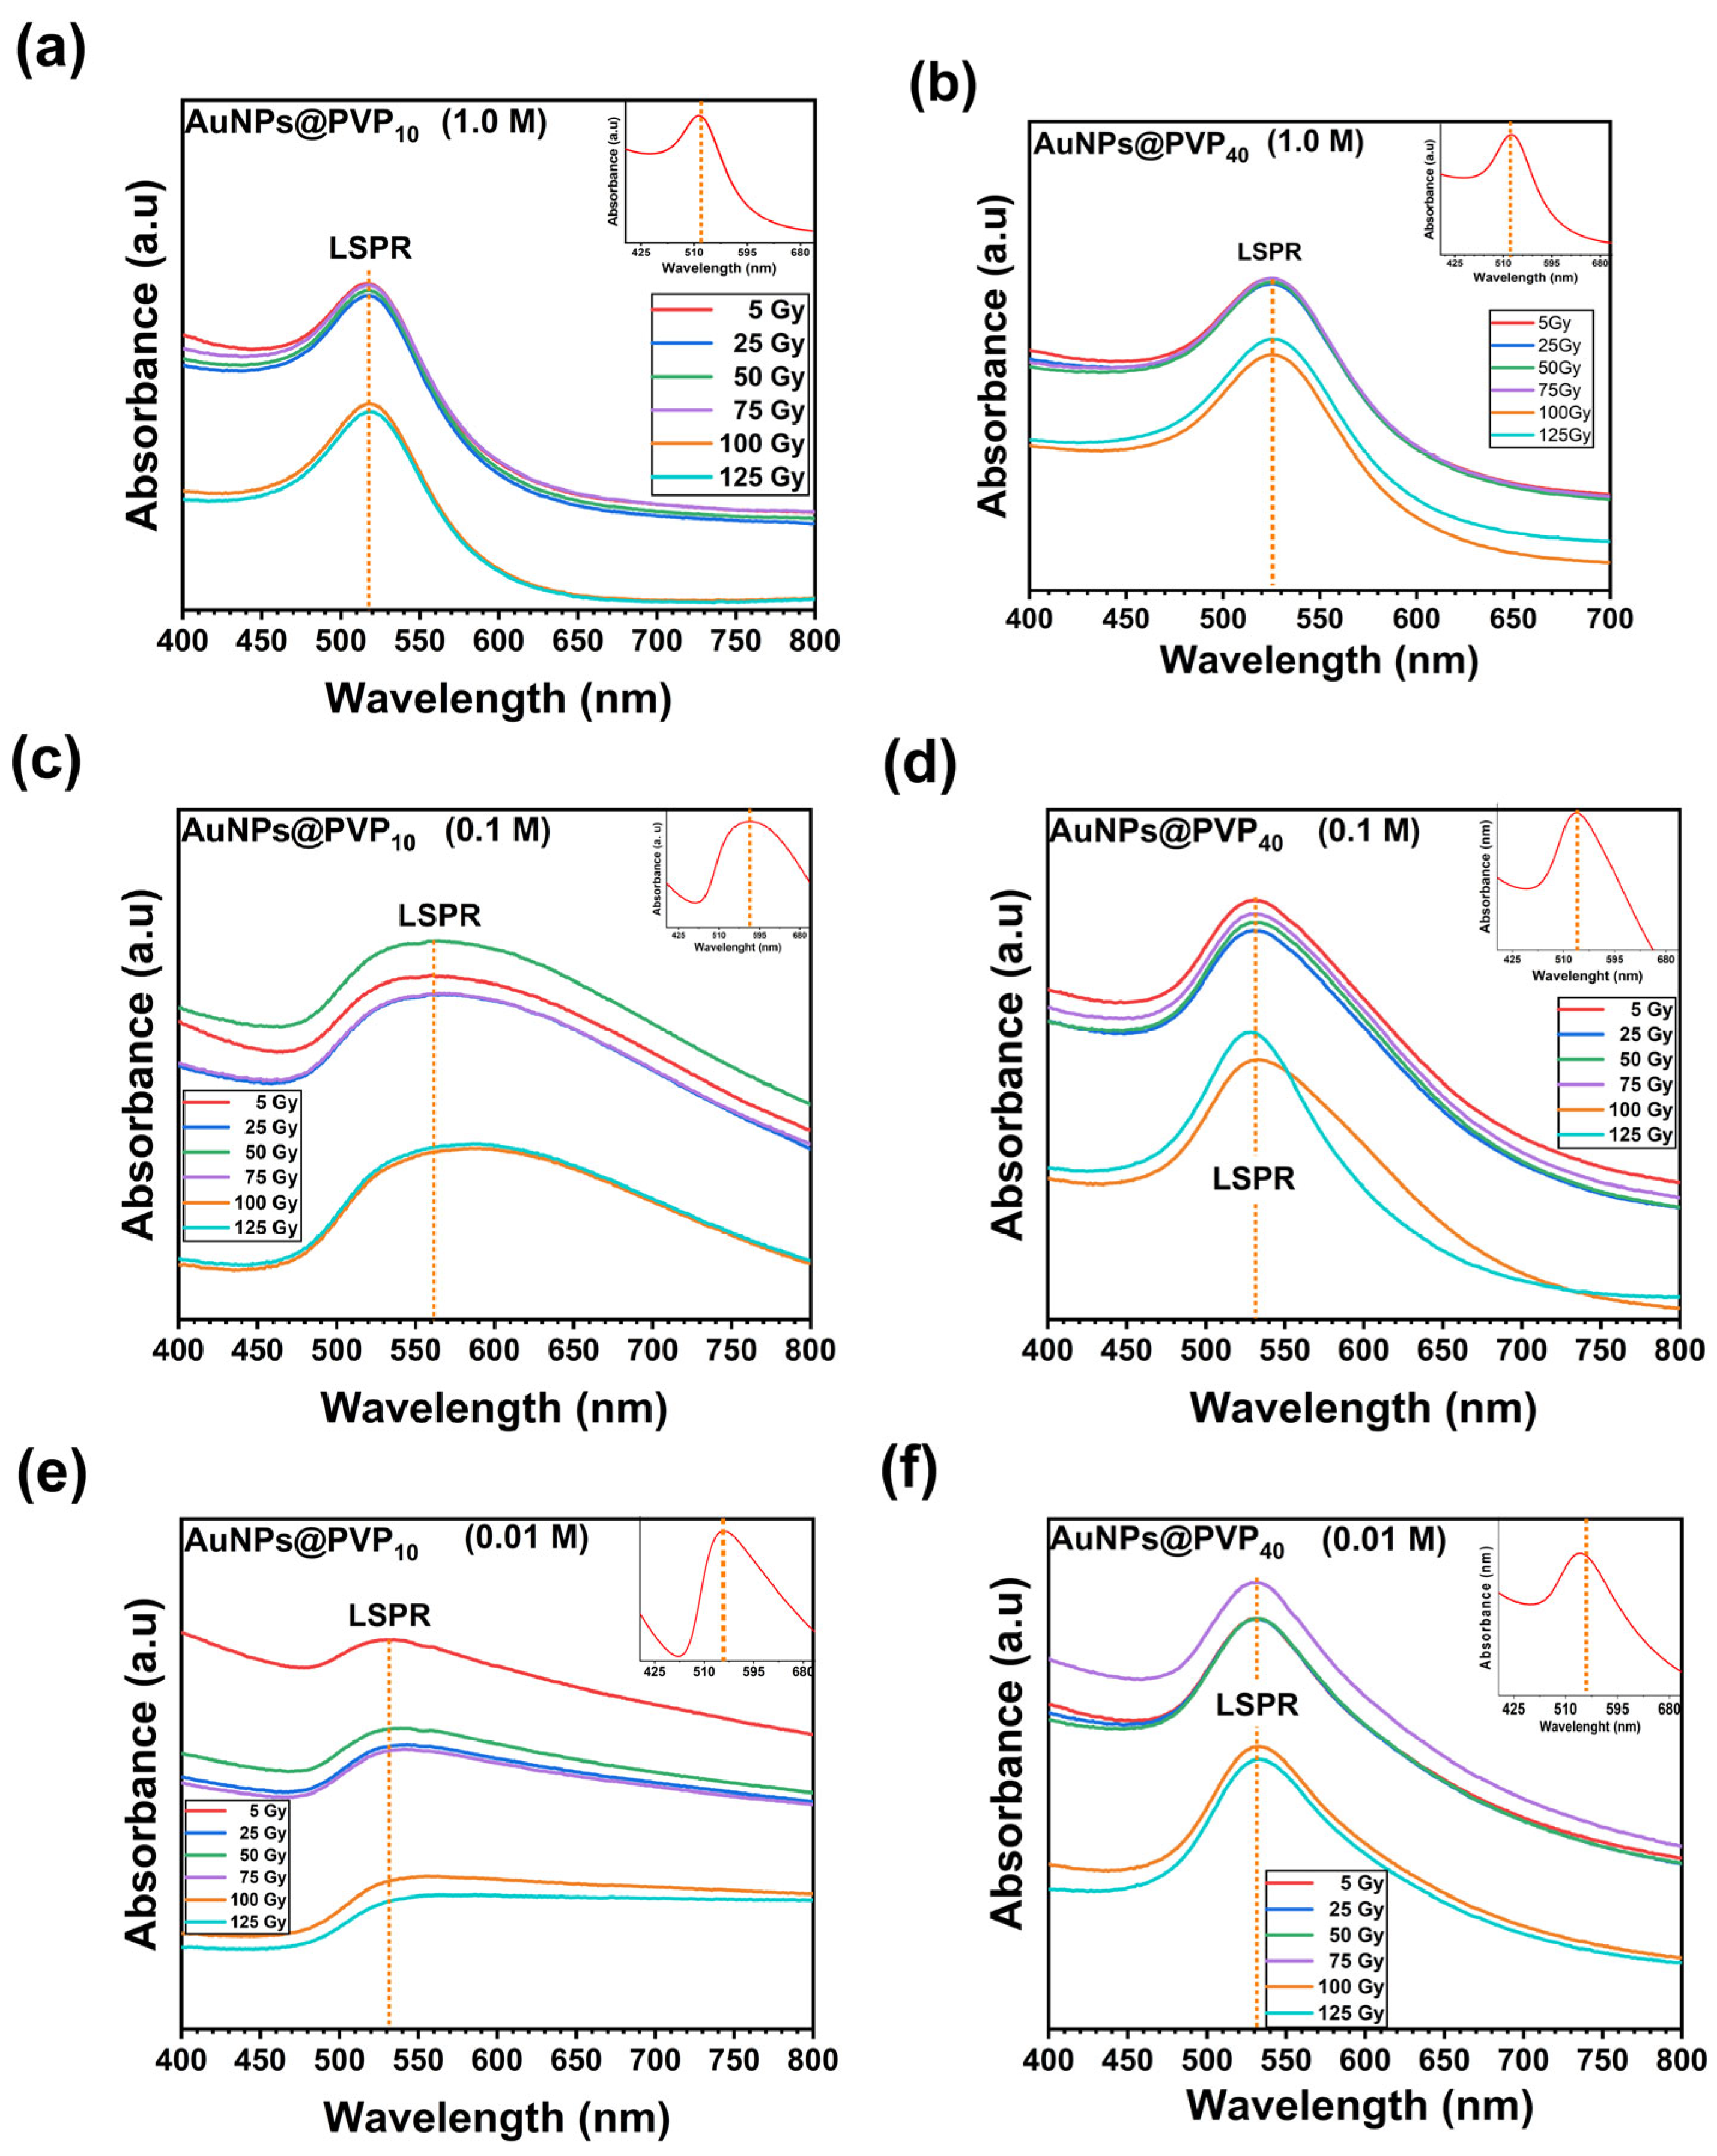
AuNPs@ PVP10 and AuNPs@PVP40 at different concentrations (1.0 M, 0.1 M, and 0.01 M) as well as AuNPs@PEG200 and AuNPs@PEG400 at 1.0% and 3.0% exhibited an LSPR absorption band in the UV-Vis spectra. The LSPR peak position of AuNPs@PVP10 for the three concentrations evaluated displayed a slight shift depending on the polymer concentration (Figure S2a), demonstrating consistent optical behavior regardless of PVP type or concentration. For pegylated AuNPs, LSPR peaks were located at 520–540 nm, for both 1.0% and 3.0% concentrations, consistent with spherical nanoparticles typically sized between 10 and 50 nm [16]. LSPR of AuNPs@PVP is significantly influenced by both the concentration and molecular weight of the polymer. UV-Vis spectra revealed that AuNPs@PVP10 LSPR peak shifts from ~517 nm (1.0 M) to ~567 nm at 0.1 M before returning to ~520 nm at 0.01 M. The redshift at 0.1 M suggests particle aggregation or morphological changes leading to larger effective particle size, which significantly influence optical properties.
AuNPs@PVP40 exhibit LSPR peaks slightly red-shifted from 525 nm (1.0 M) to ~531 nm (0.1 M) and ~534 nm (0.01 M); for more details, see Supplementary Information (Figure S2b). This shift could be attributed to changes in AuNPs sizes or surface environment as the polymer concentration decreases, consistent with previous reports on PVP-capped gold colloids [17,18]. These findings emphasize the critical role of polymer molecular weight and concentration in tuning the optical properties of AuNPs via the LSPR effect. According to UV-Vis LSPR observations, PVP40 provides more consistent stabilization across concentrations, promoting uniform particle size and stable plasmonic features. In contrast, lower molecular weight PVP can induce variable stability depending on concentration, leading to significant plasmon shifts which could indicate aggregation or shape changes. Such behavior aligns with previous studies highlighting the impact of lower molecular weight PVP on nucleation and growth dynamics, often resulting in more aggregated nanoparticles at intermediate polymer concentrations [19,20]. Results from this research align well with the literature, noting PVP steric stabilization effect without large spectral shifts between PVP10 and PVP40 types in many nanoparticle systems [21].
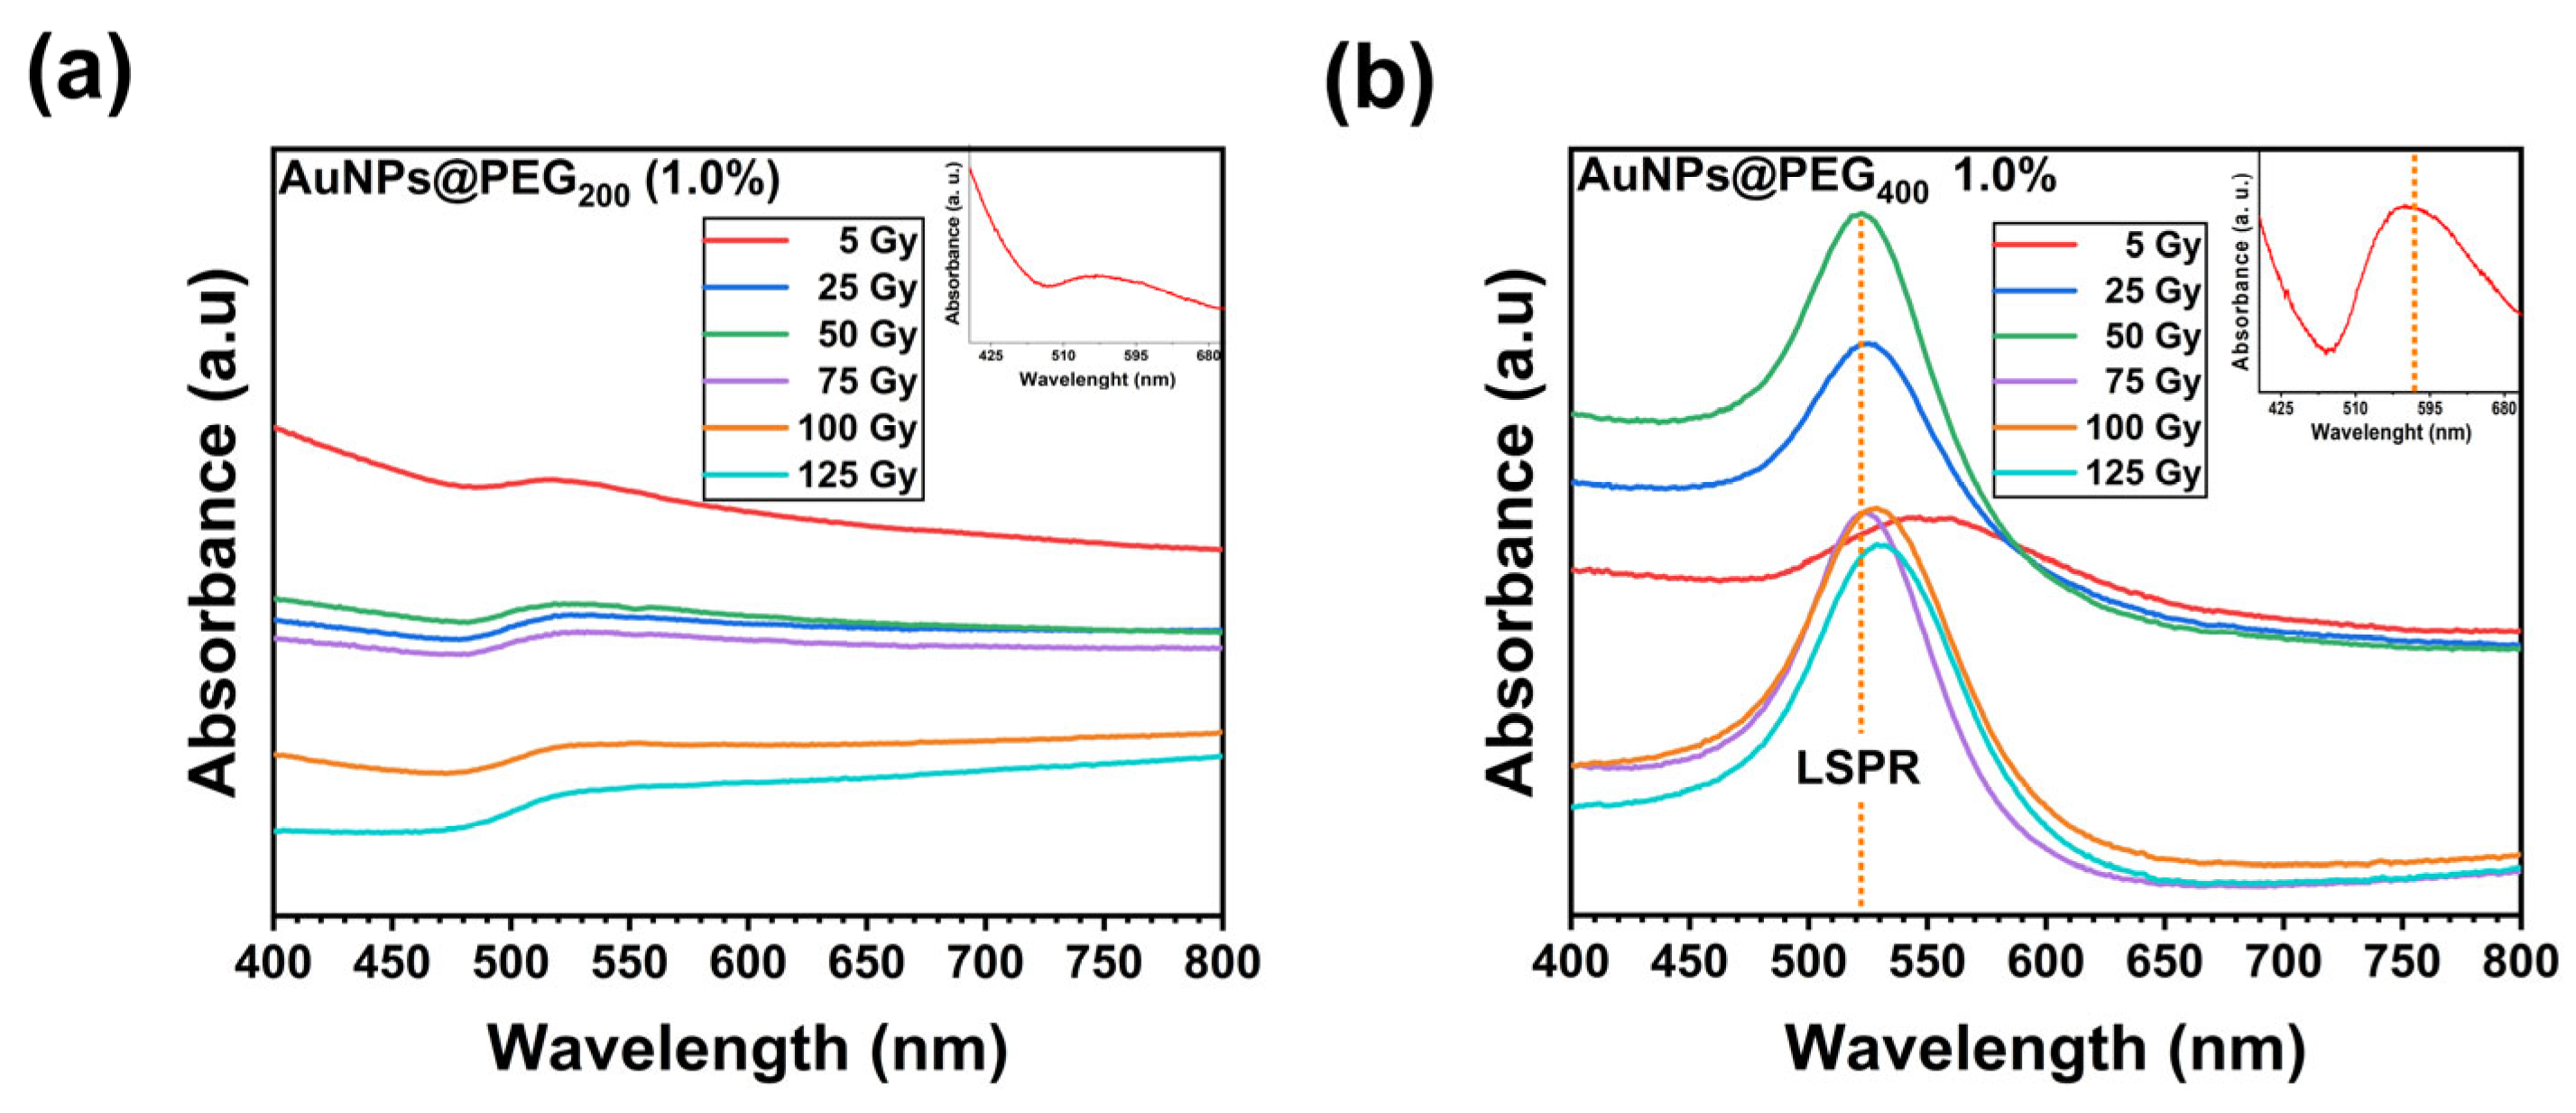
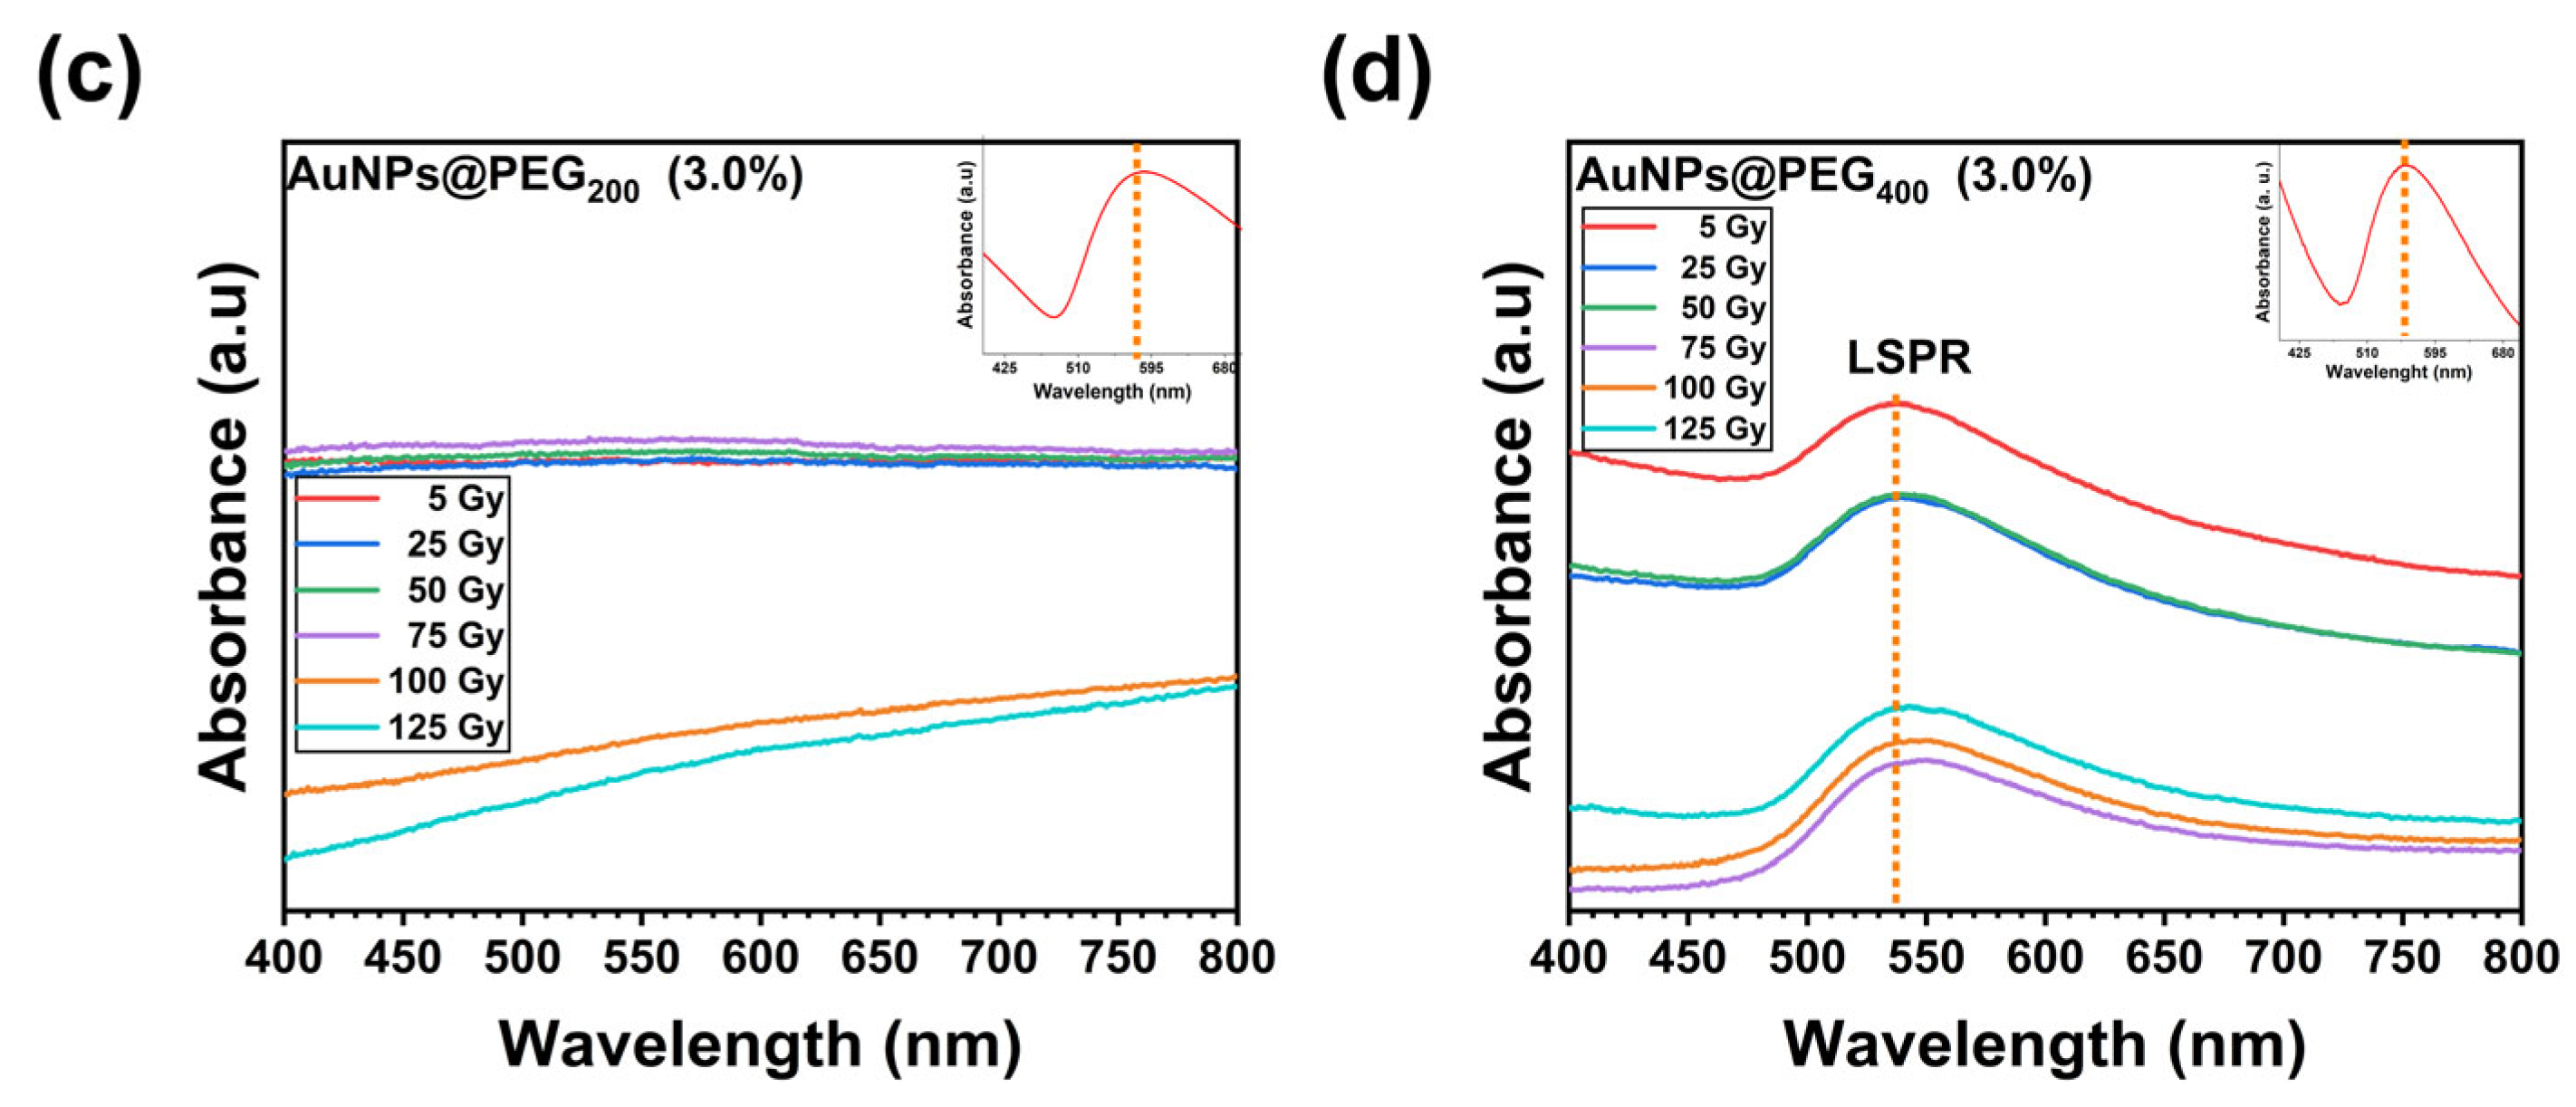
On the other hand, PEG can induce variable stability depending on concentration, leading to significant plasmon shifts that could be related to oxidation of the PEG groups. The LSPR peak position is influenced by the molecular weight and concentration of PEG, as illustrated in Figure S3a,b. PEG200 (534.01 ± 120.84 nm) and PEG400 (532.01 ± 11.48 nm) at 1.0% as well as PEG200 (662.44 ± 129.23 nm) and PEG400 (543.01 ± 4.69 nm) at 3.0% have a significant impact on LSPR, potentially due to polymer backbone changes caused by radiation. Conversely, the LSPR peak is maintained with PEG400 becoming the most suitable stabilizer for PEG-coated AuNPs. For more details, see Supplementary Information (Table S1).
AuNPs@PVP at 1.0 M, 0.1 M, and 0.01 M for both PVP10 and PVP40, were evaluated under gamma radiation doses from 5 to 125 Gy. Figure 1a,c,e show that the plasmonic properties of AuNPs PVP10 are significantly influenced by polymer concentration. The LSPR peak position of PVP10 (1.0 M) is presented in Figure 1a. In the low-dose regime (5 to 75 Gy), the LSPR remains constant at 517 ± 0.65 nm, indicating optical stability without any detectable radiation-induced changes. A dose-dependent shift occurs at high doses (100–125 Gy), resulting in a minor redshift in LSPR peak position. The threshold transition in the LSPR behavior of PVP10 at 0.1 M (Figure 1c) was observed. From 0 to 75 Gy, the LSPR is located at 565 and, for 100 Gy, shifts to 588 nm (mean 571.41 ± 11.78). In contrast to PVP10 at 1.0 M, this larger shift at 75–100 Gy could be attributed to structural changes. The identical LSPR values at 100 and 125 Gy (~588 nm) suggest that the radiation-induced structural change could reached saturation or equilibrium. Figure 1e (AuNPs-PVP10 at 0.01 M) depicts that the LSPR peak position remains constant from 0 to 75 Gy (542 nm), followed by a redshift from 100 to 125 Gy, suggesting that aggregation could occur due to dose-dependent behavior (mean 530.11 ± 59.65 nm).
Figure 1.
UV-Vis absorption spectra of AuNPs synthesized with PVP10 and PVP40 by varying polymer concentration (1.0 M, 0.1 M, 0.01 M), exposed to different gamma irradiation doses: 5, 25, 50, 75, 100, and 125 Gy. Panels (a–f) show the LSPR peaks near 520–530 nm, confirming nanoparticle formation. The inset in each panel displays the absorption spectrum of the corresponding bare polymer (PVP10 or PVP40) at the same concentration, serving as a control to distinguish polymer-specific absorption from nanoparticle plasmonic signals.
No significant changes in LSPR peak positions were observed through the dose range, for PVP40 at 1.0 M and (mean 525.33 ± 0.30 nm) 0.01 M (mean 531.50 ± 0.76 nm), as depicted in Figure 1b,f, indicating that the polymeric coating effectively preserved plasmonic properties and prevented agglomeration. Nanoparticles sizes remained stable post-irradiation, confirming the robustness of PVP40-stabilized AuNPs under gamma radiation. In contrast, AuNPs stabilized with PVP40 (0.1 M) exhibited stable LSPR features only up to 75 Gy. At higher doses of 100 Gy and 125 Gy, as demonstrated, the LSPR peak remained stable (mean 531.11 ± 1.71 nm) [22]. These results demonstrate that AuNPs@PVP40 (1.0 M) display enhanced stability and radiation resistance attributed to the extended polymer chain architecture, making this formulation desirable for radiation-intensive applications that require doses exceeding 75 Gy. LSPR band arises from the collective oscillation of conduction electrons in response to incident light, generating strong absorption and scattering phenomena. The intensity and position of this band are known to be highly sensitive to particle size, which in turn is influenced by the polymer chain length and concentration. Longer polymer chains could provide a more effective steric barrier during laser-assisted processes, often resulting in slightly larger nanoparticles with enhanced colloidal stability [17]. Conversely, shorter chains may lead to smaller particles with potentially different surface packing densities [19]. Increased polymer concentration typically enhanced particle stabilization (Table S1), limiting aggregation and growth, which can manifest as shifts in the LSPR peak towards shorter wavelengths due to smaller particle size [23].
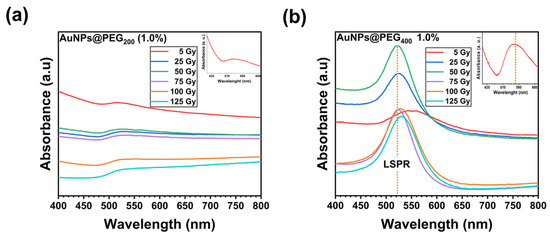
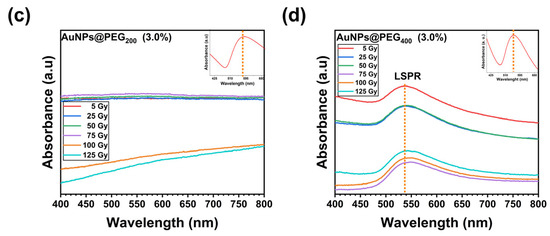
The PEG200-coated AuNPs demonstrated LSPR peak at ~548 nm (Figure 2a–c). PEG200 at 1.0% effectively stabilized the AuNPs, preserving their characteristic plasmonic properties while allowing narrow particle size distribution (Figure 2a). PEG200-AuNPs exhibit LSPR peaks positions at ~525 nm with 5, 25, and 50 Gy to rise to 800 nm at a dose of 50 Gy and to decrease to ~530 nm over 100 Gy (mean 548.01 ± 120.84 nm). By increasing the PEG200 concentration (3.0%) the LSPR displayed a redshift (mean 662.44 ± 129.23 nm) that could be attributed to structural changes in nanoparticles sizes or surface environment as the polymer concentration increases, consistent with previous reports on pegylated AuNPs [6]. In contrast, PEG400 (1.0%) (Figure 2b) demonstrated a polymer degradation from 0 to 50 Gy, followed by a partial recovery from 50 to 125 Gy (mean 532.01 ± 11.48 nm), maybe due to structural degradation rather than particle aggregation leading to larger effective particle size or anisotropic shapes, which significantly alter plasmonic coupling. Such behavior aligns with previous studies highlighting the impact of lower molecular wight PEG on nucleation and growth dynamics, often resulting in less, stable more aggregated nanoparticles at intermediate polymer concentrations [8,24,25]. These results indicate that ether bonds in PEG molecules are more susceptible to radiation damage than PVP’s carbonyl linkages. PEG200 3.0% formulations (Figure 2c) demonstrate that LSPR undergoes extreme redshift at 25–75 Gy, escalating to >270 nm at higher doses. An increase in nanoparticle diameter generally causes a redshift of the LSPR peak towards longer wavelengths due to enhanced electron conduction path and electromagnetic retardation effects [26,27,28,29].
Figure 2.
UV-Vis absorption spectra of AuNPs synthesized with PEG200 and PEG400 by varying polymer concentration (1.0% and 3.0%), exposed to different gamma irradiation doses: 5, 25, 50, 75, 100, and 125 Gy. (a) AuNPS@PEG200 (1.0%), (b) AuNPS@PEG400 (1.0%), (c) AuNPS@PEG200 (3.0%), (d) AuNPS@PEG400 (3.0%). Panels (b,d) show the LSPR peaks near 520–530 nm, confirming nanoparticle formation. The inset in each panel displays the absorption spectrum of the corresponding bare polymer (PEG200 or PEG400) at the same concentration, serving as a control to distinguish polymer-specific absorption from nanoparticle plasmonic signals.
The stability difference between PVP and PEG could indicate that ether C-O-C bonds undergo radiolytic scission compared to PVP’s backbone, since short-chain could lead to structural damage, resulting in a more disrupted polymer chain. PEG400 (3.0%) LSPR (Figure 2d) appear stable up to 50 Gy, and it increased to ~550 nm at 100 Gy and then improved to ~544 nm at 125 Gy. The radiation protective effect of PEG400 was demonstrated to be improved in comparison to PEG200; AuNPs@PEG demonstrates less radiation resistance in comparison to PVP formulations.
Studying the LSPR of AuNPS at different gamma radiation doses is a novel approach that can provide valuable information about the stability and optical properties of nanoparticles under irradiation. Gamma radiation can modify the morphology, size, and distribution of nanoparticles, which in turn influence the LSPR, indicating that both the electronic structure and geometry of the nanoparticles could be modified. The influence of polymer concentrations on LSPR and stability is systematically evaluated, offering a new insight into the design of new nanomaterials. For more details, see Supplementary Information (Table S1).
3.2. Fourier Transform Infrared Spectroscopy (FTIR)
FTIR spectroscopy was employed to confirm the successful functionalization of AuNPs with PVP and PEG elucidating the interaction mechanism between the stabilizing agent and the metallic core. Figure S4a–d depict the FTIR spectra of bare PVP10 and PVP40, along with their corresponding AuNPs@PVP formulations at concentrations of 1.0 M, 0.1 M, and 0.01 M. The spectrum of bare PVP10 (Figure S4a) exhibits characteristic bands, including the C=O stretching vibration at 1654 cm−1, indicative of the pyrrolidone ring. Additional bands correspond to C-H stretching (2800–3000 cm−1), C-N stretching (1425 cm−1), and methylene bending vibration at 1461 cm−1 and 1371 cm−1.
Upon functionalization, significant spectral shift occurs, most notably a redshift in the C=O stretching band at 1654 cm−1 in pure PVP to 1642 cm−1 (AuNPs@PVP10) and 1638 cm−1 (AuNPs@PVP40). This shift (~12–16 cm−1) indicates coordination between the C=O group and the gold surface, via the oxygen atom. The C-N stretching band also shifts slightly from 1425 cm−1 to 1420 cm−1, supporting functionalization. The difference between PVP10 and PVP40 spectra suggests stronger interaction with AuNPs for the lower molecular weight PVP10, likely due to higher chain mobility and surface accessibility [30,31,32,33].
Figure S4c,d depict FTIR spectra of AuNPs coated with PEG200 and PEG400 at 1.0% and 3.0%. characteristic PEG bands include O-H stretching at 3300 cm−1, asymmetric C-H stretching at 2880 cm−1 (which decrease in intensity upon functionalization), and C-O-C stretching at 1114 cm−1. The band at 1640 cm−1, associated with O-H groups of the PEG (-CH2-OH), shifts to carboxylates (-COO−) upon interaction with AuNPs linked to an oxidative state and increased negative charge [34,35].
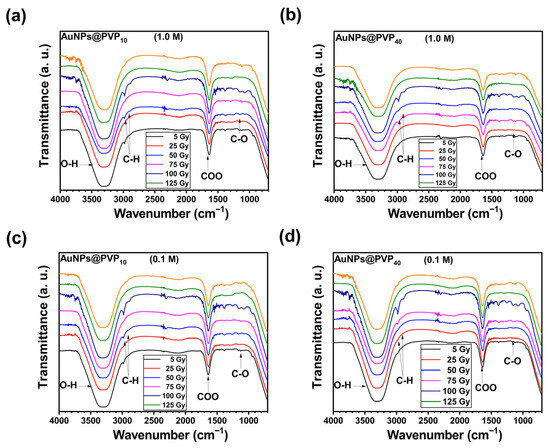
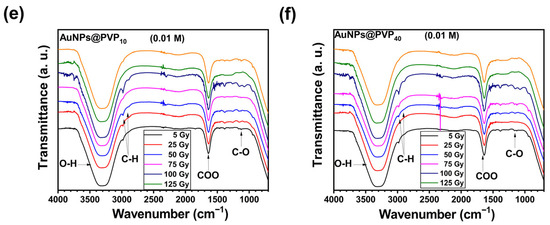
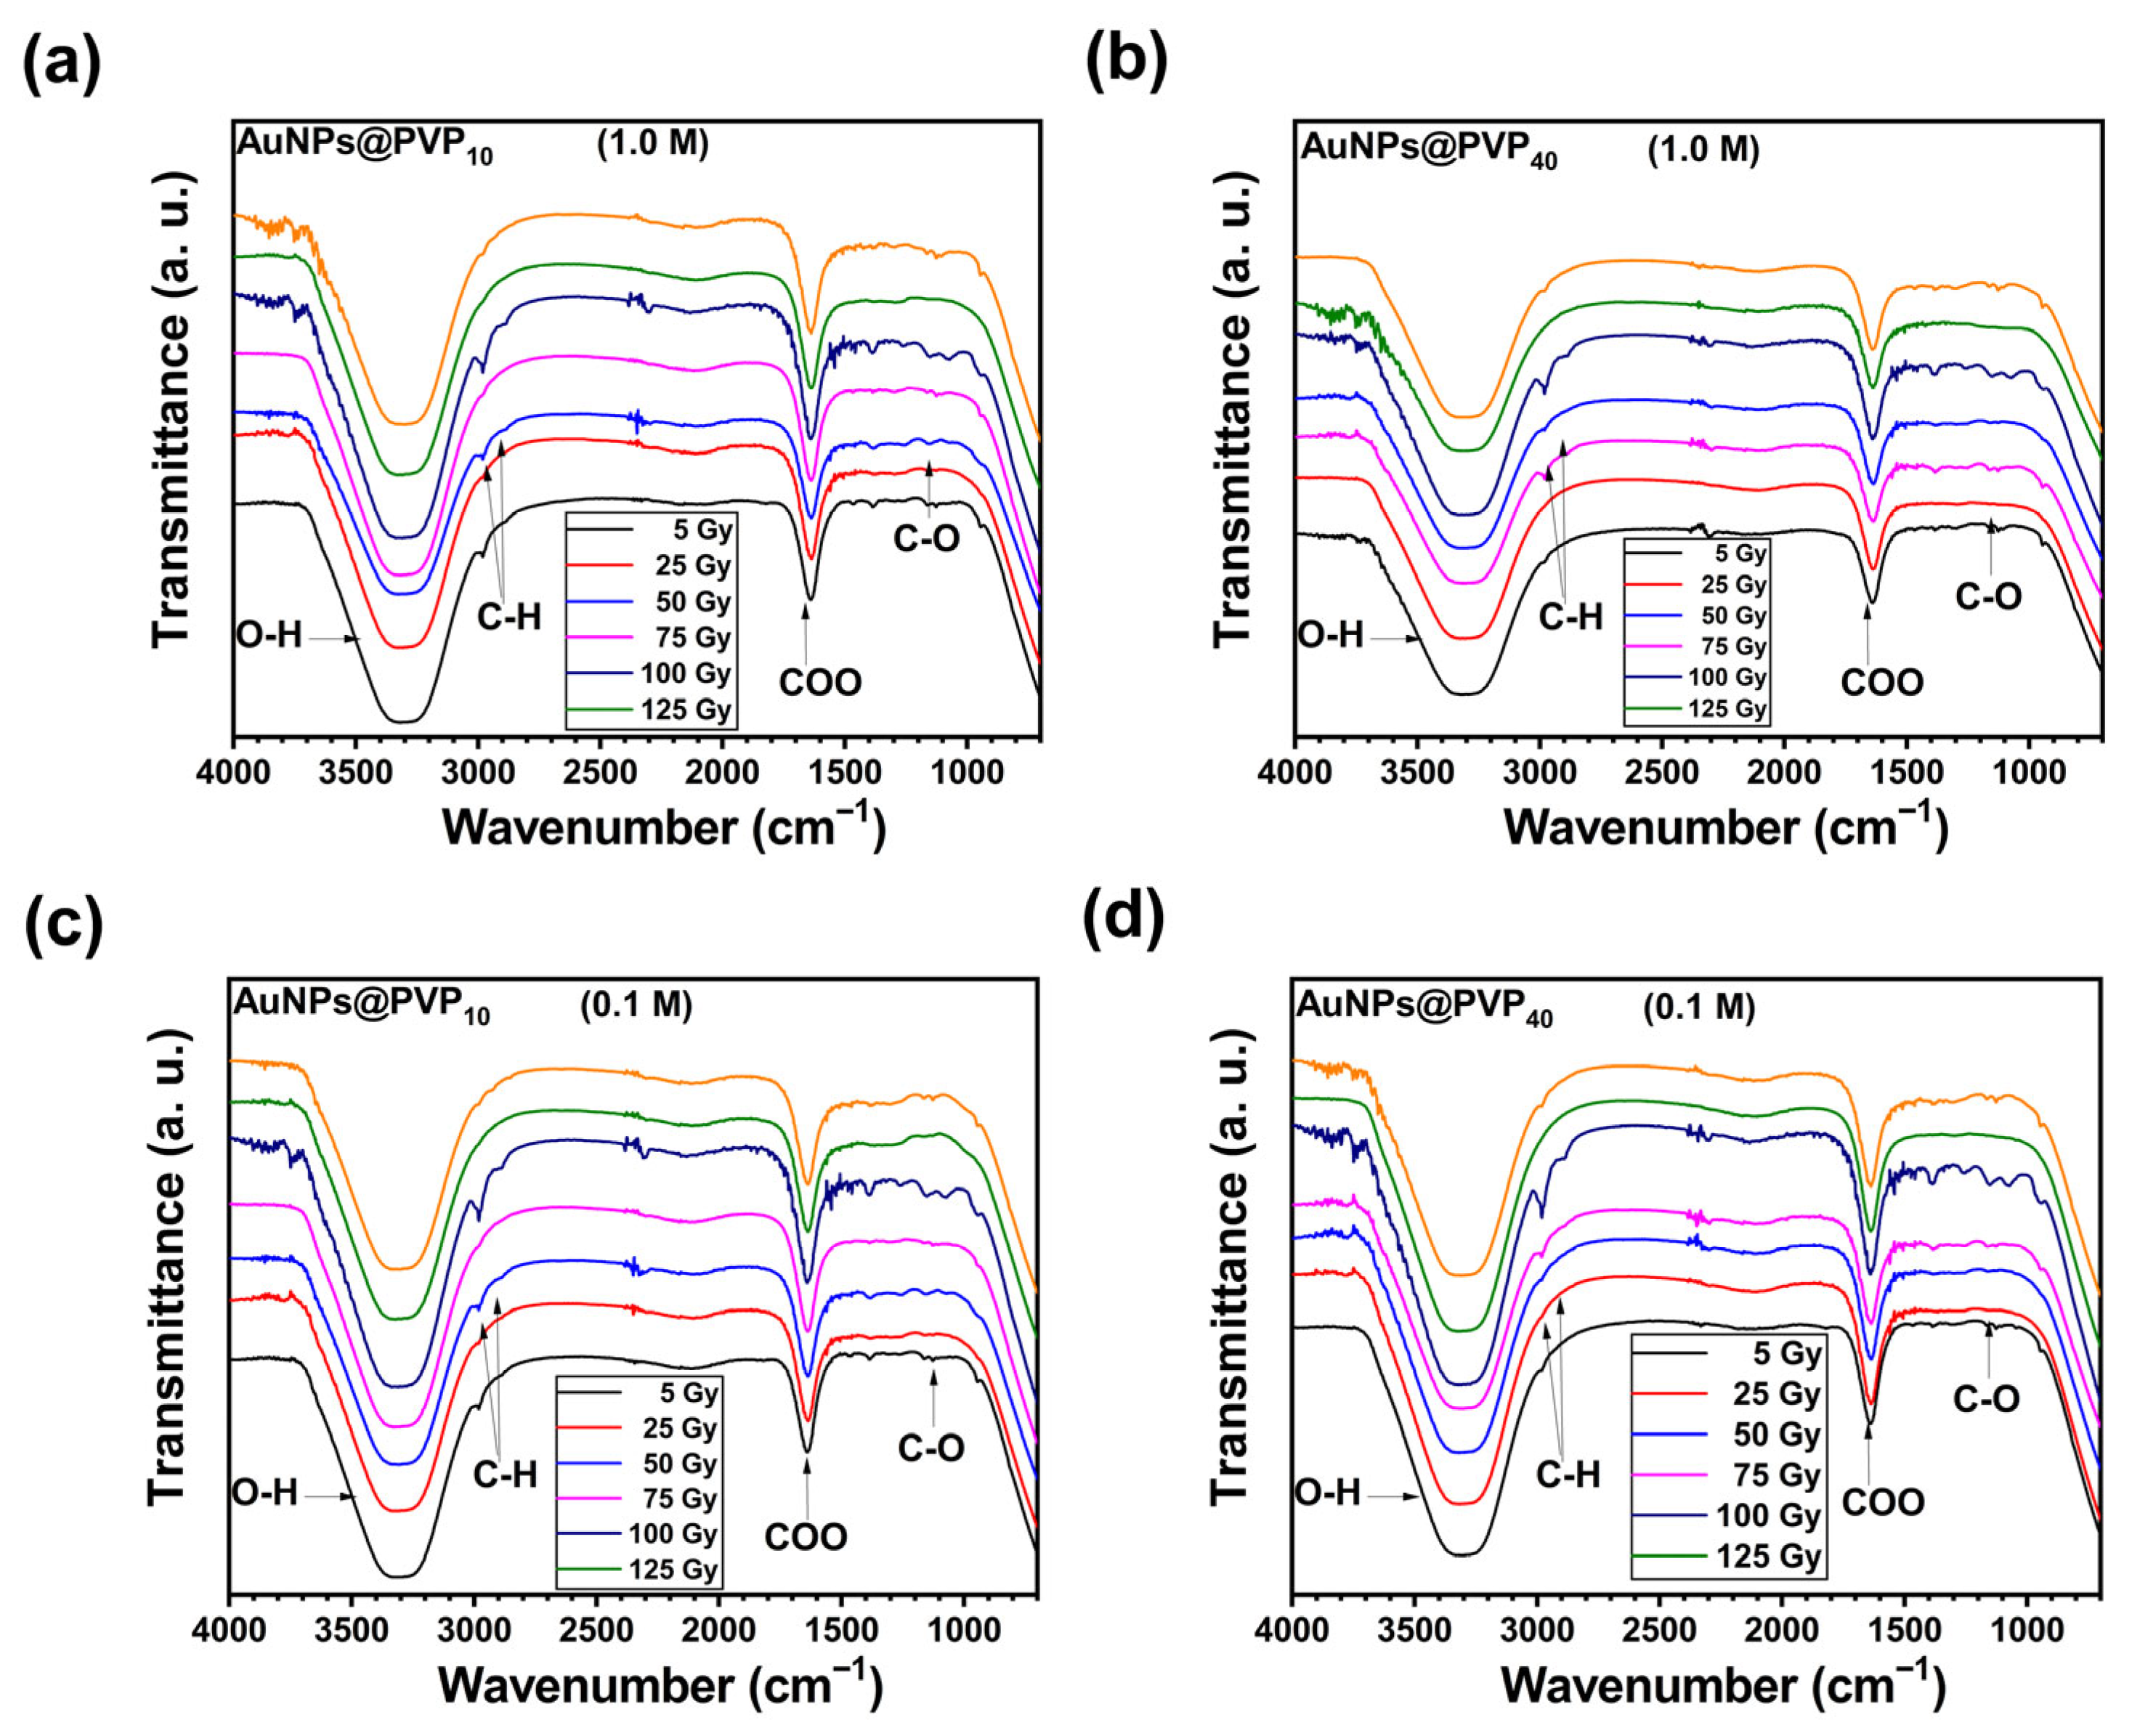
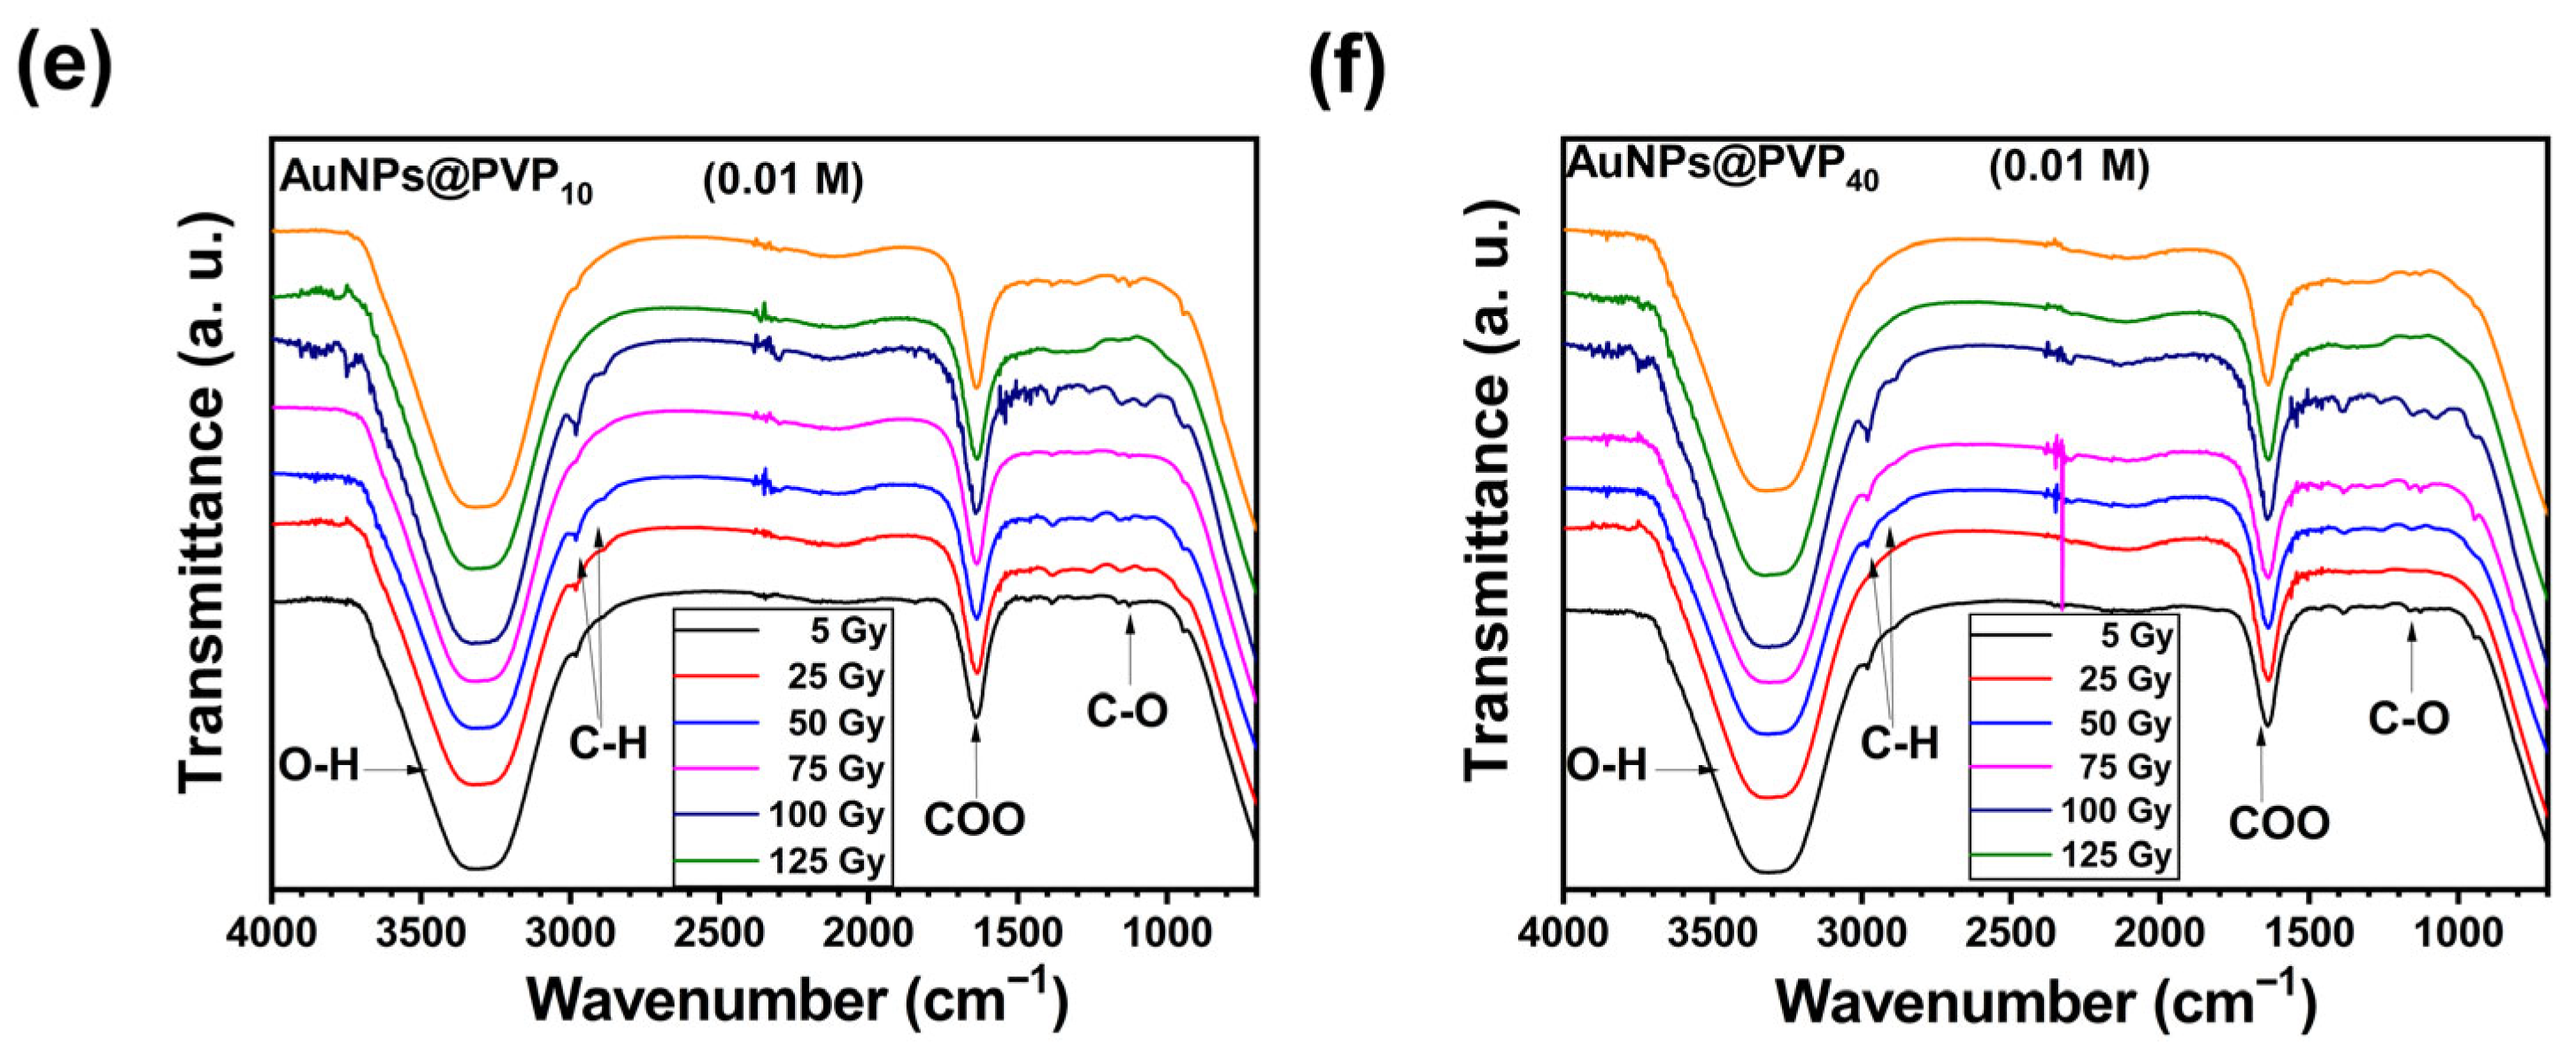
Figure 3a–f depicts the evolution of FTIR spectra of AuNPs@PVP with varying PVP chain lengths (PVP10 and PVP40) and polymer concentrations, subjected to gamma irradiation doses from 5 to 125 Gy. Control samples (0 Gy) show the characteristic bands as references. Low doses (5–25 Gy) produce minimal changes, maintaining PVP coordination. Moderate doses (50–75 Gy) cause a decrease in C=O stretching intensity and band broadening, suggesting partial polymer degradation or cross-linking. High doses (100–125 Gy) induce pronounced intensity reduction, band broadening, and appearance of new bands consistent with oxidation products. AuNPs@PVP10 shows lower radiation sensitivity than AuNPs@PVP40, likely due to molecular weight-dependent radical susceptibility [36].
Figure 3.
FTIR spectra of AuNPs@PVP by varying the chain length (PVP10 and PVP40) and polymer concentration (1.0, 0.1, and 0.01 M) to study the gamma radiation effect on polymer functional groups. Characteristics O-H, C-H, C=O and CO peaks are observed. AuNPs@PVP10 (a) 1.0 M, (b) 0.1 M, (c) 0.01 M and AuNPs@PVP40 (d) 1.0 M, (e) 0.1 M, (f) 0.01 M.
Comparative FTIR analysis revealed that AuNPs@PVP10 exhibited lower radiation sensitivity compared to AuNPs@PVP40 across all tested doses, which could be related to the formation of oxidation products. The lower radiation sensitivity of PVP10 can be attributed to its lower molecular weight, which results in increased susceptibility to radical-induced chain scission and oxidation reactions. The maintenance of C=O band could indicate that a significant fraction of PVP molecules maintains an Au-O coordination bond, providing some degree of protection against radiation-induced degradation, contributing to overall stability. Based on the FTIR analysis, the radiation-induced degradation of the AuNPs@PVP system appears to proceed through multiple pathways, including direct polymer chain scission and oxidation reactions forming carbonyl and hydroxyl functionalities.
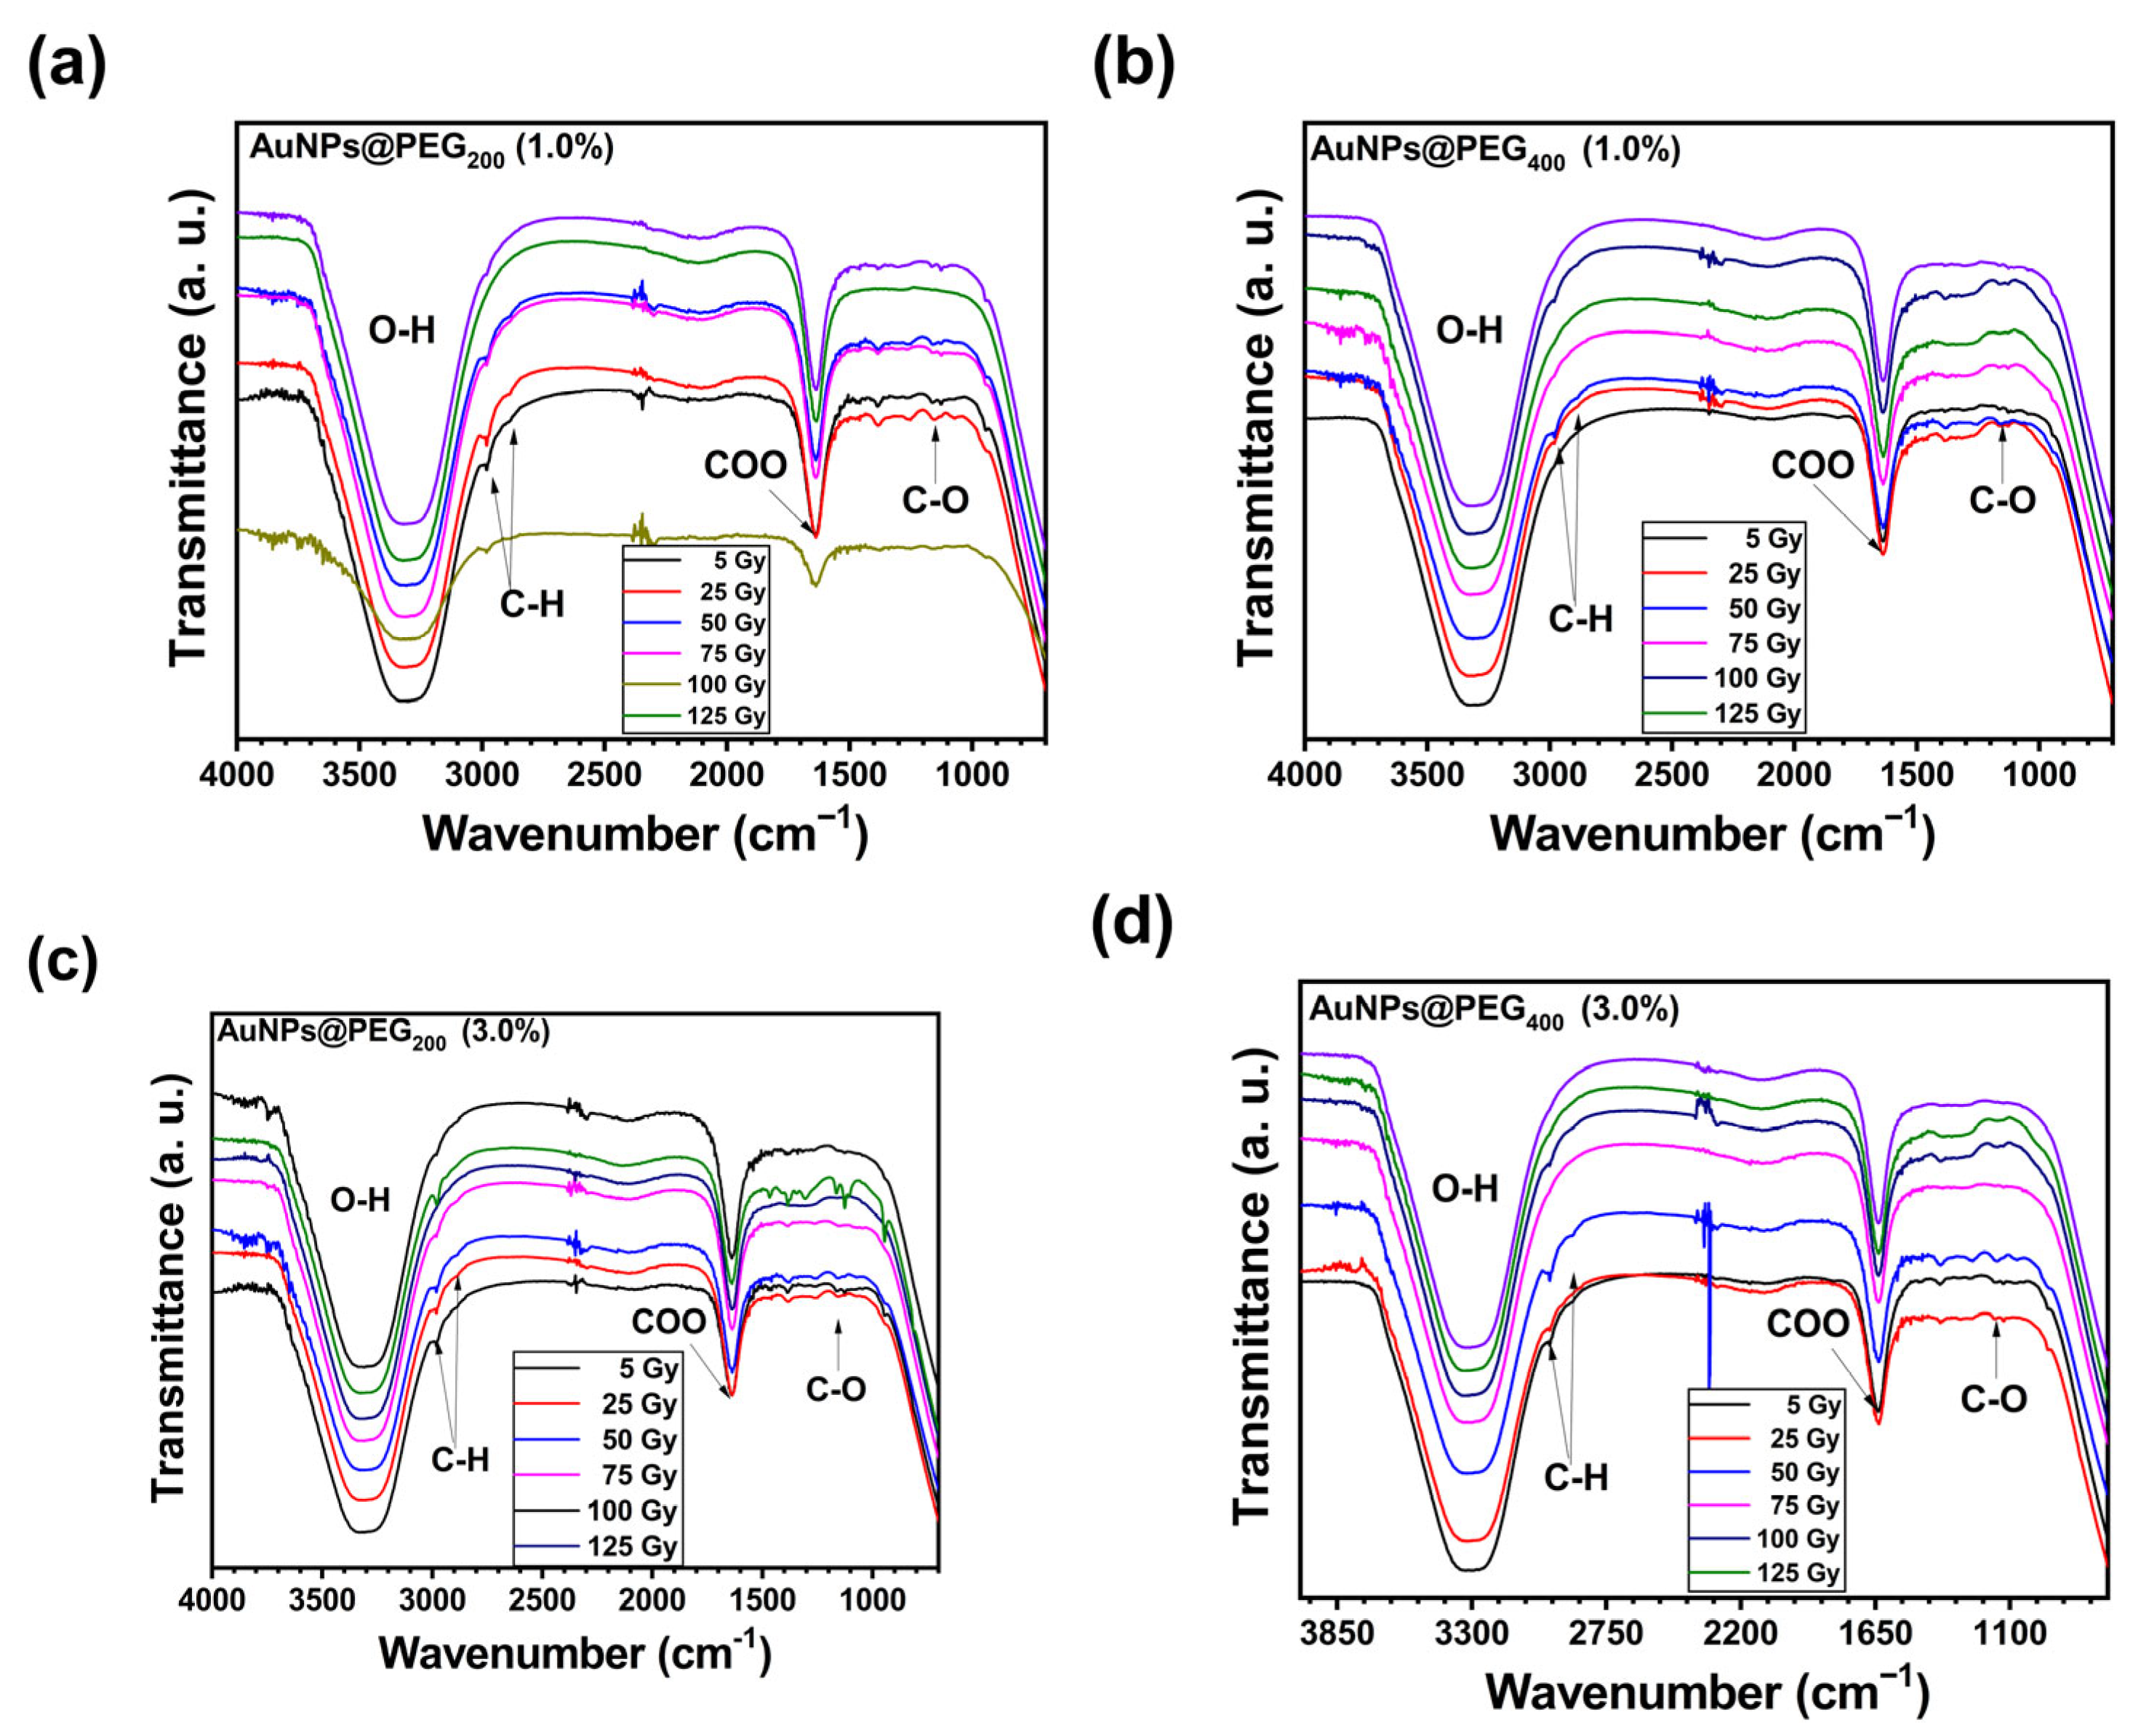
Figure 4a–d depict FTIR spectra of AuNPs@PEG (PEG200 and PEG400). All of them exhibit characteristic PEG vibrational bands at 2880 cm−1, 1467 cm−1, and 1114 cm−1, confirming polymer coating. The prominent carbonyl band at 1745 cm−1 suggests oxidative degradation during synthesis. Radiation causes aliphatic C-H bond degradation (decreased bands at 2880 and 1467 cm−1), while the C-O-C band remains stable even at higher doses [37]. This pattern aligns with oxidation-driven degradation mechanisms. Despite oxidation, colloidal stability remains, with zeta potentials from −20 to −40 mV and hydrodynamic diameters ranging from 10 nm to 100 nm for PEG200 (1.0%) and PEG400 (3.0%), respectively.
Figure 4.
FTIR spectra of AuNPs@PEG by varying the chain length (PEG200 and PEG400) and polymer concentration (1.0% and 3.0%) to study the gamma irradiation effect on polymer functional groups. Characteristics O-H, C-H, C=O and CO peaks are observed. (a) AuNPS@PEG200 (1.0%), (b) AuNPS@PEG400 (1.0%), (c) AuNPS@PEG200 (3.0%), (d) AuNPS@PEG400 (3.0%).
The low intense LSPR in AuNPs@PEG200 can be attributed to the oxidation of the polymeric shell, evidenced by the emergence of carbonyl and ether bands in the wavelet-resolved FTIR spectra. This oxidative process may modify the rigidity of the interfacial layer, dampening the collective oscillation of conduction electrons on the gold surface. In contrast, nanoparticles stabilized with PEG400 retain a well-defined LSPR band, indicating a less oxidized polymeric shell (Figure 4a,b). FTIR provides molecular-level understanding of the chemical bonds and functional groups, complementing the electronic information from optical analysis. While UV-Vis detects the LSPR related to the AuNP core, FTIR reveals chemical changes in the polymer coating due to radiation.
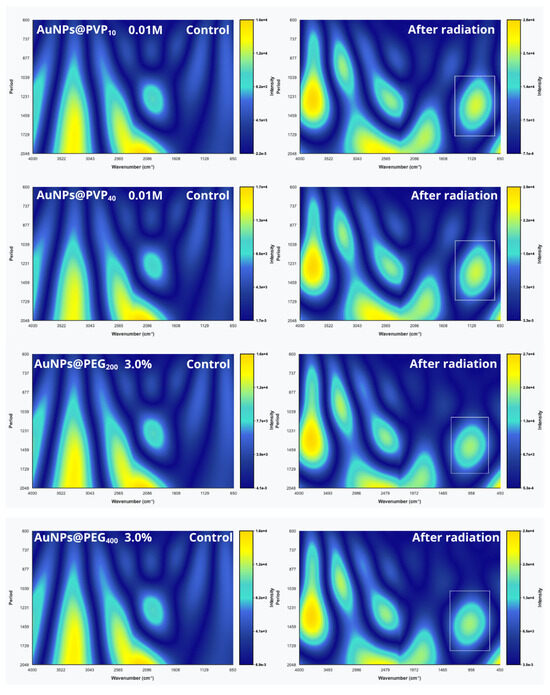
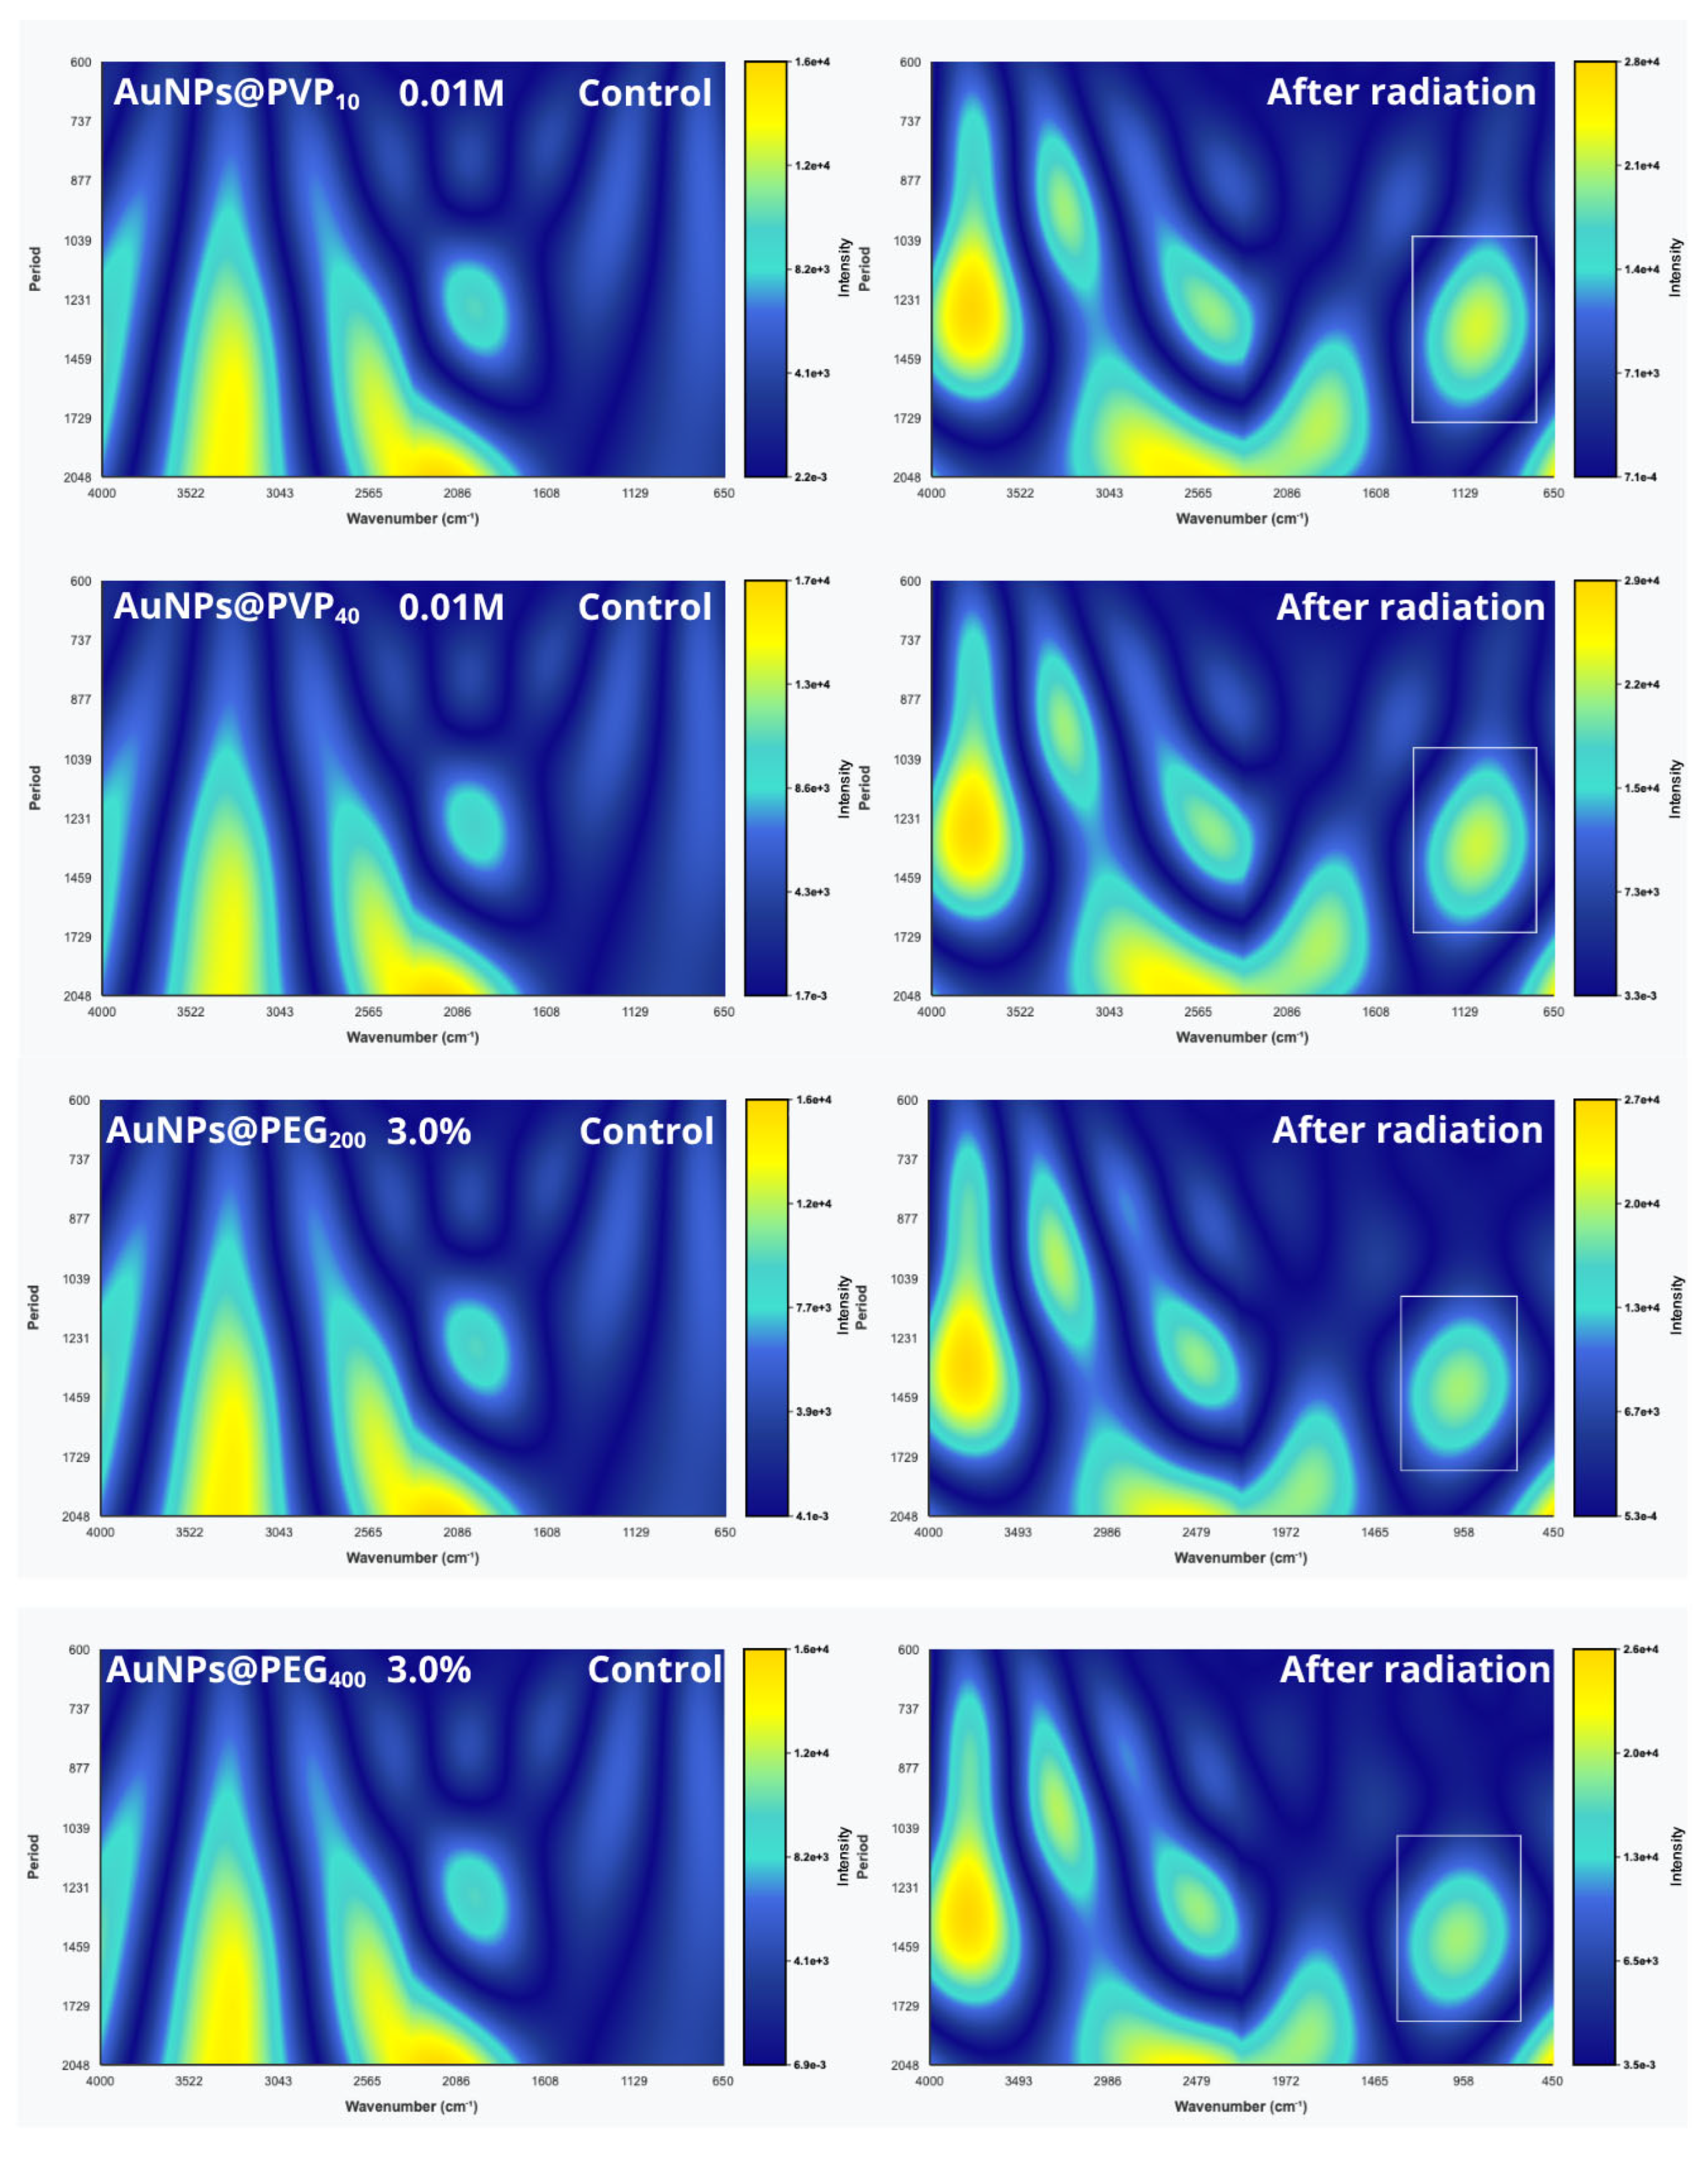
Wavelet transform analysis applied to FTIR spectra enables identification of subtle chemical changes, providing comprehensive insight into how the polymer influences the chemical stability and degradation of nanoparticle coatings during irradiation. Continuous wavelet transform (CWT), using the Morlet wavelet function, was performed with MATLAB R2024b (MathWorks, Natick, MA, USA) and Python software (Python 3.12.1 (Python Software Foundation, Beaverton, OR, USA) (Figure 5), generating scalograms for scales of 600 to 2000. Figure 6 compares 2D scalograms of control (0 Gy) and 75 Gy samples to complement UV-Vis observations. CWT-FTIR analysis of gamma-irradiated PVP10 and PVP40 (75 Gy) revealed concentration-dependent oxidative degradation characterized by C–H band depletion (3043 cm−1), enhanced O–H intensity (3522 cm−1), and expansion of C=O bands, indicating heterogeneous carbonyl products (ketones, aldehydes, acids, esters). Enhanced C–O–C ether bands (1129 cm−1) suggest cross-linking, and novel low-frequency absorptions (650–958 cm−1) point to cyclic degradation products such as lactones and anhydrides as well as chain fragments. For PVP40 at 1.0 and 0.01 M, C–H depletion might represent the primary degradation pathway influencing nanoparticle functionality post-irradiation. Overall, a heterogeneous C=O expansion and abundant cyclic degradation products with O–H enhancement were observed.
Figure 5.
Continuous wavelet transform (CWT) analysis of FTIR spectra, comparing non-irradiated control samples (0 Gy) and gamma-irradiated samples (75 Gy). Scalograms displaying the scale-resolved spectral features highlight radiation-induced chemical modifications and oxidative degradation in polymer-coated AuNPs. The CWT enables detection of subtle spectral changes not visible in direct FTIR spectra, facilitating detailed molecular-level insight into the effects of gamma radiation on polymer stability.
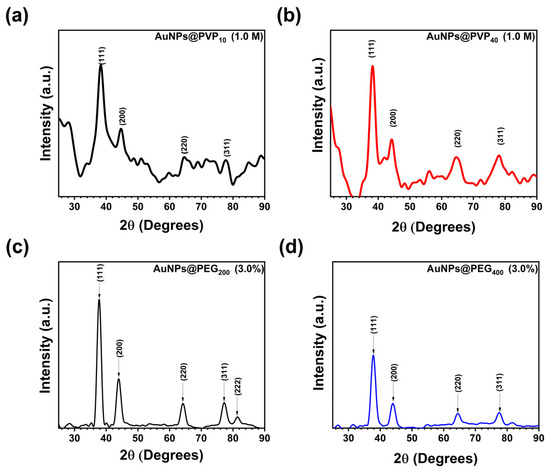
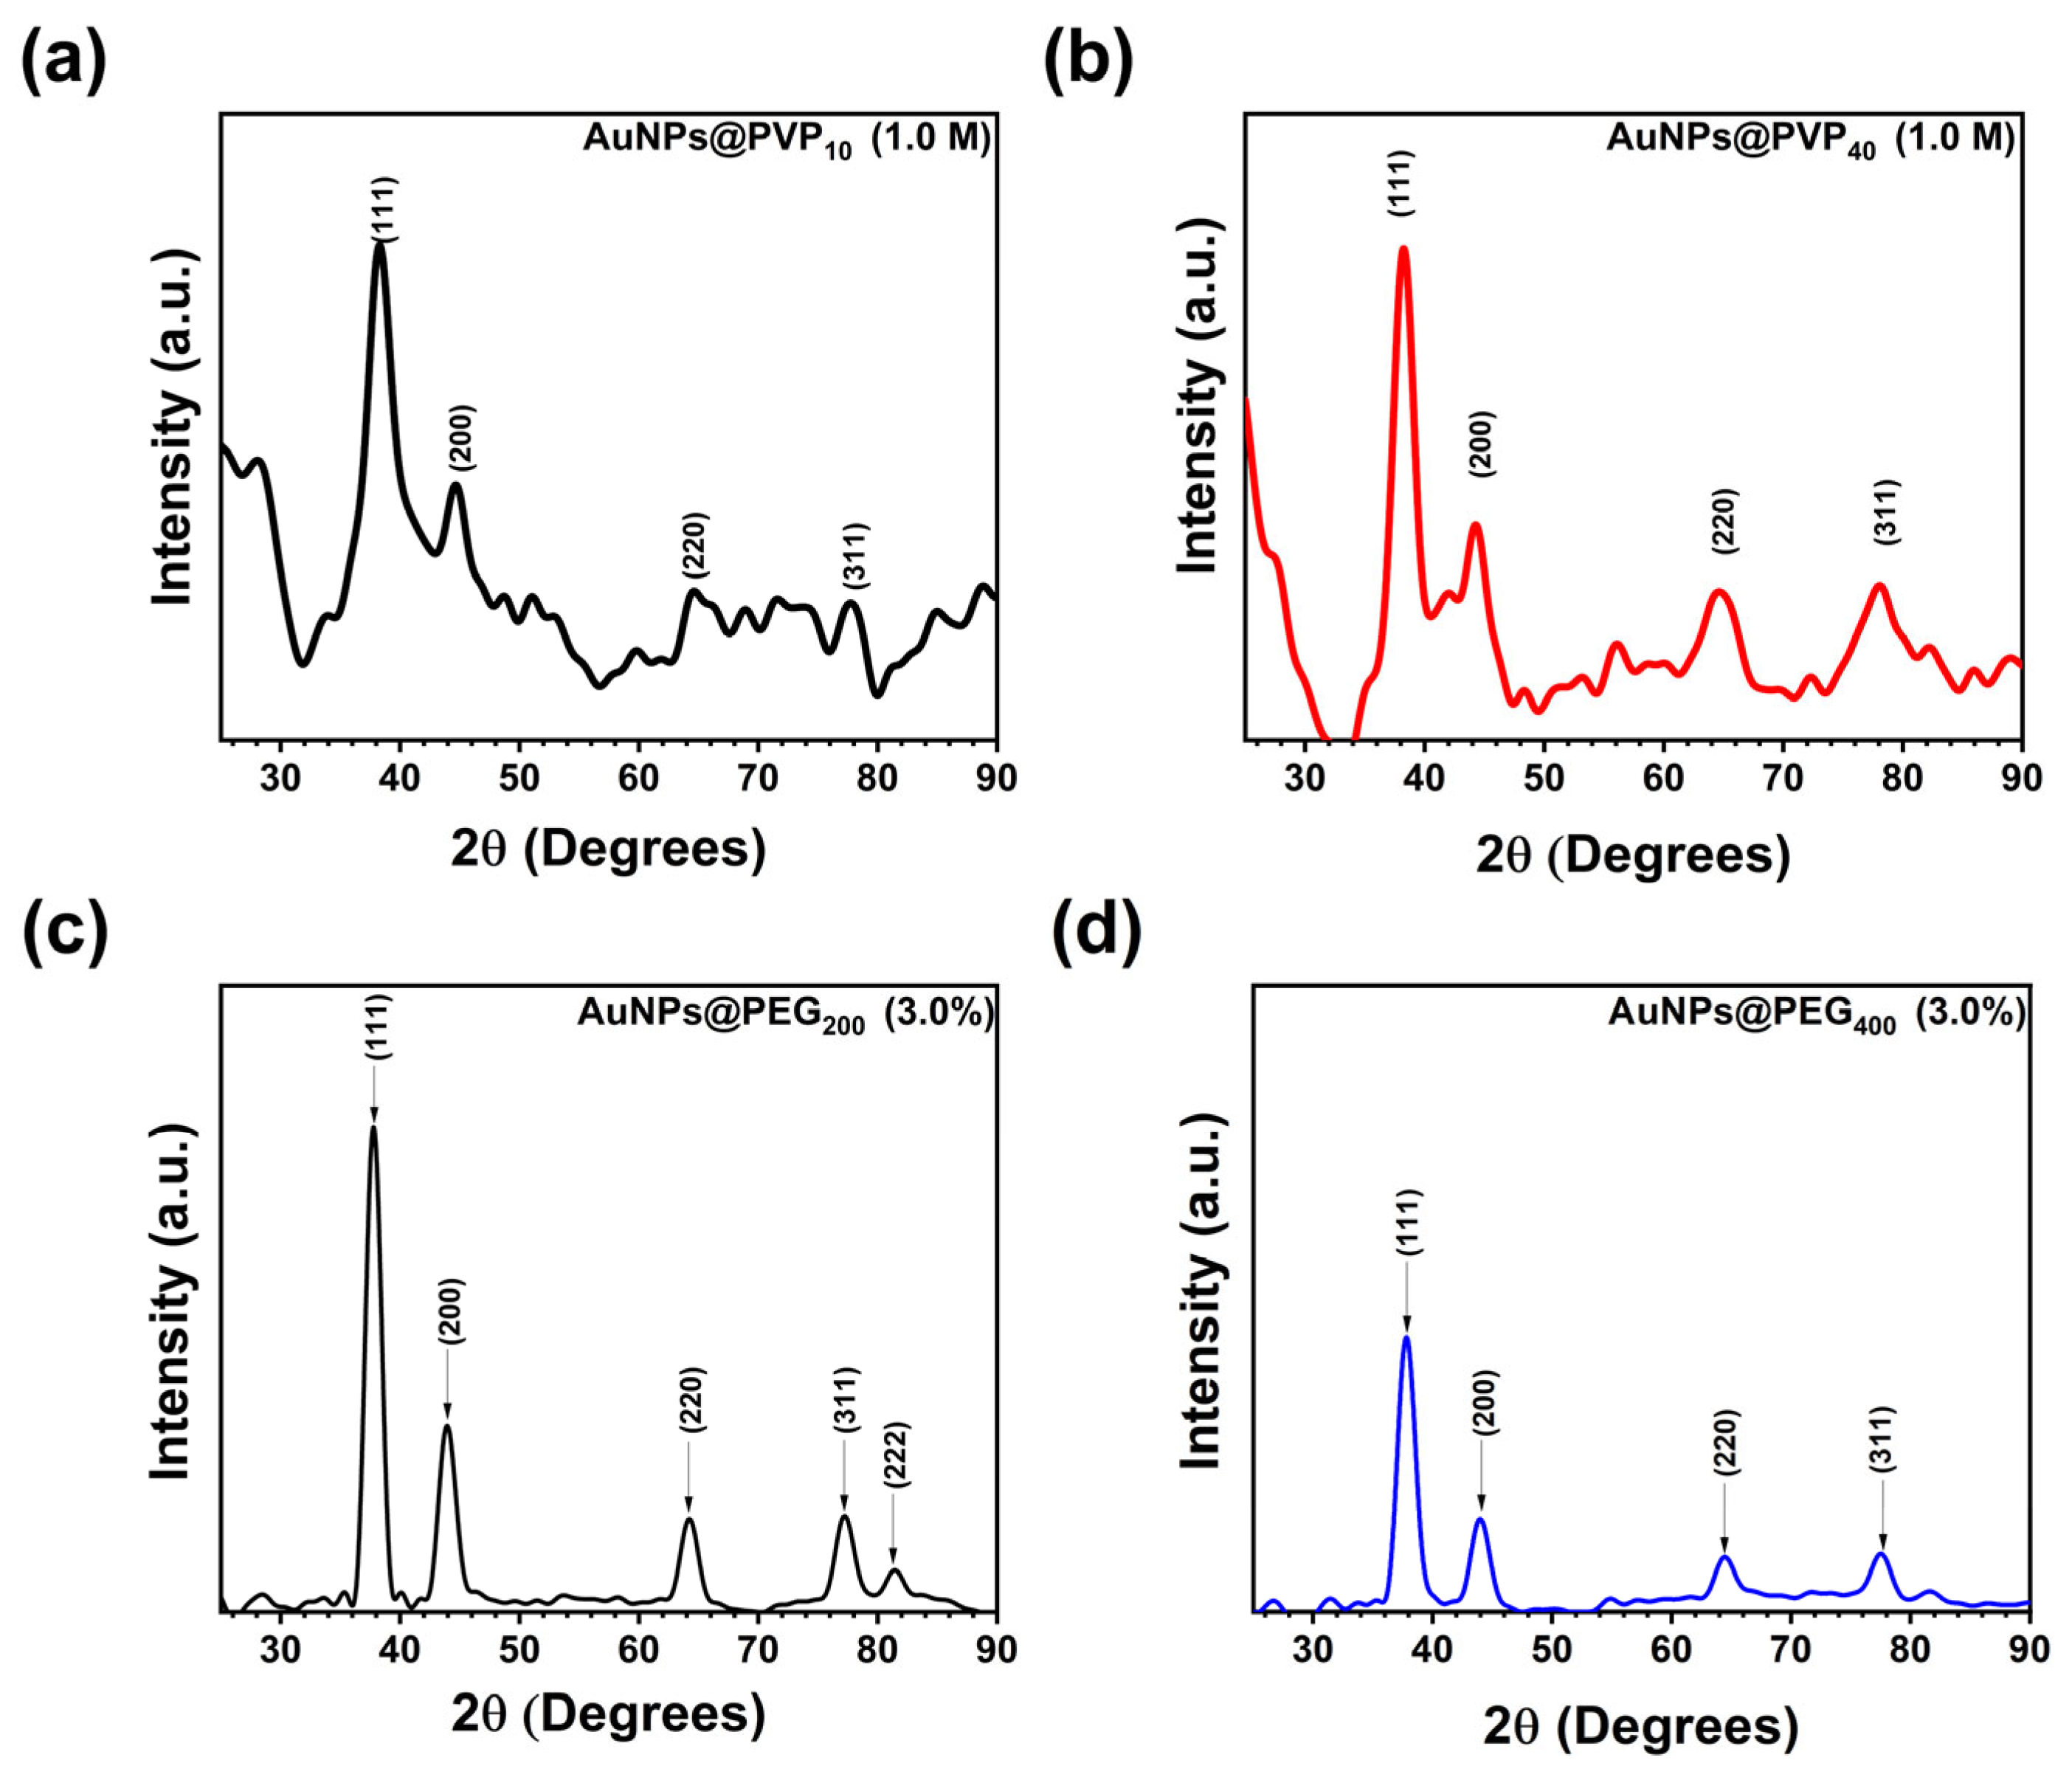
Figure 6.
XRD diffractograms of polymer-stabilized AuNPs exhibiting peaks that correspond to the (111) crystallographic planes of face-centered cubic (FCC) gold (ICDD:04-0784). (a) AuNPs@PVP40 (1.0 M), (b) AuNPs@PVP40 (1.0 M), (c) AuNPs@PEG200 (3.0%), (d) AuNPs@PEG400 (3.0%).
CWT-FTIR analysis of gamma-irradiated PEG formulations (PEG200 and PEG400 at 1.0–3.0%, 75 Gy) revealed scale-resolved oxidative degradation across all molecular weights and concentrations. C-H bands in PEG400 demonstrate greater radiation resistance compared to PEG200, consistent with UV-Vis LSPR observations where PEG200 fails to preserve LSPR while PEG400 maintains it. This may arise from more extensive damage to the C-H backbone of PEG200 before irradiation, evident in the CWT-FTIR intensity graphs from 2D scalograms. Aliphatic reductions indicative of backbone degradation is seen beyond 25 Gy, peaking at 75 Gy and slightly recovering at 100 Gy. Compensatory oxidation is observed via increased carbonyl intensity in PEG200 3.0% compared to 1.0%, indicating heterogeneous oxygen-containing product formation. The intense low-frequency absorption at 1000 cm−1, absent in controls, is a strong marker of degradation products and chain fragments. These data confirm that pegylated AuNPs undergo concentration-independent oxidative degradation under gamma irradiation, with C=O vibrations as definitive molecular transformation indicators.
The combined FTIR and wavelet transform analyses unequivocally confirm the successful functionalization of gold nanoparticles (AuNPs) with PVP and PEG polymers. The characteristic shifts in the C=O stretching band and other vibrational modes in FTIR spectra demonstrate strong coordination between polymer functional groups and the AuNP surface. Wavelet transform of the FTIR data reveals refined, localized chemical changes induced by gamma radiation, enabling detailed detection of polymer degradation pathways such as oxidation, cross-linking, and chain scission. Despite these radiation-induced modifications, both FTIR and wavelet analyses evidence the overall structural integrity and stabilization capability of the polymer coatings, particularly highlighting the enhanced radiation resistance of lower molecular weight PVP10 compared to PVP40.
3.2.1. XRD Analysis
X-ray diffraction (XRD) analysis was performed in the 2θ range of 20° to 90° to elucidate the crystalline structure of selected AuNPs coated with both PVP10 and PVP40 (1.0 M) and PEG200 1.0% and 3.0%. Figure 6 depicts the XRD diffractogram of AuNPs@PVP, exhibiting well-defined diffraction peaks at 2Q = 38.2°, 44.70°, 64.4°, and 77.4°, corresponding to the (111), (200), (220), and (311) crystallographic planes of FCC gold (ICDD:04-0784). These results confirm the formation of highly crystalline metallic AuNPs. No discernible shift in peak positions was detected between PVP10- and PVP40-coated nanoparticles, indicating that the polymer coating does not modify the intrinsic crystal lattice of gold. However, a slight increase in peak broadening was observed in the PVP40 formulation, suggestive of smaller crystallite size or augmented microstrain relative to the PVP10 AuNPs.
The AuNPs@PEG200 (3.0%) exhibited peaks at 2θ = 37.68° (111), 2θ = 43.98° (200), 2θ = 64.17° (220), 2θ = 77.12° (311), and 2θ = 81.52° (222). With increasing PEG concentration, the peak positions slightly shifted at 37.61°, 43.82°, 64.49°, and 77.55°, corresponding to the (111), (200), (220), and (311) crystallographic planes observed.
The average crystallite sizes were estimated using the Scherrer equation applied to the full width at half maximum (FWHM) of the (111) peak, yielding values of 6.61 nm (PVP40) and 7.20 nm (PVP10). AuNPs@PEG200 (1.0%) and AuNPs@PEG200 (3.0%) yielded crystallite size values of 13.98 nm and 9.5 nm, respectively.
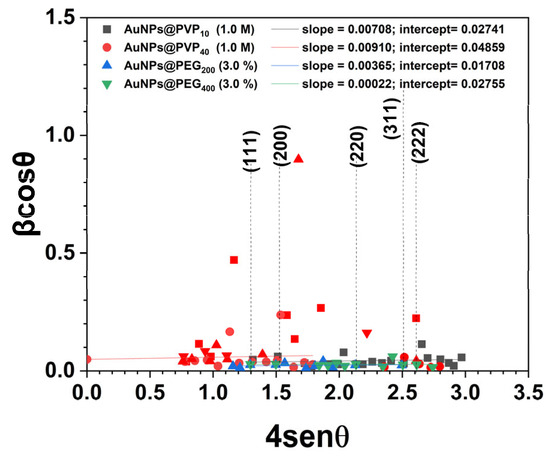
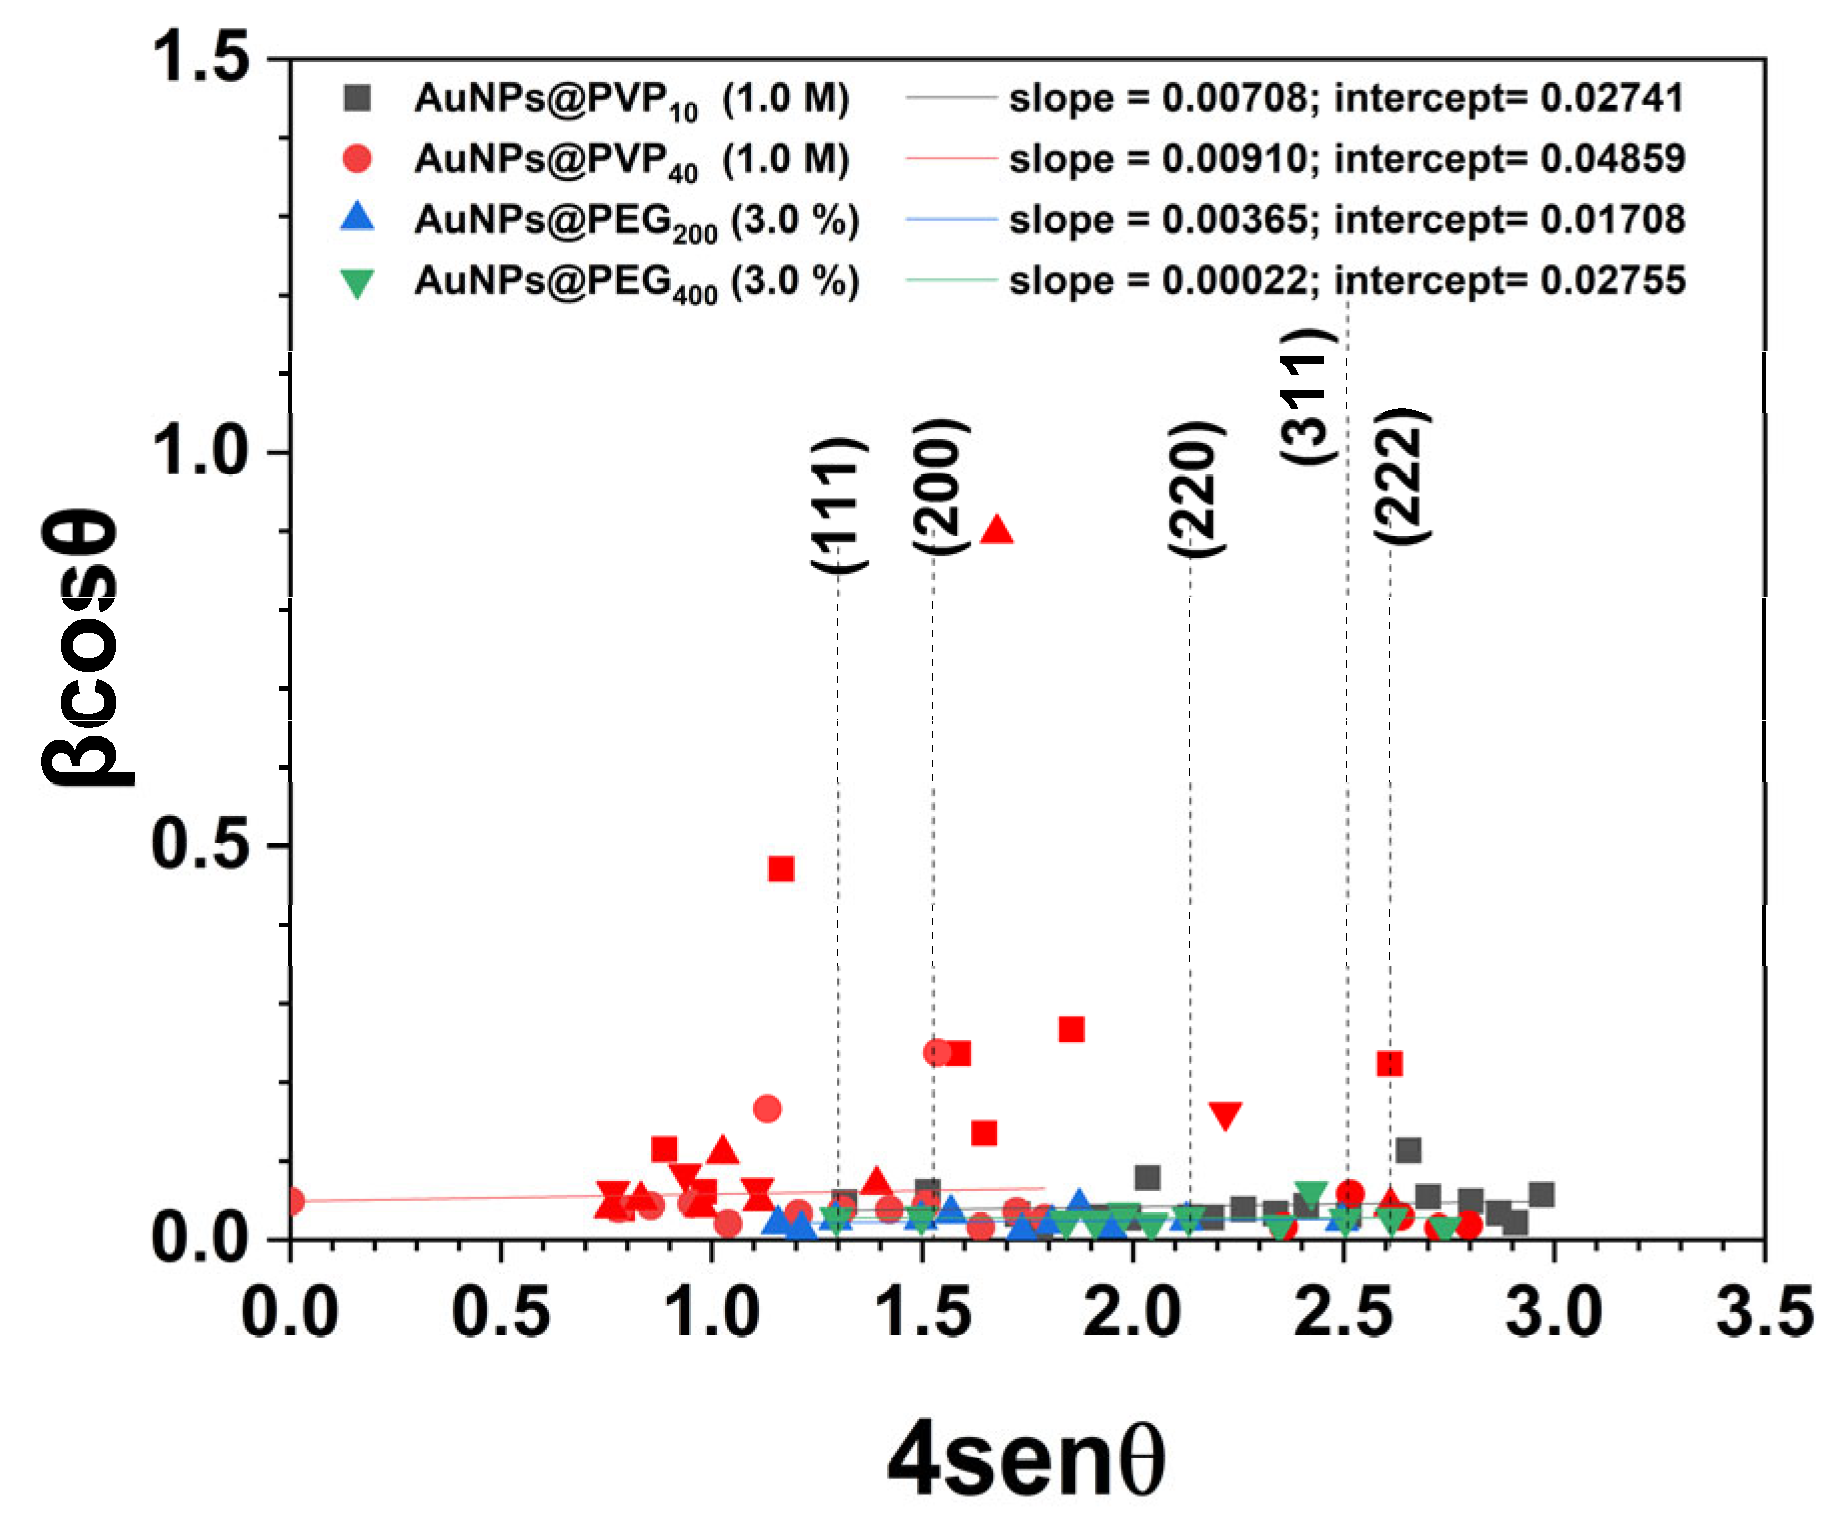
To further analyze the contributions of dislocation density and lattice strain to peak broadening, the Williamson–Hall method was employed (Figure 7). This technique enables simultaneous determination of the dislocation density and microstrain by considering the dependence of peak broadening on both 1/cos θ (size effect) and tan θ (strain effect). The plot of versus shows a linear behavior, and the slope indicates the microstrain (Figure 7). These results demonstrate that AuNPS exhibits a crystalline structure with measurable lattice distortions, which could influence their physicochemical properties and potential applications.
Figure 7.
Linear fit of the W-H model obtained from the XRD patterns of the polymer-stabilized AuNPs with PVP10 and PVP40 at 1.0 M and PEG200 and PEG400 at 1.0% and 3.0%.
Further, the unit cell volume of AuNPs was calculated based on the cubic lattice parameter, resulting in a volume of and for PVP40 and PVP10, respectively. On the other hand, the pegylated AuNPs resulted in a cell volume of 0.0689 and 0.0677 for 1.0% and 3.0%, respectively. This parameter facilitates the estimation of the number of unit cells per nanoparticle, considering the spherical geometry and crystallite size. The observed variation in the unit cell volume of AuNPs coated with both PVP and PEG can be attributed to the physicochemical interactions and structural effects that each polymer induces at the nanoparticle surface. Polymers differ in chain flexibility, molecular weight, functional groups, and steric configuration, leading to diverse interfacial stress imposed on the gold lattice. The coating can exert different surface tensions and strain environments on the metallic crystal lattice, which slightly expand or contract the lattice parameter measured. Moreover, differences in polymer crystalline and the extent of polymer coating near the metal surface can influence local structural rearrangements, provoking changes in lattice strain and, hence, volume. Laser-assisted techniques may also contribute to thermal and mechanical stresses during AuNPs preparation and further measurements, contributing to unit cell volume variability. Therefore, the unit cell volume variation reflects the interplay between the intrinsic gold lattice and the extrinsic effects of polymer coating chemistry and morphology, impacting nanoparticle stability, surface, energy, and, ultimately, functional properties. Consequently, this allows for approximate calculation of the number of gold atoms per nanoparticle, given that the FCC unit cell contains four atoms. These comprehensive analyses deepen the understanding of the physicochemical properties of nonionic polymers stabilizing AuNPs produced by the laser-assisted technique.
In summary, the XRD and W-H analyses confirm that both PVP and PEG coatings effectively stabilize gold nanoparticles. These findings validate the capability of polymer coatings to tailor nanoparticle size and microstructure.
3.2.2. Physicochemical Characterization and Radiation Stability of PVP-Functionalized Gold Nanoparticles
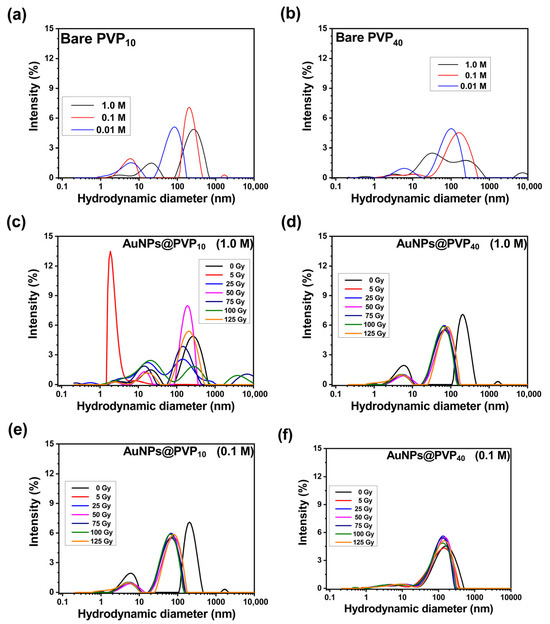
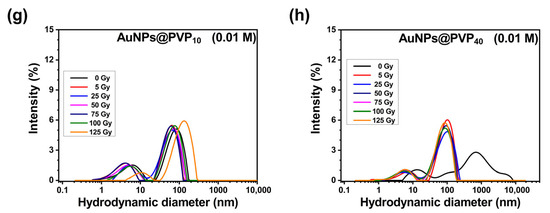
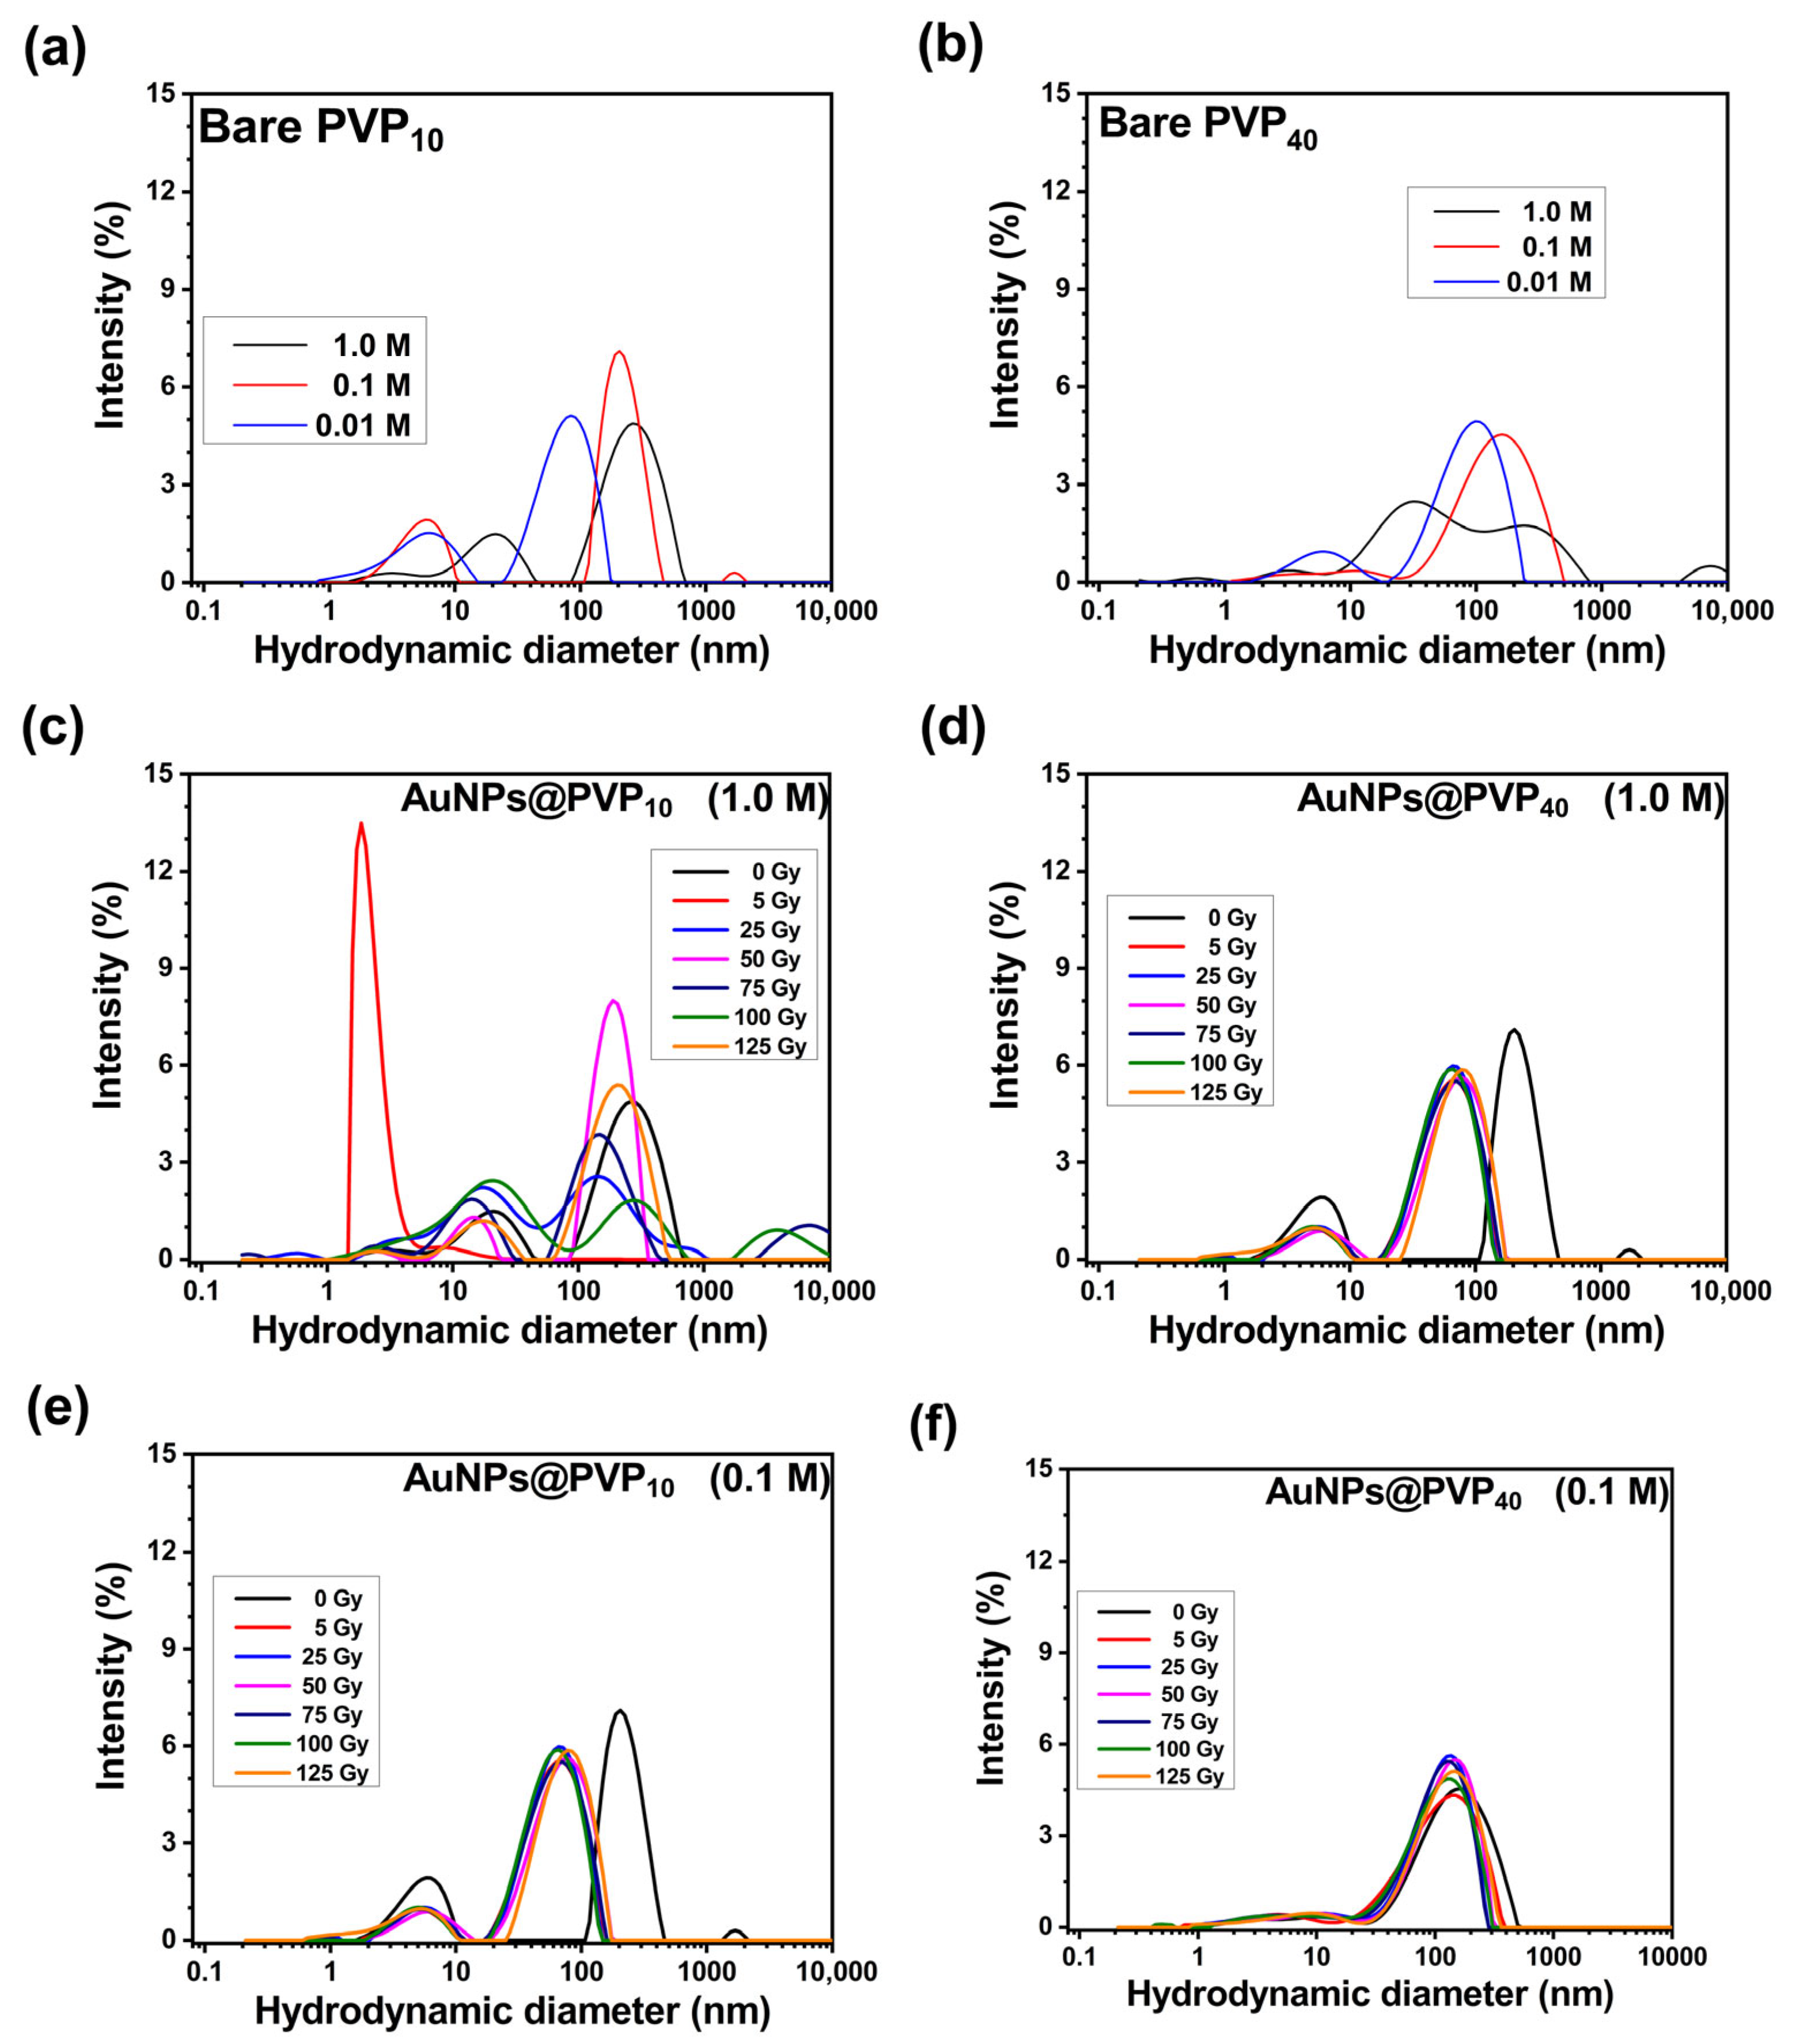
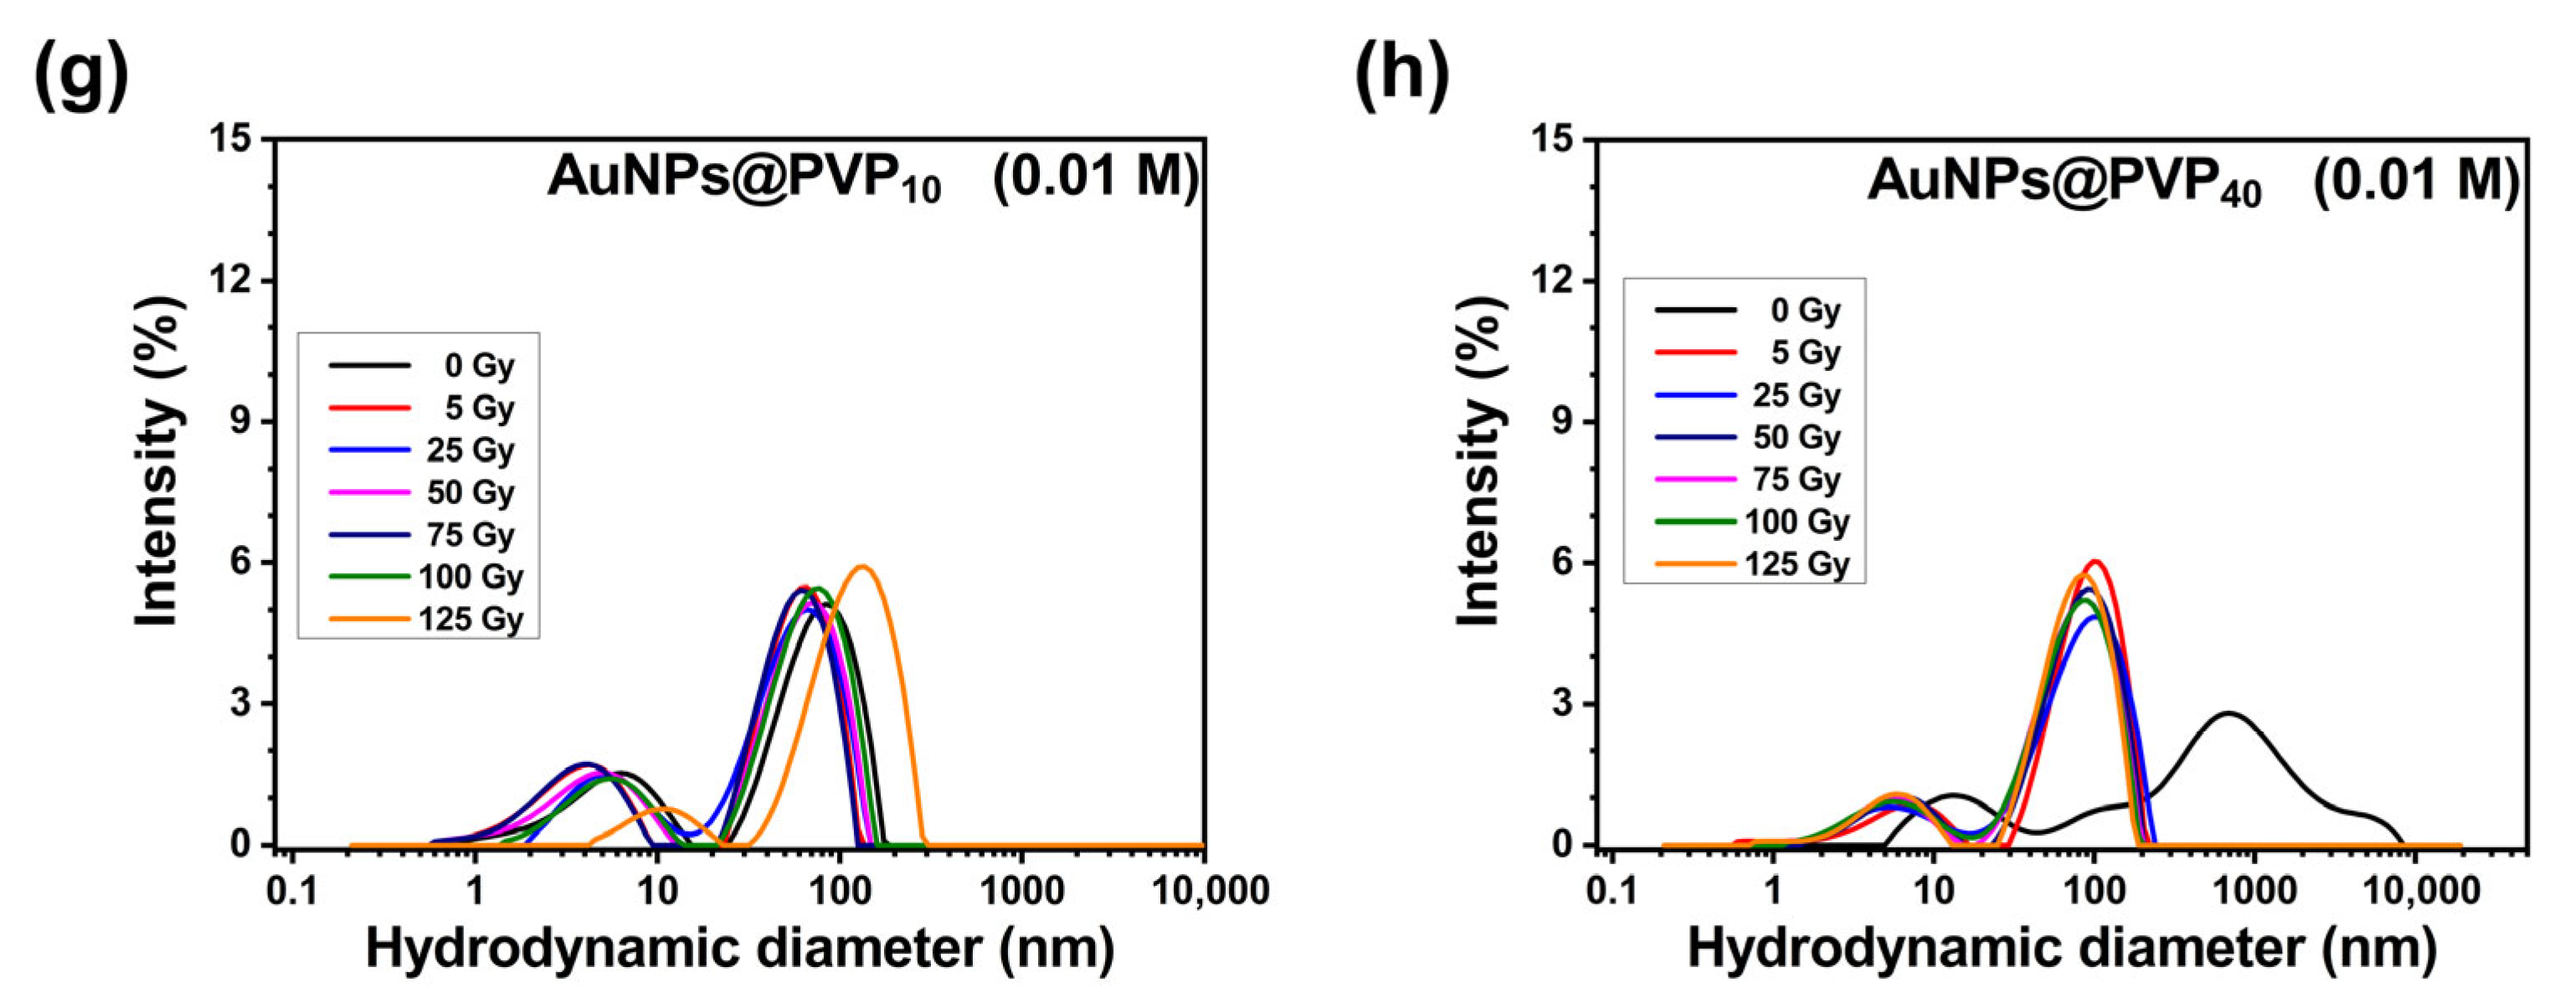
Systematic physicochemical characterization of AuNPs@PVP was conducted using DLS and zeta potential analysis of PVP10 and PVP40 at 1.0, 0.1, and 0.01 M. Initial hydrodynamic diameter measurements (Figure 8a–h) revealed distinct concentration-dependent behaviors between PVP molecular weights. AuNPs@PVP10 exhibited a pronounced inverse concentration–size relationship, with mean diameters decreasing from 171 nm at 1.0 M to 41 nm at 0.01 M across the concentration range tested. This monotonic trend suggests enhanced polymer surface coverage at higher concentrations, leading to increased steric stabilization and reduced interparticle aggregation [30,38]. Conversely, AuNPs@PVP40 demonstrated non-monotonic size dependence with an intermediate maximum at 0.1 M (112 nm), contrasting with smaller diameters at both 1.0 M (83 nm) and 0.01 M (59 nm), indicating that distinct polymer–nanoparticle interaction mechanisms may be governed by molecular weight-dependent conformational changes [19]. PVP40 yielded lower PDI values compared to PVP10 (0.273 vs. 0.293). Notably, the PVP40 system at 1.0 M achieves the lowest polydispersity (PDI: 0.235), indicating optimal size uniformity [39,40]. The hydrodynamic diameter tends to decrease as the PVP40 concentration decreased from 1.0 M to 0.1 M before further increasing at 0.01 M. Quite a different scenario was observed with PVP10 where a monotonic decrease in the hydrodynamic diameter was observed as the concentration also decreased, while PEG-coated AuNPs yielded high values of hydrodynamic diameters.
Figure 8.
Hydrodynamic size distributions of AuNPs@PVP measured by dynamic light scattering (DLS) under different experimental conditions. Panels (a,b) show size distributions of bare PVP10 and PVP40 at three different concentrations (1.0 M, 0.1 M, and 0.01 M) measured by DLS, serving as controls to evaluate polymer aggregation behavior independent of nanoparticle formation. Figures (c–h) correspond to variations in the polymer type, polymer concentration, polymer chain length, and gamma irradiation dose over AuNPs. Each panel shows the effect of these parameters on the nanoparticle size distribution, demonstrating how polymer characteristics and irradiation influence particle growth and stability.
Gamma irradiation stability assessment using a (Gammacell 200 Excel × GC-220E) with a 60Co source at room temperature with a dose rate of 12.1 Gy/min across 5–125 Gy range revealed concentration and molecular weight dependencies. AuNPs@PVP10 at 1.0 M exhibited size fluctuations: initial aggregation at 5 Gy (106 nm), followed by disaggregation at 25 Gy (74 nm), followed by a possible re-aggregation at 50 Gy (166 nm), and continued alternating behavior through 125 Gy (170 nm). In contrast, the 0.1 M formulation demonstrated radiation resistance with size stability, attributed to the preservation of the C-H backbone from FTIR results in good agreement with size distribution. The 0.01 M concentration revealed gradual size evolution in the 31–41 nm range through 100 Gy, followed by significant aggregation at 125 Gy (93 nm). This behavior indicates a critical dose threshold beyond which radiation-induced cross-linking overcomes polymer stabilization effects. AuNPs@PVP40 formulations demonstrated enhanced radiation resistance across all concentrations that could be attributed to structural integrity compared to PVP10 variants due to PVP40 providing a more effective protection against radiation.
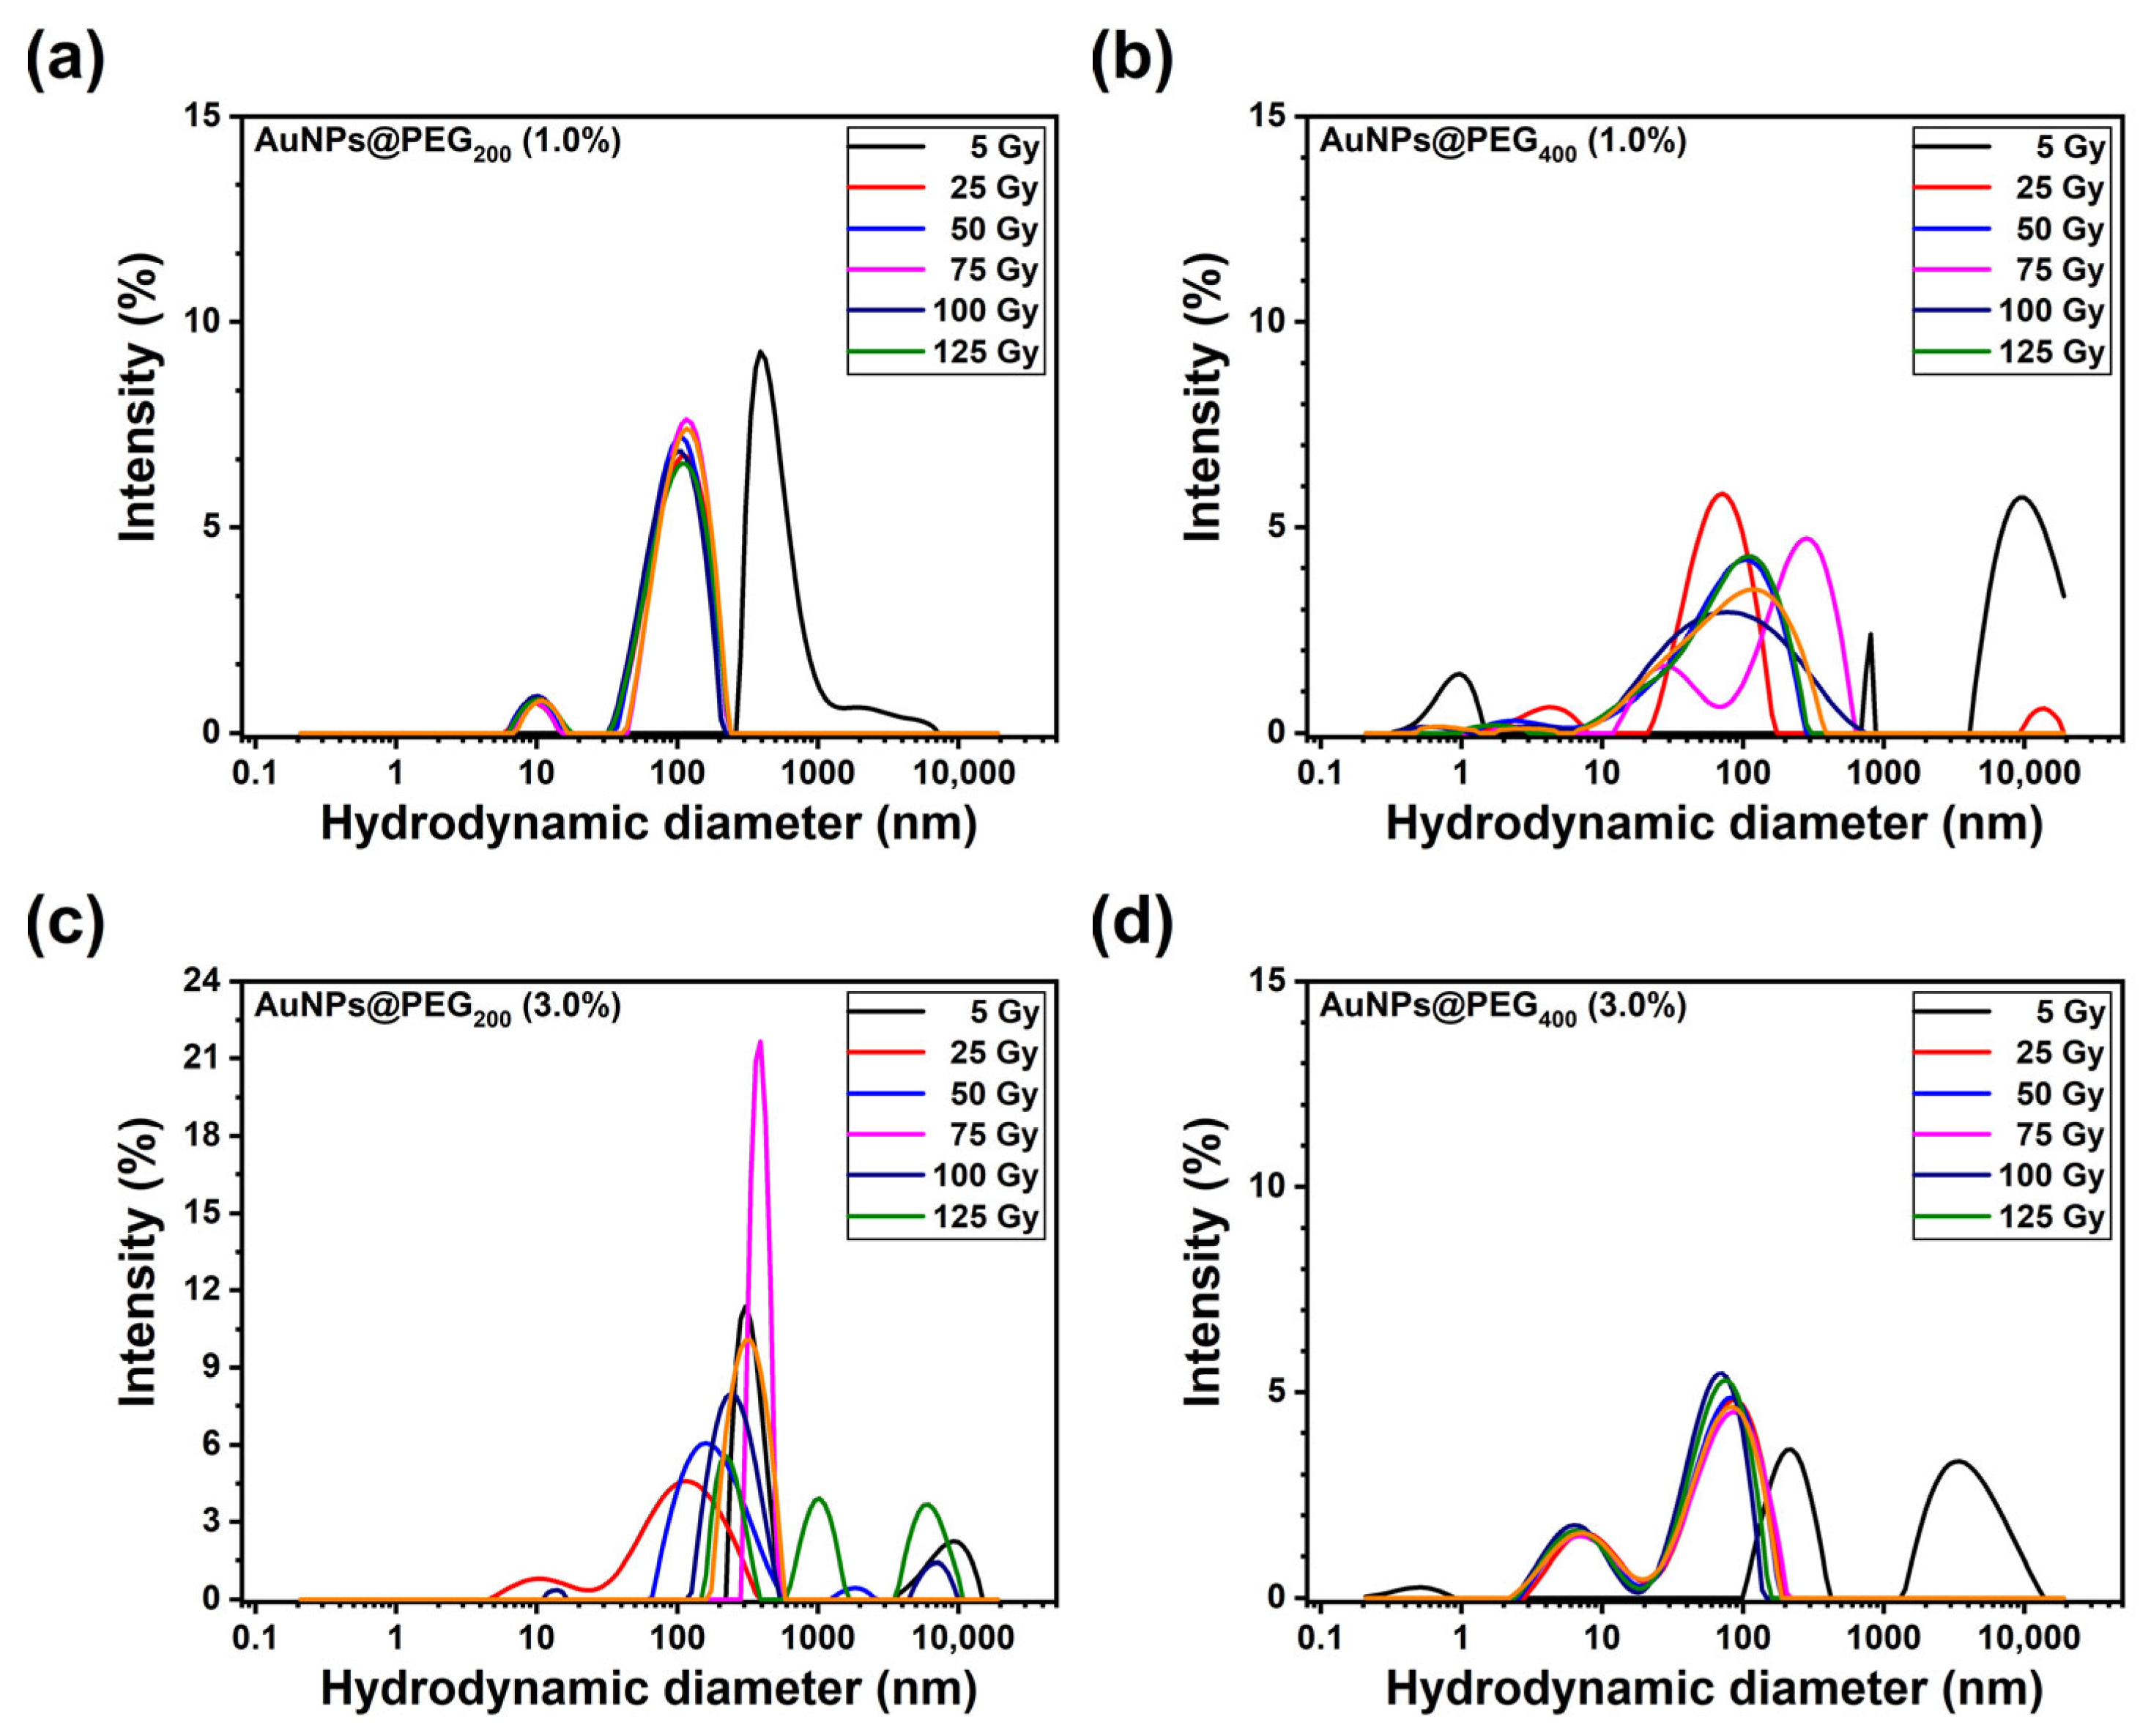
Physicochemical characterization of pegylated AuNPs was conducted using DLS and zeta potential analysis of PEG200 and PEG400 at stabilizer concentrations of 1.0% and 3.0% (Figure 9a–d). Size measurements revealed concentration-dependent behaviors between molecular weight variants. AuNPs@PEG200 exhibited an inverse concentration–size relationship, with mean diameters ranging from 95 nm at 1.0% to 423 nm at 3.0% across the concentration range tested. This suggests demerited polymer surface coverage at higher concentrations, leading to interparticle aggregation [24,37]. Conversely, AuNPs@PEG400 demonstrated non-monotonic size dependence with concentration of 1.0% (80 nm), contrasting with smaller diameters at 3.0% (42 nm), indicating distinct polymer–nanoparticle interaction mechanisms governed by molecular weight-dependent conformational changes. Polydispersity index analysis demonstrated higher monodispersity for higher molecular weight formulations across all concentrations tested. AuNPs@PEG400 (1.0%) exhibited structural instability characterized by size variations: an initial aggregation at 5 Gy (87 nm), followed by slight reduction at 25 Gy (87 nm), and 50 Gy (86 nm), followed by a possible re-aggregation at 75 Gy (97 nm), and 125 Gy (95 nm). In contrast, the PEG200 (3.0%) formulation demonstrated lowered radiation resistance which was correlated with CTW-FTIR analysis where a passivation of the surface could occur. Mean hydrodynamic diameters remain consistently within 100–600 nm across all tested doses. PDI values fluctuate throughout. PEG400 (1.0%) yields a similar result. The structural instability was characterized by size fluctuations in both PEG400 (1.0%) and PEG400 (3.0%).
Figure 9.
Effect of gamma irradiation dose on size of AuNPs@PEG, varying the chain length and concentration. (a) AuNPs@PEG200 (1.0%), (b) AuNPs@PEG400 (1.0%), (c) AuNPs@PEG200 (3.0%), (d) AuNPs@PEG400 (3.0%).
FTIR analysis identified progressive polymer degradation through systematic C=O band intensity reduction and appearance of oxidation products (1720–1750 cm−1), which could be correlated with DLS and zeta potential evolution toward more negative values. At low doses (5–25 Gy), structural changes were not evident, and that could be related to colloidal stability, with minimal DLS size variations and stable zeta potentials (−11 to −12 mV). Critical dose thresholds identified through CWT-FTIR analysis (C=O at 50–75 Gy) align with DLS aggregation onset and zeta potential shifts, establishing molecular origins of colloidal properties.
3.2.3. Zeta Potential Measurements
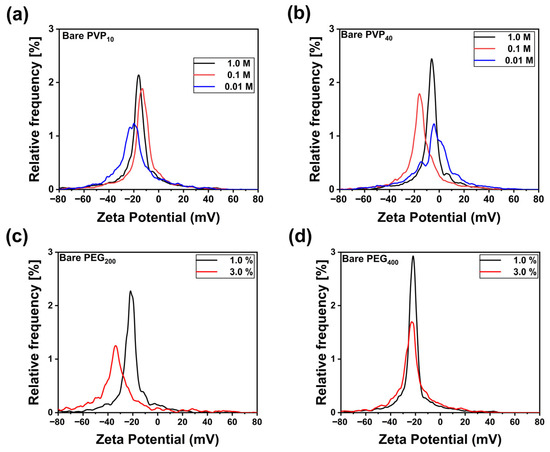
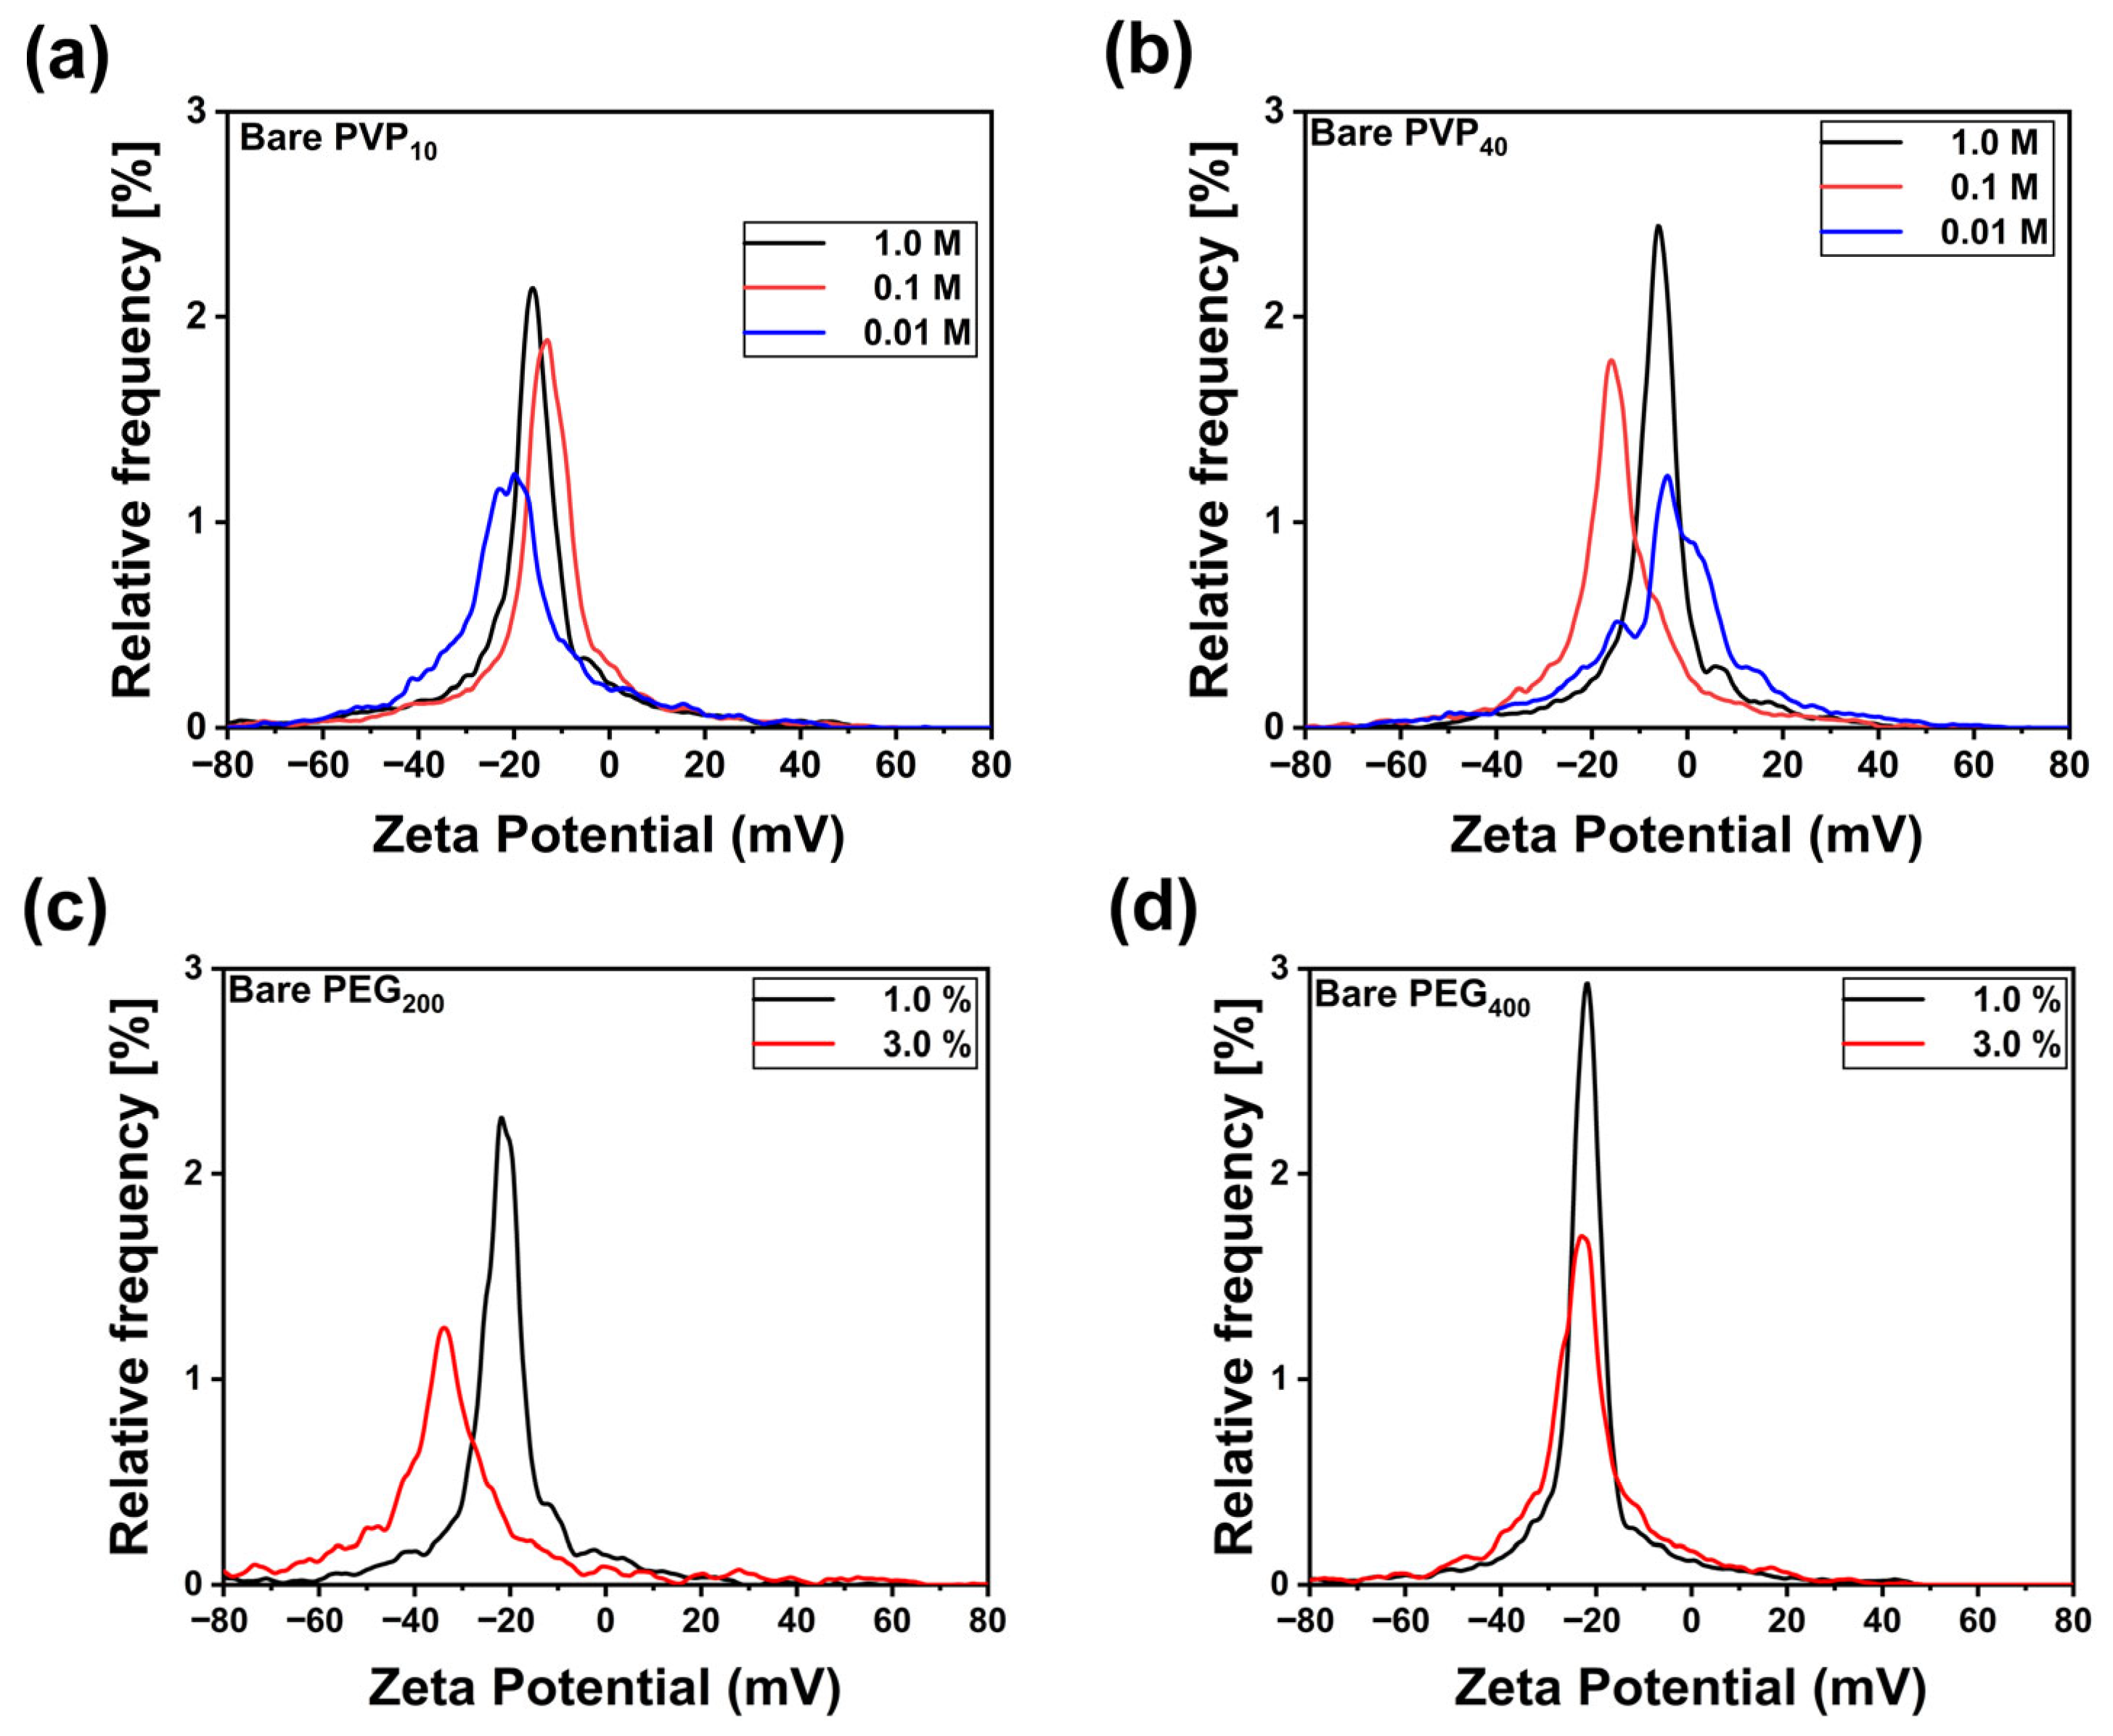
Electrokinetic characterization revealed concentration-dependent surface charge modulation correlating with polymer surface density (Figure 10). For AuNPs@PVP10, zeta potential values ranged from −18 mV (1.0 M) to −20 mV (0.01 M), while PVP40 formulations exhibited enhanced surface charge magnitude (−6 mV to −9 mV), consistent with increased polymer chain length and surface coverage. Otherwise, pegylated (PEG200) AuNPs yielded zeta potential values ranged from −40 mV to −20 mV. For PEG400, samples appear at −20 mV.
Figure 10.
Gamma irradiation (75 Gy) effects on the surface charge of nanoparticles produced by the laser-assisted method with (a) PVP10 and (b) PVP40 at 1.0, 0.1, and 1M, and (c) PEG200 and (d) PEG400 at 1.0% and 3.0%.
Gamma irradiation resulted in interesting effects on the surface charge of nanoparticles, despite the oxidative modification of both polymer coatings. PVP-stabilized AuNPs exhibited more negative zeta potentials with irradiation dose (ζGy0 = −18 mV → ζGy75 = −37mV, Δζ = −19 mV), while PEG-coated particles showed the opposite trend (ζ0Gy = −24 ± 2 mV → ζ75Gy = −11 ± 2 mV, Δζ = +13 mV). CWT-FTIR analysis revealed that this contrast arises from polymer-specific degradation pathways. PVP oxidation generated carboxylic acid functionalities at 1720–1740 cm−1 while preserving the lactam backbone structure, as was observed at 1660 cm−1 band. The formation of ionizable carboxyl groups accounts for the enhanced negative surface charge. Conversely, PEG degradation resulted in hydroxyl group depletion, as observed in the range from 3200 to 3600 cm−1 where intensity decreased, accompanied by ether backbone scission at the diminishing 1100 cm−1 band, and formation of non-ionizable carbonyl species was observed at 1720 cm−1, suggesting oxidation. The net loss of weakly acidic hydroxyl moieties reduced total surface charge density, yielding more positive zeta potentials despite extensive oxidative modification. These findings demonstrate that oxidation-induced surface charge alterations depend critically on the chemical identity of oxidation products and their ionization behavior.
3.2.4. Transmission Electron Microscopy (TEM)
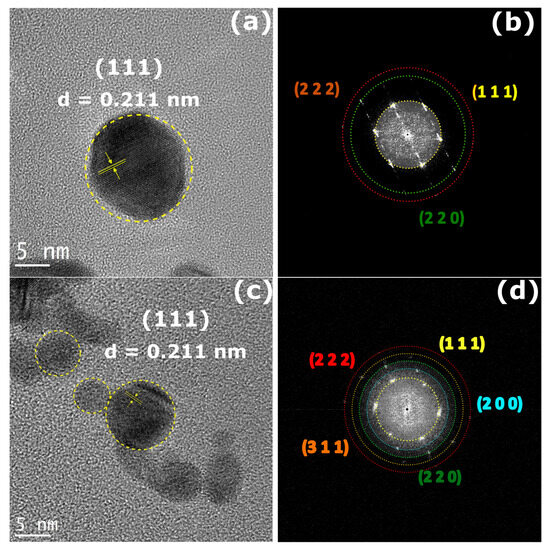
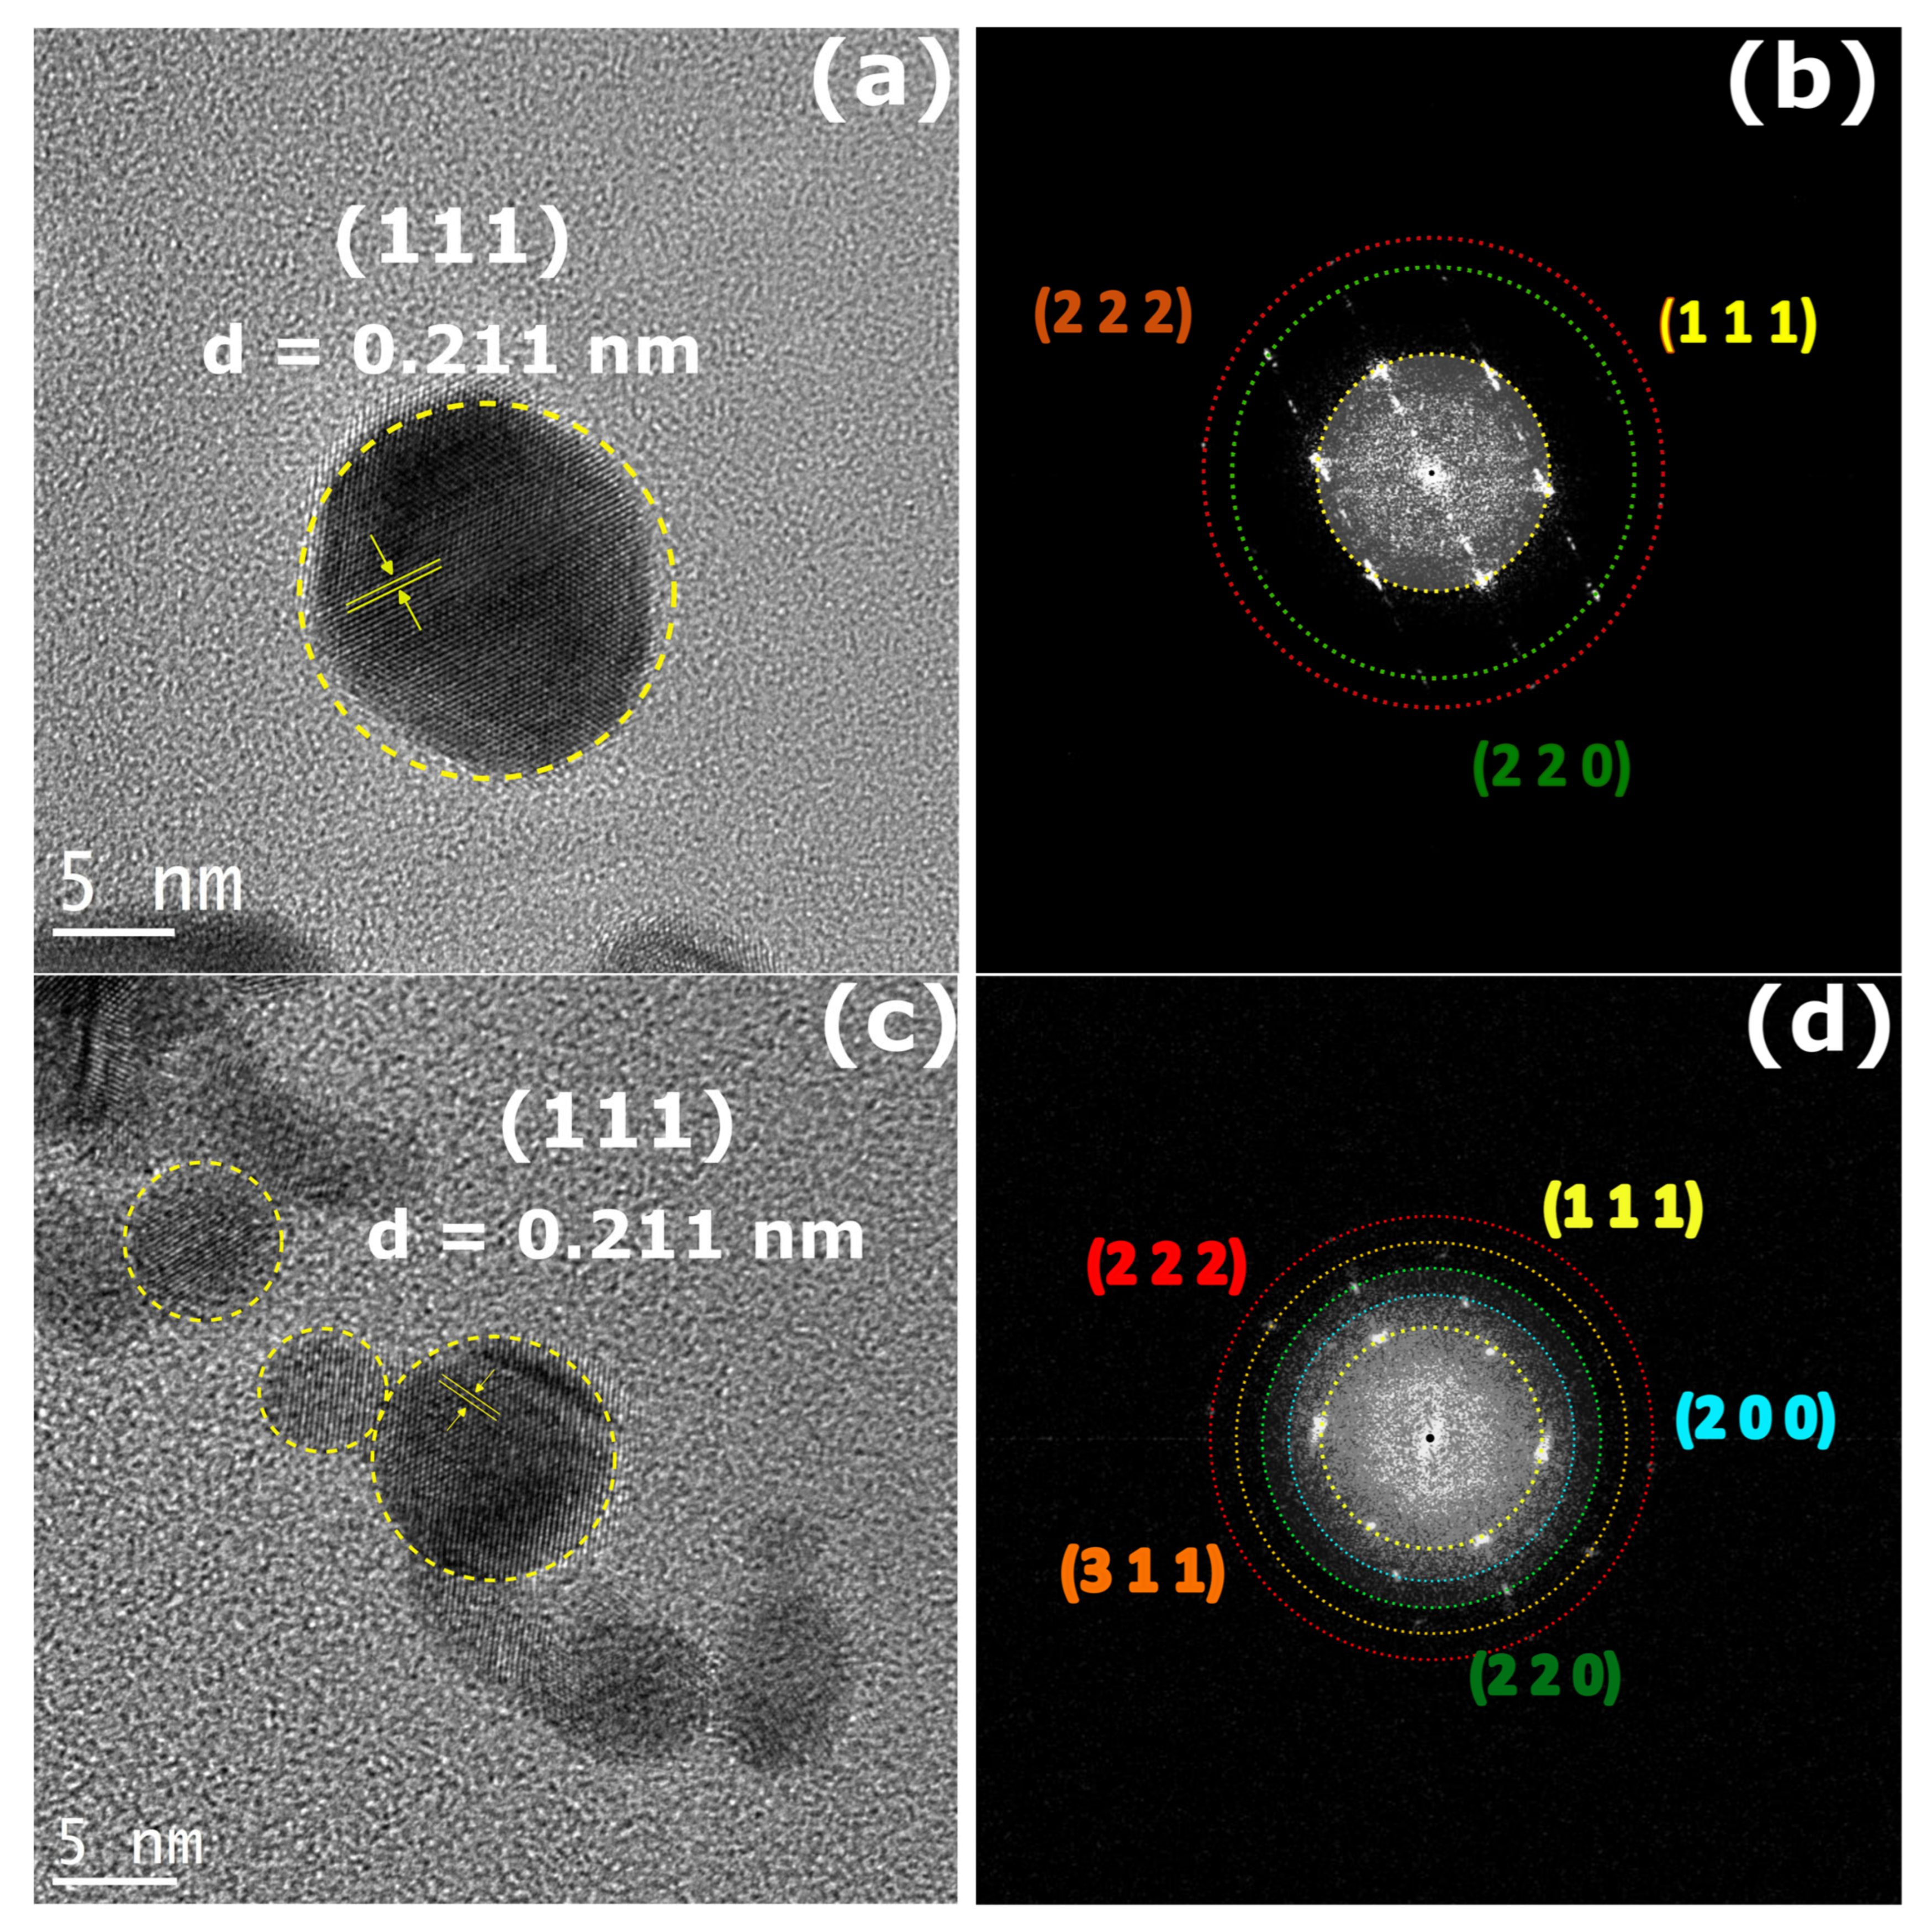
The morphology and size distribution of AuNPs were characterized by transmission electron microscopy, providing direct insight into their shape, size distribution, and crystalline structure. AuNPs@PVP40 (1.0 M) TEM images (Figure 11a) revealed that the AuNPs exhibited predominantly spherical morphology with well-defined edges and smooth surfaces, with no significant aggregation observed, indicating good dispersion. Figure 11b, displays the ring pattern of stabilized AuNPs@PVP40 (1.0 M), the signals related to the crystallographic planes (111), (220), and (222), with an interplanar distance of 0.117 nm in good agreement with XRD results. Particle sizes ranged from 5 to 20 nm, with an average diameter of 10 nm (n = over 200 particles), showing a relatively uniform distribution (Figure S6a). HRTEM images displayed lattice fringes with an interplanar spacing of 0.221 nm, corresponding to the (111) FCC metallic gold, and ring patterns confirmed both the crystalline nature of NPs and their random distribution alongside the sample surface, showing characteristic rings for the Au (111), (200), and (220) planes of both PVP10 and PVP40 stabilized NPs, which effectively prevented aggregation and enhanced colloidal stability. Figure 11c depicts the morphology and size distribution of AuNPs@PVP10 (1.0 M) and revealed AuNPs exhibited predominantly spherical morphology with well-defined edges and smooth surfaces, with no significant aggregation observed, indicating good dispersion (Figure S5). Figure 11d, displays the ring pattern of stabilized AuNPs@PVP10 (1.0 M), the signals related to the crystallographic planes (111), (220), (222), (200), and (311) with an interplanar distance of 0.221 nm in good agreement with XRD results. Particle sizes ranged from 10 to 15 nm, with an average diameter of 10 nm (n = over 200 particles), showing a relatively uniform distribution (Figure S6b).
Figure 11.
(a) HRTEM micrograph of AuNPs@PVP40 displaying lattice spacings of 0.221 nm attributed to the (111) plane of the cubic gold. Furthermore, spherical shapes are observed. (b) Corresponding ring pattern of AuNPs@PVP10. (c) Lattice spacings of 0.221 nm attributed to the (111) plane of the cubic gold. (d) Corresponding ring pattern.
TEM analysis demonstrated well-defined spherical nanoparticles Overall, the TEM analysis demonstrates that the AuNPs possess well-defined morphology, narrow size distribution, crystalline structure, and effective stabilization due to dual surface coatings, which are crucial for their potential applications biomedicine.
4. Conclusions
This study demonstrates that the radiation resistance of polymer-coated gold nanoparticles is strongly influenced by both the polymer’s backbone chemistry and molecular weight. PVP-based systems exhibit superior stability under gamma irradiation compared to PEG, due to the greater resistance of carbonyl groups to radiation attack. These findings establish fundamental design principles for radiation-resistant polymer-coated nanomaterials essential for radiotherapy protocols, radiation sterilization, and nuclear medicine applications. The protective effect of the pyrrolidone ring system in PVP, along with the molecular weight-dependent degradation mechanism, highlights the importance of polymer selection and design for radiation-resistant nanomaterials. Although previous studies have examined the effects of gamma radiation or polymer concentration individually, the integration with rapid laser-assisted production for enhanced nanoparticle stability has not been widely reported. Our results provide new insights into the stability and optical response of AuNPs under irradiation, with direct implications for the design of advanced nanomaterials. This work advances the field by offering a comprehensive analysis of how gamma radiation and polymer concentration modulate LSPR and nanoparticle stability, highlighting its potential for applications in radiotherapy, biosensing, and nanomedicine.
Supplementary Materials
The following supporting information can be downloaded at https://www.mdpi.com/article/10.3390/pr14030454/s1, Figure S1: Laser-assisted parameters to fabricate gold nanoparticles; Figure S2: UV-Vis spectra of the AuNPs@PVP stabilized with (a) PVP10 and (b) PVP40 both at 1 M, 0.1 M, and 0.01 M. Inset display the bare polymer; Figure S3: Uv-vis spectra of the AuNPs@PEG stabilized with (a) PEG200, and (b) PEG400, both at 1.0% and 3.0%. Figure S4: IR spectrum of PVP10 (a), PVP40 (b), PEG200 (c), and PEG400 (d) nanoparticles without irradiation. Figure S5: TEM micrographs of (a) AuNPs@PVP40 (b) AuNPs@PVP10. Figure S6: Size distribution of nanoparticles obtained from manual counting of > 200 particles in HRTEM images (a) AuNPs@PVP40 (1.0 M, (b) AuNPs@PVP10 (1.0 M). Table S1: Statistical data from UV-Vis analysis.
Author Contributions
Conceptualization, A.Y.D.-O., E.R.G., M.L.M. and A.B.L.-O.; methodology, A.Y.D.-O., E.R.G., R.M.-A. and E.A.C.-L.; software, E.A.C.-L.; validation, A.Y.D.-O., E.R.G., E.G.Z.-N., R.O.-L., S.J.C. and A.B.L.-O.; formal analysis, A.Y.D.-O., E.R.G., E.G.Z.-N., R.O.-L., S.J.C. and A.B.L.-O.; investigation, A.Y.D.-O., E.R.G., R.M.-A., M.L.M. and A.B.L.-O.; resources, E.R.G. and A.B.L.-O.; data curation, A.Y.D.-O. and E.A.C.-L.; writing—original draft preparation, A.Y.D.-O., E.R.G., E.G.Z.-N., S.J.C., M.L.M. and A.B.L.-O.; writing—review and editing, E.R.G., E.G.Z.-N. and A.B.L.-O.; visualization, A.Y.D.-O.; supervision, R.O.-L., S.J.C. and A.B.L.-O.; project administration, M.L.M. and A.B.L.-O.; funding acquisition, E.R.G. and A.B.L.-O. All authors have read and agreed to the published version of the manuscript.
Funding
This research was funded by Secretaría de Ciencia, Humanidades, Tecnología e Innovación (Secihti), grant number 1756.
Data Availability Statement
The original contributions presented in this study are included in the article/Supplementary Materials, further inquiries can be directed to the corresponding authors.
Acknowledgments
Díaz-Ortíz and Zamorano-Noriega are grateful for their postgraduate fellowship to Secihti. The authors express their gratitude to Secihti for the financial support received through projects 1756 and SNII-Secihti.
Conflicts of Interest
The authors declare no conflicts of interest.
References
- Ortiz-Castillo, J.E.; Gallo-Villanueva, R.C.; Madou, M.J.; Perez-Gonzalez, V.H. Anisotropic Gold Nanoparticles: A Survey of Recent Synthetic Methodologies. Coord. Chem. Rev. 2020, 425, 213489. [Google Scholar] [CrossRef] [Scilit]
- Hassan, H.; Sharma, P.; Rahil Hasan, M.; Singh, S.; Thakur, D.; Narang, J. Gold Nanomaterials—The Golden Approach from Synthesis to Applications. Mater. Sci. Energy Technol. 2022, 5, 375–390. [Google Scholar] [CrossRef] [Scilit]
- Saha, K.; Agasti, S.S.; Kim, C.; Li, X.; Rotello, V.M. Gold Nanoparticles in Chemical and Biological Sensing. Chem. Rev. 2012, 112, 2739–2779. [Google Scholar] [CrossRef] [Scilit]
- Torresan, V.; Forrer, D.; Guadagnini, A.; Badocco, D.; Pastore, P.; Casarin, M.; Selloni, A.; Coral, D.; Ceolin, M.; Fernández van Raap, M.B.; et al. 4D Multimodal Nanomedicines Made of Nonequilibrium Au–Fe Alloy Nanoparticles. ACS Nano 2020, 14, 12840–12853. [Google Scholar] [CrossRef] [Scilit]
- Amendola, V.; Polizzi, S.; Meneghetti, M. Laser Ablation Synthesis of Gold Nanoparticles in Organic Solvents. J. Phys. Chem. B 2006, 110, 7232–7237. [Google Scholar] [CrossRef] [Scilit]
- Rehbock, C.; Merk, V.; Gamrad, L.; Streubel, R.; Barcikowski, S. Size Control of Laser-Fabricated Surfactant-Free Gold Nanoparticles with Highly Diluted Electrolytes and Their Subsequent Bioconjugation. Phys. Chem. Chem. Phys. 2013, 15, 3057–3067. [Google Scholar] [CrossRef] [Scilit]
- Rodrigues, F.T.; Fanaro, G.B.; Duarte, R.C.; Koike, A.C.; Villavicencio, A.L.C.H. A Sensory Evaluation of Irradiated Cookies Made from Flaxseed Meal. Radiat. Phys. Chem. 2012, 81, 1157–1159. [Google Scholar] [CrossRef] [Scilit]
- Tajdidzadeh, M.; Zakaria, A.B.; Talib, Z.A.; Gene, A.S.; Shirzadi, S. Optical Nonlinear Properties of Gold Nanoparticles Synthesized by Laser Ablation in Polymer Solution. J. Nanomater. 2017, 2017, 4803843. [Google Scholar] [CrossRef] [Scilit]
- Negut, I.; Floroian, L.; Ristoscu, C.; Mihailescu, C.N.; Mirza Rosca, J.C.; Tozar, T.; Badea, M.; Grumezescu, V.; Hapenciuc, C.; Mihailescu, I.N. Functional Bioglass—Biopolymer Double Nanostructure for Natural Antimicrobial Drug Extracts Delivery. Nanomaterials 2020, 10, 385. [Google Scholar] [CrossRef] [Scilit] [PubMed]
- Perry, C.C.; Ramos-Méndez, J.; Milligan, J.R. DNA Condensation with a Boron-Containing Cationic Peptide for Modeling Boron Neutron Capture Therapy. Radiat. Phys. Chem. 2020, 166, 108521. [Google Scholar] [CrossRef] [Scilit]
- Borran, A.A.; Aghanejad, A.; Farajollahi, A.; Barar, J.; Omidi, Y. Gold Nanoparticles for Radiosensitizing and Imaging of Cancer Cells. Radiat. Phys. Chem. 2018, 152, 137–144. [Google Scholar] [CrossRef] [Scilit]
- Carone, A.; Emilsson, S.; Mariani, P.; Désert, A.; Parola, S. Gold Nanoparticle Shape Dependence of Colloidal Stability Domains. Nanoscale Adv. 2023, 5, 2017–2026. [Google Scholar] [CrossRef] [Scilit]
- Naser, H.; Shanshool, H.M.; Imhan, K.I. Parameters Affecting the Size of Gold Nanoparticles Prepared by Pulsed Laser Ablation in Liquid. Braz. J. Phys. 2021, 51, 878–898. [Google Scholar] [CrossRef] [Scilit]
- Her, S.; Jaffray, D.A.; Allen, C. Gold Nanoparticles for Applications in Cancer Radiotherapy: Mechanisms and Recent Advancements. Adv. Drug Deliv. Rev. 2017, 109, 84–101. [Google Scholar] [CrossRef] [Scilit]
- Kuladeep, R.; Narayana Rao, L.J.D.; Shadak Alee, K. Synthesis, Characterization And Nonlinear Optical Properties Of Laser-Induced Au Colloidal Nanoparticles. Adv. Mater. Lett. 2013, 4, 482–487. [Google Scholar] [CrossRef] [Scilit]
- Amendola, V.; Meneghetti, M. Size Evaluation of Gold Nanoparticles by UV−vis Spectroscopy. J. Phys. Chem. C 2009, 113, 4277–4285. [Google Scholar] [CrossRef] [Scilit]
- Hettiarachchi, B.S.; Takaoka, Y.; Uetake, Y.; Yakiyama, Y.; Lim, H.H.; Taira, T.; Maruyama, M.; Mori, Y.; Yoshikawa, H.Y.; Sakurai, H. Uncovering Gold Nanoparticle Synthesis Using a Microchip Laser System through Pulsed Laser Ablation in Aqueous Solution. Ind. Chem. Mater. 2024, 2, 340–347. [Google Scholar] [CrossRef] [Scilit]
- Barbosa, S.; Agrawal, A.; Rodríguez-Lorenzo, L.; Pastoriza-Santos, I.; Alvarez-Puebla, R.A.; Kornowski, A.; Weller, H.; Liz-Marzán, L.M. Tuning Size and Sensing Properties in Colloidal Gold Nanostars. Langmuir 2010, 26, 14943–14950. [Google Scholar] [CrossRef] [Scilit]
- Koczkur, K.M.; Mourdikoudis, S.; Polavarapu, L.; Skrabalak, S.E. Polyvinylpyrrolidone (PVP) in Nanoparticle Synthesis. Dalton Trans. 2015, 44, 17883–17905. [Google Scholar] [CrossRef] [Scilit] [PubMed]
- Misra, N.; Biswal, J.; Gupta, A.; Sainis, J.K.; Sabharwal, S. Gamma Radiation Induced Synthesis of Gold Nanoparticles in Aqueous Polyvinyl Pyrrolidone Solution and Its Application for Hydrogen Peroxide Estimation. Radiat. Phys. Chem. 2012, 81, 195–200. [Google Scholar] [CrossRef] [Scilit]
- Nurakhmetova, Z.A.; Azhkeyeva, A.N.; Klassen, I.A.; Tatykhanova, G.S. Synthesis and Stabilization of Gold Nanoparticles Using Water-Soluble Synthetic and Natural Polymers. Polymers 2020, 12, 2625. [Google Scholar] [CrossRef] [Scilit] [PubMed]
- Amendola, V.; Pilot, R.; Frasconi, M.; Maragò, O.M.; Iatì, M.A. Surface Plasmon Resonance in Gold Nanoparticles: A Review. J. Phys. Condens. Matter 2017, 29, 203002. [Google Scholar] [CrossRef] [Scilit]
- Haiss, W.; Thanh, N.T.K.; Aveyard, J.; Fernig, D.G. Determination of Size and Concentration of Gold Nanoparticles from UV−Vis Spectra. Anal. Chem. 2007, 79, 4215–4221. [Google Scholar] [CrossRef] [Scilit] [PubMed]
- Seol, S.K.; Kim, D.; Jung, S.; Chang, W.S.; Kim, J.T. One-Step Synthesis of PEG-Coated Gold Nanoparticles by Rapid Microwave Heating. J. Nanomater. 2013, 2013, 531760. [Google Scholar] [CrossRef] [Scilit]
- Wang, C.-H.; Liu, C.-J.; Wang, C.-L.; Hua, T.-E.; Obliosca, J.M.; Lee, K.H.; Hwu, Y.; Yang, C.-S.; Liu, R.-S.; Lin, H.-M.; et al. Optimizing the Size and Surface Properties of Polyethylene Glycol (PEG)–Gold Nanoparticles by Intense x-Ray Irradiation. J. Phys. D Appl. Phys. 2008, 41, 195301. [Google Scholar] [CrossRef] [Scilit]
- Wu, D.; Zhang, X.-D.; Liu, P.-X.; Zhang, L.-A.; Fan, F.-Y.; Guo, M.-L. Gold Nanostructure: Fabrication, Surface Modification, Targeting Imaging, and Enhanced Radiotherapy. Curr. Nanosci. 2011, 7, 110–118. [Google Scholar] [CrossRef] [Scilit]
- Huang, Y.-C.; Yang, Y.-C.; Yang, K.-C.; Shieh, H.-R.; Wang, T.-Y.; Hwu, Y.; Chen, Y.-J. Pegylated Gold Nanoparticles Induce Apoptosis in Human Chronic Myeloid Leukemia Cells. Biomed. Res. Int. 2014, 2014, 182353. [Google Scholar] [CrossRef] [Scilit]
- Zhang, X.-D.; Wu, D.; Shen, X.; Chen, J.; Sun, Y.-M.; Liu, P.-X.; Liang, X.-J. Size-Dependent Radiosensitization of PEG-Coated Gold Nanoparticles for Cancer Radiation Therapy. Biomaterials 2012, 33, 6408–6419. [Google Scholar] [CrossRef] [Scilit]
- Laprise-Pelletier, M.; Simão, T.; Fortin, M. Gold Nanoparticles in Radiotherapy and Recent Progress in Nanobrachytherapy. Adv. Healthc. Mater. 2018, 7, 1701460. [Google Scholar] [CrossRef] [Scilit]
- Behera, M.; Ram, S. Inquiring the Mechanism of Formation, Encapsulation, and Stabilization of Gold Nanoparticles by Poly(Vinyl Pyrrolidone) Molecules in 1-Butanol. Appl. Nanosci. 2014, 4, 247–254. [Google Scholar] [CrossRef] [Scilit]
- Abdelghany, A.M.; Mekhail, M.S.; Abdelrazek, E.M.; Aboud, M.M. Combined DFT/FTIR Structural Studies of Monodispersed PVP/Gold and Silver Nano Particles. J. Alloys Compd. 2015, 646, 326–332. [Google Scholar] [CrossRef] [Scilit]
- Udayabhaskar, R.; Mangalaraja, R.V.; Manikandan, D.; Arjunan, V.; Karthikeyan, B. Room Temperature Synthesis and Optical Studies on Ag and Au Mixed Nanocomposite Polyvinylpyrrolidone Polymer Films. Spectrochim. Acta A Mol. Biomol. Spectrosc. 2012, 99, 69–73. [Google Scholar] [CrossRef] [Scilit] [PubMed]
- Morsi, M.A.; Rajeh, A.; Menazea, A.A. Nanosecond Laser-Irradiation Assisted the Improvement of Structural, Optical and Thermal Properties of Polyvinyl Pyrrolidone/Carboxymethyl Cellulose Blend Filled with Gold Nanoparticles. J. Mater. Sci. Mater. Electron. 2019, 30, 2693–2705. [Google Scholar] [CrossRef] [Scilit]
- Leopold, L.F.; Tódor, I.S.; Diaconeasa, Z.; Rugină, D.; Ştefancu, A.; Leopold, N.; Coman, C. Assessment of PEG and BSA-PEG Gold Nanoparticles Cellular Interaction. Colloids Surf. A Physicochem. Eng. Asp. 2017, 532, 70–76. [Google Scholar] [CrossRef] [Scilit]
- Nițică, Ș.; Moldovan, A.I.; Toma, V.; Moldovan, C.S.; Berindan-Neagoe, I.; Știufiuc, G.; Lucaciu, C.M.; Știufiuc, R. PEGylated Gold Nanoparticles with Interesting Plasmonic Properties Synthesized Using an Original, Rapid, and Easy-to-Implement Procedure. J. Nanomater. 2018, 2018, 5954028. [Google Scholar] [CrossRef] [Scilit]
- Jeong, J.-O.; Park, J.-S.; Kim, Y.-A.; Yang, S.-J.; Jeong, S.-I.; Lee, J.-Y.; Lim, Y.-M. Gamma Ray-Induced Polymerization and Cross-Linking for Optimization of PPy/PVP Hydrogel as Biomaterial. Polymers 2020, 12, 111. [Google Scholar] [CrossRef] [Scilit]
- Omping, J.; Unabia, R.; Reazo, R.L.; Lapening, M.; Lumod, R.; Ruda, A.; Rivera, R.B.; Sayson, N.L.; Latayada, F.; Capangpangan, R.; et al. Facile Synthesis of PEGylated Gold Nanoparticles for Enhanced Colorimetric Detection of Histamine. ACS Omega 2024, 9, 14269–14278. [Google Scholar] [CrossRef] [Scilit]
- Santos-Santos, I.J.; Zamora-Justo, J.A.; Vázquez-Martínez, G.R.; Cabrera-Sierra, R.; Balderas-López, J.A. Synthesis of Gold Nanoparticles Coated with Glucose Oxidase Using PVP as Passive Adsorption Linkage. Front. Nanotechnol. 2024, 6, 1419239. [Google Scholar] [CrossRef] [Scilit]
- Cai, W. Applications of Gold Nanoparticles in Cancer Nanotechnology. Nanotechnol. Sci. Appl. 2008, 1, 17–32. [Google Scholar] [CrossRef] [Scilit]
- Siddique, S.; Chow, J.C.L. Gold Nanoparticles for Drug Delivery and Cancer Therapy. Appl. Sci. 2020, 10, 3824. [Google Scholar] [CrossRef] [Scilit]
Disclaimer/Publisher’s Note: The statements, opinions and data contained in all publications are solely those of the individual author(s) and contributor(s) and not of MDPI and/or the editor(s). MDPI and/or the editor(s) disclaim responsibility for any injury to people or property resulting from any ideas, methods, instructions or products referred to in the content. |
© 2026 by the authors. Licensee MDPI, Basel, Switzerland. This article is an open access article distributed under the terms and conditions of the Creative Commons Attribution (CC BY) license.