Article

Study on Microscopic Pore Structure and Mechanical Characteristics of Tight Sandstone Under Hydration Effect


State Key Laboratory of Petroleum Resources and Engineering, China University of Petroleum, Beijing 102249, China
*
Author to whom correspondence should be addressed.
Processes 2026, 14(3), 453; https://doi.org/10.3390/pr14030453
Submission received: 8 January 2026 / Revised: 18 January 2026 / Accepted: 26 January 2026 / Published: 28 January 2026
(This article belongs to the Topic Advanced Technology for Oil and Nature Gas Exploration)

Abstract

During the energy storage fracturing process of tight sandstone reservoirs, the pre-injection of fracturing fluid is used to supplement the formation energy, and the physical properties of rocks change under hydration. To reveal the damage mechanism of hydration on tight sandstone, the tight sandstone surrounding the Daqing Changyuan in the northern part of the Songliao Basin was taken as the research object. Through indoor static hydration experiments, combined with scanning electron microscopy (SEM), nuclear magnetic resonance (NMR), Nano-indentation experiments, and other methods, the evolution laws of rock micro-pore morphology, microfracture parameters, Young’s modulus, hardness, and other mechanical indicators under different hydration durations and soaking pressures were systematically explored. The research results show that the water–rock interaction of acidic slick water fracturing fluid significantly changes the mineral composition and microstructure of mudstone and sandstone, controls the development of induced fractures, and degrades the micro-mechanical properties of rocks, with significant lithological differences. In terms of mineral evolution, the soaking time causes the clay minerals in mudstone to increase by up to 12.0%, while pressure causes the carbonate minerals in sandstone to decrease by up to 23.3%. In terms of induced fracture development, the induced fracture widths of sandstone and mudstone under 30 MPa of pressure increase by 122.4% and 85.7%, respectively. The fracture width of mudstone shows a trend of “increasing first and then decreasing” with time, while that of sandstone decreases monotonically. In terms of micro-mechanical properties, after soaking for 168 h, the Young’s modulus of mudstone decreases by up to 66.9%, much higher than that of sandstone (29.5%), while the decrease in hardness of both is similar (58.3% and 59.8%); the mechanical parameters at the induced fractures are only 53.0% to 73.6% of those in the matrix area, confirming the influence of microstructural heterogeneity. This research provides a theoretical basis and data support for optimizing hydraulic fracturing parameters, evaluating wellbore stability, and predicting the long-term development performance in tight sandstone reservoirs.

1. Introduction

With the continuous growth of global energy demand, conventional oil and gas reserves are increasingly depleted. As an important alternative unconventional energy resource, tight sandstone oil and gas has become one of the key directions for ensuring energy security through its development and utilization [1,2]. The tight sandstone reservoirs in the Songliao Basin are characterized by a low porosity, poor permeability, and low formation energy. Before development, water injection is required to supplement the formation energy, and reservoir modification techniques such as hydraulic fracturing are used to improve its percolation capacity [3,4,5]. However, tight sandstone reservoirs are rich in clay minerals and have natural fractures. The injected fluid not only reacts with clay minerals through hydration, leading to the deterioration of rock physical and mechanical properties [6,7,8], but also induces fractures, opens natural fractures, and rapidly advances along high-permeability zones, resulting in premature water breakthrough and rapid waterflooding in production wells, which leads to poor waterflooding development effects [9,10] and severely restricts the efficient development of tight sandstone oil and gas. Therefore, deeply exploring the evolution laws and intrinsic correlation mechanisms of micro-pore structures and the mechanical characteristics of tight sandstone under hydration has important theoretical and engineering significance for guiding the efficient development of tight sandstone reservoirs.
During the development of tight sandstone reservoirs, the hydration triggered by the intrusion of water-based fluids not only leads to a significant expansion of clay minerals such as montmorillonite, but also may induce the generation or expansion of microfractures through a water–rock–stress coupling mechanism [11,12,13]. Traditional views often emphasize the blocking effect of clay expansion on throats and its damage to permeability. Hydration, through mechanisms such as clay mineral expansion, particle migration, and water–rock chemical reactions, leads to throat contraction, pore blockage, and the formation of a large number of isolated pores or dead-end pores [14,15]. Due to their distinct crystal structures and surface properties, clay minerals such as kaolinite, montmorillonite, and illite exhibit significant differences in their response to hydration [16]. However, recent studies have shown that, under conditions of high rock brittleness or the development of natural fractures, hydration phase transitions or the expansion stress concentration can exceed the tensile strength of the rock, thereby generating new microfracture networks [17,18,19,20]. Notably, the development degree of natural fractures is a key factor controlling the propagation path of hydraulic fractures and post-fracture productivity, which further determines the complexity of the fracture network formed through hydration [21]. This dual mechanism of “blocking–fracturing” makes the impact of hydration on the pore structure highly nonlinear and heterogeneous. On the one hand, clay expansion promotes pore closure and decreases connectivity; on the other hand, hydration-induced fractures may create new high-conductivity channels, temporarily enhancing permeability and anisotropy [22,23,24]. The net effect depends on the combined effects of the mineral type, reaction time, in situ stress state, and fluid chemical environment, leading to complex and variable evolutionary paths of porosity, pore size distribution, and seepage capacity [25,26,27]. Moreover, pore structure heterogeneity exerts a significant influence on the stress sensitivity of tight sandstone reservoirs, and the non-uniform distribution of pore throats can lead to differential deformation and damage to rock frameworks under stress, which directly affects the hydration damage process [28]. Currently, most studies still view expansion damage or fracture enhancement in isolation, lacking a systematic quantification of the competition–cooperation mechanism between the two. In particular, the evolution law of the coupled pore–fracture structure during dynamic hydration remains unclear.
During the invasion of water-based fluids into tight sandstone, hydration not only induces the generation of microfractures through a water–rock–stress coupling mechanism, but also alters the mechanical response of the rock due to changes in pore pressure, thereby profoundly reshaping its micro-mechanical properties [14,15,29,30]. Studies have shown that expansive clays such as montmorillonite absorb water, leading to local high stress, the weakening of particle cementation, and matrix softening, significantly reducing the local Young’s modulus and hardness [31]. Similarly to the effect of drying–wetting cycles on red sandstone, which induce microcrack expansion and mechanical degradation [32], brine erosion can also regulate the transformation of micro–meso-pores in sandstone, further verifying the significant impact of fluid–rock interactions on rock microstructure and mechanical properties [33]. Simultaneously, with the increase in pore pressure, the uniaxial compressive strength of tight sandstone can significantly decrease by 30–50%, and the failure mode transitions from brittle fracturing to shear sliding. Poisson’s ratio increases and the brittleness index decreases, reflecting a trend in mechanical behavior towards toughness [34]. More intricately, newly formed microfractures are often covered by migrated or expanding clays, forming “weak interfaces” that further reduce the shear strength and fracture toughness [35,36]. For thin interbedded tight sandstone reservoirs, the vertical propagation of hydraulic fractures is restricted by interlayer lithological differences and stress distribution, which are closely related to the hydration damage degree of different lithologies [37]. In recent years, advanced characterization techniques such as nanoindentation, atomic force microscopy (AFM), and in situ low-field nuclear magnetic resonance (NMR) have preliminarily revealed the micro-mechanical degradation phenomena caused by hydration. Hu et al. analyzed the impact of water on the micro-mechanical properties of rocks under different soaking times, pressures, and temperatures through nanoindentation testing [38]. Tang et al. quantitatively studied the percolation behavior of fracturing fluid in tight sandstone reservoirs under high-temperature and high-pressure conditions based on NMR technology [39]. Gou et al. utilized CT scanning imaging technology to characterize the spatial distribution and connectivity changes in macroscopic pores and microfractures in rock samples before and after hydration [40]. Despite extensive research on the impact of water–rock reactions on the rock pore structure and mechanical properties, there is a lack of differentiation in micro-pore structures and mechanical characteristics under varying lithologies and natural fracture development conditions. The differences in softening behavior due to water–rock interactions among rocks of different lithologies remain unclear.
To investigate the impact of hydration on the micro-pore structure and mechanical characteristics of tight sandstone under real water injection and fracturing conditions, downhole cores from the Fuyu oil reservoir in the peripheral area of the Changyuan region of the Songliao Basin were selected. Rock samples of three different lithologies, including argillaceous siltstone, sandstone, and naturally fractured sandstone, were drilled. A series of sandstone hydration experiments were conducted at a formation temperature of 55 °C. By employing experimental methods such as scanning electron microscopy, low-temperature N2 adsorption, and CT scanning, the evolution process of the pore structure parameters, including particle morphology, pore size, and induced fractures, of sandstone samples under different hydration times and pressures was compared. The reasons for the changes in the micro-pore structure of tight sandstone were analyzed. Lattice Nano-indentation testing technology was utilized to quantitatively characterize the micro-mechanical characteristics of sandstone with different lithologies under water–rock interactions, revealing the transformation mechanism of hydration on the structural–mechanical properties of tight sandstone. The research findings can provide a scientific basis for reservoir protection, fracturing parameter optimization, and engineering stability control during the development of tight sandstone reservoirs.

2. Experimental Method

2.1. Specimen Preparation

The rock samples used in the experiment are downhole cores from the tight oil reservoir of the Fuyu oil layer outside the Daqing Changyuan in the Songliao Basin, with a coring depth of 1550~1600 m. The lithology consists of argillaceous siltstone and siltstone, with some siltstone developing natural fractures. The test results of the mineral composition of the cores show that the average content of clay minerals is 29.3%, the average content of siliceous minerals is 52.5%, and the average content of carbonate minerals is 18.2%. The clay minerals are composed of kaolinite, chlorite, and illite. The test results of the porosity, permeability (effective confining pressure of 5 MPa), and rock mechanical parameters of the rock samples are shown in Table 1.
First, the original rock samples were cut into cores for experimental use. After washing the oil and measuring the basic porosity and permeability properties, core slices and powdered samples were prepared, respectively. A cylindrical sample with a diameter of 2.5 cm and a height of approximately 5.0 cm was prepared from the full-diameter core sample from the well (see Figure 1a) using wire cutting (see Figure 1b). To avoid contact with water, alcohol was used as a cooling liquid during the cutting process. To meet the requirements of XRD testing, the remaining samples after wire cutting were selected and ground into powder below 75 μm (200 mesh) (see Figure 1c). The samples were tested promptly after preparation. The surface of the samples for nanoindentation testing was mechanically polished and then subjected to argon ion beam polishing using a Leica EM RES 102 (Stuttgart, Germany) [14] (see Figure 1d). The red lines on the surface of the rock samples in Figure 1b,d indicate the location of natural crack development. The bulk samples were mechanically polished using an MC004 grinding and polishing machine (Shanghai, China). After polishing, the surface undulations of the samples ranged from 500 to 1000 nm, with the parallelism of the upper and lower surfaces of each bulk sample not exceeding 0.01 mm and the vertical deviation not exceeding 0.05°. To prevent damage to the samples due to external forces, all prepared samples were stored separately.

2.2. Static Soaking Treatments

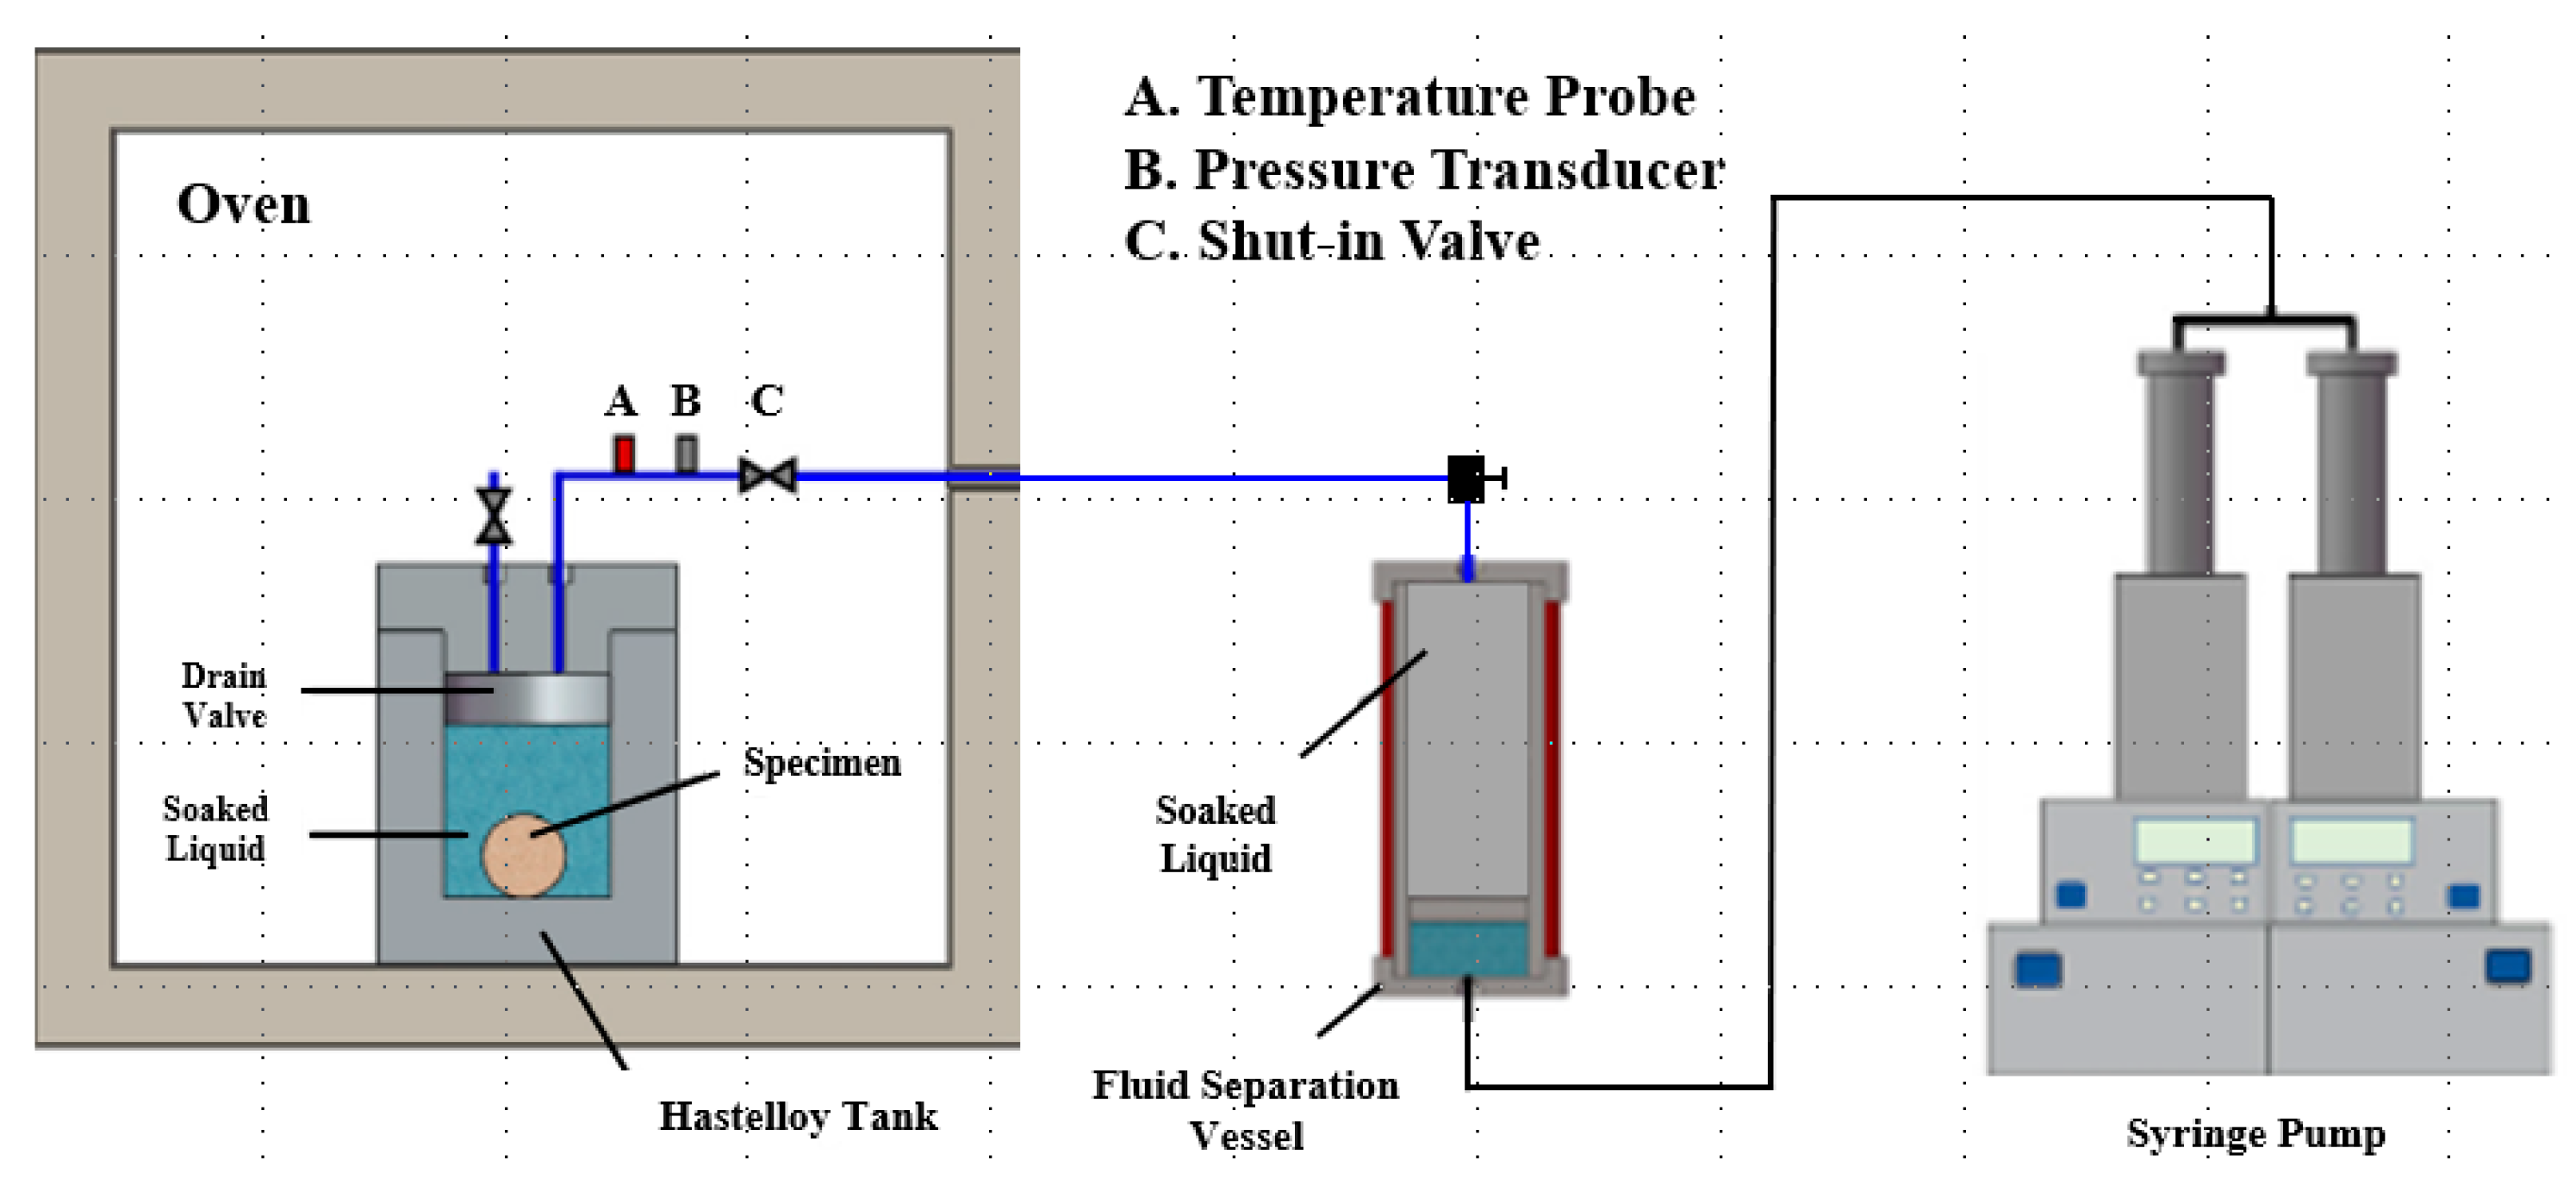
To simulate the fluid–rock interaction process under reservoir conditions, a core soaking experiment was conducted using a high-temperature and high-pressure soaking experimental device. The device mainly consists of a gas source, a constant-rate and constant-pressure displacement pump, an intermediate container, a reaction kettle, a high-temperature drying oven, and temperature and pressure sensors, etc. [14] (see Figure 2). This study primarily considers the effects of rock type (mudstone, sandstone), soaking time (5, 24, 72, 120, 168 h), and soaking pressure (5, 10, 15, 20, 30 MPa) on the micro-pore structure and mechanical properties of tight sandstone reservoirs. The types, sizes, and numbers of cores used in the experiment are shown in Table 2. Sample M1 is an original mudstone core, while Sample M2 was soaked for 5 h under conditions of 20 MPa and 55 °C; the soaking conditions for other numbered samples are sequentially extended downward. The fluid used in this experiment is a slickwater fracturing fluid commonly used in field operations, with the formula 0.2% domestic friction reducer + 1% anti-swelling agent + 0.15% cleanup additive + 0.05% demulsifier, for water–rock reaction experiments.
The basic steps of the immersion experiment are as follows: ① Before the experiment, the samples undergo oil washing purification and drying pretreatment to remove residual oil on the sample surface and free water in the pores, ensuring consistency in the initial state of the experiment. ② The experimental testing system undergoes leak verification to identify potential leakage points and ensure the tightness of the fluid system during the immersion process. ③ The samples are placed steadily in the reaction kettle, and the temperature control system is activated to heat the reaction kettle to the target formation temperature of 55 °C and maintain a constant temperature state. After the temperature field stabilizes, subsequent steps are carried out. ④ A constant-rate and constant-pressure displacement pump is used to accurately inject the immersion fluid into the reaction kettle until reaching the preset target pressure. During this process, the displacement rate is controlled to avoid disturbance to the samples caused by fluid impact. ⑤ During the immersion process, the temperature and pressure conditions in the reaction kettle are monitored in real time by sensors. ⑥ After reaching the preset immersion duration, the fluid pressure in the reaction kettle is slowly released to atmospheric pressure through a gradient pressure relief method; after the reaction kettle cools naturally to room temperature, the samples are taken out, cleaned on the surface, and dried for future use. It should be noted that the samples are not subjected to secondary polishing after immersion to avoid secondary damage to the rock sample surface caused by mechanical grinding, ensuring the accuracy of subsequent observations of rock pore structure and tests of micro-mechanical parameters.

2.3. Microscopic Pore Structure and Mechanical Parameter Testing

2.3.1. Microscopic Pore Structure Testing

To investigate the changes in pore structure parameters such as particle morphology, pore size distribution, and induced fractures of samples with hydration time, experimental methods such as scanning electron microscopy and CT scanning were employed to compare tight sandstone samples.
(1)
Scanning electron microscopy
To study the impact of hydration on the pore structure of samples from a microscopic perspective, experiments were conducted using thin sections of tight sandstone. The micro-morphology of the rock samples before and after immersion was observed through scanning electron microscopy. The scanning electron microscope used in the experiment was an environmental scanning electron microscope Quanta450 produced by the American company FEI (Hillsboro, OR, USA). Before each electron microscopy observation, the samples were dried at low temperature at 60 °C to prevent contamination of the sample chamber by water vapor. All rock samples were photographed continuously at different magnifications, with the highest magnification being 4000 times, and a resolution of 27.1 nm. The total observation range after stitching reached 3.1 mm. Through electron microscopy scanning, the pore types, sizes, quantities, and microfracture development in the tight sandstone samples could be clearly observed.
(2)
CT scan
Due to the limitations of sample preparation and pretreatment, electron microscopy scanning can only be conducted using thin rock slices for hydration immersion experiments. However, the evolution of rock structure during the hydration process mainly occurs in microfractures. Therefore, it is necessary to use computed tomography (CT) scanning imaging technology to characterize the changes in the spatial distribution and connectivity of macroscopic pores and microfractures in rock samples before and after hydration [40]. The CT scanning is performed using a MicroXCT-400 CT scanner (Xradia company, Pleasanton, CA, USA) with an X-ray diffraction spatial resolution of up to 1.5 μm. The experimental samples are cylindrical rock samples with a diameter of approximately 2.50 cm. Scans are conducted along the end faces of the rock samples to study the evolution process of internal microfractures under different hydration times.

2.3.2. Rock Mechanical Parameter Testing

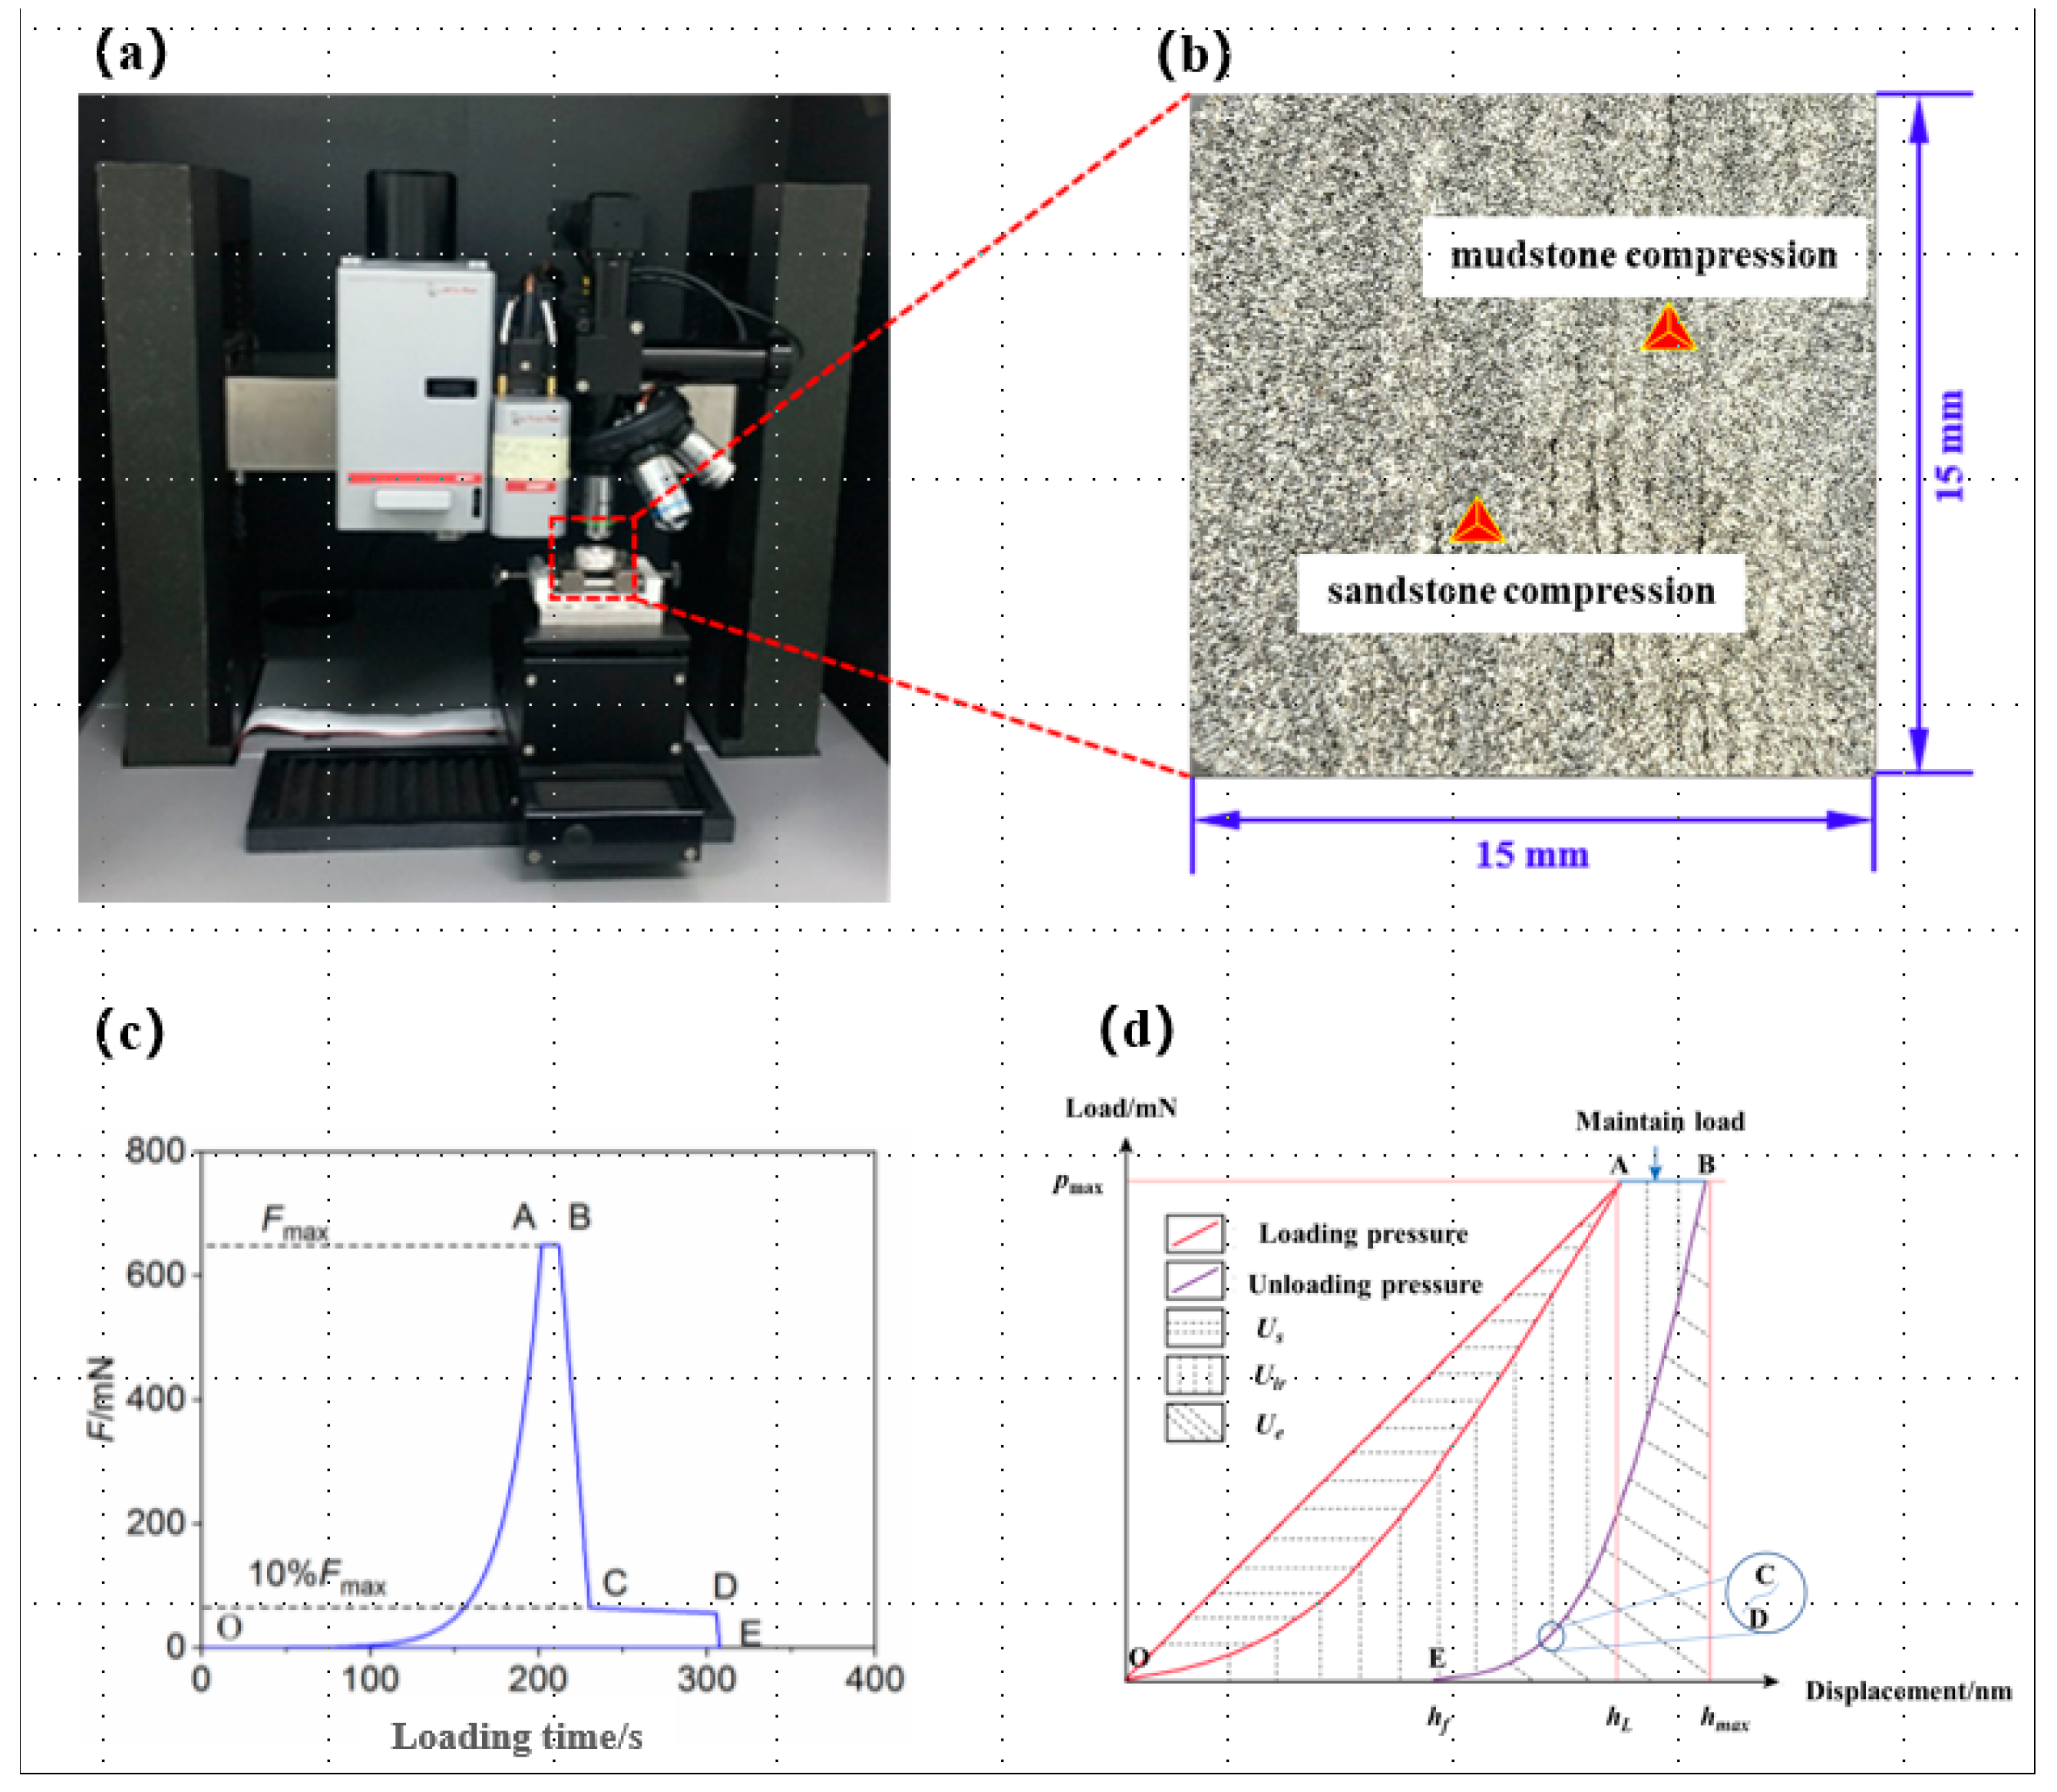
To investigate the softening behavior of compact sandstone after different static soaking treatments, a nanoindentation test was conducted using a Keysight G200 nanoindenter, Santa Rosa, CA, USA (Boltzmann indenter, with a tip radius of curvature < 20 nm; load resolution of 50 nN; maximum load of 10 N; displacement resolution < 0.01 nm; and maximum indentation depth > 500 μm) (Figure 3a). Micro-mechanical parameters such as the Young’s modulus, hardness, and fracture toughness were obtained by conducting indentation tests on the siliceous and argillaceous components of the sandstone, respectively, to characterize the micrometer-scale mechanical properties (Figure 3b). The samples were mechanically polished with silicon carbide sandpaper and then subjected to secondary polishing using a wide-beam argon ion beam to eliminate surface roughness interference. The spacing between adjacent indentations was set to 100 μm (significantly larger than the maximum indentation depth of 4000 nm) to avoid mutual interference.
In this study, the Continuous Stiffness Measurement (CSM) method was employed to determine the continuous evolution of micro-mechanical parameters with indentation depth. Figure 3c,d depict the loading history and typical load–indentation depth curve, respectively. The CSM testing process consists of five stages (Figure 3d): the OA loading stage involves applying load at a constant strain rate of 0.05 s−1, with a harmonic displacement target of 2 nm and a frequency of 45 Hz, maintaining the maximum load until the indentation depth reaches 4000 nm; the AB holding stage lasts for 10 s, during which the depth increase caused by indentation creep is recorded; the BC unloading stage involves unloading at a constant rate until the residual load reaches 10% of the maximum value; the CD stage maintains the residual load for 75 s for displacement calibration; and the DE stage unloads the residual load. The letters O to E represent different stages of loading. The letter O represents the initial time point, A is the time point at which the compression displacement is maximum, B is the time point at which unloading begins, C is the time point at which the load reaches 10% of the maximum load, the time interval between C and D is 75 s, and E is the time point at which unloading is completed.
The formula for calculating hardness is as follows [41,42]:
H = p max A c
A c = 24.5 h c 2
Among them, hc and hmax have the following relationship:
h max h c = ε p max S
h c = 2 ν E 1 2 ν E 1 h max
where hc is the contact depth, and hmax and Pmax are the maximum contact depth and the maximum load in each circle. Ac is the contact area. θ is the constant related to the geometry of the indenter (θ = 65.35° for the Berkovich indenter).
After obtaining the contact projected area and contact depth, the reduced Young’s modulus can be calculated using the following formula:
E r = π S 2 β A c
The reduced Young’s modulus can be used to reflect the composite elastic deformation of the indenter and the specimen and can be converted into the true Young’s modulus of the specimen. The calculation expression is
1 E r = 1 ν 2 E + 1 ν i 2 E i

3. Experimental Results and Analysis

3.1. Surface Observation After Soaking Treatments

3.1.1. Characteristics of Mineral Composition Variation

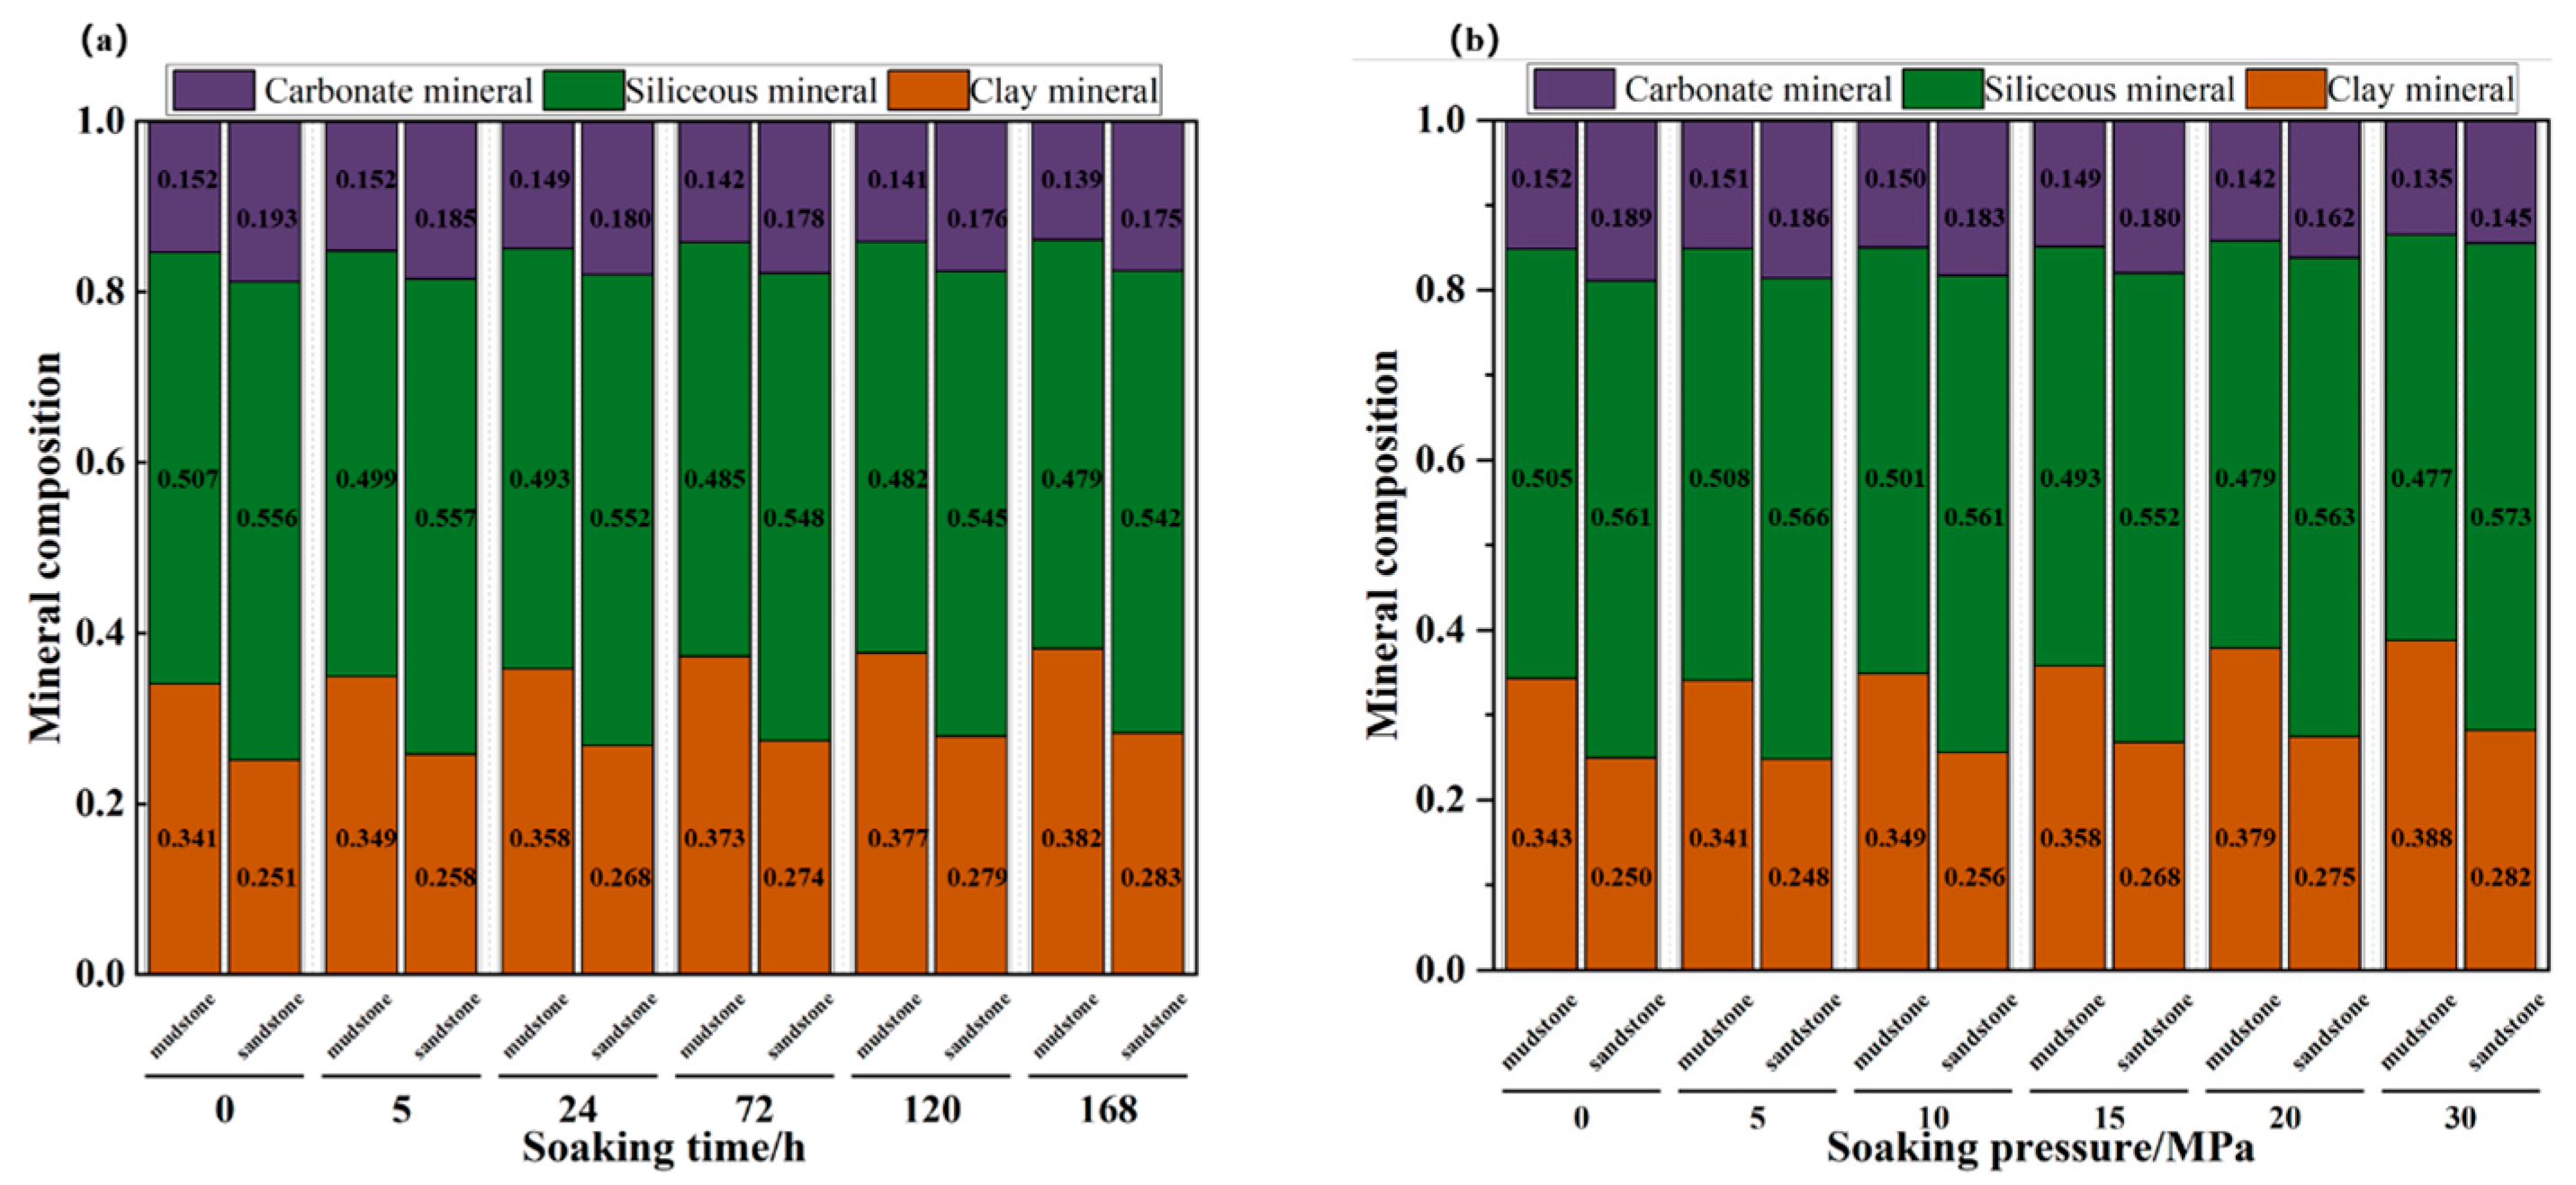
The X-ray diffraction (XRD) analysis of mudstone and sandstone before and after water–rock reactions (Figure 4a,b) showed distinct initial mineral compositions: mudstone contained 34.1% clay, 50.7% siliceous, and 15.2% carbonate minerals; sandstone had 25.1% clay, 55.6% siliceous, and 19.3% carbonate minerals, with siliceous minerals dominating both (>50%). The acidic slickwater (pH = 4.75) induced carbonate dissolution, leading to reduced siliceous/carbonate contents and an increased clay content post-reaction. A lithology-dependent mineral evolution was observed: at 15 MPa and 55 °C, the mudstone clay content increased to 34.9–38.2% (max. +12.0%, 5–168 h, Figure 4a); at 55 °C for 24 h, the sandstone carbonate content decreased to 18.9–14.5% (max. −23.3%, 0–30 MPa, Figure 4b). Prolonged soaking enhanced mudstone clay swelling, while elevated pressure accelerated sandstone carbonate dissolution. The XRD results show that the total content of clay minerals (illite, smectite, and chlorite) increased from 12.3% to 15.7% after hydration, but the types of clay minerals did not change (no new clay mineral peaks appeared). Combined with SEM observations, we found that hydration caused the dissolution of carbonate cement (calcite) in tight sandstone, which released the originally cemented clay mineral particles and led to their relative enrichment in the pore space. The smectite component in clay minerals swells after absorbing water, which not only expands the interlayer spacing of clay minerals but also promotes the detachment of clay particles from the rock matrix. This process further enhances the observed increase in clay mineral content in XRD tests.

3.1.2. Mineral Grain Morphology and Pore Structure

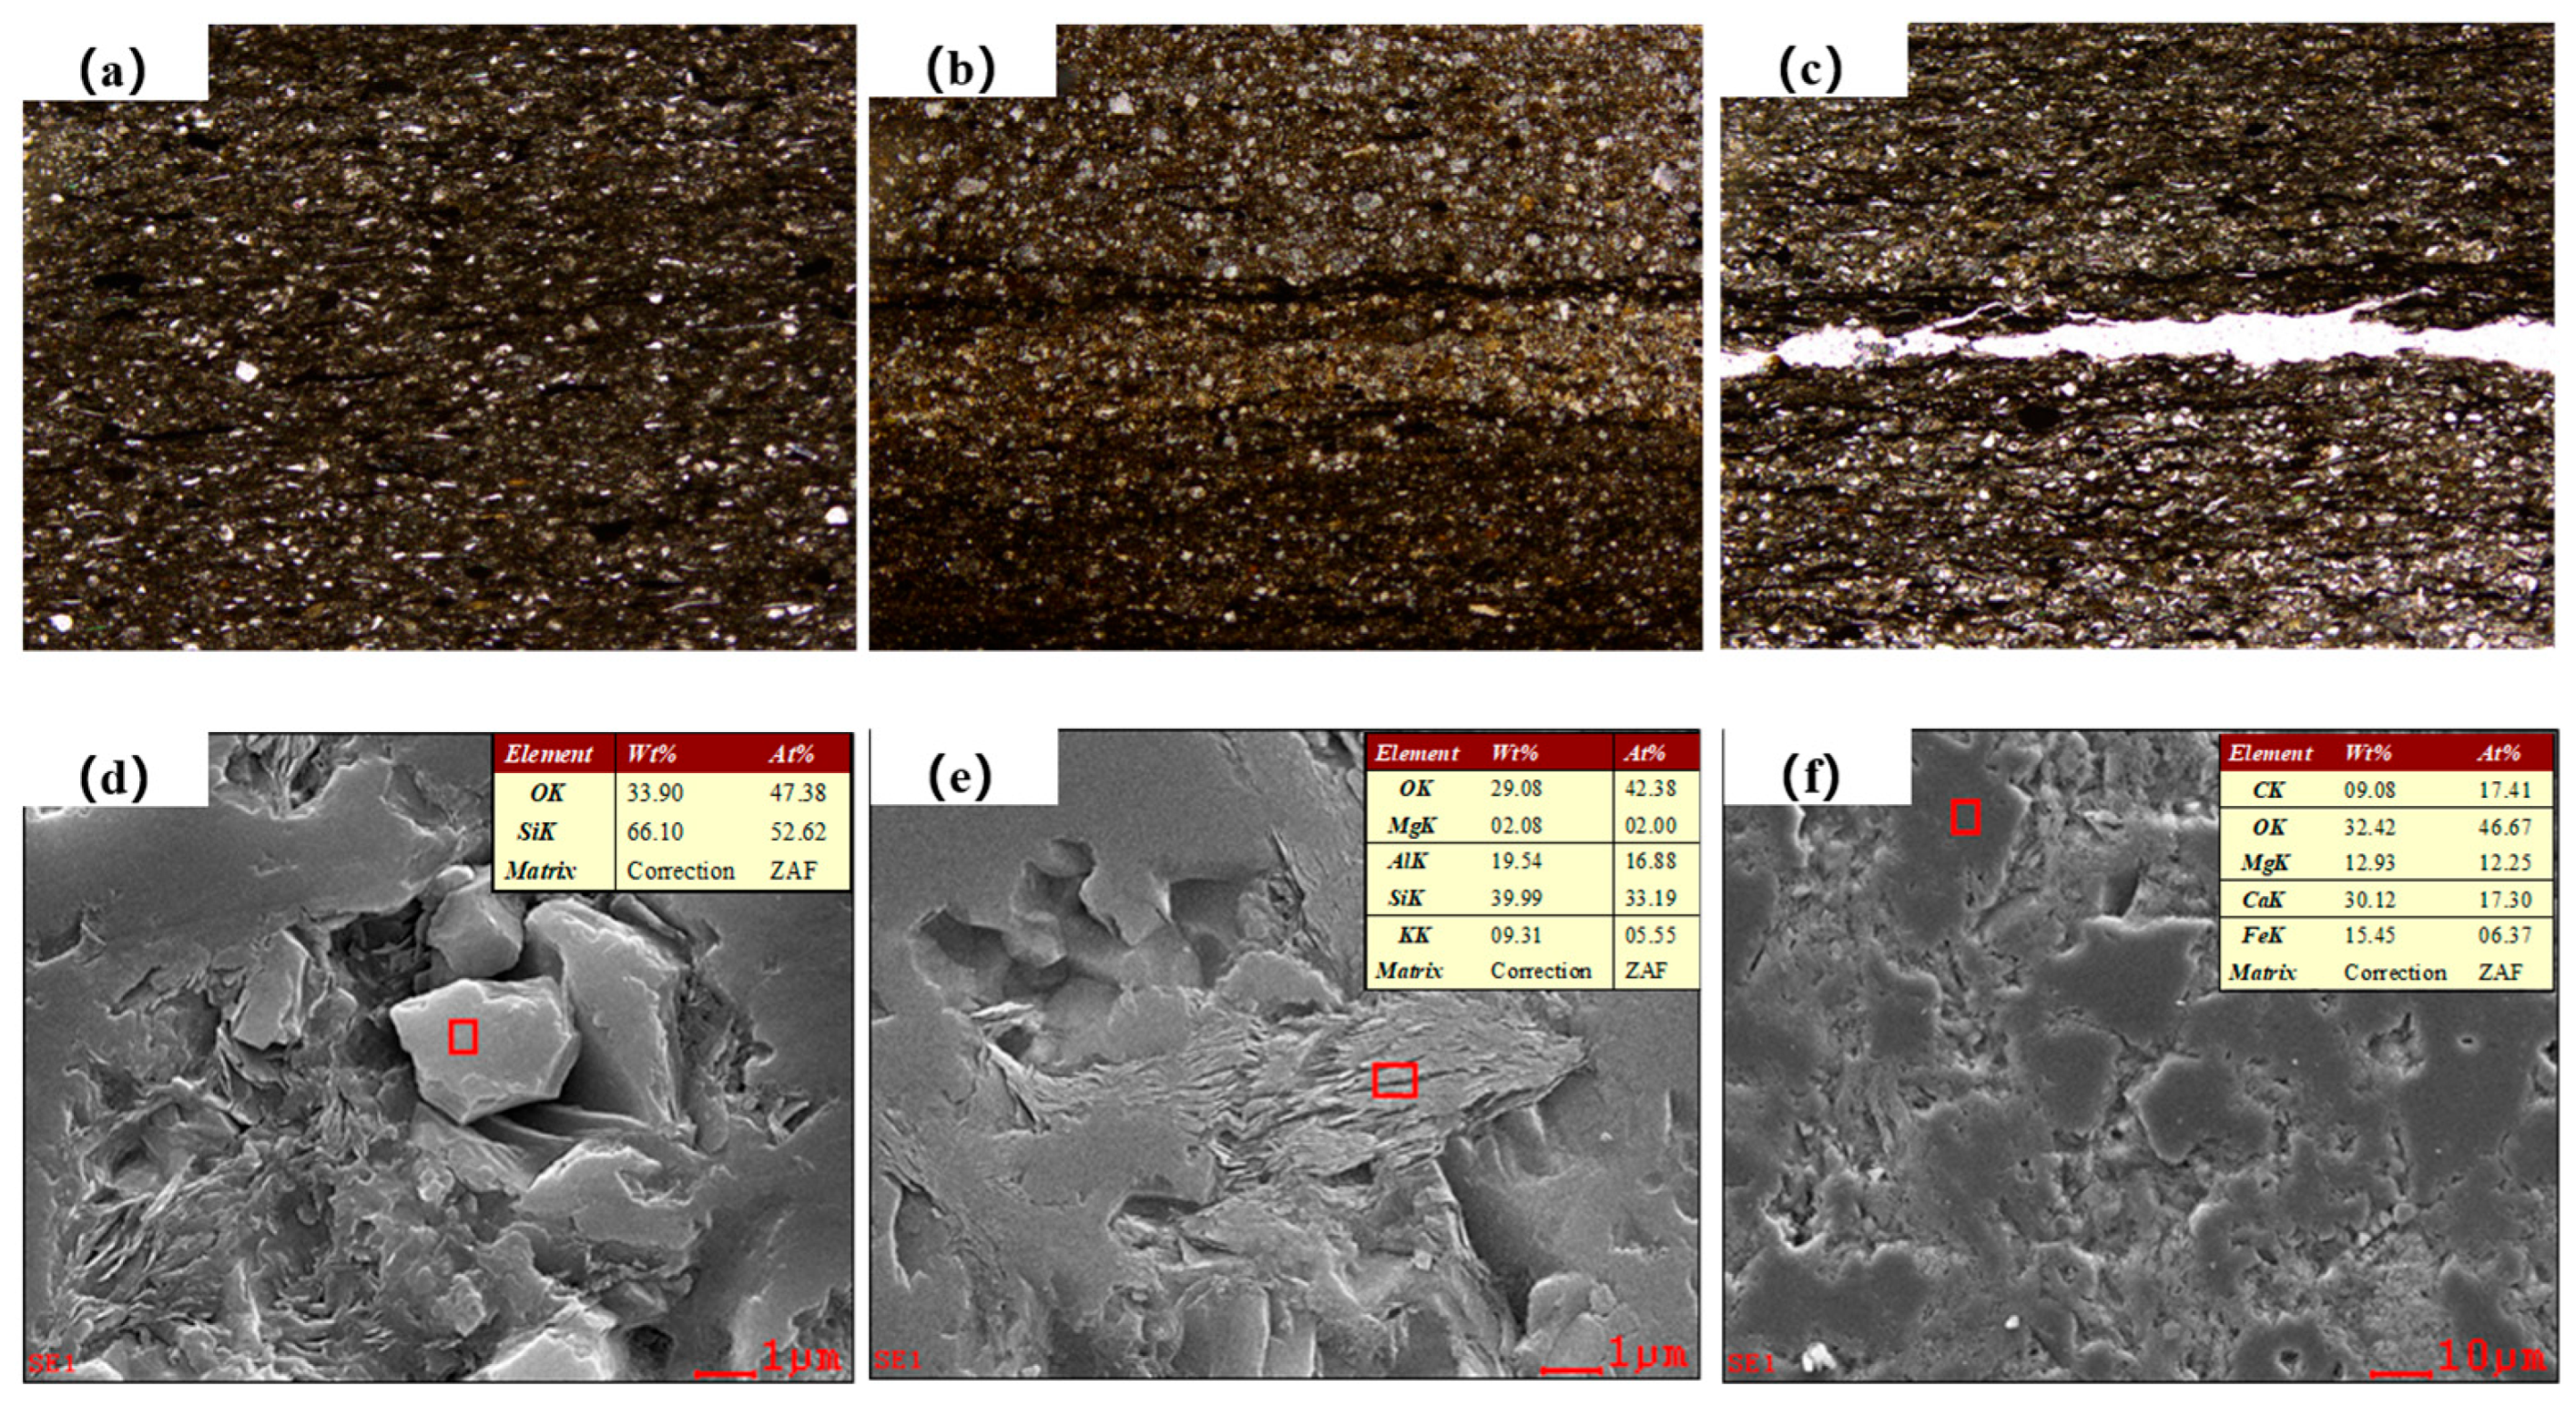
Tight sandstone is composed of muddy particles and non-muddy particles. The muddy particles consist of various clay mineral flakes, including kaolinite, chlorite, illite, montmorillonite, and some mixed-layer minerals. The non-muddy particles are composed of quartz, feldspar, calcite, and other grains. There are various pores between grains, clay flakes, and crystal layers. Both the scanning electron microscope (SEM) and energy dispersive spectroscopy (EDS) methods were used to determine the corroded minerals and collected precipitates. The red box represents the selected location, and the mineral composition at that location is identified through energy dispersive spectroscopy (EDS) to determine the mineral type. Cast thin section observations reveal that the pore–throat communities in the tight sandstone reservoir are directionally developed, exhibiting a strong heterogeneity (Figure 5a). Figure 5b shows the interbedding of light-colored sandstone layers and dark-colored clay layers, with numerous microfractures developed (Figure 5c). The pores are primarily residual pores between mineral grains, intercrystallite pores of clay minerals, and dissolved pores within grains. The throats are mainly constricted throats and curved lamellar throats, which have a certain improvement effect on reservoir permeability. The main framework minerals are quartz (Figure 5d) and feldspar (Figure 5f). The rock debris and mica content are abundant, and clay minerals are widely present. The microstructure of various clay minerals in the sand–mudstone is an ordered or disordered arrangement and accumulation of certain plate-like or lamellar units (Figure 5e).
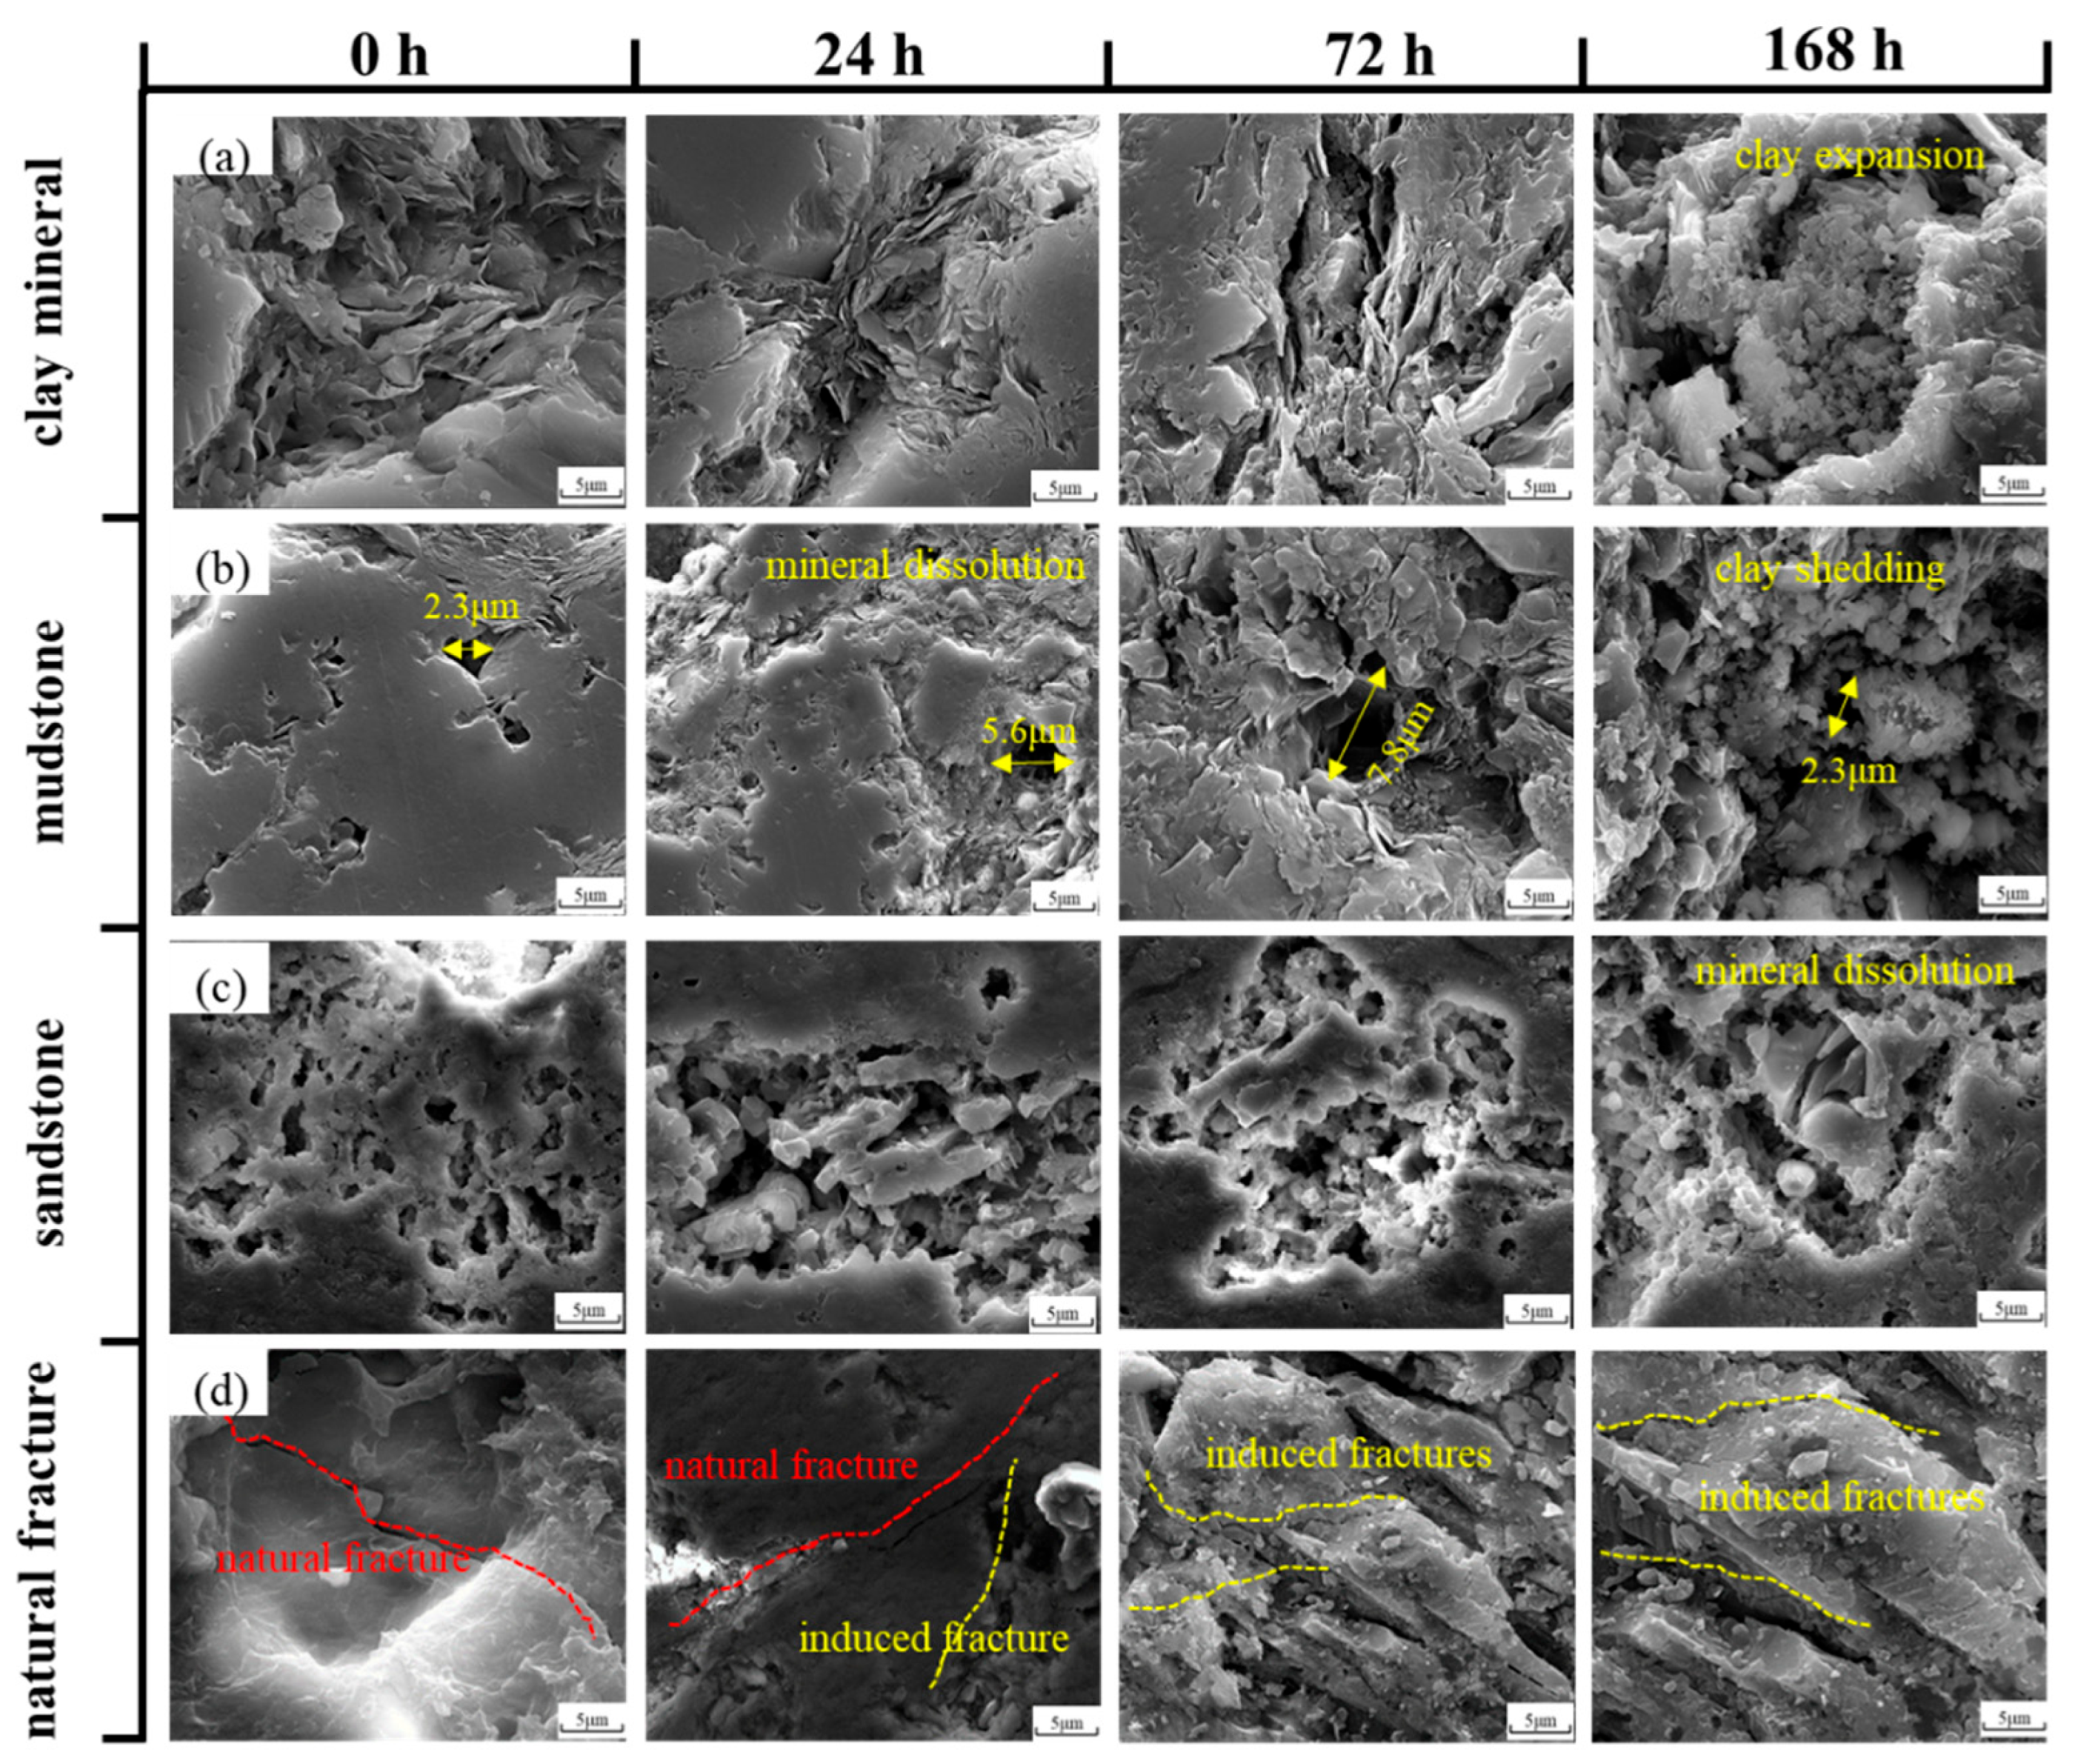
Scanning electron microscopy (SEM) was employed for fixed-point observations of the rock surface morphology and pore structure at different hydration times. Unsoaked clay minerals showed a scaly, layered distribution with sharp edges, arranged tightly in an oriented manner, accompanied by microcracks (Figure 6a). With prolonged soaking, the dense, flaky clay surfaces passivated—likely due to hydration film formation on clay particles—inducing clay expansion, disintegration, and spalling. The mudstone pore structure changed drastically with soaking time: the unreacted polished surface was smooth, with angular pores (2.3 μm in diameter, Figure 6b). After 72 h of soaking, hydration films reduced the interparticle attraction, weakening rock cementation and causing particle dissolution or migration, increasing the pore diameter to 7.8 μm. Further soaking led to a muddy mineral surface and significant clay expansion/spalling, reducing pore diameter back to 2.3 μm. For sandstone (rich in siliceous and carbonate minerals), acidic slickwater reacted with carbonates after 168 h, significantly increasing dissolved pores and rendering the structure porous and loose (Figure 6c). As shown in Figure 6d, hydration promoted the formation of interbedding microcracks, damaging the interlayer structure of clay minerals.

3.1.3. Induced Fracture

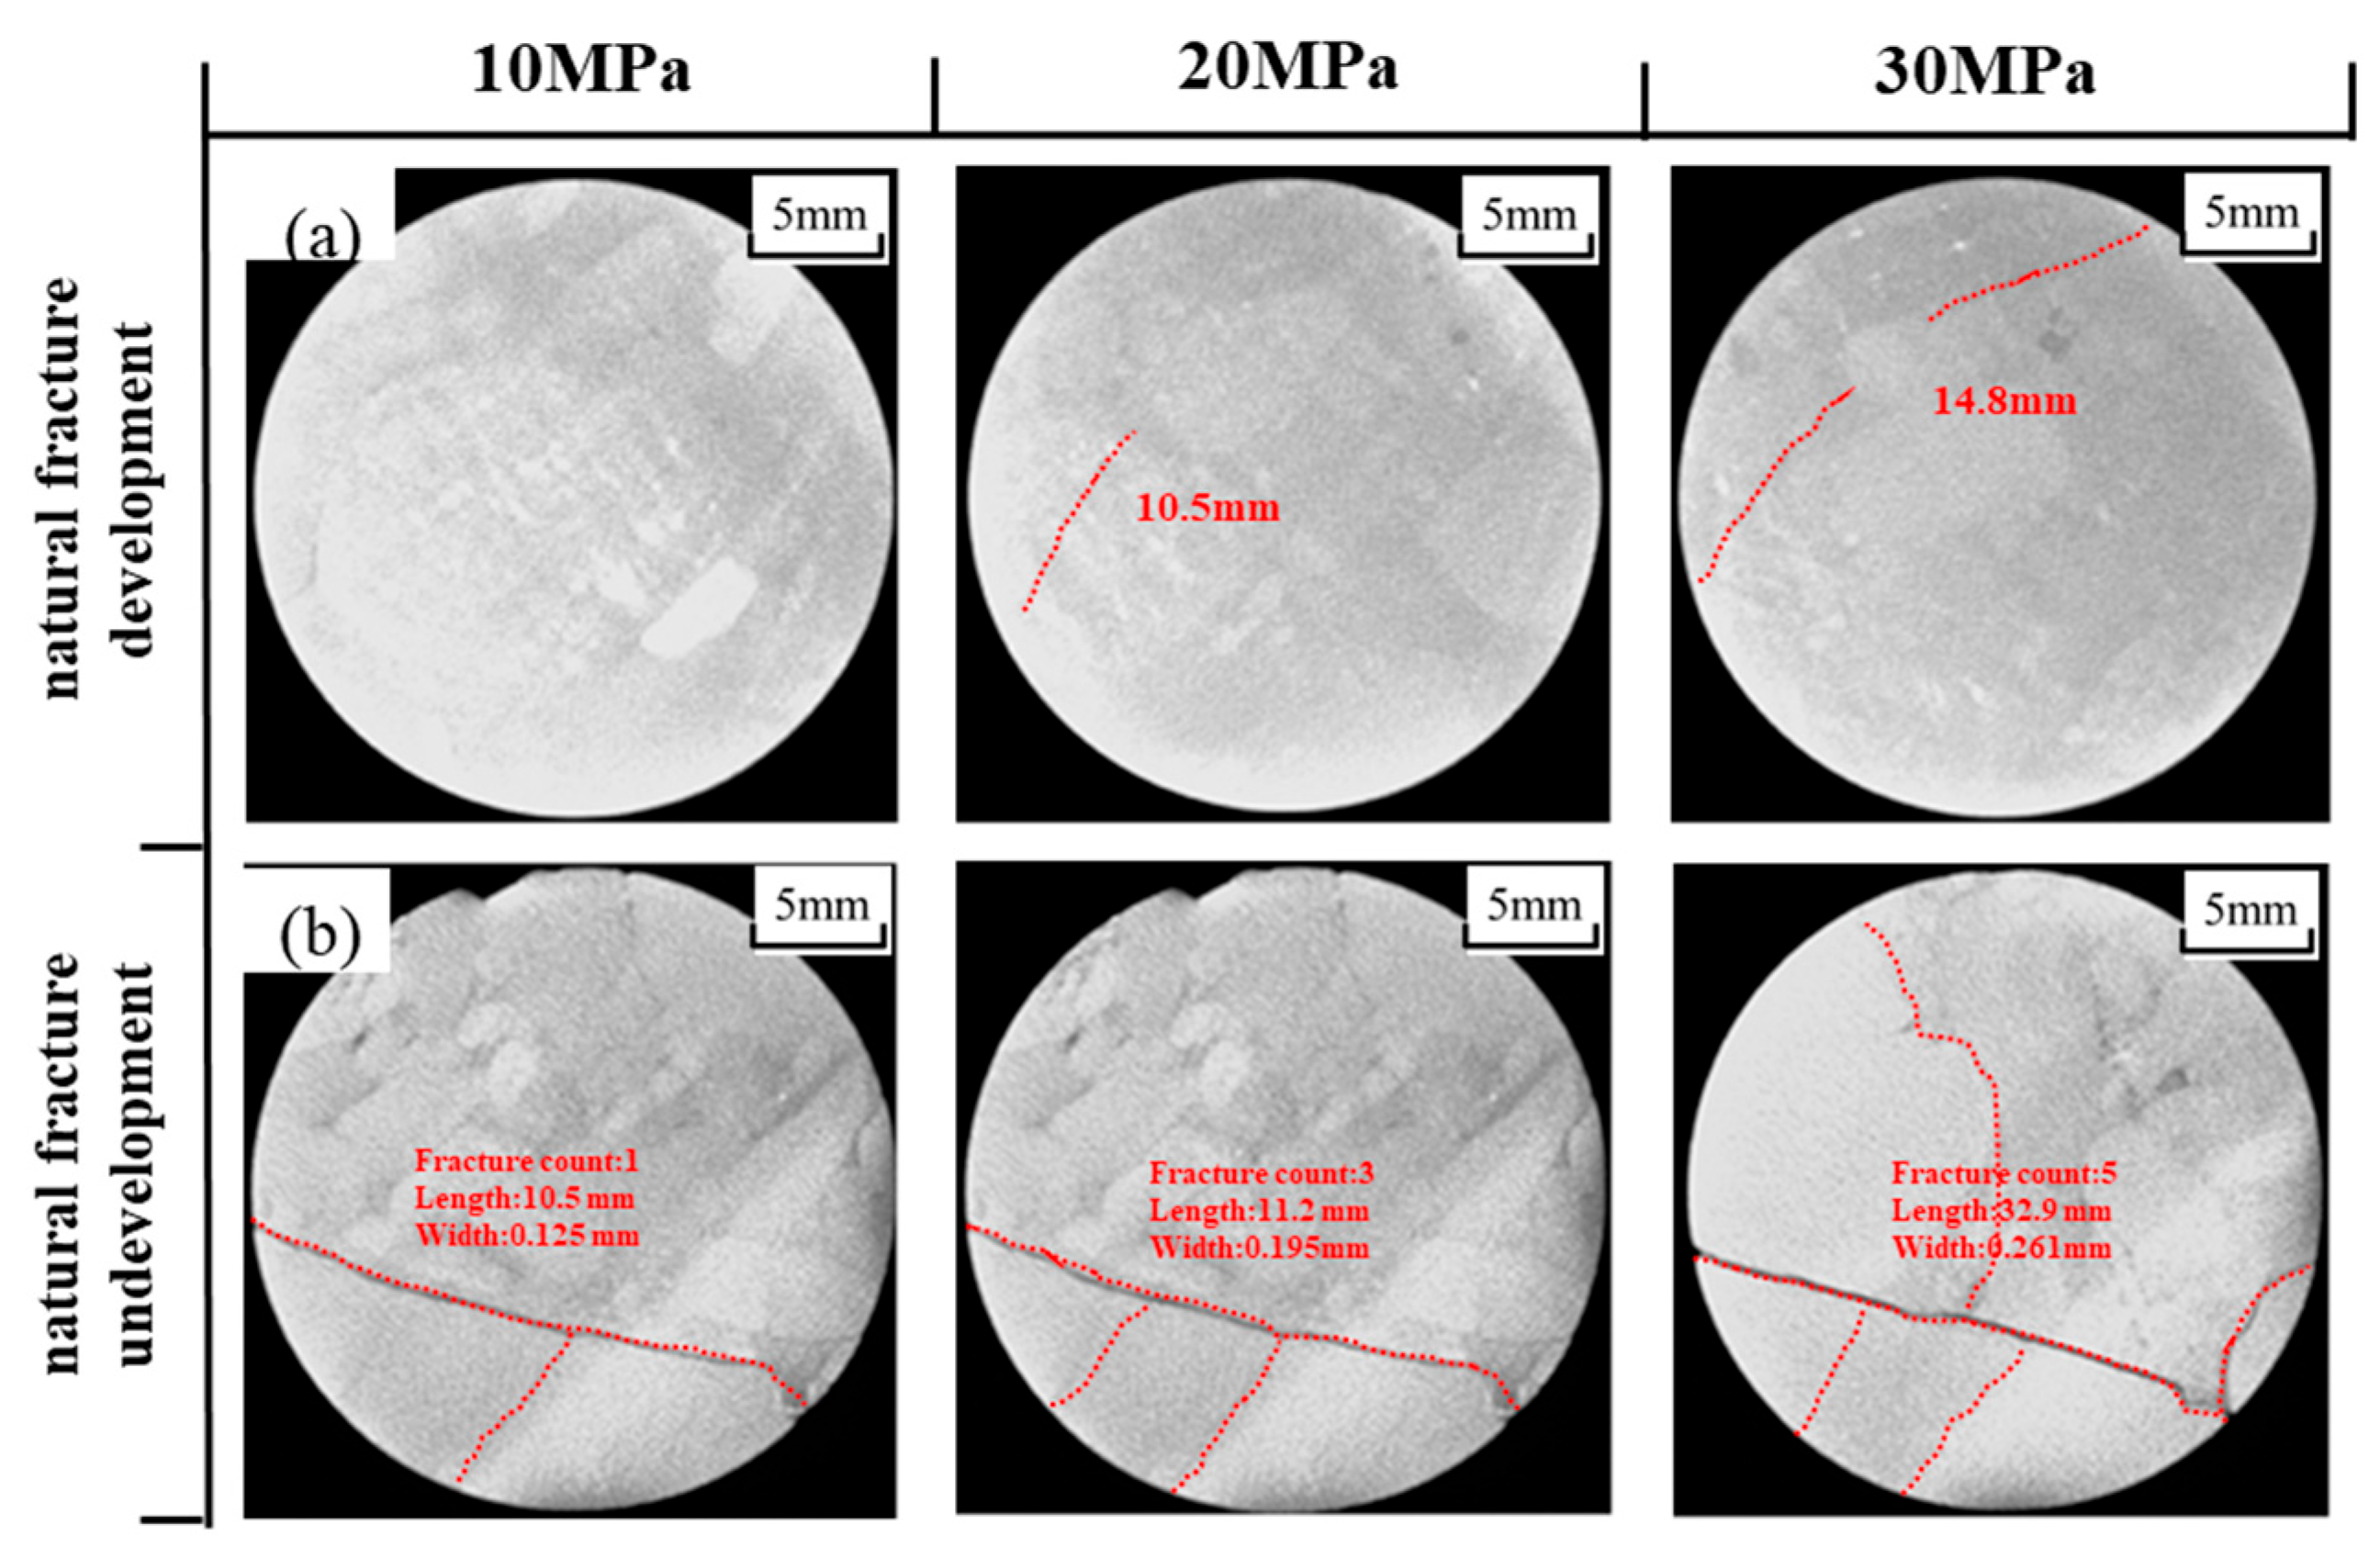
Using the combined technology of computed tomography (CT) and scanning electron microscopy (SEM), the influence of water–rock interactions on the development characteristics of induced fractures was quantitatively characterized from both macroscopic and microscopic perspectives. Standard core cylinders were taken as the research objects, and water–rock immersion experiments were conducted under different pressure conditions (Figure 7). The CT scanning results indicated that the internal damage of the rock samples was mainly concentrated in the enriched areas of interbedded light-colored sandstone and dark-colored claystone, manifesting as the initiation and propagation of induced fractures. During the immersion process, driven by the pressure difference between the inside and outside of the core, water preferentially infiltrated into the sandstone along natural fractures with strong permeability and adsorbed onto the surfaces of clay mineral particles. The expansion deformation caused by this adsorption mainly occurred inside the rock samples. When the expansion stress exceeded the mechanical strength threshold of the rock itself, induced fractures were generated accordingly.
Research indicates that the degree of natural fracture development significantly regulates the generation of induced fractures within rock samples after water–rock interactions. For sandstone samples without natural fractures (Figure 7a), no induced fractures were observed under a soaking pressure of 10 MPa; one induced fracture with a length of 10.5 mm was generated at 20 MPa; and, when the soaking pressure increased to 30 MPa, the number of induced fractures increased to two, with a total length of 14.8 mm. For sandstone samples with natural fractures (Figure 7b), one, three, and five induced fractures were generated under soaking pressures of 10, 20, and 30 MPa, respectively, with corresponding total lengths of 10.5 mm, 11.2 mm, and 32.9 mm. The above results confirm that the degree of hydration damage to sandstone intensifies with increasing soaking pressure. The presence of natural fractures increases the dominant pathways for fluid intrusion into the rock samples, providing favorable conditions for the initiation and propagation of induced fractures. Furthermore, the local connectivity of these induced microfractures significantly improves the permeability of sandstone.
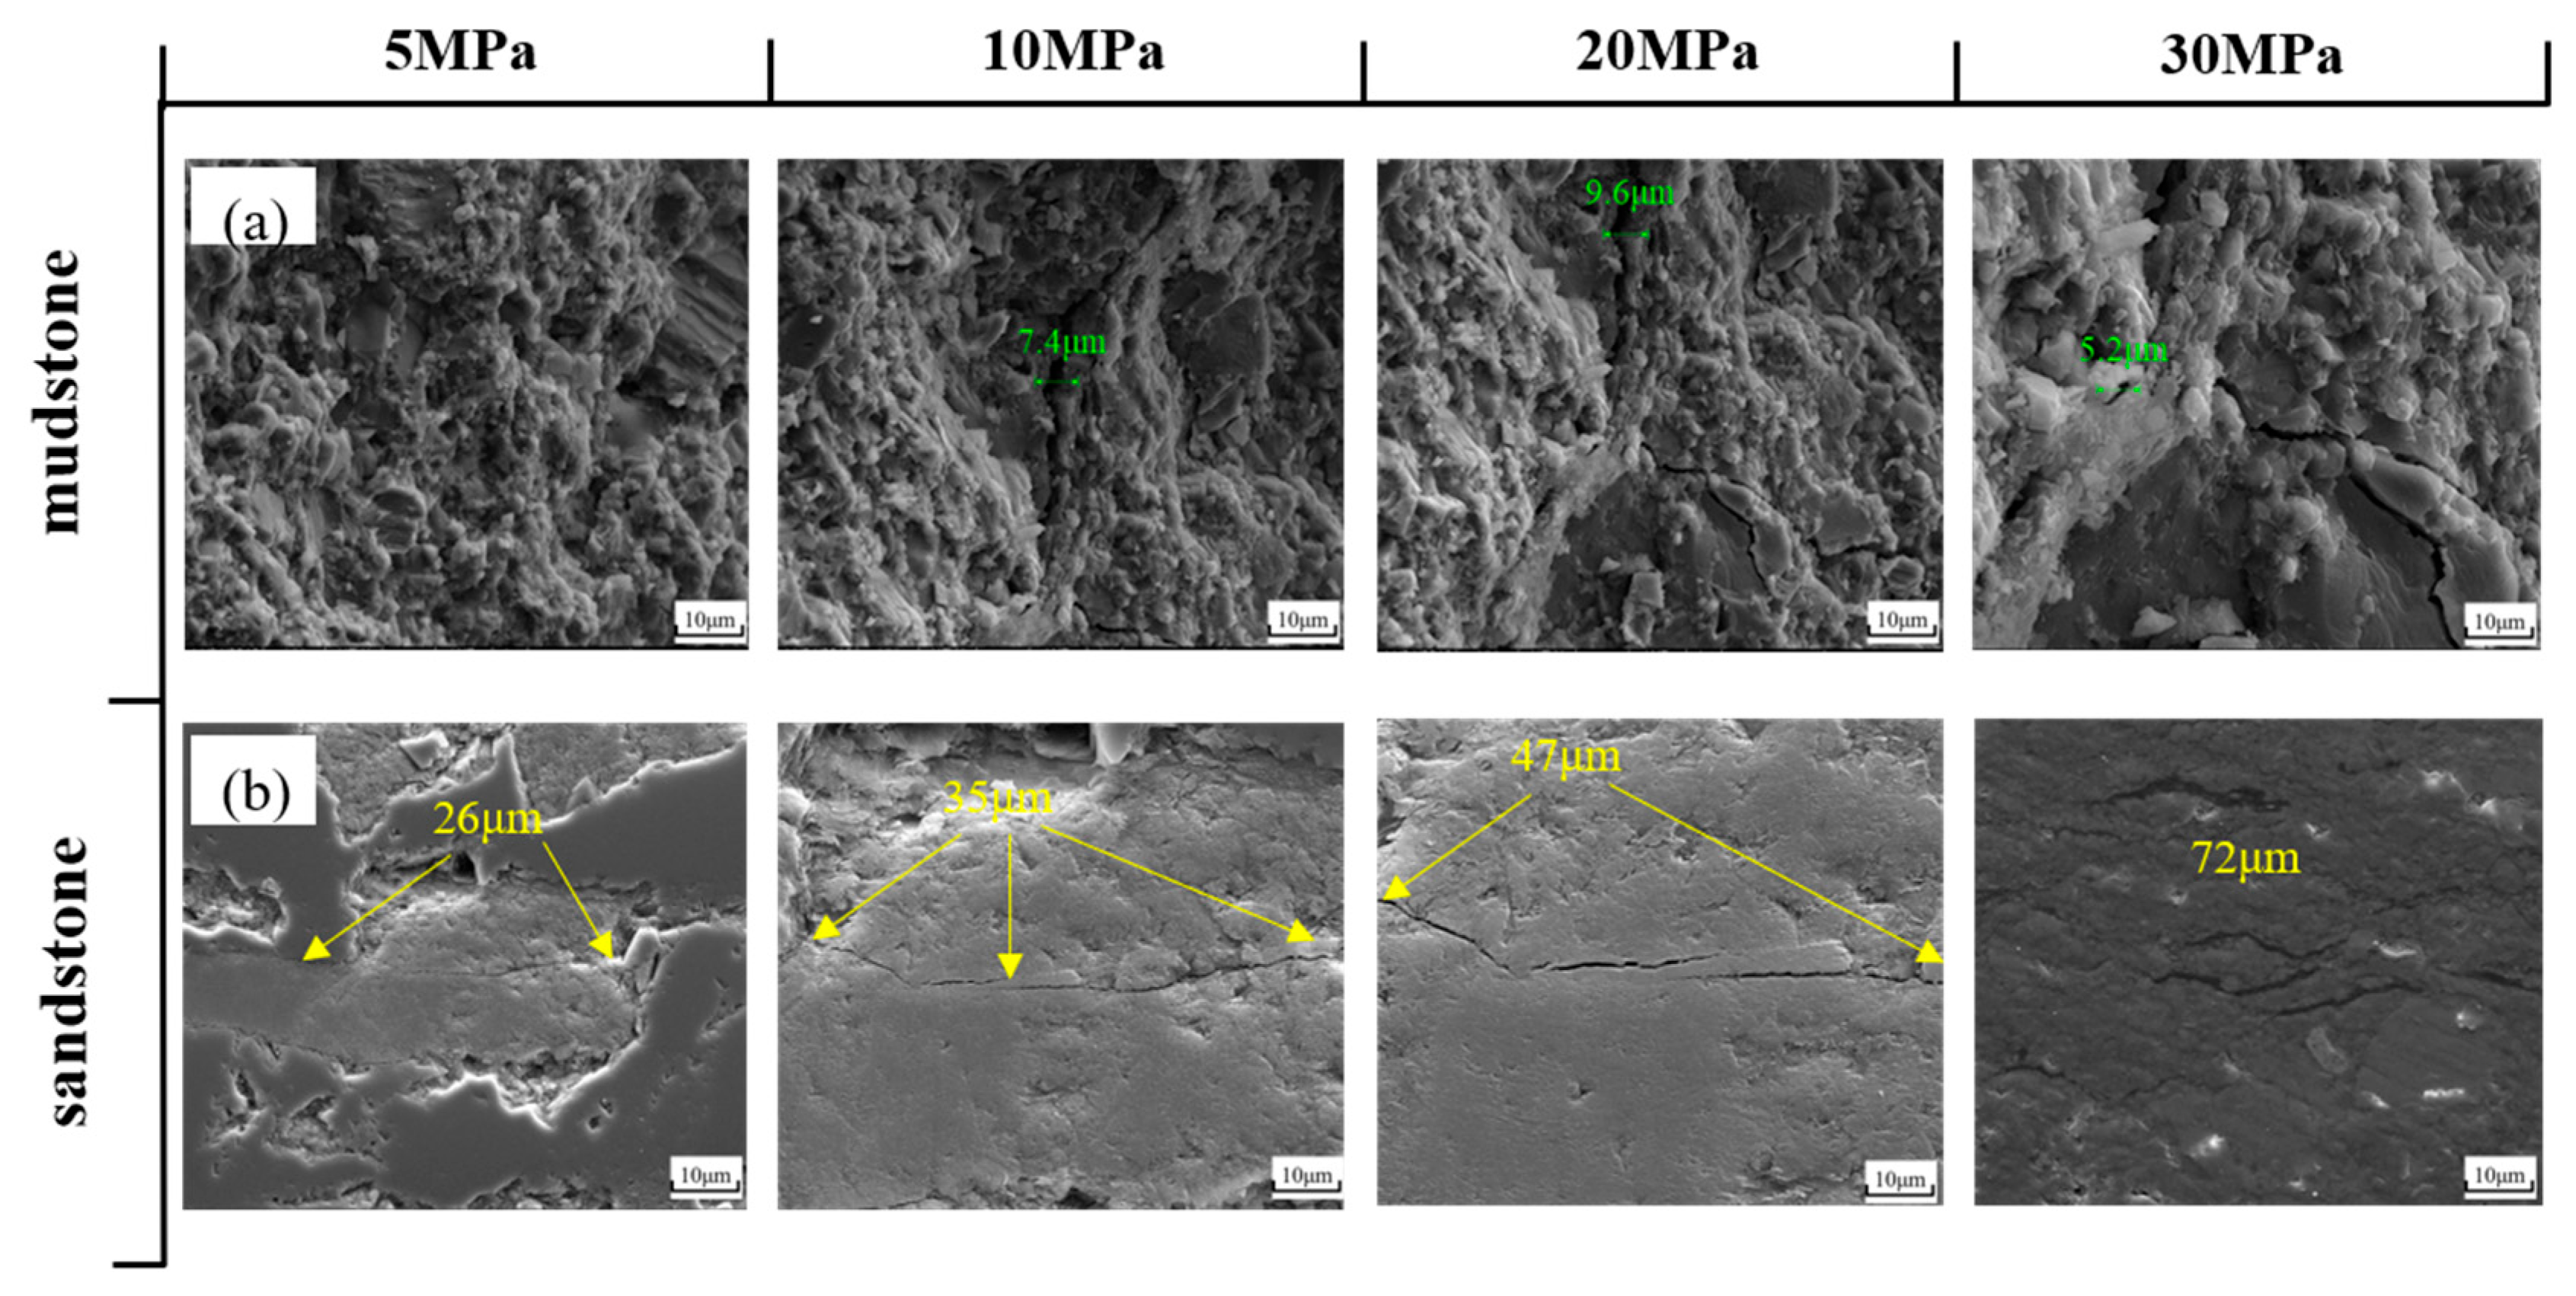
To further quantitatively describe the formation mechanism of fractures induced by immersion conditions, lithological changes, and water–rock reactions, scanning electron microscopy was used to observe two sets of mudstone and sandstone samples before and after treatment with slick water fracturing fluid. The number and width of induced fractures within the samples were statistically analyzed to quantitatively evaluate the degree of induced fracture development on the sandstone surface under different immersion conditions. Under varying immersion time and pressure conditions, the length of induced fractures in sandstone after immersion was generally greater than the width of induced fractures in mudstone after immersion (Figure 8).
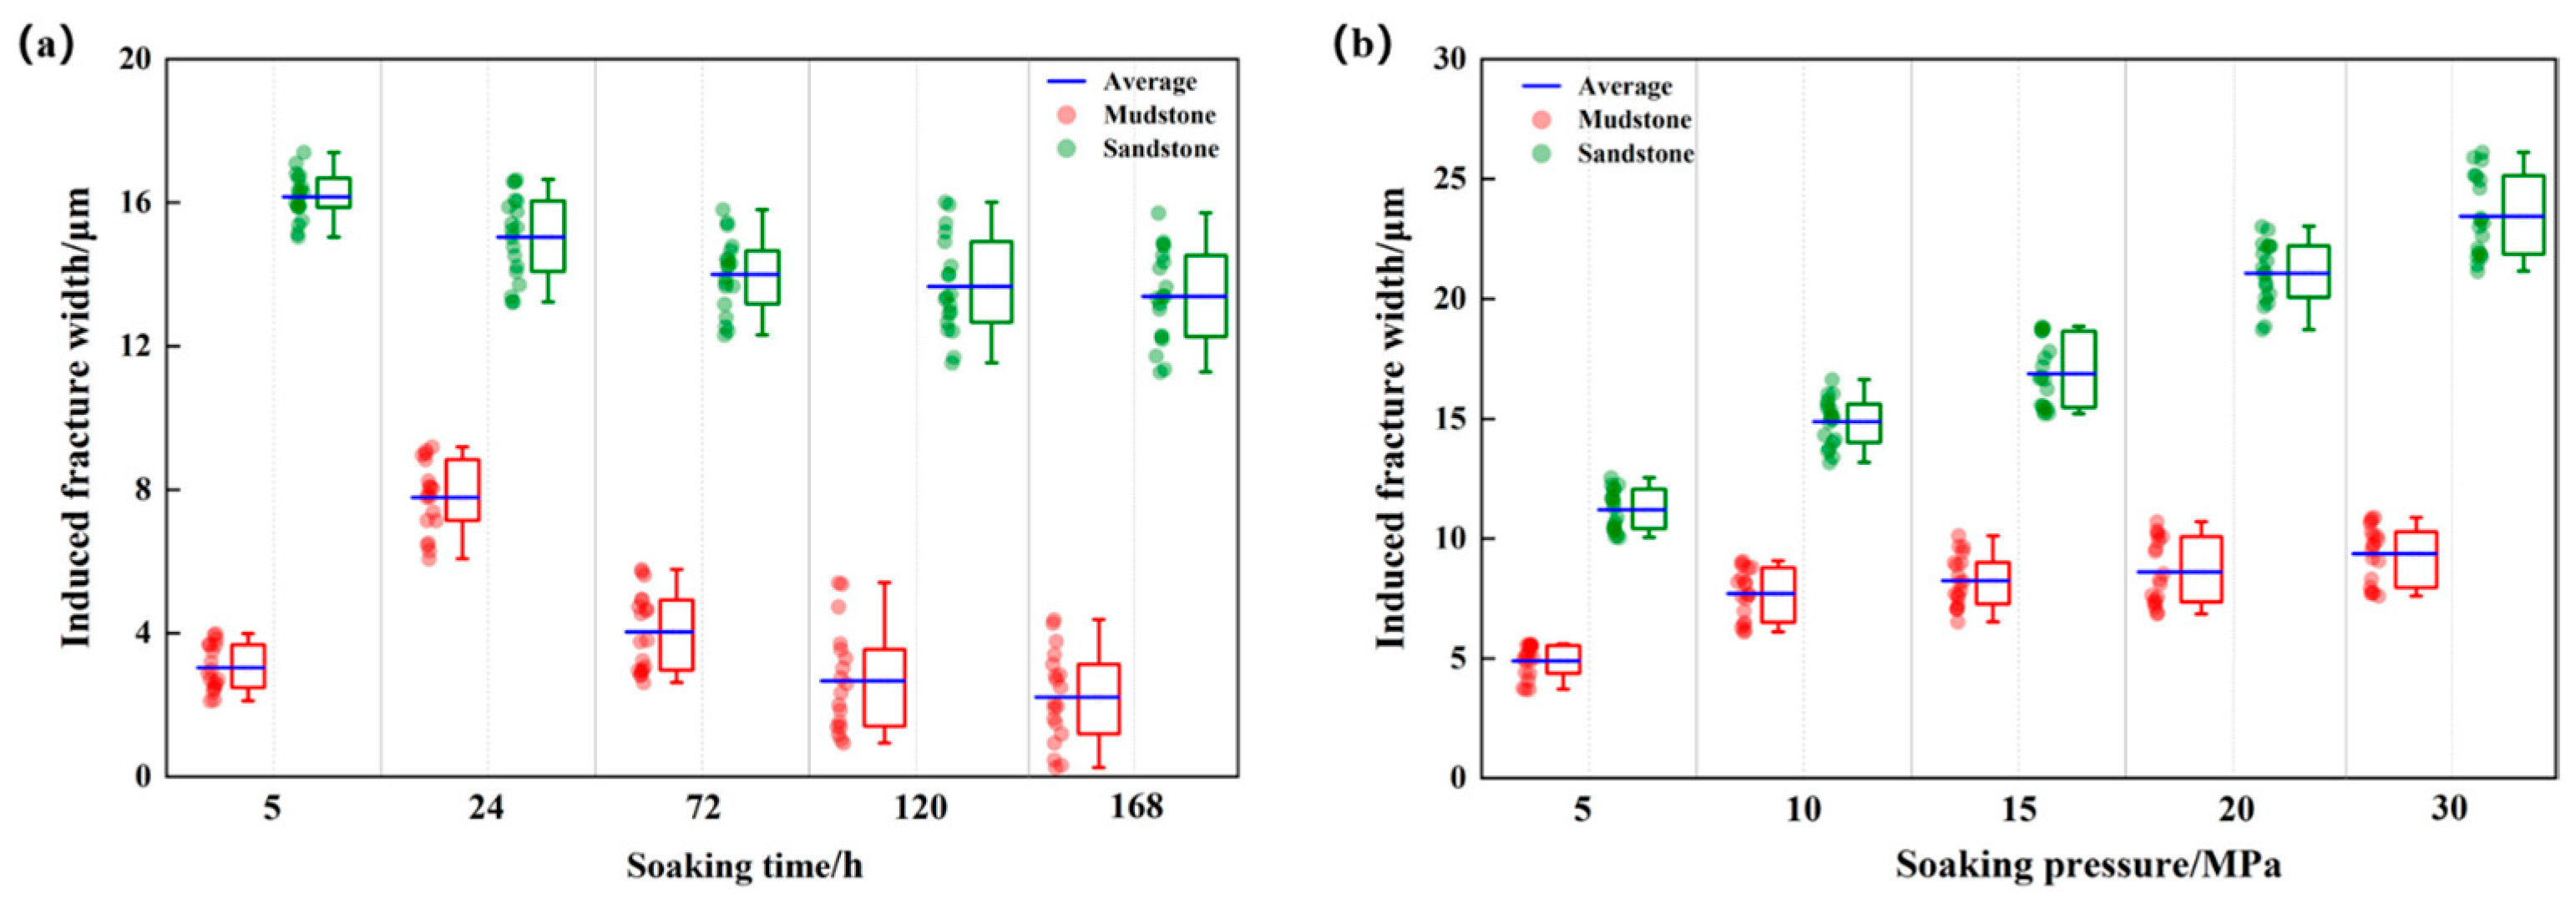
After soaking, there are significant differences in the sensitivity of the induced fracture width on the surface of the two types of lithological samples to various influencing factors. Under the conditions of a soaking pressure of 20 MPa and temperature of 55 °C, after soaking in slippery water for 5, 24, 72, 120, and 168 h, the number of induced fractures on the surface of mudstone shows an increasing trend, while the statistical average value of the fracture width exhibits a characteristic of first increasing and then decreasing, with values of 3.5, 7.9, 4.1, 3.3, and 3.1 μm in sequence, reaching a peak at 24 h of soaking. Subsequently, with the expansion and migration of clay minerals, some induced fractures become blocked, and the fracture width continues to decrease with the extension of soaking time, with a maximum decrease of 11.4%. In contrast, the statistical average value of the induced fracture width on the surface of sandstone shows a monotonically decreasing trend with the extension of soaking time, with values of 16.1, 14.6, 13.7, 13.4, and 13.2 μm in sequence, with a maximum decrease of 18.1%. Given that the clay mineral content in sandstone is significantly lower than that in mudstone, the decrease in the fracture width caused by the increase in soaking time is smaller in sandstone than in mudstone (see Figure 9a).
To elevate the interpretation from phenomenological to mechanistic levels, we further analyze the intrinsic driving mechanisms by dividing the hydration process into three stages with distinct dominant effects: Stage-dependent dominant mechanisms: We divided the hydration process into three stages and identified the dominant mechanism for each stage: (1) Initial stage (0–24 h): Surface hydration dominates, with clay mineral swelling and surface carbonate dissolution leading to a minor pore expansion, which accounts for the initial increase in the mudstone fracture width and the peak value at 24 h. (2) Intermediate stage (24–72 h): Pore pressure-driven fluid infiltration dominates, inducing microcrack initiation and propagation, while clay particle migration in mudstone starts to cause partial fracture clogging, resulting in a rapid decrease in its fracture width. (3) Advanced stage (72–168 h): Fracture network reconstruction dominates, with clay particle migration causing partial fracture clogging (in mudstone) or carbonate dissolution expanding fracture connectivity (in sandstone), leading to the stable low fracture width in mudstone and slow decreasing trend in sandstone.
The increase in immersion fluid pressure can significantly enhance the number of induced fractures in mudstone and sandstone and promote a notable increase in fracture width. As the immersion pressure rises, the depth and amount of water infiltration along pores synchronously increase, and the intensity of hydration correspondingly enhances. For sandstone immersed in slick water, an increase in pressure facilitates the adsorption of fluid in natural fractures and pores, thereby enhancing the internal pore pressure of the rock sample. Furthermore, during the pressure unloading phase, the pressure within the container gradually decreases, while the internal pore pressure of the rock sample exhibits a lag effect. Under the pressure difference between the core and the outside, the fluid undergoes a certain degree of phase change and expansion, promoting the initiation and further expansion of induced fractures. Under the conditions of fluid temperature at 55 °C and immersion for 24 h, when the immersion pressure increases from 5 MPa to 30 MPa, the statistical average values of induced fracture widths on the surfaces of mudstone and sandstone increase from 4.9 μm and 10.7 μm to 9.1 μm and 23.8 μm, respectively, with an increase of 85.7% and 122.4% (see Figure 9b). In summary, under the conditions of this experiment, immersion pressure plays a dominant role in promoting fracture development. As the pressure increases, the number of induced fractures increases, and both the statistical average and maximum values of the fracture width show an increasing trend.

3.2. Micro-Mechanical Characteristics of Water–Rock Interaction

3.2.1. Indentation Failure Morphology and Curve Characteristics

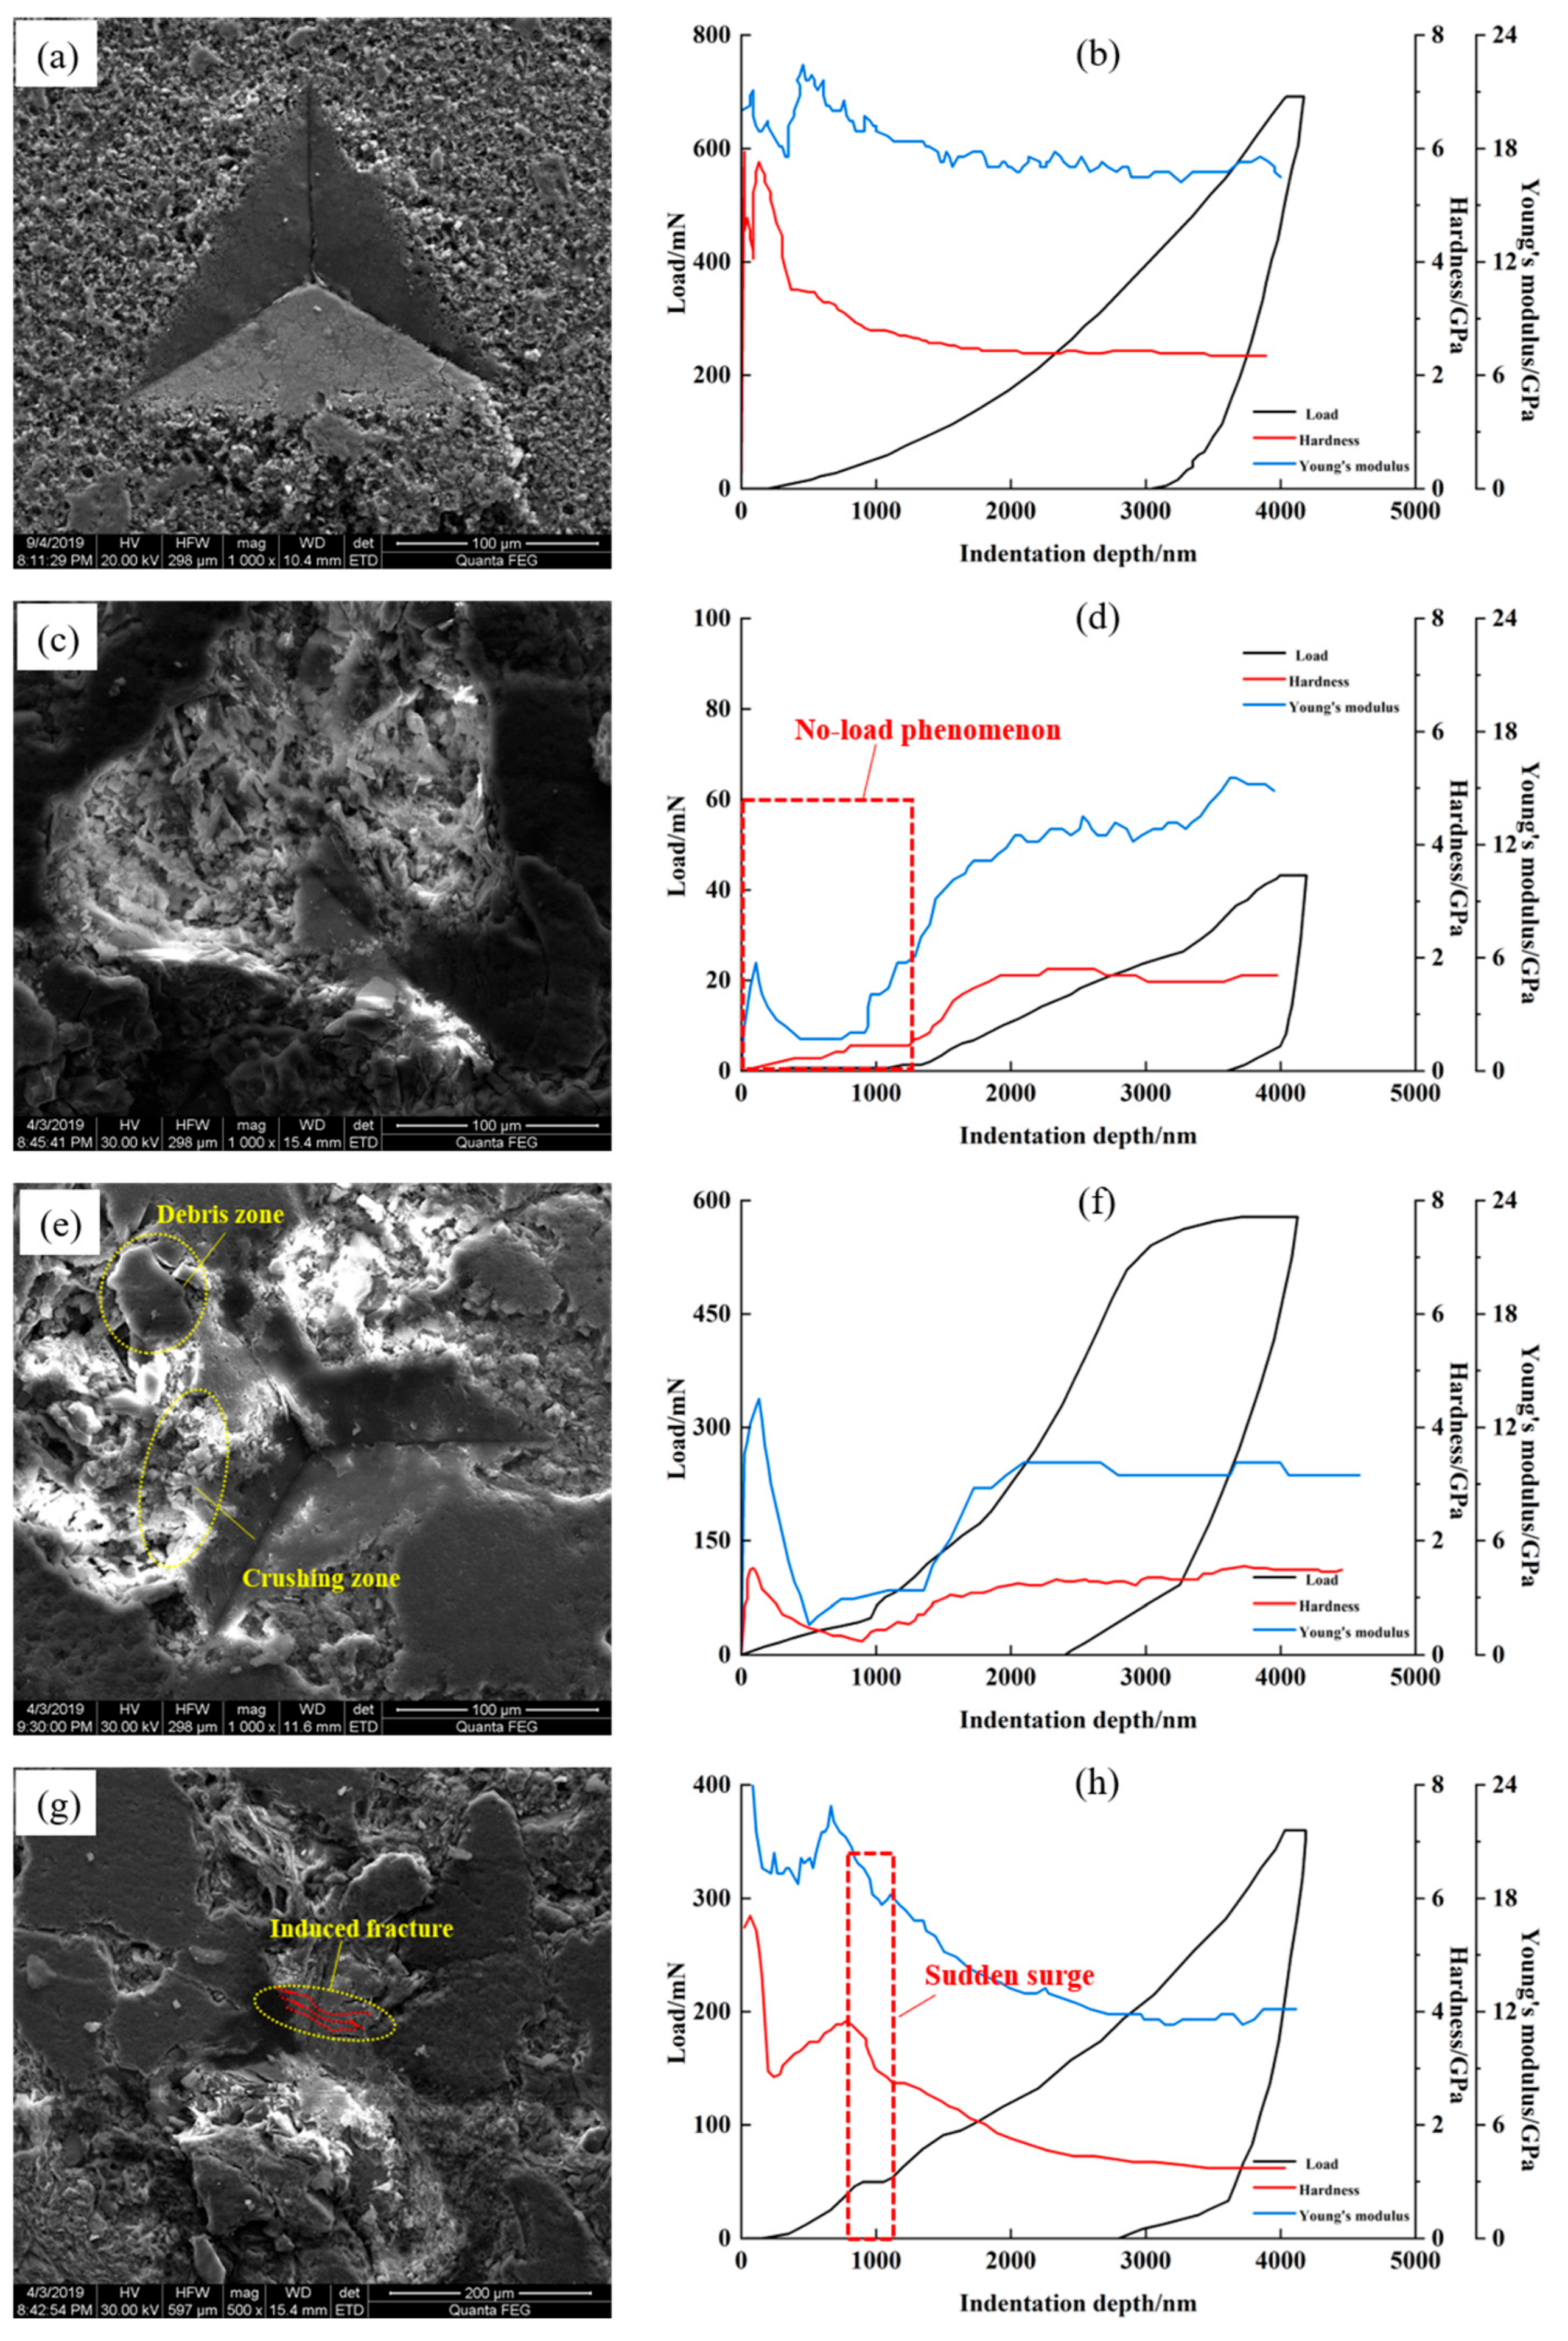
After the Nano-indentation experiment, based on the load–indentation depth curve, the variation law of the micro-mechanical parameters of the rock sample surface before and after immersion was obtained. The damage characteristics near the indentation points were observed using scanning electron microscopy (SEM). By analyzing the position of the indentation points in the test matrix, the correspondence between micro-mechanical parameters and the spatial position of indentation points was established. Combining the damage morphology of indentation points at different indentation locations on the samples surface and the characteristics of the load–indentation depth curve, the indentation points can be divided into the following four categories:
① Matrix region indentation: The indentation morphology is mostly in the shape of a standard triangular pyramid, with no obvious induced crack development near the indentation point, or only a small amount of induced microcracks appearing at the front edge of the indentation edge (see Figure 10a). As the indentation depth increases, the load shows an increasing trend, and the Young’s modulus and hardness overall show a decreasing trend and gradually stabilize. Young’s modulus and hardness at the maximum indentation depth are 16.48 GPa and 2.34 GPa, respectively (see Figure 10b).
② Indentation at pore sites: During the loading stage, the load curve exhibits a “no-load” characteristic, meaning that the indentation depth increases rapidly in the initial stage, but the load approaches 0 (see Figure 10c). When the indentation depth reaches approximately 1000 nm, the load gradually increases with the indentation depth. In the middle and later stages of loading, the Young’s modulus and hardness of the indentation points at the induced cracks gradually increase with the indentation depth and stabilize (see Figure 10d). The Young’s modulus and hardness at the maximum indentation depth are 14.86 GPa and 1.68 GPa, respectively, which are only 90.2% and 71.8% of the micro-mechanical parameters in the matrix region.
③ Indentation in clay mineral enrichment area: Due to hydration, clay minerals expand and their strength decreases. Visible extrusion crushing zones can be observed at the indentation points (see Figure 10e), and significant mineral detachment is present at the indentation edges. Hydration weakens the mechanical strength of the rock surface, resulting in a lower Young’s modulus and hardness in the shallow layer; as the indentation depth increases, the load gradually increases, and the overall Young’s modulus and hardness show a downward trend and tend to stabilize.
④ Induced crack indentation: Due to the influence of induced cracks, the damage characteristics and micro-mechanical response at the indentation point are more complex. As the indentation depth increases, the contact area between the indenter and the rock surface gradually enlarges, and the influence of cracks becomes more significant: the morphology on one side of the indentation point is incomplete, and the deformation of surface minerals leads to local compaction and the closure of the induced cracks generated during the soaking stage (see Figure 10g). At the same time, under the drag force, multiple stress-induced tensile cracks parallel to the direction of natural cracks are formed within the indentation range. The generation of new cracks on the rock sample surface or the influence of clay-rich laminae cause a significant an “accelerated breakthrough” phenomenon in the load curve, that is, the indentation depth increases rapidly but the load growth is slow (see Figure 10h). Throughout the indentation process, the micro-mechanical parameters fluctuate and decrease with increasing indentation depth, gradually stabilizing only after the indentation depth reaches about 2500 nm; the Young’s modulus and hardness at the maximum indentation depth are 12.14 GPa and 1.24 GPa, respectively, which are lower than those at the indentation point in the matrix area.

3.2.2. Micro-Mechanical Characteristics

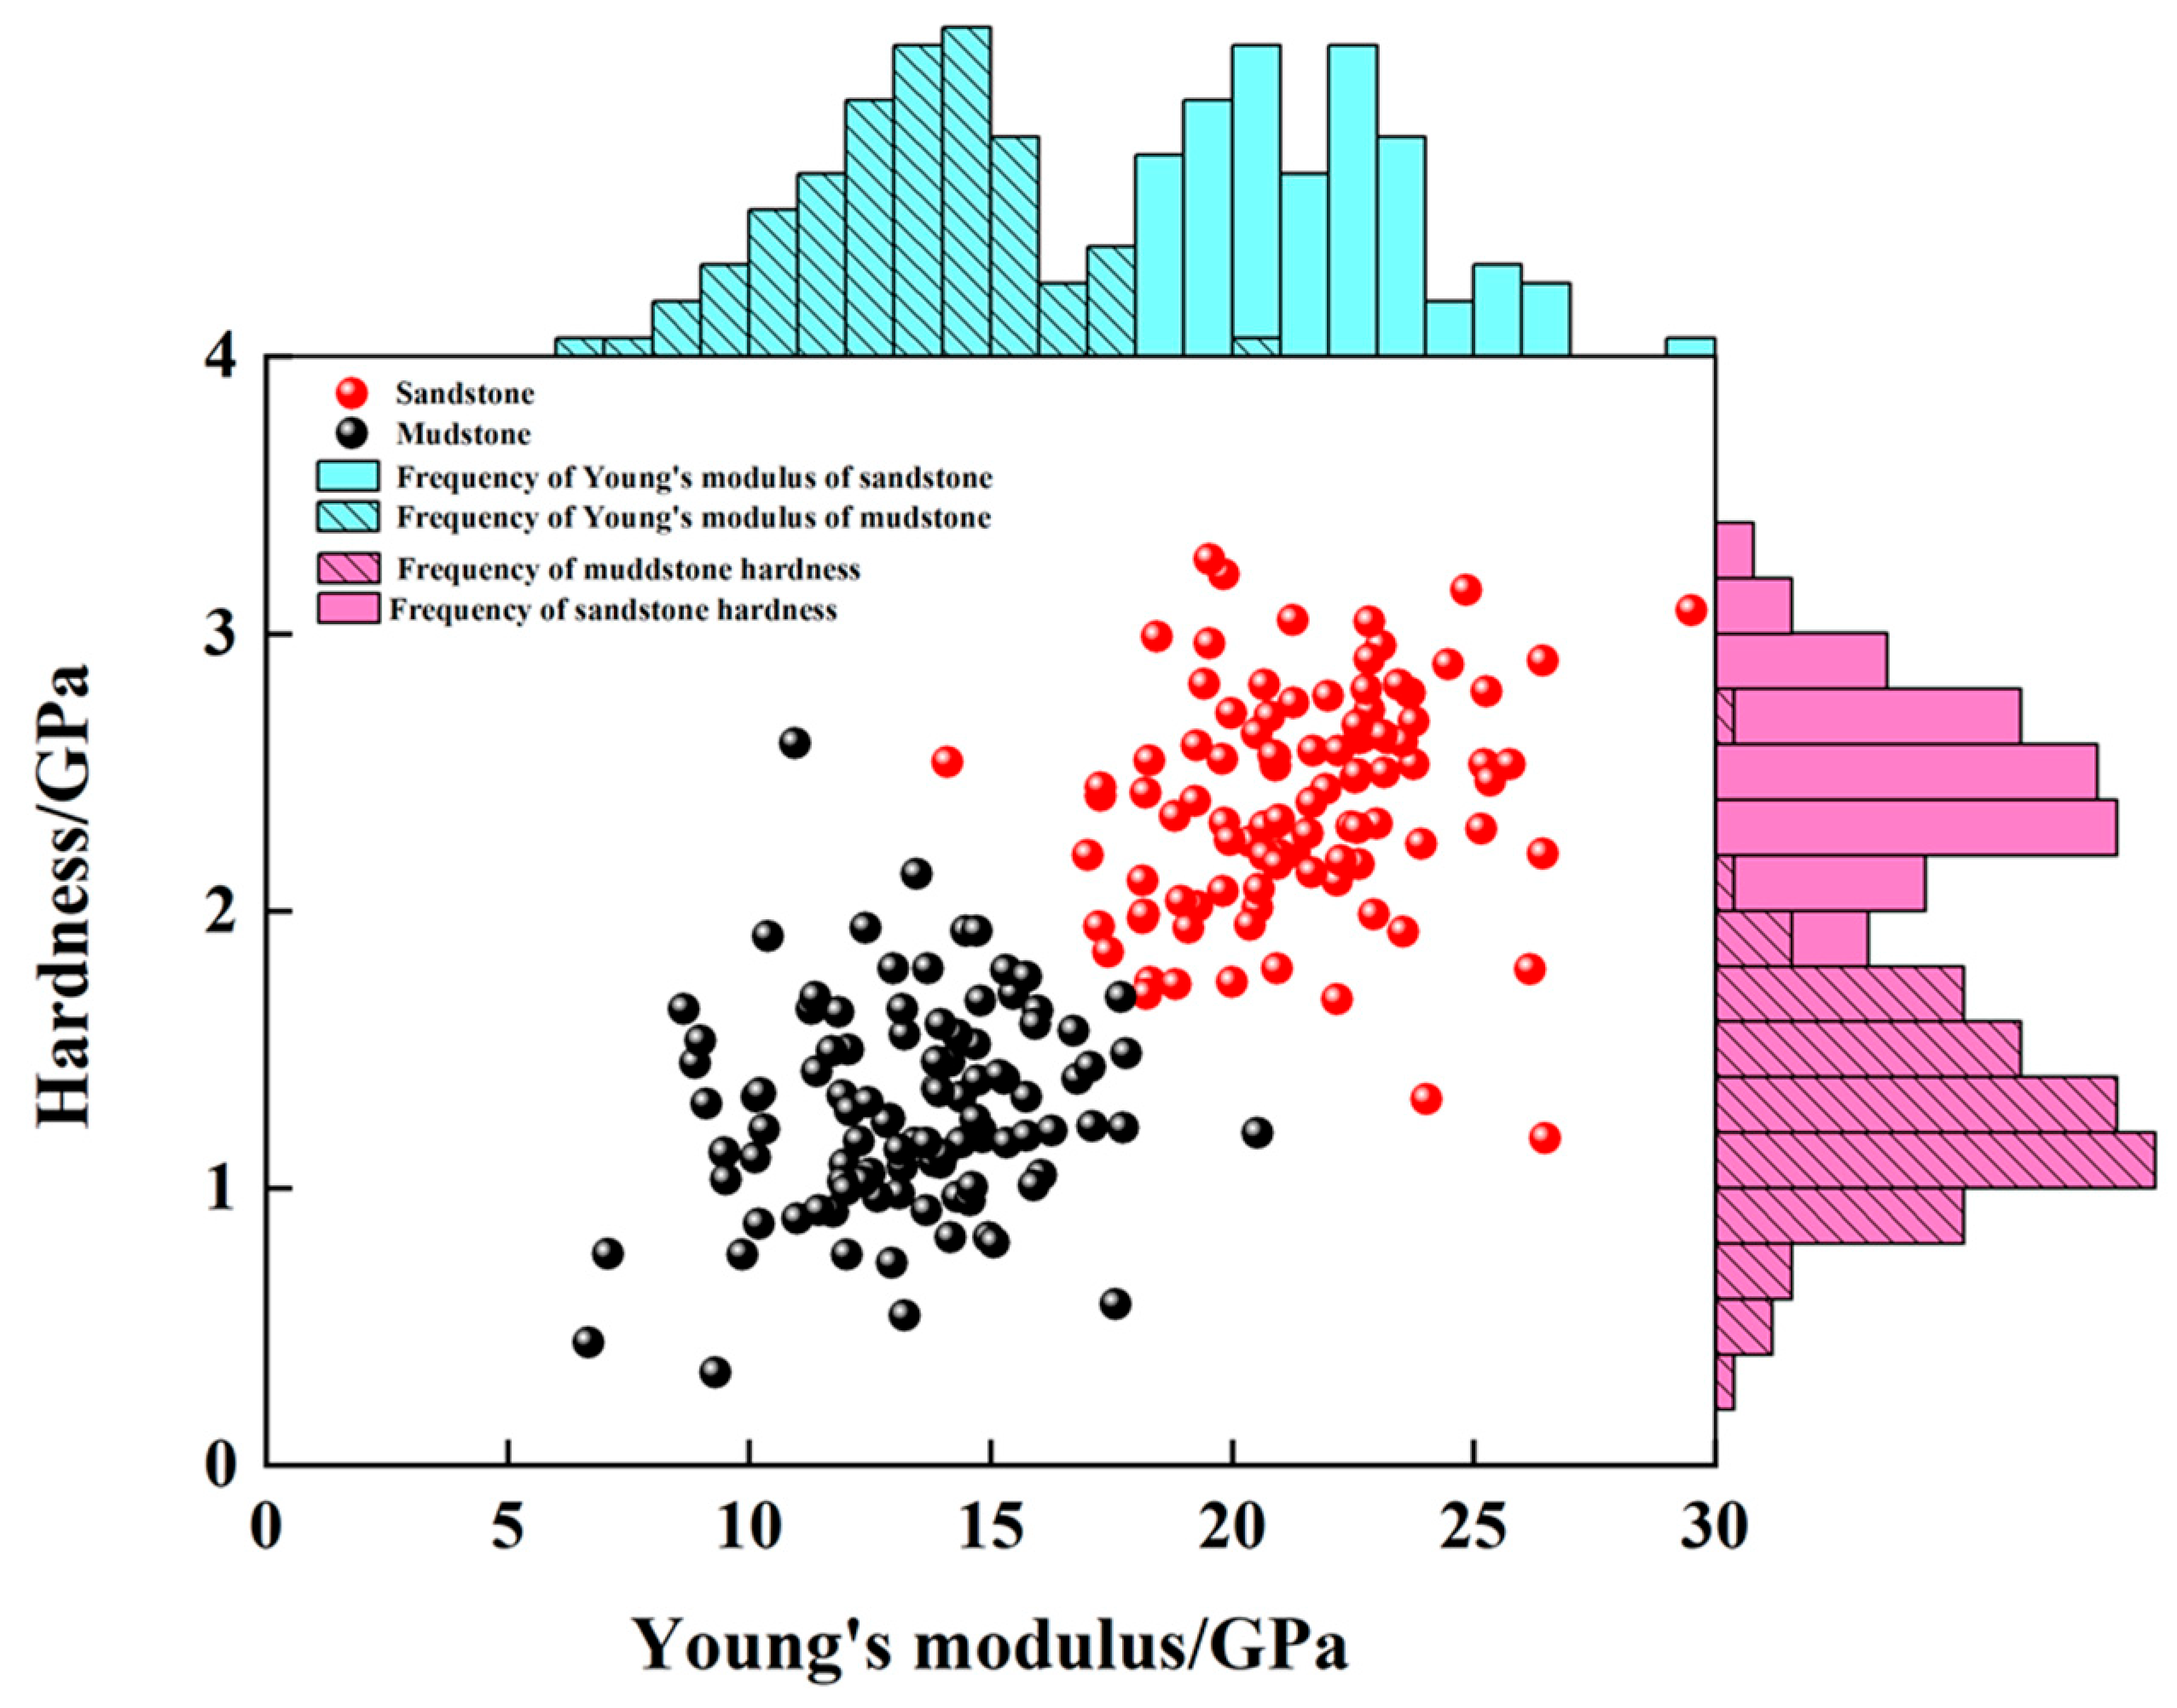
One of the main reasons for the change in crack propagation paths and non-uniform propagation due to the reduction in mechanical strength of rock surfaces is the characterization of the mechanical properties of rock surfaces after water–rock interactions at the microscale, which is more conducive to explaining the principle of crack propagation after water injection. The statistical analysis of the nanoindentation test results of sandstone and mudstone samples before and after water–rock reactions shows a significant positive correlation between the Young’s modulus and hardness, but there is significant dispersion in the test results for the same sample. This study summarizes the maximum, minimum, and average values of mechanical parameters under different conditions and calculates the parameter distribution in the 25–75% range after sorting each set of data. The statistical analysis of the Young’s modulus and hardness of mudstone and sandstone before soaking is shown in Figure 11. For the original mudstone sample, the statistical average value of the Young’s modulus at the indentation point is 13.32 GPa, with a distribution range of 10.23–16.79 GPa at the 25–75% range; the statistical average value of the hardness is 1.27 GPa, with a distribution range of 0.92–1.79 GPa at the 25–75% range. For the original sandstone sample, the statistical average value of the Young’s modulus at the indentation point is 21.46 GPa, with a distribution range of 18.21–22.49 GPa at the 25–75% range; the statistical average value of hardness is 2.40 GPa, with a distribution range of 1.95–2.96 GPa at the 25–75% range.
The observation results for rock surface damage after water immersion indicate that prolonged soaking intensifies crack development, pore structure alteration, microstructural damage, and micro-mechanical strength deterioration (Figure 6). These structural changes directly drive the degradation of micro-mechanical parameters, as confirmed by nanoindentation tests. Specifically, pore expansion, crack propagation, and clay mineral swelling (key microstructural indicators) weaken the rock’s load-bearing capacity and stress transfer efficiency, thereby reducing the Young’s modulus and hardness.
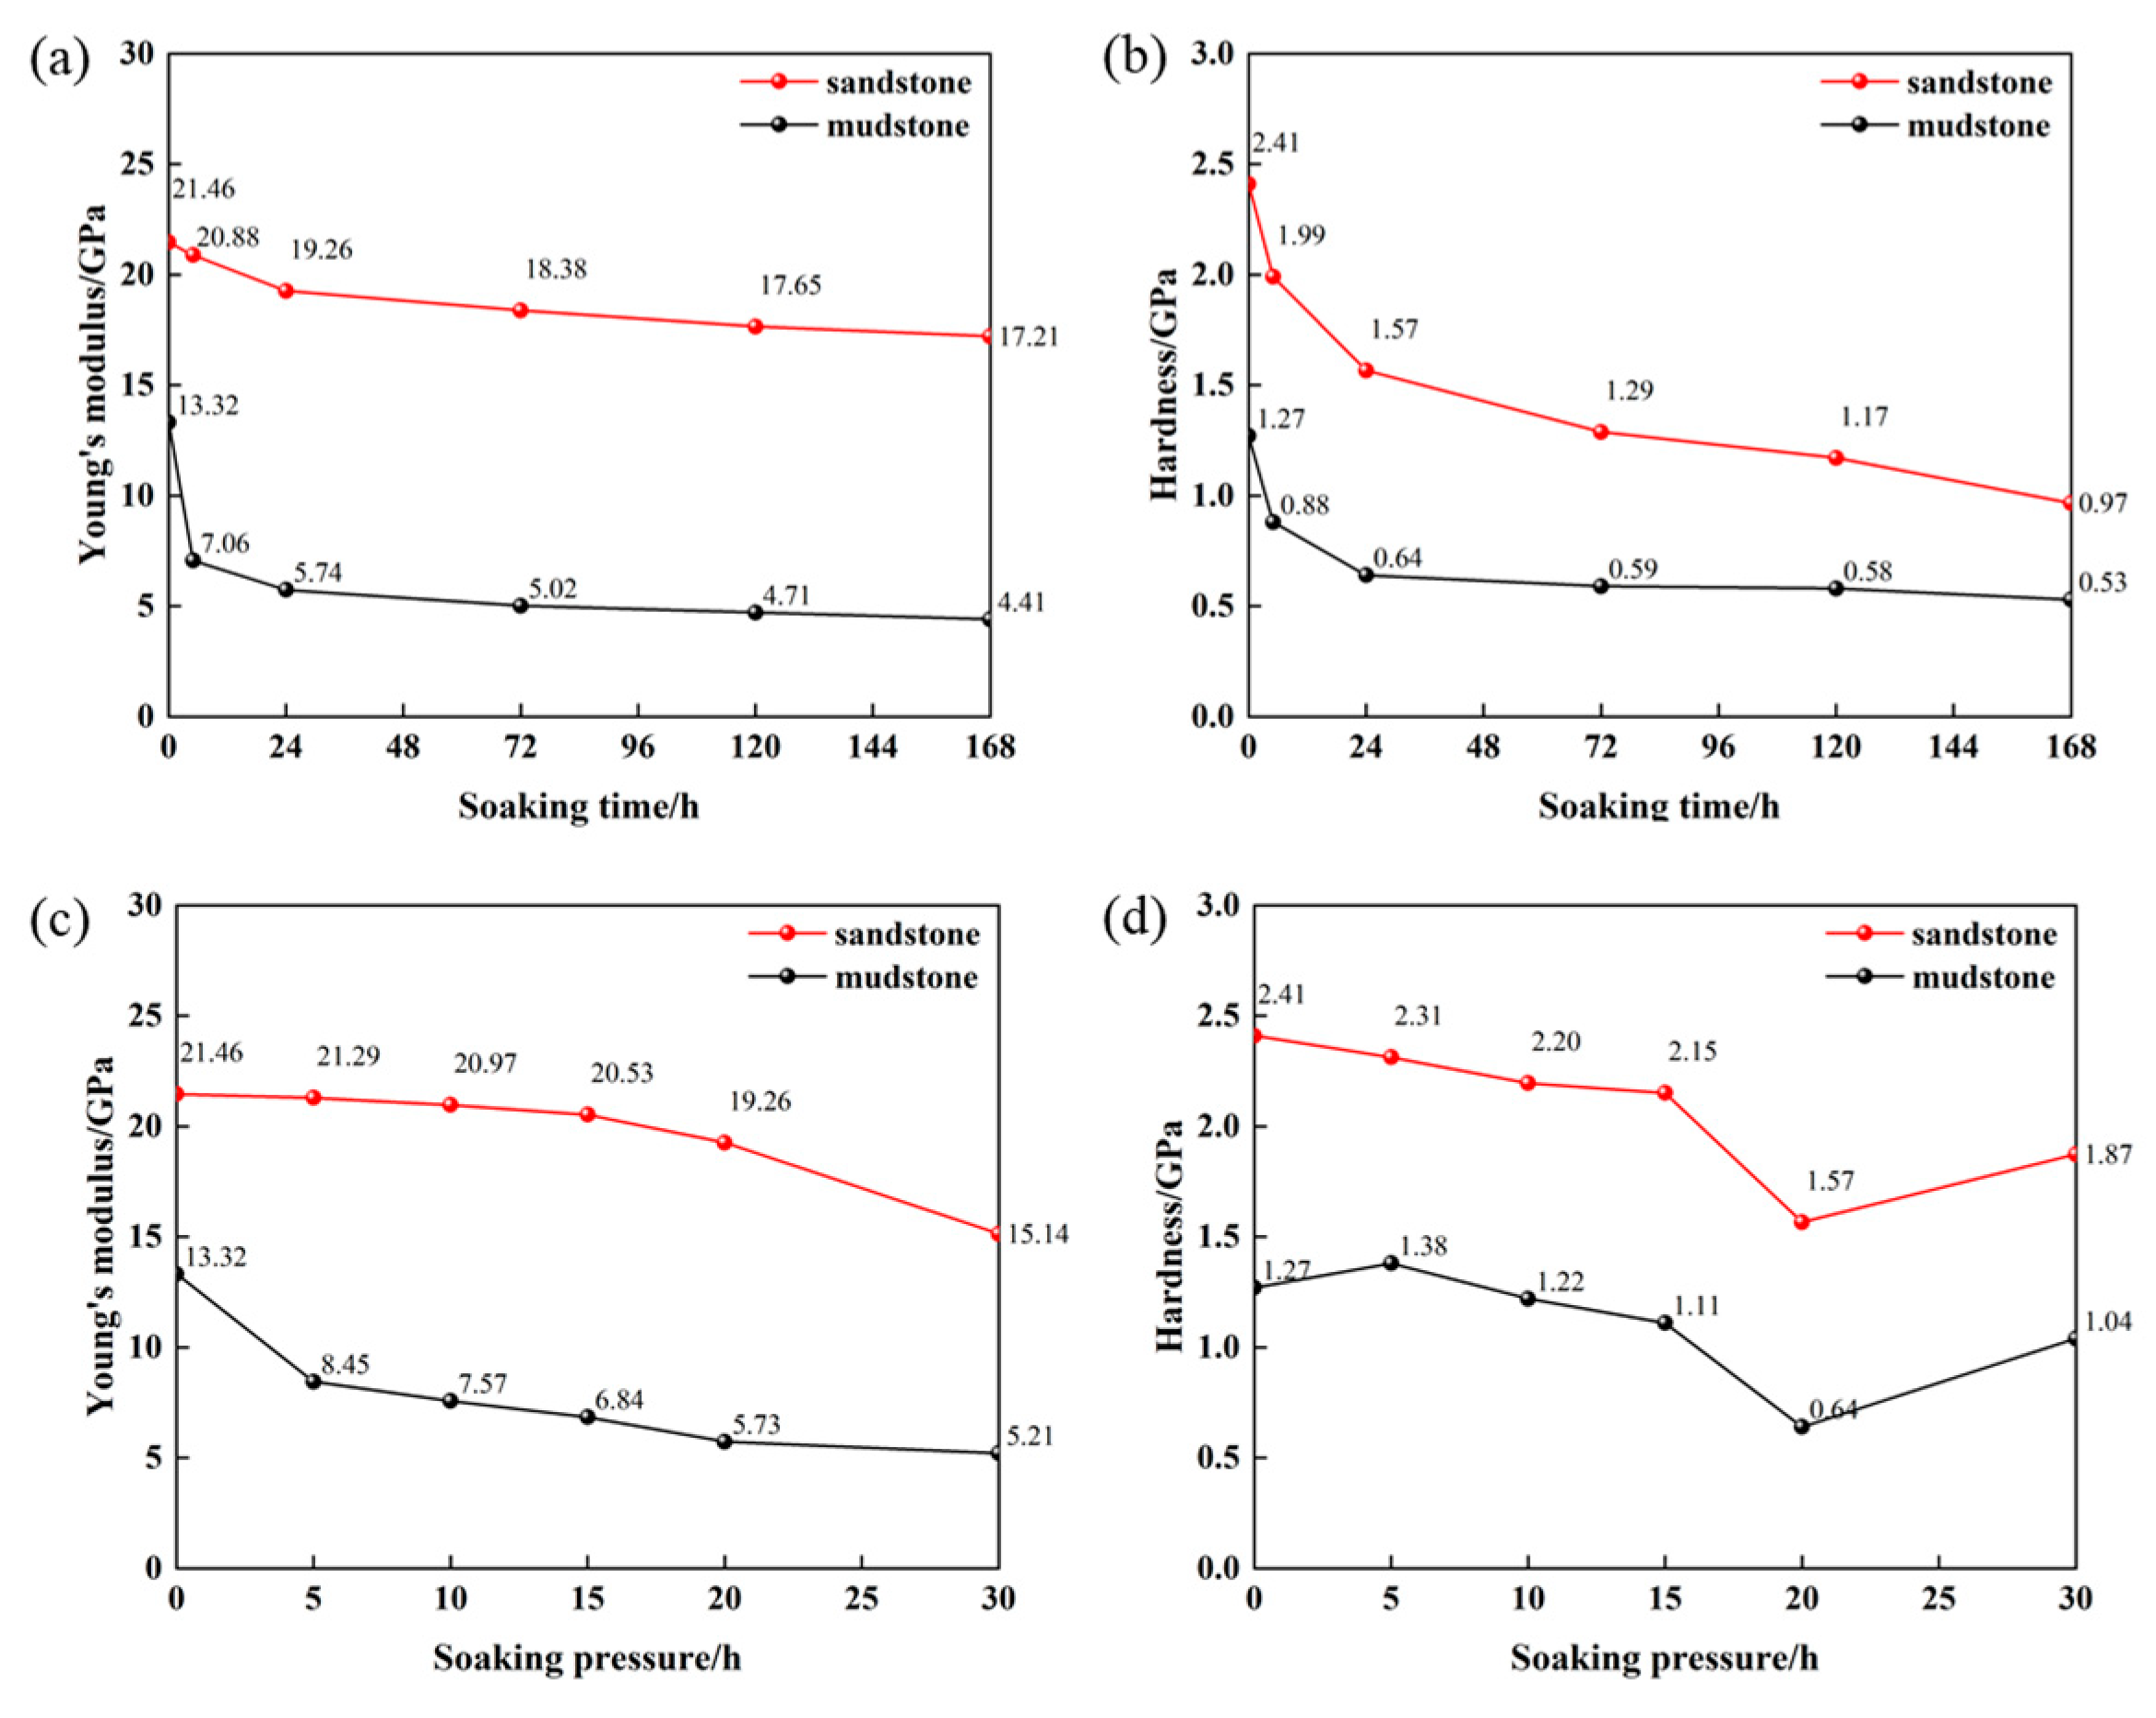
The statistical data for the Young’s modulus and hardness from nanoindentation tests are presented in Figure 12. After 5, 24, 72, 120, and 168 h of soaking (unified terminology, corrected from “exposure”), the average Young’s modulus of sandstone surfaces is 20.88, 19.26, 18.38, 17.65, and 17.21 GPa, respectively (Figure 12a), and the average hardness is 1.99, 1.57, 1.29, 1.17, and 0.97 GPa, respectively (Figure 12b). Compared to unsoaked samples, sandstone exhibits a 19.8% decrease in the Young’s modulus and 59.8% decrease in the hardness after 168 h of soaking. For mudstone, the reductions are more severe (66.9% in Young’s modulus and 58.3% in hardness) due to its high clay content, which induces an extensive hydration expansion and skeleton loosening—directly amplifying micro-mechanical degradation.
The fitted relationship equations between the surface Young’s modulus and hardness of sandstone and mudstone as a function of immersion time are as follows:
E t s a n d 21.46 t + 0.7533 0.0367
H t s a n d 2.41 t + 0.8542 0.1567
E t m u d 13.32 t + 0.982133 0.2267
H t s a n d 1.27 t + 0.9683 0.1687
The statistical results for the micro-mechanical parameters under different soaking pressures show that sandstone and mudstone micro-mechanical parameters generally decrease with increasing soaking pressure (Figure 12c,d). At soaking pressures of 5, 10, 15, 20, and 30 MPa, the surface Young’s modulus of sandstone after 24 h of soaking is 21.49, 20.97, 20.53, 19.26, and 15.14 GPa, respectively, and the hardness is 2.31, 2.19, 2.15, 1.57, and 1.87 GPa, respectively. At 30 MPa, sandstone’s Young’s modulus and hardness decrease by 29.5% and 22.4% compared to unsoaked samples, while mudstone shows reductions of 60.9% and 18.1%. The average hardness after 168 h of soaking is slightly higher than that at 120 h, attributed to the local enrichment of high-hardness minerals at indentation sites—reflecting micro-mineral distribution heterogeneity. Despite this fluctuation, the overall trend of hardness reduction with soaking time remains consistent. Notably, no strong linear correlation exists between Young’s modulus/hardness and soaking pressure, likely due to the competing effects of pressure-driven fluid infiltration (promoting crack propagation and mineral dissolution) and local mineral precipitation (moderating mechanical weakening).
The experimental results confirm that the mineral composition dominates the differential reduction in the Young’s modulus, with clear linkages to microstructural evolution. Mudstone, rich in hydrophilic clay minerals, undergoes significant hydration expansion and lattice interlayer separation during soaking. This weakens the cementation between clay particles, loosens the internal rock skeleton, and reduces the effective load-bearing area—directly leading to a substantial decrease in resistance to elastic deformation. In contrast, sandstone has a high content of rigid minerals (primarily quartz) and low clay content. Hydration only affects a small amount of clay cement or matrix, causing limited damage to the rigid mineral skeleton; thus, its Young’s modulus decrease is much smaller than that of mudstone. Hardness, which reflects the rock surface’s resistance to indenter penetration, is reduced by localized hydration-induced softening rather than overall skeleton deformation. For mudstone, surface clay swelling and cementation weakening soften the indentation area; for sandstone, localized clay cement degradation has a similar effect. This explains why mudstone and sandstone exhibit comparable hardness reductions (58.3% vs. 59.8%) despite significant differences in skeleton integrity and Young’s modulus reduction.

4. Discussion

This study systematically reveals the influence of water–rock interactions on the development of induced fractures and the micro-mechanical properties of sandstone and mudstone through a slippery water immersion experiment, providing experimental support for understanding the mechanism of hydration damage. However, the study still has certain limitations, and it also points out directions for future research. The following four directions need further exploration: ① This experiment uses single slippery water as the immersion liquid, which differs from the injection fluid used in actual oilfield development. Pre-CO2 composite fracturing, as a commonly adopted injection method on site, often involves more complex physicochemical coupling interactions between CO2–water–rock. Li et al. [34] and Li et al. [36] have demonstrated that the physicochemical coupling interactions between CO2–water–rock have a significant impact on the macroscopic physical and mechanical properties of shale. Future research needs to introduce multi-component fluids (such as supercritical CO2, formation water–crude oil mixed systems, etc.) to conduct comparative experiments and clarify the coupling mechanism of different fluid components on the development of rock-induced fractures and micro-mechanical properties. ② Expand the environmental parameter range of fluid–rock interactions, and explore the evolution law of rock damage under the synergistic effects of temperature and pressure in combination with the high-temperature and high-pressure conditions of actual oil reservoirs, enhancing the field applicability of research results. ③ Deepen the characterization of micro-mechanism interactions, utilizing high-resolution transmission electron microscopy (TEM), X-ray diffraction (XRD), and other techniques to reveal the essence of interactions between different fluid components and rock minerals from the microscopic scales of mineral crystal structure changes and element migration. ④ Conduct dynamic interaction experiments to simulate the fluid injection–production cycle process during oilfield development, explore the dynamic evolution characteristics of rock mechanical properties and fracture development, and provide a more precise theoretical basis for optimizing oilfield development plans. In future research, it is necessary to establish a quantitative prediction model, based on experimental data, to construct a quantitative relationship model between fluid components, environmental parameters, rock mechanical parameters, and fracture development characteristics, achieving a precise prediction of the degree of hydration damage in oil reservoirs.

5. Conclusions

(1)
The water–rock interaction induced by acidic slick water significantly alters the mineral composition of mudstone and sandstone, with lithological differences dominating mineral evolution—revealing the specific modification mechanism of acidic fracturing fluids on heterogeneous reservoirs. Compared with existing studies focusing on the single mineral effects of neutral/alkaline fracturing fluids, this work supplements the understanding of concurrent siliceous/carbonate dissolution and clay hydration in acidic environments, addressing gaps in composite lithology research. After hydration, both rocks show a reduced siliceous/carbonate content and increased clay minerals. Prolonged immersion exacerbates mudstone clay swelling (max. 12.0% increase), while higher pressure accelerates sandstone carbonate dissolution (max. 23.3% decrease). The core drivers are acidic erosion and clay hydration, which inform fracturing fluid optimization and pressure regulation to avoid excessive reservoir damage.
(2)
Induced fracture development differs markedly between mudstone and sandstone under water–rock interactions, resulting from the coupling of intrinsic lithological properties (natural fracture density, mineral composition) and external immersion conditions. Extending single-lithology studies, this work confirms natural fractures as universal fluid channels and clarifies the differential pressure/time regulation on fractures in diverse rocks. Higher pressure dominates fracture promotion: at 30 MPa, sandstone and mudstone fracture widths increase by 122.4% and 85.7%, respectively. The mudstone fracture width peaks at 24 h (then declines due to clay blockage), while the sandstone width decreases monotonically. This guides parameter design—controlling mudstone immersion time and optimizing sandstone pressure for effective fracturing.
(3)
The water–rock interaction degrades rock micro-mechanical properties, with lithology-specific elastic modulus and hardness variations showing a significant positive correlation—reflecting a synergistic regulation by mineral composition and microstructure. Beyond macro-scale explanations, nanoindentation tests reveal the differential responses of matrix, pores, clay-rich zones, and fractures, confirming micro-heterogeneity’s dominant role and filling micro–macro correlation gaps. Mudstone’s elastic modulus decreases more (max. 66.9%) than sandstone’s (max. 29.5%) due to clay-induced skeleton loosening, while hardness reductions are similar (58.3% vs. 59.8%) from surface hydration weakening. This supports wellbore stability assessments and fracturing process optimization for high-clay reservoirs.
(4)
This study clarifies the multi-scale chain of “lithology dominance–parameter regulation–micro response–macro characterization” for acidic slick water-induced water–rock interactions. It enriches multi-lithology reservoir stimulation theory and provides practical guidance for fracturing fluid optimization, parameter design, and effect evaluation, enhancing the development efficiency of complex reservoirs.

Author Contributions

Conceptualization, L.L., Y.Z. and S.Z.; methodology, L.L. and S.Z.; validation, L.L.; formal analysis, L.L.; resources, X.M.; data curation, Y.Z.; writing—original draft, L.L.; writing—review and editing, L.L.; visualization, L.L. and X.M.; supervision, X.M. and S.Z.; project administration, X.M., Y.Z. and S.Z.; funding acquisition, X.M. and S.Z. All authors have read and agreed to the published version of the manuscript.

Funding

This research received no external funding.

Data Availability Statement

The original contributions presented in this study are included in the article. Further inquiries can be directed to the corresponding author.

Conflicts of Interest

Authors Li Liu, Xinfang Ma, Yushi Zou, and Shicheng Zhang were employed by State Key Laboratory of Petroleum Resources and Engineering, China University of Petroleum, Beijing, China. The authors declare that the research was conducted in the absence of any commercial or financial relationships that could be construed as potential conflicts of interest.

References

  1. Azeem, R.; Mohammad, K.A.; Tawfik, A.S. Advanced developments in shale inhibitors for oil production with low environmental footprints—A review. Fuel 2019, 247, 237–249. [Google Scholar] [CrossRef] [Scilit]
  2. Sun, L.D.; Zou, C.N.; Jia, A.L.; Wei, Y.S.; Zhu, R.K.; Wu, S.T.; Guo, Z. Development characteristics and orientation of tight oil and gas in China. Pet. Explor. Dev. 2019, 46, 1073–1087. [Google Scholar] [CrossRef] [Scilit]
  3. Feng, J.; Zhang, B.; Feng, Z.; Wang, Y.; Zhang, J.; Fu, X.; Sun, Y.; Huo, Q.; Shao, H.; Zeng, H.; et al. Crude oil mobility and its controlling factors in tight sand reservoirs in northern Song Liao Basin, China. Pet. Explor. Dev. 2019, 46, 324–334. [Google Scholar] [CrossRef] [Scilit]
  4. Mayerhofer, M.J.; Lolon, E.P.; Warpinski, N.R.; Cipolla, C.L.; Walser, D.; Rightmire, C.M. What is stimulated reservoir volume? SPE Prod. Oper. 2006, 25, 89–98. [Google Scholar] [CrossRef] [Scilit]
  5. Savitski, A.A.; Detournay, E. Propagation of a penny-shaped fluid-driven fracture in an impermeable rock: Asymptotic solutions. Int. J. Solids Struct. 2002, 39, 6311–6337. [Google Scholar] [CrossRef] [Scilit]
  6. Zhang, X.; Wang, J.G.; Gao, F.; Ju, Y. Impact of water, nitrogen and CO2 fracturing fluids on fracturing initiation pressure and flow pattern in anisotropic shale reservoirs. J. Nat. Gas Sci. Eng. 2017, 45, 291–306. [Google Scholar] [CrossRef] [Scilit]
  7. Vilarrasa, V.; Laloui, L. Potential fracture propagation into the caprock induced by cold injection in normal faulting stress regimes. Geomech. Energy Environ. 2015, 2, 22–31. [Google Scholar] [CrossRef] [Scilit]
  8. Su, Y.; Lai, J.; Dang, W.L.; Bie, K.; Zhao, Y.D.; Zhao, X.J. Pore structure characterization and reservoir quality prediction in deep and ultra-deep tight sandstones by integrating image and NMR logs. J. Asian Earth Sci. 2024, 272, 106232. [Google Scholar] [CrossRef] [Scilit]
  9. Medeiros, R.S.; Biswas, D.; Suryanarayana, P.V. Impact of thief zone identification and shut-off on water production in the Nimr Field. In Proceedings of the SPE/IADC Managed Pressure Drilling and Underbalanced Operations Conference and Exhibition, Houston, TX, USA, 11–12 October 2004. [Google Scholar]
  10. Liu, H.; Shi, K.; Liu, B.; Song, X.; Deng, L.; Guo, R.; Tian, Z.; Li, Y.; Deng, Y.; Wang, G. The characteristics and origins of thief zones in the Cretaceous limestone reservoirs of Central and southern Mesopotamian Basin. J. Pet. Sci. Eng. 2021, 201, 108395. [Google Scholar] [CrossRef] [Scilit]
  11. Loucks, R.G.; Ruppel, S.C. Mississippian Barnett Shale: Lithofacies and depositional setting of a deep-water shale-gas succession in the Fort Worth Basin, Texas. AAPG Bull. 2007, 91, 579–601. [Google Scholar] [CrossRef] [Scilit]
  12. Alhindi, H.S.; Salisu, A.M.; Hussaini, S.R.; Al-Ramadan, K.; Ardiansyah, I. Novel insights to unconventional carbonate mudstone reservoir with quantitative nanoporosity characterization and modeling of Tuwaiq Mountain Formation. Geoenergy Sci. Eng. 2025, 244, 213394. [Google Scholar] [CrossRef] [Scilit]
  13. Tao, H.; Zhengqiang, D.; Xinliang, L.; Yufeng, L.; Lili, C.; Qihua, R.; Meng, O.; Hehai, Z.; Jiajun, T. Inhibitive property and mechanism of polyvinyl alcohol/tannic acid materials on clay hydration and swelling. Colloids Surf. A Physicochem. Eng. Asp. 2025, 711, 136383. [Google Scholar] [CrossRef] [Scilit]
  14. Li, N.; Jin, Z.; Wang, H.; Zou, Y.; Zhang, S.; Li, F.; Zhou, T.; Jiang, M. Investigation into shale softening induced by water/CO2-rock interaction. Int. J. Rock Mech. Min. Sci. 2023, 161, 105299. [Google Scholar] [CrossRef] [Scilit]
  15. Song, J.; Xiang, D.; Hu, D.; Zhou, H.; Guo, D.; Zhang, G. Creep characteristics of a fracturing fluid-softened shale investigated by microindentation. Int. J. Rock Mech. Min. Sci. 2022, 152, 105067. [Google Scholar] [CrossRef] [Scilit]
  16. Lu, T.; Jin, A.; Chen, S.; Zhao, Y.; Kang, S.; Dong, Y.; Yan, J. Study on the evolution of microscopic damage and mechanisms underlying mechanical deterioration of diorite under water action: Comparison of clay-containing and clay-free mineral fractions. Eng. Geol. 2026, 360, 108460. [Google Scholar] [CrossRef] [Scilit]
  17. Zhang, Y.; Long, A.; Zang, A.; Zhao, Y. Pore-scale damage evolution in sandstone induced by fluid infiltration under various stress conditions. Int. J. Rock Mech. Min. Sci. 2025, 193, 106181. [Google Scholar] [CrossRef] [Scilit]
  18. Zhou, T.; Zhang, S.; Yang, L.; Ma, X.; Zou, Y.; Lin, H. Experimental investigation on fracture surface strength softening induced by fracturing fluid imbibition and its impacts on flow conductivity in shale reservoirs. J. Nat. Gas Sci. Eng. 2016, 36, 893–905. [Google Scholar] [CrossRef] [Scilit]
  19. Meng, S.H.; Zeng, Y.F.; Wu, Q. Unraveling the mechanisms of dual-permeability flow in weakly cemented sandstones: An in-depth exploration of matrix-fracture interactions. J. Hydrol. 2025, 661, 133731. [Google Scholar] [CrossRef] [Scilit]
  20. Zhang, W.; Zhao, M.; Yang, Z.; Guo, R.; Wang, X.-Y.; Lin, R.-S. Properties of red sandstone-limestone-cement ternary composites: Hydration mechanism, microstructure, and high-temperature damage. Dev. Built Environ. 2024, 17, 100346. [Google Scholar] [CrossRef] [Scilit]
  21. Gu, T.; Yu, X.; Zhang, L.; Su, X.; Wu, Y.; Jie, Y.; Wang, H.; Zhou, D. A Study on the Influence of Natural Fractures in Tight Sandstone Reservoirs on Hydraulic Fracture Propagation Behavior and Post-Fracture Productivity. Processes 2024, 12, 2813. [Google Scholar] [CrossRef] [Scilit]
  22. Ding, S.; Tang, S.B.; Jia, H.L.; Li, Y.B. The influence of water on the failure characteristics of sandstone under uniaxial compression conditions by acoustic emission and NMR observation. Eng. Geol. 2023, 322, 107173. [Google Scholar] [CrossRef] [Scilit]
  23. Ding, Y.G.; Qiao, L.; Li, Z.H.; Luo, R.B.; Han, G.D.; Tan, J.Q.; Liu, X. Experimental study on oil recovery characteristics of different CO2 flooding methods in sandstone reservoirs with NMR. Fuel 2025, 385, 134124. [Google Scholar] [CrossRef] [Scilit]
  24. Wang, W.D.; Ji, H.J.; Han, C.; Liu, Z.; Hu, S.B. Micrometer-scale structural alterations and mesoscopic damage mechanisms in coal induced by SC-CO2 impact. Energy 2025, 329, 136718. [Google Scholar] [CrossRef] [Scilit]
  25. Liu, Y.K.; Yang, C.; Wang, J.F.; Xiong, Y.Q.; Peng, P.A. New insights into hydration-induced creep behavior of shale: A comparison study of brittle black shale and clayey oil shale at micro-scale. Mar. Pet. Geol. 2022, 138, 105554. [Google Scholar] [CrossRef] [Scilit]
  26. Deng, G.R.; Zhou, J.P.; Tian, S.F.; Xian, X.F.; Zhou, L.; Zhang, C.P.; Li, S.S.; Tan, Y.Y. Pore structure changes and its stress-sensitive behavior in sandstone under cyclic stress: Implication for underground gas storage. Gas Sci. Eng. 2023, 119, 205130. [Google Scholar] [CrossRef] [Scilit]
  27. Meng, M.M.; Ge, H.K.; Shen, Y.H. The effect of clay-swelling induced cracks on shale permeability during liquid imbibition and diffusion. J. Nat. Gas Sci. Eng. 2020, 83, 103514. [Google Scholar] [CrossRef] [Scilit]
  28. Pan, H.; Du, Y.; Zuo, Q.; Xie, Z.; Zhou, Y.; Xu, A.; Zhang, J.; Guo, Y. Stress Sensitivity of Tight Sandstone Reservoirs Under the Effect of Pore Structure Heterogeneity. Processes 2025, 13, 1960. [Google Scholar] [CrossRef] [Scilit]
  29. Zeng, L.P.; Akhondzadeh, H.; Muhammad, A.I. Effect of fluid-shale interactions on shales micromechanics: Nanoindentation experiments and interpretation from geochemical perspective. J. Nat. Gas Sci. Eng. 2022, 101, 104545. [Google Scholar] [CrossRef] [Scilit]
  30. Li, S.H.; Zhang, S.C.; Ma, X.F. Hydraulic fracturesinduced by water-/carbon dioxide-based fluids in tight sandstones. Rock Mech. Rock Eng. 2019, 52, 3323–3340. [Google Scholar] [CrossRef] [Scilit]
  31. Xu, R.Z.; Yang, S.L.; Xiao, Z.P. Quantitatively study on imbibition of fracturing fluid in tight sandstone reservoir under high temperature and high pressure based on NMR technology. J. Pet. Sci. Eng. 2022, 208, 109623. [Google Scholar] [CrossRef] [Scilit]
  32. Deng, H.; Zhou, S.; Yu, S.; Liu, Y.; Xu, J. Evolution of Pore Structure and Mechanical Characteristics of Red Sandstone Under Drying–Wetting Cycles. Minerals 2025, 15, 158. [Google Scholar] [CrossRef] [Scilit]
  33. Peng, K.; Wu, T.; Luo, K.; Luo, S.; Zhou, J.; Wang, Y. Experimental Study on the Pore Structure Evolution of Sandstone Under Brine Erosion. Materials 2025, 18, 3500. [Google Scholar] [CrossRef] [Scilit]
  34. Li, N.; Jin, Z.J.; Zhang, S.C. Micro-mechanical properties of shale due to water/supercritical carbon dioxide-rock interaction. Pet. Explor. Dev. 2023, 50, 1001–1012. [Google Scholar] [CrossRef] [Scilit]
  35. Gong, F.; Zou, G.G.; Peng, S.P. The effect of fluid saturation on the elastic properties of coal measure rocks under confining pressure. J. Appl. Geophys. 2025, 241, 105845. [Google Scholar] [CrossRef] [Scilit]
  36. Li, X.Y.; Lei, X.L.; Li, Q. Fault nucleation of tight sandstone by investigation of mechanical, acoustic, and hydraulic responses. Eng. Geol. 2021, 292, 106254. [Google Scholar] [CrossRef] [Scilit]
  37. Zhao, L.; Zhang, A.; Wu, G.; Chen, Z.; Liu, W.; Wang, J. Study on the Vertical Propagation Behavior of Hydraulic Fractures in Thin Interbedded Tight Sandstone. Processes 2024, 12, 2375. [Google Scholar] [CrossRef] [Scilit]
  38. Tang, M.; Zhang, T.; Li, Y.F. Time-dependent effect of supercritical CO2-water soaking on microstructure and mechanical properties of tight sandstone: Implications for enhanced oil recovery and geological sequestration. Geoenergy Sci. Eng. 2025, 255, 214087. [Google Scholar] [CrossRef] [Scilit]
  39. Hu, C.; Gao, Y.; Zhang, Y.; Li, Z. Statistical nanoindentation technique in application to hardened cement pastes: Influences of material microstructure and analysis method. Constr. Build. Mater. 2016, 113, 306–316. [Google Scholar] [CrossRef] [Scilit]
  40. Gou, Q.Y.; Xu, S.; Hao, F. Full-scale pores and micro-fractures characterization using FE-SEM, gas adsorption, Nano-CT and micro-CT: A case study of the Silurian Longmaxi Formation shale in the Fulling area, Sichuan Basin, China. Fuel 2019, 253, 167–179. [Google Scholar] [CrossRef] [Scilit]
  41. Shen, H.M.; Li, X.Y.; Qi, L. Hydraulic fracturing in unsaturated tight clay-rich sandstones: The role of water weakening and injection pressure. J. Rock Mech. Geotech. Eng. 2025, in press. [Google Scholar] [CrossRef] [Scilit]
  42. Oliver, W.C.; Pharr, G.M. Measurement of hardness and The Young’s modulus by instrumented indentation: Advances in understanding and refinements to methodology. J. Mater. Res. 2004, 19, 3–20. [Google Scholar] [CrossRef]
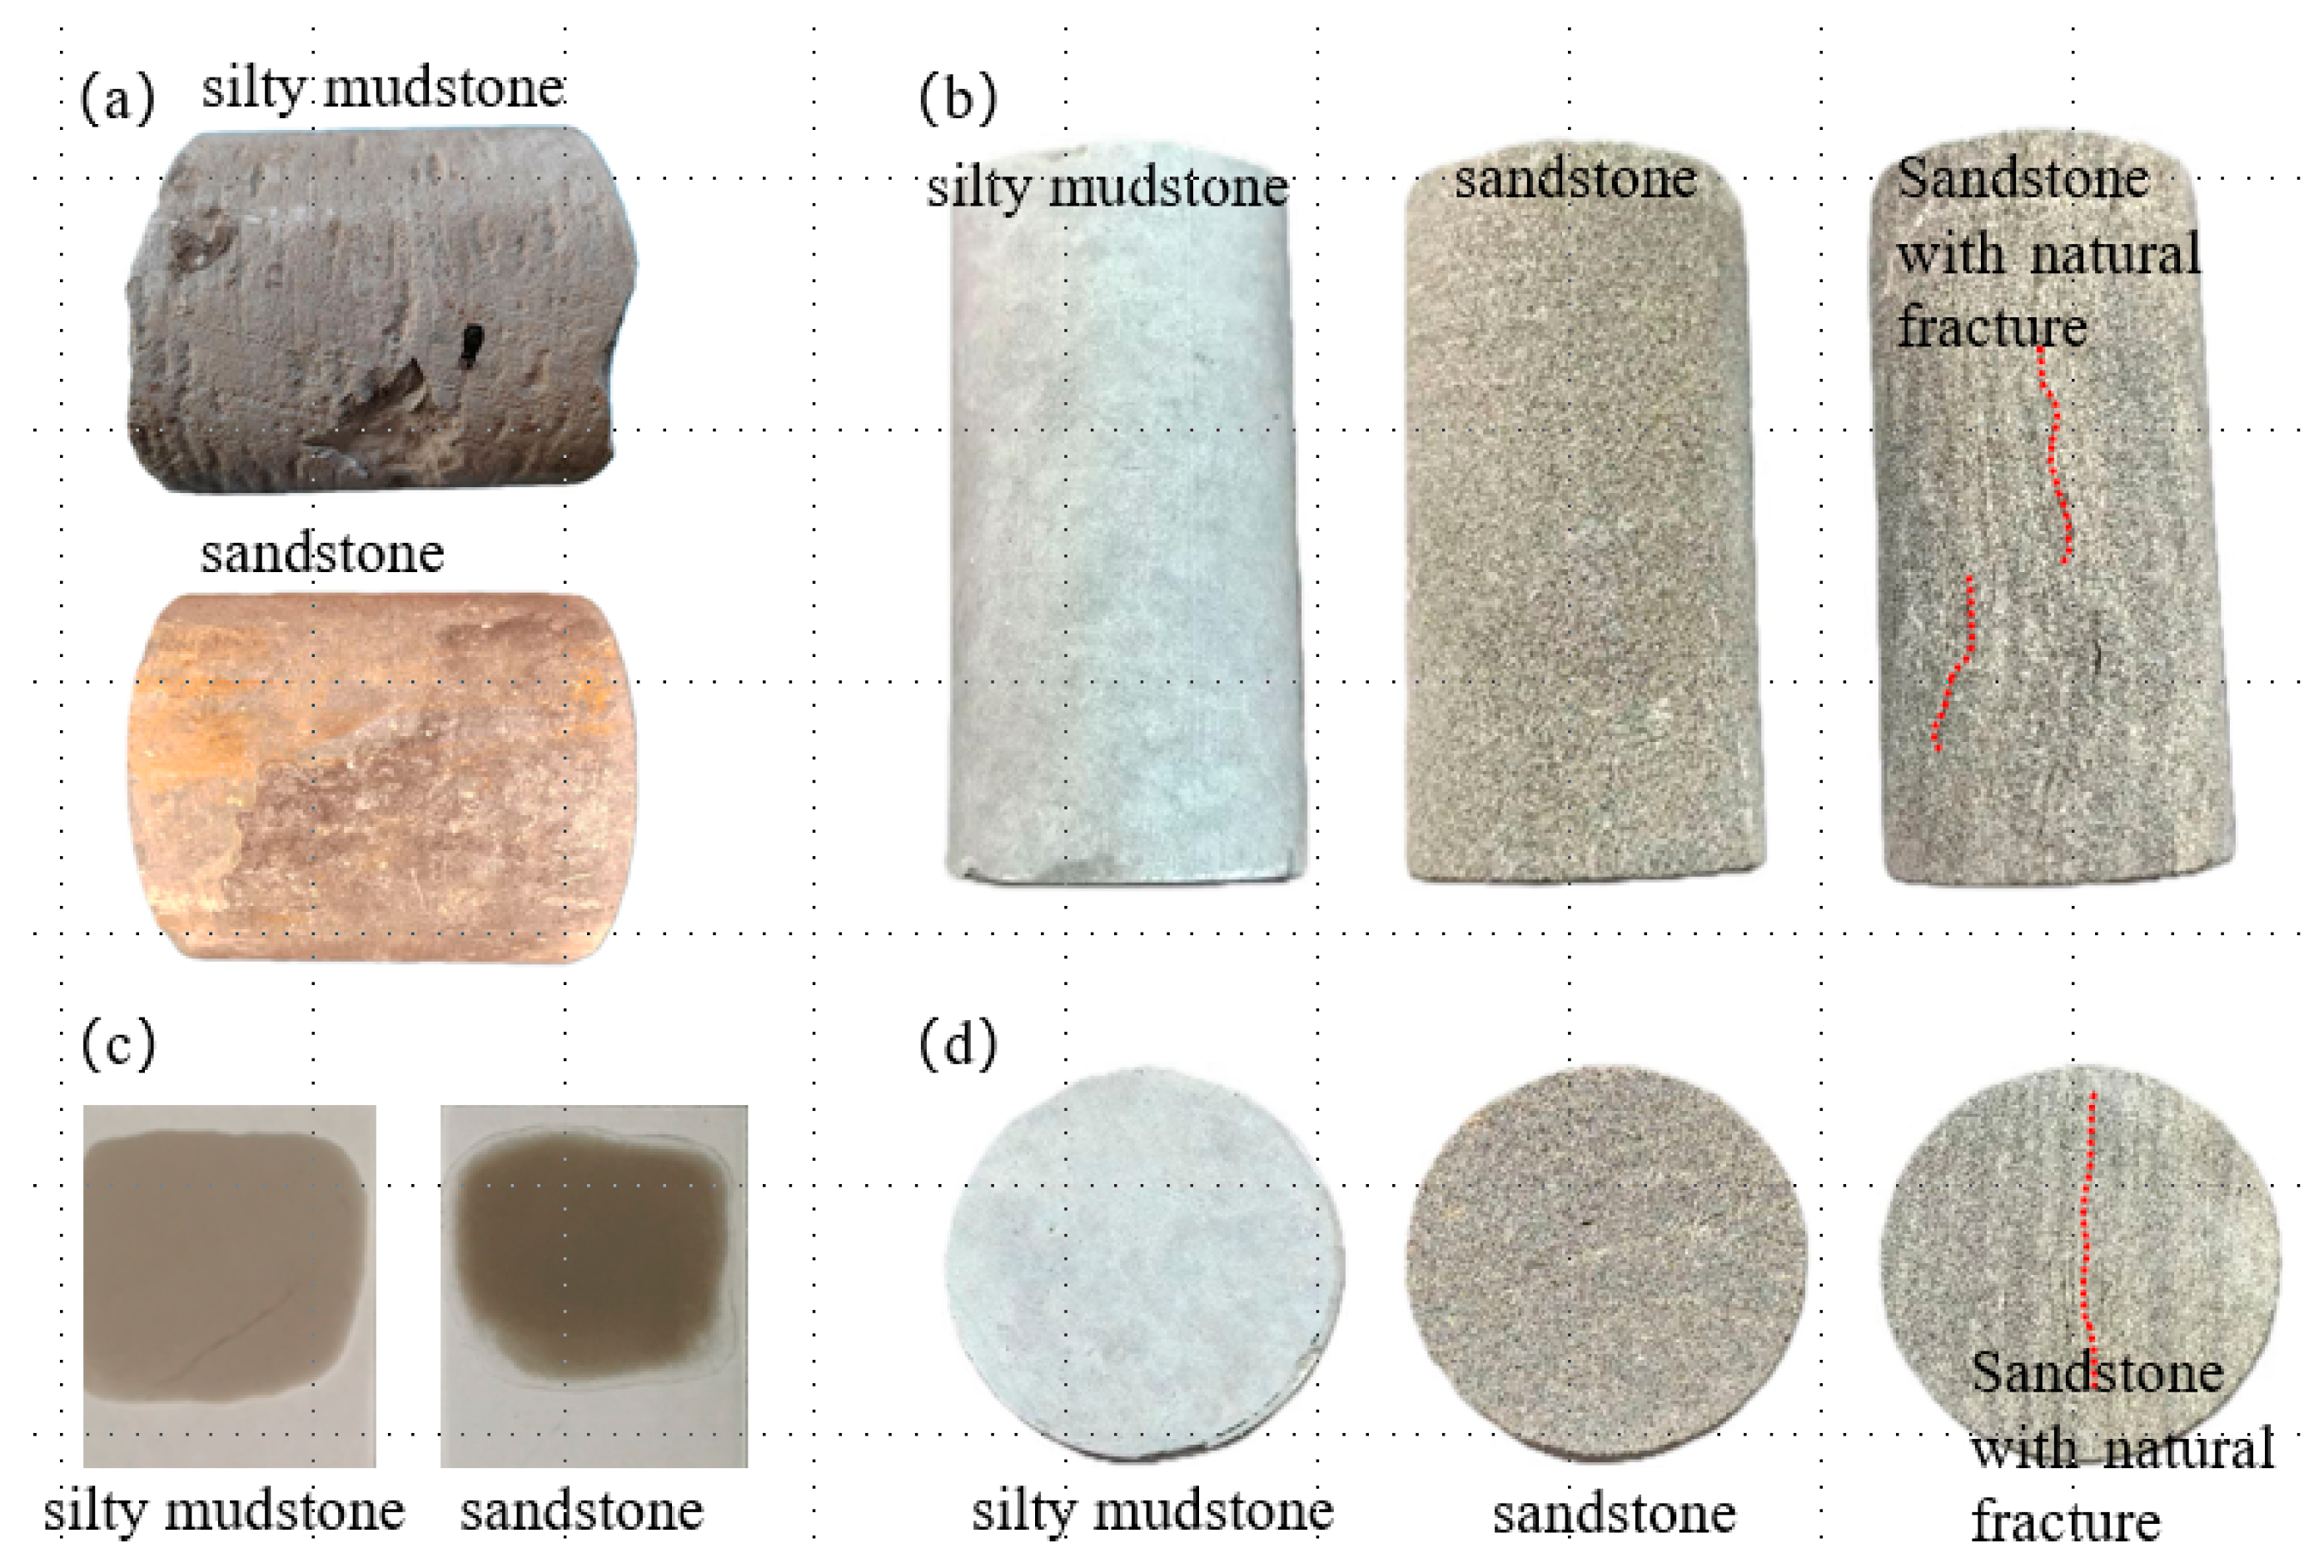
Figure 1. Part of the prepared samples for soaking experiments: (a) downhole core; (b) standard rock core; (c) granular sample; (d) cylindrical sample.
Processes 14 00453 g001
Figure 2. High-temperature–pressure static soaking device.
Processes 14 00453 g002
Figure 3. Nano indentation test: (a) G200 Nano indenter; (b) SEM image of grid indents; (c) loading history; (d) typical load–indentation depth curve.
Processes 14 00453 g003
Figure 4. Changes in mineral compositions of mudstone and sandstone after the soaking treatment: (a) soaking time; (b) soaking pressure.
Processes 14 00453 g004
Figure 5. Thin section and scanning electron microscope photos of the samples: (a) Intergranular pore structure; (b) Interlayering of light sandstone layer and dark clay layer; (c) microfracture; (d) quartz; (e) clay mineral; (f) feldspar.
Processes 14 00453 g005
Figure 6. Surface morphology of rock samples under different soaking durations: (a) clay mineral; (b) mudstone; (c) sandstone; (d) natural fracture.
Processes 14 00453 g006
Figure 7. The influence of natural fracture development on induced fractures under different soaking pressures: (a) natural fracture development; (b) natural fracture undevelopment.
Processes 14 00453 g007
Figure 8. Induced fracture development in mudstone and sandstone samples under different soaking pressures: (a) mudstone; (b) sandstone.
Processes 14 00453 g008
Figure 9. Induced fracture width changes in rock samples of different lithologies under various soaking conditions: (a) soaking time; (b) soaking pressure.
Processes 14 00453 g009
Figure 10. Failure morphologies and load–indentation depth curve characteristics of indentation points at different indentation locations on the rock surface: (a) indentation in matrix area; (b) load-indentation depth curve of matrix area; (c) indentation at pore site; (d) load-indentation depth curve of pore site; (e) indentation in clay mineral-rich area; (f) load-indentation depth curve of clay mineral-rich area; (g) indentation at induced fracture site; (h) load-indentation depth curve of in-duced fracture site.
Processes 14 00453 g010
Figure 11. Distribution diagram of Young’s modulus and hardness of mudstone and sandstone samples before water–rock reaction.
Processes 14 00453 g011
Figure 12. The variation curves of Young’s modulus and hardness of sandstone and mudstone under the influence of soaking time and pressure: (a) Young’s modulus varies with soaking time; (b) hardness varies with soaking time; (c) Young’s modulus varies with soaking pressure; (d) hardness varies with soaking pressure.
Processes 14 00453 g012
Table 1. Basic physical property parameters and mechanical properties of experimental samples.
Rock TypePorosity/%Permeability/mDYang’s Modulus/GPaPoisson’s RatioTensile Strength/MPaFracture Toughness/MPa·m0.5
Silty mudstone5.640.5911.980.285.291.13
Sandstone13.561.0816.290.248.341.50
Sandstone with natural fracture17.531.4512.560.315.120.93
Table 2. Rock sample number and experimental conditions for immersion experiment.
Type of RockSample NumberSoaking Conditions
Soaking Time/hSoaking Pressure/MPaSoaking Temperature/°C
MudstoneM10055
MT1–MT55, 24, 72, 120, 16820
MP1–MP5245, 10, 15, 20, 25, 30
SandstoneS10055
ST1–ST55, 24, 72, 120, 16820
SP1–SP5245, 10, 15, 20, 25, 30
Sandstone with natural fractureNS10055
NST1–NST55, 24, 72, 120, 16820
NSP1–NSP5245, 10, 15, 20, 25, 30
Disclaimer/Publisher’s Note: The statements, opinions and data contained in all publications are solely those of the individual author(s) and contributor(s) and not of MDPI and/or the editor(s). MDPI and/or the editor(s) disclaim responsibility for any injury to people or property resulting from any ideas, methods, instructions or products referred to in the content.