


Abstract
The extraction of land gas resources requires efficient methods to address the issue of pipeline obstruction due to the accumulation of natural gas hydrates. The existing ground heating, downhole throttling, and decompression measures are energy-intensive. The metal-reinforced composite heat-insulation pipe serves as the production string for terrestrial natural gas wells, effectively minimizing temperature loss of natural gas within the wellbore. This innovation eliminates the need for ground heating equipment and downhole throttling devices in large-scale gas well production, thereby fundamentally achieving environmentally sustainable natural gas extraction, energy conservation, and cost reduction. This research simulates the operational circumstances and environmental characteristics of the Sulige gas field. Utilizing predictions and analyses of the formation characteristics of natural gas hydrate, the gas–solid two-phase flow DPM model, RNG k-ε turbulence model, heat transfer characteristics, and population balance model are employed to examine the concentration distribution, pressure distribution, velocity distribution, and heat transfer characteristics of natural gas hydrate within the vertical tube of the structure. The findings indicate that a reduction in natural gas production or an increase in hydrate volume fraction leads to significant accumulation of hydrate adjacent to the tube wall, while the concentration distribution of hydrate is more uniform at elevated production conditions. The pressure distribution of hydrate under each operational state exhibits a pattern characterized by a high central concentration that progressively diminishes towards the periphery. The unit pressure drop of hydrate markedly escalates with an increase in flow rate. As the ambient temperature of the formation rises or the flow rate escalates, the thermal loss of the hydrate along the pipeline diminishes, resulting in an elevated exit temperature. Minimizing the thermal conductivity of the composite pipe can significantly decrease the temperature loss of the hydrate along the pipeline, greatly aiding in hydrate inhibition during the extraction of natural gas from terrestrial wells. This paper’s research offers theoretical backing for the enduring technical application of metal-reinforced composite insulating pipes in terrestrial gas fields, including the Sulige gas field.
1. Introduction
Natural gas hydrates have attracted interest recently in some domains, including the land and the oceans. Among them, deep-sea natural gas hydrates are naturally formed and abundant in reserves. People pay attention to the effective exploitation, transportation, and use of green energy. For natural gas exploitation in land gas fields, especially in cold regions, effectively addressing pipeline blockages caused by natural gas hydrate deposition in metal tubing is a concern [1]. The metal tubing utilized in terrestrial natural gas wells presently exhibits inadequate thermal insulation, leading to considerable temperature loss during the transit of natural gas (along with a specific volume of water) down the string, resulting in reduced temperatures at the wellhead. Moreover, the pressure conditions within the wellbore are elevated, leading to low temperatures and high pressures that promote the production of natural gas hydrates. The solid-phase hydrate generated under these conditions can readily accumulate along the metal tubing wall, resulting in pipeline obstruction and various complications with natural gas wells. Problems and accidents, such as production reduction and shutdown, continue to occur [2]. Using the Sulige gas field in the Changqing Oilfield of the Ordos Basin in China as a case study [3,4], 24,000 natural gas wells have been established, utilizing a metal string as the production string. Several problems exist, including pipeline blockages caused by natural gas hydrates and large-scale reductions and shutdowns in gas well production. Currently, the predominant methods employed to address this issue include the injection of chemical agents (such as alcohols), wellhead heating, downhole throttling, and depressurization [5]. These techniques aim to prevent or inhibit the formation of natural gas hydrates within metal tubing or to alter the stable conditions of natural gas hydrates to facilitate decomposition. However, these methods result in considerable energy consumption, complex construction, and elevated economic costs.
Domestic and foreign scholars and technicians have investigated the use of metal-insulated tubing (including thermal coating, thermal insulation layer, and vacuum insulation) to achieve hydrate inhibition. However, due to the limited thermal insulation effect of metal-insulated tubing, its poor corrosion resistance, inadequate sealing of the tubing connection, and inability to be applied to flexible coiled tubing operations, the application of metal-insulated tubing is limited. In recent years, flexible composite heat-insulation pipes have been studied and applied in many fields due to their excellent mechanical properties, thermal insulation properties, and corrosion resistance. For this reason, Changqing Oilfield [6] has proposed a technical scheme of replacing conventional metal tubing with flexible composite heat-insulation pipe as a natural gas well production string, and developed a steel wire reinforced composite heat-insulation pipe with a multi-layer structure, so that large-scale gas well production does not require ground heating and heat preservation equipment and downhole throttling device, and fundamentally realizes natural gas green mining, energy saving and cost reduction and efficiency increase, with good economic benefits and broad application prospects.
Neto et al. [7] employed the CFD method to precisely forecast the generation of hydrate particles from methane and water flows in maritime pipelines. Balakin B et al. [8], Balakin V B et al. [9], and Zhang et al. [10] numerically simulated hydrate deposition and flow in the pipeline using CFD, and the models were verified against experimental data from a multiphase flow loop. Utilizing computational fluid dynamics, Hailiang et al. [11] conducted numerical simulations of the two-phase solid–liquid flow field in an oil pipeline within a marine dynamic environment and performed experimental investigations on the hydraulic transport behavior of natural gas hydrate pipelines. The research indicates that an oscillation amplitude over 2 m significantly affects the distribution of the solid phase, the solid–liquid two-phase flow rate, and pressure loss.
Geng et al. [12] created a gas–liquid-solid multiphase flow model that incorporates multiphase flow, thermal transfer, and hydrate phase transition, and examined the flow properties of hydrate within double-layer coiled tubing. The findings indicate that the fluidization efficiency of hydrate particles in the double-layer continuous tube can attain 88%, with a pressure drop that is 15.6% lower than that of the single-layer tube. Ryosuke et al. [13] investigated the flow properties of R-134a and R-32 gas hydrate slurry within an annular pipe utilizing the Rabinowitsch–Monot equation. The results indicate that flow velocity significantly affects the flow behavior of the two types of slurry, with R-134a slurry exhibiting more flow resistance. Li et al. [14] investigated the flow and thermal transfer properties of hydrate in a riser under ambient circumstances in the South China Sea, emphasizing the multiphase flow dynamics of natural gas hydrate within the development riser. The simulation results indicate that the low-temperature region at the base of the riser (about 2–4 °C) is very conducive to secondary hydrate formation. Shao et al. [15] employed CFD simulations to investigate the influence of bending angles and twist rate on hydrate flow. It was observed that as the bending angle reached 90°, the local pressure loss more than doubled, and an increase in twist rate might mitigate hydrate deposition.
Chen et al. [16] conducted numerical simulations to examine the influence of pipe diameter, input velocity, and solid-phase characteristics on the three-phase flow of natural gas hydrate, indicating that when the solid volume portion is below 10%, augmenting the pipe diameter can markedly decrease the pressure loss. Liang et al. [17] examined the effects of hydrate phase transition and sand production, analyzed the flow characteristics of multiphase flow in a deepwater riser, developed a numerical model of multiphase flow utilizing CFD, and resolved it by the finite difference method. The findings indicate that hydrate decomposition will decrease fluid temperature and pressure. The presence of sand particles concurrently will elevate the local pressure decrease by 15% to 30%. Liu et al. [18] employed the Euler multiphase flow model to investigate the two-phase solid–liquid flow of natural gas hydrate slurry in vertical pipeline transit, considering hydrate disintegration during extraction and elevation. The dissociation of hydrate during the lifting process results in a substantial rise in the gas volume fraction within the intermediate and upper pipelines, which is the primary cause of flow instability. Berrouk et al. [19] employed the Eulerian–Eulerian multiphase flow approach to create a three-dimensional computational fluid dynamics model for hydrate slurry flow in pipelines and performed numerical simulations. The discrepancy between the model-predicted pressure drops and the actual results is within 10%. Umuteme et al. [20,21] established a 3D horizontal pipeline model measuring 10 m in length and 0.0204 m in diameter. The Euler–Euler multiphase flow model was employed to forecast the hydrate deposition rate in a natural gas-dominated pipeline and the flow parameters of the pipeline under conditions conducive to hydrate formation. The thickness of hydrate deposition at the pipeline’s bottom can attain millimeter levels within 24 h when the gas flow rate is below 5 m/s. Yong et al. [22] employed the discrete phase model (DPM) to estimate the distributions of velocity and pressure drop, heat transfer properties, and sedimentation behavior of hydrate particles in spiral flow pipes. Research indicates that the use of spiral flow can diminish the sedimentation rate of hydrate particles measuring 0.5 mm by around 60%; however, the total pressure loss within the system escalates by 20% to 40%. Bassani et al. [23] conducted a numerical simulation of a methane-water combination traversing a horizontal pipeline measuring 1.5 km in length and 26 mm in inner diameter, examining the impact of hydrate deposition on the pipeline’s inner wall. The findings indicate that when the hydrate deposition layer attains a thickness of 2 mm, the local heat transfer coefficient diminishes by approximately 25%, resulting in a substantial alteration of the fluid flow pattern.
Adopting the population balance model for gas hydrate particle aggregation dynamics, Yao et al. [24] conducted numerical simulations of the flow characteristics of hydrate slurry in a vertical pipe. A greater slurry volume fraction significantly increases flow resistance, while an elevated flow rate efficiently enhances particle suspension and diminishes deposition danger. Cheng et al. [25] investigated the flow dynamics of coupled hydrates and micron-sized sand in vertical, curved, and horizontal tubes through a population balance model addressing hydrate particle aggregation and fragmentation. Research indicates that micron-sized sand particles facilitate the aggregation and deposition of hydrate particles in the lower section of the pipeline. Cao et al. [26] created an extensive multiphase flow model that incorporates the coalescence and fragmentation of bubbles and hydrate particles, and simulated gas–liquid hydrate flow in vertical pipes. The simulation results indicate that the dynamic processes of coalescence and breakup between bubbles and hydrate particles influence the flow distribution and stability of each phase inside the pipeline. Song et al. [27] employed a novel hydrate agglomeration model to examine the various classes and properties of hydrate particle size distributions, as well as the stratification of hydrate particles within pipelines, through CFD simulations. The particle size distribution of hydrate particles directly influences their deposition in the pipeline, with smaller particles being more prone to establish a steady suspension flow.
Studying the flow and heat transfer characteristics of natural gas hydrate in metal-reinforced composite insulated pipe risers is crucial for the structural design of composite pipes and their practical uses in terrestrial natural gas extraction, particularly in frigid climates. However, the experiment is complex and costly. The multiphase flow of natural gas hydrate in pipes can now be effectively studied by numerical modeling thanks to the advancements in computational fluid dynamics (CFD). This research primarily examines the flow properties of hydrate slurry within metal pipelines during the extraction of marine natural hydrate reservoirs. The numerical simulation model used is a liquid–solid coupling model.
Nevertheless, limited research has investigated the flow properties of natural gas hydrate within vertical metal-reinforced composite-insulated pipelines in terrestrial gas reservoir settings. In this paper, the metal-reinforced composite insulation pipe is used as the basis for simulating the environment, working conditions, and natural gas composition conditions at the Sulige gas well. This study examines the flow and heat transmission properties of natural gas hydrate within the vertical pipe of the specified construction, utilizing the aforementioned theory and population balance model.
2. Numerical Simulation Methods
2.1. Physical Model and Parameters
2.1.1. Natural Gas Well Parameters and Working Conditions
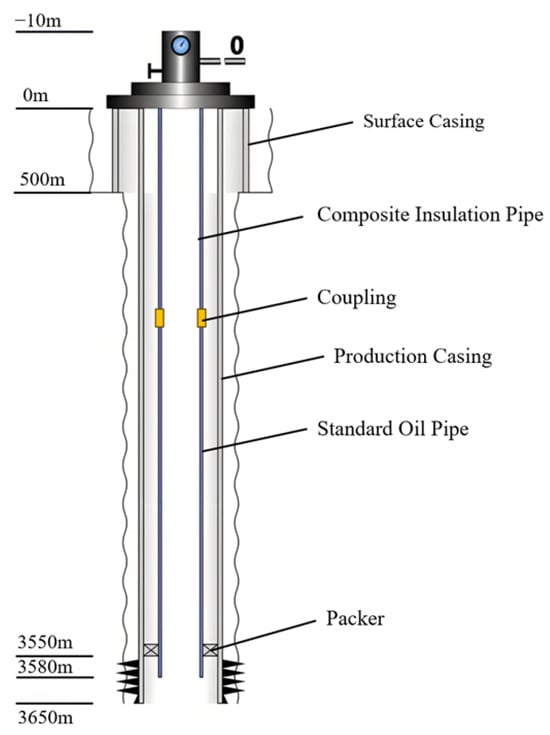
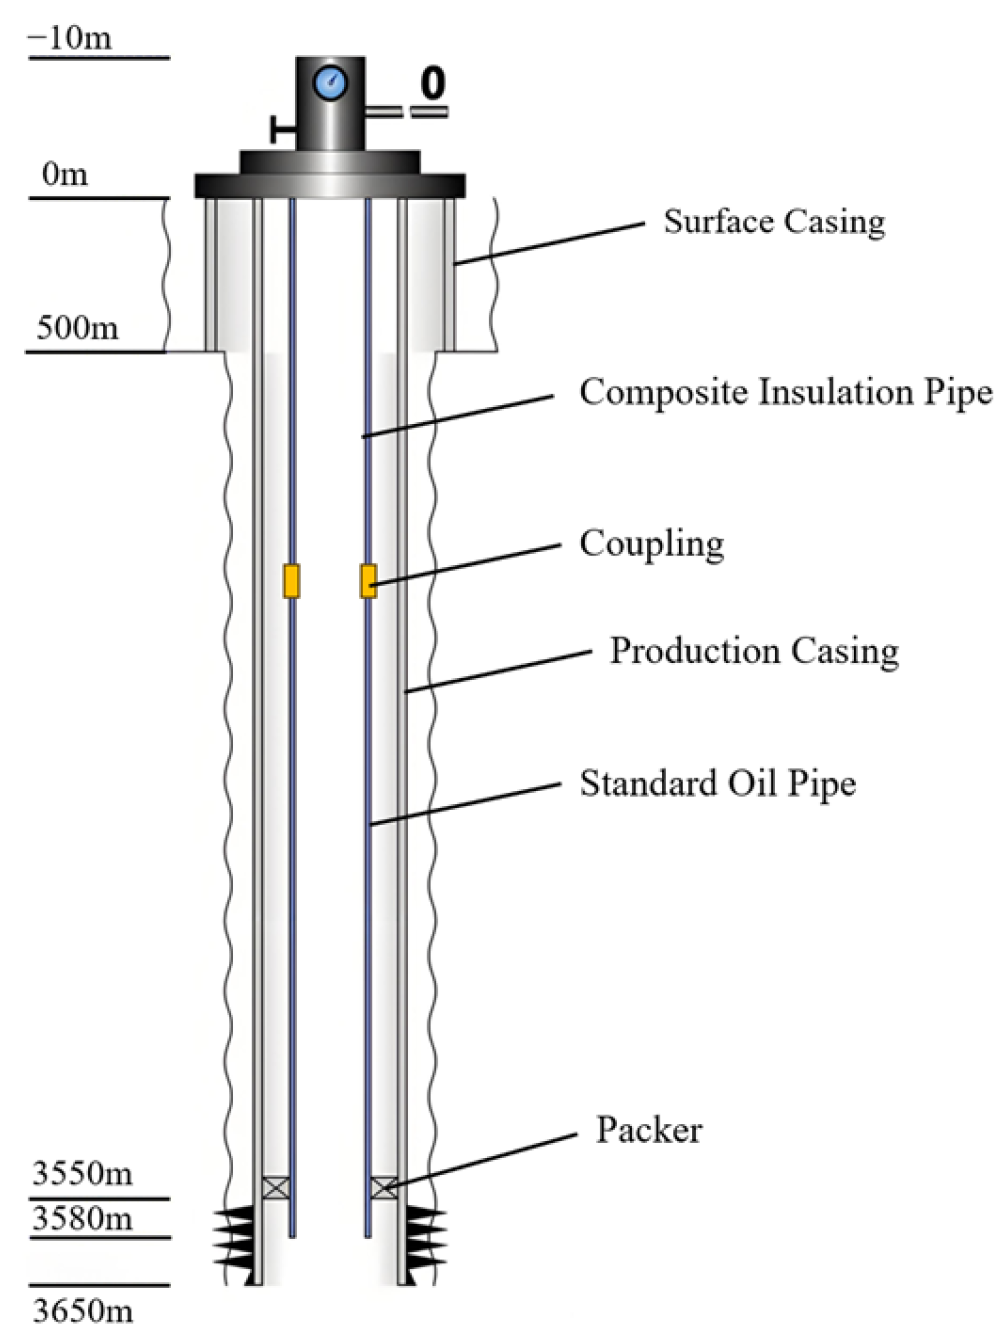
The relevant natural gas well parameters and working conditions in this study are all from the Sulige gas field [2,5]. The natural gas component parameters are shown in Table 1, and the well structure parameters are shown in Table 2. The depth of the natural gas well is 3.5 km, and a composite insulation pipe is used as the production tubing. Considering the economic cost, the composite insulation pipe is 1.5 km deep, while the rest is conventional metal tubing. The initial bottom-hole pressure of the well is 28 MPa, the temperature is 120 °C, and the maximum production flow rate is 3 × 10⁴ m3/d.
Table 1.
Natural gas composition parameters.
Table 2.
Wellbore structure and property parameters.
2.1.2. Geometric Model of Metal-Reinforced Composite Insulation Pipe
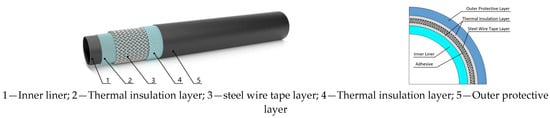
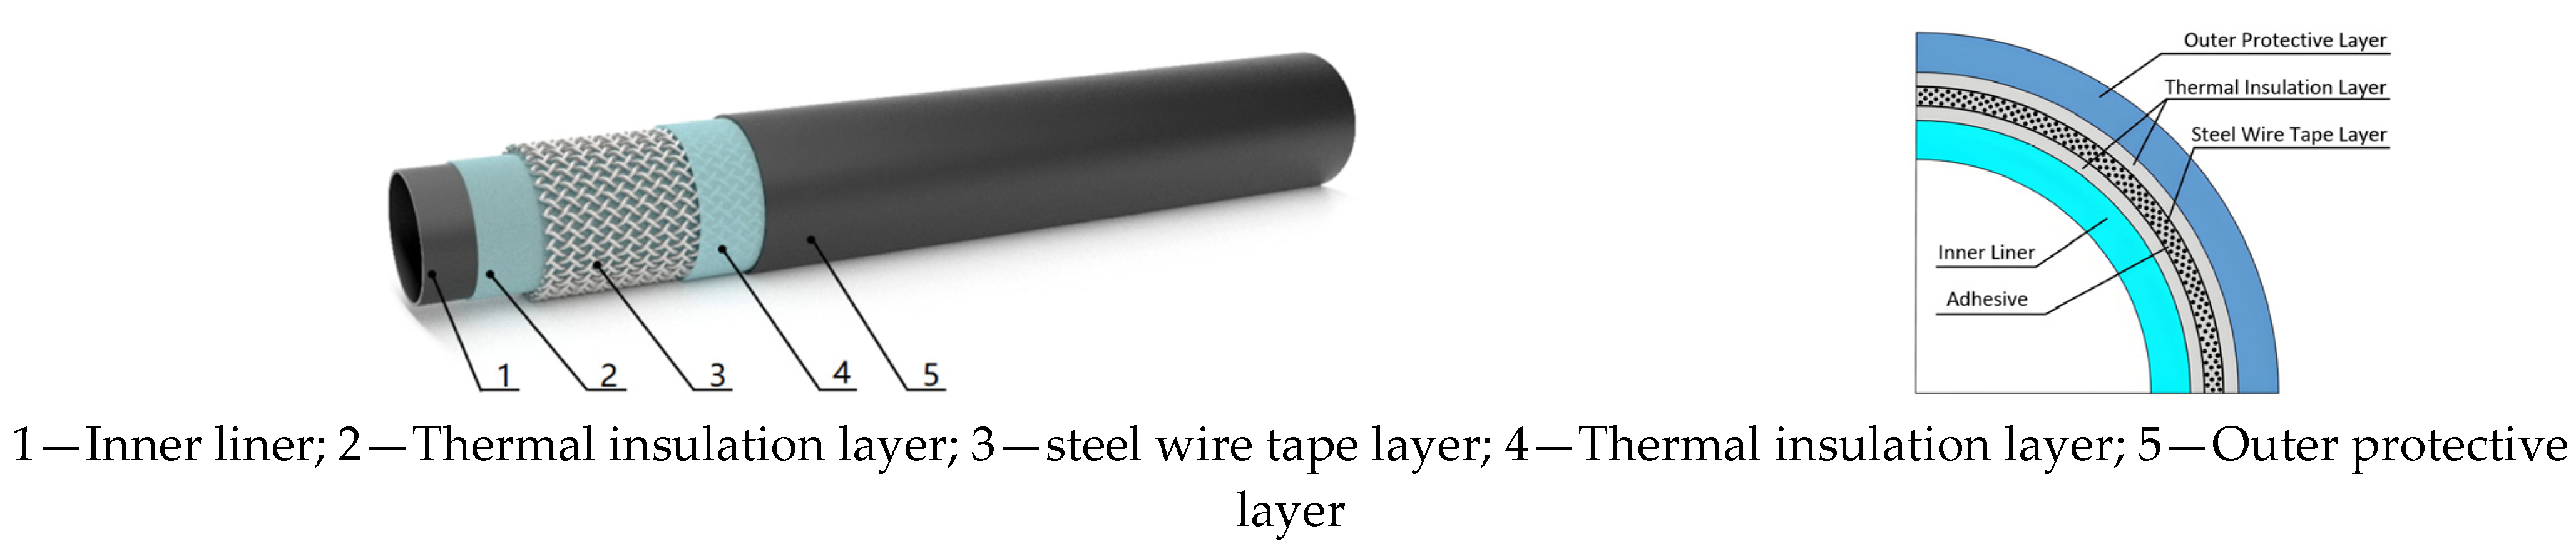
The composite insulation pipe utilized in natural gas wells within the Sulige gas field comprises an inner lining layer, a steel wire-reinforced layer, an aerogel insulation layer, and an outside protective layer. The geometric model is illustrated in Figure 1. The primary structural features and material characteristics of the composite insulating pipe are presented in Table 3, with the data sourced from the enterprise’s technical documentation. Based on the varying thermal conductivity of each layer within the composite heat-insulation tube’s multi-layered structure, and utilizing the thermal conductivity values presented in Table 3 for each material layer, the equivalent thermal conductivity of the composite heat insulation tube is determined to be 0.055 W·(m·°C)−1, and the calculation was performed using the series thermal resistance superposition method [28].
Figure 1.
Steel wire tape reinforced polyethylene composite thermal insulation pipe.
Table 3.
Geometric and material parameters of a steel wire tape-reinforced polyethylene composite thermal insulation pipe.
2.1.3. Physical Conditions
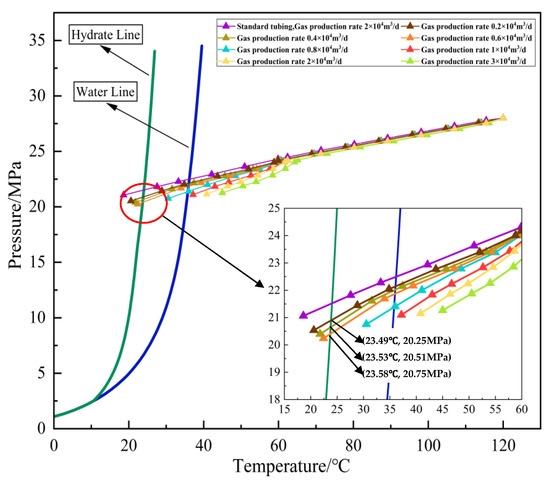
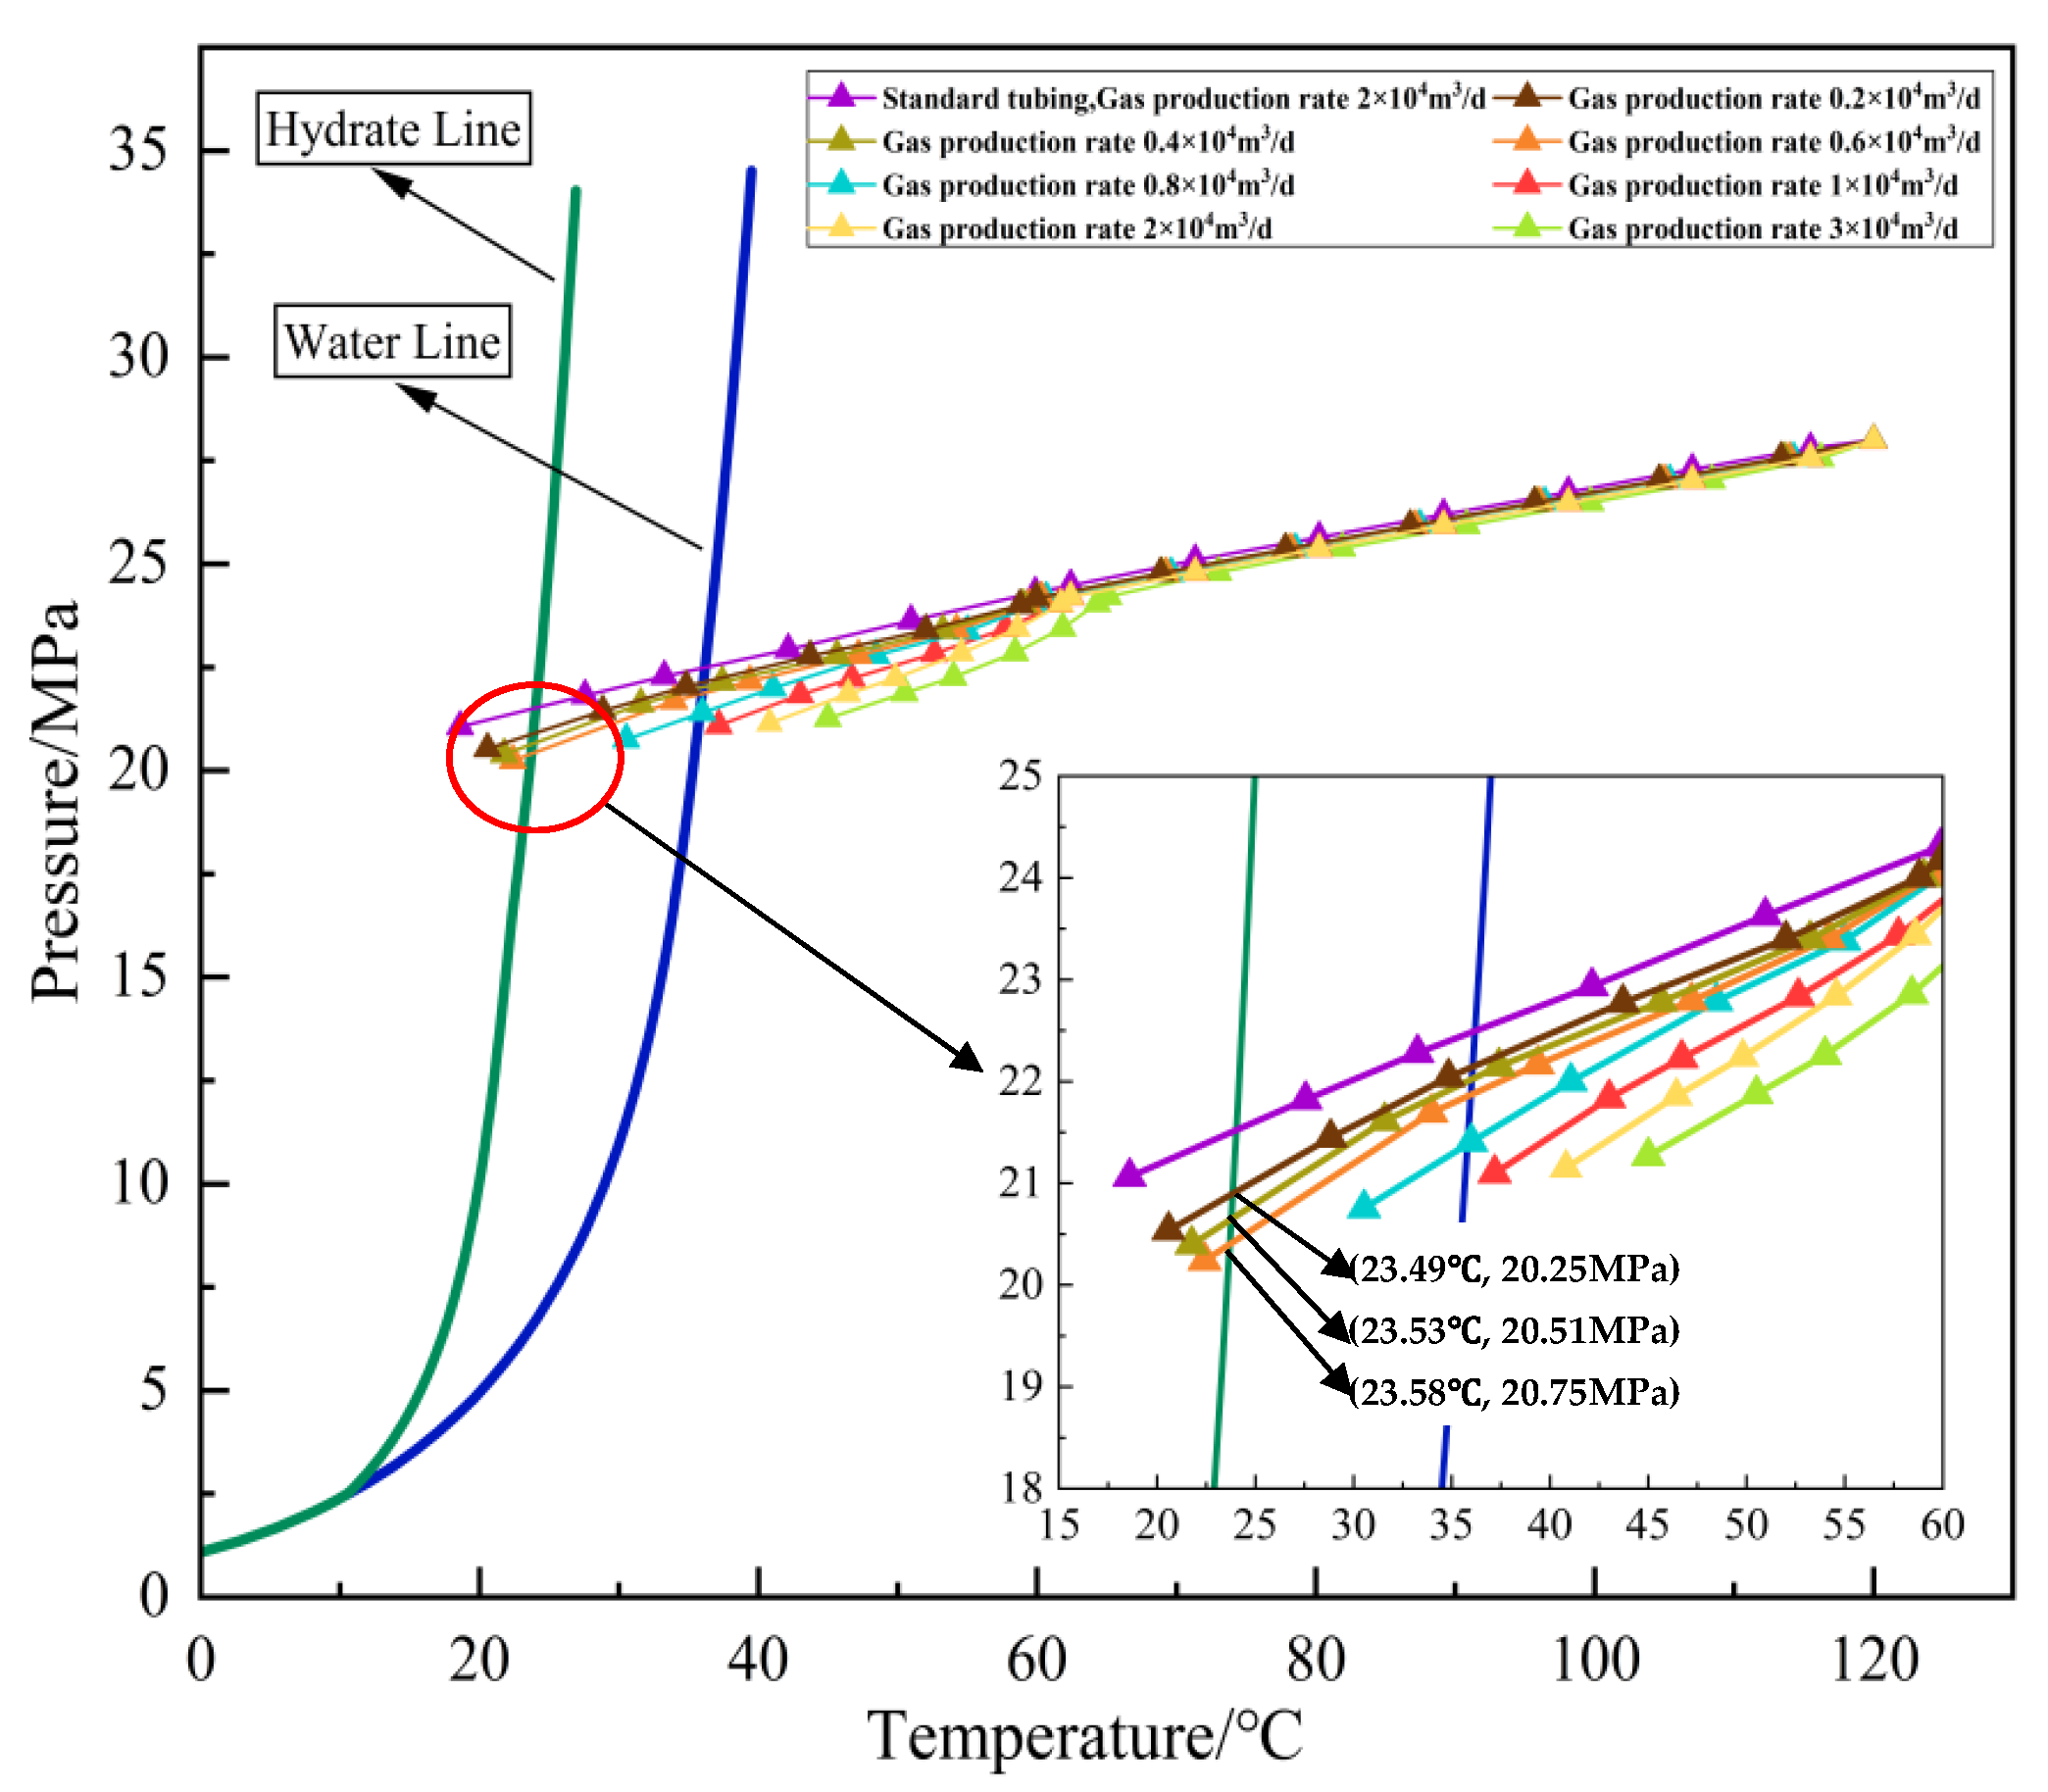
During onshore natural gas extraction, the hydrate development occurs within the length of the pipe string adjacent to the natural gas outlet portion. This paper examines the flow and heat transfer of natural gas hydrate within the composite heat-insulation pipe under real operating conditions. It is essential to ascertain the initial formation location of natural gas hydrate in the constructed riser, along with the physical operating conditions, such as initial temperature and pressure, to establish the foundation for determining the length of the pertinent pipe string and the relevant physical boundary conditions in Section 2.2 and Section 4.1. The present research employed PIPESIM 2020.1 [29,30] to create a natural gas well calculation model, illustrated in Figure 2, utilizing the characteristics detailed in Table 1 and Table 2. The temperature-pressure distribution data for the complete well section were computed. The initial formation site of natural gas hydrate within the wellbore and the associated boundary conditions, including temperature and pressure, were obtained. Subsequently, Figure 3 illustrates the correlation between the temperature–pressure distribution curve throughout the wellbore, derived from the computed data, and the location of the natural gas hydrate critical line. The trend of natural gas hydrate development escalates as natural gas output diminishes; hydrate formation commences when production falls below 1 × 10⁴ m3/d, occurring within 20 m of the wellbore outlet. Consequently, the length of the pipe string for the modeling study is established at 20 m. When the natural gas production is 0.6 × 10⁴ m3/d, 0.4 × 10⁴ m3/d, 0.2 × 10⁴ m3/d, hydrates are formed, and the corresponding initial temperature–pressure data of the wellbore are (23.58 °C, 20.75 MPa), (23.53 °C, 20.51 MPa), (23.49 °C, 20.25 MPa).
Figure 2.
Natural gas well production model (PIPESIM).
Figure 3.
Prediction of gas well hydrate formation under different production conditions.
2.2. Grid Division
The thermal boundary modeling and meshing technique offered by Fluent 15.0 exclusively models the fluid region and the pipe wall, utilizing the equivalent thermal conductivity of the composite heat-insulation tube for the wall material. This approach eliminates the necessity for solid grid division, thereby ensuring computational accuracy and circumventing the complexities associated with modeling and meshing the multi-layer solid of the composite tube. As illustrated in Figure 4, a three-dimensional geometric model with a length of L = 20 m and a diameter of D = 50.0 mm was created in FLUENT. The model was meshed using a hexahedral mesh, and the inlet and other areas were divided according to a 1 mm step size. An expansion layer was created close to the wall using eight layers of mesh refinement. Following the grid independence test, the grid quality is 0.917, and the quantity of grids satisfies the independence criteria.
Figure 4.
Geometric model meshing.
3. Mathematical Models
3.1. Governing Equations and Turbulence Model
This investigation’s CFD simulation primarily targets the pipeline region adjacent to the wellhead where hydrate formation occurs. In this region, the predominant phase is gas, the solid phase consists of hydrate particles, and the liquid phase water is minimal and so disregarded in modeling. This study examines the flow of natural gas hydrate in a composite pipe, given that the density of solid particles is considerably more than that of the gas phase, which constitutes a dilute phase with minimal mass and volume fractions. This work focuses on the two-phase flow of solid natural gas hydrate particles and gaseous natural gas. Owing to the minimal volume fraction of natural gas hydrate particles inside the fluid, the volume ratio of the discrete phase to the continuous phase is significantly below 10%; hence, the discrete phase model (DPM) is employed to simulate the gas–solid two-phase flow [15]. The DPM model is a multi-component flow model grounded in the Euler–Lagrangian framework [22,31]. This method treats the liquid phase as a continuum via the Eulerian technique, while the dispersed particles are monitored using the Lagrangian approach. The velocity and behavior of the discrete phase are determined by monitoring individual particles, considering their interactions with the continuous fluid phase. The mass, momentum, and heat can be transferred between two phases; the equations for each phase are delineated separately as follows [32,33]:
The continuity equation:
The momentum equation
where ρ is gas density, u is velocity, p is static pressure, τij is the viscous stress tensor, and t is time.
The energy equation
where Cp is gas specific heat capacity, T is temperature, λ is thermal conductivity, and v and w are velocity.
3.2. Turbulent Flow Model
This study investigates the gas–solid two-phase flow associated with the turbulence of natural gas hydrates. The selection of a turbulence model directly influences the precision of characterizing the turbulence properties of the flow field and the complexity of resolving the numerical equations. The RNG k-ε model employs renormalization group (RNG) theory to improve the conventional turbulence model [7,34,35]. Through the use of column corrections, turbulence viscosity is adjusted, and the rotating flow is incorporated into the average flow, thereby markedly enhancing the predictive accuracy of fast strain flow and near-wall flow, particularly concerning turbulent boundary layer issues. It has good applicability, making it suitable for the pipeline flow conditions presented in this paper. The kinetic energy and dissipation rate ε of turbulence are modeled by the following transmission equation [35]:
Equations (4) and (5) are under the following conditions
where k represents the turbulent dissipation rate, ε denotes the turbulent kinetic energy, μt signifies turbulent viscosity, μeff indicates effective dynamic viscosity, and μ refers to laminar viscosity. Gk denotes the production term of turbulent kinetic energy, Gb represents the production term of turbulent kinetic energy attributable to lift, S signifies the modulus of the rate-of-strain tensor, Prt refers to the Prandtl number, gi indicates the ith component of gravitational force, YM reflects the influence of wave expansion on the overall dissipation rate in compressible turbulence, while αk and αε are the inverse effective Prandtl numbers for k and ε, respectively. Sk denotes an extra word produced by the mean strain rate. C3 = tanh(VR), where VR is the vertical mean velocity component divided by the horizontal mean velocity component. The constants of the model are: Cμ = 0.0845, η0 = 4.38, β = 0.012, C1ε = 1.42, C2ε = 1.68. In the RNG model, αk and αε are analytically determined using the following equations [15]
where αk = αε = 1/α, α0 = 1.0. In the high Reynolds number limit, αk = αε ≈ 1.393, and Prt = 1/α.
The RNG theory also offers an analytically calculated differential equation for low Reynolds numbers
where , , which enables the RNG k-ε model to more effectively manage flow adjacent to a wall.
3.3. Particle Phase
In the DPM model, the gas is seen as a continuous medium (except liquid water), whereas the particle phase is considered a discrete medium. The motion condition of the particles is ascertained by evaluating the forces exerted on them, and the motion equations of the particles are resolved utilizing the established flow field parameters [31,32,33,34,35,36]. This study is based on the DPM model. In the Lagrangian coordinate system, the trajectory of each particle suspended in the fluid is determined by solving the particle force differential equation to mimic particle motion in turbulence. The kinetic equation for the solid phase is [15,22,31]
where m denotes the mass of an individual particle, xp and up represent the displacement and velocity of the particle along the x-axis, dp signifies the particle diameter, ρ indicates the density of the continuous phase, ρp refers to the density of the particle, and FD is the drag force per unit mass acting on the particle. Rep denotes the particle Reynolds number, while μ represents the dynamic viscosity of the continuous phase. CD represents the drag coefficient, while μ1, μ2, μ3, and η are constants retained in the DPM general model library, derived from pertinent empirical formulas. Fx, which will be discussed below, is the additional force that the unit particle mass experiences in the x direction. This force includes buoyancy, drag, Saffman lift, virtual mass force, pressure gradient force, Basset force, and Magnus force.
The DPM model begins its research by considering the forces exerted by particles. In a gas-phase flow field, discrete-phase particles are primarily influenced by gravity and buoyancy. Additionally, numerous forces act on particles. Different forces have different effects on particle motion.
The particles’ motion is governed by the gas phase within the flow field, and the inertial force is defined as
where dp is particle diameter, ρp is particle density, and up is particle velocity.
Resistance and drag force are opposites in the flow field; that is, the particles create resistance to the gas’s flow. The drag force represents the reactive force arising from the resistance exerted by a gas upon particles. The expression is:
The pressure gradient force constitutes the force exerted by the pressure gradient within the gaseous flow field on the particles. The expression is
where Vp denotes particle volume. The spurious mass force generated by the apparent mass effect of particles is:
The rotation of particles in the fluid produces a lift effect, known as Magnus lift. It is typically of comparable magnitude to gravity. The expression is
where ω is the angular velocity of particle rotation. Buoyancy denotes the differential (resultant force) of fluid pressure acting on each surface of an object submerged in a fluid, which may be articulated as:
The flow field exhibits a velocity gradient, resulting in differing velocities at the upper and lower surfaces of the particles. The lift produced by the particles is referred to as the Saffman lift, and the formula is:
In a viscous fluid, flow instability results in an immediate resistance to motion, known as the Basset force, which is a historical force. It is necessary to calculate the relevant indicators of particle movement time to describe it accurately. The theoretical expression is:
According to the working condition of this paper, the particle drag force is the most obvious and the largest among the above forces. The pressure gradient force, FP, is three orders of magnitude smaller than the dominant force, and the false mass force, FVM, is three to four orders of magnitude smaller as well; hence, FP and FVM are disregarded. The random fluctuation of particles caused by turbulence, and its influence on the Basset force FBas, is almost zero after integration, so it is ignored in this paper.
To determine the discrete phase particle trajectory, the instantaneous velocity at each position along the x-axis can be derived by integrating Equation (8), and the particle trajectory is acquired through the integration of Equation (8). Following the acquisition of particle coordinates in the axial direction, a parallel procedure can be employed to determine the axial coordinates, thereby enabling the simulation to ascertain the positional data of the particles within the flow field, effectively mapping the trajectories of the discrete phase particles.
3.4. Population Balance Model
The population balance model is an efficient approach for analyzing the nucleation, growth, aggregation, and fragmentation of discrete-phase hydrate particles, together with the variations in particle size, area, volume, and density distributions [24,25,26,27]. This research introduces the population balance model to simulate the aggregation and fragmentation processes of hydrate particles in the composite separator [37]. The orthogonal moment method is employed to resolve the population balance equation and determine the Sauter diameter, which refers to the diameter of solid particles. The equation governing the population balance for solid particles is as follows [14,37]
where n(L, t) signifies the number density of hydrate particles with a particle size of L at time t, measured in 1/m3; β(L − L′, L′) indicates the collision frequency of two hydration particles with particle sizes of L − L′ and L′, respectively, expressed in m3/s. α denotes the coalescence efficiency of two hydrate particles post-collision; S(L′) indicates the breakage frequency of hydrate particles with a size of L′, measured in 1/s; b(L|L′) signifies the probability that hydrate particles of size L′ will be produced following the fragmentation of hydrate particles of size L′.
Hydrate particles or hydrate aggregates may collide in the pipeline due to Brownian motion, differential sedimentation, or flow shear [37]. This paper considers the aggregate of the collision frequencies of the three as the true collision frequency of hydrate particles.
For Brownian motion
where kB represents Boltzmann’s constant, T denotes the absolute temperature, μ signifies fluid dynamic viscosity, and L indicates the particle diameter of hydrate particles.
For differential sedimentation:
The settlement rate is calculated according to Equation (20):
For fluid shear, according to the different flow patterns of particles, it is divided into two calculation formulas: one pertains to collision frequency in a laminar flow regime, while the other concerns collision frequency in a turbulent flow regime. For laminar flow, the formula proposed by CAMP et al. [38] is used
where G represents the shear rate, the equation suggested by Saffman et al. [39] is applied in turbulence
When hydrate particles exceed the Kolmogorov scale, they reside in the turbulent inertial region, where the primary flow field entrains the hydrate. The collision frequency of hydrate particles can currently be determined using the method put forward by Abrahamso [40] (see Equation (23)).
The Reynolds number of the flow field is computed based on the gas production statistics (0.2~3 × 10⁴ m3/d) and pipe diameter (50 mm) presented in Table 2. The turbulent flow in the pipeline can be classified as high Reynolds number (Re > 6.1 × 10³), significantly exceeding the crucial threshold for pipeline turbulence of 2300.
The aggregation efficiency of particles post-collision is determined using the curve model, which considers the flow shear of the flow field and the van der Waals forces between particles. The aggregation efficiency is determined using Equation (24) [14].
The crushing generated by flow shear is the primary factor taken into account when determining the crushing frequency, and the computation is based on Equation (25)
where , D is the fractal dimension, and c and E are empirical constants.
Particle size distribution functions following comminution primarily encompass binary, ternary, and normal distributions. This paper employs the binary distribution as the particle size distribution function of hydrate particles subsequent to compression, as delineated below:
The Lehr model simulates the impact of hydrate particle fragmentation. Based on Equation (18) to Equation (26), the UDF is compiled, and the essential parameters within the population balance model are determined.
3.5. Heat Transfer Decomposition Model
During the transportation of natural gas hydrate within the composite insulated conduit, variations in pressure and temperature induce the thermal decomposition of the hydrate through heat transfer. The key is to solve the decomposition mass source term () and energy source term ().
At the gas–solid interface, two key physical processes occur: one pertains to the gas flux arising from hydrate decomposition, , while the other corresponds to the Knudsen mass flux, , which represents the mass of gas diffusion through pores [41]. Under steady-state conditions, the two are equal, which is:
3.5.1. Kinetic Model of Hydrate Dissociation
The Kim–Bishnoi model is a classical kinetic model describing the decomposition of natural gas hydrates [42]. Its original form is
where n represents the quantity of substance, mol, t denotes time, s, Kd is the intrinsic kinetic constant, mol/(m2·Pa·s), As is specific surface area, m2/m3, feq is hydrate-gas equilibrium fugacity, Pa, and fg is the actual fugacity of gas phase, Pa. The mass flux per unit surface area, , is defined as:
The amount of substance is converted into mass, and the activation energy term is introduced. The mass flow rate per unit area, , can be obtained
where Mh represents the molar mass of the hydrate in kg/mol, vmol denotes the molar volume in m3/mol, ΔEa signifies the activation energy in kJ/mol, R is the gas constant approximately equal to 8.314 J/(mol·K), and T indicates the temperature in Kelvin. The kinetic coefficient kkin is established as the principal parameter for characterizing the kinetic properties of hydrate dissociation, and the kinetic equation representing the rate of hydrate dissociation can be expressed as:
3.5.2. Gas Kinetic Theory of Gas Diffusion Process
For the gas diffusion process, according to the gas kinetic theory, the Knudsen diffusion molar flux Jk of gas diffusion from the interface to the main pore region is [41]
where Dk represents the Knudsen diffusion coefficient, m2/s, C denotes the molar concentration of gas, mol/m3, and x indicates the gas diffusion direction, m. For ideal gases
where P is the pressure, Pa. We can achieve Equation (35):
Equation (35) is substituted into Equation (32) to obtain:
In practice, the pressure P needs to be replaced by the gas fugacity f
where Z represents the compressibility factor. The fugacity gradient is directly proportional to the chemical potential gradient, expressed as follows:
Equation (36) can be corrected to:
Based on the kinetic theory of gases, the Knudsen diffusion coefficient, Dk, is determined by multiplying the pore diameter, dp, by the mean thermal velocity, , of the molecule
where dp denotes the pore diameter, m, and represents the average thermal velocity of molecules, m/s. The Maxwell–Boltzmann probability distribution function is employed to compute , as demonstrated in Equation (41) [14]
where M is the molecular weight, kB is the Boltzmann constant, 1.38 × 10⁻²³ J/K, m is the single molecular mass, kg. With
where M is the molar mass, NA is the Avogadro constant, and substitutive Equation (40) can achieve:
The molar flux Jk, mol/(m2·s) in Equation (39) is converted to the mass flux Jk, mass, kg/(m2·s) to obtain:
Since the fugacity gradient is approximately linear within the thickness δ near the interface, that is
where fg,b is the gas fugacity in the main pore area, Pa, fg,i is the gas fugacity at the interface, Pa, and substitutive Equation (44) can achieve:
The Knudsen diffusion coefficient, kdiff, is defined as the key parameter to describe the flux of gas diffusion from the interface to the bulk region [41]. From Equations (40), (43) and (46), the mass flux can be written as:
With:
3.5.3. The Solution of Mass Source Term and Energy Source Term
Joint Equations (27), (31) and (48) can achieve:
By substituting Equation (49) into Equation (30), the total mass flow rate is expressed as Equation (51):
Given the assumption that hydrate particles are spherical and dispersed within porous media, the specific surface area, denoted as As, is defined as the ratio of the total surface area of the particles to the unit volume
where rp is the hydrate particle radius, m, np is the number of particles in unit volume, m−3, V is the unit volume, m3, ϕ is porosity, and Sh is hydrate saturation. Taking into account the alteration of particle size throughout the breakdown process, the specific surface area, following the application of saturation correction, is articulated as:
For the solid mass source term , hydrate dissociation leads to a decrease in solid mass, then:
Substitute Equations (51) and (53) to achieve:
Substituting Equations (32) and (49), can obtain the expression of the solid mass source term :
For the gaseous mass source term , hydrate dissociation produces gas (methane) and liquid water (or directly produces gas, depending on the model). According to the principle of mass conservation, the mass of the produced gas is equivalent to the mass of the decomposed hydrate multiplied by the gas yield coefficient η, which is defined as follows
where Mg denotes the molar mass of the gas obtained by decomposition, g/mol, and Mhyd represents the molar mass of the hydrate, g/mol. The gaseous mass source term is:
Substituting Equations (51), (53) and (57), we obtain:
Substituting Equations (32) and (49), can obtain the expression of the gaseous mass source term :
Regarding the energy source term , the dissociation of hydrate represents an endothermic process. The absorbed heat is the latent heat of dissociation, ΔHd, J/kg, and the endothermic power per unit volume is:
In the energy equation of CFD [43], the source term typically uses a positive value to represent energy input, i.e., the heating process, and a negative value to represent energy output, i.e., the cooling process. The decomposition of the hydrate is an endothermic process, so should be negative, which is written as:
Substitute Equations (32), (49), (51) and (53) to achieve:
Defines the coefficient β as Equation (64):
This paper summarizes the hydrate flow and heat transfer model based on the preceding analysis.
Equation (65) through Equation (67) display the solid mass source term , the gaseous mass source term , and the energy source term :
Equation (65) to Equation (67) are integrated into the Fluent solver via a user-defined function (UDF), and the model’s heat transfer decomposition is computed using the C programming language.
4. Numerical Solution Method
4.1. Model Solution Setting
Fluent 15.0 is utilized to resolve the model. The primary gas phase is designated as natural gas, whereas the solid phase is identified as hydrate. The gas–solid two-phase flow model utilizes the Discrete Phase Model (DPM), whereas the turbulence model employs the RNG k-ε model. The inlet is designated as the velocity-inlet boundary, the exit as the press-exit boundary, and the tube wall as the WALL barrier with no slip, utilizing the usual wall function approach for processing. Given that the flow direction of the hydrate in the riser opposes the direction of gravity, the gravitational vector is established to be contrary to the flow direction in this simulation. The temperature boundary is applied to the tube wall, with an equivalent thermal conductivity of 0.055 W·(m·°C)−1. The gas–solid two-phase at the input is configured to maintain an identical flow rate and temperature. The first-order upwind approach computes the initial flow field. Upon acquiring the preliminary solution, the pressure and momentum equations are transitioned to the second-order upwind scheme. The phase-coupled SIMPLE algorithm facilitates pressure–velocity coupling. The population balance equation is resolved using the discrete technique, with the residual established at 10−5. The main parameters involved in the model solution are shown in Table 4.
Table 4.
Model parameters.
Based on the physical circumstances governing the initial development of natural gas hydrate within the composite insulation pipe, the inlet flow rates were established at 0.2, 0.4, and 0.6 × 10⁴ m3/d, while the inlet temperatures were designated as 23.49, 23.53, and 23.58 °C, respectively. The volume fraction of R11 hydrate is estimated using water-content data from the Sulige gas field. The volume fraction of hydrate ranges from 1% to 3%, with a particle diameter of 10 μm. Table 5 delineates the nine working circumstances analyzed in this study.
Table 5.
Simulation operating condition parameters.
4.2. Model Verification
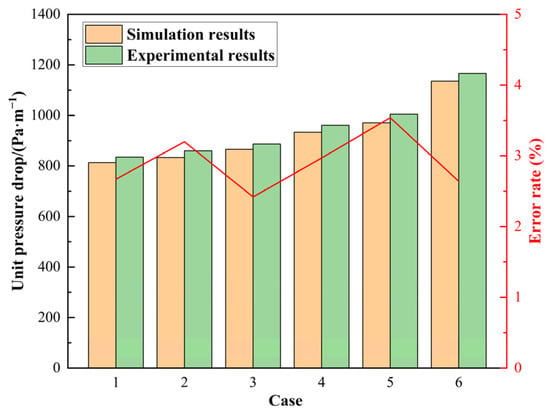
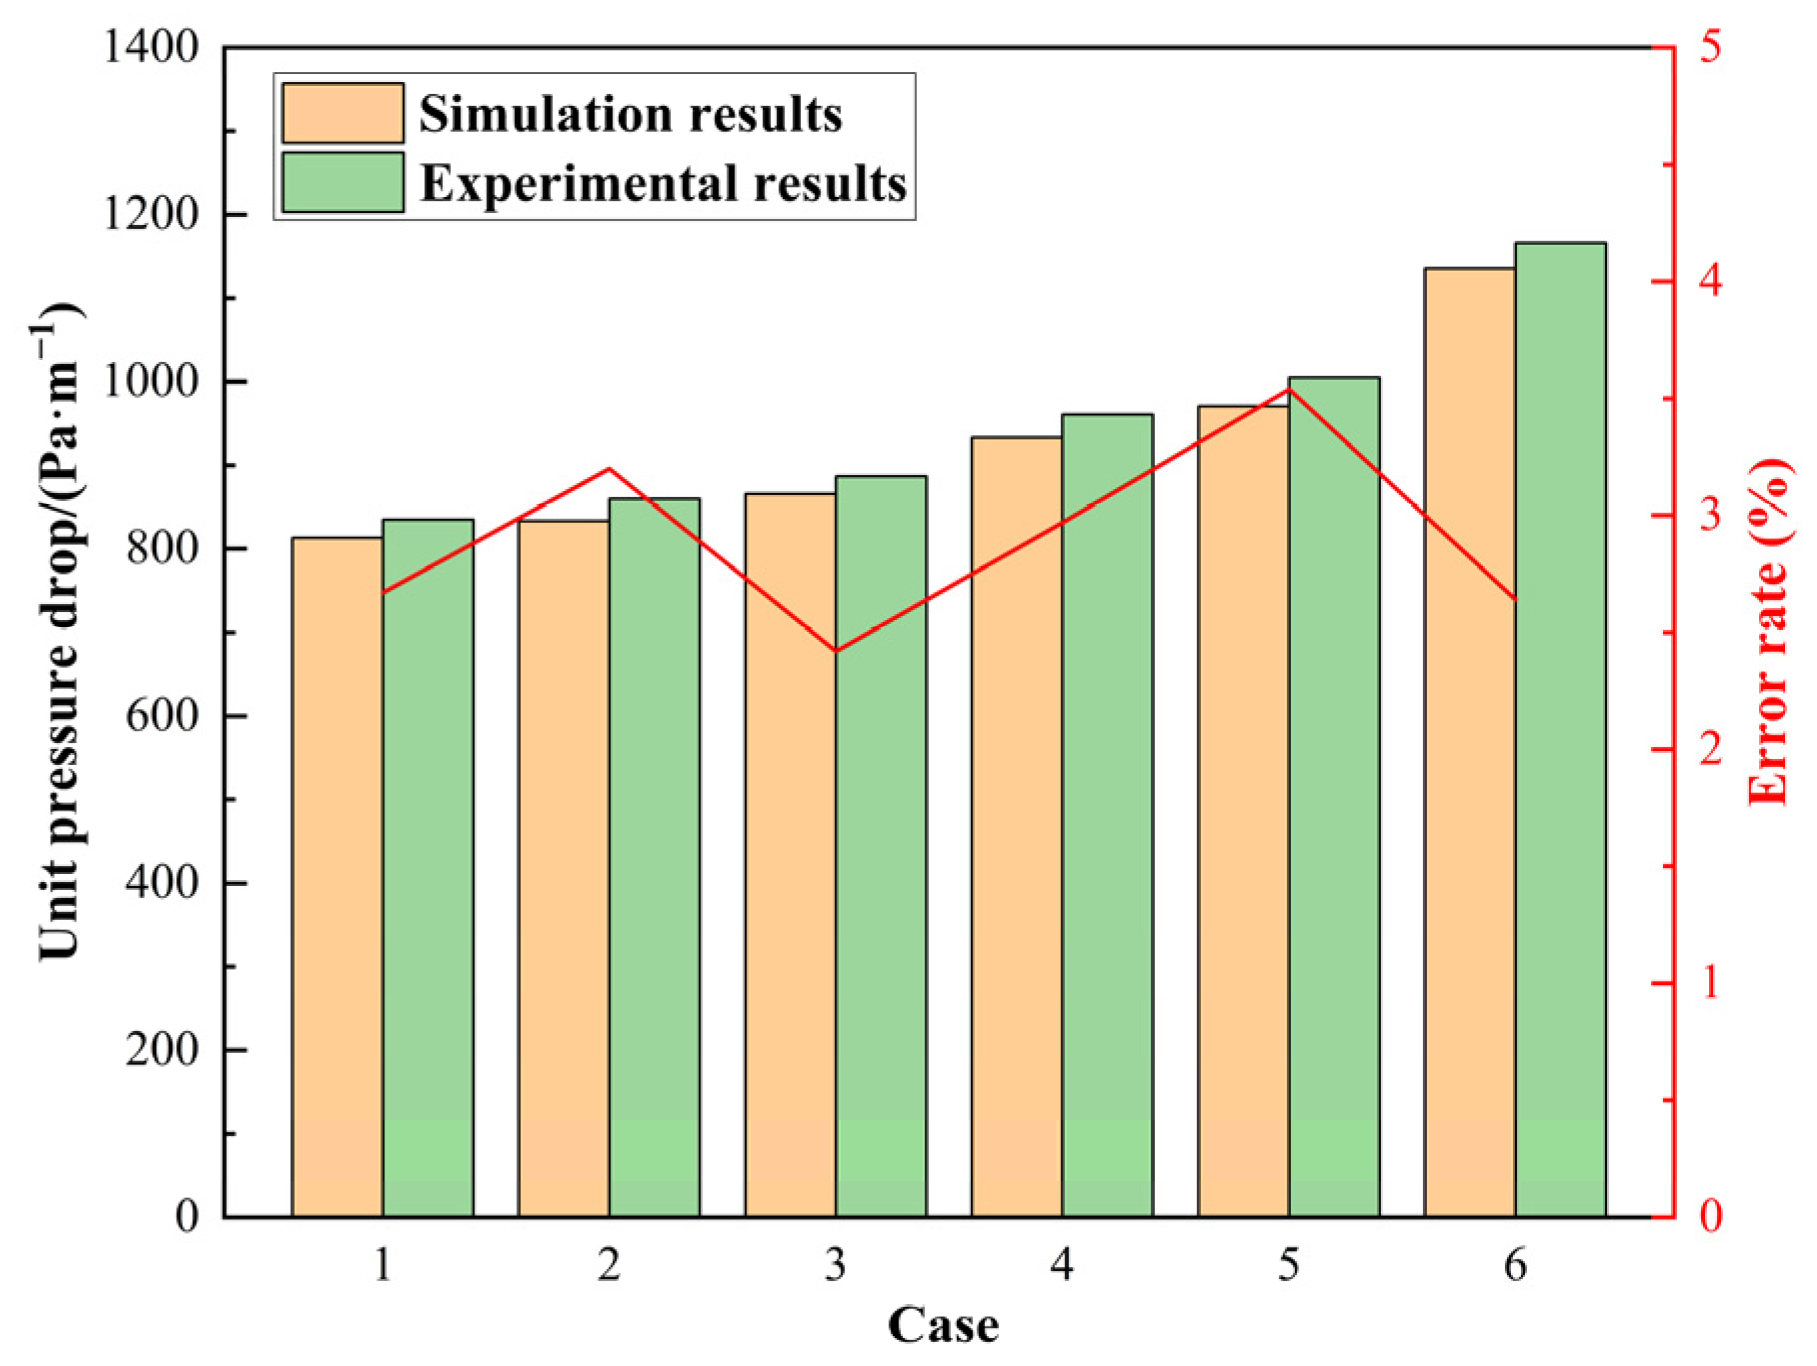
In light of the absence of experimental data regarding the flow of hydrates in vertical pipes, the unit pressure drop is used as the verification parameter to assess the model’s accuracy, based on the experimental data on natural gas hydrate flow characteristics in horizontal pipes reported in Reference [44]. This experiment utilized a horizontal tube with a diameter of 45.2 mm and a total length of 2.3 m, along with associated centrifugal pumps, pressure sensors, flowmeters, and other experimental apparatus. The experimental parameters included varying hydrate volume fractions and intake flow rates ranging from 0 to 3.9 m/s. The operational parameters of the verification model are detailed in Table 6, and the results of the unit pressure drop verification are illustrated in Figure 5. The findings indicate that the inaccuracy for each operational state is within 4%, demonstrating that the model accurately models the hydrate flow characteristics.
Table 6.
Working condition parameters verified by the model.
Figure 5.
Verification results.
5. Analysis of Flow Characteristics of Natural Gas Hydrate in Composite Insulation Pipe
5.1. Hydrate Concentration Distribution
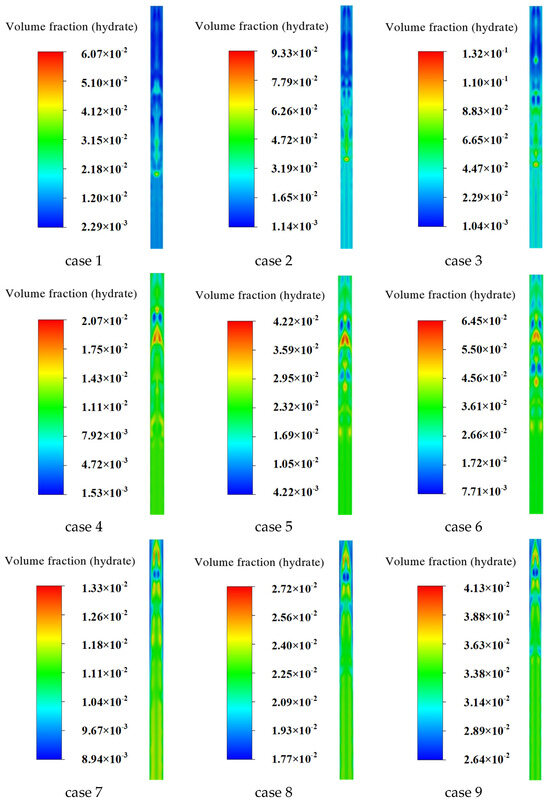
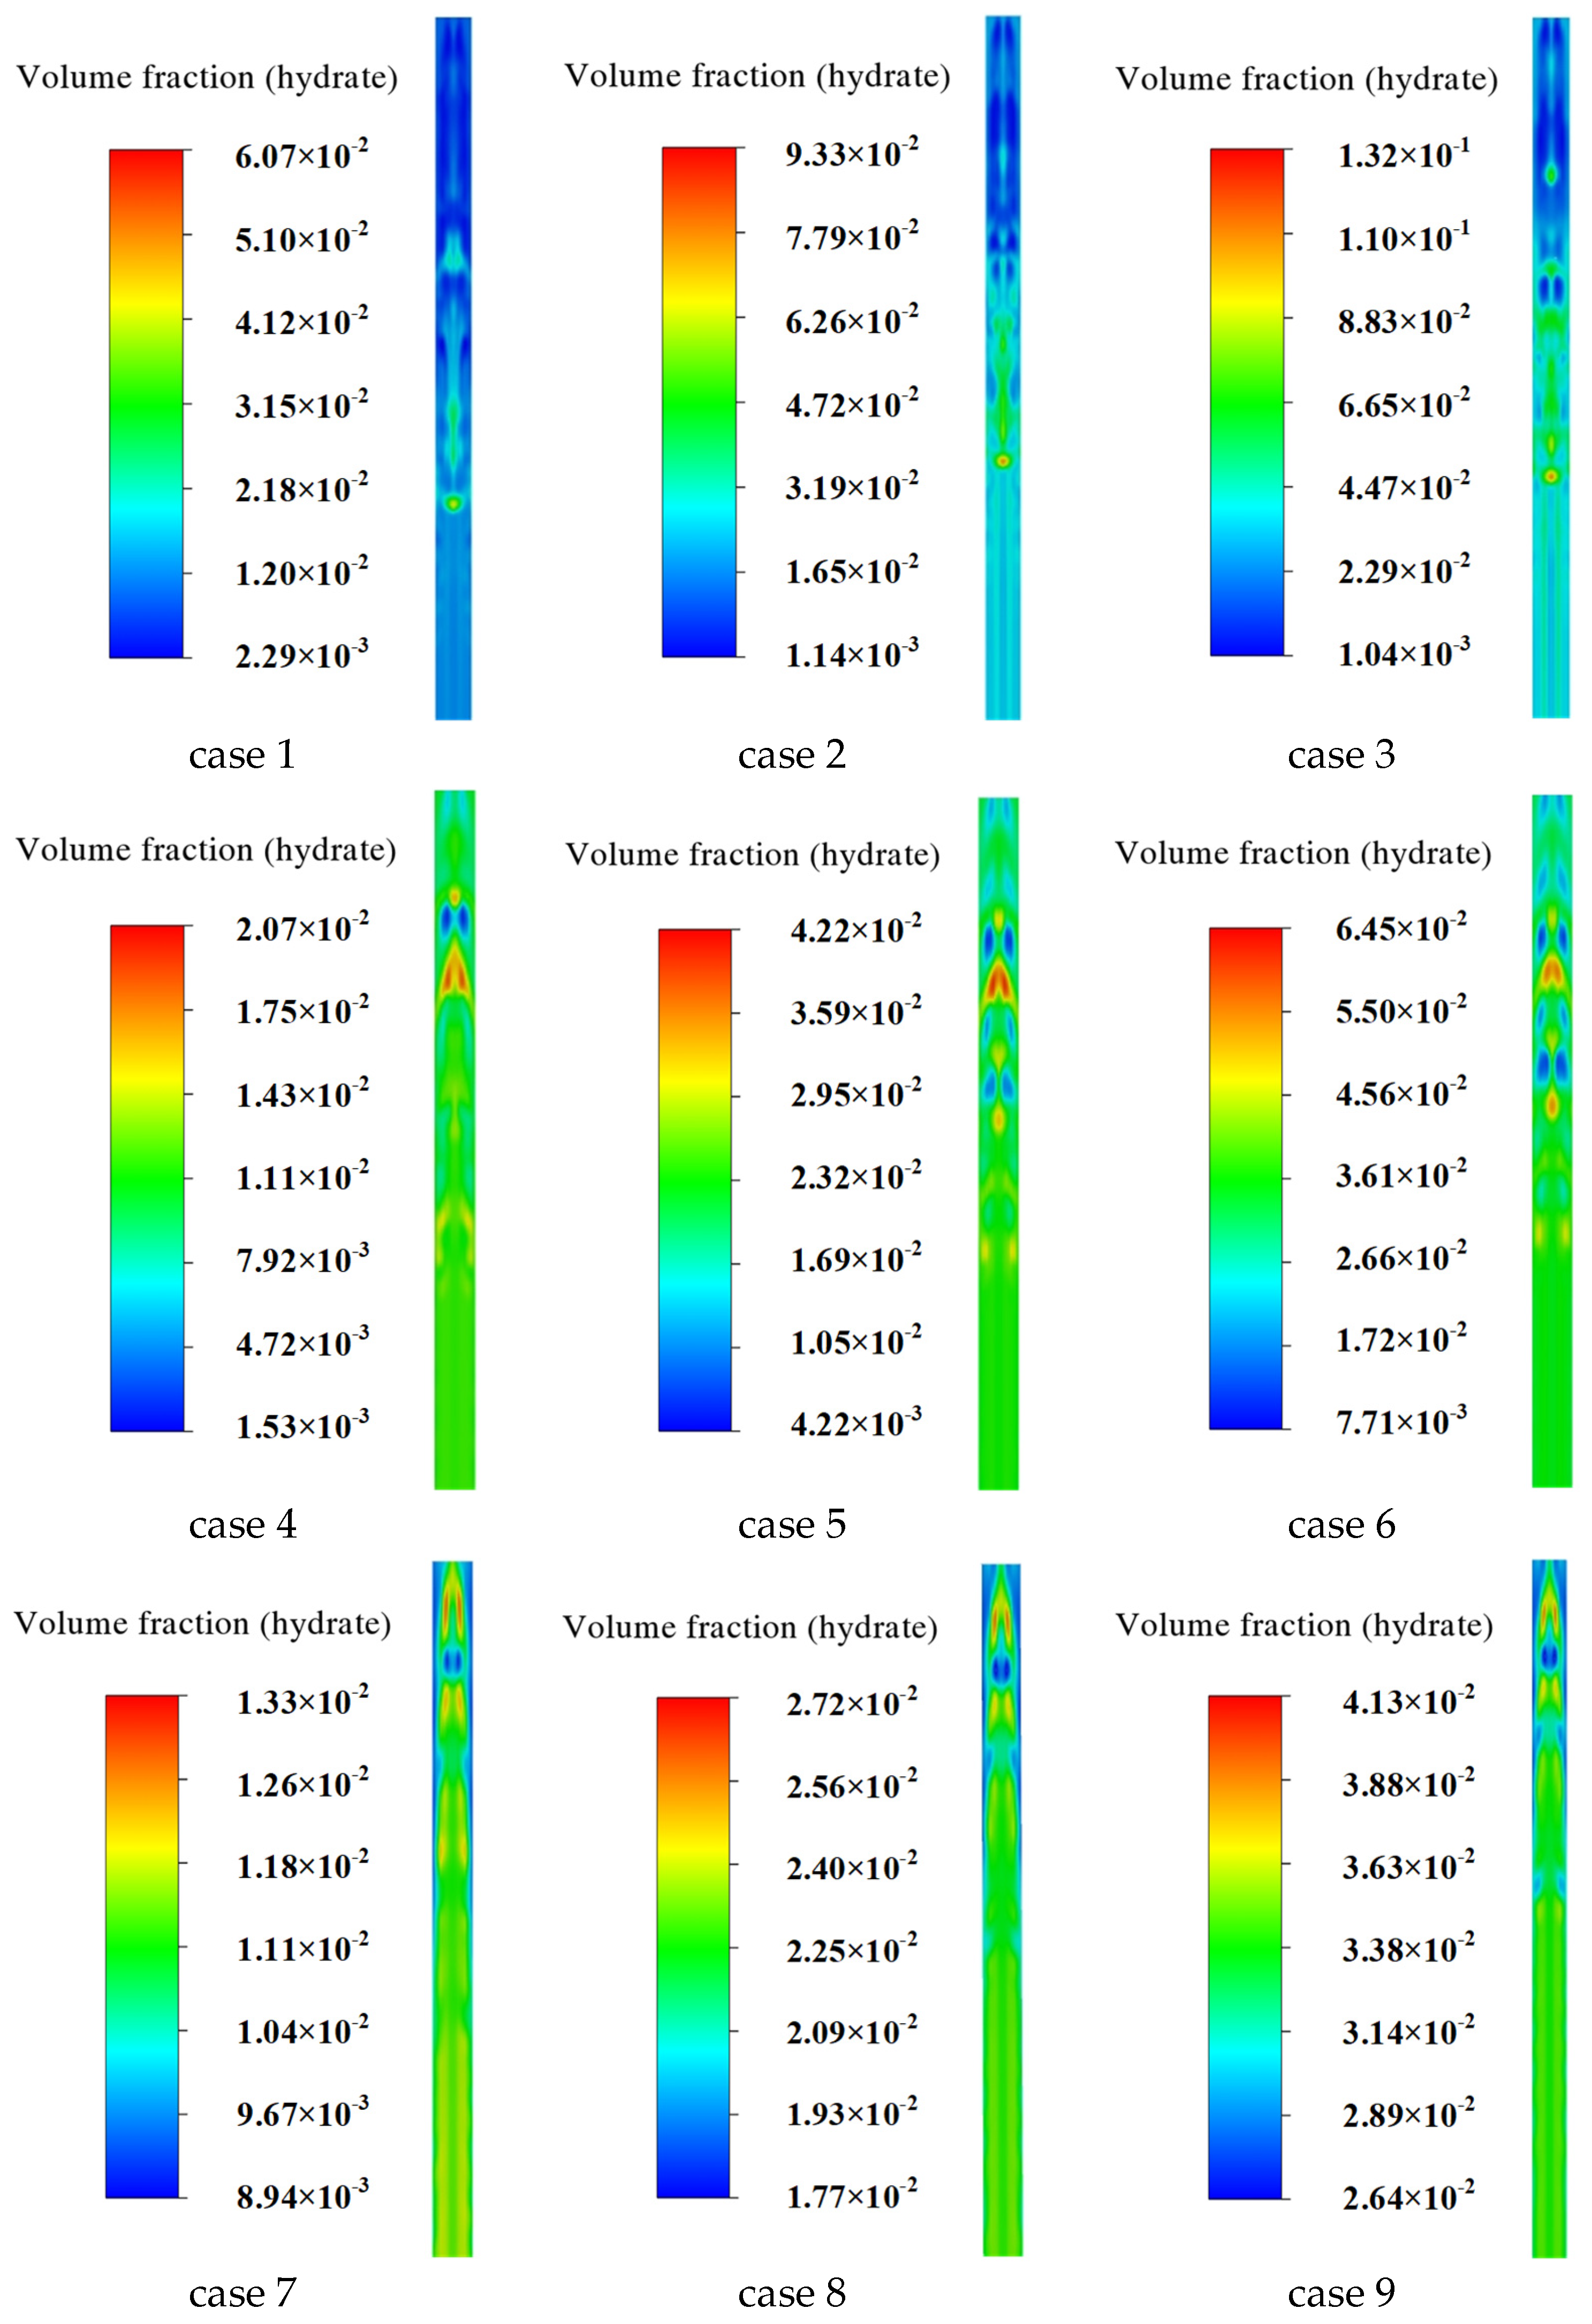
The distribution of hydrate concentration in the composite insulation tube under 9 working conditions in Table 5 is calculated and simulated. The distribution of hydrate concentration across the cross-section along the axis of the composite pipe (zox plane in Figure 4) under various working conditions is shown in Figure 6.
Figure 6.
Gas hydrate concentration distribution in vertical cross-section proximal to exit.
It can be seen from Figure 6 that when the daily output of natural gas is constant, that is, when the inlet hydrate flow rate is constant, with the increase in the inlet hydrate volume fraction, it can be seen from cases 1–3, cases 4–6 and cases 7–9 in the control figure that the concentration of natural gas hydrate in the vertical pipe is significantly improved as a whole, in which the high initial concentration (inlet volume fraction 3%) leads to the apparent accumulation of hydrate near the pipe wall. In comparison, the low initial concentration (inlet volume fraction 1%) results in a more uniform hydrate concentration distribution. When the volume fraction of the inlet hydrate is constant, with the increase in the inlet hydrate flow rate, it can be seen from the comparison of cases 1, 4, 7, cases 2, 5, 8, cases 3, 6, 9 in the figure that the hydrate is more straightforward to deposit under the condition of low yield, that is, low inlet flow rate, the local concentration gradient is large, and the concentration distribution is more uniform under high inlet flow rate. Low gas production carries more hydrate particles than high gas production, and the overall concentration base is higher.
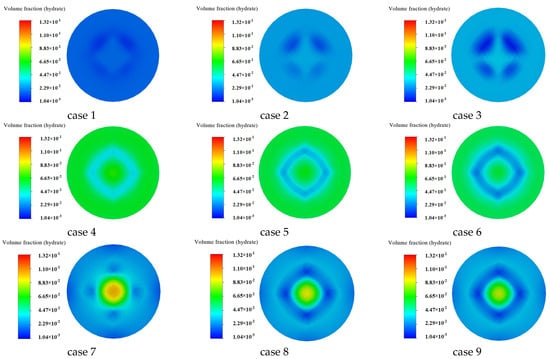
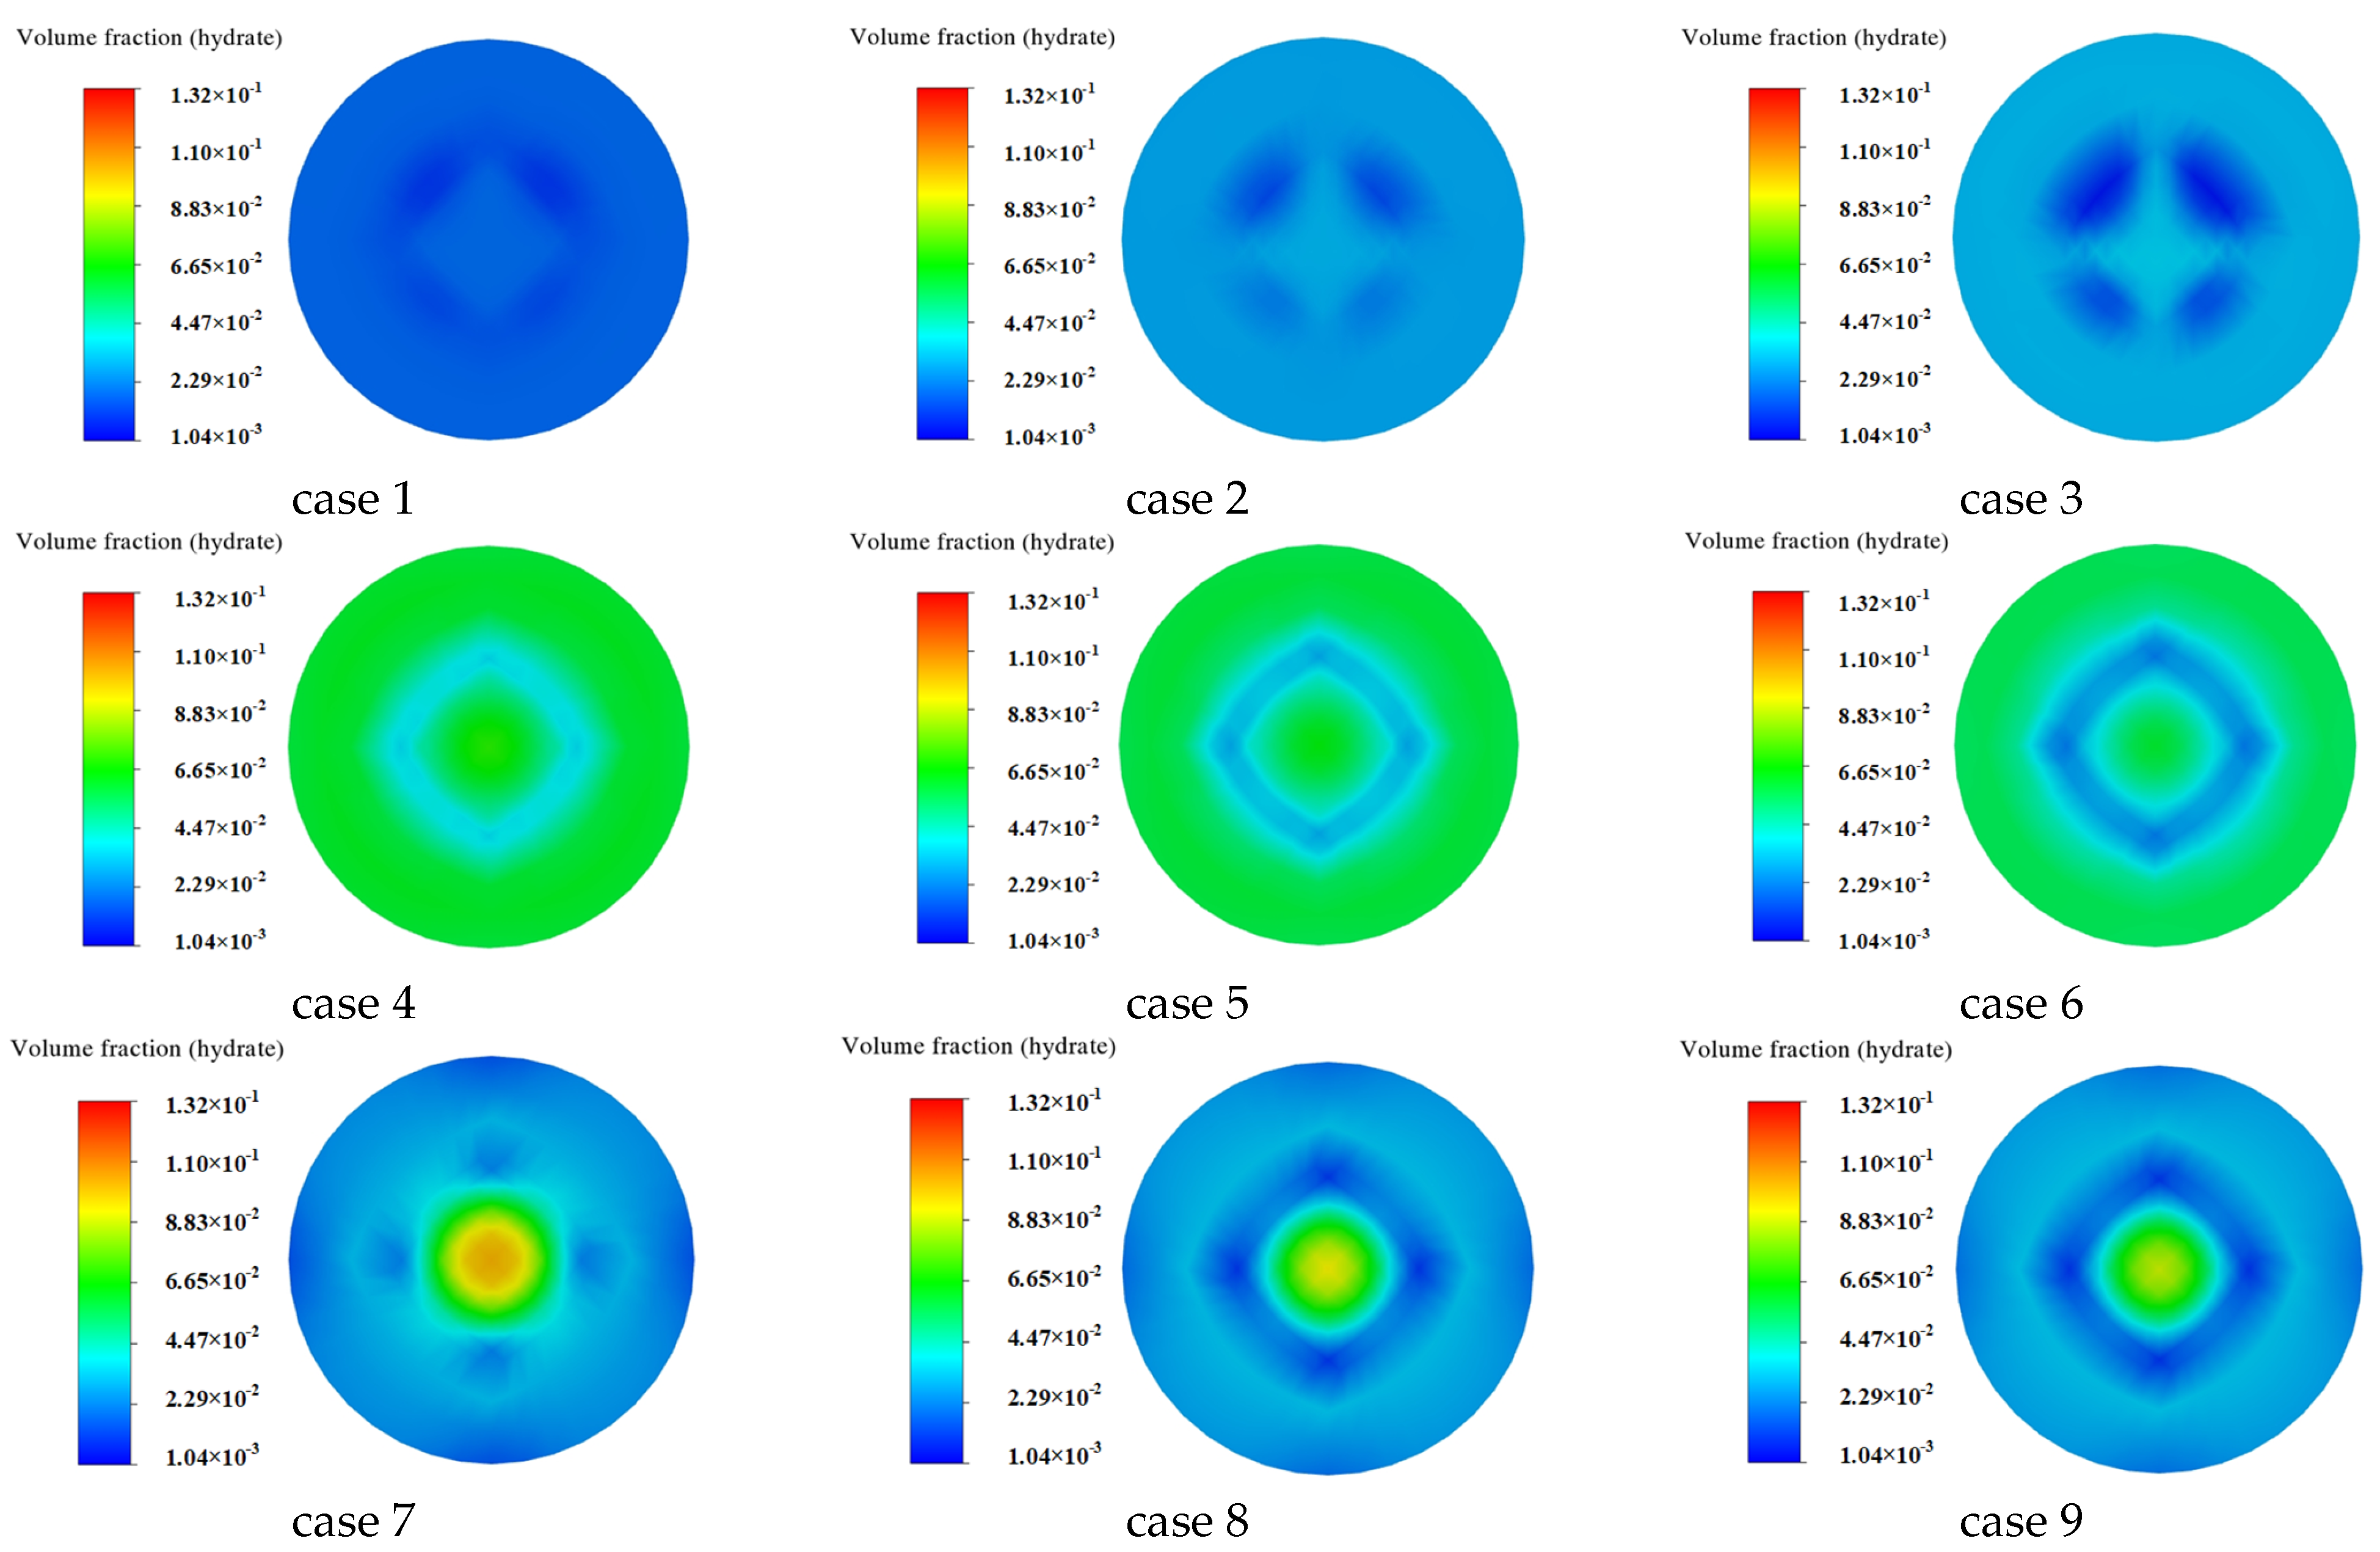
The simulation results of the hydrate concentration distribution at the outlet section of the composite insulation pipe under various working conditions are presented in Figure 7. Compared with cases 1–3, 4–6, and 7–9, it can be seen that when the inlet flow rate is constant, the initial hydrate concentration increases, and the outlet hydrate concentration increases significantly. Compared with cases 1, 4, and 7, it can be seen that, with the same initial hydrate concentration, increasing the inlet flow rate significantly increases the hydrate concentration at the center of the outlet section. In contrast, the hydrate concentration decreases gradually from the center to the pipe wall.
Figure 7.
Gas hydrate concentration distribution at the outlet cross-section under different working conditions.
5.2. Hydrate Pressure Distribution in Composite Insulation Pipe
The hydrate pressure distribution of the composite insulation pipe under nine different working conditions was studied. The parameters under different working conditions and the unit pressure drop of hydrate flow are shown in Table 7.
Table 7.
Various operating condition parameters and pressure drop.
When the volume fraction of hydrate is the same, the unit pressure drop increases with the increase in hydrate flow rate, and the gradient of unit pressure drop increases with the increase in hydrate flow rate. Compared with cases 1, 4, and 7, the unit pressure drop increases by 69.4% and 94.3%, respectively.
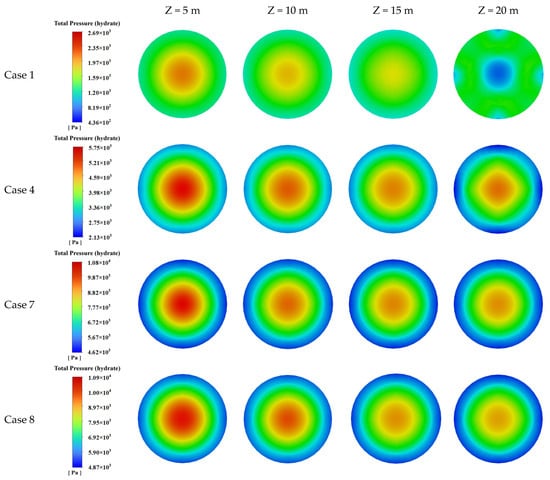
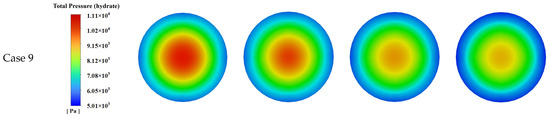
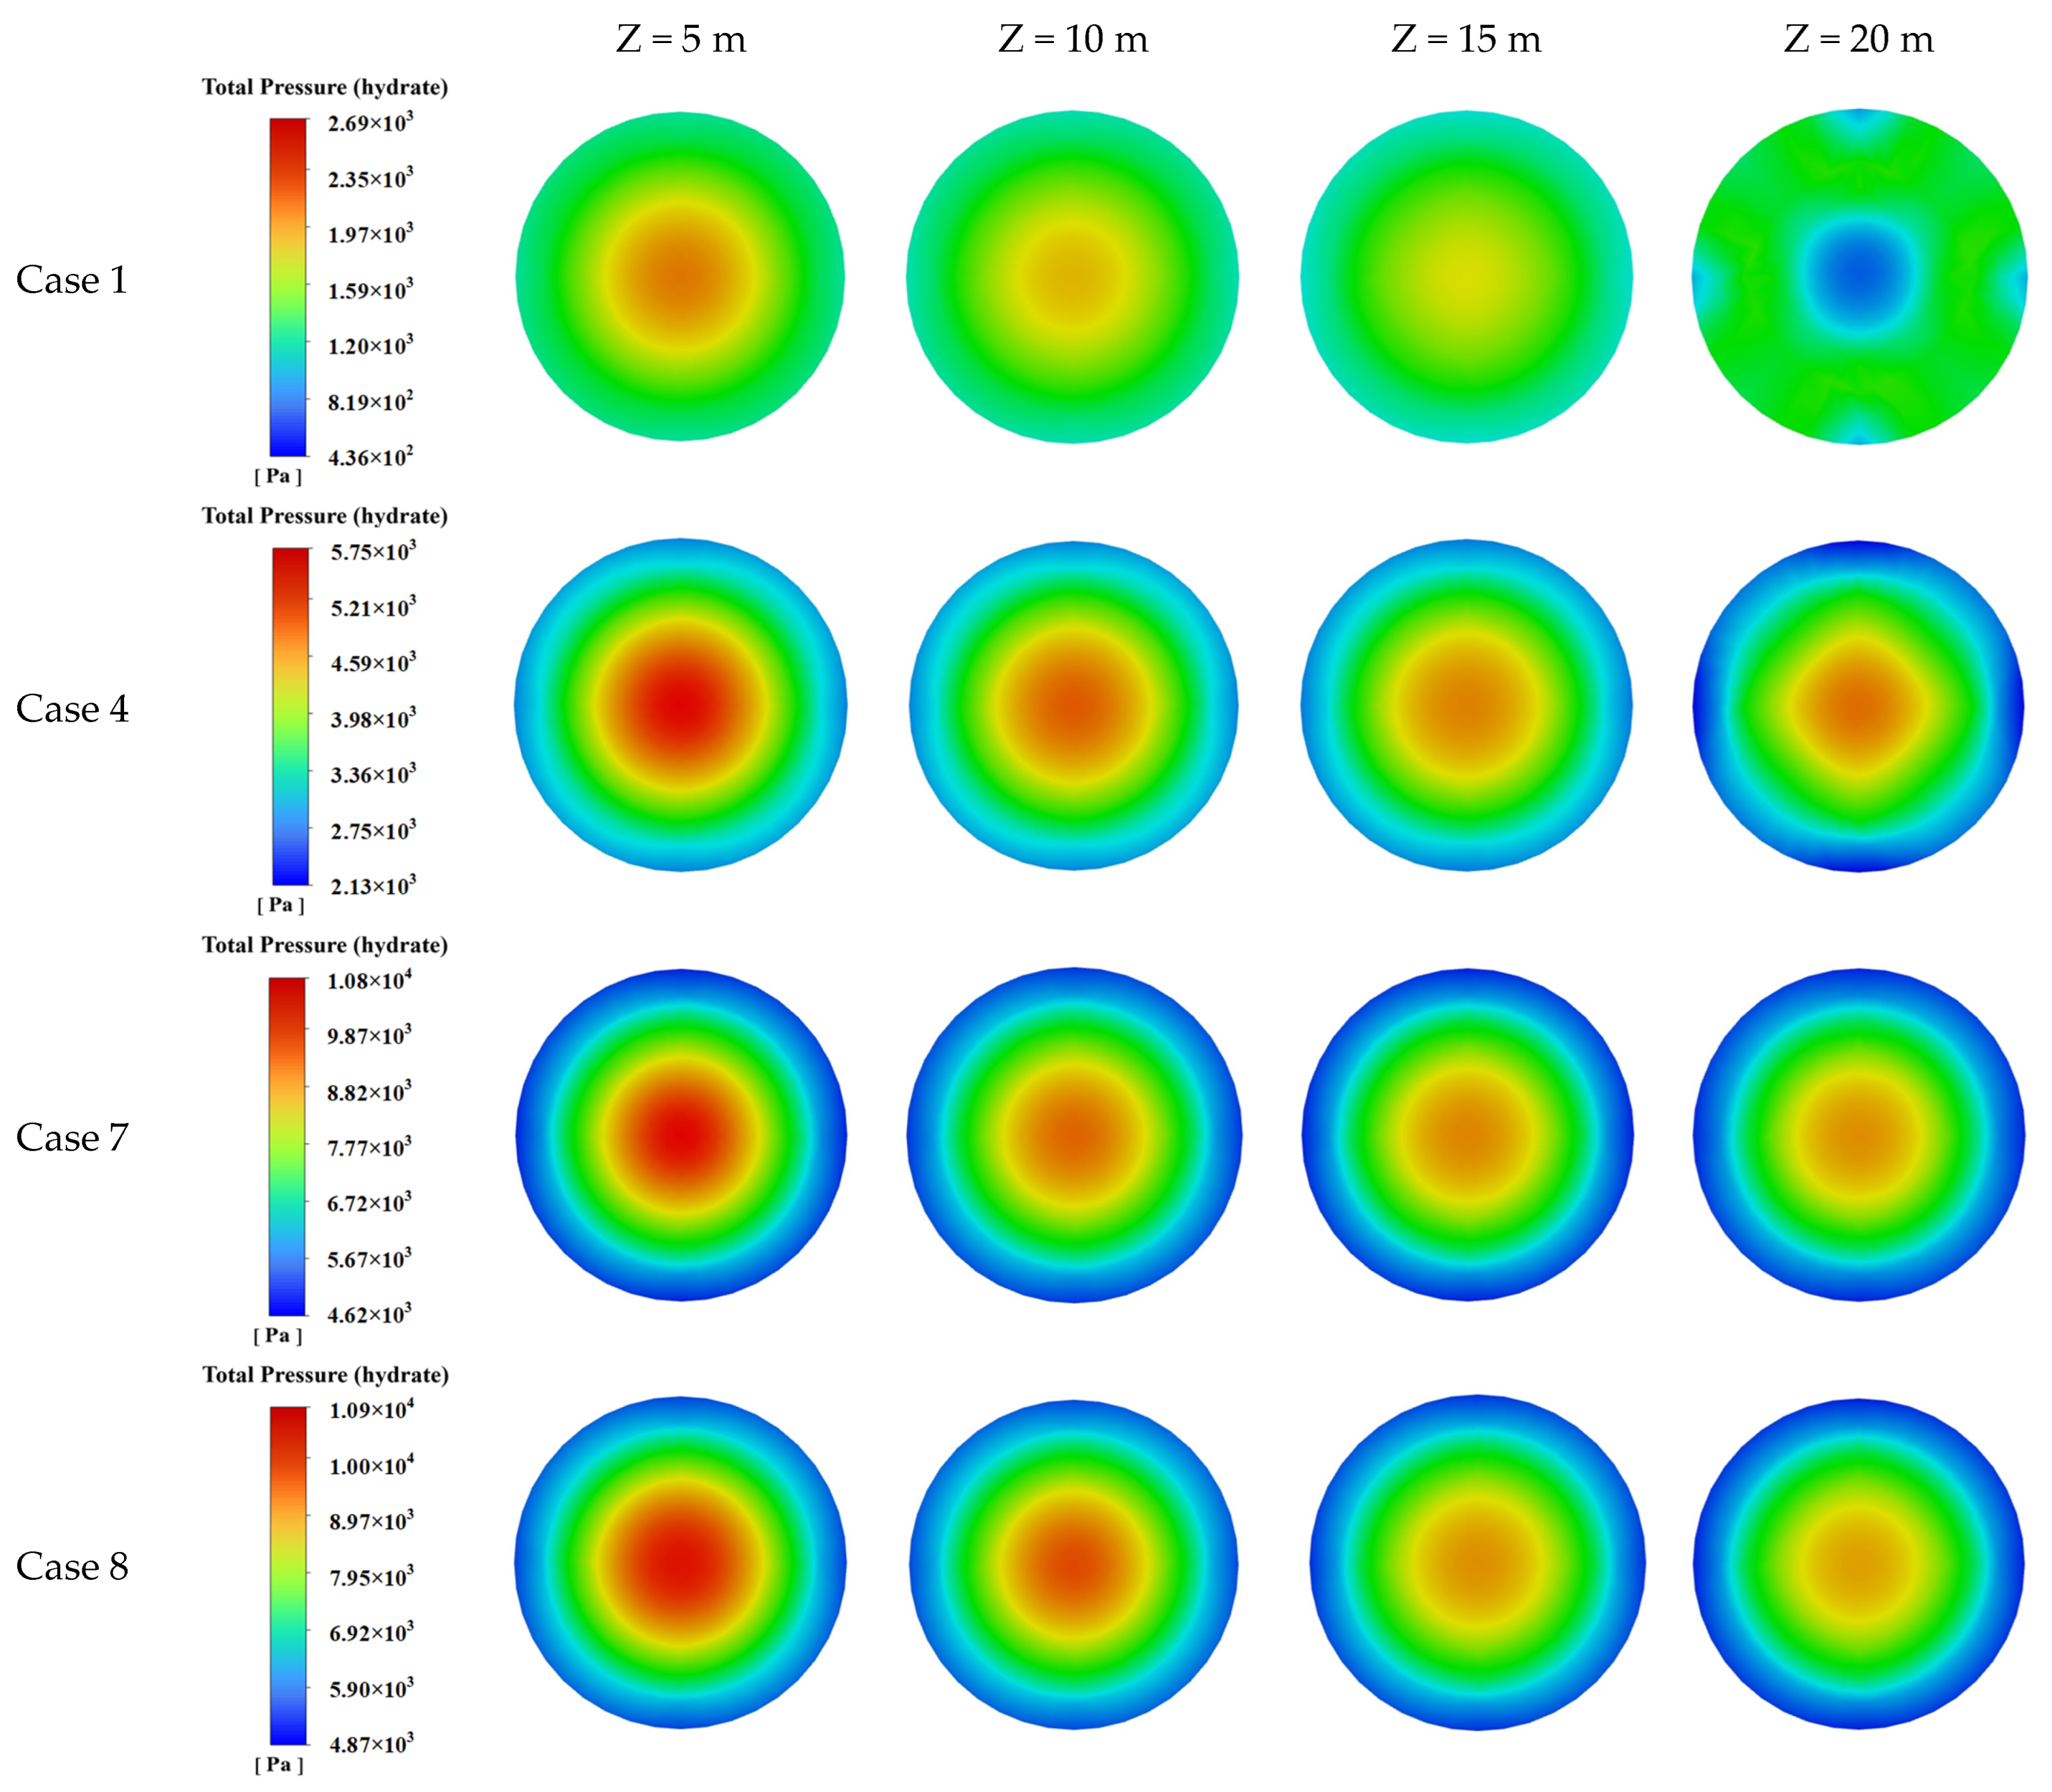
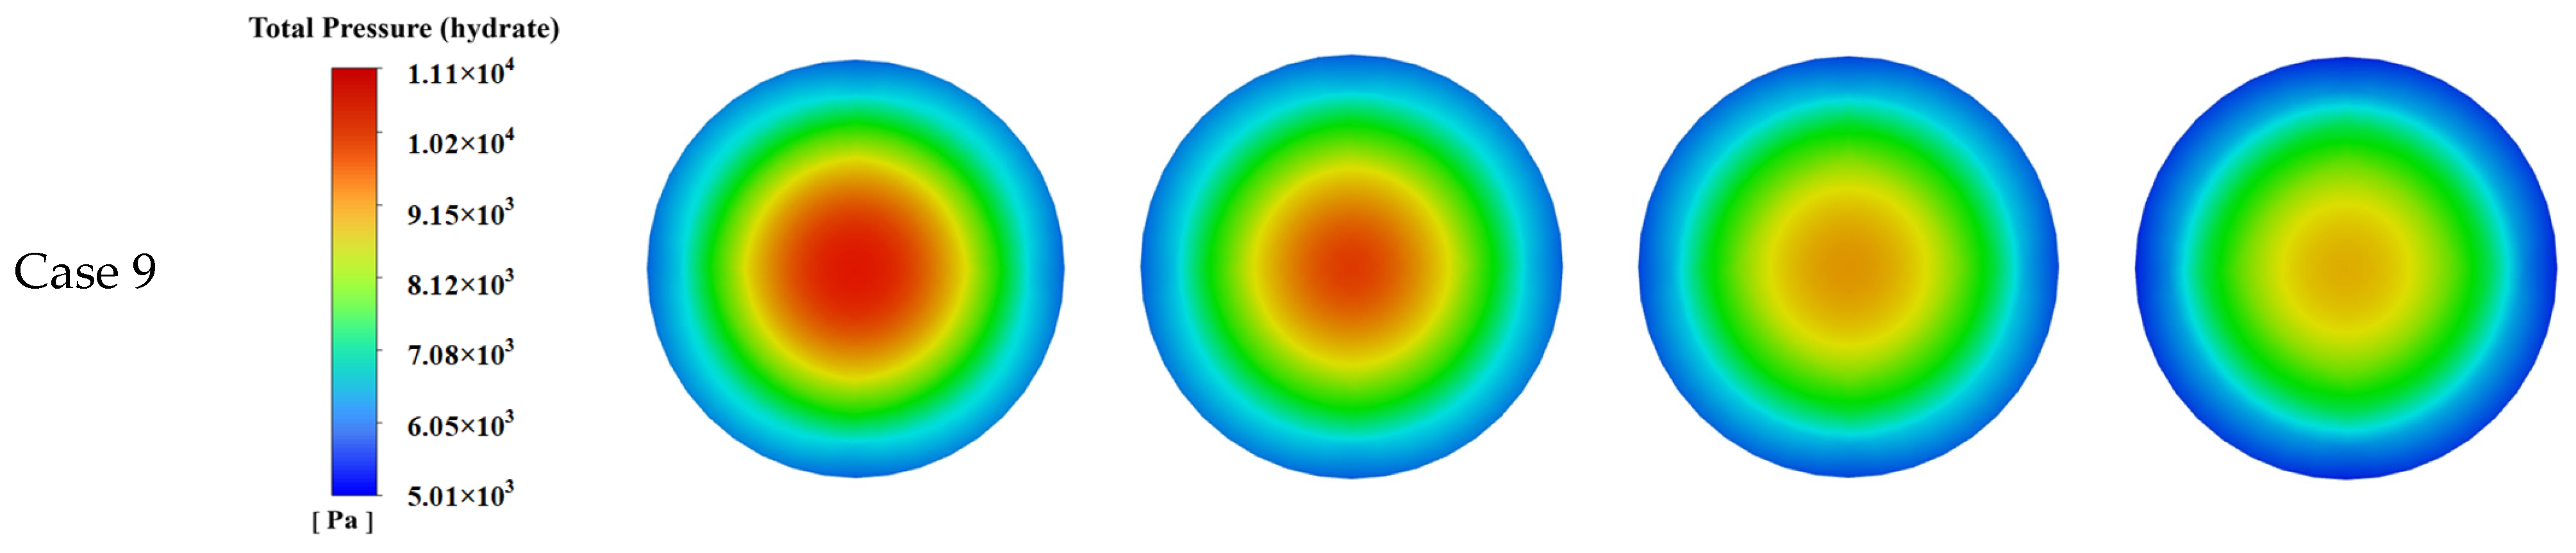
The simulation results for the hydrate pressure distribution in the composite insulation tube at different cross sections (z = 5 m, 10 m, 15 m, 20 m) under various working conditions are shown in Figure 8.
Figure 8.
Hydrate pressure distribution nephogram of composite pipe in different cross-sections.
As shown in Figure 8, the hydrate pressure at each section under each working condition exhibits a high central distribution and gradually decreasing values around it, and the pressure decreases along the axis. Due to the high concentration of hydrates in the central region of the pipe, the hydrate aggregation process will cause a local pressure increase, while the decrease in hydrate concentration near the pipe wall will lead to a certain degree of pressure drop [24]. Compared with cases 1, 4, and 7, it can be seen that, under constant hydrate volume fraction, as the hydrate flow rate increases from 2 m/s, 3 m/s, and 4 m/s, respectively, the hydrate pressure at the same section increases significantly. Compared with the pressure distribution results of cases 7, 8, and 9, it can be seen that, under constant inlet velocity, the hydrate pressure at each section increases slightly with increasing hydrate volume fraction from 2%, 3%, and 4% in turn.
5.3. Hydrate Velocity Distribution in Composite Insulation Tube
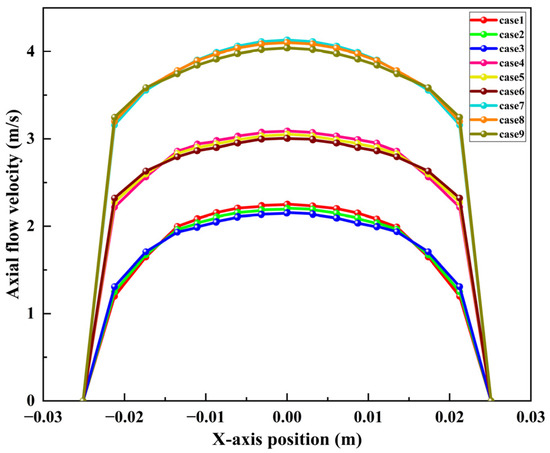
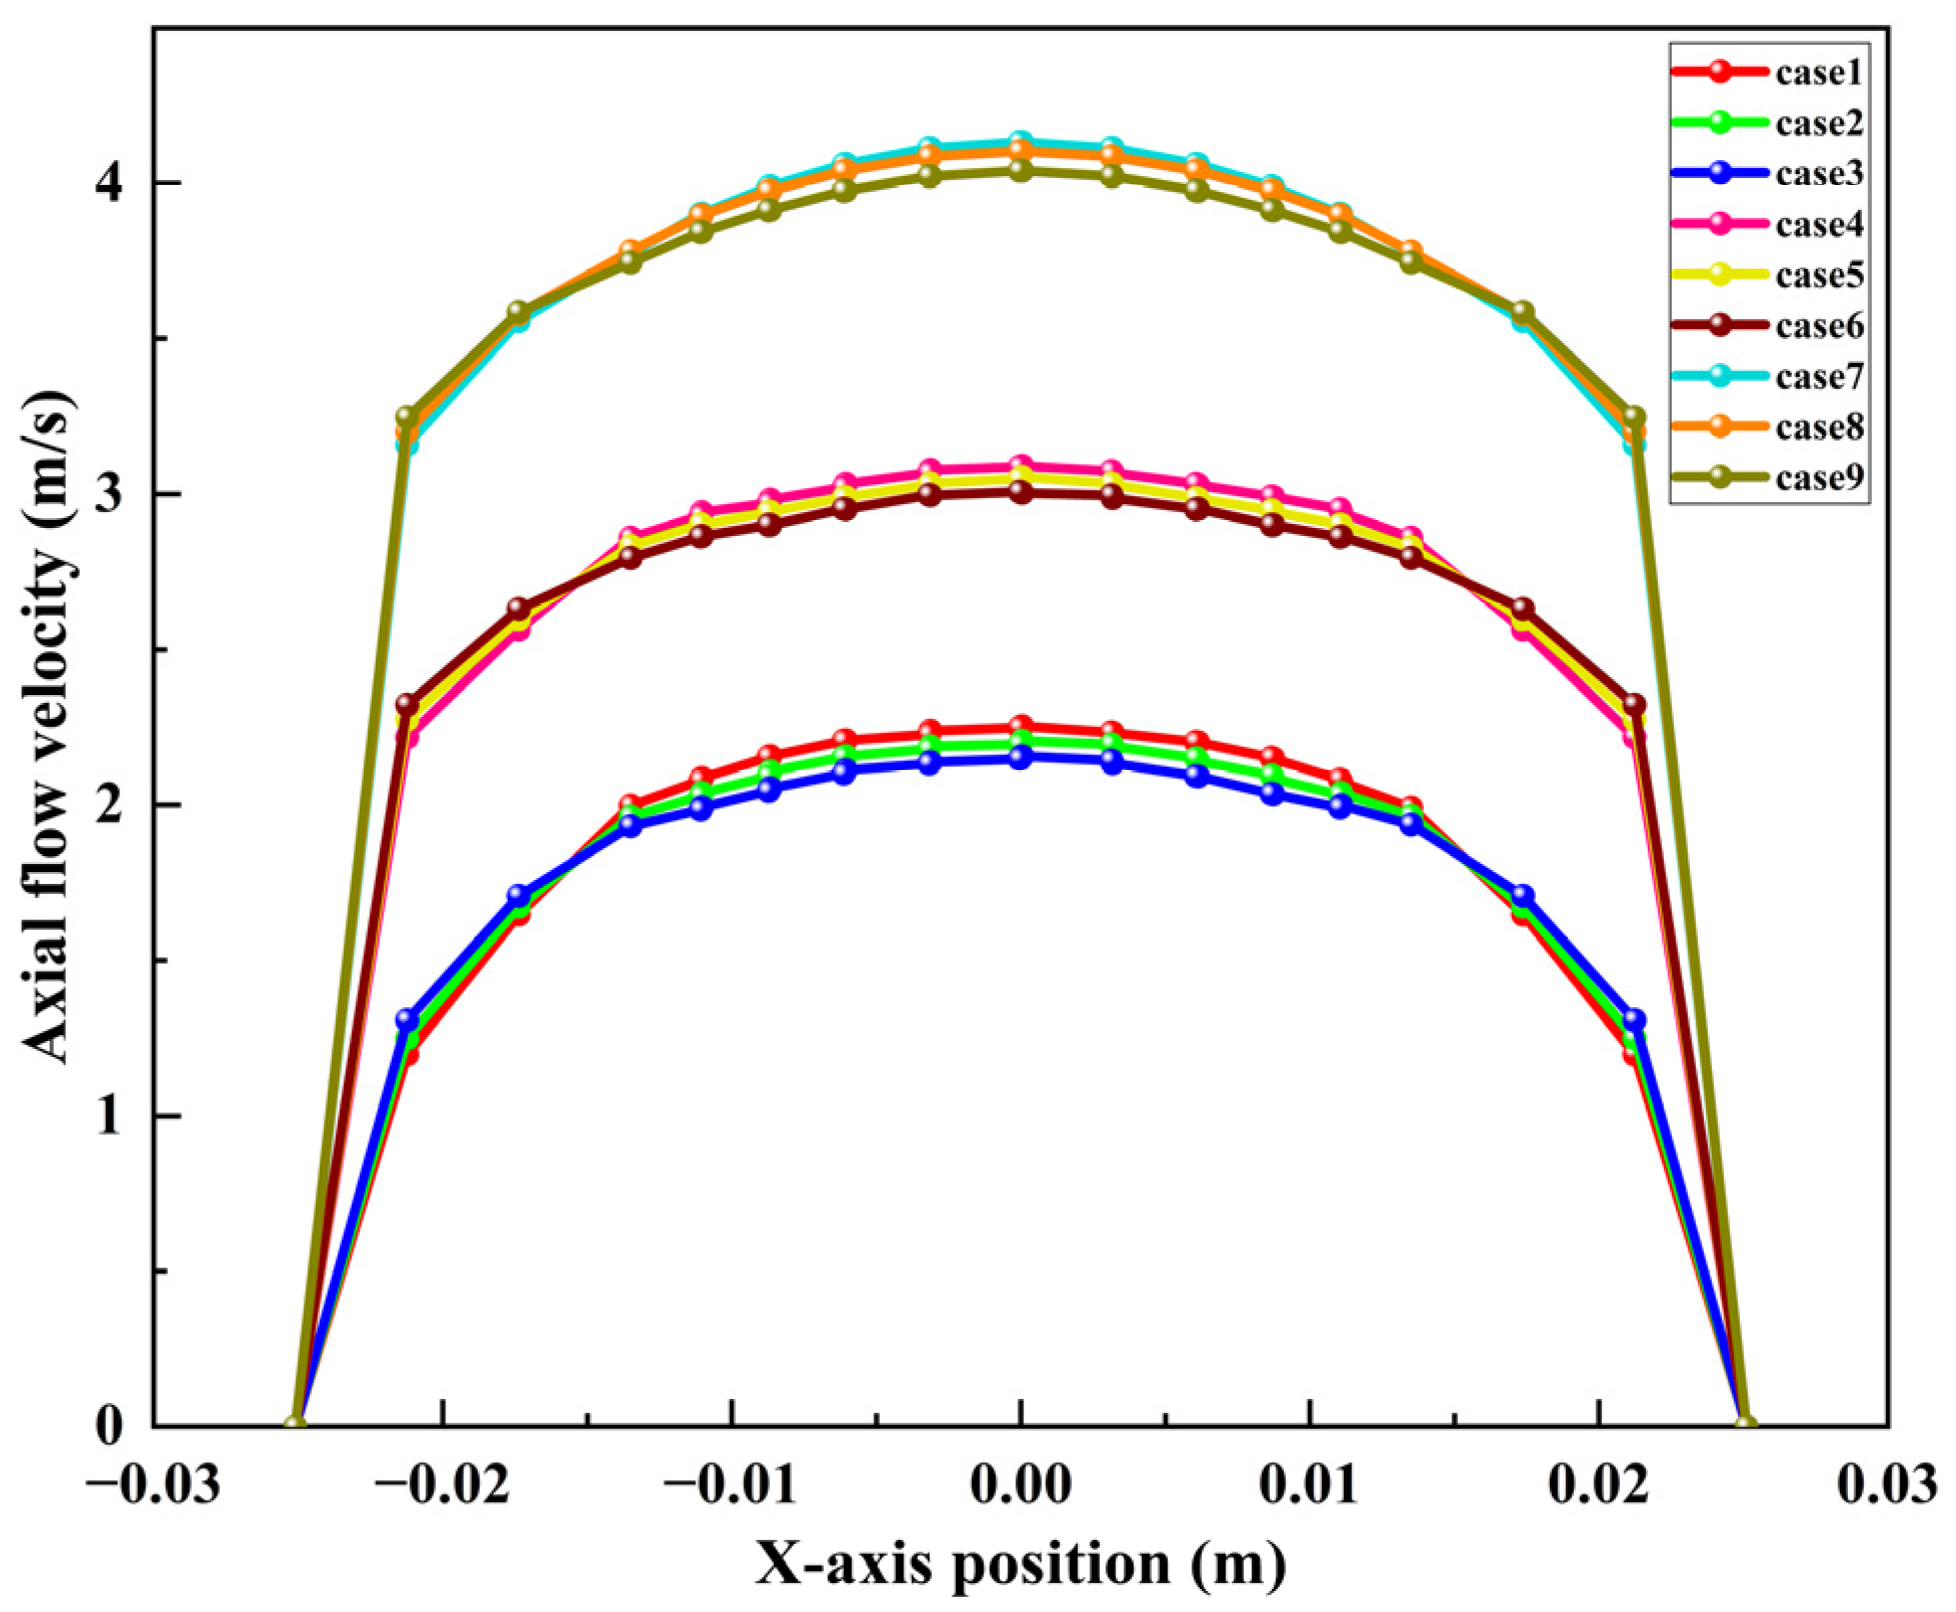
The hydrate flow in the composite insulation tube under nine different working conditions in Table 6 is simulated, and the velocity distribution curve of the hydrate particle outlet in the tube under different working conditions is drawn, as shown in Figure 9.
Figure 9.
The outlet velocity distribution of hydrate under different working conditions (z = 0 m).
From cases 1, 2, and 3 in Figure 9, it can be seen that, when the inlet flow rate and other conditions remain constant, the radial flow velocity of natural gas hydrate at the outlet decreases with increasing inlet hydrate volume fraction. The closer the pipe section is to the center, the higher the flow velocity is. The lower the flow velocity near the pipe wall is. According to cases 1, 4, and 7 in the figure, when the inlet hydrate volume fraction and other conditions remain constant, the outlet flow rate of natural gas hydrate increases significantly with increasing inlet flow rate. The flow rate of the hydrate outlet at each position is symmetrically distributed along the radial direction.
6. Heat Transfer Law of Hydrate Flow in Composite Insulation Tube
6.1. Effect of Hydrate Flow Rate on Hydrate Heat Transfer
The heat transfer characteristics of hydrate flowing in the composite insulation tube were studied by simulating the ambient temperature conditions in the Sulige gas field. The formation temperature gradient in the Sulige gas field is 0.3 °C/100 m. The formation environment temperature is 10 °C at that time, and the composite insulation pipe’s equivalent thermal conductivity is 0.055 W·(m·°C)−1.
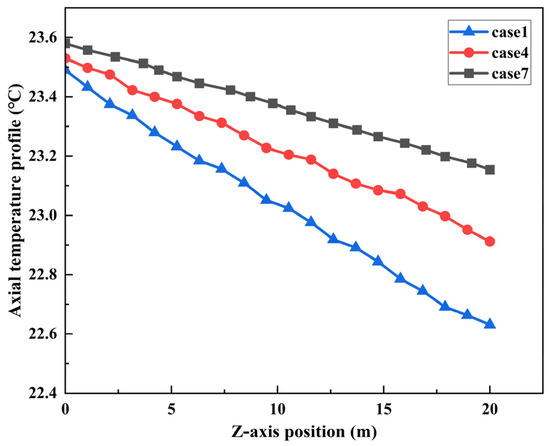
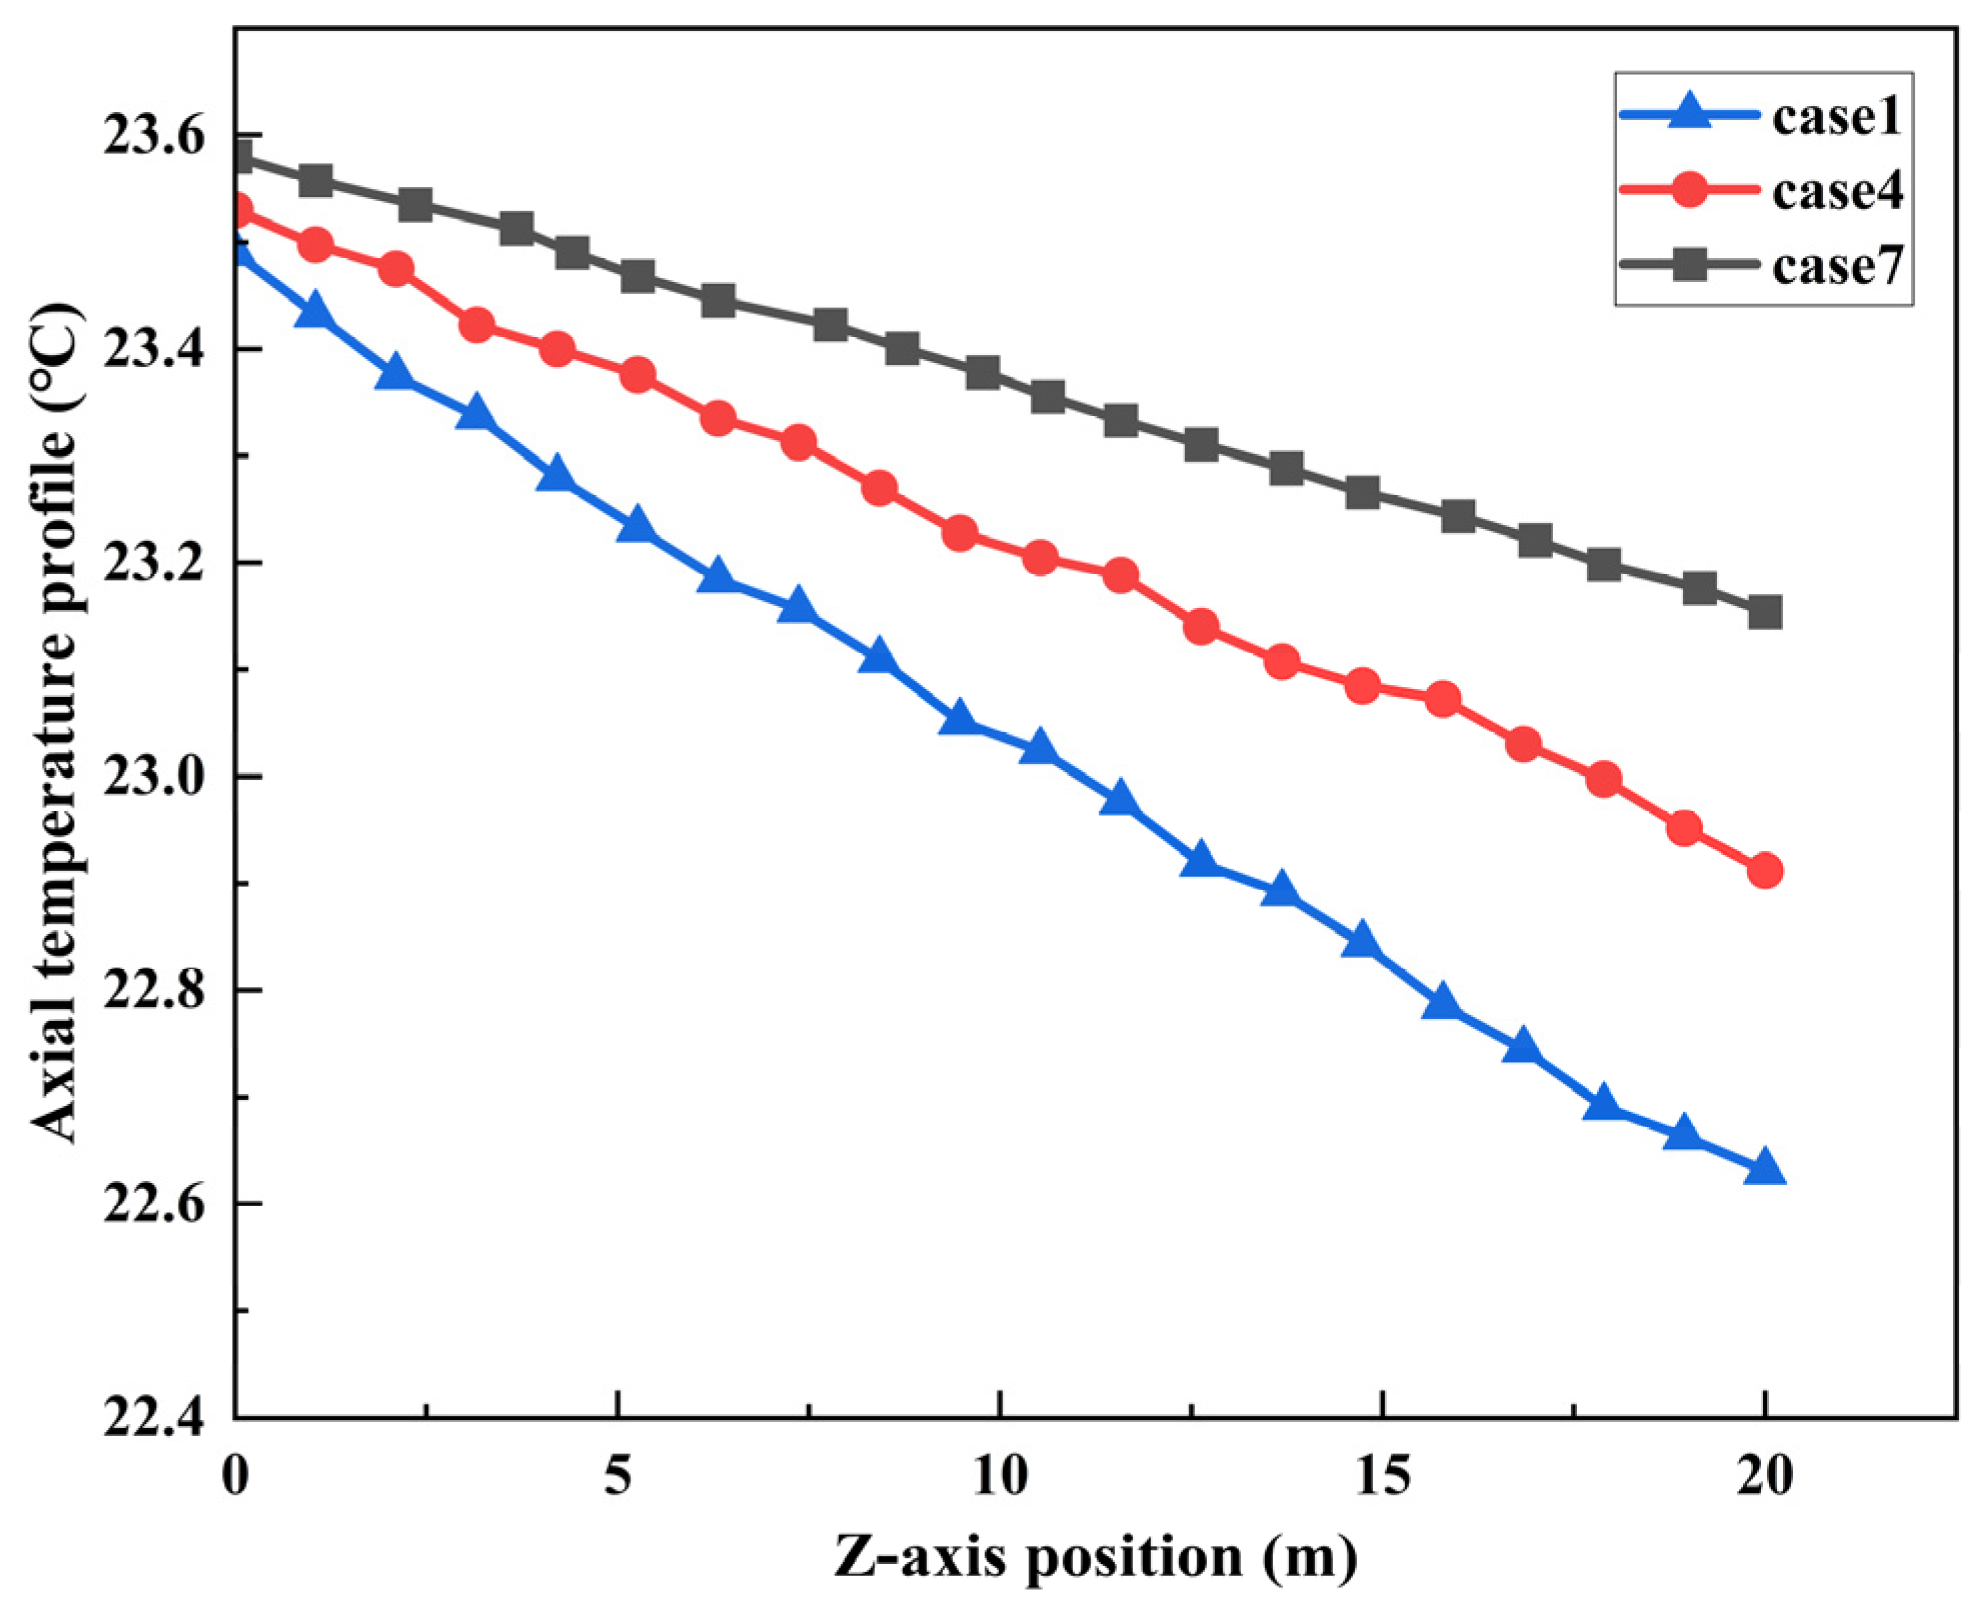
Taking cases 1, 4, and 7 as examples, the temperature drop curves of natural gas hydrate at different flow rates are calculated, as shown in Figure 10. It can be seen from the diagram that when other conditions remain unchanged, with the increase in natural gas production in gas wells, the velocity of hydrate in the composite insulated pipe will also increase. The convective heat transfer coefficient between the hydrate and the inner wall of the pipe will increase, resulting in a decrease in heat transfer between the two, because when the flow rate increases, the residence time of the fluid in the pipe becomes shorter, and the heat absorbed or released by the unit mass fluid decreases. The increase in the mass flow rate (enthalpy increase effect) exceeds the influence of the convective heat transfer coefficient, resulting in a decrease in the overall temperature drop of the fluid. Therefore, with the increase in hydrate velocity, the decrease in temperature along the hydrate is less significant.
Figure 10.
Temperature drops curves of natural gas hydrate at different flow rates.
6.2. The Influence of Formation Environment Temperature on Hydrate Heat Transfer
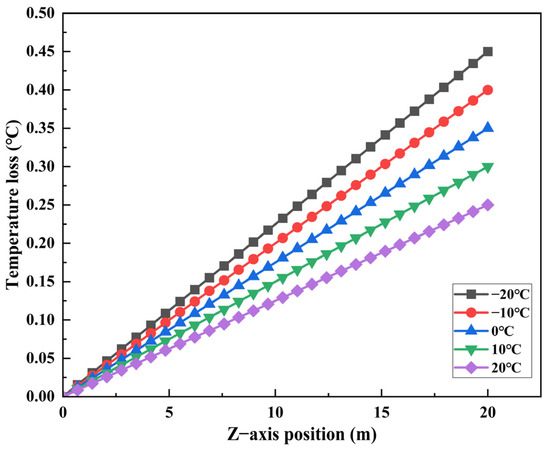
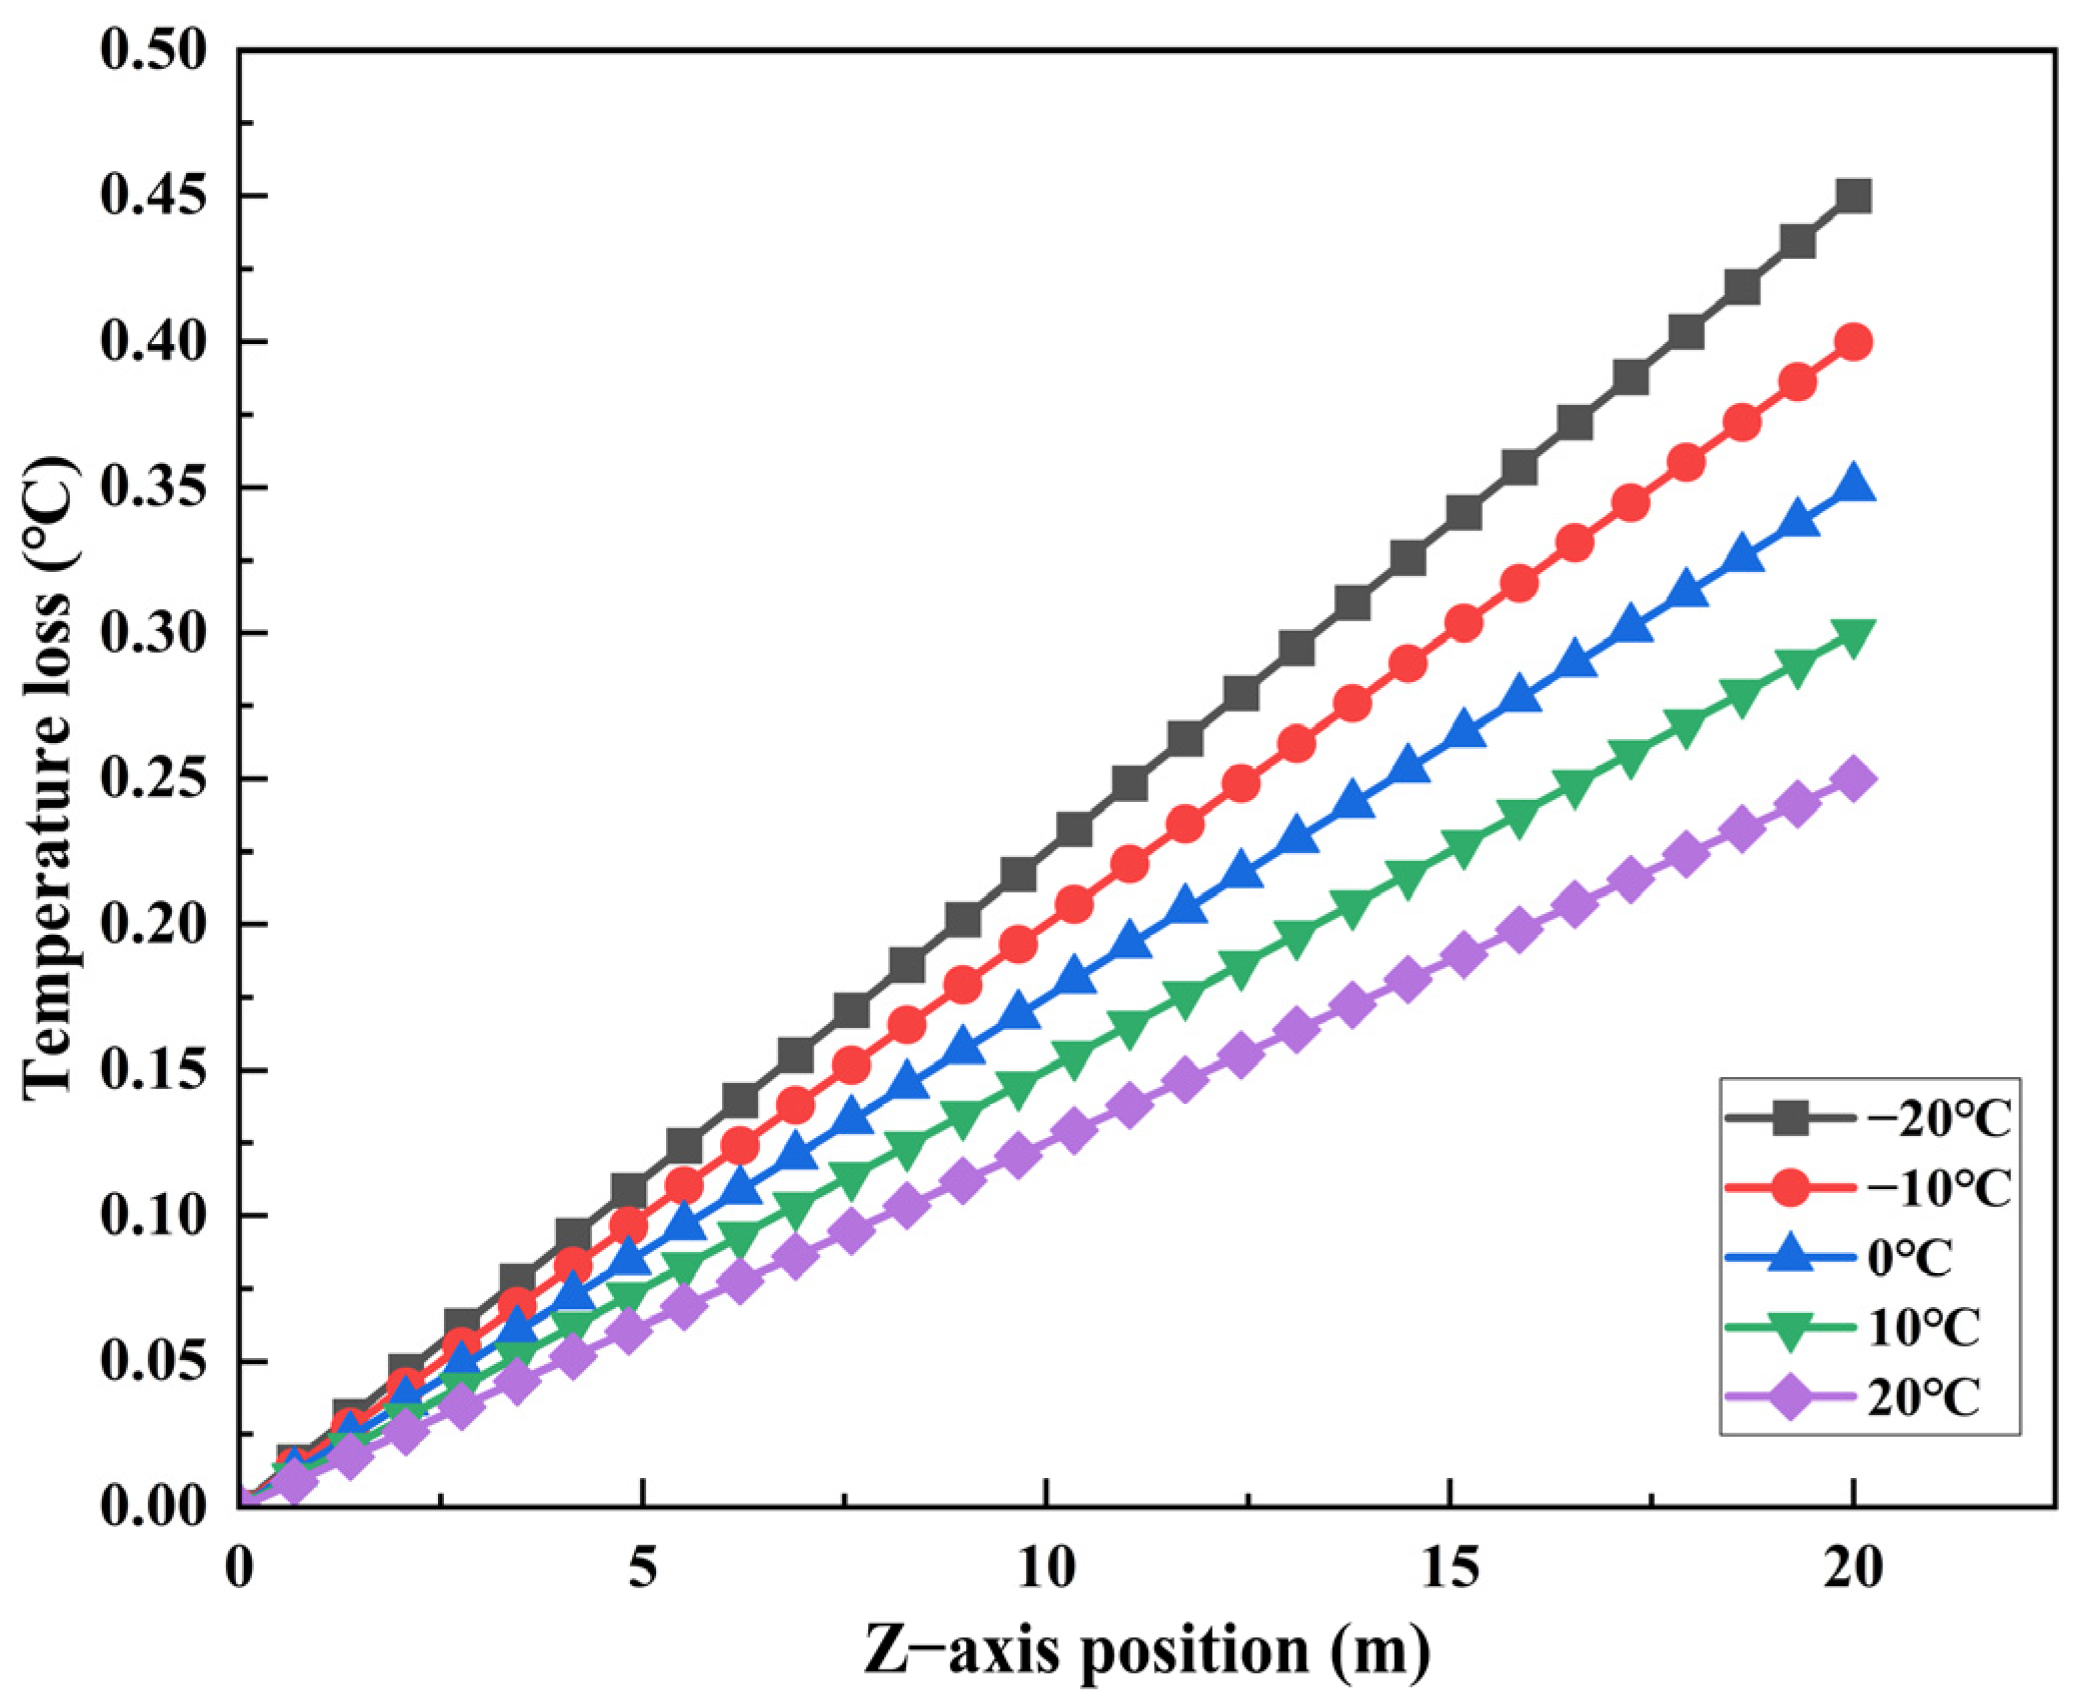
Taking case 1 working condition as an example, other conditions remain unchanged, and the wellhead temperatures of the simulated surface environment of the Sulige gas field are −20 °C, −10 °C, 0 °C, 10 °C, and 20 °C, respectively. The calculated temperature drop curve for natural gas hydrate is shown in Figure 11.
Figure 11.
Temperature drop curves of natural gas hydrate at different ambient temperatures.
As shown in Figure 11, the ambient temperature of the formation significantly affects the hydrate temperature drop in the heat-insulation tube. When other conditions remain unchanged, as the formation’s ambient temperature increases, the temperature loss of the natural gas hydrate in the tube decreases, and the hydrate temperature at the wellhead is higher, which is because at high temperatures, the temperature difference between the hydrate in the tube and the formation is slight, and heat conduction between the two is also negligible, so the temperature change is small. The lower ambient temperature of the formation will cause a significant temperature difference between the hydrate and the surrounding environment. This large temperature gradient improves heat transfer efficiency, resulting in a greater temperature drop during hydrate flow.
6.3. Effect of Thermal Conductivity on Heat Transfer of Hydrate
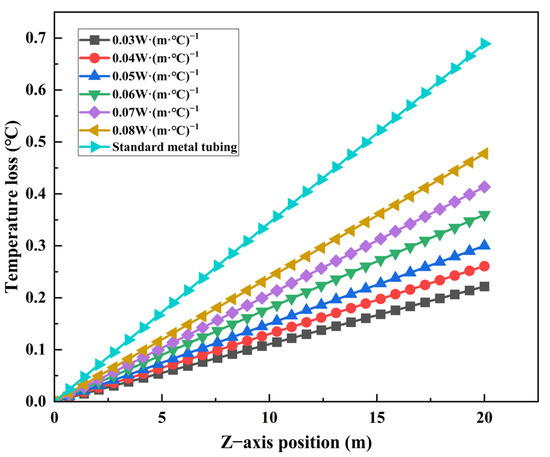
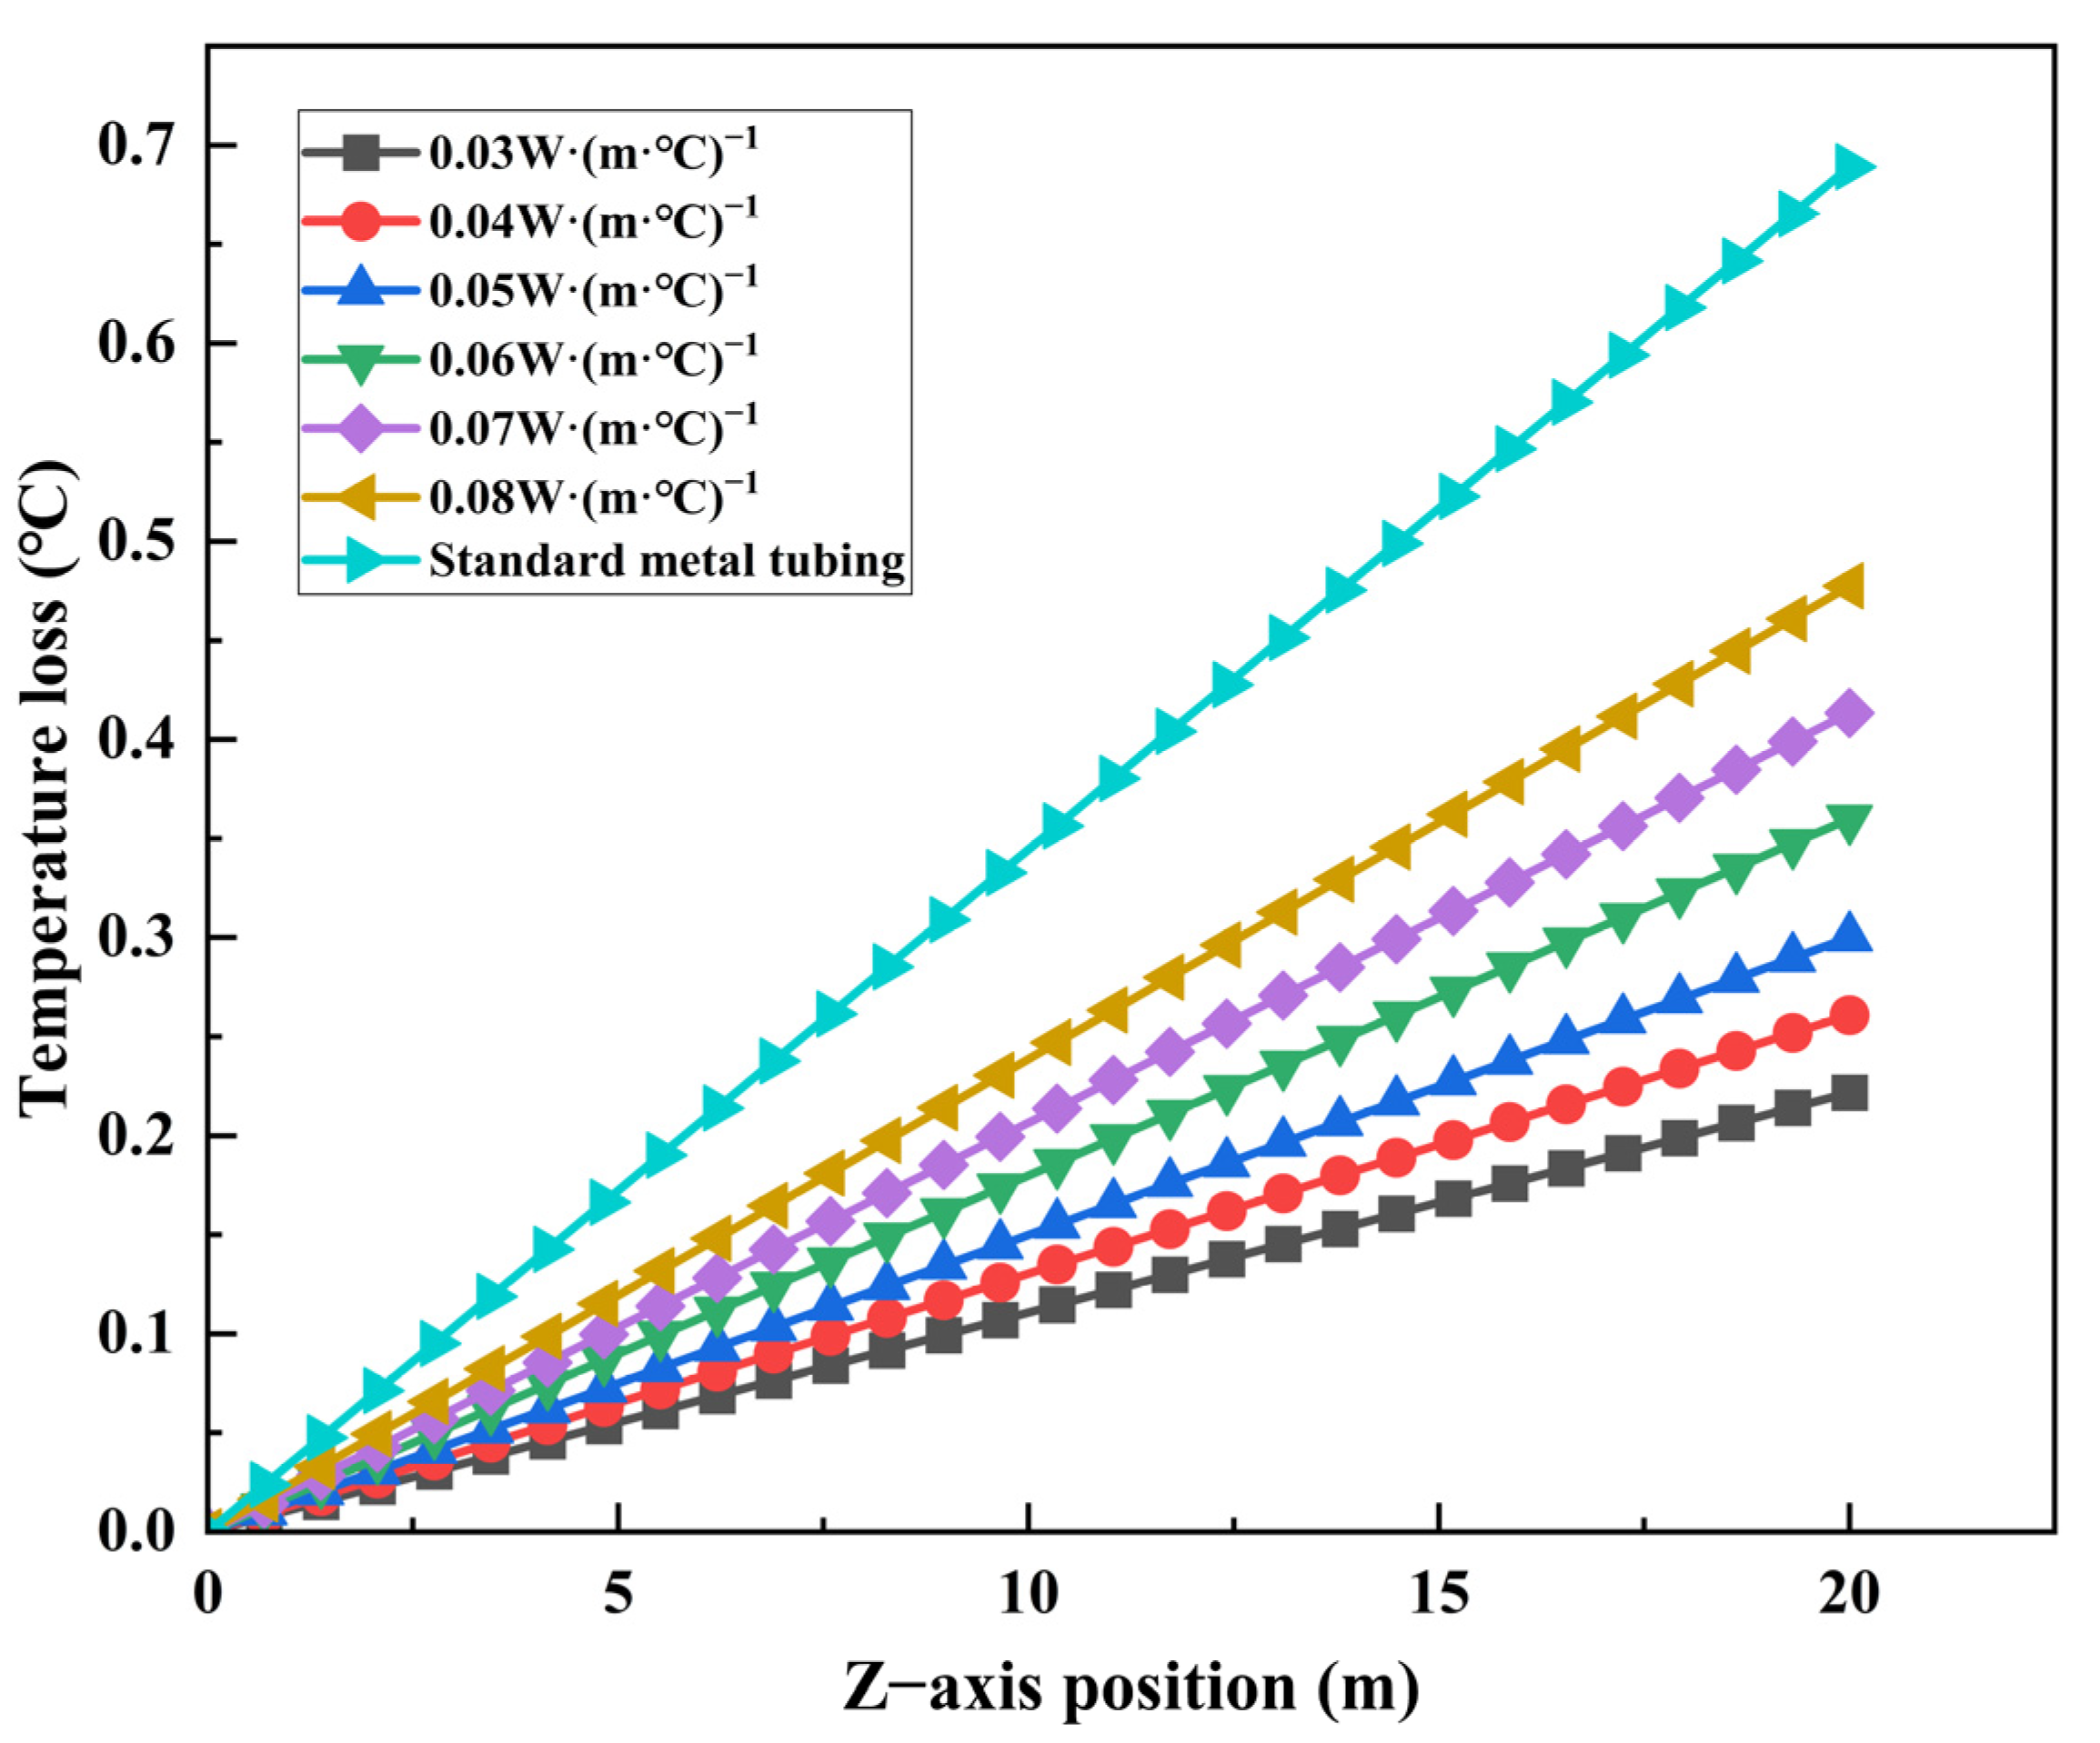
Taking case 1 working condition as an example, other conditions remain unchanged: the simulated wellhead environment temperature is 10 °C, and the thermal conductivity of the composite insulation pipe is varied. The temperature loss of the natural gas hydrate during the flow along the 20 m composite insulation pipe is analyzed as shown in Figure 12. It can be seen that the temperature loss of natural gas hydrate in the flow process of the composite insulation tube increases with the increase in the thermal conductivity of the composite insulation tube, and the two are approximately linear, which is because, with increased thermal conductivity, convective heat transfer and heat conduction between the hydrate and the inner wall of the composite tube will also increase, resulting in greater temperature loss during flow. The thermal conductivity of typical metal tubing, in comparison to composite insulation tubing, is superior, resulting in greater temperature loss of the hydrate along the pipeline.
Figure 12.
Temperature loss of natural gas hydrates under different thermal conductivities.
7. Conclusions
In this paper, the gas–solid two-phase flow DPM model, the turbulent RNG k-ε model, and the hydrate particle aggregation population balance model are used to simulate the working conditions of the Sulige gas well. The flow and heat transfer characteristics of natural gas hydrate in the vertical tube of the composite insulation tube are studied, and the following conclusions are drawn:
- (1)
- In the developed composite insulated pipe, when the daily output of natural gas is constant, with the increase in hydrate volume fraction, hydrates will obviously accumulate near the pipe wall. When natural gas production decreases, i.e., under low inlet flow rate, hydrate deposition is easier, and the local concentration gradient is larger, whereas under high inlet flow rate, the hydrate concentration distribution is more uniform.
- (2)
- The pressure of the hydrate decreases gradually during the flow of the composite insulated pipe, and the pressure distribution at each section shows a distribution law of high center and decreasing gradually to the periphery. The flow rate is an important factor affecting the pressure distribution. As the flow rate increases, the unit pressure drop across the hydrate increases significantly, while the hydrate volume fraction has little effect on the pressure.
- (3)
- The flow rate of the hydrate substantially influences its heat transmission properties. As natural gas production rises, the hydrate flow rate increases, the convective heat transfer coefficient between the hydrate and the pipeline’s inner wall increases while the temperature loss along the hydrate decreases, resulting in an increased outlet temperature.
- (4)
- By analyzing the ambient temperature change in the Sulige gas field and the temperature change in the hydrate along the insulated pipe, it is observed that with the increase in the ambient temperature of the formation, the temperature loss of natural gas hydrate along the composite insulated pipe decreases. The riser outlet temperature also increases. However, the degree of change is not significant because the composite-insulated pipe has lower thermal conductivity than the conventional metal pipe, thereby reducing heat transfer between the hydrate and the pipe. By reducing the thermal conductivity of the composite-insulated pipe, the temperature loss during hydrate flow in the pipeline can be further reduced, which is beneficial to the exploitation of terrestrial natural gas wells.
Author Contributions
Research and conception, W.T. and W.X.; modeling and computational simulation, W.T. and W.X.; validation, W.X.; writing—original draft preparation, W.T. and W.X.; writing—review and editing, X.Y., Y.L. and Y.W.; supervision, C.Y.; funding acquisition, W.T. and W.X.; data and resources, X.W. and X.Y. All authors have read and agreed to the published version of the manuscript.
Funding
This research was funded by the Open Project of National Engineering Laboratory for Exploration and Development of Low-Permeability Oil and Gas Fields: Integrated Technology Process of “Wellbore Insulation-Hydrate Prevention-Wellhead Throttling” (Grant Number KFKT2024-13, CQYT-CQYQY-2024-JS-1506), and the Oil and Gas National Science and Technology Major Project “Intelligent Sensing Wellbore and Efficient Artificial Lifting/Drainage Equipment for Oil and Gas Wells-Key Technologies and Equipment for Efficient Intelligent Oil and Gas Production Engineering” (No. 2024ZD1406503).
Data Availability Statement
The original contributions presented in this study are included in the article. Further inquiries can be directed to the corresponding author.
Acknowledgments
Thanks to the the Oil and Gas National Engineering Laboratory for Exploration and Development of Low-Permeability Oil and Gas Fields, and National Science and Technology Major Project (No. 2024ZD1406503) for supporting this work.
Conflicts of Interest
Authors Wei Tian, Xiongxiong Wang, Changhao Yan, Xudong Yang, Yanbin Li, and Yaming Wei were employed by the PetroChina Changqing Oilfield Company. The remaining author declares that the research was conducted in the absence of any commercial or financial relationships that could be construed as a potential conflict of interest.
References
- Makogon, Y.F.; Holditch, S.A.; Makogon, T.Y. Natural gas-hydrates—A potential energy source for the 21st Century. J. Pet. Sci. Eng. 2007, 56, 14–31. [Google Scholar] [CrossRef] [Scilit]
- Liu, S.Q.; Tian, W.; Yang, X.D.; Xiao, S.Q. Downhole Throttling Technology and Practice; Petroleum Industry Press: Beijing, China, 2024. [Google Scholar]
- He, J.C.; Yu, H.J.; He, G.H.; Zhang, J.; Li, Y. Natural gas development prospects in changqing province gas area of the ordos basin. Nat. Gas Ind. 2021, 41, 23–33. [Google Scholar]
- Yu, H.J.; Wang, Z.J.; Li, J.B.; Zhu, Y.J. Key technological progress and break through direction for the development of complex tight gas reservoirs in changqing gas field, ordos basin. Acta Petrolei Sinica 2023, 44, 698–712. [Google Scholar] [CrossRef]
- Tian, W.; Wang, X.W.; Li, L.; Jia, Y.L. Drainage Gas Production Technology and Practice; Petroleum Industry Press: Beijing, China, 2023. [Google Scholar]
- Xi, W.K.; Guo, Z.Y.; Zhang, Z.H.; Cheng, Q.Q.; Zhao, B. Prediction and Case Study of Natural Gas Hydrate Formation in Composite Insulated Pipelines. Petrochem. Technol. 2025, 32, 150–152. [Google Scholar]
- Neto, E.T.; Rahman, M.A.; Imtiaz, S.; Ahmed, S. Numerical Flow Analysis of Hydrate Formation in Offshore Pipelines Using Computational Fluid Dynamics (CFD). International Conference on Offshore Mechanics and Arctic Engineering. Am. Soc. Mech. Eng. 2016, 49996, V008T11A007. [Google Scholar]
- Balakin, B.; Hoffmann, A.; Kosinski, P. Experimental study and computational fluid dynamics modeling of deposition of hydrate particles in a pipeline with turbulent water flow. Chem. Eng. Sci. 2011, 66, 755–765. [Google Scholar] [CrossRef] [Scilit]
- Balakin, V.B.; Kosinska, A.; Kutsenko, V.K. Pressure drop in hydrate slurries: Rheology, granulometry and high water cut. Chem. Eng. Sci. 2018, 190, 77–85. [Google Scholar] [CrossRef] [Scilit]
- Zhang, N.; Li, S.; Chen, L.; Guo, Y.; Liu, L. Study of gas-liquid two-phase flow characteristics in hydrate-bearing sediments. Energy 2024, 290, 130215. [Google Scholar] [CrossRef] [Scilit]
- Xu, H.L.; Wei, C.; Hu, W.G. Hydraulic transport flow law of natural gas hydrate pipeline under marine dynamic environment. Eng. Appl. Comput. Fluid Mech. 2020, 14, 507–521. [Google Scholar] [CrossRef] [Scilit]
- Zhang, G.; Li, J.; Yang, H.W.; Liu, G.; Pang, Q.; Wu, T.; Huang, H. Simulation research on solid fluidization exploitation of deepwater superficial layer natural gas hydrate reservoirs based on double-layer continuous pipe. J. Nat. Gas Sci. Eng. 2022, 108, 104828. [Google Scholar] [CrossRef] [Scilit]
- Ryosuke, E.; Tomoya, S.; Tatsuya, H.; Arai, Y.; Komatsu, H.; Yamagiwa, K.; Tajima, H. Flow characteristics of hydrofluorocarbon gas hydrate slurries under various conditions in a loop tube. Chem. Eng. Sci. 2021, 246, 116974. [Google Scholar] [CrossRef] [Scilit]
- Li, C.; Han, G.; Zhong, H.; Zhang, C.; Zhang, R.; Choe, J.; Chen, X.; Cao, X.; Bian, J. Flow and Heat Transfer Characteristics of Natural Gas Hydrate Riser Transportation. Energy Eng. 2025, 122, 1287–1309. [Google Scholar] [CrossRef] [Scilit]
- Shao, D.; Zhang, C.; Rao, Y.; Wang, S.; Li, F.; Yu, M.; Gong, Z. Numerical Simulation Study on the Effect of Bend Angle on the Flow Characteristics of Natural Gas Hydrate Particles. Energy Sci. Eng. 2025, 13, 512–529. [Google Scholar] [CrossRef] [Scilit]
- Chen, W.; Xu, H.L.; Kong, W.Y.; Yang, F.Q. Study on three-phase flow characteristics of natural gas hydrate pipeline transmission. Ocean Eng. 2020, 214, 107727. [Google Scholar] [CrossRef] [Scilit]
- Liang, W.; Lou, M. Analysis of Multiphase Flow Characteristics by Considering Hydrate Phase Transition and Sand Production in a Deepwater Riser. Proc. Inst. Civ. Eng.-Energy 2020, 174, 13–23. [Google Scholar] [CrossRef] [Scilit]
- Liu, Y.; Tang, X.; Hu, K. Study on flow characteristics of natural gas hydrate slurry with decomposition in vertical tube. Chemistry 2018, 81, 267–273. [Google Scholar] [CrossRef]
- Berrouk, S.A.; Jiang, P.; Safiyullah, F.; Basha, M. CFD modelling of hydrate slurry flow in a pipeline based on Euler-Euler approach. Prog. Comput. Fluid Dyn. Int. J. 2020, 20, 156–168. [Google Scholar] [CrossRef] [Scilit]
- Umuteme, O.M.; Hossain, M.; Karnik, A. Prediction of Gas-Water Multiphase Flow Behaviour and Hydrates Severity in Gas-Dominant Subsea Pipelin. Preprints, 2024; submitted. [CrossRef] [Scilit]
- Monday, O.U.; Sheikh, I.Z.; Mamdud, H.; Karnik, A. An improved computational fluid dynamics (CFD) model for predicting hydrate deposition rate and wall shear stress in offshore gas-dominated pipeline. J. Nat. Gas Sci. Eng. 2022, 107, 104800. [Google Scholar] [CrossRef] [Scilit]
- Rao, Y.C.; Li, L.J.; Wang, S.L.; Zhao, S.; Zhou, S. Numerical Simulation Study on Flow Laws and Heat Transfer of Gas Hydrate in the Spiral Flow Pipeline with Long Twisted Band. Entropy 2021, 23, 489. [Google Scholar] [CrossRef] [Scilit]
- Bassani, L.C.; Barbuto, A.F.; Sum, K.A.; Morales, R.E. Modeling the effects of hydrate wall deposition on slug flow hydrodynamics and heat transfer. Appl. Therm. Eng. 2017, 114, 245–254. [Google Scholar] [CrossRef] [Scilit]
- Yao, S.; Li, Y.; Wang, W.; Song, J.; Jiang, K. Numerical simulation of hydrate slurry flow characteristics in vertical pipes based on population balance theory. Int. J. Oil Gas Coal Technol. 2020, 25, 319–339. [Google Scholar] [CrossRef] [Scilit]
- Yu, C.; Han, C.J.; Wang, L.; Jing, J.; Li, Y.; Wang, W.; Song, X. Numerical simulation of hydrate slurry flow behaviors with micron-sized sand in the transport pipe based on the population balance model. J. Mech. Sci. Technol. 2023, 37, 5159–5171. [Google Scholar] [CrossRef] [Scilit]
- Cao, X.W.; Yang, K.R.; Wang, H.G.; Bian, J. Gas–liquid–hydrate flow characteristics in vertical pipe considering bubble and particle coalescence and breakage. Chem. Eng. Sci. 2022, 252, 117249. [Google Scholar] [CrossRef] [Scilit]
- Song, G.C.; Li, Y.X.; Wang, W.C.; Shi, Z. Numerical simulation of hydrate particle size distribution and hydrate particle bedding in pipeline flowing systems. J. Dispers. Sci. Technol. 2020, 41, 1051–1064. [Google Scholar] [CrossRef] [Scilit]
- Liang, Y.; Ding, W.J. Study on internal and external layout of multilayer pipe insulation materials. Chem. Eng. 2019, 33, 19–21. [Google Scholar] [CrossRef]
- Wayoe, S.K.; Wayoe, R.D. Performance optimization of offshore production wells using pipesim simulation: A case study of horizon oilfield. Improv. Oil Gas Recovery 2025, 9, 1–25. [Google Scholar] [CrossRef] [Scilit]
- Wang, W.Y.; Zhu, W.; Li, M.Z. Gas-Liquid flow behavior in condensate gas wells under different development stages. Energies 2023, 16, 950. [Google Scholar] [CrossRef] [Scilit]
- Yang, Y.; Zang, W.W.; Han, X.S.; Mao, J.K. Numerical Investigation on Unsteady Pressure Oscillation of Gas-Solid Two-Phase Turbulent Flow. Trans. Nanjing Univ. Aeronaut. Astronaut. 2024, 41, 311–324. [Google Scholar] [CrossRef]
- Zhang, L.; Ding, S.; Zhao, Z.; Yang, J. Influence of ventilation structure on air flow distribution of large turbo-generator. AIP Conf. Proc. 2018, 1955, 030032. [Google Scholar] [CrossRef] [Scilit]
- Liu, Y.; Guan, C.T.; Zhao, Y.P.; Cui, Y.; Dong, G. Numerical simulation and PIV study of unsteady flow around hollow cube artificial reef with free water surface. Eng. Appl. Comput. Fluid Mech. 2012, 6, 527–540. [Google Scholar] [CrossRef] [Scilit]
- Gan, G. Prediction Of Turbulent Buoyant Flow Using An RNG A-ϵ MODEL. Numer. Heat Transf. Part A Appl. 2007, 33, 169–189. [Google Scholar] [CrossRef] [Scilit]
- Han, Z.; Reitz, R.D. Turbulence Modeling of Internal Combustion Engines Using RNG k-ε Models. Combust. Sci. Technol. 1995, 106, 267–295. [Google Scholar] [CrossRef] [Scilit]
- Wang, S.; Rao, Y.; Hao, C.; Yao, J.; Zhou, S. Numerical Simulation Study on the Influence of Twist Tape Parameters on Hydrate Particle Deposition. Processes 2023, 11, 1658. [Google Scholar] [CrossRef] [Scilit]
- Zhang, J.J.; Li, X.Y. Modeling Particle-Size Distribution Dynamics in a Flocculation System. AIChE J. 2003, 49, 1870–1882. [Google Scholar] [CrossRef] [Scilit]
- Camp, T.R.; Stein, P.C. Velocity gradients and internal work in fluid motion. J. Boston Soc. Civ. Eng. 1943, 30, 219–237. [Google Scholar]
- Saffman, P.G.; Turner, J.S. On the collision of drops in turbulent clouds. J. Fluid Mech. 1956, 1, 16–30. [Google Scholar] [CrossRef] [Scilit]
- Abrahamson, J. Collision rates of small particles in a vigorously turbulent fluid. Chem. Eng. Sci. 1975, 30, 1371–1379. [Google Scholar] [CrossRef] [Scilit]
- Javadpour, F.; Fisher, D.; Unsworth, M. Nanoscale gas flow in shale gas sediments. J. Can. Pet. Technol. 2007, 46, 55–61. [Google Scholar] [CrossRef] [Scilit]
- Kim, H.C.; Bishnoi, P.R.; Heidemann, R.A.; Rizvi, S.S.H. Kinetics of methane hydrate decomposition. Chem. Eng. Sci. 1987, 42, 1645–1653. [Google Scholar] [CrossRef] [Scilit]
- Keshtkar, M.; Eslami, M.; Jafarpur, K. A novel procedure for transient CFD modeling of basin solar stills: Coupling of species and energy equations. Desalination 2020, 481, 114350. [Google Scholar] [CrossRef] [Scilit]
- Balakin, B.V.; Pedersen, H.; Kilinc, Z.; Hoffmann, A.C.; Kosinski, P.; Høiland, S. Turbulent flow of freon R11 hydrate slurry. J. Pet. Sci. Eng. 2010, 70, 177–182. [Google Scholar] [CrossRef] [Scilit]



Disclaimer/Publisher’s Note: The statements, opinions and data contained in all publications are solely those of the individual author(s) and contributor(s) and not of MDPI and/or the editor(s). MDPI and/or the editor(s) disclaim responsibility for any injury to people or property resulting from any ideas, methods, instructions or products referred to in the content. |
© 2026 by the authors. Licensee MDPI, Basel, Switzerland. This article is an open access article distributed under the terms and conditions of the Creative Commons Attribution (CC BY) license.