


Abstract
Partial discharge (PD) is a major cause of insulation degradation in oil-immersed power equipment, and dissolved-gas analysis (DGA) is the principal chemical diagnostic tool for such faults; conventional DGA criteria, however, were developed for mineral oil and may not transfer directly to ester-based insulating liquids. The gas-generation characteristics of mineral oil (Kunlun KI50X), natural ester (FR3) and synthetic ester (MIDEL 7131) were investigated under four representative PD regimes: corona, surface, cavity and floating-electrode discharge, with insulating pressboard present; the corona configuration was tested additionally without pressboard, and all configurations were further examined under higher-energy spark discharge, on a closed-loop oil-circulation platform combining synchronized phase-resolved PD (PRPD) monitoring with automatic oil chromatography. Under moderate-energy PD, mineral oil produces mainly H2 together with the hydrocarbon gases CH4 and C2H2, whereas both esters preferentially liberate H2 and CO, reflecting their ester linkages; the presence of pressboard further elevates CO/CO2 through cellulose decomposition. Under intermittent sparking, the C2H2 and H2 production rates converge across the three fluids, indicating that molecular-structure effects diminish once repeated dielectric breakdown occurs. Within each PD mode, estimated cumulative discharge energy and cumulative dissolved-gas volume are linearly related, but this linearity deteriorates when data from different modes are pooled. Conventional mineral oil DGA schemes therefore cannot be applied uncritically to ester-filled apparatus; reliable fault diagnosis requires combined electrical (PRPD-based energy quantification) and oil-specific chemical (DGA) diagnostics.
1. Introduction
Partial discharge (PD) is widely recognized as one of the primary mechanisms of insulation degradation in oil-immersed power equipment. Sustained PD activity gradually erodes the dielectric integrity of the insulating liquid and the adjacent solid insulation (typically cellulose-based pressboard), ultimately leading to dielectric failure if left undetected. Dissolved-gas analysis (DGA) has long served as the principal chemical diagnostic technique for identifying the presence, type and severity of such electrical faults. By quantifying the concentrations of key gases—hydrogen (H2), methane (CH4), ethane (C2H6), ethylene (C2H4), acetylene (C2H2), carbon monoxide (CO) and carbon dioxide (CO2)—and applying established interpretation schemes (IEC ratios, Duval triangles, key-gas methods, etc.), operators can distinguish between low-energy PD, high-energy arcing and thermal faults [1,2].
The quantitative interpretation schemes in use today were largely formalized in the 1970s and have since been refined almost exclusively on the basis of mineral oil data [1,2]; mineral oils, composed predominantly of saturated hydrocarbons, produce characteristic gas mixtures in which H2, CH4 and C2H2 dominate under PD conditions [1,2]. In recent decades, however, natural ester (vegetable-oil-based) and synthetic ester fluids have gained increasing acceptance as environmentally preferable alternatives. Their higher flash and fire points, superior biodegradability and competitive dielectric performance make them attractive for both new installations and retrofills, particularly in environmentally sensitive or fire-risk locations, and commercial products such as FR3 (natural ester) and MIDEL 7131 (synthetic ester) are already in service in a growing number of power and distribution transformers [3,4,5].
Whether these mineral oil criteria can be transferred to ester liquids is open to question, because the two classes of fluids differ fundamentally in molecular structure: mineral oils are mixtures of saturated hydrocarbons, whereas natural esters consist primarily of triacylglycerols containing ester linkages and unsaturated fatty-acid chains, and synthetic esters are typically polyol esters [6,7,8]. Under electrical stress, the cleavage of the ester bonds favours the formation of carbon oxides (CO and CO2) in addition to hydrogen and hydrocarbons, so that the species and proportions of the gases generated under nominally identical discharge conditions differ markedly between the two classes of fluids. The uncritical application of mineral oil criteria to ester-filled transformers may therefore result in the misidentification of fault types or in an overestimation or underestimation of fault severity. With ester-filled transformers now deployed at scale in wind farms, rail-transit systems and urban distribution networks, systematic gas-generation data for ester liquids covering multiple discharge modes have become an urgent requirement. Although IEEE Std C57.155-2014 [9] and the forthcoming IEC 63585:2026 [10] have begun to address this need, the database supporting oil-specific DGA interpretation for ester-filled equipment is still far from complete.
A number of laboratory investigations have already highlighted these differences. Studies of surface and corona PD in natural esters have shown elevated production of H2 and C2H6, together with comparatively low C2H2 yields relative to mineral oil [7,8,11,12,13,14]. Under higher-energy spark or arc conditions the disparity in C2H2 generation tends to diminish, suggesting that plasma chemistry begins to dominate once dielectric breakdown occurs repeatedly [7]. Similar observations have been reported for synthetic esters, where CO often appears as a prominent secondary gas under moderate-energy PD [12,13,14,15]. Parallel work on oil–paper insulation has further demonstrated that cellulose decomposition contributes additional CO and CO2, thereby complicating the interpretation of carbon oxide ratios [16,17,18]. Collectively, these findings indicate that conventional mineral oil DGA schemes—particularly those relying on absolute concentration thresholds or fixed hydrocarbon ratios—cannot be transferred uncritically to ester-filled equipment [6,10, 19].
Despite this growing body of evidence, systematic comparative data covering multiple representative PD regimes (corona, surface/creepage, cavity/void and floating-electrode discharge), together with higher-energy spark discharge, remain limited; moreover, few studies have quantified the relationship between estimated discharge energy (obtained from pulse-current measurements) and the volume of dissolved gas produced, or examined how that relationship varies across discharge modes and fluid types [9,20,21,22]. Such quantitative mode- and fluid-specific mappings are precisely what modern online monitoring systems are positioned to exploit: these systems already provide two synchronized data streams—PRPD discharge signals and dissolved-gas concentrations—so that, once an energy-to-gas mapping is established, the theoretical increment of dissolved gas can be estimated in real time from electrical measurements, and any systematic deviation of the measured gas levels from the electrically predicted values would provide an early warning of a transition in discharge mode or of the involvement of solid insulation. Establishing these mappings is therefore essential for correlating electrical and chemical diagnostics and for developing oil-specific interpretation rules.
The present work addresses these gaps. A closed-loop oil-circulation platform was constructed to enable controlled sampling of dissolved gases with simultaneous phase-resolved partial-discharge (PRPD) monitoring. Three commercially relevant insulating liquids—mineral oil (Kunlun KI50X), natural ester (FR3) and synthetic ester (MIDEL 7131)—were subjected to the four principal PD modes, all in the presence of oil-impregnated pressboard (the corona configuration being tested additionally without pressboard), as well as to intermittent spark discharge. Dissolved-gas concentrations were determined by automatic headspace chromatography, and discharge energy was calculated from calibrated pulse-current measurements. The resulting data set allows a direct comparison of gas-generation characteristics, an assessment of the contribution of cellulose decomposition to the measured carbon oxides through the corona with/without-pressboard pair, and an evaluation of the linearity between discharge energy and gas yield within and across PD regimes.
The main contributions of this work are threefold. Methodologically, a closed-loop experimental method combining synchronized discharge-energy accumulation and dissolved-gas measurement is established, in which the discharge energy is accumulated pulse by pulse from pulse-current measurements; this shifts the characterization of gas-generation behaviour from the time domain to the energy domain, so that the gas-production efficiencies of different fluids and discharge modes can be compared quantitatively on a unified energy basis. Mechanistically, a dual-factor control scheme governed by molecular structure and discharge energy is proposed and validated: under moderate-energy PD the molecular structure governs the gas speciation, with ester linkages opening a carbon oxide formation pathway while hydrocarbon chains follow the hydrocarbon-gas pathway, whereas once the discharge energy reaches the level of repeated dielectric breakdown, high-temperature plasma chemistry erases these structural differences and the C2H2 and H2 production rates of the three fluids converge; these observations are interpreted at the molecular level in terms of bond-energy sequences, possible effects of unsaturation and differences in gas solubility (Ostwald coefficients) among the fluids; the present gas measurements do not isolate radical-scavenging kinetics. In terms of application, the energy–gas linearity is shown to be strictly mode-dependent: it holds within any single discharge mode but deteriorates markedly when data from different modes are pooled. On this basis, a diagnostic workflow based on mode- and fluid-specific energy-to-gas coefficients is proposed that can be embedded directly in existing synchronized PRPD–DGA monitoring systems, providing a quantitative foundation for oil-specific DGA criteria for ester-filled apparatus.
2. Experimental Platform and Methods
2.1. Experimental Platform
2.1.1. Fluid Circulation Path
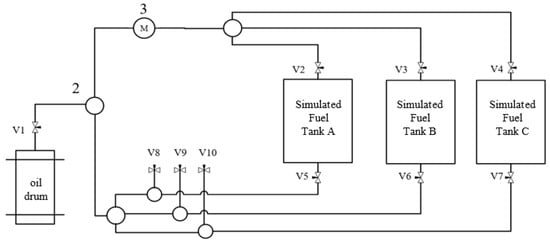
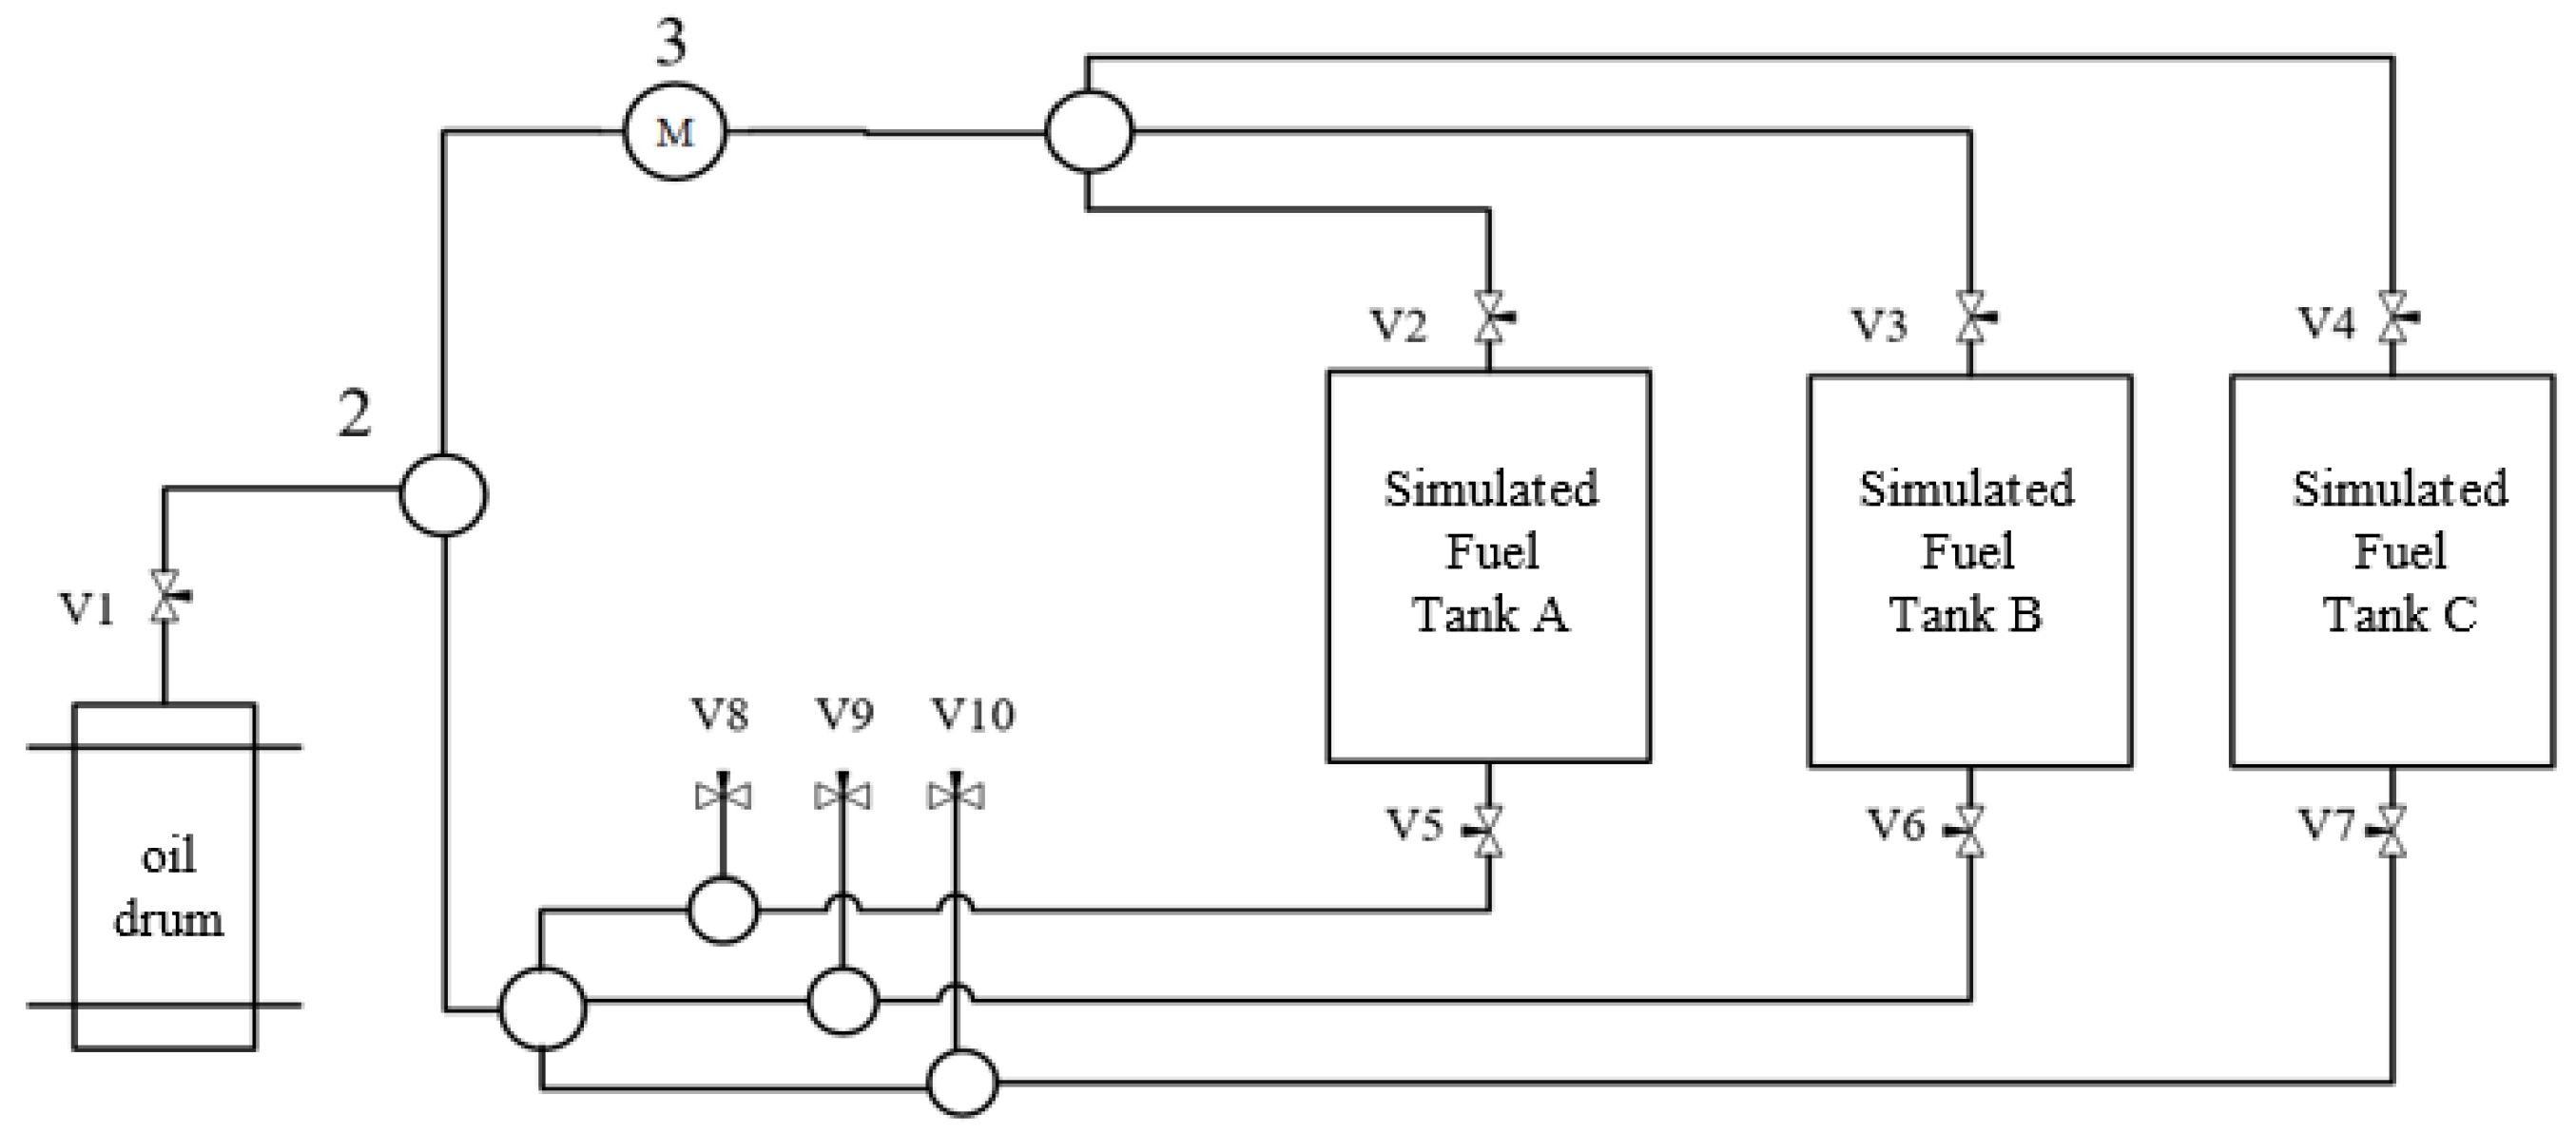
Under electrical stress, the characteristic gases generated in pure-oil gaps or oil–paper insulation dissolve into the insulating liquid. Because their distribution inside a tank is inherently non-uniform, a closed fluid pathway with multiple valves was designed to simulate forced oil circulation and accelerate gas diffusion, thereby yielding more representative dissolved-gas data (Figure 1). The pathway supports oil filling, individual-tank circulation, sampling and recovery simply by changing valve states. The oil flow rate was limited to 0.8 L min−1 (controlled by a PWM-modulated pump) to avoid any contribution of pump-induced shear to gas generation.
Figure 1.
Schematic diagram of the fluid circuit in the experimental platform. V1–V10, valve; 2, tee pipe and cross pipe; 3, oil pump.
2.1.2. Dissolved-Gas Detection System
Oil samples were withdrawn with airtight syringes and analysed on a fully automatic oil chromatography analyzer (ZF-301Q, Henan Zhongfen Instrument Co., Ltd., Shangqiu, China). The instrument performs automatic gas extraction, sample introduction and chromatographic separation, thereby eliminating operator-dependent variability and ensuring high accuracy and repeatability of the measured gas concentrations. For each chromatographic determination, a 40.0 mL oil sample was processed by mechanical shaking before chromatographic analysis. For the headspace calculation, oil-specific, dimensionless Ostwald coefficients at the 50 °C extraction equilibrium temperature were taken from Table 3 of GB/T 17623-2026 [23]. The 50 °C coefficient temperature refers to chromatographic extraction; the discharge experiments themselves were performed at 20 ± 1 °C. Using one oil’s coefficients for another would bias the calculated dissolved-gas concentrations.
For the seven reported gases, the coefficients are listed here in the order H2, CO, CO2, CH4, C2H4, C2H6 and C2H2: mineral oil (Kunlun KI50X, PetroChina Lubricant Company, Beijing, China), 0.06, 0.12, 0.92, 0.39, 1.46, 2.30 and 1.02; natural ester (FR3, Cargill, Incorporated, Plymouth, MN, USA, treated as soybean-based), 0.06, 0.11, 1.14, 0.33, 1.42, 1.77 and 1.88; and synthetic ester (MIDEL 7131, MIDEL & MIVOLT Fluids Ltd., Manchester, UK), 0.06, 0.13, 1.53, 0.36, 1.56, 1.82 and 3.29. These coefficients were used in the chromatographic gas-extraction correction; they are not gas diffusion coefficients or direct measures of gas-generation yield.
Before energisation, a baseline oil sample was analysed for each test. The chromatographic measurement background was approximately 0.1 μL·L−1. For gas i, the reported increase was ΔCi(t) = Ci(t) − Ci(0), where each measured concentration has units of μL·L−1. The plots show the measured dissolved-gas concentrations Ci(t). In each test, the data point at 0 h represents the initial concentration Ci(0) of gas i. The nonzero CO2 concentrations at 0 h represent CO2 already dissolved in the oil before discharge, with values varying among test samples. For conversion of the background-corrected dissolved-gas concentration increase to gas volume, the effective oil volume is 8 L: ΔVi(t) = ΔCi(t) × 8 L, yielding μL of gas. The 40.0 mL aliquot is used for chromatographic determination and is not the volume used in this gas-yield conversion. A concentration growth rate was calculated as ΔCi/Δt and has units of μL·L−1·h−1. The initial dissolved-gas content of the oils was reduced by the degassing protocol described below.
2.1.3. Partial-Discharge Simulation Models and Electrode Design
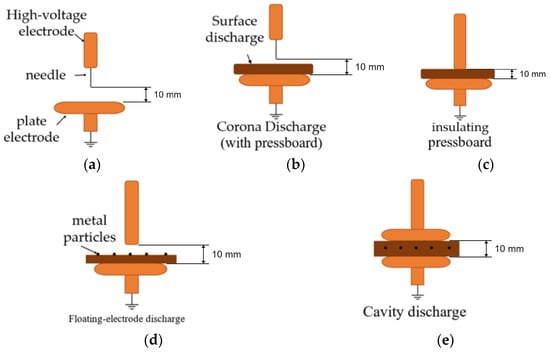
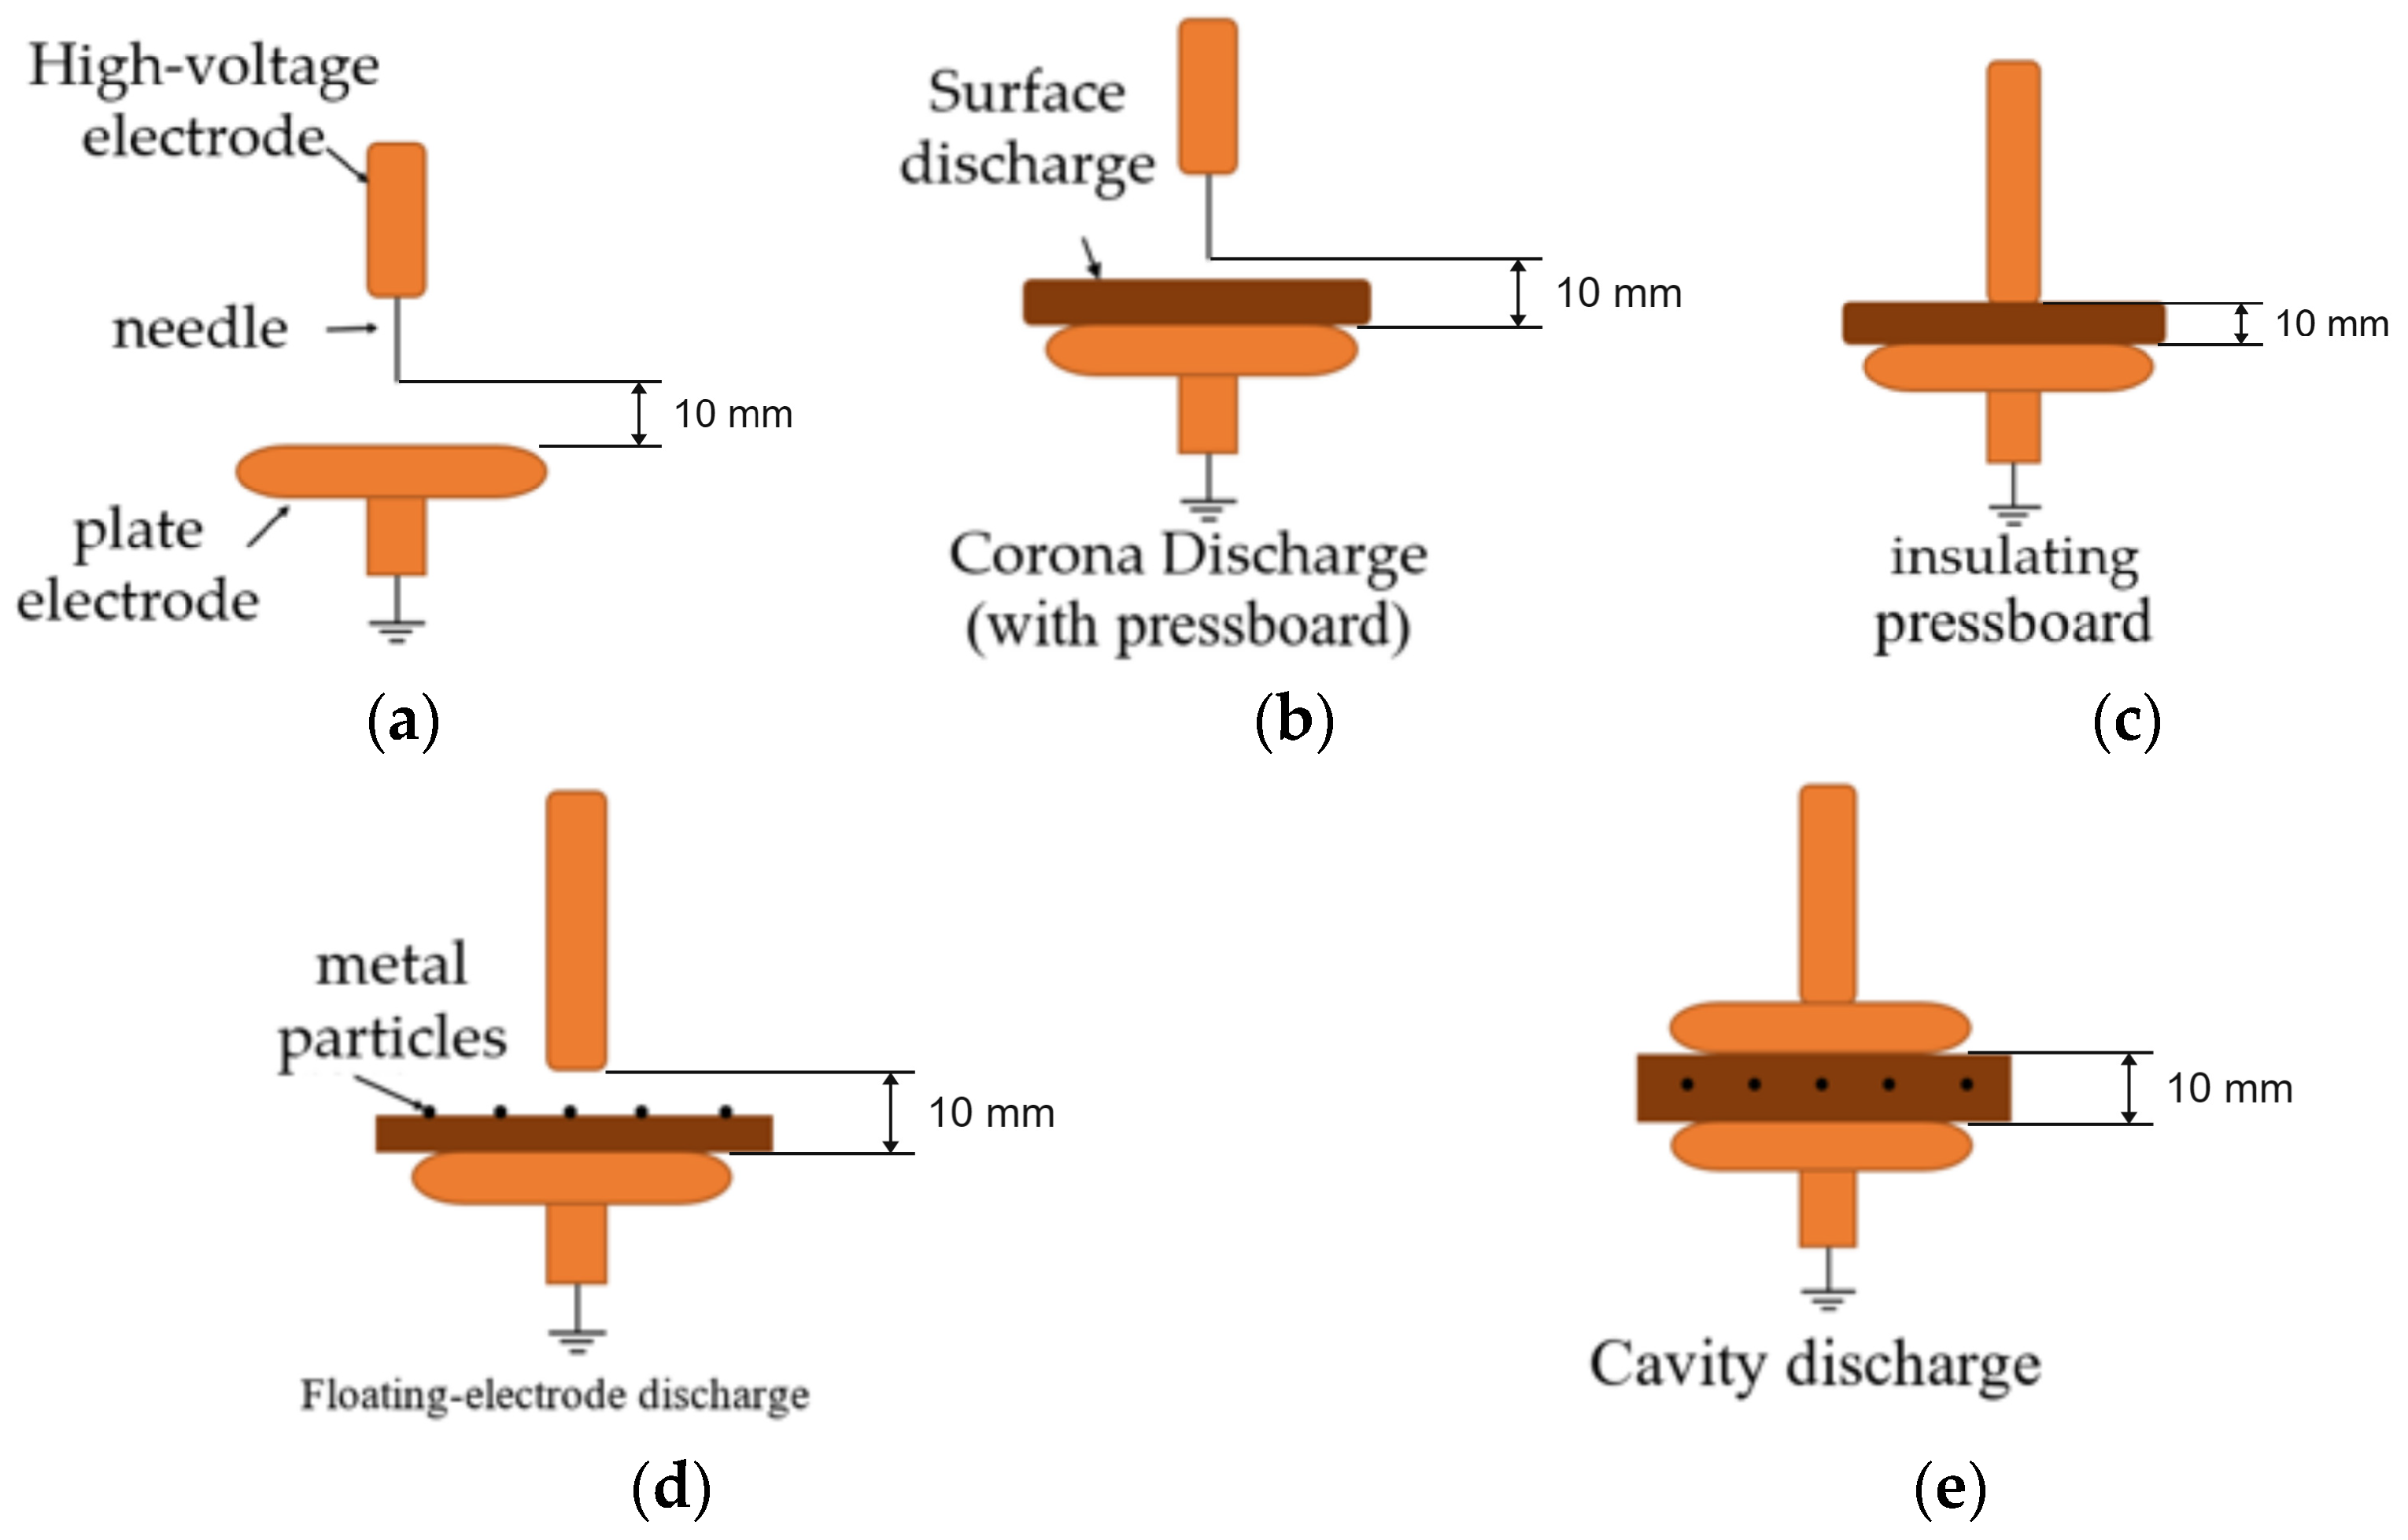
The defects that initiate partial discharge inside a transformer take many forms, including gas bubbles in the oil, cavities and voids within the solid insulation, sharp burrs on metallic structures, floating-potential bodies formed by contact failure, and surface flashover along the insulation paper. Such defects occur predominantly in oil gaps and gas cavities, at the surface of solid insulation and around floating metal, and their electric-field characteristics span the range from strongly non-uniform fields (around burr tips and floating bodies) to weakly non-uniform or quasi-uniform fields (in oil and gas gaps). To reproduce these typical scenarios under controlled laboratory conditions, four PD simulation models—corona, surface, cavity and floating-electrode discharge—were constructed according to the initiation mechanism and typical location of each discharge type (Figure 2).
Figure 2.
Schematic diagrams of the electrode configurations of the four PD simulation models. (a) Corona discharge without pressboard; (b) corona discharge with pressboard; (c) surface discharge; (d) floating-electrode discharge; (e) cavity discharge.
The models are assembled from three basic electrode configurations—needle, rod and plane—selected because together they cover the full spectrum of field non-uniformity. The needle electrode (φ 0.05 mm × 40 mm) has an extremely small tip radius and establishes a strongly non-uniform field around the tip at comparatively low voltage, simulating corona discharge induced by metallic burrs. The rod electrode (φ 2 mm × 50 mm) exhibits an intermediate degree of field non-uniformity at its end and provides the field configuration required by the surface and cavity models. The plane electrode (φ 30 mm × 24 mm) provides a nearly uniform field distribution and serves as the grounded plane, representing large-area grounded structures such as the tank wall and the core. Combined in this way, a single electrode system covers the continuous range from strongly non-uniform to quasi-uniform fields and reproduces all four typical PD defects of a transformer. All electrodes were machined from brass, which offers excellent electrical conductivity, is easy to machine and polish with high precision, resists electrical erosion and can be repeatedly re-faced, so that the electrode geometry remains consistent across experiments and the repeatability of the discharges—and hence the comparability of the data—is maintained. The electrode dimensions comply with IEC 60243 [24].
The four models were constructed as follows. The corona model uses a needle–plane arrangement and was tested both without and with oil-impregnated pressboard. In the surface model, the end of the rod electrode is in direct contact with oil-impregnated pressboard resting on the plane electrode, forcing the discharge to develop along the pressboard surface. In the cavity model, a void is pre-formed between layers of oil-impregnated pressboard to simulate a gas cavity inside the solid insulation. In the floating model, a steel sphere 1 mm in diameter is placed between the electrodes to simulate a floating-potential body formed by contact failure. The high-voltage electrode is mounted on a micrometer head, allowing the electrode gap to be adjusted precisely. For the sustained-discharge configurations, the nominal electrode setting was 10 mm. In the rod-based surface and cavity models, pressboard occupies the interelectrode region; hence, 10 mm does not represent an unobstructed oil gap. In the surface model the rod contacts the pressboard, as described above. For spark discharge, the needle–plane gap was reduced to 2 mm. The cavity model contained a cylindrical void of diameter 3 mm and depth 1.5 mm between layers of oil-impregnated pressboard. The pressboard thickness was 1.5 mm. All electrodes were machined from brass, and the electrode dimensions comply with IEC 60243. The pulse-current measuring system, calibrated with an XD51J calibrator (CT6800, Hangzhou High Voltage Technology Co., Ltd., Hangzhou, China), has a detection threshold of 5 pC, which was the threshold applied throughout.
The main oil tank has an effective volume of 8 L and two connecting channels in its side wall, through which the electrodes pass the tank wall and are connected to the high-voltage lead. The tanks were completely filled with oil so that no gas headspace remained above the oil surface: any gas phase above the oil would allow the dissolved gases generated by the discharges to partition into it, and the measured dissolved-gas concentrations would then no longer represent the true gas production. The gas-tightness of the tanks was verified in the pre-experiments, and leakage over typical test durations (a few hours) was negligible. All tests were performed at 20 ± 1 °C in order to exclude the influence of temperature on gas solubility (the Ostwald coefficients vary with temperature) and on the gas-production rates. Three structurally identical main tanks were operated simultaneously under identical electrical conditions. Each reported gas concentration is the mean of the three tank-level values obtained at the same elapsed time, the spread among the three tanks being within about 5%. Two syringes of oil were drawn at every sampling point and their gas concentrations compared; when the two agreed they were averaged, and when they did not the sampling was repeated. This parallel arrangement was adopted to reduce the scatter caused by the stochastic nature of partial discharge; it is not, however, a repetition of the test campaign, since the three tanks are parallel measurements of the same gas-generation process rather than independent runs at different times or with freshly prepared oil. The three physically separate tanks thus provide concurrent observations of within-campaign consistency; values were averaged only after agreement was checked, and discrepant samples were collected again.
2.2. Materials and Sample Preparation
2.2.1. Sample Preparation
Three insulating liquids were examined: mineral oil (Kunlun KI50X), natural ester (FR3) and synthetic ester (MIDEL 7131). The oils were vacuum-filtered at 80 °C and 0.01 MPa and held under the same conditions for 24 h, yielding moisture ≤ 12 ppm, total gas content ≤ 1% and AC breakdown voltage ≥ 75 kV (GB/T 7595-2017 [25]).
Insulating pressboard was dried at 105 °C/1 kPa for 24 h and vacuum-impregnated with the respective oil at 90 °C/1 kPa for a further 24 h.
Because esters readily generate C2H6 and H2 during thermal treatment, an optimized degassing protocol was developed: 72 h of stirred vacuum degassing at 0.01 MPa with periodic re-evacuation, followed by nitrogen blanketing. Residual gas levels were thereby reduced to values acceptable for the subsequent PD tests.
2.2.2. Experimental Procedure
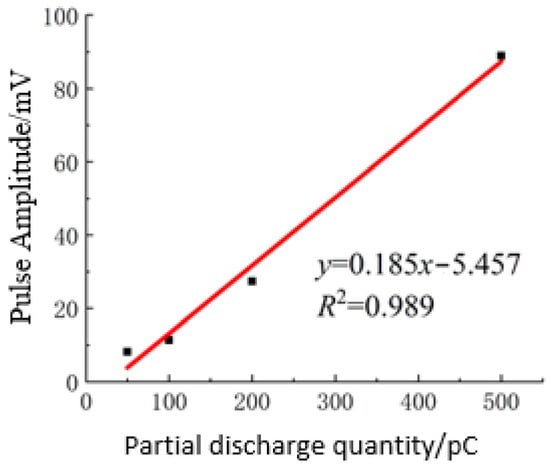
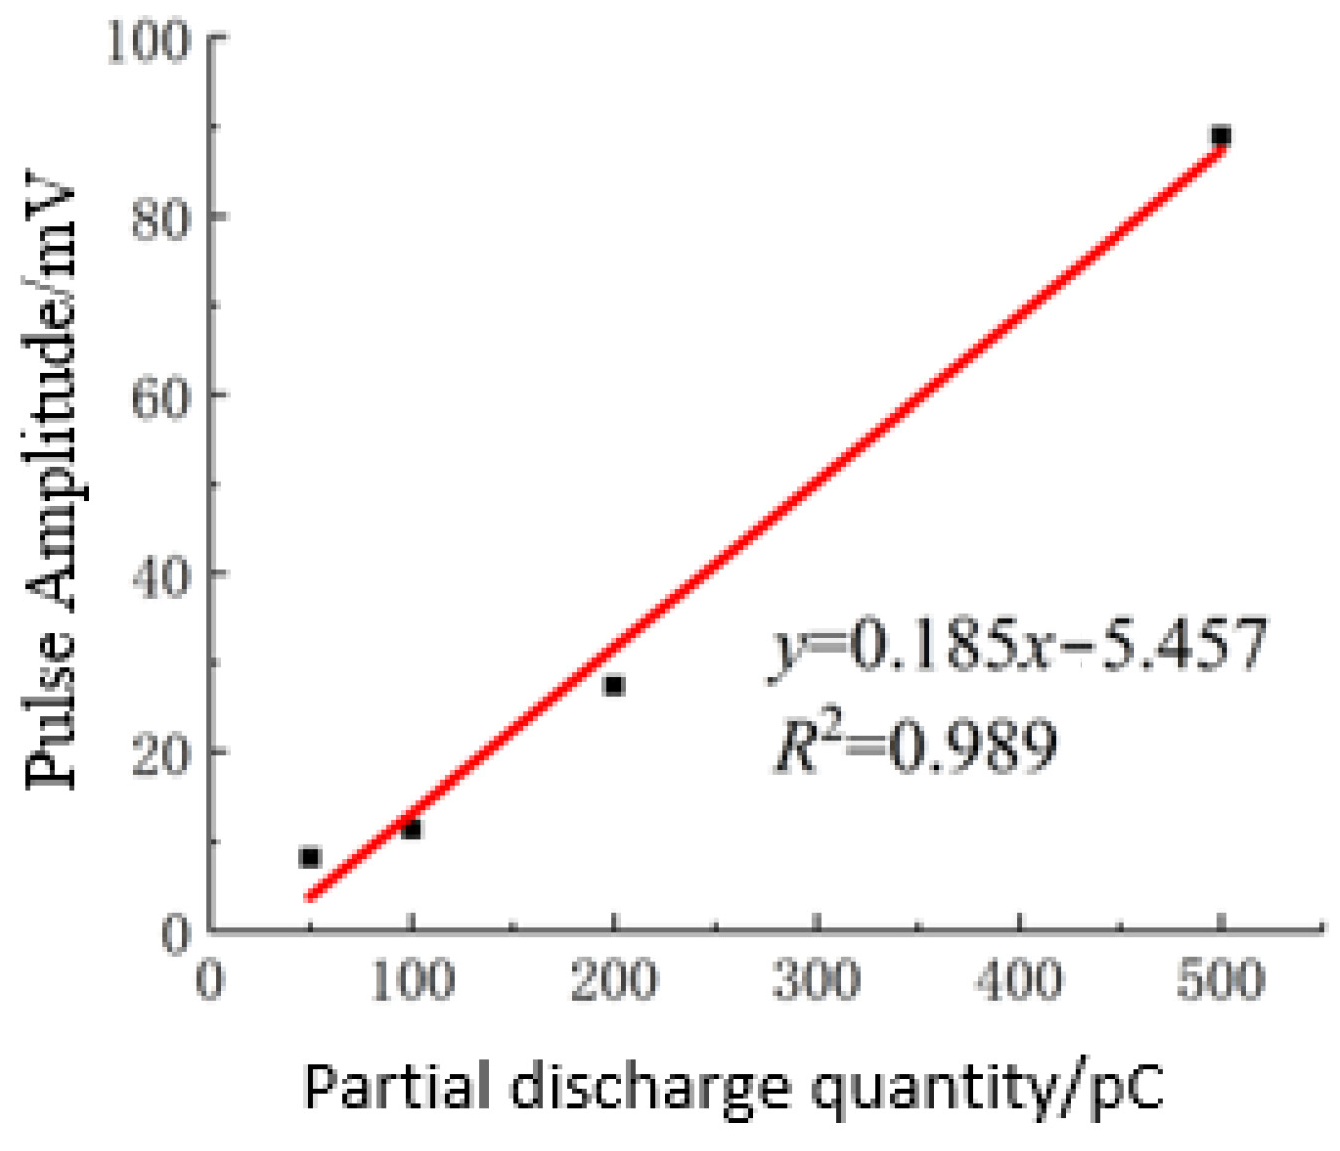
The partial-discharge inception voltage U0 was determined in pre-experiments for each electrode configuration by uniformly raising the voltage at 0.5 kV per 10 s and recording the level at which a stable PD pulse signal first appeared. For the four sustained-discharge configurations (corona, surface, cavity and floating-electrode), the applied test voltage was Utest = 1.2 U0. The measured inception voltages were 16.5 kV (corona without pressboard), 15.0 kV (corona with pressboard), 12.5 kV (surface), 6.5 kV (floating-electrode) and 23.0 kV (cavity), the corresponding test voltages being 1.2 times these values (20.0, 18.0, 15.0, 7.8 and 27.6 kV, respectively); these applied voltages were used for all three oils. The spark-discharge condition, by contrast, is by definition a breakdown regime and is therefore characterized by its own applied voltage instead of a 1.2 U0 setting: the needle–plane gap was reduced to 2 mm and a voltage of 10 kV was applied, producing intermittent breakdowns. The pulse-current measurement system was calibrated with an XD51J calibrator; the resulting charge-to-amplitude relationships are shown in Figure 3.
Figure 3.
Relationship between partial-discharge quantity and pulse amplitude.
After electrode assembly and oil filling, the system was left to stand for 12 h to eliminate bubbles. Voltage was raised until stable PD appeared. Oil circulation through the closed loop at 0.8 L·min−1 was maintained throughout the test, and samples were withdrawn from a sampling port located downstream from the main tank after the circulation had been running steadily. Continuous PRPD monitoring and hourly oil sampling were performed over a 6 h period for the three oils under the four PD regimes (corona, surface, cavity and floating-electrode). All configurations were tested with pressboard present; the corona configuration was additionally tested without pressboard.
3. Gas-Generation Characteristics Under Different Partial-Discharge Modes
This section compares the dissolved-gas generation behaviour of mineral oil (MO), synthetic ester (SE) and natural ester (NE) under four representative PD modes. All four modes were tested with pressboard present, and the corona mode was additionally tested without pressboard. Each plotted value is the mean of the three parallel tank measurements described in Section 2.1.3, the spread among the three tanks being within about 5%. Each measurement was additionally repeated at the sampling stage: two syringes of oil were drawn at every sampling point and compared, and their values were averaged when they agreed, the sampling being repeated when they did not. No error bars are plotted on the figures: because the three tanks are parallel measurements of the same gas-generation process rather than independent repetitions of the campaign, the inter-tank spread characterises the reproducibility of the measurement and of the tank-to-tank distribution of the dissolved gas, but it is not a run-to-run standard deviation and would therefore understate the true uncertainty if it were drawn as an error bar. The inter-tank spread is accordingly reported in the text as a reproducibility figure. The reported approximately 5% inter-tank spread describes consistency among the three parallel tanks under matched conditions.
3.1. Corona Discharge
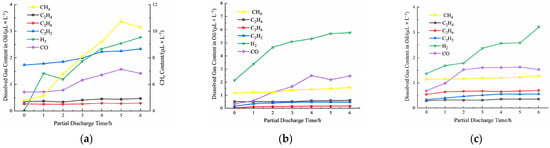
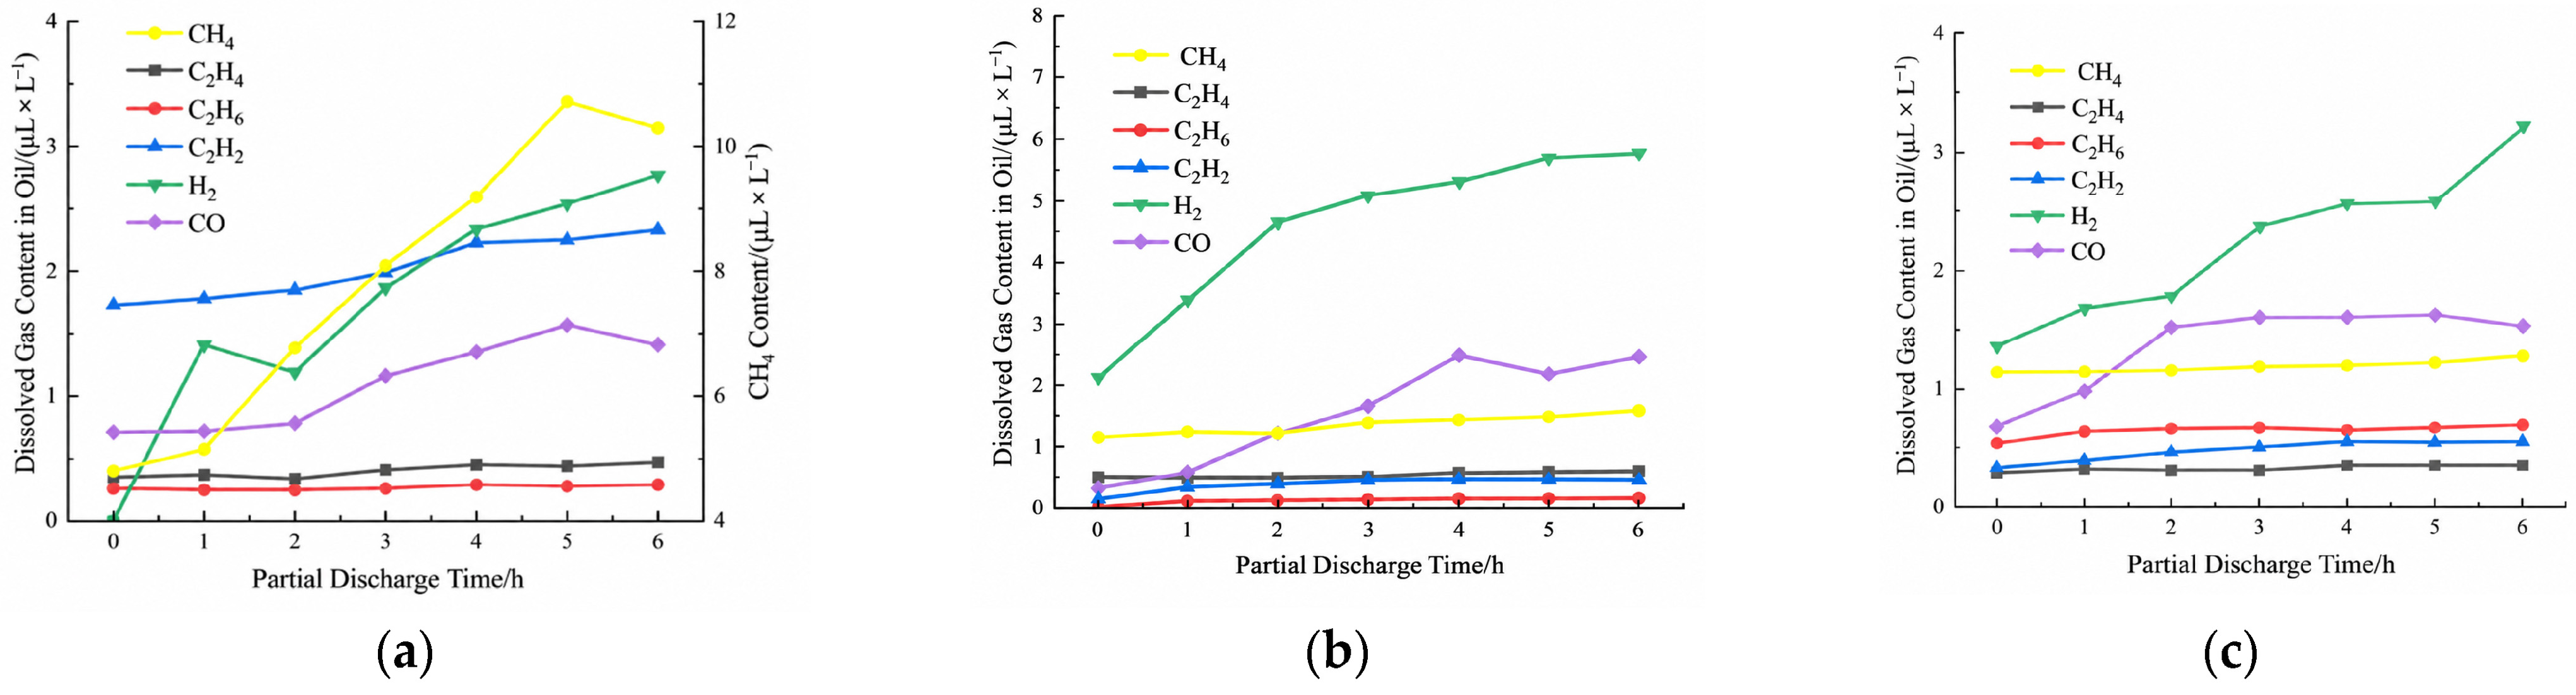
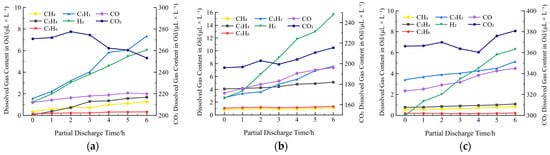
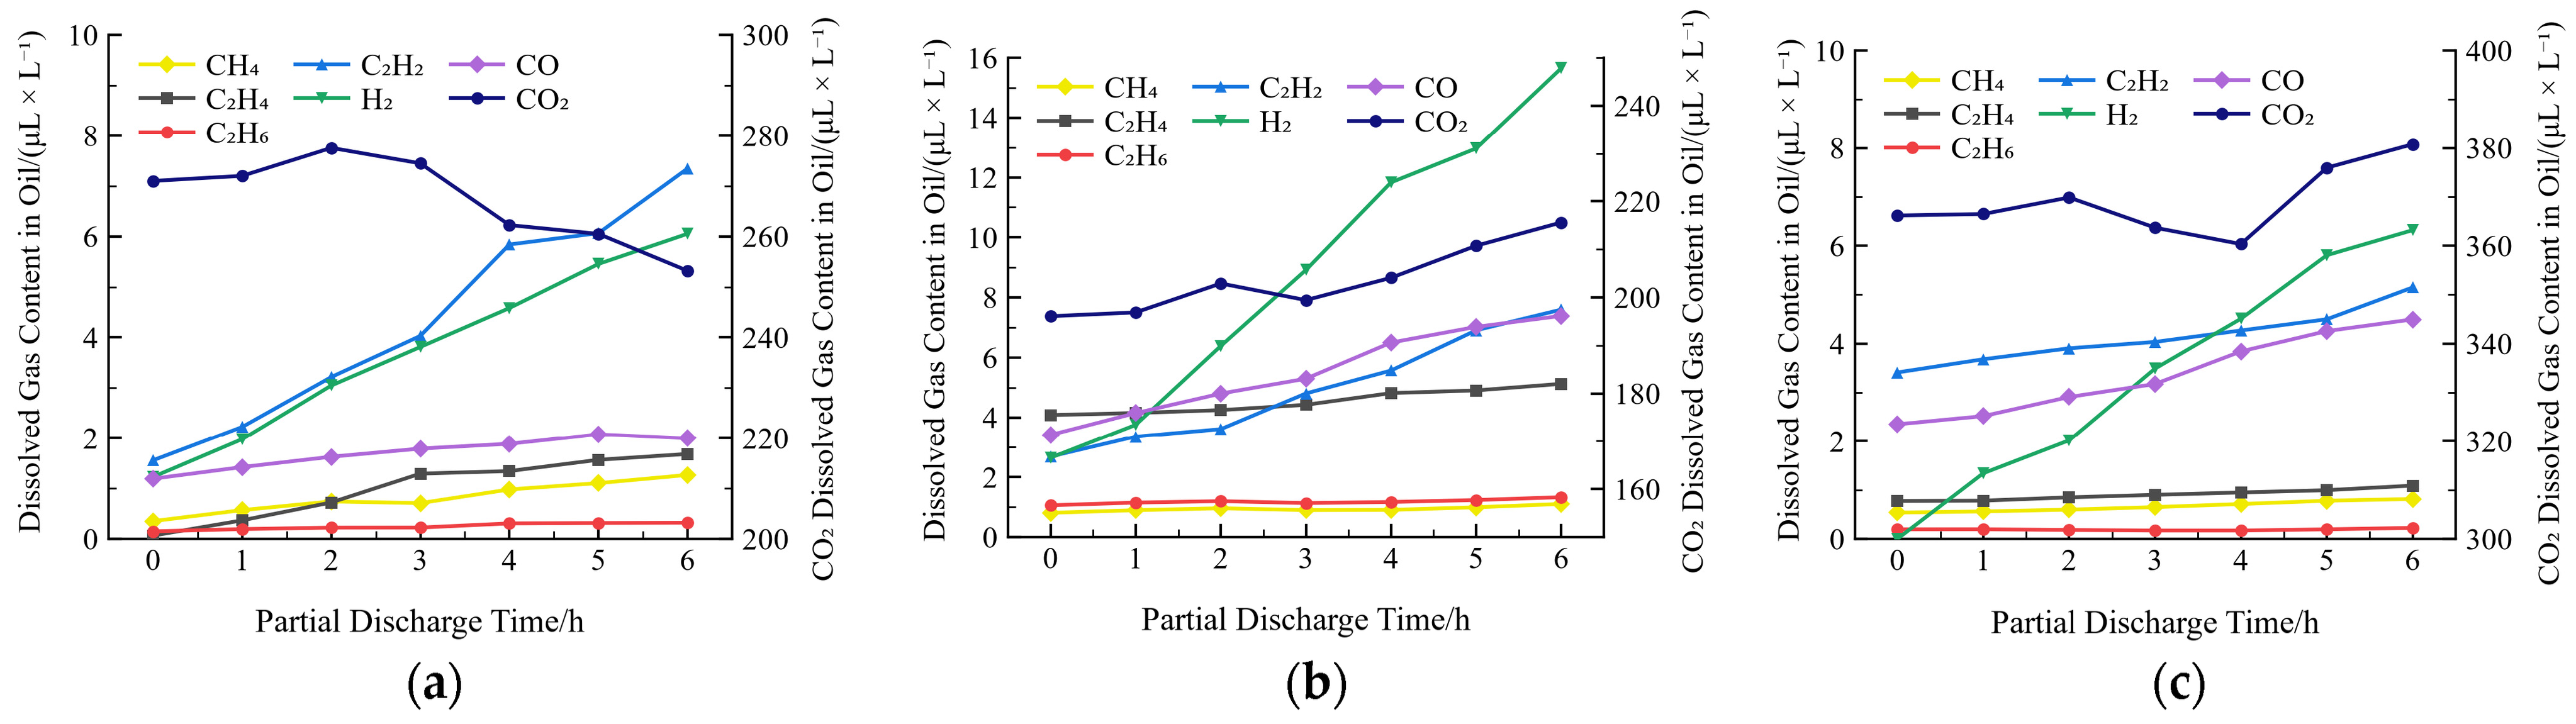
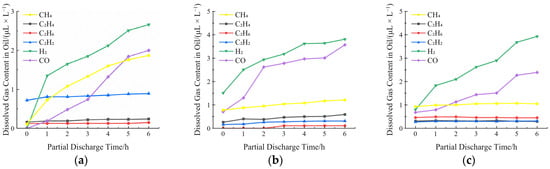
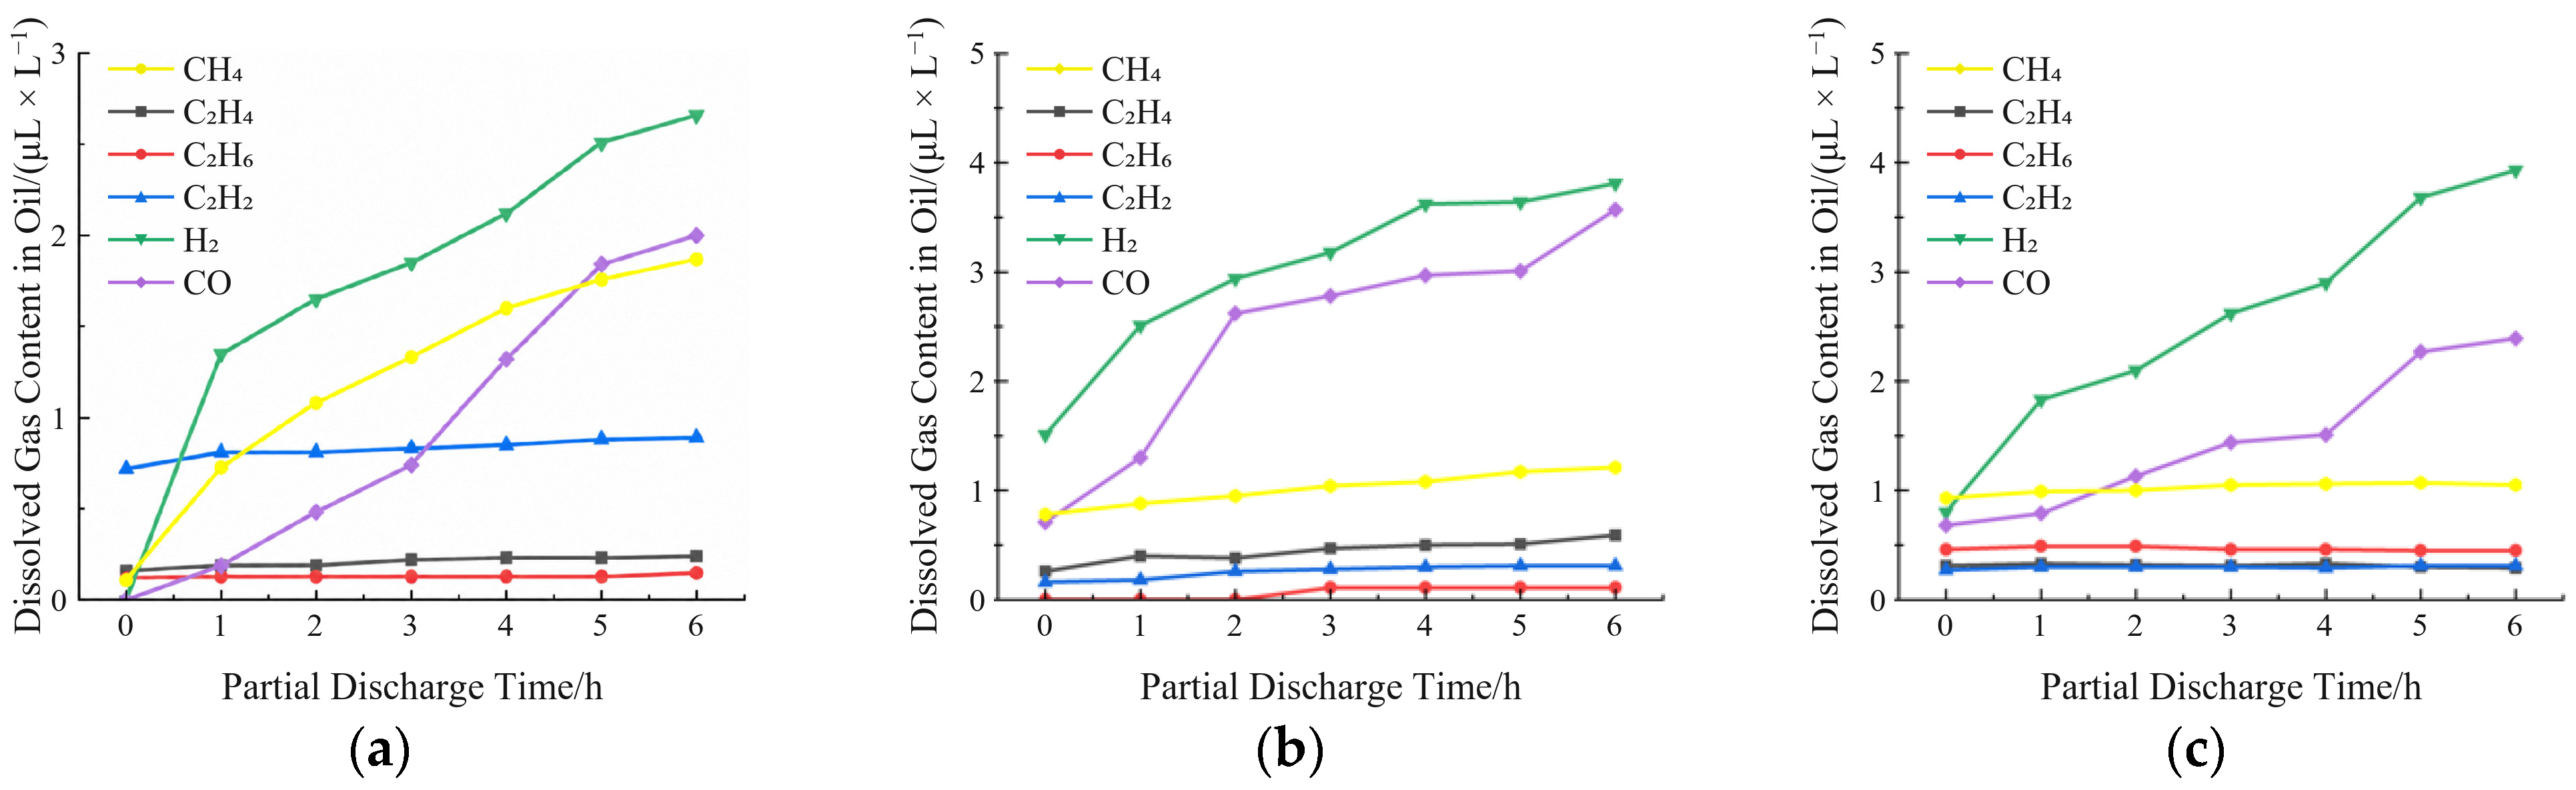
With pressboard present (Figure 4), mineral oil shows an overall rise in CH4 concentration over 6 h, plotted on the right-hand ordinate in Figure 4a, with CH4 and H2 as the principal dissolved gases and moderate C2H2 and CO, whereas both esters preferentially generate H2 and CO; at 6 h, mineral oil has the lowest dissolved H2 concentration and the highest dissolved C2H2 concentration of the three liquids in this corona configuration. These are dissolved concentrations under the stated test conditions, not cross-regime production-rate rankings.
Figure 4.
Variation in the dissolved-gas concentrations of the three insulating oils under corona discharge with pressboard present (1.2 U0, 6 h)L (a) mineral oil; (b) synthetic ester; (c) natural ester.
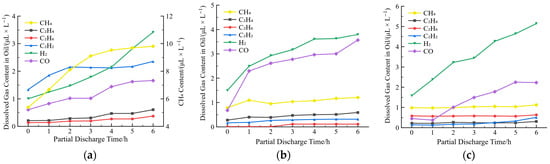
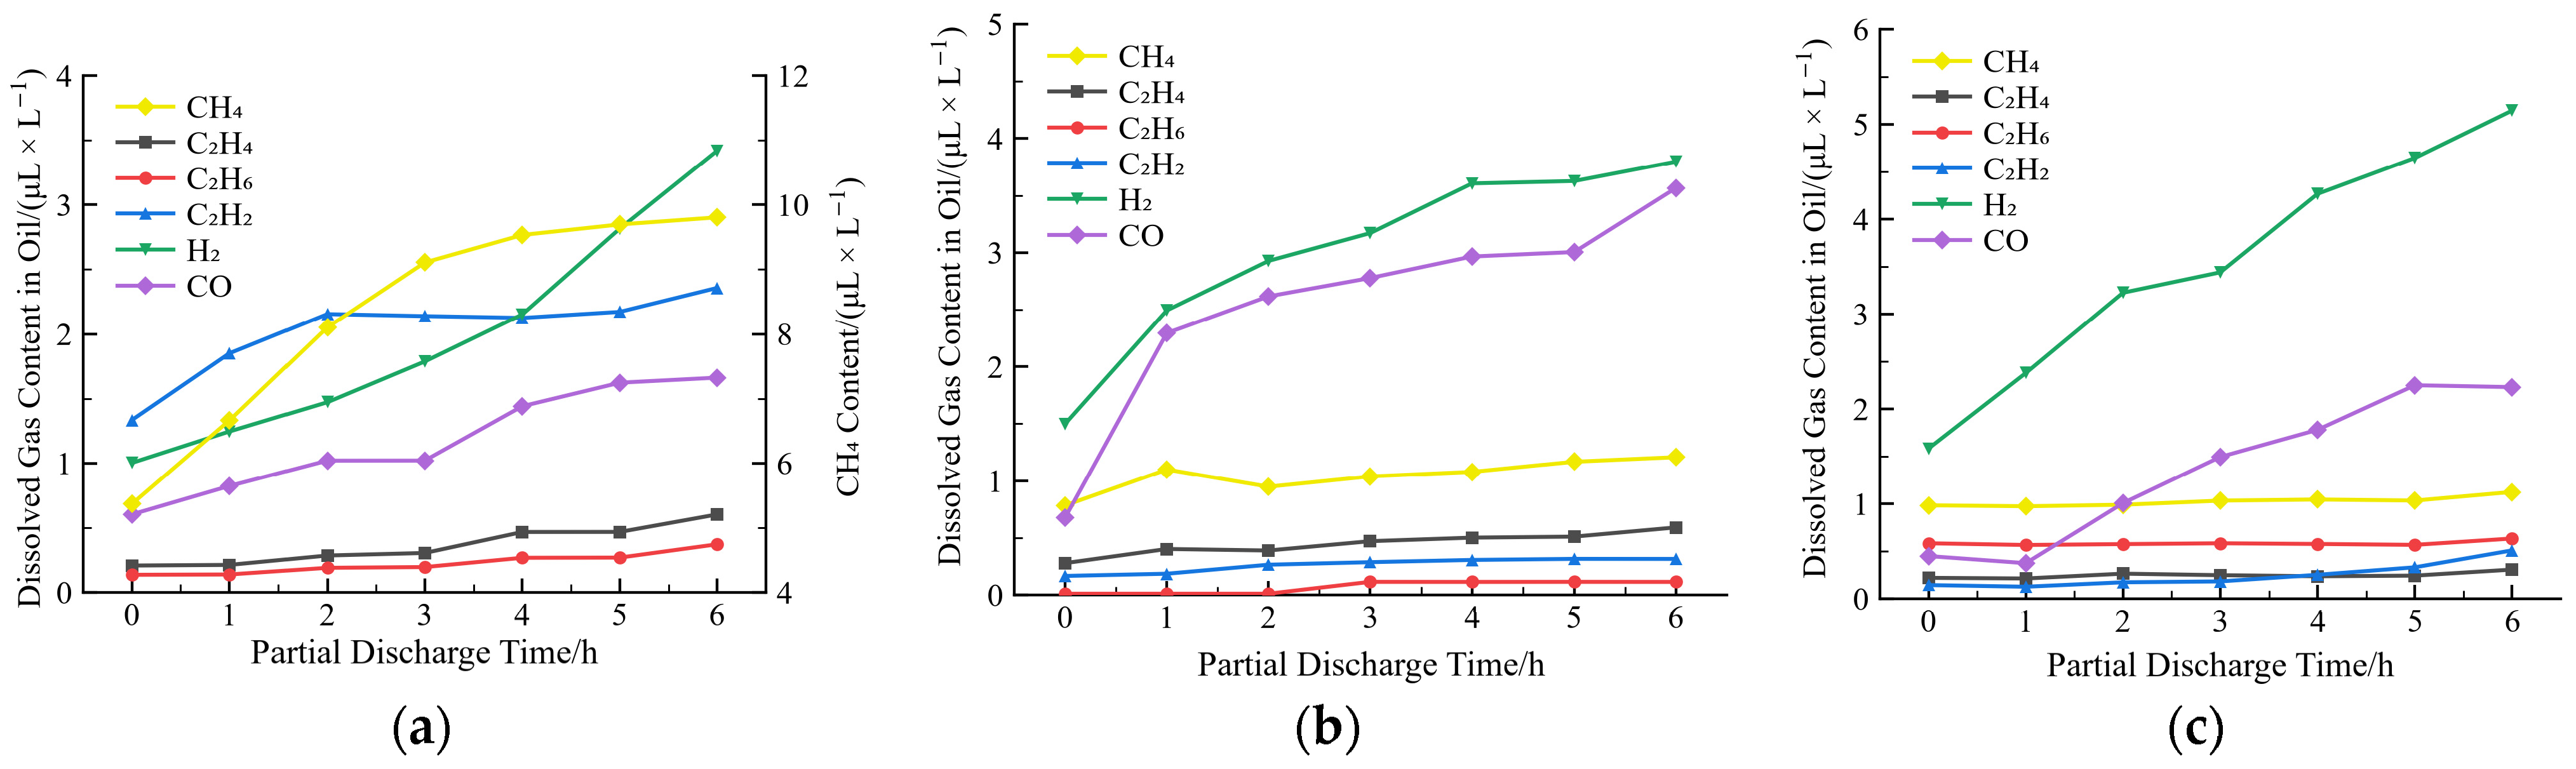
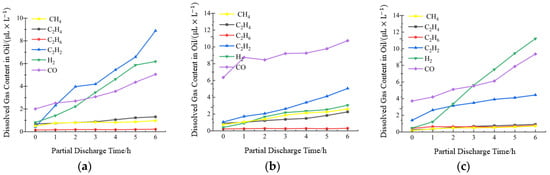
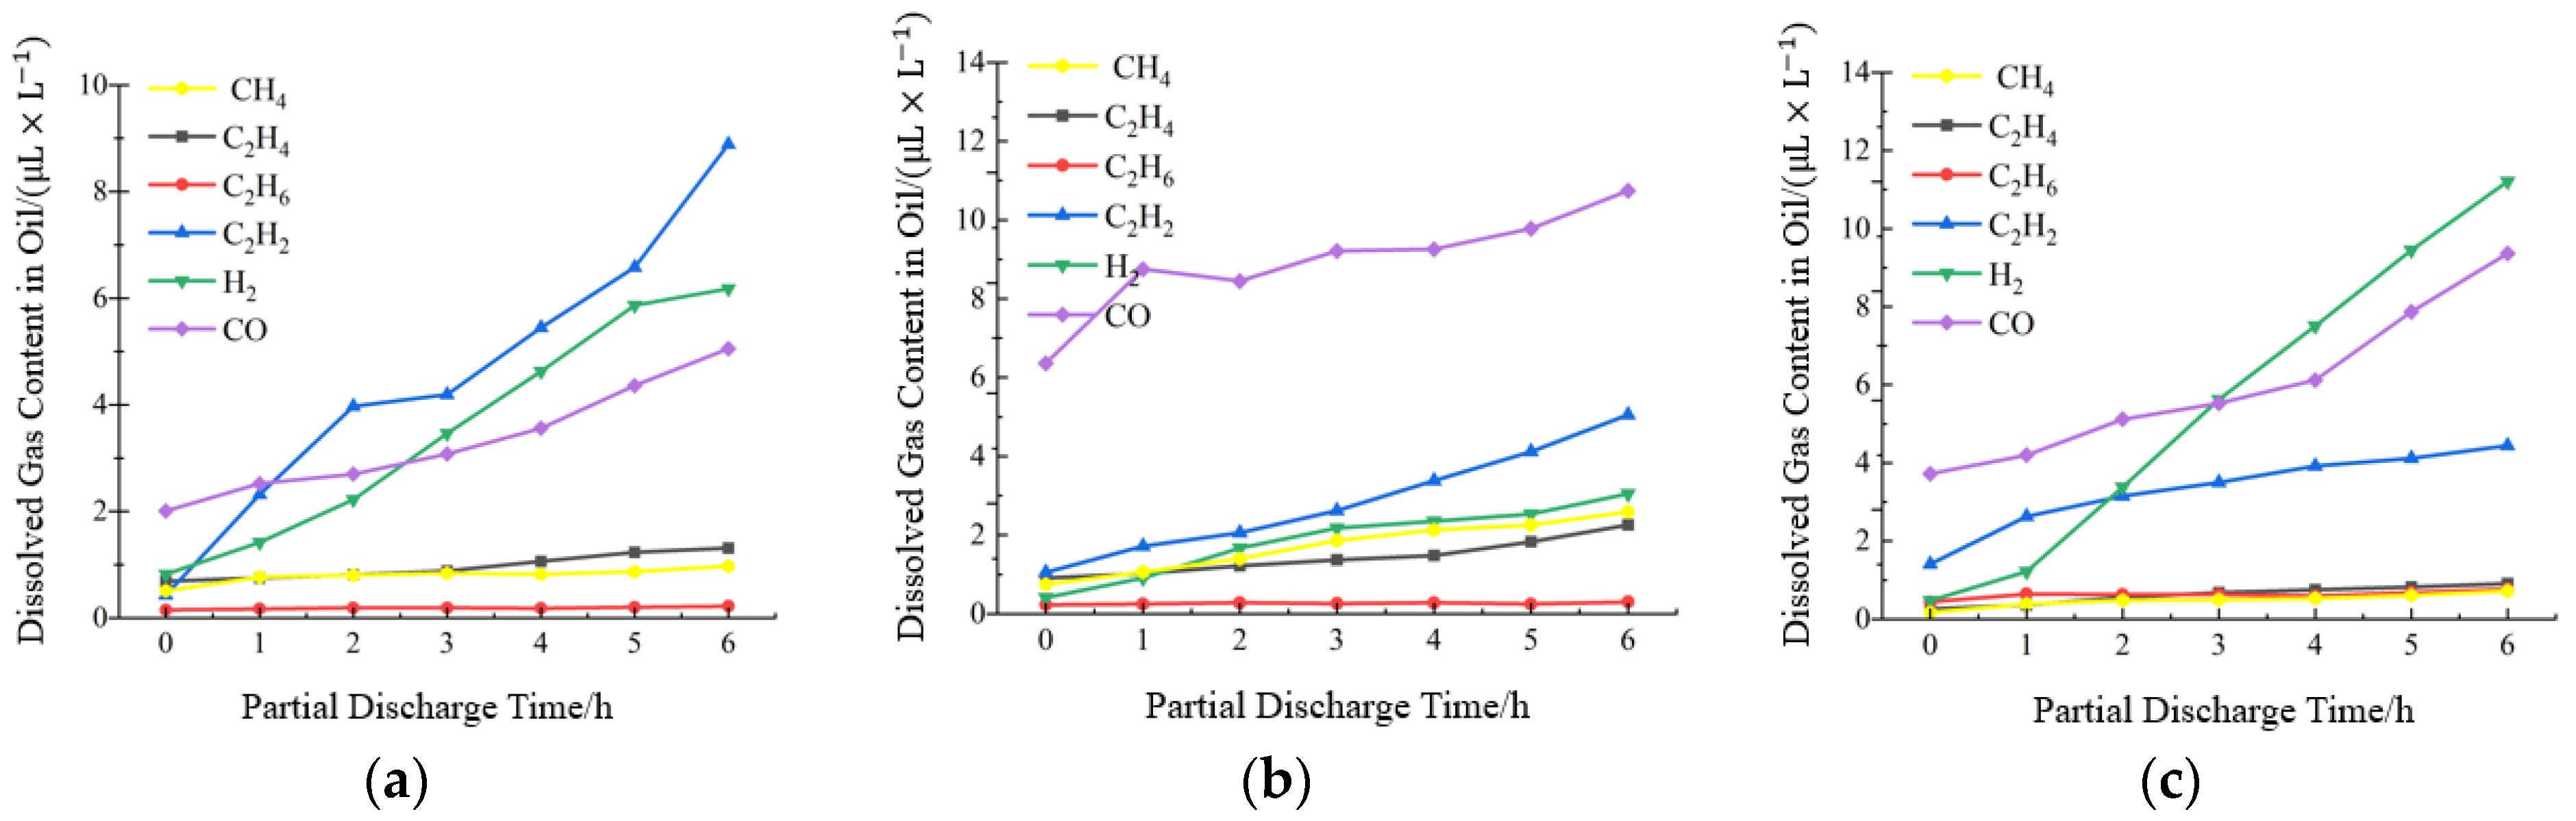
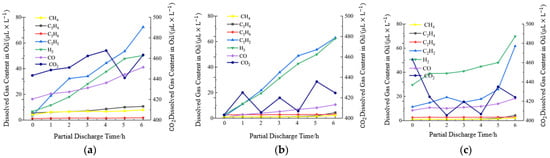
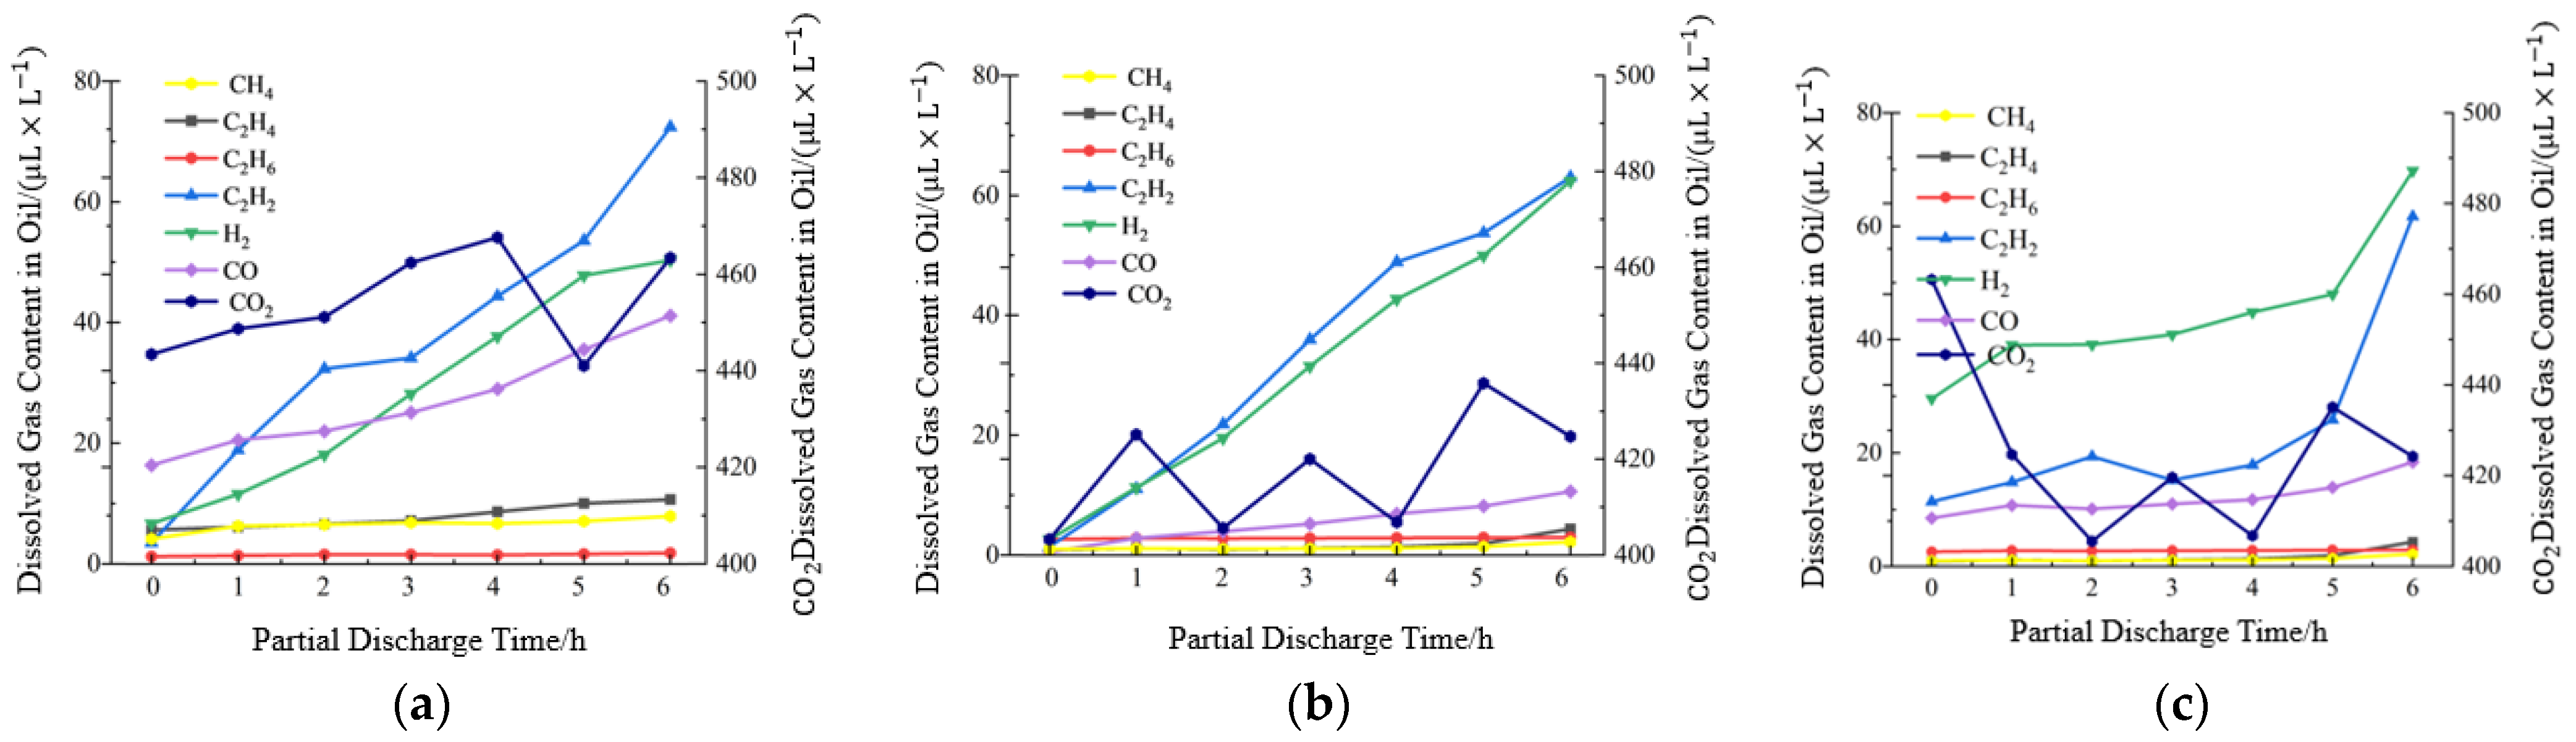
To eliminate any contribution of CO and CO2 that might originate from thermal or electrical degradation of the cellulose, the pressboard was removed and the corona-discharge experiments were repeated under otherwise identical conditions (Figure 5). In the absence of paper the characteristic gases of all three oils are dominated by C2H2 and H2. Mineral oil additionally produces modest quantities of CH4, C2H4 and CO, accompanied by a gradual decline in the background CO2 concentration—behaviour that is consistent with the pre-experiments described in Section 2.2.2. Both natural and synthetic esters generate higher levels of CO and CO2 than mineral oil. Taken together with the reduced carbon oxide levels measured in the absence of pressboard, this is consistent with part of the carbon oxides observed in the presence of pressboard originating from cellulose decomposition, although the two contributions can be separated experimentally only for this corona pair. Fluctuations in the measured CO2 concentration are attributable to residual atmospheric carbon dioxide in the sampling system and do not alter the overall ranking of the oils.
Figure 5.
Variation in the characteristic-gas concentrations in insulating oil under corona discharge without pressboard: (a) mineral oil; (b) synthetic ester; (c) natural ester.
3.2. Surface, Cavity and Floating-Electrode Discharges
Under surface (creepage) discharge the high-voltage electrode is in direct contact with the pressboard, producing more severe mechanical and thermal stress on the solid insulation. Consequently, larger quantities of C2H2 and CO are observed than under corona discharge; nevertheless, the dominant products in mineral oil remain CH4 and H2, while the ester oils continue to favour H2 and CO, with only small amounts of CH4 (Figure 6).
Figure 6.
Variation in the dissolved-gas concentrations of the three insulating oils under surface discharge with pressboard present (1.2 U0, 6 h): (a) mineral oil; (b) synthetic ester; (c) natural ester.
Cavity (void) discharge is even more energetic and causes greater destruction of the pressboard. In mineral oil the yield of CO now exceeds that of CH4. The ester liquids again produce mainly H2 and CO; in addition, synthetic ester begins to generate measurable amounts of CH4, C2H4 and C2H6 as the discharge progresses (Figure 7).
Figure 7.
Variation in the dissolved-gas concentrations of the three insulating oils under cavity discharge with pressboard present (1.2 U0, 6 h): (a) mineral oil; (b) synthetic ester; (c) natural ester.
Floating-electrode discharge, performed with pressboard present, yields C2H2, H2, CO and CO2 in all three oils. Mineral oil and synthetic ester produce essentially no CH4, whereas natural ester evolves a detectable quantity of methane. None of the liquids generates significant C2H6 under this condition (Figure 8).
Figure 8.
Variation in the dissolved-gas concentrations of the three insulating oils under floating-electrode discharge with pressboard present (1.2 U0, 6 h): (a) mineral oil; (b) synthetic ester; (c) natural ester.
3.3. Spark Discharge
To examine gas production under a higher-energy, more destructive regime, spark-discharge tests were conducted with the same needle–plane geometry used for corona discharge, but with a reduced gap of 2 mm and an applied voltage of 10 kV. Under these conditions intermittent breakdown occurs between the electrodes. Because of the stochastic nature of the breakdowns and the large quantity of gas liberated by each spark, a quantitative relationship between discharge magnitude and gas yield could not be established. The time evolution of the characteristic gases is shown in Figure 9.
Figure 9.
Variation in the characteristic-gas concentrations of the three insulating oils under spark discharge: (a) mineral oil; (b) synthetic ester; (c) natural ester.
All three oils generate substantial amounts of C2H2 and H2. The ester fluids additionally produce moderate quantities of CO, whereas in mineral oil it remains below the detection limit (n.d. in Table 1). Table 1 lists the average production rates (μL L−1 h−1). The rates of C2H2 and H2 formation are of the same order of magnitude among the three liquids, suggesting that, once the discharge energy is high enough to cause repeated dielectric breakdown, the chemical structure of the oil exerts a smaller influence on the absolute gas yields.
Table 1.
Gas production rates of the three insulating oils per unit time (μL·L−1·h−1) under the intermittent spark-discharge regime (needle–plane gap reduced to 2 mm, applied voltage 10 kV, repeated breakdown). n.d.: not detected. The H2 and C2H2 rates follow opposite orderings among the three liquids.
3.4. Summary of Gas-Generation Characteristics
Taken together, the results demonstrate that the identity of the dominant dissolved gases is strongly dependent on both the type of insulating liquid and the severity of the partial-discharge activity. Mineral oil consistently favours H2 together with the hydrocarbon gases CH4 and C2H2, whereas the ester oils, because of their ester linkages, preferentially liberate CO (and, to a lesser extent, CO2) in addition to H2 and C2H2. These differences must be taken into account when diagnostic criteria for dissolved-gas analysis (DGA), originally developed for equipment filled with mineral oil, are applied to ester-filled apparatus.
4. Energy–Gas Correlation Analysis
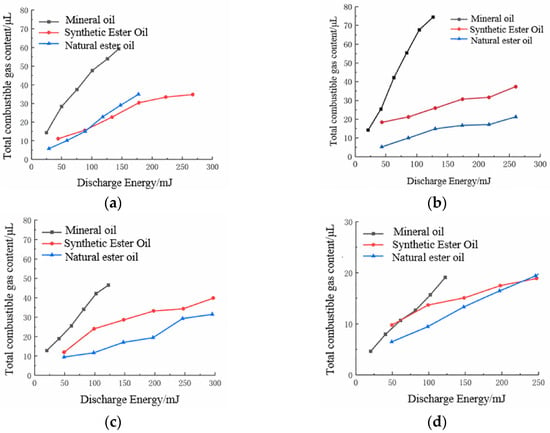
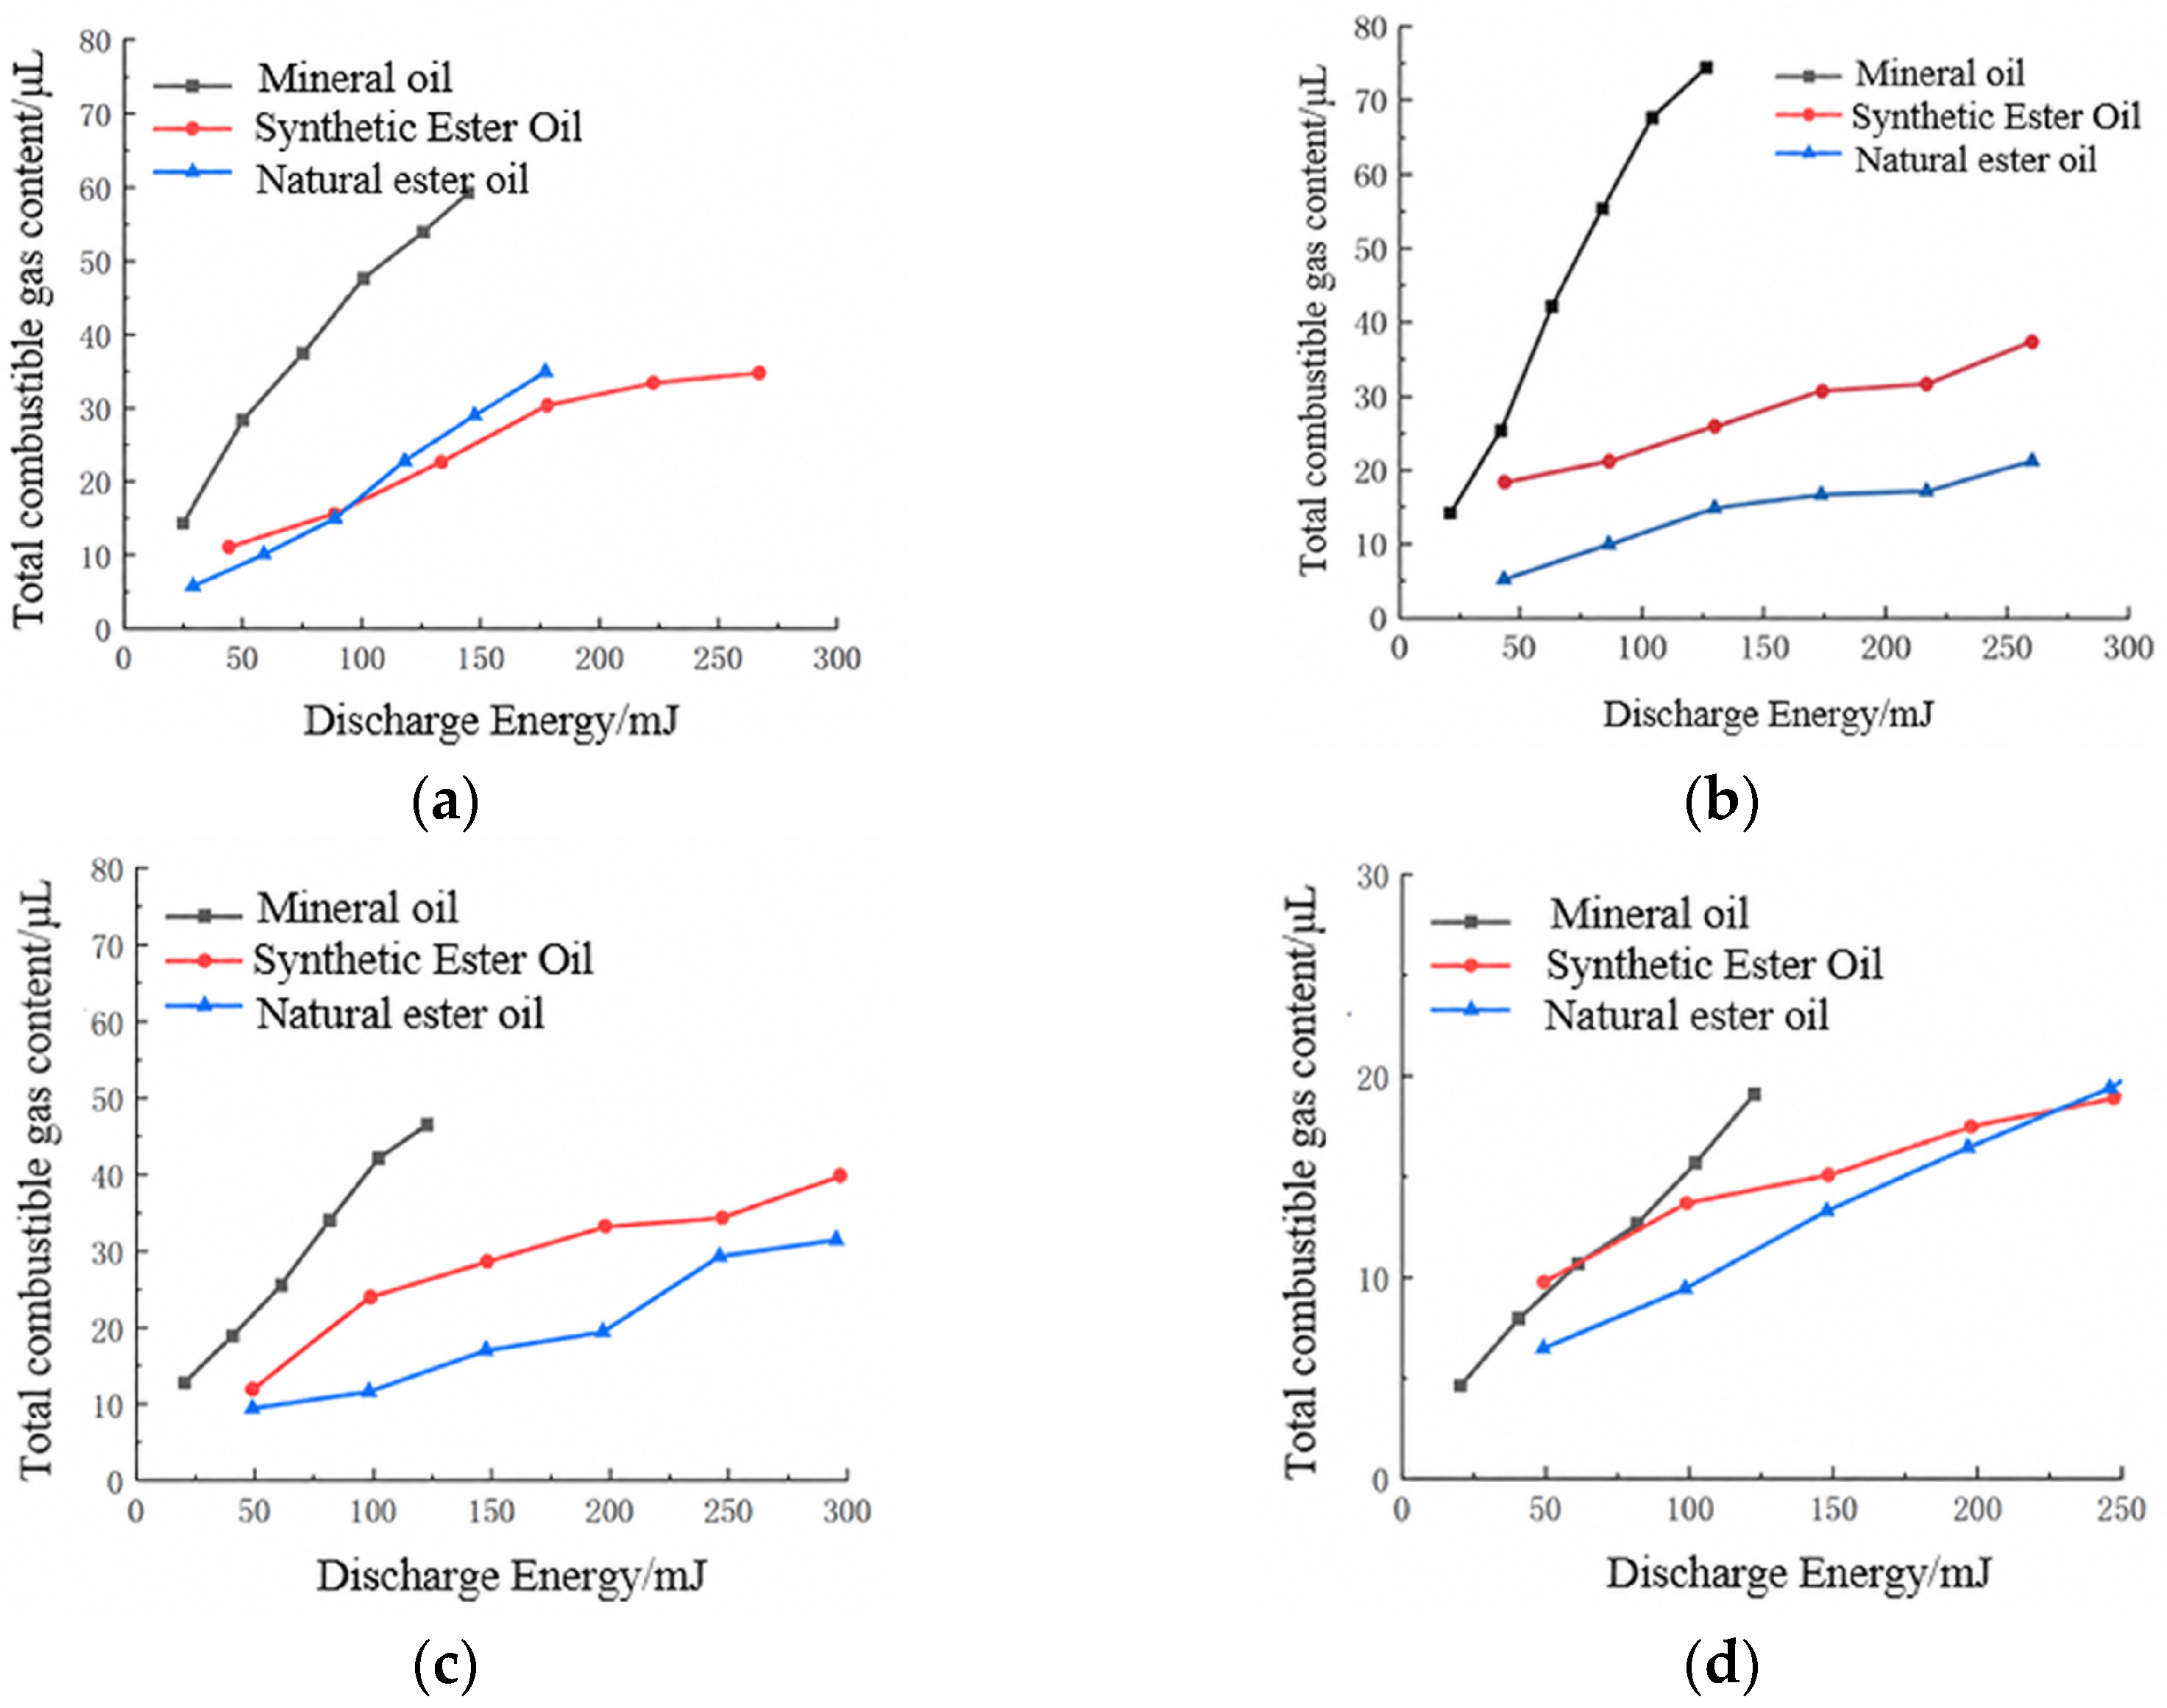
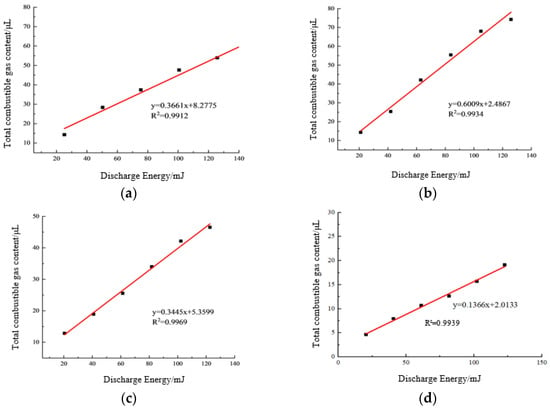
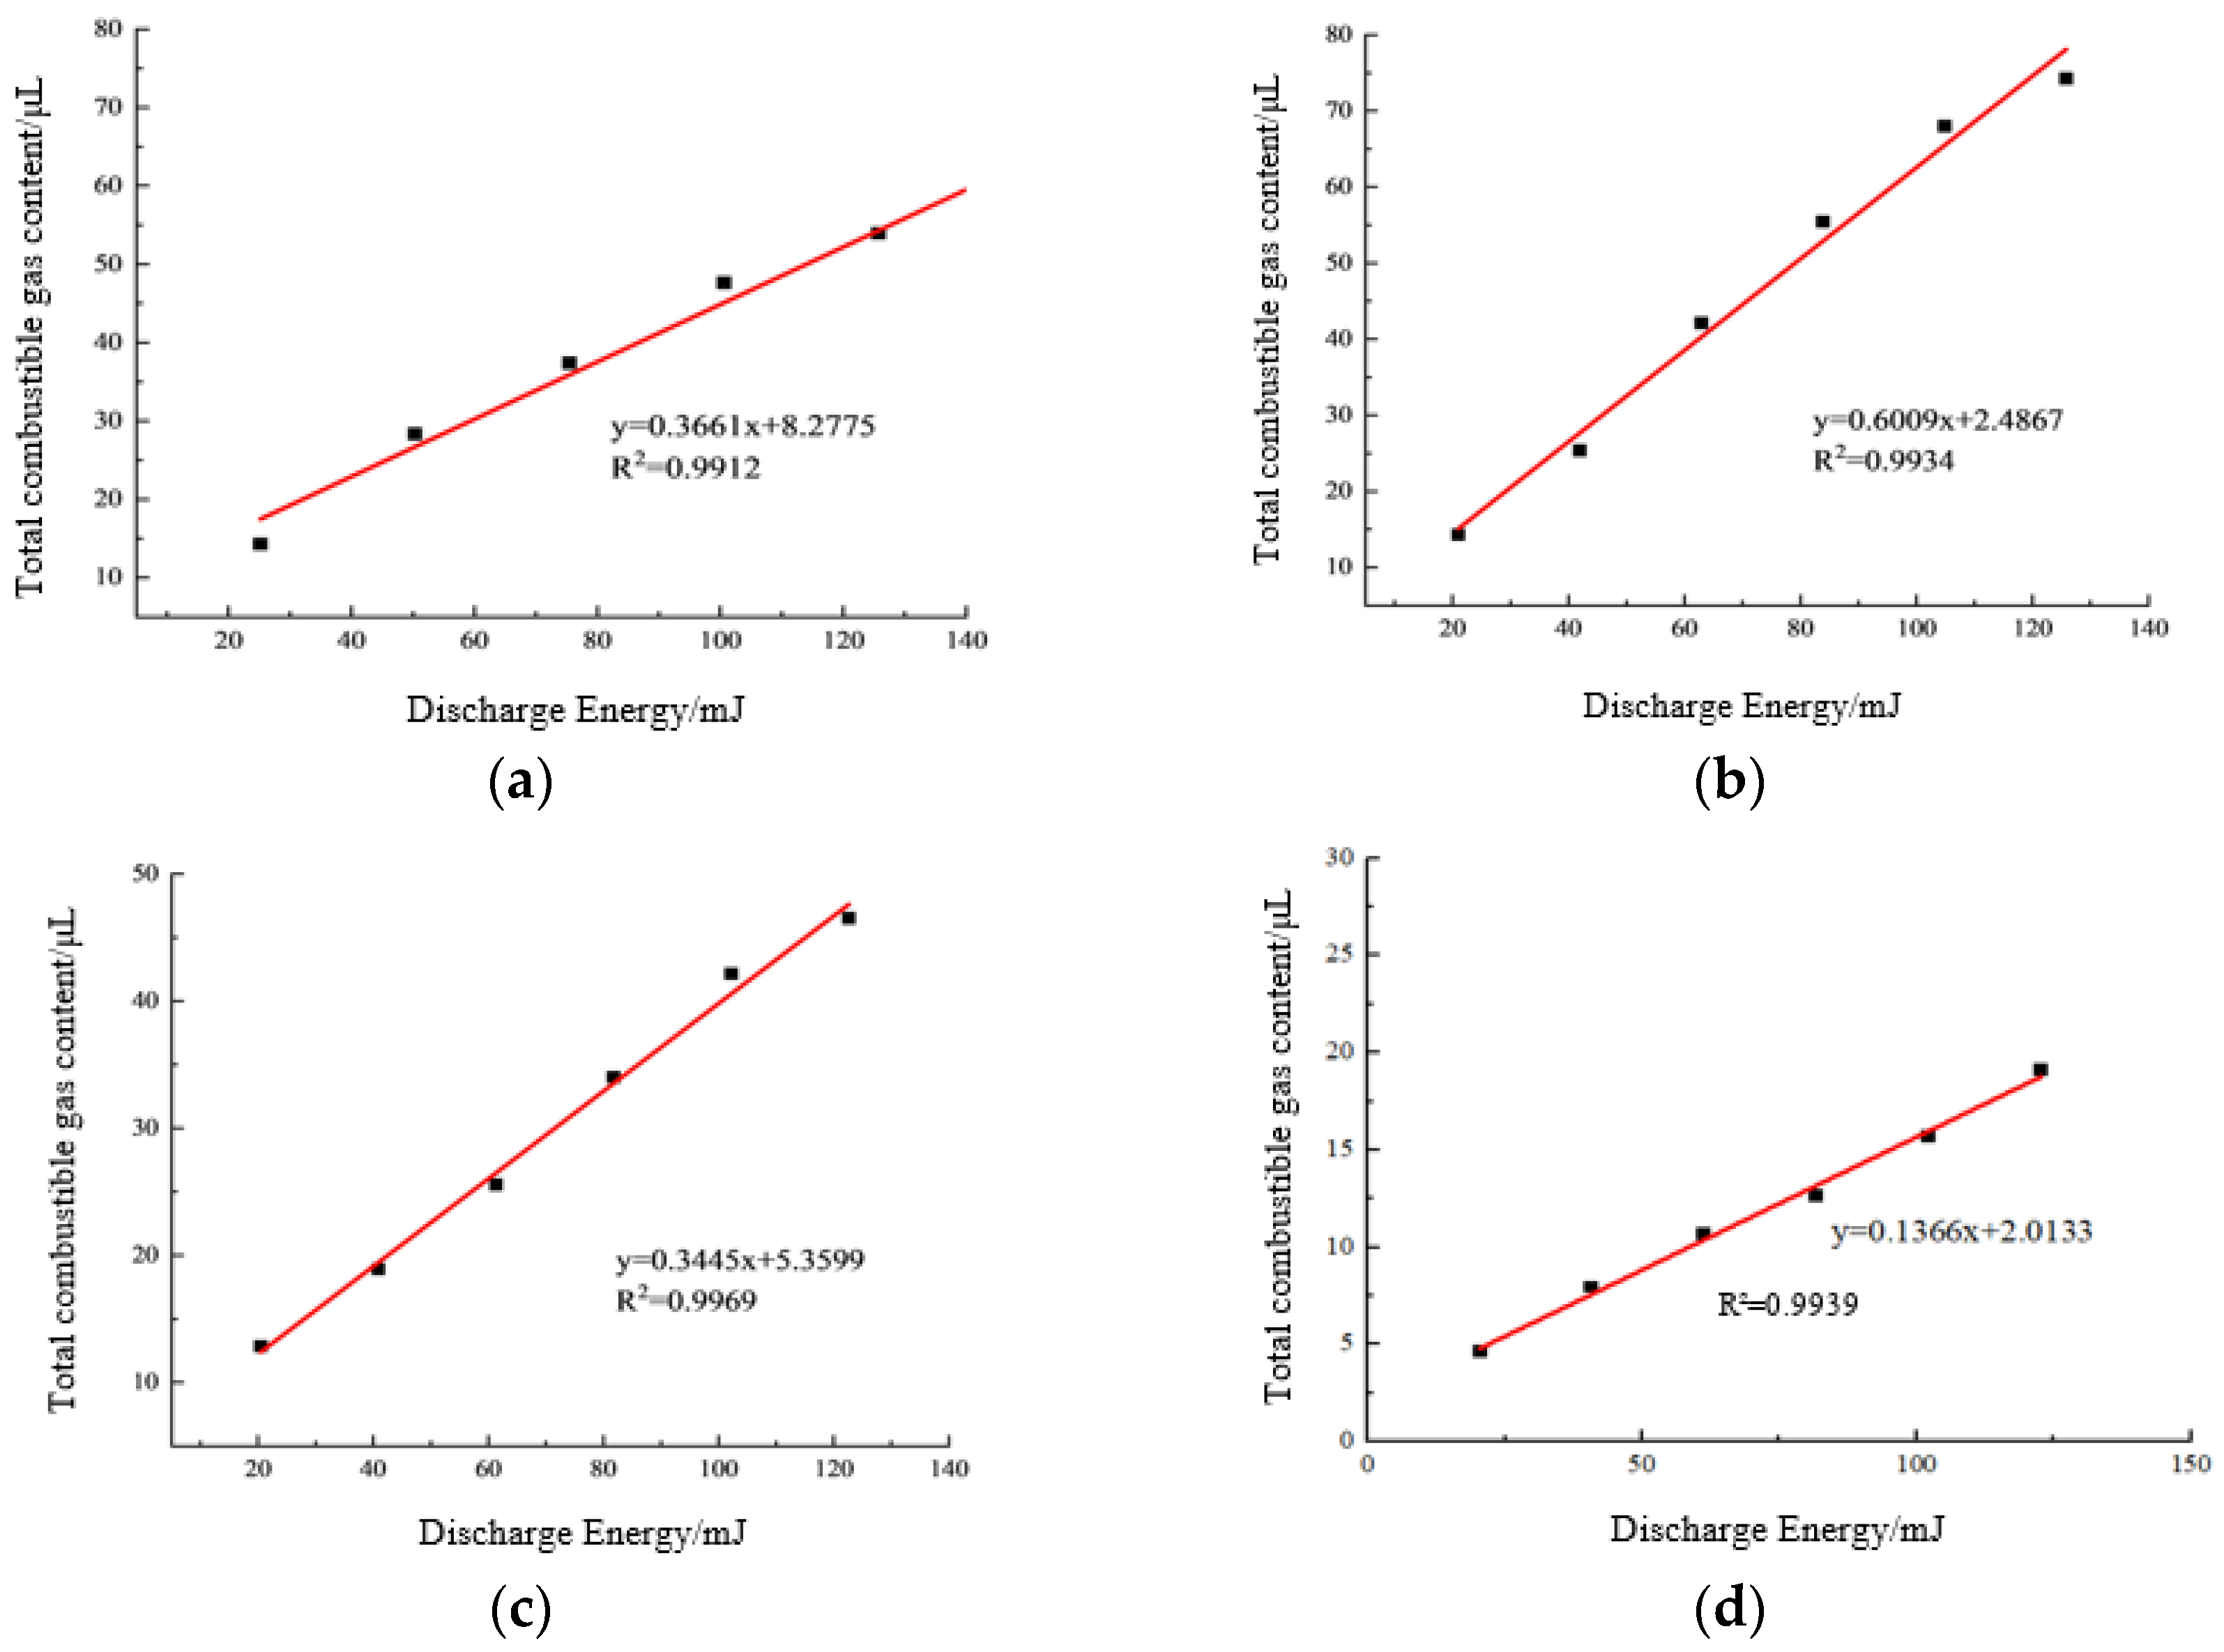
To characterize the gas-production behaviour of the three insulating oils under partial-discharge conditions, the relationship between estimated cumulative discharge energy and the volume of dissolved gas was systematically analysed, because this mapping allows gas-generation characteristics to be evaluated indirectly from measurable electrical parameters. The variations in gas-production volume with discharge energy for mineral oil, synthetic ester and natural ester are presented in Figure 10.
Figure 10.
Gas-generation amount and discharge energy of the three insulating oils: (a) corona discharge; (b) surface discharge; (c) cavity discharge; (d) floating-electrode discharge.
The partial discharge energy WPD is estimated according to:
where U denotes the rms value of the applied voltage, qi the apparent charge of the i-th discharge pulse, φi the phase angle at which this pulse occurs, and n the total number of discharges recorded within the statistical interval. The instantaneous applied voltage at the moment of the i-th discharge is , so that each product qiu(φi) is a signed voltage–charge contribution evaluated from apparent charge and the applied voltage; summation over all n pulses recorded within the statistical interval yields the cumulative discharge energy estimate WPD.
The following assumptions underlie this estimate. (i) The applied voltage is taken to be sinusoidal, so that its instantaneous value at phase φi is √2 U sinφi with U the rms value; the √2 factor in the expression above converts the rms value to the instantaneous peak. (ii) The apparent charge qi is obtained from the calibrated pulse-current measurement and is assumed proportional to the charge actually transferred in the discharge; the proportionality factor is set by the XD51J calibration. (iii) The sign of qiu(φi), with qi taken as the nonnegative magnitude of the apparent charge, follows the polarity of the applied voltage at the instant of the pulse, so pulses occurring in the positive and negative half-cycles enter the summation with opposite sign and are therefore not simply additive in magnitude; this is the standard convention for this energy estimate. This follows Clause 3.3.6 of IEC 60270:2000 [26], which treats qi as an apparent-charge magnitude and requires the sign of the instantaneous voltage ui to be retained. (iv) The summation is performed pulse by pulse over the measurement interval, with n the number of pulses recorded. The approximation has two recognised limitations: the apparent charge does not resolve the true charge distribution within an individual discharge, and the field distortion produced by space charge during the discharge is neglected. These approximations are acceptable for the comparative purpose of the present work, in which the same procedure is applied to every liquid and every discharge mode, but they should be kept in mind when the absolute energy values are used.
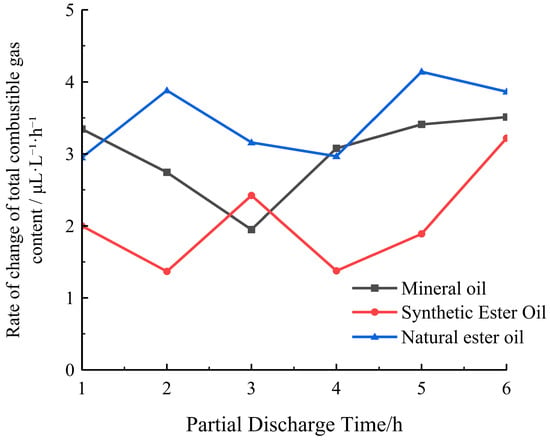
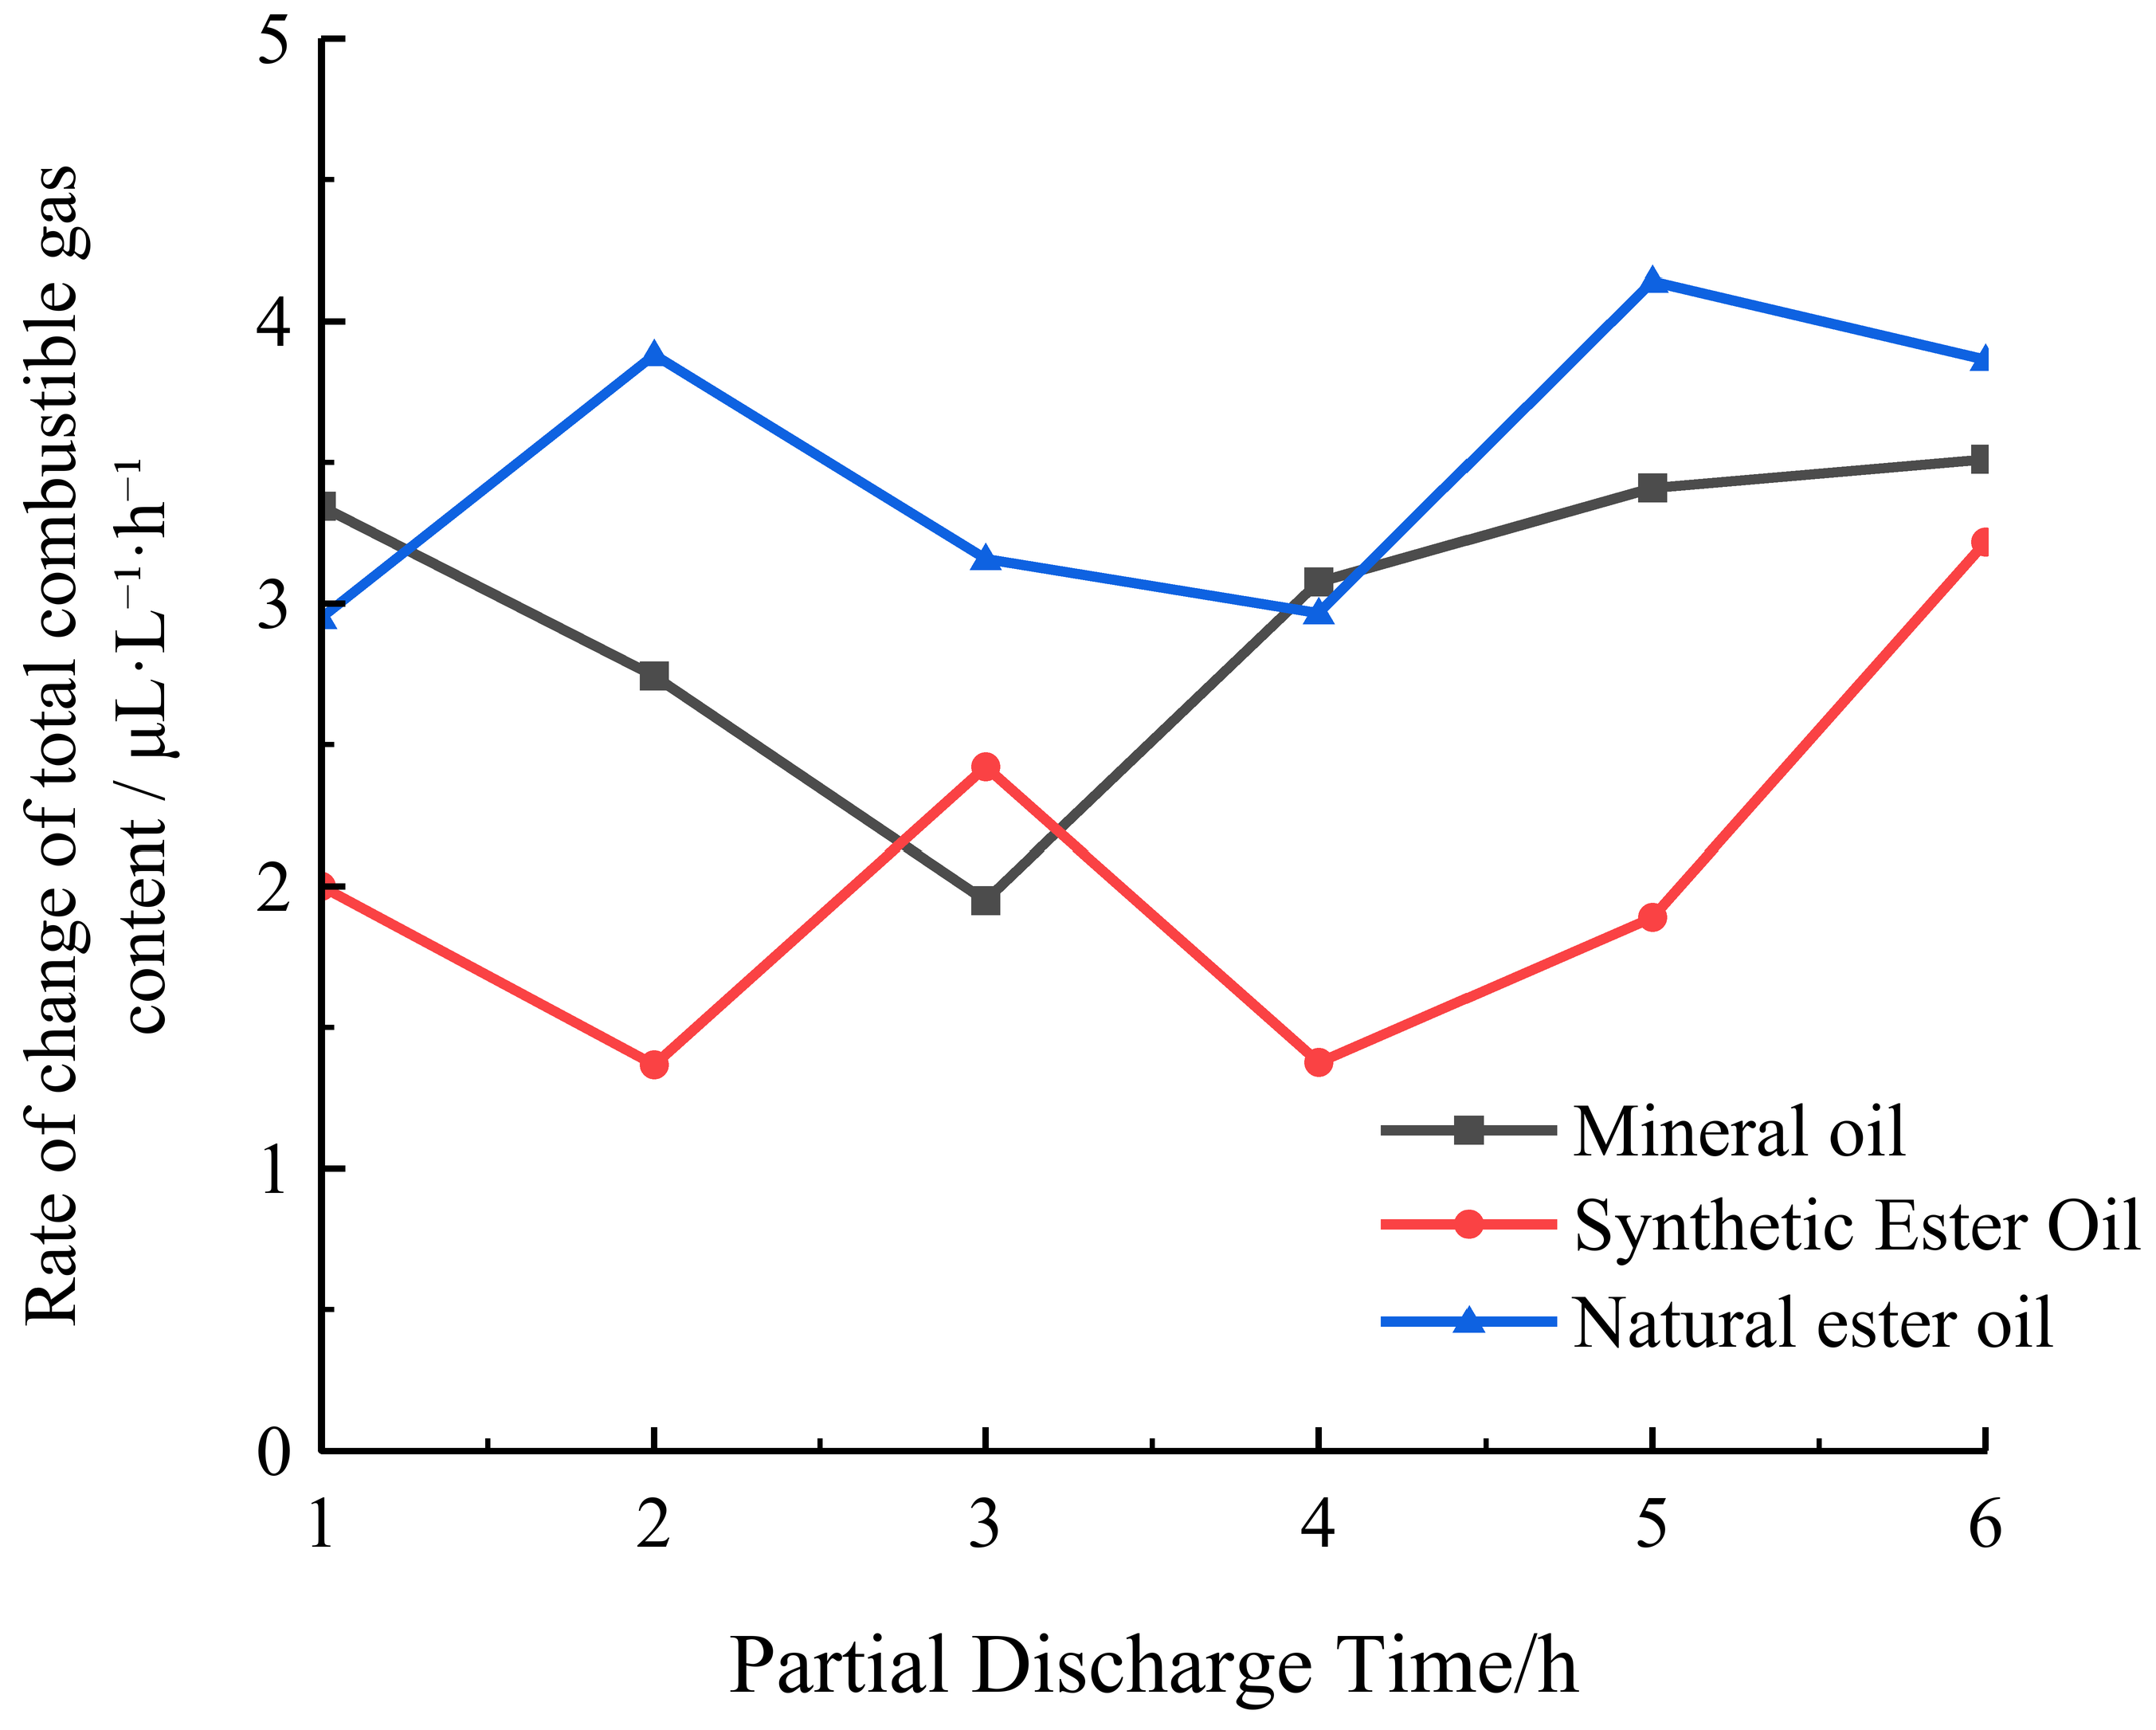
In practical structures of large oil-immersed power equipment, the physical distance between a PD fault site and the oil sampling port delays gas transport and produces spatial concentration gradients of the characteristic gases. Accurate correction of this spatial discrepancy requires knowledge of the gas generation rate. The temporal evolution of the total combustible-gas generation rate of the three oils is shown in Figure 11. The curves cross, and natural ester exceeds one or both of the other liquids at several sampling times. Because Figure 11 reports a total rate, it cannot establish a ranking for an individual gas or a radical-scavenging mechanism. No systematic trend with elapsed time is observed.
Figure 11.
Variation in the background-corrected total combustible-gas concentration growth rate (µL·L−1·h−1) of the three insulating oils with partial-discharge duration (1–6 h) at 1.2 U0 with pressboard present. Each curve summarizes the oil-specific total combustible-gas concentration growth rates across the four sustained-discharge regimes at each sampling time. The legend entry “Natural ester oil” denotes FR3.
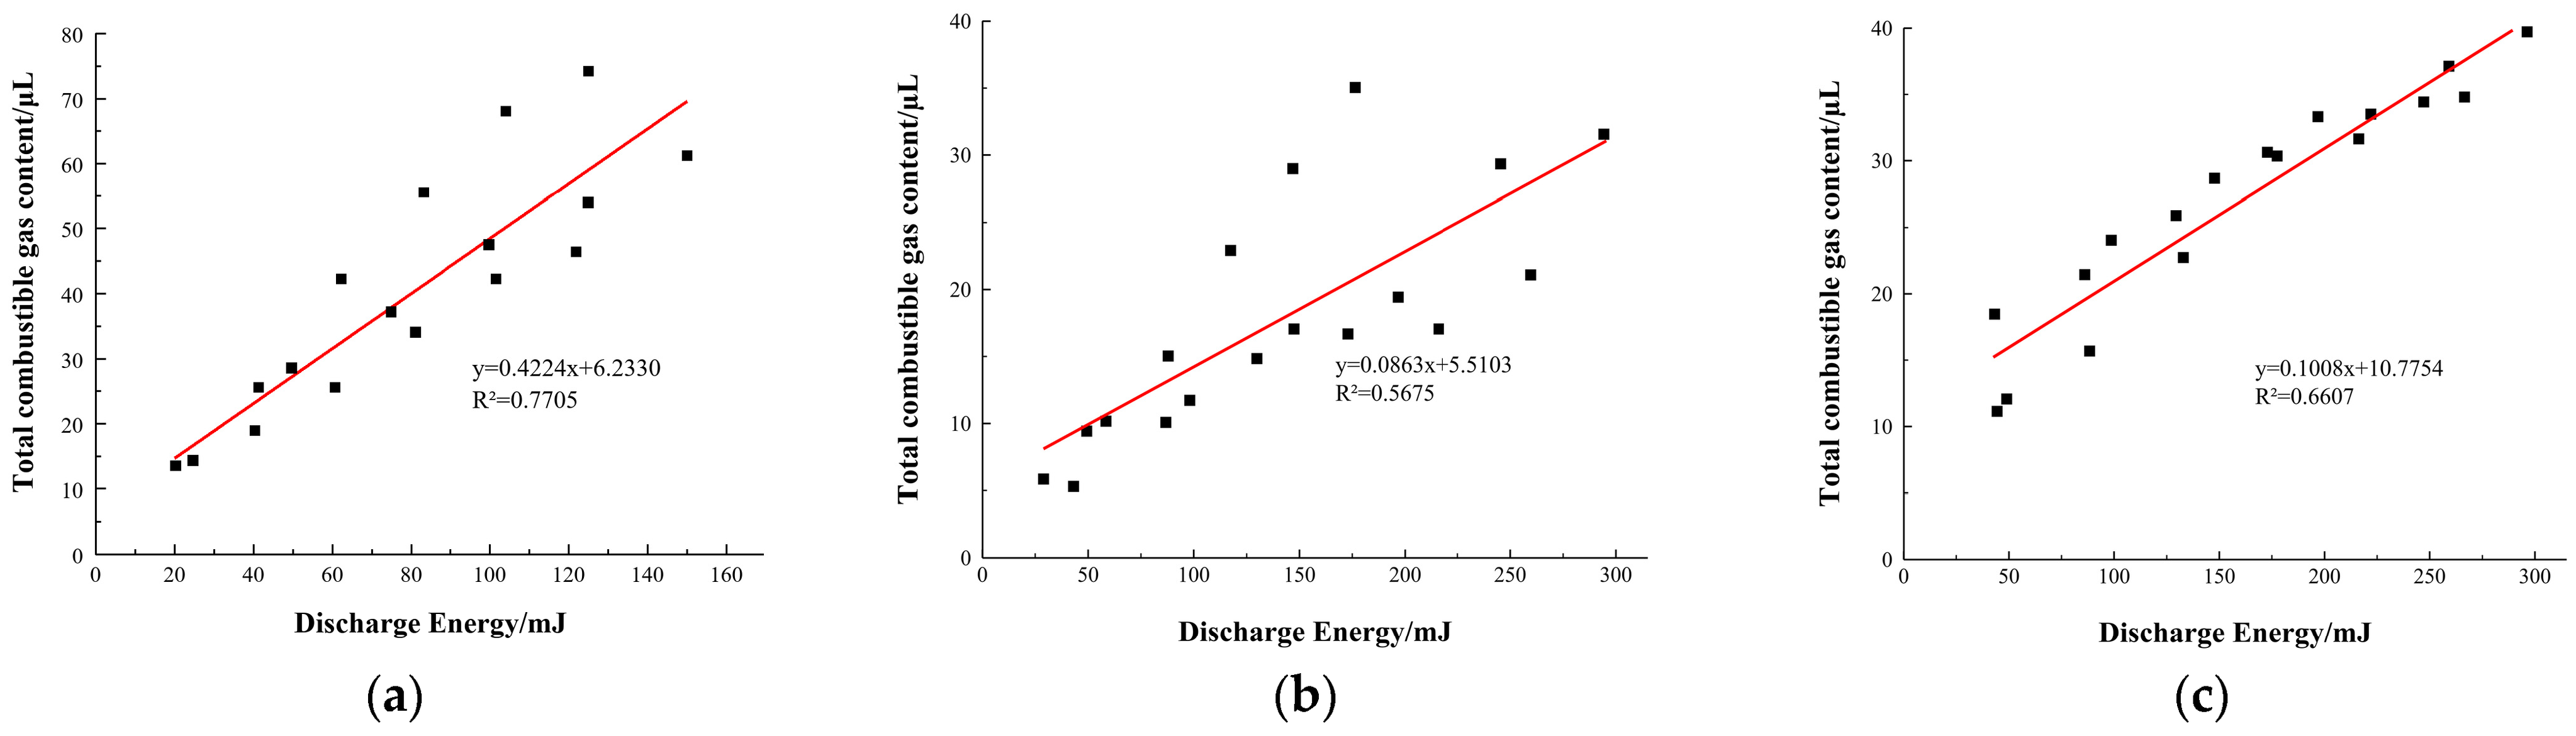
Four representative PD modes (corona, surface, cavity and floating-electrode discharge) were examined. For each individual discharge type a clear linear correlation exists between cumulative discharge energy and cumulative gas volume, allowing gas production to be estimated from the discharge-energy estimate within that mode. When the data of all four discharge types are pooled, however, the linearity deteriorates markedly, indicating that the discharge mechanism itself exerts a pronounced influence on the quantity of gas generated. The energy–volume relationships for mineral oil under the four separate PD modes are illustrated in Figure 12, while the corresponding relationships obtained by combining all discharge types for the three oils are given in Figure 13. Figure 12 compares the estimated discharge energy with the corresponding total combustible-gas volume for mineral oil under four separate partial-discharge modes. The horizontal axis the represents discharge energy estimate calculated from the electrical measurements, rather than elapsed time. The fitted slope, expressed as gas volume per unit discharge energy, describes the apparent gas yield per unit estimated discharge energy within each mode over the investigated range. The slopes are 0.3661, 0.6009, 0.3445 and 0.1366 μL/mJ for corona, surface, cavity and floating-electrode discharge, respectively. Their differences indicate that a single energy-to-gas coefficient does not describe all four modes under the tested conditions. Nearly uniform spacing in time therefore cannot by itself create the different gas-per-energy slopes in Figure 12; the slopes compare gas increments with estimated discharge-energy increments within each mode. The cumulative representation is therefore best regarded as a descriptive summary of the data within a mode, and the quantitative mapping it provides is limited to the energy range and the discharge mode for which it was established. The coefficients of determination are as follows. For the single-mode plots of Figure 12: (a) R2 = 0.9912, (b) R2 = 0.9934, (c) R2 = 0.9969 and (d) R2 = 0.9939. For the pooled plots of Figure 13: (a) R2 = 0.7705, (b) R2 = 0.5675 and (c) R2 = 0.6607. These values are displayed on the figures themselves and in the corresponding captions. The contrast between the single-mode and pooled fits is consistent with mode-dependent gas-per-energy behaviour, although the high R2 values of cumulative plots retain the time-trend qualification stated above.
Figure 12.
Relationship between discharge energy and gas-production volume of mineral oil: (a) corona discharge; (b) surface discharge; (c) cavity discharge; (d) floating-electrode discharge. The panel-specific coefficients of determination are (a) R2 = 0.9912, (b) R2 = 0.9934, (c) R2 = 0.9969 and (d) R2 = 0.9939.
Figure 13.
Relationship between discharge energy and gas production of the three insulating oils under partial discharge: (a) mineral oil; (b) synthetic ester; (c) natural ester. The panel-specific coefficients of determination are (a) R2 = 0.7705, (b) R2 = 0.5675 and (c) R2 = 0.6607.
5. Discussion
The experimental results reveal clear differences in the dissolved-gas generation behaviour of mineral oil, natural ester and synthetic ester under identical partial-discharge conditions. These differences have direct implications for the application of conventional DGA interpretation schemes to ester-filled power equipment.
Under moderate-energy PD regimes (corona, surface, cavity and floating-electrode discharge), mineral oil consistently produces H2 together with predominant hydrocarbons CH4 and C2H2. In contrast, both natural and synthetic esters preferentially liberate H2 and CO (together with smaller amounts of CO2), while their C2H2 concentrations are lower than those of mineral oil at 6 h, as shown in Figure 4, Figure 6, Figure 7 and Figure 8. This comparison concerns dissolved concentration at the specified endpoint within each moderate-energy PD configuration, rather than a pooled production-rate ranking. This behaviour is consistent with the presence of ester linkages in the molecular structure of the ester liquids, which favour the formation of carbon oxides rather than pure hydrocarbons when the liquid is subjected to electrical stress. The elevated CO and CO2 concentrations observed when pressboard is present further indicate that cellulose decomposition contributes to the measured carbon oxide yields. The corona with/without-pressboard pair is the only configuration in which the two contributions can be separated by difference, and it is therefore the only direct experimental evidence for the involvement of cellulose; for the surface, cavity and floating-electrode configurations the defect geometry is defined by the pressboard itself and the oil-derived and cellulose-derived carbon oxides cannot be separated experimentally, so the participation of cellulose in those cases is inferred rather than measured. This distinction should be borne in mind when DGA data from oil–paper insulation systems are interpreted.
These differences can be interpreted consistently in terms of molecular structure and chemical bond energies (Table 2). Mineral oil consists of alkanes, cycloalkanes and aromatic hydrocarbons and contains only C–C (bond energy ≈ 348 kJ/mol) and C–H (≈413 kJ/mol) bonds, so that its decomposition can proceed only along two routes: C–C scission yields alkyl radicals, which recombine or abstract hydrogen to form CH4, C2H6 and C2H4, while C–H scission followed by stepwise dehydrogenation yields H2; only at higher energies does deep dehydrogenation create unsaturated bonds and ultimately C2H2.
Table 2.
Molecular-structure origin of the dissolved-gas behaviour of the three liquids under moderate-energy partial-discharge regimes (corona, surface, cavity and floating-electrode, with pressboard present).
The molecular picture of the ester liquids is fundamentally different. The ester linkage (–COO–) carries its own oxygen atoms, and the acyl–oxygen bond is comparatively weak (C–O ≈ 358 kJ/mol): under discharge it breaks preferentially to form acyl and alkoxy radicals, which undergo decarbonylation and decarboxylation to yield CO and CO2 at comparatively low energies. This opens a carbon oxide formation pathway that does not exist in mineral oil and constitutes the molecular origin of the preferential liberation of H2 and CO observed for both esters under moderate-energy PD. The lower dissolved C2H2 concentrations measured in both esters under the investigated sustained PD conditions are consistent with fluid-dependent decomposition pathways. However, the present dissolved-gas data do not identify the individual reaction steps or directly quantify the total C2H2 generated.
When the discharge energy is raised to the level of intermittent sparking, the absolute production rates of C2H2 and H2 converge to the same order of magnitude across the three fluids. This observation suggests that once dielectric breakdown occurs repeatedly, the influence of molecular structure diminishes and the gas-generation process is dominated by the high-temperature plasma chemistry common to all three liquids. Consequently, diagnostic ratios that rely primarily on C2H2/H2 may remain useful even for ester-filled apparatus under severe arcing conditions, whereas ratios involving CH4 or CO require oil-specific calibration under moderate PD.
Gas comparisons must distinguish the measured quantity and the discharge regime. Table 1 reports per-volume, per-hour production rates under intermittent spark discharge: H2 follows mineral oil > synthetic ester > natural ester, whereas C2H2 follows synthetic ester > natural ester > mineral oil. In contrast, Figure 4, Figure 6, Figure 7 and Figure 8 report dissolved-gas concentrations during four separate moderate-energy PD configurations with pressboard present; at 6 h, mineral oil has a higher dissolved C2H2 concentration than either ester in each configuration. Figure 11 reports the total combustible-gas rate, with natural ester higher at several sampling times. Pressboard decomposition can contribute CO and CO2; the corona with/without-pressboard comparison provides the direct evidence for this contribution in the present data.
Beyond the generation pathways, the measured dissolved-gas concentrations are further modulated by differences in gas solubility (Ostwald coefficients) among the fluids—an additional reason why DGA criteria for ester liquids require separate calibration. At the 50 °C chromatographic extraction temperature, the listed CO2 coefficients are higher for natural and synthetic ester oils (1.14 and 1.53) than for mineral oil (0.92), whereas the CO coefficients are similar across the three oils (0.11–0.13). Hydrogen has the lowest listed coefficient among the characteristic gases (0.06 in each oil), indicating similar H2 solubility across the three oils at this temperature. The listed coefficients follow K(CO2) > K(CO) > K(H2) in all three oils, whereas the ordering of the hydrocarbon-gas coefficients varies with oil type [27,28,29].
These solubility differences have two implications for the interpretation of DGA results. First, the dissolved concentration does not equal the total gas production: a given quantity of generated gas partitions differently between the dissolved and free phases in mineral oil and in ester liquids, so that a direct comparison of dissolved concentrations between fluid classes introduces a systematic bias. Second, in practical equipment containing a gas phase (conservator, gas relay), H2 can partition into the gas phase because of its low solubility in all three oils; assessment based solely on dissolved H2 may therefore underestimate gas generation. The headspace extraction–chromatography calculation itself likewise relies on Ostwald coefficients, and applying mineral oil coefficients to ester samples directly introduces systematic concentration errors [29]. In the present experiments the main tanks were completely filled and sealed, which eliminates such gas-phase partitioning losses and ensures that the measured dissolved-gas concentrations faithfully reflect the gas-production process; when extrapolating the present results to operating equipment with a gas headspace, however, the solubility differences discussed above must be taken into account. A linear relationship between estimated cumulative discharge energy and the cumulative dissolved-gas volume was observed within each individual PD mode, the quantitative limits of which are examined in Section 4. The linearity deteriorates markedly when data from different discharge modes are pooled, demonstrating that gas yield is strongly dependent on the underlying discharge mechanism.
From a process-monitoring perspective, the energy–gas mappings established above can be organized into a quantitative online diagnostic workflow: (i) the PRPD unit continuously accumulates discharge energy according to Equation (1); (ii) the mode-specific energy–gas coefficient of the fluid in service converts the accumulated energy into an expected dissolved-gas volume; and (iii) any deviation between the expected and the DGA-measured gas levels flags abnormal gas generation, a transition between discharge modes, or cellulose involvement. Because these coefficients are both fluid and mode-specific, the workflow naturally accommodates ester-filled equipment, for which conventional ratio-based criteria are unreliable, and it can be integrated into the digital condition-monitoring systems of oil-immersed plants using only the synchronized PRPD and DGA data streams that modern monitoring units already provide.
The controlled conditions used here also identify priorities for future work to assess whether these energy–gas mappings can be applied in service. First, the present tests used new, unaged oil; future work will subject the three liquids to accelerated thermal and electrical ageing, so that the ageing-derived species and the synergistic ageing–discharge effects that develop in service can be quantified and separated from the intrinsic gas-generation behaviour of the fresh liquids. Second, all measurements were made under isothermal conditions at 20 ± 1 °C; the next stage will introduce controlled temperature gradients, since the Ostwald solubility coefficients are temperature-dependent and the partitioning of the generated gases between liquid and gas phase will therefore differ in operating equipment. Third, the electrode geometries were idealised and well defined, whereas service defects are irregular in shape and spatially distributed; future work will examine defect geometries closer to those encountered in practice, so that the field enhancement and the resulting discharge energy density at a real defect can be related to the present controlled cases. Fourth, in field equipment the discharging site and the oil sampling port are physically separated, so a further objective is to reproduce the associated transport delay and spatial concentration gradient, and to verify the mixing behaviour of the loop directly by tracer measurements, which the present study inferred only from a plug-flow estimate. Fifth, pressboard in service is itself progressively degraded, and future tests will use aged pressboard so that the additional carbon oxides it contributes can be included rather than treated as a controlled variable. The present study assesses parallel-tank consistency; independent repeat runs remain necessary to quantify run-to-run variability. Work along these lines will allow the present energy–gas mappings, established under well-defined laboratory conditions, to be progressively extended towards the interpretation of field DGA data.
6. Conclusions
This study systematically compared the dissolved-gas generation characteristics of mineral oil (Kunlun KI50X), natural ester (FR3) and synthetic ester (MIDEL 7131) under four representative partial-discharge regimes (corona, surface/creepage, cavity/void and floating-electrode), all with insulating pressboard present and the corona regime additionally without pressboard, as well as under intermittent spark discharge. The principal findings are as follows.
Under moderate-energy PD, mineral oil generates mainly H2 together with the hydrocarbon gases CH4 and C2H2, whereas both esters preferentially liberate H2 and CO owing to their ester linkages; the presence of pressboard further elevates CO and CO2 through cellulose decomposition, a contribution quantified experimentally only for the corona with/without-pressboard pair and otherwise inferred, an effect that must be accounted for when interpreting DGA results from oil–paper insulation systems.
When the discharge energy is increased to the level of intermittent sparking, the production rates of C2H2 and H2 converge to the same order of magnitude among the three liquids. This indicates that molecular-structure effects diminish once repeated dielectric breakdown occurs and high-temperature plasma chemistry begins to dominate.
Within each individual PD mode a clear linear relationship exists between estimated cumulative discharge energy and the cumulative volume of dissolved gas produced. This linearity deteriorates markedly when data from different discharge modes are pooled, demonstrating that gas yield is strongly dependent on the underlying discharge mechanism.
The present results also demonstrate concretely how the uncritical transfer of mineral oil criteria to ester-filled apparatus can mislead diagnosis. First, the fault type may be misidentified: under moderate-energy PD the ester liquids evolve gas mixtures dominated by H2 and CO, whereas in the key-gas experience accumulated for mineral oil a prominent CO content conventionally indicates a thermal fault involving the solid insulation. An ester-filled transformer with an actual PD defect could therefore be misreported as suffering from a thermal fault involving the pressboard, misleading the maintenance decision. Second, a mineral oil C2H2 threshold could misstate severity when applied to an ester-filled unit: at 6 h in each of the moderate-energy PD configurations shown in Figure 4, Figure 6, Figure 7 and Figure 8, the esters have lower dissolved C2H2 concentrations than mineral oil. The direction and size of any diagnostic error in service cannot be inferred from these endpoint comparisons alone, because gas partitioning, temperature, ageing and discharge mode can change the measured concentrations. The fluid- and mode-specific energy-to-gas relationships and the characteristic gas spectra established in this work provide a calibration basis for eliminating these two classes of systematic misjudgement: the discharge energy level and mode are determined electrically from the accumulated PRPD energy, and the chemical evidence is then interpreted using the gas-generation laws of the fluid actually in service, yielding a mutually corroborating electrical–chemical diagnosis.
Taken together, the results show that conventional mineral oil DGA interpretation schemes cannot be applied uncritically to ester-filled apparatus. Reliable fault diagnosis in ester-insulated equipment requires the combined use of electrical diagnostics (PRPD patterns and quantitative energy assessment) and oil-specific chemical diagnostics (DGA). The quantitative energy–gas mappings obtained in this work provide a foundation for the development of such oil-specific interpretation criteria.
Author Contributions
Conceptualisation, X.W. and Z.W.; methodology, X.W., W.Z. and Z.W.; software, J.S. and J.H.; validation, X.W., W.Z., J.S., J.H. and Z.W.; formal analysis, X.W., J.S. and J.H.; investigation, X.W., W.Z., J.S. and J.H.; resources, X.W. and Z.W.; data curation, J.S. and J.H.; writing—original draft preparation, X.W. and J.S.; writing—review and editing, W.Z., J.H. and Z.W.; visualisation, J.S. and J.H.; supervision, Z.W.; project administration, Z.W. All authors have read and agreed to the published version of the manuscript.
Funding
This research was funded by the Science and Technology Project of State Grid Shandong Electric Power Company(2025A-025/52062625000G). The APC was funded by State Key Laboratory of Electric Insulation and Power Equipment, Xi’an Jiaotong University.
Data Availability Statement
The original contributions presented in this study are included in the article. Further inquiries can be directed to the corresponding author.
Conflicts of Interest
Authors Xuelei Wang and Wenbing Zhu were employed by the Electric Power Research Institute, State Grid Shandong Electric Power Company. The remaining authors declare that the research was conducted in the absence of any commercial or financial relationships that could be construed as potential conflicts of interest. The authors declare that this study received funding from Electric Power Research Institute, State Grid Shandong Electric Power Company. The funder was not involved in the study design, collection, analysis, interpretation of data, the writing of this article or the decision to submit it for publication.
Abbreviations
The following abbreviations are used in this manuscript:
| PD | partial discharge |
| DGA | dissolved-gas analysis |
| PRPD | phase-resolved PD |
| MO | mineral oil |
| NE | natural ester |
| SE | synthetic ester |
References
- IEC 60599:2022; Mineral Oil-Filled Electrical Equipment in Service-Guidance on the Interpretation of Dissolved and Free Gases Analysis. International Electrotechnical Commission: Geneva, Switzerland, 2022.
- Duval, M. A review of faults detectable by gas-in-oil analysis in transformers. IEEE Electr. Insul. Mag. 2002, 18, 8–17. [Google Scholar] [CrossRef] [Scilit]
- IEC 62770:2013; Fluids for Electrotechnical Applications-Unused Natural Esters for Transformers and Similar Electrical Equipment. International Electrotechnical Commission: Geneva, Switzerland, 2013.
- IEC 61099:2010; Insulating Liquids-Specifications for Unused Synthetic Organic Esters for Electrical Purposes. International Electrotechnical Commission: Geneva, Switzerland, 2010.
- Loiselle, L.; Rao, U.M.; Fofana, I. Gassing Tendency of Fresh and Aged Mineral Oil and Ester Fluids under Electrical and Thermal Fault Conditions. Energies 2020, 13, 3472. [Google Scholar] [CrossRef] [Scilit]
- Meira, M.; Alvarez, R.; Catalano, L.; Verucchi, C. Dissolved gas analysis differences between natural esters and mineral oils used in power transformers: A review. IET Gener. Transm. Distrib. 2019, 13, 5441–5448. [Google Scholar] [CrossRef] [Scilit]
- Wang, Z.D.; Wang, X.; Yi, X.; Li, S.; Hinshaw, J.V. Gas generation in natural ester and mineral oil under partial discharge and sparking faults. IEEE Electr. Insul. Mag. 2013, 29, 62–70. [Google Scholar] [CrossRef] [Scilit]
- Xing, Y.; Hu, Y.; Ma, Y.; Liu, Y.; Dong, M.; Xu, Y. Difference analysis of dissolved gas in natural ester insulating fluids under typical electrical and thermal faults: An experimental study. High Volt. 2023, 8, 1206–1214. [Google Scholar] [CrossRef] [Scilit]
- IEEE Std C57.155-2014; IEEE Guide for Interpretation of Gases Generated in Natural Ester and Synthetic Ester-Immersed Transformers. IEEE: New York, NY, USA, 2014. [Google Scholar] [CrossRef] [Scilit]
- IEC 63585:2026; Interpretation of Dissolved Gas Analysis in Natural and Synthetic Esters. International Electrotechnical Commission: Geneva, Switzerland, 2026.
- Jovalekic, M.; Vukovic, D.; Tenbohlen, S. Dissolved gas analysis of natural ester insulating fluids under electrical and thermal stress. In Proceedings of the 16th International Symposium on High Voltage Engineering, Cape Town, South Africa, 24–28 August 2009. [Google Scholar]
- Perrier, C.; Marugan, M.; Beroual, A. DGA comparison between ester and mineral oils. IEEE Trans. Dielectr. Electr. Insul. 2012, 19, 1609–1614. [Google Scholar] [CrossRef] [Scilit]
- Khan, I.U.; Wang, Z.D.; Cotton, I.; Northcote, S. Dissolved gas analysis of alternative fluids for power transformers. IEEE Electr. Insul. Mag. 2007, 23, 5–14. [Google Scholar] [CrossRef] [Scilit]
- Muhamad, N.A.; Phung, B.T.; Blackburn, T.R. Dissolved gas analysis for common transformer faults in soy seed-based oil. IET Electr. Power Appl. 2011, 5, 133–142. [Google Scholar] [CrossRef] [Scilit]
- Gómez, N.A.; Wilhelm, H.M.; Santos, C.C.; Stocco, G.B. Dissolved gas analysis (DGA) of natural ester insulating fluids with different chemical compositions. IEEE Trans. Dielectr. Electr. Insul. 2014, 21, 1071–1078. [Google Scholar] [CrossRef] [Scilit]
- Coulibaly, M.L.; Perrier, C.; Marugan, M.; Beroual, A. Aging behaviour of cellulosic materials in presence of mineral oil and ester liquids under various conditions. IEEE Trans. Dielectr. Electr. Insul. 2013, 20, 1971–1976. [Google Scholar] [CrossRef] [Scilit]
- Liao, R.; Liang, S.; Sun, C.; Yang, L.; Sun, H. A comparative study of thermal aging of transformer insulation paper impregnated in natural ester and in mineral oil. Eur. Trans. Electr. Power 2010, 20, 518–528. [Google Scholar] [CrossRef] [Scilit]
- Bian, G.; Liu, Q.; Jarman, P.; Mavrommatis, P. Dissolved Gas Generation Characteristics of Dielectric Liquids Under Partial Discharges and Breakdown Sparks. High Volt. 2026, 11, 233–242. [Google Scholar] [CrossRef] [Scilit]
- Duval, M. The Duval triangle for load tap changers, non-mineral oils and low temperature faults in transformers. IEEE Electr. Insul. Mag. 2008, 24, 22–29. [Google Scholar] [CrossRef] [Scilit]
- Martin, D.; Wang, Z.D.; Dyer, P.; Darwin, A.W.; James, I.R. A comparative study of the dielectric strength of ester impregnated cellulose for use in large power transformers. In Proceedings of the 2007 IEEE International Conference on Solid Dielectrics, Winchester, UK, 8–13 July 2007; pp. 294–297. [Google Scholar] [CrossRef] [Scilit]
- Dai, J.; Wang, Z.D. A comparison of the impregnation of cellulose insulation by ester and mineral oil. IEEE Trans. Dielectr. Electr. Insul. 2008, 15, 374–381. [Google Scholar] [CrossRef] [Scilit]
- Duval, M.; Lamarre, L. The Duval pentagon-A new complementary tool for the interpretation of dissolved gas analysis in transformers. IEEE Electr. Insul. Mag. 2014, 30, 9–12. [Google Scholar] [CrossRef] [Scilit]
- GB/T 17623-2026; Determination of Componental Contents of Gases Dissolved in Insulating Oil by Gas Chromatography Method. Standards Press of China: Beijing, China, 2026.
- IEC 60243-1:2013; Electric Strength of Insulating Materials—Test Methods—Part 1: Tests at Power Frequencies. International Electrotechnical Commission: Geneva, Switzerland, 2013.
- GB/T 7595-2017; Quality of Transformer Oils in Service. Standards Press of China: Beijing, China, 2017.
- IEC 60270:2000; High-Voltage Test Techniques—Partial Discharge Measurements. International Electrotechnical Commission: Geneva, Switzerland, 2000.
- Müller, A.; Jovalekic, M.; Tenbohlen, S. Solubility study of different gases in mineral and ester-based transformer oils. In Proceedings of the 2012 IEEE International Conference on Condition Monitoring and Diagnosis, Bali, Indonesia, 23–27 September 2012; pp. 937–940. [Google Scholar] [CrossRef] [Scilit]
- Cai, S.; Chen, J.; Shao, M.; Li, H.; Yuan, S.; Wang, J. Dissolution properties of characteristic gases in nature ester insulating oils for power transformer. High Volt. Eng. 2017, 43, 2608–2613. (In Chinese) [Google Scholar]
- Schütt, C.; Atanasova-Höhlein, I. Solubility coefficients and their importance for the analysis of dissolved gases in insulating liquids. IEEE Electr. Insul. Mag. 2022, 38, 24–29. [Google Scholar] [CrossRef] [Scilit]

Disclaimer/Publisher’s Note: The statements, opinions and data contained in all publications are solely those of the individual author(s) and contributor(s) and not of MDPI and/or the editor(s). MDPI and/or the editor(s) disclaim responsibility for any injury to people or property resulting from any ideas, methods, instructions or products referred to in the content. |
© 2026 by the authors. Licensee MDPI, Basel, Switzerland. This article is an open access article distributed under the terms and conditions of the Creative Commons Attribution (CC BY) license.