


Abstract
The study of conglomerate mechanical properties is challenging due to their inherent heterogeneity and the limitations of conventional testing methods, which often yield highly scattered data. This research develops an integrated methodology combining CT-based 3D reconstruction with continuum-based discrete element method (CDEM) simulations to investigate conglomerate mechanical behavior. CT-derived geometry fixes the measured mesostructure, while the indentation-hardness contrast constrains relative constituent strength, jointly reducing the arbitrariness of conventional trial-and-error calibration. A 5% relative-error tolerance is adopted for calibration against UCS, E, and ν of the single CT-reconstructed specimen. Post-failure CT imaging provides a qualitative comparison of fracture characteristics. Using this calibrated approach, the effects of interface strength, gravel-matrix strength ratio, gravel content, spatial distribution, and particle size on mechanical properties are systematically investigated. Results reveal that high-strength interfaces enhance mechanical strength by restricting fracture propagation. Within the investigated model settings, UCS peaks at a gravel-to-matrix strength ratio of 1.5, whereas E peaks over ratios of 2–2.5. Predictive curves illustrate the relationship between gravel content and mechanical parameters; influenced by spatial distribution variations, mechanical parameters exhibit fluctuations around the curve, with compressive strength variability peaking at 25% gravel content. The gravel radius associated with maximum strength and stiffness is also conditional on the model settings. This study provides new insights into conglomerate mechanical properties and establishes a transferable methodology for simulating other heterogeneous geomaterials.
1. Introduction
Tight conglomerate reservoirs contain substantial hydrocarbon resources, but their efficient development requires drilling through rock whose mechanical response varies strongly over short distances. Wellbore stability, drilling efficiency, and the development of damage around an excavation depend on the strength and deformation of the gravel, matrix, and cemented contacts. Unlike homogeneous rock, conglomerate contains irregular clasts with broad size and property distributions, so load transfer is nonuniform and failure may shift between the matrix, interfaces, and gravel. Micro-geometric heterogeneity can therefore govern the macroscopic response even when bulk composition is similar [1,2].
Laboratory observations consistently associate conglomerate failure with constituent contrast and mesostructure. Gravel-matrix mismatch promotes localized deformation and crack initiation around clast boundaries, while cracks may bypass, penetrate, or terminate within gravel depending on the relative strengths of the phases [3,4]. Comparable inclusion-bearing materials show that clast size, shape, orientation, content, and cement properties alter stiffness, strength, and fracture topology [5,6,7,8]. These observations establish the physical relevance of the mesostructure but do not by themselves isolate the contribution of each variable.
Experimental characterization is further constrained by sampling. Standard cylindrical specimens are difficult to recover from weakly cemented conglomerate because coring can induce gravel spalling, interface separation, or complete disintegration. Even intact specimens differ in gravel content and arrangement, which produces broad scatter and prevents repeated tests on an identical internal structure. Consequently, laboratory data provide essential macroscopic bounds but are poorly suited to controlled one-factor-at-a-time studies of the internal variables that govern failure.
Numerical methods provide a complementary means of isolating these variables. Particle-based and discrete-element studies have reproduced transgranular, circumgranular, and interface-controlled cracking and have examined the effects of block proportion, particle size, cement strength, and spatial arrangement [9,10,11]. Bonded-particle and soil-rock mixture models have also clarified contact-force evolution and scale effects [12,13,14,15]. More broadly, mesoscopic and homogenization studies show that heterogeneity controls both extensive damage and effective elastic properties [16,17,18].
Despite this progress, two limitations remain prominent. First, many conglomerate models are two-dimensional, although clast contacts and fracture connectivity are intrinsically three-dimensional. Second, idealized circular or spherical clasts cannot represent the measured shape and spatial arrangement of natural gravel [9,19]. Recent discrete-element work on composite granular rock confirms the importance of inclusion geometry and arrangement, while finite-discrete modeling of block-in-matrix reservoirs demonstrates that block strength can redirect fracture growth.
X-ray computed tomography (CT) offers a route to specimen-specific geometry. CT-driven models have been used to reconstruct irregular aggregates and to compare simulated and observed three-dimensional fracture patterns in heterogeneous cementitious materials [20]. Subsequent frameworks have improved image-based segmentation, localizing damage formulations, and cohesive representations of complex mesoscale fracture [21,22,23,24,25]. These studies demonstrate the value of realistic geometry, but their transfer to conglomerate requires a fracture method that can represent both intact-phase damage and separation along numerous irregular interfaces.
The continuum-based discrete element method (CDEM) integrates finite-element deformation within blocks with discrete contact and fracture behavior along real and virtual interfaces. This formulation can represent crack initiation, coalescence, contact, and large post-fracture displacement without prescribing a single macroscopic crack path. CDEM has been applied to discontinuous rock masses and three-dimensional hydraulic fractures [26,27,28]. For conglomerates, their principal advantage is the ability to assign distinct properties to gravel, matrix, and their interfaces while retaining the CT-derived three-dimensional geometry.
This study makes three connected contributions to the investigation of conglomerate mechanics. First, CT-based reconstruction retains the measured gravel geometry and spatial arrangement of a natural core. Second, the reconstructed geometry and the measured gravel-to-matrix indentation-hardness contrast jointly constrain CDEM calibration, reducing the freedom of conventional trial-and-error fitting without guaranteeing a unique parameter set. Third, controlled variations in constituent contrast, interface strength, gravel content, arrangement, and size use the calibrated parameters as a common basis for interpreting heterogeneity effects. Section 2, Section 3 and Section 4 describe the experiments, formulation, reconstruction, and calibration; Section 5 presents the controlled comparisons and their applicability; Section 6 summarizes the findings.
2. Experimental Characterization
2.1. Geological Setting and Specimen Preparation
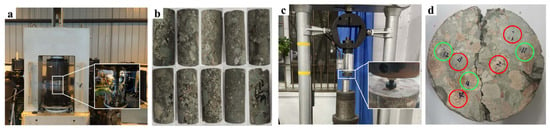
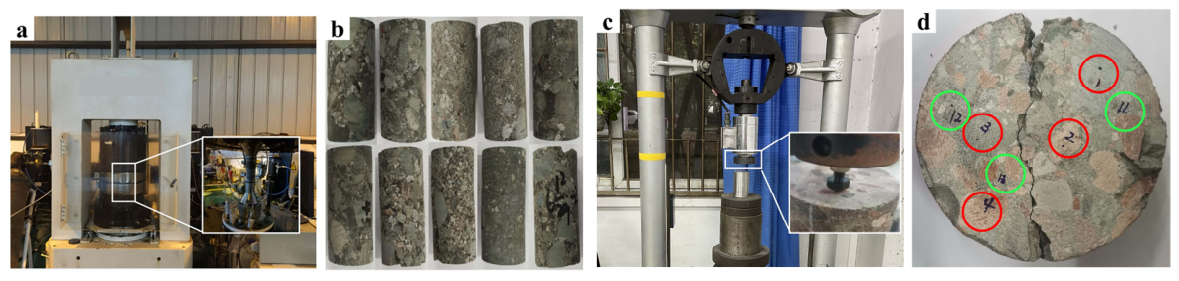
Conglomerate cores were recovered from three wells in the Mahu Oilfield, Junggar Basin, Xinjiang. The specimens originated from the Triassic Baikouquan Formation (T1b) at depths of approximately 2910–3688 m (Figure 1). Uniaxial compression was conducted with reference to the ISRM suggested methods for determining the uniaxial compressive strength and deformability of rock materials. The cylindrical cores had a nominal diameter of 25 mm and a length of 50 mm, giving a length-to-diameter ratio of 2.0.
Figure 1.
Testing facilities and specimens: (a) compression-test equipment; (b) cylindrical conglomerate cores with nominal diameter 25 mm and length 50 mm for uniaxial compression; (c) point-indentation equipment; (d) gravel (red circles) and matrix (green circles) indentation locations.
2.2. Mechanical Testing and Observed Variability
Uniaxial compression provided the composite-scale response, whereas point-indentation hardness tests were used to compare gravel and matrix locally. Hardness is positively associated with rock strength, although it is not a direct substitute for a complete constitutive characterization [29]. Test locations were assigned separately to gravel and matrix on the exposed specimen surface (Figure 1c,d).
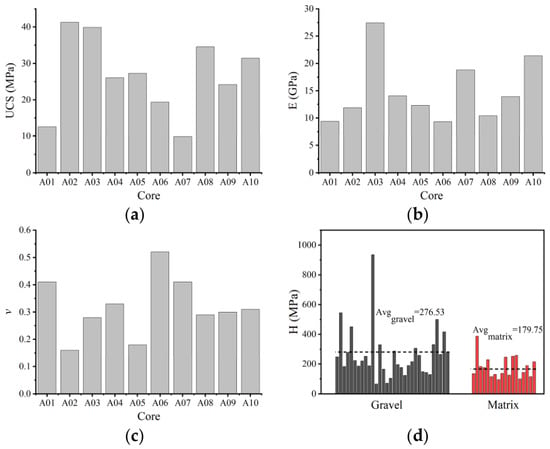
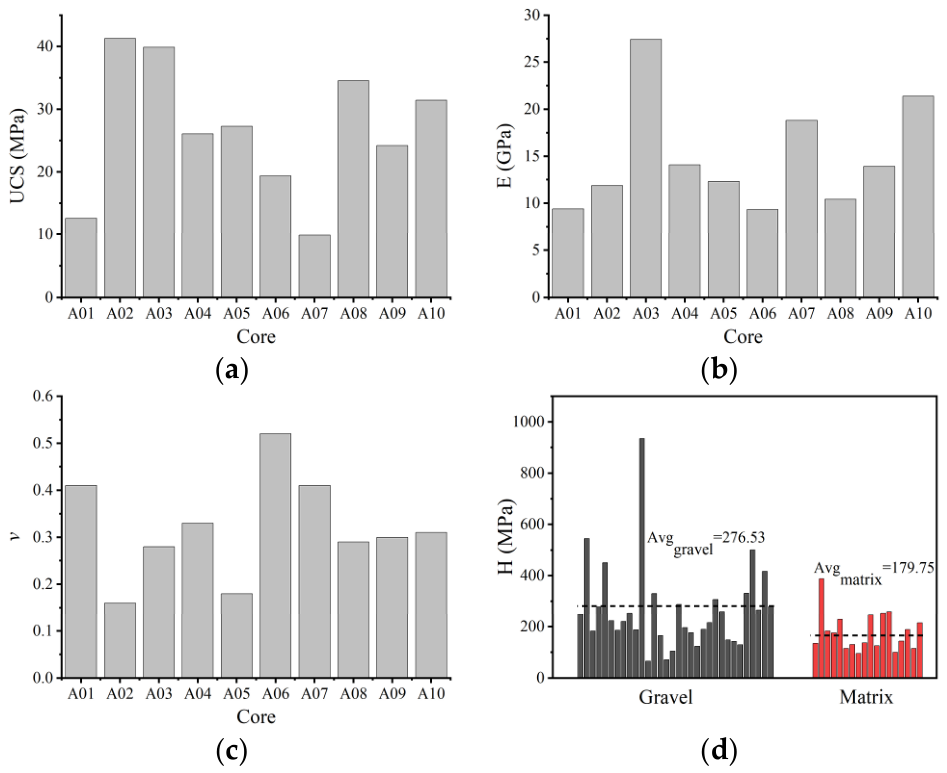
Ten uniaxial compression tests and 40 point-indentation tests were conducted (Figure 2). Uniaxial compressive strength, UCS, ranged from 9.86 to 41.29 MPa, with a mean of 26.65 MPa. Elastic modulus, E, ranged from 9.34 to 27.45 GPa (mean 14.91 GPa), and Poisson’s ratio, ν, ranged from 0.16 to 0.52 (mean 0.319). Gravel hardness ranged from 65.86 to 934.88 MPa (mean 276.53 MPa), whereas matrix hardness, H, ranged from 96.13 to 387.91 MPa (mean 179.75 MPa). The sample standard deviations estimated from the bar heights in Figure 2d were approximately 168 MPa for gravel and 75 MPa for matrix, indicating greater dispersion in the plotted gravel hardness values. The ratio of the mean gravel hardness to the mean matrix hardness was 1.54.
Figure 2.
Measured mechanical properties. UCS, E, and ν were obtained from ten uniaxial compression tests, and H was obtained from point-indentation tests: (a) UCS; (b) E; (c) ν; (d) H.
The reported hardness ranges are the observed minimum and maximum values, rather than confidence intervals. The gravel hardness spans a wider range than the matrix hardness, indicating that the phase means alone do not describe the observed scatter. The ratio of mean hardness values (1.54) is used below as a descriptive constraint on the constituent-strength contrast; it does not quantify uncertainty in that contrast. Together with the broad ranges in UCS, E, and ν, these results motivate the CT-based reconstruction and CDEM analysis of structural heterogeneity.
3. CDEM Formulation
3.1. Block-Contact Representation and Numerical Scheme
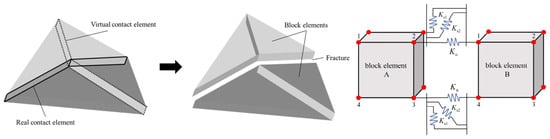
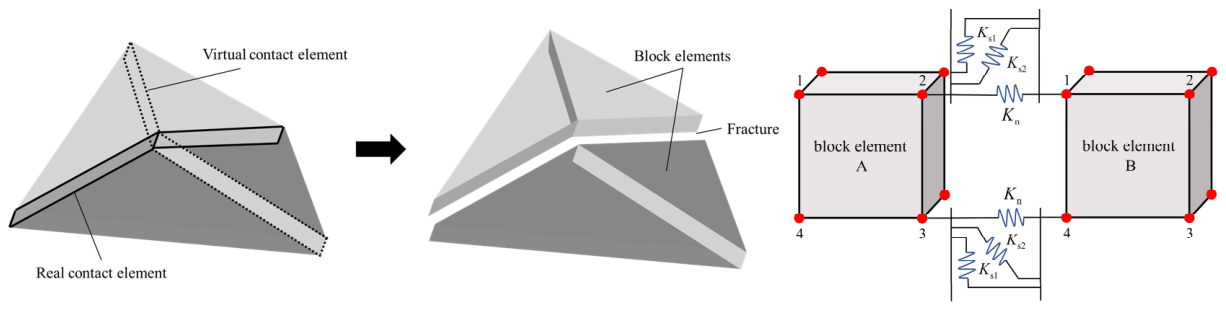
CDEM represents the domain by block elements and contact elements (Figure 3). Each block contains one or more finite elements and describes continuous deformation within gravel or matrix. Real contact elements connect distinct blocks and represent material interfaces or existing discontinuities. Virtual contact elements are embedded between adjacent finite elements and provide potential paths for damage and fracture within an initially continuous block.
Figure 3.
CDEM block-contact architecture and three-dimensional contact element.
A three-dimensional virtual contact element contains one normal spring and two orthogonal tangential springs. Before failure, these springs transfer normal and shear forces between neighboring block elements. Once a fracture criterion is satisfied, cohesive capacity degrades according to the prescribed fracture energy and the virtual contact becomes a real contact. The resulting contact formulation permits opening, sliding, separation, and renewed interaction after fracture, allowing cracks to cross gravel, follow interfaces, or propagate through the matrix.
For each finite element, translational equilibrium is written in the incremental form shown in Equation (1) [28]. In this expression, respectively, a, v, and s are the acceleration, velocity, and displacement arrays of all nodes in the element; sc and vc are the relative displacement and relative velocity arrays on the virtual contact element; M, C, and K are the mass, damping, and stiffness matrices of the element; Kc and Cc are the stiffness and damping matrices of the contact element; F is the nodal external load array. Contact contributions depend on the relative displacement and velocity across virtual elements, their stiffness and damping matrices, and the externally applied nodal load.
The element and contact contributions are assembled at shared nodes. Relative kinematics are evaluated in the local normal and tangential directions of each contact, so the same formulation accommodates arbitrary three-dimensional interface orientation.
The equations are advanced explicitly using the forward Euler incremental scheme in Equation (2). At each step, the solver calculates finite-element deformation and damping forces, evaluates contact forces, and then updates nodal resultant force, acceleration, velocity, and displacement. The imbalance ratio is monitored to assess quasi-static equilibrium [28].
3.2. Elastic-Damage-Fracture Constitutive Relations
The mechanical model combines linear elasticity inside each finite element with damage and fracture on virtual contacts. Block inputs are density, elastic modulus, and Poisson’s ratio. Contact inputs are normal and tangential stiffness, cohesion, friction angle, tensile strength, and the tensile and shear fracture energies.
The incremental isotropic elastic relation for the block elements is given in Equation (3) [26].
Here, K and G are the bulk modulus and shear modulus of the block material, respectively; σ is the stress tensor, Δσ and Δε are the stress and strain increments, and the Kronecker delta defines the volumetric contribution. Superscripts identify the current and subsequent calculation steps.
For each virtual contact, the normal and tangential force increments are first calculated from the relative-displacement increments using Equations (4) and (5) [26].
In these relations, Fn and Fs are the normal and tangential spring forces, kn and ks are stiffnesses per unit area, A is contact area, and Δdun and Δdus are the corresponding relative-displacement increments.
Tensile fracture is evaluated with the maximum tensile-stress criterion in Equation (6) [28].
When the criterion is exceeded, the tensile capacity is degraded according to the traction–separation relation in Equation (7).
The tensile-strength variables denote the initial, current, and updated capacities of the virtual contact; the softening response is controlled by normal relative displacement and tensile fracture energy.
Shear fracture is evaluated with the Mohr–Coulomb criterion in Equation (8).
If the shear criterion is exceeded, tangential force and cohesion evolve according to Equations (9) and (10).
The shear relation uses the contact friction angle, the initial and evolving cohesion, tangential relative displacement, and shear fracture energy. Together, the tensile and shear laws permit mixed-mode degradation before complete conversion to a frictional real contact.
4. Ct-Based Model Construction, Calibration, and Assessment
4.1. Ct Segmentation and Mesh Generation
CT-based reconstruction was used to retain the resolved internal gravel distribution of the selected core. A minimum gravel diameter of 2 mm was adopted for geometric segmentation to balance structural detail and computational cost; this cutoff is not the CT voxel size. The reconstruction focuses on the coarse gravel fraction described for the Mahu cores, while smaller particles are incorporated into the effective matrix continuum. Their separate volume fraction was not quantified here, so this treatment is a modeling assumption rather than evidence that all sub-2 mm particles are mechanically negligible throughout the Junggar Basin.
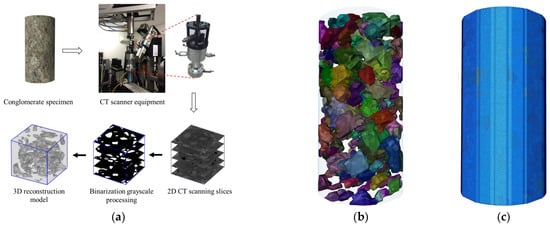
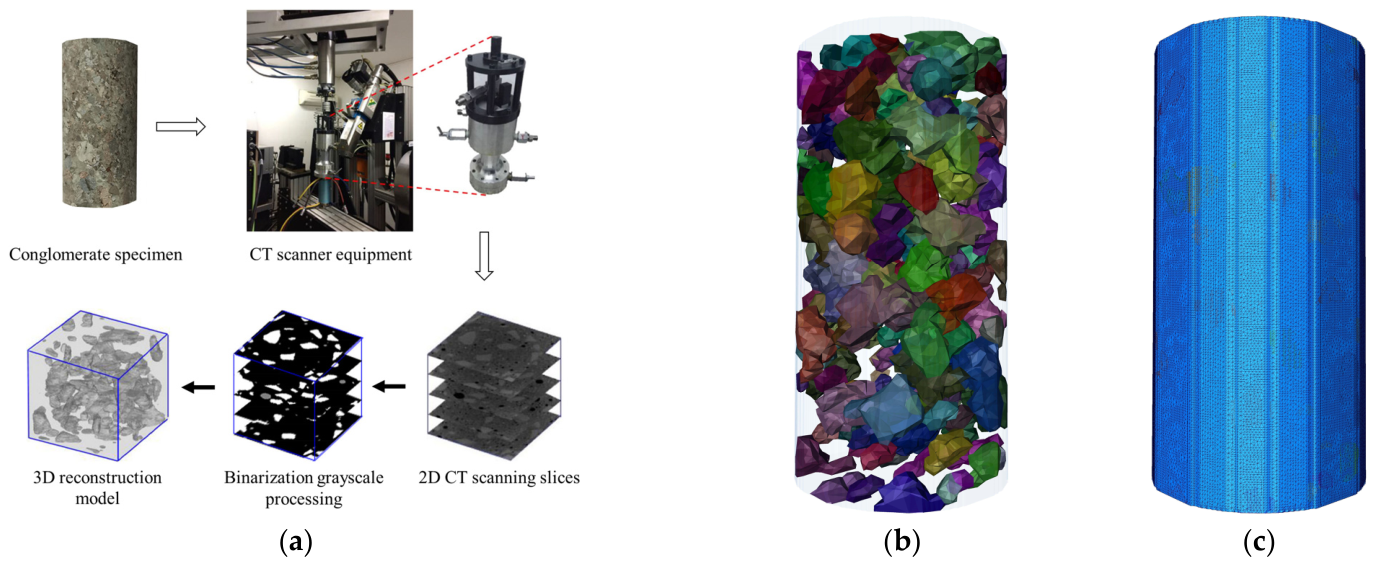
A cylindrical core with a diameter of 25 mm and a length of 50 mm was prepared from a depth of 3268.47 m in Well M1 and selected for CT scanning (Figure 4a).
Figure 4.
CT-based heterogeneous reconstruction: (a) image-processing workflow; (b) segmented gravel distribution with transparent matrix; (c) tetrahedral mesh.
The specimen was scanned using a Xradia Context micro-CT system at the State Key Laboratory of Oil and Gas Reservoir Geology and Exploitation. The scan produced 1005 two-dimensional slices, each containing 980 × 980 pixels. The use of micro-CT to distinguish fractures and mineral phases in heterogeneous geomaterials is well established [30].
The reconstructed model was meshed using the meshing module on the Avizo platform. Tetrahedral meshes were used according to the calculation requirements of the CDEM, and the mesh division was controlled by setting the maximum mesh edge length. A total of 1,435,668 tetrahedral elements were used in the model. Elements were assigned to gravel, matrix, or gravel-matrix interface groups. The mesh was exported in CDB format, checked and optimized in ABAQUS using a custom routine, and then imported into the CDEM solver.
4.2. Physically Constrained Parameter Calibration
4.2.1. Sensitivity of Macroscopic Properties to Microscopic Parameters
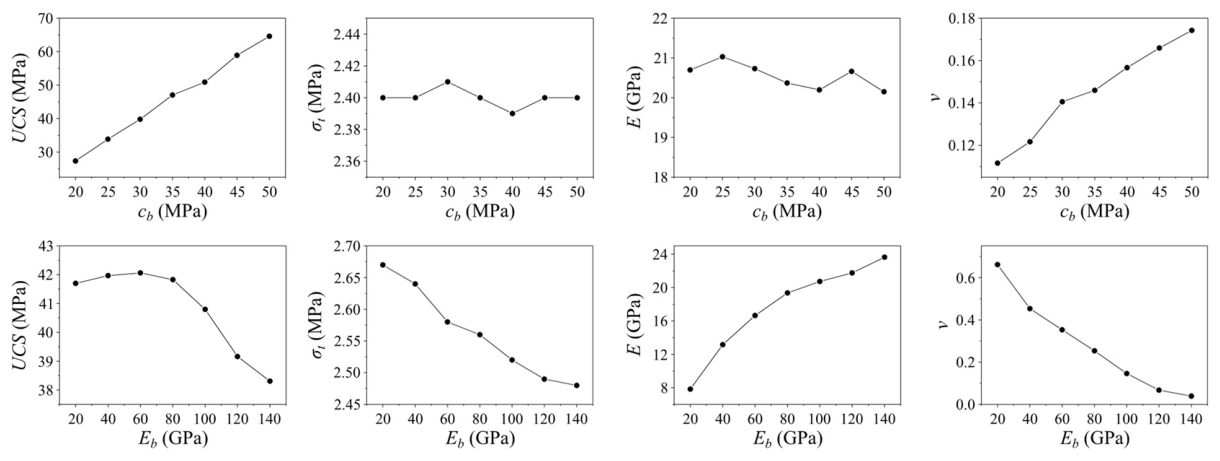
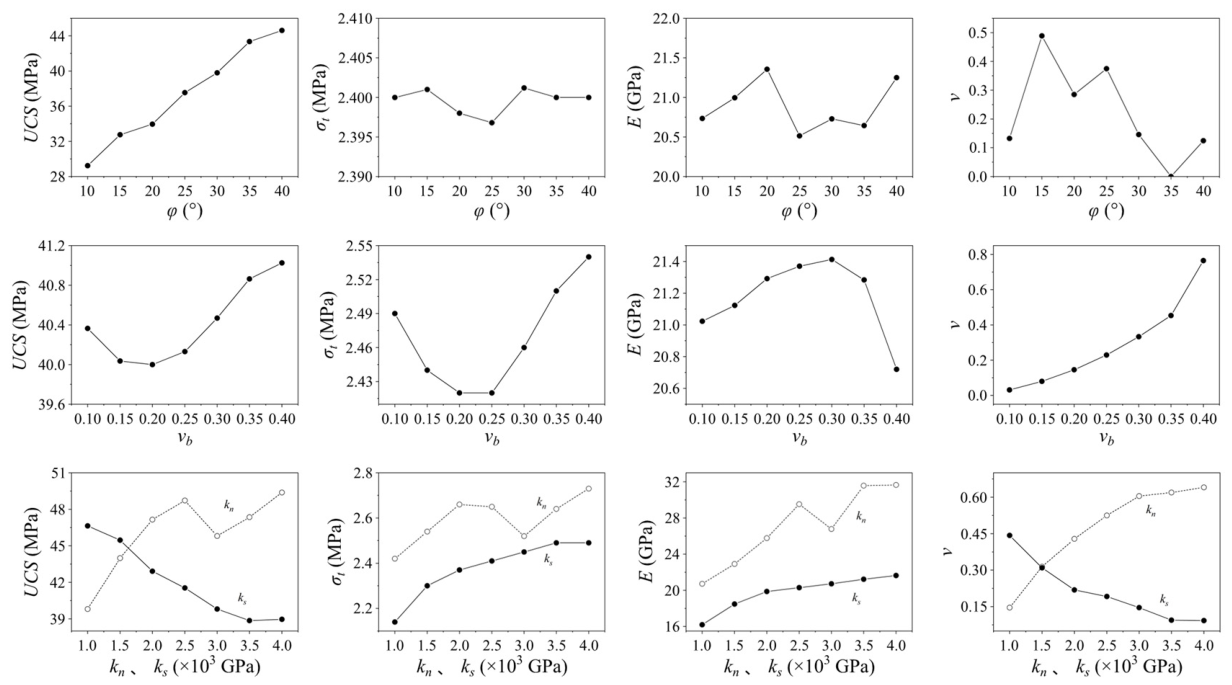
The relationships between microscopic inputs and macroscopic properties are not known a priori because the block and contact models interact nonlinearly. We therefore performed preliminary uniaxial compression and tension simulations on homogeneous cylinders 25 mm in diameter and 50 mm in height. Each microscopic input was varied independently to quantify its influence on the simulated macroscopic response.
Axial displacement was prescribed at the top and bottom surfaces at 0.02 mm per 1000 steps for compression and −0.001 mm per 1000 steps for tension.
Microscopic inputs govern macroscopic behavior by controlling distinct failure modes. For example, greater contact cohesion cb and friction angle φ increase resistance to shear failure along virtual contact elements. Crack initiation and propagation are consequently suppressed, which generally increases UCS.
Figure 5 shows that UCS increased with contact cohesion, friction angle, and normal stiffness, but decreased with tangential stiffness. Tensile strength was nearly insensitive to cohesion and friction angle, decreased as block elastic modulus increased, and increased with normal and tangential stiffness; its dependence on block Poisson’s ratio was non-monotonic. Macroscopic elastic modulus increased strongly with block modulus and normal stiffness, showed little sensitivity to cohesion, and was only weakly affected by tangential stiffness. Macroscopic Poisson’s ratio increased with cohesion, block Poisson’s ratio, and normal stiffness, but decreased with friction angle and tangential stiffness. These sensitivity patterns guided the sequence and direction of calibration adjustments.
Figure 5.
Sensitivity of macroscopic mechanical properties to microscopic model parameters.
4.2.2. Model Parameter Calibration
Microscopic inputs for gravel, matrix, and interfaces cannot be identified uniquely from a single macroscopic compression curve. We therefore used an iterative, physically constrained calibration with two complementary sources of information: indentation-hardness measurements to constrain the relative strength of gravel and matrix, and a specimen-scale acceptance tolerance for the measured macroscopic response. The hardness data are an additional physical constraint, not an independent specimen-level validation dataset. The resulting parameter set is specific to the CT-reconstructed specimen and the adopted CDEM formulation and discretization.
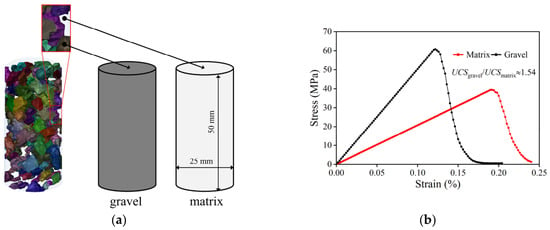
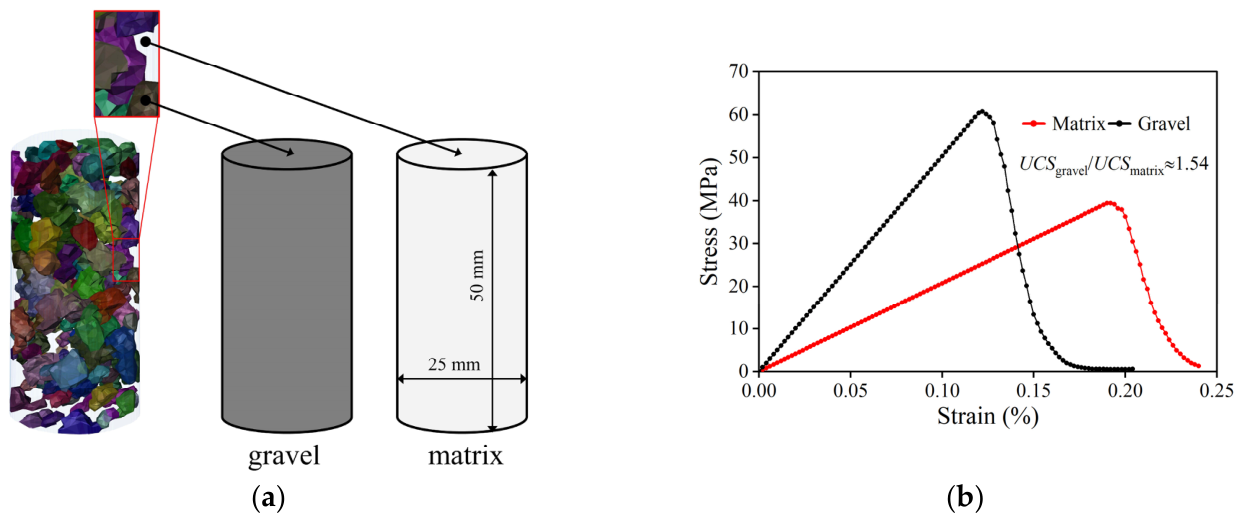
(1) Uniaxial compression simulations were performed on homogeneous gravel and matrix cylinders (Figure 6a). The ratio of their simulated compressive strengths, ng/m = UCSgravel/UCSmatrix, was constrained to approximately 1.54 using the measured ratio of mean indentation hardness values (Figure 2d). Hardness therefore constrains the relative constituent strength, rather than directly determining the elastic modulus or Poisson’s ratio of each phase.
Figure 6.
Constituent calibration: (a) homogeneous gravel and matrix models; (b) simulated stress–strain responses.
(2) Achieving a 1:1 relationship between the simulation and test results by calibrating the microscopic parameters in the simulation was challenging. In this study, the error range between the mechanical strength simulation results of the conglomerate specimen and the experimental results was within 5%, and it was considered that the appropriate microscopic parameters were obtained.
The final microscopic parameters are listed in Table 1. Block elastic constants and contact parameters were adjusted within the physically constrained calibration; they were not measured directly by indentation. The hardness ratio restricts the strength contrast between the homogeneous gravel and matrix models, while the macroscopic response of the reconstructed core constrains the remaining adjustments. These complementary constraints reduce fitting arbitrariness but do not establish a unique set of microscopic parameters.
Table 1.
Microscopic mechanical parameters used in the CDEM model.
4.3. Macroscopic Response and Fracture-Pattern Assessment
Table 2 shows the UCS, E, and υ obtained by the simulation and experiment, with errors of 4.67%, 4.05%, and 4.90%, respectively. The error threshold of 5% between the simulation results and experimental measurements was selected based on common practice in rock mechanics numerical modeling. This value represents a balance between achieving sufficient accuracy for engineering applications and accounting for the inherent uncertainties and simplifications involved in the modeling process, such as the discrete representation of a continuous medium, the idealized constitutive relationships, and the natural variability of rock properties [31,32].
Table 2.
Measured and simulated macroscopic mechanical parameters of the single CT-reconstructed specimen used for calibration.
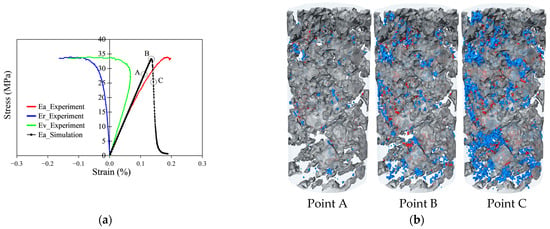
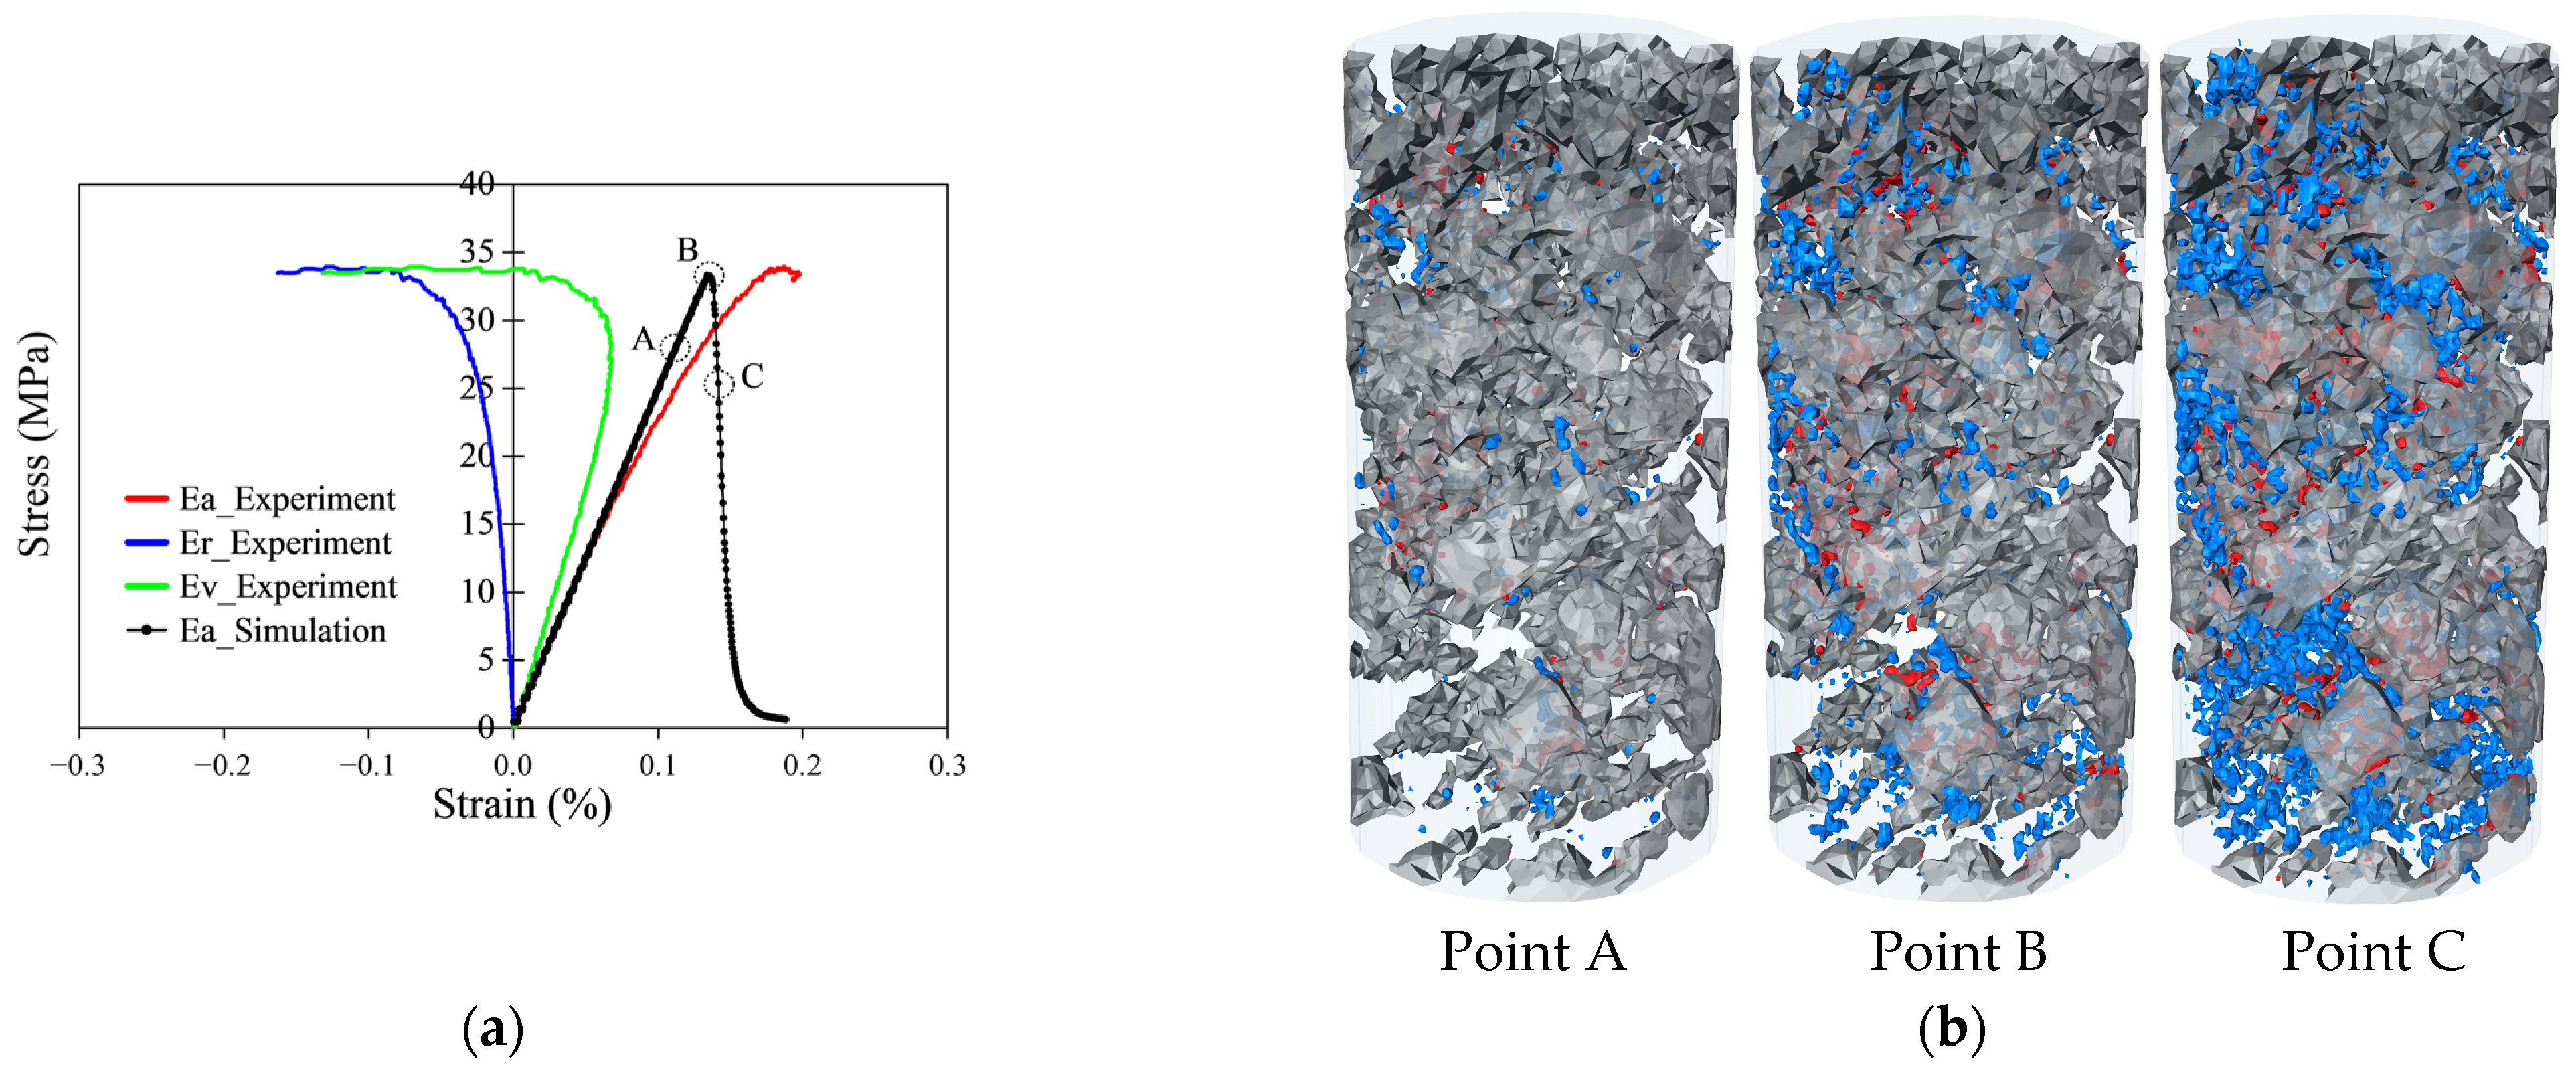
As shown in Table 2, the errors for UCS, E, and ν are all below the adopted tolerance, indicating acceptable agreement with the macroscopic calibration targets of this particular core. The stress–strain curves were obtained from the simulation experiment, and the fracture distribution at different compression stages, where gray represents the gravel particles, blue represents the fracture propagating in the matrix/interface, and red represents the fracture propagating in the gravel are shown (Figure 7). According to the distribution of fractures inside the conglomerate, the matrix or interface was mainly damaged, and a small amount of gravel was damaged, consistent with the CT scanning result.
Figure 7.
(a) simulated stress–strain response (gray represents gravel particles, blue represents failure cracks occurring in the matrix or cementation interface region, and red represents failure cracks occurring in the gravel region); (b) fracture evolution during uniaxial compression.
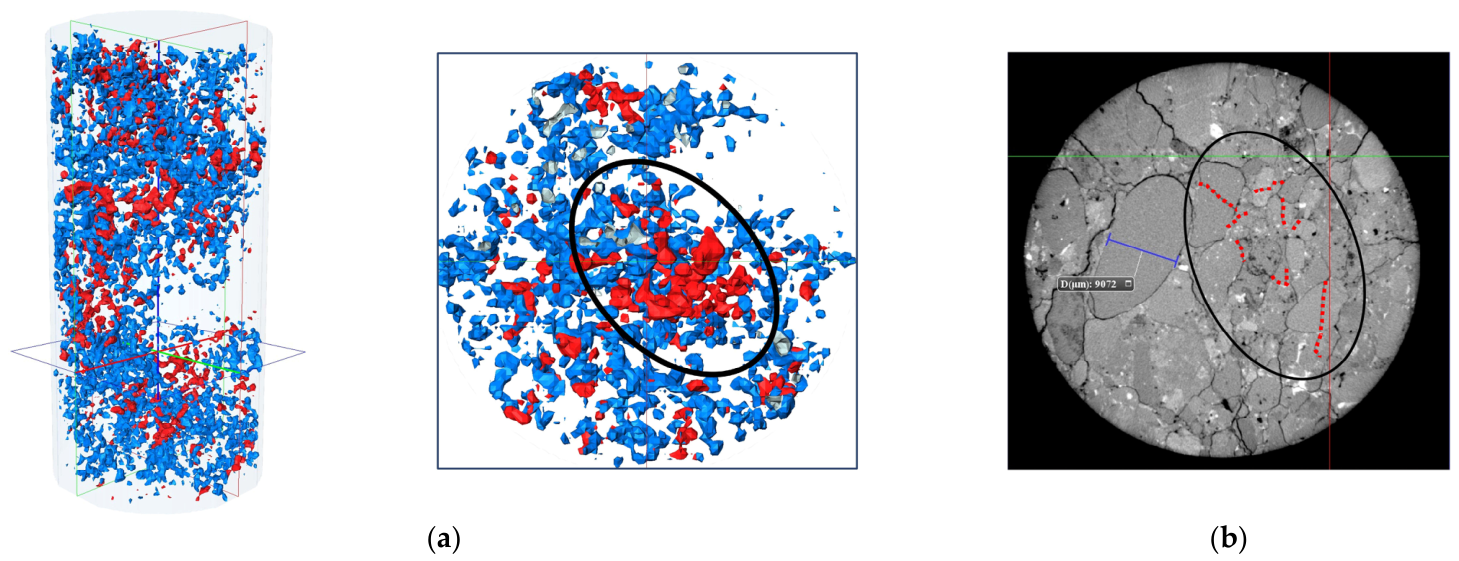
Figure 8 compares transverse views normal to the cylindrical specimen axis and the axial loading direction. The views are presented to illustrate the coexistence of transgranular fracture in the interior and circumgranular cracking toward the outer region. In the post-failure CT section (Figure 8b), the circled interior contains fractured gravel, whereas cracks outside this region more often bypass gravel. The same destruction pattern was also exhibited in the simulation (Figure 8a). In conclusion, this method can effectively simulate the uniaxial compressive strength of a conglomerate.
Figure 8.
Qualitative comparison of transverse fracture views normal to the specimen axis: (a) simulated specimen; (b) post-failure CT specimen.
5. Results and Discussion
5.1. Effect of Gravel-to-Matrix Strength Ratio
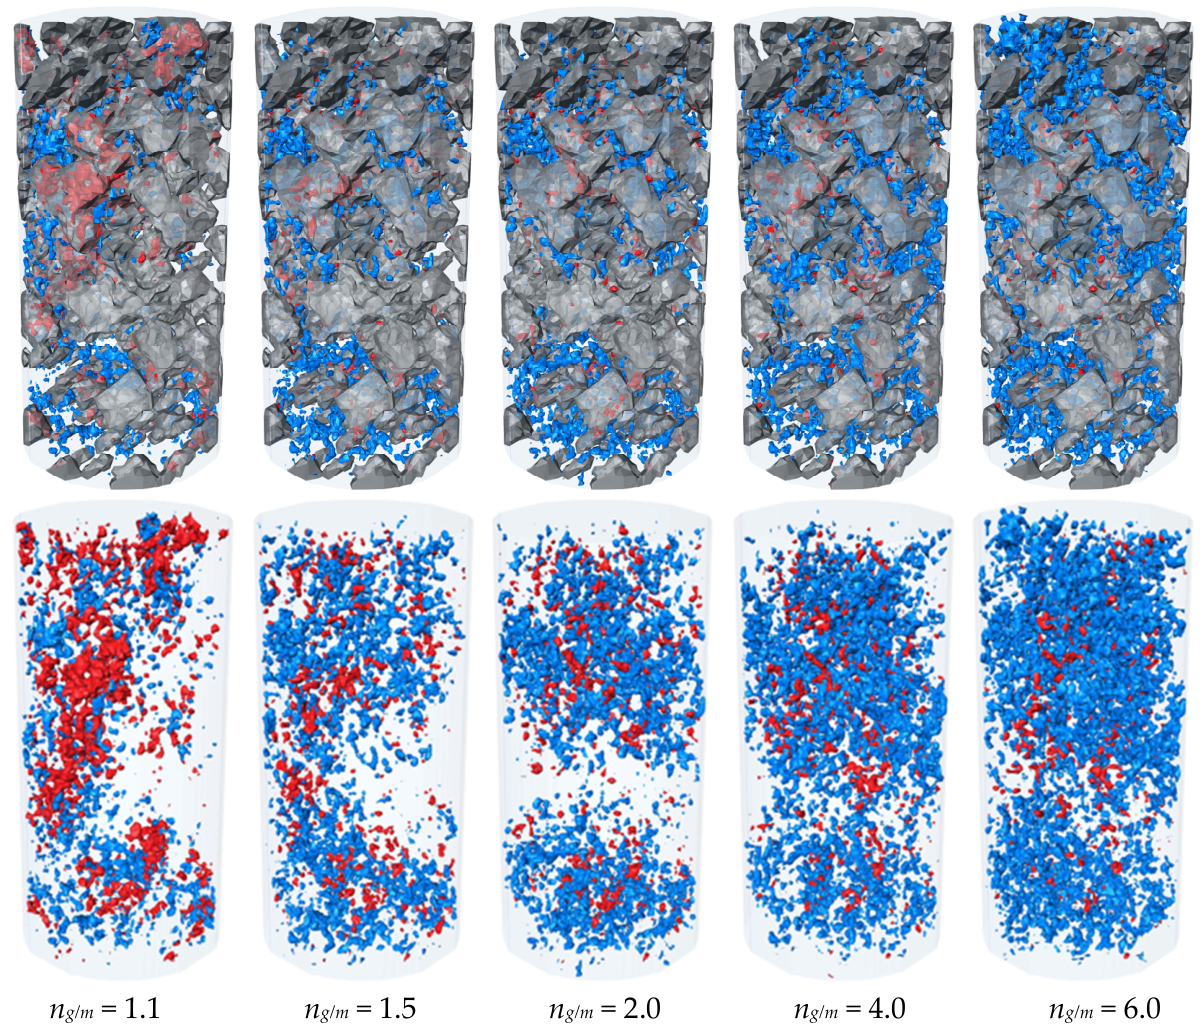
Fifteen uniaxial-compression simulations were used to isolate the effect of the gravel-to-matrix strength ratio, ng/m. Matrix properties and specimen geometry were held constant, while gravel strength was varied by scaling its microscopic strength parameters. Representative fracture patterns for ng/m = 1.1–6.0 are shown in Figure 9.
Figure 9.
Fracture patterns for different gravel-to-matrix strength ratios.
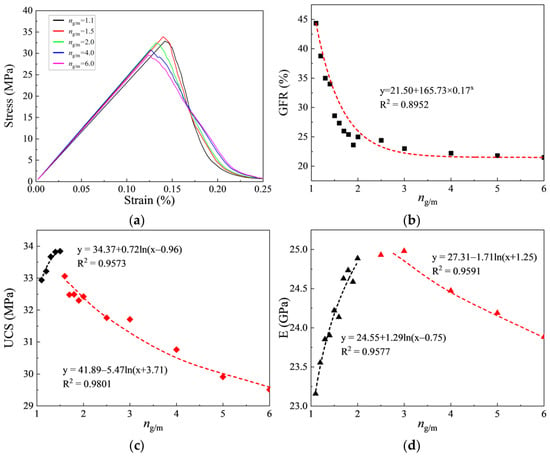
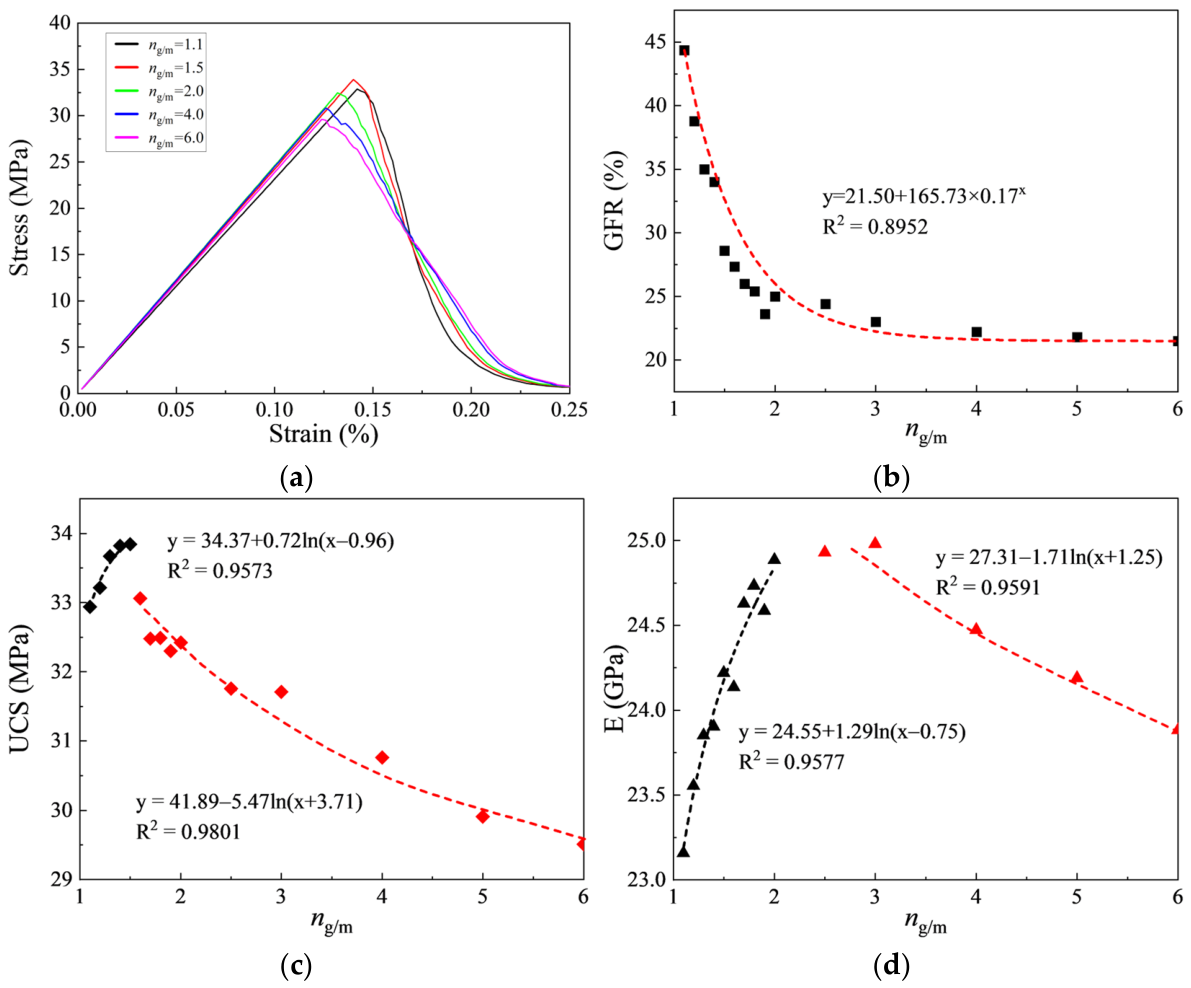
Both UCS and E increase initially with ng/m and then decrease after reaching distinct maxima (Figure 10). At ng/m = 1.1, cracks frequently cross the gravel and the gravel failure rate (GFR), defined here as the fraction of recorded fracture elements located in gravel, is high. Increasing gravel strength suppresses transgranular damage and increases the load required for macroscopic failure.
Figure 10.
Mechanical response for different gravel-to-matrix strength ratios: (a) stress–strain response; (b) gravel failure rate; (c) uniaxial compressive strength; (d) elastic modulus.
When ng/m exceeds approximately 2.5, the larger strength and stiffness mismatch produces more incompatible deformation at gravel boundaries. The associated local stress concentrations redirect damage toward the matrix and interfaces; at ng/m = 6.0, this phase-boundary damage dominates and the macroscopic strength decreases. Non-monotonic inclusion effects have also been reported for particulate composites [33].
The results indicate that an optimal strength ratio exists for maximizing mechanical performance. Within the investigated model settings, UCS reaches its maximum at ng/m = 1.5, whereas E peaks over ng/m = 2.0–2.5. These different maxima indicate that the constituent contrast associated with peak strength differs from that associated with elastic stiffness. The large strength difference leads to the instability in the internal structure of the conglomerate under load, and the overall strength of the conglomerate decreases.
5.2. Effect of Interface Strength
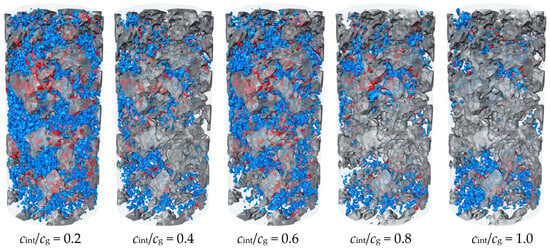
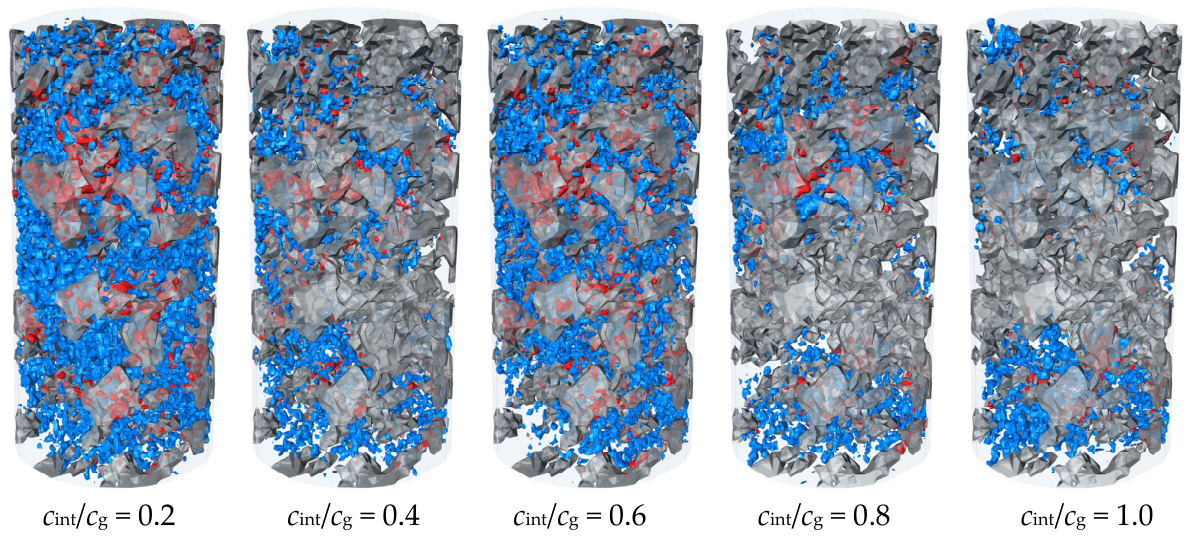
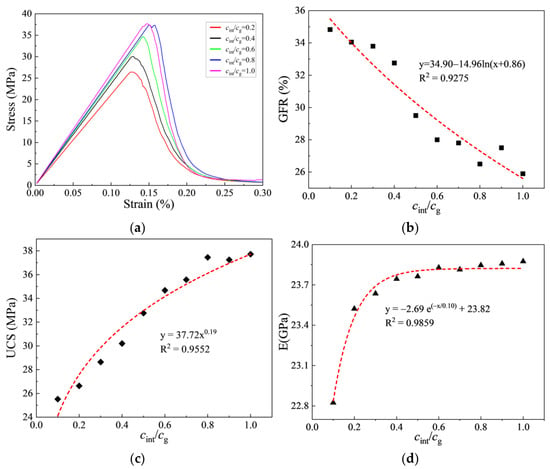
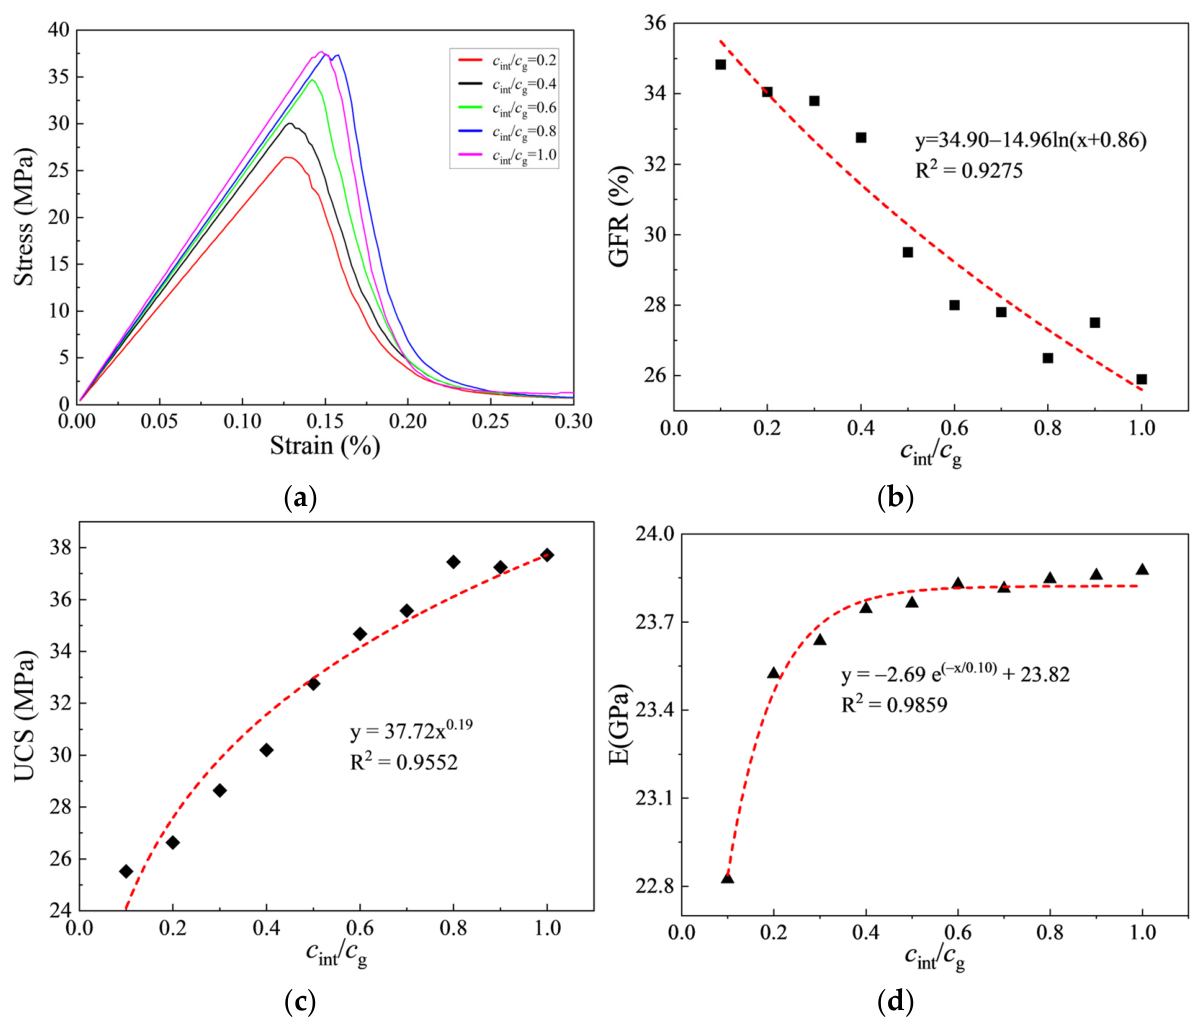
Interface effects were examined by varying the interface-to-gravel cohesion ratio, cint/cg, from 0.1 to 1.0 while holding other properties constant (Figure 11). Ten simulations were conducted.
Figure 11.
Fracture patterns for different interface-to-gravel cohesion ratios.
At low cint/cg, weak interfaces act as preferential initiation sites. Cracks develop around gravel, coalesce through the matrix, and form distributed throughgoing paths. As the interface strength increases, fewer contact elements fail and damage becomes less spatially extensive.
As cint/cg approaches 1.0, initiation shifts progressively from interfaces to the matrix and the GFR decreases (Figure 12). This result indicates that strong interfaces promote stress transfer around or through intact phases rather than allowing early circumgranular separation.
Figure 12.
Mechanical response for different interface-to-gravel cohesion ratios: (a) stress–strain response; (b) gravel failure rate; (c) uniaxial compressive strength; (d) elastic modulus.
UCS rises from 25.52 MPa at cint/cg = 0.1 to 37.71 MPa at cint/cg = 1.0, an increase of 47.7% (Figure 12c). E rises rapidly from 22.82 to 23.82 GPa between cint/cg = 0.1 and 0.6 and then changes only slightly (Figure 12d). Interface cohesion therefore has a sustained effect on peak strength but a diminishing effect on the small-strain stiffness of the calibrated model, consistent with the interface-controlled cracking reported by Luo [9].
5.3. Effects of Gravel Volume Percentage and Spatial Arrangement
Beyond the mechanical properties of individual constituents, gravel content is a key factor governing the heterogeneity and anisotropy of conglomerates. Under loading, stress concentrations develop at the edges and corners of irregular gravel particles [34,35,36]. To isolate the effect of gravel content while minimizing shape-induced variability, spherical particles with radii r = 2.50–2.60 mm were used in this series of simulations, with a minimum inter-particle spacing of 0.2 mm. The phase parameters calibrated on the CT-reconstructed core were held fixed across these idealized simulations.
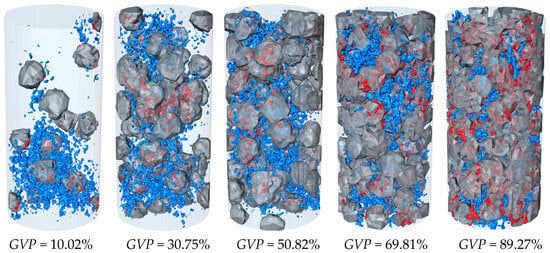
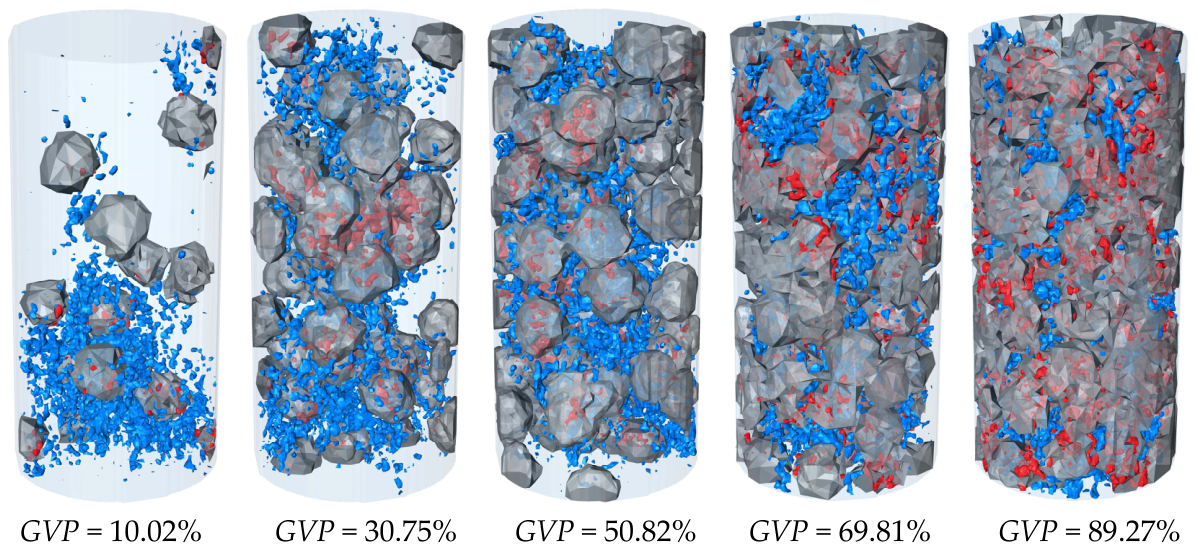
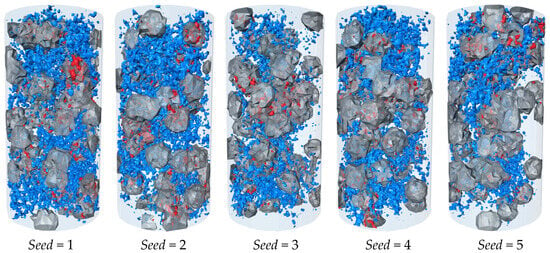
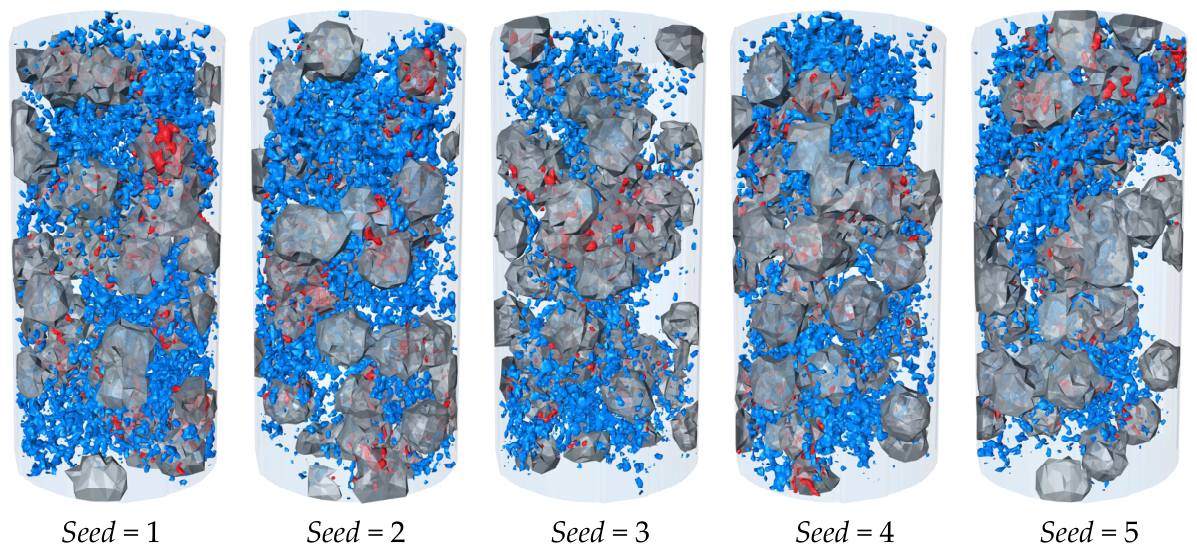
GVP ranged from 5% to 90% in 5% increments. Eight spatial realizations generated with different random seeds were analyzed at each GVP, giving 144 simulated specimens. Representative fracture fields are shown in Figure 13, and the eight arrangements at approximately 30% GVP are shown in Figure 14.
Figure 13.
Fracture patterns at different gravel volume percentages.
Figure 14.
Spatial realizations generated with different random seeds at the same gravel volume percentage.
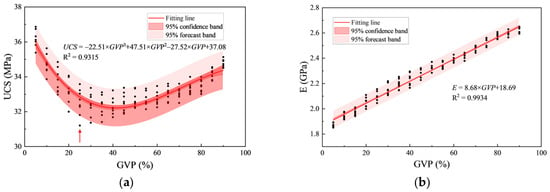
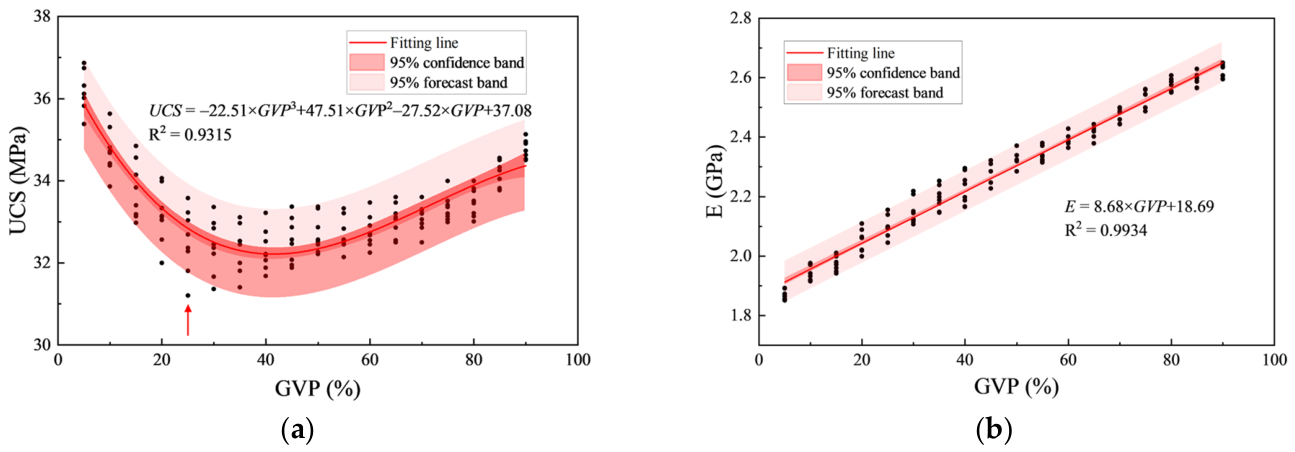
The central UCS trend follows a U-shaped relation with GVP: it decreases to a minimum near 25% and increases thereafter (Figure 15a). This transition agrees with physical-model and volcanic-bimrock observations that blocks begin to contribute positively to strength above an intermediate volume fraction [37,38]. In contrast, the central E trend increases approximately linearly with GVP (Figure 15b), as expected when the proportion of the stiffer phase increases [10,18].
Figure 15.
(a) Distributions of uniaxial compressive strength; (b) elastic modulus (The 95% confidence band describes uncertainty in the fitted regression mean, the 95% prediction band includes residual scatter for an individual simulated spatial realization).
At a fixed GVP, changes in spatial arrangement generate a range of UCS and E values. The UCS range first widens, reaches its maximum near 25% GVP, and then narrows. Spatial arrangement is therefore most influential where neither phase forms an overwhelmingly dominant load-bearing skeleton. The E range changes less with GVP, indicating lower sensitivity of elastic stiffness to random arrangement. The fitted relations in Equations (11) and (12) summarize the central GVP-dependent trends. In Figure 15, the 95% confidence band concerns the fitted regression mean, whereas the 95% prediction band concerns an individual simulated spatial realization and includes residual variability.
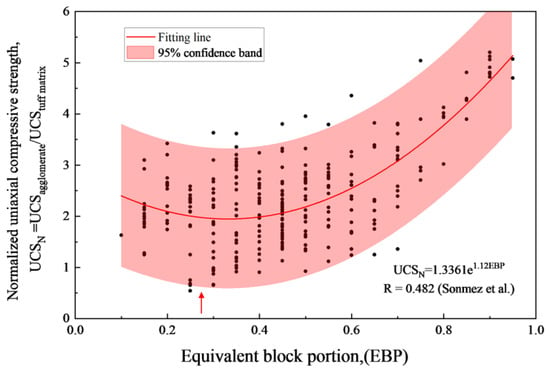
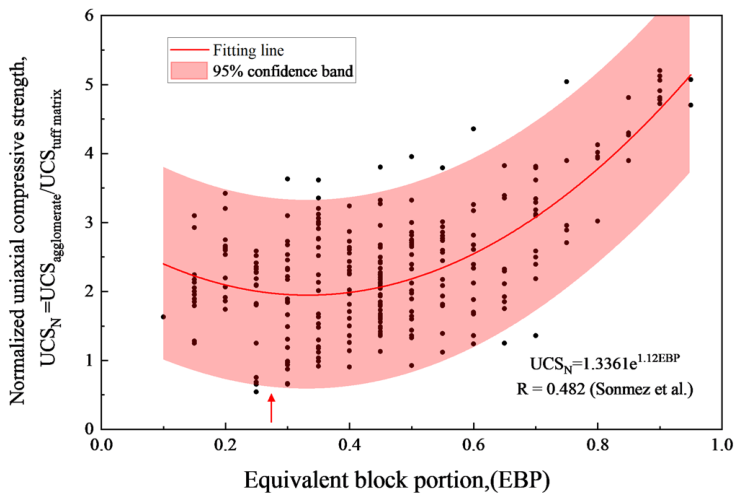
The observed scatter and trend are consistent with the experimental results of Sonmez et al., who tested 270 core specimens with varying block proportions (Figure 16). Their data also show maximum UCS dispersion at approximately 25% gravel content, validating the numerical findings. Although Sonmez did not investigate GVP below 12%, their data suggest an increasing UCS trend as GVP decreases from 20% to 12%, consistent with the U-shaped behavior identified in this study.
Figure 16.
Comparison with uniaxial compressive-strength data reported for 270 volcanic bimrock specimens [38].
5.4. Effect of Gravel Size
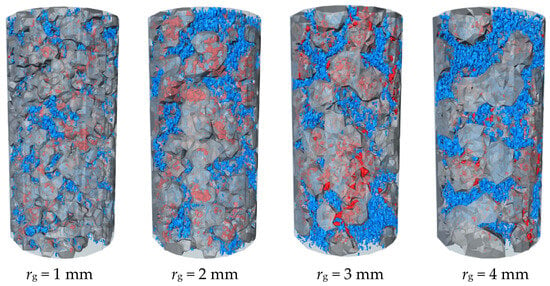
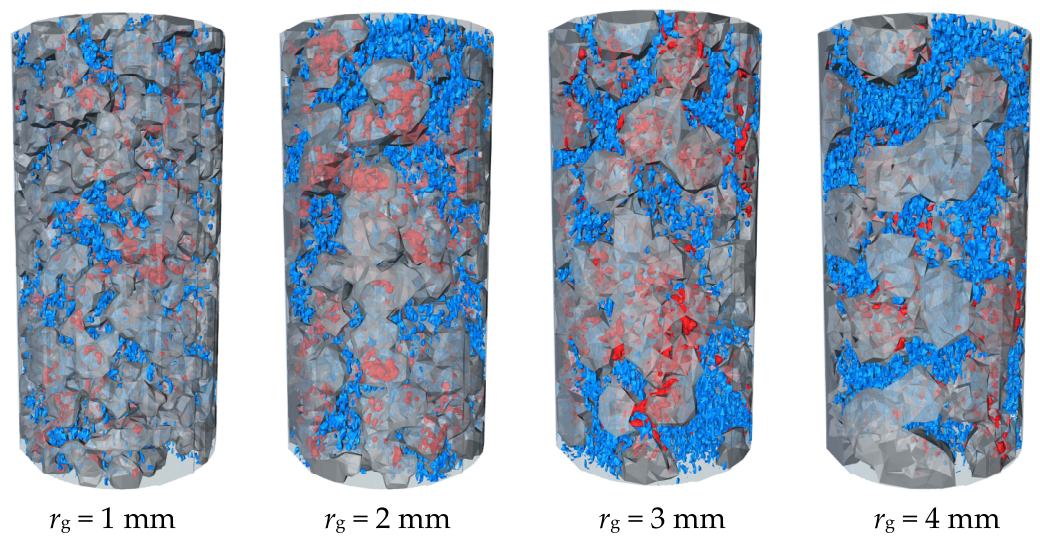
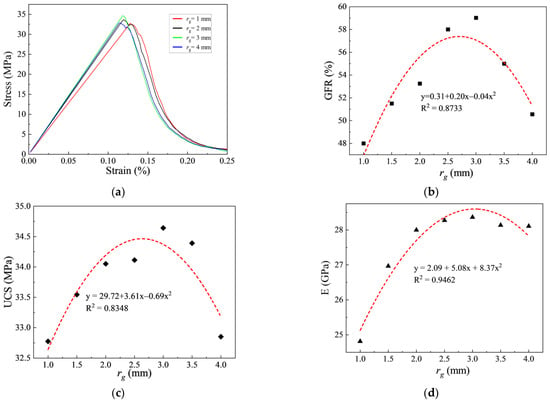
Gravel particle size is another critical factor affecting the mechanical response of conglomerates. To isolate size effects while minimizing variability from spatial distribution, specimens were generated with a constant GVP of 80% and gravel radii (rg) ranging from 1.0 to 4.0 mm. Figure 17 shows fracture distributions for rg = 1, 2, 3, and 4 mm; Figure 18 presents the corresponding stress–strain curves, GFR, UCS, and E.
Figure 17.
Fracture patterns for different gravel radii.
Figure 18.
Mechanical response for different gravel radii: (a) stress–strain response; (b) gravel failure rate; (c) uniaxial compressive strength; (d) elastic modulus.
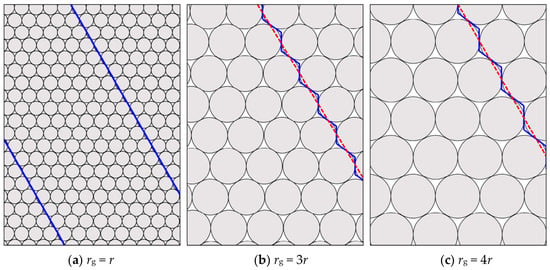
At rg = 1 mm, the large interface area provides connected weak paths. Cracks propagate mainly along gravel boundaries and form a comparatively planar circumgranular surface, giving the lowest GFR (Figure 19a).
Figure 19.
Schematic fracture-coalescence modes for different gravel radii.
For rg = 2.5–3.0 mm, fracture surfaces become more tortuous and cross gravel more frequently (Figure 19b). The additional transgranular damage increases GFR, UCS, and E. At rg = 4 mm, fewer particles are available to interact with an advancing crack, so GFR and the macroscopic properties decline relative to the 3 mm case (Figure 19c).
The non-monotonic trends in UCS, E, and GFR with increasing gravel radius (Figure 18b–d) thus arise from a trade-off between interfacial area (which promotes weak path propagation) and the frequency of gravel traversing fractures (which enhances energy dissipation).
5.5. Engineering Implications, Limitations, and Applicability
First, the model represents conglomerate as gravel, matrix, and gravel–matrix interfaces. Omitting explicit pores limits its ability to resolve local stress concentrations and the associated changes in crack initiation and propagation. At fixed constituent properties, this omission may also increase the simulated stiffness and strength. The phase and contact properties fitted to the measured response of the natural core are effective parameters of this three-phase representation and may absorb part of the bulk influence of porosity. The contribution of porosity to individual fitted parameters and its effect on the trends in Section 5 remain to be quantified. Pore-resolved meshes or stochastic pore networks constrained by measured pore-size distributions could be used to assess these effects.
Second, the current CT resolution limits the detection of micro-pores and micro-cracks within the gravel or matrix. Future work should aim to employ higher-resolution scanning techniques to capture these finer features. Additionally, developing multi-scale modeling approaches that can efficiently incorporate both meso-scale gravel/matrix structures and micro-scale pore distributions would be a promising direction. Such models could more accurately replicate the realistic fracture mechanisms, including the interplay between pores and gravel-matrix interfaces.
Finally, the parametric study focused on isolated factors (gravel strength, interface strength, content, distribution, and size) under uniaxial loading conditions. In reality, these factors interact in complex ways, and their coupled effects under different stress paths (e.g., triaxial compression, tension, or shear) warrant further investigation. Systematic design of experiments coupled with numerical simulations could help disentangle these interactions and lead to more general predictive models.
Notwithstanding the aforementioned limitations, the present methodology provides a robust framework for investigating the primary controlling factors of conglomerate strength. The findings establish a solid foundation for subsequent refinements that incorporate pore effects, finer-scale features, more complex constitutive behaviour, and multi-axial loading conditions. Such advancements will render numerical simulations more capable of capturing the full complexity of conglomerate mechanical behaviour in engineering applications.
6. Conclusions
This study systematically investigated the mechanical behavior of conglomerates and its influencing factors through CT-based 3D reconstruction and CDEM numerical simulation. The main conclusions are as follows:
(1) A novel integrated CT-based 3D reconstruction and CDEM simulation framework has been developed for conglomerate modelling, thereby establishing a physically constrained and experimentally validated calibration protocol. Indentation hardness tests provided independent physical constraints on the gravel-matrix strength ratio (approximately 1.54), thus eliminating the non-uniqueness inherent in trial-and-error parameter estimation. At the mesoscopic scale, the simulated fracture patterns were validated against post-failure CT imaging, demonstrating the method’s capability to capture realistic failure mechanisms. The calibrated model successfully reproduced both the quantitative macroscopic mechanical response (with errors controlled within 5%) and the qualitative failure characteristics, providing robust evidence of its ability to replicate true failure mechanisms.
(2) Interface strength and constituent contrast controlled different aspects of the response. Increasing cint/cg from 0.1 to 1.0 increased UCS by 47.7%, whereas the associated increase in E became small above cint/cg of approximately 0.6. UCS was highest near ng/m = 1.5, while E was highest over ng/m = 2.0–2.5, indicating different constituent contrasts for peak resistance and elastic stiffness.
(3) Across 144 random spatial realizations, the central UCS trend showed a U-shaped relation with GVP and its realization-to-realization range was largest near 25% GVP. The central E trend increased approximately linearly with GVP and was less sensitive to spatial arrangement. These results show that content and arrangement should be considered jointly when interpreting conglomerate strength.
(4) For the standard cylindrical specimens modeled here, compressive strength and elastic modulus first increase and then decrease as gravel radius increases. At the fixed GVP of 80% and the phase properties used in this series, both reach their highest values near a gravel radius of 3 mm.
The mechanical behavior of conglomerates may vary across different geological settings due to regional differences in rock strength and structural characteristics. Future research should investigate the individual and coupled effects of additional parameters not addressed in this study, including specimen size, gravel shape, strongly cemented interfaces, and the interdependencies among these factors.
Author Contributions
Conceptualization, H.M.; Methodology, H.M. and H.Z.; Software, Z.X. and J.G.; Validation, H.Z.; Resources, H.Z.; Data curation, K.L. and J.G.; Writing—original draft, Z.X.; Writing—review and editing, H.M. and Z.Z.; Supervision, H.M. All authors have read and agreed to the published version of the manuscript.
Funding
This project is supported by the Bureau-Controlled Scientific Research Project of Northwest Oilfield Company, SINOPEC. (No. KJ202338).
Data Availability Statement
The data presented in this study are available on request from the corresponding author.
Conflicts of Interest
Authors Zehao Xu, Haiyang Zhao and Jianru Gou were employed by the company Engineering Technology Research Institute of Sinopec Northwest Oil Field Branch, Urumqi, 830011, China. The authors declare that this study received funding from the Bureau-Controlled Scientific Research Project of Northwest Oilfield Company, SINOPEC. (No. KJ202338). The funder was not involved in the study design, collection, analysis, interpretation of data, the writing of this article or the decision to submit it for publication.
References
- Liu, G.; Cai, M.; Huang, M. Mechanical properties of brittle rock governed by micro-geometric heterogeneity. Comput. Geotech. 2018, 104, 358–372. [Google Scholar] [CrossRef] [Scilit]
- Xu, Z.; Liu, X.; Liang, L. Numerical investigation of hydraulic fracture propagation morphology in the conglomerate reservoir. Geofluids 2022, 2022, 6811300. [Google Scholar] [CrossRef] [Scilit]
- Ma, X.; Zou, Y.; Li, N.; Chen, M.; Zhang, Y.; Liu, Z. Experimental study on the mechanism of hydraulic fracture growth in a glutenite reservoir. J. Struct. Geol. 2017, 97, 37–47. [Google Scholar] [CrossRef] [Scilit]
- Wang, J.; Ge, H.; Liu, J.; Shen, Y.; Zhang, Z.; Luo, S.; Liu, D. Effects of gravel size and content on the mechanical properties of conglomerate. Rock Mech. Rock Eng. 2022, 55, 2493–2502. [Google Scholar] [CrossRef] [Scilit]
- Janeiro, R.P.; Einstein, H.H. Experimental study of the cracking behavior of specimens containing inclusions (under uniaxial compression). Int. J. Fract. 2010, 164, 83–102. [Google Scholar] [CrossRef] [Scilit]
- Akram, M.S.; Sharrock, G.B.; Mitra, R. Investigating mechanics of conglomeratic rocks: Influence of clast size distribution, scale and properties of clast and interparticle cement. Bull. Eng. Geol. Environ. 2019, 78, 2769–2788. [Google Scholar] [CrossRef] [Scilit]
- Kumara, J.; Hayano, K.; Shigekuni, Y.; Sasaki, K. Physical and mechanical properties of sand-gravel mixtures evaluated from DEM simulation and laboratory triaxial test. GEOMATE J. 2013, 4, 546–551. [Google Scholar]
- Khanlari, G.; Heidari, M.; Noori, M.; Momeni, A. The effect of petrographic characteristics on engineering properties of conglomerates from Famenin Region, Northeast of Hamedan, Iran. Rock Mech. Rock Eng. 2016, 49, 2609–2621. [Google Scholar] [CrossRef] [Scilit]
- Luo, S.; Ge, H.; Wang, J.; Zhou, W.; Shen, Y.; Liu, P.; Liu, J. Numerical simulation study on the crack propagation of conglomerate. R. Soc. Open Sci. 2021, 8, 202178. [Google Scholar] [CrossRef] [Scilit] [PubMed]
- Wang, S.; Li, Y.; Gao, X.; Xue, Q.; Zhang, P.; Wu, Z. Influence of volumetric block proportion on mechanical properties of virtual soil-rock mixtures. Eng. Geol. 2020, 278, 105850. [Google Scholar] [CrossRef] [Scilit]
- Tien, Y.; Lu, Y.; Cheng, H. Variability of mechanical properties of bimrock. In ARMA US Rock Mechanics/Geomechanics Symposium, 2015; ARMA: Overland Park, KS, USA, 2015. [Google Scholar]
- Ergenzinger, C.; Seifried, R.; Eberhard, P. A discrete element model to describe failure of strong rock in uniaxial compression. Granul. Matter 2011, 13, 341–364. [Google Scholar] [CrossRef] [Scilit]
- Su, O.; Akcin, N.A. Numerical simulation of rock cutting using the discrete element method. Int. J. Rock Mech. Min. Sci. 2011, 48, 434–442. [Google Scholar] [CrossRef] [Scilit]
- Gong, J.; Liu, J. Analysis on the mechanical behaviors of soil-rock mixtures using discrete element method. Procedia Eng. 2015, 102, 1783–1792. [Google Scholar] [CrossRef] [Scilit]
- Haeri, H.; Sarfarazi, V.; Zhu, Z.; Lazemi, H.A. Investigation of the effects of particle size and model scale on the UCS and shear strength of concrete using PFC2D. Struct. Eng. Mech. 2018, 67, 505–516. [Google Scholar]
- Lan, H.; Martin, C.D.; Hu, B. Effect of heterogeneity of brittle rock on micromechanical extensile behavior during compression loading. J. Geophys. Res. Solid Earth 2010, 115, B01202–B01216. [Google Scholar] [CrossRef] [Scilit]
- Xu, W.-j.; Zhang, H.-y.; Jie, Y.-x.; Yu, Y.-z. Generation of 3D random meso-structure of soil-rock mixture and its meso-structural mechanics based on numerical tests. J. Cent. South Univ. 2015, 22, 619–630. [Google Scholar] [CrossRef] [Scilit]
- Tsesarsky, M.; Hazan, M.; Gal, E. Estimating the elastic moduli and isotropy of block in matrix (bim) rocks by computational homogenization. Eng. Geol. 2016, 200, 58–65. [Google Scholar] [CrossRef] [Scilit]
- Li, L.; Meng, Q.; Wang, S.; Li, G.; Tang, C. A numerical investigation of the hydraulic fracturing behaviour of conglomerate in Glutenite formation. Acta Geotech. 2013, 8, 597–618. [Google Scholar] [CrossRef] [Scilit]
- Huang, Y.; Yang, Z.; Ren, W.; Liu, G.; Zhang, C. 3D meso-scale fracture modelling and validation of concrete based on in-situ X-ray Computed Tomography images using damage plasticity model. Int. J. Solids Struct. 2015, 67, 340–352. [Google Scholar] [CrossRef] [Scilit]
- Huang, Y.-j.; Zhang, H.; Zhou, J.-j.; Xu, S.-l. Efficient quasi-brittle fracture simulations of concrete at mesoscale using micro CT images and a localizing gradient damage model. Comput. Methods Appl. Mech. Eng. 2022, 400, 115559. [Google Scholar] [CrossRef] [Scilit]
- Huang, Y.-j.; Natarajan, S.; Zhang, H.; Guo, F.-q.; Xu, S.-l.; Zeng, C.; Zheng, Z.-s. A CT image-driven computational framework for investigating complex 3D fracture in mesoscale concrete. Cem. Concr. Compos. 2023, 143, 105270. [Google Scholar] [CrossRef] [Scilit]
- Huang, Y.-j.; Hai, L.; Li, Q.-h.; Zhang, H.; Cheng, Z.; Xu, W.-z.; Xu, S.-l. Stochastic analysis of dynamic fracture of concrete using CT-image based mesoscale models with a rate-dependent phase field method. Int. J. Impact Eng. 2025, 197, 105188. [Google Scholar] [CrossRef] [Scilit]
- Zhang, H.; Huang, Y.-j.; Xu, S.-l.; Hu, X.-j.; Zheng, Z.-s. 3D cohesive fracture of heterogeneous CA-UHPC: A mesoscale investigation. Int. J. Mech. Sci. 2023, 249, 108270. [Google Scholar] [CrossRef] [Scilit]
- Zhang, H.; Huang, Y.-j.; Xu, S.-l.; Natarajan, S.; Yao, F. An explicit methodology of random fibre modelling for FRC fracture using non-conforming meshes and cohesive interface elements. Compos. Struct. 2023, 310, 116762. [Google Scholar] [CrossRef] [Scilit]
- Feng, C.; Li, S.; Liu, X.; Zhang, Y. A semi-spring and semi-edge combined contact model in CDEM and its application to analysis of Jiweishan landslide. J. Rock Mech. Geotech. Eng. 2014, 6, 26–35. [Google Scholar] [CrossRef] [Scilit]
- Ju, Y.; Liu, P.; Chen, J.; Yang, Y.; Ranjith, P.G. CDEM-based analysis of the 3D initiation and propagation of hydrofracturing cracks in heterogeneous glutenites. J. Nat. Gas Sci. Eng. 2016, 35, 614–623. [Google Scholar] [CrossRef] [Scilit]
- Zhu, X.; Feng, C.; Cheng, P.; Wang, X.; Li, S. A novel three-dimensional hydraulic fracturing model based on continuum–discontinuum element method. Comput. Methods Appl. Mech. Eng. 2021, 383, 113887. [Google Scholar] [CrossRef] [Scilit]
- Quane, S.L.; Russell, J.K. Rock strength as a metric of welding intensity in pyroclastic deposits. Eur. J. Mineral. 2003, 15, 855–864. [Google Scholar] [CrossRef] [Scilit]
- Cui, J.; Liu, D.; Cai, Y.; Pan, Z.; Zhou, Y. Insights into fractures and minerals in subbituminous and bituminous coals by FESEM-EDS and X-ray μ-CT. Fuel 2019, 237, 977–988. [Google Scholar] [CrossRef] [Scilit]
- Jing, L. A review of techniques, advances and outstanding issues in numerical modelling for rock mechanics and rock engineering. Int. J. Rock Mech. Min. Sci. 2003, 40, 283–353. [Google Scholar] [CrossRef] [Scilit]
- Potyondy, D.O.; Cundall, P.A. A bonded-particle model for rock. Int. J. Rock Mech. Min. Sci. 2004, 41, 1329–1364. [Google Scholar] [CrossRef] [Scilit]
- Ramakrishnan, N. An analytical study on strengthening of particulate reinforced metal matrix composites. Acta Mater. 1996, 44, 69–77. [Google Scholar] [CrossRef] [Scilit]
- Chen, H.; Wan, J.-P. The effect of orientation and shape distribution of gravel on slope angles in central Taiwan. Eng. Geol. 2004, 72, 19–31. [Google Scholar] [CrossRef] [Scilit]
- Cho, G.-C.; Dodds, J.; Santamarina, J.C. Particle shape effects on packing density, stiffness, and strength: Natural and crushed sands. J. Geotech. Geoenviron. Eng. 2006, 132, 591–602. [Google Scholar] [CrossRef] [Scilit]
- Andriani, G.F.; Walsh, N. Physical properties and textural parameters of calcarenitic rocks: Qualitative and quantitative evaluations. Eng. Geol. 2002, 67, 5–15. [Google Scholar] [CrossRef] [Scilit]
- Lindquist, E.; Goodman, R. Strength and deformation properties of a physical model mélange. In ARMA North America Rock Mechanics Symposium, 1994; ARMA: Overland Park, KS, USA, 1994. [Google Scholar]
- Sonmez, H.; Gokceoglu, C.; Medley, E.; Tuncay, E.; Nefeslioglu, H. Estimating the uniaxial compressive strength of a volcanic bimrock. Int. J. Rock Mech. Min. Sci. 2006, 43, 554–561. [Google Scholar] [CrossRef] [Scilit]

Disclaimer/Publisher’s Note: The statements, opinions and data contained in all publications are solely those of the individual author(s) and contributor(s) and not of MDPI and/or the editor(s). MDPI and/or the editor(s) disclaim responsibility for any injury to people or property resulting from any ideas, methods, instructions or products referred to in the content. |
© 2026 by the authors. Licensee MDPI, Basel, Switzerland. This article is an open access article distributed under the terms and conditions of the Creative Commons Attribution (CC BY) license.