


Abstract
Smart waste management needs fill-level sensing that is accurate, affordable and reported in a reproducible way. This paper presents an IoT-enabled smart waste management system (SWMS) designed for the Special Economic Zone at Duqm (SEZAD), Oman, built around an Arduino Uno node with ultrasonic fill-level sensing, load-cell weighing, GPS and GSM communication. It reports a bench validation of the ultrasonic sensing, a partial component-level cost and a datasheet-based power estimate. Fourteen readings of an HC-SR04 sensor were taken around the 80% alert threshold (13.2 cm); ten fell in the alert region, with a mean of 13.38 cm (SD 0.37 cm; 95% CI 13.11–13.65 cm). Ranging accuracy was 99.37% (95% CI 98.59–100%) over the six readings nearest the threshold and 97.88% (95% CI 96.29–99.47%) over all ten, and all 14 alert decisions were correct (95% Wilson interval 78.5–100%). These values come from one sensor unit in a single run and are set beside three published accuracy figures (95.00–97.16%) whose protocols are not stated, so the comparison is indicative only. The priced bill of materials (USD 75.14 per bin) is partial, and the 3.3 W power figure is calculated from component ratings, not measured. A critical review of 21 studies identifies gaps in measurement-protocol reporting, multi-objective evaluation and field validation.
1. Introduction
Growing urban population and increasing commercial activities have made the management of Municipal Solid Waste (MSW) a major challenge in the operation of modern cities. Failure to collect waste in a timely manner results in environmental degradation, public health risks, and measurable decrease in citizen satisfaction, while fixed-schedule collection services for the collection vehicle waste fuel, labor, and vehicle life due to not utilizing vehicles as efficiently as possible. The shift to smart cities provides a path to escape this conundrum, as a digital sensing and communication layer enables collection efforts to match real needs instead of a schedule [1,2,3], and dynamic models have been proven for supporting high-priority collection scheduling in such contexts [4].
The technology that makes this possible is the Internet of Things (IoT). An operator is given real-time visibility of bin contents by instrumenting bins with low-cost sensors and linking them to a central management system, which enables the operator to only send vehicles to bins that need to be emptied and to calculate routes that will save the operator the distance traveled. There is a significant body of literature on this concept, including ultrasonic fill-level detection, gas and temperature sensing for hazard detection, radio-frequency identification and quick-response codes for user attribution, and machine-learning techniques for route optimization and waste classification [5,6,7,8,9,10].
However, the field is hard to evaluate as a whole, and this is due to three reasons that justify the present work. First, reported performance data may not include the measurement protocol for making the measurement; a 95% accuracy rating does not mean much unless it is known how many readings were made, at what distance, and whether it is the entire range that is reported or just the range around the alert threshold. Second, studies usually optimize for just one objective—minimizing fuel or maximizing detection accuracy—without characterizing the trade-offs between objectives that a municipal operator needs to consider when making decisions about how to run their systems. Third, many of the papers are only validated by simulation, and there is not enough information on the behavior of the actual sensing hardware.
Study Area
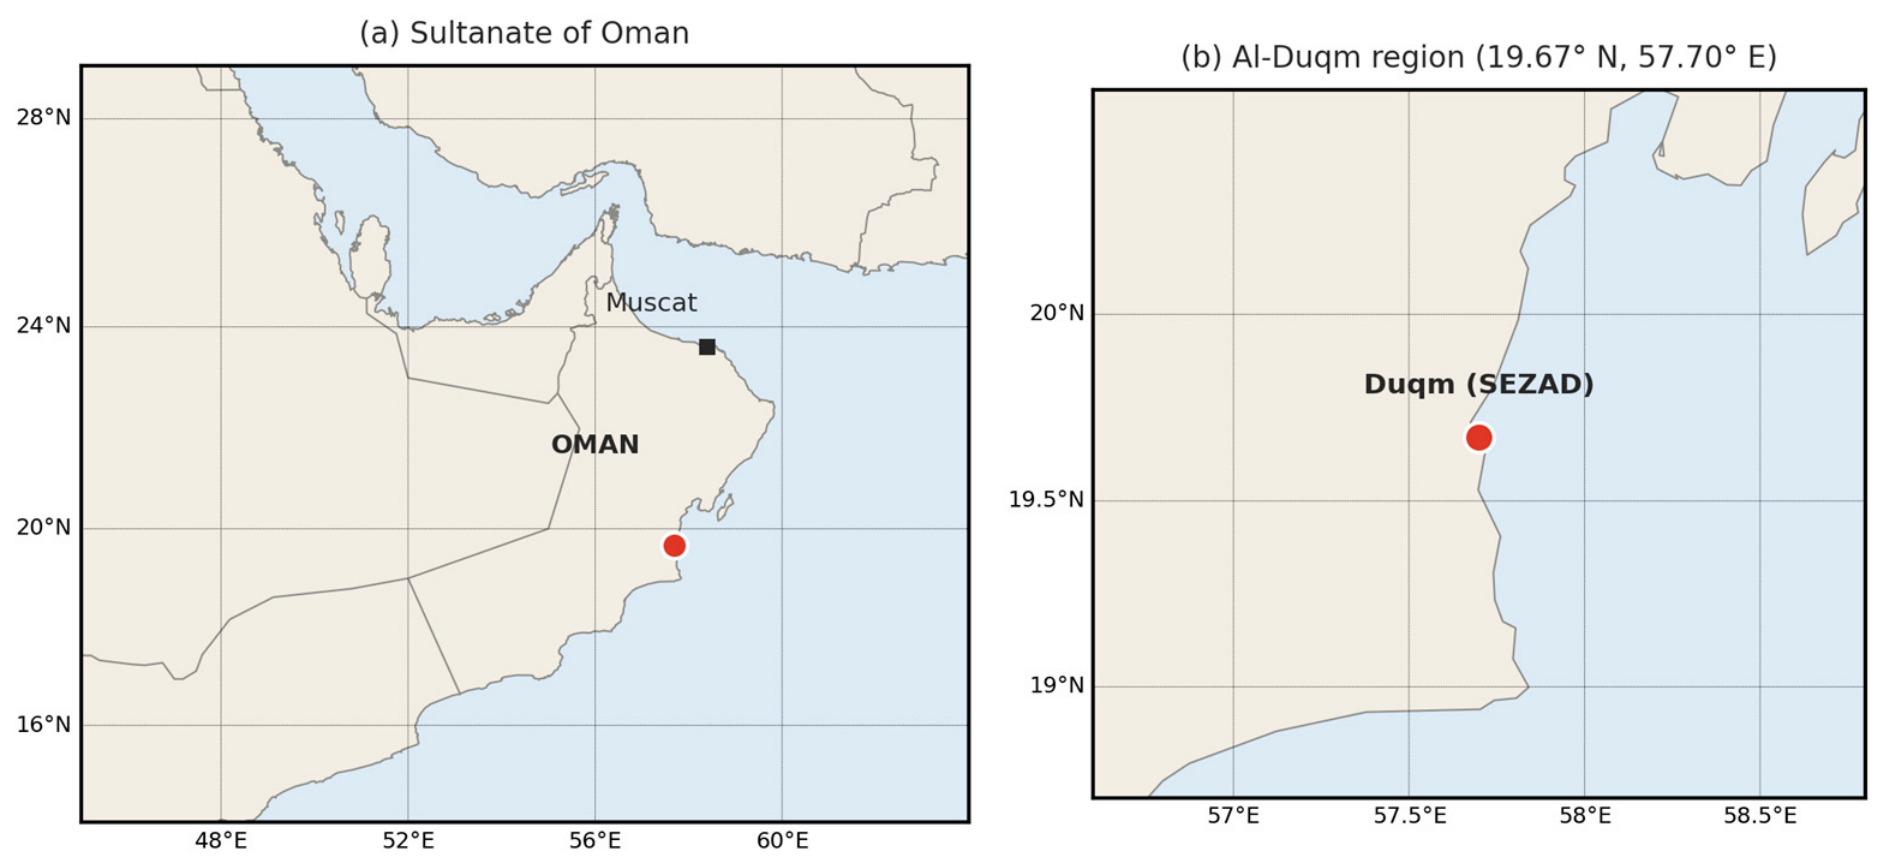
The system tested in this work is developed for Al-Duqm, the Special Economic Zone at Duqm (SEZAD), which is one of the most prominent economic destinations in the region due to its location, political stability, natural resources and topography. The zone covers an area of 2000 km2 with an ocean coastline of 90 km, and it is located in and acting as a catalyst of socio-economic development in the Sultanate of Oman [1]. It has an increasing infrastructure, an arid climate, and existing gaps in the provision of waste management, making it a demanding and representative case for the evaluation of an IoT-based collection system. The location of the zone is shown in Figure 1.
Figure 1.
The location of Al-Duqm (Special Economic Zone at Duqm, SEZAD) in the Sultanate of Oman: (a) a national map with the capital, Muscat; (b) a regional map of the Duqm coast. The maps were drawn by the authors from GSHHG coastline and boundary data.
The present paper fills these gaps by means of original experimental studies, put into perspective with a comparative review. The primary contribution is the design and experimental validation of an IoT-enabled smart waste management system for Al-Duqm. We characterize the fill-level detection accuracy of the HC-SR04 ultrasonic sensor at the operationally critical 80% threshold, reporting the full measurement protocol, the dispersion of the readings, and an explicit account of how the accuracy figure depends on the sample over which it is computed; we further report a partial component-level bill of materials and a datasheet-based estimate of the continuous power draw of the bin-side node. The secondary contribution is a structured review of twenty-one IoT-enabled waste management studies published between 2021 and 2023, in which each study is analyzed for its design and development method, its enabling tools, and its performance against three key indicators that recur across the field: accuracy level, route optimization, and energy consumption. A third contribution is a critical comparison of the algorithmic models used in waste-collection systems and of how this system is positioned against the closest published systems (Section 2.3 and Section 4.4).
The review establishes the baseline against which our measured results are benchmarked in Section 4.4. The comparative review is given in Section 2, the system is described in Section 3 and the experimental method is described and discussed in Section 4, with conclusions in Section 5.
2. Literature Review
Two failure modes are characteristic of traditional waste collection: bins that overflow before collection, and vehicles that are sent to bins that are almost empty. The work reviewed here shares a single objective—to move away from schedule-driven collection to demand-driven collection—and varies mostly in the manner in which the sensing is done, the communications technology, and the logic of the decision making.
2.1. Critical Review of Sensing Modalities and System Architectures
At the node level, the reviewed systems differ mainly in how much sensing is added to the basic level measurement and in the radio link used. Golden Julie [7] combined ultrasonic, gas and temperature sensors on Arduino Uno and NodeMCU boards; this extends the system from fill level to hazard detection, but every added sensor brings extra calibration work, and no accuracy figure is reported (Table 1). Jagtap et al. [8] paired ultrasonic level detection with LoRaWAN, which suits long-range, low-power links in populated areas but depends on gateway coverage; again, no accuracy figure is given against which the added infrastructure could be weighed. Both studies establish feasibility, but neither allows a reader to judge how reliable the level reading itself is, which is the quantity isolated by the experiment in this paper.
Table 1.
The sensing modalities identified in the reviewed literature.
System-level studies either move the intelligence away from the bin or widen the scope of the problem. Zhao and Shao [11] used lifecycle assessment to compare waste management actions on environmental and social criteria; this is useful for policy but does not address real-time collection decisions and reports no sensing or routing performance. Dubey et al. [12] applied machine learning together with IoT sensing in residential societies; no numerical detection accuracy is reported, so the benefit of the learning component cannot be separated from that of the sensors. Singh and Bajpai [9] shifted the intelligence from the bin into the vehicle with smart trucks and a conveyor loading mechanism; this automates loading, but the fill state of the bins is then not available to the operator before the vehicle arrives.
Interface and coordination layers have also been studied. Chetan et al. [13] demonstrated the value of the mobile application layer, with an application that let users specify collection requests and provided bin-level tracking; the value of such an interface depends on the quality of the fill data behind it, which is not characterized. Dixit et al. [14] addressed medical waste, where institutions share resources under centralized coordination, a regulatory and logistical setting whose lessons transfer to municipal waste only in part. Aparna et al. [10] placed quick-response codes on bins and required users to scan them to update the collection status; this increases accountability but relies on the users’ willingness and ability to act, which causes delays in high-density areas.
A third group concentrates on decision algorithms and system integration. Thirupathieswaran et al. [15] combined fuzzy-logic interpretation of sensor data with deep reinforcement learning for routing and reporting in a MATLAB R2021a simulation, so the reported benefit is not tied to measurements from physical sensors. Kumar et al. [16] built a multi-sensor node around a NodeMCU board, and Puppala et al. [17] integrated IoT sensors with cloud computing for real-time monitoring and route optimization; neither reports a numerical accuracy. Rahayu et al. [18] integrated volume monitoring with organic, metal and non-metal separation over the MQTT protocol and reported 97.16% accuracy—one of only three numerical accuracy figures in the reviewed literature. The sensing modalities encountered across these studies are summarized in Table 1. A further group developed comparable systems with similar approaches, algorithms and platforms: waste reduction and recycling [19], geographic information systems paired with smart collection bins [20], machine learning for a smart green campus [21], waste segregation with monitoring and analytics [22,23], sustainable-city waste systems [24], and bin management for densely populated areas [25]. These papers describe architectures and demonstrate feasibility, but none of them reports detection accuracy, route-optimization gain or energy use as a value that can be compared across studies. Rathnayake et al. [26] reported real-time fill-level detection with dual-sensing smart bins and real-time analytics at 95.00% accuracy, and Nugroho et al. [27] applied fuzzy logic to model uncertainty in sensor readings and reported 96.70% accuracy; neither states the number of readings, the measurement distance or the averaging convention, which is why the comparison in Section 4.4 is made with caution.
2.2. Review Methodology
The review proceeded in the five stages shown in Figure 2. Twenty-one recent project papers from 2021 to 2023 were gathered, and this time frame was selected to present not the “old” ways, but the most current enabling technologies. The design and development method, which is the process used to conceive and develop the system, and the design and development tools, which include the hardware platforms, communication technologies and algorithms used in the design and development of the system, were then analyzed from each paper.
Figure 2.
Research development method.
Scope and selection: This is a narrative critical review, not a formal systematic review, and no search protocol was registered. Studies from 2021 to 2023 describing IoT-based systems for the collection, monitoring or routing of waste were considered, and the 21 studies cited as [7,8,9,10,11,12,13,14,15,16,17,18,19,20,21,22,23,24,25,26,27] were retained because each gives a technical description of the sensing, communication or decision component. Studies of waste treatment or disposal without a collection or monitoring component, and papers without a technical description of the system, were not considered. The databases searched, the query strings and the numbers of records screened were not recorded during the review, so no selection-flow counts are reported. This is a limitation: the findings of Section 2.4 describe the studies retained and should not be read as an exhaustive survey of the field.
For each retained study, the design method, the enabling tools and the three indicators defined below were extracted.
Three main performance indicators were then defined, as the most relevant in a large number of projects in this area: accuracy level, route optimization, and energy consumption (Table 2). The accuracy level determines the reliability of the collection alert, route optimization determines fuel usage and latency to collect it, and energy consumption determines the time between maintenance cycles of the bin-side node. These three indicators are not independent; for example, a higher duty cycle of the sensor improves the responsiveness, but reduces the battery life. This is why considering them together is more informative than optimizing each of them individually.
Table 2.
The key performance indicators used in the analysis.
The three indicators are not found in a commensurable form in the majority of the studies, so that they cannot be quantitatively compared within the literature and constitute the main outcome of the review carried out. A quantitative value was reported for each indicator in only a minority of the studies reviewed; this is reflected in the data in Table 3. Of the twenty-one studies examined, only three report a numerical detection-accuracy figure—Rathnayake et al. [26] at 95.00%, Nugroho et al. [27] at 96.70%, and Rahayu et al. [18] at 97.16%—and none reports route optimization or energy consumption as a quantified, independently interpretable value. Improvements are instead described qualitatively, or expressed as percentage reductions against unstated baselines, which cannot be compared across studies.
Table 3.
Reporting coverage of the three key indicators across the reviewed studies.
We therefore deliberately refrain from presenting a cross-study bar chart of these indicators. Constructing one would require assigning numerical values that the source publications do not contain, and any apparent trade-off structure visible in such a chart would be an artifact of the assignment rather than evidence from the literature. The absence of comparable reporting is the substantive gap, and it is what motivates the measurement protocol adopted for our own experimental work in Section 3.4.
The pattern in Table 3 is unambiguous. Detection accuracy is quantified in three of the reviewed studies; route optimization is described qualitatively in four and quantified in none; energy consumption is quantified in none. This is not a criticism of any individual paper—each was written to demonstrate feasibility rather than to enable cross-study benchmarking—but it does mean that claims about the relative performance of IoT waste management architectures cannot currently be substantiated from the published record.
2.3. Algorithmic Models and Positioning of This Study
Beyond sensing, waste-collection systems differ in the algorithmic model that turns bin data into a collection decision. Reviews of IoT-enabled waste management systems [28]; of artificial-intelligence applications in solid waste management [29]; and of collection-optimization objectives, constraints and modeling approaches [30] cover these model types. In the studies reviewed here they can be grouped into four families: (i) threshold or rule-based triggering, in which a bin is serviced when its fill level or weight crosses a fixed limit; (ii) fuzzy-logic and other soft-computing models that interpret noisy sensor data, as in [15,27]; (iii) machine-learning models for fill-level prediction and waste classification, as in [12,21]; and (iv) routing optimization, from shortest-path and vehicle-routing formulations to reinforcement learning [15].
The families have different strengths. Rule-based triggering is simple and inexpensive to run on an 8-bit microcontroller, but it inherits every error of the sensor reading, so the accuracy of that reading is decisive. Soft-computing and learning models can compensate for noisy readings but need training data and more computing resources, and in the reviewed studies their benefits are either shown in simulation [15] or reported without a numerical accuracy (Table 3). Routing optimization reduces distance traveled but presupposes reliable fill information; none of the reviewed studies quantifies how sensing error propagates into routing performance.
Positioning of this study: The system described in Section 3 uses the first family: an alert is raised when the fill level reaches 80% or the weight limit is exceeded. This study therefore does not advance the algorithmic state of the art. Its contribution is a measured and reproducible characterization of the sensing input on which every model family depends, together with an openly stated cost and power basis. The comparison with the closest published systems is given in Section 4.4.
2.4. Summarized Research Gaps
Although there has been significant progress in the use of IoT in waste management, the literature surveyed shows a lack of coherence with regard to its scope and assessment. There are five common gaps that are repeatedly found.
There is the lack of attention given to multi-objective trade-offs. Systems are optimized for a single goal—minimum fuel cost or maximum detection accuracy—but systems that are optimized for one goal are not necessarily optimized for the other goals for which a municipal operator is responsible at the same time—time, cost, energy and environmental impact.
There are many situations in which measurement procedures are not reported. The accuracy figures are not accompanied by the number of readings, distance of measurement, environmental conditions or the sample of the figure being averaged, thus making a cross-study comparison difficult and impossible to reproduce.
Limited interoperability between types of waste and platforms. Studies usually focus on a single communication technology and a single waste stream, while the consideration of recyclable and electronic waste or scalability across a diverse municipal estate is neglected.
No methods are in place for engaging users. Current systems tend to lack citizen participation in the waste management process, and have very few behavioral reinforcement or community engagement aspects.
There are very few examples of real-life validation. A vast number of frameworks are tested in a simulated environment and practical issues like sensor drift, interference from the environment and the scalability are not addressed. The experiment conducted at the sensor level discussed in this paper tackles the second and fifth of these gaps directly.
3. Material and Methods
3.1. System Architecture
This study’s system has eight functional elements that interact to form the data path from the bin to the collection vehicle. The load cell is used to check the weight of the waste accumulated and will feed the weight reading into the microcontroller for further operation. It can accurately detect the fill level of the container in real time, sensing the contents of the container: it will be in sleep mode when the container shows an empty state; when the container does not show an empty state, it will transmit the fill level to the microcontroller. Arduino Uno is used as the main processor—it receives data from the load cell, the ultrasonic sensor and the GPS module and forwards it to the communication module. With the GPS module, it is possible to immediately determine one’s position on the map, and this is what allows for path optimization. The GSM module is the communication bridge between the microcontroller and the Internet, which sends the waste weight, fill level and location. The Center of Waste Management System is the center where all device data is collected, stored, and analyzed; the levels in the bins are monitored and locations of the bins for good decision making. Short message service alerts are sent to truck drivers: when a bin is full and the best route to take for efficient collection. These are connected to each other through the Internet, which facilitates communication between devices, stakeholders and the management center.
The ultrasonic sensor is an HC-SR04 unit. Its manufacturer datasheet [31] specifies a 5 V supply, a 15 mA working current, a 15° measuring angle, a 2–400 cm range, and a resolution and ranging accuracy of 0.3 cm. These datasheet values are the basis of the power estimate in Section 3.3 and the reference against which the measured dispersion in Section 4.2 is compared.
3.1.1. Operating Logic
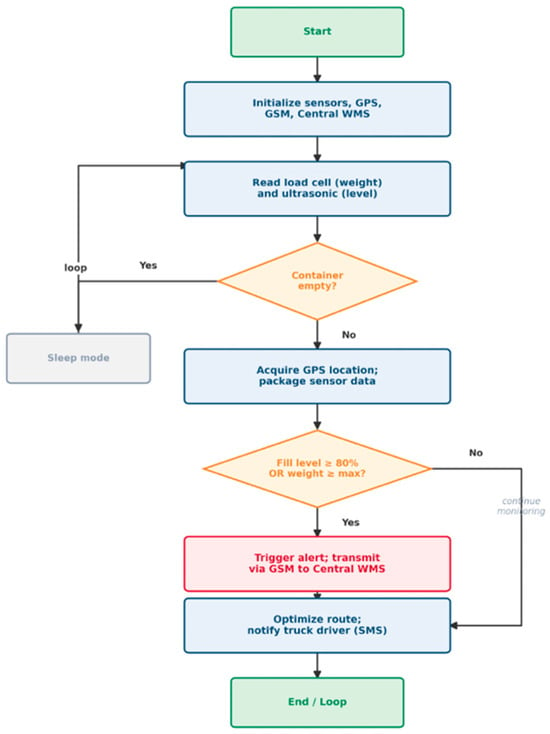
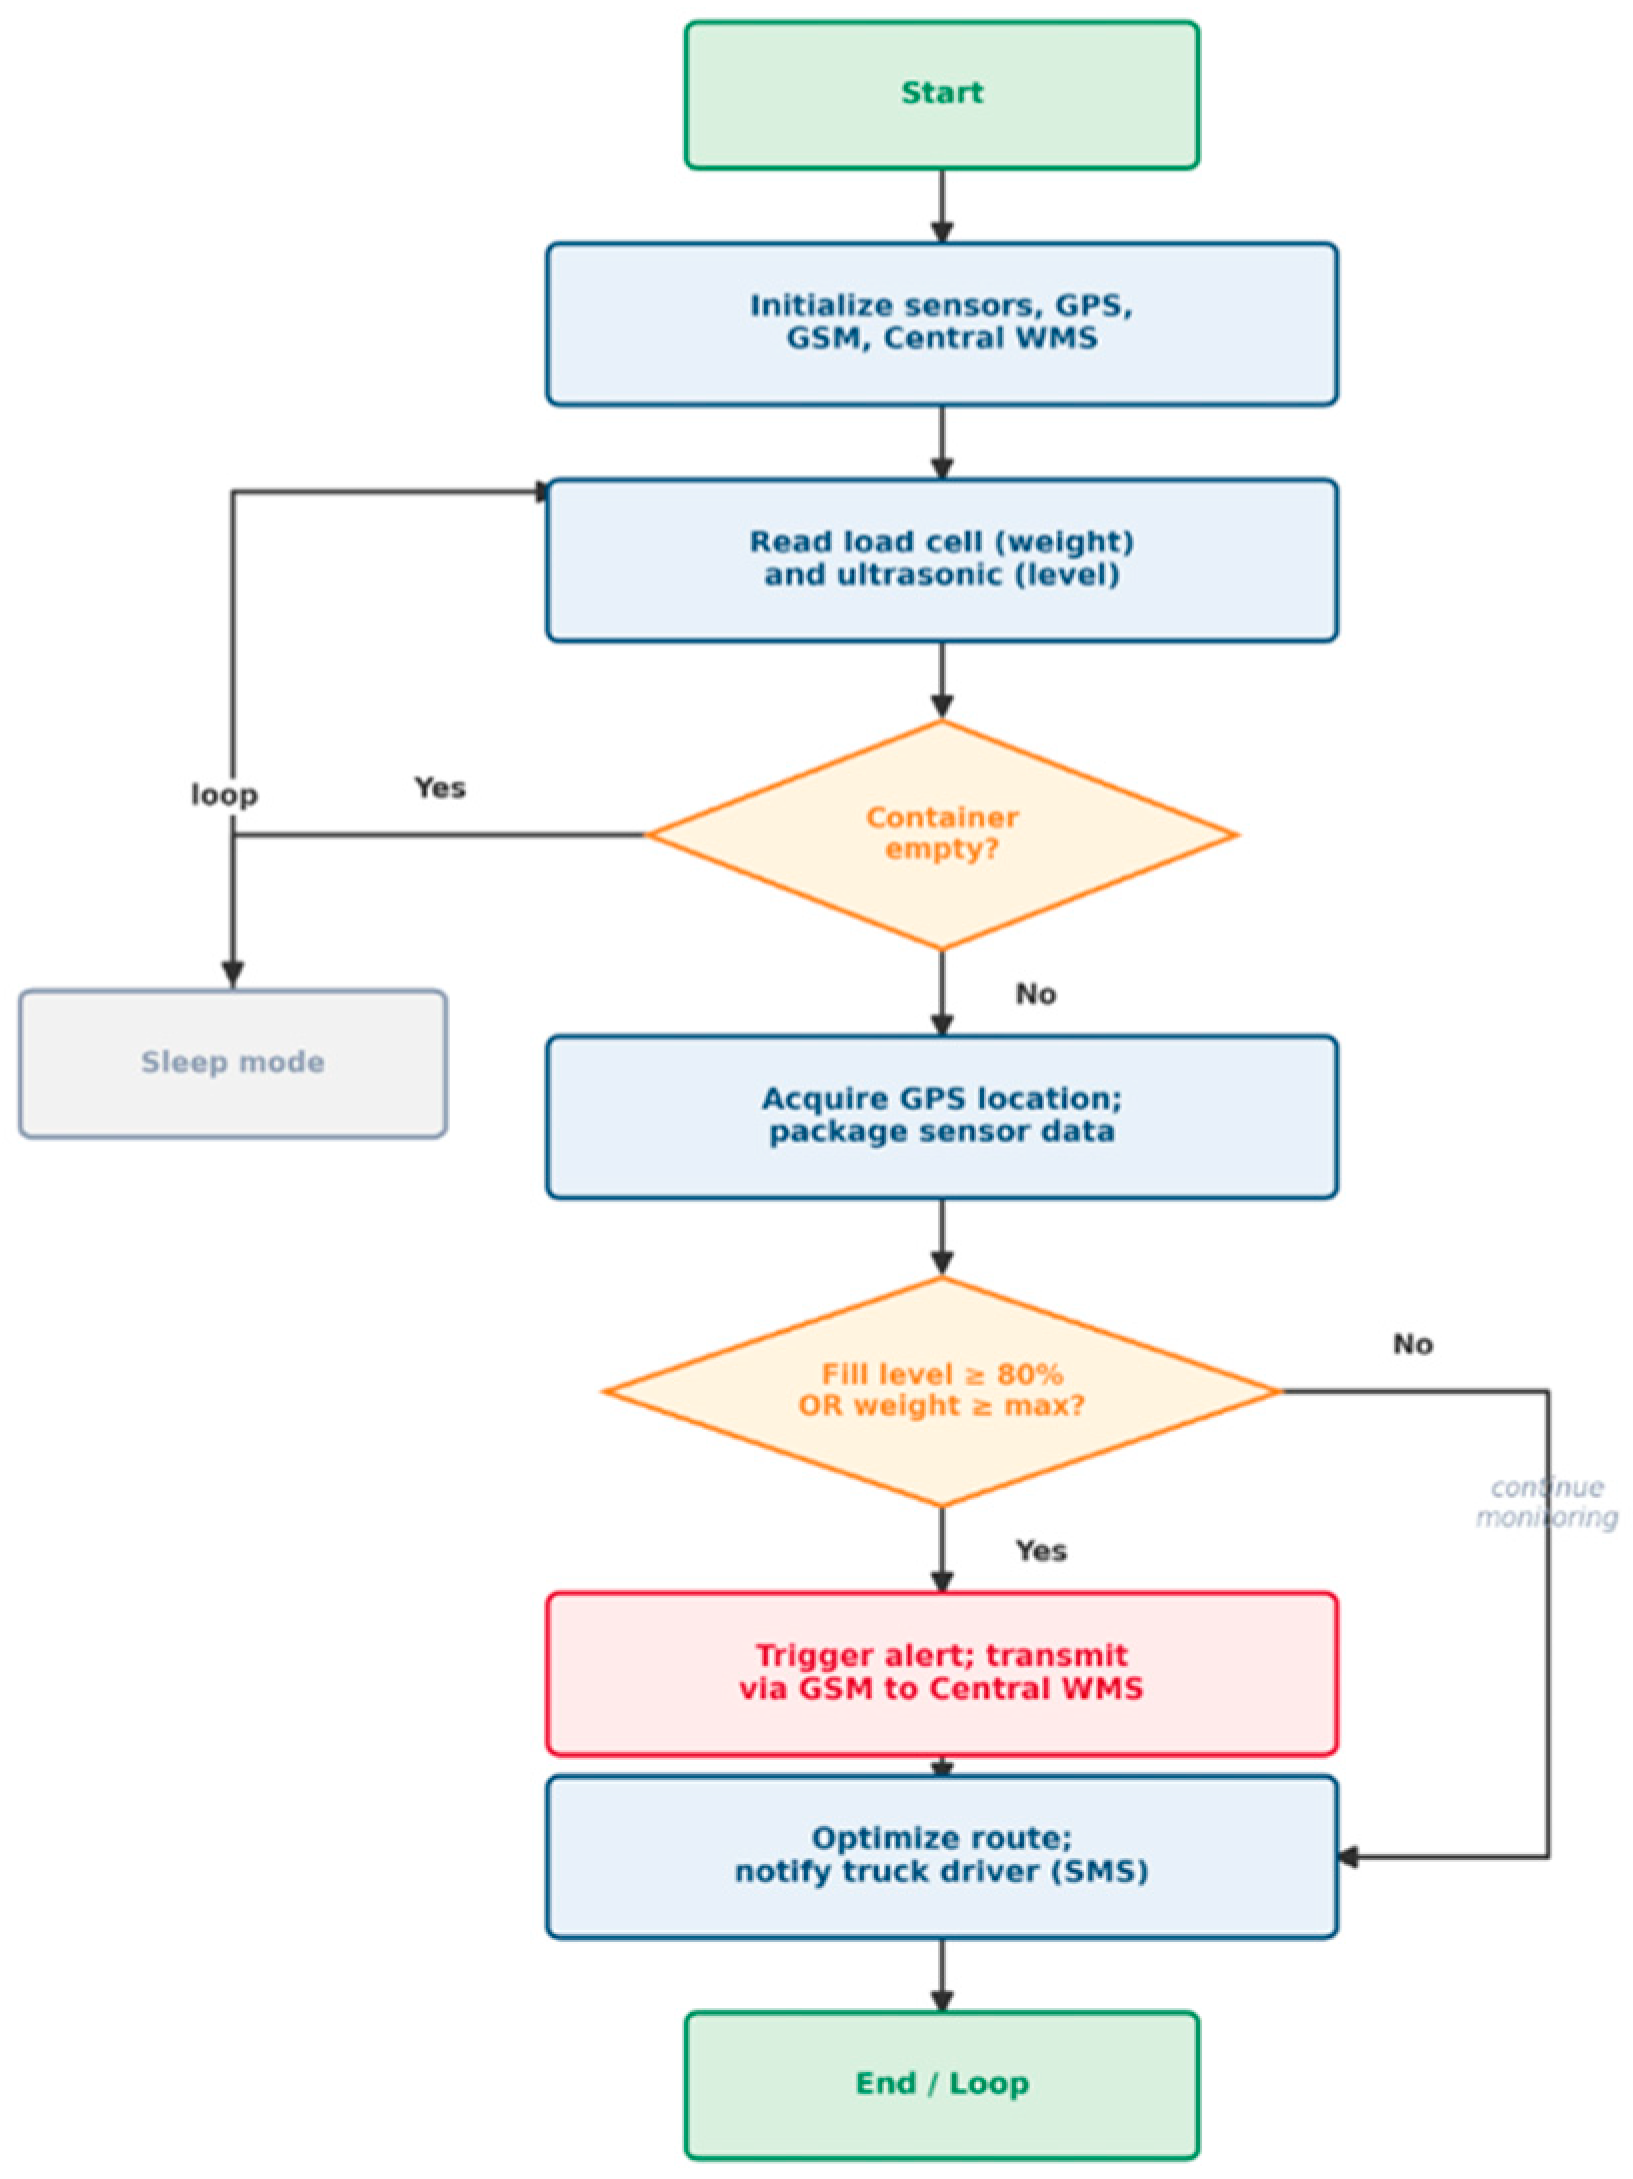
The working procedure of the system is explained in the flowchart of Figure 3. Once it has been initialized, the node reads the load cell and ultrasonic sensor every cycle. When the container registers as empty, the node goes to sleep to conserve energy, but when the container is not empty, then the node gets the GPS location and bundles up the sensor data. The alert condition is taken as an OR expression: If the fill level reaches 80% or the weight exceeds the maximum capacity the node triggers an alert and passes it on through the GSM module to the Central Waste Management System which calculates the optimum route and sends out an alert via SMS to the driver assigned to the route. If neither of these conditions are fulfilled, the monitoring will continue without any transmission, which is the reason for a low communication duty cycle (and low energy consumption) during normal operation.
Figure 3.
A flowchart of the smart waste management system operating logic.
3.1.2. Component Interaction
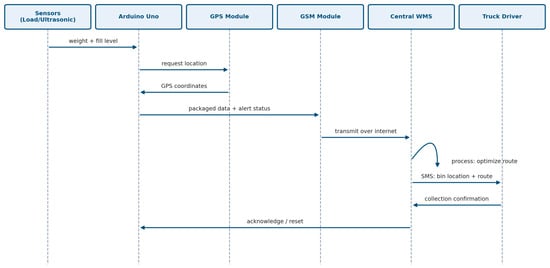
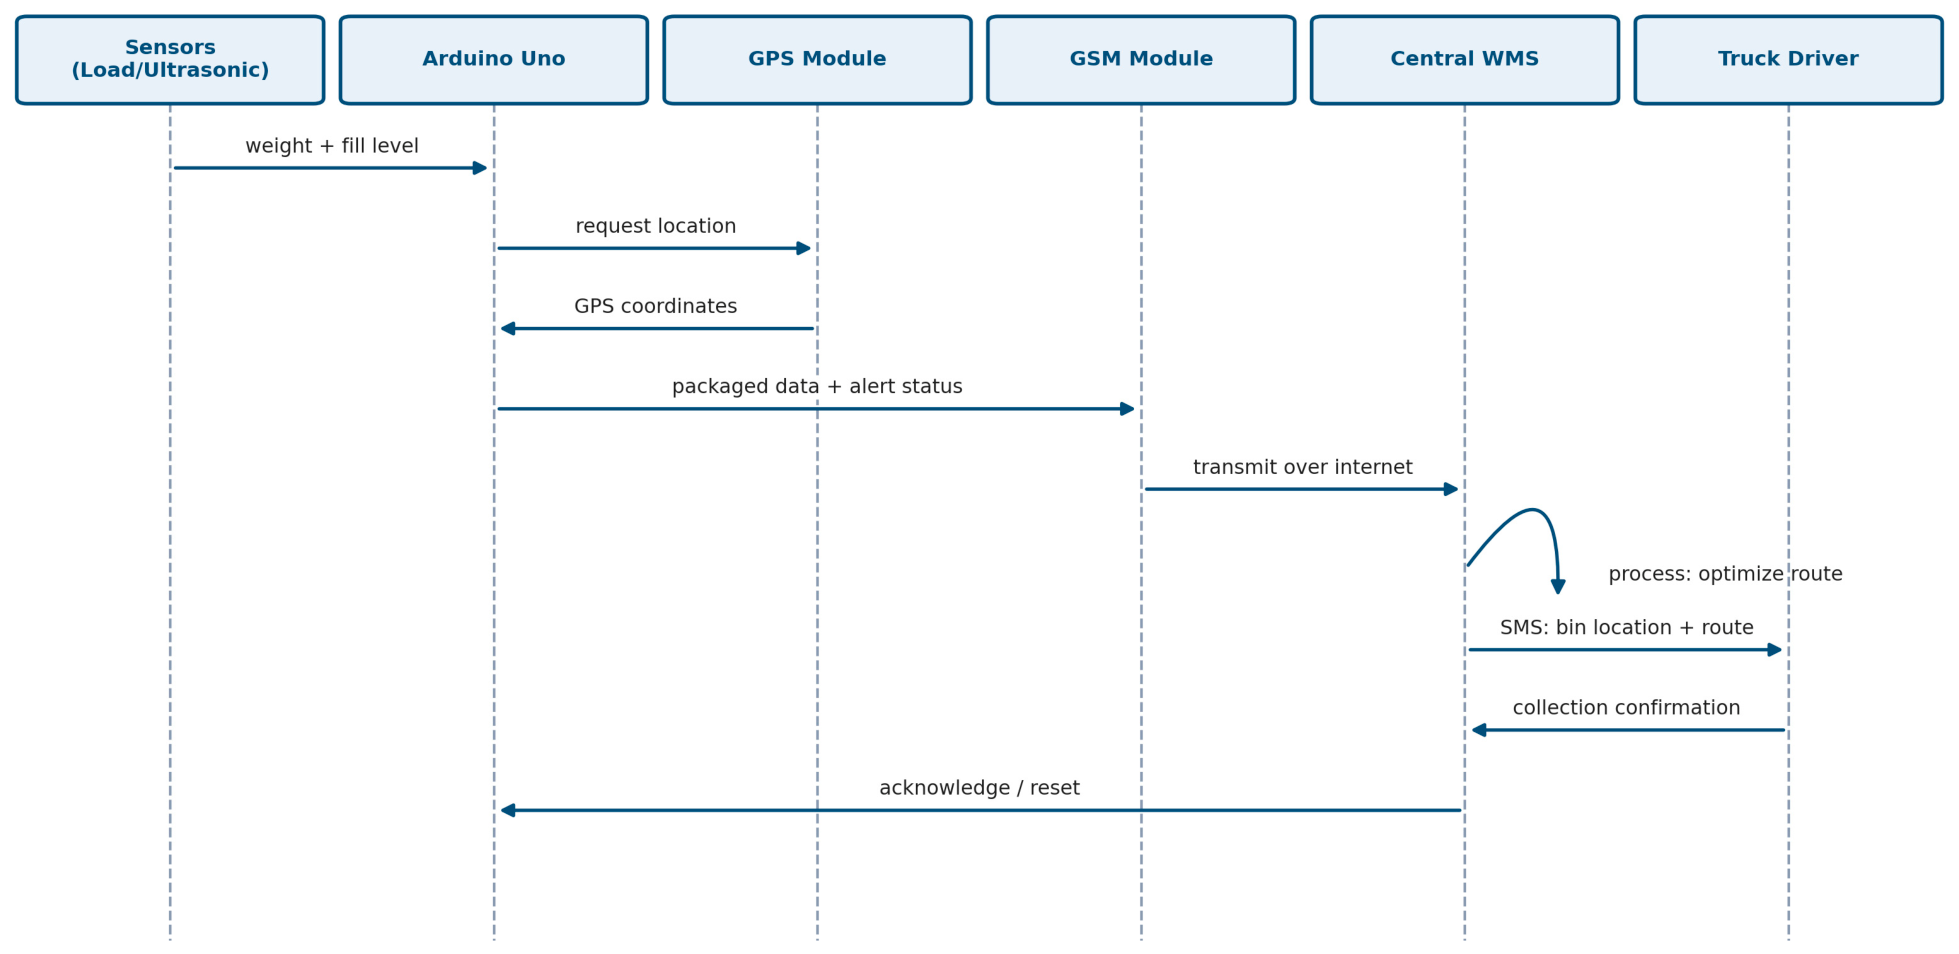
Figure 4 is a sequence diagram that includes the same information as Figure 3, but that also makes explicit the ordering of the messages exchanged between the components and the times at which the components are active. The diagram shows two implicit properties of the design that were not explicitly captured in the flowchart: (1) The microcontroller is responsible for each exchange; thus, the network does not have any sensor communicate directly with it. (2) The acknowledgement returned by the management center marks the completion of the exchange, so the node resets its alert state only when it receives an acknowledgement from the management center.
Figure 4.
Sequence diagram of component interaction from sensing to collection.
3.2. Cost Analysis
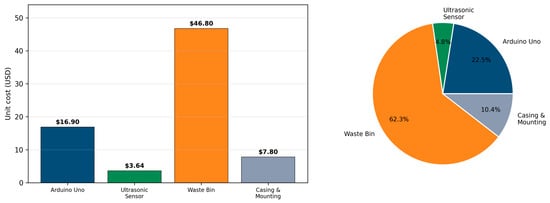
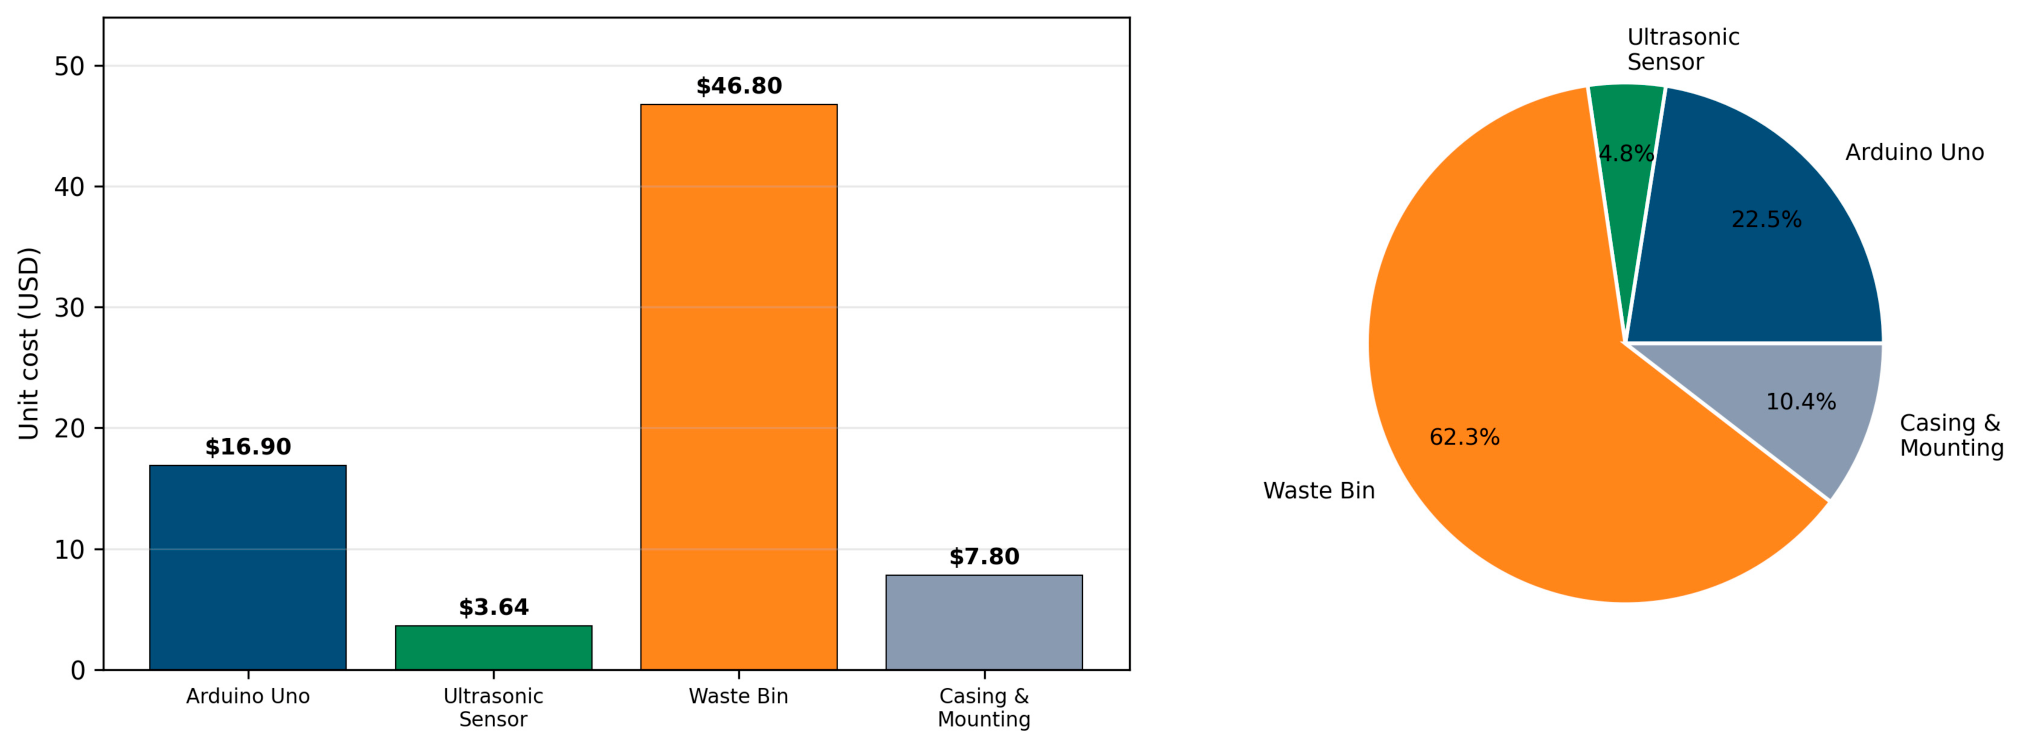
The capital cost per instrumented bin determines whether a system can be deployed at a municipal scale, and is therefore reported here at the component level (Table 4, Figure 5). Table 4 sums the four components that were priced, USD 75.14 per unit; this is a partial bill of materials, because the load cell, GPS module, GSM module and LCD display used in the node (Section 3.1) are not priced in Table 4, so the full node cost is higher. The unit costs are indicative component prices, not measured or negotiated values, and should be updated against current supplier quotations before deployment planning. The distribution is itself informative: the bin body accounts for 62.3% of the priced total, while the ultrasonic sensor—the component that delivers the system’s core sensing function—accounts for only 4.8%. The marginal cost of instrumenting an existing bin is therefore lower than the figure for a completely new unit suggests, although the unpriced electronics must be added to it, which is favorable for retrofit deployments where bins are already in place.
Table 4.
Infrastructure cost per smart bin.
Figure 5.
Per-bin component cost (left) and cost share (right).
3.3. Power Consumption
The continuous power draw of the bin-side node was calculated, not measured, from the nominal power ratings in the component datasheets (Table 5); no power-meter measurement was made. The calculated total was 3.3 W per bin, and it excludes the load cell and the GPS module, whose ratings are not included in Table 5:
P_total = 0.5 (Arduino) + 2.0 (GSM) + 3 × 0.1 (Sensors) + 0.5 (LCD) = 3.3 W
Table 5.
Power consumption per bin.
The GSM module accounts for 61% of the calculated power budget (2.0 of 3.3 W), making it the main term to optimize for battery-life extension. Continuous operation at 3.3 W corresponds to 79.2 Wh per day. Because the node transmits only when an alert condition is met (Section 3.1.1), the average draw of the GSM module should be lower than its nominal rating, but this has not been measured and is left for future work.
3.4. Sensor Validation Protocol
The accuracy of ultrasonic fill-level determination was characterized in a bench experiment under controlled indoor conditions with a single HC-SR04 unit. The alert threshold corresponds to a measured distance of 13.2 cm between the sensor and the waste surface, which is the 80% fill level at which the system raises a collection alert; 13.2 cm is therefore the reference (true) distance in the accuracy calculation. Fourteen readings were taken in one run, in a sequence approaching and passing this threshold: four readings below it (10.0–12.5 cm), for which no alert is expected, and ten readings at or above it (13.0–14.0 cm), which form the analysis sample for dispersion and ranging accuracy. The measured distance and the alert decision were recorded for each reading. A reading is the distance reported by the sensor. The experiment was carried out indoors; the temperature and humidity were not logged, the instrument used to set each distance was not recorded, and no independent repetition of the run was made (one reading per distance setting).
Two statistics were computed. The sample mean characterizes systematic bias:
and the sample standard deviation characterizes dispersion:
where s is the sample standard deviation, n the number of readings, xi each individual reading, and the sample mean. Accuracy for each reading was computed as the complement of the relative error against the true distance:
Accuracy Error = |(Measured Value − True Value)/True Value| × 100%
Two distinct quantities are reported and should not be confused. Ranging accuracy (Equation (4)) measures how closely a single distance reading reproduces the true distance of 13.2 cm; it is computed for the readings at or above the threshold. Alert classification accuracy is the fraction of the 14 readings for which the alert decision (alert or no alert) matches the decision expected for that distance. A sensor can have an imperfect ranging accuracy and still classify every reading correctly, as happens here. Accuracy figures quoted from the literature are not labeled in this way (Section 2.2), which limits the comparison in Section 4.4. In addition to the mean and standard deviation, 95% confidence intervals were computed with the t-distribution (n − 1 degrees of freedom) for the means and with the Wilson score method for the classification proportion, and the bias was tested with a one-sample t-test against the 13.2 cm reference.
4. Result and Discussion
4.1. Fill-Level Detection Readings
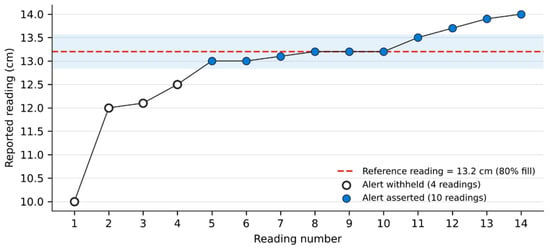
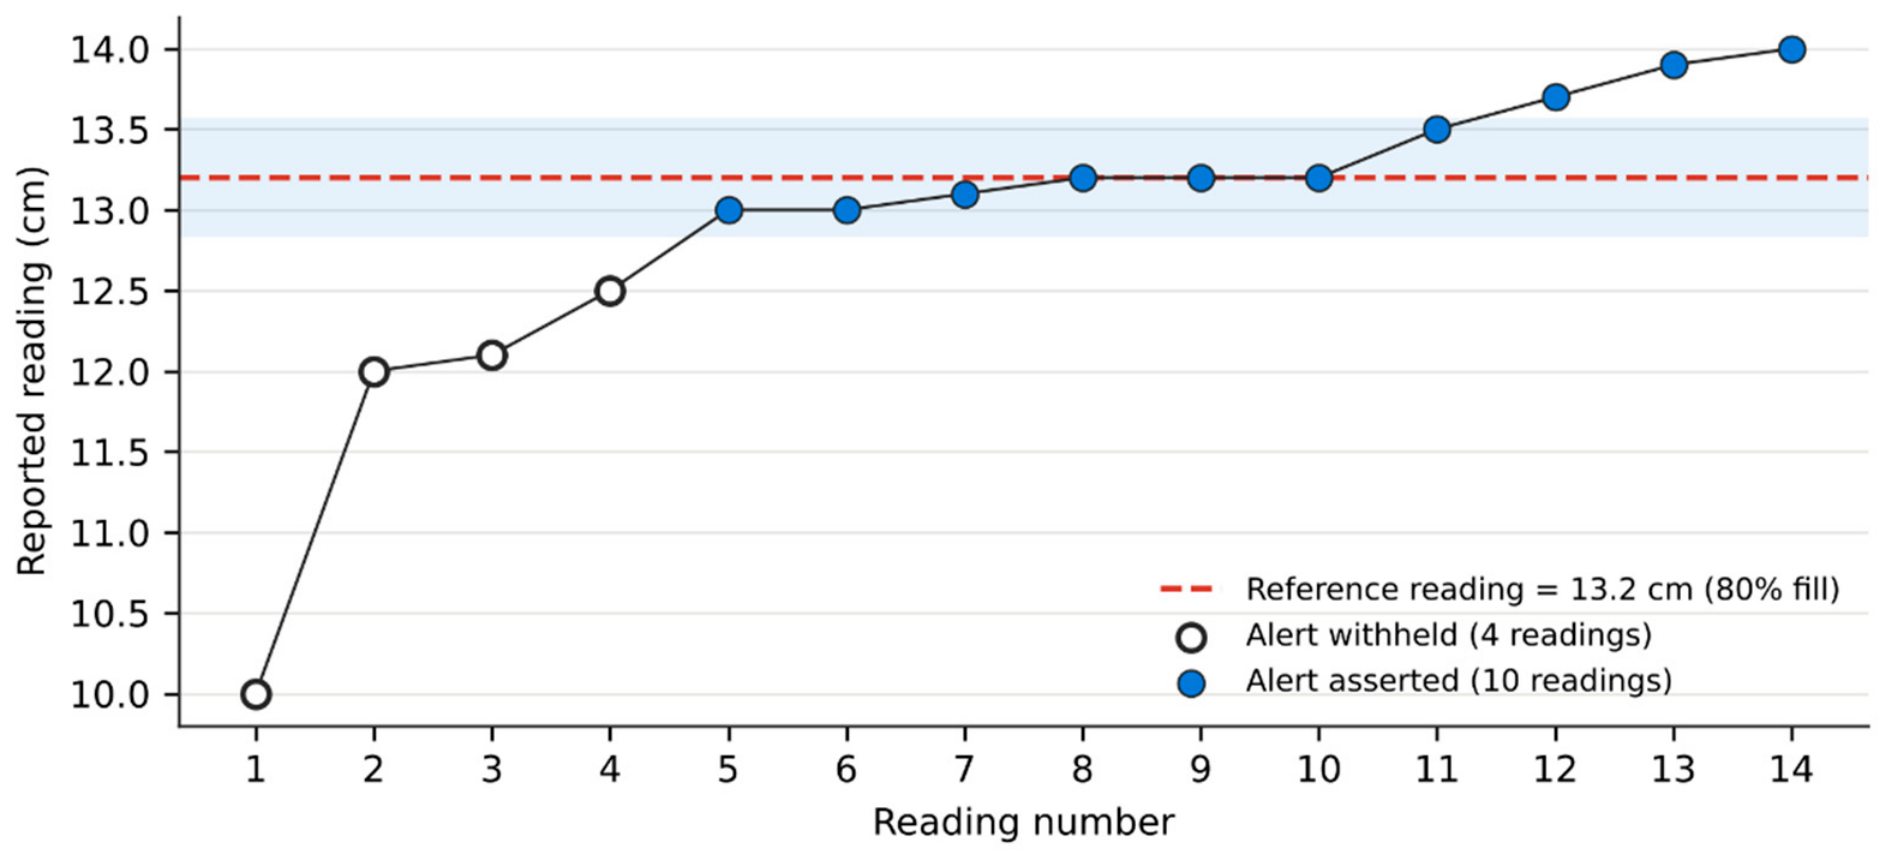
Table 6 presents the experimental readings and the corresponding detection decisions. The sensor correctly withheld detection for all readings below the threshold (10.0 to 12.5 cm) and correctly asserted detection for all readings at or above 13.0 cm, giving perfect classification performance at the decision boundary across the fourteen-reading sequence, as plotted in Figure 6. This is the operationally decisive result: for the purpose of triggering a collection alert, the sensor made no classification error. Alert classification accuracy was therefore 14/14 (100%; 95% Wilson interval 78.5–100%). The point estimate is perfect, but with only 14 readings the lower bound of the interval is wide, so the result is not a guarantee of error-free classification in the field.
Table 6.
The experimental readings, alert decisions and ranging accuracy (reference distance 13.2 cm = 80% fill). The ranging accuracy (Equation (4)) is computed only for readings at or above the threshold; alert classification is 14/14 correct.
Figure 6.
Ultrasonic readings relative to the 13.2 cm alert threshold (14 readings, single run). Filled markers: alert asserted; hollow markers: alert withheld; shaded band: reference ± 1 SD of the ten alert-region readings.
4.2. Dispersion of Readings
Table 7 gives the computation of the deviations, with a sum of squared deviations of 1.2360, and a small positive bias of 0.18 cm, against the true distance of 13.2 cm, giving a ten-reading mean of 13.38 cm.
s = √(1.2360/9) = 0.3706 cm
Table 7.
Standard-deviation computation for the ten threshold-region readings.
The standard deviation of 0.37 cm describes the typical spread of the readings about their mean, and it is of the same order as the 0.3 cm resolution and ranging accuracy stated in the sensor datasheet [31]. From the point of view of operation, a spread of this size around a threshold of 13.2 cm is easily tolerated: all readings produced the correct alert decision. This is a small positive bias which is consistent with the physics of ultrasonic ranging on rough waste surfaces, where the echo returned may come from a point a little beyond the nominal surface. The 95% confidence interval for the mean of the ten readings is 13.11–13.65 cm (t-distribution, n = 10). The bias of +0.18 cm is not statistically distinguishable from zero (one-sample t-test, t = 1.54, p = 0.16), so these data do not demonstrate a systematic offset; the echo-physics explanation above is a possible interpretation, not an established one.
4.3. Detection Accuracy
In the case of accuracy, the calculations were done for each reading, with the use of Equation (4), and here it is necessary to make a methodological point explicit. The accuracy figure obtained depends materially on the sample over which it is averaged, and reporting only the more favorable figure would misrepresent the sensor’s behavior.
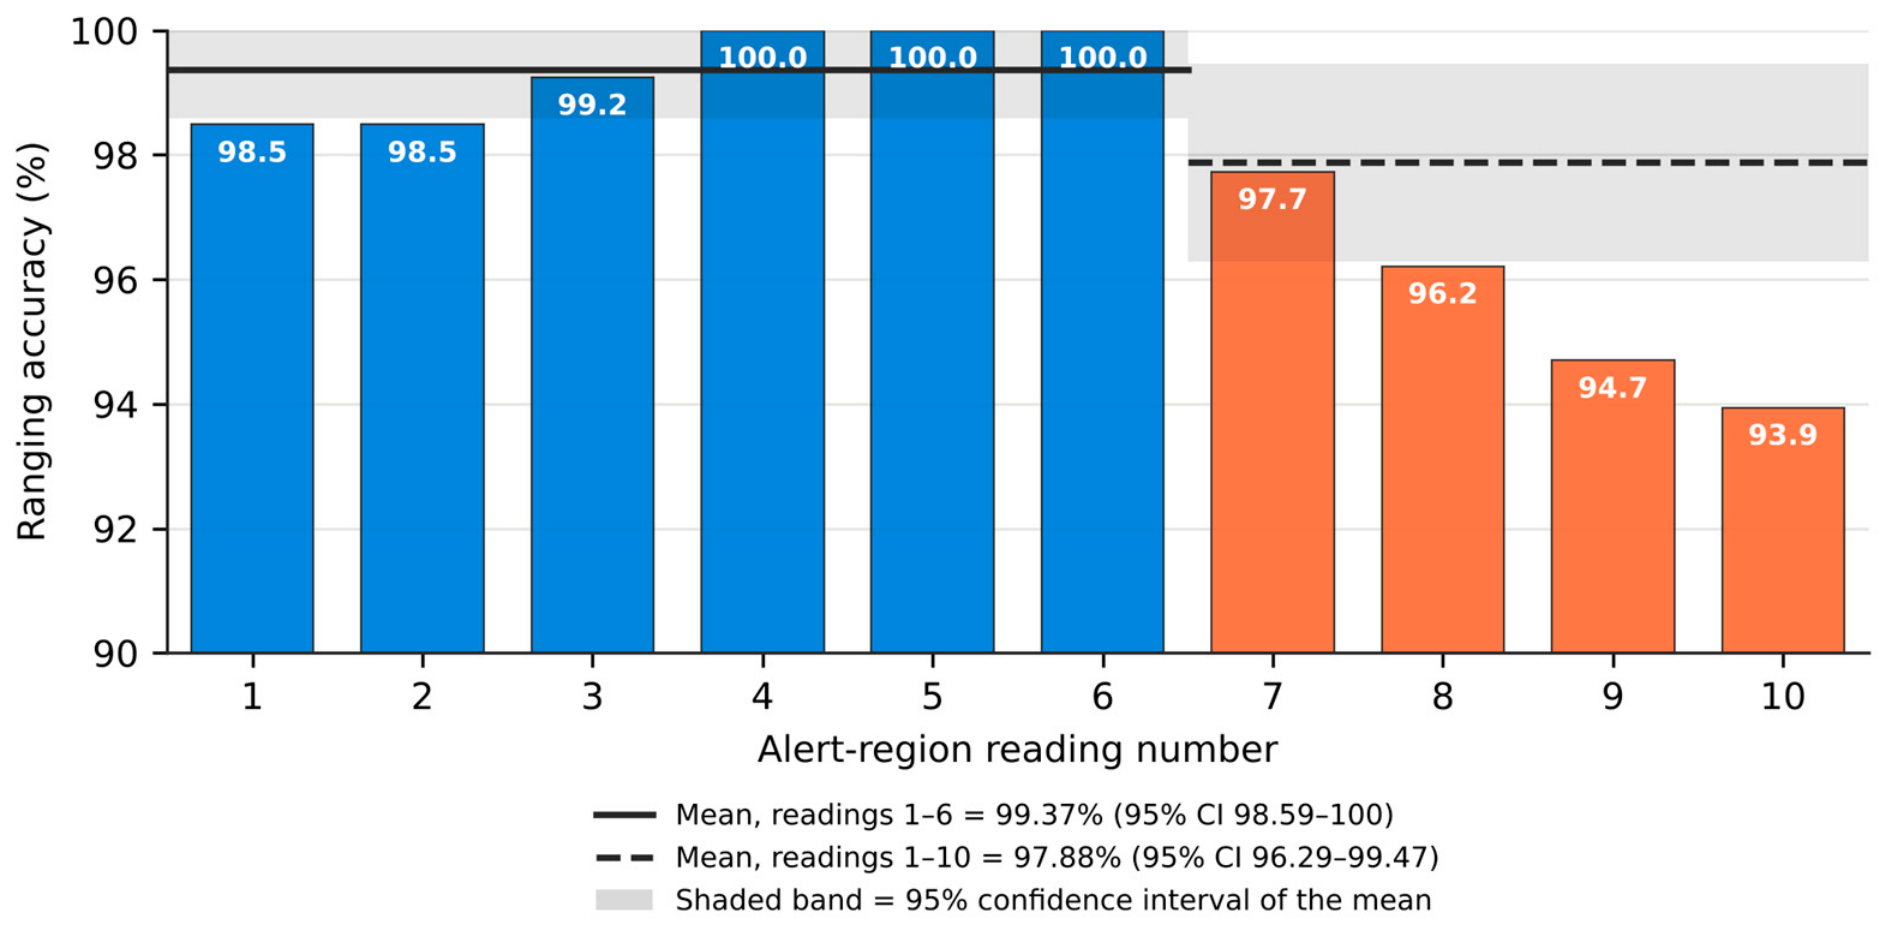
Averaged over the six readings within the immediate threshold detection band (13.0–13.2 cm), accuracy is 99.37%. Averaged over the full ten-reading sample, which extends to 14.0 cm, accuracy is 97.88%. The divergence arises because relative error grows with distance from the true value, so readings further above the threshold are individually less accurate even though all of them yield the correct detection decision. Table 8 reports both figures with their dispersion and 95% confidence intervals, and Figure 7 displays the per-reading accuracy with both averages marked. For the six-reading band the interval is 98.59–100% (the upper limit, 100.15% before truncation, is capped at the physical maximum of 100%) and for the ten-reading sample it is 96.29–99.47%; the intervals overlap, and the point estimates differ because they average different samples.
Table 8.
Ranging accuracy under two sample conventions, with 95% confidence intervals (t-distribution; upper limit capped at 100%).
Figure 7.
The ranging accuracy of each of the ten alert-region readings, with the mean and 95% confidence band for readings 1–6 (solid line) and readings 1–10 (dashed line). The vertical axis is capped at 100%.
Which figure is appropriate depends on the question being asked. If the question is how precisely the sensor reproduces a known distance in the immediate neighborhood of the alert threshold—the quantity that matters for threshold detection—then 99.37% is the correct answer. If the question is how precisely it reproduces distance across the wider measurement range, then 97.88% is correct. We report both, together with the protocol that produced them, because the practice of quoting a single unqualified accuracy figure is precisely the reporting gap identified in Section 2.4. Both values come from one sensor in a single run; the confidence intervals describe the scatter of these readings and not run-to-run or unit-to-unit reproducibility.
4.4. Benchmark Against Reported Systems
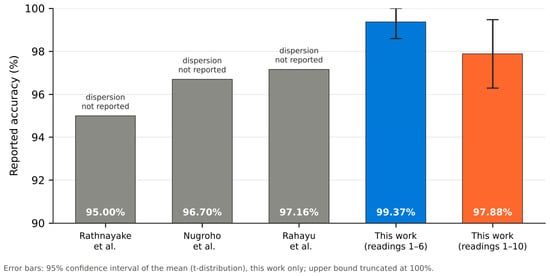
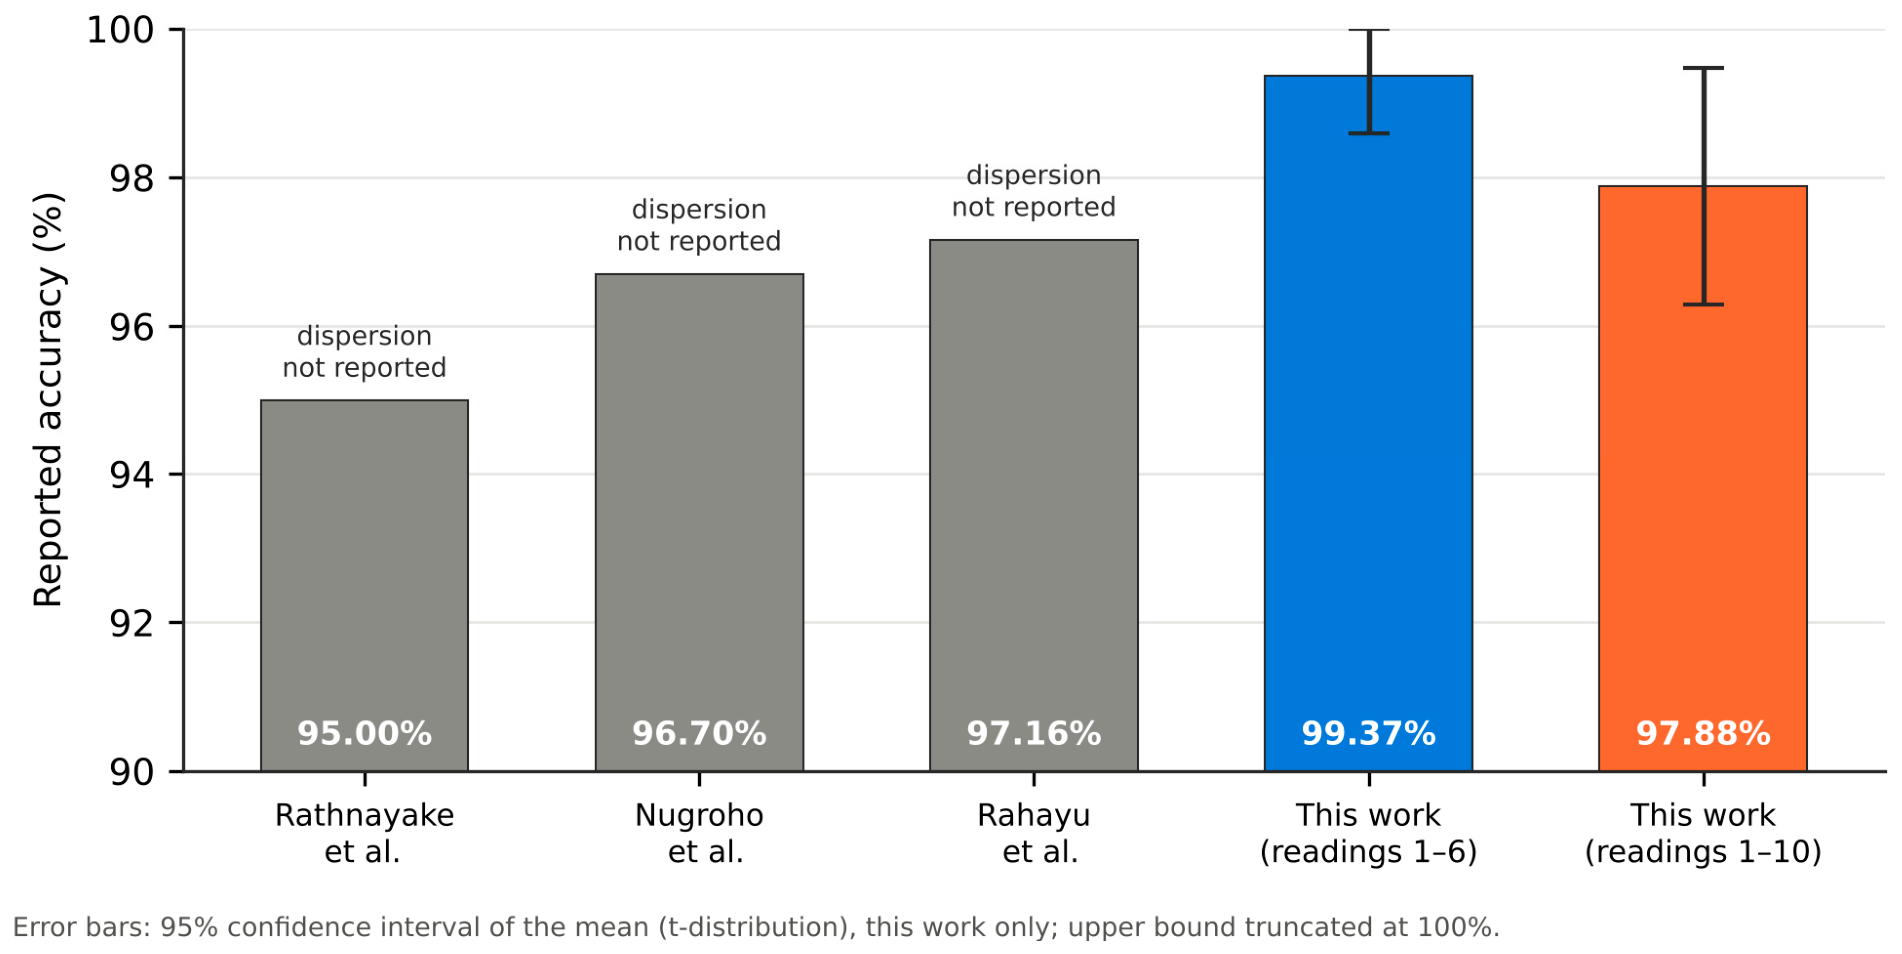
Table 9 and Figure 8 place the measured ranging accuracy beside the three accuracy figures reported by Rathnayake et al. [26] (95.00%), Nugroho et al. [27] (96.70%) and Rahayu et al. [18] (97.16%). The two sets of numbers are not equivalent: the published figures come from different systems and setups, with sample size, distance and averaging convention not stated, whereas ours is the ranging accuracy of one sensor on a bench. The comparison is therefore presented as context, with the dispersion of the measured values shown and the published values marked as having no reported dispersion. Under the threshold-band convention the mean is 99.37% (95% CI 98.59–100%), above all three published figures. Under the full-sample convention it is 97.88% (95% CI 96.29–99.47%); this interval contains the 96.70% and 97.16% figures, so a difference from them cannot be claimed at this sample size, and only the 95.00% figure lies below it.
Table 9.
Comparison of fill-level accuracy with reported systems (published values have no stated protocol or dispersion).
Figure 8.
The measured ranging accuracy (this work, with 95% confidence intervals) beside accuracy values reported in the literature (no dispersion reported). The vertical axis is capped at 100% [18,26,27].
This comparison should be read with appropriate caution. The three reference studies do not state the sample size, measurement distance, or averaging convention behind their reported figures, so the comparison is between quantities that may not be strictly commensurable. It is entirely possible that a study reporting 95% measured across a wider range would report a higher figure under the threshold-band convention used here. The honest conclusion is therefore narrower than a simple ranking would suggest: the sensor evaluated here is above the reported range under the threshold-band convention and statistically indistinguishable from the two higher reported values under the full-sample convention, and the more consequential observation is that the field lacks the reporting standards that would make such comparisons rigorous.
To address how the system compares with other systems beyond a single accuracy figure, Table 10 sets it beside the closest published systems on the characteristics that can be verified from the published descriptions. No claim of superiority is made. The accuracy figures are not commensurable with ours, the other systems were not re-measured under a common protocol, and several report no accuracy at all. What the present data support is that the ultrasonic sensing in this system reaches an accuracy comparable to the published figures while its protocol, raw data and analysis script are disclosed.
Table 10.
Positioning of this work against the closest published systems.
4.5. Implications
Three practical implications follow. First, ultrasonic sensing is an accurate and economical basis for fill-level detection: at USD 3.64 per unit and a nominal 0.1 W, it classified all 14 readings of the tested sequence correctly (95% Wilson lower bound 78.5%), and the case for more expensive sensing modalities must rest on functions beyond fill level, such as hazard or material detection. Secondly, the dominant terms are not the sensor: the bin body accounts for 62.3% of the priced cost and the GSM module for 61% of the calculated power budget, so deployment strategy and communication, not sensor choice, determine cost and energy. Third, and most significantly for the field, there is a difference between two defensible accuracy figures based on the same ten measurements, and this reveals that there is no way to interpret an accuracy claim without its protocols, and that comparative tables compiled from unqualified accuracy figures should be used with care instead of treating them as definitive.
5. Conclusions and Future Work
This paper presented an IoT-enabled smart waste management system for Al-Duqm, a bench validation of its ultrasonic fill-level sensing, a partial component-level cost and a datasheet-based power estimate, and a critical review of 21 studies published between 2021 and 2023. The review identified recurring gaps: multi-objective trade-offs are not adequately addressed, measurement protocols are not reported, interoperability between waste types and platforms is limited, user engagement is underdeveloped, and real-world validation is scarce.
Findings supported by the experiments: In a single bench run with one HC-SR04 unit, the ten alert-region readings had a mean of 13.38 cm (SD 0.3706 cm; 95% CI 13.11–13.65 cm) against a reference distance of 13.2 cm, and the bias of 0.18 cm was not statistically significant (p = 0.16). The ranging accuracy was 99.37% over the six readings nearest the threshold and 97.88% over all ten, and all 14 alert decisions were correct (95% Wilson interval 78.5–100%). The two ranging-accuracy values differ because they average different samples, which illustrates the reporting problem identified in the review. The three published accuracy figures (95.00%, 96.70% and 97.16%) are below the threshold-band result and within or below the full-sample interval, but their protocols are not stated and our data cover one sensor, so the comparison is indicative and does not establish superiority. The priced bill of materials, USD 75.14 per bin, covers the bin, the Arduino Uno, the ultrasonic sensor and the casing only, and the 3.3 W power figure is calculated from component ratings; neither was measured in operation.
Expected benefits not established by the present data. The system is designed to reduce unnecessary vehicle trips, limit overflow and lower fuel use, and its architecture could support route optimization, user engagement and several waste streams. None of these benefits were measured here: no route-optimization, fuel, overflow-frequency or battery-life experiment was carried out, and the field performance of the system at Al-Duqm has not been evaluated. They remain expected outcomes, not conclusions of this study.
Limitations and future work: The validation used a single sensor unit in one run under controlled indoor conditions, with 14 readings of which ten were in the alert region. Ultrasonic ranging is sensitive to temperature, humidity and irregular reflecting surfaces, so dispersion in field deployments is expected to be larger, and the confidence intervals describe scatter within the run, not run-to-run or unit-to-unit reproducibility. Future work should repeat the measurements over multiple independent runs, sensor units and environmental conditions; measure the power consumption of the node in operation; price the complete bill of materials; evaluate routing performance jointly with accuracy and energy; and adopt a reporting standard for detection accuracy that states sample size, distance and averaging basis.
Author Contributions
K.S.A.Y.: Conceptualization, methodology, formal analysis, investigation, and writing—original draft. S.O.F.K.: Supervision and writing—review and editing. S.M.E.H.: Supervision and writing—editing. G.H.: Validation and writing—review and editing. H.A.: Writing—review, methodology and editing. All authors have read and agreed to the published version of the manuscript.
Funding
This research was funded by the University of Nizwa under the Faculty Publication Support.
Data Availability Statement
Python 3 (ipykernel) script that reproduces all statistics and Figures will be provided upon request with valid reason.
Acknowledgments
The authors would like to thanks the University of Nizwa for supporting this publication under the Faculty Publication Support.
Conflicts of Interest
The authors declare no conflicts of interest.
References
- Eyecomms. Your Gateway to the World. The Special Economic Zone at Duqm. Available online: https://duqm.gov.om/en (accessed on 25 December 2024).
- Yigitcanlar, T.; Velibeyoglu, K.; Baum, S. (Eds.) Knowledge-Based Urban Development: Planning and Applications in the Information Era; IGI Global: Hershey, PA, USA, 2008. [Google Scholar]
- Kumar, A. A novel framework for waste management in smart city transformation with industry 4.0 technologies. Res. Glob. 2024, 8, 100234. [Google Scholar] [CrossRef] [Scilit]
- Anagnostopoulos, T.; Kolomvatsos, K.; Anagnostopoulos, C.; Zaslavsky, A.; Hadjiefthymiades, S. Assessing dynamic models for high priority waste collection in smart cities. J. Syst. Softw. 2015, 110, 178–192. [Google Scholar] [CrossRef] [Scilit]
- Malapur, B.S.; Pattanshetti, V.R. IoT based waste management: An application to smart city. In Proceedings of the 2017 International Conference on Energy, Communication, Data Analytics and Soft Computing (ICECDS), Chennai, India, 1–2 August 2017; pp. 2476–2486. [Google Scholar]
- Mahbub, M.; Hossain, M.M.; Gazi, M.S.A. IoT-cognizant cloud-assisted energy efficient embedded system for indoor intelligent lighting, air quality monitoring, and ventilation. Internet Things 2022, 18, 100266. [Google Scholar] [CrossRef] [Scilit]
- Golden Julie, E. Waste Management System for Smart City Using IoT. In The IoT and the Next Revolutions Automating the World; IGI Global Publisher: Hershey, PA, USA, 2019. [Google Scholar] [CrossRef] [Scilit]
- Jagtap, S.; Gandhi, A.; Bochare, R.; Patil, A.; Shitole, A. Waste management improvement in cities using IoT. In Proceedings of the 2020 International Conference on Power Electronics & IoT Applications in Renewable Energy and Its Control (PARC), Mathura, India, 28–29 February 2020. [Google Scholar]
- Singh, P.; Bajpai, A. Smart trucks: An IoT-based novel approach for smart and effective waste management system. In Proceedings of the 2022 IEEE Conference on Interdisciplinary Approaches in Technology and Management for Social Innovation (IATMSI), Gwalior, India, 21–23 December 2022. [Google Scholar]
- Aparna, H.; Bhumijaa, B.; Avila, J.; Thenmozhi, K.; Rengarajan, A.; Padmapriya, P. IoT assisted waste collection and management system using QR codes. In Proceedings of the International Conference on Computer Communication and Informatics (ICCCI), Coimbatore, India, 27–29 January 2021. [Google Scholar]
- Zhao, D.; Shao, H. The construction of management system model for environmental assessment of solid waste. In Proceedings of the 2010 IEEE International Conference on Intelligent Computing and Intelligent Systems, Xiamen, China, 29–31 October 2010. [Google Scholar]
- Dubey, S.; Singh, M.K.; Singh, P.; Aggarwal, S. Waste management of residential society using machine learning and IoT approach. In Proceedings of the 2020 International Conference on Emerging Smart Computing and Informatics (ESCI), Pune, India, 12–14 March 2020. [Google Scholar]
- Chetan, S.R.; Karanth, A.B.; Dheeraj, D.; Singh, R.R.; Arun, J. Dumpy: A Waste Management App. In 2023 International Conference on IoT, Communication and Automation Technology (ICICAT); IEEE: New York, NY, USA, 2023. [Google Scholar]
- Dixit, A.; Tyagi, A.; Prakash, A.; Avasthi, S. Establishing vast network of medical institutions to reduce medical waste. In Proceedings of the 2023 International Conference on IoT, Communication and Automation Technology (ICICAT), Gorakhpur, India, 23–24 June 2023. [Google Scholar]
- Thirupathieswaran, R.; Rajan, K.P.; Niranjana, R.; Muthu, A.E.; Krishnan, R.S.; Saravanan, K. IoT enabled waste management optimization framework (IWMOF). In Proceedings of the 2023 3rd International Conference on Pervasive Computing and Social Networking (ICPCSN), Salem, India, 19–20 June 2023. [Google Scholar]
- Kumar, S.V.; Sankar, S.; Rethanya, S.; Sriram, E.; Hussain, S. Innovative waste management solutions for smart cities using IoT and NodeMCU. In Proceedings of the 2023 International Conference on Recent Advances in Electrical, Electronics, Ubiquitous Communication, and Computational Intelligence (RAEEUCCI), Chennai, India, 19–21 April 2023. [Google Scholar] [CrossRef] [Scilit]
- Puppala, R.; Ramya, V.; Rao, M.B. IoT-based household electronic waste management systems for electronic waste collection. In Proceedings of the International Conference on Inventive Computation Technologies; IEEE: New York, NY, USA, 2023. [Google Scholar]
- Rahayu, M.; Widlan, M.N.; Bramantyo, H.A. Smart trash with web integrated volume monitoring and sorting system via MQTT protocol. Electron. Electr. J. Innov. Technol. 2022, 3, 6–11. [Google Scholar] [CrossRef] [Scilit]
- Kumar, J.S.; Venkatesan, S.P.; Venkatramana, B.; Logeshwaran, E. IoT-enabled waste reduction and recycling to alleviate environmental hazards. In Proceedings of the 2023 3rd International Conference on Pervasive Computing and Social Networking (ICPCSN), Salem, India, 19–20 June 2023. [Google Scholar]
- Burman, A.R.; Goswami, A.; Sharma, H.; Mohan, V.C.J. Smart waste management system using GIS paired with IoT-based smart waste collection bins. In Proceedings of the 2022 International Conference on Smart and Sustainable Technologies; IEEE: New York, NY, USA, 2022. [Google Scholar]
- Ramasawmy, K.; Nagowah, S.D. Smart waste monitoring system using machine learning for IoT-enabled smart green campus. In Proceedings of the 2023 11th International Conference on Information and Communication Technology (ICoICT); IEEE: New York, NY, USA, 2023. [Google Scholar]
- Suthar, S.B.; Chithra, R.; Abhinaya, G.K.; Harikumar, H. Smart waste segregation and collection system with IoT-enabled monitoring and analytics. In Proceedings of the 2023 International Conference on Recent Advances in Science and Engineering Technology; IEEE: New York, NY, USA, 2023. [Google Scholar]
- Bhatele, P.; Dalvi, M.; Kulkarni, M.; Mali, T.; Manalwar, M.; Manakshe, A. Smart waste segregation using IoT. In Proceedings of the 2023 4th International Conference for Emerging Technology (INCET), Belgaum, India, 26–28 May 2023; pp. 1–4. [Google Scholar]
- Anand, J.; Elangovan, V.; Muthukumar, V.; Chandrasekar, T. Waste management system using iot for sustainable cities. In 2023 Second International Conference on Augmented Intelligence and Sustainable Systems (ICAISS); IEEE: New York, NY, USA, 2023. [Google Scholar]
- Singh, D.; Chaturvedi, P.; Dhawan, G.; Singh, A.; Aggarwal, R. WBMS: Waste bin management system for densely populated urban areas. In Proceedings of the 2022 2nd International Conference on Innovative Practices in Technology and Management (ICIPTM), Gautam Buddha Nagar, India, 23–25 February 2022. [Google Scholar]
- Rathnayake, R.M.K.T.; Chanaka, T.M.M.; Dabare, P.; Hewagamage, K.P. IoT-enabled dual-sensing smart waste management system: Enhancing urban cleanliness and sustainability in smart cities. In 2024 8th SLAAI International Conference on Artificial Intelligence (SLAAI-ICAI); IEEE: New York, NY, USA, 2024; Volume 15, pp. 1–10. [Google Scholar]
- Nugroho, D.S.; Rosad, S.; Agustin, N. Real time smart trash bins monitoring system using fuzzy logic method in Kuripan Village. J. Inform. Inf. Syst. Softw. Eng. Appl. 2023, 5, 70–79. [Google Scholar] [CrossRef] [Scilit]
- Sosunova, I.; Porras, J. IoT-enabled smart waste management systems for smart cities: A systematic review. IEEE Access 2022, 10, 73326–73363. [Google Scholar] [CrossRef] [Scilit]
- Abdallah, M.; Abu Talib, M.; Feroz, S.; Nasir, Q.; Abdalla, H.; Mahfood, B. Artificial intelligence applications in solid waste management: A systematic research review. Waste Manag. 2020, 109, 231–246. [Google Scholar] [CrossRef] [Scilit] [PubMed]
- Hannan, M.A.; Lipu, M.S.H.; Akhtar, M.; Begum, R.A.; Al Mamun, M.A.; Hussain, A.; Mia, M.S.; Basri, H. Solid waste collection optimization objectives, constraints, modeling approaches, and their challenges toward achieving sustainable development goals. J. Clean. Prod. 2020, 277, 123557. [Google Scholar] [CrossRef] [Scilit]
- HC-SR04 Ultrasonic Range Finder User Manual; AccuDIY: Port Coquitlam, BC, Canada, 2011.




Disclaimer/Publisher’s Note: The statements, opinions and data contained in all publications are solely those of the individual author(s) and contributor(s) and not of MDPI and/or the editor(s). MDPI and/or the editor(s) disclaim responsibility for any injury to people or property resulting from any ideas, methods, instructions or products referred to in the content. |
© 2026 by the authors. Licensee MDPI, Basel, Switzerland. This article is an open access article distributed under the terms and conditions of the Creative Commons Attribution (CC BY) license.