


Abstract
As global fossil fuel reserves face unavoidable exhaustion, the prominence of electric vehicles (EVs) continues to escalate. This transition is largely driven by a greater societal commitment to sustainable transport solutions, resulting in a marked increase in the integration of EVs into the modern transportation landscape. Consequently, existing power distribution frameworks are not capable of providing significantly higher levels of active power to support the growing infrastructure of electric vehicle charging stations (EVCSs). However, this surge in demand poses technical challenges, specifically the degradation of voltage profiles and the escalation of active power losses (APL) within the grid. To counteract these effects and strengthen network stability and self-sufficiency, it is vital to integrate EVCSs, distributed energy resources (DERs), and distribution static compensators (DSTATCOMs) through precise sizing and strategic placement. The core objectives of this optimization approach are to mitigate APL, minimize voltage deviation (VD), and improve the overall voltage stability index (VSI). This study utilizes the IEEE 33-bus system as a benchmark to evaluate system performance in both conventional radial and mesh configurations. The African vulture optimization algorithm combined with dimension learning-based hunting (AVOA-DLH) and the opposition flow direction algorithm (OFDA) are employed in this research to optimize the objective functions. The results demonstrate that the coordinated allocation substantially mitigates the adverse effects of EVCSs integration. For the radial configuration, the best AVOA-DLH solution achieves a power-loss reduction of 79.74%, while the corresponding mesh configuration achieves 85.20%. In the mesh configuration, the best AVOA-DLH solution reduces APL to 23.24 kW, with a VD of 0.0139 p.u. and a VSI of 0.8741 p.u. The annual energy-loss cost is reduced from PKR to PKR for the radial system and from PKR to PKR for the mesh system. Statistical analysis further indicates a significant performance difference between AVOA-DLH and OFDA.
1. Introduction
Modern distribution networks (DNs) face increasing vulnerability to voltage drops and line losses caused by increasing electricity demand [1]. Historically, utilities resolved this by expanding the network infrastructure or constructing new substations [2]. However, this traditional approach is no longer economically viable due to high capital and operating expenses. At the same time, global energy planning must address the depletion of fossil fuels and the broader challenges of climate change. Since the transportation sector represents a major source of global carbon emissions, the transition from internal combustion engine vehicles to electric vehicles (EVs) has become a research priority. Developing countries are also accelerating the adoption of EVs, primarily because electricity is more cost-effective than conventional fuel. Despite these benefits, widespread adoption is still hindered by the limited driving range of EVs. To mitigate this range anxiety, vehicles must rely on strategically deployed charging stations to replenish power along their travel routes.
Thus, building a charging infrastructure must be prioritized to prepare for the mass adoption of EVs. Coordinated electric vehicle charging station (EVCSs) planning is essential for the long term expansion of EV industry. The installation of EVCSs places an additional burden on the power network, and the operating characteristics of the DN will deteriorate due to the high charging rates of the EVCSs. In addition, an inappropriate location and an enormous EVCS installation will harm the infrastructure. Power losses, voltage profile, and harmonic distortions will occur when EVs are connected to the DN to charge. The use of distributed generation (DG) is one of the best ways to reduce losses caused by the rapid expansion of EVCSs. The combination of EVCSs with DG units reduces the effects of EV charging.
Researchers are investigating novel ways to harvest electrical energy from abundant DERs to meet the growing global demand for power and the depletion of conventional energy resources. As a result, distributed generation systems and renewable energy based microgrids seem to be the most promising solution to the upcoming energy crisis. To satisfy the increasing demand for electricity driven by urbanization and modernization, and to make room for the replacement of conventional power-generating stations, power transmission and distribution networks are being integrated with DER-based generation [2].
Literature Review
Many investigations have explored various aspects of optimal allocation, encompassing EVCSs placement, DERs sizing and positioning, energy management methodologies, and their subsequent impacts on DN operation and stability. To address these complex formulation challenges, researchers have deployed a diverse range of methodologies. These methods span traditional mathematical programming techniques, such as mixed-integer linear programming, as well as metaheuristic search algorithms, including the genetic algorithm (GA) and particle swarm optimization (PSO). Furthermore, several studies have investigated the integrated allocation of conventional DGs and EVCSs under various operating constraints to determine optimal capacities. However, while extensive literature has addressed the standalone allocation of EVCSs, DGs, or distribution static compensator (DSTATCOM), the simultaneous planning of EVCSs integrated with both DERs and DSTATCOMs remains significantly underexplored. Consequently, the co-optimal placement and sizing of these components within a unified framework represents an emerging and critical area of study. The existing literature firmly establishes that improving voltage stability and minimizing power losses are vital objectives for radial distribution systems (RDS). Simultaneously optimizing the allocation of EVCSs, DERs, and DSTATCOMs serves as a highly effective strategy to achieve these goals while unlocking further operational benefits for the network. This section reviews the existing literature on the optimal allocation of DGs, EVCSs, and DSTATCOM units. It examines both standalone deployment strategies and recent advances in simultaneous integration, thus, establishing a state-of-the-art context for this research domain.
In the literature, a variety of nature-inspired optimization techniques have been employed to address these integration challenges, as they are effective in solving challenging problems beyond the scope of analytical approaches. The study in [3] demonstrates the growing popularity of EVs and the possible problems they may cause for the power market, such as increasing energy demand and deteriorating voltage stability index (VSI). Chen et al. in [4] presented a balanced mayfly algorithm to address the optimal placement and size strategy for EVCSs. EV load modeling does not account for changes in charging-station load on the DN due to ambiguity in EV user behavior. The study in [5] focused on the optimal allocation of DGs and EVCSs with network reconfiguration to lessen system losses using the binary bat algorithm. This technique may take a very long time to arrive at an ideal solution, particularly when dealing with complex issues. The research presented in [6] focused on reducing power losses. For this purpose, the author adopted a modified chicken swarm optimization technique to place DERs optimally and EVCSs on the IEEE 33 RDS. However, it may be necessary to consider challenges in scaling the solution to larger and more complex networks, as well as environmental factors. The study in [7] highlights the fundamental challenges that hinder the widespread adoption of EVs. Specifically, it focuses on high economic costs, limited battery capacity, and the lack of accessible charging infrastructure. The authors proposed an optimization method that combines differential evolution with Harris-hawks optimization (HHO) to optimally allocate EVCSs and PVs. Similarly, Dharavat et al. in [8] discussed the allocation of DERs and EVCSs in the DN using the political optimization algorithm. By strategically positioning and sizing the DERs, it aims to decrease power loss and improve the voltage profile. However, a larger DN with several energy sources and EVs may require a more scalable version of the proposed algorithm. The research in [9] stressed the need to minimize the impact of EVCSs and reduce power losses to enable the DN to operate efficiently. The authors in [10] used a battle-royale optimization method on the CIGRE 14-bus network to find the best spots for EVCSs. However, the study is limited by its exclusive focus on static load models. Consequently, the proposed approach may not perform well under dynamic operating conditions.
Notably, only a limited number of studies have addressed the EVCSs allocation problem considering real-time operating conditions. Numerous studies have investigated the simultaneous allocation of conventional DGs and EVCSs within DNs. These studies often also include the use of flexible AC transmission system (FACTS) devices. To enhance the voltage profiles of IEEE 51 and IEEE 69 RDS, ref. [11] applied the grasshopper optimization algorithm to determine the ideal placement of EVCSs, DGs, and capacitors. Nevertheless, the algorithm struggles with slow convergence when applied to intricate problems, leading to high computational demands that limit its real-world applicability.
Furthermore, a growing body of literature focuses on optimal allocation of EVCSs, DGs, and shunt capacitors (SCs) within DNs [12,13,14,15,16]. One big problem with using multi-objective methods for fast charging stations is that there is not enough data on how people charge their EVs, their driving habits, or other important factors. Mohanty et al. [17] integrated a fuzzy approach with the RAO-3 algorithm to determine the optimal locations for DGs, DSTATCOMs, and EVCSs within IEEE 69 RDS. Integrating dynamic load patterns and DERs can substantially improve the accuracy and reliability of this approach. To find the best placement for several DGs, SCs, and EVs in a DN, the study in [18] suggests using the marine predators algorithm. Technical rules, such as power quality and voltage stability, might make it harder to add DGs, SCs, and EVs to RDS. The algorithm must handle these rules well. In [19] a hybrid approach is used that combines a modified gravitational search algorithm and PSO to solve the load dispatch problem in EV-integrated microgrids. Finally, the researchers in [20] optimally allocate EVCSs to a real DN.
The study in [21] evaluates the effectiveness of HHO and teaching-learning-based optimization (TLBO). However, these multi-objective optimization techniques may fail to account for dynamic shifts in demand patterns and network topologies during co-allocation. In [22], the gorilla troops optimizer is deployed to find the optimal location and capacity of the DERs paired with the battery energy storage system (BESS) in a 108-bus RDS, in order to reduce the adverse impacts of the EVCSs loads and reduce the voltage deviation (VD). Economic objectives, specifically minimizing operating expenses and maximizing revenue within DNs, are addressed in [23]. Furthermore, ref. [24] proposes an allocation framework for DERs (PV and BESS) and EVCSs utilizing a whale optimization algorithm based on reinforcement learning (RL); however, the computational complexities and algorithmic limitations inherent to RL integration are not thoroughly discussed. The authors of [25,26,27,28] present a strategy for optimizing the placement of EVs to save installation costs and reduce losses while effectively managing the load and gas emissions (GE) of EVs. The authors in [29,30,31,32,33] highlight the need for an optimization framework that effectively integrates EVCSs and DGs into RDS. Research in [34,35,36,37] presents a comprehensive approach to optimal placement of EVCSs by integrating multiple energy resources (PV, BESS) and SCs, using advanced optimization methods to lessen system losses, enhance VSI, and effectively manage increased load demand. For complex, multi-dimensional problems, conventional optimization methods may deviate from the local optimal solution and require longer calculation times. A summary of the existing literature regarding the optimal placement of EVCSs and energy resources is presented in Table 1.
In our previous conference paper [38], an optimization approach was proposed to reduce the impact of EVCSs only on RDS. However, the study considered only one optimization algorithm and three operating scenarios based on multi-objective function without including economic, environmental, statistical, and sensitivity analysis. The present study extends this work by investigating both RDS and mesh distribution system (MDS) configurations, comparing two optimization algorithms, namely african vulture optimization algorithm with dimension learning based hunting and opposition flow direction algorithm (AVOA-DLH and OFDA), and analyzes the results of seven operating scenarios based on single- and multi-objective formulations. Furthermore, the extended study considered economic and environmental assessment, statistical comparison, and sensitivity analysis.
Although the majority of work exists on EVCSs, DERs, and compensator allocation problems, there exist some gaps within the existing literature base. One gap is that most studies analyze the allocation problem of EVCSs in relation to one form of DERs. Another gap is the fact that the effect of network topology on allocation problems is mostly studied for RDS; therefore, there is not enough research done on the effect of the same coordinated allocation problem for both RDS and MDS.
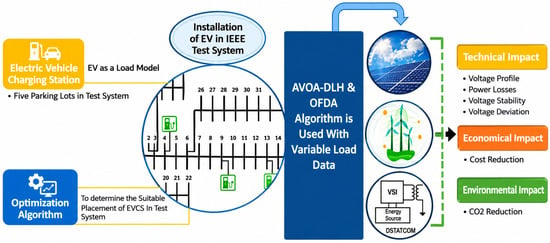
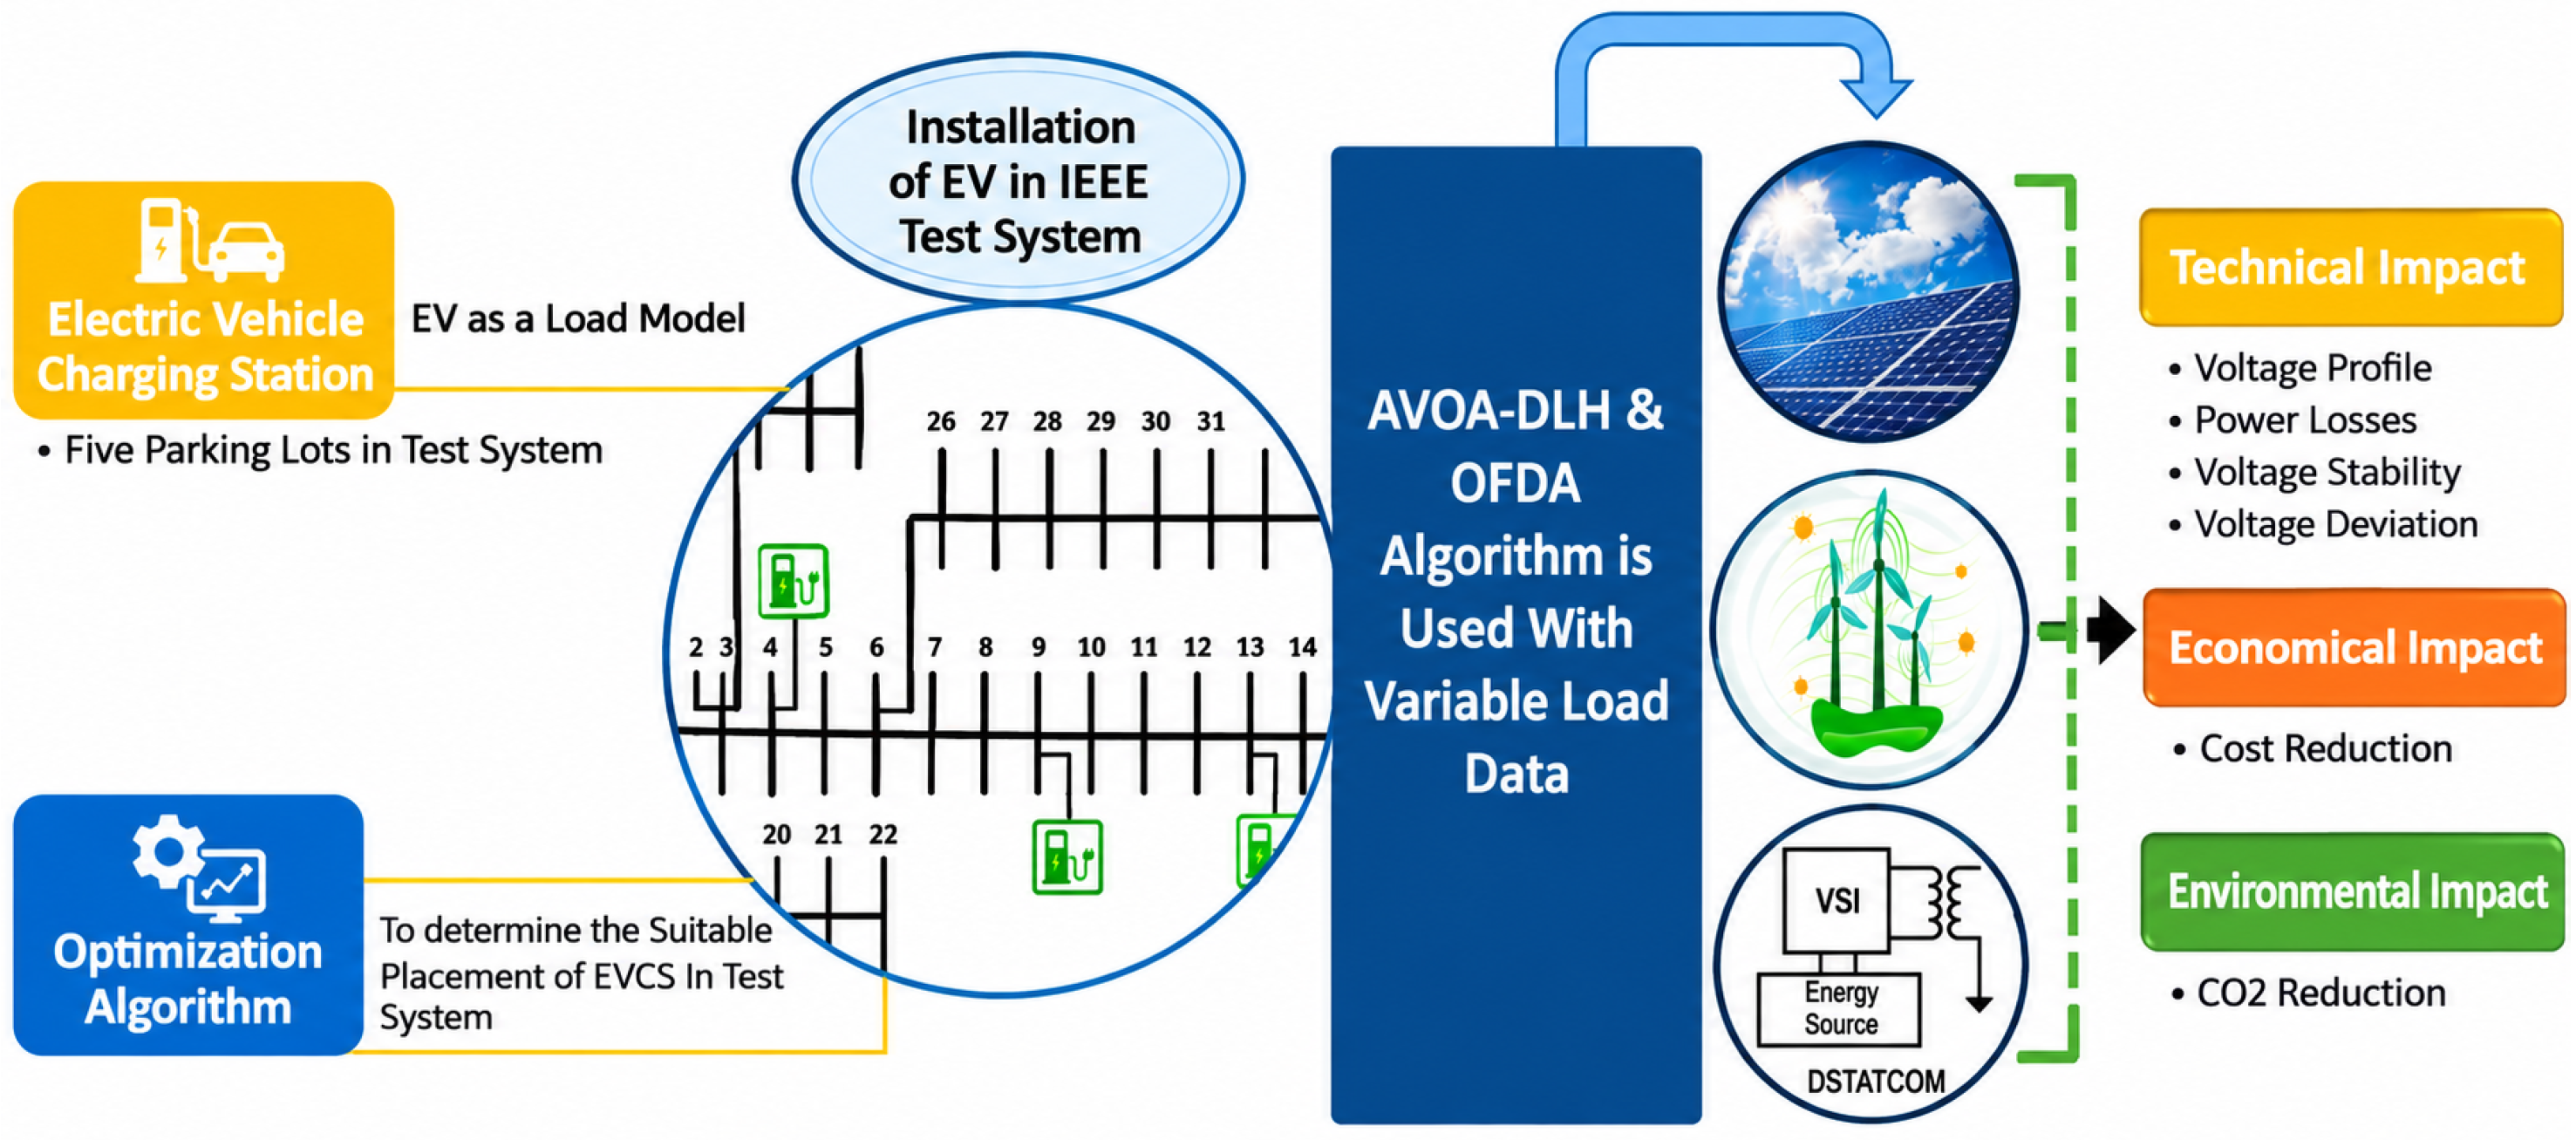
This study seeks to fill this gap by employing a coordinated optimal allocation approach based on the AVOA-DLH and OFDA for the simultaneous allocation of EVCSs, DERs (PV, wind), and DSTATCOM in both RDS and MDS configurations of the IEEE 33-bus system. The allocation problem considers both single- and multi-objective formulations to reduce active power loss (APL) and VD while improving the VSI. In addition to these conventional evaluation factors, the cost of annual energy loss, carbon emissions, statistical differences between the methods, and sensitivity analysis of objective weightings are also investigated. Figure 1 shows the proposed methodology for the DN.
Figure 1.
Proposed methodology.
The primary contributions of this research are summarized below:
- EVCSs are modeled as constant load and their impact is analyzed over a 24-h time-varying load profile.
- DERs (PV and wind) and DSTATCOMs are integrated to minimize the effect of EVCSs load on the DN.
- The AVOA-DLH and OFDA algorithms are evaluated on the IEEE 33-bus system under RDS and MDS configurations using single- and multi-objective formulations. The single-objective function (SOF) focuses on APL reduction, whereas the multi-objective function (MOF) simultaneously minimizes APL and VD and maximizes VSI.
- The economic and environmental impacts are assessed in terms of annual energy-loss cost and carbon emissions.
- The Wilcoxon signed-rank test is used for the statistical comparison of AVOA-DLH and OFDA, and sensitivity analysis is performed by varying the weight factors in the MOF to determine the effect on the optimization results.
Table 1.
Summary of previous research for optimal allocation of EVCSs and energy resources on RDS.
The remainder of this study is organized into the following sections: Section 2 outlines the mechanics of the AVOA-DLH and OFDA algorithms, while Section 3 introduces the problem formulation, covering the mathematical modeling of the DN, objective functions, and system constraints. Section 4 discusses the simulation findings, and Section 5 summarizes the main conclusions.
2. Preliminaries
In this research, the african vulture optimization algorithm with dimension learning based hunting (AVOA-DLH) and the flow direction algorithm with opposition-based learning (OFDA) are used to optimize objectives.
2.1. African Vulture Optimization Algorithm with Dimension Learning Based Hunting
The african vulture optimization algorithm (AVOA) [44] with dimension learning-based hunting (DLH) [45] enhances global optimization capabilities by combining broad-scale metaheuristic exploration with precise dimension-wise local search mechanics. The standard AVOA emulates the biological foraging and dominance hierarchies of African vultures. The population is governed by the two best solutions with the highest ranking, denoted as vultures and . The tradeoff between exploration and exploitation is driven by a dynamic hunger rate parameter G, calculated as follows:
where represents the current iteration, signifies the maximum allowable iterations, is a random number, r is a random velocity parameter, and c and W represent control parameters.
2.1.1. Exploration Phase ()
When the hunger level satisfies , the vultures search through many regions. The position vector for the subsequent iteration, , is updated based on a selection probability parameter:
where , and are random numbers between 0 and 1, and are the upper and lower boundaries of the decision space, and the distance vector is defined as:
where represents the target reference selected from the top two groups based on the roulette wheel selection method.
2.1.2. Exploitation Phase ()
When , the population transitions to localized refinement. Depending on internal probability parameters ( and ), the operational logic alternates between localized siege-fights, spiral rotation steps, or aggressive high-intensity foraging behaviors combined with Levy flight steps.
2.1.3. Dimension Learning-Based Hunting (DLH)
In standard AVOA, all dimensions of a candidate solution are updated simultaneously, which may disturb useful information in individual dimensions and elevate the probability of trapping in local optima. To overcome this limitation, the DLH mechanism performs dimension-wise learning. For every individual vector within the population, an auxiliary learning candidate vector, , is generated. Each dimension, j, is adjusted by observing a randomly selected peer vector from the population, , and the optimal reference target, :
A greedy selection mechanism compares the fitness of the standard AVOA solution and the DLH-based solution . The better solution is retained for the next iteration:
This decoupled dimensional tuning introduces a robust equilibrium between large-scale space exploration and localized convergence characteristics. The control parameters for the AVOA-DLH algorithm are presented in Table 2.
Table 2.
Control parameters of AVOA-DLH and OFDA.
2.2. Opposition Flow Direction Algorithm
Inspired by physical phenomena, the flow direction algorithm (FDA) [46] is a metaheuristic approach that replicates fluid movement toward minimum elevation levels. Using the hydrological approach, the algorithm assumes that flows move towards neighboring positions with lower elevations at a velocity proportional to the terrain slope. The initial positions of the flows are generated within the problem search space bounds:
where and denote the lower and upper limits of the decision variables, while specifies a random value drawn uniformly from the interval . Each flow explores its neighborhood within a dynamic radius :
To balance global exploration and local exploitation, is linearly decreased using a non-linear weight W:
where and denote the current iteration index and the maximum allowable iterations, respectively, while is a random location. The movement velocity V depends directly on the slope B between the current flow site and its neighbor across the n-th dimension:
The candidate flow position is updated along the gradient as follows:
The proposed position is accepted only if it yields an improvement in the target objective function value:
To prevent premature convergence to local optima within the standard FDA search mechanism, opposition-based learning (OBL) [47] is applied. For a flow position vector in a n-dimensional search space, the opposite flow candidate is defined by:
The final selection rule ensures that the opposite candidate replaces the current position only if it yields superior fitness:
3. Problem Formulation
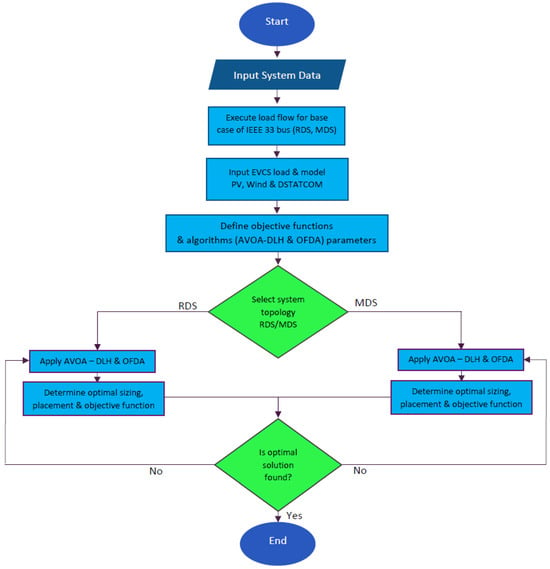
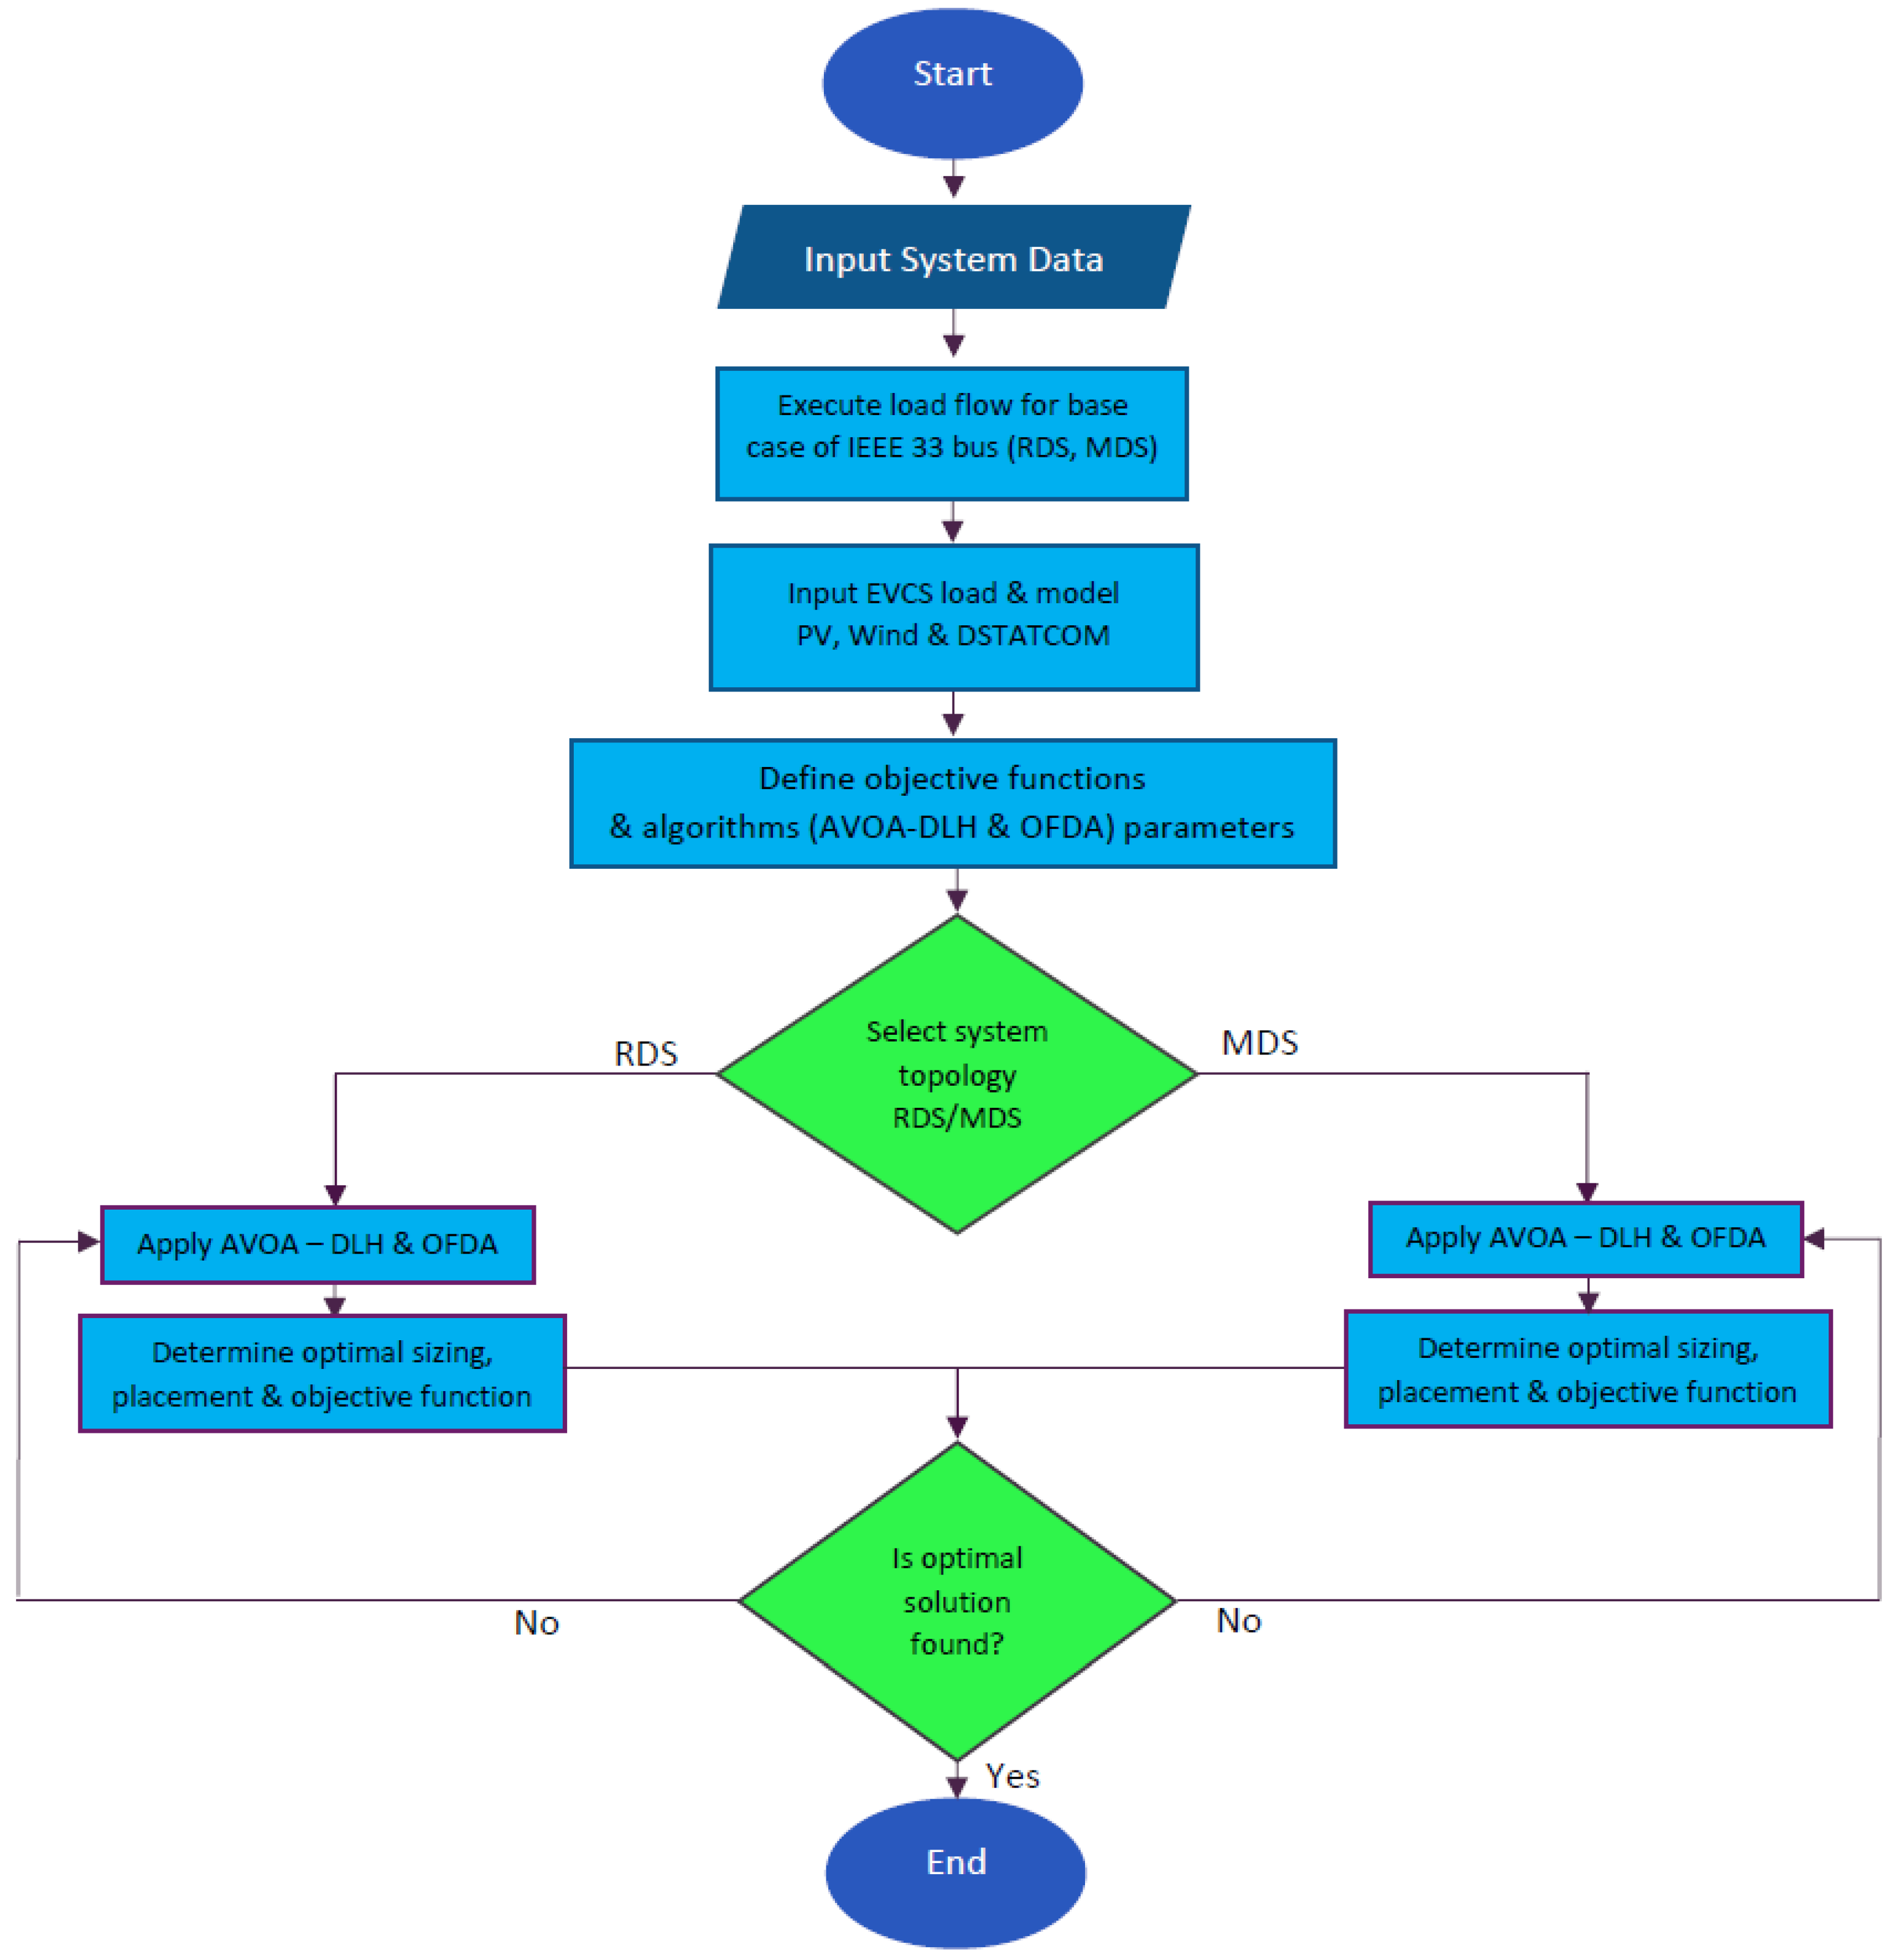
This section addresses system modeling, including load flow analysis, objective functions, and problem constraints. Figure 2 presents a comprehensive flowchart for the execution process of AVOA-DLH and OFDA in DNs. The initialization of the DN data, EVCSs characteristics, DERs limits, DSTATCOM limits, and algorithmic parameters are done first. The decision variable range is then the range of the candidate population. The EVCSs capacity and locations, allocation of DERs and DSTATCOM settings are applied to the network model and then load-flow analysis is performed for each candidate solution. The resulting APL, VD, and VSI are calculated and the objective function is evaluated for these. Solutions with network constraints different from those stated above are rejected or penalized based on the network constraint handling procedure that is used.
Figure 2.
Flowchart for execution of the algorithms.
The standard AVOA search is followed by dimension learning based search and greedy selection of the improved candidate for AVOA-DLH. For OFDA, candidate flow positions are created and updated based on the flow-direction mechanism and OBL is then added. This is repeated until the desired maximum number of iterations or the stopping condition is met. Finally, the optimum solution is saved and the positions of its elements, the capacities of the elements and indices of network performance are given.
3.1. Load Flow Analysis
In order to solve power flows in DNs, a practical load-flow approach is used based on the backward-forward sweep (BFS) technique [48]. It is suitable for both RDS and MDS [49]. The branch current between buses l and m and the load current on bus m are calculated using Equations (17) and (18), respectively.
APL and reactive power loss (QPL) in the branch connecting buses l and m are calculated using the following Equations:
The total APL and QPL in the DN are determined by adding the losses of all branches, as given in Equations (21) and (22).
3.1.1. EVCSs Model
For modeling purposes, each EVCS is characterized as a constant active power sink during charging intervals. Consequently, the cumulative power demand imposed by EVs via chargers must comply with the permitted power capacity constraints of the corresponding bus. The total load profile of the DN that integrates these EVCSs units is formulated in Equation (23) [38].
3.1.2. DERs Modeling
For active power compensation, DERs (PV and wind) are used. After the introduction of DERs in this model, Equation (24) shows the net active power produced by the system to lower the active power demand [38].
- (a)
- PV Modeling:
For PV modeling, the beta distribution is used. Equation (25) provides the probability density function (pdf) of the beta distribution for variations in the magnitude of solar irradiance for and > 0 [50].
where and represent the beta-distribution shape parameters and their values are 0.61294 and 0.64496 respectively, denotes the solar irradiance, and refers to the gamma function. Monte carlo (MC) simulation is used to generate samples from the beta distribution after estimating the parameters and . Equation (26) is utilized to derive the power from solar irradiance [50].
where indicates the active power generated by the PV, denotes the overall number of PV modules, F represents the fill factor, V establishes the output operating voltage, I is the output current.
- (b)
- Wind Modeling:
The Weibull probability distribution serves as an adequate model for wind speed variability [50]. Equation (27) represents the pdf of the Weibull distribution.
where x and y are the Weibull scale and shape parameters and their values are 0.74378 and 3.64167 respectively. Again, MC is used to generate samples after estimating x and y from the Weibull distribution. After synthesizing wind samples from the Weibull distribution, the wind speed power is harvested using the model described by Equation (28).
where denotes the speed of the wind, is cut in, is cut out, and is the rated speed.
3.1.3. DSTATCOM Modeling
DSTATCOM is a FACTS device that is used to inject or absorb reactive power in the DN. By supplying reactive power on the bus m, DSTATCOM directly compensates and reduces the overall demand for reactive power by the magnitude of its generated output [38,40,51]. It is described by Equation (29):
3.2. Objective Functions
This paper addresses the strain on the power grid that results from expanded EV charging infrastructure by formulating an optimal placement and capacity strategy for EVCSs, DERs, and DSTATCOMs. Minimizing APL alongside VD, together with strengthening system VSI, constitute the main optimization goals. The mathematical representation of these objective functions is given below:
3.2.1. Active Power Loss (APL)
In DN optimization, following equation presents the objective function designed to minimize APL [1,38]:
where is the total number of branches, m denotes the branch index, represents the current flowing through branch m, and is the resistance of branch m. Owing to their intrinsic radial topology, DNs typically exhibit high APL, making their minimization a critical operational goal.
3.2.2. Voltage Deviation (VD)
The VD is minimized to maintain acceptable voltage profiles throughout the network and improve power quality [1,38]. It is the deviation between the preset reference voltage and the actual voltage observed at any particular bus. The following equation represents it:
where stands for the nominal voltage and is always taken as 1 per unit (p.u.), k is the bus number and b is the total number of buses [1]. The VD should always be kept to a minimum (close to zero) to improve the system voltage.
3.2.3. Voltage Stability Index (VSI)
VSI is a widely used indicator for assessing the voltage stability of a DN. If a bus in the network goes past its allowed voltage limits, the entire system can become unstable. VSI is calculated using the following equation:
where and represent the line inductive reactance and resistance, while and represent the active and reactive power demands at load bus m, respectively. VSI should be greater than zero and closer to 1 for DNs to work steadily [1,38].
3.2.4. Multi-Objective Function (MOF)
MOF is designed to give equal priority to three objective functions, i.e., reducing APL, reducing VD, and increasing VSI. For this purpose, the weighted sum method is used. Equation (33) employs weighting factors to combine the three objective functions, which are minimized through the optimal allocation of EVCSs, DERs, and DSTATCOM units [38,52]. These objective functions are combined and described by the following equation:
where , , and are the weights of three objective functions. To ensure proper normalization, the weighting factors are constrained by . Each weight in this research is set equal to 1/3. The equal weighting strategy was chosen as it is a strategy that does not give any a priori preference to any single objective.
3.2.5. Annual Energy Loss Cost
The annual cost of energy () serves as an economic metric to evaluate the efficacy of the proposed strategy to reduce costs [53]. The primary goal is to reduce this cost.
where t is the time of year in hours, i.e., 8760 h, and is the rate of energy, i.e., 0.06 PKR/kWh.
3.2.6. Carbon Emission
Since carbon emissions () have increased significantly over the past several decades, a considerable body of research has focused on identifying the main factors that govern these emissions. Therefore, any proposed solution to this problem must also consider to ensure that it is environmentally viable. is computed using the following equation [28]:
where is the emission rate of and varies depending on the sources. For PV, it is 0.058 kg/kWh, and for wind, it is 0.00525 kg/kWh [53]. is the energy generated by the substation.
3.3. Problem Constraints
The optimal allocation and size of EVCSs, DERs, and DSTATCOMs are governed by a strict set of operational constraints, including equality conditions for network power balance and inequality limits for system operation.
3.3.1. Equality Constraints
To avoid reverse power flow and prevent potential equipment damage, the total power generation must strictly match the sum of aggregate load demand and APL. In this case, active power demand (), APL and EVCSs load demand () must be equal to the power generated by the DERs () and the substation () [38]. It is expressed in Equation (36).
Similarly, reactive power balance requires that the combined output of the substation () and DSTATCOM () must equal the sum of total reactive load demand () and reactive power losses () [38]. It is represented by Equation (37).
3.3.2. Inequality Constraints
Inequality constraints for the distribution network are expressed as follows:
Voltage Constraint: The bus voltage magnitudes must be maintained within the specified lower and upper limits, as expressed below:
Current Constraint: The magnitude of the branch current must not exceed its perspective allowable thermal limit for safe operation as given in the equation below:
DERs Constraint: represents the active power supplied by DERs, the following equation can be used to express the size limit of DERs [54].
DSTATCOM Constraint: The reactive power supplied by DSTATCOM is restricted by device capacity limits. The operation must be bounded by the minimum and maximum size limit of the DSTATCOM unit [54].
4. Results and Discussion
MATLAB 2022b is used in this research to evaluate the performance of AVOA-DLH and OFDA, on a standard bus system, i.e., IEEE-33. EVCSs, DERs (PV and wind) and DSTATCOM are integrated in different scenarios. This article considers five charging stations with varying ratings to meet customer demand, as shown in Table 3. These EVCSs are designed to accommodate a daily load profile of up to 100 EVs. The total power demand by the EVCSs is mathematically formulated and calculated using Equation (42) [54,55].
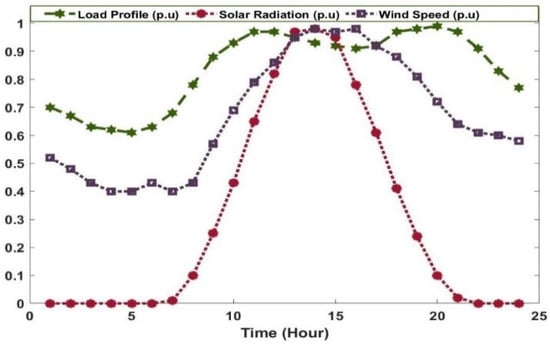
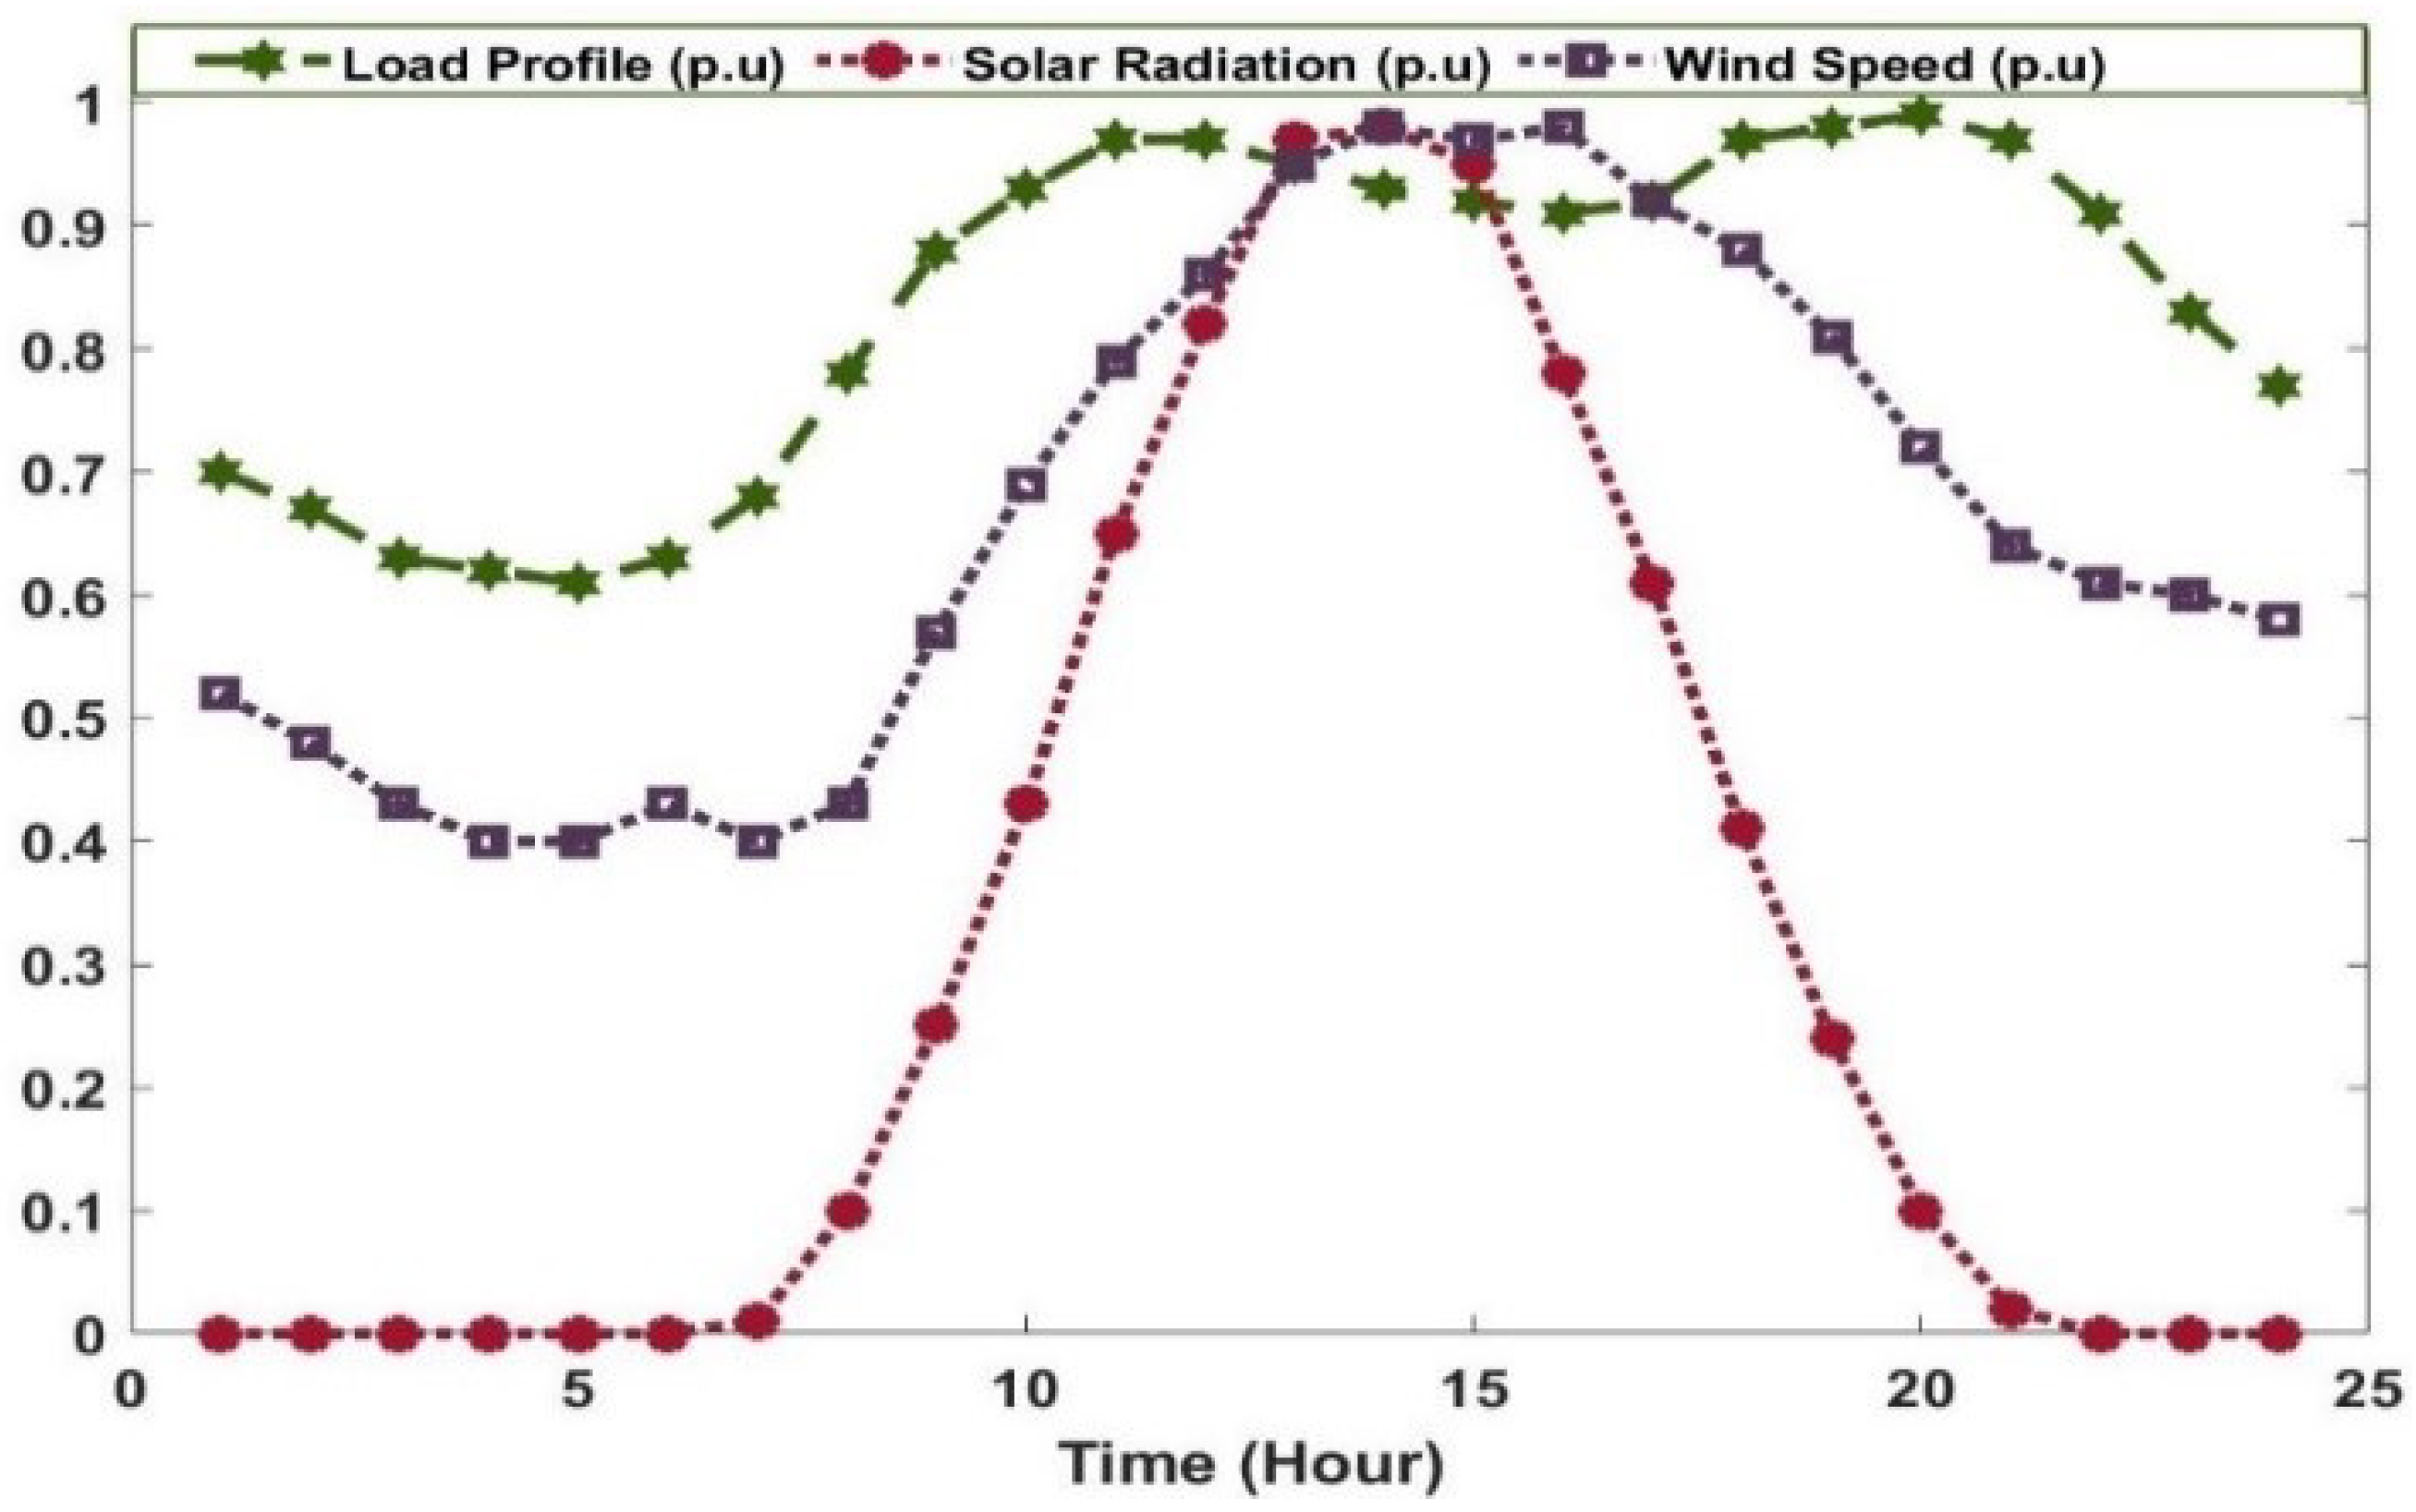
where is the power required by EVs for charging, is the total number of charging points and denotes the rating of the charging points in kW. Figure 3 shows the load profile, solar radiation, and wind speed curve over a conventional 24-h time frame in per unit (p.u.). Variations in conventional DN demand are represented by a normalized, deterministic 24-h load profile. Daily DN demand is modeled by applying an hourly normalized load multiplier to the base active and reactive loads of the IEEE 33-bus system. At each hour, this scaled baseline demand is combined with the EVCSs load as per Equation (23), maintaining baseline operating conditions. This 24-h horizon is used to evaluate the interactions among conventional demand, EVCSs loads, solar radiation and wind speed.
Table 3.
EVCSs load power requirement [55].
Figure 3.
Load profile, solar radiation, and wind speed over a conventional 24-h time frame.
To evaluate both SOF and MOF, the following scenarios are analyzed using the IEEE 33 DN:
- Scenario 1: Integration of five EVCSs
- Scenario 2: Integration of EVCSs and PV
- Scenario 3: Integration of EVCSs and wind
- Scenario 4: Integration of EVCSs, PV and wind
- Scenario 5: Integration of EVCSs, PV and DSTATCOM
- Scenario 6: Integration of EVCSs, wind, and DSTATCOM
- Scenario 7: Integration of EVCSs, PV, wind and DSTATCOM
4.1. IEEE 33-Bus RDS Configuration
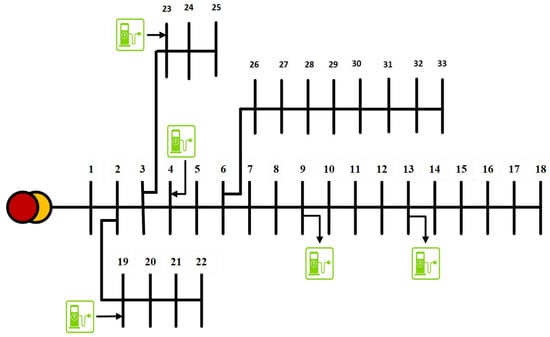
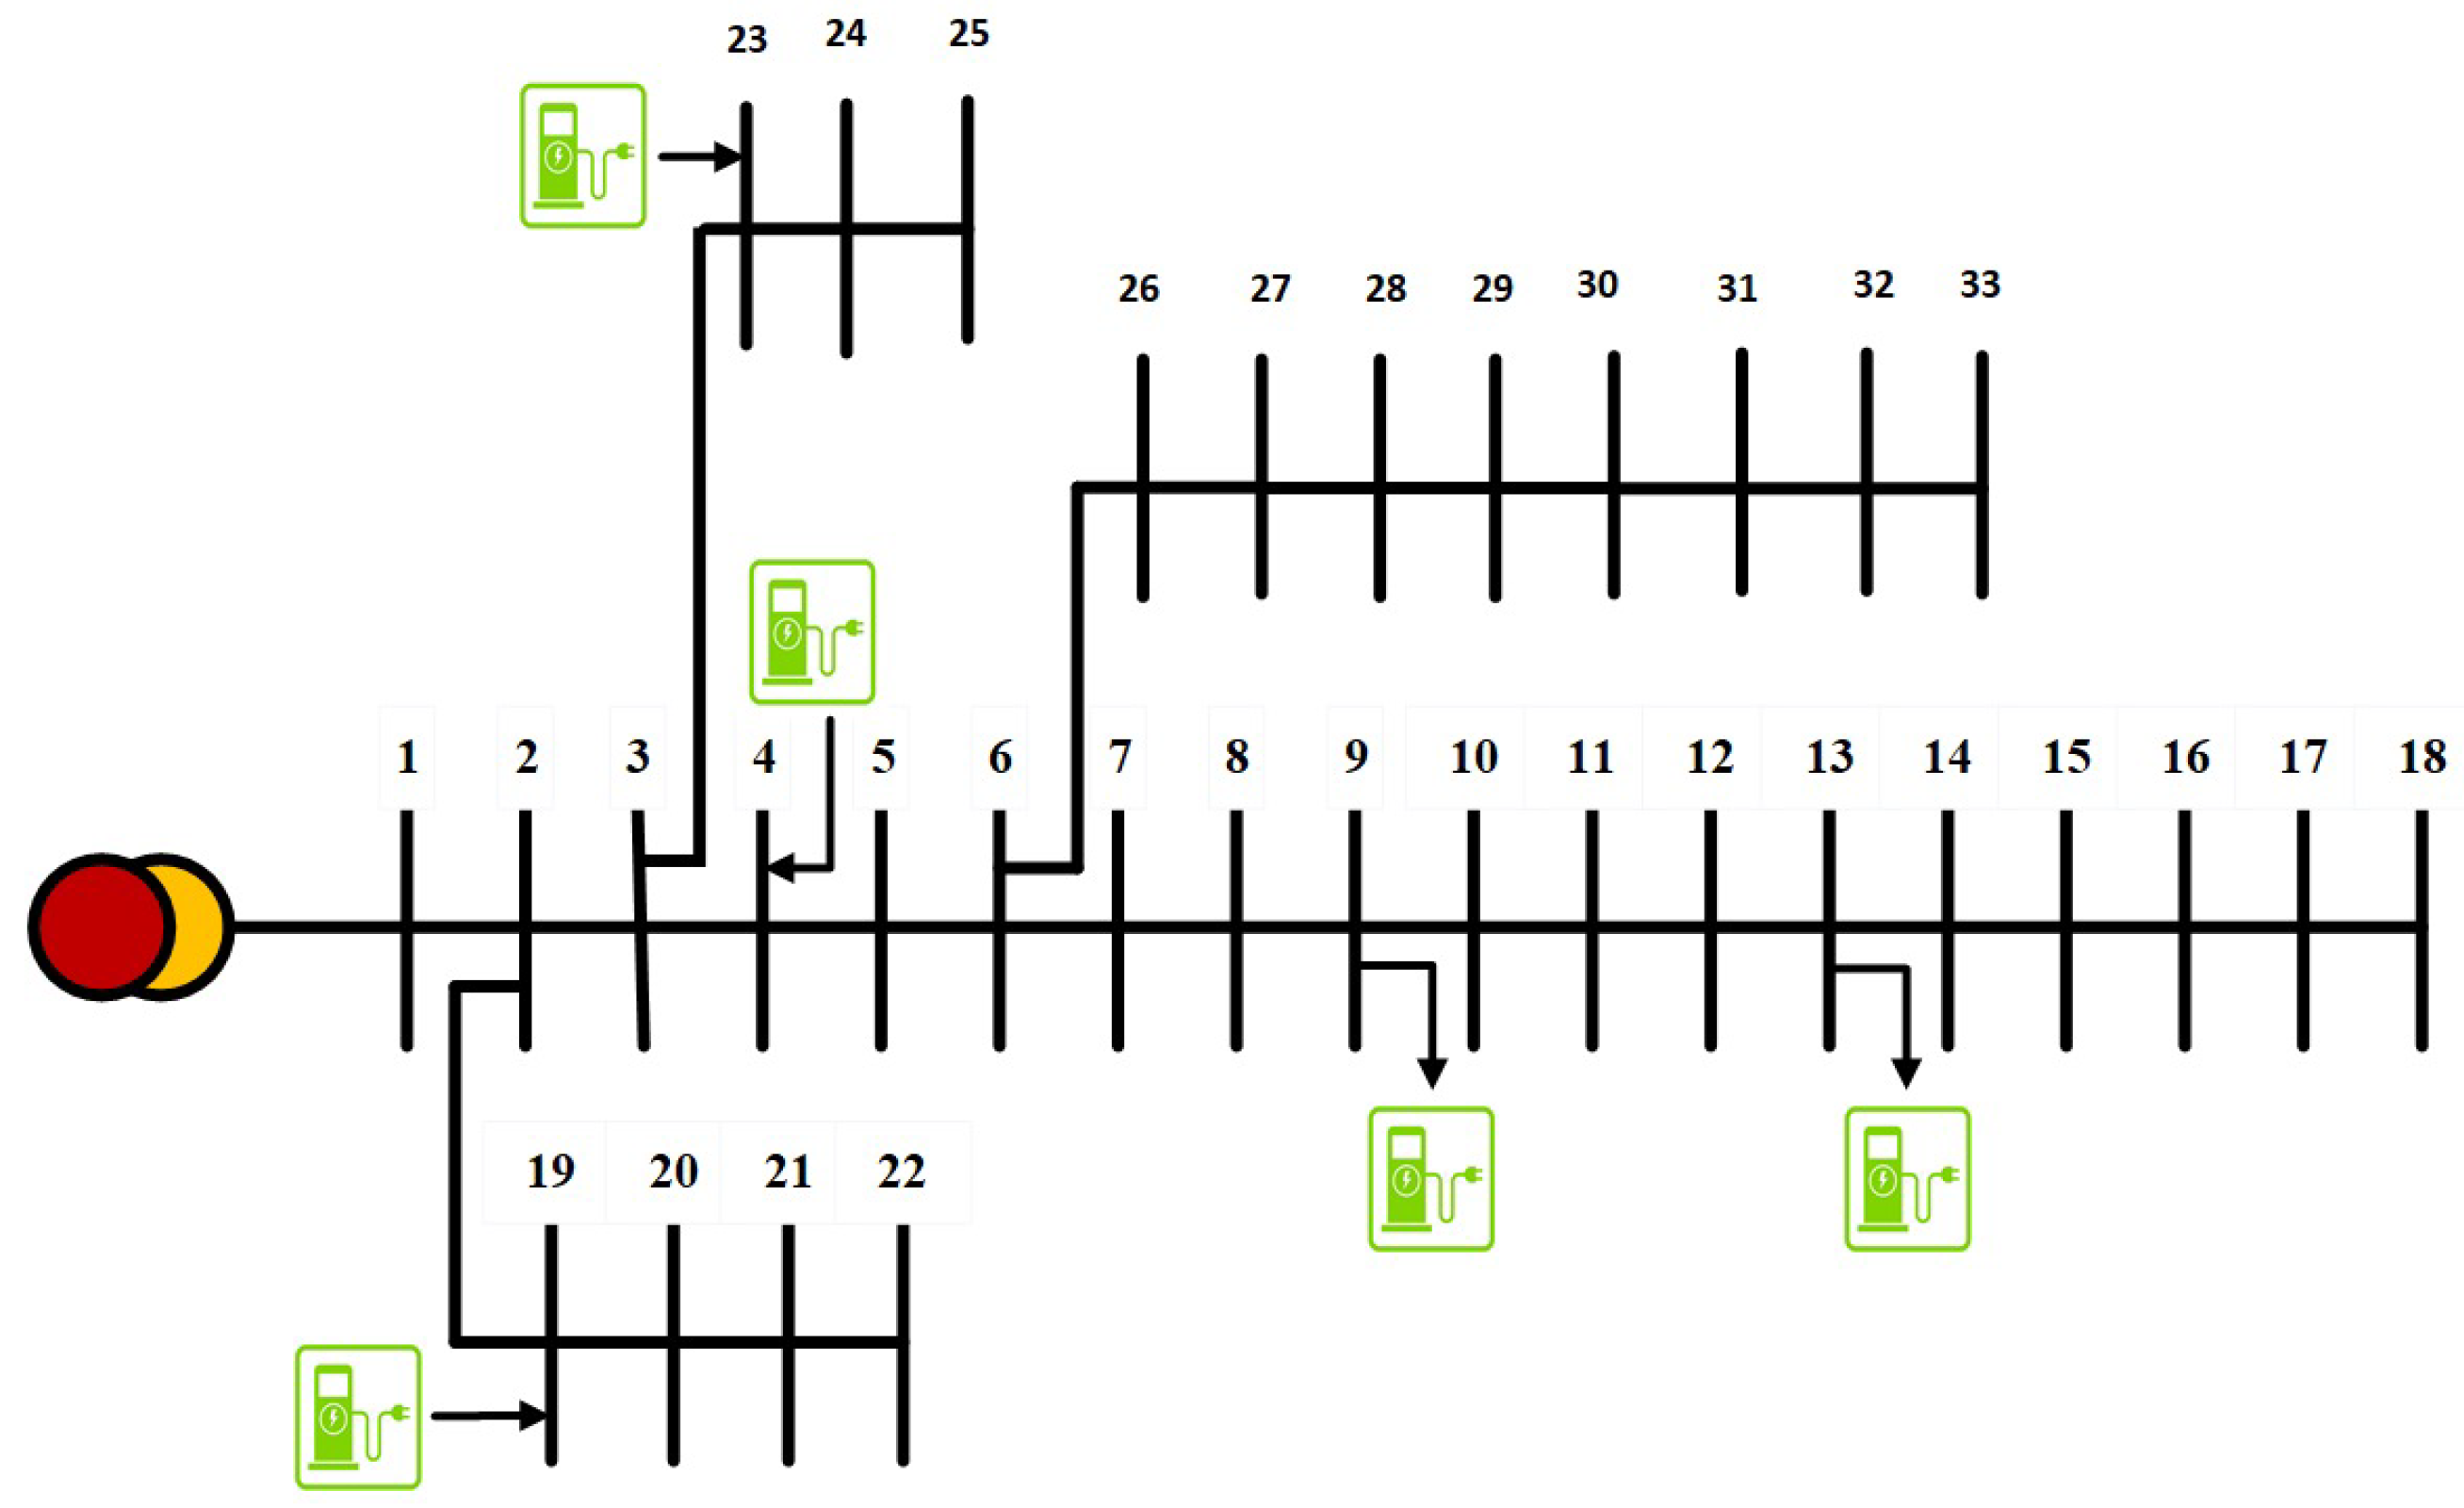
The single-line diagram of the IEEE 33-bus radial DN is illustrated in Figure 4, highlighting the optimal EVCS locations identified by AVOA-DLH. Operating at a base voltage of 12.66 kV and a base power of 100 MVA, it consists of 33 buses and 32 branches [56]. The network maintains a conventional radial configuration, where each node connects to the main substation via a single path, supporting an aggregate active load of 3715 kW and a reactive load of 2300 kvar. Using the BFS load flow analysis, it is observed that bus 18 has the lowest minimum voltage (Vmin) of 0.9042 p.u. The initial APL is 210.05 kW and the QPL is 142.42 kvar. Furthermore, the VSI is 0.6697 p.u. and the VD is 0.1328 p.u. [56].
Figure 4.
Single-line diagram of the IEEE 33-bus RDS showing optimal locations of EVCSs determined by AVOA-DLH.
4.1.1. Single Objective Function (SOF) Assessment for RDS Configuration
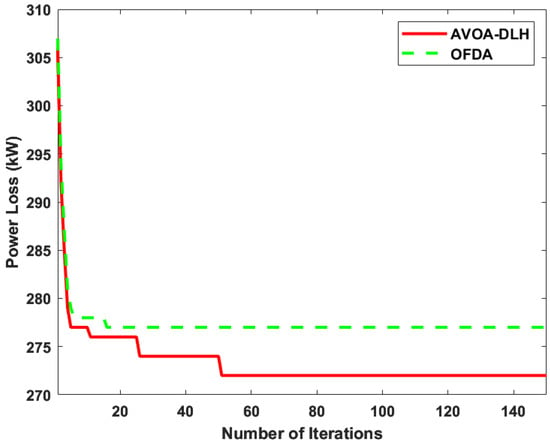
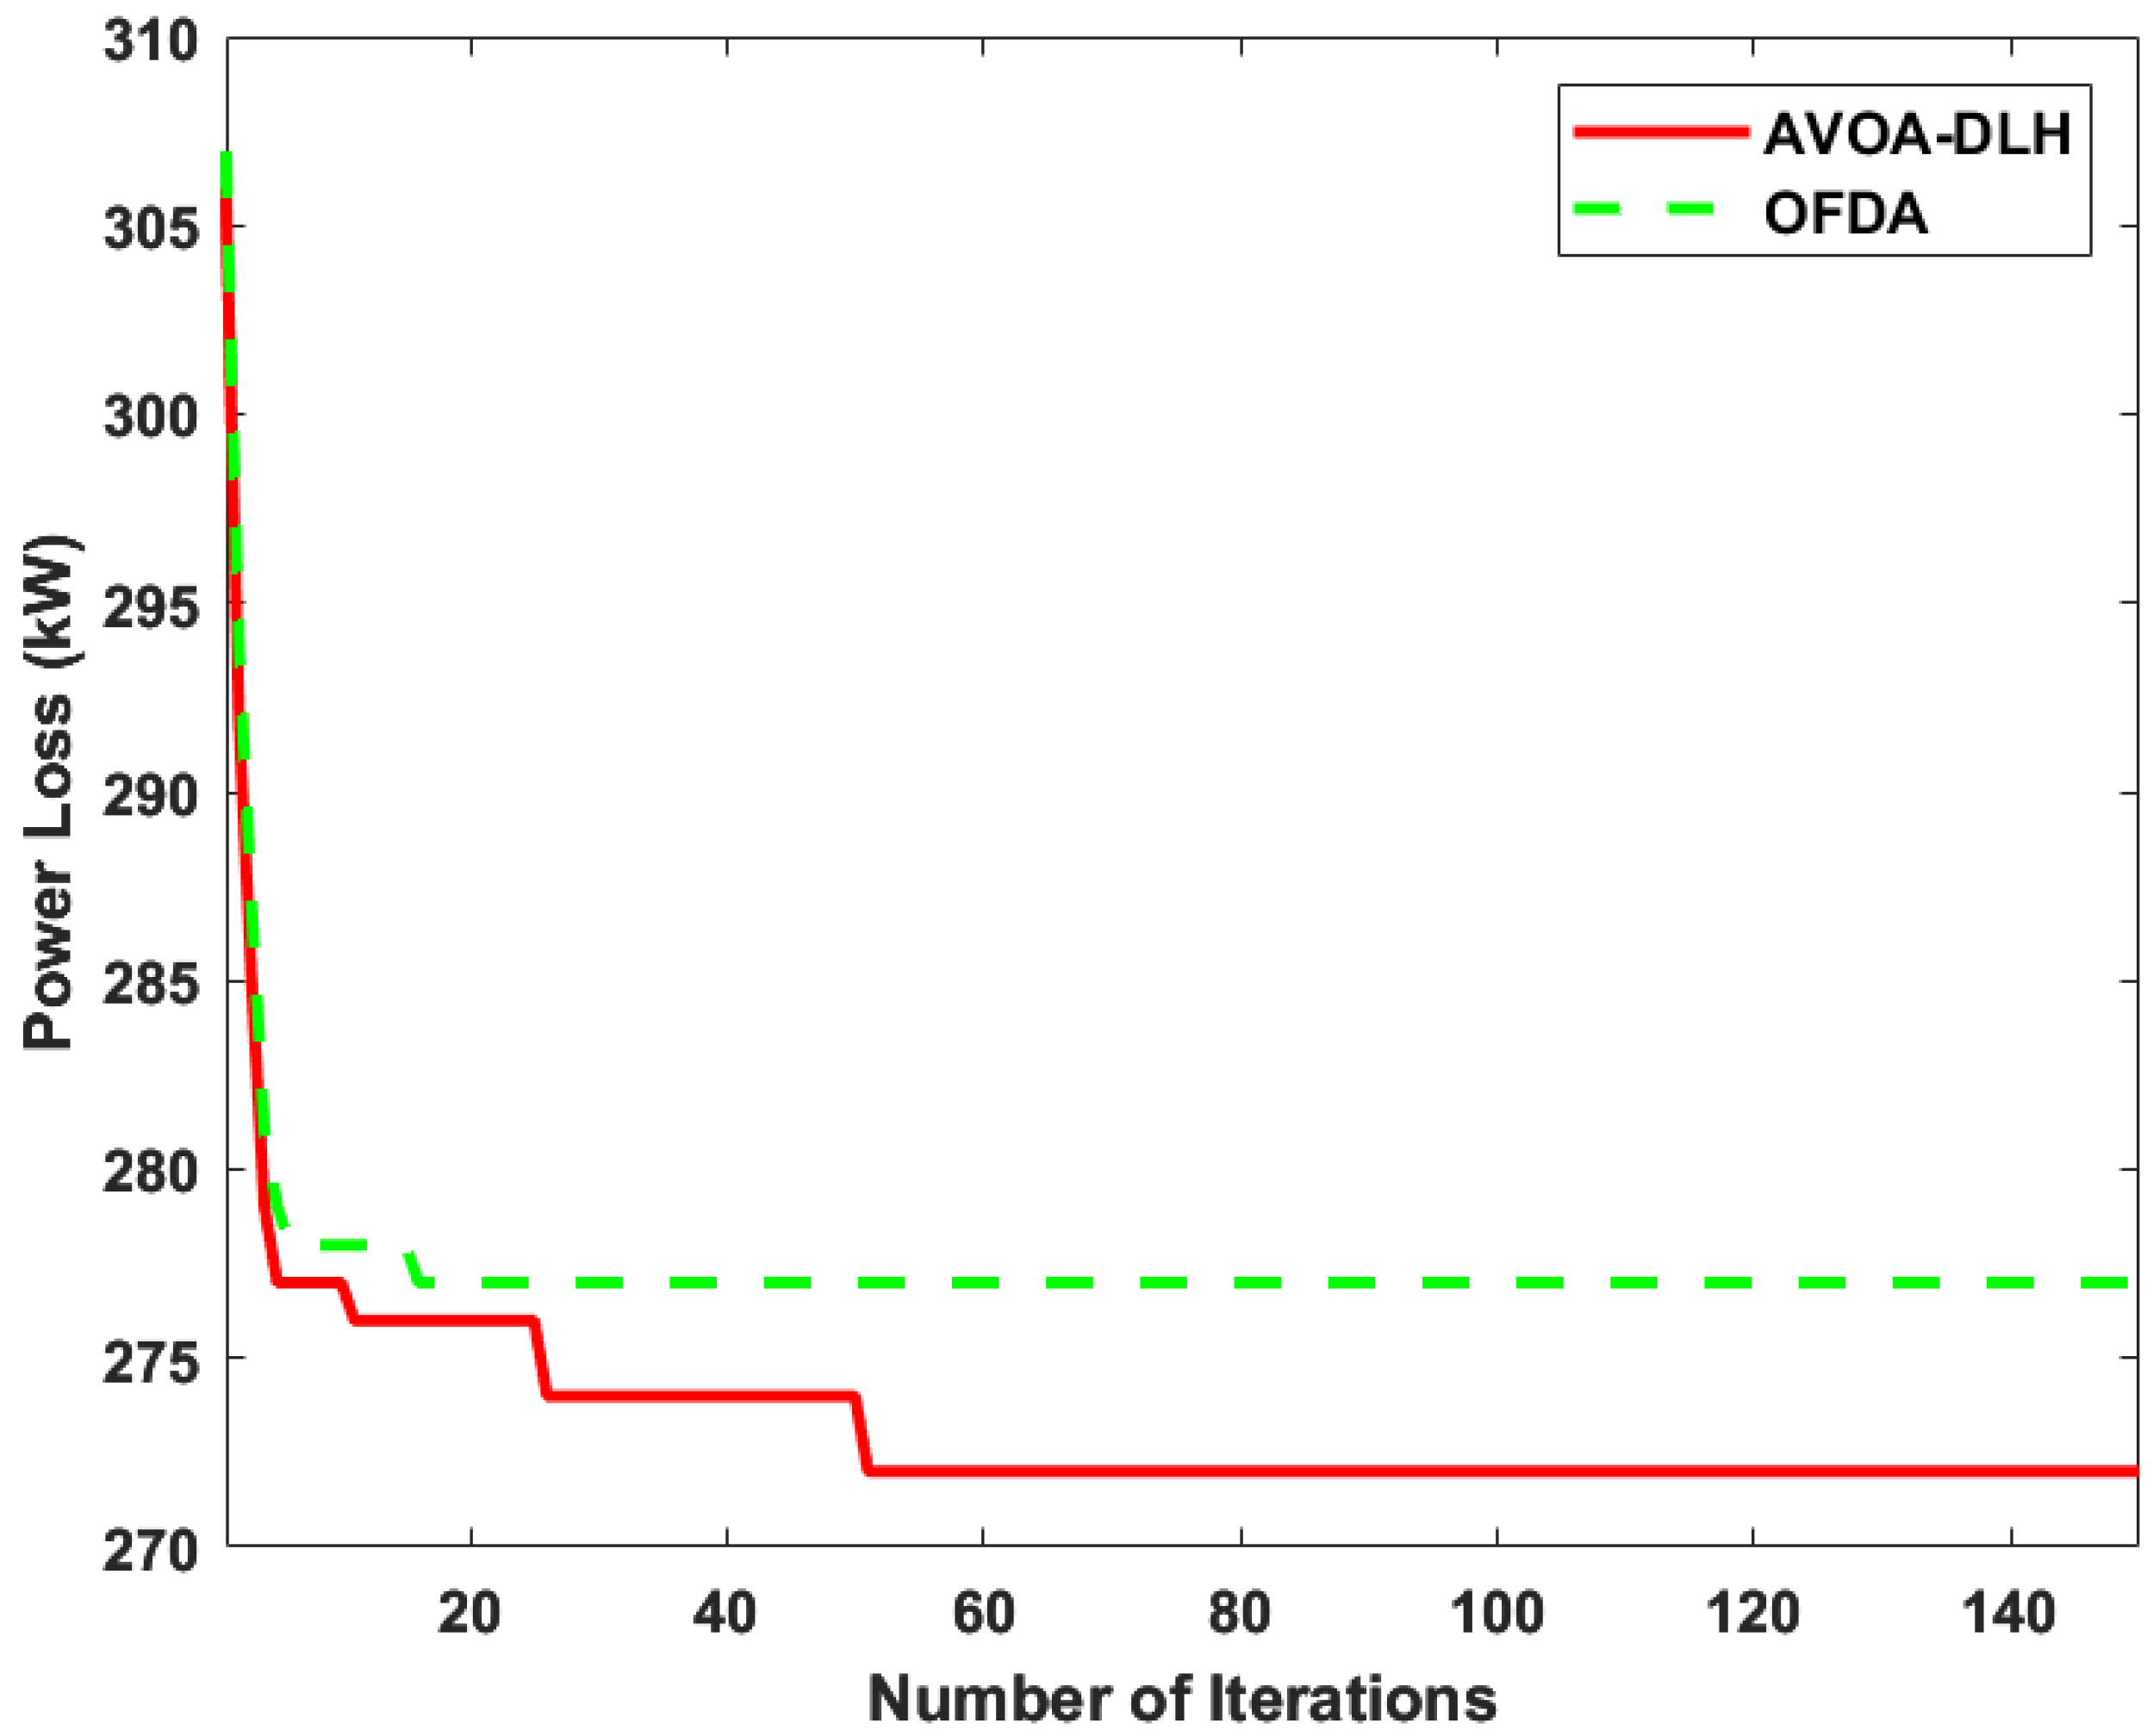
The study used AVOA-DLH and OFDA to determine the optimal locations of the EVCSs, and the results are presented in Table 4. The integration of EVCSs in scenario 1 greatly degraded the system performance, as detailed in Table 5. An APL of 272.31 kW and 276.43 kW is produced using AVOA-DLH and OFDA, which is greater than the base case value, i.e., 210.05 kW. This results in a percentage loss reduction (PLR) of −29.62% in AVOA-DLH and −31.60% in OFDA. Vmin is also reduced to 0.8909 p.u. (AVOA-DLH) and 0.8875 p.u. (OFDA) compared to the base case value of 0.9042 p.u. For AVOA-DLH, the VD and VSI values are 0.1711 p.u. and 0.6334 p.u., respectively; for OFDA, the values are 0.1753 p.u. and 0.6247 p.u., respectively. The comparative convergence behavior of AVOA-DLH and OFDA in scenario 1 is shown in Figure 5. To mitigate the technical challenges imposed by EVCSs integration, scenario 2 co-locates PV generation at the charging stations. Optimization through AVOA-DLH reduces the APL from 272.31 kW to 137.17 kW, while OFDA yields a reduction from 276.43 kW to 139.56 kW. Integration of wind in scenario 3 significantly reduces power losses and also improves other metrics. The reason for the greater reduction in power losses in this scenario as compared to scenario 2 is that the wind is available day and night. In contrast, solar power is not available round the clock. The APL yielded by AVOA-DLH is 94.24 kW, while OFDA yields 96.56 kW for this scenario. In the AVOA-DLH, the computed magnitudes of VD and VSI are 0.0589 p.u. and 0.7470 p.u., respectively; however, in the case of OFDA, the comparable magnitudes are 0.0611 p.u. and 0.7468 p.u.
Table 4.
Size and location of EVCSs, DERs (PV and Wind), and DSTATCOM in RDS configuration under SOF scenarios.
Table 5.
APL, PLR (%), VD, VSI, and Vmin for RDS configuration under SOF scenarios.
Figure 5.
Convergence curve for EVCSs integration in the IEEE 33-bus RDS configuration.
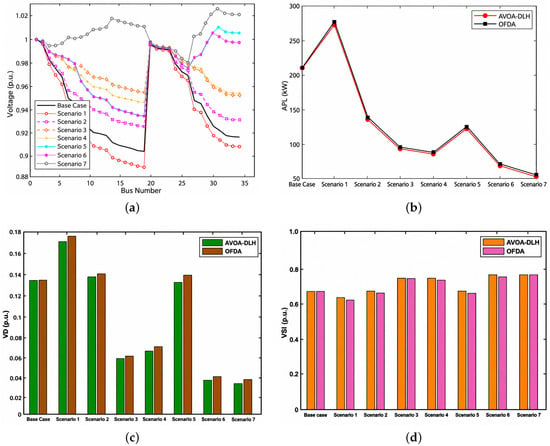
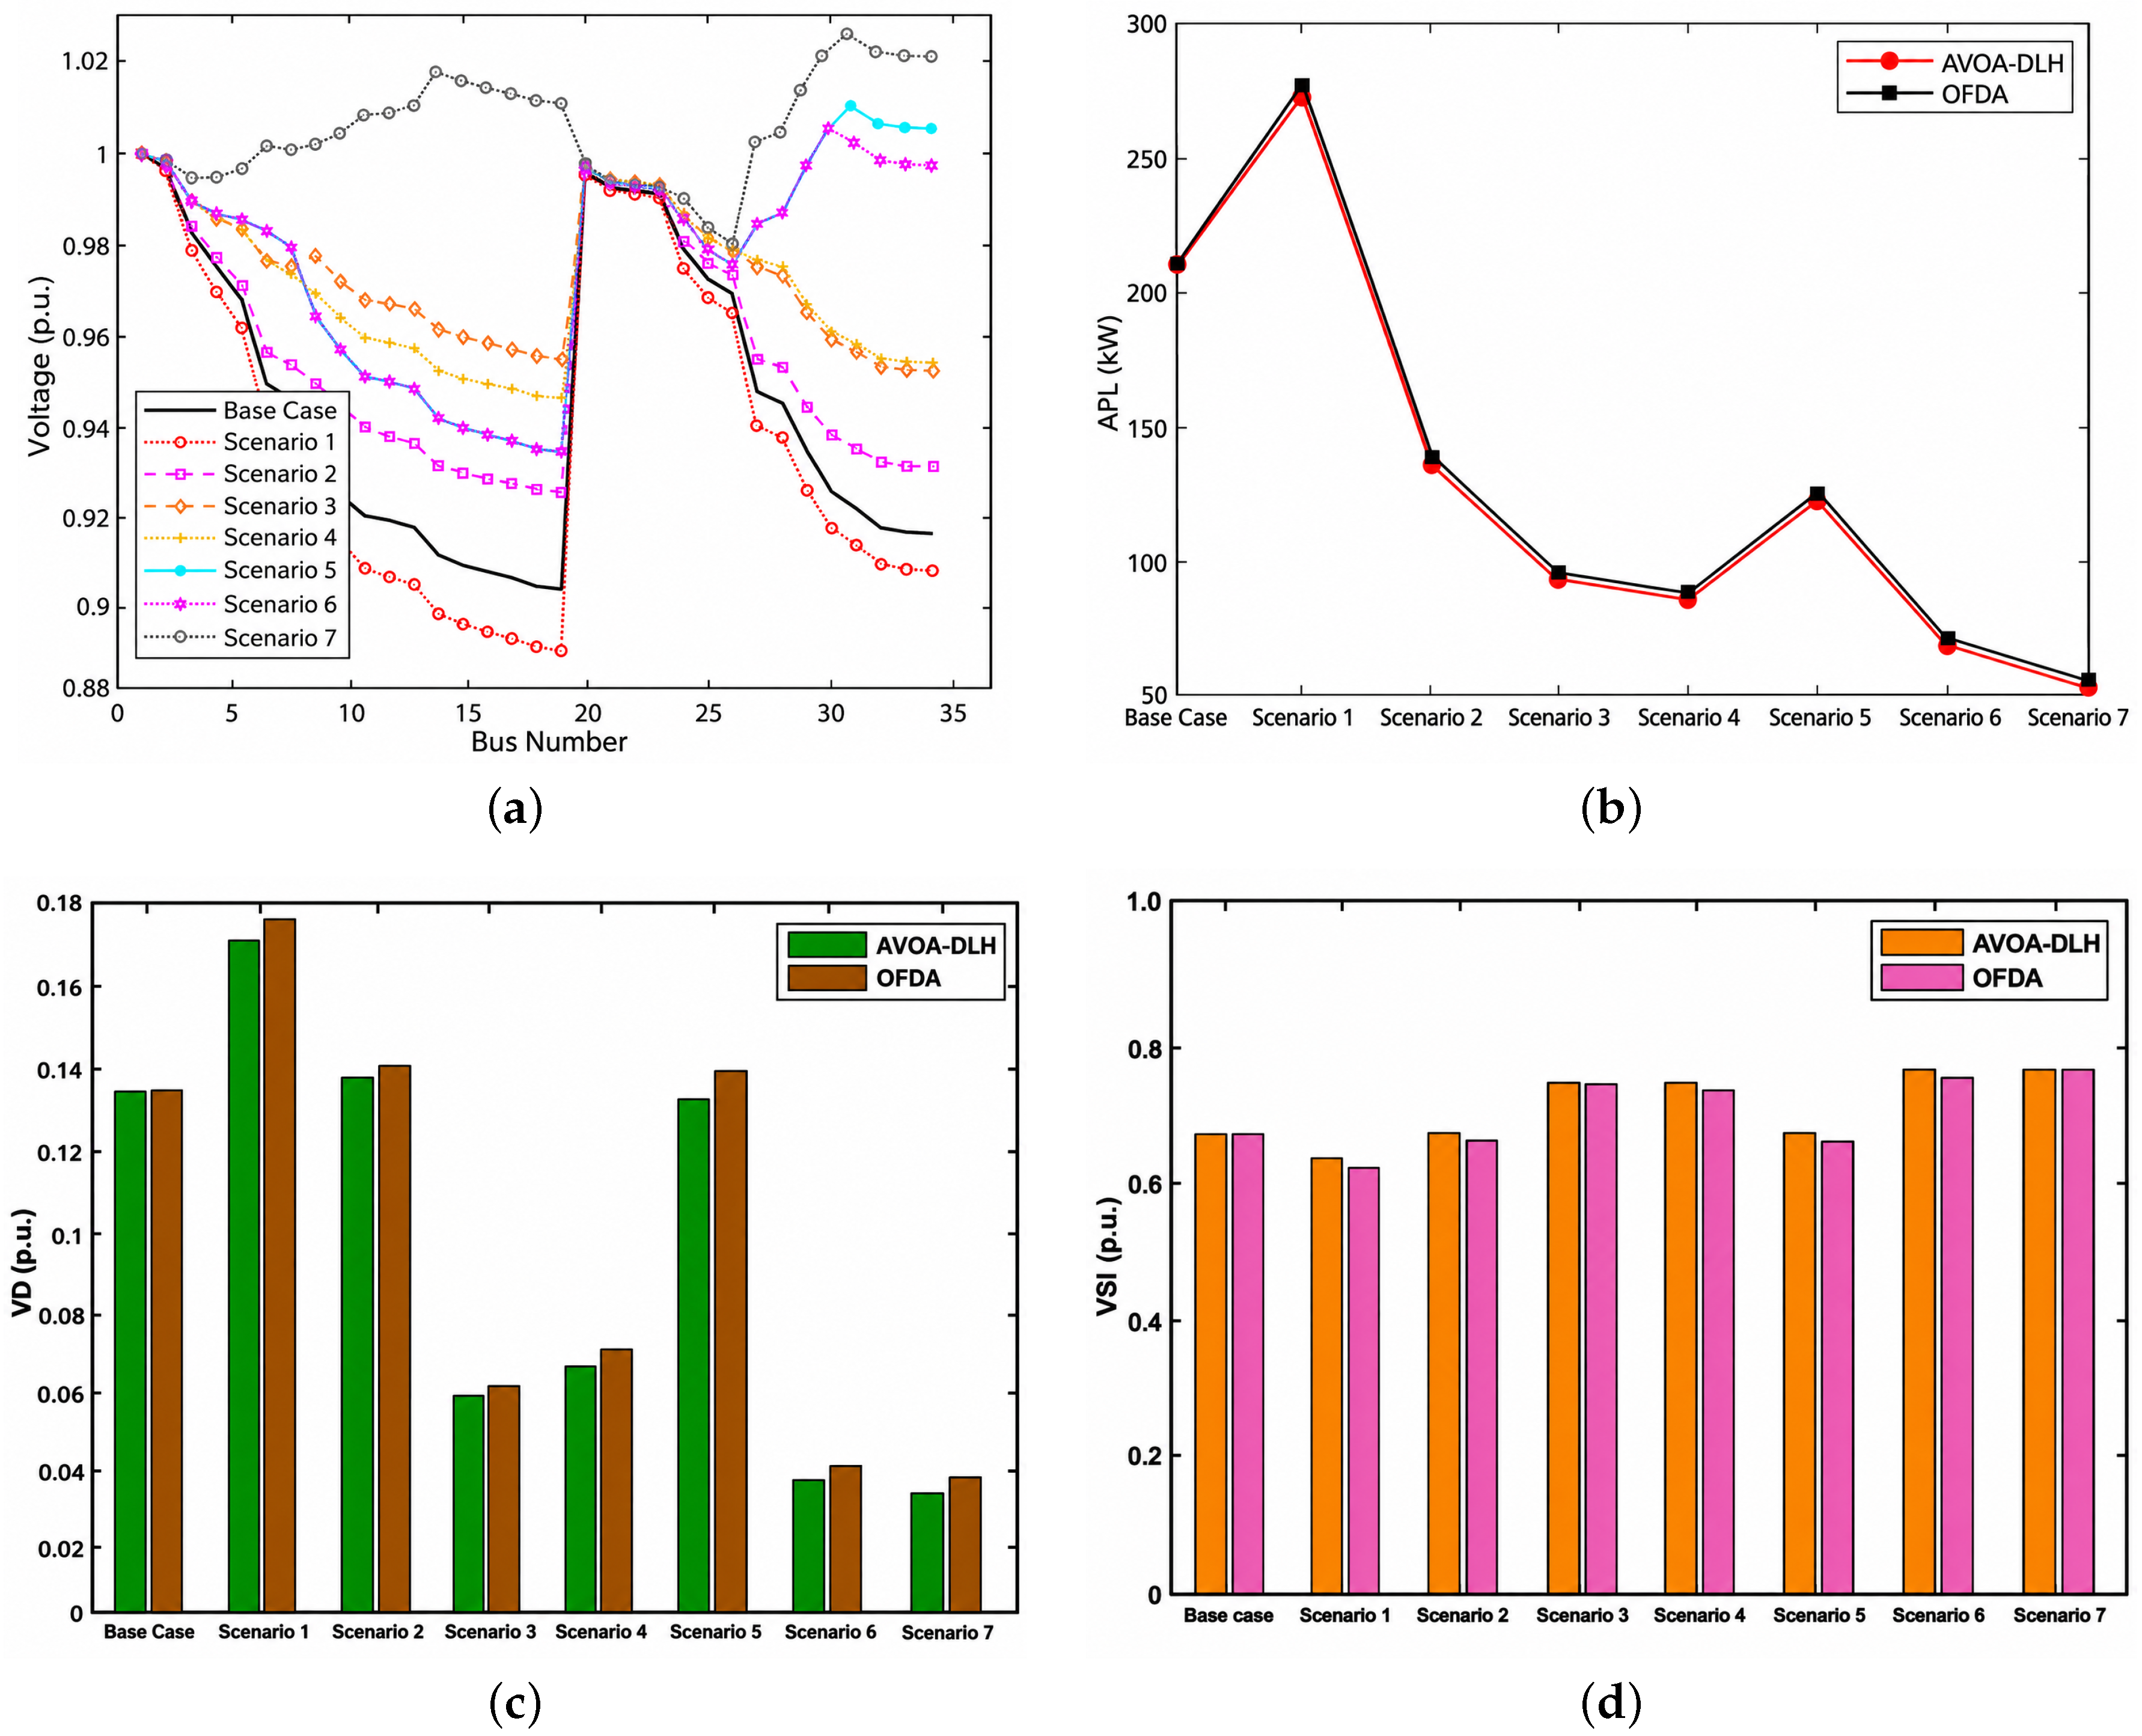
The simultaneous integration of PV, wind and EVCSs in scenario 4 significantly mitigates network stress. Using AVOA-DLH, the APL is minimized to 86.65 kW, while the OFDA reduces it to 87.97 kW. In terms of voltage quality, AVOA-DLH produces a VD of 0.0677 p.u. and a higher VSI of 0.7451 p.u., whereas the OFDA results in a VD of 0.0702 p.u. and a VSI of 0.7356 p.u. In scenarios 5 through 7, DSTATCOM is strategically included to further enhance system performance. The APL is further reduced to 124.07 kW using AVOA-DLH and 126.66 kW using OFDA, with the inclusion of PV, DSTATCOM, and EVCSs in scenario 5. In scenario 6, integrating wind power, DSTATCOM, and EVCSs further improves the system voltage profile and VSI. In scenario 7, the integration of PV, wind and DSTATCOM significantly enhances the overall performance of the system and increases the Vmin to 0.9808 p.u. at bus 25, as illustrated in Figure 6a. In this scenario, the VD and VSI values for AVOA-DLH are 0.0320 p.u. and 0.7728 p.u., whereas for OFDA values are 0.0376 p.u. and 0.7688 p.u. respectively. Consequently, AVOA-DLH and OFDA achieve PLR of 79.74% and 79.23%, respectively. AVOA-DLH consistently outperforms OFDA in almost every scenario. As illustrated in Figure 6b–d, the implementation of AVOA-DLH produces a substantial reduction in both APL and VD, along with a marked improvement in VSI compared to OFDA.
Figure 6.
SOF performance analysis of AVOA-DLH and OFDA for RDS configuration: (a) Voltage profile of system optimized using AVOA-DLH; (b) APL comparison; (c) VD comparison; (d) VSI comparison.
4.1.2. Multi Objective Function (MOF) Assessment for RDS Configuration
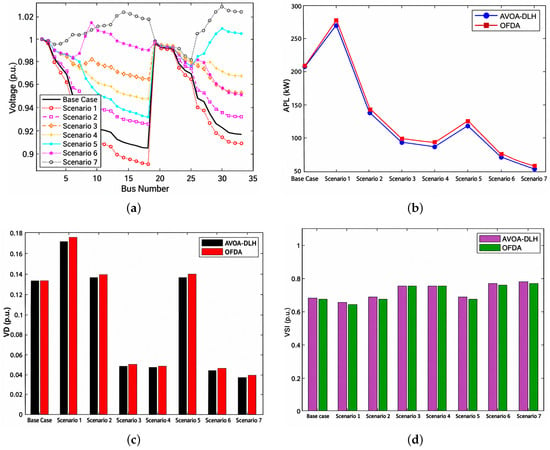
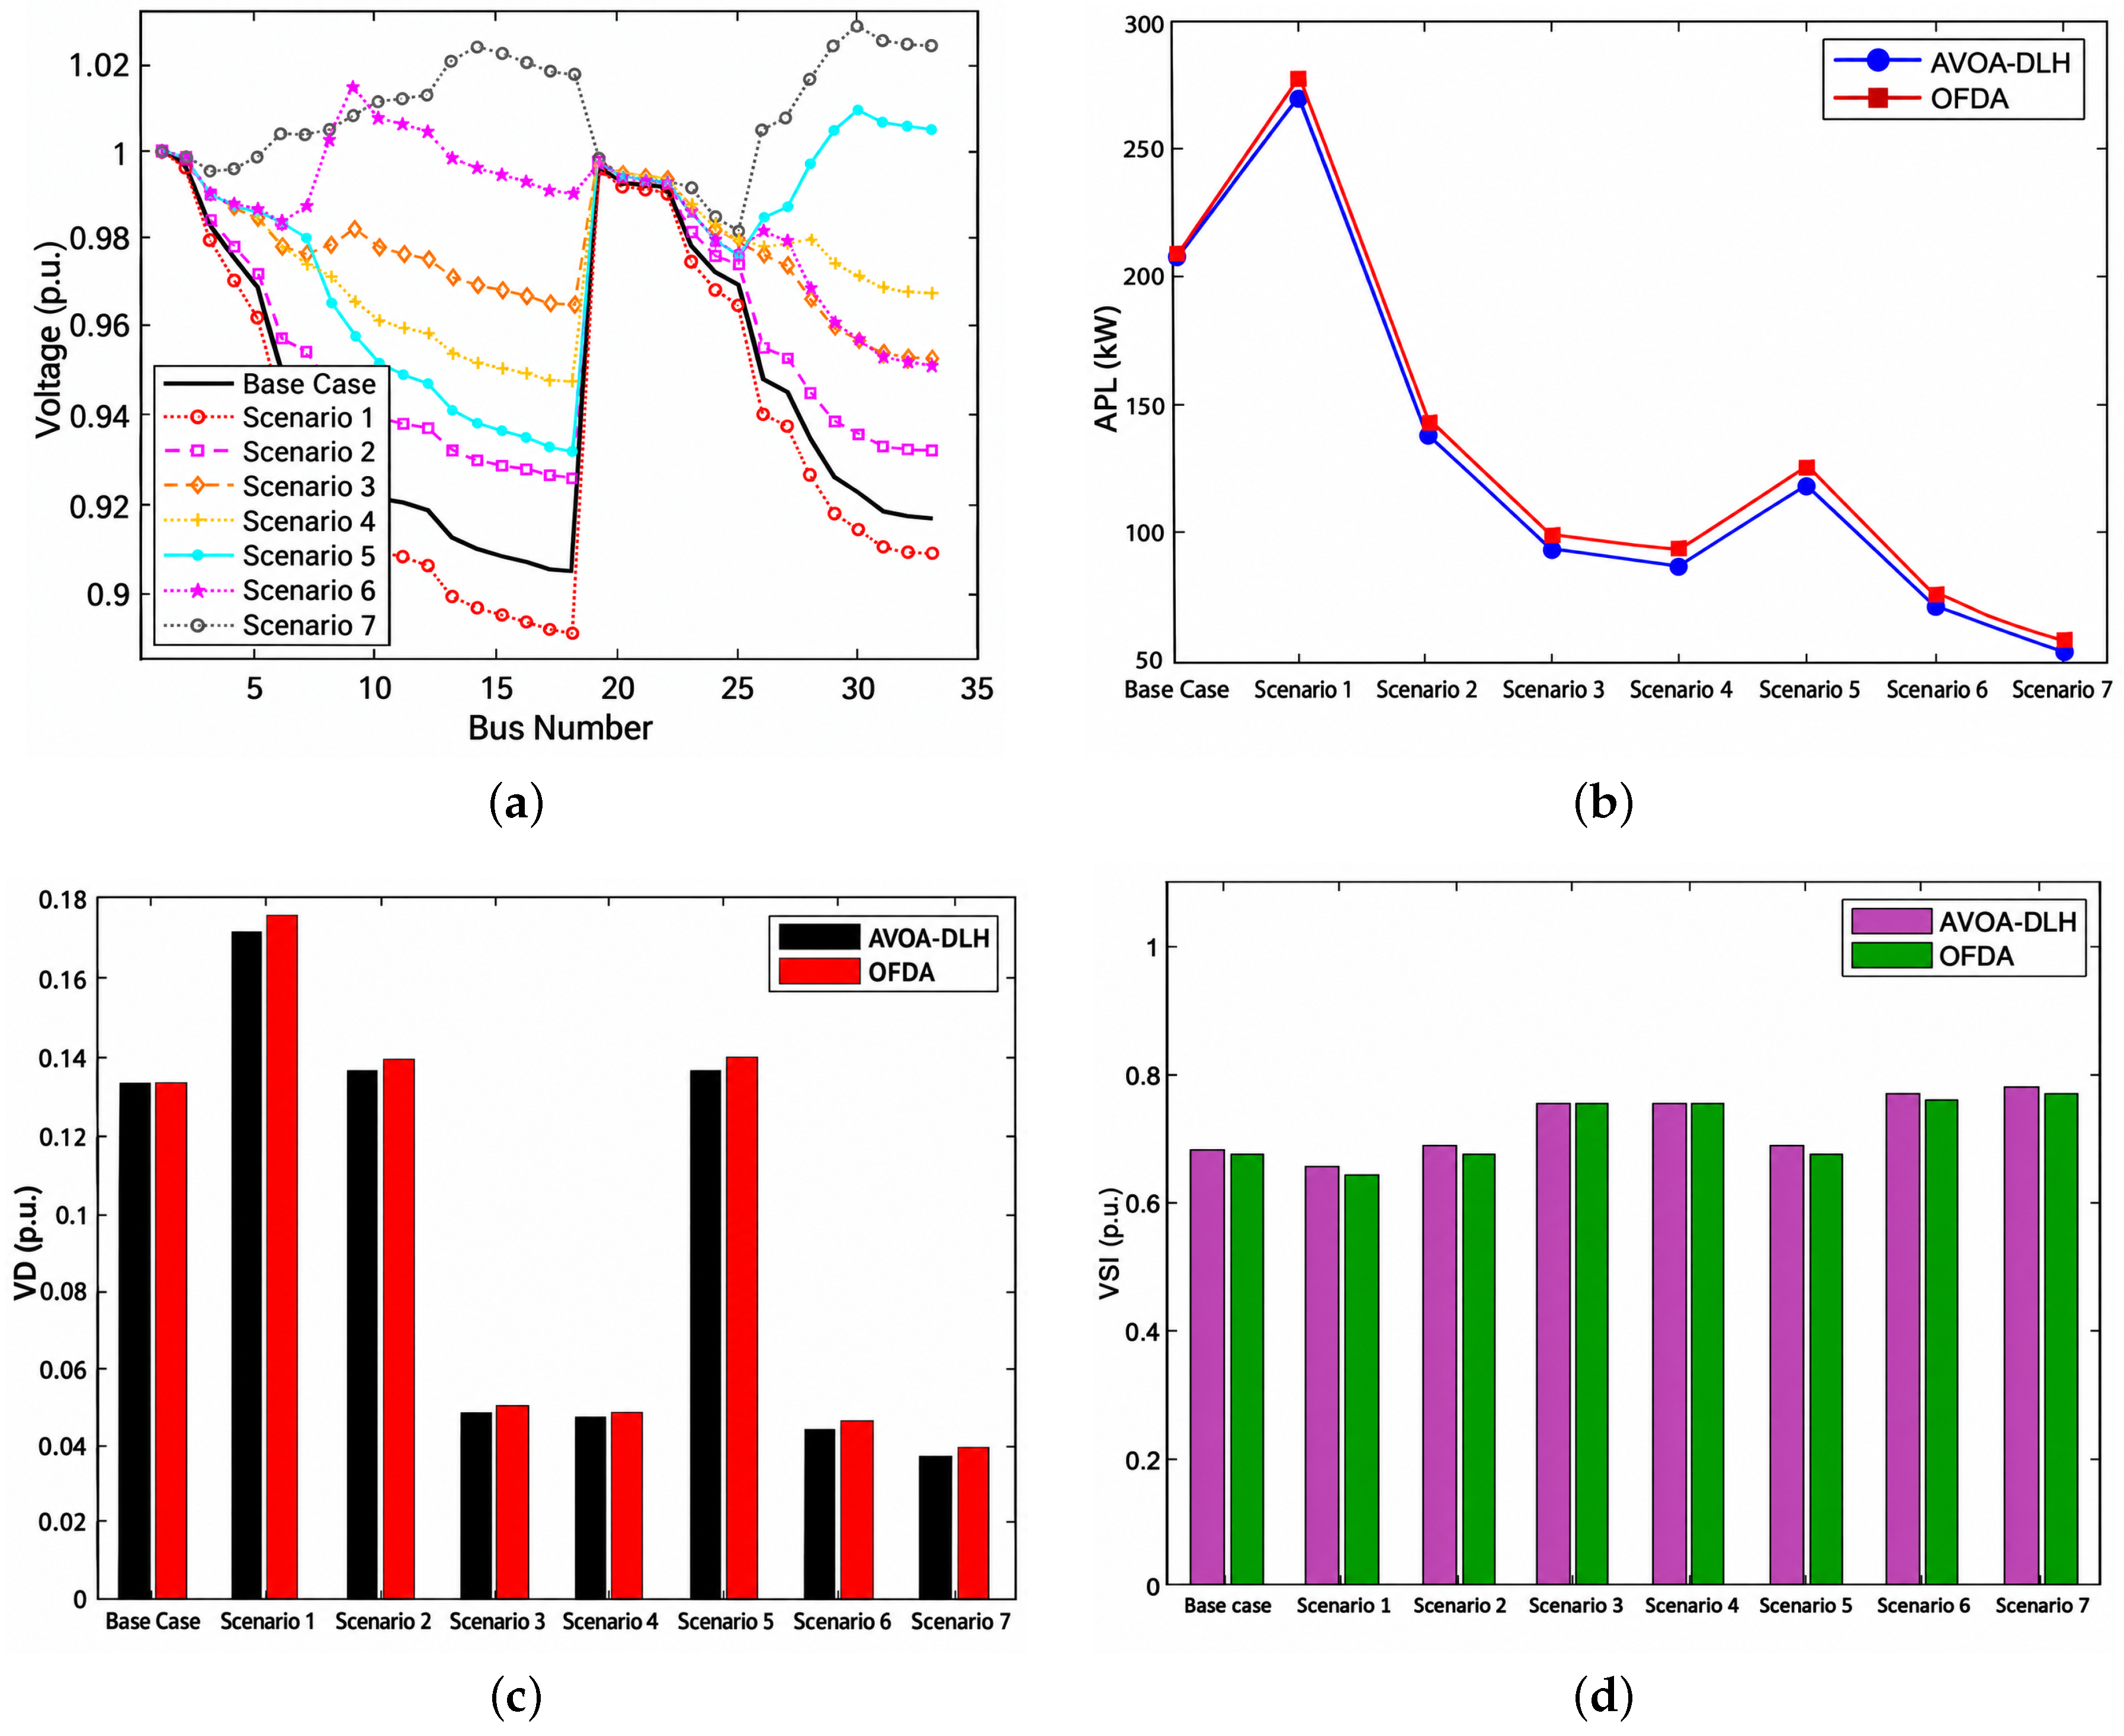
The MOF is optimized using the proposed algorithms. Table 6 shows the sizes and locations of EVCSs, DERs, and DSTATCOM for different scenarios. Performance metrics for both algorithms are shown in Table 7. In scenario 2, integration of PV with EVCSs reduces the APL to 138.22 kW using AVOA-DLH and 140.00 kW using OFDA. With a VD of 0.1360 p.u. and a VSI of 0.6730 p.u., AVOA-DLH outperformed OFDA in voltage metrics, which produces VD and VSI of 0.1387 p.u. and 0.6658 p.u. With the integration of wind in scenario 3, APL in the system is further decreased to 95.55 kW with AVOA-DLH and 97.76 kW with OFDA. The VD and VSI values are 0.0483 p.u. and 0.7475 p.u. achieved using AVOA-DLH; however, 0.0501 p.u. and 0.7473 p.u. are achieved in the case of OFDA. The AVOA-DLH technique generates an APL of 89.56 kW, whereas OFDA generates an APL of 94.14 kW in scenario 4 due to integration of both PV and wind. The VD in AVOA-DLH is now 0.0477 p.u., which is less than the VD of OFDA, i.e., 0.0481 p.u., as depicted in Figure 7c. Figure 7d shows the improvement of VSI using AVOA-DLH compared to OFDA. The addition of PV and DSTATCOM with EVCSs in scenario 5 enhances the system voltage profile and improves APL, VD, and VSI to a greater extent. The strategic placement of wind and DSTATCOM alongside EVCSs in scenario 6 results in further reduction in APL of 76.10 kW and 78.32 kW using AVOA-DLH and OFDA, respectively. The VD and VSI values for AVOA-DLH (0.0432 p.u. and 0.7596 p.u.) are also much better than those for OFDA (0.0453 p.u. and 0.7536 p.u.).
Table 6.
Size and location of EVCSs, DERs (PV and Wind), and DSTATCOM in RDS configuration under MOF scenarios.
Table 7.
APL, PLR (%), VD, VSI, and Vmin for RDS configuration under MOF scenarios.
Figure 7.
MOF performance analysis of AVOA-DLH and OFDA for RDS configuration: (a) Voltage profile of system optimized using AVOA-DLH; (b) APL comparison; (c) VD comparison; (d) VSI comparison.
Integration of PV, wind and DSTATCOM results in an APL of 56.81 kW for AVOA-DLH and 58.20 kW for OFDA in scenario 7, which is lower than the power losses achieved in previous scenarios, as shown in Figure 7b. In terms of voltage metrics, AVOA-DLH again outperformed OFDA, yielding a lower VD of 0.0374 p.u. and a higher VSI of 0.7627 p.u. (compared to 0.0387 p.u. and 0.7595 p.u. for OFDA). Consequently, AVOA-DLH yielded a PLR of 79.13%, while OFDA achieved a PLR of 78.94%, Vmin is significantly improved to 0.9814 p.u. under the AVOA-DLH framework. Graphical representations of improvements in voltage profile, APL, VD, and VSI comparisons for the proposed algorithms are provided in Figure 7a–d. Finally, the best approach is AVOA-DLH, which consistently outperforms OFDA in all investigated scenarios. Additionally, contrasting the results with the literature presented in Table 8, the efficacy of the proposed approach can be conceived.
Table 8.
Summary of performance evaluation of different optimization methods for EVCSs optimal allocation on the RDS IEEE 33-bus system.
4.2. IEEE 33-Bus MDS Configuration
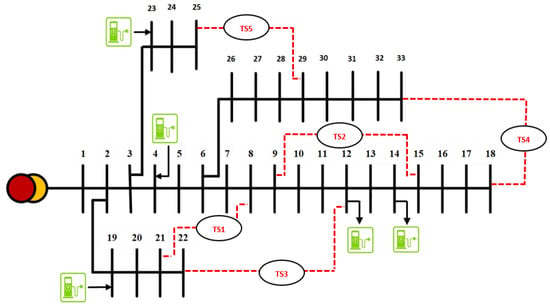
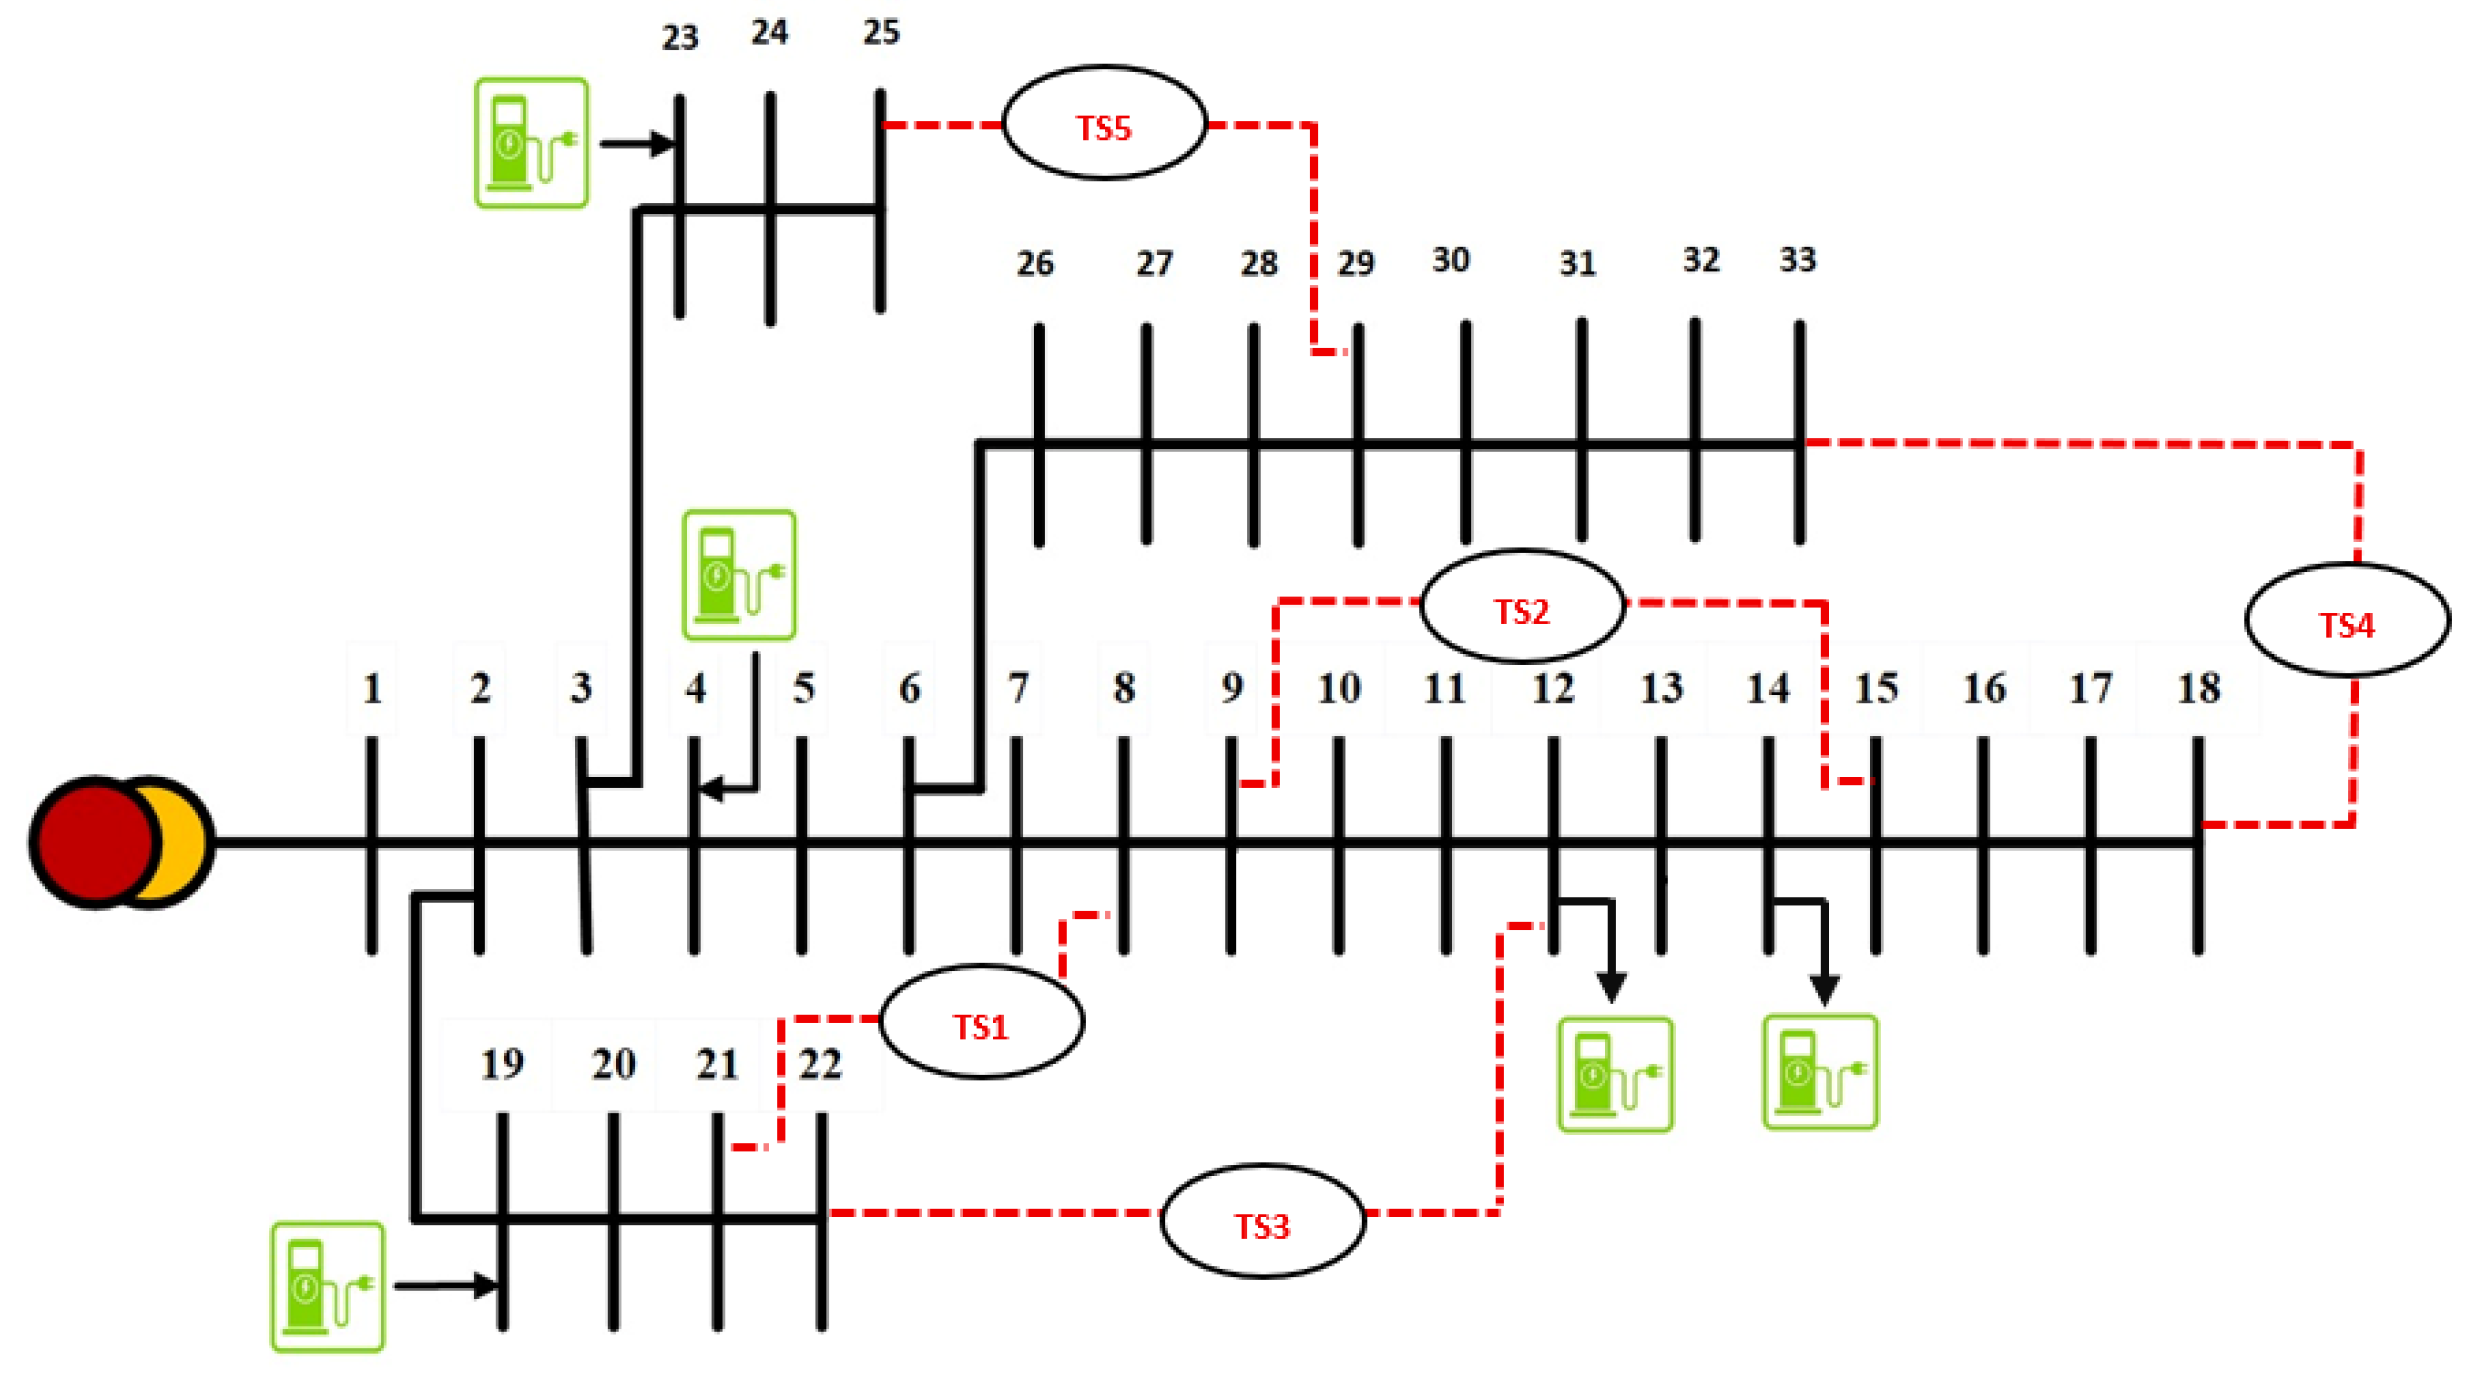
In this section, the results of the proposed optimization techniques are analyzed using IEEE 33 MDS. Figure 8 illustrates the single line diagram of 33-bus MDS, along with the optimal locations of the EVCSs determined using AVOA-DLH. The IEEE 33 bus RDS is converted into MDS by closing all five tie switches, thus, establishing an interconnection between the buses, i.e., 9-15, 8-21, 12-22, 18-33, 25-29 [49]. This setup enables the network to function in a mesh topology by introducing several loops. These loops enable bidirectional power flow that improves voltage profiles, reduces APL, and increases overall reliability of the system. The power flow analysis (BFS) performed for the IEEE 33-bus system in mesh configuration serves as the base case [49]. An APL of 125 kW is achieved, which is far lower than the RDS configuration (210.05 kW).
Figure 8.
Single-line diagram of the IEEE 33-bus MDS configuration showing optimal locations of EVCSs determined using AVOA-DLH.
4.2.1. Single Objective Function (SOF) Assessment for MDS Configuration
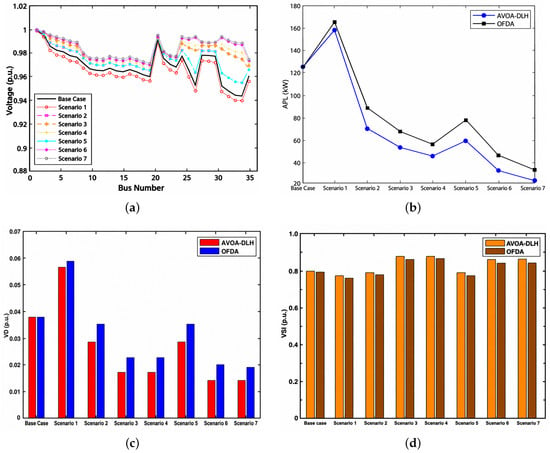
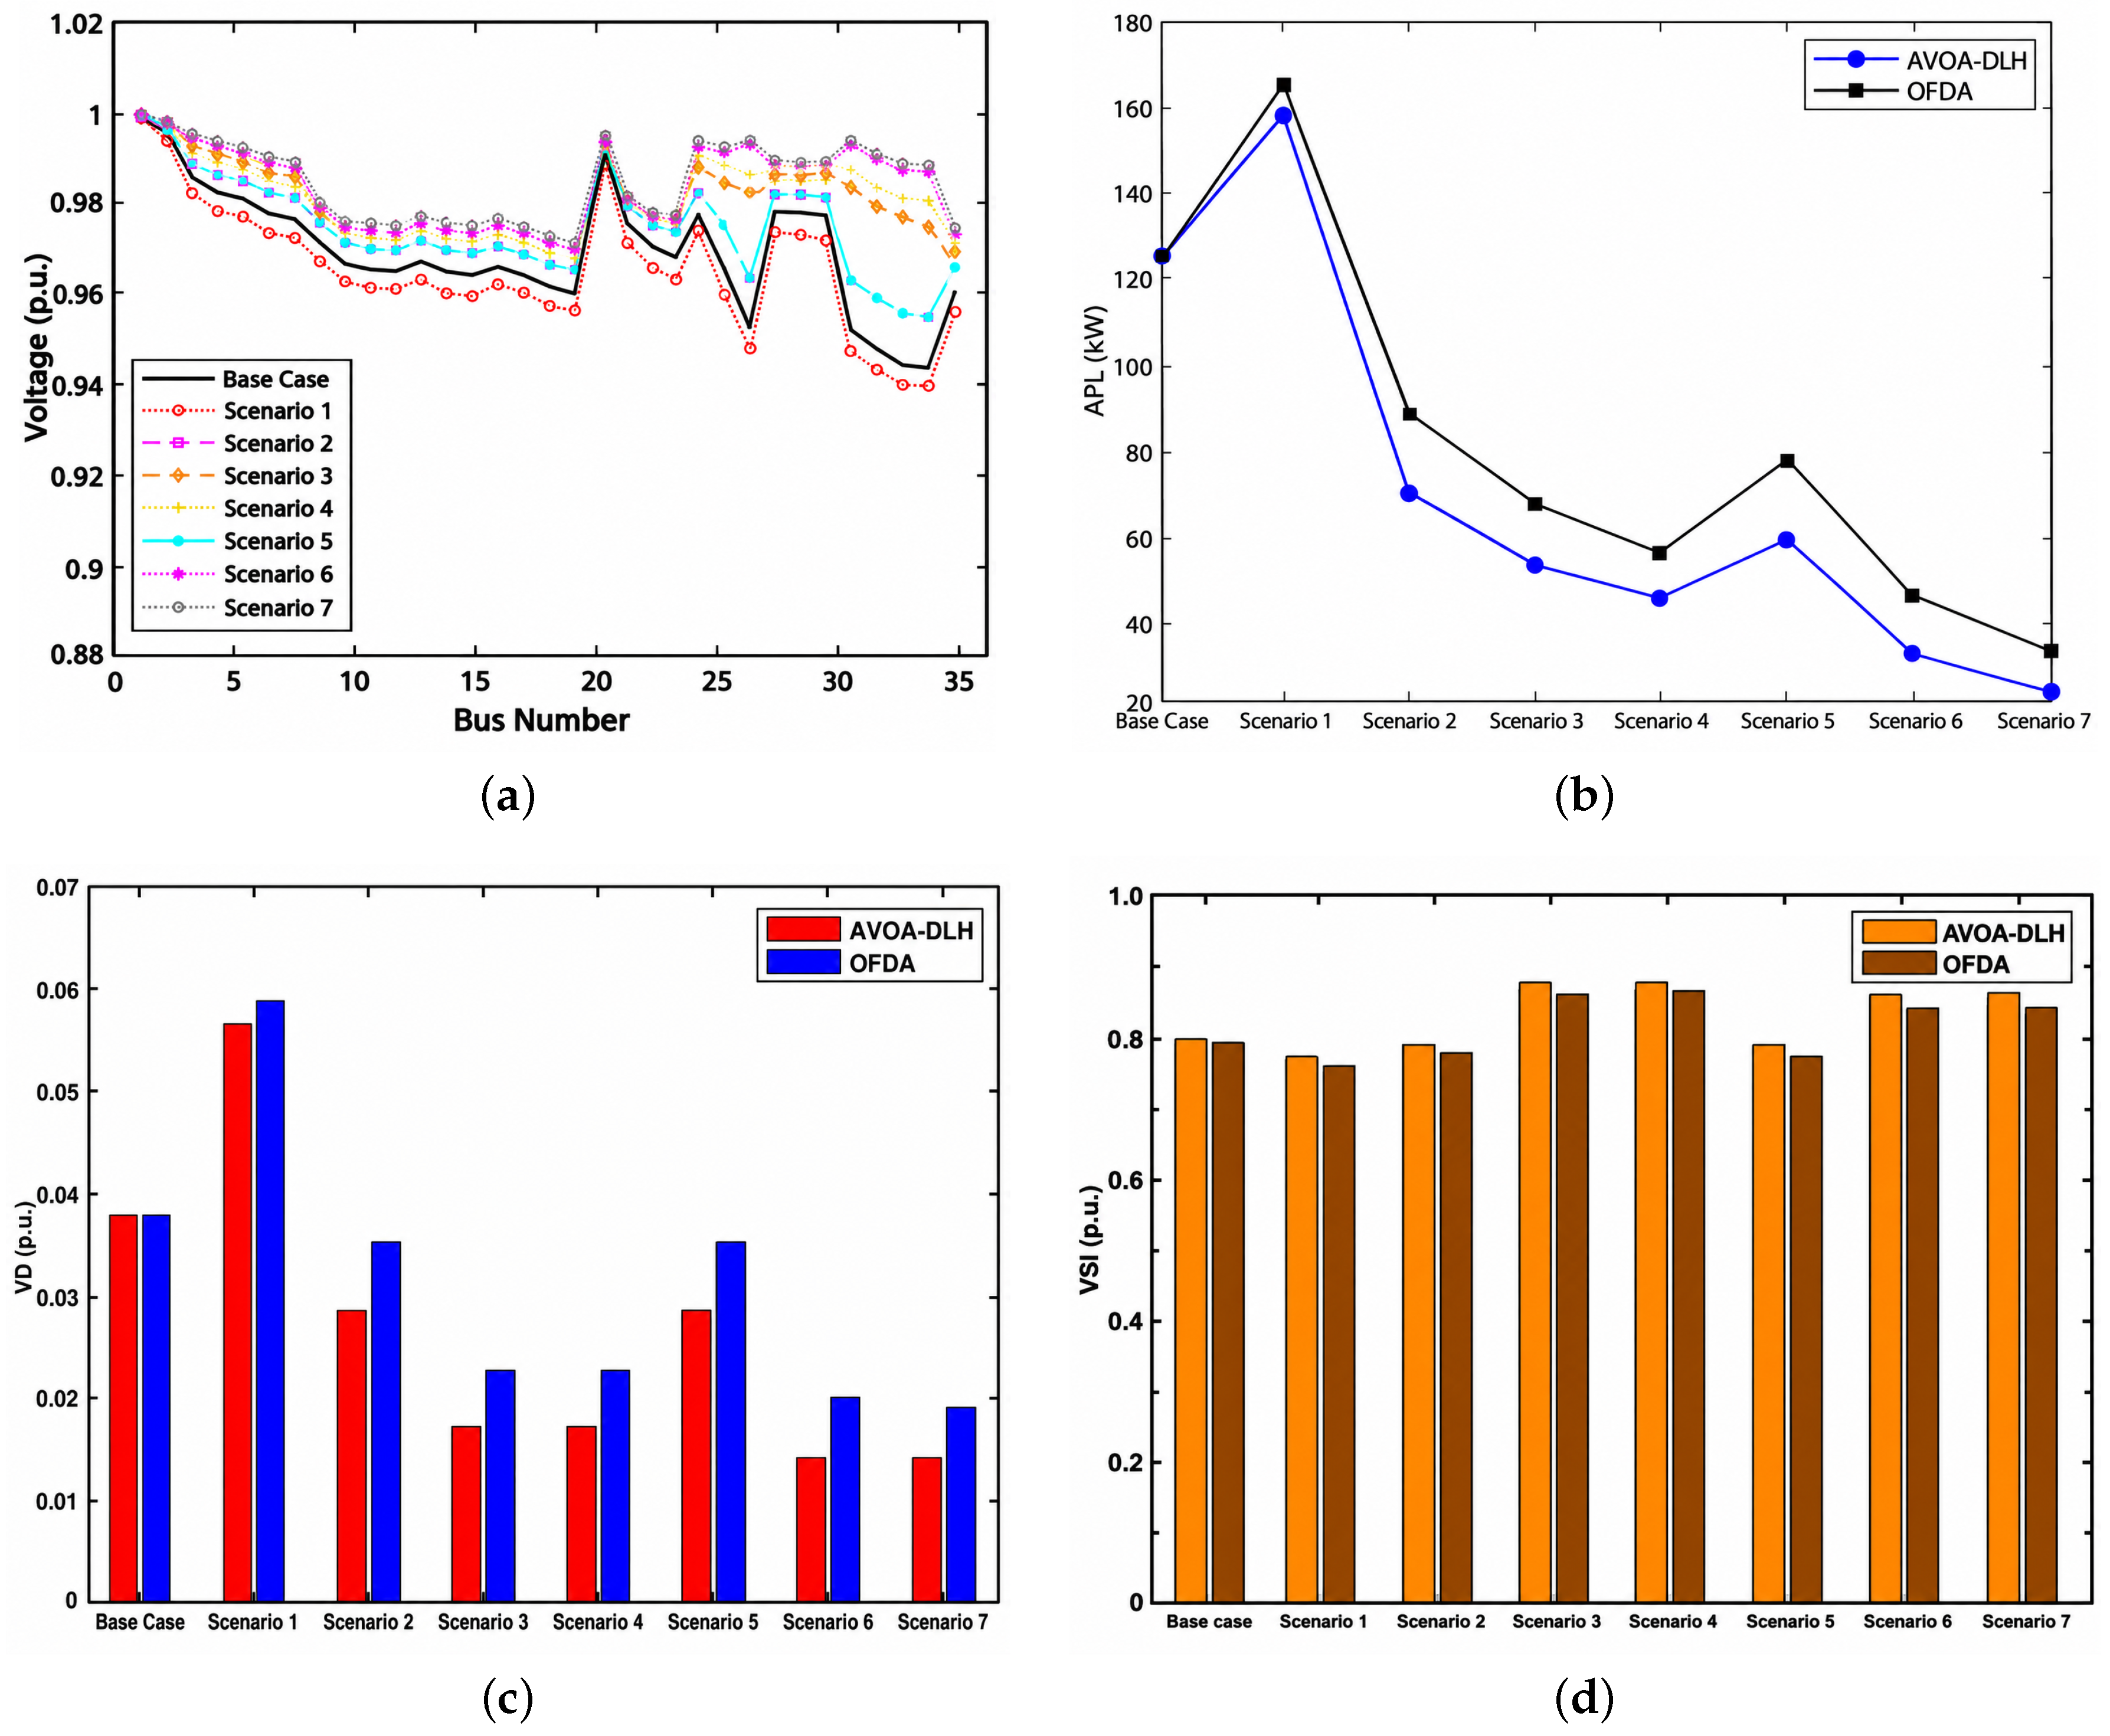
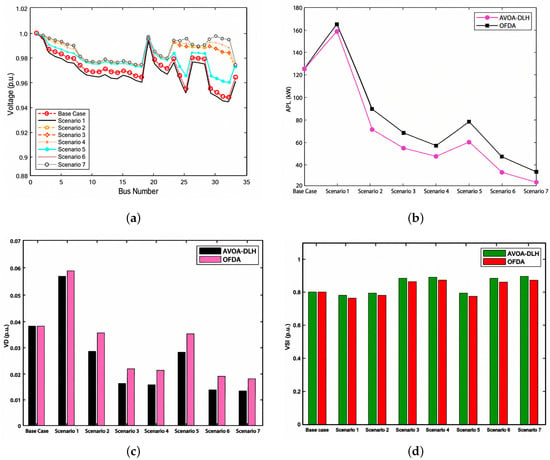
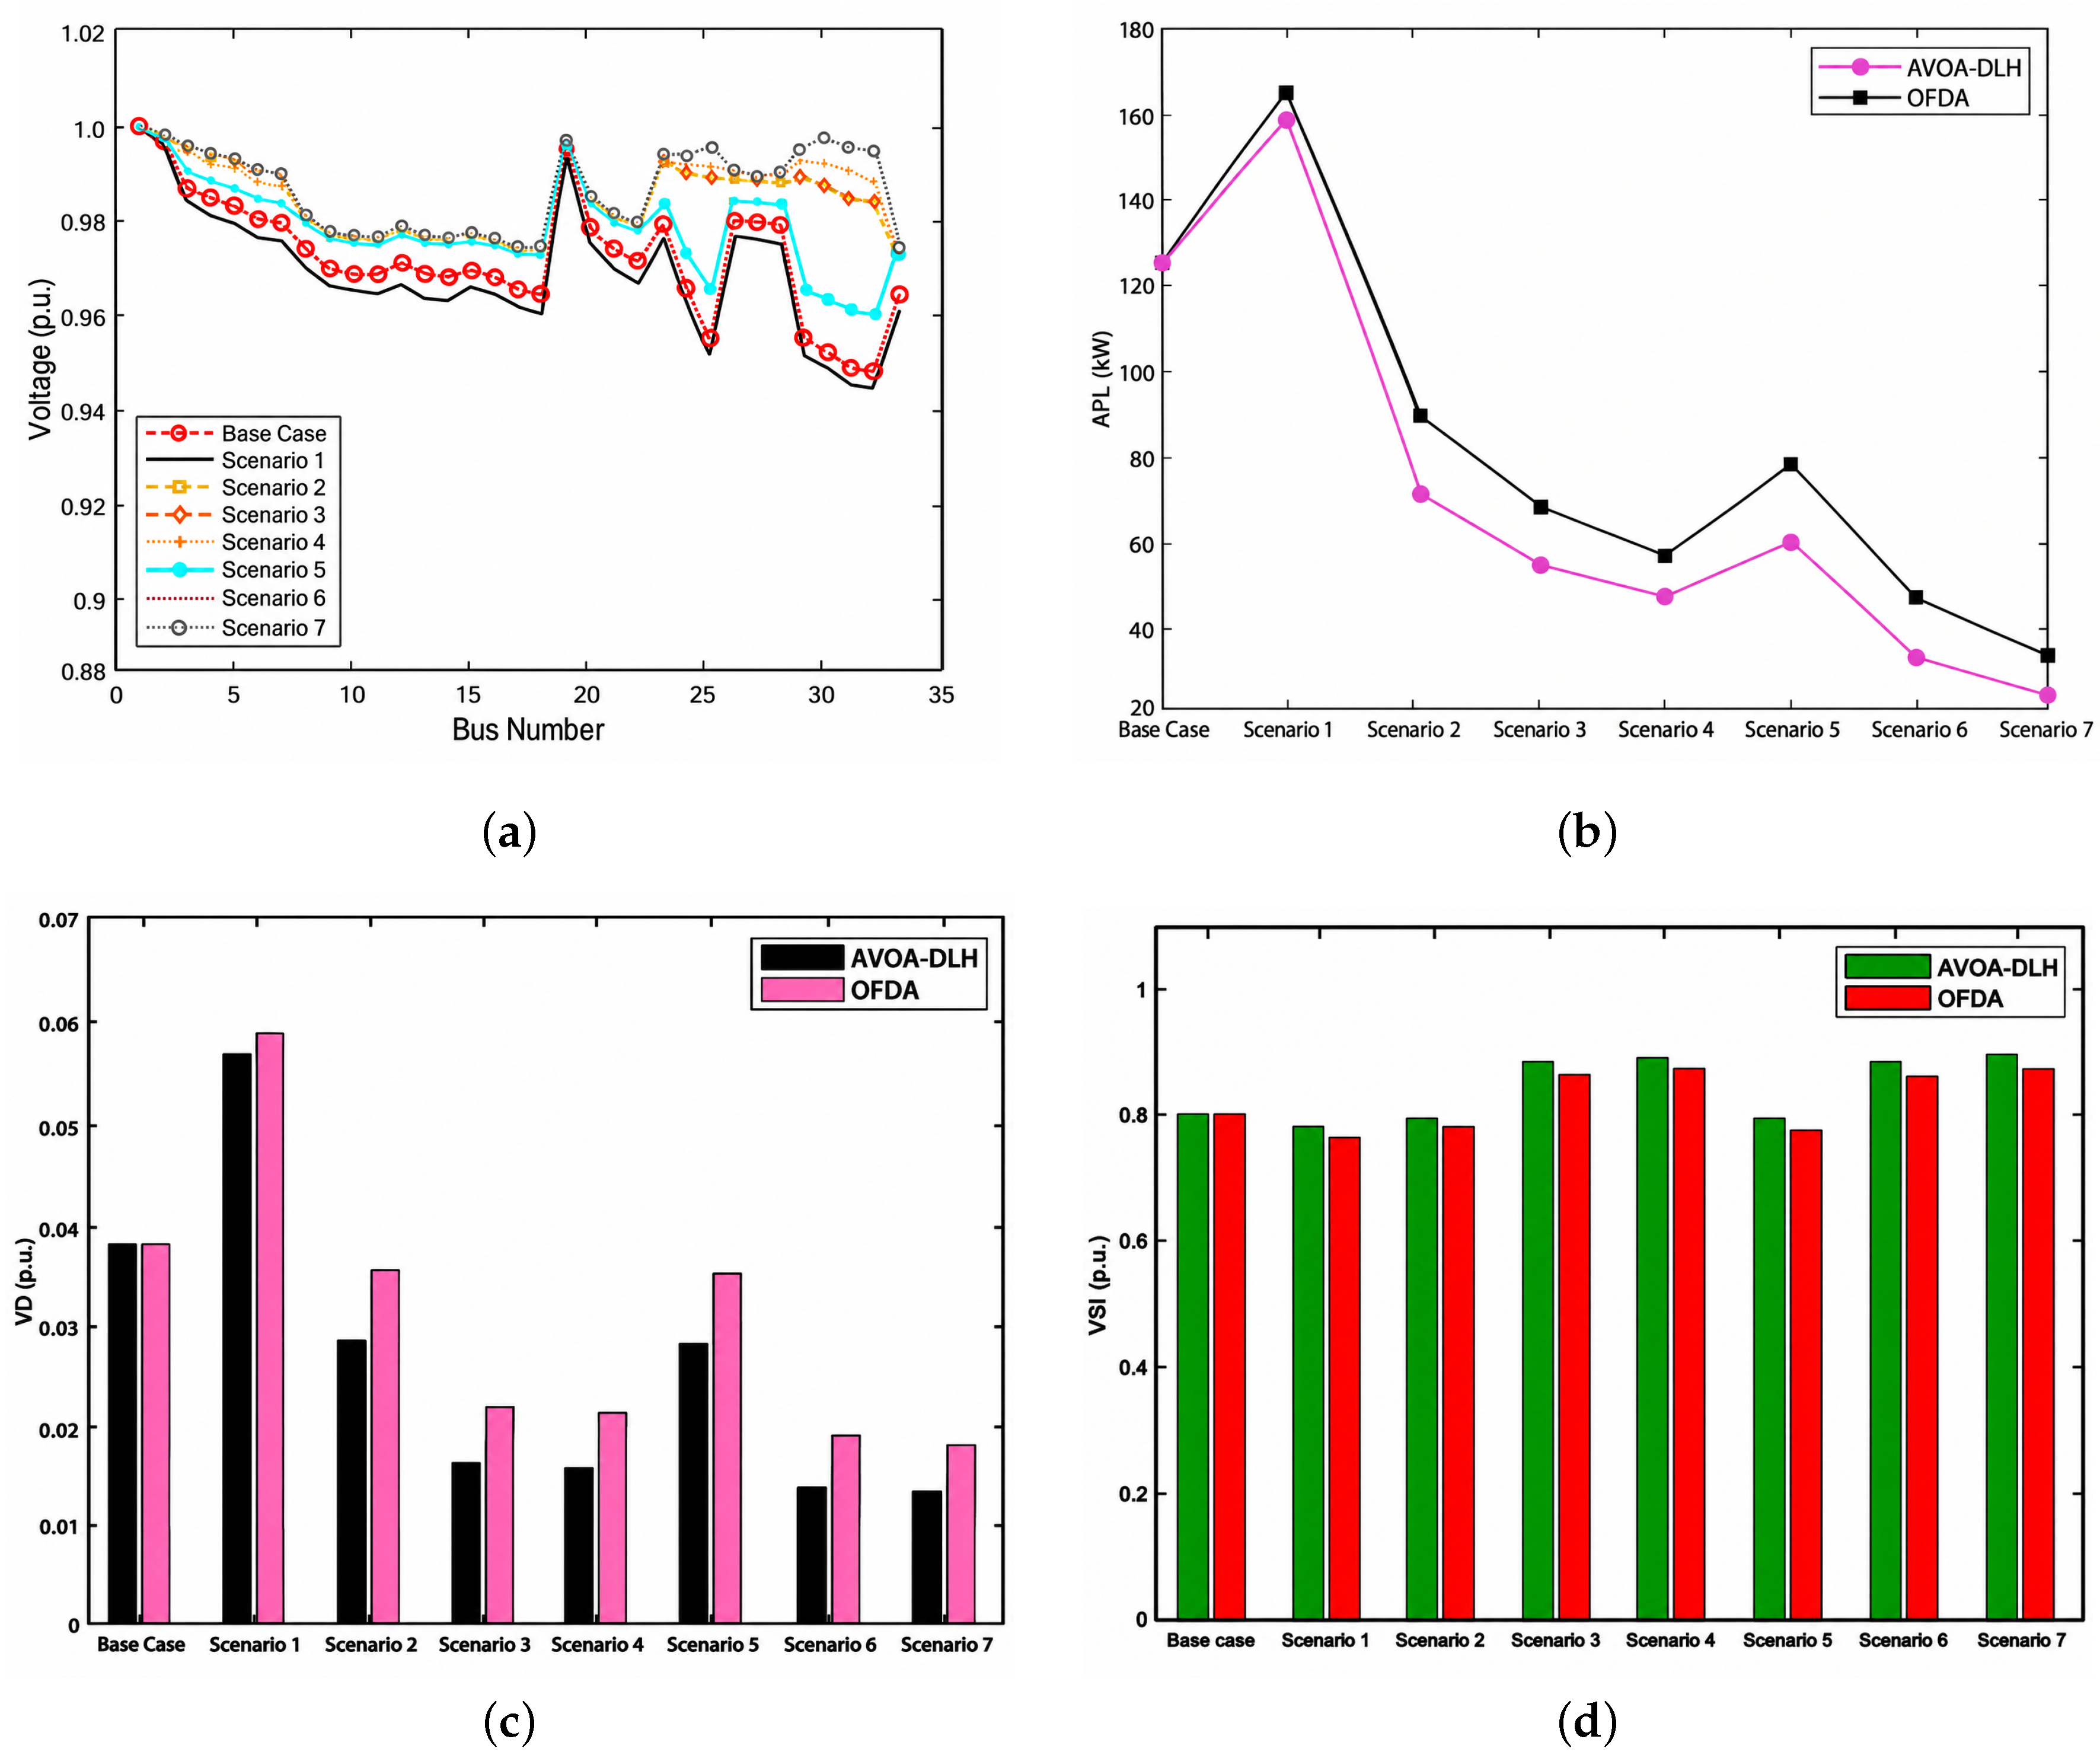
AVOA-DLH and OFDA are used to optimize SOF by optimally allocating EVCSs in conjunction with PV, wind, and DSTATCOM in MDS in disparate scenarios. Table 9 lists the size and location of these scenarios. In scenario 1, five EVCSs are optimally allocated using AVOA-DLH and OFDA to optimize SOF. As presented in Table 10, an APL of 157 kW is produced in the case of AVOA-DLH and 163 kW in OFDA after the integration of EVCSs into the system. Both values are higher than the base case value, i.e., 125 kW. Additionally, for this scenario, the VD and VSI values are 0.0569 p.u. and 0.7710 p.u. for AVOA-DLH and 0.0588 p.u. and 0.7606 p.u. for OFDA, respectively. Figure 9a illustrates that the bus with the lowest voltage is 32 and has a magnitude of 0.9431 p.u. in AVOA-DLH. The system’s losses decreased from 157 kW to 70.59 kW in scenario 2 for AVOA-DLH and from 163 kW to 88.96 kW for OFDA after integration of PV with EVCSs. When the findings from the proposed algorithms are compared, it is found that for AVOA-DLH, VD and VSI are 0.0284 p.u. and 0.7870 p.u.; however, for OFDA, they are 0.0356 p.u. and 0.7760 p.u. In scenario 3, losses are substantially reduced due to the integration of wind along with EVCSs. The APL is minimized to 53.85 kW via AVOA-DLH, whereas OFDA produced an APL of 68.34 kW. Finally, the VD and VSI magnitudes obtained using AVOA-DLH are optimized to 0.0174 p.u. and 0.8682 p.u., respectively, outperforming the corresponding OFDA metrics of 0.0224 p.u. and 0.8495 p.u.
Table 9.
Size and location of EVCSs, DERs (PV and Wind), and DSTATCOM in MDS configuration under SOF scenarios.
Table 10.
APL, PLR (%), VD, VSI, and Vmin for MDS configuration under SOF scenarios.
Figure 9.
SOF performance analysis of AVOA-DLH and OFDA for MDS configuration: (a) Voltage profile of system optimized using AVOA-DLH; (b) APL comparison; (c) VD comparison; (d) VSI comparison.
In scenario 4, due to the integration of PV and wind with EVCSs, a significant reduction in APL is observed. It is decreased to 45.87 kW with AVOA-DLH and 56.71 kW with OFDA. Figure 9c,d show that AVOA-DLH again outperforms OFDA in terms of VD and VSI in this scenario. The performance of the system remains lower even after adding PV and wind to coordinate the EVCSs load at optimal positions. In scenario 5, the active and reactive power compensation given by the combination of PV and DSTATCOM with EVCSs at optimal locations seems to outweigh the impact of EVCSs. Comparison of AVOA-DLH and OFDA reveals that AVOA-DLH produces a lower APL of 59.50 kW, while OFDA yields an APL of 78.32 kW. The APL is further reduced to 32.49 kW in scenario 6, with AVOA-DLH, resulting from the integration of DSTATCOM with wind, and is smaller than the power losses obtained in previous scenarios. The reduction in system losses has improved significantly in this scenario, as shown in Figure 9b.
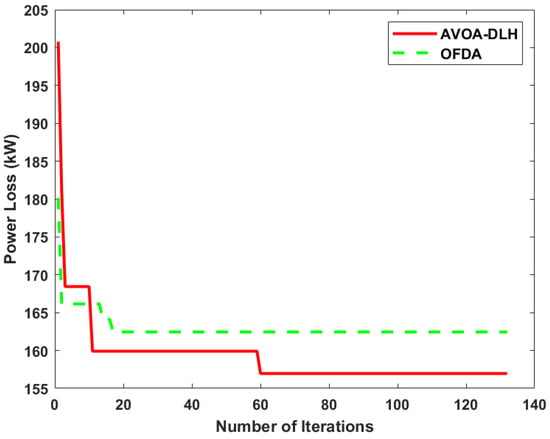
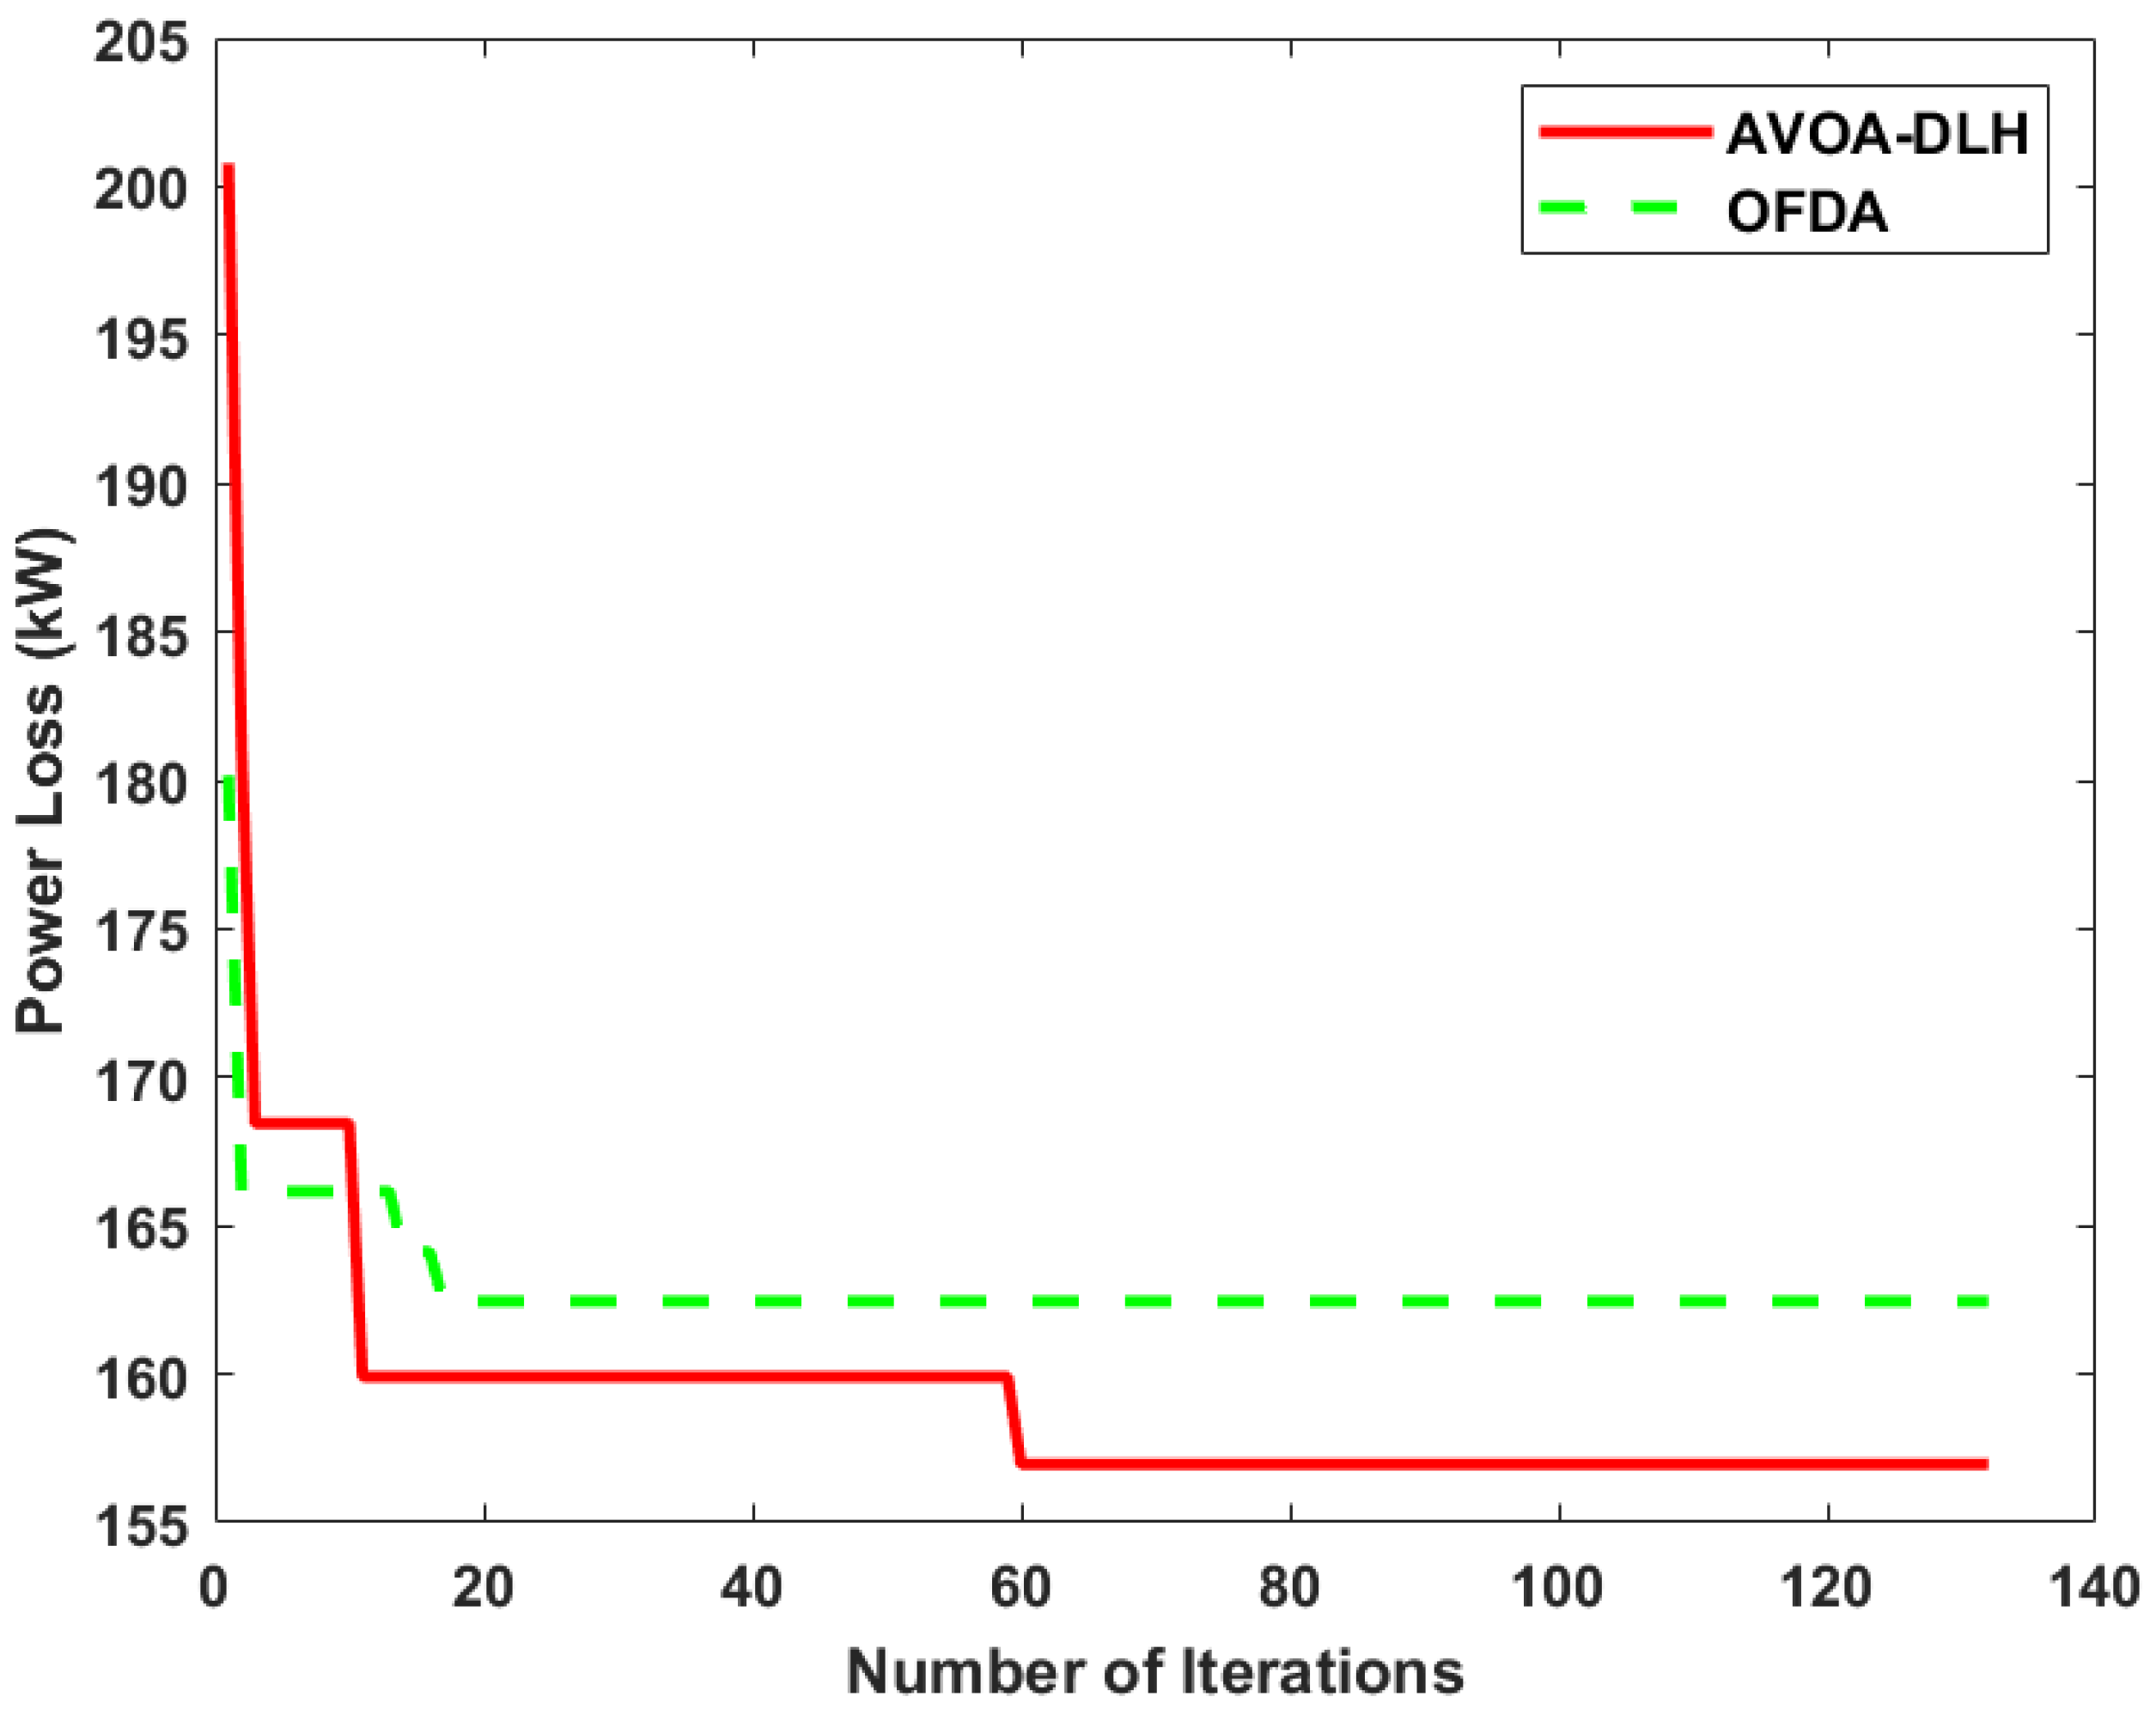
A comparison of the findings from scenario 7 reveals that for AVOA-DLH, APL is 23.24 kW, while it is 34.36 kW for OFDA. The VD and VSI values for AVOA-DLH are 0.0139 p.u. and 0.8741 p.u. respectively, while the corresponding values for OFDA are 0.0190 p.u. and 0.8552 p.u. Vmin has increased to 0.9735 p.u. from 0.9431 p.u. in AVOA-DLH. Figure 9a shows the significant improvement in the voltage profile of the system in Scenario 7 which is achieved due to the combined integration of PV, wind and DSTATCOM. The PLR achieved in this scenario is 85.20%, which is much higher than the values achieved in all previous scenarios. Comparison of the results of the algorithms reveals that AVOA-DLH outperforms OFDA. Figure 9c,d confirm this by showing substantial improvements in VD and VSI. Figure 10 shows the convergence curves for the EVCSs integration using AVOA-DLH and OFDA. This figure shows that OFDA converges to a local optimum after very few iterations.
Figure 10.
Convergence curve for EVCSs integration in the IEEE 33-bus MDS configuration.
4.2.2. Multi Objective Function (MOF) Assessment for MDS Configuration
To optimize MOF using AVOA-DLH and OFDA, five EVCSs are optimally assigned to the IEEE 33-bus MDS. Table 11 and Table 12 demonstrate the results of AVOA-DLH and OFDA for different scenarios. The proposed algorithms are used to allocate PVs and EVCSs in scenario 2. Figure 11b shows that the system losses have decreased in this scenario. The VD and VSI values for AVOA-DLH are 0.0284 p.u. and 0.7872 p.u. respectively, while they are 0.0356 p.u. and 0.7760 p.u. for OFDA. With the integration of wind along with EVCSs in scenario 3, APL in the system dropped from 157 kW to 55.54 kW using AVOA-DLH and from 163 kW to 57.73 kW using OFDA. Figure 11c,d show that when employing AVOA-DLH, the VD and VSI are 0.0158 p.u. and 0.8688 p.u. respectively. However, in OFDA, these values are 0.0214 p.u. and 0.8498 p.u. respectively.
Table 11.
Size and location of EVCSs, DERs (PV and Wind), and DSTATCOM in MDS configuration under MOF scenarios.
Table 12.
APL, PLR (%), VD, VSI, and Vmin for MDS configuration under MOF scenarios.
Figure 11.
MOF performance analysis of AVOA-DLH and OFDA for MDS configuration: (a) Voltage profile of system optimized using AVOA-DLH; (b) APL comparison; (c) VD comparison; (d) VSI comparison.
Table 12 shows that the combined integration of PV and wind with EVCSs in scenario 4 results in a higher PLR, i.e., 69.36% (in AVOA-DLH). The APL generated by the AVOA-DLH method is 48.10 kW, while the APL achieved by the OFDA method is 57.73 kW. The benefits of PV and DSTATCOM at appropriate sites appear to outweigh the effects of EVCSs on active and reactive power losses in scenario 5. In this scenario, APL is reduced to 59.48 kW, and VSI is increased to 0.7920 p.u. with AVOA-DLH. When the results of both algorithms are compared, it is found that the AVOA-DLH technique yields a lower APL of 59.48 kW, while OFDA yields 78.48 kW. Additionally, the Vmin for AVOA-DLH is higher than that for OFDA. In scenario 6, PLR is further increased to 78.87% for AVOA-DLH due to the integration of wind, DSTATCOM and EVCSs. The performance of the system has improved significantly in this scenario. The PLR is further increased to 84.73% as a result of the integration of PV, wind, and DSTATCOM in scenario 7, exceeding the PLR achieved in all previous scenarios. Figure 11a shows the significant improvement in the voltage profile of the system in this scenario. With AVOA-DLH Vmin has increased to 0.9735 p.u. from 0.9431 p.u., VD is reduced to 0.0133 p.u. and VSI is increased to 0.8746 p.u. The findings in Table 12 make it clear that AVOA-DLH again outperforms OFDA in this scenario. Figure 11b shows that AVOA outperforms OFDA in reducing APL. Additionally, Figure 11c,d provide a graphical illustration of the improvement in VD and VSI using the proposed approaches. Thus, AVOA-DLH outperforms OFDA in almost all scenarios. It is important to note that significant improvements have been achieved in almost all the objectives using the proposed methods. Therefore, it can be concluded that the proposed co-allocation strategy reinforces network stability and counterbalances the impacts of EVCSs integration.
4.3. Economic and Environmental Assessment
The use of renewable energy sources results in cost-effective and environmentally sustainable electricity generation. The analysis focuses on two key metrics for the IEEE 33-bus system: the annual energy loss cost () for economic analysis and the carbon emissions () for environmental analysis. and are analyzed in all scenarios; however, the best results from both optimization methods are presented in Table 13, comparing AVOA-DLH with OFDA. For the RDS configuration, the application of AVOA-DLH significantly reduces , from a base case value of 110.402 to 29.025 (in PKR). Although OFDA also reduces , however, it remains higher than AVOA-DLH, confirming AVOA-DLH’s superior effectiveness in the use of DERs. As anticipated, the more robust MDS configuration shows even greater improvement, with further reduced to 12.214 from its base value of 65.70 using AVOA-DLH, which significantly outperforms the reduction achieved by OFDA. is also assessed in all scenarios; however, the scenario combining wind with EVCSs yields the best results, i.e., the lowest . For the RDS and MDS configurations, is reduced to 249.48 kg and 236.37 kg, respectively, from their base-case values using AVOA-DLH, as shown in Table 13.
Table 13.
Economic and environmental assessment of different algorithms for RDS and MDS configurations.
4.4. Statistical and Sensitivity Analysis
The statistical validation results for scenario 7 are presented in Table 14, where the wilcoxon signed-rank test confirms that AVOA-DLH significantly outperforms OFDA. The two algorithms performed significantly differently, as evidenced by a p-value of 0.00147 in RDS and 0.000655 in MDS, which is safely below the significance level of the 0.05 threshold. A similar trend is reflected in the sensitivity analysis detailed in Table 15. When evaluated across various weight configurations, AVOA-DLH consistently maintains its competitive edge over the OFDA method. Together, these findings demonstrate the statistical superiority and operational robustness of AVOA-DLH under changing parameters.
Table 14.
Statistical comparison of AVOA-DLH and OFDA for RDS and MDS configurations.
Table 15.
Sensitivity analysis under different objective function weights for RDS and MDS configurations.
5. Conclusions
EVs are a practical way to reduce transportation-related pollution. The installation of EVCSs has increased as the popularity of EVs has increased. However, this increase can adversely impact the DN, so it is important to assess how the placement of EVCSs affects the network. This paper describes a new method for sizing and placing PV, wind, DSTATCOMs, and EVCSs in the IEEE 33-bus system. The study considers both RDS and MDS configurations. The size and optimal locations are determined on the basis of key objectives, including reduction in APL, VD, , and , as well as enhancement of VSI. AVOA-DLH and OFDA algorithms inspired by nature have been proposed to optimize both SOF and MOF. With more EVCSs and higher load, this optimization approach achieved its goals.
Furthermore, the AVOA-DLH optimization approach lessens the effect of EVCSs on the DN more effectively than the OFDA approach. The simulation results confirm that AVOA-DLH, unlike OFDA, significantly contributed to achieving the main goals of the research. The findings emphasize the vital role of effective compensator allocation in addressing the challenges associated with EVCSs integration. Thus, it can be inferred that the suggested optimization strategy remains effective at nearly any network scale. Some of the main findings of the optimization are as follows:
- The results show that the simultaneous integration of DERs and DSTATCOM, along with EVCSs, greatly reduced the adverse impacts of the EVCSs load on the system by reducing VD and APL and increasing VSI.
- The structural arrangement of the mesh network serves as the main determinant that influences the efficacy of the optimization process. Applying the AVOA-DLH approach to the MDS configuration yields a PLR of 85.20%, substantially outperforming the PLR of 79.74% achieved in the RDS configuration. Crucially, the mesh topology proves to be superior, yielding better optimal solutions for every defined objective.
- Additionally, AVOA-DLH performs much better than OFDA, as it finds the solution faster and with more precision. It successfully avoids premature convergence and local entrapment issues observed with the OFDA approach.
- In conclusion, AVOA-DLH proved to be a more effective method for optimally allocating DERs and DSTATCOM with EVCSs in both RDS and MDS. It significantly minimizes the impact of EVCSs integration and enhances the voltage profile and overall performance of the system.
Future research will aim to expand the electric vehicle charging approach by including additional constraints and objectives in the optimization framework, thereby maintaining a significant degree of complexity. Subsequent research might also examine the application of modern and hybrid optimization techniques to further improve system performance. Furthermore, the present concept can also be applied to an unbalanced distribution system and real world utility feeders.
Author Contributions
Conceptualization, K.K., F.H.M., Z.M.H. and M.A.Q.; methodology, K.K., F.H.M., Z.M.H. and A.A.; software, K.K., F.H.M. and Z.M.H.; validation, F.H.M., Z.M.H., A.A. and M.A.Q.; formal analysis, F.H.M. and Z.M.H.; investigation, F.H.M., A.A. and M.A.Q.; resources, F.H.M., Z.M.H., A.A. and M.A.Q.; data curation, Z.M.H., A.A. and M.A.Q.; writing—original draft preparation, K.K., Z.M.H. and M.A.Q.; writing—review and editing, F.H.M. and A.A.; visualization, F.H.M., A.A. and M.A.Q.; supervision, Z.M.H. and M.A.Q. All authors have read and agreed to the published version of the manuscript.
Funding
This research received no external funding.
Data Availability Statement
The data supporting the findings of this study are available upon request from the corresponding author.
Acknowledgments
The authors are very grateful to the Office of Research, Innovation and Commercialization (ORIC), The Islamia University of Bahawalpur, Pakistan (No. 3900/ORIC/IUB/2021), for their support in this study.
Conflicts of Interest
The authors declare no conflicts of interest.
Abbreviations
The following abbreviations are used in this manuscript:
| APL | Active power loss |
| AVOA | African vulture optimization algorithm |
| EVCSs | Electric vehicle charging stations |
| EV | Electric Vehicle |
| DERs | Distributed energy resources |
| DSTATCOM | Distribution static compensator |
| DLH | Dimension learning-based hunting |
| OFDA | Opposition flow direction algorithm |
| PV | Photovoltaic |
| VD | Voltage deviation |
| VSI | Voltage stability index |
| RDS | Radial distribution system |
| MDS | Mesh distribution system |
| SOF | Single-objective function |
| MOF | Multi-objective function |
| LB | Lower decision-variable bound |
| UB | Upper decision-variable bound |
| MC | Monte carlo |
References
- Akbar, M.I.; Kazmi, S.A.A.; Alrumayh, O.; Khan, Z.A.; Altamimi, A.; Malik, M.M. A novel hybrid optimization-based algorithm for the single and multi-objective achievement with optimal DG allocations in distribution networks. IEEE Access 2022, 10, 25669–25687. [Google Scholar] [CrossRef] [Scilit]
- Ahmad, F.; Ashraf, I.; Iqbal, A.; Marzband, M.; Khan, I. A novel AI approach for optimal deployment of EV fast charging station and reliability analysis with solar based DGs in distribution network. Energy Rep. 2022, 8, 11646–11660. [Google Scholar] [CrossRef] [Scilit]
- Kanojia, S.; Suthar, B.; Giri, A. Hybrid Optimization Approach for Optimal Location of Electric Vehicle Charging Station (EVCS) in Distribution Network Considering Voltage Stability. Smart Grids Sustain. Energy 2025, 10, 36. [Google Scholar] [CrossRef] [Scilit]
- Chen, L.; Xu, C.; Song, H.; Jermsittiparsert, K. Optimal sizing and sitting of EVCS in the distribution system using metaheuristics: A case study. Energy Rep. 2021, 7, 208–217. [Google Scholar] [CrossRef] [Scilit]
- Salkuti, S.R. Binary bat algorithm for optimal operation of radial distribution networks. Int. J. Electr. Eng. Inform. 2022, 14, 148–160. [Google Scholar] [CrossRef] [Scilit]
- Ahmad, F.; Khalid, M.; Panigrahi, B.K. An enhanced approach to optimally place the solar powered electric vehicle charging station in distribution network. J. Energy Storage 2021, 42, 103090. [Google Scholar] [CrossRef] [Scilit]
- Pal, A.; Bhattacharya, A.; Chakraborty, A.K. Placement of electric vehicle charging station and solar distributed generation in distribution system considering uncertainties. Sci. Iran. 2023, 30, 183–206. [Google Scholar] [CrossRef] [Scilit]
- Dharavat, N.; Sudabattula, S.K.; Velamuri, S.; Mishra, S.; Sharma, N.K.; Bajaj, M.; Elgamli, E.; Shouran, M.; Kamel, S. Optimal allocation of renewable distributed generators and electric vehicles in a distribution system using the political optimization algorithm. Energies 2022, 15, 6698. [Google Scholar] [CrossRef] [Scilit]
- Chippada, D.; Reddy, M.D. Optimal planning of electric vehicle charging station along with multiple distributed generator units. Int. J. Intell. Syst. Appl. 2022, 14, 40–53. [Google Scholar] [CrossRef] [Scilit]
- Habib, H.U.R.; Waqar, A.; Farhan, B.S.; Ahmad, T.; Jahangiri, M.; Ismail, M.M.; Ahmad, P.; Abbas, A.; Kim, Y.S. Analysis of optimal integration of EVs and DGs into CIGRE’s MV benchmark model. IEEE Access 2022, 10, 95949–95969. [Google Scholar] [CrossRef] [Scilit]
- Gampa, S.R.; Jasthi, K.; Goli, P.; Das, D.; Bansal, R.C. Grasshopper optimization algorithm based two stage fuzzy multiobjective approach for optimum sizing and placement of distributed generations, shunt capacitors and electric vehicle charging stations. J. Energy Storage 2020, 27, 101117. [Google Scholar] [CrossRef] [Scilit]
- Huiling, T.; Jiekang, W.; Fan, W.; Lingmin, C.; Zhijun, L.; Haoran, Y. An optimization framework for collaborative control of power loss and voltage in distribution systems with DGs and EVs using stochastic fuzzy chance constrained programming. IEEE Access 2020, 8, 49013–49027. [Google Scholar] [CrossRef] [Scilit]
- Gupta, R.S.; Tyagi, A.; Anand, S. Optimal allocation of electric vehicles charging infrastructure, policies and future trends. J. Energy Storage 2021, 43, 103291. [Google Scholar] [CrossRef] [Scilit]
- Ahmad, F.; Iqbal, A.; Ashraf, I.; Marzband, M.; Khan, I. Optimal location of electric vehicle charging station and its impact on distribution network: A review. Energy Rep. 2022, 8, 2314–2333. [Google Scholar] [CrossRef] [Scilit]
- Mohanty, A.K.; Babu, P.S.; Salkuti, S.R. Optimal allocation of fast charging station for integrated electric-transportation system using multi-objective approach. Sustainability 2022, 14, 14731. [Google Scholar] [CrossRef] [Scilit]
- Soliman, I.A.; Tulsky, V.; el Ghany, H.A.A.; Elgebaly, A.E. Optimal allocation of electric vehicle charging stations and distributed generation in radial distribution networks. Eng. Sci. Technol. Int. J. 2024, 60, 101907. [Google Scholar] [CrossRef] [Scilit]
- Mohanty, A.K.; Babu, P.S.; Salkuti, S.R. Fuzzy-based simultaneous optimal placement of electric vehicle charging stations, distributed generators, and DSTATCOM in a distribution system. Energies 2022, 15, 8702. [Google Scholar] [CrossRef] [Scilit]
- Pratap, A.; Tiwari, P.; Maurya, R. Marine Predator Algorithm for Optimal Placement of EV Charging Station with Optimal Power Factor of DG on Distribution Network. In Proceedings of the 2023 6th International Conference on Contemporary Computing and Informatics (IC3I), Gautam Buddha Nagar, India, 14–16 September 2023; Volume 6, pp. 2380–2386. [Google Scholar]
- Zhang, X.; Wang, Z.; Lu, Z. Multi-objective load dispatch for microgrid with electric vehicles using modified gravitational search and particle swarm optimization algorithm. Appl. Energy 2022, 306, 118018. [Google Scholar] [CrossRef] [Scilit]
- Zeb, M.Z.; Imran, K.; Khattak, A.; Janjua, A.K.; Pal, A.; Nadeem, M.; Zhang, J.; Khan, S. Optimal placement of electric vehicle charging stations in the active distribution network. IEEE Access 2020, 8, 68124–68134. [Google Scholar] [CrossRef] [Scilit]
- Ponnam, V.K.B.; Swarnasri, K. Multi-objective optimal allocation of electric vehicle charging stations and distributed generators in radial distribution systems using metaheuristic optimization algorithms. Eng. Technol. Appl. Sci. Res. 2020, 10, 5837–5844. [Google Scholar] [CrossRef] [Scilit]
- Eid, A.; Mohammed, O.; El-Kishky, H. Efficient operation of battery energy storage systems, electric-vehicle charging stations and renewable energy sources linked to distribution systems. J. Energy Storage 2022, 55, 105644. [Google Scholar] [CrossRef] [Scilit]
- Jeddi, B.; Vahidinasab, V.; Ramezanpour, P.; Aghaei, J.; Shafie-khah, M.; Catalão, J.P.S. Robust optimization framework for dynamic distributed energy resources planning in distribution networks. Int. J. Electr. Power Energy Syst. 2019, 110, 419–433. [Google Scholar] [CrossRef] [Scilit]
- Adetunji, K.E.; Hofsajer, I.W.; Abu-Mahfouz, A.M.; Cheng, L. An optimization planning framework for allocating multiple distributed energy resources and electric vehicle charging stations in distribution networks. Appl. Energy 2022, 322, 119513. [Google Scholar] [CrossRef] [Scilit]
- Bagherzadeh, L.; Shahinzadeh, H.; Gharehpetian, G.B. Scheduling of distributed energy resources in active distribution networks considering combination of techno-economic and environmental objectives. In Proceedings of the 2019 International Power System Conference (PSC), Tehran, Iran, 9–11 December 2019; pp. 687–695. [Google Scholar]
- Chen, L.; Ma, R. Clean energy synergy with electric vehicles: Insights into carbon footprint. Energy Strategy Rev. 2024, 53, 101394. [Google Scholar] [CrossRef] [Scilit]
- Janamala, V.; Kumar, U.K.; Pandraju, T.K.S. Future search algorithm for optimal integration of distributed generation and electric vehicle fleets in radial distribution networks considering techno-environmental aspects. SN Appl. Sci. 2021, 3, 464. [Google Scholar] [CrossRef] [Scilit]
- Nugroho, N.D.S.; Priyadi, A.; Lystianingrum, V. Optimal Placement of Electric Vehicle Charging Stations in Distribution Networks Using Firefly Algorithm and Particle Swarm Optimization. In Proceedings of the 2025 International Seminar on Intelligent Technology and Its Applications (ISITIA), Surabaya, Indonesia, 23–25 July 2025; pp. 567–572. [Google Scholar]
- Sahay, S.; Biswal, S.R.; Shankar, G.; Jha, A.V.; Appasani, B.; Srinivasulu, A.; Nsengiyumva, P. Optimized placement of distributed generators, capacitors, and EV charging stations in reconfigured radial distribution networks using enhanced artificial hummingbird algorithm. Sci. Rep. 2025, 15, 11144. [Google Scholar] [CrossRef] [Scilit]
- Injeti, S.K.; Thunuguntla, V.K. Optimal integration of DGs into radial distribution network in the presence of plug-in electric vehicles to minimize daily active power losses and to improve the voltage profile of the system using bio-inspired optimization algorithms. Prot. Control Mod. Power Syst. 2020, 5, 1. [Google Scholar] [CrossRef] [Scilit]
- Singh, D.K.; Bohre, A.K. Planning of EV fast charging station including DG in distribution system using optimization technique. In Proceedings of the 2020 IEEE International Conference on Power Electronics, Drives and Energy Systems (PEDES); IEEE: Piscataway, NJ, USA, 2020; pp. 1–6. [Google Scholar]
- Kathiravan, K.; Rajnarayanan, P.N. Application of AOA algorithm for optimal placement of electric vehicle charging station to minimize line losses. Electr. Power Syst. Res. 2023, 214, 108868. [Google Scholar] [CrossRef] [Scilit]
- Mohanty, A.K.; Babu, P.S. Multi Objective Optimal Planning of Fast Charging station and Distributed Generators in a Distribution System. In Proceedings of the 2021 IEEE 2nd International Conference On Electrical Power and Energy Systems (ICEPES); IEEE: Piscataway, NJ, USA, 2021; pp. 1–6. [Google Scholar]
- Deeum, S.; Charoenchan, T.; Janjamraj, N.; Romphochai, S.; Baum, S.; Ohgaki, H.; Mithulananthan, N.; Bhumkittipich, K. Optimal placement of electric vehicle charging stations in an active distribution grid with photovoltaic and battery energy storage system integration. Energies 2023, 16, 7628. [Google Scholar] [CrossRef] [Scilit]
- Dhanabalan, S.; Ponnusamy, T. Multi-objective Tuna Swarm Optimization for Coordinated Allocation of Electric Vehicle Charging Stations and Photovoltaic Distributed Generators in Radial Distribution Systems. J. Electr. Eng. Technol. 2025, 20, 1747–1760. [Google Scholar] [CrossRef] [Scilit]
- Mejia, M.A.; Macedo, L.H.; Muñoz-Delgado, G.; Contreras, J.; Padilha-Feltrin, A. Multistage planning model for active distribution systems and electric vehicle charging stations considering voltage-dependent load behavior. IEEE Trans. Smart Grid 2021, 13, 1383–1397. [Google Scholar] [CrossRef] [Scilit]
- Rene, E.A.; Fokui, W.S.T.; Kouonchie, P.K.N. Optimal allocation of plug-in electric vehicle charging stations in the distribution network with distributed generation. Green Energy Intell. Transp. 2023, 2, 100094. [Google Scholar] [CrossRef] [Scilit]
- Khalil, K.; Haider, Z.M.; Qureshi, M.A. Optimization Framework for Minimizing Impact of EV Charging stations on Distribution System. In Proceedings of the 2025 Horizons of Information Technology and Engineering (HITE); IEEE: Piscataway, NJ, USA, 2025; pp. 1–6. [Google Scholar]
- Jamatia, P.; Bhattacharjee, S.; Sharma, S. Allocation of electric vehicle charging station in distribution network along with distributed generation sources. In Proceedings of the 2022 IEEE 6th International Conference on Condition Assessment Techniques in Electrical Systems (CATCON); IEEE: Piscataway, NJ, USA, 2022; pp. 196–201. [Google Scholar]
- Yuvaraj, T.; Devabalaji, K.R.; Thanikanti, S.B.; Pamshetti, V.B.; Nwulu, N.I. Integration of electric vehicle charging stations and DSTATCOM in practical Indian distribution systems using bald eagle search algorithm. IEEE Access 2023, 11, 55149–55168. [Google Scholar] [CrossRef] [Scilit]
- Mehroliya, S.; Arya, A. Optimal planning of power distribution system employing electric vehicle charging stations and distributed generators using metaheuristic algorithm. Electr. Eng. 2024, 106, 1373–1389. [Google Scholar] [CrossRef] [Scilit]
- Kumar, B.V.; Farhan, A. Optimal allocation of EV charging station and capacitors considering reliability using a hybrid optimization approach. Appl. Energy 2024, 375, 124139. [Google Scholar] [CrossRef] [Scilit]
- Kumar, B.V.; Farhan, A. Optimal simultaneous allocation of electric vehicle charging stations and capacitors in radial distribution network considering reliability. J. Mod. Power Syst. Clean Energy 2024, 12, 1584–1595. [Google Scholar] [CrossRef] [Scilit]
- Abdollahzadeh, B.; Gharehchopogh, F.S.; Mirjalili, S. African vultures optimization algorithm: A new nature-inspired metaheuristic algorithm for global optimization problems. Comput. Ind. Eng. 2021, 158, 107408. [Google Scholar] [CrossRef] [Scilit]
- Nadimi-Shahraki, M.H.; Taghian, S.; Mirjalili, S. An improved grey wolf optimizer for solving engineering problems. Expert Syst. Appl. 2021, 166, 113917. [Google Scholar] [CrossRef] [Scilit]
- Karami, H.; Anaraki, M.V.; Farzin, S.; Mirjalili, S. Flow direction algorithm (FDA): A novel optimization approach for solving optimization problems. Comput. Ind. Eng. 2021, 156, 107224. [Google Scholar] [CrossRef] [Scilit]
- Dhargupta, S.; Ghosh, M.; Mirjalili, S.; Sarkar, R. Selective opposition based grey wolf optimization. Expert Syst. Appl. 2020, 151, 113389. [Google Scholar] [CrossRef] [Scilit]
- Eminoglu, U.; Hocaoglu, M.H. Distribution systems forward/backward sweep-based power flow algorithms: A review and comparison study. Electr. Power Compon. Syst. 2008, 37, 91–110. [Google Scholar] [CrossRef] [Scilit]
- Khan, M.S.; Waheed, D.; Shahzad, S.; Afzal, S.; Killic, H. Optimal allocation of distributed generation in meshed power networks: A metaheuristic approach. IET Renew. Power Gener. 2024, 18, 1570–1595. [Google Scholar] [CrossRef] [Scilit]
- Siddique, R.; Raza, S.; Mannan, A.; Khalil, L.; Alwaz, N.; Riaz, M. A modified NSGA approach for optimal sizing and allocation of distributed resources and battery energy storage system in distribution network. Mater. Today Proc. 2021, 47, S102–S109. [Google Scholar] [CrossRef] [Scilit]
- Hosseini, M.; Shayanfar, H.A.; Fotuhi-Firuzabad, M. Modeling of D-STATCOM in distribution systems load flow. J. Zhejiang Univ.-Sci. A 2007, 8, 1532–1542. [Google Scholar] [CrossRef] [Scilit]
- Sultana, U.; Khairuddin, A.B.; Mokhtar, A.S.; Zareen, N.; Sultana, B. Grey wolf optimizer based placement and sizing of multiple distributed generation in the distribution system. Energy 2016, 111, 525–536. [Google Scholar] [CrossRef] [Scilit]
- Sultan, M.S.; Kazmi, S.A.A.; Altamimi, A.; Khan, Z.A.; Shin, D.R. Multi-objective optimization-based approach for optimal allocation of distributed generation considering techno-economic and environmental indices. Sustainability 2023, 15, 4306. [Google Scholar] [CrossRef] [Scilit]
- Pratap, A.; Tiwari, P.; Maurya, R.; Singh, B. Minimisation of electric vehicle charging stations impact on radial distribution networks by optimal allocation of DSTATCOM and DG using African vulture optimisation algorithm. Int. J. Ambient. Energy 2022, 43, 8653–8672. [Google Scholar] [CrossRef] [Scilit]
- Singh, M.; Kumar, P.; Kar, I. Implementation of vehicle to grid infrastructure using fuzzy logic controller. IEEE Trans. Smart Grid 2012, 3, 565–577. [Google Scholar] [CrossRef] [Scilit]
- Baran, M.E.; Wu, F.F. Network reconfiguration in distribution systems for loss reduction and load balancing. IEEE Trans. Power Deliv. 2002, 4, 1401–1407. [Google Scholar] [CrossRef] [Scilit]

Disclaimer/Publisher’s Note: The statements, opinions and data contained in all publications are solely those of the individual author(s) and contributor(s) and not of MDPI and/or the editor(s). MDPI and/or the editor(s) disclaim responsibility for any injury to people or property resulting from any ideas, methods, instructions or products referred to in the content. |
© 2026 by the authors. Licensee MDPI, Basel, Switzerland. This article is an open access article distributed under the terms and conditions of the Creative Commons Attribution (CC BY) license.